THIS REPORT CONTAINS ASSESSMENTS OF COMMODITY AND TRADE ISSUES MADE BY USDA STAFF AND NOT NECESSARILY STATEMENTS OF OFFICIAL U.S. GOVERNMENT POLICY Date: GAIN Report Number: Approved By: Prepared By: Report Highlights: In Fiscal year (FY) 2010, Indonesia was the 8 th largest export market for U.S. agricultural products, reaching $2.13 billion. Indonesia managed to maintain a relatively healthy macroeconomic environment. In 2010, GDP growth reached an estimated 6.0 percent, up from 4.5 percent in 2009. GDP growth is projected to remain strong in 2011. Despite expanded levels of trade, market access issues continue to exist. Indonesia‟s uneven enforcement of existing regulations combined with new regulations, which are often not properly notified to trading partners, create uncertainty for U.S. exporters. Fahwani Y.R. & Jonn Slette Dennis Voboril Exporter Guide Update Exporter Guide Indonesia ID1043 1/27/2011 Required Report - public distribution

Welcome message from author
This document is posted to help you gain knowledge. Please leave a comment to let me know what you think about it! Share it to your friends and learn new things together.
Transcript
THIS REPORT CONTAINS ASSESSMENTS OF COMMODITY AND TRADE ISSUES MADE BY
USDA STAFF AND NOT NECESSARILY STATEMENTS OF OFFICIAL U.S. GOVERNMENT
POLICY
Date:
GAIN Report Number:
Approved By:
Prepared By:
Report Highlights:
In Fiscal year (FY) 2010, Indonesia was the 8th
largest export market for U.S. agricultural products,
reaching $2.13 billion. Indonesia managed to maintain a relatively healthy macroeconomic
environment. In 2010, GDP growth reached an estimated 6.0 percent, up from 4.5 percent in 2009.
GDP growth is projected to remain strong in 2011. Despite expanded levels of trade, market access
issues continue to exist. Indonesia‟s uneven enforcement of existing regulations combined with new
regulations, which are often not properly notified to trading partners, create uncertainty for U.S.
exporters.
Fahwani Y.R. & Jonn
Slette
Dennis Voboril
Exporter Guide Update
Exporter Guide
Indonesia
ID1043
1/27/2011
Required Report - public distribution
Post:
Executive Summary:
SECTION I. MARKET OVERVIEW
Economic Situation
During the 2008-2009 global recessions, Indonesia managed to maintain a relatively healthy
macroeconomic environment, with positive growth rates of 6.0 and 4.5 percent respectively. This is
mainly attributed to high and inclusive growth of domestic consumption. Bank of Indonesia‟s latest
projections show that 2010 growth will reach the upper level of 5.5-6.0 percent range and that growth in
2011 could be as high as 6.0-6.5 percent. A combination of more progressive economic policies,
ongoing structural reforms, and good debt management also contributed to Indonesia‟s macroeconomic
performance and economic stability.
A stable rupiah is expected to help insulate pressure from higher commodity prices and provide room
towards lowering inflation. Going forward in 2011, apart from uncertainties in food prices, inflationary
pressures could also be driven by an increase in domestic demand. This will also enhance Indonesia as
a market for U.S. processed food products.
Significantly, Indonesia is now considered as the most stable democracy in Southeast Asia. Indonesia
has impressively transformed from an authoritarian state to a regional role model. In 2001, Indonesia
embarked on an ambitious and challenging decentralization effort. Today Indonesia is one of the most
decentralized countries in the world with substantial funds and authorities devolved to the regional
levels.
Investment Law No. 25/2007 updated investment law redefines “capital investment” as all investments, whether
by domestic or foreign investors, for the first time offering equal treatment to all investors. There is no longer a
limit of 30 years on foreign investment permits, and gone is the provision in Law 1/1967 for divestment. It
includes also a range of investor protections, including a one-stop service for investors as well as more
transparent rules. Different tax incentives are given to new investors and investors expanding their investment in
Indonesia.
As of December 2010, Indonesia maintains free trade agreements (FTA) with Japan, ASEAN, ASEAN-
South Korea, ASEAN-Australia and New Zealand, ASEAN-Japan and ASEAN-China. However beside
the gradual reduction in tariffs and quotas following trade agreements, exporters and importers still
continue face lengthy and cumbersome custom procedures and non-tariff measures.
Key Demographic Development and Customer Expenditure
Jakarta
Indonesia is the 4th most populous nation in the world. Indonesia is also undergoing a major structural
shift in terms of demographics. Of the 234 million people in 2010, around 53 percent of the population
is between the ages 5-34 years old. A growing and more affluent middle class accounts for
approximately 70% of GDP. The emerging middle class and consumers from the Indonesian middle
class broadly support domestic industry and imported goods, particularly for retail and consumer
products, processed foods, and the automotive industry.
The latest Nielsen surveyed in September 2010 confirmed that Consumers in Indonesia remained
optimistic, reaching an index of 115 Nielsen Global Consumer Confidence Index. Consumer
Confidence Index levels above and below the baseline of 100 indicate degrees of optimism and
pessimism.
Based on the Statistic Indonesia (BPS), in 2009, monthly average expenditure per capita for food was
Rp 217,720 ($21) or about 51 percent of total monthly expenditures.
U.S. Food Product Exports to Indonesia
The U.S. food and agricultural exports to Indonesia continues to grow and remained the 8th
-largest
export market for U.S. agricultural products. Fiscal Year 2010 BICO data showed that the U.S.
Agricultural and Fishery Product exports to Indonesia reached $2.19 billion, nearly matching the record
level of $2.28 billion set in FY08. In the consumer-oriented product category, Fresh Fruit, Processed
Fruit & Vegetables, Fruit & Vegetable Juices, Tree Nuts, Nursery Products, and Pet Foods all reached
record levels. Red meats showed a five-fold increase and approached the record level of $21 million.
Dairy Products remained the largest export in this category at $145 million, up 60 percent from FY09
but short of the record level of $216 million set in FY08.
Market Access Issue
Despite the growth in trade, several market access issues continue to exist. Uneven enforcement of
existing regulations combined with new regulations that are frequently not properly notified to trading
partners or to the World Trade Organization (WTO). In general terms, market access barriers are a
result of a combination of protectionism, nationalism, corruption, and lack of soft infrastructure among
inspection agencies.
The Government of Indonesia (GOI) has made efforts to address some concerns. Since December 2007,
GOI has implemented the National Single Window (NSW) to push the movement of exported and
imported products at the port. The NSW system requires all related government institutions to
coordinate the process to clear exported & imported goods through an electronic system. The NSW
system is planned to link with the ASEAN Single Window (ASW) in 2009 and all ASEAN countries
will link completely in 2012. However, the electronic system creates additional problems for
Indonesian traders as confusion continues with the requirements for the online documentation.
Meanwhile, long lasting imported food package product registration number issue remains unresolved
though progress has been made. The food labeling issue announced in September has further
complicated this issue. Please visit GAIN attaché report ID 1028 in www.fas.usda.gov to get more
information on these issues.
Market Opportunities
Indonesia's population of 234 million in 2010 is relatively young with almost 18 percent of the
population between 15-24 years, and another 17 percent is between 25-34 years. Nearly 58
percent of the population lives on Java and accounts for 60 to 65 percent of consumer goods
sales. Java also has the best infrastructure although urban areas in Sumatera, Bali, and Sulawesi
are developing. There are 107 million people living in urban area in 2005 (latest published
data).
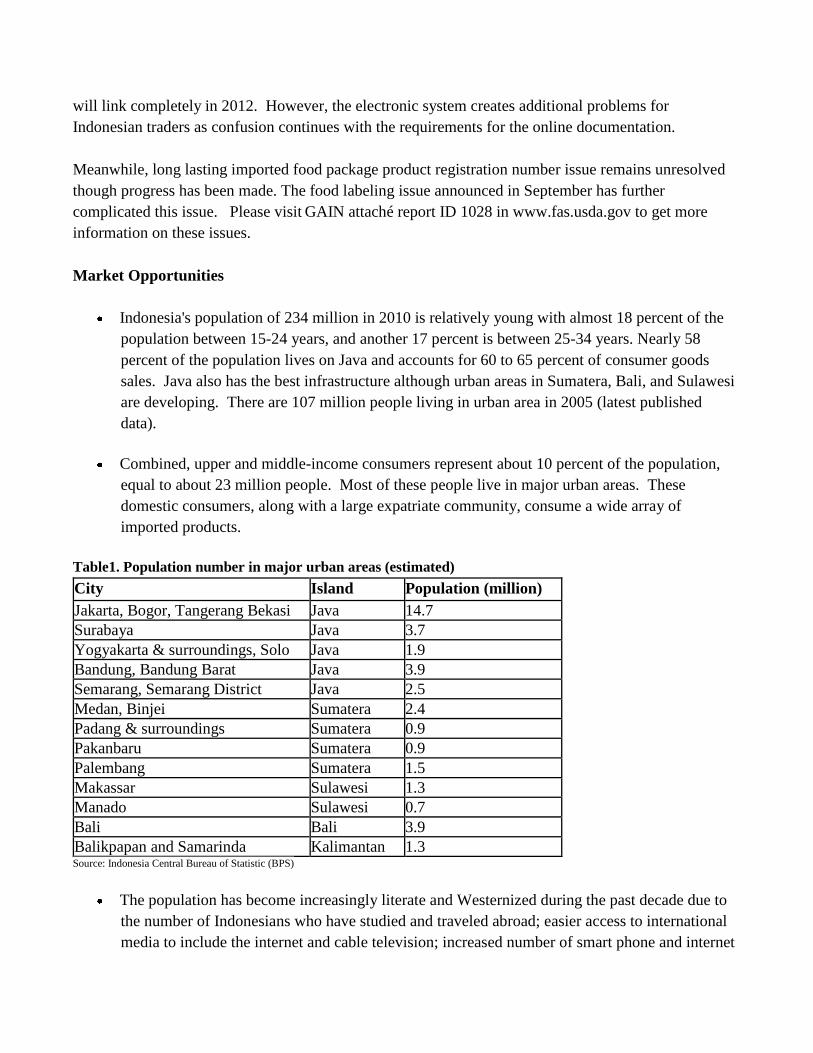
Combined, upper and middle-income consumers represent about 10 percent of the population,
equal to about 23 million people. Most of these people live in major urban areas. These
domestic consumers, along with a large expatriate community, consume a wide array of
imported products.
Table1. Population number in major urban areas (estimated)
City Island Population (million)
Jakarta, Bogor, Tangerang Bekasi Java 14.7
Surabaya Java 3.7
Yogyakarta & surroundings, Solo Java 1.9
Bandung, Bandung Barat Java 3.9
Semarang, Semarang District Java 2.5
Medan, Binjei Sumatera 2.4
Padang & surroundings Sumatera 0.9
Pakanbaru Sumatera 0.9
Palembang Sumatera 1.5
Makassar Sulawesi 1.3
Manado Sulawesi 0.7
Bali Bali 3.9
Balikpapan and Samarinda Kalimantan 1.3 Source: Indonesia Central Bureau of Statistic (BPS)
The population has become increasingly literate and Westernized during the past decade due to
the number of Indonesians who have studied and traveled abroad; easier access to international
media to include the internet and cable television; increased number of smart phone and internet
users; expansion of modern malls in major urban areas; and dramatic growth of major
international hotel, restaurants, quick serve restaurants, and bakery chains; and continued growth
of foreign tourist arrivals.
Demand for imported food ingredients is growing. Food manufacturers are continually
developing new snack products. Snacking is popular in Indonesian culture and is promoted in
the media.
The Indonesian consumer is very price conscious and susceptible to economic swings,
particularly the middle and lower level income consumers. Overall, customers tend to prefer
purchasing imports in smaller, less expensive packaging.
An interest in healthy and organic products is growing. The trend includes digestive health,
immune system, fortification, going back to nature, weight management, cardiovascular health,
oral health and beauty health.
More urban women are entering the workforce and choosing to stay there after marrying and
having children. With less time available for shopping and cooking, more urban women are
basing purchasing decisions on convenience.
The number of kitchen appliances throughout the country is relatively low. In 2005, 19 percent
of households had a refrigerator (33.7 percent of urban households and 8.1 percent of rural
households). In 2008, about 19 percent of Indonesians used Liquefied Petroleum Gas (LPG), and
one percent use electricity for cooking. The remaining households used kerosene stoves (31
percent) and fire wood (47 percent). Following GOI reduction of the fuel subsidy in 2008, more
households switched from kerosene to LPG.
During both Muslim and Chinese holiday seasons, consumer spending increases. The most
important holiday seasons are Ramadan (the month-long Muslim fasting period in which food
consumption goes up significantly), Lebaran or Idul Fitri (Muslim celebration at the end of
Ramadhan), and Chinese New Year. Indonesians consume significantly greater amounts of
flour, sugar, eggs, baking ingredients, poultry, meats, cheeses, cakes, cookies, pastries, and fresh
and dried fruits during these holidays.
Although Christmas is celebrated by less than 10 percent of the population, stores take advantage
of the season and decorate and promote festive foods such as special fruits, sweets, and pastries.
Other western celebrations including Valentine's Day, U.S. Independence Day, and Halloween
have also become trendy among upper-scale restaurants in Indonesia.
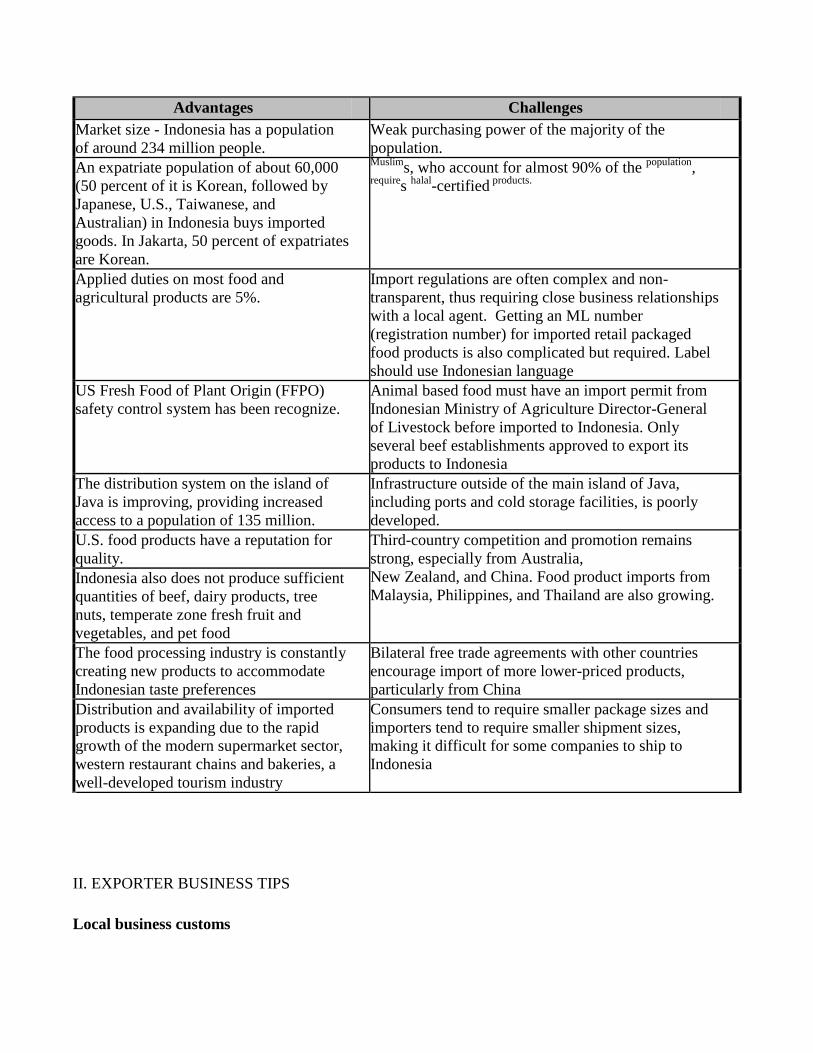
ADVANTAGES AND CHALLENGES FACING U.S. PRODUCTS IN INDONESIA
Advantages Challenges
Market size - Indonesia has a population
of around 234 million people.
Weak purchasing power of the majority of the
population.
An expatriate population of about 60,000
(50 percent of it is Korean, followed by
Japanese, U.S., Taiwanese, and
Australian) in Indonesia buys imported
goods. In Jakarta, 50 percent of expatriates
are Korean.
Muslims, who account for almost 90% of the
population,
requires
halal-certified
products.
Applied duties on most food and
agricultural products are 5%.
Import regulations are often complex and non-
transparent, thus requiring close business relationships
with a local agent. Getting an ML number
(registration number) for imported retail packaged
food products is also complicated but required. Label
should use Indonesian language
US Fresh Food of Plant Origin (FFPO)
safety control system has been recognize.
Animal based food must have an import permit from
Indonesian Ministry of Agriculture Director-General
of Livestock before imported to Indonesia. Only
several beef establishments approved to export its
products to Indonesia
The distribution system on the island of
Java is improving, providing increased
access to a population of 135 million.
Infrastructure outside of the main island of Java,
including ports and cold storage facilities, is poorly
developed.
U.S. food products have a reputation for
quality.
Third-country competition and promotion remains
strong, especially from Australia,
New Zealand, and China. Food product imports from
Malaysia, Philippines, and Thailand are also growing. Indonesia also does not produce sufficient
quantities of beef, dairy products, tree
nuts, temperate zone fresh fruit and
vegetables, and pet food
The food processing industry is constantly
creating new products to accommodate
Indonesian taste preferences
Bilateral free trade agreements with other countries
encourage import of more lower-priced products,
particularly from China
Distribution and availability of imported
products is expanding due to the rapid
growth of the modern supermarket sector,
western restaurant chains and bakeries, a
well-developed tourism industry
Consumers tend to require smaller package sizes and
importers tend to require smaller shipment sizes,
making it difficult for some companies to ship to
Indonesia
II. EXPORTER BUSINESS TIPS
Local business customs
Agents/importers are only allowed to register imported package products for retail purpose in
order to obtain an import registration (ML) number to the National Agency of Drug and Food
Control (BPOM). So choosing a local agent is a very important decision. Several principles to
keep in mind when choosing a local agent are:
o Conduct careful, detailed research in order to confirm claims. Prospective representatives who
claim connections to important people should be treated with extreme caution. Such
connections are not necessary - commercial acumen is of greater value in the market.
o Do not grant exclusive rights to a local representative until after working with them in order to
gain a clear understanding of their capabilities.
o Pay attention to accounting standards applied in the preparation of reports supporting the
financial standing of a potential representative or partner.
Most importers also act as distributors, whether as exclusive agents or as consolidators, and have
offices or local distributors in major cities all over Indonesia.
Educate the importer, the retailer, and the consumer about your product. Exporters should not
assume that Indonesian companies know how to promote, handle, and prepare imported
products. Food processors often require assistance developing products using imported food
ingredients. Support your importer, distributor, and agent by maintaining product quality.
Market research, especially for product testing, price comparison, and adjusting the product for
local tastes is important. Importers, distributors, food service providers, and retailers can help
with market research as well as understanding government regulations, which is critical.
While quality and price are important, they are secondary to the personal interaction with
business partners. Face-to-face meetings are very important to Indonesians, though younger
importers are more comfortable with establishing their relationships via electronic
communication. Exporters usually must visit Indonesia 2-3 times before details are finalized.
Product should be packed and shipped for a tropical climate and have clear storage instructions.
Few cold storage or air-conditioned facilities and delivery trucks exist. Sometimes stores turn off
cold storage facilities at night to conserve energy.
General consumer tastes and preference
The majority of people still prefer fresh foodstuffs, which are readily available in their
neighborhood at affordable prices. Healthy eating is becoming more popular among educated
consumers and featured by newspaper, magazine, and television. Fresh foods, fruit juices, fruit
concentrated-based beverages, organic foods, sugar-free confectionary, packaged food with
higher fiber content, dairy products, vitamin and calcium fortified packaged food and beverages
are also preferred by middle to upper-income consumers.
Traditional and modern snack foods, such as confectionary, pastries, cakes, biscuits, ice cream,
or sweet and savory snacks are very popular among Indonesians.
Local flavors are preferred and local food manufacturers are exploring opportunities to produce
new products using a combination of local and imported flavors.
Frozen foods and instant noodles, which are preferred and easy to prepare for children, are
popular among working mothers.
Smaller package sizes are preferred due to convenience, price considerations, and weight
management concern.
Consumers are showing a concern to food additive, high amount of MSG, fat, sugar, salt, and
preservatives in packaged food.
Food Standards and Regulations & Export Certificates
According to Indonesian regulations, imported products packaged for retail sale must be
registered with the BPOM to obtain a ML number. The registration process can be lengthy,
bureaucratic, and costly, so it is best to use a local agent.
Food labeling is required. Requirements for labeling of food products are broad in scope. At the
end of 2003, the head of BPOM published guidelines food labeling. The labeling regulation
just enforced recently and per March 1, 2011, label must use Indonesian language (see recent
GAIN Reports). Halal certification is not mandatory at this time but these guidelines are also
under review. Given that almost 90 percent of the population professes the Islamic faith, it is
highly recommended that halal certification be obtained. U.S. Islamic Centers must approved by
the Indonesian Muslim Council (MUI) to issue halal certificates.
All beef and poultry products and animal-based food products must be certified halal by Halal
Certifier Body in the country of origin approved by MUI and the products must originate from
slaughterhouses that have been approved by Directorate General of Livestock Service (DGLS),
Ministry of Agriculture. Also, each imported meat shipment requires prior approval by the
Ministry of Agriculture. The Indonesian government does not issue permits for imports of U.S.
poultry parts, but allows imports of mechanically deboned (MDM) poultry meat. However,
there is no progress on importing this product.
Imported table grapes must be produced in a pest free area. In the United States, only the state
of California has been declared by the government of Indonesia as an area determined to be free
from Ceratitis capitata. Fresh fruit and vegetables, except table grapes originating in California,
must be treated prior to shipment or subjected to in-transit cold treatment. In addition, the U.S.
Fresh Fruit of Plant Origin (FFPO) safety control system of country of origin has been
recognized by GOI. All imported the U.S. FFPO do not need Certificate of Analysis (COA) of
Pesticide Residue.
General import and inspection procedures
At the end of 2007, GOI established its National Single Window program to improve the process
for reviewing export and import documentations at the port. The NSW system requires all
related government institutions to coordinate the process to clear exported & imported goods
through an electronic system. The NSW system is planned to link with ASW in 2009 and all
ASEAN countries will link completely in 2012.
At the end of 2008, the Indonesian Ministry of Trade issued a regulation increasing the
requirements for imported products that fall under 505 Indonesian 10-digit harmonized tariff
codes, including food and beverages under 188 lines. The regulation limits the ports of entry,
requires importer registration, and requires surveys by government-approved companies before
export (See New Requirements for Selected Food & Beverages Report (ID9001).
Indonesia‟s Customs uses a schedule of arbitrary “check prices” rather than actual transaction
prices on importation documents to assess duties on food products import.
Indonesian bound tariff rates on major food and agricultural items generally range from 5 to 40
percent. Import duties for a number of processed food products range from 5 to 15 percent. The
duty applied to all imported alcoholic beverages effectively changed from ad valorem tariff to a
specific tariff in April 2010 (see New Import Duty on Beverages content Certain Ethyl
Alcohol report (ID1019) at www.fas.usda.gov). To find other regulation on the alcoholic
beverage, please see New Regulation on Alcoholic Beverages report (ID9029).
The government levies a 10 percent value-added tax on the sale of all domestic and imported
goods. A regulation in early 2007 stated that value added tax is exempted for certain strategic
products, such as corn, meat, poultry, egg, and fresh milk. For imports, these taxes are collected
at the point of import and are calculated based on the landed value of the product, including
import duties. Sales tax is 2.5 percent and excise for alcoholic beverage and alcoholic
concentrate ranges between Rp.11,000-130,000/liter (approximately $1,25 cents to $14,60),
depending on the percentage of ethyl alcohol content. Please see New Regulation on Alcoholic
Beverages Excise report (ID1011) at www. fas.usda.gov.
Import documents should be concise, with simple language, and complete. If all documentation
is complete, customs clearance can be finished as early as two days (green line) and 5-7 days
(red line and yellow line). Incomplete documentation could result in delays of several weeks.
SECTION III. MARKET SECTOR STRUCTURE AND TRENDS
A. Retail Sector
Market Overview
The Indonesian retail sector began its rapid expansion in 1999, when a Presidential Decree allowed
Carrefour, a French retailer, to increase its outlet numbers in Jakarta. Growth of these retailers includes
foreign retail giants such as Giant, Lotte (formerly Makro), and Lion Superindo as well Carrefour itself.
Since then, the competition among the retailers become stronger and the Indonesian consumers have a
benefit from it. Modern retail businesses such as hypermarkets, supermarkets, and mini-markets are
replacing more traditional retail outlets, including wet markets and independent small grocers.
Presidential Decree No 111/2007 stated that only supermarkets under 1,200 square meters and mini-
markets under 400 square meters should be owned by domestic investor. Some of them have multi-
format outlets.
The development of information technology and changing life styles impacts consumers‟ perception of
the value and quality of food products, as well as the way they purchase daily necessities. National
modern retail chains generally start in Jakarta, then spread to other Javanese cities, and finally become
established in other areas outside of Java. Foreign and national chains compete directly with existing
regional modern outlets in these areas.
Despite the growth in the modern retail sector, the majority of Indonesians continue to shop at
traditional stores conveniently located near their homes or places of work. These stores sell
conventional food and beverage products familiar to the majority of consumers. Nielsen reported that
consumers visit the traditional markets 25 times per month for Traditional Grocery, 12 times per month
for Wet Market and 19 times in Vegetable vendors.
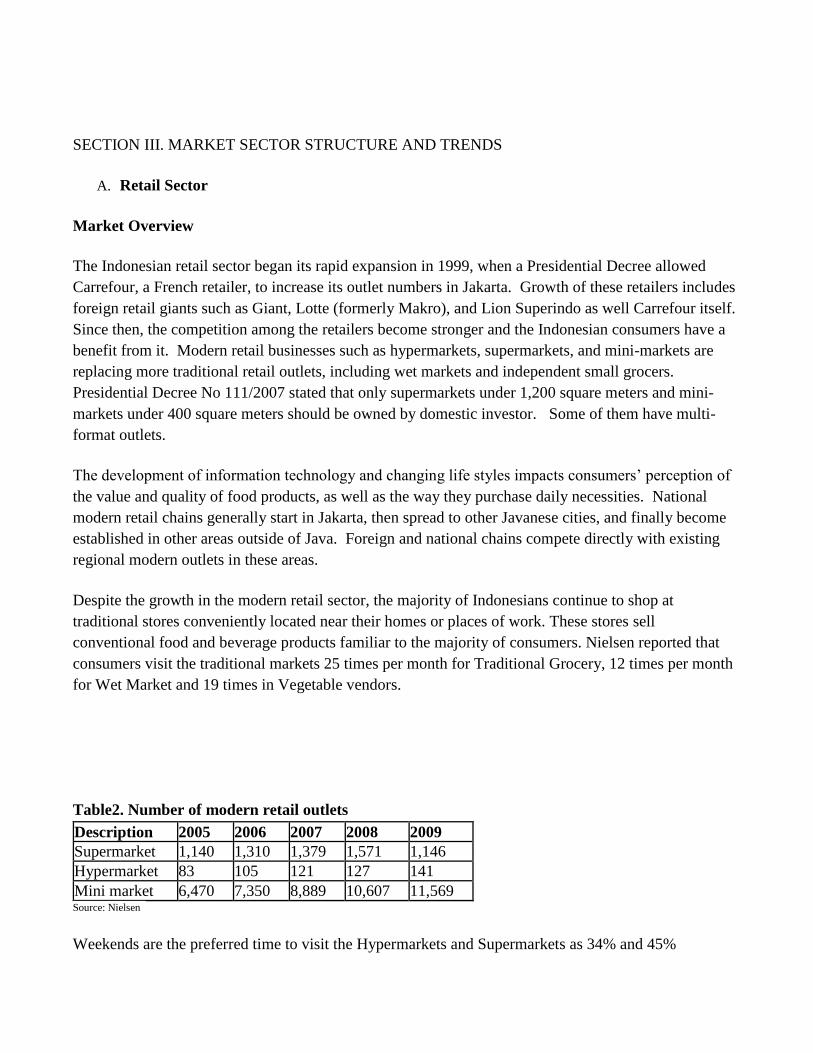
Table2. Number of modern retail outlets
Description 2005 2006 2007 2008 2009
Supermarket 1,140 1,310 1,379 1,571 1,146
Hypermarket 83 105 121 127 141
Mini market 6,470 7,350 8,889 10,607 11,569 Source: Nielsen
Weekends are the preferred time to visit the Hypermarkets and Supermarkets as 34% and 45%
consumers respectively choose to visit both channels during the weekend time, probably while doing
their „recreation‟ as well, as they also choose afternoon time to visit the store. For Mini Markets,
consumers usually visit at night (43%) during the workdays (19%). For traditional outlets (traditional
stores and wet markets), consumers opt to visit in the morning with around 40% visit the channels on
weekdays.
The „recreation‟ function of modern outlets is also important, as 79% of consumers visit these outlets
with their families. With traditional markets, more than 65 percent of consumers prefer to go alone.
Domestic Industry Concentration
Modern retailers are concentrating on improving their marketing of quality fresh produce, a substantial
portion of which is imported, as is exemplified by the emergence of a number of fruit boutiques. Beside
the growing specialty stores to serve highend customers, dairy and poultry one-stop shopping stores
(Susu Oke and Bel Mart) are also starting in Jakarta and surrounding areas.
In addition, mini-markets, convenience stores, and other shops carry a wide range of convenience food
items and fresh fruits. These stores are found throughout Indonesia‟s major urban centers and are also
co-located with gasoline stations, such as Bright, Select, Surya, Bonjour and now includes Indomaret
and Alfamart. Franchising is also driving the rapid growth of mini-markets and convenient stores.
Some outlets open for 24 hours, such as 7-Eleven, Circle, Alfamart and Indomart convenience stores.
Nielsen reported that consumers select different channels for different categories. Consumers make
their purchase for commodity goods like instant noodles, cooking oil, soy sauce in traditional channels.
More 50 percent of consumers purchase milk, vitamins and personal care products in modern trade.
In 2009, the average per capita monthly expenditure in Indonesia was about 41.54 dollars (Rp. 430,065)
and 50.62 percent of it goes for food. A typical break down of these expenditures is as follows:
17.5 percent for cereals
8.5 percent for fish
7.7 percent for vegetables
6.5 percent for milk & eggs
4.0 percent for fruit
4.0 percent for beverages
3.9 percent for oil & fats
3.7 percent for meat
the rest for other food products
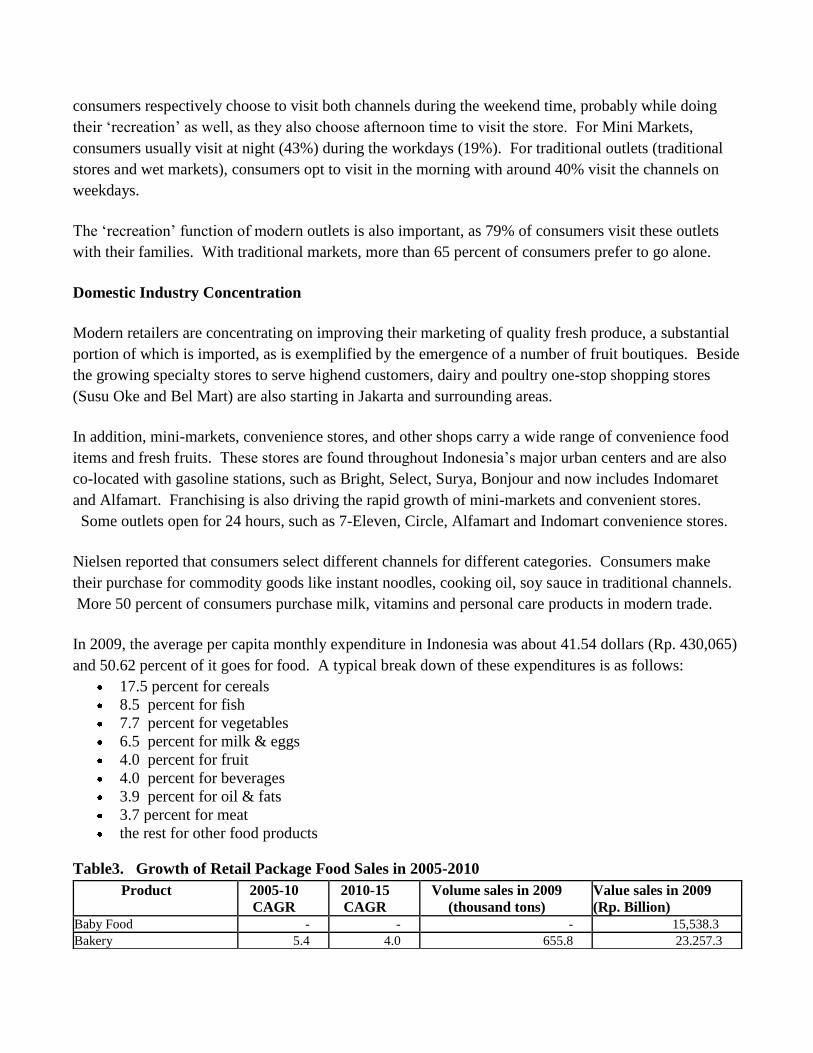
Table3. Growth of Retail Package Food Sales in 2005-2010
Product 2005-10
CAGR 2010-15
CAGR Volume sales in 2009
(thousand tons) Value sales in 2009
(Rp. Billion) Baby Food - - - 15,538.3 Bakery 5.4 4.0 655.8 23.257.3
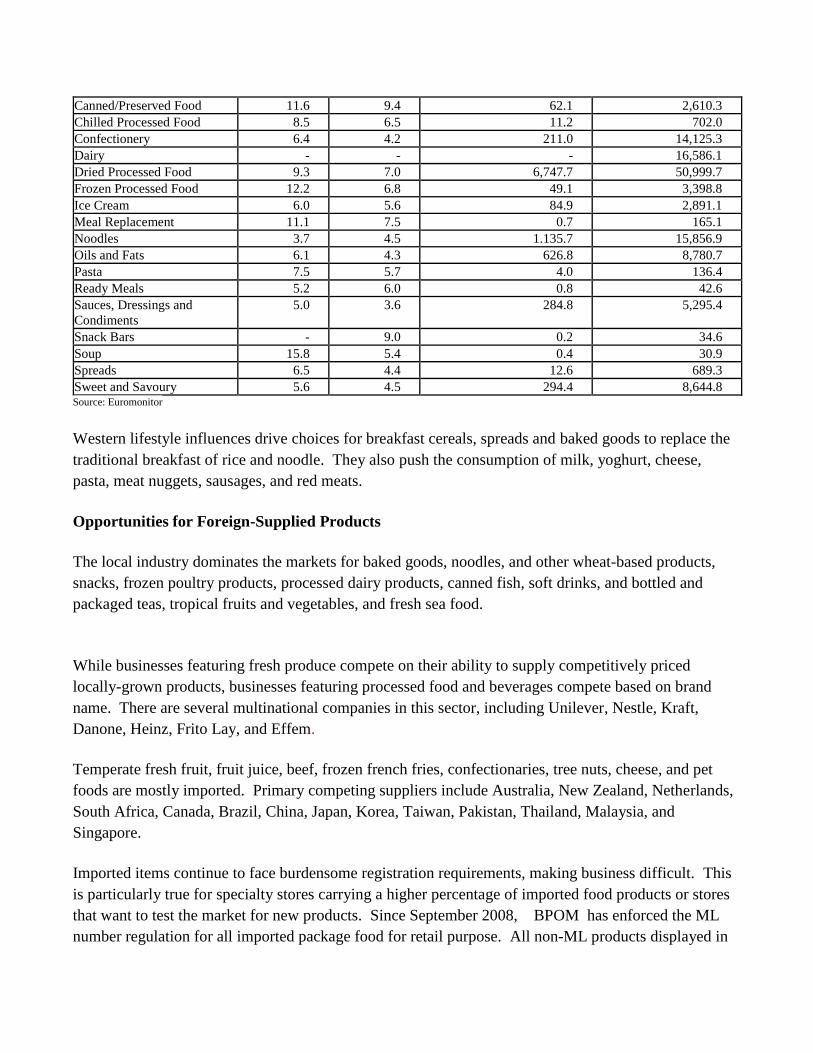
Canned/Preserved Food 11.6 9.4 62.1 2,610.3 Chilled Processed Food 8.5 6.5 11.2 702.0 Confectionery 6.4 4.2 211.0 14,125.3 Dairy - - - 16,586.1 Dried Processed Food 9.3 7.0 6,747.7 50,999.7 Frozen Processed Food 12.2 6.8 49.1 3,398.8 Ice Cream 6.0 5.6 84.9 2,891.1 Meal Replacement 11.1 7.5 0.7 165.1 Noodles 3.7 4.5 1.135.7 15,856.9 Oils and Fats 6.1 4.3 626.8 8,780.7 Pasta 7.5 5.7 4.0 136.4 Ready Meals 5.2 6.0 0.8 42.6 Sauces, Dressings and
Condiments 5.0 3.6 284.8 5,295.4
Snack Bars - 9.0 0.2 34.6 Soup 15.8 5.4 0.4 30.9 Spreads 6.5 4.4 12.6 689.3 Sweet and Savoury 5.6 4.5 294.4 8,644.8 Source: Euromonitor
Western lifestyle influences drive choices for breakfast cereals, spreads and baked goods to replace the
traditional breakfast of rice and noodle. They also push the consumption of milk, yoghurt, cheese,
pasta, meat nuggets, sausages, and red meats.
Opportunities for Foreign-Supplied Products
The local industry dominates the markets for baked goods, noodles, and other wheat-based products,
snacks, frozen poultry products, processed dairy products, canned fish, soft drinks, and bottled and
packaged teas, tropical fruits and vegetables, and fresh sea food.
While businesses featuring fresh produce compete on their ability to supply competitively priced
locally-grown products, businesses featuring processed food and beverages compete based on brand
name. There are several multinational companies in this sector, including Unilever, Nestle, Kraft,
Danone, Heinz, Frito Lay, and Effem.
Temperate fresh fruit, fruit juice, beef, frozen french fries, confectionaries, tree nuts, cheese, and pet
foods are mostly imported. Primary competing suppliers include Australia, New Zealand, Netherlands,
South Africa, Canada, Brazil, China, Japan, Korea, Taiwan, Pakistan, Thailand, Malaysia, and
Singapore.
Imported items continue to face burdensome registration requirements, making business difficult. This
is particularly true for specialty stores carrying a higher percentage of imported food products or stores
that want to test the market for new products. Since September 2008, BPOM has enforced the ML
number regulation for all imported package food for retail purpose. All non-ML products displayed in
supermarket shelves and storages are subject to being confiscated. Furthermore, non-transparent and
unpredictable customs clearance procedures, besides being costly and administratively cumbersome,
create problems when products with limited shelf-life are unexpectedly held at port.
Specialty stores serving expatriates from the west nations, Korea, Japan, as well as domestic high-end
consumers in major urban areas, have been negatively impacted because of ML issue.
In addition to that, labeling issues that recently came up also will hamper the imported products. All
imported package food products must use Indonesian language and it will be enforced in March 1, 2010.
This issue remains unresolved as of December, 2010.
Indonesian halal concerns continue to challenge U.S. food exporters. According to Indonesian
regulations, halal products shall be foods, beverages, drugs, cosmetics, biochemistry products,
genetically modified products composed of halal elements to be consumed, drank, used, or worn that
have undertake process of halal products in accordance with Islamic Law.
Trend in Promotion and Marketing Strategies
Expatriate and high-income Indonesian consumers are not as price sensitive and often look for branded,
gourmet, and imported items. Organic and healthy products are starting to become more popular.
Younger consumers from middle and upper income families are also looking for more variety and are
less cost conscious.
The latest Nielsen survey found that Indonesian consumer purchasing decision for food is 19 percent
influenced by online reviews, consumer researching is 23 percent influenced by online reviews, and
17 percent will not buy without consulting online reviews. In Indonesia, about 30 percent of consumers
will share a negative product experience online.
Modern retailers use television and print media for regular and seasonal promotions.
Trend in Tourism Sales, Holiday Gift Sales, and Internet Sales
Food in retail sale mostly goes to domestic consumers. Indonesian is delighted to buy food for their
family, relatives, friends, and colleagues especially after travel and special day includes holiday season.
However, in the last few years, the GOI prohibited holiday gifts for GOI official to support an
anticorruption campaign.
Although the Indonesian consumers have begun to use the internet to buy products, it is not commonly
used to buy food products at this point.
Best Product Prospects
For U.S. products currently present in the Indonesian market, fresh fruit continues to have the best sales
prospects. U.S. cheese and processed fruits & vegetables have also started to increase market share.
Some of the best selling processed foods include frozen french fries, frozen and canned vegetables,
breakfast cereals, snack foods, biscuits, crackers, popcorn, baby food, dressings, sauces, seasonings,
cooking and salad oils, fruit juices and beverages.
There are also good opportunities for sales of other U.S. high value items. Many of these are not yet in
the market in significant quantities. These include refrigerated frozen foods such as frozen pizza, frozen
meats, delicatessen meats, organic foods, and specialty fruits, particularly certain types of berries.
B. HRI (Hotel, Restaurant, and Institutional) Food Service Sector
Market Overview
Over the past view years, the HRI sector - especially hotels, restaurants, bars and cafés - has expanded
into the major secondary cities in Java and the bigger cities in other islands. This is driven by business
visitors and cultural events: Meeting, Incentive, Convention, and Event (MICE)-and the opening of new
modern shopping malls in those cities.
Bali remains the most visited tourist destination in Indonesia followed by Jakarta and Batam. During
2002 to 2008, Singapore, Malaysia, Japan, Australia, China, South Korea, and Taiwan accounted for the
highest numbers of tourists by nationality, followed by the United States, the United Kingdom,
Germany, Netherlands, and France.
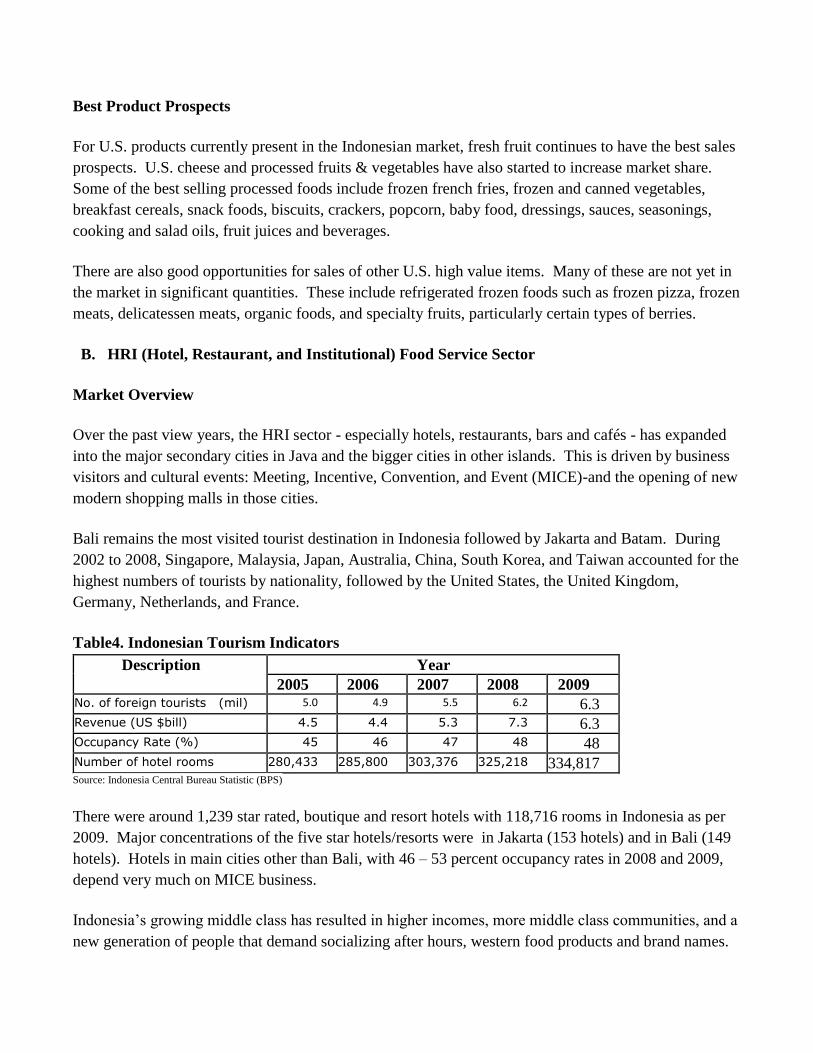
Table4. Indonesian Tourism Indicators
Description Year
2005 2006 2007 2008 2009 No. of foreign tourists (mil) 5.0 4.9 5.5 6.2 6.3 Revenue (US $bill) 4.5 4.4 5.3 7.3 6.3 Occupancy Rate (%) 45 46 47 48 48 Number of hotel rooms 280,433 285,800 303,376 325,218 334,817 Source: Indonesia Central Bureau Statistic (BPS)
There were around 1,239 star rated, boutique and resort hotels with 118,716 rooms in Indonesia as per
2009. Major concentrations of the five star hotels/resorts were in Jakarta (153 hotels) and in Bali (149
hotels). Hotels in main cities other than Bali, with 46 – 53 percent occupancy rates in 2008 and 2009,
depend very much on MICE business.
Indonesia‟s growing middle class has resulted in higher incomes, more middle class communities, and a
new generation of people that demand socializing after hours, western food products and brand names.
Middle class consumers also have easier access to media and internet facilities. These mediums further
expose Indonesian consumers to various international products, activities and lifestyles.
Around 70 percent of the 1,212 upscale chain and independent restaurants are located in Bali and
Jakarta. 408 restaurants in Bali and 146 in Jakarta are considered high-end and serve Western and
international cuisine made with imported food products. The rapid growth of Western-style, specialized
coffee shops, café, bars and wine lounges as well as bakeries have also resulted in an increase of
imported specialty and gourmet food and beverage products.
Fast food outlets continue to thrive, despite the domination of roadside stalls and vendors in the food
service industry. Currently, over thirty percent of Indonesia‟s urban population eats fast food once a
week. The most prevalent fast food outlets include Kentucky Fried Chicken, McDonald‟s, A&W and
Pizza Hut. These outlets will remain popular due to affordable prices, high standards and quality, and
their widespread throughout Indonesia. More and more burger and pizza outlets from different
companies open in Jakarta and its surrounding in the last few years.
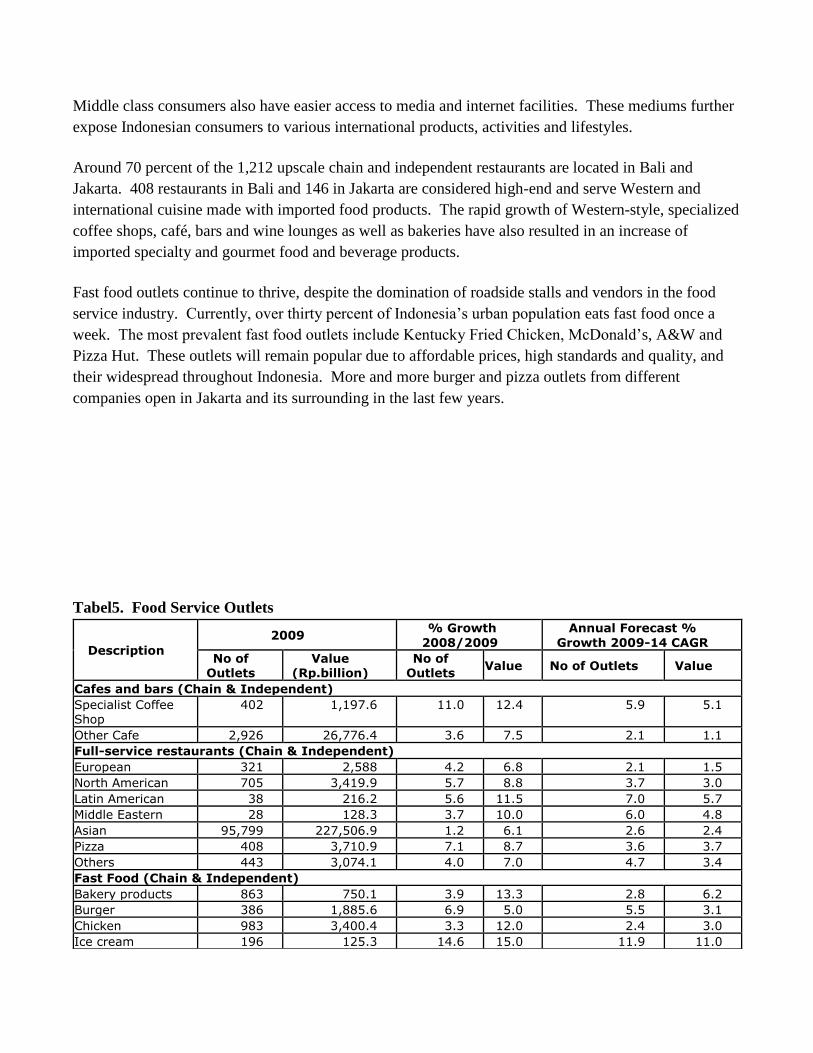
Tabel5. Food Service Outlets
Description
2009 % Growth
2008/2009
Annual Forecast %
Growth 2009-14 CAGR
No of Outlets
Value (Rp.billion)
No of Outlets
Value No of Outlets Value
Cafes and bars (Chain & Independent)
Specialist Coffee Shop
402 1,197.6 11.0 12.4 5.9 5.1
Other Cafe 2,926 26,776.4 3.6 7.5 2.1 1.1
Full-service restaurants (Chain & Independent)
European 321 2,588 4.2 6.8 2.1 1.5
North American 705 3,419.9 5.7 8.8 3.7 3.0
Latin American 38 216.2 5.6 11.5 7.0 5.7
Middle Eastern 28 128.3 3.7 10.0 6.0 4.8
Asian 95,799 227,506.9 1.2 6.1 2.6 2.4
Pizza 408 3,710.9 7.1 8.7 3.6 3.7
Others 443 3,074.1 4.0 7.0 4.7 3.4
Fast Food (Chain & Independent)
Bakery products 863 750.1 3.9 13.3 2.8 6.2
Burger 386 1,885.6 6.9 5.0 5.5 3.1
Chicken 983 3,400.4 3.3 12.0 2.4 3.0
Ice cream 196 125.3 14.6 15.0 11.9 11.0
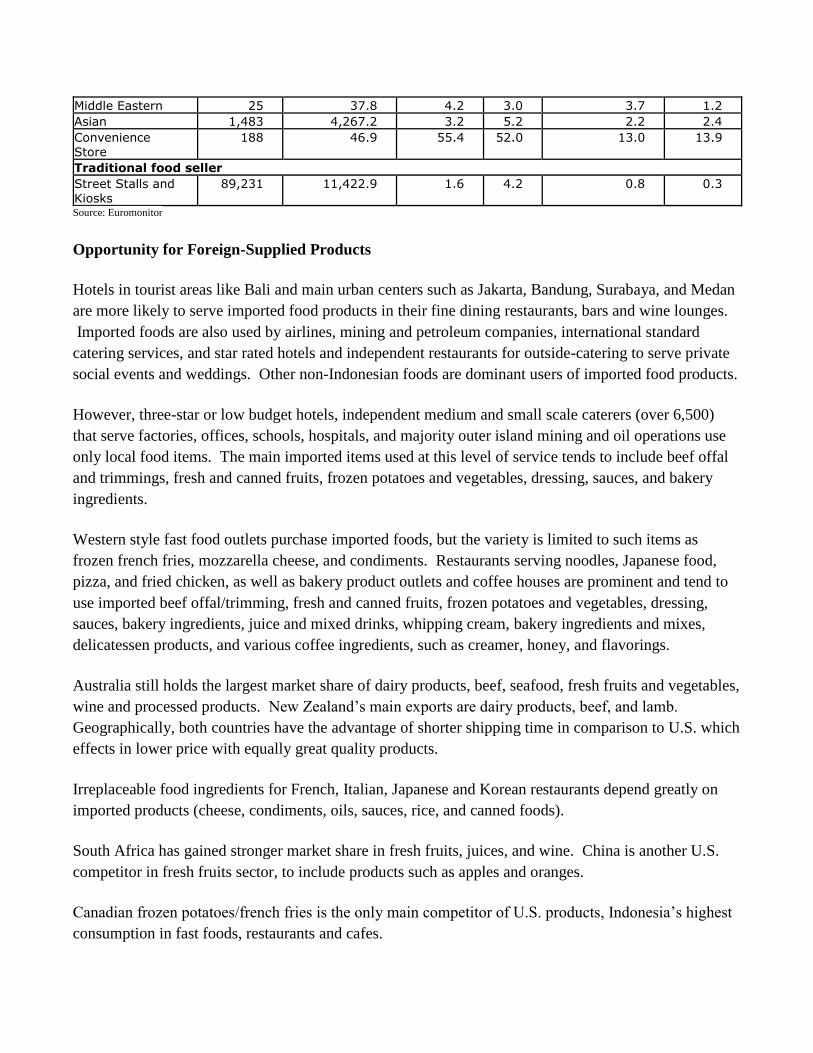
Middle Eastern 25 37.8 4.2 3.0 3.7 1.2
Asian 1,483 4,267.2 3.2 5.2 2.2 2.4
Convenience Store
188 46.9 55.4 52.0 13.0 13.9
Traditional food seller
Street Stalls and Kiosks
89,231 11,422.9 1.6 4.2 0.8 0.3
Source: Euromonitor
Opportunity for Foreign-Supplied Products
Hotels in tourist areas like Bali and main urban centers such as Jakarta, Bandung, Surabaya, and Medan
are more likely to serve imported food products in their fine dining restaurants, bars and wine lounges.
Imported foods are also used by airlines, mining and petroleum companies, international standard
catering services, and star rated hotels and independent restaurants for outside-catering to serve private
social events and weddings. Other non-Indonesian foods are dominant users of imported food products.
However, three-star or low budget hotels, independent medium and small scale caterers (over 6,500)
that serve factories, offices, schools, hospitals, and majority outer island mining and oil operations use
only local food items. The main imported items used at this level of service tends to include beef offal
and trimmings, fresh and canned fruits, frozen potatoes and vegetables, dressing, sauces, and bakery
ingredients.
Western style fast food outlets purchase imported foods, but the variety is limited to such items as
frozen french fries, mozzarella cheese, and condiments. Restaurants serving noodles, Japanese food,
pizza, and fried chicken, as well as bakery product outlets and coffee houses are prominent and tend to
use imported beef offal/trimming, fresh and canned fruits, frozen potatoes and vegetables, dressing,
sauces, bakery ingredients, juice and mixed drinks, whipping cream, bakery ingredients and mixes,
delicatessen products, and various coffee ingredients, such as creamer, honey, and flavorings.
Australia still holds the largest market share of dairy products, beef, seafood, fresh fruits and vegetables,
wine and processed products. New Zealand‟s main exports are dairy products, beef, and lamb.
Geographically, both countries have the advantage of shorter shipping time in comparison to U.S. which
effects in lower price with equally great quality products.
Irreplaceable food ingredients for French, Italian, Japanese and Korean restaurants depend greatly on
imported products (cheese, condiments, oils, sauces, rice, and canned foods).
South Africa has gained stronger market share in fresh fruits, juices, and wine. China is another U.S.
competitor in fresh fruits sector, to include products such as apples and oranges.
Canadian frozen potatoes/french fries is the only main competitor of U.S. products, Indonesia‟s highest
consumption in fast foods, restaurants and cafes.
U.S. dairy and non-dairy based beverage mixes for cafes, fast foods, and beverage vendors have done
well during the past five years. Main U.S. competitors in these products include Taiwan and Korea.
France and Chile have become very competitive in the Indonesian wine market. The past few years,
local wine makers have also begun to produce varieties of wine from both local grapes and imported
Australian grape must to avoid the high taxes on imported alcoholic beverage. These wines become
readily available and more affordable for all HRI industry type throughout the country.
The U.S. market share remain strong with high potential in fresh fruits, frozen potatoes, dairy, bakery
ingredients, and beverage ingredients since 80 percent fast food, restaurant, and café industries are U.S.
franchise holders.
Unfortunately, since around September of 2008, the enforcement of government regulations on
imported products and the global economic downturn have resulted in dramatic shortages of high
quality imported products at both retail and HRI industries and in urban areas. This means the
industries have to source for local products with substandard or lower quality in general.
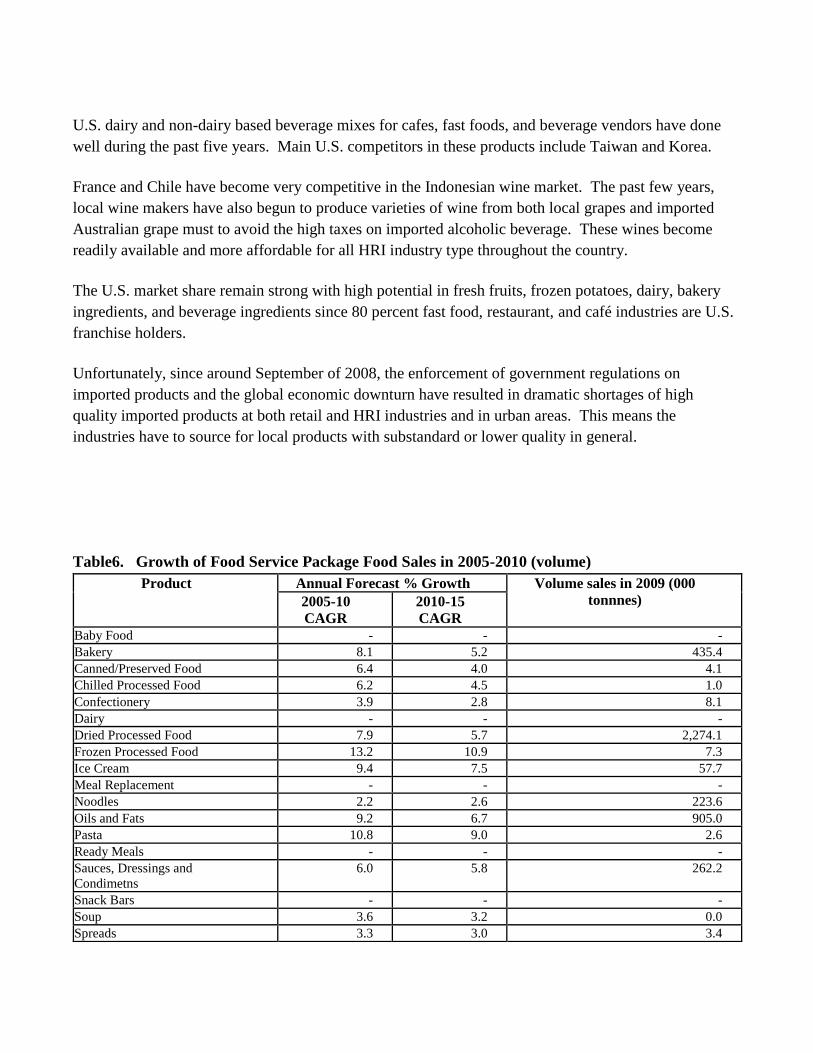
Table6. Growth of Food Service Package Food Sales in 2005-2010 (volume)
Product Annual Forecast % Growth Volume sales in 2009 (000
tonnnes) 2005-10
CAGR 2010-15
CAGR Baby Food - - - Bakery 8.1 5.2 435.4 Canned/Preserved Food 6.4 4.0 4.1 Chilled Processed Food 6.2 4.5 1.0 Confectionery 3.9 2.8 8.1 Dairy - - - Dried Processed Food 7.9 5.7 2,274.1 Frozen Processed Food 13.2 10.9 7.3 Ice Cream 9.4 7.5 57.7 Meal Replacement - - - Noodles 2.2 2.6 223.6 Oils and Fats 9.2 6.7 905.0 Pasta 10.8 9.0 2.6 Ready Meals - - - Sauces, Dressings and
Condimetns 6.0 5.8 262.2
Snack Bars - - - Soup 3.6 3.2 0.0 Spreads 3.3 3.0 3.4
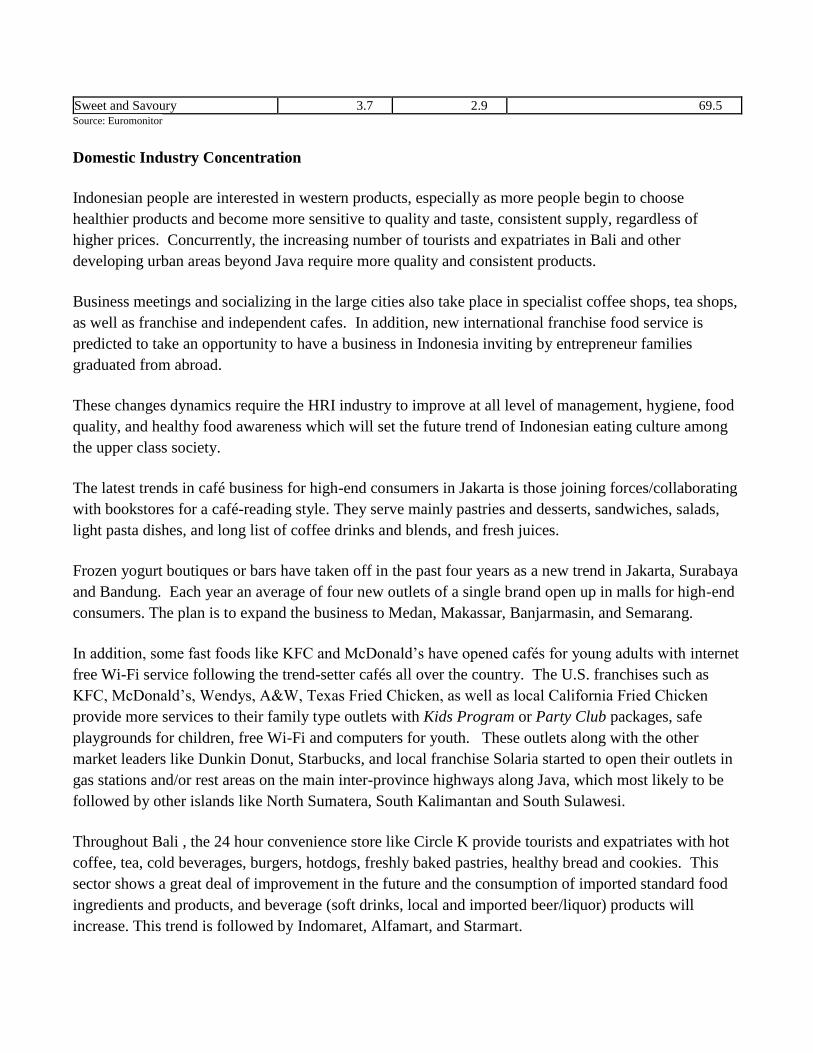
Sweet and Savoury 3.7 2.9 69.5 Source: Euromonitor
Domestic Industry Concentration
Indonesian people are interested in western products, especially as more people begin to choose
healthier products and become more sensitive to quality and taste, consistent supply, regardless of
higher prices. Concurrently, the increasing number of tourists and expatriates in Bali and other
developing urban areas beyond Java require more quality and consistent products.
Business meetings and socializing in the large cities also take place in specialist coffee shops, tea shops,
as well as franchise and independent cafes. In addition, new international franchise food service is
predicted to take an opportunity to have a business in Indonesia inviting by entrepreneur families
graduated from abroad.
These changes dynamics require the HRI industry to improve at all level of management, hygiene, food
quality, and healthy food awareness which will set the future trend of Indonesian eating culture among
the upper class society.
The latest trends in café business for high-end consumers in Jakarta is those joining forces/collaborating
with bookstores for a café-reading style. They serve mainly pastries and desserts, sandwiches, salads,
light pasta dishes, and long list of coffee drinks and blends, and fresh juices.
Frozen yogurt boutiques or bars have taken off in the past four years as a new trend in Jakarta, Surabaya
and Bandung. Each year an average of four new outlets of a single brand open up in malls for high-end
consumers. The plan is to expand the business to Medan, Makassar, Banjarmasin, and Semarang.
In addition, some fast foods like KFC and McDonald‟s have opened cafés for young adults with internet
free Wi-Fi service following the trend-setter cafés all over the country. The U.S. franchises such as
KFC, McDonald‟s, Wendys, A&W, Texas Fried Chicken, as well as local California Fried Chicken
provide more services to their family type outlets with Kids Program or Party Club packages, safe
playgrounds for children, free Wi-Fi and computers for youth. These outlets along with the other
market leaders like Dunkin Donut, Starbucks, and local franchise Solaria started to open their outlets in
gas stations and/or rest areas on the main inter-province highways along Java, which most likely to be
followed by other islands like North Sumatera, South Kalimantan and South Sulawesi.
Throughout Bali , the 24 hour convenience store like Circle K provide tourists and expatriates with hot
coffee, tea, cold beverages, burgers, hotdogs, freshly baked pastries, healthy bread and cookies. This
sector shows a great deal of improvement in the future and the consumption of imported standard food
ingredients and products, and beverage (soft drinks, local and imported beer/liquor) products will
increase. This trend is followed by Indomaret, Alfamart, and Starmart.
Trend in Promotion and Marketing Strategies
Promotion efforts by the Indonesian Board of Tourism around the country for example Visit Musi
Palembang in Sumatera, Laskar Pelangi Belitung, Tanah Toraja Festival in South Sulawesi, Wakatobi
Festival in Southeast Sulawesi, Sasando Music Festival in Kupang-Nusa Tenggara, and Sultra Vista
Vaganza Bali in conjunction with Bali travel industry are expected to increase the flight frequencies,
ground transportation improvement, hotel and restaurant services that attracted more domestic and
foreign visitors.
Constant exposures of Bali in documentary National Geography, Discovery Channel, BBC Knowledge
films, and Hollywood movies provide an even more positive impact on the growth of tourism and HRI
industry in the eastern part of Indonesia.
Currently, comments and information about food and restaurants are commonly spread through smart
phones and social networking sites like Facebook and Twitter. This trend is widely use by users in big
cities in line with improvement of internet connection.
In addition, flyer distribution, Facebook and billboards to promote home delivery and takeaway service
are increasing to support busy life style demand such as student, the office workers, and young families.
Best Product Prospects
The high demand food items in the HRI industry includes chicken, beef, processed meats, seafood, and
frozen potatoes.
Best market prospects for U.S. suppliers include duck, turkey, seafood, French-fries, bakery ingredients,
sauces and seasonings, oil and vinegars, cereals, seafood, canned food, fresh fruits, soft drinks, juices,
tree nuts, ice cream, snacks, beer, reasonably-priced wines, liquor, beef and beef offal.
USDA choice meat, processed meat, chicken, salmon, variety of cheese, and wine are among the
potential products but lack of availability due to significant barrier.
The demand for U.S. dairy and non-dairy based beverage mixes/blends for cafés, fast foods, and
beverage vendors (Pop Ice) will continue to grow.
Imported healthy flavored ice drinks like green-tea and fruit ice blends, pure chocolate and non-fat milk
drinks, fresh and concentrated fruit juices will be expected to increase dramatically in the next few
years.
Table7. Variety of Imported Food Products in Indonesia Market for HRI Industry
Products Description Type of HRI Industry
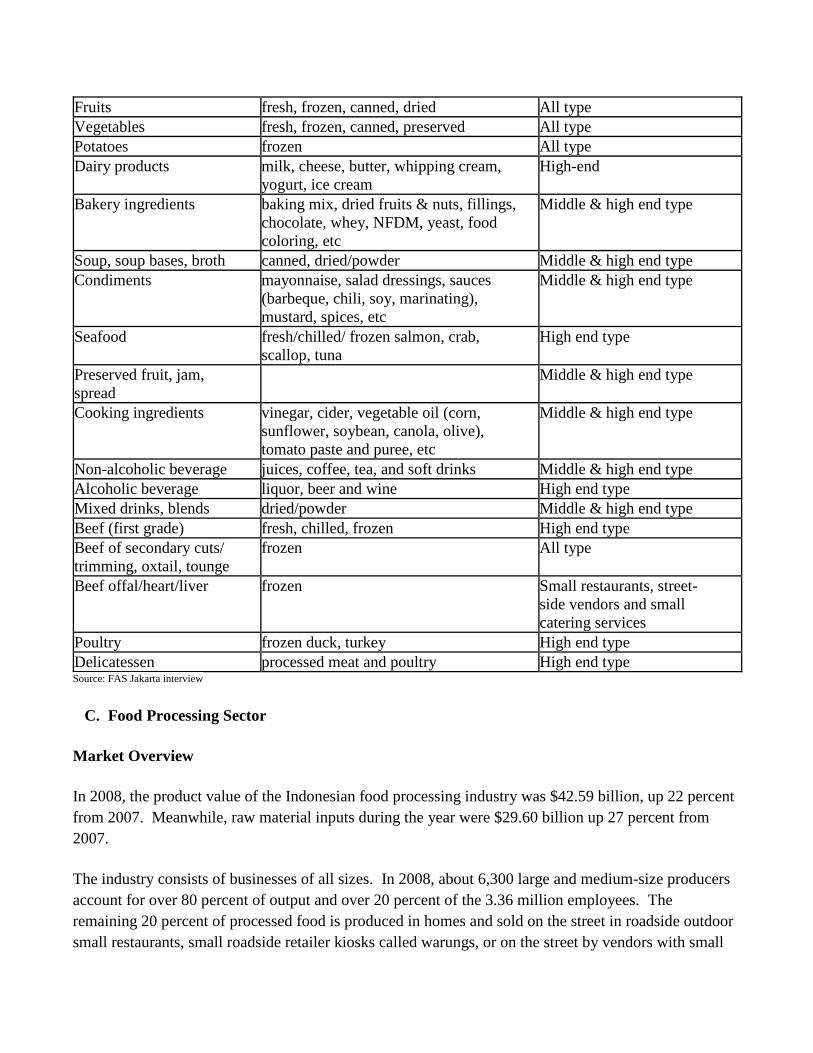
Fruits fresh, frozen, canned, dried All type
Vegetables fresh, frozen, canned, preserved All type
Potatoes frozen All type
Dairy products milk, cheese, butter, whipping cream,
yogurt, ice cream
High-end
Bakery ingredients baking mix, dried fruits & nuts, fillings,
chocolate, whey, NFDM, yeast, food
coloring, etc
Middle & high end type
Soup, soup bases, broth canned, dried/powder Middle & high end type
Condiments mayonnaise, salad dressings, sauces
(barbeque, chili, soy, marinating),
mustard, spices, etc
Middle & high end type
Seafood fresh/chilled/ frozen salmon, crab,
scallop, tuna
High end type
Preserved fruit, jam,
spread
Middle & high end type
Cooking ingredients vinegar, cider, vegetable oil (corn,
sunflower, soybean, canola, olive),
tomato paste and puree, etc
Middle & high end type
Non-alcoholic beverage juices, coffee, tea, and soft drinks Middle & high end type
Alcoholic beverage liquor, beer and wine High end type
Mixed drinks, blends dried/powder Middle & high end type
Beef (first grade) fresh, chilled, frozen High end type
Beef of secondary cuts/
trimming, oxtail, tounge
frozen All type
Beef offal/heart/liver frozen Small restaurants, street-
side vendors and small
catering services
Poultry frozen duck, turkey High end type
Delicatessen processed meat and poultry High end type Source: FAS Jakarta interview
C. Food Processing Sector
Market Overview
In 2008, the product value of the Indonesian food processing industry was $42.59 billion, up 22 percent
from 2007. Meanwhile, raw material inputs during the year were $29.60 billion up 27 percent from
2007.
The industry consists of businesses of all sizes. In 2008, about 6,300 large and medium-size producers
account for over 80 percent of output and over 20 percent of the 3.36 million employees. The
remaining 20 percent of processed food is produced in homes and sold on the street in roadside outdoor
small restaurants, small roadside retailer kiosks called warungs, or on the street by vendors with small
carts called kaki limas. Warungs, small restaurants along the road, and kaki limas are ubiquitous in
Indonesia and provide a variety of meals and popular snacks for Indonesians. In Indonesia, giving food
as a gift is a tradition and remains popular and snacking is also very popular.
Several medium and large scale Indonesian snack food manufactures have merged over the past several
years. The results of these mergers include lower production costs, and an increased use of more
modern manufacturing methods and equipment. This has ultimately led to higher quality, and more
consistent products that are less expensive for consumers. Also, large scale Indonesian snack food
manufacturers are developing more creative ways to compete with imports in the domestic market.
Other than beef, chicken, fish, and soybean-based foods (e.g. tofu and tempe), processed meat products
are an alternative protein source for over 50 percent of the Indonesian population – namely among the
middle and lower income consumers. Processed meat products include delicatessen products, burger
patties, meatballs, sausages, and nuggets. These products are more affordable to the middle and lower
income consumers than beef or poultry meat.
Meatball production has always been a significant source of meat protein for the total population.
Burger patty, sausage, and nugget production took off after the financial and political crises in 1998.
The meat processing industries require consistent supplies of quality meat as basic ingredients; this
demand cannot be met locally and are totally reliant on meat imports.
The increasing healthy life style drives the need for exercise and the demand for healthier food products
or those products considered to have health benefits. Besides attracting young consumers, the need for
healthier products also creates more beverage products in the market currently, such as beverages that
contain vitamin C, mineral, polyphenols, ginseng, low calorie, fruit juice extract, etc.
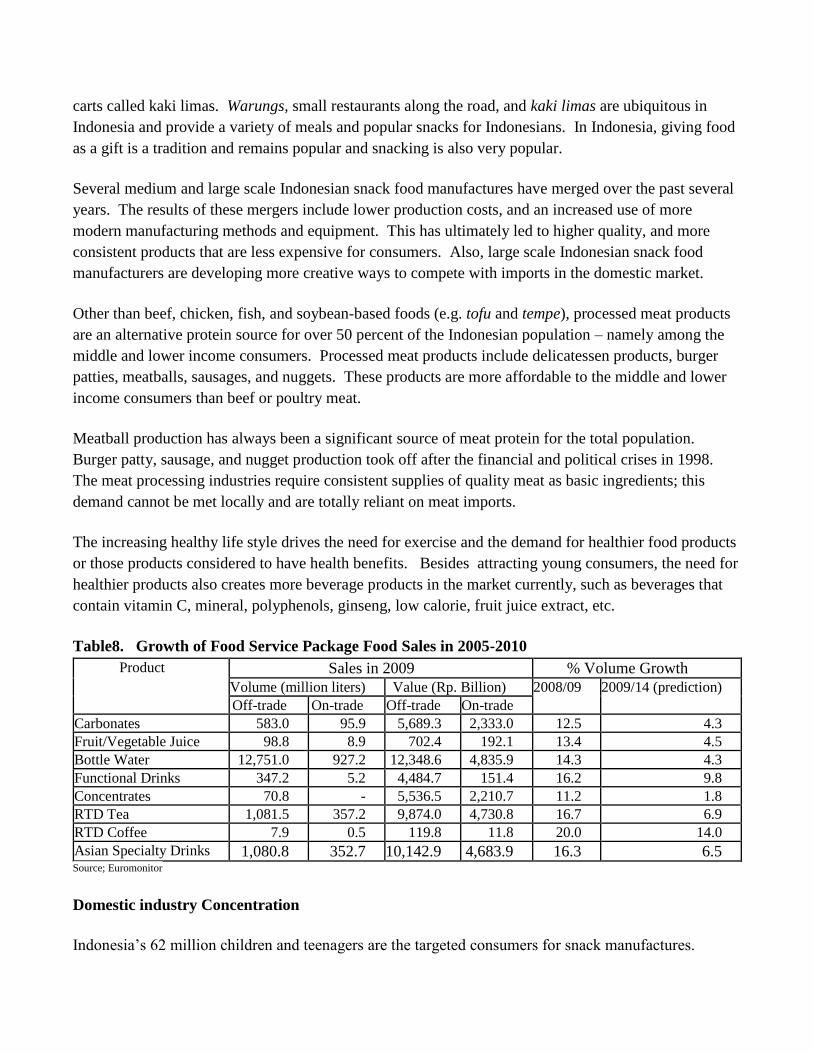
Table8. Growth of Food Service Package Food Sales in 2005-2010
Product Sales in 2009 % Volume Growth
Volume (million liters) Value (Rp. Billion) 2008/09 2009/14 (prediction)
Off-trade On-trade Off-trade On-trade
Carbonates 583.0 95.9 5,689.3 2,333.0 12.5 4.3
Fruit/Vegetable Juice 98.8 8.9 702.4 192.1 13.4 4.5
Bottle Water 12,751.0 927.2 12,348.6 4,835.9 14.3 4.3
Functional Drinks 347.2 5.2 4,484.7 151.4 16.2 9.8
Concentrates 70.8 - 5,536.5 2,210.7 11.2 1.8
RTD Tea 1,081.5 357.2 9,874.0 4,730.8 16.7 6.9
RTD Coffee 7.9 0.5 119.8 11.8 20.0 14.0
Asian Specialty Drinks 1,080.8 352.7 10,142.9 4,683.9 16.3 6.5 Source; Euromonitor
Domestic industry Concentration
Indonesia‟s 62 million children and teenagers are the targeted consumers for snack manufactures.
Medium and low-end manufactures produce snacks almost exclusively for traditional markets, as these
outlets have lower quality and packaging requirements. About five to ten percent of the products go to
modern retailers.
Currently, they are fifteen large-scale snack manufactures in Indonesia. About six of these companies
are manufacturing savory snacks. The numbers of medium and small manufactures are estimated to be
in the thousands; mostly located on Java. The number of these manufactures has increased over sixty
percent during the past five years. Also, many medium-scale snack food manufactures produce bulk
plain snacks, which they sell to larger snack companies for further processing. The large manufactures
add flavoring and packaging and then retail the products under their own specific brand names.
The medium and large scale snack food manufactures distribute their products directly to retailers‟
warehouses, hypermarkets, supermarkets, and minimarkets, and traditional markets. Small vendors
purchase branded snacks from agents, sub-agents, or wholesalers.
Despite energy supply and infrastructure problems, there is several factors contributing to the growth of
the food processing industry are the introduction of new flavors and products, aggressive promotional
activities, growth of modern retail outlets, and growing health awareness particularly among consumers
who were educated in the west.
Smaller ready to eat packages are popular because of lower prices and the variety offered is increasing.
Popular products include frozen poultry, frozen seafood, sausages, sugar confectionery, instant noodles,
sweet and savory snacks, dairy drinks, and soft drinks. New brands and products with local flavors are
also growing. All ages and income levels enjoy extruded snacks and other snacks of all kinds.
More processors are finding adding value by fortifying their products. Currently wheat flour, dairy
products, noodles, cooking oil, cookies, and frozen processed chicken fortified with minerals and
vitamins are for sale in the market. Other products that are growing in popularity include functional
packaged foods, breakfast cereals, fresh and pasteurized milk, yogurt, pasta, and frozen snacks, such as
Chinese snacks, chicken and shrimp puffs, spring rolls, dumplings, and croquettes. Since the large
majority of Indonesians are Muslim, most foods are produced using methods and products that meet
halal requirements. ASEAN free trade agreement creates opportunity to supply food products produce
domestically to other ASEAN countries.
Opportunity for Foreign-Supplied Products
Indonesia offers significant potential for U.S. suppliers of ingredients to the local food processing
sector. Forecast increases in U.S. sales were attributed to more aggressive marketing, Government of
Indonesia (GOI) efforts to promote the local food processing industry, concerns about the safety of
Chinese ingredients, and opportunities to differentiate their products with U.S. ingredients.
Medium and large scale snack food manufactures generally use between 20 percent and 40 percent of
imported ingredients. The remaining ingredients generally consist of locally sourced products.
The demand for processed meat is year round, the survey indicates that most products (65 percent) go to
the wet/traditional markets, while 30 percent goes to modern retailers. The remaining 5 percent is
absorbed by high-end meat products for foodservice industries and upscale retailers.
Rice is a staple eaten at every meal. However, noodles from imported wheat are a popular substitute and
use of wheat continues to grow. Dairy products continue to offer opportunities for U.S. milk
powder to be mixed with fresh milk and as an ingredient. Indonesia currently only produces about 25
percent of milk production needs.
Most importers prefer to work directly with U.S. suppliers in obtaining ingredients for snack
manufactures, rather than work through agents or traders. However, in recent years it has been more
difficult for Indonesian importers to find responsive U.S. suppliers. Demand of imported food
ingredient includes food additive, other food chemical for fortification, and processing aid.
Future food products trend is food that are able to enhance health, convenience, indulgence, ethics, and
environment.
Trend in Promotion and Marketing Strategies
The growing number of more sophisticated, critical and educated Indonesian consumers is leading to an
expanding market for more high value food ingredients and for more value added end products.
Emphasizing of the superiority of food ingredients utilized in the food product advertisements in the
media has proven to be an effective tool in educating the consumers especially children and mother in
TV. Small packaging with nice package design and good quality package is common for children
breakfast or lunch box.
With the growth of modern retail outlets, consumers have better access to a wider variety of foods in
general, and package food in particular, leading to positive growth in the food processing sector.
Consumers with higher levels of education and income seek to consume healthy bread products
containing oats, rye, sunflower seeds, pistachios, walnuts, cranberries, blueberries, and other berries as
they become more health conscious and are exposed to western trends and lifestyles through cable TV
and internet.
Trend in Tourism Sales, Holiday Gift Sales, and Internet Sales
The preferred breads for typical Indonesian consumers include sliced white bread, and bread rolls
stuffed with chocolate, cheese, or meat. Middle and upper income consumers, to include international
tourists and expatriates, demonstrate a growing interest in wheat bread, pastries made with almonds and
other tree nuts, pastries and doughnuts made with blueberries, blackberries, and fresh-fruits tarts. This
segment of the population is eager to try any new bakery products including cheese cakes, muffins,
brownies, cupcakes, fruitcakes, and other Western pastries. Those products are usually bought by the
Indonesian for their family, relatives, friends, and colleagues especially after travel and special day
includes holiday season.
The volumes of ingredients required may increase three to five times more prior to and during the
Ramadan period. In addition, snacks are popular during the fasting month and are exchanged as gifts
during Ramadan among all Indonesians.
Best Product Prospects
Sweet snack foods, which generally include items like sweet biscuits, creamed layered biscuits, butter
cookies, chocolate and cheese wafers, and different types of extruded snacks, to include chocolate and
vanilla rolls, chiki chocolate balls, chocolate filling squares, and chocolate coated square.
Beside for baby food and drinking milk products, the manufactures add imported skim milk powder,
sweet whey, full cream, and demineralized whey to the ingredient mixture and/or as additional
ingredients for chocolate coating and filling. Other imported products, such as egg powder, malt
extract, emulsifier, flavoring, vitamin premix (B1, B2, B6, B12) are used in smaller amounts. Primary
ingredients include wheat flour (although milled from imported wheat), vegetable fats and oils, sugar,
and cocoa powder.
Savory snacks consists of potato chips, corn chips, extruded cheese balls, short sticks (Cheetos),
square/roll stick with cheese filling and/or cheese coating or other fillings. The primary imported
ingredients are mostly corn starch, potato starch, sweet whey, cheese powder, and cream cheese. These
imported items are used in smaller quantities when compared to the primary local ingredients, like corn
powder and dried corn kernel for extruded snack food production.
Various secondary cut, variety meat, offal, chicken meat, and isolated soy protein (ISP) are needed by
processed meat manufacturers.
SECTIONIV. BEST CONSUMER ORIENTED PRODUCT PROSPECT
Best market prospects for imported product, as identified by FAS Jakarta based on The Indonesian
Statistic World Trade Atlas website:
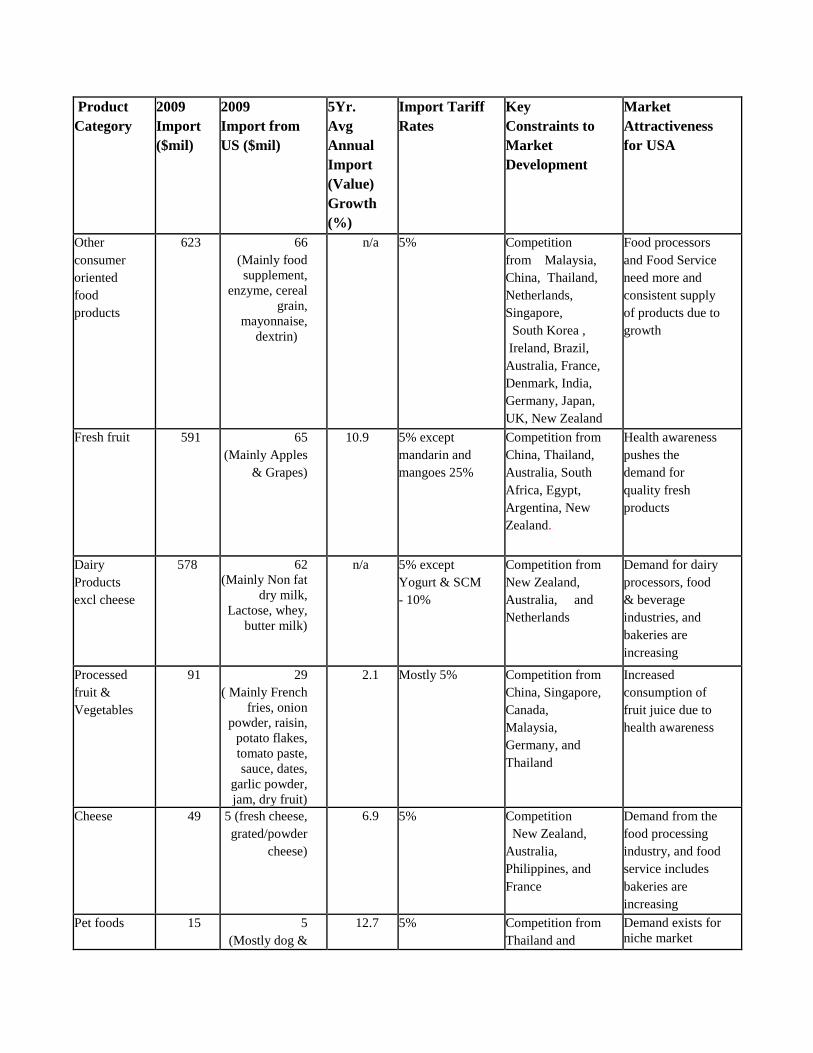
Product
Category
2009
Import
($mil)
2009
Import from
US ($mil)
5Yr.
Avg
Annual
Import
(Value)
Growth
(%)
Import Tariff
Rates
Key
Constraints to
Market
Development
Market
Attractiveness
for USA
Other
consumer
oriented
food
products
623 66 (Mainly food
supplement,
enzyme, cereal
grain,
mayonnaise,
dextrin)
n/a 5% Competition
from Malaysia,
China, Thailand,
Netherlands,
Singapore,
South Korea ,
Ireland, Brazil,
Australia, France,
Denmark, India,
Germany, Japan,
UK, New Zealand
Food processors
and Food Service
need more and
consistent supply
of products due to
growth
Fresh fruit 591 65 (Mainly Apples
& Grapes)
10.9 5% except
mandarin and
mangoes 25%
Competition from
China, Thailand,
Australia, South
Africa, Egypt,
Argentina, New
Zealand.
Health awareness
pushes the
demand for
quality fresh
products
Dairy
Products
excl cheese
578 62 (Mainly Non fat
dry milk,
Lactose, whey,
butter milk)
n/a 5% except
Yogurt & SCM
- 10%
Competition from
New Zealand,
Australia, and
Netherlands
Demand for dairy
processors, food
& beverage
industries, and
bakeries are
increasing
Processed
fruit &
Vegetables
91 29 ( Mainly French
fries, onion
powder, raisin,
potato flakes,
tomato paste,
sauce, dates,
garlic powder,
jam, dry fruit)
2.1 Mostly 5% Competition from
China, Singapore,
Canada,
Malaysia,
Germany, and
Thailand
Increased
consumption of
fruit juice due to
health awareness
Cheese 49 5 (fresh cheese,
grated/powder
cheese)
6.9 5% Competition
New Zealand,
Australia,
Philippines, and
France
Demand from the
food processing
industry, and food
service includes
bakeries are
increasing
Pet foods 15 5 (Mostly dog &
12.7 5% Competition from
Thailand and
Demand exists for
niche market
cat food) Australia
Red meats
fresh,
chilled,
frozen
273 3
18.4 5% Competition from
Australia, New
Zealand, and
Canada. GOI
regulations only
allowed certain
US plan to export
beef to Indonesia
High demand of
prime beef for
high-end
restaurants and
offal for the lower
to mid-class food
service industry
Tree nuts 9.7 2.7 (Mostly
Almonds)
54,4 5% Competition
from Vietnam,
Thailand, Cote d‟
Ivory, Singapore
and local products
Demand from
fast-growing
bakery industry
Fish & Sea
food 119 2.6
(Mostly shrimp,
crab meat, tuna,
cod & other
seafood)
39.1 5% except fish
canning - 10% Competition from
China, Thailand,
Malaysia,
Vietnam, Japan,
South Korea,
Taiwan and local
products
High-end
restaurants need
non-tropical
seafood products
Snack food
excl nuts 42 0.5
(Mainly
confectionary,
potato chips,
popcorn)
-15.8 5% except
chocolate &
other food prep
containing
cocoa 15%;
sweet biscuit,
waffle & wafer
10%, and sugar
confectionary
not containing
cocoa 10%
Competition from
Malaysia, China,
and Singapore
and also Import
registration
number problem
Retail industry
development
pushes sales of
snack food
products
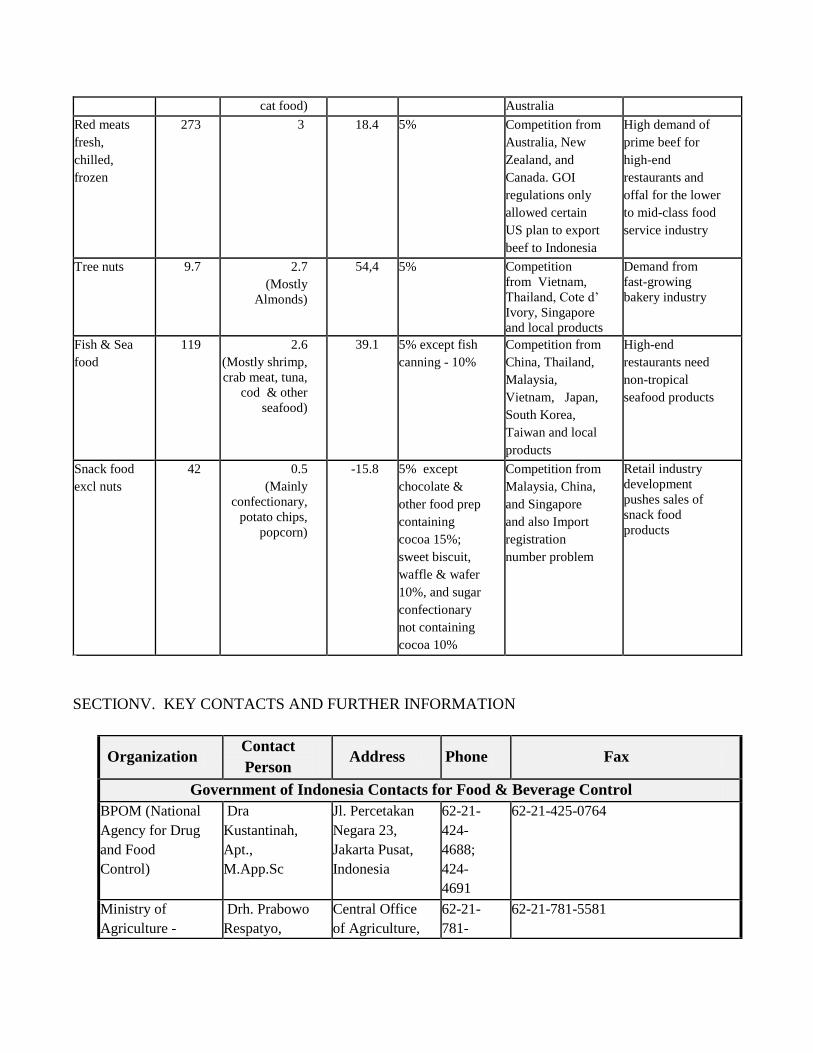
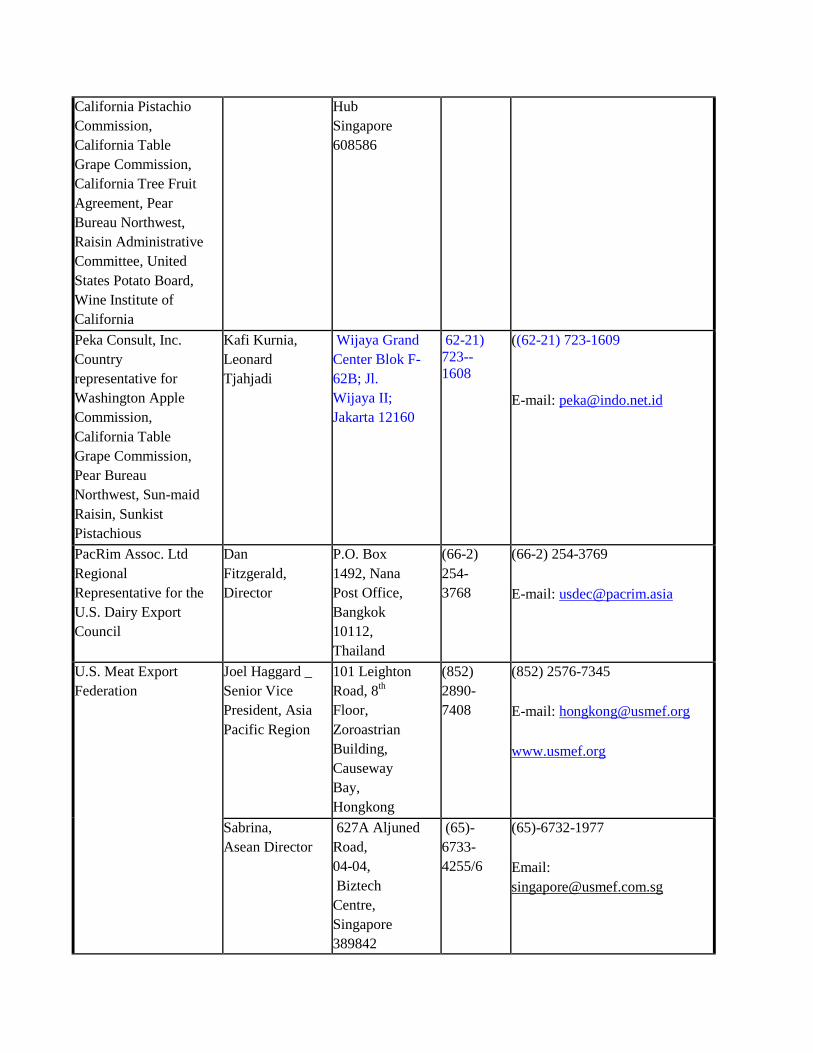
SECTIONV. KEY CONTACTS AND FURTHER INFORMATION
Organization Contact
Person Address Phone Fax
Government of Indonesia Contacts for Food & Beverage Control
BPOM (National
Agency for Drug
and Food
Control)
Dra
Kustantinah,
Apt.,
M.App.Sc
Jl. Percetakan
Negara 23,
Jakarta Pusat,
Indonesia
62-21-
424-
4688;
424-
4691
62-21-425-0764
Ministry of
Agriculture -
Drh. Prabowo
Respatyo,
Central Office
of Agriculture,
62-21-
781-
62-21-781-5581
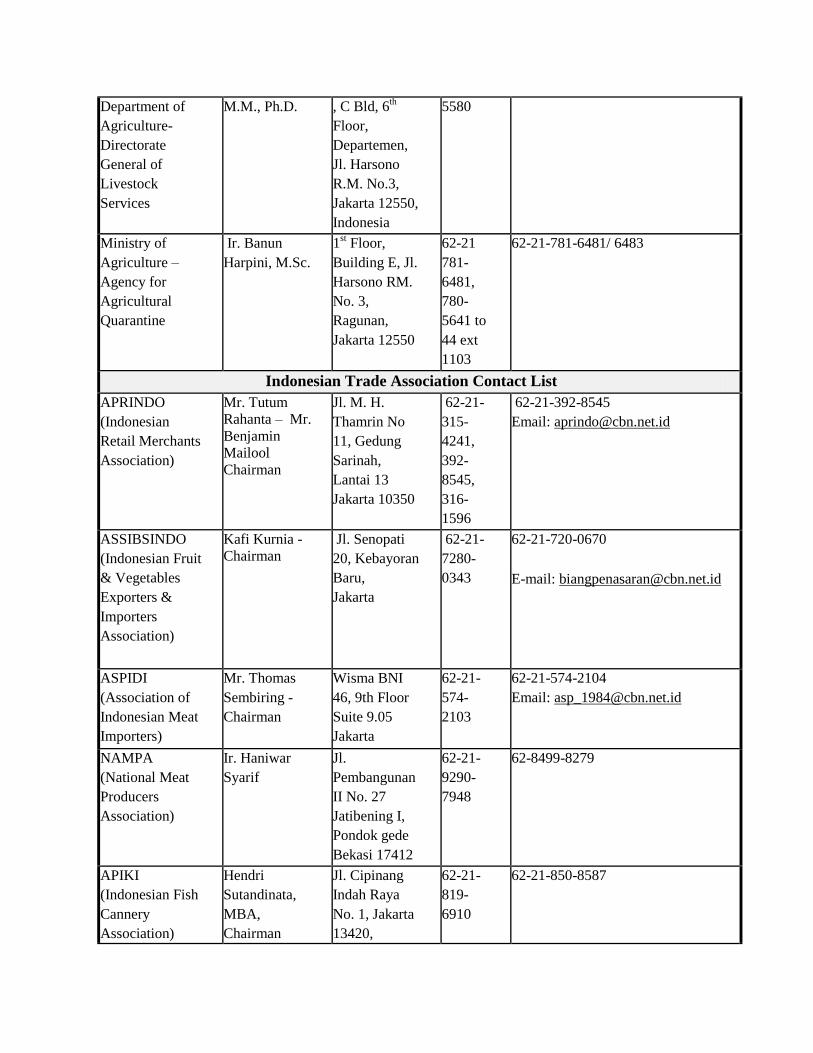
Department of
Agriculture-
Directorate
General of
Livestock
Services
M.M., Ph.D. , C Bld, 6th
Floor,
Departemen,
Jl. Harsono
R.M. No.3,
Jakarta 12550,
Indonesia
5580
Ministry of
Agriculture –
Agency for
Agricultural
Quarantine
Ir. Banun
Harpini, M.Sc.
1st Floor,
Building E, Jl.
Harsono RM.
No. 3,
Ragunan,
Jakarta 12550
62-21
781-
6481,
780-
5641 to
44 ext
1103
62-21-781-6481/ 6483
Indonesian Trade Association Contact List
APRINDO
(Indonesian
Retail Merchants
Association)
Mr. Tutum
Rahanta – Mr.
Benjamin
Mailool Chairman
Jl. M. H.
Thamrin No
11, Gedung
Sarinah,
Lantai 13
Jakarta 10350
62-21-
315-
4241,
392-
8545,
316-
1596
62-21-392-8545
Email: [email protected]
ASSIBSINDO
(Indonesian Fruit
& Vegetables
Exporters &
Importers
Association)
Kafi Kurnia -
Chairman
Jl. Senopati
20, Kebayoran
Baru,
Jakarta
62-21-
7280-
0343
62-21-720-0670
E-mail: [email protected]
ASPIDI
(Association of
Indonesian Meat
Importers)
Mr. Thomas
Sembiring -
Chairman
Wisma BNI
46, 9th Floor
Suite 9.05
Jakarta
62-21-
574-
2103
62-21-574-2104
Email: [email protected]
NAMPA
(National Meat
Producers
Association)
Ir. Haniwar
Syarif
Jl.
Pembangunan
II No. 27
Jatibening I,
Pondok gede
Bekasi 17412
62-21-
9290-
7948
62-8499-8279
APIKI
(Indonesian Fish
Cannery
Association)
Hendri
Sutandinata,
MBA,
Chairman
Jl. Cipinang
Indah Raya
No. 1, Jakarta
13420,
62-21-
819-
6910
62-21-850-8587
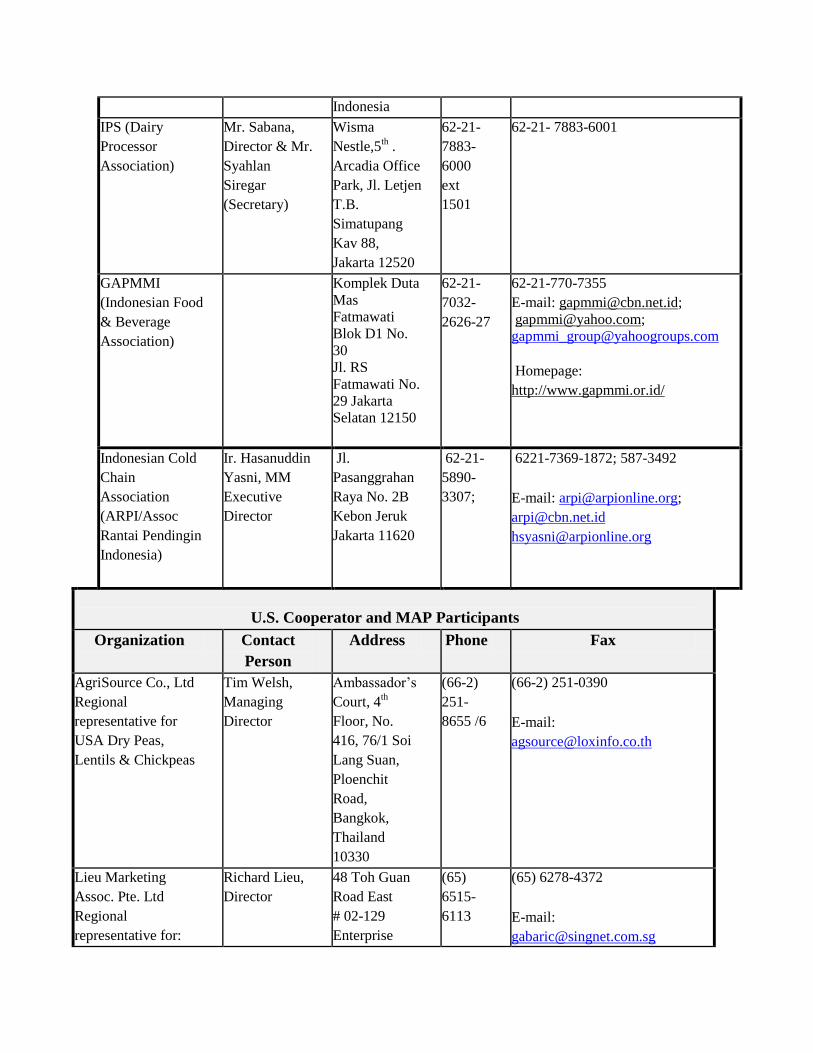
Indonesia
IPS (Dairy
Processor
Association)
Mr. Sabana,
Director & Mr.
Syahlan
Siregar
(Secretary)
Wisma
Nestle,5th .
Arcadia Office
Park, Jl. Letjen
T.B.
Simatupang
Kav 88,
Jakarta 12520
62-21-
7883-
6000
ext
1501
62-21- 7883-6001
GAPMMI
(Indonesian Food
& Beverage
Association)
Komplek Duta
Mas
Fatmawati Blok D1 No.
30 Jl. RS
Fatmawati No.
29 Jakarta Selatan 12150
62-21-
7032-
2626-27
62-21-770-7355
E-mail: [email protected];
Homepage:
http://www.gapmmi.or.id/
Indonesian Cold
Chain
Association
(ARPI/Assoc
Rantai Pendingin
Indonesia)
Ir. Hasanuddin
Yasni, MM
Executive
Director
Jl.
Pasanggrahan
Raya No. 2B
Kebon Jeruk
Jakarta 11620
62-21-
5890-
3307;
6221-7369-1872; 587-3492
E-mail: [email protected];
U.S. Cooperator and MAP Participants
Organization Contact
Person
Address Phone Fax
AgriSource Co., Ltd
Regional
representative for
USA Dry Peas,
Lentils & Chickpeas
Tim Welsh,
Managing
Director
Ambassador‟s
Court, 4th
Floor, No.
416, 76/1 Soi
Lang Suan,
Ploenchit
Road,
Bangkok,
Thailand
10330
(66-2)
251-
8655 /6
(66-2) 251-0390
E-mail:
Lieu Marketing
Assoc. Pte. Ltd
Regional
representative for:
Richard Lieu,
Director
48 Toh Guan
Road East
# 02-129
Enterprise
(65)
6515-
6113
(65) 6278-4372
E-mail:
California Pistachio
Commission,
California Table
Grape Commission,
California Tree Fruit
Agreement, Pear
Bureau Northwest,
Raisin Administrative
Committee, United
States Potato Board,
Wine Institute of
California
Hub
Singapore
608586
Peka Consult, Inc.
Country
representative for
Washington Apple
Commission,
California Table
Grape Commission,
Pear Bureau
Northwest, Sun-maid
Raisin, Sunkist
Pistachious
Kafi Kurnia,
Leonard
Tjahjadi
Wijaya Grand
Center Blok F-
62B; Jl.
Wijaya II;
Jakarta 12160
62-21)
723--
1608
((62-21) 723-1609
E-mail: [email protected]
PacRim Assoc. Ltd
Regional
Representative for the
U.S. Dairy Export
Council
Dan
Fitzgerald,
Director
P.O. Box
1492, Nana
Post Office,
Bangkok
10112,
Thailand
(66-2)
254-
3768
(66-2) 254-3769
E-mail: [email protected]
U.S. Meat Export
Federation
Joel Haggard _
Senior Vice
President, Asia
Pacific Region
101 Leighton
Road, 8th
Floor,
Zoroastrian
Building,
Causeway
Bay,
Hongkong
(852)
2890-
7408
(852) 2576-7345
E-mail: [email protected]
www.usmef.org
Sabrina,
Asean Director
627A Aljuned
Road,
04-04,
Biztech
Centre,
Singapore
389842
(65)-
6733-
4255/6
(65)-6732-1977
Email:
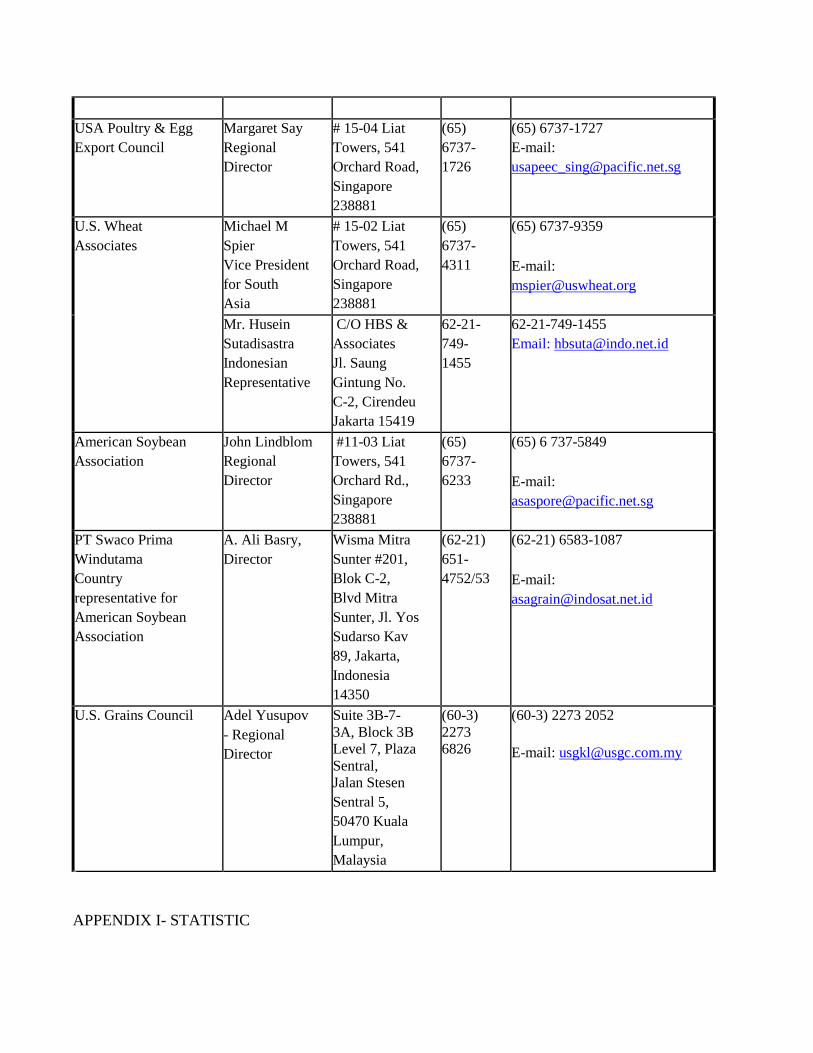
USA Poultry & Egg
Export Council
Margaret Say
Regional
Director
# 15-04 Liat
Towers, 541
Orchard Road,
Singapore
238881
(65)
6737-
1726
(65) 6737-1727
E-mail:
U.S. Wheat
Associates
Michael M
Spier
Vice President
for South
Asia
# 15-02 Liat
Towers, 541
Orchard Road,
Singapore
238881
(65)
6737-
4311
(65) 6737-9359
E-mail:
Mr. Husein
Sutadisastra
Indonesian
Representative
C/O HBS &
Associates
Jl. Saung
Gintung No.
C-2, Cirendeu
Jakarta 15419
62-21-
749-
1455
62-21-749-1455
Email: [email protected]
American Soybean
Association
John Lindblom
Regional
Director
#11-03 Liat
Towers, 541
Orchard Rd.,
Singapore
238881
(65)
6737-
6233
(65) 6 737-5849
E-mail:
PT Swaco Prima
Windutama
Country
representative for
American Soybean
Association
A. Ali Basry,
Director
Wisma Mitra
Sunter #201,
Blok C-2,
Blvd Mitra
Sunter, Jl. Yos
Sudarso Kav
89, Jakarta,
Indonesia
14350
(62-21)
651-
4752/53
(62-21) 6583-1087
E-mail:
U.S. Grains Council
Adel Yusupov
- Regional
Director
Suite 3B-7-
3A, Block 3B Level 7, Plaza
Sentral, Jalan Stesen
Sentral 5,
50470 Kuala
Lumpur,
Malaysia
(60-3)
2273
6826
(60-3) 2273 2052
E-mail: [email protected]
APPENDIX I- STATISTIC
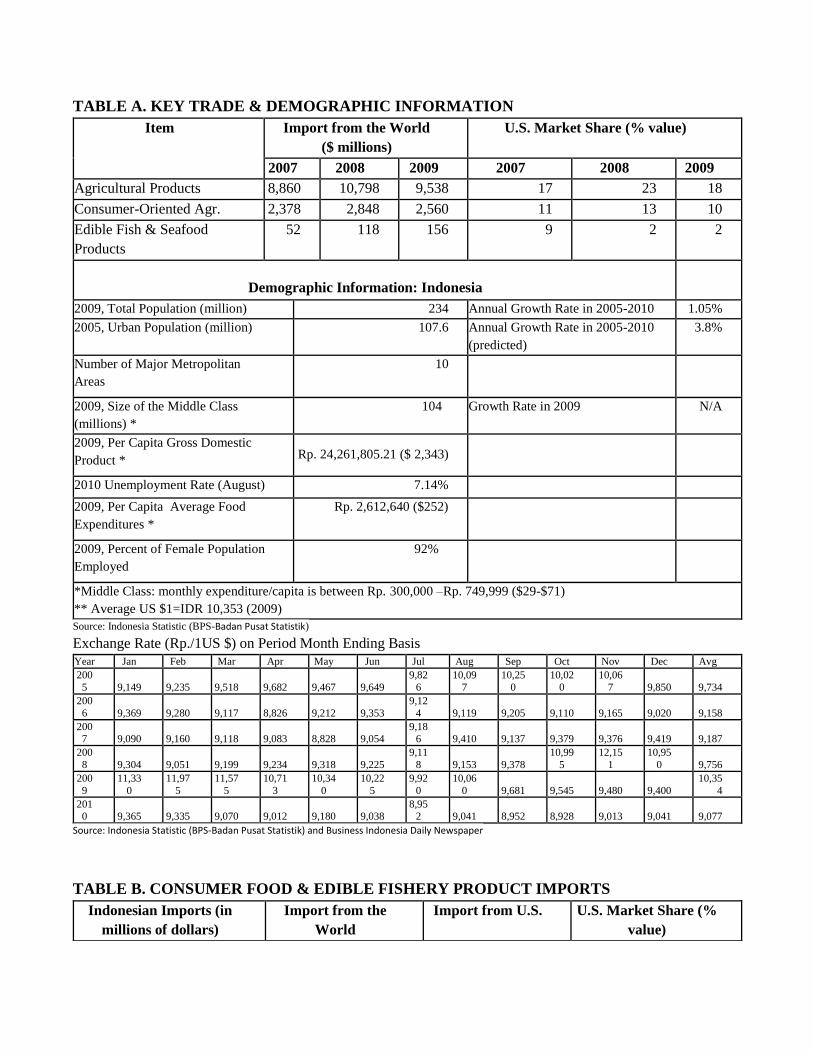
TABLE A. KEY TRADE & DEMOGRAPHIC INFORMATION
Item
Import from the World
($ millions)
U.S. Market Share (% value)
2007 2008 2009 2007 2008 2009
Agricultural Products 8,860 10,798 9,538 17 23 18
Consumer-Oriented Agr. 2,378 2,848 2,560 11 13 10
Edible Fish & Seafood
Products
52 118 156 9 2 2
Demographic Information: Indonesia
2009, Total Population (million) 234 Annual Growth Rate in 2005-2010 1.05%
2005, Urban Population (million) 107.6 Annual Growth Rate in 2005-2010
(predicted) 3.8%
Number of Major Metropolitan
Areas 10
2009, Size of the Middle Class
(millions) * 104 Growth Rate in 2009 N/A
2009, Per Capita Gross Domestic
Product * Rp. 24,261,805.21 ($ 2,343)
2010 Unemployment Rate (August) 7.14%
2009, Per Capita Average Food
Expenditures * Rp. 2,612,640 ($252)
2009, Percent of Female Population
Employed 92%
*Middle Class: monthly expenditure/capita is between Rp. 300,000 –Rp. 749,999 ($29-$71) ** Average US $1=IDR 10,353 (2009) Source: Indonesia Statistic (BPS-Badan Pusat Statistik)
Exchange Rate (Rp./1US $) on Period Month Ending Basis
Year Jan Feb Mar Apr May Jun Jul Aug Sep Oct Nov Dec Avg 200
5 9,149 9,235 9,518 9,682 9,467 9,649 9,82
6 10,09
7 10,25
0 10,02
0 10,06
7 9,850 9,734 200
6 9,369 9,280 9,117 8,826 9,212 9,353 9,12
4 9,119 9,205 9,110 9,165 9,020 9,158 2007 9,090 9,160 9,118 9,083 8,828 9,054
9,186 9,410 9,137 9,379 9,376 9,419 9,187
200
8 9,304 9,051 9,199 9,234 9,318 9,225 9,11
8 9,153 9,378 10,99
5 12,15
1 10,95
0 9,756 200
9 11,33
0 11,97
5 11,57
5 10,71
3 10,34
0 10,22
5 9,92
0 10,06
0 9,681 9,545 9,480 9,400 10,35
4 2010 9,365 9,335 9,070 9,012 9,180 9,038
8,952 9,041 8,952 8,928 9,013 9,041 9,077
Source: Indonesia Statistic (BPS-Badan Pusat Statistik) and Business Indonesia Daily Newspaper
TABLE B. CONSUMER FOOD & EDIBLE FISHERY PRODUCT IMPORTS
Indonesian Imports (in
millions of dollars)
Import from the
World
Import from U.S. U.S. Market Share (%
value)
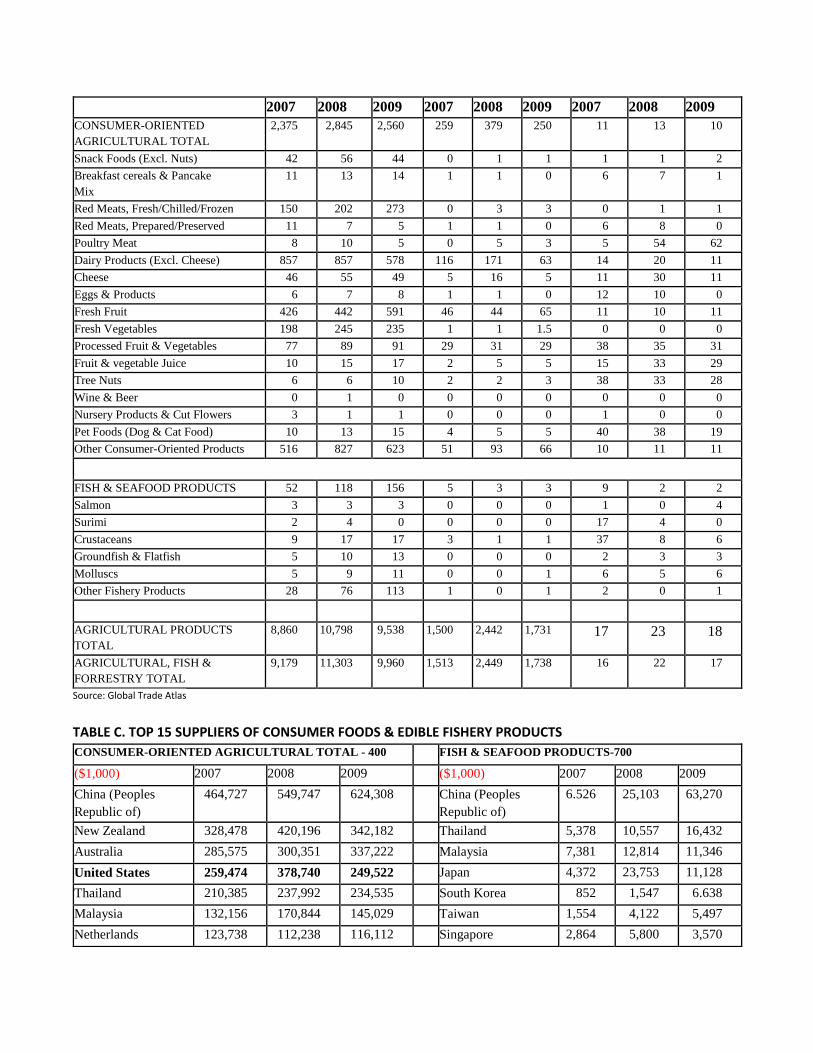
2007 2008 2009 2007 2008 2009 2007 2008 2009
CONSUMER-ORIENTED
AGRICULTURAL TOTAL 2,375 2,845 2,560 259 379 250 11 13 10
Snack Foods (Excl. Nuts) 42 56 44 0 1 1 1 1 2 Breakfast cereals & Pancake
Mix 11 13 14 1 1 0 6 7 1
Red Meats, Fresh/Chilled/Frozen 150 202 273 0 3 3 0 1 1 Red Meats, Prepared/Preserved 11 7 5 1 1 0 6 8 0 Poultry Meat 8 10 5 0 5 3 5 54 62 Dairy Products (Excl. Cheese) 857 857 578 116 171 63 14 20 11 Cheese 46 55 49 5 16 5 11 30 11 Eggs & Products 6 7 8 1 1 0 12 10 0 Fresh Fruit 426 442 591 46 44 65 11 10 11 Fresh Vegetables 198 245 235 1 1 1.5 0 0 0 Processed Fruit & Vegetables 77 89 91 29 31 29 38 35 31 Fruit & vegetable Juice 10 15 17 2 5 5 15 33 29 Tree Nuts 6 6 10 2 2 3 38 33 28 Wine & Beer 0 1 0 0 0 0 0 0 0 Nursery Products & Cut Flowers 3 1 1 0 0 0 1 0 0 Pet Foods (Dog & Cat Food) 10 13 15 4 5 5 40 38 19 Other Consumer-Oriented Products 516 827 623 51 93 66 10 11 11
FISH & SEAFOOD PRODUCTS 52 118 156 5 3 3 9 2 2 Salmon 3 3 3 0 0 0 1 0 4 Surimi 2 4 0 0 0 0 17 4 0 Crustaceans 9 17 17 3 1 1 37 8 6 Groundfish & Flatfish 5 10 13 0 0 0 2 3 3 Molluscs 5 9 11 0 0 1 6 5 6 Other Fishery Products 28 76 113 1 0 1 2 0 1
AGRICULTURAL PRODUCTS
TOTAL 8,860 10,798 9,538 1,500 2,442 1,731 17 23 18
AGRICULTURAL, FISH &
FORRESTRY TOTAL 9,179 11,303 9,960 1,513 2,449 1,738 16 22 17
Source: Global Trade Atlas
TABLE C. TOP 15 SUPPLIERS OF CONSUMER FOODS & EDIBLE FISHERY PRODUCTS
CONSUMER-ORIENTED AGRICULTURAL TOTAL - 400 FISH & SEAFOOD PRODUCTS-700
($1,000) 2007 2008 2009 ($1,000) 2007 2008 2009
China (Peoples
Republic of) 464,727 549,747 624,308 China (Peoples
Republic of) 6.526 25,103 63,270
New Zealand 328,478 420,196 342,182 Thailand 5,378 10,557 16,432
Australia 285,575 300,351 337,222 Malaysia 7,381 12,814 11,346
United States 259,474 378,740 249,522 Japan 4,372 23,753 11,128
Thailand 210,385 237,992 234,535 South Korea 852 1,547 6.638
Malaysia 132,156 170,844 145,029 Taiwan 1,554 4,122 5,497
Netherlands 123,738 112,238 116,112 Singapore 2,864 5,800 3,570
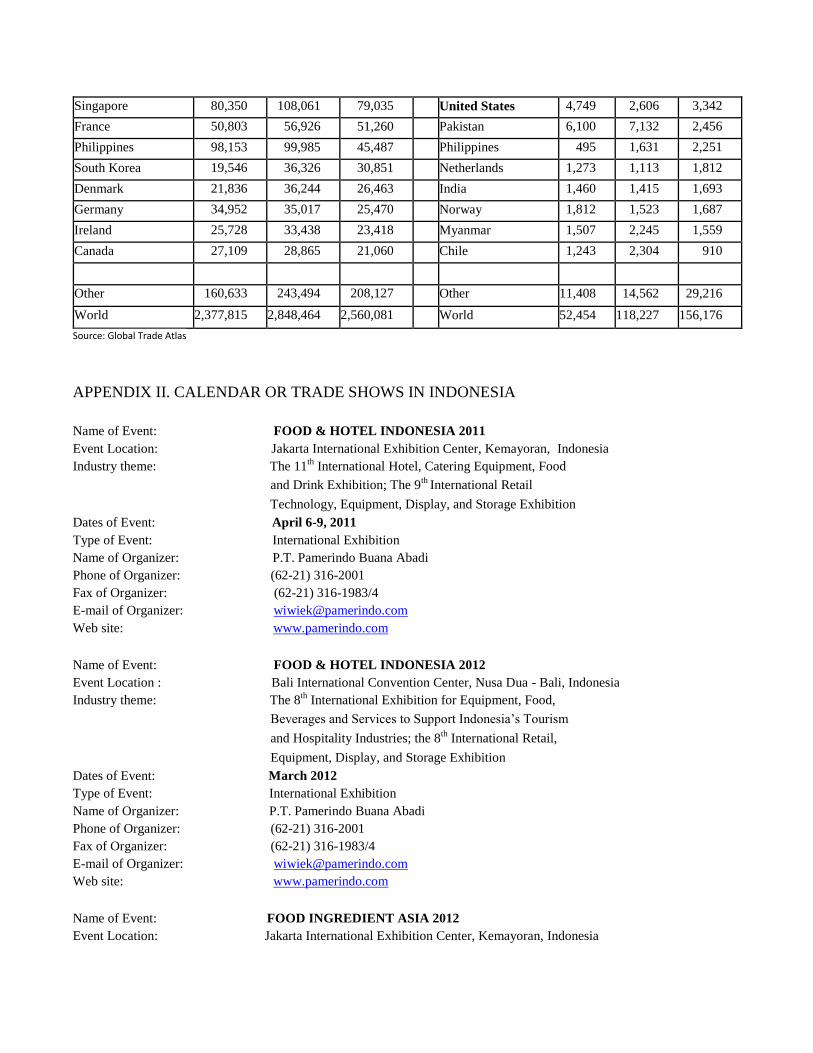
Singapore 80,350 108,061 79,035 United States 4,749 2,606 3,342
France 50,803 56,926 51,260 Pakistan 6,100 7,132 2,456
Philippines 98,153 99,985 45,487 Philippines 495 1,631 2,251
South Korea 19,546 36,326 30,851 Netherlands 1,273 1,113 1,812
Denmark 21,836 36,244 26,463 India 1,460 1,415 1,693
Germany 34,952 35,017 25,470 Norway 1,812 1,523 1,687
Ireland 25,728 33,438 23,418 Myanmar 1,507 2,245 1,559
Canada 27,109 28,865 21,060 Chile 1,243 2,304 910
Other 160,633 243,494 208,127 Other 11,408 14,562 29,216
World 2,377,815 2,848,464 2,560,081 World 52,454 118,227 156,176
Source: Global Trade Atlas
APPENDIX II. CALENDAR OR TRADE SHOWS IN INDONESIA
Name of Event: FOOD & HOTEL INDONESIA 2011
Event Location: Jakarta International Exhibition Center, Kemayoran, Indonesia
Industry theme: The 11th
International Hotel, Catering Equipment, Food
and Drink Exhibition; The 9th
International Retail
Technology, Equipment, Display, and Storage Exhibition
Dates of Event: April 6-9, 2011
Type of Event: International Exhibition
Name of Organizer: P.T. Pamerindo Buana Abadi
Phone of Organizer: (62-21) 316-2001
Fax of Organizer: (62-21) 316-1983/4
E-mail of Organizer: [email protected]
Web site: www.pamerindo.com
Name of Event: FOOD & HOTEL INDONESIA 2012
Event Location : Bali International Convention Center, Nusa Dua - Bali, Indonesia
Industry theme: The 8th
International Exhibition for Equipment, Food,
Beverages and Services to Support Indonesia‟s Tourism
and Hospitality Industries; the 8th
International Retail,
Equipment, Display, and Storage Exhibition
Dates of Event: March 2012
Type of Event: International Exhibition
Name of Organizer: P.T. Pamerindo Buana Abadi
Phone of Organizer: (62-21) 316-2001
Fax of Organizer: (62-21) 316-1983/4
E-mail of Organizer: [email protected]
Web site: www.pamerindo.com
Name of Event: FOOD INGREDIENT ASIA 2012
Event Location: Jakarta International Exhibition Center, Kemayoran, Indonesia

Industry theme: The only exhibition that unites the growing ASEAN food
ingredients community in one place and alternate with
FiA Bangkok. The fair encompasses all ingredients which
makes the food and beverage we consume today, such
as sweeteners, emulsifiers, flavoring, coloring, etc
Dates of Event: September 2012
Type of Event: International Exhibition
Name of Organizer: P.T. Media Artha Sentosa
Phone of Organizer: (62-21) 7060-8638
Fax of Organizer: (62-21) 5830-1097
E-mail of Organizer: [email protected]
Web site: www.ingredientsnetwork.com
Related Documents