Welcome message from author
This document is posted to help you gain knowledge. Please leave a comment to let me know what you think about it! Share it to your friends and learn new things together.
Transcript


Exploring the Digital Nation: Embracing the Mobile Internet
i
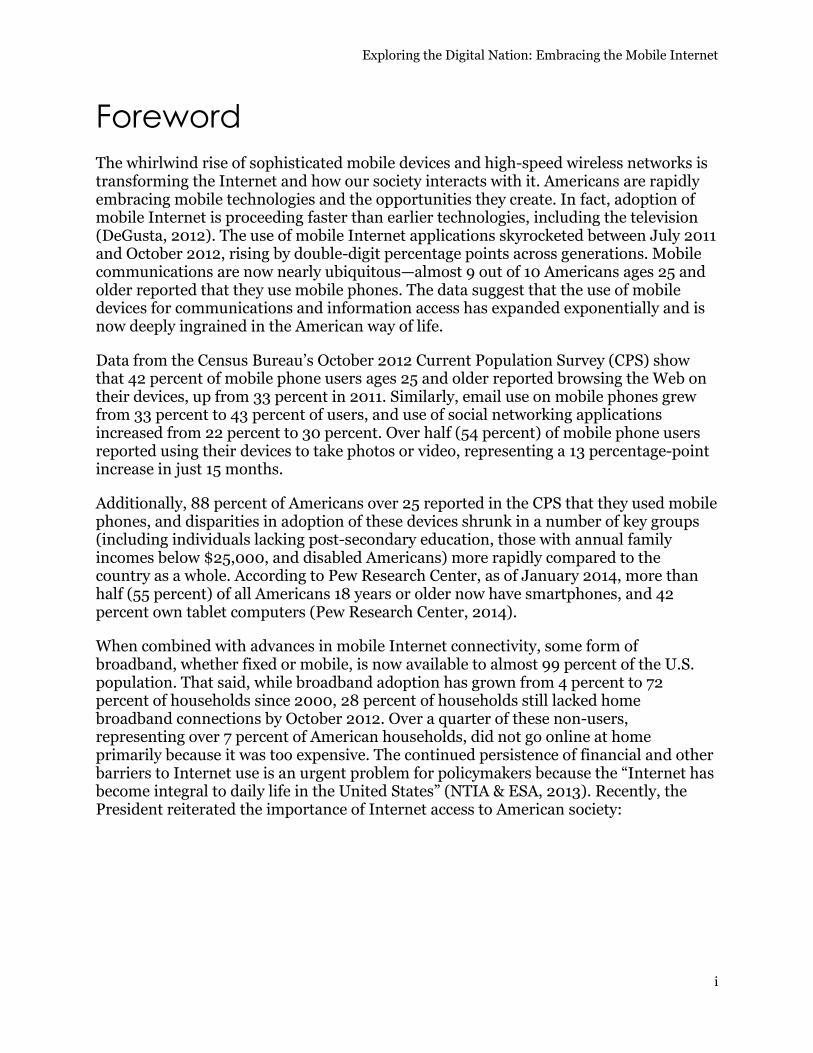
Foreword The whirlwind rise of sophisticated mobile devices and high-speed wireless networks is transforming the Internet and how our society interacts with it. Americans are rapidly embracing mobile technologies and the opportunities they create. In fact, adoption of mobile Internet is proceeding faster than earlier technologies, including the television (DeGusta, 2012). The use of mobile Internet applications skyrocketed between July 2011 and October 2012, rising by double-digit percentage points across generations. Mobile communications are now nearly ubiquitous—almost 9 out of 10 Americans ages 25 and older reported that they use mobile phones. The data suggest that the use of mobile devices for communications and information access has expanded exponentially and is now deeply ingrained in the American way of life.
Data from the Census Bureau’s October 2012 Current Population Survey (CPS) show that 42 percent of mobile phone users ages 25 and older reported browsing the Web on their devices, up from 33 percent in 2011. Similarly, email use on mobile phones grew from 33 percent to 43 percent of users, and use of social networking applications increased from 22 percent to 30 percent. Over half (54 percent) of mobile phone users reported using their devices to take photos or video, representing a 13 percentage-point increase in just 15 months.
Additionally, 88 percent of Americans over 25 reported in the CPS that they used mobile phones, and disparities in adoption of these devices shrunk in a number of key groups (including individuals lacking post-secondary education, those with annual family incomes below $25,000, and disabled Americans) more rapidly compared to the country as a whole. According to Pew Research Center, as of January 2014, more than half (55 percent) of all Americans 18 years or older now have smartphones, and 42 percent own tablet computers (Pew Research Center, 2014).
When combined with advances in mobile Internet connectivity, some form of broadband, whether fixed or mobile, is now available to almost 99 percent of the U.S. population. That said, while broadband adoption has grown from 4 percent to 72 percent of households since 2000, 28 percent of households still lacked home broadband connections by October 2012. Over a quarter of these non-users, representing over 7 percent of American households, did not go online at home primarily because it was too expensive. The continued persistence of financial and other barriers to Internet use is an urgent problem for policymakers because the “Internet has become integral to daily life in the United States” (NTIA & ESA, 2013). Recently, the President reiterated the importance of Internet access to American society:

Exploring the Digital Nation: Embracing the Mobile Internet
ii
If you think about the history of America, we united a continent by rail. We stretched a network of highways from sea to shining sea. We brought light to dark and remote areas. We connected the world through the Internet, through our imagination. All these projects created jobs. All these projects grew our economy. They also unified the country and they are unifying the world.
—President Obama on Technology in Schools, June 6, 2013
This report is the latest edition of our Digital Nation series, and it is based on data collected by the U.S. Census Bureau at the request of NTIA. Against this backdrop of data, today’s Internet-connected society raises a range of significant policy issues, including questions about spectrum use, universal service, copyright, privacy, security, and the economy itself.
The data collected from NTIA’s Broadband Technology Opportunities Program (BTOP) and the State Broadband Data and Development grants that supported data collection for the National Broadband Map, as well as the CPS data, provide insight for the President’s wireless initiative, the Federal digital literacy programs, and the FCC’s universal service reform initiative. These efforts will also help state and local policymakers throughout the country, in cooperation with private partners, to make sound, fact-based decisions that will improve America’s productivity, ingenuity, world competitiveness, and standard of living.
Consistent with this Administration’s resolve to maintain a transparent and open government, the survey data utilized in this report are publicly available for use and analysis by academic and policy researchers and others interested in the state of Internet use in America.

Exploring the Digital Nation: Embracing the Mobile Internet
iii
Acknowledgments National Telecommunications and Information Administration Lawrence E. Strickling Assistant Secretary for Communications and Information
Angela M. Simpson Deputy Assistant Secretary for Communications and Information
John B. Morris, Jr. Associate Administrator for Policy Analysis and Development
Evelyn L. Remaley Deputy Associate Administrator for Policy Analysis and Development
James McConnaughey Chief Economist (Retired)
Maureen A. Lewis Director of Minority Telecommunications Development
Rafi M. Goldberg Policy Analyst
Deborah Goldman Intern Danna Gabel O’Rourke Intern The Project Team gratefully acknowledges Anne Neville and Paul Berry of NTIA; David Beede of the Economics and Statistics Administration; Lisa Clement, Gregory Weyland, Mary Beth Eldridge, Kyra Linse, Karen Woods, Tim Marhsall, Agatha Heesock Jung, Sunhak Kim, Kurt Bauman, and Thomas File of the U.S. Census Bureau; and Peter Stenberg of the U.S. Department of Agriculture for their assistance with this report.


Exploring the Digital Nation: Embracing the Mobile Internet
v
Executive Summary Exploring the Digital Nation: Embracing the Mobile Internet builds on the last Digital Nation study (NTIA & ESA, 2013) and examines data from the 2012 Current Population Survey (CPS) describing Americans’ use of computers and the Internet. Data from this survey depict the accelerating popularity of mobile phone-based Internet use across American demographic groups. The Census Bureau collected data from over 53,000 households in the October 2012 CPS Computer and Internet Use Supplement, forming a representative sample of the 122 million households across the United States. NTIA’s analysis of this dataset, summarized below, reveals a mobile Internet explosion, accompanied by narrowing but persistent disparities in computer ownership and Internet use overall.
As in all installments of Digital Nation, this report includes NTIA’s analysis of the demographic characteristics of home Internet users and the technologies they use to go online, as well as the alternative locations where they use the Internet. The report also presents data on the primary reasons why some Americans do not access the Internet from their homes. These data can inform further research and policy that strives to eliminate disparities by increasing the availability of affordable broadband in the United States and promoting broadband adoption by all Americans.
Highlights of this report include the following:
Online On-the-Go with Mobile Phones Mobile Internet usage has grown substantially across demographic categories.
• In October 2012, mobile phone users were exploiting their devices’ enhanced capabilities for much more than just voice communications. Over a 15-month period, the proportion of users who downloaded mobile applications jumped by ten percentage points, from 22 to 32 percent. In addition, 54 percent of mobile phone users at least 25 years of age reported taking photos or videos with their phones, 43 percent stated they checked or sent email, and 42 percent browsed the Web. Each of the latter two activities increased in prevalence by 9 percentage points since the July 2011 survey.
• Eighty-eight percent of Americans ages 25 and older used mobile phones by October 2012, up 2 percentage points from July 2011. This growth reflects an encouraging narrowing of the adoption gap among historically disadvantaged groups. For example, mobile phone use increased 4 percentage points each among individuals with family incomes below $25,000 (73 percent to 77 percent) and people with disabilities (68 percent to 72 percent).
• Use of Internet-dependent applications on mobile phones varied significantly based on educational attainment, family income, and population density. For example, among mobile phone users ages 25 and older, 57 percent of college
Exploring the Digital Nation: Embracing the Mobile Internet
vi
graduates stated they checked or sent email, and 54 percent of users with college degrees browsed the Web on their mobile phones, compared to 19 percent and 21 percent, respectively, of those with no high school diploma. A 36 percentage-point gap exists between the 63 percent of mobile phone users with family incomes of $100,000 or more who used their devices for email and the 27 percent of users with family incomes below $25,000 who did so. Even as mobile phones approach ubiquity and traditional disparities in adoption shrink, there is evidence of a socioeconomic-based digital divide in usage patterns. Examination of population density also revealed differences in users’ propensity to browse the Web on their mobile phones, with 44 percent of urban dwellers reporting they used their mobile phones for that purpose compared to 31 percent of rural residents.
• NTIA modeled the probability that mobile phone users ages 25 and older checked or sent email, browsed the Web, downloaded apps, and used online social networks through a technique known as multivariate regression analysis. The regression models enabled NTIA to study how various demographic and geographic characteristics correlate with these activities when holding other factors constant. The results were largely consistent across activities, with higher income and education levels strongly correlating with an increased probability of undertaking the activities.
• The regression models predict that female mobile phone users were 5 percentage points more likely to use social networks on their devices than their male counterparts. Further, the results suggest associations between geographic region and Internet-based mobile phone activities. The model forecasts that users in the West were between 6 and 8 percentage points more likely to use their phones for the studied purposes than their counterparts in the Northeast, and users in the South and Midwest exhibited smaller increases in these activities.
The Diminishing Digital Divide: Adoption Demographics According to 2012 CPS data, U.S. broadband adoption continued to grow.
• Seventy-two percent of U.S. households used broadband at home in 2012, while home computer use grew to 79 percent, representing a 3 percentage-point gain in both activities from 2011 (69 percent and 76 percent, respectively). Two percent of households continued to rely on dial-up service, which raised the percentage of households engaged in any home Internet use to approximately 75 percent.
• Over the five years from 2007 to 2012, home broadband use by persons 65 and older rose dramatically, increasing from 32 percent to 47 percent, a 15 percentage-point increase.
• Persons 16 years and older who use the Internet at any location grew from 151 million in October 2007 to 187 million in October 2012, an increase of over 18 percent after adjusting for population growth.

Exploring the Digital Nation: Embracing the Mobile Internet
vii
• Libraries were important locations of Internet access across all income and educational brackets (used by 11 percent of households nationally), but especially so for unemployed householders (20 percent), households with school-age children (18 percent) and African Americans (16 percent).
• In 2012, 83 percent of households headed by an employed person reported using the Internet at home, compared to 70 percent of unemployed respondents. In 2007, only 71 percent of employed householders and 56 percent of unemployed householders used the Internet at home, resulting in a 13 and 15 percentage-point increase, respectively, over five years.
Persistent Gaps in Home Internet Use In 2012, a significant portion—28 percent—of American households did not use broadband at home. Households commonly cited several primary reasons for non-use.
• No Need or Interest: Over time, U.S. households without the Internet at home have most often cited a lack of need or interest as the main reason why they did not go online at home. Although 48 percent of non-using households gave this reason in both 2011 and 2012, the figure rose from 39 percent in 2003. Consistently, White and Asian American households were most likely to express a lack of interest in going online at home. American Indian and Alaska Native households have been the least likely to say they lacked a need or interest in going online at home. In 2012, households led by people with disabilities citing lack of interest or need for home Internet use increased to 56 percent of non-users, compared to 51 percent in 2011. Households with school-age children that lacked home Internet service were 7 percentage points less likely to state they did not need to use the Internet at home at 47 percent, compared to 54 percent of those without school-age children. Non-using householders ages 65 or older were the least interested in going online at home, and the frequency with which seniors gave this response rose 3 percentage points from 67 percent in 2011 to 70 percent in 2012.
• Expense: Affordability concerns deterred the next largest segment of households from going online at home. In 2012, as in past years, this reason was the second most popular explanation for no home Internet use, at 29 percent of non-using households. Viewed from a different perspective, these figures indicate that 7 percent of all American households do not have Internet service at home because of the cost. Among households not online, unemployed householders (58 percent), the youngest householders 15 to 24 years old (50 percent), those with family incomes below $25,000 (32 percent), and homes with children in school (30 percent) responded most often in 2012 that cost concerns prevented them from using the Internet at home. While White households not online (20 percent) continued to be the least concerned about the high cost of accessing the Internet in their homes, the proportion of other ethnic groups citing expense grew between 2011 and 2012. During that period, householders of American Indian or Alaska Native origin who did not go online at home became dramatically more
Exploring the Digital Nation: Embracing the Mobile Internet
viii
likely to cite expense, increasing by 17 percentage points from 25 percent to 42 percent, followed by a 9 percentage-point increase among Asian American households. More urban households (30 percent) than rural residents (25 percent) that did not use the Internet at home stated that cost was the main reason for non-use.
• No or Inadequate Computer: This reason for not using the Internet at home has continued to decrease in prominence, declining by 2 percentage points between 2011 and 2012 to 11 percent. Data from the 2012 CPS reflected slight differences based on race and ethnicity, with non-using American Indian and Alaska Native households being the least likely at 8 percent to cite the lack of an adequate computer. This figure suggests a sharp 10 percentage-point decline among this group from 2011. Age, education, income, employment status, population density, gender, and the presence of school-age children at home only nominally differentiated households explaining they lacked an adequate computer as their main reason for not connecting to the Internet at home.
Exploring the Digital Nation: Embracing the Mobile Internet
ix
Contents Introduction ........................................................................................................................ 1
The Mobile Transformation ................................................................................................ 4
Mobile Phone Adoption ................................................................................................... 4
Use of Mobile Applications ............................................................................................. 7
Getting Online ................................................................................................................... 14
Internet at Home: Devices, Technologies, and Trends ................................................. 14
Going Online in 2012: Connecting Beyond the Home .................................................. 20
No Internet Use at Home .................................................................................................. 25
No Need or Interest ....................................................................................................... 26
Expense .......................................................................................................................... 30
No or Inadequate Computer .......................................................................................... 33
Other Reasons ................................................................................................................ 35
Can Use It Elsewhere ..................................................................................................... 35
Not Available In Area .................................................................................................... 37
Privacy............................................................................................................................ 37
Conclusion ......................................................................................................................... 38
References ......................................................................................................................... 39
Appendix A: Data and Methodology ................................................................................. 43
Appendix B: Statistical Tables .......................................................................................... 45

Exploring the Digital Nation: Embracing the Mobile Internet
1
Introduction There is considerable evidence that high-speed (broadband) Internet has a positive effect on a nation’s economy and well-being (NTIA & ESA, 2013).1 For example, about 752,000 U.S. jobs come from the mobile applications (“apps”) industry, which followed the rapid spread of smartphones (Mandel, 2013). One analyst estimates that each American consumer can save $8,674 annually by using broadband in a variety of ways (Internet Innovation Alliance, 2013). For example, a recent study found that 69 percent of surveyed baby boomers and seniors over age 54 used their smartphones while shopping in local stores, and half of them did so primarily to comparison shop and find discounts (Cisero, 2014). By the end of 2014, U.S. consumers will spend an estimated $114 billion in online retail sales on smartphones and tablets, which will account for 29 percent of all e-commerce sales, according to analysts’ projections (Mulpuru, 2014). As NTIA stated in its June 2014 progress report on freeing up spectrum for commercial use, “America’s future competitiveness and global technology leadership depend on access to radio spectrum—the lifeblood of smartphones, tablets, and other data-hungry wireless devices.”
Deployment of mobile wireless broadband networks (with speeds of at least 3 Mbps download and 768 Mbps upload) has proliferated in the United States in recent years, resulting in availability of service to 97.5 percent of the nation’s population as of June 30, 2013. Wired broadband availability to Americans by individual technology—fiber (25.2 percent), DSL (74.0 percent), and cable (87.5 percent)—trails the coverage of mobile wireless networks (NTIA & FCC, 2014). There is good news concerning higher-speed Internet as well. Ninety percent of Americans had access to 4G wireless broadband, defined as service with download speeds of at least 6 Mbps, as of the end of 2012. The increase over June 2010 is impressive, gaining approximately 64 percentage points during the span (NTIA, 2013).
Broadband adoption and computer ownership by U.S. households continued their rise in 2012.2 Research suggests that adoption of new technologies typically resembles an S-shaped curve over time (Rogers, 1995). The slopes in Figure 1 have decreased over time but there is little evidence that any of the technologies depicted have reached saturation. Factors that affect the shape of the curve include consumer awareness of the technology, its affordability, accessibility, and ease of use (NTIA & ESA, 2000). 1 Two studies issued in 2013 support the notion that broadband has salient effects. One study asserts that based on an 11-country analysis, the faster the connection speed, the greater the quantifiable benefits to household income and ultimately a nation’s gross domestic product (Arthur D. Little, Chalmers University of Technology, & Ericsson, 2013); while the other argues that for every £1 the government invests in broadband, the UK economy benefits by £20, and that social and environmental benefits also result from broadband use (SQW Group, 2013).
2 Among countries that are members of the Organisation for Economic Co-operation and Development (OECD), a global organization of nations with market economies backed by democratic institutions, the United States ranked number one in terms of total wired (91 million) and wireless (299 million) broadband subscriptions as of June 2013. Arrayed by subscriptions per 100 inhabitants, the United States ranked 16th in wired connections and 7th in wireless (OECD, 2014a & 2014b).
Exploring the Digital Nation: Embracing the Mobile Internet
2
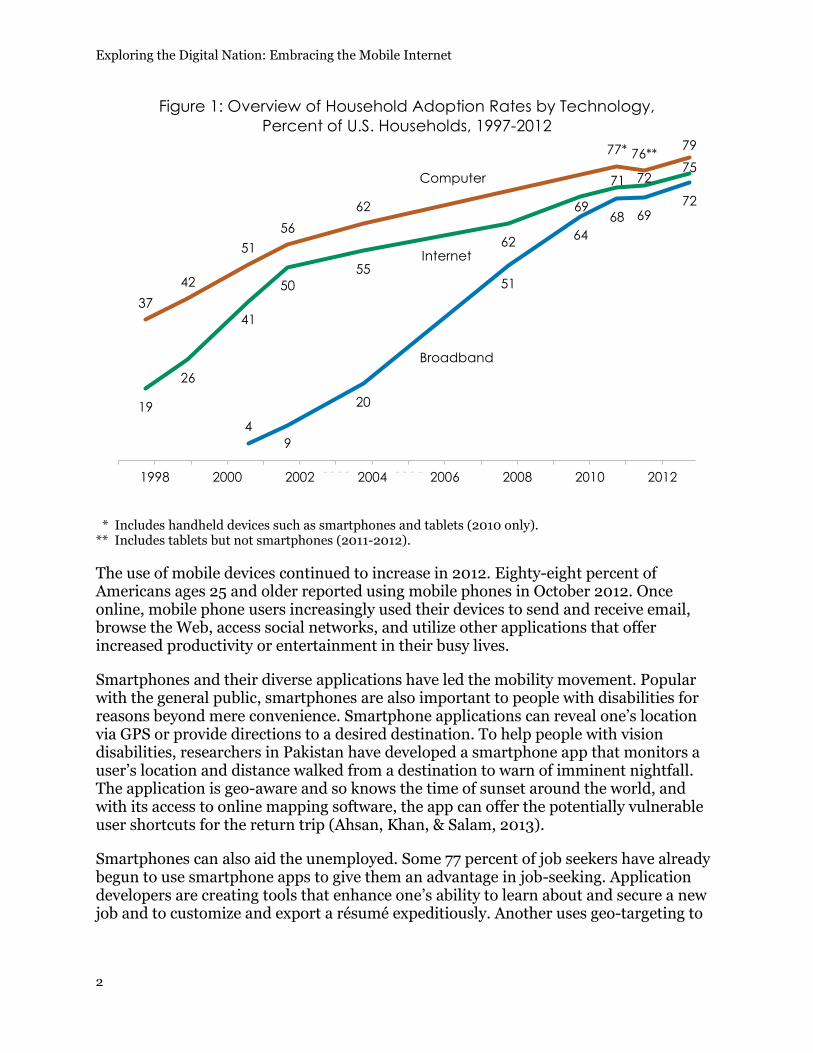
Figure 1: Overview of Household Adoption Rates by Technology, Percent of U.S. Households, 1997-2012
* Includes handheld devices such as smartphones and tablets (2010 only). ** Includes tablets but not smartphones (2011-2012).
The use of mobile devices continued to increase in 2012. Eighty-eight percent of Americans ages 25 and older reported using mobile phones in October 2012. Once online, mobile phone users increasingly used their devices to send and receive email, browse the Web, access social networks, and utilize other applications that offer increased productivity or entertainment in their busy lives.
Smartphones and their diverse applications have led the mobility movement. Popular with the general public, smartphones are also important to people with disabilities for reasons beyond mere convenience. Smartphone applications can reveal one’s location via GPS or provide directions to a desired destination. To help people with vision disabilities, researchers in Pakistan have developed a smartphone app that monitors a user’s location and distance walked from a destination to warn of imminent nightfall. The application is geo-aware and so knows the time of sunset around the world, and with its access to online mapping software, the app can offer the potentially vulnerable user shortcuts for the return trip (Ahsan, Khan, & Salam, 2013).
Smartphones can also aid the unemployed. Some 77 percent of job seekers have already begun to use smartphone apps to give them an advantage in job-seeking. Application developers are creating tools that enhance one’s ability to learn about and secure a new job and to customize and export a résumé expeditiously. Another uses geo-targeting to
19
26
41
50 55
62
69
71 72 75
4 9
20
51
64 68 69
72
37 42
51 56
62
77* 76** 79
1997 1998 1999 2000 2001 2002 2003 2004 2005 2006 2007 2008 2009 2010 2011 2012
Computer
Internet
Broadband

Exploring the Digital Nation: Embracing the Mobile Internet
3
find industry-specific contacts that are open to career networking. One app permits busy job-seekers to create short videos with answers to employer questions (Jackson, 2012).
The sections that follow illustrate the results of the Current Population Survey (CPS) Computer and Internet Use Supplement, collected by the Census Bureau in October 2012 at the request of NTIA. In the next section, we provide an analysis of mobility in the online world. The data suggest that the use of mobile devices for communications and information access has expanded exponentially, becoming an essential element of American daily life. The focus then turns to adoption, with a longitudinal analysis of devices of choice, Internet technologies, demographics, geography, and locations of Internet use. We believe that, while progress continues in home broadband adoption, disparities among groups and areas persist, and libraries and other public access points provide alternative venues for Internet use. The final section contains new evidence as to why some U.S. households remained unconnected in 2012, providing key insights for policymakers seeking to expand Internet usage to all Americans.
Exploring the Digital Nation: Embracing the Mobile Internet
4
The Mobile Transformation Digital Nation reports have historically focused on trends in computer and Internet use in the United States that highlight policy choices that might further accelerate adoption. Getting more Americans online remains vital to the nation’s future. However, policymakers should note that in recent years there have been fundamental changes in the way people use the Internet. Through a combination of faster wireless data networks, advances in the miniaturization of computing hardware, and innovations in human-computer interaction, the Internet is now in people’s pockets and at their fingertips, available to many at almost any time and location.
To date, adoption of mobile computing technologies has primarily been in the form of mobile phones with advanced capabilities (“smartphones”) and tablet computers. NTIA tracked the use of mobile phones in the July 2011 and October 2012 CPS Supplements, and the results are discussed in this section. The 2012 survey, which was less detailed than the 2011 survey, did not distinguish usage of tablets from desktop and laptop computers. Data from upcoming CPS Supplements will enable us to track growth in tablet adoption since the 2011 survey, which showed that 9 percent of Internet users reported using tablets to go online (NTIA and ESA, 2013). Research by the Pew Research Center suggests that 42 percent of Americans ages 18 and older owned tablet computers by January 2014; that number rises to 50 percent if e-readers are included (Pew Research Center, 2014).
Eighty-eight percent of Americans ages 25 and older used mobile phones as of October 2012. While this represents a small (2 percentage-point) increase from July 2011, mobile phone usage is evolving in two important ways. First, mobile phones are becoming more common among historically disadvantaged groups; the adoption gap is shrinking across demographic and socioeconomic groups. Second, Americans are taking advantage of the wide range of new functionalities made possible by the fast Internet connections and advanced hardware present in contemporary mobile phones. However, there are some significant disparities in phone usage patterns. Among mobile phone users, use of Internet-based applications is primarily a function of income, education, and age, even after controlling for a range of demographic variables.
Mobile Phone Adoption The July 2011 CPS Supplement revealed different levels of mobile phone adoption based on income, education, race, and other factors, suggesting this technology is subject to a digital divide similar to those found in computer and Internet use (as described in previous Digital Nation reports). We are encouraged, however, that disparities in mobile phone use dropped significantly by the time of the October 2012 data collection. The small overall increase in mobile phone adoption during this time masks a more interesting story: adoption among historically lagging groups increased more quickly than among groups where mobile phone use was already extremely common. Among adults ages 25 and older, 96 percent of those with annual family incomes of $100,000 or greater used mobile phones in 2012, a nominal increase from 95 percent in 2011. During

Exploring the Digital Nation: Embracing the Mobile Internet
5
the same time period, however, those with family incomes below $25,000 became 4 percentage points more likely to use mobile phones, as adoption in this group increased from 73 to 77 percent (see Figure 2).
Figure 2: Mobile Phone Use by Family Income, Percent of Persons Age 25+, 2011-2012
There was also accelerated growth in mobile phone use among other historically lagging groups. Adoption among Americans with disabilities grew at twice the rate of their non-disabled counterparts. Mobile phone use increased from 68 percent of those who identified themselves as having a disability in 2011 to 72 percent in 2012, while adoption among those who did not self-identify as having a disability grew from 88 to 90 percent. Similarly, individuals with lower education levels narrowed the adoption gap with their highly-educated counterparts. Seventy-two percent of Americans who lacked a high school diploma or equivalent used mobile phones by 2012, an increase from 68 percent in 2011, and adoption among those who graduated from high school but did not continue their education increased from 79 to 83 percent. In contrast with the 4 percentage-point increases among those groups, mobile phone use among college graduates increased by just one percentage point, from 94 to 95 percent.
Mobile phone use among rural3 Americans also increased significantly between 2011 and 2012. Eighty-five percent of rural dwellers reported using a mobile phone in 2012, a 3 The CPS public use files do not provide the geographic variable for identifying a household’s location as urban or rural. In this report, “urban” refers to metropolitan areas and “rural” to nonmetropolitan areas. Since 2000, a metropolitan area is defined by its “core based statistical area” (CBSA), which includes both metropolitan and micropolitan statistical areas. According to the 2000 standards, each CBSA must have
2011, 73
2011, 85
2011, 91
2011, 94
2011, 95
2012, 77
2012, 87
2012, 93
2012, 95
2012, 96
< $25,000
$25,000-49,999
$50,000-74,999
$75,000-99,999
$100,000 +
Exploring the Digital Nation: Embracing the Mobile Internet
6
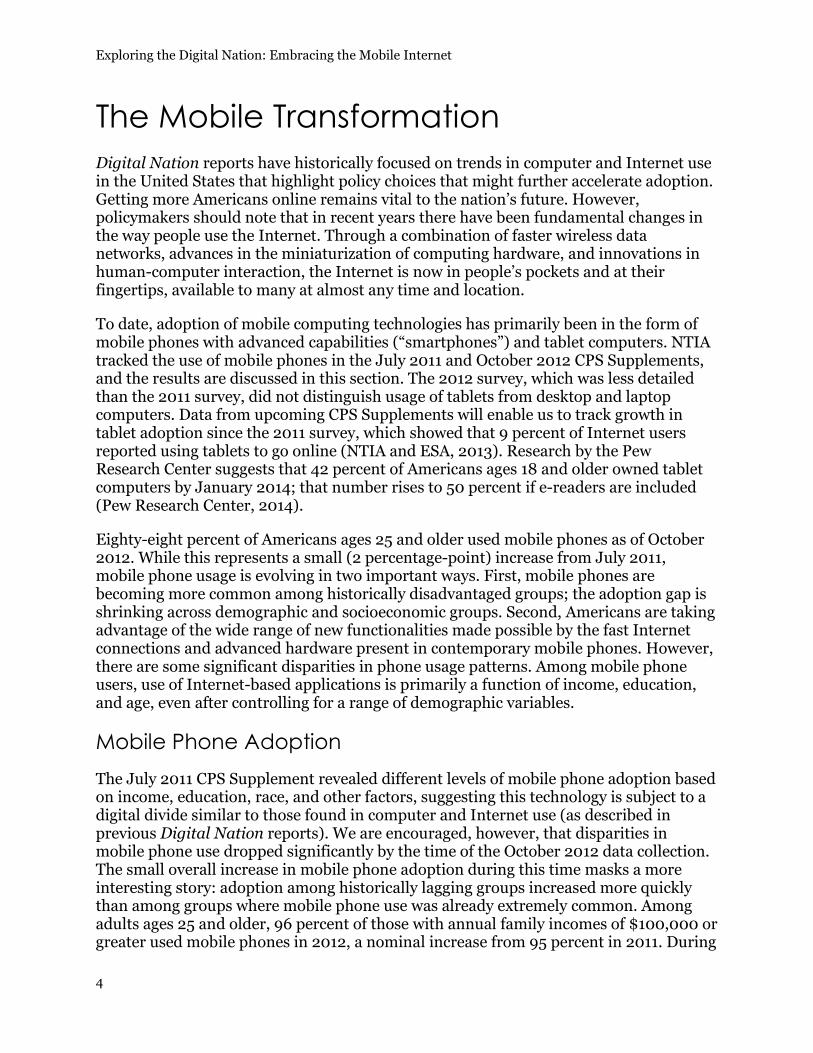
5 percentage-point increase from the 80 percent reported 15 months earlier. In contrast, the adoption rate among urban Americans only increased by 2 percentage points, from 86 to 88 percent (see Figure 3). The narrowing of this adoption gap based on population density is particularly promising because rural areas have historically experienced less-extensive build-out of network infrastructure than urban areas (NTIA & FCC, 2014).
Figure 3: Mobile Phone Use by Population Density, Percent of Persons Age 25+, 2011-2012
Racial disparities in mobile phone adoption were small in 2011 and appeared to nearly vanish in 2012. In 2011, 86 percent of Whites used mobile phones, compared to 84 percent of African Americans and 83 percent of Hispanics. In 2012, however, adoption among African Americans and Hispanics grew to 87 percent each, while adoption among Whites grew more slowly to 88 percent; the estimated difference between those groups is no longer statistically significant (see Figure 4).
at least one urban area with at least 10,000 inhabitants. Each metropolitan statistical area must contain at least one urbanized area with a population of 50,000 or more. Each micropolitan statistical area must contain at least one urban cluster with a population of between 10,000 and 50,000 (Office of Management and Budget [OMB], 2009).
2011, 86
2011, 80
2012, 88
2012, 85
Urban
Rural

Exploring the Digital Nation: Embracing the Mobile Internet
7
Figure 4: Mobile Phone Use by Race, Percent of Persons Age 25+, 2011-2012
Trends in mobile phone adoption during this 15-month period are encouraging. Demographic disparities appear to be shrinking, and in at least one case may have disappeared—though it is important to recognize that substantial gaps remain and will only close if adoption continues to grow more quickly among lagging groups.
Use of Mobile Applications Contemporary mobile phones are not mere telephones. In the rapid transition to advanced devices on high-speed data networks, mobile phone users are engaging in a dramatically expanded range of activities. Beyond phone calls and text messaging, mobile phones offer constant access to Internet applications like email and Web browsing, location-based services, and the ability to take pictures and listen to music.
Use of these applications is skyrocketing. Usage of non-voice applications grew rapidly between July 2011 and October 2012, with application usage growing 10 percentage points or more over the 15-month period in many cases. For example, over half (54 percent) of American mobile phone users ages 25 and older used their devices to take photos or video by 2012, a 13 percentage-point increase. The use of mobile phones for checking or sending email grew from 33 percent of users to 43 percent, and Web browsing increased from 33 to 42 percent. The proportion of mobile phone users utilizing maps and other GPS-based applications grew by 10 percentage points to 34 percent in 2012. Other uses of Internet-connected mobile phones, such as social networking and downloading apps, also saw considerable increases in popularity (see Figure 5).
2011, 86
2011, 84
2011, 83
2011, 87
2012, 88
2012, 87
2012, 87
2012, 90
White
Black
Hispanic
Asian

Exploring the Digital Nation: Embracing the Mobile Internet
8
Figure 5: Activities Americans Conduct on Mobile Phones, Percent of Mobile Phone Users Age 25+, 2011-2012
NTIA focused on four reported Internet-dependent activities: checking or sending email, Web browsing, downloading apps, and social networking to determine if there are disparities in usage patterns among different groups of mobile phone users. Data show that there are dramatic differences in mobile phone usage based on educational attainment. Among mobile phone users ages 25 and older, 57 percent of college graduates reported checking or sending email on their devices in 2012, compared to 45 percent of those with some college credit, 29 percent of high school graduates, and 19 percent of those with no diploma. Similarly, 54 percent of users with college degrees browsed the Web on their mobile phones, compared with just 21 percent of those without high school diplomas. There were also significant disparities in downloading apps and social networking based on education (see Figure 6).
2011, 63
2011, 41
2011, 33
2011, 33
2011, 24
2011, 22
2011, 22
2011, 21
2011, 19
2012, 70
2012, 54
2012, 43
2012, 42
2012, 34
2012, 32
2012, 30
2012, 29
2012, 25
Texting
Taking Photos or Video
Checking or Sending Email
Web Browsing
Using Maps or GPS
Downloading Apps
Social Networking
Listening to Music
Playing Games

Exploring the Digital Nation: Embracing the Mobile Internet
9
Figure 6: Activities Americans Conduct on Mobile Phones by Education, Percent of Mobile Phone Users Age 25+, 2012
Use of mobile phone-based Internet also differs greatly based on income. Sixty-three percent of mobile phone users with family incomes of at least $100,000 checked or sent email with their devices, compared with 52 percent in the $75,000-99,999 range, 45 percent in the $50,000-74,999 range, 36 percent in the $25,000-49,999 range, and 27 percent with family incomes below $25,000. Web browsing, downloading apps, and social networking were similarly stratified.
In stark contrast to the modest and shrinking mobile phone adoption gap between urban and rural Americans, use of Internet-based applications on those mobile phones varied dramatically by population density. For example, while 45 percent of urban mobile phone users checked or sent email with their devices, only 29 percent of their rural counterparts reported doing so. Additionally, rural users were 13 percentage points less likely to browse the Web on their phones, 12 percentage points less likely to download apps, and 8 percentage points less likely to use social networks (see Figure 7). Slower wireless network speeds in rural areas, in addition to demographic differences between urban and rural dwellers, may partially explain these disparities (NTIA & FCC, 2014).
No Diploma, 19
No Diploma, 21
No Diploma, 13
No Diploma, 15
High School, 29
High School, 30
High School, 22
High School, 22
Some College, 45
Some College, 44
Some College, 34
Some College, 32
College Grad, 57
College Grad, 54
College Grad, 42
College Grad, 37
Checking or SendingEmail
Web Browsing
Downloading Apps
Social Networking

Exploring the Digital Nation: Embracing the Mobile Internet
10
Figure 7: Activities Americans Conduct on Mobile Phones by Population Density, Percent of Mobile Phone Users Age 25+, 2012
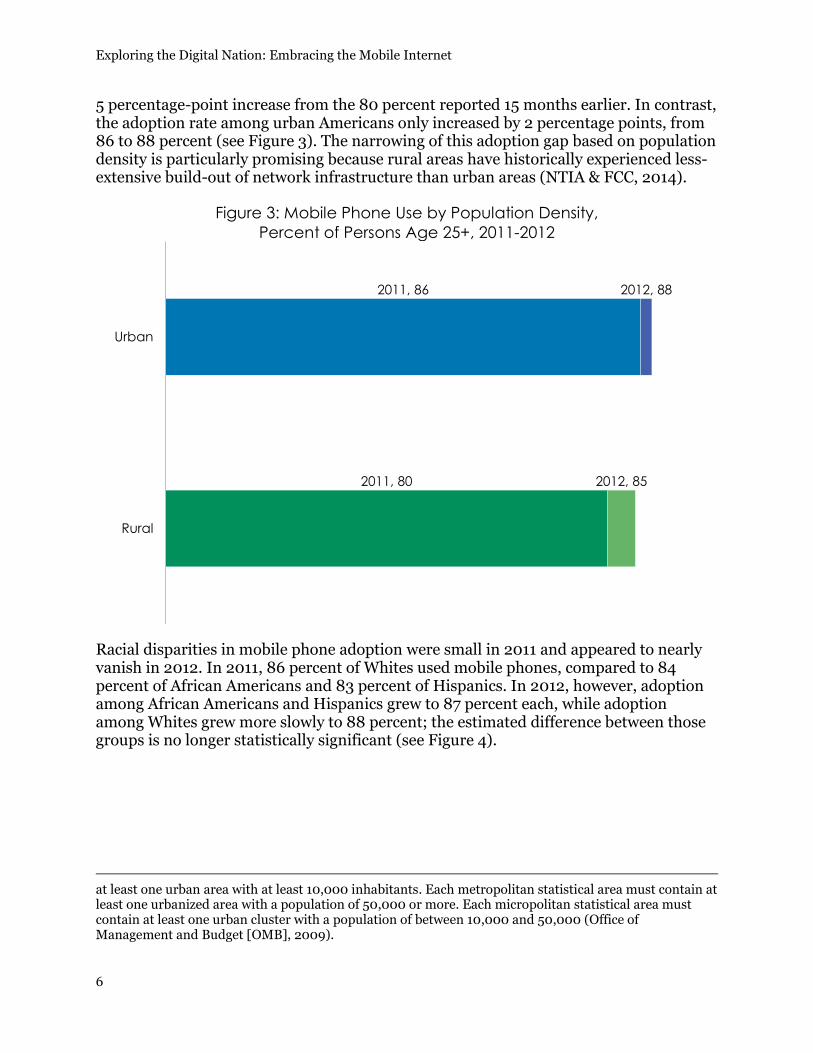
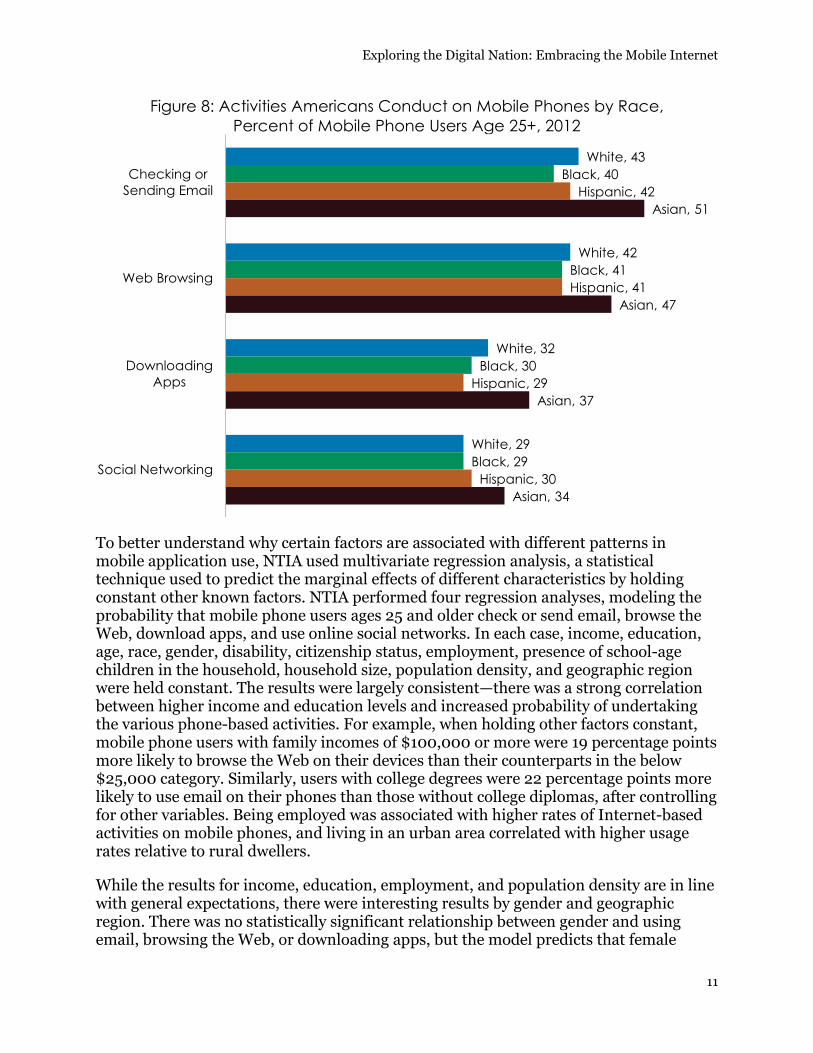
Similar to mobile phone adoption generally, Internet use on devices does not vary dramatically by race. The one exception is that Asian American mobile phone users were significantly more likely to check or send email, browse the Web, download apps, and use online social networks with their devices. For example, 51 percent of Asian American users reported checking or sending email on their mobile phones, compared with 43 percent of Whites, 40 percent of African Americans, and 42 percent of Hispanics (see Figure 8). These differences may be due in part to other demographic characteristics, like income and education levels.
Urban, 45
Urban, 44
Urban, 34
Urban, 31
Rural, 29
Rural, 31
Rural, 22
Rural, 23
Checking or SendingEmail
Web Browsing
Downloading Apps
Social Networking
Exploring the Digital Nation: Embracing the Mobile Internet
11
Figure 8: Activities Americans Conduct on Mobile Phones by Race, Percent of Mobile Phone Users Age 25+, 2012
To better understand why certain factors are associated with different patterns in mobile application use, NTIA used multivariate regression analysis, a statistical technique used to predict the marginal effects of different characteristics by holding constant other known factors. NTIA performed four regression analyses, modeling the probability that mobile phone users ages 25 and older check or send email, browse the Web, download apps, and use online social networks. In each case, income, education, age, race, gender, disability, citizenship status, employment, presence of school-age children in the household, household size, population density, and geographic region were held constant. The results were largely consistent—there was a strong correlation between higher income and education levels and increased probability of undertaking the various phone-based activities. For example, when holding other factors constant, mobile phone users with family incomes of $100,000 or more were 19 percentage points more likely to browse the Web on their devices than their counterparts in the below $25,000 category. Similarly, users with college degrees were 22 percentage points more likely to use email on their phones than those without college diplomas, after controlling for other variables. Being employed was associated with higher rates of Internet-based activities on mobile phones, and living in an urban area correlated with higher usage rates relative to rural dwellers.
While the results for income, education, employment, and population density are in line with general expectations, there were interesting results by gender and geographic region. There was no statistically significant relationship between gender and using email, browsing the Web, or downloading apps, but the model predicts that female
White, 43
White, 42
White, 32
White, 29
Black, 40
Black, 41
Black, 30
Black, 29
Hispanic, 42
Hispanic, 41
Hispanic, 29
Hispanic, 30
Asian, 51
Asian, 47
Asian, 37
Asian, 34
Checking orSending Email
Web Browsing
DownloadingApps
Social Networking
Exploring the Digital Nation: Embracing the Mobile Internet
12
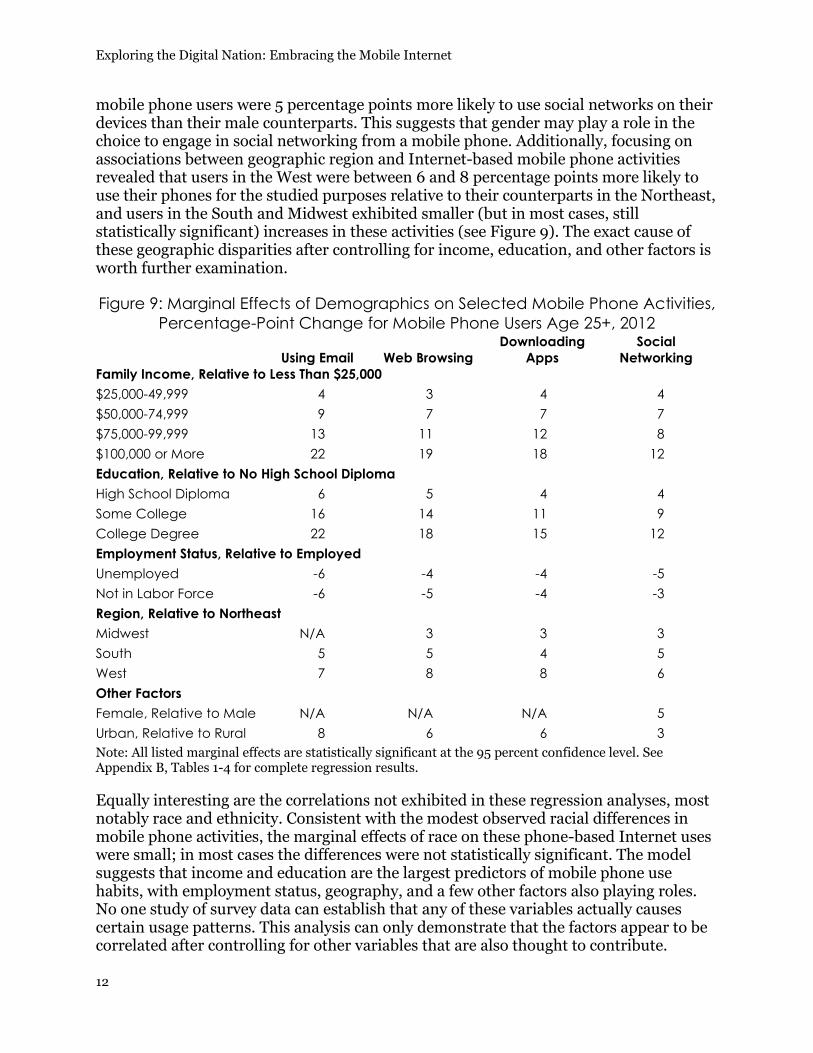
mobile phone users were 5 percentage points more likely to use social networks on their devices than their male counterparts. This suggests that gender may play a role in the choice to engage in social networking from a mobile phone. Additionally, focusing on associations between geographic region and Internet-based mobile phone activities revealed that users in the West were between 6 and 8 percentage points more likely to use their phones for the studied purposes relative to their counterparts in the Northeast, and users in the South and Midwest exhibited smaller (but in most cases, still statistically significant) increases in these activities (see Figure 9). The exact cause of these geographic disparities after controlling for income, education, and other factors is worth further examination.
Figure 9: Marginal Effects of Demographics on Selected Mobile Phone Activities, Percentage-Point Change for Mobile Phone Users Age 25+, 2012
Using Email Web Browsing
Downloading Apps
Social Networking
Family Income, Relative to Less Than $25,000 $25,000-49,999 4 3 4 4 $50,000-74,999 9 7 7 7 $75,000-99,999 13 11 12 8 $100,000 or More 22 19 18 12 Education, Relative to No High School Diploma High School Diploma 6 5 4 4 Some College 16 14 11 9 College Degree 22 18 15 12 Employment Status, Relative to Employed Unemployed -6 -4 -4 -5 Not in Labor Force -6 -5 -4 -3 Region, Relative to Northeast Midwest N/A 3 3 3 South 5 5 4 5 West 7 8 8 6 Other Factors Female, Relative to Male N/A N/A N/A 5 Urban, Relative to Rural 8 6 6 3 Note: All listed marginal effects are statistically significant at the 95 percent confidence level. See Appendix B, Tables 1-4 for complete regression results.
Equally interesting are the correlations not exhibited in these regression analyses, most notably race and ethnicity. Consistent with the modest observed racial differences in mobile phone activities, the marginal effects of race on these phone-based Internet uses were small; in most cases the differences were not statistically significant. The model suggests that income and education are the largest predictors of mobile phone use habits, with employment status, geography, and a few other factors also playing roles. No one study of survey data can establish that any of these variables actually causes certain usage patterns. This analysis can only demonstrate that the factors appear to be correlated after controlling for other variables that are also thought to contribute.

Exploring the Digital Nation: Embracing the Mobile Internet
13
Examination of the October 2012 CPS Supplement data on mobile phone use suggests a need for further research and policy focus on how people are using their devices, rather than mere ownership. Simply having such a device does not reliably indicate that a user is taking advantage of the advanced applications made possible by recent innovations in mobile technologies. As mobile phones approach ubiquity and traditional disparities in adoption shrink, there is evidence of a new socioeconomic-based digital divide in usage patterns. Thus, policymakers should focus on addressing its possible causes, including the additional cost of mobile data plans, limited availability of high-speed networks in rural areas, or gaps in digital literacy. This is an essential step in extending to all Americans the opportunities created by carrying the entire Internet in their pockets.
Exploring the Digital Nation: Embracing the Mobile Internet
14
Expanding Broadband Use in Arkansas Through Education
When Connect Arkansas received a $3.7 million BTOP award to increase broadband adoption, the state ranked 49th in Internet subscribership and 47th in per capita income, according to FCC data. NTIA’s data suggest that the state has significantly improved its broadband adoption rate during the last few years (see Figures 11 and 12). To encourage broadband adoption by Arkansans, the project offers digital literacy and computer basics training for adults and free refurbished computers to qualifying low income families. In addition to selling discounted reconditioned computers to the public, Connect Arkansas trains residents in business plan writing, the principles of entrepreneurship, and small business technology use. See the project website at http://www.connect-arkansas.org/home for more details.
Getting Online Although gaps remain, broadband adoption continues to grow across demographic and geographic groups. Data also suggest some interesting variations in broadband adoption based on a number of factors. For example, households with school-age children report higher rates of adoption, possibly indicating greater demand among younger individuals or perhaps students’ need to use the Internet for homework and studying.
Internet at Home: Devices, Technologies, and Trends Computer Use at Home
Data collected in 2012 on Americans’ digital device choices show that 79 percent of households reported having computers at home, a 3 percentage-point increase from 2011. This also represents a 28 percentage-point increase in home computer use since 2000.
In 2000, 61 percent of 25- to 44-year-old householders4 reported having a computer at home, while only 24 percent of those 65 and older reported the same. In 2012, this number jumped to 85 percent for 25- to 44-year-olds and to 64 percent for those 65 and older, a 40 percentage-point increase among seniors. In 2001, only 54 percent of unemployed householders owned a computer, whereas by October 2012, 75 percent of households facing unemployment had this important resource at home to aid in job seeking.
In 2012, low-income households continued to lag behind wealthier households in having a computer at home. Only 57 percent of households earning less than $25,000 a year had a computer at home, while they were nearly ubiquitous in households earning $100,000 or more (97 percent). Householders with no high school diploma made strides in closing the 4 A “householder” or “reference person” is the household member who owns or rents the housing unit (U.S. Bureau of Labor Statistics & U.S. Census Bureau, 2006). When analyzing household-level data, NTIA uses the householder’s demographic characteristics (such as age, race, and educational attainment) as a proxy for the entire household.
Exploring the Digital Nation: Embracing the Mobile Internet
15
computer-at-home gap by 31 percentage points over the last 12 years (2000: 18 percent to 2012: 49 percent); yet in 2012, they still lagged far behind those with a college degree or higher (94 percent).
Throughout the last decade, Asian American householders consistently reported the highest rates of home computer use, while the lowest percentage shifted over the years between African American, Hispanic, and American Indian and Alaska Native households. In 2012, African American householders reported the lowest prevalence of computers at home at 67 percent.
The gap is closing between computers at home in rural versus urban communities. In 2000, urban households were 11 percentage points more likely to have computers at home than their rural counterparts. By 2012, however, that gap narrowed to 8 percentage points.
Internet Use at Home
Internet use at home is continuing to rise, although not at the same rates observed during the earlier years of the 21st century. Between August 2000 and September 2001, the proportion of households going online at home jumped by 9 percentage points, from 41 percent to 50 percent. In 2012, 75 percent of households reported having Internet at home, representing a 3 percentage-point increase from 2011. By 2012, just 2 percent of households online at home relied solely on dial-up Internet service.
Different demographic and geographic groups reported disparate levels of home Internet use. For instance, in 2012 82 percent of 25- to 44-year-old householders had Internet at home, similar to 79 percent of 45- to 64-year-olds. Those 65 and over continued to lag behind other age brackets, with only 57 percent reporting home Internet use. Income levels also impacted Internet adoption at home. Low-income households were far behind their wealthier counterparts: Forty-nine percent of households making less than $25,000 used the Internet at home, compared to 96 percent of households making $100,000 or more.
In 2012, 40 percent of householders without a high school diploma reported having the Internet at home, a 28 percentage-point gain over the last 12 years, but significantly behind the 92 percent of home users with at least a college degree. Although 83 percent of employed householders used the Internet at home in 2012, such use has continued to rise among the unemployed as well, with 70 percent of unemployed householders having the Internet at home, compared to 50 percent in 2003. Importantly, households led by females continued to lag in home Internet use over the last 12 years. Although female heads of household narrowed the gap from a 10 percentage point disparity (2000, 2001), they continued trailing male heads of household by 6 percentage points in 2012 (72 percent adoption for female householders).
Similar to home computer use, while home Internet use increased during the last decade, adoption continued to be lowest among African American, Hispanic, and American Indian and Alaska Native householders. One of the largest increases occurred among Hispanic householders, with 64 percent reporting Internet at home in 2012, up

Exploring the Digital Nation: Embracing the Mobile Internet
16
from 24 percent in 2000. As with computer use at home, Asian American householders continued to lead in home Internet adoption, with 85 percent reporting having the Internet at home.
In 2012, rural households made progress in closing the gap with urban households, with 66 percent online; yet they remained 10 percentage points behind their urban counterparts, who reported 76 percent penetration. Disabled householders were 27 percentage points less likely to have the Internet at home than their non-disabled counterparts at 52 percent and 79 percent, respectively.
Figure 10: Home Computer, Internet, and Broadband Use by Demographics and Population Density, Percent of Households, 2012
Computer Use Internet Use Broadband Use** All Households 79 75 73 Family Income Less Than $25,000 57 49 48 $25,000-49,999 77 72 70 $50,000-74,999 90 88 86 $75,000-99,999 95 93 92 $100,000 or More 97 96 95 Education* No Diploma 49 40 39 High School Diploma 69 65 63 Some College 84 80 79 College Degree 94 92 91 Race and Ethnicity* White 82 79 77 African American 67 62 61 Hispanic 69 64 63 Asian American 87 85 84 American Indian or Alaska Native 68 58 56 Population Density Urban 80 76 75 Rural 72 66 63 * These are attributes of the householder. ** For the purpose of this analysis, households are considered to use broadband if they report home
Internet use and list any type of connection other than dial-up, including “some other service.”
Home Internet Use by State
Similar to previous Digital Nation reports, states experienced significantly different Internet adoption levels in 2012. For example, households in some western and northeastern states reported home Internet adoption rates significantly above the national average of 75 percent, including Oregon at 85 percent and New Hampshire at 83 percent. In contrast, certain states in southern regions and Appalachia reported the

Exploring the Digital Nation: Embracing the Mobile Internet
17
lowest adoption rates nationally, including Mississippi at 58 percent of households, and Louisiana at 61 percent (see Figure 11).5
Figure 11: Internet Use at Home by State, Percent of Households, 2012
Note: See Appendix B, Table 5 for complete results.
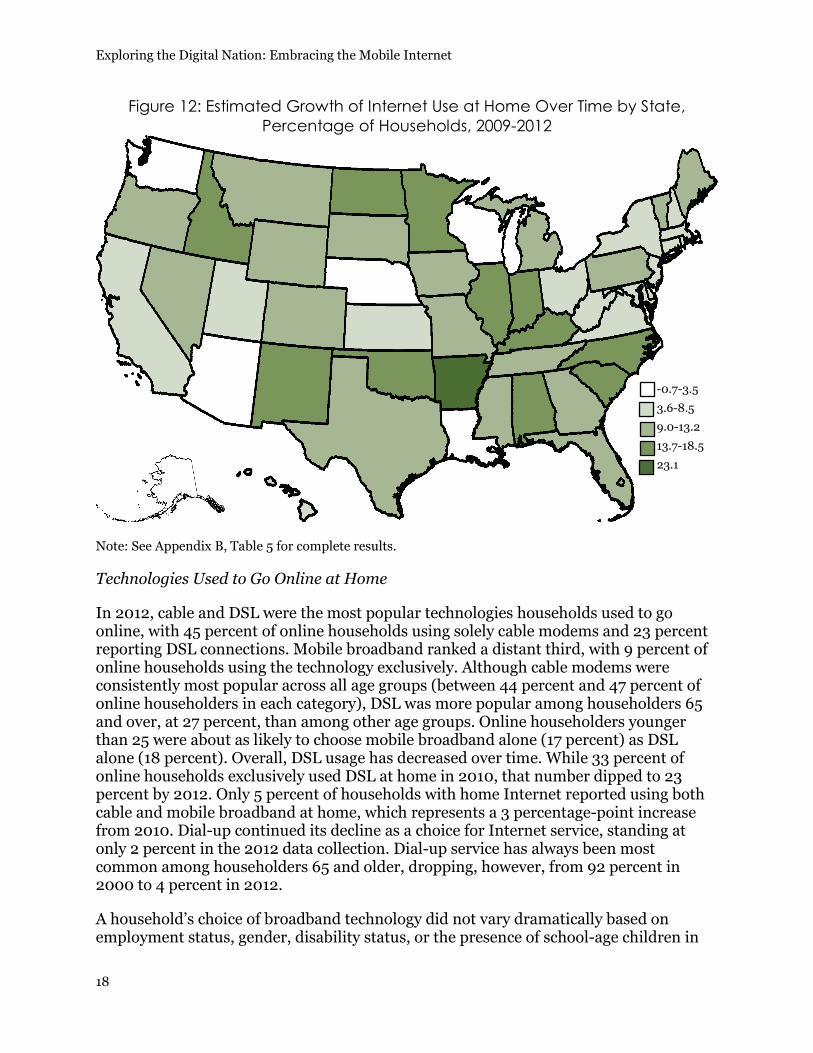
The estimated growth in Internet use during this three-year period varied significantly among the states from 2009 to 2012. Some historically lagging states appeared to make considerable progress towards closing the gap with their peers. For example, while only 56 percent of households in Arkansas were going online at home in 2009, the adoption rate there grew rapidly through 2012, when 69 percent of households used the Internet at home. While Arkansas still lagged behind the national home Internet use rate of 75 percent in 2012, the state may have significantly improved its standing (see Figure 12).6
5 It is important to note that, due to the smaller sample sizes for individual states, state-level adoption estimates are subject to a margin of error of several percentage points. These estimates therefore are best understood as a general assessment of home Internet use in each state, and not as a precise ranking. 6 It is beyond the scope of this study to attempt to identify the causes of different growth rates observed in each state. In some states with high adoption rates, for example, saturation may simply have limited growth in home Internet use. Other states may have faced economic issues, population shifts, or a range of other factors. NTIA encourages researchers to delve more deeply into the circumstances that affect growth in Internet adoption.
58.4-63.6
64.7-68.8
69.0-74.1
74.3-79.5
79.6-84.8
Exploring the Digital Nation: Embracing the Mobile Internet
18
Figure 12: Estimated Growth of Internet Use at Home Over Time by State, Percentage of Households, 2009-2012
Note: See Appendix B, Table 5 for complete results.
Technologies Used to Go Online at Home
In 2012, cable and DSL were the most popular technologies households used to go online, with 45 percent of online households using solely cable modems and 23 percent reporting DSL connections. Mobile broadband ranked a distant third, with 9 percent of online households using the technology exclusively. Although cable modems were consistently most popular across all age groups (between 44 percent and 47 percent of online householders in each category), DSL was more popular among householders 65 and over, at 27 percent, than among other age groups. Online householders younger than 25 were about as likely to choose mobile broadband alone (17 percent) as DSL alone (18 percent). Overall, DSL usage has decreased over time. While 33 percent of online households exclusively used DSL at home in 2010, that number dipped to 23 percent by 2012. Only 5 percent of households with home Internet reported using both cable and mobile broadband at home, which represents a 3 percentage-point increase from 2010. Dial-up continued its decline as a choice for Internet service, standing at only 2 percent in the 2012 data collection. Dial-up service has always been most common among householders 65 and older, dropping, however, from 92 percent in 2000 to 4 percent in 2012.
A household’s choice of broadband technology did not vary dramatically based on employment status, gender, disability status, or the presence of school-age children in
-0.7-3.5
3.6-8.5
9.0-13.2
13.7-18.5
23.1

Exploring the Digital Nation: Embracing the Mobile Internet
19
the household. Across each of these categories, the overall averages remained consistent. Interestingly, 13 percent of online households with family incomes below $25,000 used mobile broadband exclusively. The exclusive use of mobile broadband at home was also most common among online heads of household lacking a diploma (12 percent), compared to the other education categories (7 percent for those with a college degree or higher). Four percent of those without a high school diploma reported utilizing dial-up alone, while only 1 percent of users with a college degree or higher did so. Seven percent of heads of household online at home with a college degree or higher accessed the Internet through fiber, while only 3 percent of those without a high school diploma reported the same. Six percent of online householders with college degrees reported use of both cable and mobile broadband at home, while only 3 percent without a high school diploma reported the same.
When considering employment status, mobile broadband use to access the Internet at home has grown most among the unemployed, rising from 8 percent in 2010 to 13 percent in 2012. After remaining flat between 2010 and 2011, growth in the use of both cable and mobile by households across income brackets occurred in 2012, while growing most significantly to 8 percent among households with incomes of $100,000 or more.
Figure 13: Selected Technologies Used to Go Online at Home by Demographics and Population Density, Percent of Online Households, 2012
Cable Only DSL Only
Fiber-optic Only
Mobile BB Only
Cable and Mobile
All Online Households 45 23 5 9 5 Family Income Less Than $25,000 43 25 4 13 3 $25,000-49,999 44 25 4 10 4 $50,000-74,999 46 24 6 8 5 $75,000-99,999 45 24 6 7 6 $100,000 or More 45 20 8 6 8 Education* No Diploma 43 25 3 12 3 High School Diploma 43 25 5 10 3 Some College 44 24 5 10 5 College Degree 46 22 7 7 6 Race and Ethnicity* White 45 24 6 8 5 African American 42 24 5 13 5 Hispanic 41 24 5 12 4 Asian American 53 20 7 5 5 American Indian or Alaska Native 39 26 2 14 5 Population Density Urban 47 21 6 9 5 Rural 32 35 2 11 3 * These are attributes of the householder.
Exploring the Digital Nation: Embracing the Mobile Internet
20
In 2012, cable modems were least prevalent among online American Indian and Alaska Native householders (39 percent), compared with their counterparts from other ethnic groups. DSL was the least popular among Asian American householders (20 percent). Mobile broadband adoption was highest among American Indians and Alaska Natives (14 percent), African American (13 percent), and Hispanic (12 percent) householders, and least so among Asian Americans (5 percent). American Indians and Alaska Natives reported some of the highest rates of home mobile broadband use and lowest rates of cable modem use; this may be partly due to a lack of cable broadband availability in regions with a high concentration of these households.
Four percent of online rural households relied on dial-up Internet service in 2012, while only 1 percent of their urban counterparts used dial-up service exclusively at home. Thirty-five percent of rural households with home Internet service used DSL, while only 21 percent of online urban households did the same. Forty-seven percent of urban users utilized cable alone, while only 32 percent of rural dwellers reported accessing the Internet this way. Satellite use was higher in rural areas at 5 percent, versus 2 percent reported by online urban households. Mobile broadband use was not significantly differentiated by geography: 11 percent of rural Internet-using households relied on this technology, while 9 percent of their urban counterparts reported the same. Only 2 percent of online rural households reported using fiber-optic connections for home Internet service, while 6 percent in urban areas reported utilizing this option. Of note, in 2011 and 2012 cable modem usage reported in rural areas was 15 percentage points lower than urban areas. However, during this same 15-month period, mobile broadband experienced a significant increase in rural communities, growing from 7 percent to 11 percent.
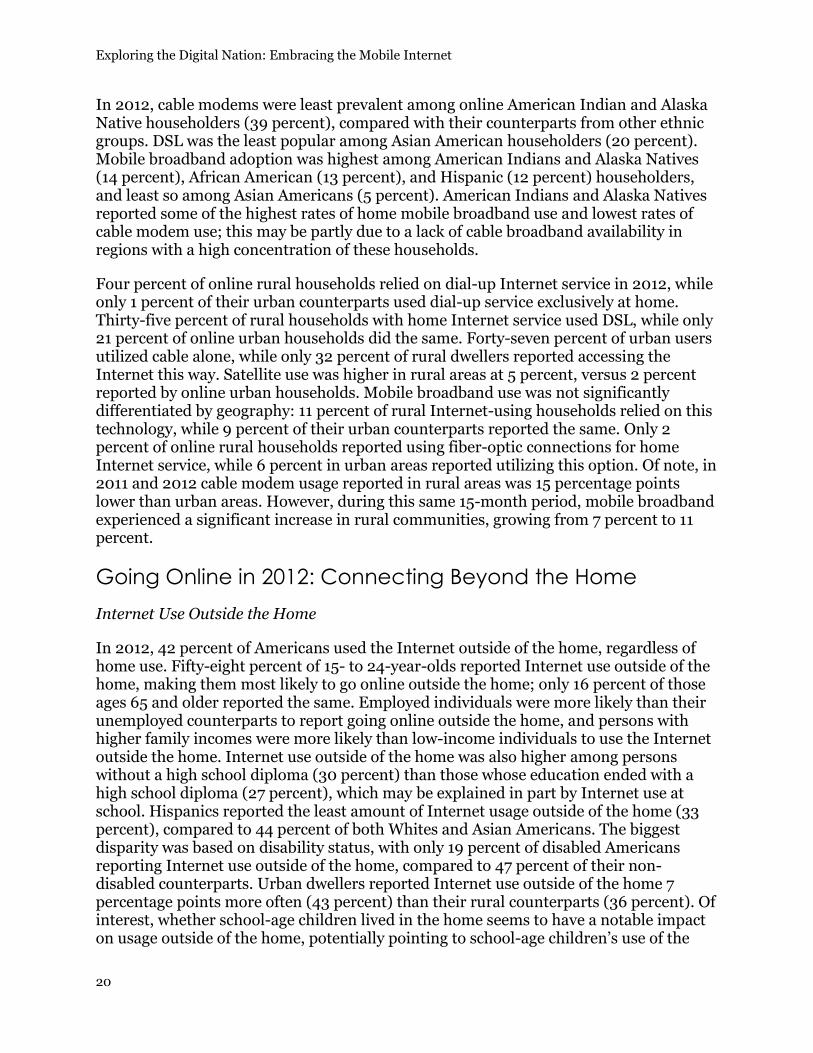
Going Online in 2012: Connecting Beyond the Home Internet Use Outside the Home
In 2012, 42 percent of Americans used the Internet outside of the home, regardless of home use. Fifty-eight percent of 15- to 24-year-olds reported Internet use outside of the home, making them most likely to go online outside the home; only 16 percent of those ages 65 and older reported the same. Employed individuals were more likely than their unemployed counterparts to report going online outside the home, and persons with higher family incomes were more likely than low-income individuals to use the Internet outside the home. Internet use outside of the home was also higher among persons without a high school diploma (30 percent) than those whose education ended with a high school diploma (27 percent), which may be explained in part by Internet use at school. Hispanics reported the least amount of Internet usage outside of the home (33 percent), compared to 44 percent of both Whites and Asian Americans. The biggest disparity was based on disability status, with only 19 percent of disabled Americans reporting Internet use outside of the home, compared to 47 percent of their non-disabled counterparts. Urban dwellers reported Internet use outside of the home 7 percentage points more often (43 percent) than their rural counterparts (36 percent). Of interest, whether school-age children lived in the home seems to have a notable impact on usage outside of the home, potentially pointing to school-age children’s use of the

Exploring the Digital Nation: Embracing the Mobile Internet
21
Internet at school or libraries (no school-age children: 40 percent; school-age children: 45 percent).
Figure 14: Internet Use Locations, Percent of Households, 2012
Internet Use Locations Outside the Home
The 2012 survey asked respondents where the household’s Internet users go online. Among households with a member who used the Internet at locations other than home, 38 percent identified work as a source of Internet access. Householders ages 25-44 reported that someone in the household used the Internet at work more often than other age groups (51 percent). While only 13 percent of households making less than $25,000 had someone going online at work, 70 percent of households making $100,000 or above did. Only 25 percent of householders with a high school diploma reported Internet use at work, while 59 percent of those with a college degree or higher did so. Significantly, survey results largely show a great deal of parity in adoption numbers between the genders, but Internet use at work seems to be an exception—40 percent of male householders reported someone going online at work, while 36 percent of females reported the same. Only 29 percent of Hispanic householders and 31 percent of African Americans reported Internet use at work, while 41 percent of Whites and 48 percent of Asian American householders reported the same. Only 13 percent of householders with a disability stated that someone accessed the Internet at work, compared to 42 percent of non-disabled householders. Among urban dwellers, 40 percent answered that someone in the household went online at work, while only 30 percent of rural households reported the same. While 47 percent of households with school-age children
75
38
20
14
11
10
2
8
Home
Work
School
Someone Else's House
Public Library
Café
Community Center
Other

Exploring the Digital Nation: Embracing the Mobile Internet
22
at home indicated that someone goes online at work, only 35 percent of households without school-age children reported the same.
Twenty percent of all households reported that someone in the household used the Internet at school. The authors observed a large gap between the lowest and highest income households: Only 15 percent of households making $25,000 and under stated that a member used the Internet at school, while 30 percent of households earning $100,000 and above responded similarly. Of interest, only 18 percent of White householders reported that someone within the household goes online at school, compared to 22 percent of African American householders and 26 percent each for of Hispanic and Asian American householders. One possible explanation for this is that households with home Internet connections may rely less often on school Internet use (e.g., Whites at 79 percent and African Americans at 62 percent). This also raises questions, however, about why Asian American households, with an adoption rate comparable to White households in 2012, were also those most likely, along with Hispanic households to go online at school. These findings may benefit from further research and investigation. Only 16 percent of rural dwellers reported that someone in the household goes online at school, compared to 21 percent of households in urban areas.
Eleven percent of households reported that someone went online at a public library. Use of public libraries to go online varies by age group: 15- to 24-year-old householders showed the highest utilization (16 percent), while householders 65 and older reported the lowest (5 percent). Of note, unemployed householders (20 percent) reported Internet use at public libraries much more often than their employed counterparts (11 percent). African American (16 percent), Asian American (14 percent), and Hispanic (12 percent) householders reported the most Internet use at public libraries, compared to 9 percent of White householders. Additionally, 18 percent of households with school-age children at home reported that someone went online at a public library, compared to
ConnectED Broadband has tremendous potential to enhance education through customized lessons, rich digital content, and access to unprecedented amounts of information. However, less than 30 percent of schools have the high-speed Internet capacity necessary to access these benefits. In June 2013, President Obama announced ConnectEd, an effort to ensure that 99 percent of schools and libraries are connected to broadband with speeds of at least 100 Mbps with the goal of 1 Gbps by 2017. The ConnectEd initiative also seeks to fund teacher technology training and professional development to support the adoption of digital learning tools. As of February 2014, the private sector had committed $750 million in software, hardware, Internet connectivity, and educational tools and content to support the initiative. The Federal Communications Commission has directed $2 billion of funding from its E-Rate universal service program for schools and libraries be used as a down payment to extend broadband to 2o million students. In addition, the U.S. Department of Agriculture committed another $10 million for distance learning grants to rural schools. For a fact sheet describing ConnectED’s progress, visit http://www.whitehouse.gov/the-press-office/2014/02/04/fact-sheet-opportunity-all-answering-president-s-call-enrich-american-ed.
Exploring the Digital Nation: Embracing the Mobile Internet
23
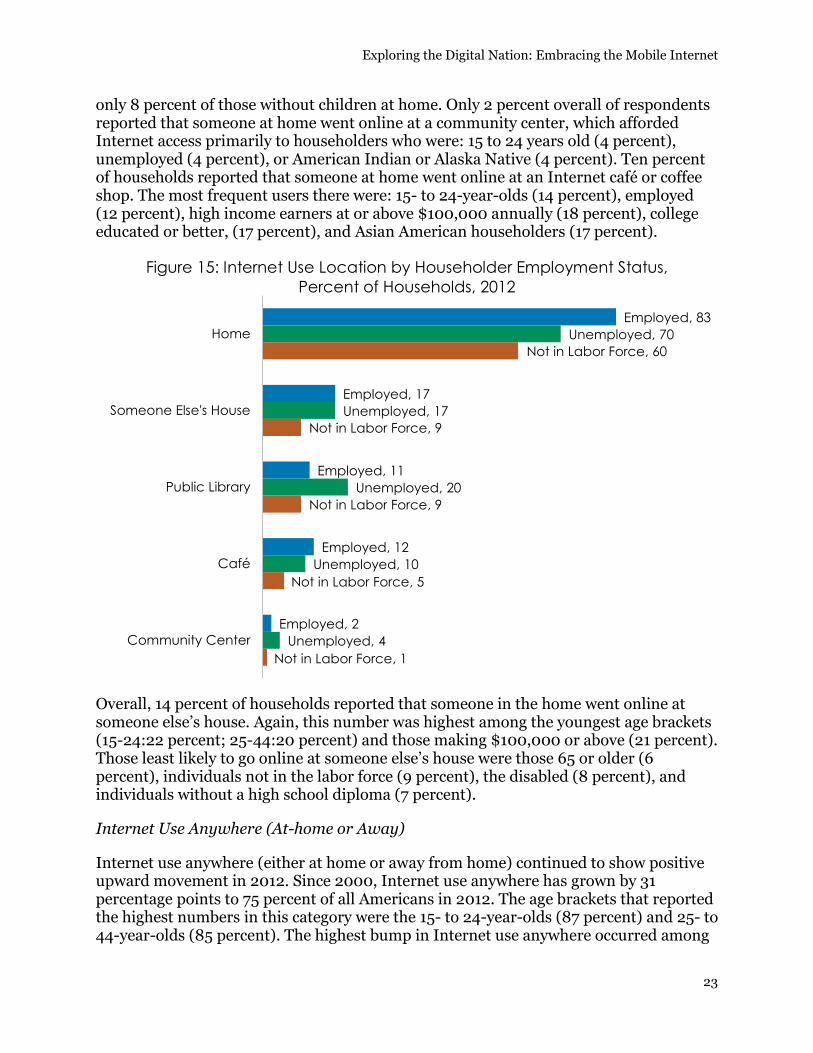
only 8 percent of those without children at home. Only 2 percent overall of respondents reported that someone at home went online at a community center, which afforded Internet access primarily to householders who were: 15 to 24 years old (4 percent), unemployed (4 percent), or American Indian or Alaska Native (4 percent). Ten percent of households reported that someone at home went online at an Internet café or coffee shop. The most frequent users there were: 15- to 24-year-olds (14 percent), employed (12 percent), high income earners at or above $100,000 annually (18 percent), college educated or better, (17 percent), and Asian American householders (17 percent).
Figure 15: Internet Use Location by Householder Employment Status, Percent of Households, 2012
Overall, 14 percent of households reported that someone in the home went online at someone else’s house. Again, this number was highest among the youngest age brackets (15-24:22 percent; 25-44:20 percent) and those making $100,000 or above (21 percent). Those least likely to go online at someone else’s house were those 65 or older (6 percent), individuals not in the labor force (9 percent), the disabled (8 percent), and individuals without a high school diploma (7 percent).
Internet Use Anywhere (At-home or Away)
Internet use anywhere (either at home or away from home) continued to show positive upward movement in 2012. Since 2000, Internet use anywhere has grown by 31 percentage points to 75 percent of all Americans in 2012. The age brackets that reported the highest numbers in this category were the 15- to 24-year-olds (87 percent) and 25- to 44-year-olds (85 percent). The highest bump in Internet use anywhere occurred among
Employed, 83
Employed, 17
Employed, 11
Employed, 12
Employed, 2
Unemployed, 70
Unemployed, 17
Unemployed, 20
Unemployed, 10
Unemployed, 4
Home
Someone Else's House
Public Library
Café
Community Center
Not in Labor Force, 60
Not in Labor Force, 9
Not in Labor Force, 9
Not in Labor Force, 5
Not in Labor Force, 1

Exploring the Digital Nation: Embracing the Mobile Internet
24
those 65 and above, reporting a 37 percentage-point gain between 2000 and 2012. Adoption rates for using the Internet anywhere tended to rise along with income and education level, suggesting that persons with lower levels of family income and educational attainment may still lack resources and opportunities to get connected. Although in the year 2000 Hispanics were less likely than other ethnic groups to go online anywhere (24 percent), they closed the gap in 2012, by reporting numbers similar to other minority groups (Hispanic: 62 percent; American Indian and Alaska Native: 62 percent; African American: 68 percent). Persons living in rural areas still lagged behind their urban counterparts in Internet use anywhere, although both groups made over a 16 percentage-point gain since 2003 (rural: 69 percent; urban: 76 percent).
Exploring the Digital Nation: Embracing the Mobile Internet
25
No Internet Use at Home Even as Americans increasingly access the Internet through mobile devices and outside of the home, the Administration continues to encourage home broadband adoption. As the Internet evolves, some uses—such as consulting by video conference with a health professional or completing an online application with personal information—may require the privacy afforded by a home broadband connection. In addition, residential broadband connections can extend student learning beyond the classroom and facilitate digital literacy among household members unfamiliar or uncomfortable with Internet use. Families with broadband connections and telework options may have the ability to spend less on child care services by shortening commuting times. Finally, the advent of the “Internet of Things,” which is now allowing consumers to monitor their energy consumption and home security systems remotely, among other activities, could accelerate the demand for broadband-enabled homes and the necessity of broadband adoption by all their occupants.7
As more Americans go online at home, a significant but declining number have yet to cross the digital divide by connecting to the Internet there. According to 2012 CPS data, 28 percent of the 122 million households represented in the survey did not use broadband at home. Including dial-up service decreases the proportion of households not online at home to 25 percent. Even so, households without Internet service at home offered a variety of primary reasons why they did not use it where they live (see Figure 16). Additionally, 18 percent of U.S. households did not use the Internet at all, regardless of location. The following discussion of the main reasons why some households declined to access the Internet at home, in order of their prevalence among 2012 CPS respondents, may assist policymakers as they pursue universal broadband adoption and affordable connectivity in every community in the nation.
7 Frost & Sullivan project the market for “connected living” or ubiquitously connected video and data services at home, work, and public spaces will grow to $731.7 billion by 2020, citing cloud computing, big data, mobility, and low cost sensors as driving growth of the Internet of Things (IoT). Fifteen percent of this estimate ($111 billion) is attributable to the “connected home” (2014). Further, Gartner predicts that the low cost of processors will cause the number of IoT devices, which communicate or interact with external environments or internal systems, to grow 3.5 times larger than the 7.3 billion smartphones, tablets, and personal computers expected in use by 2020. Also, the IoT will yield $1.9 trillion in global economic valued added through sales in diverse end markets (2014).

Exploring the Digital Nation: Embracing the Mobile Internet
26
Figure 16: Main Reason for Non-Use of the Internet at Home, Percent of Households Not Online at Home, 2012
No Need or Interest In 2012, as in previous years, the prevailing reason that households without residential Internet service gave for not using it was the lack of need or interest in going online at home. In the 15 months between the July 2011 and October 2012 data collections, the portion of non-Internet using households offering this explanation remained at 48 percent. The percentage of such households increased 9 points between 2003 and 2012 from 39 percent to 48 percent.
Views on whether households needed Internet access or were interested in it varied based on previous home Internet use. Households that once used the Internet at home, but no longer did so as of the 2012 CPS, expressed disinterest in home Internet use much less frequently (21 percent) than the households that had never connected to the Internet from home (53 percent). Additionally, 38 percent of households that reported only using dial-up Internet service at home cited a lack of need for, or interest in, home broadband connections in 2012, an increase from 34 percent of dial-up users in 2011.
Dividing households by householder age shows differences in perceptions of whether home Internet use is needed or of interest. From 2001 to 2012, CPS data reveal a consistent pattern of non-adopting householders expressing no interest in, or no need for, home Internet service increasing with age. Accordingly, in 2012 non-Internet using householders ages 15 to 24 (24 percent), and those between 25 and 44 (26 percent), were the least likely groups to state they did not want or need to use the Internet at
48
29
11
3
1
1
7
Don't Need It, Not Interested
Too Expensive
No Computeror Computer Inadequate
Can Use It Somewhere Else
Not Available in Area
Privacy or Security Concerns
Other Reason
Exploring the Digital Nation: Embracing the Mobile Internet
27
home. Forty-four percent of the next oldest age group, 45- to 64-year-olds, stated they did not want or need to use the Internet at home in 2012, and 70 percent of seniors ages 65 and older responded similarly. Between 2011 and 2012, however, disinterest increased among senior citizens over 65 years old (67 percent to 70 percent). While the incidence of senior non-using householders reporting they did not want or need to access the Internet at home rose 3 percentage points from 2011 to 2012, this increase followed a significant 11 percentage-point jump from 57 percent to 68 percent between the 2009 and 2010 CPS data collections.
In recent years, employers have more actively recruited through online job postings that extend beyond the declining circulation of some local newspapers or the limited reach of community job banks (Salpeter, 2012). CPS data from 2001 through 2012 demonstrate that unemployed householders were always the least likely to state they did not need to use the Internet at home. For example, in 2012, non-Internet using households led by an unemployed person expressed disinterest in home Internet use (19 percent) less often than households headed by employed individuals (39 percent) or those “not in the labor force” (58 percent).8 Between 2011 and 2012, unemployed-led households responding it was not necessary or desirable to go online at home declined 3 percentage points from 22 percent, while the percentage of households headed by working householders giving the same reason remained unchanged. At the same time, households of those outside the labor force continued to exhibit the least interest in home Internet adoption, showing a 1 percentage-point increase from 57 percent in 2011 to 58 percent in 2012.
In 2012, the most affluent non-using households, with annual incomes of $100,000 or more, stated less often than other income groups that they did not want or need to use the Internet in their homes (45 percent), followed closely by households with family incomes below $25,000 per year (47 percent). About half of households with annual incomes ranging between $25,000 and $99,999 expressed disinterest in accessing the Internet at home (see Figure 19). Comparing data from the 2011 CPS, the lowest income households, those earning below $25,000 annually, were the least likely to offer a lack of need or interest in using the Internet at home (45 percent), while households with incomes at or above $100,000 were the most likely to say they did not need to do so (53 percent). Between 2011 and 2012, disinterest in residential Internet use dropped 8 percentage points among these highest income households.
Non-using householders with some college education or an associate degree were less likely to report not going online at home due to a lack of interest than others with higher or lower educational attainment levels. Forty-three percent said they did not get online at home because they were not interested in accessing the Internet there, up from 41 percent in 2011. In 2012, 50 percent of every other category of academic completion expressed no interest in connecting to the Internet where they lived. Except in 2001,
8 The U.S. Department of Labor defines the term as “[p]ersons who are neither employed nor unemployed are not in the labor force. This category includes retired persons, students, those taking care of children or other family members, and others who are neither working nor seeking work. Information is collected on their desire for and availability for work, job search activity in the prior year, and reasons for not currently searching.” (U.S. Bureau of Labor Statistics [BLS], 2014).

Exploring the Digital Nation: Embracing the Mobile Internet
28
when 8 percentage points separated the least educated (55 percent) and the most educated (47 percent) householders who said they did not need to visit the Internet at home, the difference between these groups has been nominal (see Figure 17).
Figure 17: Households Citing Lack of Interest as Main Reason for Not Going Online by Education, Percent of Households Not Online at Home, 2001-2012
2001 2003 2009 2010 2011 2012 No Diploma 55 40 40 48 49 50 High School Diploma 53 41 41 50 50 50 Some College 46 36 35 41 41 43 College Degree 47 41 40 45 48 50 Note: Educational attainment is an attribute of the householder.
Following a pattern from 2001, more men than women expressed disinterest in going online at home in 2012, with 50 percent of male heads of non-using households and 47 percent of their female counterparts reporting this answer. The percentage of men offering this response increased 2 points from 2011, but was unchanged for women at 47 percent.
The race or ethnicity of a householder correlates with whether a household not online is interested in using the Internet while home. Between 2001 and 2012, White households have most often stated no interest or need to connect to the Internet in their homes, except in 2011, when 56 percent of Asian American non-using householders stated no desire to do so, compared to 53 percent of Whites. In all other years, Asian American householders were the next group after Whites to express disinterest in using the Internet at home. In the period between 2009 and 2010, the proportion of households of all racial and ethnic groups reporting they lacked interest in, or need for, home Internet use increased markedly, although less so among American Indians and Alaska Natives. From 2011 to 2012, these households were the least likely to say they were not interested in accessing the Internet from home, with the percentage of such responses declining 3 points during the period.
Figure 18: Households Citing Lack of Interest as Main Reason for Not Going Online by Race, Percent of Households Not Online at Home, 2001-2012
2001 2003 2009 2010 2011 2012 White 56 46 45 53 53 55 African American 40 29 33 40 40 40 Hispanic 39 25 30 35 39 38 Asian American 43 36 39 46 56 49 American Indian or Alaska Native 38 31 34 37 34 31 Other N/A 30 28 35 39 38 Note: Race and ethnicity are attributes of the householder.
In 2010, Hispanic households (35 percent) were the least likely to say they did not need to use the Internet where they lived, but disinterest expressed by this group increased to 39 percent in 2011, before falling slightly to 38 percent in 2012. The percentage of

Exploring the Digital Nation: Embracing the Mobile Internet
29
American Indian and Alaska Native households that stated they were not interested in home Internet access decreased from 37 percent in 2010 to 34 percent in 2011 to 31 percent in 2012. While the percentage of African American households expressing that view remained flat at 40 percent from 2010 to 2012, Asian American households offering disinterest to explain why they did not use the Internet at home increased 10 percentage points between 2010 and 2011 (2010: 46 percent; 2011: 56 percent) then dropped 7 points to 49 percent between 2011 and 2012. (see Figure 18).
Generally, between 2001 and 2012, rural residents stated they did not need to use the Internet at home more often than urban residents. CPS data for 2012 show 52 percent of rural residents explained they were not interested in home Internet use, while 48 percent urban residents replied they were uninterested in home Internet).
As in past years, households with school-age children were more likely to consider home Internet use an important supplement to classroom education than households without children in school. In 2001, 49 percent of non-using families with children stated they lacked a need or interest in accessing the Internet at home compared to 57 percent of households without children, but 2012 CPS data reflect decreased disinterest among both groups at 47 percent and 54 percent respectively. Interestingly, between 2009 and 2010, expressions of disinterest in home Internet use increased significantly among families with school-age children (38 percent to 46 percent) and those without them (45 percent to 52 percent).
A higher incidence of U.S. householders who were disabled cited their lack of need or interest in home Internet connections at 56 percent, compared to the 48 percent of all U.S. households that did not access the Internet at home in 2012. Yet in 2011, 51 percent of people with disabilities explained they did not visit the Internet at home because they did not need to. This figure represented a 3 percentage-point decline from 2010 (54 percent) and suggests that further research could help shed light on the reluctance of some people with disabilities to use residential Internet services despite the significant potential benefits such access could provide. For example, in 2012, 61 percent of deaf or hard of hearing individuals who did not access the Internet at home expressed the highest disinterest among people with various disabilities. These respondents may, however, be unaware of, or unable to afford, assistive technologies that could facilitate their use of the Internet at home.
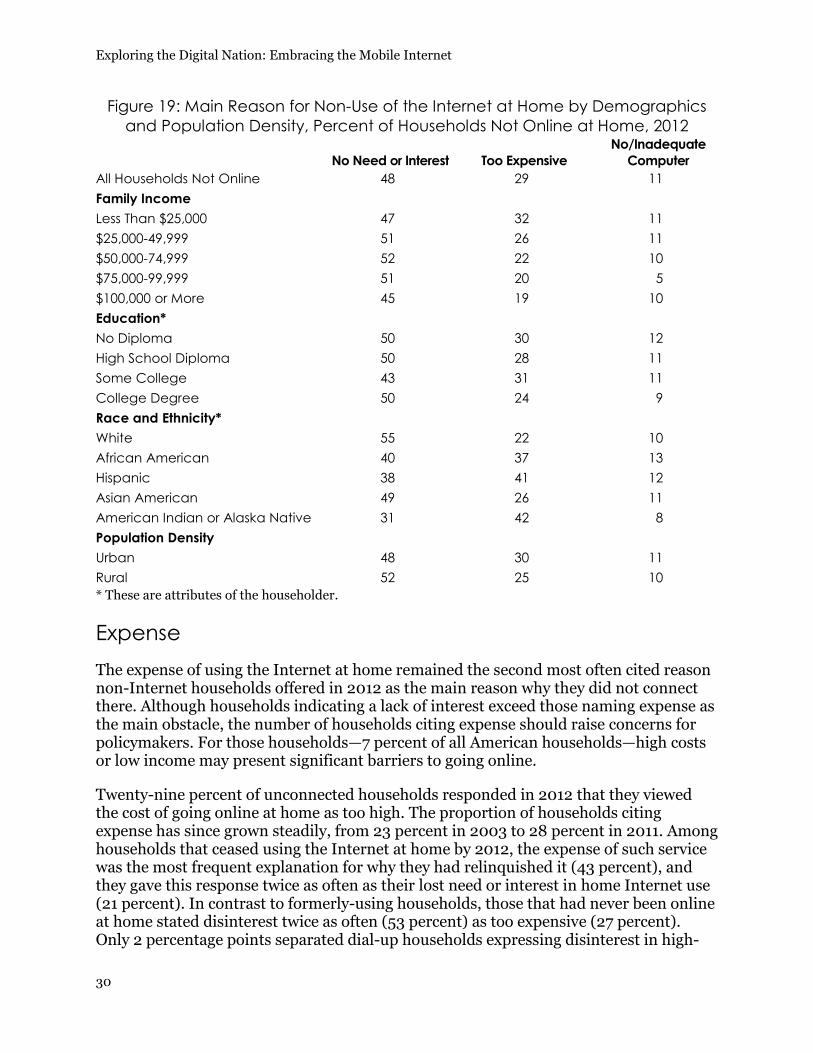
Exploring the Digital Nation: Embracing the Mobile Internet
30
Figure 19: Main Reason for Non-Use of the Internet at Home by Demographics and Population Density, Percent of Households Not Online at Home, 2012
No Need or Interest Too Expensive
No/Inadequate Computer
All Households Not Online 48 29 11 Family Income Less Than $25,000 47 32 11 $25,000-49,999 51 26 11 $50,000-74,999 52 22 10 $75,000-99,999 51 20 5 $100,000 or More 45 19 10 Education* No Diploma 50 30 12 High School Diploma 50 28 11 Some College 43 31 11 College Degree 50 24 9 Race and Ethnicity* White 55 22 10 African American 40 37 13 Hispanic 38 41 12 Asian American 49 26 11 American Indian or Alaska Native 31 42 8 Population Density Urban 48 30 11 Rural 52 25 10 * These are attributes of the householder.
Expense The expense of using the Internet at home remained the second most often cited reason non-Internet households offered in 2012 as the main reason why they did not connect there. Although households indicating a lack of interest exceed those naming expense as the main obstacle, the number of households citing expense should raise concerns for policymakers. For those households—7 percent of all American households—high costs or low income may present significant barriers to going online.
Twenty-nine percent of unconnected households responded in 2012 that they viewed the cost of going online at home as too high. The proportion of households citing expense has since grown steadily, from 23 percent in 2003 to 28 percent in 2011. Among households that ceased using the Internet at home by 2012, the expense of such service was the most frequent explanation for why they had relinquished it (43 percent), and they gave this response twice as often as their lost need or interest in home Internet use (21 percent). In contrast to formerly-using households, those that had never been online at home stated disinterest twice as often (53 percent) as too expensive (27 percent). Only 2 percentage points separated dial-up households expressing disinterest in high-
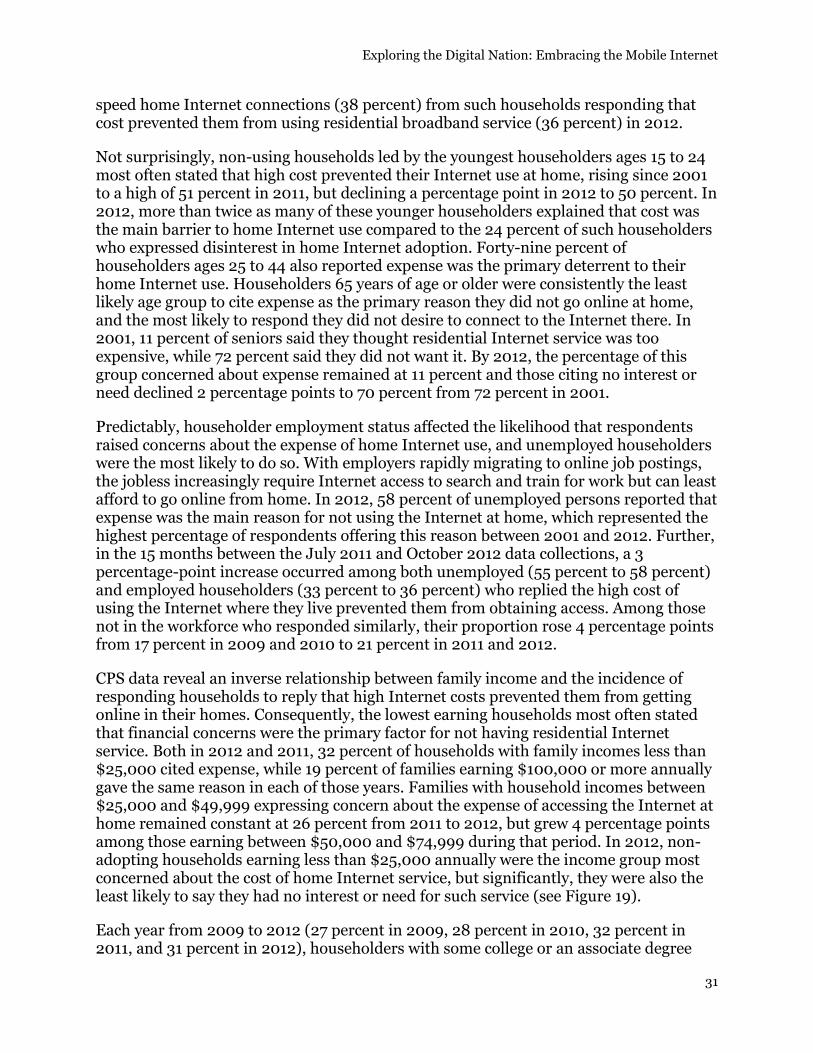
Exploring the Digital Nation: Embracing the Mobile Internet
31
speed home Internet connections (38 percent) from such households responding that cost prevented them from using residential broadband service (36 percent) in 2012.
Not surprisingly, non-using households led by the youngest householders ages 15 to 24 most often stated that high cost prevented their Internet use at home, rising since 2001 to a high of 51 percent in 2011, but declining a percentage point in 2012 to 50 percent. In 2012, more than twice as many of these younger householders explained that cost was the main barrier to home Internet use compared to the 24 percent of such householders who expressed disinterest in home Internet adoption. Forty-nine percent of householders ages 25 to 44 also reported expense was the primary deterrent to their home Internet use. Householders 65 years of age or older were consistently the least likely age group to cite expense as the primary reason they did not go online at home, and the most likely to respond they did not desire to connect to the Internet there. In 2001, 11 percent of seniors said they thought residential Internet service was too expensive, while 72 percent said they did not want it. By 2012, the percentage of this group concerned about expense remained at 11 percent and those citing no interest or need declined 2 percentage points to 70 percent from 72 percent in 2001.
Predictably, householder employment status affected the likelihood that respondents raised concerns about the expense of home Internet use, and unemployed householders were the most likely to do so. With employers rapidly migrating to online job postings, the jobless increasingly require Internet access to search and train for work but can least afford to go online from home. In 2012, 58 percent of unemployed persons reported that expense was the main reason for not using the Internet at home, which represented the highest percentage of respondents offering this reason between 2001 and 2012. Further, in the 15 months between the July 2011 and October 2012 data collections, a 3 percentage-point increase occurred among both unemployed (55 percent to 58 percent) and employed householders (33 percent to 36 percent) who replied the high cost of using the Internet where they live prevented them from obtaining access. Among those not in the workforce who responded similarly, their proportion rose 4 percentage points from 17 percent in 2009 and 2010 to 21 percent in 2011 and 2012.
CPS data reveal an inverse relationship between family income and the incidence of responding households to reply that high Internet costs prevented them from getting online in their homes. Consequently, the lowest earning households most often stated that financial concerns were the primary factor for not having residential Internet service. Both in 2012 and 2011, 32 percent of households with family incomes less than $25,000 cited expense, while 19 percent of families earning $100,000 or more annually gave the same reason in each of those years. Families with household incomes between $25,000 and $49,999 expressing concern about the expense of accessing the Internet at home remained constant at 26 percent from 2011 to 2012, but grew 4 percentage points among those earning between $50,000 and $74,999 during that period. In 2012, non-adopting households earning less than $25,000 annually were the income group most concerned about the cost of home Internet service, but significantly, they were also the least likely to say they had no interest or need for such service (see Figure 19).
Each year from 2009 to 2012 (27 percent in 2009, 28 percent in 2010, 32 percent in 2011, and 31 percent in 2012), householders with some college or an associate degree
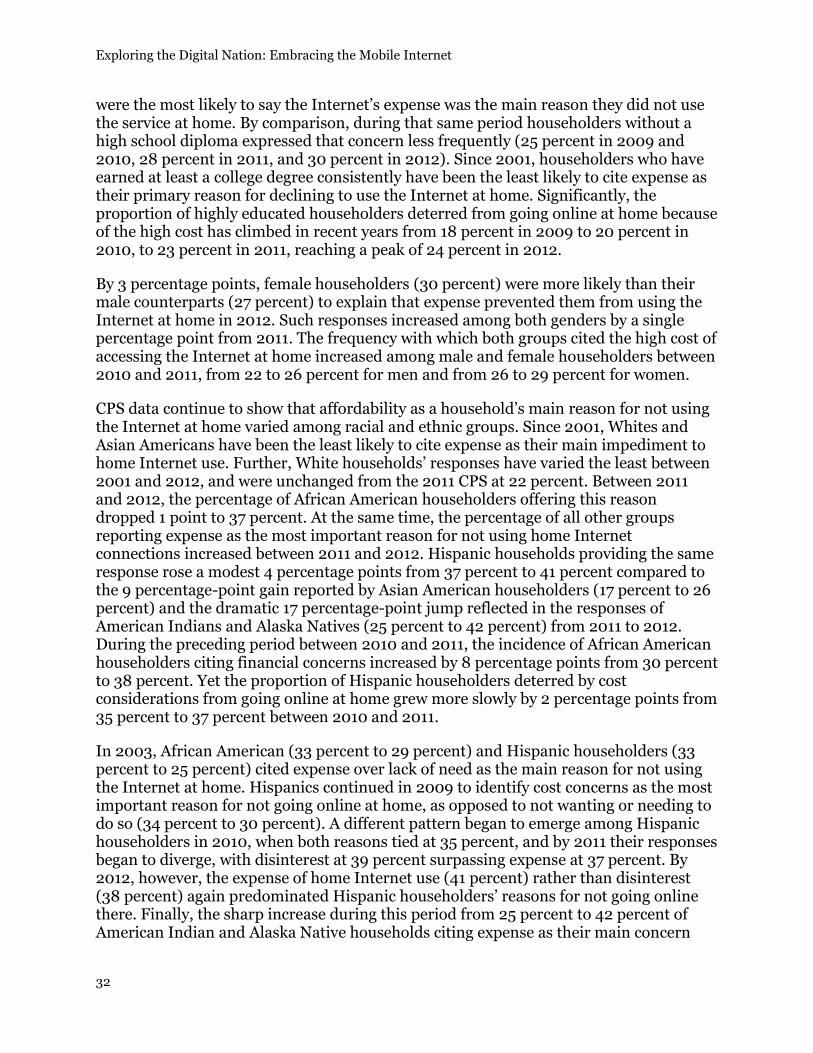
Exploring the Digital Nation: Embracing the Mobile Internet
32
were the most likely to say the Internet’s expense was the main reason they did not use the service at home. By comparison, during that same period householders without a high school diploma expressed that concern less frequently (25 percent in 2009 and 2010, 28 percent in 2011, and 30 percent in 2012). Since 2001, householders who have earned at least a college degree consistently have been the least likely to cite expense as their primary reason for declining to use the Internet at home. Significantly, the proportion of highly educated householders deterred from going online at home because of the high cost has climbed in recent years from 18 percent in 2009 to 20 percent in 2010, to 23 percent in 2011, reaching a peak of 24 percent in 2012.
By 3 percentage points, female householders (30 percent) were more likely than their male counterparts (27 percent) to explain that expense prevented them from using the Internet at home in 2012. Such responses increased among both genders by a single percentage point from 2011. The frequency with which both groups cited the high cost of accessing the Internet at home increased among male and female householders between 2010 and 2011, from 22 to 26 percent for men and from 26 to 29 percent for women.
CPS data continue to show that affordability as a household’s main reason for not using the Internet at home varied among racial and ethnic groups. Since 2001, Whites and Asian Americans have been the least likely to cite expense as their main impediment to home Internet use. Further, White households’ responses have varied the least between 2001 and 2012, and were unchanged from the 2011 CPS at 22 percent. Between 2011 and 2012, the percentage of African American householders offering this reason dropped 1 point to 37 percent. At the same time, the percentage of all other groups reporting expense as the most important reason for not using home Internet connections increased between 2011 and 2012. Hispanic households providing the same response rose a modest 4 percentage points from 37 percent to 41 percent compared to the 9 percentage-point gain reported by Asian American householders (17 percent to 26 percent) and the dramatic 17 percentage-point jump reflected in the responses of American Indians and Alaska Natives (25 percent to 42 percent) from 2011 to 2012. During the preceding period between 2010 and 2011, the incidence of African American householders citing financial concerns increased by 8 percentage points from 30 percent to 38 percent. Yet the proportion of Hispanic householders deterred by cost considerations from going online at home grew more slowly by 2 percentage points from 35 percent to 37 percent between 2010 and 2011.
In 2003, African American (33 percent to 29 percent) and Hispanic householders (33 percent to 25 percent) cited expense over lack of need as the main reason for not using the Internet at home. Hispanics continued in 2009 to identify cost concerns as the most important reason for not going online at home, as opposed to not wanting or needing to do so (34 percent to 30 percent). A different pattern began to emerge among Hispanic householders in 2010, when both reasons tied at 35 percent, and by 2011 their responses began to diverge, with disinterest at 39 percent surpassing expense at 37 percent. By 2012, however, the expense of home Internet use (41 percent) rather than disinterest (38 percent) again predominated Hispanic householders’ reasons for not going online there. Finally, the sharp increase during this period from 25 percent to 42 percent of American Indian and Alaska Native households citing expense as their main concern
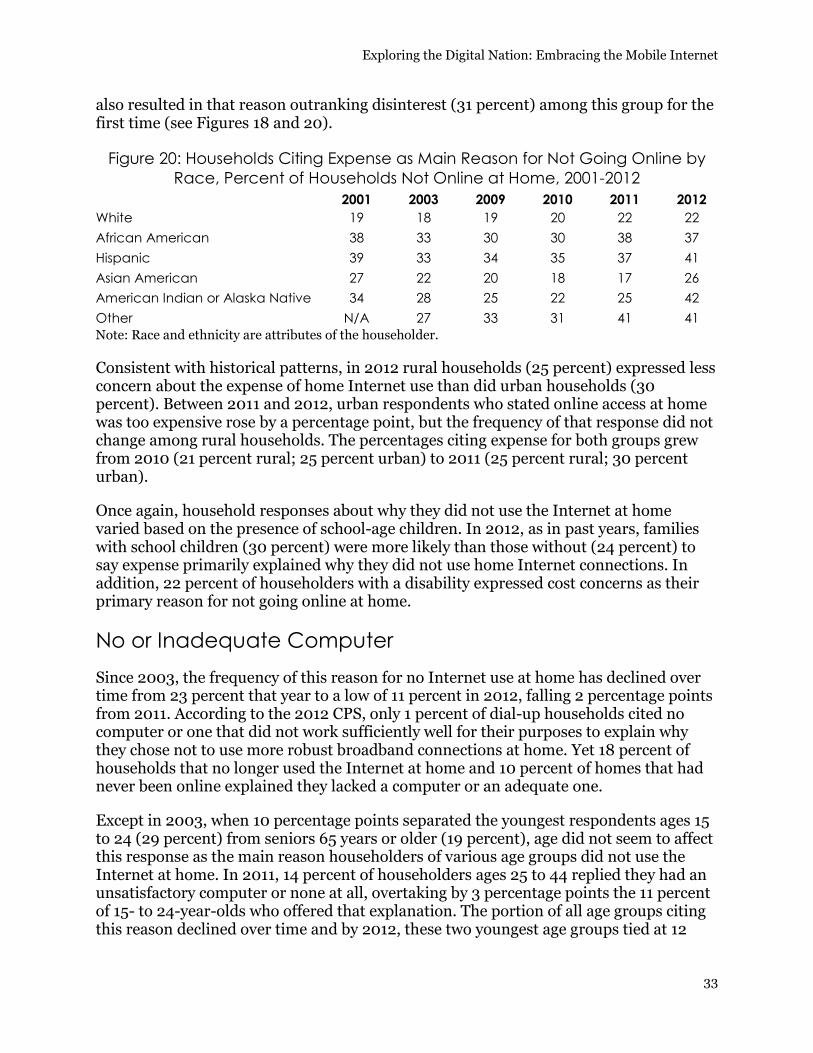
Exploring the Digital Nation: Embracing the Mobile Internet
33
also resulted in that reason outranking disinterest (31 percent) among this group for the first time (see Figures 18 and 20).
Figure 20: Households Citing Expense as Main Reason for Not Going Online by Race, Percent of Households Not Online at Home, 2001-2012
2001 2003 2009 2010 2011 2012 White 19 18 19 20 22 22 African American 38 33 30 30 38 37 Hispanic 39 33 34 35 37 41 Asian American 27 22 20 18 17 26 American Indian or Alaska Native 34 28 25 22 25 42 Other N/A 27 33 31 41 41 Note: Race and ethnicity are attributes of the householder.
Consistent with historical patterns, in 2012 rural households (25 percent) expressed less concern about the expense of home Internet use than did urban households (30 percent). Between 2011 and 2012, urban respondents who stated online access at home was too expensive rose by a percentage point, but the frequency of that response did not change among rural households. The percentages citing expense for both groups grew from 2010 (21 percent rural; 25 percent urban) to 2011 (25 percent rural; 30 percent urban).
Once again, household responses about why they did not use the Internet at home varied based on the presence of school-age children. In 2012, as in past years, families with school children (30 percent) were more likely than those without (24 percent) to say expense primarily explained why they did not use home Internet connections. In addition, 22 percent of householders with a disability expressed cost concerns as their primary reason for not going online at home.
No or Inadequate Computer Since 2003, the frequency of this reason for no Internet use at home has declined over time from 23 percent that year to a low of 11 percent in 2012, falling 2 percentage points from 2011. According to the 2012 CPS, only 1 percent of dial-up households cited no computer or one that did not work sufficiently well for their purposes to explain why they chose not to use more robust broadband connections at home. Yet 18 percent of households that no longer used the Internet at home and 10 percent of homes that had never been online explained they lacked a computer or an adequate one.
Except in 2003, when 10 percentage points separated the youngest respondents ages 15 to 24 (29 percent) from seniors 65 years or older (19 percent), age did not seem to affect this response as the main reason householders of various age groups did not use the Internet at home. In 2011, 14 percent of householders ages 25 to 44 replied they had an unsatisfactory computer or none at all, overtaking by 3 percentage points the 11 percent of 15- to 24-year-olds who offered that explanation. The portion of all age groups citing this reason declined over time and by 2012, these two youngest age groups tied at 12

Exploring the Digital Nation: Embracing the Mobile Internet
34
percent, followed by 45- to 64-year-olds at 11 percent, and seniors ages 65 or older at 10 percent.
Householder employment status apparently has no effect on this reason for no home Internet use. In 2011, 13 percent of both unemployed householders and those not in the labor force cited no computer or a poor one for not going online at home, while 12 percent of employed respondents gave the same reason. In 2012, 11 percent of employed householders, as well as householders outside the labor force gave this response, as did 12 percent of unemployed CPS participants.
Similarly, breaking out households by family income did not reveal large differences in the frequency with which respondents stated they did not go online at home because they lacked an adequate computer.9 In 2011, only 3 percentage points separated the highest income families earning at least $100,000 annually (10 percent) from the lowest income household earning less than $25,000 per year (13 percent) responding that no computer or an inadequate one kept them offline at home. Only a single percentage point differentiated households making as much as $49,999 (11 percent) from households with annual incomes from $50,000 to $74,999, as well as those earning $100,000 or above (10 percent). Interestingly, in 2012, families earning $75,000 to $99,999 were half as likely as other income groups to respond that no or poor computer equipment prevented them from accessing the Internet at home (5 percent) (see Figure 19). CPS results for 2012 showed a large 8 percentage-point drop from 13 percent in 2011 among households in this $75,000 to $99,999 per year income range.
A householder’s lower education level indicated a slightly higher incidence of no computer or an inadequate one as the main reason the household did not use residential Internet service. Between 2003 and 2012, a 4 percentage-point gap existed between householders with a college degree or more and those without a high school diploma generally, except in 2009, when the difference reached 7 percentage points (16 percent to 23 percent). The difference declined to 3 percentage points in 2012 (9 percent to 12 percent). In 2012, the frequency of this response dropped 2 percentage points from 2011 among those without a high school diploma (14 percent to 12 percent) and high school graduates (13 percent to 11 percent). From 2011 to 2012, the percentage gap fell to only 1 point among those with some college or an associate degree (12 percent to 11 percent) and those with at least college degree (10 percent to 9 percent).
American Indian and Alaska Native respondents were the least likely, at 8 percent, to say they lacked any or an adequate computer as the most important reason for not using the Internet at home. In 2010, 23 percent of American Indians and Alaska Natives compared to 14 percent of Whites gave that reason, with 17 percent each of African American and Hispanic householders and 18 percent of Asian American householders citing the same response. In 2012, 10 percent of White householders said their poor or absent computer kept them offline at home, as Asian American (11 percent), Hispanic (12 percent), and African American (13 percent) householders offered similar
9 The falling prices of certain consumer goods and services such as personal computers, cell phones, and cell phone service make them affordable for low income consumers, while “the cost of many services crucial to escaping poverty—including education, health care, and child care—has soared” (Lowrey, 2014).
Exploring the Digital Nation: Embracing the Mobile Internet
35
explanations for their non-use (see Figure 19). Data from all groups show a decrease in the incidence of this response between 2011 and 2012 (including among American Indians and Alaska Natives—18 to 8 percent; Hispanics—15 to 12 percent; Asian Americans—14 to 11 percent; and Whites—13 to 10 percent), except among African American householders, which grew from 11 percent to 13 percent during the period.
Householder gender made little difference between male and female respondents stating they lacked any or an adequate computer to explain why they did not access the Internet from home. In 2011, 13 percent of each gender stated this reason, which dropped to 11 percent for both men and women in 2012. Two percentage points separated men and women in 2009, with men less likely (20 percent) than women (22 percent) to cite access to an insufficient computer, if one was available at all, to explain why they did not use the Internet at home.
Rural or urban residence also negligibly affected whether a household identified no computer or an inadequate one as the major reason for no residential Internet use. Ten percent of rural householders compared to 11 percent of urban householders offered this reason in 2012, with each decreasing from 13 percent in 2011.
As the frequency of households citing computer inadequacy declined over time, only one percentage point distinguished households with school children and families without them in 2003 (23 percent to 22 percent), 2009 (21 percent to 20 percent), 2010 (15 percent to 16 percent), and 2012 (11 percent to 10 percent). In 2011, these two household types tied at 13 percent in the respective frequency of this explanation for no home Internet use. Among people with disabilities, 10 percent expressed dissatisfaction with their computer’s adequacy or stated they had no computer to use for Internet access at home in 2012.
Other Reasons The proportion of households offering this response for why they did not have the Internet at home remained unchanged at 7 percent since 2010, up slightly from 6 percent in 2009. As 2012 data show, 6 percent of households that have never had home Internet access cited “other” reasons for not connecting at home, compared to dial-up households at 9 percent and formerly-Internet-using households at 10 percent.
Can Use It Elsewhere In 2012, households stating they did not access the Internet at home because they could go online at some other location remained constant at 3 percent from 2011, down from 5 percent in 2009 and 2010. Only 1 percent of dial-up households stated they could use the Internet at a different location in 2012, compared to 3 percent of households that have never had residential Internet service and 4 percent of households that previously used the Internet at home.
Consistently, householders ages 15 to 24 and 25 to 44 were the most likely to say they could access the Internet at a location other than their own homes, possibly because
Exploring the Digital Nation: Embracing the Mobile Internet
36
service was available to them at school or work. Seniors 65 years or older were predictably the least likely to state alternative access as their main reason. For example, in 2012, 5 percent of 15- to 44-year-olds gave this as their main reason, followed by householders ages 45 to 64 at 4 percent, and those 65 and older at 1 percent.
More employed and unemployed individuals offered this reason, compared to householders not in the labor force. Conceivably, employed householders could use the Internet where they work, just as unemployed household heads may find access at job placement and training sites or other locations. Data from the 2012 CPS demonstrate that employed householders (5 percent) were more than twice as likely as those not in labor force (2 percent) to give this response. This represents a decrease from 2011 among employed (6 percent) and unemployed (3 percent) non-using householders, but doubled to 2 percent in 2012 for those not in labor force.
Income appears to be positively related to the opportunity to use the Internet outside of the home, with the lowest earning households least likely to give alternative location as the primary reason they did not use the Internet at home. In 2012, householders earning $75,000 to $99,999 (9 percent) were three times more likely to give this answer than those earning $25,000 to $49,999 (3 percent). The most affluent householders with family incomes of at least $100,000 (8 percent) were four times more likely than those earning less than $25,000 (2 percent) to reply they could use the Internet somewhere else. The same pattern held in 2011, and remained constant for the highest and lowest income households, but increased from 5 percent to 9 percent in 2012 for households earning $75,000 to $99,999 per year.
As with income, the likelihood that respondents replied they had other places to access the Internet increases with educational attainment. The proportions did not fluctuate between 2011 and 2012 for householders with: no diploma (1 percent), a high school diploma (3 percent), some college courses or associate degree (4 percent), and a college degree or higher (7 percent). The largest percentage-point change reported by higher educated householders occurred between 2010 and 2011, when the incidence dropped 4 percentage points from 8 percent to 4 percent among those with some college, and by 5 points from 12 percent to 7 percent among householders with at least a college degree.
Male and female households responding they could use the Internet elsewhere held firm for each at 3 percent in 2011 and 2012. Two percent of individuals with disabilities reported they could go online at another location in the 2012 CPS.
CPS data indicate small differences in householders explaining they could go elsewhere to connect to the Internet based on their race and ethnicity. In 2003, “Others” provided this response most often at 4 percent, followed by Whites and Asian Americans at 3 percent each, American Indians and Alaska Natives at 2 percent, and African Americans and Hispanics at 1 percent each. However, the proportion of all racial and ethnic groups offering this as the main reason for no home Internet has increased over time between 2003 and 2010, peaking in 2010 with American Indian and Alaska Native householders at 9 percent, African American householders at 6 percent and White, Asian American, and Hispanic householders each at 5 percent. The percentages of American Indian and Alaska Native householders fell by two-thirds in 2011 to 3 percent, before doubling

Exploring the Digital Nation: Embracing the Mobile Internet
37
again to 6 percent in 2012, when again they were the most likely to say their ability to use the Internet at an alternative location explained why they did not connect to the Internet where they lived. Between 2011 and 2012, the portion of Whites giving this reason remained stable at 3 percent as did that of Asian Americans at 4 percent, but African American and Hispanic householder responses dropped to 3 percent and 2 percent, respectively.
In 2011, rural (2 percent) and urban (3 percent) respondents reported other locations as their main reason for no home Internet use, but they tied each at 3 percent in 2012. No difference existed between the responses of non-using families with or without school-age children, with 5 percent of each responding in this fashion in 2010, compared to 3 percent each in 2011 and 2012.
Not Available In Area This response has remained constant for both rural and urban householders from 2009 to 2012. During that time, rural residents were twice as likely at 2 percent to explain they did not connect to the Internet at home because no Internet service was available where they lived compared to 1 percent of urban residents. American Indian and Alaska Native households were the most likely racial group to give this reason, with the ratio fluctuating from 3 percent in 2009, to 4 percent in 2010, up significantly to 11 percent in 2011, before settling back to 4 percent in 2012. Three percent of non-using households with family incomes of $100,000 or more reported that residential Internet service was unavailable, compared to 1 percent of those households with incomes below $50,000. Fifteen percent of dial-up households reported they did not use high-speed connections at home because residential broadband service was inaccessible to them.
Privacy Although only 1 percent of households expressed privacy concerns in both 2011 and 2012 as their primary reason for not using the Internet at home, well-publicized data breaches and greater consumer awareness of Internet privacy issues may affect this response in future years. In view of its ongoing efforts to advance policies to protect consumer data privacy, NTIA will carefully monitor upcoming data on this question.
As households increase their home Internet use, research exploring the value proposition for non-Internet consumers could help policymakers understand, for example, whether persistent non-users do not find such access integral to their daily lives and therefore are not interested in it, whether they do not find sufficient utility in home Internet use to pay the costs they perceive as too high, or whether they truly desire residential Internet service, but simply cannot afford it. Further research on these and other questions could help government and community leaders best tailor policies that facilitate sustained broadband adoption by Americans who cannot use this empowering technology or have not yet to chosen to do so.
Exploring the Digital Nation: Embracing the Mobile Internet
38
Conclusion From the start of the Digital Nation series and predecessor reports on the digital divide beginning in 1994, each survey provides new insight into how Americans are accessing and using the Internet. NTIA looks forward to further exploring the questions generated by the current data, while continuing to find new ways to analyze and report findings to best meet the needs of social scientists and policymakers. In the next Digital Nation report, NTIA hopes to develop a greater understanding of why Americans choose to go online, and the device choices they make to do so. As NTIA uses this information to advance national policy to reach the critical goal of making the Internet available and affordable for every American, we urge each community to accelerate local efforts to bridge the digital divide through actively engaging citizens and elected officials, as well as its civic, business, and non-profit leaders. Our nation’s future depends in part on our success in this common pursuit.

Exploring the Digital Nation: Embracing the Mobile Internet
39
References Ahsan, K., Khan, O., Salam, A. (2013). Assistive technology for night blindness: A mobile application approach. International Journal of Mobile Learning and Organisation, 7 (2), 140-157. Arthur D. Little, Chalmers University of Technology, & Ericsson. (2013, Sep.). Socioeconomic effects of broadband speed. Retrieved from http://www.ericsson.com/res/thecompany/docs/corporate-responsibility /2013/ericsson-broadband-final-071013.pdf Cisero, M. (2014, April 17). How baby boomers are embracing mobile shopping. BIA/Kelsey Local Media Watch. Retrieved from http://blog.biakelsey.com/index.php/2014/04/17/how-baby-boomers-are- embracing-mobile-shopping/ DeGusta, M. (2012, May 9). Are smart phones spreading faster than any technology in
human history? MIT Technology Review. Retrieved from http://www.technologyreview.com/news/427787/are-smart-phones-spreading-faster-than-any-technology-in-human-history/
Economics and Statistics Administration (ESA), & National Telecommunications and Information Administration (NTIA). (2000, Oct.). Falling through the net: Toward digital inclusion—A report on Americans’ access to technology tools. Retrieved from http://www.ntia.doc.gov/files/ntia/publications/fttn00.pdf Executive Order No. 13636, 78 F.R. 11739 (2013). Federal Communications Commission (FCC) & National Telecommunications and Information Administration (NTIA). (2014, Feb.). Access to broadband technology by speed. National Broadband Map Broadband Statistics Report. Retrieved from http://www.broadbandmap.gov/download/Technology%20by%20Speed.pdf Federal Communications Commission (FCC) & National Telecommunications and Information Administration (NTIA). (2014, Feb.). Broadband availability in urban vs. rural areas. National Broadband Map Broadband Statistics Report. Retrieved from http://www.broadbandmap.gov/download/Broadband%20Availability%20in%2 0Rural%20vs%20Urban%20Areas.pdf Frost & Sullivan. (2014, May 15). Frost and Sullivan: A market potential of USD$731 billion in connected living by 2020. Retrieved from http://www.frost.com/prod/servlet/press-release.pag?docid=290755603

Exploring the Digital Nation: Embracing the Mobile Internet
40
Gartner. (2013, Dec. 12). Gartner says the Internet of things installed base will grow to 26 billion units by 2020. Retrieved from http://www.gartner.com/newsroom/id/2636073 Internet Innovation Alliance. (2013). Access to broadband internet: Top ten areas of saving—2013. Retrieved from http://www.internetinnovation.org/library/special-reports/access-to- broadband-internet-top-ten-areas-of-saving-2013/ Jackson, D. (2012, Jul. 30). Smartphones: The new weapon to combat unemployment. Jobs & Hire. Retrieved from http://www.jobsnhire.com/articles/2606/20120730/jobs-hunting-mobile-apps- iphone-android-careers-entry-level-unemployment.htm Lowrey, A. (2014, Apr. 30). Changed life of the poor: Better off, but far behind. The New York Times. Retrieved from http://www.nytimes.com/2014/05/01/business/economy/changed-life-of-the- poor-squeak-by-and-buy-a- lot.html?emc=edit_th_20140501&nl=todayshead lines&nlid=62921653&_r=0 Mandel, M. (2013, Jul. 8). 752,000 app economy jobs on the 5th anniversary of the app store. Progressive Policy Institute. Retrieved from http://www.progressivepolicy.org/2013/07/752000-app-economy-jobs-on-the- 5th-anniversary-of-the-app-store/ Mulpuru, S. (2014, May 12). US mobile phone and tablet commerce forecast, 2013 to 2018. Forrester Research. Retrieved from http://www.forrester.com/US+Mobile+Phone+And+Tablet+Commerce+Forecas t+2013+To+2018/fulltext//ERES115514?intcmp=blog:forrlink National Telecommunications and Information Administration (NTIA). (2001-2012). Current Population Survey data. Internet and Computer Use Studies and Data Files. Retrieved from http://www.ntia.doc.gov/data National Telecommunications and Information Administration (NTIA). (2013, Aug. 5). New broadband map data shows progress, but work remains. Retrieved from http://www.ntia.doc.gov/blog/2013/new-broadband-map-data-shows-progress- work-remains National Telecommunications and Information Administration (NTIA). (2014, Feb. 5). Digital learning program prepares students for school, careers and life in the 21st century. Retrieved from http://www.ntia.doc.gov/blog/2014/digital- learning-program-prepares-students-school-careers-and-life-21st-century

Exploring the Digital Nation: Embracing the Mobile Internet
41
National Telecommunications and Information Administration (NTIA). (2014, Jun. 5). NTIA releases interim progress report on administration’s plan to free up more spectrum. Retrieved from http://www.ntia.doc.gov/blog/2014/ntia-releases- interim-progress-report-administration-s-plan-free-more-spectrum National Telecommunications and Information Administration (NTIA) & Economics
and Statistics Administration (ESA). (2013, June). Exploring the digital nation: America’s emerging online experience. Retrieved from http://www.ntia.doc.gov/files/ntia/publications/exploring_the_digital_nation_-_americas_emerging_online_experience.pdf
Office of Management and Budget (OMB). 2009, Dec. 9), OMB bulletin no. 10-02:
Update of statistical area definitions and guidance on their uses. Retrieved from http://www.whitehouse.gov/sites/default/files/omb/assets/bulletins/b10-02.pdf
The Organisation for Economic Co-operation and Development (OECD). (2014a, Jan. 9). Total fixed and wireless broadband subscriptions by country. OECD Broadband Portal. Retrieved from http://www.oecd.org/sti/broadband/oecdbroadbandportal.htm The Organisation for Economic Co-operation and Development (OECD). (2014b, Jan. 9). Fixed and wireless broadband subscriptions per 100 inhabitants. OECD Broadband Portal. Retrieved from http://www.oecd.org/sti/broadband/oecdbroadbandportal.htm Pew Research Center. (2014, Jan. 16). E-reading rises as device ownership jumps. PewResearch Internet Project. Retrieved from http://www.pewinternet.org/2014/01/16/e-reading-rises-as-device-ownership-jumps/ Rogers, E.M. (1995). Diffusion of innovations (4th ed.). New York, NY: Free Press. Salpeter, M. (2012, Jul. 11). The 9 best tips for submitting an online job application. US News & World Report. Retrieved from http://money.usnews.com/money/blogs/ outside-voices-careers/2012/07/11/the-9-best-tips-for-submitting-an-online- job-application SQW Group. (2013, Nov.) UK broadband impact study: Impact report. Commissioned by the United Kingdom Department for Culture, Media & Sport. Retrieved from https://www.gov.uk/government/uploads/system/uploads/attachment_data/fil e/257006/U K_Broadband_Impact_Study_-_Impact_Report_-_Nov_2013_- _Final.pdf U.S. Bureau of Labor Statistics (BLS). (2014). Labor force characteristics. Labor force statistics from the Current Population Survey. Retrieved from http://www.bls.gov/cps/lfcharacteristics.htm#nlf
Exploring the Digital Nation: Embracing the Mobile Internet
42
U.S. Bureau of Labor Statistics (BLS) & U.S. Census Bureau. (2006, Oct.). Technical paper 66. Design and Methodology—Current Population Survey, 5-1. Retrieved from http://www.census.gov/prod/2006pubs/tp-66.pdf U.S. Census Bureau. (2011). July 2011 computer and Internet use supplemental survey. Retrieved from http://thedataweb.rm.census.gov/ftp/cps_ftp.html#cpssupps U.S. Census Bureau. (2011). July 2011 current population survey. Retrieved from http://thedataweb.rm.census.gov/ftp/cps_ftp.html#cpsbasic U.S. Census Bureau. (2012). Current population survey (CPS) data. Retrieved from https://www.census.gov/cps/data/ U.S. Census Bureau. (2012). October 2012 current population survey. Retrieved from http://thedataweb.rm.census.gov/ftp/cps_ftp.html#cpsbasic U.S. Census Bureau. (2012). October 2012 school enrollment and Internet use supplemental survey. Retrieved from http://thedataweb.rm.census.gov/ftp/cps_ftp.html#cpssupps U.S. Department of Commerce. (2013, July 31). Commerce’s Internet Policy Task Force releases report on digital copyright policy. Retrieved from http://www.commerce.gov/blog/2013/07/31/commerces-internet-policy-task- force-releases-report-digital-copyright-policy The White House, Office of the Press Secretary. (2013, June 6). President Obama unveils connected initiative to bring America’s students into digital age. Retrieved from http://www.whitehouse.gov/the-press- office/2013/06/06/president-obama-unveils-connected-initiative-bring- america-s-students-di The White House, Office of the Press Secretary. (2013, June 6). Remarks by the
President at Mooresville Middle School. Speech presented at Mooresville Middle School, Mooresville, NC. Retrieved from http://www.whitehouse.gov/the-press-office/2013/06/06/remarks-president-mooresville-middle-school-mooresville-nc

Exploring the Digital Nation: Embracing the Mobile Internet
43
Appendix A: Data and Methodology This report uses data from the October 2012 Current Population Survey (“CPS”), a monthly survey of a representative sample of the U.S. noninstitutional population that provides data on labor force participation, income, and demographic characteristics of households. It includes data from the October 2012 CPS Computer and Internet Use Supplement, a special supplement to the CPS periodically commissioned by NTIA.
The October 2012 CPS asked each surveyed household whether someone in that household used or owned a computer, as well as who in the household used the Internet, and the devices and locations from which they did so. In addition, the survey asked the household which of the following technologies members utilized to connect to the Internet from home: dial-up service, DSL, cable modem, fiber optics, satellite, mobile broadband, or some other Internet connection technology. Using these data, it is possible to determine whether a household owned a personal computer (i.e., desktop, laptop, netbook, or notebook) or a handheld device, as well as the type of broadband technology (i.e., DSL, cable modem, fiber optics, satellite, or mobile broadband) members utilized to connect to the Internet. The survey also asked those households that did not access Internet services to state their main reason for not doing so.
The October 2012 CPS Supplement included a group of questions primarily concerning Internet and mobile phone usage habits.10 These questions were asked of the household respondent about his/her own usage habits. Since one person in each household responded and that person was not randomly selected, a special set of weights was created to properly tally these variables. Care should be used when analyzing these data because the respondents are not evenly distributed across the sample based on age. This is why analysis of these data only includes the population ages 25 and older.
About 53,600 household records comprise the sample, representing 122 million American households. NTIA analyzes computer and Internet use at the household and person levels and their association with characteristics such as age, family income, household size and composition, and geographic location. When conducting household-level analysis, the authors use information for the household reference person (also known as the “head of household” or “householder”) as proxies for characteristics like education, race, ethnicity, age, disability status, and foreign-born status.
Prior to October 2010, data on computer use, as well as the types of broadband technology that online households utilized, had not been available since the early 2000s. The supply and demand for both mobile devices and residential Internet access services have changed enormously during this period. The October 2012 data serve to update these trends. The data from the October 2012 CPS make it possible to continue to identify the preferred or most common types of computers and access technologies used for residential Internet access, including the prevalence of mobile broadband technologies and handheld devices. 10 The specific questions used in the October 2012 survey instrument are available at http://www.census.gov/prod/techdoc/cps/cpsoct12.pdf.

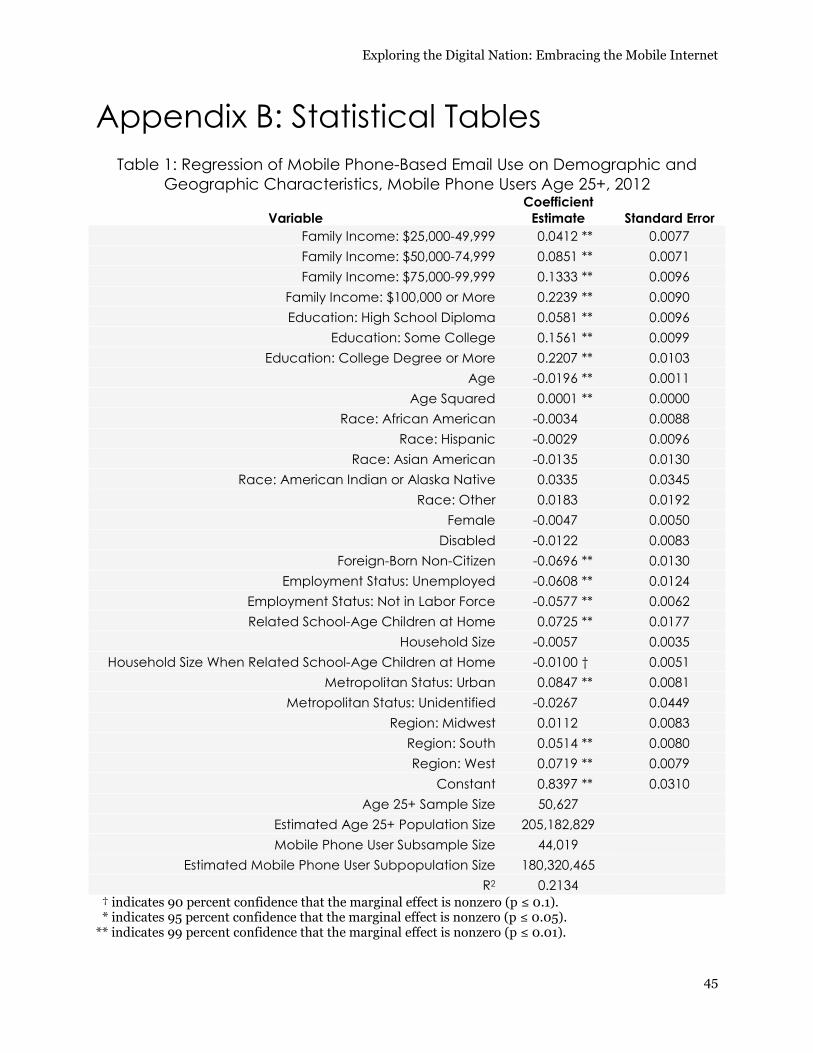
Exploring the Digital Nation: Embracing the Mobile Internet
45
Appendix B: Statistical Tables Table 1: Regression of Mobile Phone-Based Email Use on Demographic and
Geographic Characteristics, Mobile Phone Users Age 25+, 2012
Variable Coefficient
Estimate Standard Error Family Income: $25,000-49,999 0.0412 ** 0.0077 Family Income: $50,000-74,999 0.0851 ** 0.0071 Family Income: $75,000-99,999 0.1333 ** 0.0096
Family Income: $100,000 or More 0.2239 ** 0.0090 Education: High School Diploma 0.0581 ** 0.0096
Education: Some College 0.1561 ** 0.0099 Education: College Degree or More 0.2207 ** 0.0103
Age -0.0196 ** 0.0011 Age Squared 0.0001 ** 0.0000
Race: African American -0.0034 0.0088 Race: Hispanic -0.0029 0.0096
Race: Asian American -0.0135 0.0130 Race: American Indian or Alaska Native 0.0335 0.0345
Race: Other 0.0183 0.0192 Female -0.0047 0.0050
Disabled -0.0122 0.0083 Foreign-Born Non-Citizen -0.0696 ** 0.0130
Employment Status: Unemployed -0.0608 ** 0.0124 Employment Status: Not in Labor Force -0.0577 ** 0.0062 Related School-Age Children at Home 0.0725 ** 0.0177
Household Size -0.0057 0.0035 Household Size When Related School-Age Children at Home -0.0100 † 0.0051
Metropolitan Status: Urban 0.0847 ** 0.0081 Metropolitan Status: Unidentified -0.0267 0.0449
Region: Midwest 0.0112 0.0083 Region: South 0.0514 ** 0.0080 Region: West 0.0719 ** 0.0079
Constant 0.8397 ** 0.0310 Age 25+ Sample Size 50,627
Estimated Age 25+ Population Size 205,182,829 Mobile Phone User Subsample Size 44,019
Estimated Mobile Phone User Subpopulation Size 180,320,465 R2 0.2134
† indicates 90 percent confidence that the marginal effect is nonzero (p ≤ 0.1). * indicates 95 percent confidence that the marginal effect is nonzero (p ≤ 0.05). ** indicates 99 percent confidence that the marginal effect is nonzero (p ≤ 0.01).
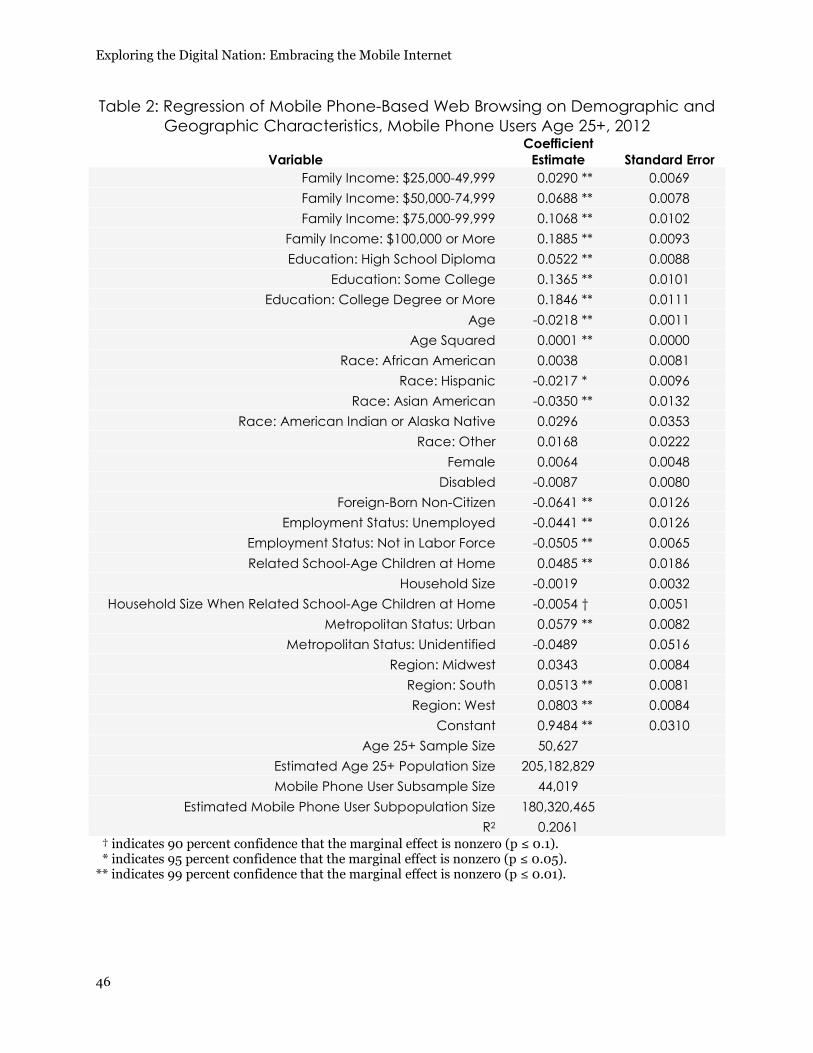
Exploring the Digital Nation: Embracing the Mobile Internet
46
Table 2: Regression of Mobile Phone-Based Web Browsing on Demographic and Geographic Characteristics, Mobile Phone Users Age 25+, 2012
Variable Coefficient
Estimate Standard Error Family Income: $25,000-49,999 0.0290 ** 0.0069 Family Income: $50,000-74,999 0.0688 ** 0.0078 Family Income: $75,000-99,999 0.1068 ** 0.0102
Family Income: $100,000 or More 0.1885 ** 0.0093 Education: High School Diploma 0.0522 ** 0.0088
Education: Some College 0.1365 ** 0.0101 Education: College Degree or More 0.1846 ** 0.0111
Age -0.0218 ** 0.0011 Age Squared 0.0001 ** 0.0000
Race: African American 0.0038 0.0081 Race: Hispanic -0.0217 * 0.0096
Race: Asian American -0.0350 ** 0.0132 Race: American Indian or Alaska Native 0.0296 0.0353
Race: Other 0.0168 0.0222 Female 0.0064 0.0048
Disabled -0.0087 0.0080 Foreign-Born Non-Citizen -0.0641 ** 0.0126
Employment Status: Unemployed -0.0441 ** 0.0126 Employment Status: Not in Labor Force -0.0505 ** 0.0065 Related School-Age Children at Home 0.0485 ** 0.0186
Household Size -0.0019 0.0032 Household Size When Related School-Age Children at Home -0.0054 † 0.0051
Metropolitan Status: Urban 0.0579 ** 0.0082 Metropolitan Status: Unidentified -0.0489 0.0516
Region: Midwest 0.0343 0.0084 Region: South 0.0513 ** 0.0081 Region: West 0.0803 ** 0.0084
Constant 0.9484 ** 0.0310 Age 25+ Sample Size 50,627
Estimated Age 25+ Population Size 205,182,829 Mobile Phone User Subsample Size 44,019
Estimated Mobile Phone User Subpopulation Size 180,320,465 R2 0.2061
† indicates 90 percent confidence that the marginal effect is nonzero (p ≤ 0.1). * indicates 95 percent confidence that the marginal effect is nonzero (p ≤ 0.05). ** indicates 99 percent confidence that the marginal effect is nonzero (p ≤ 0.01).

Exploring the Digital Nation: Embracing the Mobile Internet
47
Table 3: Regression of Mobile Phone-Based App Downloading on Demographic and Geographic Characteristics, Mobile Phone Users Age 25+, 2012
Variable Coefficient
Estimate Standard Error Family Income: $25,000-49,999 0.0396 ** 0.0067 Family Income: $50,000-74,999 0.0747 ** 0.0071 Family Income: $75,000-99,999 0.1187 ** 0.0095
Family Income: $100,000 or More 0.1845 ** 0.0087 Education: High School Diploma 0.0390 ** 0.0091
Education: Some College 0.1115 ** 0.0082 Education: College Degree or More 0.1455 ** 0.0099
Age -0.0230 ** 0.0010 Age Squared 0.0001 ** 0.0000
Race: African American -0.0090 0.0080 Race: Hispanic -0.0371 ** 0.0090
Race: Asian American -0.0261 * 0.0128 Race: American Indian or Alaska Native 0.0035 0.0328
Race: Other 0.0199 0.0197 Female -0.0002 0.0045
Disabled -0.0062 0.0073 Foreign-Born Non-Citizen -0.0815 ** 0.0120
Employment Status: Unemployed -0.0421 ** 0.0112 Employment Status: Not in Labor Force -0.0382 ** 0.0055 Related School-Age Children at Home 0.0640 ** 0.0177
Household Size 0.0021 0.0035 Household Size When Related School-Age Children at Home -0.0138 ** 0.0052
Metropolitan Status: Urban 0.0584 ** 0.0078 Metropolitan Status: Unidentified -0.0316 0.0335
Region: Midwest 0.0251 ** 0.0084 Region: South 0.0438 ** 0.0081 Region: West 0.0797 ** 0.0077
Constant 0.8562 ** 0.0312 Age 25+ Sample Size 50,627
Estimated Age 25+ Population Size 205,182,829 Mobile Phone User Subsample Size 44,019
Estimated Mobile Phone User Subpopulation Size 180,320,465 R2 0.1725
† indicates 90 percent confidence that the marginal effect is nonzero (p ≤ 0.1). * indicates 95 percent confidence that the marginal effect is nonzero (p ≤ 0.05). ** indicates 99 percent confidence that the marginal effect is nonzero (p ≤ 0.01).

Exploring the Digital Nation: Embracing the Mobile Internet
48
Table 4: Regression of Mobile Phone-Based Social Networking on Demographic and Geographic Characteristics, Mobile Phone Users Age 25+, 2012
Variable Coefficient
Estimate Standard Error Family Income: $25,000-49,999 0.0352 ** 0.0067 Family Income: $50,000-74,999 0.0651 ** 0.0075 Family Income: $75,000-99,999 0.0779 ** 0.0100
Family Income: $100,000 or More 0.1227 ** 0.0088 Education: High School Diploma 0.0359 ** 0.0084
Education: Some College 0.0928 ** 0.0085 Education: College Degree or More 0.1168 ** 0.0105
Age -0.0274 ** 0.0010 Age Squared 0.0002 ** 0.0000
Race: African American -0.0094 0.0086 Race: Hispanic -0.0190 * 0.0087
Race: Asian American -0.0226 † 0.0131 Race: American Indian or Alaska Native 0.0464 0.0324
Race: Other 0.0421 * 0.0203 Female 0.0482 ** 0.0049
Disabled 0.0001 0.0067 Foreign-Born Non-Citizen -0.0703 ** 0.0115
Employment Status: Unemployed -0.0468 ** 0.0121 Employment Status: Not in Labor Force -0.0342 ** 0.0055 Related School-Age Children at Home 0.0640 ** 0.0164
Household Size 0.0012 0.0031 Household Size When Related School-Age Children at Home -0.0132 ** 0.0048
Metropolitan Status: Urban 0.0341 ** 0.0073 Metropolitan Status: Unidentified -0.0869 * 0.0371
Region: Midwest 0.0311 ** 0.0075 Region: South 0.0499 ** 0.0071 Region: West 0.0608 ** 0.0074
Constant 0.9967 ** 0.0301 Age 25+ Sample Size 50,627
Estimated Age 25+ Population Size 205,182,829 Mobile Phone User Subsample Size 44,019
Estimated Mobile Phone User Subpopulation Size 180,320,465 R2 0.1739
† indicates 90 percent confidence that the marginal effect is nonzero (p ≤ 0.1). * indicates 95 percent confidence that the marginal effect is nonzero (p ≤ 0.05). ** indicates 99 percent confidence that the marginal effect is nonzero (p ≤ 0.01).
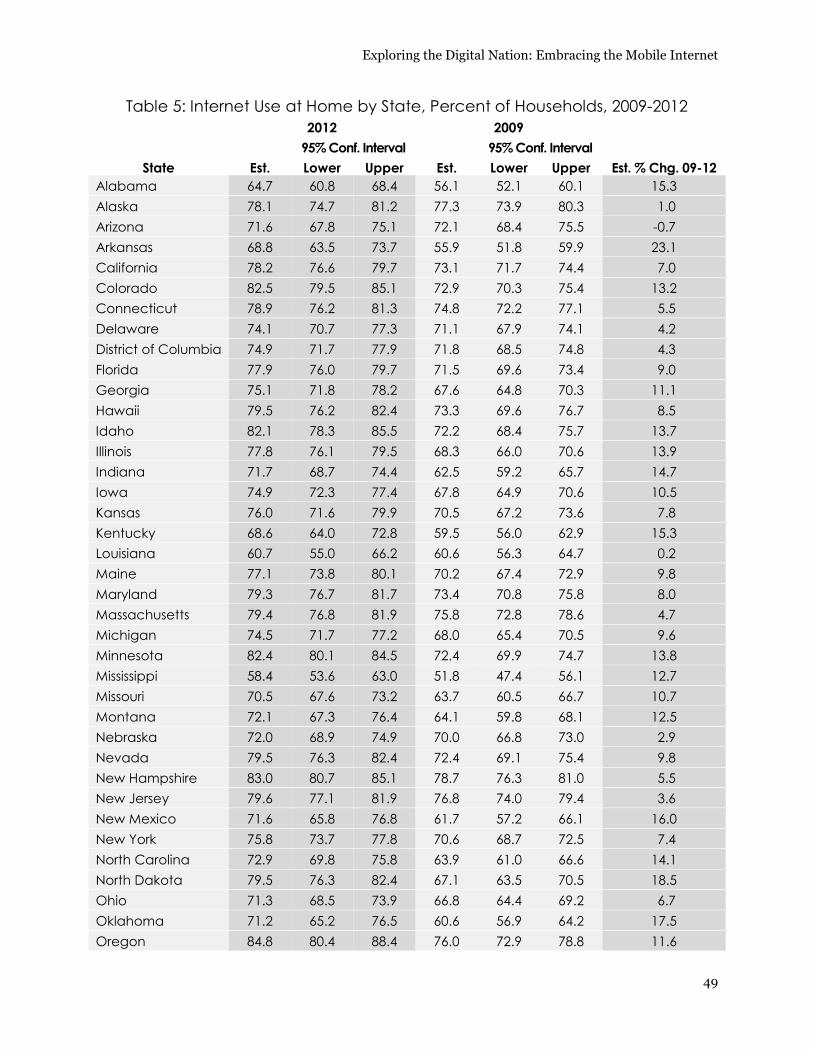
Exploring the Digital Nation: Embracing the Mobile Internet
49
Table 5: Internet Use at Home by State, Percent of Households, 2009-2012
2012 2009
95% Conf. Interval
95% Conf. Interval
State Est. Lower Upper Est. Lower Upper Est. % Chg. 09-12 Alabama 64.7 60.8 68.4 56.1 52.1 60.1 15.3 Alaska 78.1 74.7 81.2 77.3 73.9 80.3 1.0 Arizona 71.6 67.8 75.1 72.1 68.4 75.5 -0.7 Arkansas 68.8 63.5 73.7 55.9 51.8 59.9 23.1 California 78.2 76.6 79.7 73.1 71.7 74.4 7.0 Colorado 82.5 79.5 85.1 72.9 70.3 75.4 13.2 Connecticut 78.9 76.2 81.3 74.8 72.2 77.1 5.5 Delaware 74.1 70.7 77.3 71.1 67.9 74.1 4.2 District of Columbia 74.9 71.7 77.9 71.8 68.5 74.8 4.3 Florida 77.9 76.0 79.7 71.5 69.6 73.4 9.0 Georgia 75.1 71.8 78.2 67.6 64.8 70.3 11.1 Hawaii 79.5 76.2 82.4 73.3 69.6 76.7 8.5 Idaho 82.1 78.3 85.5 72.2 68.4 75.7 13.7 Illinois 77.8 76.1 79.5 68.3 66.0 70.6 13.9 Indiana 71.7 68.7 74.4 62.5 59.2 65.7 14.7 Iowa 74.9 72.3 77.4 67.8 64.9 70.6 10.5 Kansas 76.0 71.6 79.9 70.5 67.2 73.6 7.8 Kentucky 68.6 64.0 72.8 59.5 56.0 62.9 15.3 Louisiana 60.7 55.0 66.2 60.6 56.3 64.7 0.2 Maine 77.1 73.8 80.1 70.2 67.4 72.9 9.8 Maryland 79.3 76.7 81.7 73.4 70.8 75.8 8.0 Massachusetts 79.4 76.8 81.9 75.8 72.8 78.6 4.7 Michigan 74.5 71.7 77.2 68.0 65.4 70.5 9.6 Minnesota 82.4 80.1 84.5 72.4 69.9 74.7 13.8 Mississippi 58.4 53.6 63.0 51.8 47.4 56.1 12.7 Missouri 70.5 67.6 73.2 63.7 60.5 66.7 10.7 Montana 72.1 67.3 76.4 64.1 59.8 68.1 12.5 Nebraska 72.0 68.9 74.9 70.0 66.8 73.0 2.9 Nevada 79.5 76.3 82.4 72.4 69.1 75.4 9.8 New Hampshire 83.0 80.7 85.1 78.7 76.3 81.0 5.5 New Jersey 79.6 77.1 81.9 76.8 74.0 79.4 3.6 New Mexico 71.6 65.8 76.8 61.7 57.2 66.1 16.0 New York 75.8 73.7 77.8 70.6 68.7 72.5 7.4 North Carolina 72.9 69.8 75.8 63.9 61.0 66.6 14.1 North Dakota 79.5 76.3 82.4 67.1 63.5 70.5 18.5 Ohio 71.3 68.5 73.9 66.8 64.4 69.2 6.7 Oklahoma 71.2 65.2 76.5 60.6 56.9 64.2 17.5 Oregon 84.8 80.4 88.4 76.0 72.9 78.8 11.6
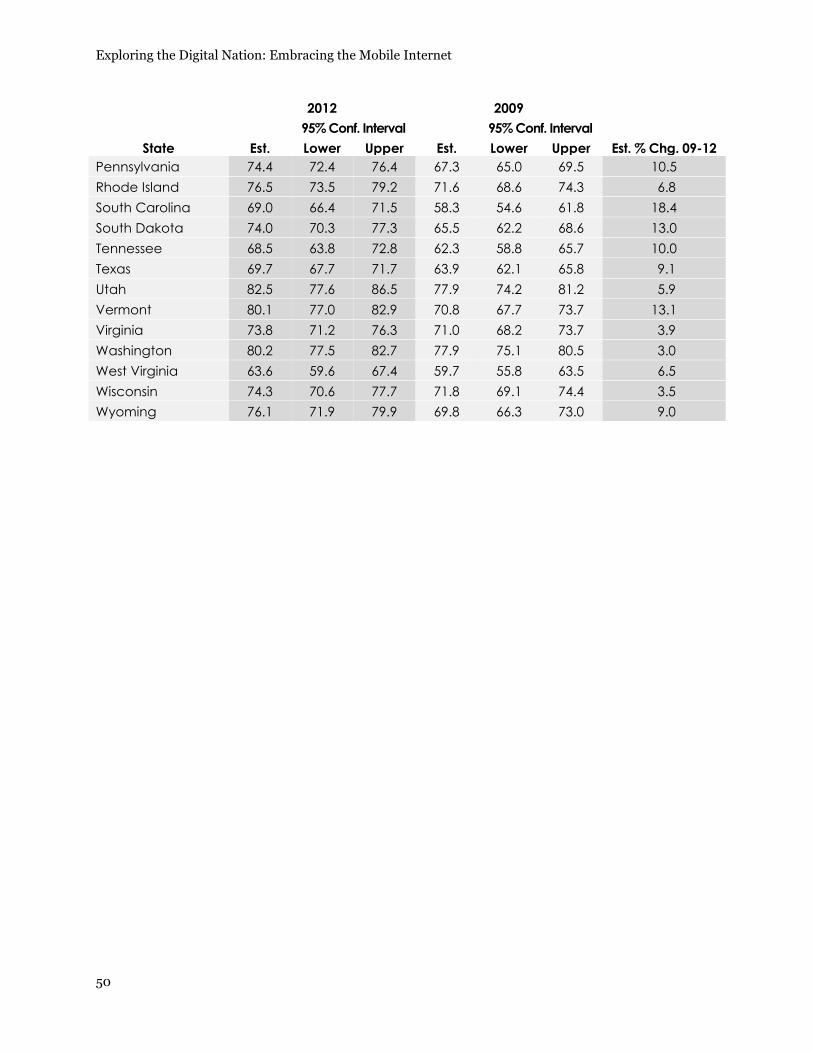
Exploring the Digital Nation: Embracing the Mobile Internet
50
2012 2009
95% Conf. Interval
95% Conf. Interval
State Est. Lower Upper Est. Lower Upper Est. % Chg. 09-12 Pennsylvania 74.4 72.4 76.4 67.3 65.0 69.5 10.5 Rhode Island 76.5 73.5 79.2 71.6 68.6 74.3 6.8 South Carolina 69.0 66.4 71.5 58.3 54.6 61.8 18.4 South Dakota 74.0 70.3 77.3 65.5 62.2 68.6 13.0 Tennessee 68.5 63.8 72.8 62.3 58.8 65.7 10.0 Texas 69.7 67.7 71.7 63.9 62.1 65.8 9.1 Utah 82.5 77.6 86.5 77.9 74.2 81.2 5.9 Vermont 80.1 77.0 82.9 70.8 67.7 73.7 13.1 Virginia 73.8 71.2 76.3 71.0 68.2 73.7 3.9 Washington 80.2 77.5 82.7 77.9 75.1 80.5 3.0 West Virginia 63.6 59.6 67.4 59.7 55.8 63.5 6.5 Wisconsin 74.3 70.6 77.7 71.8 69.1 74.4 3.5 Wyoming 76.1 71.9 79.9 69.8 66.3 73.0 9.0

Exploring the Digital Nation: Embracing the Mobile Internet
52
Related Documents