54 GEOExPro October 2014 GEOExPro October 2014 55 Exploration e Niger Delta system is one of the world’s largest Tertiary deltas and one of its most prolific hydrocarbon systems, containing an estimated 68 Bboe and producing approximately 3 MMboe per day. e evolution of the delta has created an almost perfect petroleum system with the thick Akata shale oil-prone source rock overlain by a substantial succession of progressively shallower facies in a sand-prone delta system. e load of the thick delta rocks causes gravitational collapse on the underlying, overpressured Akata shale, forming structural traps in both up-dip extensional and down-dip contractional systems (Figure 2). As always though, the devil is in the detail, and the complex relationship between timing of maturation and timing of structuration in the different structural domains creates exploration risk and the need to understand the development of the system as a whole. ION’s NigeriaSPAN data is being used to pull together this integrated story. e Niger Delta prograded into the South Atlantic during the Cenozoic, after break-up in the Albian/Aptian (Figure 1). e fit of the South American continent demonstrates the entire offshore area has to be underlain by Cretaceous oceanic crust. During break-up, several rift basins opened in Central Africa and these topographic lows have focussed sediment flux and deposition into the Niger Delta area since that time. The Main Play Initial offshore exploration was an extension of the onshore successes in a shallow water region with a continuation of the extensional, growth fault structural regime (Figure 3). Large listric faults with throws mainly down to the basin (SW) provided a rich environment for structural traps within the Lower Miocene and younger stratigraphy (Figure 2). Successes came thick and fast with a string of medium- sized oil, gas and condensate fields discovered along this coastal belt. During the past decade drilling has progressed into deep water, to 2,000m and beyond in the inner fold and thrust belt, with several major discoveries. Among these are Bosi, Agbami and Nnwa, all associated with a thick (>100m) Akata source rock and with production from often stacked deepwater turbidite reservoirs of Upper Miocene age. Reservoirs are often of very high quality and acoustic effects of fluids are often visible on seismic. e structures of the inner fold and thrust belt have been difficult to image in past datasets, showing only thick sections of seismically opaque facies commonly interpreted as shale ‘diapirs’ with only thin sediments. Deep-tow data here reveals several deep areas of stacked thrust sheets, within the Paleogene strata (Figures 2 and 4), with associated floor and roof detachments interpreted throughout the delta. New Plays, New Risks To continue to grow the resource of the Niger Delta, new plays must be proven and demonstrated to be economic. e old adage to ‘go deeper’ applies in two senses: extending exploration out to the deeper water and the outer fold belt, and exploring the deeper stratigraphy in the proven areas. Both carry challenges and risks, but offer huge potential. The Deepwater Niger Delta: Regional, deep-penetrating 2D seismic data is imaging new petroleum potential in this prolific province. PAUL BELLINGHAM, CHRIS CONNORS, RICHARD HAWORTH, BARBARA RADOVICH and AL DANFORTH, ION Geophysical Seismic recording buoys ready for deployment on a deepwater survey. Quality Data Important A key to making a full evaluation of the Niger delta system has been the availability of long-offset (10km), long-record (18s TWT), regional seismic data that have been pre-stack depth migrated. Many of the NigeriaSPAN lines were also acquired using a deep-towed cable and source, which also helps to improve image quality. Beyond careful planning and acquisition, the use of ION GXT’s latest imaging and velocity modelling capabilities has provided the results seen here. Depth imaging enables the interpreter to view complex structures with true depth perspective and to see the regional links between the different provinces. is improved imaging allows one to see detail in places within the mobile shale structures, which can help constrain the extent of brittle vs. ductile deformation (Figures 4 and 5). What may previously have been interpreted as shale structures with a diapiric origin are at once transformed into low angle shale-cored thrust sheets. What has been interpreted as a single mobile Akata shale formation becomes layered sequences of shale bodies with differing mobilities separated by regional detachment zones that are fundamental to the present-day structural shape of the offshore Niger Delta. Early exploration in the deep water between 2002 and 2005 proved disappointing and much less successful than earlier efforts in the shallower parts of the delta. Exploration from 2005 through 2009 was somewhat more successful with a string of finds in the southern part of the delta (Pina, Etan, Zabazaba and Kuro). All of these discoveries are on the inboard side of the outer fold and thrust belt, and highlight some of the key risks in this play where only a significant- sized accumulation will prove economic. ese risks include: • Maturation and source potential: e thinner sediment package in the outboard clearly limits maturation – this means maturation is probably more recent. Also, the Akata shale unit clearly thins as well, decreasing total potential. • Migration: If detachment faults act as any kind of barrier to migration then the outer fold and thrust belt can Figure 1: Tectonic map showing the restored fit of the Brazilian plate at Aptian time. Surface geology shown on the African plate, major Cretaceous rift basins and break-up direction shown. Figure 2: Regional PSDM seismic line (NG2-4500) across the main provinces of the Niger Delta. The extensional domain, inner fold and thrust belt and the outer fold and thrust belt are all shown. Thrusts and detachment faults are mapped, clearly demonstrating the younger nature of the outer fold and thrust belt compared to the inner belt. The deeper of the two main detachment zones is the one which extends out to the outer belt. The Bonga field in the inner fold and thrust belt is located close to this line and the structural high is well imaged here; trapping at Bonga is both structural and stratigraphic. (VE 3:1. For location see Figure 3) An Underexplored World-Class Petroleum Province

Welcome message from author
This document is posted to help you gain knowledge. Please leave a comment to let me know what you think about it! Share it to your friends and learn new things together.
Transcript
54 GeoexPro October 2014 GeoexPro October 2014 55
Exploration
The Niger Delta system is one of the world’s largest Tertiary deltas and one of its most prolific hydrocarbon systems, containing an estimated 68 Bboe and producing approximately 3 MMboe per day. The evolution of the delta has created an almost perfect petroleum system with the thick Akata shale oil-prone source rock overlain by a substantial succession of progressively shallower facies in a sand-prone delta system. The load of the thick delta rocks causes gravitational collapse on the underlying, overpressured Akata shale, forming structural traps in both up-dip extensional and down-dip contractional systems (Figure 2). As always though, the devil is in the detail, and the complex relationship between timing of maturation and timing of structuration in the different structural domains creates exploration risk and the need to understand the development of the system as a whole. ION’s NigeriaSPAN data is being used to pull together this integrated story.
The Niger Delta prograded into the South Atlantic during the Cenozoic, after break-up in the Albian/Aptian (Figure 1). The fit of the South American continent demonstrates the entire offshore area has to be underlain by Cretaceous oceanic crust. During break-up, several rift basins opened in Central Africa and these topographic lows have focussed sediment flux and deposition into the Niger Delta area since that time.
The Main PlayInitial offshore exploration was an extension of the onshore successes in a shallow water region with a continuation of the extensional, growth fault structural regime (Figure 3). Large listric faults with throws mainly down to the basin (SW) provided a rich environment for structural traps within the Lower Miocene and younger stratigraphy (Figure 2). Successes came thick and fast with a string of medium-sized oil, gas and condensate fields discovered along this coastal belt.
During the past decade drilling has progressed into deep water, to 2,000m and beyond in the inner fold and thrust belt, with several major discoveries. Among these are Bosi, Agbami and Nnwa, all associated with a thick (>100m) Akata source rock and with production from often stacked deepwater turbidite reservoirs of Upper Miocene age. Reservoirs are often of very high quality and acoustic effects of fluids are often visible on seismic. The structures of the inner fold and thrust belt have been difficult to image in past datasets, showing only thick sections of seismically opaque facies commonly interpreted as shale ‘diapirs’ with only thin sediments. Deep-tow data here reveals several deep areas of stacked thrust sheets, within the Paleogene strata (Figures 2 and 4), with associated floor and roof detachments interpreted throughout the delta.
New Plays, New RisksTo continue to grow the resource of the Niger Delta, new plays must be proven and demonstrated to be economic. The old adage to ‘go deeper’ applies in two senses: extending exploration out to the deeper water and the outer fold belt, and exploring the deeper stratigraphy in the proven areas. Both carry challenges and risks, but offer huge potential.
The Deepwater Niger Delta: Regional, deep-penetrating 2D seismic data is imaging new petroleum potential in this prolific province.Paul Bellingham, Chris Connors, riChard haworth, BarBara radoviCh and al danforth, ION Geophysical
Seismic recording buoys ready for deployment on a deepwater survey.
Quality Data ImportantA key to making a full evaluation of the Niger delta system has been the availability of long-offset (10km), long-record (18s TWT), regional seismic data that have been pre-stack depth migrated. Many of the NigeriaSPAN lines were also acquired using a deep-towed cable and source, which also helps to improve image quality. Beyond careful planning and acquisition, the use of ION GXT’s latest imaging and velocity modelling capabilities has provided the results seen here. Depth imaging enables the interpreter to view complex structures with true depth perspective and to see the regional links between the different provinces.
This improved imaging allows one to see detail in places within the mobile shale structures, which can help constrain the extent of brittle vs. ductile deformation (Figures 4 and 5). What may previously have been interpreted as shale structures with a diapiric origin are at once transformed into low angle shale-cored thrust sheets. What has been interpreted as a single mobile Akata shale formation becomes layered sequences of shale bodies with differing mobilities separated by regional detachment zones that are fundamental to the present-day structural shape of the offshore Niger Delta.
Early exploration in the deep water between 2002 and 2005 proved disappointing and much less successful than earlier efforts in the shallower parts of the delta. Exploration from 2005 through 2009 was somewhat more successful with a string of finds in the southern part of the delta (Pina, Etan, Zabazaba and Kuro). All of these discoveries are on the inboard side of the outer fold and thrust belt, and highlight some of the key risks in this play where only a significant-sized accumulation will prove economic. These risks include:• Maturationandsourcepotential:Thethinnersediment
package in the outboard clearly limits maturation – this means maturation is probably more recent. Also, the Akata shale unit clearly thins as well, decreasing total potential.
• Migration:Ifdetachmentfaultsactasanykindofbarrierto migration then the outer fold and thrust belt can
Figure 1: Tectonic map showing the restored fit of the Brazilian plate at Aptian time. Surface geology shown on the African plate, major Cretaceous rift basins and break-up direction shown.
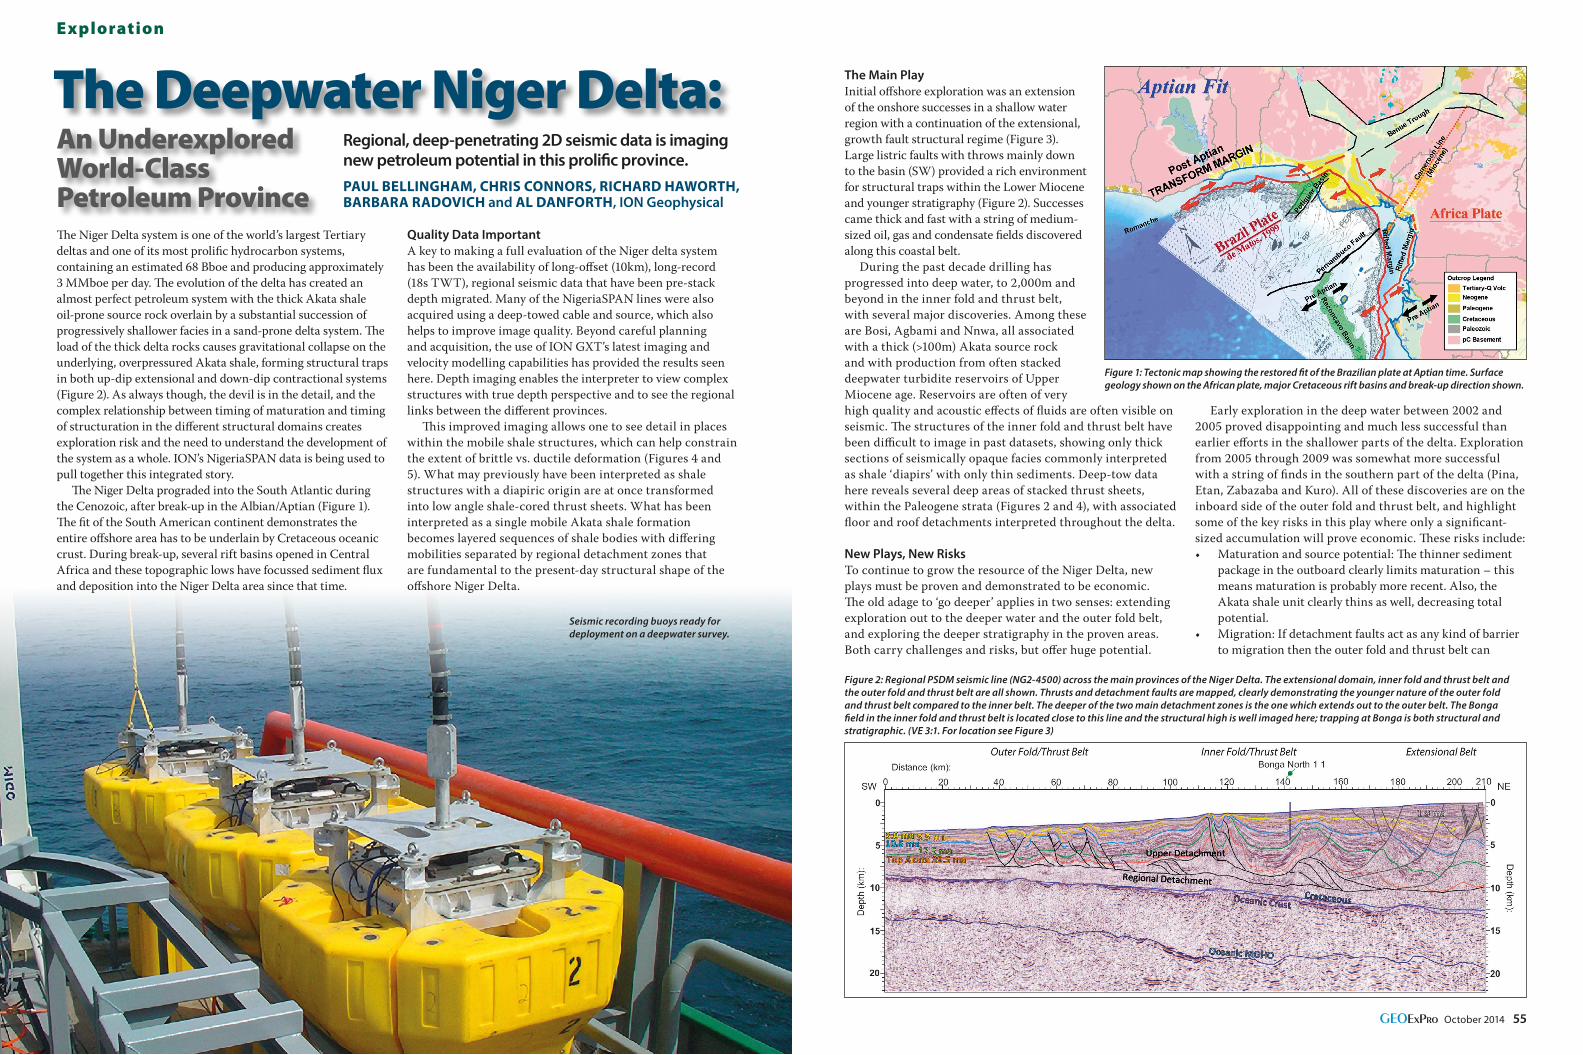
Figure 2: Regional PSDM seismic line (NG2-4500) across the main provinces of the Niger Delta. The extensional domain, inner fold and thrust belt and the outer fold and thrust belt are all shown. Thrusts and detachment faults are mapped, clearly demonstrating the younger nature of the outer fold and thrust belt compared to the inner belt. The deeper of the two main detachment zones is the one which extends out to the outer belt. The Bonga field in the inner fold and thrust belt is located close to this line and the structural high is well imaged here; trapping at Bonga is both structural and stratigraphic. (VE 3:1. For location see Figure 3)
An Underexplored World-Class Petroleum Province
56 GeoexPro October 2014
only directly access a much thinner section of source than the inner belt. This means the outer belt may be more dependent on longer distance migration.
• Timingoftrapformation:Theouterfold belt is a younger feature than the inner belt (compare Figures 4 and 5) and will only trap the most recent migrated hydrocarbons.
Successful deeper drilling within the established inner fold and thrust belt relies on identification of reservoirs through good imaging. Figure 4 demonstrates the clear presence of reservoir character stratigraphy at lower Miocene levels, and these targets are gradually being exploited but remaining potential is high.
Further potential also exists in defining combined structural/stratigraphic traps on mobile shale structures. Several successful wells have targeted this play, such as the Bonga field (Figure 2). Structural development occurred throughout the Miocene, sometimes continuing to the present day, and the associated pinch-outs have largely been ignored. Ultimately they will provide a rich if somewhat more uncertain harvest.
The NigeriaSPAN data have been used to image two major detachments within the Akata shale that have not previously been imaged, which appear to control the overlying structural development. The upper detachment is constrained to the inner fold and thrust belt, and the lower detachment underlies both inner and outer fold and thrust belts (the outer being the younger of the systems). By post-Cretaceous times, basement tectonic control had ceased to be an influence on the overall morphology; the South America plate had long since departed. What remains to control the structural evolution is sediment loading and mobile Akata shale, and to understand the twinned thrust belts requires high quality imaging of this formation across the whole system. The deposition, burial and deformation of this unit appear to control the success
Exploration
of the various petroleum plays.
Acknowledgement: The authors wish to thank ION Geophysical Inc. for permission to show the data, and also the Department of Petroleum Resources (DPR), Nigeria and Mabon Ltd. for their partnership and cooperation in this effort, including utilisation of selected well data for control.
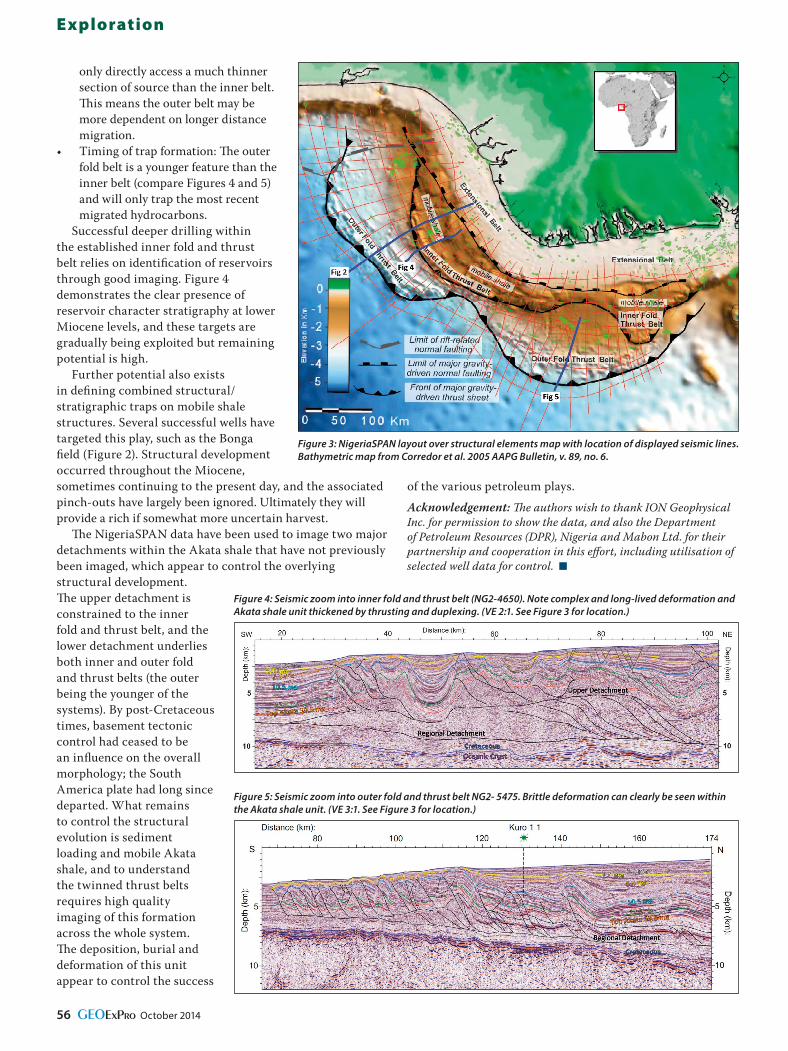
Figure 3: NigeriaSPAN layout over structural elements map with location of displayed seismic lines. Bathymetric map from Corredor et al. 2005 AAPG Bulletin, v. 89, no. 6.
Figure 5: Seismic zoom into outer fold and thrust belt NG2- 5475. Brittle deformation can clearly be seen within the Akata shale unit. (VE 3:1. See Figure 3 for location.)
Figure 4: Seismic zoom into inner fold and thrust belt (NG2-4650). Note complex and long-lived deformation and Akata shale unit thickened by thrusting and duplexing. (VE 2:1. See Figure 3 for location.)
YOU CAN DO THAT
The Emerson logo is a trademark and a service mark of Emerson Electric Co. © 2014 Emerson Electric Co.
Generate confidence in your organisation with our leading reservoir modelling solution – Better Decisions, Better Returns. With RMS™, users are provided with a full seismic to simulation workflow. This enables a more complete representation of the data in less time, with users able to quickly integrate and share knowledge across the prospect lifecycle. By placing uncertainty management at the heart of the decision-making, Roxar delivers the confidence and understanding that enables operators to enhance their recovery and unlock the value of their assets. For more information go to www.roxarsoftware.com
Being late to first oil is costly. I need a better reservoir modelling solution that unlocks the value of my assets.
Related Documents