Experiences with Service-Oriented Middleware for Dynamic Instrumentation of Enterprise Distributed Real-time and Embedded Systems James H. Hill Indiana University-Purdue University Indianapolis Indianapolis, IN USA Email: [email protected] Douglas C. Schmidt Carnegie Mellon University Pittsburgh, PA USA Email: [email protected] Abstract—This paper describes our experiences applying a test and evaluation (T&E) middleware framework called the Open-source Architecture for Software Instrumentation Systems (OASIS) to the Unified SHIP platform, which is a representa- tive system for next-generation shipboard computing systems. The OASIS middleware framework discussed in this paper enables instrumenting distributed real-time and embedded (DRE) systems to collect and extract metrics without a priori knowledge of the metrics collected. The flexibility of OASIS’s metametrics-driven approach to instrumentation and data col- lection increased developer and tester knowledge and analytical capabilities of end-to-end QoS in shipboard computing systems. I. I NTRODUCTION Shipboard computing systems are a class of enterprise distributed real-time and embedded (DRE) systems with stringent quality-of-service (QoS) requirements (such as latency, response time, and scalability) that must be met in addition to functional requirements [1]. To ensure QoS requirements of such DRE systems, developers must analyze and optimize end-to-end performance throughout the soft- ware lifecycle. Ideally, this test and evaluation (T&E) [2] process should start in the architectural design phase of shipboard computing, as opposed to waiting until final system integration later in the lifecycle when it is more expensive to fix problems. T&E of shipboard computing system QoS requirements typically employs software instrumentation techniques [1], [3]–[5] that collect metrics of interest (e.g., CPU utilization, memory usage, response of received events, and heartbeat of an application) while the system executes in its target environment. Performance analysis tools then evaluate the collected metrics and inform system developers and testers whether the system meets its QoS requirements. These tools can also identify bottlenecks in system and application components that exhibit high and/or unpredictable resource usage [6], [7]. Although software instrumentation facilitates T&E of shipboard computing system QoS requirements, conven- tional techniques for collecting metrics are typically highly- coupled to the system’s implementation [1], [2], [8]. For ex- ample, shipboard computing developers often decide during the system design phase what metrics to collect for T&E, as shown in Figure 1. Developers then incorporate into the system’s design the necessary probes to collect these metrics from the distributed environment. !"#$%#&’()" +(’,-./. 0%%, 1"2"(3 &%(/3%# 4#%5"6 17!8 9:,; 4#%5"6 1&"&%#- 4#%5"6 Figure 1. Conventional Way to Instrument Shipboard Computing Systems The drawback with a tightly-coupled approach is that shipboard computing developers must either (1) redesign the system to incorporate the new/different metrics or (2) use ad hoc techniques, such as augmenting existing code with the necessary interfaces without understanding its impact to the overall system’s design and maintainability, to collect such metrics. Developers therefore need better techniques to simplify instrumenting shipboard computing systems for collecting and extracting metrics—especially when the de- sired metrics are not known a priori. The Embedded Instrumentation Systems Architecture (EISA) [9] initiative defines a metadata-driven method for heterogeneous data collection and aggregation in a syn- chronized and time-correlated fashion [9], as opposed to an interface-centric method [10] used in conventional DRE systems. Instead of integrating many interfaces and methods to extract and collect metrics into the system’s design, EISA treats all metrics as arbitrary data that flows over a common reusable channel and discoverable via metametrics. 1 EISA thus helps reduce the coupling between system design and 1 Metametrics are metadata that describe metrics collected at runtime without knowing its structure and quantity a priori.

Welcome message from author
This document is posted to help you gain knowledge. Please leave a comment to let me know what you think about it! Share it to your friends and learn new things together.
Transcript
Experiences with Service-Oriented Middleware for Dynamic Instrumentation ofEnterprise Distributed Real-time and Embedded Systems
James H. HillIndiana University-Purdue University Indianapolis
Indianapolis, IN USAEmail: [email protected]
Douglas C. SchmidtCarnegie Mellon University
Pittsburgh, PA USAEmail: [email protected]
Abstract—This paper describes our experiences applying atest and evaluation (T&E) middleware framework called theOpen-source Architecture for Software Instrumentation Systems(OASIS) to the Unified SHIP platform, which is a representa-tive system for next-generation shipboard computing systems.The OASIS middleware framework discussed in this paperenables instrumenting distributed real-time and embedded(DRE) systems to collect and extract metrics without a prioriknowledge of the metrics collected. The flexibility of OASIS’smetametrics-driven approach to instrumentation and data col-lection increased developer and tester knowledge and analyticalcapabilities of end-to-end QoS in shipboard computing systems.
I. INTRODUCTION
Shipboard computing systems are a class of enterprisedistributed real-time and embedded (DRE) systems withstringent quality-of-service (QoS) requirements (such aslatency, response time, and scalability) that must be metin addition to functional requirements [1]. To ensure QoSrequirements of such DRE systems, developers must analyzeand optimize end-to-end performance throughout the soft-ware lifecycle. Ideally, this test and evaluation (T&E) [2]process should start in the architectural design phase ofshipboard computing, as opposed to waiting until finalsystem integration later in the lifecycle when it is moreexpensive to fix problems.
T&E of shipboard computing system QoS requirementstypically employs software instrumentation techniques [1],[3]–[5] that collect metrics of interest (e.g., CPU utilization,memory usage, response of received events, and heartbeatof an application) while the system executes in its targetenvironment. Performance analysis tools then evaluate thecollected metrics and inform system developers and testerswhether the system meets its QoS requirements. Thesetools can also identify bottlenecks in system and applicationcomponents that exhibit high and/or unpredictable resourceusage [6], [7].
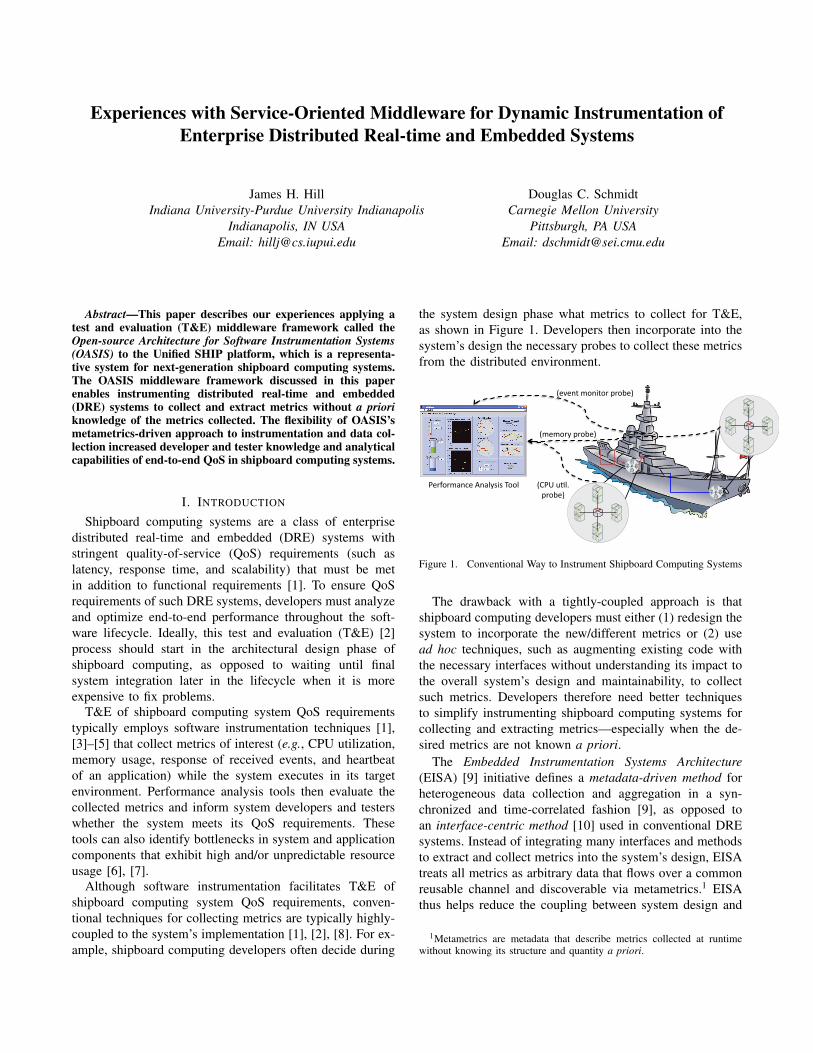
Although software instrumentation facilitates T&E ofshipboard computing system QoS requirements, conven-tional techniques for collecting metrics are typically highly-coupled to the system’s implementation [1], [2], [8]. For ex-ample, shipboard computing developers often decide during
the system design phase what metrics to collect for T&E,as shown in Figure 1. Developers then incorporate into thesystem’s design the necessary probes to collect these metricsfrom the distributed environment.
!"#$%#&'()"*+(',-./.*0%%,*
1"2"(3*&%(/3%#*4#%5"6*
17!8*9:,;*
4#%5"6*
1&"&%#-*4#%5"6*
Figure 1. Conventional Way to Instrument Shipboard Computing Systems
The drawback with a tightly-coupled approach is thatshipboard computing developers must either (1) redesign thesystem to incorporate the new/different metrics or (2) usead hoc techniques, such as augmenting existing code withthe necessary interfaces without understanding its impact tothe overall system’s design and maintainability, to collectsuch metrics. Developers therefore need better techniquesto simplify instrumenting shipboard computing systems forcollecting and extracting metrics—especially when the de-sired metrics are not known a priori.
The Embedded Instrumentation Systems Architecture(EISA) [9] initiative defines a metadata-driven method forheterogeneous data collection and aggregation in a syn-chronized and time-correlated fashion [9], as opposed toan interface-centric method [10] used in conventional DREsystems. Instead of integrating many interfaces and methodsto extract and collect metrics into the system’s design, EISAtreats all metrics as arbitrary data that flows over a commonreusable channel and discoverable via metametrics.1 EISAthus helps reduce the coupling between system design and
1Metametrics are metadata that describe metrics collected at runtimewithout knowing its structure and quantity a priori.

!"#$%&&'()*+
!"#,-".#$/0.#)*+
1".23"45#6"4#)*+
1".274#4)*+
$/.-".'/.4(+89,+ ,:;<=641"2+89,+
;>?@6/452+
$/A@0'.!+
,.-?5/.A".#+
;B1#"A+
Figure 2. Conventional Approach vs. EISA’s Approach to T&E
instrumentation logic incurred with the conventional T&Etechniques described above [11], as shown in Figure 2.
Initial implementations of the EISA standard focusedmainly on hardware instrumentation. To apply the EISAstandard in the software domain, we developed the Open-source Architecture for Software Instrumentation of Systems(OASIS). This experience report discusses our insights andlessons learned while developing and applying OASIS toa representative shipboard computing project. The maincontributions of this experience report include:• A discussion of design choices made while designing
and implementing OASIS,• An analysis of current limitations of the OASIS archi-
tecture, as well as insights on how such limitations canbe addressed,
• A summary of open research challenges associated withinstrumenting DRE systems.
Our experiences gained from developing and applyingOASIS to shipboard computing show that EISA’s metadata-driven approach to instrumentation and data collection pro-vides flexibility that can increase DRE system developersand tester’s knowledge base and analytical capabilities ofend-to-end QoS. OASIS also provides a solid foundationfor addressing open problems associated with instrumentingDRE systems.
Paper organization. The remainder of this paper is orga-nized as follows: Section II provides an overview the repre-sentative shipboard computing system we use as a case studyfor our work, and of OASIS focusing on key instrumentationchallenges; Section III describes how OASIS addresses thesechallenges; Section IV compares OASIS with related work;and Section V presents concluding remarks.
II. CASE STUDY: THE UNIFIED SHIP PLATFORM
EISA-based tools have primarily been used to instrumenthardware components (e.g., sensor hardware components) ofDRE systems [9]. These systems, however, are composedof both hardware and software components. Ideally, end-to-end QoS evaluation of shipboard computing systems shouldemploy performance analysis of both hardware and softwarecomponents.
To help evaluate EISA in a representative enterpriseDRE system, we created the Unified Software/Hardware
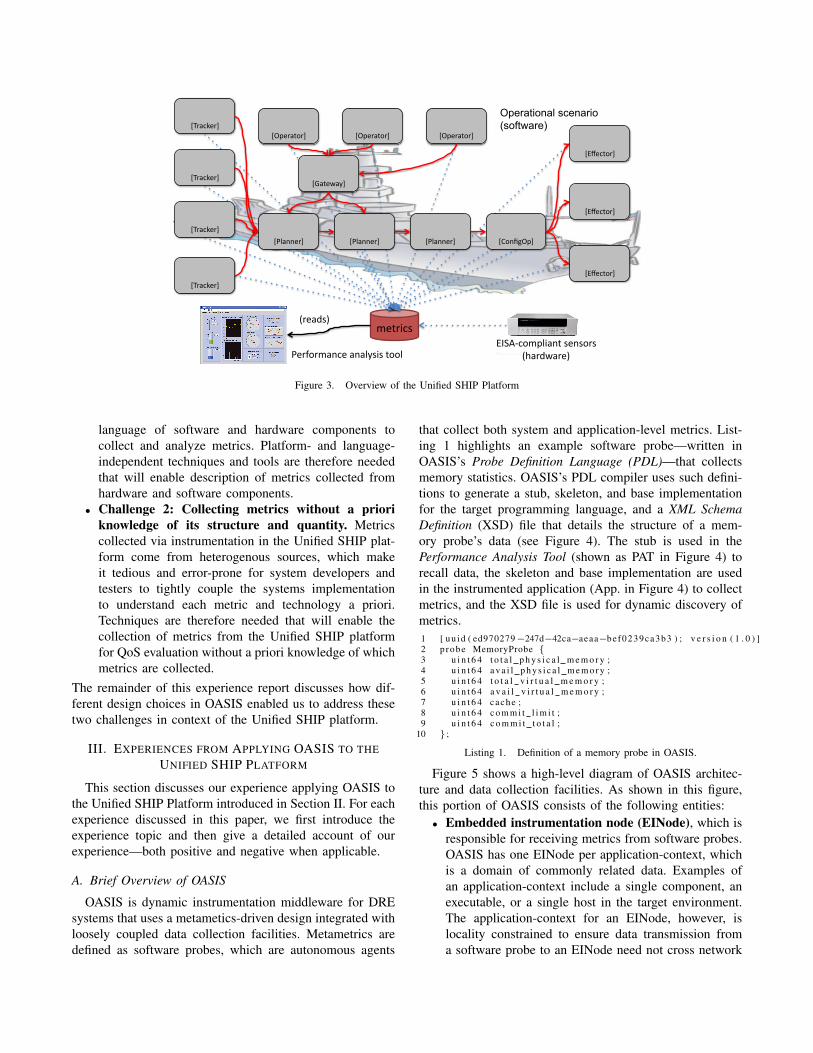
Instrumentation Proof-of-concept (Unified SHIP) platform,which provides a representative environment for investi-gating technical challenges of next-generation shipboardcomputing systems. The Unified SHIP platform containssoftware components (i.e., the rectangles in Figure 3) imple-mented using the Component Integrated ACE ORB (www.dre.vanderbilt.edu/CIAO), which is a C++ implementation ofthe Lightweight CORBA Component Model [12]. Likewise,performance analysis tools are implemented using a varietyof programming languages, such as C++, C#, and Java. Thesoftware applications run on real-time Linux and Solarisoperating systems, whereas performance analysis tools runon Windows and conventional Linux operating systems.
Figure 3 also shows how the Unified SHIP platformconsists of EISA-compliant sensor hardware componentsand a collection of software components that performed thefollowing operational capabilities for shipboard computingsystems: 4 components are trackers that monitor events inthe operational environment, 3 components are planners thatprocess data from the sensor components, 1 componentperforms configuration of the effectors, 3 components areeffectors that react to commands from the configurationcomponent, 3 components allow operators to send com-mands to the planner components, and 1 component is agateway that authenticates login credentials from the opera-tor components. The directed line between each componentin Figure 3 represents inter-component communication, suchas sending an event between two different components.
Existing techniques for instrumenting shipboard comput-ing systems assume software instrumentation concerns (e.g.,what metrics to collect and how to extract metrics from thesystem) are incorporated into the system’s design. Since theUnified SHIP platform consists of hardware and softwarecomponents at various degrees of maturity and deployment,it is hard to use existing instrumentation techniques to collectand extract metrics for QoS evaluation during early phasesof the software lifecycle. In particular, developers and testersof the Unified SHIP platform faced the following challenges:
• Challenge 1: Describing metametrics in a platform-and language-independent manner. The heterogeityof the Unified SHIP platform’s software and hardwarecomponents makes it undesirable to tightly coupleperformance analysis tools to the target platform and
!"#$%&'()*+,-./01-0'20/
34,256,217/
(1.2+&0//
8129'2(,-&1/,-,*:0+0/.''*/
;<2,&=12>/
;<2,&=12>/
;<2,&=12>/
;<2,&=12>/
;8*,--12>/ ;8*,--12>/ ;8*,--12>/ ;?'-@AB)>/
;!C1&.'2>/
;!C1&.'2>/
;!C1&.'2>/
;D,.16,:>/
;B)12,.'2>/ ;B)12,.'2>/ ;B)12,.'2>/
Operational scenario
(software)
321,507/
Figure 3. Overview of the Unified SHIP Platform
language of software and hardware components tocollect and analyze metrics. Platform- and language-independent techniques and tools are therefore neededthat will enable description of metrics collected fromhardware and software components.
• Challenge 2: Collecting metrics without a prioriknowledge of its structure and quantity. Metricscollected via instrumentation in the Unified SHIP plat-form come from heterogenous sources, which makeit tedious and error-prone for system developers andtesters to tightly couple the systems implementationto understand each metric and technology a priori.Techniques are therefore needed that will enable thecollection of metrics from the Unified SHIP platformfor QoS evaluation without a priori knowledge of whichmetrics are collected.
The remainder of this experience report discusses how dif-ferent design choices in OASIS enabled us to address thesetwo challenges in context of the Unified SHIP platform.
III. EXPERIENCES FROM APPLYING OASIS TO THEUNIFIED SHIP PLATFORM
This section discusses our experience applying OASIS tothe Unified SHIP Platform introduced in Section II. For eachexperience discussed in this paper, we first introduce theexperience topic and then give a detailed account of ourexperience—both positive and negative when applicable.
A. Brief Overview of OASIS
OASIS is dynamic instrumentation middleware for DREsystems that uses a metametics-driven design integrated withloosely coupled data collection facilities. Metametrics aredefined as software probes, which are autonomous agents
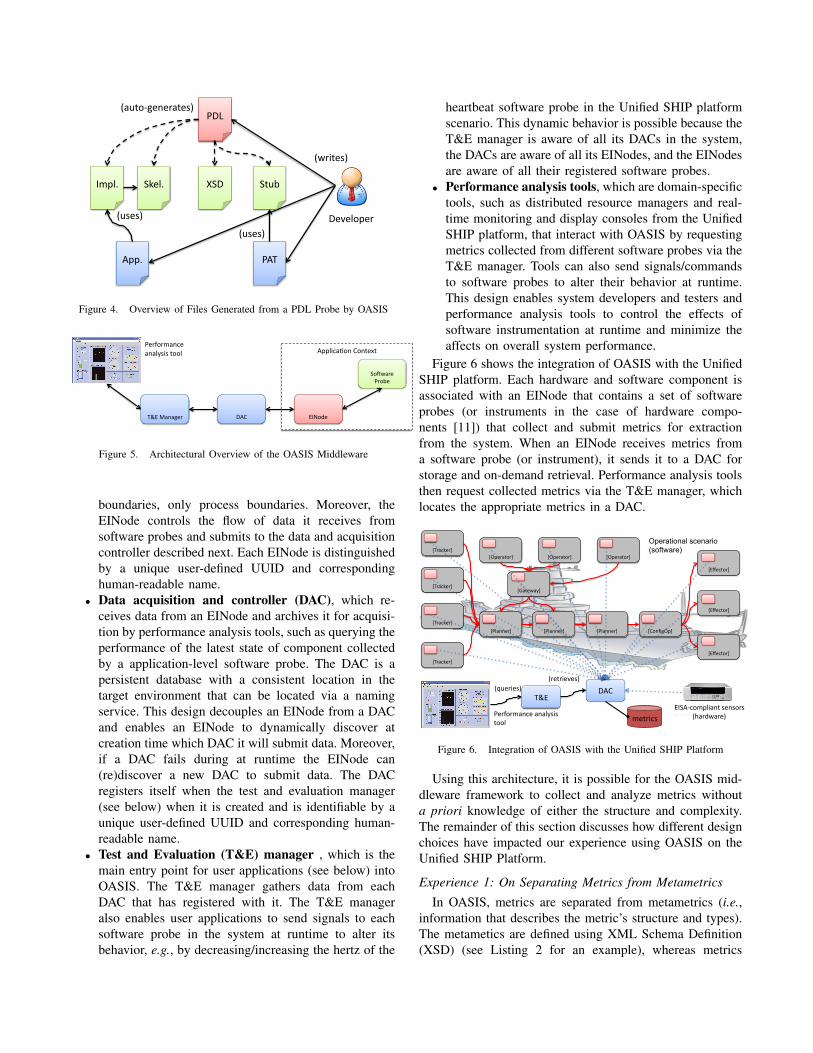
that collect both system and application-level metrics. List-ing 1 highlights an example software probe—written inOASIS’s Probe Definition Language (PDL)—that collectsmemory statistics. OASIS’s PDL compiler uses such defini-tions to generate a stub, skeleton, and base implementationfor the target programming language, and a XML SchemaDefinition (XSD) file that details the structure of a mem-ory probe’s data (see Figure 4). The stub is used in thePerformance Analysis Tool (shown as PAT in Figure 4) torecall data, the skeleton and base implementation are usedin the instrumented application (App. in Figure 4) to collectmetrics, and the XSD file is used for dynamic discovery ofmetrics.1 [ uu id ( ed970279−247d−42ca−aeaa−bef0239ca3b3 ) ; v e r s i o n ( 1 . 0 ) ]2 p robe MemoryProbe {3 u i n t 6 4 t o t a l p h y s i c a l m e m o r y ;4 u i n t 6 4 a v a i l p h y s i c a l m e m o r y ;5 u i n t 6 4 t o t a l v i r t u a l m e m o r y ;6 u i n t 6 4 a v a i l v i r t u a l m e m o r y ;7 u i n t 6 4 cache ;8 u i n t 6 4 c o m m i t l i m i t ;9 u i n t 6 4 c o m m i t t o t a l ;
10 } ;
Listing 1. Definition of a memory probe in OASIS.
Figure 5 shows a high-level diagram of OASIS architec-ture and data collection facilities. As shown in this figure,this portion of OASIS consists of the following entities:• Embedded instrumentation node (EINode), which is
responsible for receiving metrics from software probes.OASIS has one EINode per application-context, whichis a domain of commonly related data. Examples ofan application-context include a single component, anexecutable, or a single host in the target environment.The application-context for an EINode, however, islocality constrained to ensure data transmission froma software probe to an EINode need not cross network
!"#$
%&'()$ *+,()$ *-./$
!01$0'')$
2*"$
34.-567,8,94-,:;$
",<,(5',9$
3=9>-,:;$
3.:,:;$
3.:,:;$
Figure 4. Overview of Files Generated from a PDL Probe by OASIS
!""#$%&'()*+(),-.,*
/01(2-*3!+*
4(56&7-*
87(9-*
:;/*<&)&=-7*
8-7>(7?&)%-*
&)&#@A$A*,((#*
Figure 5. Architectural Overview of the OASIS Middleware
boundaries, only process boundaries. Moreover, theEINode controls the flow of data it receives fromsoftware probes and submits to the data and acquisitioncontroller described next. Each EINode is distinguishedby a unique user-defined UUID and correspondinghuman-readable name.
• Data acquisition and controller (DAC), which re-ceives data from an EINode and archives it for acquisi-tion by performance analysis tools, such as querying theperformance of the latest state of component collectedby a application-level software probe. The DAC is apersistent database with a consistent location in thetarget environment that can be located via a namingservice. This design decouples an EINode from a DACand enables an EINode to dynamically discover atcreation time which DAC it will submit data. Moreover,if a DAC fails during at runtime the EINode can(re)discover a new DAC to submit data. The DACregisters itself when the test and evaluation manager(see below) when it is created and is identifiable by aunique user-defined UUID and corresponding human-readable name.
• Test and Evaluation (T&E) manager , which is themain entry point for user applications (see below) intoOASIS. The T&E manager gathers data from eachDAC that has registered with it. The T&E manageralso enables user applications to send signals to eachsoftware probe in the system at runtime to alter itsbehavior, e.g., by decreasing/increasing the hertz of the
heartbeat software probe in the Unified SHIP platformscenario. This dynamic behavior is possible because theT&E manager is aware of all its DACs in the system,the DACs are aware of all its EINodes, and the EINodesare aware of all their registered software probes.
• Performance analysis tools, which are domain-specifictools, such as distributed resource managers and real-time monitoring and display consoles from the UnifiedSHIP platform, that interact with OASIS by requestingmetrics collected from different software probes via theT&E manager. Tools can also send signals/commandsto software probes to alter their behavior at runtime.This design enables system developers and testers andperformance analysis tools to control the effects ofsoftware instrumentation at runtime and minimize theaffects on overall system performance.
Figure 6 shows the integration of OASIS with the UnifiedSHIP platform. Each hardware and software component isassociated with an EINode that contains a set of softwareprobes (or instruments in the case of hardware compo-nents [11]) that collect and submit metrics for extractionfrom the system. When an EINode receives metrics froma software probe (or instrument), it sends it to a DAC forstorage and on-demand retrieval. Performance analysis toolsthen request collected metrics via the T&E manager, whichlocates the appropriate metrics in a DAC.
!"#$%&'#()
!"#$%&'#()
!"#$%&'#()
!"#$%&'#()
!*+$,,'#() !*+$,,'#() !*+$,,'#() !-.,/012()
!34'%5.#()
!34'%5.#()
!34'%5.#()
!6$5'7$8()
!12'#$5.#() !12'#$5.#() !12'#$5.#()
Operational scenario
(software)
*'#9.#:$,%')$,$+8;<;)
5..+)
=>?'#<';@) AB-)"C3)
=#'5#<'D';@)
:'5#<%;)
3EFBG%.:2+<$,5);',;.#;)
=H$#I7$#'@)
Figure 6. Integration of OASIS with the Unified SHIP Platform
Using this architecture, it is possible for the OASIS mid-dleware framework to collect and analyze metrics withouta priori knowledge of either the structure and complexity.The remainder of this section discusses how different designchoices have impacted our experience using OASIS on theUnified SHIP Platform.
Experience 1: On Separating Metrics from Metametrics
In OASIS, metrics are separated from metametrics (i.e.,information that describes the metric’s structure and types).The metametics are defined using XML Schema Definition(XSD) (see Listing 2 for an example), whereas metrics
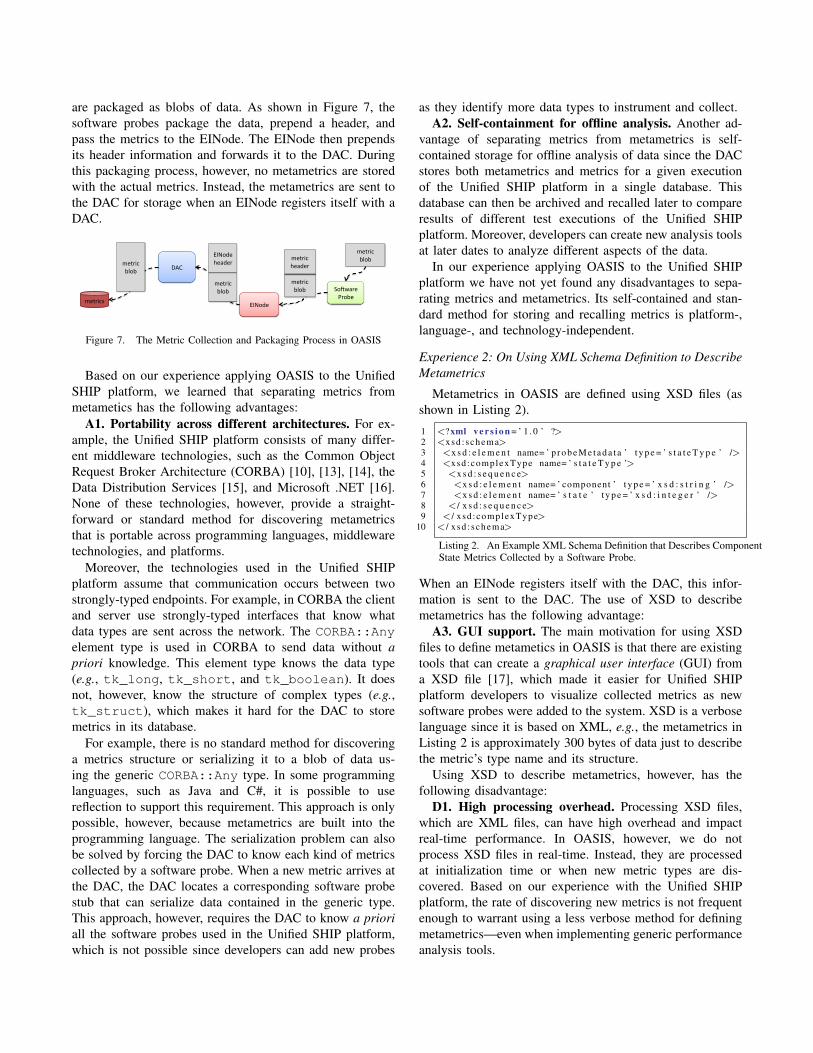
are packaged as blobs of data. As shown in Figure 7, thesoftware probes package the data, prepend a header, andpass the metrics to the EINode. The EINode then prependsits header information and forwards it to the DAC. Duringthis packaging process, however, no metametrics are storedwith the actual metrics. Instead, the metametrics are sent tothe DAC for storage when an EINode registers itself with aDAC.
!"#$%&'(
)&"*'(
+,-".'(
/01(
2'3&45(
*6"*(
2'3&45(
*6"*(
2'3&45(
7'%.'&(
2'3&45((
*6"*(
+,-".'(
7'%.'&(
2'3&458(
2'3&45(
*6"*(
Figure 7. The Metric Collection and Packaging Process in OASIS
Based on our experience applying OASIS to the UnifiedSHIP platform, we learned that separating metrics frommetametics has the following advantages:
A1. Portability across different architectures. For ex-ample, the Unified SHIP platform consists of many differ-ent middleware technologies, such as the Common ObjectRequest Broker Architecture (CORBA) [10], [13], [14], theData Distribution Services [15], and Microsoft .NET [16].None of these technologies, however, provide a straight-forward or standard method for discovering metametricsthat is portable across programming languages, middlewaretechnologies, and platforms.
Moreover, the technologies used in the Unified SHIPplatform assume that communication occurs between twostrongly-typed endpoints. For example, in CORBA the clientand server use strongly-typed interfaces that know whatdata types are sent across the network. The CORBA::Anyelement type is used in CORBA to send data without apriori knowledge. This element type knows the data type(e.g., tk_long, tk_short, and tk_boolean). It doesnot, however, know the structure of complex types (e.g.,tk_struct), which makes it hard for the DAC to storemetrics in its database.
For example, there is no standard method for discoveringa metrics structure or serializing it to a blob of data us-ing the generic CORBA::Any type. In some programminglanguages, such as Java and C#, it is possible to usereflection to support this requirement. This approach is onlypossible, however, because metametrics are built into theprogramming language. The serialization problem can alsobe solved by forcing the DAC to know each kind of metricscollected by a software probe. When a new metric arrives atthe DAC, the DAC locates a corresponding software probestub that can serialize data contained in the generic type.This approach, however, requires the DAC to know a prioriall the software probes used in the Unified SHIP platform,which is not possible since developers can add new probes
as they identify more data types to instrument and collect.A2. Self-containment for offline analysis. Another ad-
vantage of separating metrics from metametrics is self-contained storage for offline analysis of data since the DACstores both metametrics and metrics for a given executionof the Unified SHIP platform in a single database. Thisdatabase can then be archived and recalled later to compareresults of different test executions of the Unified SHIPplatform. Moreover, developers can create new analysis toolsat later dates to analyze different aspects of the data.
In our experience applying OASIS to the Unified SHIPplatform we have not yet found any disadvantages to sepa-rating metrics and metametrics. Its self-contained and stan-dard method for storing and recalling metrics is platform-,language-, and technology-independent.
Experience 2: On Using XML Schema Definition to DescribeMetametrics
Metametrics in OASIS are defined using XSD files (asshown in Listing 2).
1 <? xml v e r s i o n = ’ 1 . 0 ’ ?>2 <xsd : schema>3 <x s d : e l e m e n t name= ’ p r o b e M e t a d a t a ’ t y p e = ’ s t a t e T y p e ’ />4 <xsd :complexType name= ’ s t a t e T y p e ’>5 <x s d : s e q u e n c e>6 <x s d : e l e m e n t name= ’ component ’ t y p e = ’ x s d : s t r i n g ’ />7 <x s d : e l e m e n t name= ’ s t a t e ’ t y p e = ’ x s d : i n t e g e r ’ />8 </ x s d : s e q u e n c e>9 </ xsd :complexType>
10 </ x sd : schema>
Listing 2. An Example XML Schema Definition that Describes ComponentState Metrics Collected by a Software Probe.
When an EINode registers itself with the DAC, this infor-mation is sent to the DAC. The use of XSD to describemetametrics has the following advantage:
A3. GUI support. The main motivation for using XSDfiles to define metametics in OASIS is that there are existingtools that can create a graphical user interface (GUI) froma XSD file [17], which made it easier for Unified SHIPplatform developers to visualize collected metrics as newsoftware probes were added to the system. XSD is a verboselanguage since it is based on XML, e.g., the metametrics inListing 2 is approximately 300 bytes of data just to describethe metric’s type name and its structure.
Using XSD to describe metametrics, however, has thefollowing disadvantage:
D1. High processing overhead. Processing XSD files,which are XML files, can have high overhead and impactreal-time performance. In OASIS, however, we do notprocess XSD files in real-time. Instead, they are processedat initialization time or when new metric types are dis-covered. Based on our experience with the Unified SHIPplatform, the rate of discovering new metrics is not frequentenough to warrant using a less verbose method for definingmetametrics—even when implementing generic performanceanalysis tools.

Experience 3: On Software Probe Definition and Stucture
Software probes in OASIS are defined using PDL. De-velopers define the metrics collected by a software probe,as shown in Listing 1 in the overview of OASIS. TheOASIS compiler then generates the appropriate stubs andskeletons for using the software probe for instrumentation.The current implementation of OASIS does not supporthierarchical software probe definitions, which means thateach software probe definition is its own entity. This designchoice, however, presented the following disadvantage:
D2. Lack of hierarchy increases instrumentation com-plexity. Based on our experience applying OASIS to theUnified SHIP platform, the lack of hierarchical softwareprobe definitions increases the complexity of instrumentingsuch systems since developers must either:• Define a software probe such that it is too broad in
scope,• Define a software probe that is too narrow in scope, or• Create separate software probes that collect similar
information with slight differences.The problem with broad software probes is that they collectmore information than is needed, i.e., have fields that haveno data on different platforms. Likewise, narrow softwareprobes must sacrifice data in certain situations, such as notcollecting a specific metric on the Linux platform since thereis not an equivalent metrics on the Windows platform.
For example, in the Unified SHIP platform, softwarecomponents execute on either a Windows or Linux platform.If developers want to collect memory metrics from eitherplatform they would have to decide either to implement abroad or narrow software probe since each platform providesdifferent information about memory usage, as shown inTable I. If a broad software probe were implemented theUnified SHIP platform developers would have to ensure thatall metrics in Table I were covered. If a narrow softwareprobe were implemented, conversely, they would only cover8 common memory metrics (i.e., MemTotal, MemFree,Cached, CommittedLimit, Committed AS, VmallocTotal,VmallocUsed, and AvailVirtual), which also fails to accountfor mapping similar metrics to a common name and unit inthe software probe’s implementation.
Ideally, it should be possible for Unified SHIPplatform developers to define hierarchical softwareprobes to show relations between them. For example,Unified SHIP platform developers should be able todefine a MemoryProbe that contains all metricscommon across all platforms, as shown in Figure 8.Each specific platform-specific memory probe (e.g.,LinuxMemoryProbe and WindowsMemoryProbe)then extends the MemoryProbe definition, as needed.
Based on our needs, we have realized that supportinghierarchical software probe definitions, however, has thefollowing advantages:
!"#$%&'(&")'*
+',"&-(&")'*
./012+',"&-(&")'* 333* 4/05"$6+',"&-(&")'*
Figure 8. An Example of Hierarchically Defining the Memory SoftwareProbe in OASIS
A4. Metric reuse. When we define software probes hier-archical as done in object-oriented programming languages,such as C++, C#, and Java, it allows similar softwareprobes to reuse metric definitions. Unified SHIP Platformdevelopers therefore need not make critical decisions as towhether they should implement broad or narrow softwareprobes.
A5. Platform-specific vs. general-purpose performanceanalysis tools. OASIS allows performance analysis toolsto request real-time updates when new data arrives. Thehierarchical software probe definitions give performanceanalysis tools greater flexibility when registering for real-time updates. For example, they can request general mem-ory probe data, i.e., data collected by a probe of typeMemoryProbe, or specific memory probe data, i.e., ei-ther WindowsMemoryProbe or LinuxMemoryProbedata. The Unified SHIP platform developers can thereforeimplement general-purpose performance analysis tools orplatform-specific performance analysis tools.
Experience 4: Observing Other Roles of the T&E Manager
The T&E Manager is the main entry point into the OASISarchitecture for performance analysis tools, as describedin Section II. This manager assists with gathering andcorrelating data requested by performance analysis tools. Italso routes commands to software probes—via the DAC andEINode—to enable dynamic runtime behavior modifications,such as reducing its data collection frequency. Based on ourexperience applying OASIS to the Unified SHIP Platform,the T&E Manager has the following advantages:
A6. Domain-specific naming service. Based on ourexperience applying OASIS to the Unified SHIP platform,the T&E Manager is also a domain-specific naming servicethat keeps track of available DACs since the T&E managermust know all DACs available in test execution. Otherwise,it is hard for performance analysis tools to send commandsto software probes. In addition, it is hard for performanceanalysis tools to register for real-time updates, which mustbe done by first locating an appropriate DACs via the T&Emanager.
A7. Gateway and policy manager. Another role of the
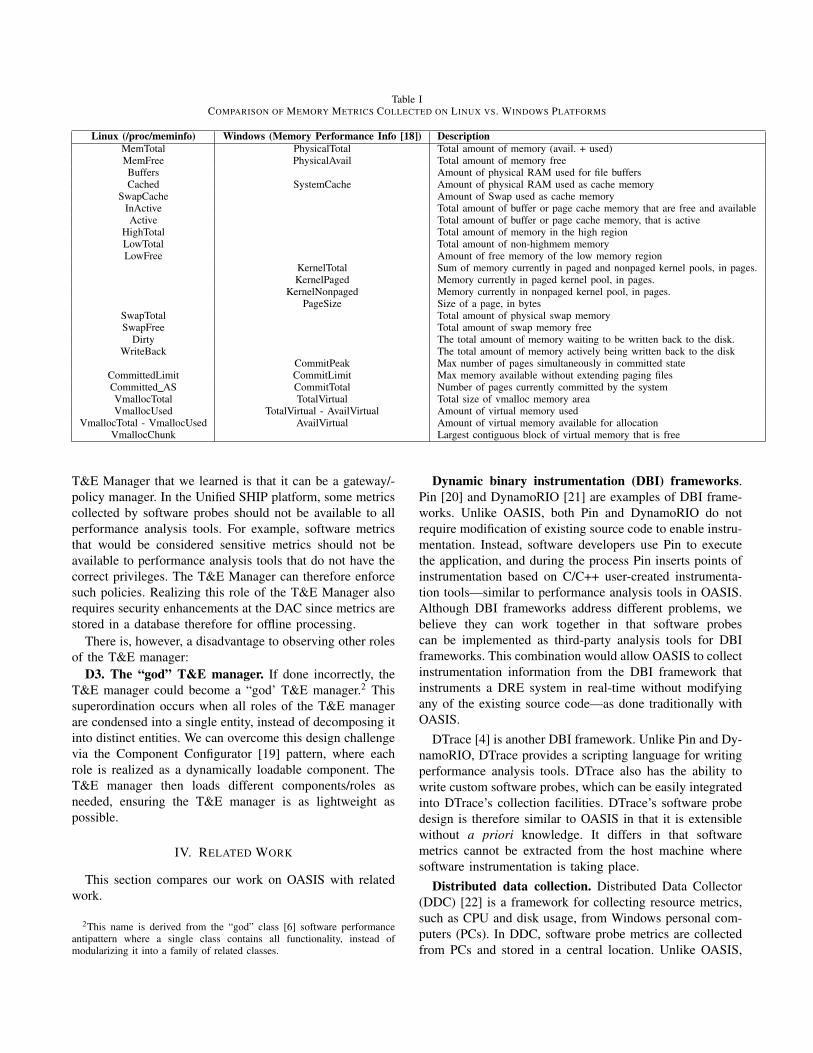
Table ICOMPARISON OF MEMORY METRICS COLLECTED ON LINUX VS. WINDOWS PLATFORMS
Linux (/proc/meminfo) Windows (Memory Performance Info [18]) DescriptionMemTotal PhysicalTotal Total amount of memory (avail. + used)MemFree PhysicalAvail Total amount of memory freeBuffers Amount of physical RAM used for file buffersCached SystemCache Amount of physical RAM used as cache memory
SwapCache Amount of Swap used as cache memoryInActive Total amount of buffer or page cache memory that are free and availableActive Total amount of buffer or page cache memory, that is active
HighTotal Total amount of memory in the high regionLowTotal Total amount of non-highmem memoryLowFree Amount of free memory of the low memory region
KernelTotal Sum of memory currently in paged and nonpaged kernel pools, in pages.KernelPaged Memory currently in paged kernel pool, in pages.
KernelNonpaged Memory currently in nonpaged kernel pool, in pages.PageSize Size of a page, in bytes
SwapTotal Total amount of physical swap memorySwapFree Total amount of swap memory free
Dirty The total amount of memory waiting to be written back to the disk.WriteBack The total amount of memory actively being written back to the disk
CommitPeak Max number of pages simultaneously in committed stateCommittedLimit CommitLimit Max memory available without extending paging filesCommitted AS CommitTotal Number of pages currently committed by the systemVmallocTotal TotalVirtual Total size of vmalloc memory areaVmallocUsed TotalVirtual - AvailVirtual Amount of virtual memory used
VmallocTotal - VmallocUsed AvailVirtual Amount of virtual memory available for allocationVmallocChunk Largest contiguous block of virtual memory that is free
T&E Manager that we learned is that it can be a gateway/-policy manager. In the Unified SHIP platform, some metricscollected by software probes should not be available to allperformance analysis tools. For example, software metricsthat would be considered sensitive metrics should not beavailable to performance analysis tools that do not have thecorrect privileges. The T&E Manager can therefore enforcesuch policies. Realizing this role of the T&E Manager alsorequires security enhancements at the DAC since metrics arestored in a database therefore for offline processing.
There is, however, a disadvantage to observing other rolesof the T&E manager:
D3. The “god” T&E manager. If done incorrectly, theT&E manager could become a “god’ T&E manager.2 Thissuperordination occurs when all roles of the T&E managerare condensed into a single entity, instead of decomposing itinto distinct entities. We can overcome this design challengevia the Component Configurator [19] pattern, where eachrole is realized as a dynamically loadable component. TheT&E manager then loads different components/roles asneeded, ensuring the T&E manager is as lightweight aspossible.
IV. RELATED WORK
This section compares our work on OASIS with relatedwork.
2This name is derived from the “god” class [6] software performanceantipattern where a single class contains all functionality, instead ofmodularizing it into a family of related classes.
Dynamic binary instrumentation (DBI) frameworks.Pin [20] and DynamoRIO [21] are examples of DBI frame-works. Unlike OASIS, both Pin and DynamoRIO do notrequire modification of existing source code to enable instru-mentation. Instead, software developers use Pin to executethe application, and during the process Pin inserts points ofinstrumentation based on C/C++ user-created instrumenta-tion tools—similar to performance analysis tools in OASIS.Although DBI frameworks address different problems, webelieve they can work together in that software probescan be implemented as third-party analysis tools for DBIframeworks. This combination would allow OASIS to collectinstrumentation information from the DBI framework thatinstruments a DRE system in real-time without modifyingany of the existing source code—as done traditionally withOASIS.
DTrace [4] is another DBI framework. Unlike Pin and Dy-namoRIO, DTrace provides a scripting language for writingperformance analysis tools. DTrace also has the ability towrite custom software probes, which can be easily integratedinto DTrace’s collection facilities. DTrace’s software probedesign is therefore similar to OASIS in that it is extensiblewithout a priori knowledge. It differs in that softwaremetrics cannot be extracted from the host machine wheresoftware instrumentation is taking place.
Distributed data collection. Distributed Data Collector(DDC) [22] is a framework for collecting resource metrics,such as CPU and disk usage, from Windows personal com-puters (PCs). In DDC, software probe metrics are collectedfrom PCs and stored in a central location. Unlike OASIS,
each software probe’s metrics are stored its own file, whichis then parsed by analysis tools. OASIS improves upon thisdesign by storing all metrics in a single database, instead ofseparate files. Likewise, OASIS’s data collection frameworkis platform-, language-, and architecture-independent (i.e.,not bound to only Windows PCs and Windows-specificsoftware probes).
General-purpose middleware solutions can be used fordistributed data collection. For example, the DDS is anevent-based middleware specification that treats data as first-class entities. This concept is similar to OASIS in that eventsare similar to software probe metrics. The main differenceis that DDS is a strongly-typed middleware solution in thatboth endpoints know the data type a priori. Moreover, thereis not standard way to serialize the data in a DDS event.This therefore makes it hard to store metrics in the DAC’sdatabase.
V. CONCLUDING REMARKS
Test and evaluation (T&E) of shipboard computing systemQoS during early phases of the software lifecycle helpsincrease confidence that the system being developed willmeet it functional and QoS requirements. ConventionalT&E instrumentation mechanisms, however, are tightly cou-pled with the system’s design and implementation. Thisexperience report therefore described how design choicesin OASIS’s implementation of the EISA standard helpedreduced these coupling concerns. In addition, it also high-lighted several revelations about different design choicesthat are currently being addressed in the OASIS middlewareframework.
Based on our experience with OASIS, we found thefollowing open research challenges, which extend the re-search directions presented in prior work [23], remain wheninstrumenting DRE systems:• Complex Event Processing. Complex event process-
ing [24] involves processing many different events andstreams of data, across all layers of a domain, identi-fying meaningful events, and determining their impacton a given concern, such as performance, functionality,and scalability. Each software probe in OASIS can beviewed as stream of data and the DAC can be viewedas a data source with historical records. Likewise,performance analysis tools can register for real-timedelivery of software probe data.Future research directions therefore include imple-menting complex event processing support in OASIS.Adding this support will be hard because the tradi-tional use of complex event processing engines involvesviewing results via a graphical user interface, which isconsidered one form of a performance analysis tool inOASIS. In reality, many different performance analy-sis tools (such as real-time monitoring and feedbackperformance analysis tools) should be able to leverage
complex event processing support. Likewise, complexevent processing has not been applied to general-purpose instrumentation middleware for DRE systems.
• Data Fusion and Data Integration. Data fusion [25]is the process of combining data from multiple sourcesfor inference. The motivation for data fusion is thatmultiple data sources will be more accurate that asingle data source. Although data fusion can be usedto support complex event processing, it is a separateresearch area. Data integration [26], however, is theprocess of combining data from different sources toprovide a unified view.When we examine the OASIS middleware framework,and each of its entities that play a major role in col-lecting and storing data (e.g., software probe, EINode,and DAC), it is clear that data fusion and data integra-tion techniques can be applied readily. The challenge,however, is understanding how both data fusion anddata integration can be integrated with the real-timeaspects of OASIS. Future research directions thereforeinvolves addressing these challenges in OASIS so wecan provide a general-purpose middleware solution fordata fusion and data integration in OASIS.
As we apply OASIS to other application domains, such asresource-constrained embedded systems and mobile devices,we will continue identifying new research challenges. SinceOASIS is an open-source middleware framework, it providesan effective foundation for ensuring that solutions to theseopen research challenges will be available to the T&Ecommunity.
OASIS is currently integrated into CUTS and is freelyavailable for download in open-source format from cuts.cs.iupui.edu.
REFERENCES
[1] Z. Tan, W. Leal, and L. Welch, “Verification of Instrumen-tation Techniques for Resource Management of Real-timeSystems,” J. Syst. Softw., vol. 80, no. 7, pp. 1015–1022, 2007.
[2] G. Hudgins, K. Poch, and J. Secondine, “The Test andTraining Enabling Architecture (TENA) Enabling TechnologyFor The Joint Mission Environment Test Capability (JMETC)and Other Emerging Range Systems,” in Proceeding of U.S.Air Force T&E Days, 2009.
[3] A. Srivastava and A. Eustace, “ATOM: A System for BuildingCustomized Program Analysis Tools,” in PLDI ’94: Proceed-ings of the ACM SIGPLAN 1994 Conference on ProgrammingLanguage Design and Implementation, 1994, pp. 196–205.
[4] B. Cantrill, M. W. Shapiro, and A. H. Leventhal, “DynamicInstrumentation of Production Systems,” in Proceedings of theGeneral Track: 2004 USENIX Annual Technical Conference,June 2004, pp. 15–28.
[5] K. O’Hair, “The JVMPI Transition to JVMTI,” java.sun.com/developer/technicalArticles/Programming/jvmpitransition,2006.

[6] C. Smith and L. Williams, Performance Solutions: A PracticalGuide to Creating Responsive, Scalable Software. Boston,MA, USA: Addison-Wesley Professional, September 2001.
[7] D. A. Menasce, L. W. Dowdy, and V. A. F. Almeida, Perfor-mance by Design: Computer Capacity Planning By Example.Upper Saddle River, NJ, USA: Prentice Hall PTR, 2004.
[8] D. G. Waddington, N. Roy, and D. C. Schmidt, “DynamicAnalysis and Profiling of Multi-threaded Systems,” in De-signing Software-Intensive Systems: Methods and Principles,P. F. Tiako, Ed. Idea Group, 2007.
[9] N. Visnevski, “Embedded Instrumentation Systems Architec-ture,” in Proceedings of IEEE International Instrumentationand Measurement Technology Conference, May 2008.
[10] The Common Object Request Broker: Architecture and Spec-ification Version 3.1, Part 1: CORBA Interfaces, OMG Docu-ment formal/2008-01-04 ed., Object Management Group, Jan.2008.
[11] A. Stefani and M. N. Xenos, “Meta-metric Evaluation of E-Commerce-related Metrics,” Electronic Notes in TheoreticalComputer Science (ENTCS), vol. 233, pp. 59–72, 2009.
[12] Light Weight CORBA Component Model Revised Submission,OMG Document realtime/03-05-05 ed., Object ManagementGroup, May 2003.
[13] The Common Object Request Broker: Architecture andSpecification Version 3.1, Part 2: CORBA Interoperability,OMG Document formal/2008-01-07 ed., Object ManagementGroup, Jan. 2008.
[14] The Common Object Request Broker: Architecture and Spec-ification Version 3.1, Part 3: CORBA Component Model,OMG Document formal/2008-01-08 ed., Object ManagementGroup, Jan. 2008.
[15] Data Distribution Service for Real-time Systems Specification,1.2 ed., Object Management Group, Jan. 2007.
[16] Microsoft Corporation, “Microsoft .NET Framework 3.0Community,” www.netfx3.com, 2007.
[17] V. Radha, S. Ramakrishna, and N. kumar, “Generic XMLSchema Definition (XSD) to GUI Translator,” DistributedComputing and Internet Technology, pp. 290–296, 2005.
[18] M. Library, “Memory Performance Information,”msdn.microsoft.com/en-us/library/aa965225\%28v=vs.85\%29.aspx.
[19] D. C. Schmidt, M. Stal, H. Rohnert, and F. Buschmann,Pattern-Oriented Software Architecture: Patterns for Concur-rent and Networked Objects, Volume 2. New York: Wiley& Sons, 2000.
[20] C.-K. Luk, R. Cohn, R. Muth, H. Patil, A. Klauser,G. Lowney, S. Wallace, V. J. Reddi, and K. Hazelwood, “Pin:Building Customized Program Analysis Tools with DynamicInstrumentation,” SIGPLAN Notes, vol. 40, pp. 190–200, June2005.
[21] D. Bruening, T. Garnett, and S. Amarasinghe, “AnInfrastructure for Adaptive Dynamic Optimization,” inProceedings of the international symposium on Codegeneration and optimization: feedback-directed and runtimeoptimization, ser. CGO ’03. Washington, DC, USA: IEEEComputer Society, 2003, pp. 265–275. [Online]. Available:http://portal.acm.org/citation.cfm?id=776261.776290
[22] P. Domingues, P. Marques, and L. Silva, “Distributed DataCollection through Remote Probing in Windows Environ-ments,” in Parallel, Distributed and Network-Based Process-ing, 2005. PDP 2005. 13th Euromicro Conference on. IEEE,2005, pp. 59–65.
[23] J. H. Hill, H. Sutherland, P. Staudinger, T. Silveria, D. C.Schmidt, J. M. Slaby, and N. Visnevski, “OASIS: An Archi-tecture for Dynamic Instrumentation of Enterprise DistributedReal-time and Embedded Systems,” International Journal ofComputer Systems Science and Engineering, Special Issue:Real-time Systems, April 2011.
[24] P. Dekkers, “Complex Event Processing,” Master’s thesis,Radboud University Nijmegen, Nijmegen, Netherlands, Oc-tober 2007.
[25] J. Bleiholder and F. Naumann, “Data Fusion,” ACM Comput-ing Surveys, vol. 41, pp. 1:1–1:41, January 2009. [Online].Available: http://doi.acm.org/10.1145/1456650.1456651
[26] M. Lenzerini, “Data Integration: A Theoretical Perspective,”in Proceedings of the twenty-first ACM SIGMOD-SIGACT-SIGART symposium on Principles of database systems, ser.PODS ’02. New York, NY, USA: ACM, 2002, pp. 233–246. [Online]. Available: http://doi.acm.org/10.1145/543613.543644
Related Documents


![National Institute of Science & Technology Architecture of Message Oriented Middleware Anindya Kumar Jena [1] Architecture of Message Oriented Middleware.](https://static.cupdf.com/doc/110x72/56649ed55503460f94be62a5/national-institute-of-science-technology-architecture-of-message-oriented.jpg)

![Message-Oriented Middleware with QoS Awarenessfanye/papers/icsoc09-message.pdf · ing an emerging engineering discipline around the system of systems (SoS) [2]. Message-oriented middleware](https://static.cupdf.com/doc/110x72/5e89a7db0af43b5620240a6d/message-oriented-middleware-with-qos-fanyepapersicsoc09-messagepdf-ing-an-emerging.jpg)