NHS Patient Survey Programme 2019 survey of women’s experiences of maternity care Technical details for analysing trust-level results Published January 2020 CQC publication

Welcome message from author
This document is posted to help you gain knowledge. Please leave a comment to let me know what you think about it! Share it to your friends and learn new things together.
Transcript
NHS Patient Survey Programme
2019 survey of women’s
experiences of
maternity care
Technical details for
analysing trust-level
results
Published January 2020
CQC publication
1
Contents
Introduction ........................................................................................................................... 2
Selecting data for reporting ................................................................................................... 2
The trust benchmark reports ................................................................................................. 3
The maternity survey attribution exercise .............................................................................. 4
Interpreting the data .............................................................................................................. 5
5.1 Scoring ................................................................................................................... 5
5.2 Standardisation ....................................................................................................... 5
5.3 Expected range ....................................................................................................... 6
5.4 Conclusion made on performance .......................................................................... 6
5.5 Comparing scores across trusts or across survey years ......................................... 6
Further information ................................................................................................................ 6
Appendix A: Scoring for the 2019 Maternity Survey .............................................................. 8
Appendix B: Calculating the trust score ............................................................................... 18
Appendix C: Calculating the expected ranges ..................................................................... 22
Appendix D: Calculating the standard errors ....................................................................... 24
References ......................................................................................................................... 27
2
Introduction This document outlines the methods used by the Care Quality Commission (CQC) to score
and analyse the trust-level results for the 2019 Maternity Survey.
The survey results are available for each trust on the CQC website. The survey data is
shown in a simplified way, identifying whether a trust performed ‘better’ or ‘worse’ or ‘about
the same’ as the majority of other trusts for each question. This analysis is based on a
statistic called the ‘expected range’ (see section 5.3). On publication of the survey, an A-to-
Z list of trust names will be available at the link below, containing further links to the survey
data for all NHS trusts that took part in the survey: http://www.cqc.org.uk/maternitysurvey
The CQC webpage also contains a statistical release document containing England-level
results, alongside relevant national policy and comparisons with the results from the 2013,
2015, 2017 and 2018 surveys. The page also contains the Quality and Methodology report
which provides further information on the survey.
Results for each trusts are also embedded in CQC’s organisation research tool alongside
information from various areas within CQC’s functions. The tool is accessible through the
homepage of CQC’s website.
Benchmark reports for each trust are also available for download on the NHS Survey
website at: https://nhssurveys.org/surveys/survey/04-maternity/year/2019/ (Benchmark
reports section). These reports not only provide the benchmark information available on
CQC’s website (i.e. how the trust compare to other participating trusts), but also information
on whether the changes seen between 2018 and 2019 at the trust are statistically significant.
All trusts who participated to the 2019 Maternity Survey receive a Labour and Birth
benchmark report.
Two additional benchmark reports are available for each trust that (a) completed the
maternity attribution exercise (see section 0) and (b) had a sufficient number of respondents
whose antenatal and/or postnatal care could be attributed to the trust: an Antenatal Care
Benchmark report and a Postnatal Care Benchmark report.
Selecting data for reporting Response to questions that can be used to assess the performance of a trust (questions of
evaluative nature) are assigned a score (see section 5.1 for more details on scoring) which
is used for reporting. ‘Routing’ questions used to guide respondents past any questions that
may not be relevant to them are not scored. An example of routing question would be
question C4 ‘Did the pain relief you used change from what you had originally wanted
(before you went into labour)?’. Similarly, questions used for descriptive or information
purposes (such as question C10 ‘What position were you when your baby was born?’) are
not scored either.
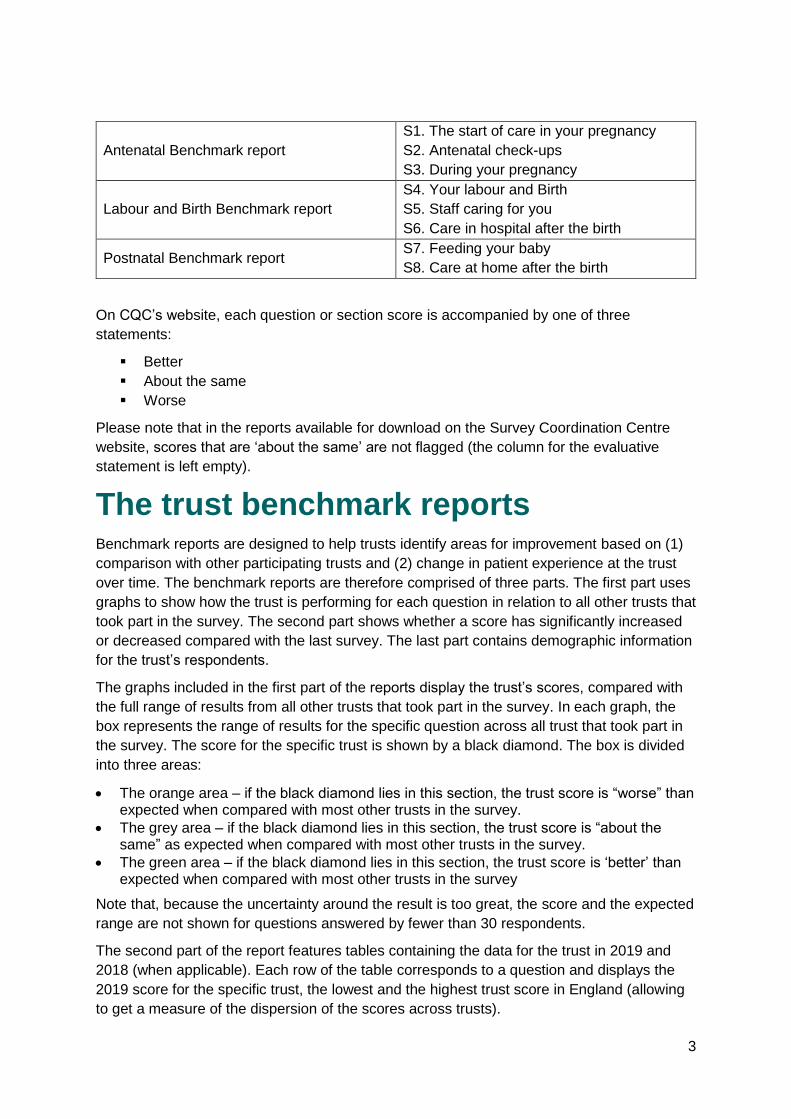
The scores for each question are grouped into thematic sections based on the
questionnaire’s sections. The table below present the sections for each type of benchmark
report.
3
Antenatal Benchmark report
S1. The start of care in your pregnancy
S2. Antenatal check-ups
S3. During your pregnancy
Labour and Birth Benchmark report
S4. Your labour and Birth
S5. Staff caring for you
S6. Care in hospital after the birth
Postnatal Benchmark report S7. Feeding your baby
S8. Care at home after the birth
On CQC’s website, each question or section score is accompanied by one of three
statements:
▪ Better
▪ About the same
▪ Worse
Please note that in the reports available for download on the Survey Coordination Centre
website, scores that are ‘about the same’ are not flagged (the column for the evaluative
statement is left empty).
The trust benchmark reports Benchmark reports are designed to help trusts identify areas for improvement based on (1)
comparison with other participating trusts and (2) change in patient experience at the trust
over time. The benchmark reports are therefore comprised of three parts. The first part uses
graphs to show how the trust is performing for each question in relation to all other trusts that
took part in the survey. The second part shows whether a score has significantly increased
or decreased compared with the last survey. The last part contains demographic information
for the trust’s respondents.
The graphs included in the first part of the reports display the trust’s scores, compared with
the full range of results from all other trusts that took part in the survey. In each graph, the
box represents the range of results for the specific question across all trust that took part in
the survey. The score for the specific trust is shown by a black diamond. The box is divided
into three areas:
• The orange area – if the black diamond lies in this section, the trust score is “worse” than expected when compared with most other trusts in the survey.
• The grey area – if the black diamond lies in this section, the trust score is “about the same” as expected when compared with most other trusts in the survey.
• The green area – if the black diamond lies in this section, the trust score is ‘better’ than expected when compared with most other trusts in the survey
Note that, because the uncertainty around the result is too great, the score and the expected
range are not shown for questions answered by fewer than 30 respondents.
The second part of the report features tables containing the data for the trust in 2019 and
2018 (when applicable). Each row of the table corresponds to a question and displays the
2019 score for the specific trust, the lowest and the highest trust score in England (allowing
to get a measure of the dispersion of the scores across trusts).
4
The tables also include the number of respondents to each question within the trust. A small
number of respondents for a question might indicate lower level of reliability of the score.
Finally, the table display the score for the trust in 2018 when data is available. If the change
between 2018 and 2019 is statistically significant, an arrow up or down is displayed in the
last column of the table. When the change is not statistically significant, this column is left
blank. Significance is tested using a two-sample t-test.
The maternity survey attribution
exercise For some women, a number of questions will relate to care that they received from their
midwife, GP or other provider, rather than the acute trust where they gave birth. Indeed, the
trust that provided care during labour and birth may not have provided antenatal and
postnatal care. As a result, for some sections of the questionnaire, respondents will not have
been reflecting on care attributable to the trust from which they were sampled and their
response cannot contribute to the benchmark report for the trust.
In order to address this issue, attribution data is submitted by trusts to identify whether a
woman received all or only part of their care at the trust. In the first instance, trusts are asked
to use electronic records on the provision of antenatal and postnatal care to indicate whether
they provided each respondent’s antenatal and/or postnatal care. However, if these records
are not available, trusts are asked to provide postcode details to identify the women in their
sample who lived in postcode sectors where the trust delivered maternity care. We refer to
this two-stage process as the ‘attribution exercise’. This attribution methodology, developed
in 2013, was followed in all following iterations of the survey (2015, 2017, 2018 and 2019).
As there is uncertainty over where postnatal and antenatal care was delivered for women
who gave birth in trusts who didn’t submit attribution data, these trusts are not provided with
antenatal and postnatal benchmark report.
In the 2019 Maternity Survey, 118 trusts (out of 126) completed the attribution exercise. This
information was used to identify the respondents who were likely to have been referring to
the acute trust when responding to the antenatal and postnatal care sections of the
questionnaire. Scored results and reports for antenatal and postnatal care were then
produced based on analyses involving only those respondents.
Out of these 118 trusts, one trust doesn’t have any postnatal data because their attribution
data indicated that no one in their sample received postnatal care from the trust. Therefore,
a total of 118 trusts received an antenatal benchmark report and 117 trusts received a
postnatal benchmark report.
The data for the antenatal and postnatal sections cannot be considered as statistically robust
as the data for the labour and birth questions, for several reasons:
▪ Although the value of the data for exploring individual trust performance is improved,
due to the more accurate attribution of responses to provider, the lack of complete
coverage across all trusts means that we cannot fairly say that one trust is ‘better’ or
‘worse’ than all others. Therefore, in antenatal and postnatal reports, trust results are
only identified as being ‘better’ or ‘worse’ than most of the subset of trusts that
completed the attribution exercise. As we cannot say that the subset of trusts is
5
representative of all trusts, it is not a true benchmark for performance across
England.
▪ Where electronic records are not available, the attribution is based on the
respondent’s postcode. Unfortunately, there are no means available to identify
women who receive care from a more distantly located provider for other reasons,
such as requiring specialist care, or moving to a new house during or after
pregnancy. Some respondents may have been included in the trust’s antenatal
and/or postnatal data and analyses despite having received care from another
provider.
▪ NHS trusts complete the attribution exercise themselves. Due to the limitations of the
process, the Survey Coordination Centre is unable to verify the accuracy of the
exercise. This means that we cannot be certain about the reliability of the attribution
of the data.
The antenatal and postnatal survey data from the trusts that completed the attribution
exercise will be shared with those trusts. The data will be considered by the Care Quality
Commission (CQC) to inform its intelligence model and will be shared with CQC inspectors.
While the reports will be published on the NHS Survey website, they will not be published on
the CQC website for the reasons given above.
Trusts with antenatal and postnatal benchmark reports should keep the above caveats in
mind when interpreting their data.
Interpreting the data
5.1 Scoring
Questions are scored on a scale from 0 to 10. Details of the scoring for this survey are
available in Appendix A at the end of this document.
The scores represent the extent to which the patient’s experience could be improved. A
response assigned a score of 0 refers to the most negative patient experience we can
measure, and a response assigned a score of 10 refers to the most positive patient
experience we can measure.
Where a number of options lay between the most negative and most positive responses,
they are placed at equal intervals along the scale. Where options are provided that did not
have any bearing on the trust’s performance in terms of peoples’ experience, the responses
are classified as ‘not applicable’ and a score is not given. Similarly, where respondents state
that they could not remember, or did not know the answer to a question, a score is not given.
5.2 Standardisation
Results are based on ‘standardised’ data. We know that the views of a respondent can
reflect not only their experiences of NHS services, but can also relate to certain demographic
characteristics, such as age and parity (whether a woman has given birth previously). The
mix of patients varies across trusts, and this could lead to bias, resulting in a trust appearing
better or worse than they would if they had a slightly different profile of patients. To account
for this, we ‘standardise’ the data. Standardising data adjusts for these differences and
6
enables the results for trusts to be compared more fairly than could be achieved using non-
standardised data.
The results of the 2019 Maternity Survey are standardised by age and parity (see section
5.2 and Appendix B).
5.3 Expected range
The ‘better’, ‘about the same’, and ‘worse’ categories are based on the 'expected range’,
which is calculated for each question for each trust. This is the range within which we would
expect a particular trust to score if it performed about the same as most other trusts in the
survey. The range takes into account the number of respondents from each trust, as well as
the scores for all other trusts, and allows us to identify which scores we can confidently say
are 'better' or 'worse' than the majority of other trusts (see section 5.3 and Appendix C for
more details). Analysing the survey information in such a way allows for fairer conclusions
on each trust’s performance. This approach presents the findings simply and in a way that
takes account of multiple factors.
As the ‘expected range’ calculation accounts for the number of respondents at each trust
who answer a question, it is not necessary to present confidence intervals around each
score for the purposes of comparing across all trusts.
5.4 Conclusion made on performance
It should be noted that the data only show performance relative to other trusts; we have not
set absolute thresholds for ‘good’ or ‘bad’ performance. Thus, a trust may have a low score
for a specific question, while still performing very well on the whole. This is particularly true
on questions where the majority of trusts exhibit a high score.
A separate report, which explores how overall results between trusts vary across the
country, known as the Outliers report, is available on the CQC website
http://www.cqc.org.uk/maternitysurvey.
This report focuses on identifying significantly higher levels of better or worse patient
experience across the entire questionnaire, rather than considering performance on
individual questions.
5.5 Comparing scores across trusts or across survey years
The expected range statistic is used to arrive at a judgement of how a trust is performing
compared with all other trusts that took part in the survey. However, if you wish to use the
scored data in another way—for example, to compare scores between two different trusts or
subsets of trusts—you will need to apply an appropriate statistical test to ensure that any
differences are ‘statistically significant’. ‘Statistically significant’ means that it is very unlikely
that any difference between scores is due to chance.
Further information The results for England, and trust level results, can be found on the CQC website. Also
available is a ‘Quality and Methodology’ document which provides information about the
survey development and methodology: http://www.cqc.org.uk/maternitysurvey

7
The results from previous maternity surveys carried out between 2007 and 2018 are
available at the link below. Please note that due to redevelopment work, results from the
2019 survey are only comparable with 2013, 2015, 2017 and 2018. Full details of the
methodology for the survey, including questionnaires, supporting materials, sampling
instructions and the survey development report are available at:
https://nhssurveys.org/surveys/survey/04-maternity/year/2019/
More information on the NHS Patient Survey Programme, including results from other
surveys and a programme of current and forthcoming surveys can be found at:
www.cqc.org.uk/surveys
8
Appendix A: Scoring for the 2019
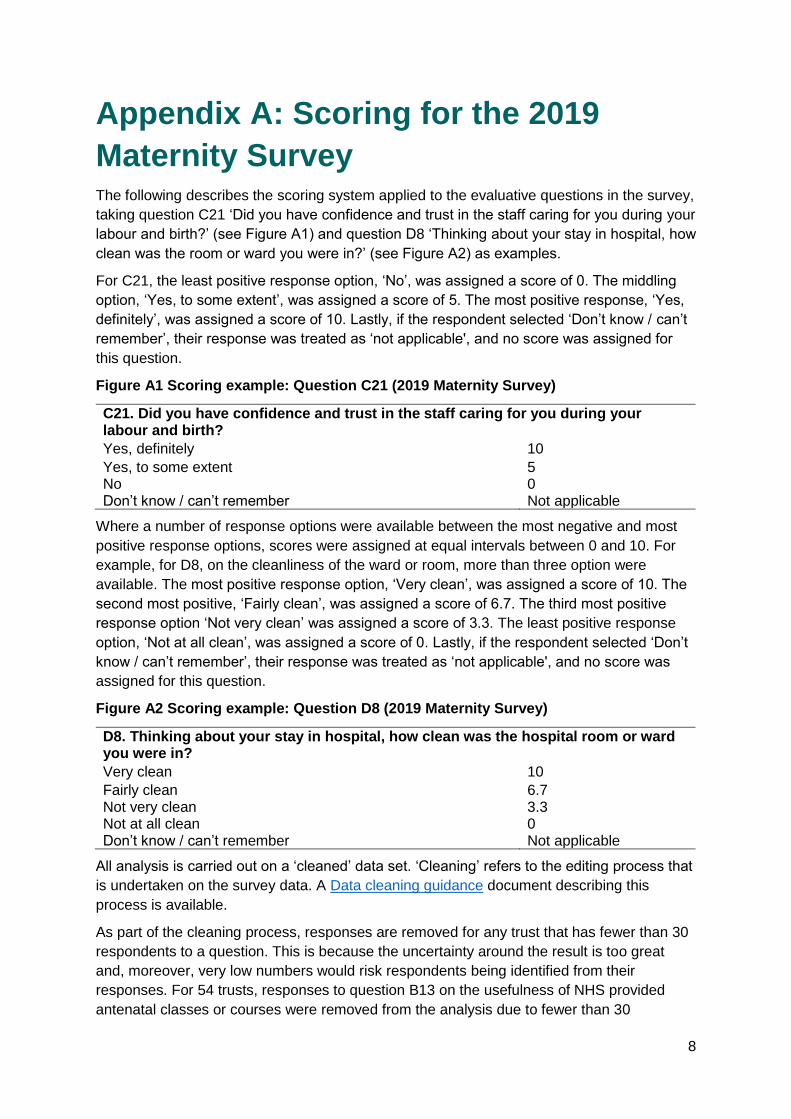
Maternity Survey The following describes the scoring system applied to the evaluative questions in the survey,
taking question C21 ‘Did you have confidence and trust in the staff caring for you during your
labour and birth?’ (see Figure A1) and question D8 ‘Thinking about your stay in hospital, how
clean was the room or ward you were in?’ (see Figure A2) as examples.
For C21, the least positive response option, ‘No’, was assigned a score of 0. The middling
option, ‘Yes, to some extent’, was assigned a score of 5. The most positive response, ‘Yes,
definitely’, was assigned a score of 10. Lastly, if the respondent selected ‘Don’t know / can’t
remember’, their response was treated as ‘not applicable', and no score was assigned for
this question.
Figure A1 Scoring example: Question C21 (2019 Maternity Survey)
C21. Did you have confidence and trust in the staff caring for you during your labour and birth?
Yes, definitely 10
Yes, to some extent 5 No 0 Don’t know / can’t remember Not applicable
Where a number of response options were available between the most negative and most
positive response options, scores were assigned at equal intervals between 0 and 10. For
example, for D8, on the cleanliness of the ward or room, more than three option were
available. The most positive response option, ‘Very clean’, was assigned a score of 10. The
second most positive, ‘Fairly clean’, was assigned a score of 6.7. The third most positive
response option ‘Not very clean’ was assigned a score of 3.3. The least positive response
option, ‘Not at all clean’, was assigned a score of 0. Lastly, if the respondent selected ‘Don’t
know / can’t remember’, their response was treated as ‘not applicable', and no score was
assigned for this question.
Figure A2 Scoring example: Question D8 (2019 Maternity Survey)
D8. Thinking about your stay in hospital, how clean was the hospital room or ward you were in?
Very clean 10
Fairly clean 6.7 Not very clean 3.3 Not at all clean 0 Don’t know / can’t remember Not applicable
All analysis is carried out on a ‘cleaned’ data set. ‘Cleaning’ refers to the editing process that
is undertaken on the survey data. A Data cleaning guidance document describing this
process is available.
As part of the cleaning process, responses are removed for any trust that has fewer than 30
respondents to a question. This is because the uncertainty around the result is too great
and, moreover, very low numbers would risk respondents being identified from their
responses. For 54 trusts, responses to question B13 on the usefulness of NHS provided
antenatal classes or courses were removed from the analysis due to fewer than 30
9
respondents. Additionally, 39 trusts had data suppressed for question C5 “Why did you not
use the pain relief that you originally wanted (before you went into labour); 14 trusts had data
suppressed for question D3, on the reason for delay at discharge; and 9 trusts had data
suppressed for question F17 ‘If, during evenings, nights or weekends, you needed support
or advice about feeding your baby, were you able to get this?’.
The scoring method for each question used in the analysis, under headings to identify which
report they are contained within, are set out below.
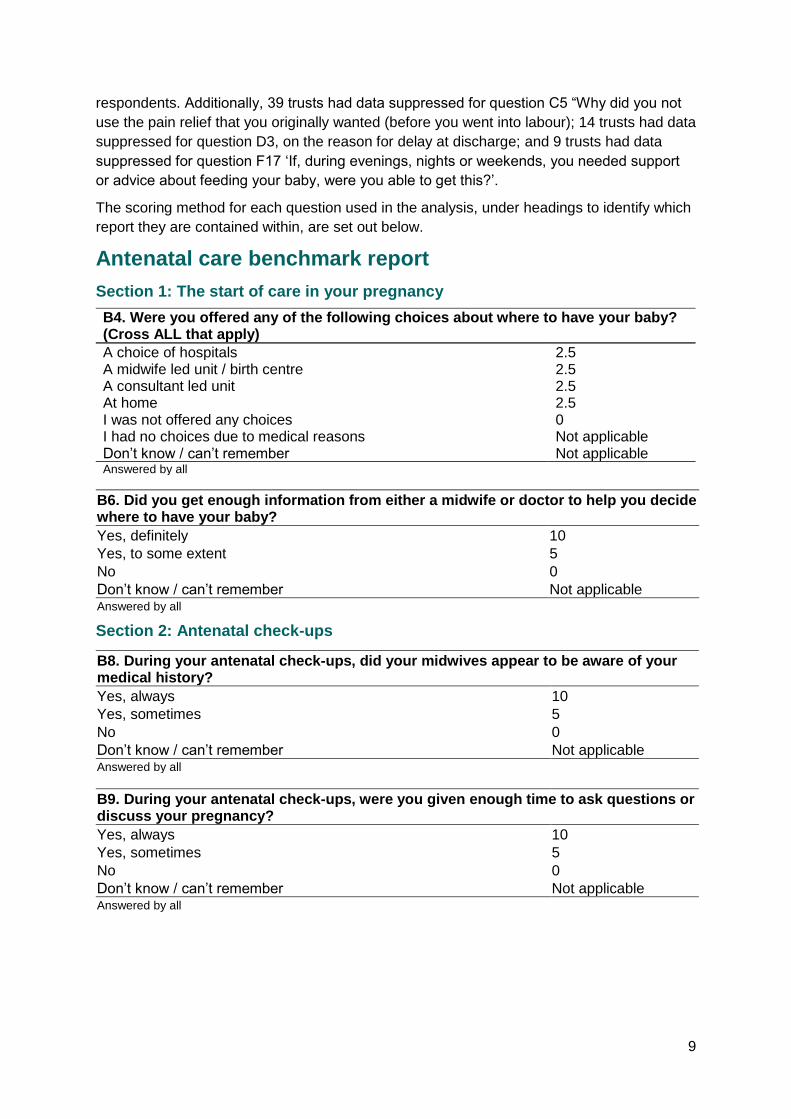
Antenatal care benchmark report
Section 1: The start of care in your pregnancy
B4. Were you offered any of the following choices about where to have your baby? (Cross ALL that apply)
A choice of hospitals 2.5 A midwife led unit / birth centre 2.5 A consultant led unit 2.5 At home 2.5 I was not offered any choices 0 I had no choices due to medical reasons Not applicable Don’t know / can’t remember Not applicable Answered by all
B6. Did you get enough information from either a midwife or doctor to help you decide where to have your baby?
Yes, definitely 10
Yes, to some extent 5
No 0
Don’t know / can’t remember Not applicable Answered by all
Section 2: Antenatal check-ups
B8. During your antenatal check-ups, did your midwives appear to be aware of your medical history?
Yes, always 10
Yes, sometimes 5
No 0
Don’t know / can’t remember Not applicable Answered by all
B9. During your antenatal check-ups, were you given enough time to ask questions or discuss your pregnancy?
Yes, always 10
Yes, sometimes 5
No 0
Don’t know / can’t remember Not applicable Answered by all
10
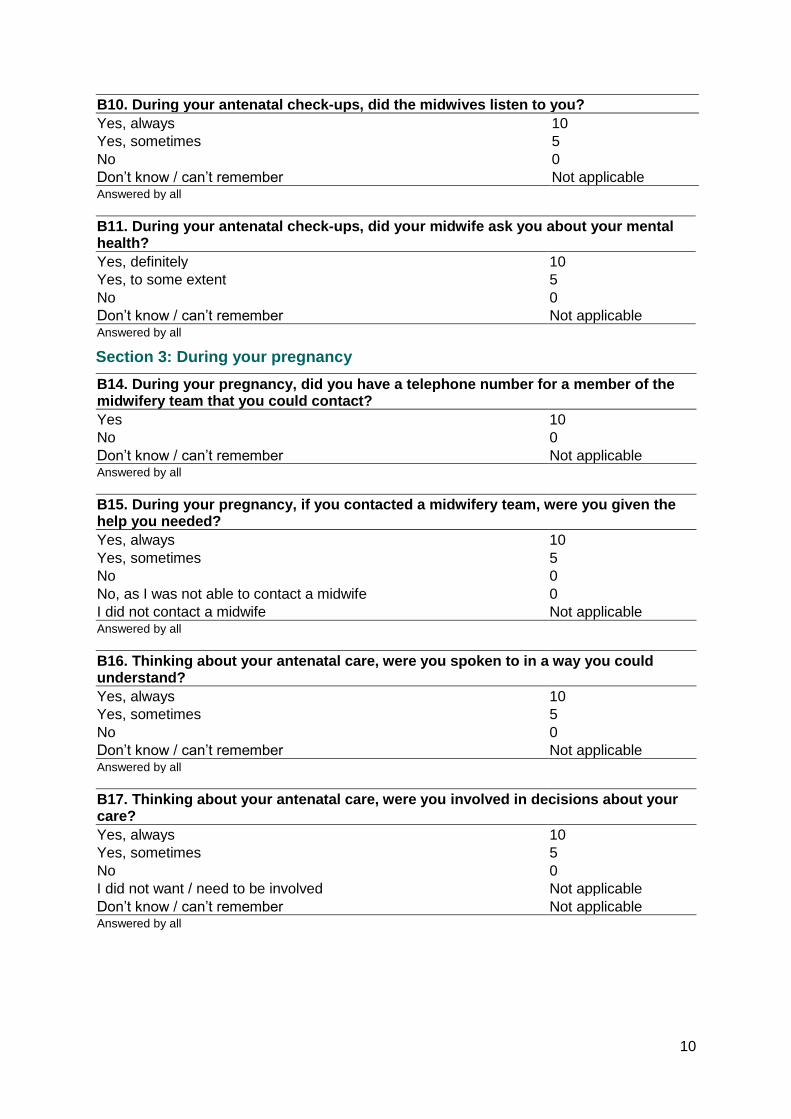
B10. During your antenatal check-ups, did the midwives listen to you?
Yes, always 10
Yes, sometimes 5
No 0
Don’t know / can’t remember Not applicable Answered by all
B11. During your antenatal check-ups, did your midwife ask you about your mental health?
Yes, definitely 10
Yes, to some extent 5
No 0
Don’t know / can’t remember Not applicable Answered by all
Section 3: During your pregnancy
B14. During your pregnancy, did you have a telephone number for a member of the midwifery team that you could contact?
Yes 10
No 0
Don’t know / can’t remember Not applicable Answered by all
B15. During your pregnancy, if you contacted a midwifery team, were you given the help you needed?
Yes, always 10
Yes, sometimes 5
No 0
No, as I was not able to contact a midwife 0
I did not contact a midwife Not applicable Answered by all
B16. Thinking about your antenatal care, were you spoken to in a way you could understand?
Yes, always 10
Yes, sometimes 5
No 0
Don’t know / can’t remember Not applicable Answered by all
B17. Thinking about your antenatal care, were you involved in decisions about your care?
Yes, always 10
Yes, sometimes 5
No 0
I did not want / need to be involved Not applicable
Don’t know / can’t remember Not applicable Answered by all
11
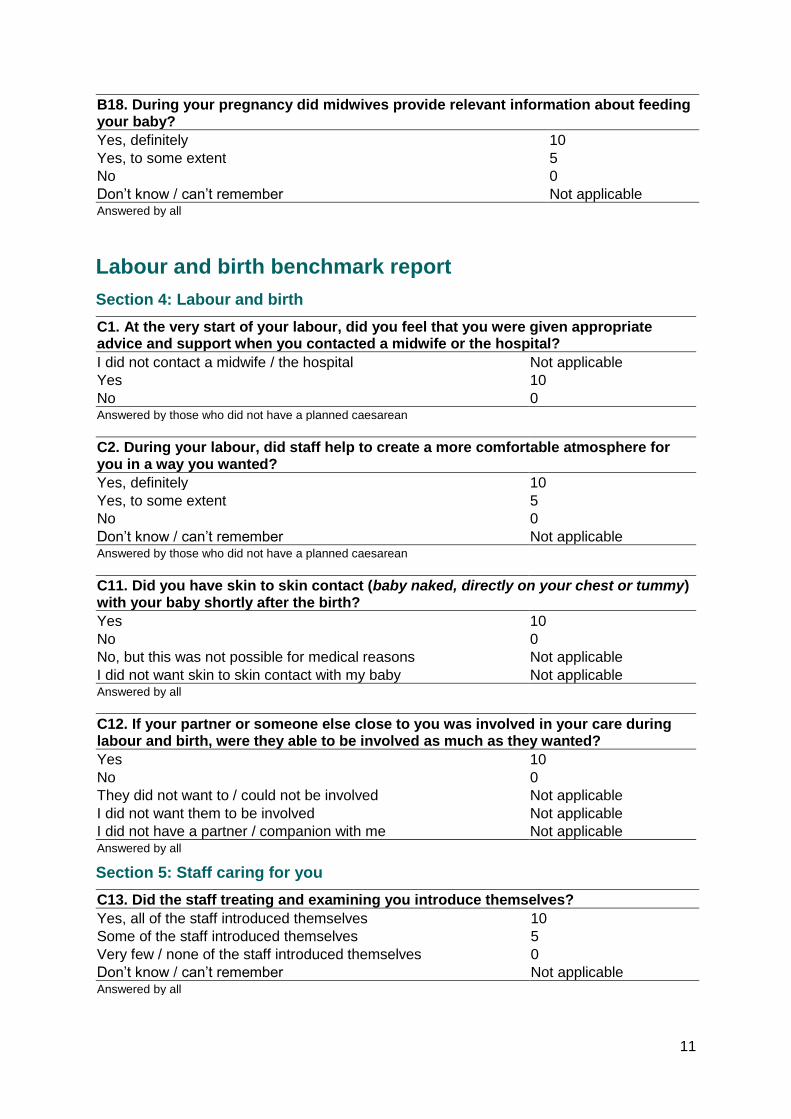
B18. During your pregnancy did midwives provide relevant information about feeding your baby?
Yes, definitely 10
Yes, to some extent 5
No 0
Don’t know / can’t remember Not applicable Answered by all
Labour and birth benchmark report
Section 4: Labour and birth
C1. At the very start of your labour, did you feel that you were given appropriate advice and support when you contacted a midwife or the hospital?
I did not contact a midwife / the hospital Not applicable
Yes 10
No 0 Answered by those who did not have a planned caesarean
C2. During your labour, did staff help to create a more comfortable atmosphere for you in a way you wanted?
Yes, definitely 10
Yes, to some extent 5
No 0
Don’t know / can’t remember Not applicable Answered by those who did not have a planned caesarean
C11. Did you have skin to skin contact (baby naked, directly on your chest or tummy) with your baby shortly after the birth?
Yes 10
No 0
No, but this was not possible for medical reasons Not applicable
I did not want skin to skin contact with my baby Not applicable Answered by all
C12. If your partner or someone else close to you was involved in your care during labour and birth, were they able to be involved as much as they wanted?
Yes 10
No 0
They did not want to / could not be involved Not applicable
I did not want them to be involved Not applicable
I did not have a partner / companion with me Not applicable Answered by all
Section 5: Staff caring for you
C13. Did the staff treating and examining you introduce themselves?
Yes, all of the staff introduced themselves 10
Some of the staff introduced themselves 5
Very few / none of the staff introduced themselves 0
Don’t know / can’t remember Not applicable Answered by all
12
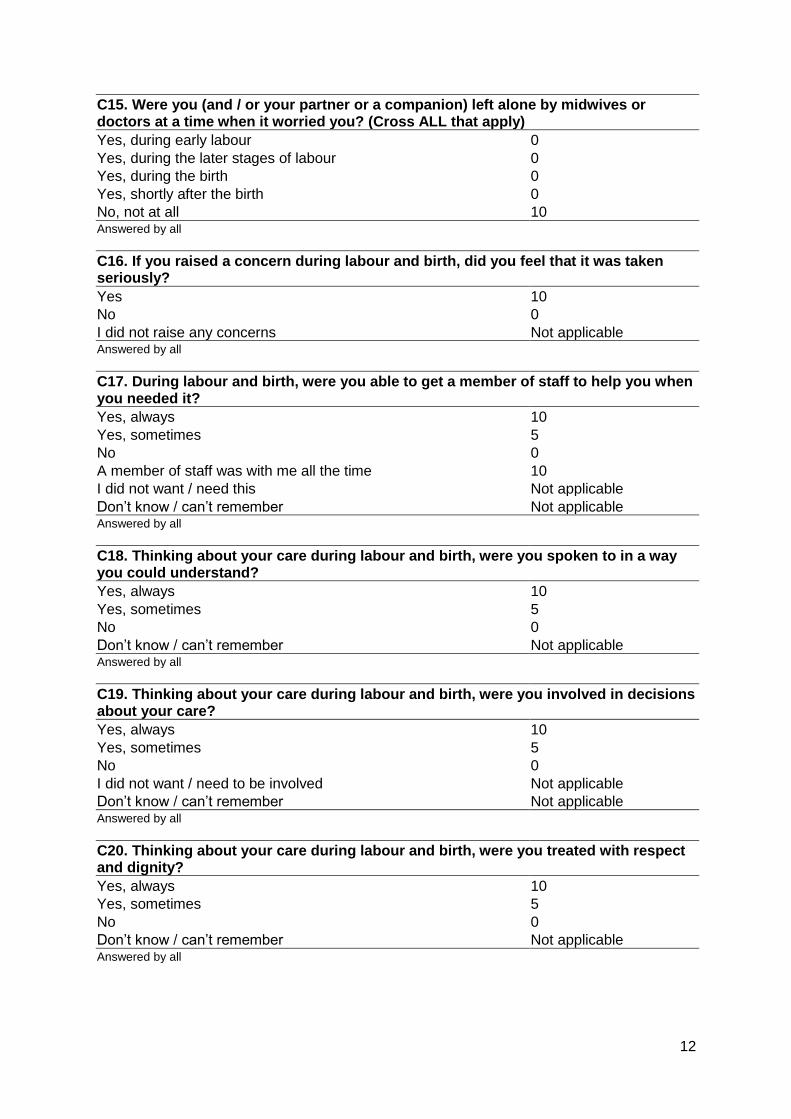
C15. Were you (and / or your partner or a companion) left alone by midwives or doctors at a time when it worried you? (Cross ALL that apply)
Yes, during early labour 0
Yes, during the later stages of labour 0
Yes, during the birth 0
Yes, shortly after the birth 0
No, not at all 10 Answered by all
C16. If you raised a concern during labour and birth, did you feel that it was taken seriously?
Yes 10
No 0
I did not raise any concerns Not applicable Answered by all
C17. During labour and birth, were you able to get a member of staff to help you when you needed it?
Yes, always 10
Yes, sometimes 5
No 0
A member of staff was with me all the time 10
I did not want / need this Not applicable
Don’t know / can’t remember Not applicable Answered by all
C18. Thinking about your care during labour and birth, were you spoken to in a way you could understand?
Yes, always 10
Yes, sometimes 5
No 0
Don’t know / can’t remember Not applicable Answered by all
C19. Thinking about your care during labour and birth, were you involved in decisions about your care?
Yes, always 10
Yes, sometimes 5
No 0
I did not want / need to be involved Not applicable
Don’t know / can’t remember Not applicable Answered by all
C20. Thinking about your care during labour and birth, were you treated with respect and dignity?
Yes, always 10
Yes, sometimes 5
No 0
Don’t know / can’t remember Not applicable Answered by all
13
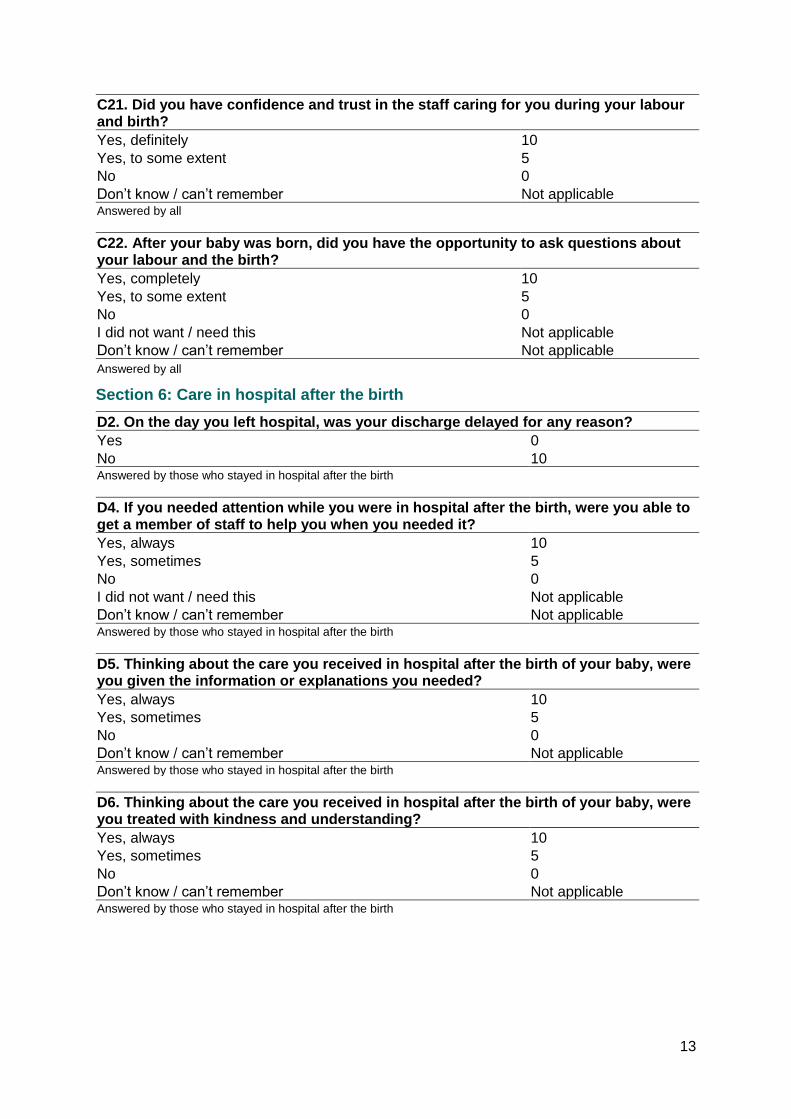
C21. Did you have confidence and trust in the staff caring for you during your labour and birth?
Yes, definitely 10
Yes, to some extent 5
No 0
Don’t know / can’t remember Not applicable Answered by all
C22. After your baby was born, did you have the opportunity to ask questions about your labour and the birth?
Yes, completely 10
Yes, to some extent 5
No 0
I did not want / need this Not applicable
Don’t know / can’t remember Not applicable
Answered by all
Section 6: Care in hospital after the birth
D2. On the day you left hospital, was your discharge delayed for any reason?
Yes 0
No 10 Answered by those who stayed in hospital after the birth
D4. If you needed attention while you were in hospital after the birth, were you able to get a member of staff to help you when you needed it?
Yes, always 10
Yes, sometimes 5
No 0
I did not want / need this Not applicable
Don’t know / can’t remember Not applicable Answered by those who stayed in hospital after the birth
D5. Thinking about the care you received in hospital after the birth of your baby, were you given the information or explanations you needed?
Yes, always 10
Yes, sometimes 5
No 0
Don’t know / can’t remember Not applicable Answered by those who stayed in hospital after the birth
D6. Thinking about the care you received in hospital after the birth of your baby, were you treated with kindness and understanding?
Yes, always 10
Yes, sometimes 5
No 0
Don’t know / can’t remember Not applicable Answered by those who stayed in hospital after the birth
14
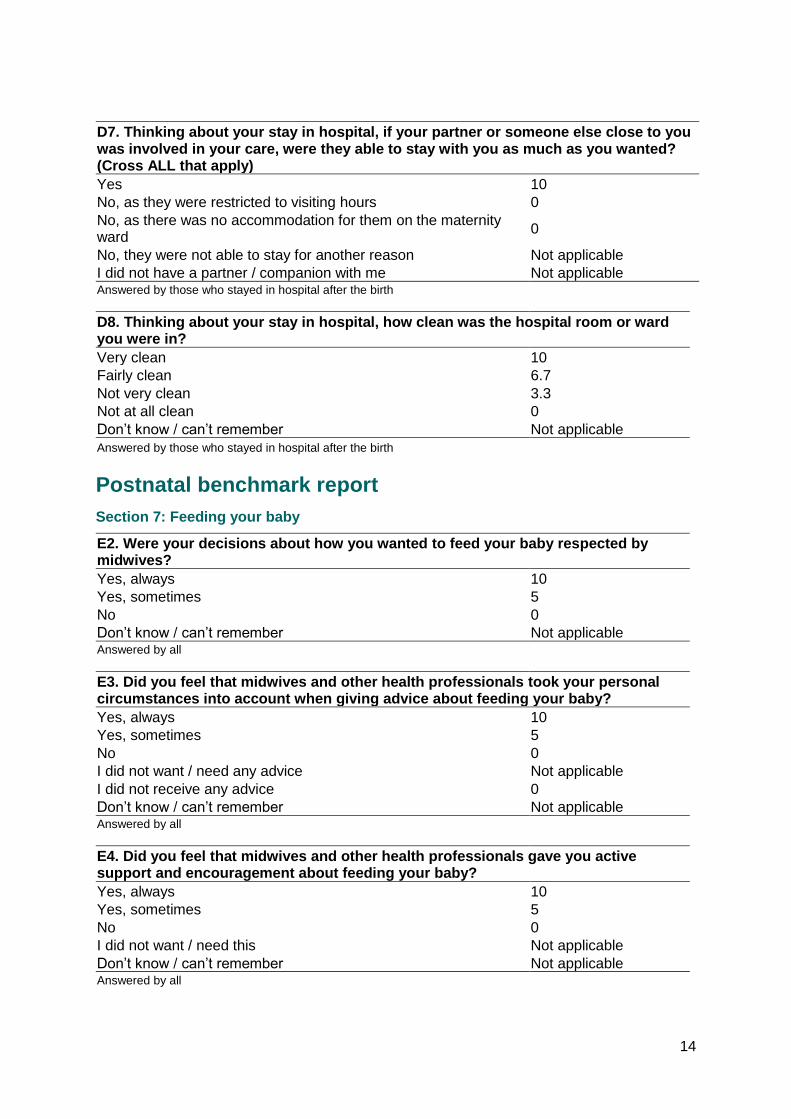
D7. Thinking about your stay in hospital, if your partner or someone else close to you was involved in your care, were they able to stay with you as much as you wanted? (Cross ALL that apply)
Yes 10
No, as they were restricted to visiting hours 0
No, as there was no accommodation for them on the maternity ward
0
No, they were not able to stay for another reason Not applicable
I did not have a partner / companion with me Not applicable Answered by those who stayed in hospital after the birth
D8. Thinking about your stay in hospital, how clean was the hospital room or ward you were in?
Very clean 10
Fairly clean 6.7
Not very clean 3.3
Not at all clean 0
Don’t know / can’t remember Not applicable
Answered by those who stayed in hospital after the birth
Postnatal benchmark report
Section 7: Feeding your baby
E2. Were your decisions about how you wanted to feed your baby respected by midwives?
Yes, always 10
Yes, sometimes 5
No 0
Don’t know / can’t remember Not applicable Answered by all
E3. Did you feel that midwives and other health professionals took your personal circumstances into account when giving advice about feeding your baby?
Yes, always 10
Yes, sometimes 5
No 0
I did not want / need any advice Not applicable
I did not receive any advice 0
Don’t know / can’t remember Not applicable Answered by all
E4. Did you feel that midwives and other health professionals gave you active support and encouragement about feeding your baby?
Yes, always 10
Yes, sometimes 5
No 0
I did not want / need this Not applicable
Don’t know / can’t remember Not applicable Answered by all
15
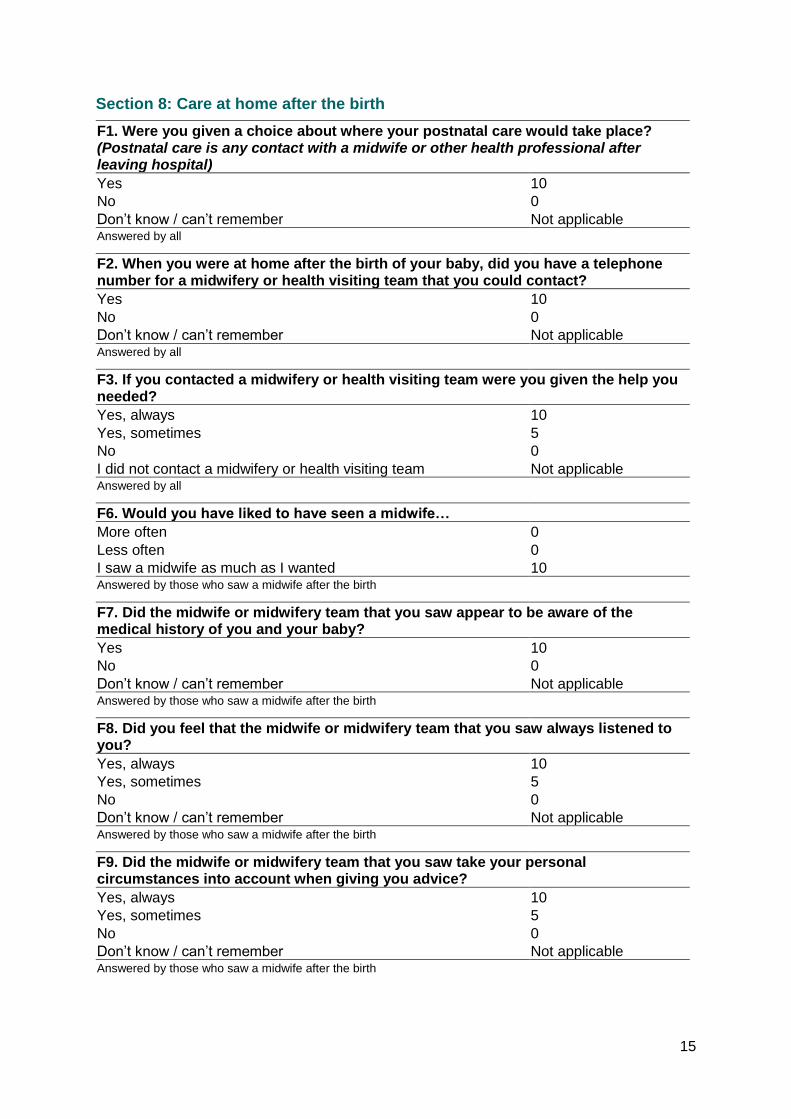
Section 8: Care at home after the birth
F1. Were you given a choice about where your postnatal care would take place? (Postnatal care is any contact with a midwife or other health professional after leaving hospital)
Yes 10
No 0
Don’t know / can’t remember Not applicable Answered by all
F2. When you were at home after the birth of your baby, did you have a telephone number for a midwifery or health visiting team that you could contact?
Yes 10
No 0
Don’t know / can’t remember Not applicable Answered by all
F3. If you contacted a midwifery or health visiting team were you given the help you needed?
Yes, always 10
Yes, sometimes 5
No 0
I did not contact a midwifery or health visiting team Not applicable Answered by all
F6. Would you have liked to have seen a midwife…
More often 0
Less often 0
I saw a midwife as much as I wanted 10 Answered by those who saw a midwife after the birth
F7. Did the midwife or midwifery team that you saw appear to be aware of the medical history of you and your baby?
Yes 10
No 0
Don’t know / can’t remember Not applicable Answered by those who saw a midwife after the birth
F8. Did you feel that the midwife or midwifery team that you saw always listened to you?
Yes, always 10
Yes, sometimes 5
No 0
Don’t know / can’t remember Not applicable Answered by those who saw a midwife after the birth
F9. Did the midwife or midwifery team that you saw take your personal circumstances into account when giving you advice?
Yes, always 10
Yes, sometimes 5
No 0
Don’t know / can’t remember Not applicable Answered by those who saw a midwife after the birth
16
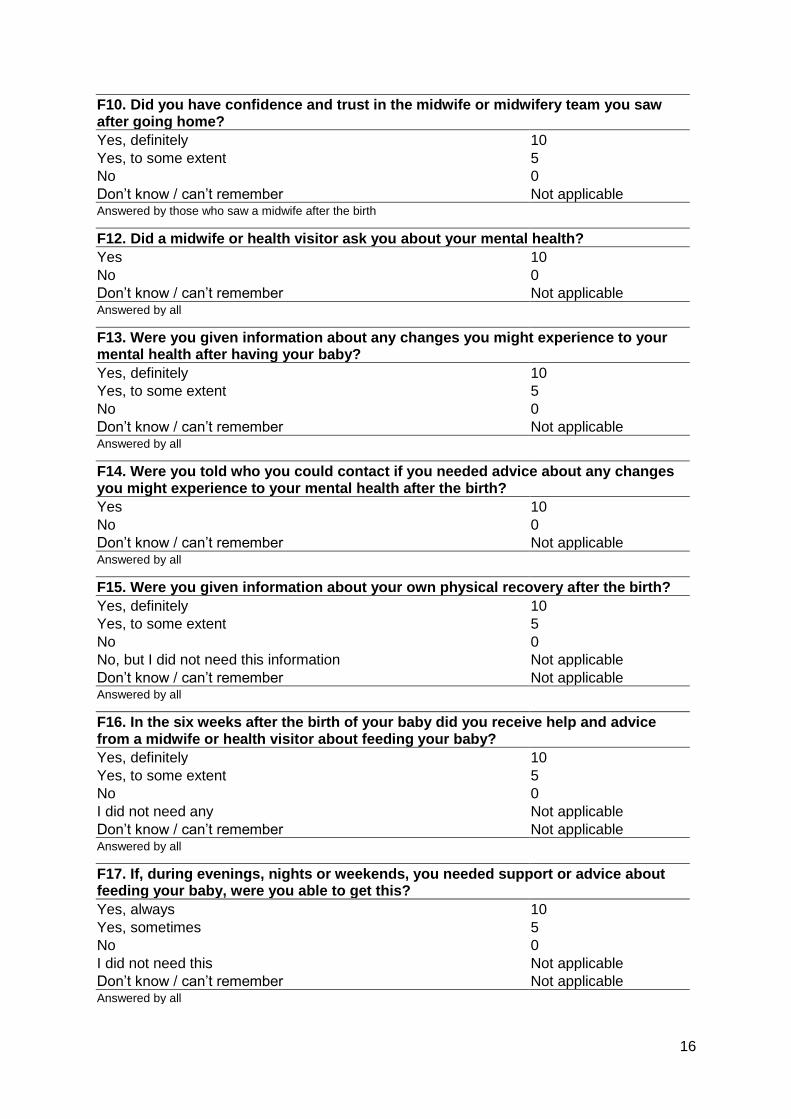
F10. Did you have confidence and trust in the midwife or midwifery team you saw after going home?
Yes, definitely 10
Yes, to some extent 5
No 0
Don’t know / can’t remember Not applicable Answered by those who saw a midwife after the birth
F12. Did a midwife or health visitor ask you about your mental health?
Yes 10
No 0
Don’t know / can’t remember Not applicable Answered by all
F13. Were you given information about any changes you might experience to your mental health after having your baby?
Yes, definitely 10
Yes, to some extent 5
No 0
Don’t know / can’t remember Not applicable Answered by all
F14. Were you told who you could contact if you needed advice about any changes you might experience to your mental health after the birth?
Yes 10
No 0
Don’t know / can’t remember Not applicable Answered by all
F15. Were you given information about your own physical recovery after the birth?
Yes, definitely 10
Yes, to some extent 5
No 0
No, but I did not need this information Not applicable
Don’t know / can’t remember Not applicable Answered by all
F16. In the six weeks after the birth of your baby did you receive help and advice from a midwife or health visitor about feeding your baby?
Yes, definitely 10
Yes, to some extent 5
No 0
I did not need any Not applicable
Don’t know / can’t remember Not applicable Answered by all
F17. If, during evenings, nights or weekends, you needed support or advice about feeding your baby, were you able to get this?
Yes, always 10
Yes, sometimes 5
No 0
I did not need this Not applicable
Don’t know / can’t remember Not applicable Answered by all

17
F18. In the six weeks after the birth of your baby did you receive help and advice from health professionals about your baby’s health and progress?
Yes, definitely 10
Yes, to some extent 5
No 0
I did not need any Not applicable
Don’t know / can’t remember Not applicable
Answered by all
18
Appendix B: Calculating the trust score The question and section scores for each trust, for each of the three reports, were calculated
using the method described below.
Weights were calculated to adjust for any variation between trusts that resulted from
differences in the age and parity groupings of respondents. A weight was calculated for each
respondent by dividing the national proportion of respondents in their age/parity group by the
corresponding trust proportion. The reason for weighting the data was that respondents may
answer questions differently, depending on certain characteristics. If a trust had a large
population of very young patients for example, their performance might be judged more
harshly (or better) than if there was a more consistent distribution of patient ages across all
trusts.
Weighting survey responses
The first stage of the analysis involved calculating the national age/parity proportions. It must
be noted that the term ‘national proportion’ is used loosely here as it was obtained from
pooling the survey data from all trusts, and was therefore based on the respondent
population rather than the entire population of England.
The questionnaire asked respondents to state their year of birth. The approximate age of
each woman was then calculated by subtracting the year given from 2019. Parity was
determined according to responses to question G3 (‘How many babies have you given birth
to before this pregnancy’). The respondents were then grouped according to the categories
shown in Figure B1.
If a respondent did not fill in their year of birth on the questionnaire, this information was
taken from the sample file. If information on a respondent’s age was missing from both the
questionnaire and the sample file, or if the respondent did not complete question G3 to
provide information on parity, it was not possible to assign a weight and the woman was
excluded from the analysis.
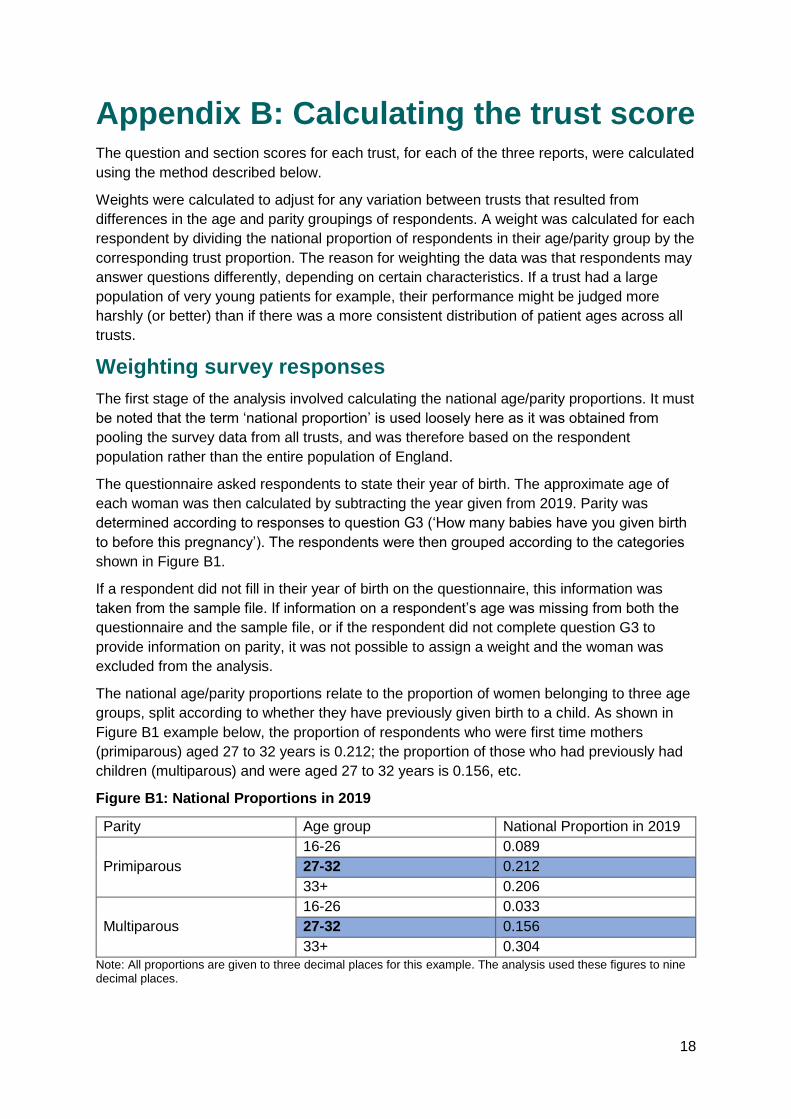
The national age/parity proportions relate to the proportion of women belonging to three age
groups, split according to whether they have previously given birth to a child. As shown in
Figure B1 example below, the proportion of respondents who were first time mothers
(primiparous) aged 27 to 32 years is 0.212; the proportion of those who had previously had
children (multiparous) and were aged 27 to 32 years is 0.156, etc.
Figure B1: National Proportions in 2019
Parity Age group National Proportion in 2019
Primiparous
16-26 0.089
27-32 0.212
33+ 0.206
Multiparous
16-26 0.033
27-32 0.156
33+ 0.304
Note: All proportions are given to three decimal places for this example. The analysis used these figures to nine decimal places.
19
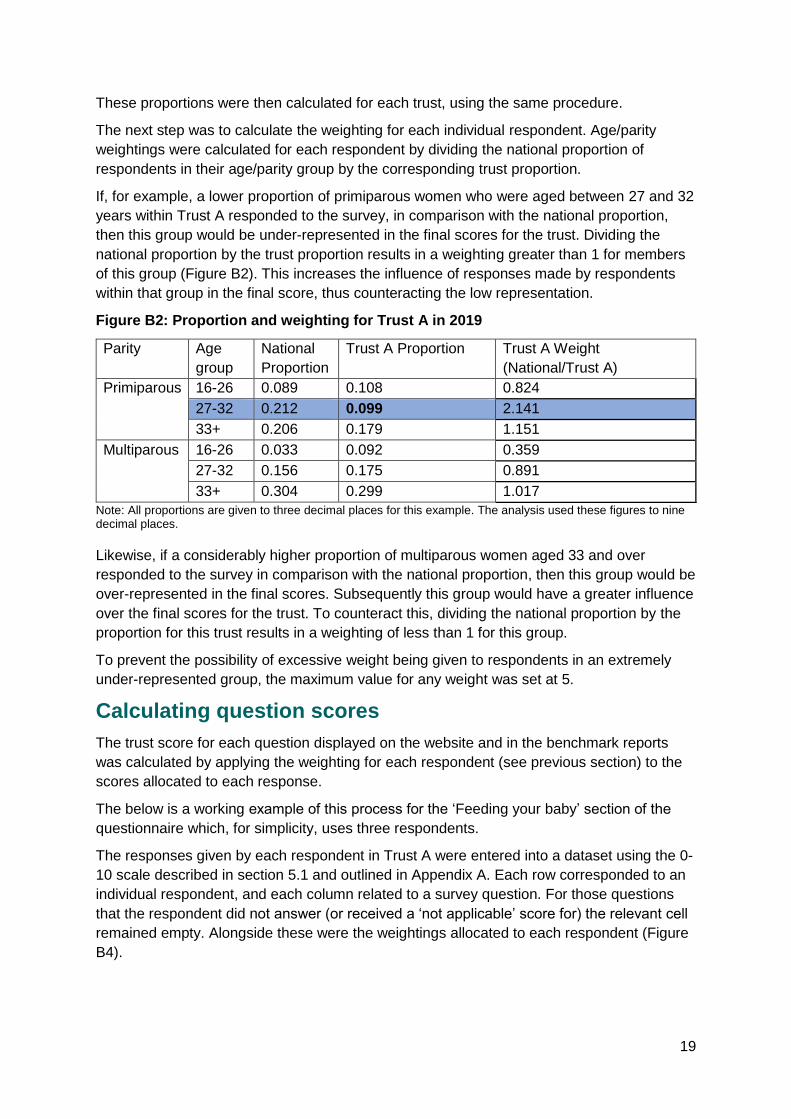
These proportions were then calculated for each trust, using the same procedure.
The next step was to calculate the weighting for each individual respondent. Age/parity
weightings were calculated for each respondent by dividing the national proportion of
respondents in their age/parity group by the corresponding trust proportion.
If, for example, a lower proportion of primiparous women who were aged between 27 and 32
years within Trust A responded to the survey, in comparison with the national proportion,
then this group would be under-represented in the final scores for the trust. Dividing the
national proportion by the trust proportion results in a weighting greater than 1 for members
of this group (Figure B2). This increases the influence of responses made by respondents
within that group in the final score, thus counteracting the low representation.
Figure B2: Proportion and weighting for Trust A in 2019
Parity Age
group
National
Proportion
Trust A Proportion Trust A Weight
(National/Trust A)
Primiparous 16-26 0.089 0.108 0.824
27-32 0.212 0.099 2.141
33+ 0.206 0.179 1.151
Multiparous 16-26 0.033 0.092 0.359
27-32 0.156 0.175 0.891
33+ 0.304 0.299 1.017
Note: All proportions are given to three decimal places for this example. The analysis used these figures to nine decimal places.
Likewise, if a considerably higher proportion of multiparous women aged 33 and over
responded to the survey in comparison with the national proportion, then this group would be
over-represented in the final scores. Subsequently this group would have a greater influence
over the final scores for the trust. To counteract this, dividing the national proportion by the
proportion for this trust results in a weighting of less than 1 for this group.
To prevent the possibility of excessive weight being given to respondents in an extremely
under-represented group, the maximum value for any weight was set at 5.
Calculating question scores
The trust score for each question displayed on the website and in the benchmark reports
was calculated by applying the weighting for each respondent (see previous section) to the
scores allocated to each response.
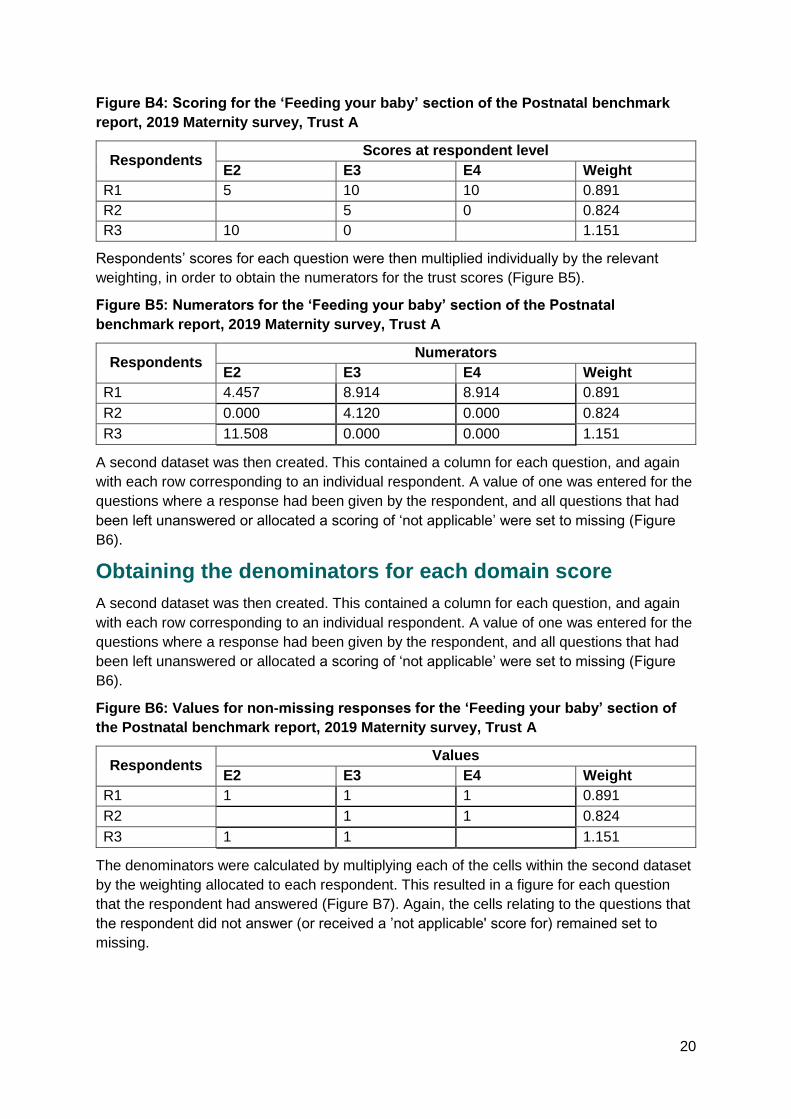
The below is a working example of this process for the ‘Feeding your baby’ section of the
questionnaire which, for simplicity, uses three respondents.
The responses given by each respondent in Trust A were entered into a dataset using the 0-
10 scale described in section 5.1 and outlined in Appendix A. Each row corresponded to an
individual respondent, and each column related to a survey question. For those questions
that the respondent did not answer (or received a ‘not applicable’ score for) the relevant cell
remained empty. Alongside these were the weightings allocated to each respondent (Figure
B4).
20
Figure B4: Scoring for the ‘Feeding your baby’ section of the Postnatal benchmark
report, 2019 Maternity survey, Trust A
Respondents Scores at respondent level
E2 E3 E4 Weight
R1 5 10 10 0.891
R2 5 0 0.824
R3 10 0 1.151
Respondents’ scores for each question were then multiplied individually by the relevant
weighting, in order to obtain the numerators for the trust scores (Figure B5).
Figure B5: Numerators for the ‘Feeding your baby’ section of the Postnatal
benchmark report, 2019 Maternity survey, Trust A
Respondents Numerators
E2 E3 E4 Weight
R1 4.457 8.914 8.914 0.891
R2 0.000 4.120 0.000 0.824
R3 11.508 0.000 0.000 1.151
A second dataset was then created. This contained a column for each question, and again
with each row corresponding to an individual respondent. A value of one was entered for the
questions where a response had been given by the respondent, and all questions that had
been left unanswered or allocated a scoring of ‘not applicable’ were set to missing (Figure
B6).
Obtaining the denominators for each domain score
A second dataset was then created. This contained a column for each question, and again
with each row corresponding to an individual respondent. A value of one was entered for the
questions where a response had been given by the respondent, and all questions that had
been left unanswered or allocated a scoring of ‘not applicable’ were set to missing (Figure
B6).
Figure B6: Values for non-missing responses for the ‘Feeding your baby’ section of
the Postnatal benchmark report, 2019 Maternity survey, Trust A
Respondents Values
E2 E3 E4 Weight
R1 1 1 1 0.891
R2 1 1 0.824
R3 1 1 1.151
The denominators were calculated by multiplying each of the cells within the second dataset
by the weighting allocated to each respondent. This resulted in a figure for each question
that the respondent had answered (Figure B7). Again, the cells relating to the questions that
the respondent did not answer (or received a ’not applicable' score for) remained set to
missing.
21
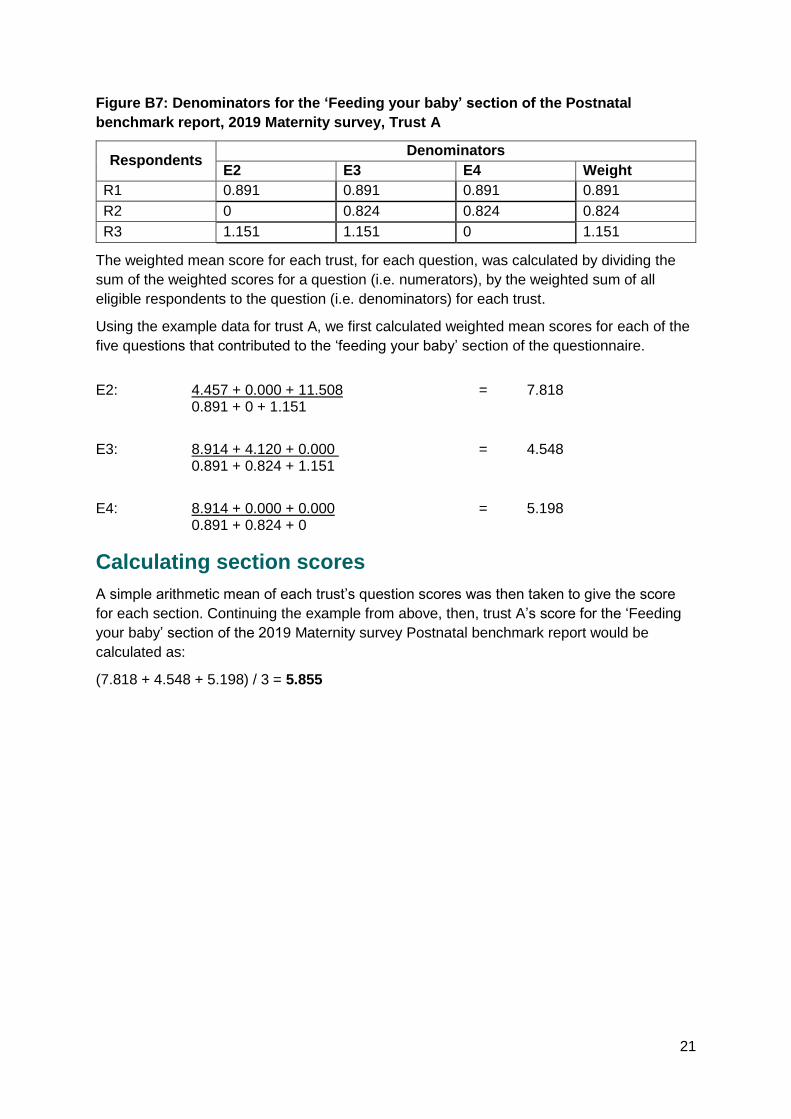
Figure B7: Denominators for the ‘Feeding your baby’ section of the Postnatal
benchmark report, 2019 Maternity survey, Trust A
Respondents Denominators
E2 E3 E4 Weight
R1 0.891 0.891 0.891 0.891
R2 0 0.824 0.824 0.824
R3 1.151 1.151 0 1.151
The weighted mean score for each trust, for each question, was calculated by dividing the
sum of the weighted scores for a question (i.e. numerators), by the weighted sum of all
eligible respondents to the question (i.e. denominators) for each trust.
Using the example data for trust A, we first calculated weighted mean scores for each of the
five questions that contributed to the ‘feeding your baby’ section of the questionnaire.
E2: 4.457 + 0.000 + 11.508 = 7.818 0.891 + 0 + 1.151
E3: 8.914 + 4.120 + 0.000 = 4.548
0.891 + 0.824 + 1.151
E4: 8.914 + 0.000 + 0.000 = 5.198
0.891 + 0.824 + 0
Calculating section scores
A simple arithmetic mean of each trust’s question scores was then taken to give the score
for each section. Continuing the example from above, then, trust A’s score for the ‘Feeding
your baby’ section of the 2019 Maternity survey Postnatal benchmark report would be
calculated as:
(7.818 + 4.548 + 5.198) / 3 = 5.855
22
Appendix C: Calculating the expected
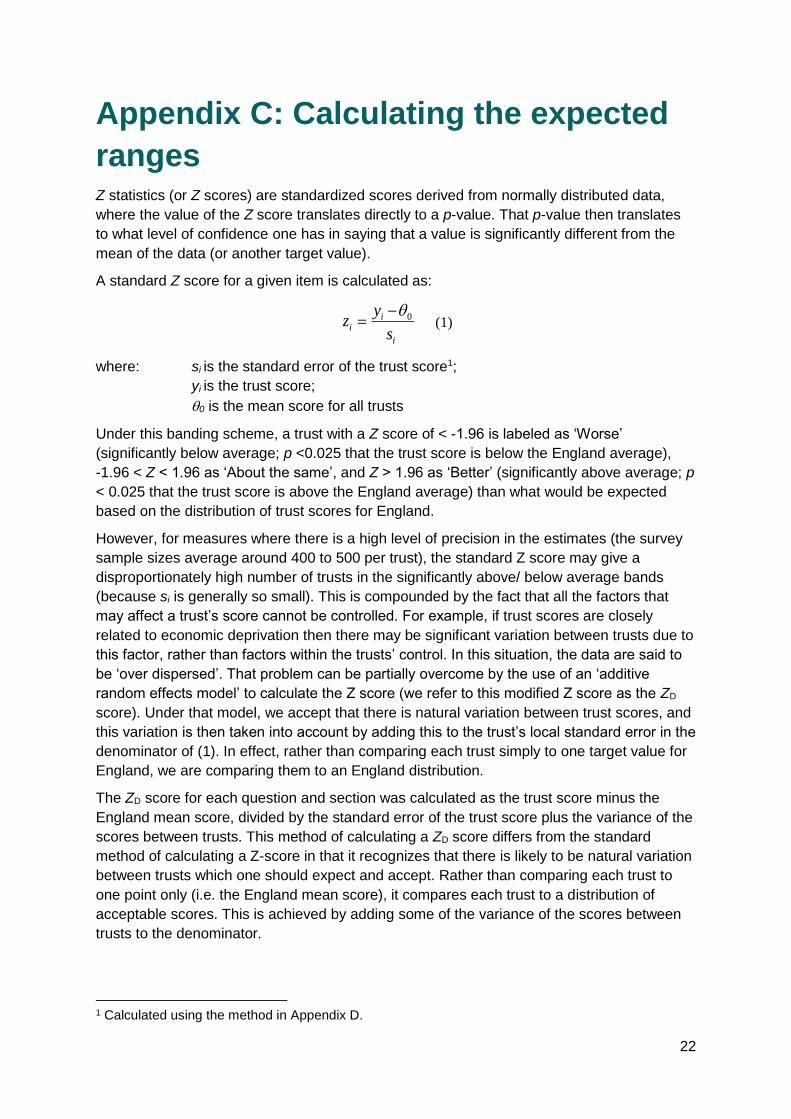
ranges Z statistics (or Z scores) are standardized scores derived from normally distributed data,
where the value of the Z score translates directly to a p-value. That p-value then translates
to what level of confidence one has in saying that a value is significantly different from the
mean of the data (or another target value).
A standard Z score for a given item is calculated as:
i
ii
s
yz 0−= (1)
where: si is the standard error of the trust score1;
yi is the trust score;
0 is the mean score for all trusts
Under this banding scheme, a trust with a Z score of < -1.96 is labeled as ‘Worse’
(significantly below average; p <0.025 that the trust score is below the England average),
-1.96 < Z < 1.96 as ‘About the same’, and Z > 1.96 as ‘Better’ (significantly above average; p
< 0.025 that the trust score is above the England average) than what would be expected
based on the distribution of trust scores for England.
However, for measures where there is a high level of precision in the estimates (the survey
sample sizes average around 400 to 500 per trust), the standard Z score may give a
disproportionately high number of trusts in the significantly above/ below average bands
(because si is generally so small). This is compounded by the fact that all the factors that
may affect a trust’s score cannot be controlled. For example, if trust scores are closely
related to economic deprivation then there may be significant variation between trusts due to
this factor, rather than factors within the trusts’ control. In this situation, the data are said to
be ‘over dispersed’. That problem can be partially overcome by the use of an ‘additive
random effects model’ to calculate the Z score (we refer to this modified Z score as the ZD
score). Under that model, we accept that there is natural variation between trust scores, and
this variation is then taken into account by adding this to the trust’s local standard error in the
denominator of (1). In effect, rather than comparing each trust simply to one target value for
England, we are comparing them to an England distribution.
The ZD score for each question and section was calculated as the trust score minus the
England mean score, divided by the standard error of the trust score plus the variance of the
scores between trusts. This method of calculating a ZD score differs from the standard
method of calculating a Z-score in that it recognizes that there is likely to be natural variation
between trusts which one should expect and accept. Rather than comparing each trust to
one point only (i.e. the England mean score), it compares each trust to a distribution of
acceptable scores. This is achieved by adding some of the variance of the scores between
trusts to the denominator.
1 Calculated using the method in Appendix D.
23
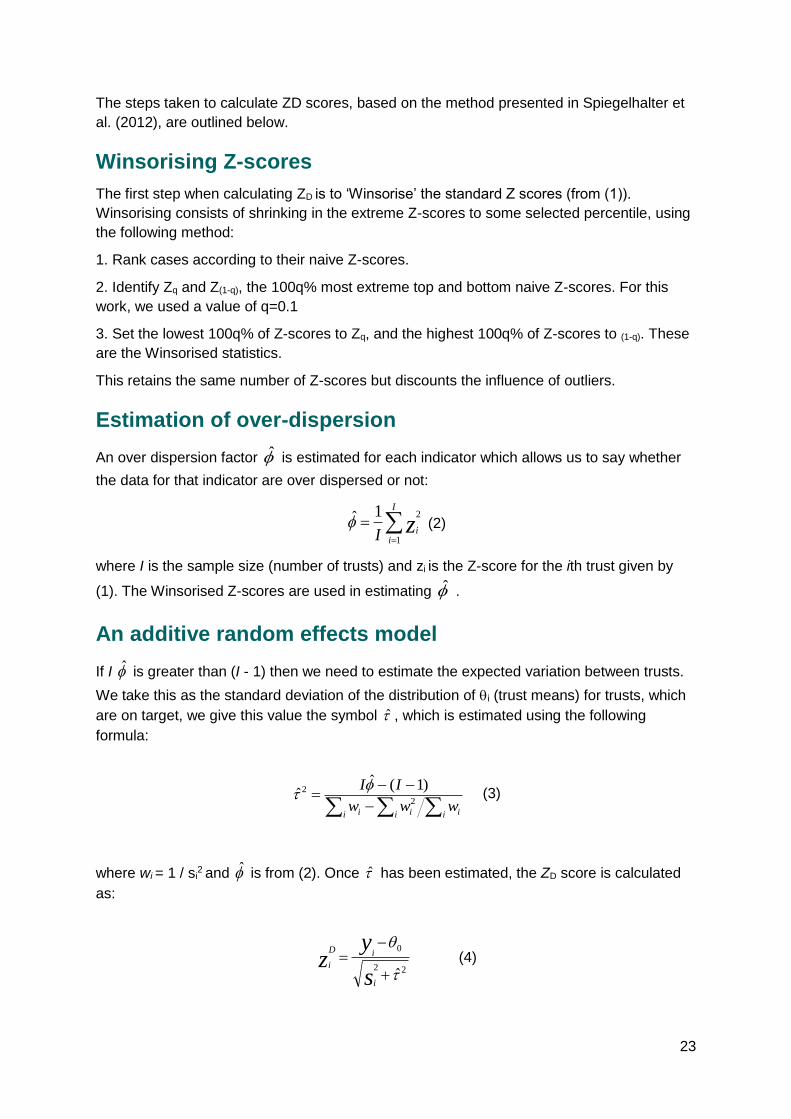
The steps taken to calculate ZD scores, based on the method presented in Spiegelhalter et
al. (2012), are outlined below.
Winsorising Z-scores
The first step when calculating ZD is to ‘Winsorise’ the standard Z scores (from (1)).
Winsorising consists of shrinking in the extreme Z-scores to some selected percentile, using
the following method:
1. Rank cases according to their naive Z-scores.
2. Identify Zq and Z(1-q), the 100q% most extreme top and bottom naive Z-scores. For this
work, we used a value of q=0.1
3. Set the lowest 100q% of Z-scores to Zq, and the highest 100q% of Z-scores to (1-q). These
are the Winsorised statistics.
This retains the same number of Z-scores but discounts the influence of outliers.
Estimation of over-dispersion
An over dispersion factor is estimated for each indicator which allows us to say whether
the data for that indicator are over dispersed or not:
=
=I
iizI 1
21 (2)
where I is the sample size (number of trusts) and zi is the Z-score for the ith trust given by
(1). The Winsorised Z-scores are used in estimating .
An additive random effects model
If I is greater than (I - 1) then we need to estimate the expected variation between trusts.
We take this as the standard deviation of the distribution of i (trust means) for trusts, which
are on target, we give this value the symbol , which is estimated using the following
formula:
−−−
=
i i ii ii www
II2
2 )1(ˆˆ
(3)
where wi = 1 / si2 and is from (2). Once has been estimated, the ZD score is calculated
as:
22
0
+
−=
s
yz
i
iD
i (4)
24
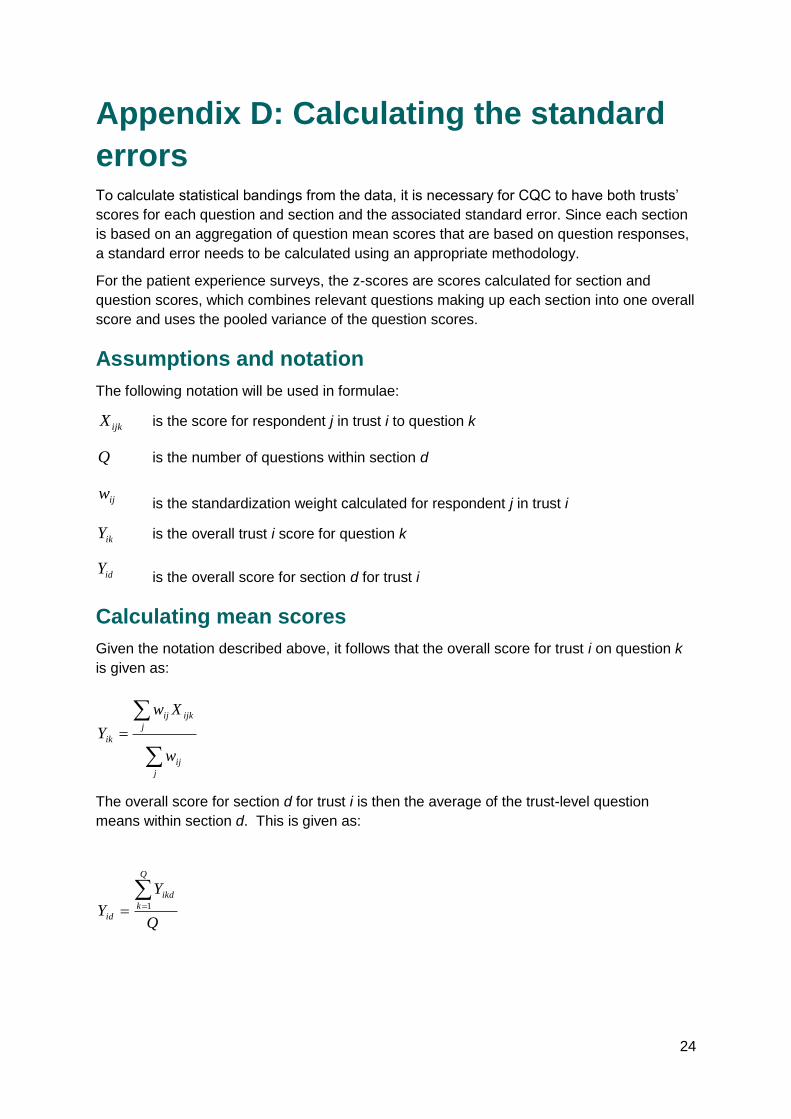
Appendix D: Calculating the standard
errors To calculate statistical bandings from the data, it is necessary for CQC to have both trusts’
scores for each question and section and the associated standard error. Since each section
is based on an aggregation of question mean scores that are based on question responses,
a standard error needs to be calculated using an appropriate methodology.
For the patient experience surveys, the z-scores are scores calculated for section and
question scores, which combines relevant questions making up each section into one overall
score and uses the pooled variance of the question scores.
Assumptions and notation
The following notation will be used in formulae:
ijkX is the score for respondent j in trust i to question k
Q is the number of questions within section d
is the standardization weight calculated for respondent j in trust i
ikY is the overall trust i score for question k
is the overall score for section d for trust i
Calculating mean scores
Given the notation described above, it follows that the overall score for trust i on question k
is given as:
=
j
ij
j
ijkij
ik
w
Xw
Y
The overall score for section d for trust i is then the average of the trust-level question
means within section d. This is given as:
Q
Y
Y
Q
k
ikd
id
== 1
ijw
idY
25
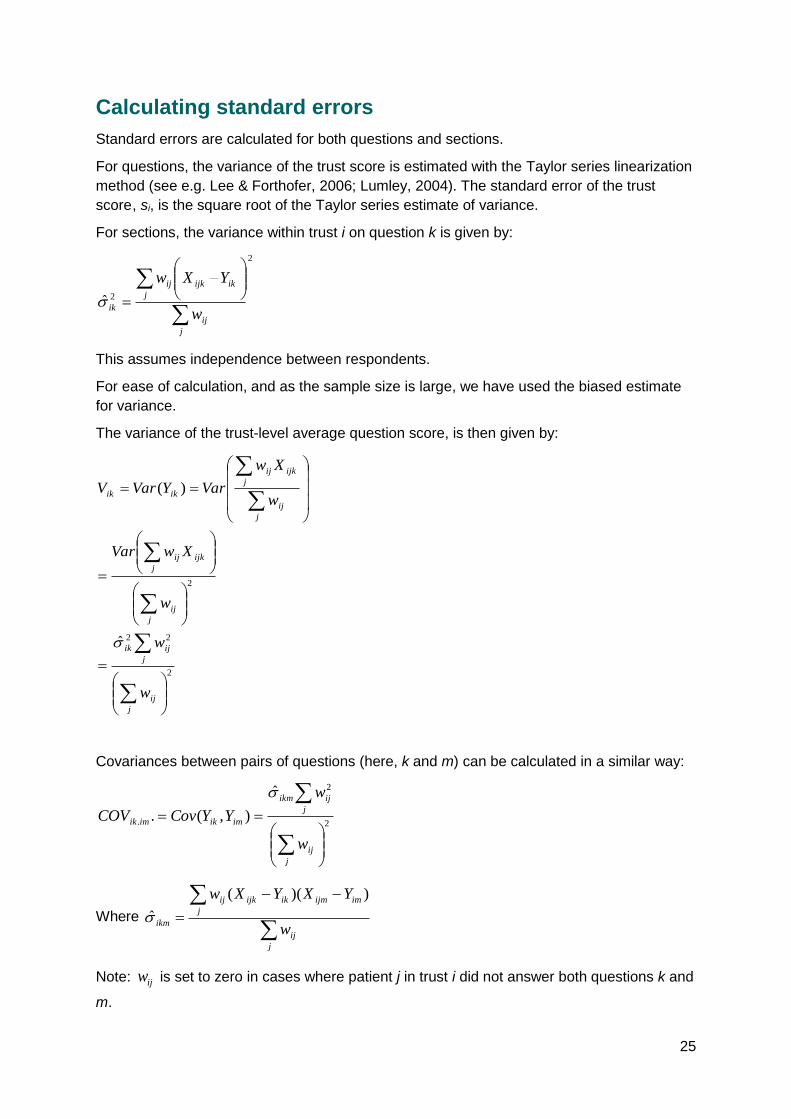
Calculating standard errors
Standard errors are calculated for both questions and sections.
For questions, the variance of the trust score is estimated with the Taylor series linearization
method (see e.g. Lee & Forthofer, 2006; Lumley, 2004). The standard error of the trust
scoreF, si, is the square root of the Taylor series estimate of variance.
For sections, the variance within trust i on question k is given by:
2
2ˆ
=
j
ij
j
ikijkij
ikw
YXw
This assumes independence between respondents.
For ease of calculation, and as the sample size is large, we have used the biased estimate
for variance.
The variance of the trust-level average question score, is then given by:
2
22
2
ˆ
)(
=
=
==
j
ij
j
ijik
j
ij
j
ijkij
j
ij
j
ijkij
ikik
w
w
w
XwVar
w
Xw
VarYVarV
Covariances between pairs of questions (here, k and m) can be calculated in a similar way:
2
2
.
ˆ
),(.
==
j
ij
j
ijikm
imikimik
w
w
YYCovCOV
Where
−−
=
j
ij
j
imijmikijkij
ikmw
YXYXw ))((
Note: ijw is set to zero in cases where patient j in trust i did not answer both questions k and
m.

26
The trust-level variance for the section score d for trust i is given by:
+== =
−
==
Q
k
k
m
imik
Q
k
ikidid COVVQ
YVarV2
1
1
,
12
21
)(
The standard error of the section score is then:
idid VSE =
This simple case can be extended to cover sections of greater length.
27
References Lee, E. S., & Forthofer, R. N. (2006). Analyzing complex survey data (2nd ed.). Thousand
Oaks, CA: Sage. http://dx.doi.org/10.4135/9781412983341
Lumley, T. (2004). Analysis of complex survey samples. Journal of Statistical Software, 9.
doi: 10.18637/jss.v009.i08
Spiegelhalter, D., Sherlaw-Johnson, C., Bardsley, M., Blunt, I., Wood, C., & Grigg, O. (2012).
Statistical methods for healthcare regulation: Rating, screening and surveillance. Journal of
the Royal Statistical Society (Series A), 175(1), 1-47.
Related Documents