Event Visualization with OpenStreetMap Data Interdisciplinary Project Bibek Shrestha ([email protected]) Supervised by Khatereh Polous ([email protected]) Contents Abstract 3 Introduction 3 Open Street Map Database Structure ......................... 3 Open Event Map Data .................................. 4 Open Event Map Visualization ............................. 5 Open Street Map Technology Stack 5 Server ........................................... 5 Operating System: Archlinux ........................... 5 The Rails Port (TRP) .................................. 5 Database Setup ................................... 7 Rendering Software ................................. 7 Events, Event Tags and EventEditor JOSM Plugin 8 Event Tags ........................................ 8 EventEditor JOSM Plugin ................................ 9 OpenEventMap Event Visualization 9 Cron, OSM and OpenEventMap table formats .................... 9 OpenEventMap web application ............................ 12 Search parameters ................................. 12 Conclusion 12 1

Event Visualization with OpenStreetMap Data, Interdisciplinary Project
Aug 31, 2014
Welcome message from author
This document is posted to help you gain knowledge. Please leave a comment to let me know what you think about it! Share it to your friends and learn new things together.
Transcript
Event Visualization with OpenStreetMap DataInterdisciplinary Project
Bibek Shrestha ([email protected])Supervised by
Khatereh Polous ([email protected])
Contents
Abstract 3
Introduction 3
Open Street Map Database Structure . . . . . . . . . . . . . . . . . . . . . . . . . 3
Open Event Map Data . . . . . . . . . . . . . . . . . . . . . . . . . . . . . . . . . . 4
Open Event Map Visualization . . . . . . . . . . . . . . . . . . . . . . . . . . . . . 5
Open Street Map Technology Stack 5
Server . . . . . . . . . . . . . . . . . . . . . . . . . . . . . . . . . . . . . . . . . . . 5
Operating System: Archlinux . . . . . . . . . . . . . . . . . . . . . . . . . . . 5
The Rails Port (TRP) . . . . . . . . . . . . . . . . . . . . . . . . . . . . . . . . . . 5
Database Setup . . . . . . . . . . . . . . . . . . . . . . . . . . . . . . . . . . . 7
Rendering Software . . . . . . . . . . . . . . . . . . . . . . . . . . . . . . . . . 7
Events, Event Tags and EventEditor JOSM Plugin 8
Event Tags . . . . . . . . . . . . . . . . . . . . . . . . . . . . . . . . . . . . . . . . 8
EventEditor JOSM Plugin . . . . . . . . . . . . . . . . . . . . . . . . . . . . . . . . 9
OpenEventMap Event Visualization 9
Cron, OSM and OpenEventMap table formats . . . . . . . . . . . . . . . . . . . . 9
OpenEventMap web application . . . . . . . . . . . . . . . . . . . . . . . . . . . . 12
Search parameters . . . . . . . . . . . . . . . . . . . . . . . . . . . . . . . . . 12
Conclusion 12
1
Future Improvements 14
Improving Search API . . . . . . . . . . . . . . . . . . . . . . . . . . . . . . . . . . 14
Data collection process . . . . . . . . . . . . . . . . . . . . . . . . . . . . . . . . . . 14
Appendix A : The Rails Port (TRP) Installation Notes 16
Introduction . . . . . . . . . . . . . . . . . . . . . . . . . . . . . . . . . . . . . . . . 16
Setting up Linux Server . . . . . . . . . . . . . . . . . . . . . . . . . . . . . . . . . 16
The Database . . . . . . . . . . . . . . . . . . . . . . . . . . . . . . . . . . . . . . . 17
Configuring Postgres . . . . . . . . . . . . . . . . . . . . . . . . . . . . . . . . 17
The RailsPort . . . . . . . . . . . . . . . . . . . . . . . . . . . . . . . . . . . . 17
Installation of tile server . . . . . . . . . . . . . . . . . . . . . . . . . . . . . . . . . 20
Setting up /etc/hosts file . . . . . . . . . . . . . . . . . . . . . . . . . . . . . 20
Setting up Mapnik and mod_tile . . . . . . . . . . . . . . . . . . . . . . . . . 20
Loading renderd during boot . . . . . . . . . . . . . . . . . . . . . . . . . . . 23
Synchronizing changes from ApiDB to MapnikDb . . . . . . . . . . . . . . . . 23
Appendix B : EventsEditor JOSM Plugin Installation Notes 26
Appendix C : OpenEventMap Installation Notes 29
2
Abstract
OpenStreetMap (OSM) is a collaborative volunteer based mapping platform. The largeamount of data is stored in a robust key (tags) value pair database. The database canstore any sets of key values in the form of strings. However entered data is monitored andmoderated by dedicated volunteers to prevent garbage input and vandalism. Current set oftags used by OSM are only spatial tags. In this project, the OSM database and technologyinfrastructure is copied and extended to explore the idea of temporal data collection. Eventsinformation are collected and entered into the database using special tags. The process issimplified using a self made plugin on top of JOSM editor.
A web based platform has been built named ‘OpenEventMap’ that extracts the data fromkey-value database of OSM, gives structure to the data by converting into another formatfor easy searching and finally renders it for visualization purposes.
The details of event based tag metadata, system architecture of the system and technicaldetails of entire system has been presented in this report.
Introduction
Our history is written through myriads of events happening all over the world. These eventsbring about wide array of changes from political, geographical, social, architecture to namea few. It is important to document these events precisely to facilitate further study andresearch. Currently, there is no platform that records events methodologically which includesevent description along with associated spatial and temporal information. A knowledgerepository that captures past and future events needs to be made.
Of different ways of building a knowledge repository, the Wikipedia model has come out asa voluntary, collaborative, transparent and accurate way of building large scale knowledgerepository. It has been replicated into creating maps in the form of Open Street Map(OSM). OSM has thousands of volunteers contributing location based data to build an onlineplatform for community based Maps. Anyone with a GPS device and an internet connectioncan easily start building maps of his locality. It is based entirely on voluntary effort and thiseffort has helped build a very high quality online global map.
Open Street Map Database Structure
OSM data structure is very simple. A piece of data (row in the database) consists of a pairof (key, value). Using this, for any point in the database, multiple data can be associated asthe point’s attributes.
When any kind of data is entered into the system, no checks are performed to restrict theinput by the system. So a user can enter any kind of data into the OSM database. This systemallows for all different kinds of data to be entered to accomodate different terminologies usedin different parts of the world. However it also opens the door for vandalism and wrong input.In order to prevent users from entering or misusing the platform, dedicated volunteers checkthe consistency of the database from time to time and either fix the database or punish theuser by deleting a user account or both.
3
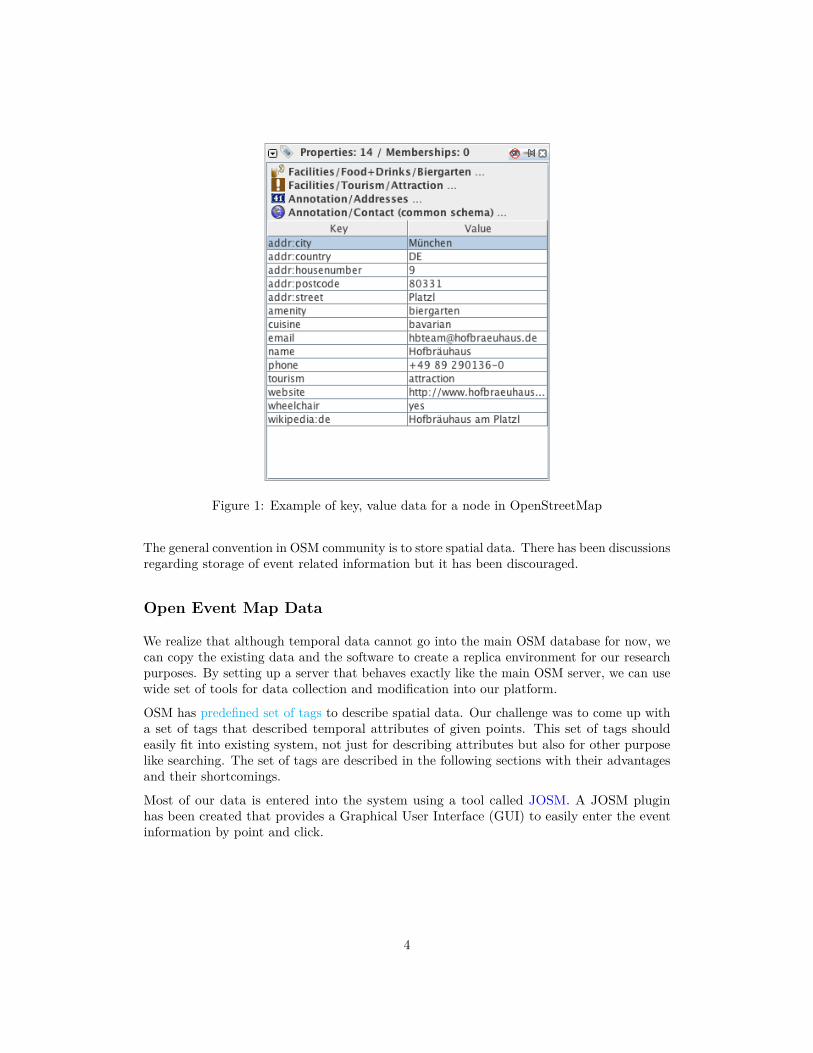
Figure 1: Example of key, value data for a node in OpenStreetMap
The general convention in OSM community is to store spatial data. There has been discussionsregarding storage of event related information but it has been discouraged.
Open Event Map Data
We realize that although temporal data cannot go into the main OSM database for now, wecan copy the existing data and the software to create a replica environment for our researchpurposes. By setting up a server that behaves exactly like the main OSM server, we can usewide set of tools for data collection and modification into our platform.
OSM has predefined set of tags to describe spatial data. Our challenge was to come up witha set of tags that described temporal attributes of given points. This set of tags shouldeasily fit into existing system, not just for describing attributes but also for other purposelike searching. The set of tags are described in the following sections with their advantagesand their shortcomings.
Most of our data is entered into the system using a tool called JOSM. A JOSM pluginhas been created that provides a Graphical User Interface (GUI) to easily enter the eventinformation by point and click.
4

Open Event Map Visualization
Events data are associated with existing nodes, ways or relations in the system. Nodes, Waysand Relations are the spatial data that represent buildings, trees, pools, roads, compounds,parks or any other physical elements that exist. By associating events to these, we associatetemporal data to spatial data. For visualization purpose, we extract stored temporal dataand it’s spatial coordinates and display it on a web based platform by placing colored markerson top of a map.
User can use the web platform to search for events based on different parameters like eventname, category, event dates and see color coded results based on different category.
Open Street Map Technology Stack
OpenStreetMap is powerd by a combination of Open Source softwares that can be downloadedfreely from the internet. The detail guide to setting up Open Street Map on a server isavailable at The Rails Port link. A brief description of different components including adiagram follows.
Server
Operating system: ArchlinuxRAM: 12 GBHarddisk Space: 500 GBDatabase: Postgres 9.2.4Webserver: Apache 2.2.24
Operating System: Archlinux
Archlinux has both advantages as well as disadvantages. It is a rolling distribution, sothe software packages are always up to date. The disadvantage is that constantly changingpackages might break required version of libraries. However, the main application The RailsPort runs on a virtualenv environment with specific version of ruby and rails gems.
Apache webserver is for serving three different applications. Passenger Phusion is used toserve The Rails Port based on Rails and Open Event Map based on python/django. mod_tileis used to render and serve tiles.
Postgres with PostGIS extension is used as our main database server.
The Rails Port (TRP)
TRP is the codebase for entire webfrontend of Open Street Map. This includes:
1. Map frontend for visualization.
5
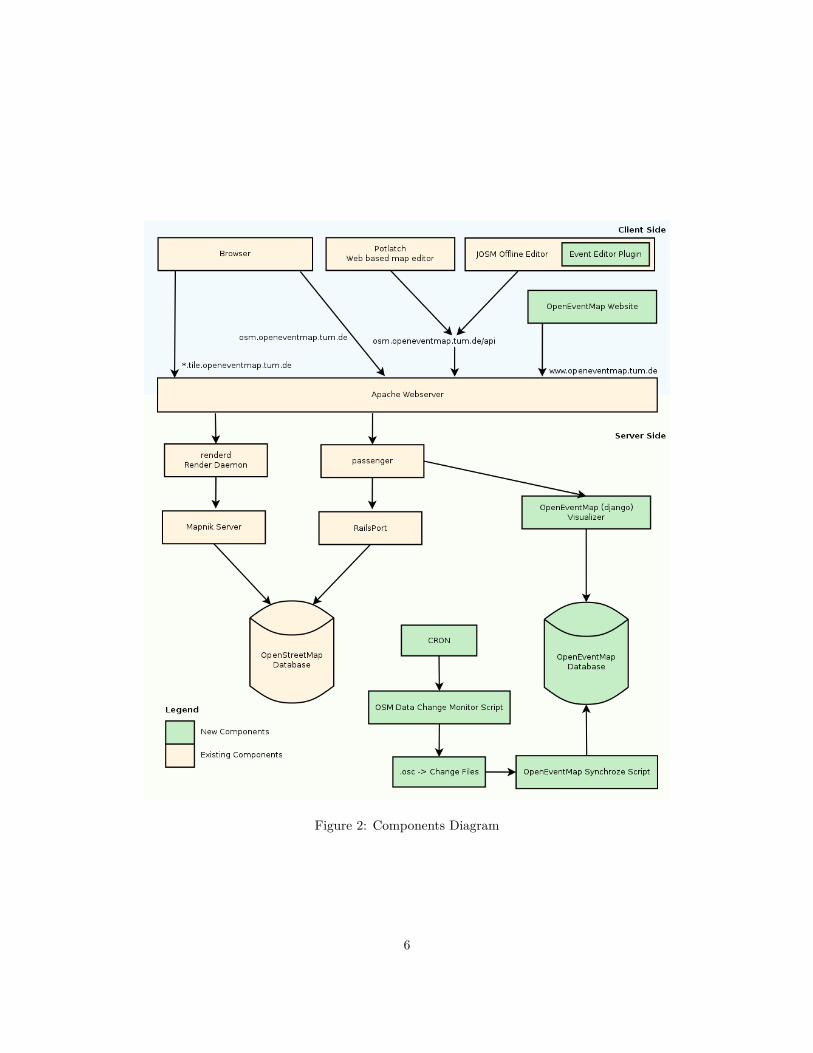
Figure 2: Components Diagram
6
2. User login and map editing using Potlatch 2 editor.3. API version 6 accessible via /api/ URL.
The installation of TRP can be accessed through http://osm.openeventmap.tum.de. Similarlythe API capabilities can be viewed from http://osm.openeventmap.tum.de/api/capabilities.
Source code for TRP can be downloaded easily from GitHub. It is a standard rails applicationthat connects to the Postgres database. A detail guide on installation of The Rails Port(TRP)is given in the Appendix A.
Database Setup
The complete OpenStreetMap database is available for download from OSM Planet. It canbe copied, distributed or adapted to different forms as long as the Open Data CommonsOpen Database License is agreed upon by the user. However, the complete databaseis 30GB large in size in a compressed format. It is estimated to be more than 100GBuncompressed. Such a large volume of data is not required in our case as we deal mostly inthe region around Bavaria, Germany.
Geofabrik provides map database files of smaller regions by dividing the main OSM databaseinto multiple regions. The Oberbayern mapfile is used in our case, which is 96MB whencompressed. We only work with 0.32% of total database size.
The data is imported into our Postgres database and connected with TRP.
Rendering Software
We have three subdomains to serve tiles in our website.
1. a.tile.openeventmap.tum.de/osm_tiles/x/y/z.png2. b.tile.openeventmap.tum.de/osm_tiles/x/y/z.png3. c.tile.openeventmap.tum.de/osm_tiles/x/y/z.png
Where x and y are square coordinates and z is the zoom level of the tile.
Tiles are served using mod_tile extension. It maps every request in above format to renderddaemon. The renderd daemon in turn checks if an existing tile is available in the cache. Iffound, it then checks if the tile needs to be regenerated due to changes in OSM data. Asa result, it returns either the tile in the cache or generates a new tile, saves the tile in thecache and serves it through apache.
renderd uses Mapnik as a tile server. Mapnik connects to the database, extract informationfor tile generation and then applies color styles on top of the data and generates the tiles.Mapnik can use different stylesheet to generate different types of maps. In our case, thedefault OSM stylesheet is used.
7
Events, Event Tags and EventEditor JOSM Plugin
In OSM, we have three basic types of elements: node, way and relation. A node is a singlepoint characterised by a unique pair of latitude and longitude values. A node can representany physical object that exist in the exact coordinate. A way is a set of nodes groupedtogether. A way can be used to represent a bigger larger area or a continuous path. Similarlya relation is a logical grouping of multiple ways and nodes to represent an advanced concept.Besides having spatial coordinate data, nodes, ways and relations have other informationincluding name, classification type and other varieties of properties in the form of tags.
Event Tags
An event is primarily associated with one of the nodes, ways or relations. This is done byassociating special event tags to the OSM elements which is described in detail below.
The primary tag to mark any element as event, we need to set the following tag:
event: yes
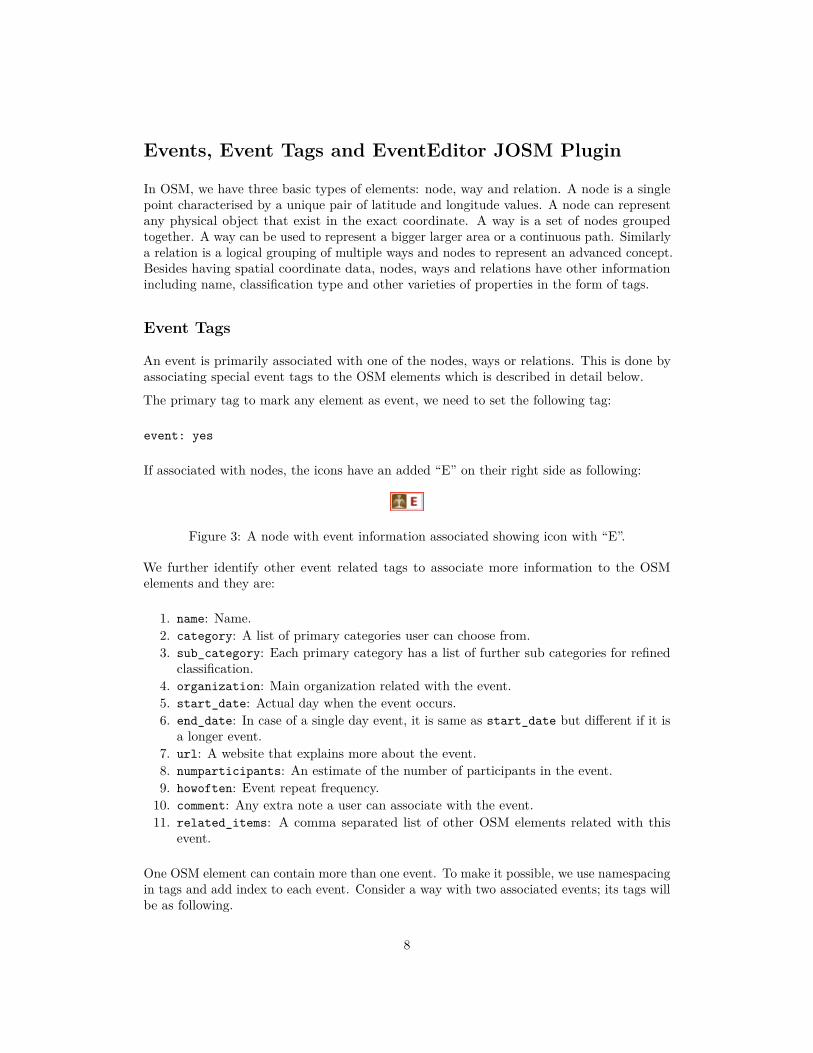
If associated with nodes, the icons have an added “E” on their right side as following:
Figure 3: A node with event information associated showing icon with “E”.
We further identify other event related tags to associate more information to the OSMelements and they are:
1. name: Name.2. category: A list of primary categories user can choose from.3. sub_category: Each primary category has a list of further sub categories for refined
classification.4. organization: Main organization related with the event.5. start_date: Actual day when the event occurs.6. end_date: In case of a single day event, it is same as start_date but different if it is
a longer event.7. url: A website that explains more about the event.8. numparticipants: An estimate of the number of participants in the event.9. howoften: Event repeat frequency.
10. comment: Any extra note a user can associate with the event.11. related_items: A comma separated list of other OSM elements related with this
event.
One OSM element can contain more than one event. To make it possible, we use namespacingin tags and add index to each event. Consider a way with two associated events; its tags willbe as following.
8
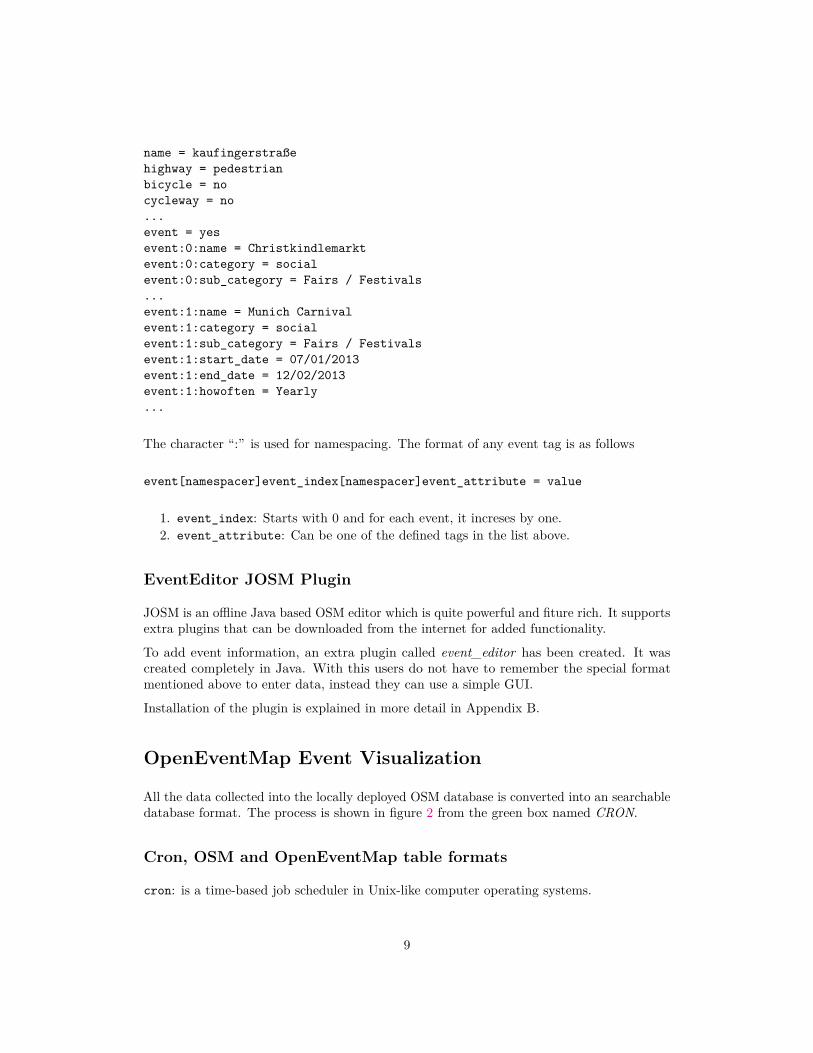
name = kaufingerstraßehighway = pedestrianbicycle = nocycleway = no...event = yesevent:0:name = Christkindlemarktevent:0:category = socialevent:0:sub_category = Fairs / Festivals...event:1:name = Munich Carnivalevent:1:category = socialevent:1:sub_category = Fairs / Festivalsevent:1:start_date = 07/01/2013event:1:end_date = 12/02/2013event:1:howoften = Yearly...
The character “:” is used for namespacing. The format of any event tag is as follows
event[namespacer]event_index[namespacer]event_attribute = value
1. event_index: Starts with 0 and for each event, it increses by one.2. event_attribute: Can be one of the defined tags in the list above.
EventEditor JOSM Plugin
JOSM is an offline Java based OSM editor which is quite powerful and fiture rich. It supportsextra plugins that can be downloaded from the internet for added functionality.
To add event information, an extra plugin called event_editor has been created. It wascreated completely in Java. With this users do not have to remember the special formatmentioned above to enter data, instead they can use a simple GUI.
Installation of the plugin is explained in more detail in Appendix B.
OpenEventMap Event Visualization
All the data collected into the locally deployed OSM database is converted into an searchabledatabase format. The process is shown in figure 2 from the green box named CRON.
Cron, OSM and OpenEventMap table formats
cron: is a time-based job scheduler in Unix-like computer operating systems.
9

Figure 4: EventEditor Starting Screenshot. 1) Option to mark current selected OSM Entityto an event. 2) Button to create a new Event for the event entity. 3) GUI to enter moredetail tags for the event.
10
The cron configuration runs a special script in the server every minute. This script generatesosmchange files in .osc format which contains addition, modification or deletion of any OSMElement within the last minute.
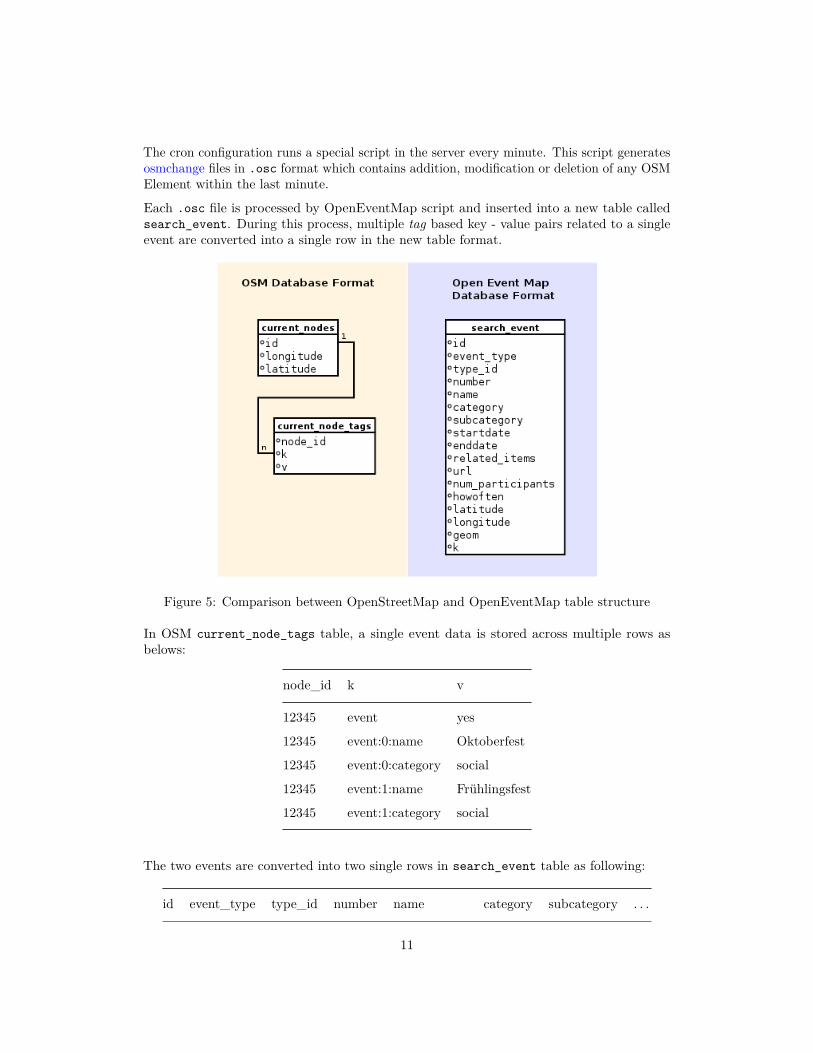
Each .osc file is processed by OpenEventMap script and inserted into a new table calledsearch_event. During this process, multiple tag based key - value pairs related to a singleevent are converted into a single row in the new table format.
Figure 5: Comparison between OpenStreetMap and OpenEventMap table structure
In OSM current_node_tags table, a single event data is stored across multiple rows asbelows:
node_id k v
12345 event yes
12345 event:0:name Oktoberfest
12345 event:0:category social
12345 event:1:name Frühlingsfest
12345 event:1:category social
The two events are converted into two single rows in search_event table as following:
id event_type type_id number name category subcategory . . .
11
1 node 12345 0 Oktoberfest social . . .
2 node 12345 1 Frühlingsfest social . . .
The search_event table format makes it easier to do complex queries searching more thanone field at any time. For example the following query is now possible:
SELECT * FROM search_event WHERE name LIKE %val%AND category=’social’AND ...
The query above would be complicated to execute on current_node_tags table.
OpenEventMap web application
The web application allows any user to search event database.
Search parameters
There are four parameters to filter the search results by: event name does a partial matchingwith existing event names, category parameter searches for exact match in category andsubcategory fields, start date and end date creates a date range and returns all the eventsthat fall under given range. Date filter also takes care of repeating events. For example, anevent that occurred in March 5, 2012 and repeats yearly will be found when searching forevents between March 1, 2013 and March 10, 2013.
If search is performed with non of the parameters entered, it returns all matching eventswithin given map region.
Search results are color coded. Most of the popular event categories are assigned differentcolors which are shown on the textual search results section as well as a colorful pointer onthe map. As the pointer is clicked, all events belonging to the place is shown in a popup.
Event data can be exported along with OSM elements like node, ways and relations in OSMformat using the Export link in the Search Results Section. It redirects the user to the OSMwebpage.
There is also a feature to first search any location by name. This is achieved by OSM’sNominatim api. For given location name, a search is performed around Bayern area and theresults are listed. When clicked on the result, the map gets zoomed in.
Conclusion
All parts of the system developed have been on top of opensource technologies and opendata. Open technologies provide easily accessible platforms. In this case, OpenStreetMap
12
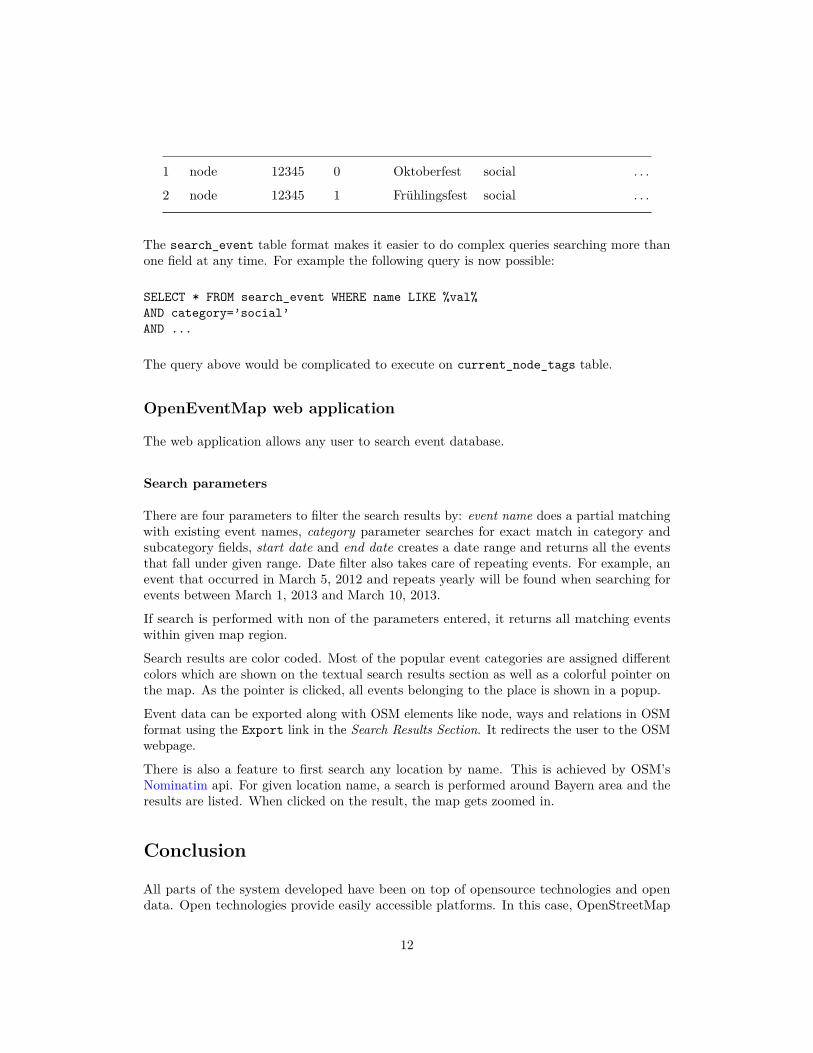
Figure 6: Web application screenshot. 1) Choice between Nominatim search and Eventsearch. 2) Fields to enter search parameters. 3) Search results grouped into categories. 4)Visualization of OSM elements and associated events.
13

ecosystem provided us with ready made data, software suite from backend to frontend likeTheRailsPort, mod_tile, Mapnik, JOSM etc. Building complete infrastructure by self wouldtake extremely large amount of time.
We are also grateful to the volunteers spread all over the internet for collecting the data,submitting it online in OSM and allowing other individuals to use them. The philosophymotivates further more people to contribute and innovate. In our case, we were able toimagine, plan, implement and finally visualize chronological data like events on top ofOpenStreetMap.
Not everything was easy. Documentation of most of the components were spread all overOSM wiki. Functionalities of the software components was unclear and they had to beunderstood and pieced together.
In conclusion, the following tasks have been successfully carried out:
1. The mapserver has been installed as requested.2. A special purpose extension EventEditor has been created to help users enter events
data.3. A webapp for visualizing the user contributed data has been created and setup.
Our original goals for the project have been successfully fulfilled.
Future Improvements
We realize that the current work is the base for further improvements. This is a beginningfor integrating temporal data into OSM. Looking ahead, there are more that can be done ontop of current work and these have been listed below.
Improving Search API
OpenEventMap is powered by a search API that takes name, category and startdate -enddate as search parameters. The results are returned as JOSN objects.
First improvement can be increasing the search parameters to facilitate advanced searchusing all the attributes we have collected.
Second improvement on search could be combining event names with locations. With this,a user should be able to search for “Oktoberfest in Munich” and see the result. The earchterm contains both event name and location information.
Data collection process
Event data entry is a painful process right now. The normal process is to identify event,then search the related items on OSM and then attach event attributes to those items.
When large and existing datasets have to be integrated, this is not trivial.
14

The solution could be a probabilistic model that identifies location based on techniques likegeocode to identify OSM entities. An extra layer of API can be made to quickly add andedit one or more events in a single entity.
With this, softwares could be developed that would automatically save data from existingdata sources to OSM.
15

Appendix A : The Rails Port (TRP) Installation Notes
Most of the installation instructions are explained in detail here. The following instructionshave been explained for Archlinux with necessary modifications.
Introduction
Inorder to create our local copy of the openstreetmap database and visualize it like it is inmain OSM website, we setup a linux server and setup the following components on it.
1. Postgre Database for our data2. renderd, a tool that generates tiles from the database3. MapServer, that serves generated tiles.4. RailsPort, the main application that powers OSM website with features of user login,
view, zoom, export tile and edit the data using potlatch editor.
Installation instruction are as follows:
Setting up Linux Server
Packages Installed:
1. postgis2. mapnik3. apache4. boost5. python26. ttf-dejavu7. subversion8. libxslt9. imagemagick
10. unzip11. yaourt (aur)12. osm2pgsql-svn (aur)13. osmosis (aur)14. ruby1.9
We need crontab to run during startup, so run the following command to enable cronieservice.
$ systemctl enable cronie$ systemctl start cronie
16
The Database
The main OpenStreetMap database is run on PostgreSQL database. PostgreSQL hasnumerous features that allow geometry types. However OpenStreetMap does not used thoseand have its own data primitives.
PostGIS is an extension to PostgreSQL database that provides spatial objects allowingstorage and query of information about location and mapping. The main database does notuse PostGIS features but is used by mapnik, the tile rendering software.
There are two main databases used in our approach:
1. ApiDB - This backs rails port, allows a read-write api to edit the database, thuscalled ApiDB. JOSM and other editors make modifications in this database using theapi. The data is imported from planet dump files, in our case data inside oberbayern-latest.osm.bz2 was imported using the tool Osmosis.
2. Mapnik Db Format - This is used by mapnik to generate the tiles. Data is importedfrom oberbayern-latest.osm.bz2 using osm2pgsql tool.
The database for ApiDB schema is named as myosmdb and database for mapnik schema isnamed as mymapnikdb.
Configuring Postgres
The step by step process to install PostgreSQL and PostGIS extension is explained below.Postgres requires initialization. We run the following commands as root on the server.
$ mkdir /var/lib/postgres/data$ su - postgres -c "initdb --locale en_US.UTF-8 -D ’/var/lib/postgres/data’"$ systemctl enable postgresql.service$ systemctl start postgresql.service
A user is created in the server and a database is created under this user. The followingcommands were ran under postgres username
$ sudo -u postgres createuser myosmuser -s -P$ sudo -u postgres createdb -E UTF8 -O myosmuser myosmdb
As seen on the commands above, the username/password combination is myos-muser/myosmuser and the database name is myosmdb.
The RailsPort
OSM front end website is based on the Ruby on Rails framework. The source code for it canbe downloaded from git clone https://github.com/openstreetmap/openstreetmap-website.git
17
$ sudo mkdir /opt/myosm$ sudo chown bibek /opt/myosm
Change bibek to the username you want.
$ cd /opt/myosm$ git clone https://github.com/openstreetmap/openstreetmap-website.git
Copy proper application.yml and database.yml.
$ cd /opt/myosm$ cp config/example.application.yml config/application.yml$ cp config/example.database.yml config/database.yml
Change the development section of config/database.yml file
development:adapter: postgresqldatabase: myosmdbusername: myosmuserpassword: myosmuserhost: localhostencoding: utf8
Quadtile functions need to be installed on the server. For this
$ cd /opt/myosm/openstreetmap-website/db/functions$ make libpgosm.so
And the following commands need to be executed in postgresql
$ psql -U myosmuser -d myosmdb -c "CREATE EXTENSION btree_gist;"$ psql -Umyosmuser -d myosmdb -c "CREATE FUNCTION \
maptile_for_point(int8, int8, int4) RETURNS \int4 AS ’/opt/myosm/openstreetmap-website/db/functions/libpgosm’, \’maptile_for_point’ LANGUAGE C STRICT;"
$ psql -Umyosmuser -d myosmdb -c "CREATE FUNCTION \tile_for_point(int4, int4) RETURNS \int8 AS ’/opt/myosm/openstreetmap-website/db/functions/libpgosm’, \’tile_for_point’ LANGUAGE C STRICT;"
$ psql -Umyosmuser -d myosmdb -c "CREATE FUNCTION xid_to_int4(xid) \RETURNS int4 AS ’/opt/myosm/openstreetmap-website/db/functions/libpgosm’, \’xid_to_int4’ LANGUAGE C IMMUTABLE STRICT;"
Also ruby and rails are installed using ruby version manager (rvm)
18
$ \curl -L https://get.rvm.io | bash -s stable --autolibs=enabled --ruby=1.9.3$ gem install rails$ cd /opt/myosm/openstreetmap-website$ bundle install
Setup necessary database tables in postgresql. We use the production configuration here.
$ rake db:migrate
To make sure everything is setup properly, run
$ rake test
We can now populate the date for Munich.
$ cd /opt/myosm$ wget http://download.geofabrik.de/europe/germany/bayern/oberbayern-latest.osm.bz2$ osmosis --read-xml-0.6 file="oberbayern-latest.osm.bz2" --write-apidb-0.6 \
populateCurrentTables=yes host="localhost" database="myosmdb" \user="myosmuser" password="myosmuser" validateSchemaVersion=no
In the psql terminal the following was executed
$ echo "select setval(’acls_id_seq’, (select max(id) from acls));select setval(’changesets_id_seq’, (select max(id) from changesets));select setval(’client_applicaations_id_seq’, (select max(id) from client_applications));select setval(’countries_id_seq’, (select max(id) from countries));select setval(’current_nodes_id_seq’, (select max(id) from current_nodes));select setval(’current_relations_id_seq’, (select max(id) from current_relations));select setval(’current_ways_id_seq’, (select max(id) from current_ways));select setval(’diary_comments_id_seq’, (select max(id) from diary_comments));select setval(’diary_entries_id_seq’, (select max(id) from diary_entries));select setval(’friends_id_seq’, (select max(id) from friends));select setval(’gpx_file_tags_id_seq’, (select max(id) from gpx_file_tags));select setval(’gpx_files_id_seq’, (select max(id) from gpx_files));select setval(’messages_id_seq’, (select max(id) from messages));select setval(’oauth_nonces_id_seq’, (select max(id) from oauth_nonces));select setval(’oauth_tokens_id_seq’, (select max(id) from oauth_tokens));select setval(’redactions_id_seq’, (select max(id) from redactions));select setval(’user_blocks_id_seq’, (select max(id) from user_blocks));select setval(’user_roles_id_seq’, (select max(id) from user_roles));select setval(’user_tokens_id_seq’, (select max(id) from user_tokens));select setval(’users_id_seq’, (select max(id) from users));" | psql -d myosmdb -U myosmuser -w -e -f -
19
Installation of tile server
A tile server serves the images that are displayed as the map. Each tile is 256pixels by256pixels in size. When OSM Website is opened, the large map image is formed by placethese smaller tiles together.
A tile has three properties
• z: The zoom level. 0 being the least zoomed and 18 being the most zoomed.• x,y: On each zoom level, x and y are the coordinates of a given tile.
A sample Url from OSM Website looks like http://a.tile.openstreetmap.org/0/0/0.png whichshows the whole world’s map.
We will set up our own tile server which can be accessed from http://a.tile.openeventmap.tum.de/osm_tiles/z/x/y.png or http://b.tile.openeventmap.tum.de/osm_tiles/z/x/y.png orhttp://c.tile.openeventmap.tum.de/osm_tiles/z/x/y.png.
Setting up /etc/hosts file
As root, add the following line at the bottom of the /etc/hosts file.
127.0.0.1 a.tile.openeventmap.tum.de b.tile.openeventmap.tum.de c.tile.openeventmap.tum.de
Once the tiles load, the configuration for our rails port needs to be pointed to our new tileservers. Edit /opt/myosm/openstreetmap-website/vendor/assets/leaflet/leaflet.osm.js andreplace
http://{s}.tile.openstreetmap.org/{z}/{x}/{y}.png
with
http://{s}.tile.openeventmap.tum.de/osm_tiles/{z}/{x}/{y}.png
Setting up Mapnik and mod_tile
Generating and serving of tiles includes three pieces of software to work to-gether. First, apache and mod_tile needs to be configured to receive requests inhttp://{a,b,c}.tile.openeventmap.tum.de/osm_tiles/z/x/y.png format. Mod_Tile forwardsthe request to renderd and renderd checks if a valid tile is in it’s cache. If found, it servesthe tile and if not found it asks Mapnik to generate the tile which is then served.
We will look into how to install these three pieces in the following section.
More detail information for installing mod_tile can be found in Mod_tile
Here are the commands executed.
20
$ cd /opt/myosm$ git clone https://github.com/openstreetmap/mod_tile$ cd mod_tile$ ./autogen.sh$ ./configure --with-apxs=/usr/sbin/apxs$ make$ sudo make install$ sudo make install-mod_tile$ sudo ldconfig
This will create the file /usr/lib/httpd/modules/mod_tile.so
$ cd /opt/myosm$ git clone git://github.com/openstreetmap/mapnik-stylesheets.git$ cd mapnik-stylesheets$ ./get-coastlines.sh$ cd world_boundaries/$ ln -s ne_110m_admin_0_boundary_lines_land.shp 110m_admin_0_boundary_lines_land.shp$ ln -s ne_110m_admin_0_boundary_lines_land.dbf 110m_admin_0_boundary_lines_land.dbf$ cd ..$ /generate_xml.py --host localhost --dbname mymapnikdb --symbols \
./symbols --world_boundaries world_boundaries --port 5432 \--password myosmuser --user myosmuser
This will generate a file osm.xml which we shall use later for renderd.
Mapnik requires a PostGIS database. PostGIS provides spatial objects for the PostgreSQLdatabase allowing storage and query of information about location and mapping.
In the following section we create a database for mapnik, enable PostGIS and then load thedata in it.
$ mkdir /opt/myosm/postgis$ cd /opt/myosm/postgis$ createdb -U postgres -E UTF8 -O myosmuser mymapnikdb$ psql -U postgres -d mymapnikdb -f /usr/share/postgresql/contrib/postgis-2.0/postgis.sql$ wget https://raw.github.com/openstreetmap/osm2pgsql/master/900913.sql -O 900913.sql$ psql -U postgres -d mymapnikdb -f ./900913.sql$ osm2pgsql -U myosmuser -s -d mymapnikdb --slim oberbayern-latest.osm
We now configure apache so that mod_tile is configured to a special virtual host.
Uncomment the line from by removing the # at the start of the line in the file/etc/httpd/conf/httpd.conf
Include conf/extra/httpd-vhosts.conf
Then add the following to the bottom of /etc/httpd/conf/extra/httpd-vhosts.conf. Originalsource can be found here.
21
LoadModule tile_module modules/mod_tile.so<VirtualHost *:80>
ServerName tile.openeventmap.tum.deServerAlias a.tile.openeventmap.tum.de b.tile.openeventmap.tum.de c.tile.openeventmap.tum.de d.tile.openeventmap.tum.deDocumentRoot /var/www/html
LoadTileConfigFile /etc/renderd.confModTileRequestTimeout 3
ModTileMissingRequestTimeout 10
ModTileMaxLoadOld 2ModTileMaxLoadMissing 5ModTileRenderdSocketName /var/run/renderd.sockModTileCacheDurationMax 604800ModTileCacheDurationDirty 900ModTileCacheDurationMinimum 10800ModTileCacheDurationMediumZoom 13 86400ModTileCacheDurationLowZoom 9 518400ModTileCacheLastModifiedFactor 0.20ModTileEnableTileThrottling OffModTileThrottlingTiles 10000 1ModTileThrottlingRenders 128 0.2LogLevel debug
</VirtualHost>
Create a new file /etc/renderd.conf and add the following. Note this was modified by editing/opt/myosm/mod_tile/renderd.conf.
[renderd]socketname=/var/run/renderd.socknum_threads=4tile_dir=/var/lib/mod_tilestats_file=/var/run/renderd.stats
[mapnik]plugins_dir=/usr/lib64/mapnik/inputfont_dir=/usr/lib64/mapnik/fontsfont_dir_recurse=1
[default]URI=/osm_tiles/XML=/opt/myosm/mapnik-stylesheets/osm.xmlHOST=localhost
Start apache and renderd
22

$ sudo systemctl start httpd.service$ sudo /opt/myosm/mod_tile/renderd
To see if tiles are working, one can try loading the url http://a.tile.openeventmap.tum.de/osm_tiles/0/0/0.png. A successful setup with load the world map like this.
Figure 7: 0th level tile
Loading renderd during boot
Whenever there is a server reboot, renderd daemon does not start automatically. Thus, itneeds to be made sure that renderd is running all the time by logging in to the server.
Synchronizing changes from ApiDB to MapnikDb
Any write modifications to the data happens in ApiDB. These changes need to be migratedto the tiles as well, and as such we setup a synchronization mechanism between ApiDB andMapnikDB.
The synchronization involes three parts.
1. Extract changes from ApiDB in regular intervals.2. Migrate those changes to MapnikDB.3. Remove the respective tiles from cache so fresh tiles are generated.
23
Extract changes from ApiDB in regular intervals Perform the following as root
$ sudo -u $USER mkdir -p /opt/myosm/apidb2mapnikdb/replicate$ cd /opt/myosm/apidb2mapnikdb$ sudo -u $USER osmosis --replicate-apidb user=myosmuser database=myosmdb \
validateSchemaVersion=no --write-replication workingDirectory=replicate
This will create couple of files inside the replicate folder. At the time of first execution, it savesthe current state of ApiDb in a state.txt file. As the third command is executed repeatedly,osm change files (.osc) files are generated and the contents of state.txt file updated.
$ tree replicate/replicate/’-- 000
’-- 000’-- 000.state.txt
’-- replicate.lock’-- state.txt
osmosis --replicate-apidb user=myosmuser database=myosmdb validateSchemaVersion=no \--write-replication workingDirectory=replicate
tree replicate/replicate/’-- 000
’-- 000’-- 000.state.txt’-- 001.osc.gz’-- 001.state.txt
’-- replicate.lock’-- state.txt
As you can see, new files have been added as the command is executed each time.000/000/001.osc.gz file is our required change file. We take the changes from .osc.gz filesand pass it to mymapnik db. The process of migration is done through a minte-wise runningcronjob.
Save the following as a script in /opt/myosm/apidb2mapnikdb/update.sh
osmosis --replicate-apidb user=myosmuser database=myosmdb validateSchemaVersion=no \--write-replication workingDirectory=data
a=‘grep ’sequenceNumber’ replicate/state.txt | awk -F"=" {’print $2’}‘a=$(printf %09d $a)filename=replicate/${a:0:3}/${a:3:3}/${a:6:3}.osc.gzecho $filenamerm expire.listosm2pgsql -U myosmuser -s -d mymapnikdb --append $filename -e15 -o expire.listcat expire.list | /usr/local/bin/render_expired --min-zoom=10 --touch-from=10
24

Also, make the update.sh file executable
$ chmod +x /opt/myosm/apidb2mapnikdb/update.sh
The script takes the last generated changefile (.osc.gz file) and uses osm2pgsql to updatemymapnikdb. The output of the command generates a list of tiles that needs to be updatedwhich is saved in expire.list. The list is then fed to render_expired so old files are deleted.
Add the following in the crontab using crontab -l as root
* * * * * (cd /opt/myosm/apidb2mapnikdb/ && ./update.sh &>> file.log)
25
Appendix B : EventsEditor JOSM Plugin InstallationNotes
JOSM can be downloaded freely from http://josm.openstreetmap.de/wiki/Download. Therecommended way is to download the jnlp file as it updates itself automatically everytime anew version comes out. After http://josm.openstreetmap.de/download/josm.jnlp has beendownloaded, double clicking on josm.jnlp would start JOSM editor.
There are two parts to the plugin.
1. The event_editor.jar plugin source code.2. The stylesheet files elemstyles.xml and event_editor.mapcss.
event_editor.jar installation instructions are available at JOSM manual plugin installationpage. Once the plugin is installed and enabled, the styles need to be installed.
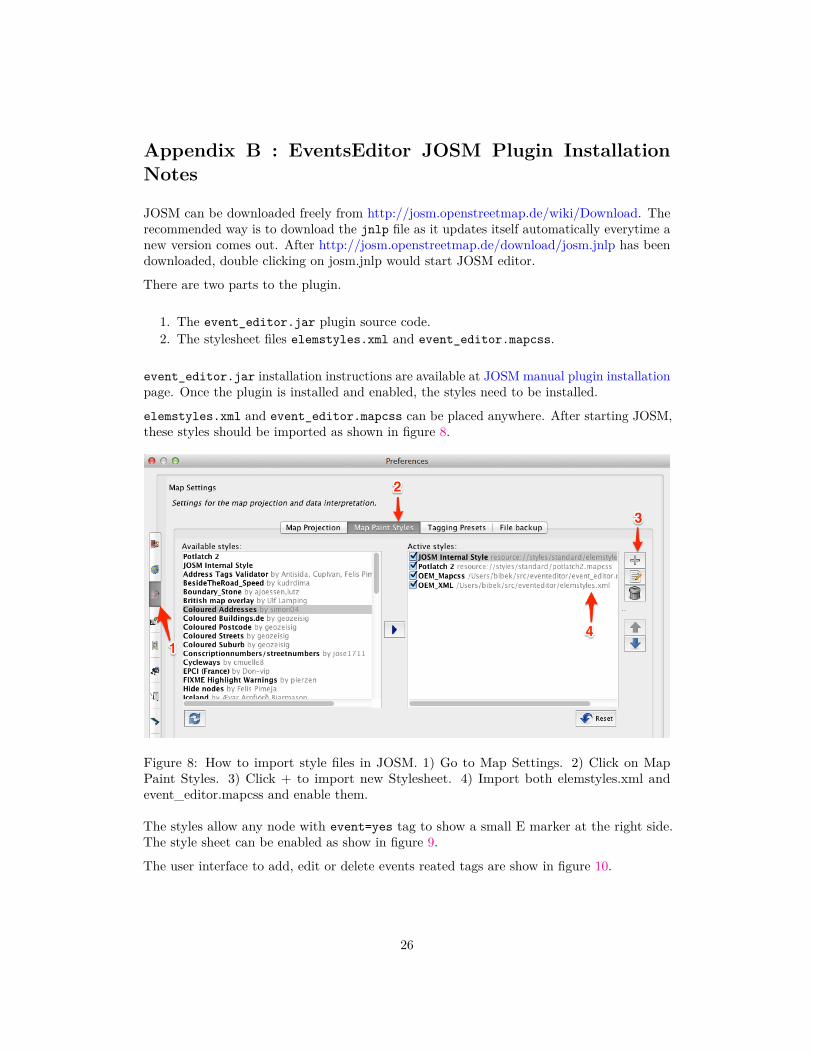
elemstyles.xml and event_editor.mapcss can be placed anywhere. After starting JOSM,these styles should be imported as shown in figure 8.
Figure 8: How to import style files in JOSM. 1) Go to Map Settings. 2) Click on MapPaint Styles. 3) Click + to import new Stylesheet. 4) Import both elemstyles.xml andevent_editor.mapcss and enable them.
The styles allow any node with event=yes tag to show a small E marker at the right side.The style sheet can be enabled as show in figure 9.
The user interface to add, edit or delete events reated tags are show in figure 10.
26
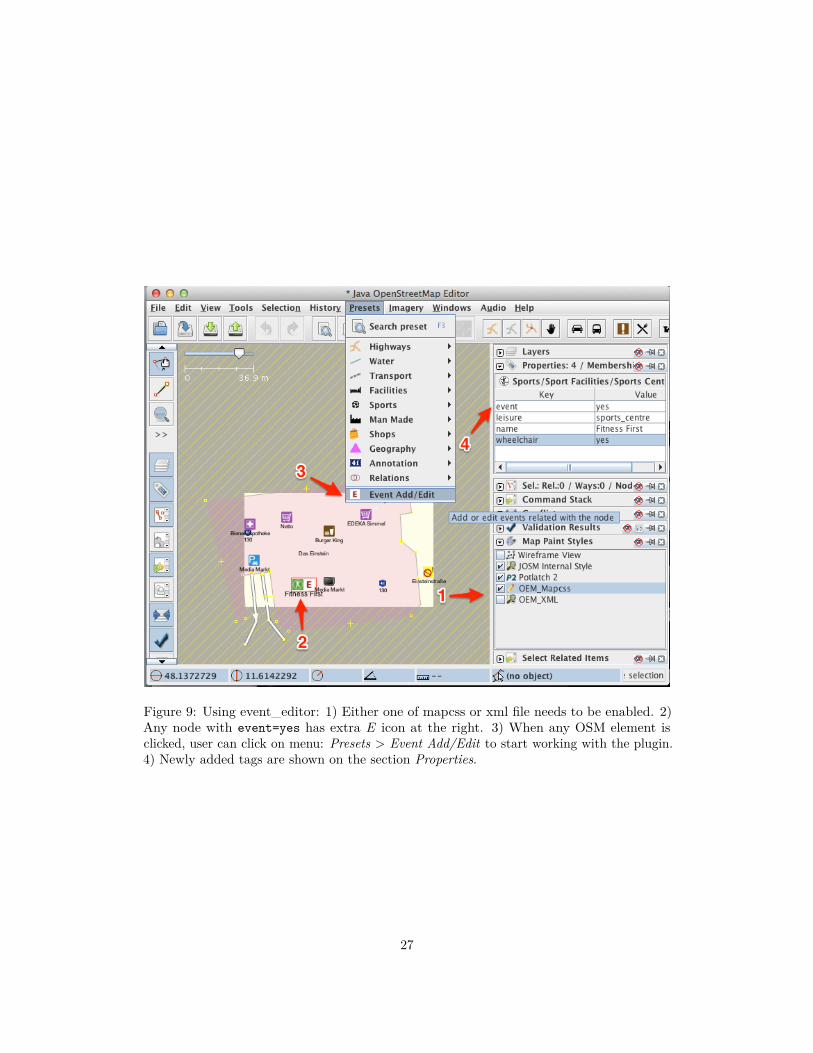
Figure 9: Using event_editor: 1) Either one of mapcss or xml file needs to be enabled. 2)Any node with event=yes has extra E icon at the right. 3) When any OSM element isclicked, user can click on menu: Presets > Event Add/Edit to start working with the plugin.4) Newly added tags are shown on the section Properties.
27
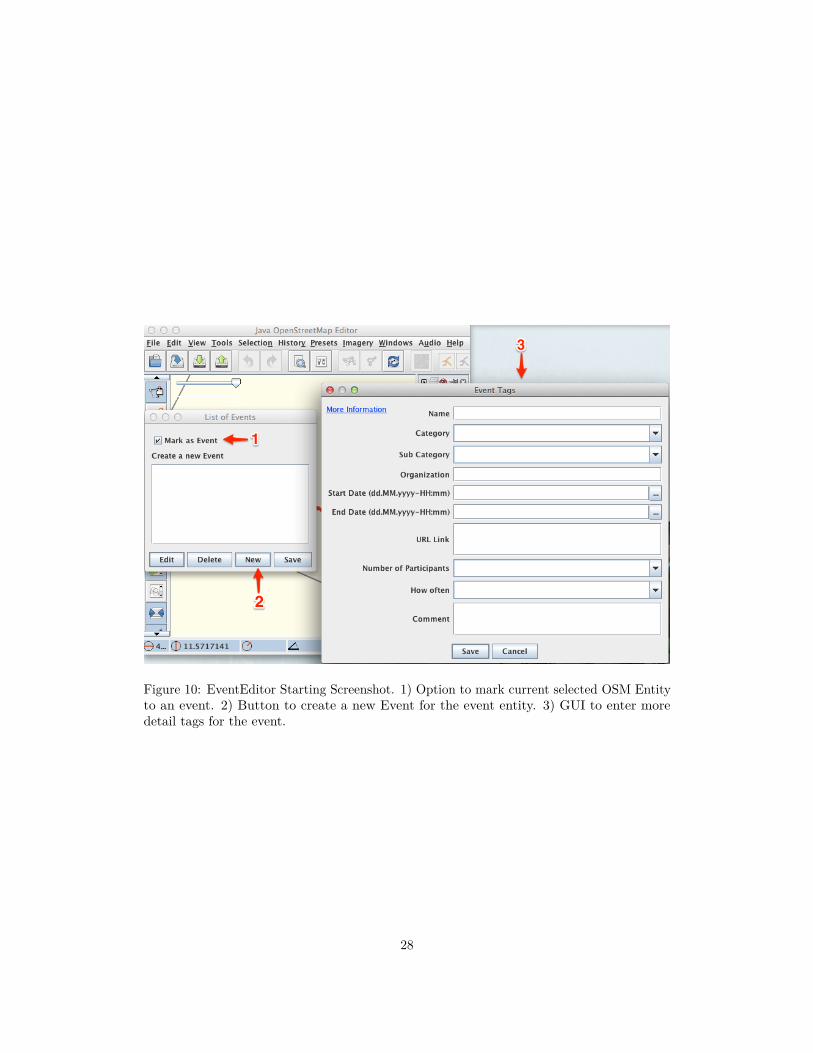
Figure 10: EventEditor Starting Screenshot. 1) Option to mark current selected OSM Entityto an event. 2) Button to create a new Event for the event entity. 3) GUI to enter moredetail tags for the event.
28
Appendix C : OpenEventMap Installation Notes
OpenEventEditor is based on Django 1.4 and python2. It uses pip to take care of necessarydependencies and integrates seamlessly with apache and passenger module.
It is recommended that openeventmap is run inside a virtualenv.
$ cd /home/bibek/app/virtualenv/$ virtualenv openeventmapdjango$ source openeventmapdjango/bin/activate
Next step, we install all required dependencies for OpenEventMap to run
(openeventmapdjango)$ cd /opt/myosm/openeventmap(openeventmapdjango)$ pip install -r requirements.txt
The database name, username and password are used exactly the same as in TheRailsPortand edited in the file eventsvisualizer/settings.py.
We are serving static files from apache directly, so we collect all files inside the static_dirfolder.
(openeventmapdjango)$ ./manage.py collectstatic
Now comes the part to configure apache and passenger to serve our web appli-cation automatically. The setup is achieved simply by a VirtualHost entry in/etc/httpd/conf/extra/httpd-vhosts.conf.
<VirtualHost *:80>ServerName www.openeventmap.tum.de
Alias /static/ /opt/myosm/openeventmap/static_dir/
DocumentRoot "/opt/myosm/openeventmap"PassengerPython /home/bibek/app/virtualenv/openeventmapdjango/bin/pythonPassengerAppRoot /opt/myosm/openeventmap<Directory /opt/myosm/openeventmap>
Order allow,denyAllow from all
</Directory></VirtualHost>
Accessing http://www.openeventmap.tum.de will load our webapplication.
29
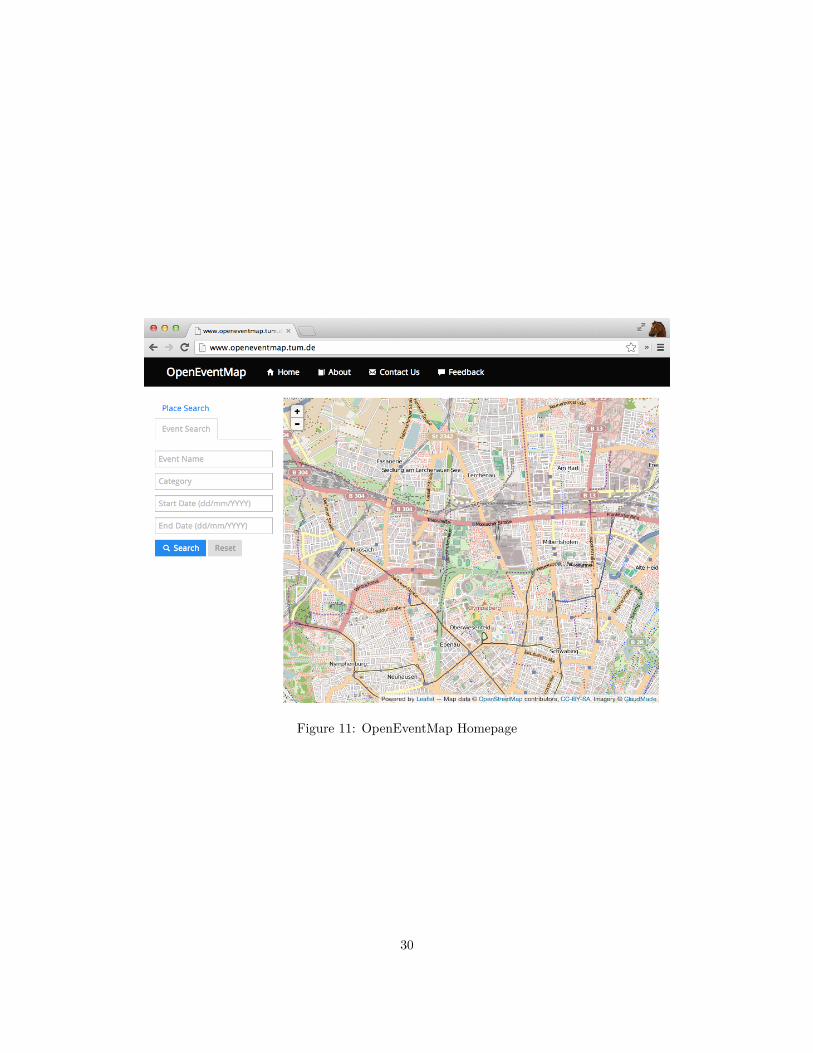
Figure 11: OpenEventMap Homepage
30
Related Documents