Evaluating price volatility and the role of trade in Eastern and Southern African maize markets T. Davids, R. Gitau, F.H. Meyer, B. Chisanga and T.S. Jayne Invited paper presented at the 5th International Conference of the African Association of Agricultural Economists, September 23-26, 2016, Addis Ababa, Ethiopia Copyright 2016 by [authors]. All rights reserved. Readers may make verbatim copies of this document for non-commercial purposes by any means, provided that this copyright notice appears on all such copies.

Welcome message from author
This document is posted to help you gain knowledge. Please leave a comment to let me know what you think about it! Share it to your friends and learn new things together.
Transcript
Evaluating price volatility and the role of
trade in Eastern and Southern African maize
markets
T. Davids, R. Gitau, F.H. Meyer, B. Chisanga and T.S. Jayne
Invited paper presented at the 5th International Conference of the African Association of
Agricultural Economists, September 23-26, 2016, Addis Ababa, Ethiopia
Copyright 2016 by [authors]. All rights reserved. Readers may make verbatim copies of this
document for non-commercial purposes by any means, provided that this copyright notice
appears on all such copies.
1
Evaluating price volatility and the role
of trade in Eastern and Southern
African maize markets
By
Ms T Davids1, Mr R Gitau
2, Prof FH Meyer
3, Mr. B Chisanga
4 and Prof TS Jayne
5
1Reasearch Analyst and
3Director: Bureau for Food and Agricultural Policy
Department of Agricultural Economics, Extension and Rural Development
Faculty of Natural and Agricultural Sciences
University of Pretoria
2Tegemeo institute of Agricultural Policy and Development, Egerton University
4Research Associate – Indaba Agricultural Policy Research Institute
5Professor – Michigan State University
2
EVALUATING PRICE VOLATILITY AND THE ROLE OF
TRADE IN EASTERN AND SOUTHERN AFRICAN MAIZE
MARKETS
ABSTRACT
Food price volatility, particularly in key food staple markets, has been a long standing
challenge in Sub-Saharan Africa, where prices are already some of the highest in the world.
In many cases, governments have acted to curb volatility, though several researchers have
shown that actions aimed at reducing volatility in the short run have often been
counterproductive for long term aims of market led productivity growth that would be able to
reduce high prices in the region. With increased intra-regional trade having been proposed as
a solution to volatile prices in the region, this study finds that across a sample of 36 maize
markets in Eastern and Southern Africa between 2008 and 2014, volatility is significantly
lower in markets with higher trade volumes. Thus it postulates that policies aimed at
increasing the efficiency and reducing the cost of intra-regional trade will be efficient in
curbing volatility in the region, thus improving food security.
1. INTRODUCTION
Food price volatility has long been a recurring issue in many African countries and
particularly in relation to food staple markets, it has been an important factor affecting food
security. Comparing food price volatility in international markets to a sample of Eastern and
Southern African (ESA) countries, Minot (2014) demonstrates that food price volatility in the
region is more than double that evident in international markets over the same period.
Considering that poor households spend a greater share of total expenditure on food and that
the share of the population that depend on agriculture for its livelihood is generally larger in
SSA relative to the rest of the world, this presents an important source of risk for the region.
In ESA, maize is the primary staple crop; it provides the foremost source of calories in the
average diet accounting for approximately 25% of total caloric intake between 2013 and 2015
(OECD-FAO, 2016). Maize accounted for more than 35% and 50% of total cultivated area in
Eastern and Southern Africa respectively between 2013 and 2015 (OECD-FAO, 2016) and is
grown by multitudes of smallholder producers across the region, who rely on it for food and
income. Given its undisputed importance, maize has become synonymous with food security
in the region and consequently has also been prioritised on the political front. The perceived
need to stabilise prices and supply, thus ensuring food security, has been offered as
3
justification for continued government intervention, despite the international drive towards
liberalisation (Jayne and Tschirley 2009, Minot 2014).
Governments are often faced with the need to balance short term food security objectives
with longer term goals of increased, market led productivity growth and in many instances
appear to lack the confidence to rely on market and trade based approaches to ensure that
food security goals are met (Chapoto and Sitko, 2014). Thus interventions have been
forthcoming, however, such interventions have been highly discretionary and unpredictable,
often characterised by the sudden implementation of trade controls, unanticipated changes to
tariff policy and inconsistent pricing policies for government purchases. Consequently
several researchers have questioned the success of such policies and contrary to stabilisation
objectives, observed volatility over the past decade has been higher in markets where
governments intervene most actively (Chapoto and Jayne 2009, Jayne 2012, Minot 2014).
Policies designed to reduce volatility are important in improving food security, owing to its
impact on affordability, yet as Minot (2014) notes, the absolute levels of food prices are
equally important. With few exceptions, maize prices in ESA remain high in the global
context, with significant differences between surplus and deficit markets. This study therefore
evaluates relative price levels and volatility across the ESA region, as well as the factors
influencing them. Given the limited success of price stabilisation efforts noted by Minot
(2014), it considers the role of trade in reducing price volatility. The paper is organised as
follows: After this introduction, it considers key drivers of price volatility, followed by an
assessment of both price levels and volatility across the nine countries included in the
Regional Network of Agricultural Policy Research Institutes1 (ReNAPRI). An evaluation of
processing margins between wholesale maize prices and retail maize meal prices follows,
before drawing conclusions and summarising key findings.
2. FACTORS INFLUENCING PRICE VOLATILITY IN EASTERN
AND SOUTHERN AFRICA
Following the global food crisis in 2007/08, increasing attention has been focused on the
extent to which the sharp increase in global price levels, as well as the heightened volatility
evident in global markets was transmitted into the developing world. Africa in particular has
been the subject of numerous studies and while results indicate that prices in the region did
rise significantly over the same period, spatial analysis indicates that within the maize sector,
integration with world markets remains weak, with domestic supply and demand shocks
responsible for most of the volatility in the region (Minot 2011, Baquedano and Liefert 2014,
Baffes et al. 2015). The predominance of rain-fed agriculture supports this notion, as climatic
conditions influence the consistency of production levels. Combined with typically low price
1 Countries include Democratic Republic of the Congo, Kenya, Malawi, Mozambique, South Africa, Tanzania,
Uganda, Zambia and Zimbabwe.
4
elasticities in food staple markets, such variation in production levels is arguably an
important driver of price volatility.
The role of stock levels in influencing volatility has also been acknowledged. In many ESA
countries, stock levels are limited by infrastructural constraints and often the majority of
stocks are held as strategic food reserves by government. The establishment of such food
reserve programs was a resolution within the Maputo declaration on agriculture food security.
Across ESA, strategic food reserves have been employed in Kenya, Zambia, Malawi and
Zimbabwe. While the maintenance of such reserves is justifiable, design in line with the
specific objectives of the policy, as well as transparent implementation and pricing is key to
achieving success and limiting market distorting impacts. When prices are not transparent
and market based, they can also lead to speculation. For example in Kenya the National
Cereal and Produce Board (NCPB) buys maize for strategic reserves, with the added
objective of stabilising prices. NCPB policy indicates that prices are based on the market
price, yet over the years, producers have always exerted pressure through withholding stocks
and lobbied government to increase the price offered by NCPB. When prices are increased,
this drives the market price higher. During the periods when NCPB was not participating in
the market, prices have been more stable.
Government actions aimed at curbing price volatility have differed across the region,
allowing conclusions related to their success based on volatility levels post 2008. An
extensive discussion on policy responses of several developing countries to the price
volatility crisis is presented by Bryan (2015). Overall, most governments focussed on
consumer and trade issues at the expense of increased production, with 50% more policy
responses focused on consumers and trade through lower import tariffs and food taxes, rather
than output. Particularly in the group of countries that intervened most actively, export bans
were also frequently employed. Such actions inhibit efficient trade with the rest of the region
however, which can impact on prices in neighbouring countries. Such actions also further
diminish confidence in market and trade related responses to changes in prices and further
emphasise the often perceived need for self-sufficiency.
The role of intra-regional trade in reducing volatility and improving food security was
recognised in the Malabo Declaration on accelerated agricultural growth, which committed to
boosting intra-African trade in agricultural commodities and services. A reduction in barriers
to regional trade offers an inexpensive means of reducing domestic price volatility (Dorosch
et al., 2010) and the World Bank (2012) indicates that an enabling environment which allows
intra-regional trade to occur more efficiently has enormous potential to improve food security
in the region. This positive contribution is already evident in regions where cross border trade
is prevalent (Mozambique-Malawi, Malawi-Zambia, Uganda-Kenya), with neighbouring
countries essentially pooling production in order to stabilise markets (Chapoto and Sitko,
2014).
5
3. REGIONAL COMPARISON OF PRICE LEVELS AND
VOLATILITY
Consideration of historic trade-flow within the region supports the notion that domestic
supply and demand fluctuations have a greater influence on price volatility than international
price movements. White maize accounts for the majority of maize consumption within ESA,
whilst yellow maize dominates in the global market. Maize markets in the region remain
insulated from world markets by high transportation costs, while policies that reflect the
reluctance to accept maize with genetically modified technology further limits potential
import sources from outside of the region. Consequently, the majority of trade occurs intra-
regionally and maize imports from outside the region have been limited, except for yellow
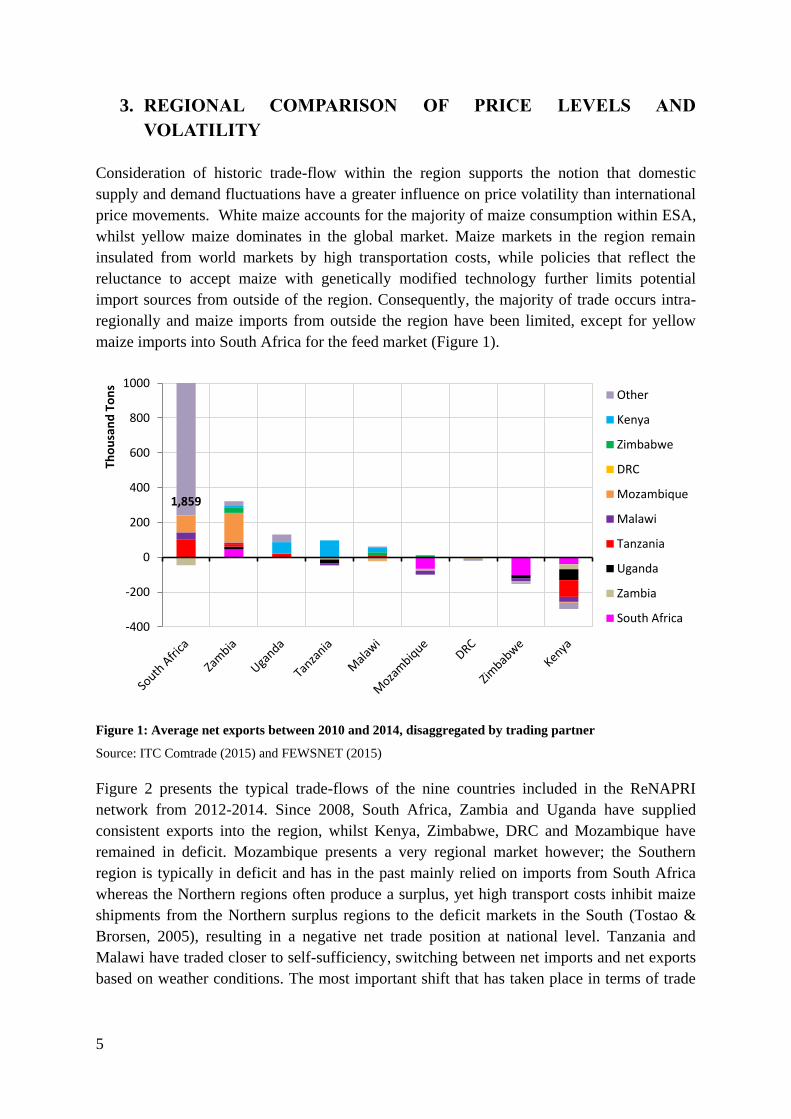
maize imports into South Africa for the feed market (Figure 1).
Figure 1: Average net exports between 2010 and 2014, disaggregated by trading partner
Source: ITC Comtrade (2015) and FEWSNET (2015)
Figure 2 presents the typical trade-flows of the nine countries included in the ReNAPRI
network from 2012-2014. Since 2008, South Africa, Zambia and Uganda have supplied
consistent exports into the region, whilst Kenya, Zimbabwe, DRC and Mozambique have
remained in deficit. Mozambique presents a very regional market however; the Southern
region is typically in deficit and has in the past mainly relied on imports from South Africa
whereas the Northern regions often produce a surplus, yet high transport costs inhibit maize
shipments from the Northern surplus regions to the deficit markets in the South (Tostao &
Brorsen, 2005), resulting in a negative net trade position at national level. Tanzania and
Malawi have traded closer to self-sufficiency, switching between net imports and net exports
based on weather conditions. The most important shift that has taken place in terms of trade
1,859
-400
-200
0
200
400
600
800
1000
Tho
usa
nd
To
ns
Other
Kenya
Zimbabwe
DRC
Mozambique
Malawi
Tanzania
Uganda
Zambia
South Africa
6
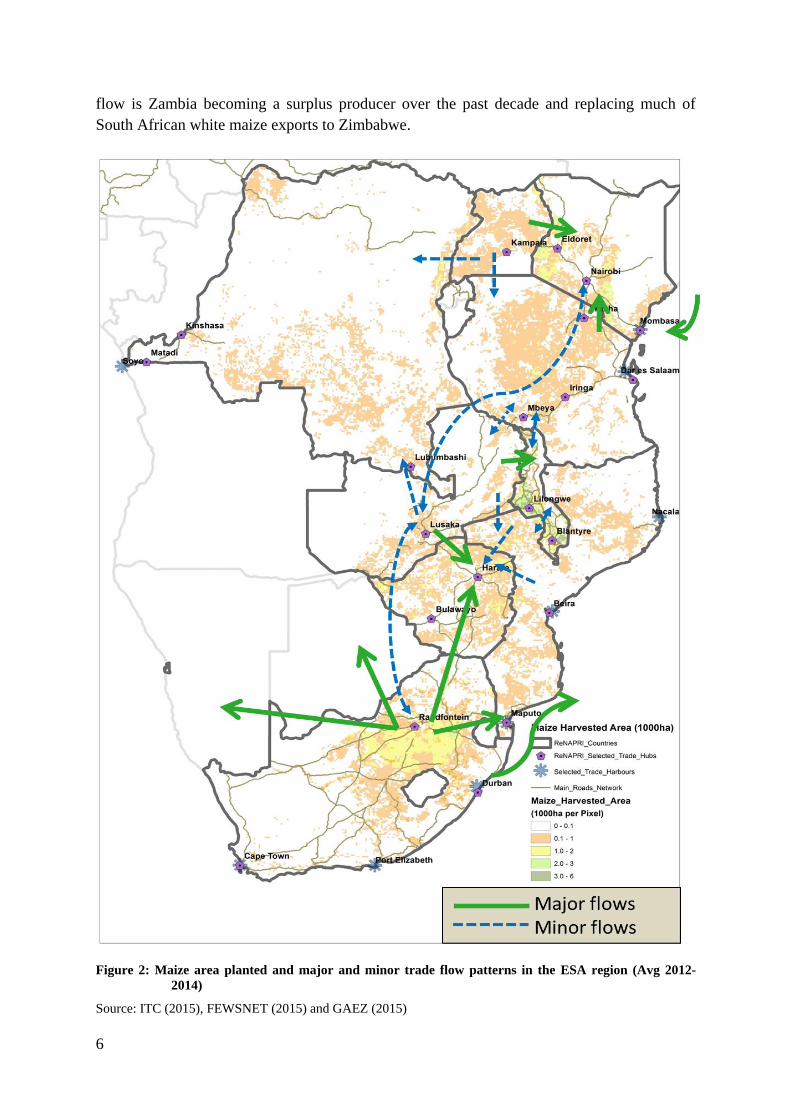
flow is Zambia becoming a surplus producer over the past decade and replacing much of
South African white maize exports to Zimbabwe.
Figure 2: Maize area planted and major and minor trade flow patterns in the ESA region (Avg 2012-
2014)
Source: ITC (2015), FEWSNET (2015) and GAEZ (2015)
7
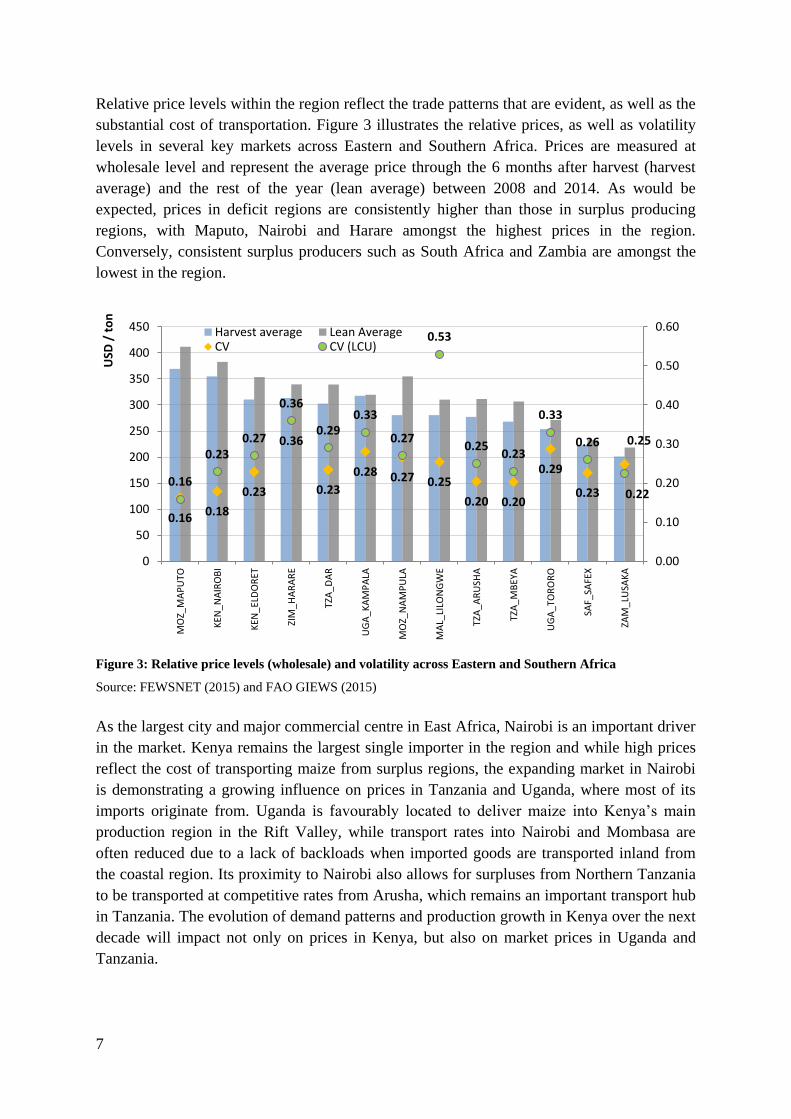
Relative price levels within the region reflect the trade patterns that are evident, as well as the
substantial cost of transportation. Figure 3 illustrates the relative prices, as well as volatility
levels in several key markets across Eastern and Southern Africa. Prices are measured at
wholesale level and represent the average price through the 6 months after harvest (harvest
average) and the rest of the year (lean average) between 2008 and 2014. As would be
expected, prices in deficit regions are consistently higher than those in surplus producing
regions, with Maputo, Nairobi and Harare amongst the highest prices in the region.
Conversely, consistent surplus producers such as South Africa and Zambia are amongst the
lowest in the region.
Figure 3: Relative price levels (wholesale) and volatility across Eastern and Southern Africa
Source: FEWSNET (2015) and FAO GIEWS (2015)
As the largest city and major commercial centre in East Africa, Nairobi is an important driver
in the market. Kenya remains the largest single importer in the region and while high prices
reflect the cost of transporting maize from surplus regions, the expanding market in Nairobi
is demonstrating a growing influence on prices in Tanzania and Uganda, where most of its
imports originate from. Uganda is favourably located to deliver maize into Kenya’s main
production region in the Rift Valley, while transport rates into Nairobi and Mombasa are
often reduced due to a lack of backloads when imported goods are transported inland from
the coastal region. Its proximity to Nairobi also allows for surpluses from Northern Tanzania
to be transported at competitive rates from Arusha, which remains an important transport hub
in Tanzania. The evolution of demand patterns and production growth in Kenya over the next
decade will impact not only on prices in Kenya, but also on market prices in Uganda and
Tanzania.
0.16 0.18
0.23
0.36
0.23
0.28 0.27 0.25
0.20 0.20
0.29
0.23
0.25
0.16
0.23 0.27
0.36
0.29 0.33
0.27
0.53
0.25 0.23
0.33
0.26
0.22
0.00
0.10
0.20
0.30
0.40
0.50
0.60
0
50
100
150
200
250
300
350
400
450
MO
Z_M
AP
UTO
KEN
_N
AIR
OB
I
KEN
_EL
DO
RET
ZIM
_HA
RA
RE
TZA
_DA
R
UG
A_K
AM
PA
LA
MO
Z_N
AM
PU
LA
MA
L_LI
LON
GW
E
TZA
_AR
USH
A
TZA
_MB
EYA
UG
A_T
OR
OR
O
SAF_
SAFE
X
ZAM
_LU
SAK
A
USD
/ t
on
Harvest average Lean AverageCV CV (LCU)
8
Tanzania itself is a complex market; it covers a large geographical area, characterised by 5
distinct geographic and agro ecological zones, with self-sufficiency across different regions
reflecting a large degree of variation. Whilst surplus markets in the North such as Moshi and
Arusha supply into the growing market in Nairobi, the surplus markets in the South remain
fairly isolated from large consumption centres such as Dar Es Salaam and Dodoma in the
central deficit region due to large distances and high transportation costs. Hence cross border
trade into Northern Mozambique and Malawi provide additional markets for surplus products
(Baffes et al. 2015).
Malawi represents a complex market, with limited information related to production volumes
and informal cross border trade-flows. Despite its smaller size, prices across the country
show a great deal of variation; markets remain thin, with estimates by the Grain Traders and
Processors association indicating that only about 10% of total maize production is traded
formally (Edelman and Pauw 2015). Due to its proximity to various surplus regions, imports
accrue from various sources - historically imports have been prevalent from Northern
Mozambique, Tanzania and Zambia, however in different years, exports have also flowed to
Mozambique, Tanzania and Zimbabwe. Whilst mostly operating in an autarkic situation, its
proximity to relatively reliable surpluses from Zambia and Northern Mozambique results in
prices tending to follow those markets in years of deficit. Figure 3 indicates that prices in
Lilongwe are some of the most volatile in the region, consistent with the findings of Chapoto
and Jayne (2009).
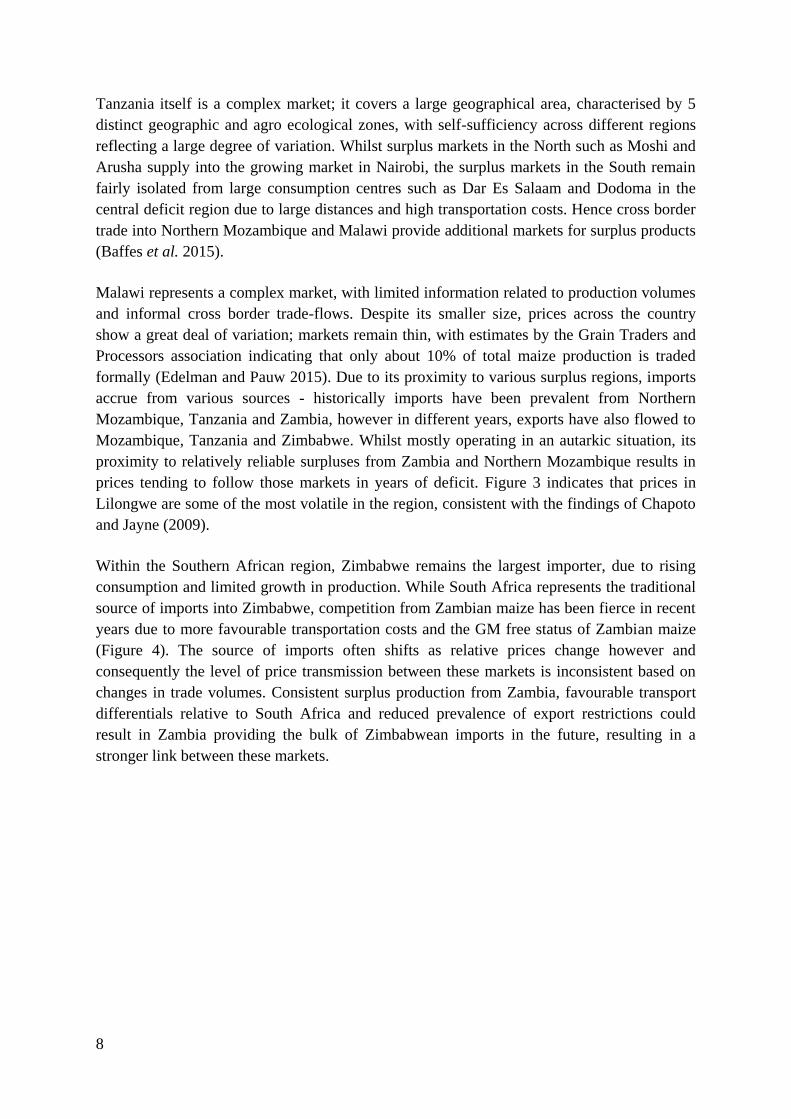
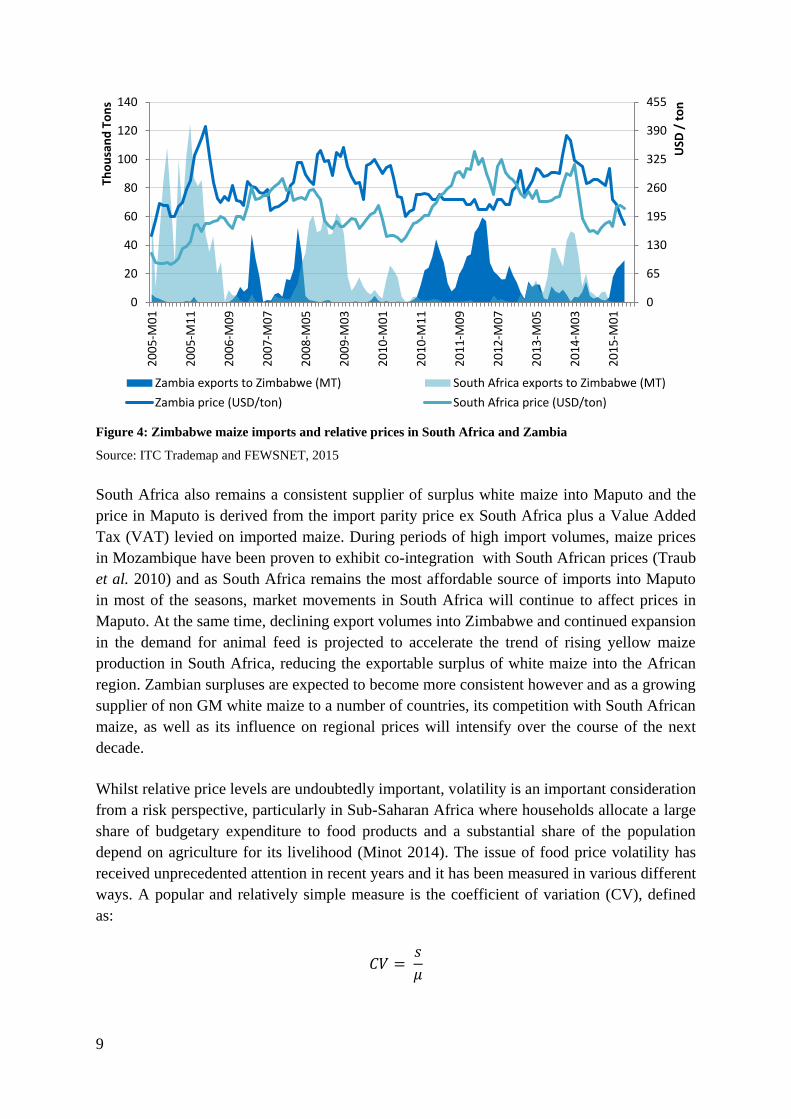
Within the Southern African region, Zimbabwe remains the largest importer, due to rising
consumption and limited growth in production. While South Africa represents the traditional
source of imports into Zimbabwe, competition from Zambian maize has been fierce in recent
years due to more favourable transportation costs and the GM free status of Zambian maize
(Figure 4). The source of imports often shifts as relative prices change however and
consequently the level of price transmission between these markets is inconsistent based on
changes in trade volumes. Consistent surplus production from Zambia, favourable transport
differentials relative to South Africa and reduced prevalence of export restrictions could
result in Zambia providing the bulk of Zimbabwean imports in the future, resulting in a
stronger link between these markets.
9
Figure 4: Zimbabwe maize imports and relative prices in South Africa and Zambia
Source: ITC Trademap and FEWSNET, 2015
South Africa also remains a consistent supplier of surplus white maize into Maputo and the
price in Maputo is derived from the import parity price ex South Africa plus a Value Added
Tax (VAT) levied on imported maize. During periods of high import volumes, maize prices
in Mozambique have been proven to exhibit co-integration with South African prices (Traub
et al. 2010) and as South Africa remains the most affordable source of imports into Maputo
in most of the seasons, market movements in South Africa will continue to affect prices in
Maputo. At the same time, declining export volumes into Zimbabwe and continued expansion
in the demand for animal feed is projected to accelerate the trend of rising yellow maize
production in South Africa, reducing the exportable surplus of white maize into the African
region. Zambian surpluses are expected to become more consistent however and as a growing
supplier of non GM white maize to a number of countries, its competition with South African
maize, as well as its influence on regional prices will intensify over the course of the next
decade.
Whilst relative price levels are undoubtedly important, volatility is an important consideration
from a risk perspective, particularly in Sub-Saharan Africa where households allocate a large
share of budgetary expenditure to food products and a substantial share of the population
depend on agriculture for its livelihood (Minot 2014). The issue of food price volatility has
received unprecedented attention in recent years and it has been measured in various different
ways. A popular and relatively simple measure is the coefficient of variation (CV), defined
as:
𝐶𝑉 = 𝑠
𝜇
0
65
130
195
260
325
390
455
0
20
40
60
80
100
120
140
20
05
-M0
1
20
05
-M1
1
20
06
-M0
9
20
07
-M0
7
20
08
-M0
5
20
09
-M0
3
20
10
-M0
1
20
10
-M1
1
20
11
-M0
9
20
12
-M0
7
20
13
-M0
5
20
14
-M0
3
20
15
-M0
1
USD
/ t
on
Tho
usa
nd
To
ns
Zambia exports to Zimbabwe (MT) South Africa exports to Zimbabwe (MT)
Zambia price (USD/ton) South Africa price (USD/ton)
10
Where s is the standard deviation over a specified period and 𝜇 is the mean value over that
same period. Expressing the standard deviation relative to the mean allows for the
comparison of variation between series that differ in scale and while the CV is time-
dependant it remains an appropriate measure of relative volatility in different series over the
same time period.
As a relative comparison between the volatility evident in the different markets, Figure 8
illustrates the average price levels in selected maize markets across Eastern and Southern
Africa in the 6 months following the harvest (harvest period), as well as the remaining six
months (lean period) for the period between January 2008 and October 2014. The CV
calculated in both domestic currency and US dollar terms is also included. Whilst Figure 3
only presents the main markets, evaluation of the full sample of 36 markets suggests that the
seasonality experienced in East African markets that are able to harvest for a second time
within each 12 month period is reduced. The difference between harvest period and lean
period prices in the East African markets amounted to 8% on average across the sample,
whilst the same difference in the Southern African markets averaged 12%. This also results in
a marginally higher coefficient of variation (US dollar terms) in the Southern African
Markets (27%) relative to the East African markets (24%).
Figure 3 suggests a significant increase in volatility when considered in domestic currency
terms relative to US dollar terms, implying that macro-economic volatility is a significant
contributing factor to the volatility experienced in these markets. Considered in US dollar
terms to account for currency fluctuations, the observed volatility over the period under
examination was the highest in Harare and Kampala, whilst it was the lowest in Maputo,
Nairobi, Mbeya and Arusha. Three of these low volatility markets have the benefit of
multiple harvests in any calendar year, however it remains a diverse grouping in terms of
classification as surplus or deficit regions, as well as distance to other surplus or deficit
regions. Maputo and Nairobi are both deficit regions, Maputo being a coastal city with a port,
but Nairobi almost 500 km away from the closest port in Mombasa. There is however a good
road network between the two cities. Mbeya and Arusha on the other hand are surplus
producers in the South and North of Tanzania respectively. Arusha is favourably located to
supply maize into Nairobi, whereas Mbeya is a relatively isolated market (Baffes et al. 2015).
Maputo typically imports from South Africa, which benefits from a transparent price
formation mechanism on the commodity exchange market. Many reasons have been offered
in literature as a reason for volatility in the region; Minimal volatility in Mozambique is
supported by the findings of Chapoto and Jayne (2009), who attributed this fact to
Mozambique’s relatively open trade and marketing strategy and concluded that markets
typically characterised by increased government intervention tend to be more volatile. Minot
(2014) also suggested that within maize markets, volatility was greater in landlocked
countries relative to coastal regions, although this finding was unique to maize markets, with
most other commodities exhibiting less volatility in landlocked countries.
Minot’s findings suggest that improved access to international markets reduces volatility,
however it fails to account for the fact that the greatest share of maize traded originates from
11
within the region as opposed to international sources and access to ports may therefore not be
the primary determinant of the impact that efficient trade-flow has in reducing market
volatility. In order to test for the impact of port access, a simple bivariate regression analysis
was conducted to relate market volatility, as measured by the CV to distance to closest port.
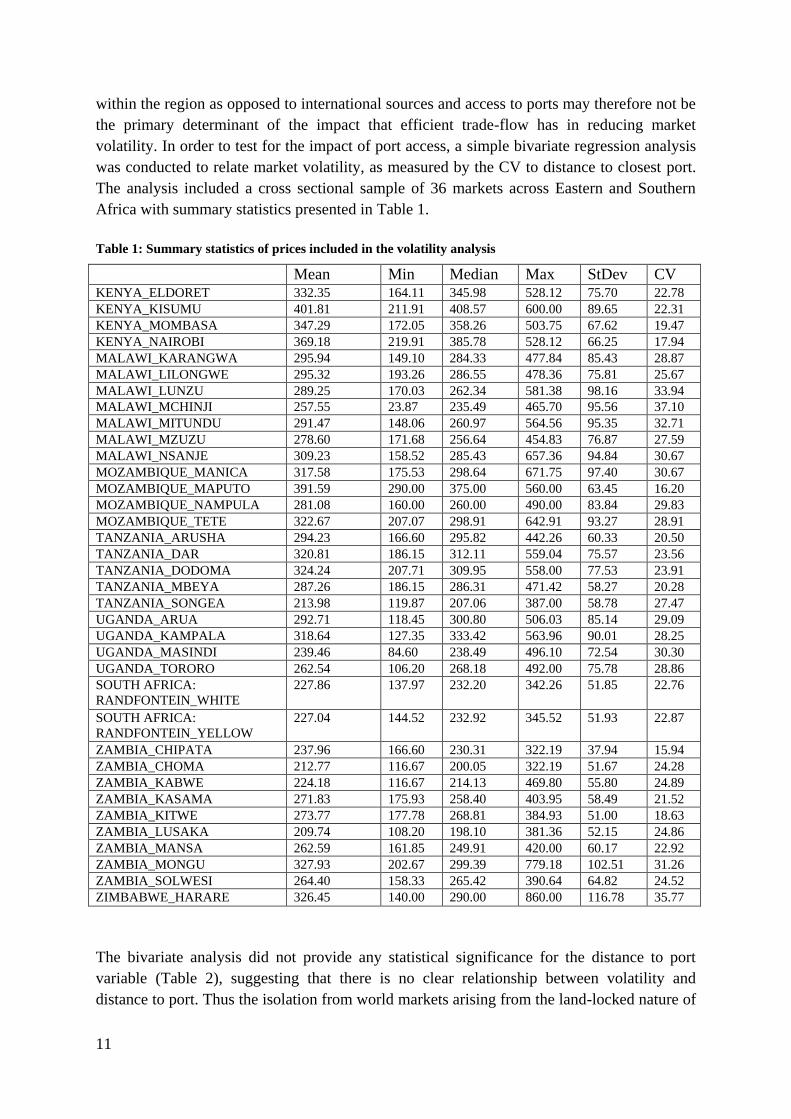
The analysis included a cross sectional sample of 36 markets across Eastern and Southern
Africa with summary statistics presented in Table 1.
Table 1: Summary statistics of prices included in the volatility analysis
Mean Min Median Max StDev CV KENYA_ELDORET 332.35 164.11 345.98 528.12 75.70 22.78
KENYA_KISUMU 401.81 211.91 408.57 600.00 89.65 22.31
KENYA_MOMBASA 347.29 172.05 358.26 503.75 67.62 19.47
KENYA_NAIROBI 369.18 219.91 385.78 528.12 66.25 17.94
MALAWI_KARANGWA 295.94 149.10 284.33 477.84 85.43 28.87
MALAWI_LILONGWE 295.32 193.26 286.55 478.36 75.81 25.67
MALAWI_LUNZU 289.25 170.03 262.34 581.38 98.16 33.94
MALAWI_MCHINJI 257.55 23.87 235.49 465.70 95.56 37.10
MALAWI_MITUNDU 291.47 148.06 260.97 564.56 95.35 32.71
MALAWI_MZUZU 278.60 171.68 256.64 454.83 76.87 27.59
MALAWI_NSANJE 309.23 158.52 285.43 657.36 94.84 30.67
MOZAMBIQUE_MANICA 317.58 175.53 298.64 671.75 97.40 30.67
MOZAMBIQUE_MAPUTO 391.59 290.00 375.00 560.00 63.45 16.20
MOZAMBIQUE_NAMPULA 281.08 160.00 260.00 490.00 83.84 29.83
MOZAMBIQUE_TETE 322.67 207.07 298.91 642.91 93.27 28.91
TANZANIA_ARUSHA 294.23 166.60 295.82 442.26 60.33 20.50
TANZANIA_DAR 320.81 186.15 312.11 559.04 75.57 23.56
TANZANIA_DODOMA 324.24 207.71 309.95 558.00 77.53 23.91
TANZANIA_MBEYA 287.26 186.15 286.31 471.42 58.27 20.28
TANZANIA_SONGEA 213.98 119.87 207.06 387.00 58.78 27.47
UGANDA_ARUA 292.71 118.45 300.80 506.03 85.14 29.09
UGANDA_KAMPALA 318.64 127.35 333.42 563.96 90.01 28.25
UGANDA_MASINDI 239.46 84.60 238.49 496.10 72.54 30.30
UGANDA_TORORO 262.54 106.20 268.18 492.00 75.78 28.86
SOUTH AFRICA:
RANDFONTEIN_WHITE
227.86 137.97 232.20 342.26 51.85 22.76
SOUTH AFRICA:
RANDFONTEIN_YELLOW
227.04 144.52 232.92 345.52 51.93 22.87
ZAMBIA_CHIPATA 237.96 166.60 230.31 322.19 37.94 15.94
ZAMBIA_CHOMA 212.77 116.67 200.05 322.19 51.67 24.28
ZAMBIA_KABWE 224.18 116.67 214.13 469.80 55.80 24.89
ZAMBIA_KASAMA 271.83 175.93 258.40 403.95 58.49 21.52
ZAMBIA_KITWE 273.77 177.78 268.81 384.93 51.00 18.63
ZAMBIA_LUSAKA 209.74 108.20 198.10 381.36 52.15 24.86
ZAMBIA_MANSA 262.59 161.85 249.91 420.00 60.17 22.92
ZAMBIA_MONGU 327.93 202.67 299.39 779.18 102.51 31.26
ZAMBIA_SOLWESI 264.40 158.33 265.42 390.64 64.82 24.52
ZIMBABWE_HARARE 326.45 140.00 290.00 860.00 116.78 35.77
The bivariate analysis did not provide any statistical significance for the distance to port
variable (Table 2), suggesting that there is no clear relationship between volatility and
distance to port. Thus the isolation from world markets arising from the land-locked nature of
12
many markets in the region may not be the primary determinant of volatility in these markets.
This finding is in fact confirmed by previous studies which suggested that the heightened
volatility evident within the African region is attributed to domestic supply shocks and policy
responses, as opposed to world market volatility (Minot, 2014). The high cost of
transportation associated with the region provides a natural insulation from world markets
whilst, the preference for non-GM, white maize limits the surplus markets for potential
imports from outside the region. Despite the protection offered by these factors during
periods of global instability, the comparatively high cost of transportation within the region
increases the cost of imported products during periods of domestic shortage, often
exacerbating the price impact of domestic supply shocks.
Given the predominance of intra-regional trade, the findings related to the regression using
distance to port as an explanatory variable for volatility are not unexpected, but also are not
sufficient to suggest that trade does not influence volatility. Consequently a second bivariate
regression analysis was conducted with the coefficient of variation as dependant variable and
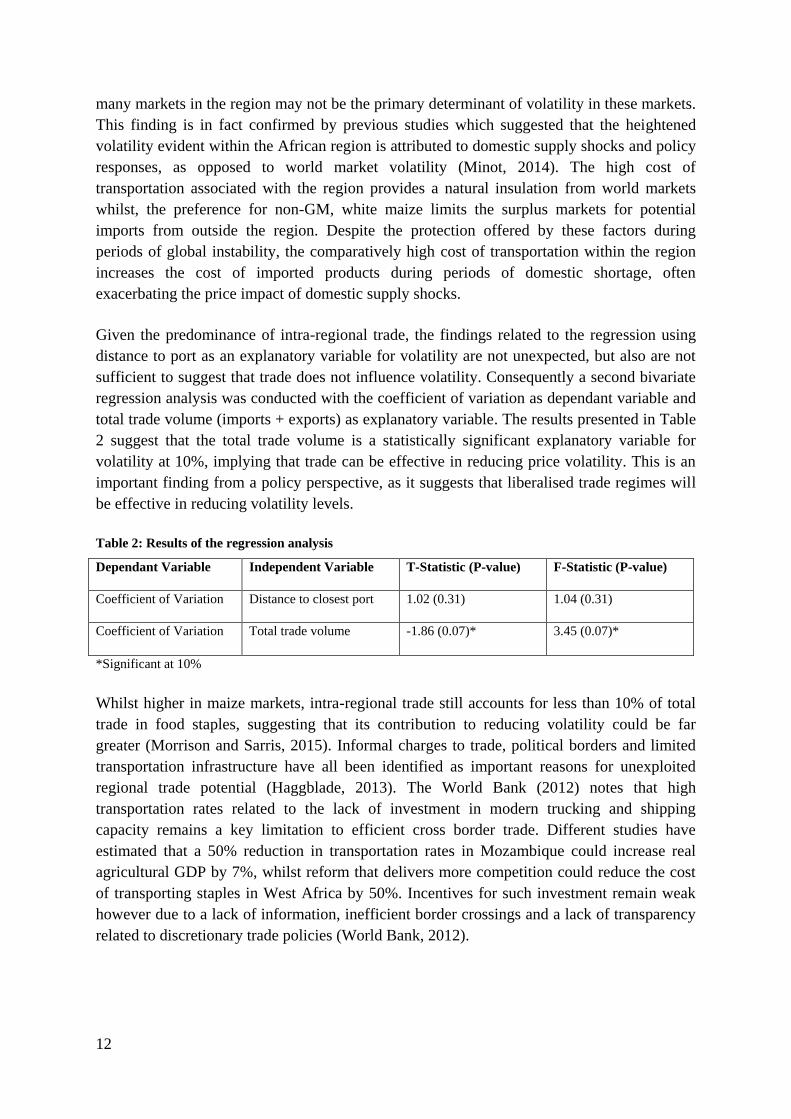
total trade volume (imports + exports) as explanatory variable. The results presented in Table
2 suggest that the total trade volume is a statistically significant explanatory variable for
volatility at 10%, implying that trade can be effective in reducing price volatility. This is an
important finding from a policy perspective, as it suggests that liberalised trade regimes will
be effective in reducing volatility levels.
Table 2: Results of the regression analysis
Dependant Variable Independent Variable T-Statistic (P-value) F-Statistic (P-value)
Coefficient of Variation Distance to closest port 1.02 (0.31) 1.04 (0.31)
Coefficient of Variation Total trade volume -1.86 (0.07)* 3.45 (0.07)*
*Significant at 10%
Whilst higher in maize markets, intra-regional trade still accounts for less than 10% of total
trade in food staples, suggesting that its contribution to reducing volatility could be far
greater (Morrison and Sarris, 2015). Informal charges to trade, political borders and limited
transportation infrastructure have all been identified as important reasons for unexploited
regional trade potential (Haggblade, 2013). The World Bank (2012) notes that high
transportation rates related to the lack of investment in modern trucking and shipping
capacity remains a key limitation to efficient cross border trade. Different studies have
estimated that a 50% reduction in transportation rates in Mozambique could increase real
agricultural GDP by 7%, whilst reform that delivers more competition could reduce the cost
of transporting staples in West Africa by 50%. Incentives for such investment remain weak
however due to a lack of information, inefficient border crossings and a lack of transparency
related to discretionary trade policies (World Bank, 2012).
13
4. RELATIVE MARKETING MARGIN COMPARISON: MAIZE TO
MAIZE MEAL
From a consumer’s perspective, prices are measured at retail as opposed to wholesale level
and hence the efficiency of the value chain in converting primary commodities such as maize
grain to maize meal is an important attribute in considering the affordability of food products.
Consequently, evaluations of relative price levels remain incomplete when the margin to
retail level is not considered. The challenge of making any form of analysis of retail prices of
maize meal within the region and markets is to ensure that the products are comparable.
Apart from the extraction rate that is the most important indicator of the type of maize meal,
the type of fortification that is required in countries like South Africa also plays an important
role.
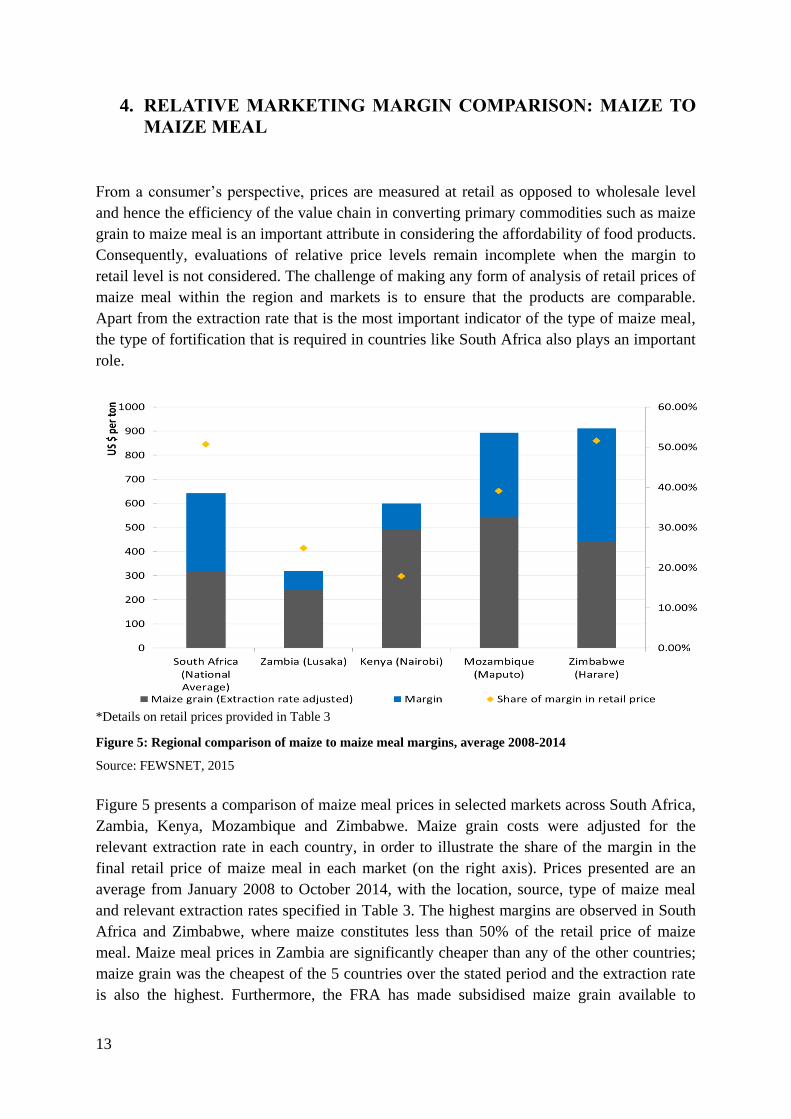
*Details on retail prices provided in Table 3
Figure 5: Regional comparison of maize to maize meal margins, average 2008-2014
Source: FEWSNET, 2015
Figure 5 presents a comparison of maize meal prices in selected markets across South Africa,
Zambia, Kenya, Mozambique and Zimbabwe. Maize grain costs were adjusted for the
relevant extraction rate in each country, in order to illustrate the share of the margin in the
final retail price of maize meal in each market (on the right axis). Prices presented are an
average from January 2008 to October 2014, with the location, source, type of maize meal
and relevant extraction rates specified in Table 3. The highest margins are observed in South
Africa and Zimbabwe, where maize constitutes less than 50% of the retail price of maize
meal. Maize meal prices in Zambia are significantly cheaper than any of the other countries;
maize grain was the cheapest of the 5 countries over the stated period and the extraction rate
is also the highest. Furthermore, the FRA has made subsidised maize grain available to
14
millers in the past in order to maintain maize meal prices at acceptable levels. Interestingly,
despite significantly higher maize grain prices, maize meal prices in Kenya are below South
African levels. Kenyan extraction rates are marginally higher and South African maize is
fortified, but at less than 20%, the share of the margin in total maize meal cost is significantly
below South Africa, Zimbabwe and Mozambique. Kaves (2014) indicated that in 2014, the
cost of maize grain represented 85% of maize meal costs, supporting the estimated value of
82% on average from 2008 to 2014.
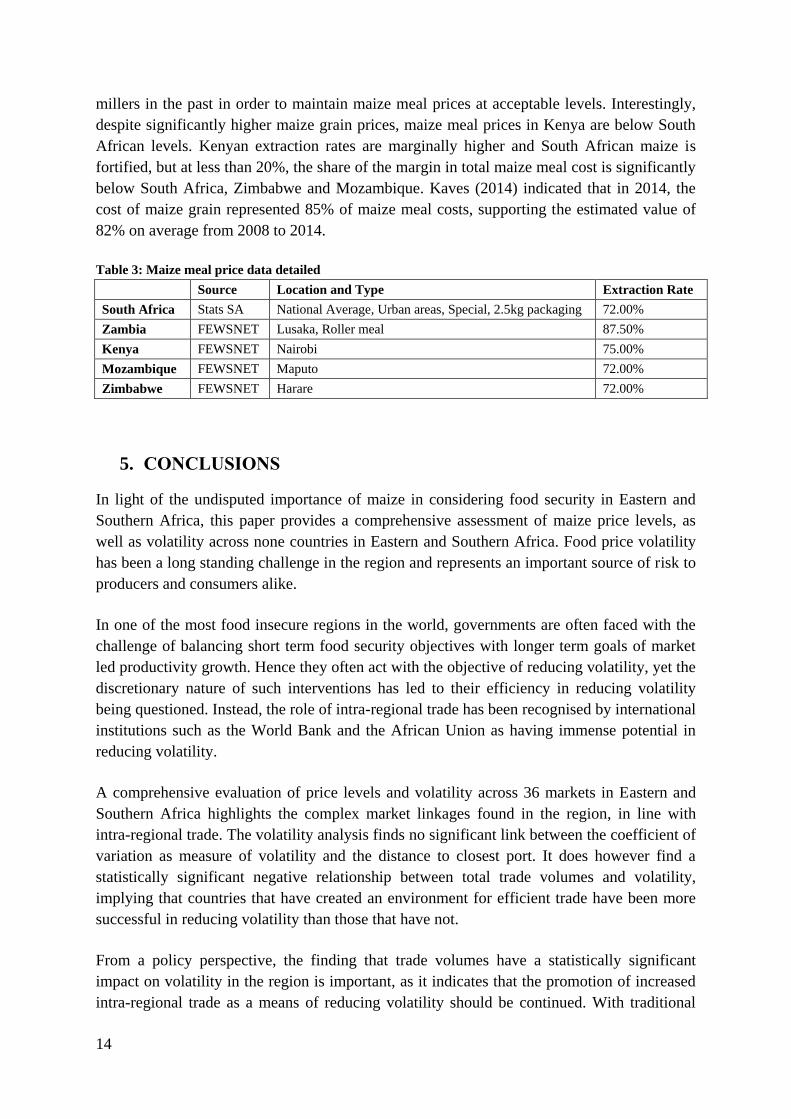
Table 3: Maize meal price data detailed
Source Location and Type Extraction Rate
South Africa Stats SA National Average, Urban areas, Special, 2.5kg packaging 72.00%
Zambia FEWSNET Lusaka, Roller meal 87.50%
Kenya FEWSNET Nairobi 75.00%
Mozambique FEWSNET Maputo 72.00%
Zimbabwe FEWSNET Harare 72.00%
5. CONCLUSIONS
In light of the undisputed importance of maize in considering food security in Eastern and
Southern Africa, this paper provides a comprehensive assessment of maize price levels, as
well as volatility across none countries in Eastern and Southern Africa. Food price volatility
has been a long standing challenge in the region and represents an important source of risk to
producers and consumers alike.
In one of the most food insecure regions in the world, governments are often faced with the
challenge of balancing short term food security objectives with longer term goals of market
led productivity growth. Hence they often act with the objective of reducing volatility, yet the
discretionary nature of such interventions has led to their efficiency in reducing volatility
being questioned. Instead, the role of intra-regional trade has been recognised by international
institutions such as the World Bank and the African Union as having immense potential in
reducing volatility.
A comprehensive evaluation of price levels and volatility across 36 markets in Eastern and
Southern Africa highlights the complex market linkages found in the region, in line with
intra-regional trade. The volatility analysis finds no significant link between the coefficient of
variation as measure of volatility and the distance to closest port. It does however find a
statistically significant negative relationship between total trade volumes and volatility,
implying that countries that have created an environment for efficient trade have been more
successful in reducing volatility than those that have not.
From a policy perspective, the finding that trade volumes have a statistically significant
impact on volatility in the region is important, as it indicates that the promotion of increased
intra-regional trade as a means of reducing volatility should be continued. With traditional
15
food stabilisation efforts having been shown to be counterproductive, policies aimed at
improving the efficiency of intra-regional trade are key to overcoming the long standing
problem of volatility in the region.
16
6. REFERENCES
Baffes, J., Kshirsagar, V., and Mitchell, D., 2015. What Drives Local Food Prices ? Evidence
from the Tanzanian Maize Market.
Baquedano, F.G. and Liefert, W.M., 2014. Market integration and price transmission in
consumer markets of developing countries. Food Policy, 44, 103–114.
Bryan, S. 2015 ‘A Cacophony of Policy Responses: Evidence from 14 Countries during the
2007–08 Food Crisis’. In P. Pinstrup-Andersen (ed.), Food Price Policy in an Era of
Market Instability: A Political Economy Analysis. Oxford: Oxford University Press
Chapoto, A. and Jayne, T.S., 2009. The Impact of Trade Barriers and Market Interventions
on Maize Price Unpredictability: Evidence from Eastern and Southern Africa.
Chapoto A and N Sitiko 2014 Understanding the effects of trade restriction on maize prices .
Presentation to COMESA/ACTESA Parliamentary Policy Seminar on Import and
Export Ban Lusaka 11-12 August 2014
Dorosh, P. Dradri, S. and S. Haggblade (2010) Regional trade and food security: recent
evidence from Zambia. In: Sarris, A and J. Morrison (eds) (2010) Food Security in
Africa: Market and Trade Policy for Staple Foods in Eastern and Southern Africa. pp
182 – 220. Edward Elgar Publishing and FAO
http://www.fao.org/docrep/018/i0714e/i0714e.pdf
Edelman, B. and Pauw, K., 2015. Discretionary Policy Interventions in Malawi: An Impact
Analysis of Export Bans and Minimum Farm Gate Prices.
Famine Early Warning Systems Network (FEWSNET). 2015. Unpublished data.
Famine Early Warning Systems Network (FEWSNET). 2014. Informal cross border trade in
Southern Africa. [Online] Available at: <
http://www.fews.net/sites/default/files/documents/reports/Food_Trade_Bulletin_Jul_-
_Sept_14_-1.pdf>
Food and Agricultural Organisation of the United Nations (FAO). 2015. Global Agro
Ecological Zones database. Accessed October 2015.
Haggblade, S. (2013), “Unscrambling Africa: Regional requirements for achieving food
security”, Development Policy Review, 31(2), pp. 149-176.
International Trade Council (ITC). 2016. Trademap database. [Online] Available at:
<www.trademap.org>
17
Jayne, T.S., 2012. Managing food price instability in East and Southern Africa. Global Food
Security, 1 (2), 143–149.
Jayne, T.S. and Tschirley, D.L., 2009. Food price spikes and strategic interactions between
the public and private sectors: Market failures or governance failures.
USAID-KAVES. 2014. Maize value chain analysis. [Online] Available at: <
http://www.eagc.org/documents/KAVES_Maize_Value_Chain_Analyses.pdf>
Minot, N., 2011. Transmission of World Food Price Changes to Markets in Sub-Saharan
Africa. IFPRI Discussion Paper Series, 01059 (January), 1–44.
Minot, N., 2014. Food price volatility in sub-Saharan Africa: Has it really increased? Food
Policy, 45, 45–56.
Morrison, J. 2016. “Managing food security risks and intra-regional trade in Africa” Rome,
FAO.
Organisation for Economic Coordination and Development (OECD) and Food and
Agriculture Organisation of the United Nations (FAO). 2016. OECD-FAO Agricultural
outlook 2016-2025. Forthcoming.
Tostao, E. and Brorsen, B.W., 2005. Spatial Efficiency in Mozambique’s Post-Reform Maize
Markets. Agricultural Economics, 33 (2), 205–214.
Traub, L., Myers, R., Jayne, T.S., and Meyer, F., 2010. Measuring Integration and Efficiency
in Maize Grain Markets: The Case of South Africa and Mozambique. Joint 3rd African
Association of Agricultural Economists (AAAE) and 48th Agricultural Economists
Association of South Africa (AEASA) Conference.
World Bank. 2012. Africa: Unlocking regional trade to help feed a continent. A World Bank
Research Report. [Online] Available at: <
http://siteresources.worldbank.org/INTAFRICA/Resources/Africa-Can-Feed-Africa-
Report.pdf>
Related Documents