Engine Testing and Instrumentation 1 Combustion Quality

Welcome message from author
This document is posted to help you gain knowledge. Please leave a comment to let me know what you think about it! Share it to your friends and learn new things together.
Transcript
Engine Testing and Instrumentation 1
Combustion Quality

Engine Testing and Instrumentation 2
Combustion chambers

Engine Testing and Instrumentation 3
Some classic combustion chambers
Engine Testing and Instrumentation 4
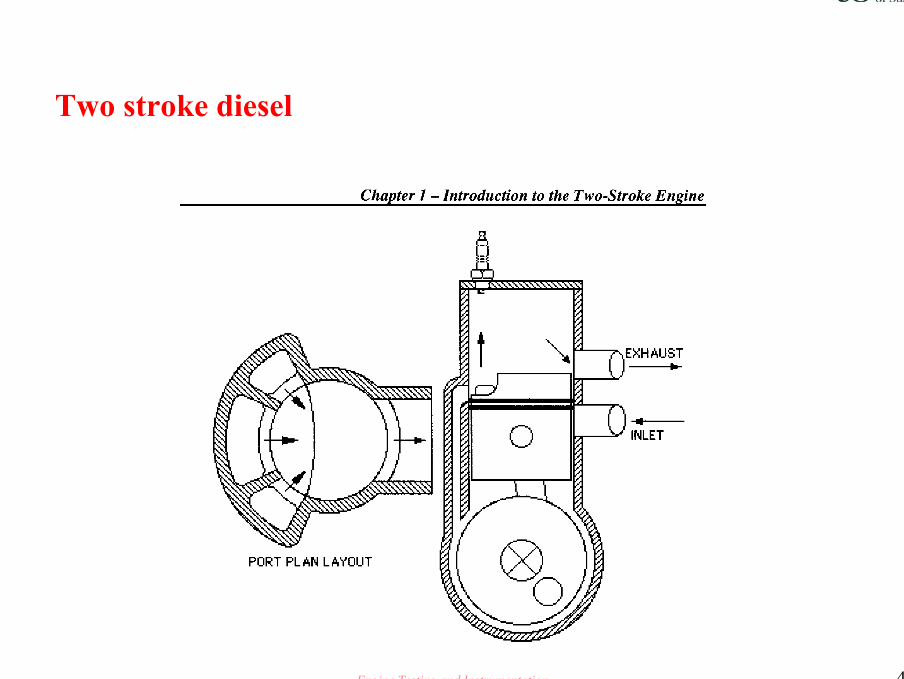
Two stroke diesel

Engine Testing and Instrumentation 5
Pressure/volume indicator diagram for a two stroke engine
Dotted line = four stroke

Engine Testing and Instrumentation 6
Two stroke designs
a= loop scavenge
a’= rotary valve loop scavenge
b=reverse loop scavenge
C= opposed piston
d= U-cylinder
e= poppet valve
F = sleeve valve

Engine Testing and Instrumentation 7

Engine Testing and Instrumentation 8
AVL advanced 2 stroke automotive concept 1996

Engine Testing and Instrumentation 9
Hesselman injector 1908

Engine Testing and Instrumentation 10
1910 McKechnie of Vicars
Engine Testing and Instrumentation 11
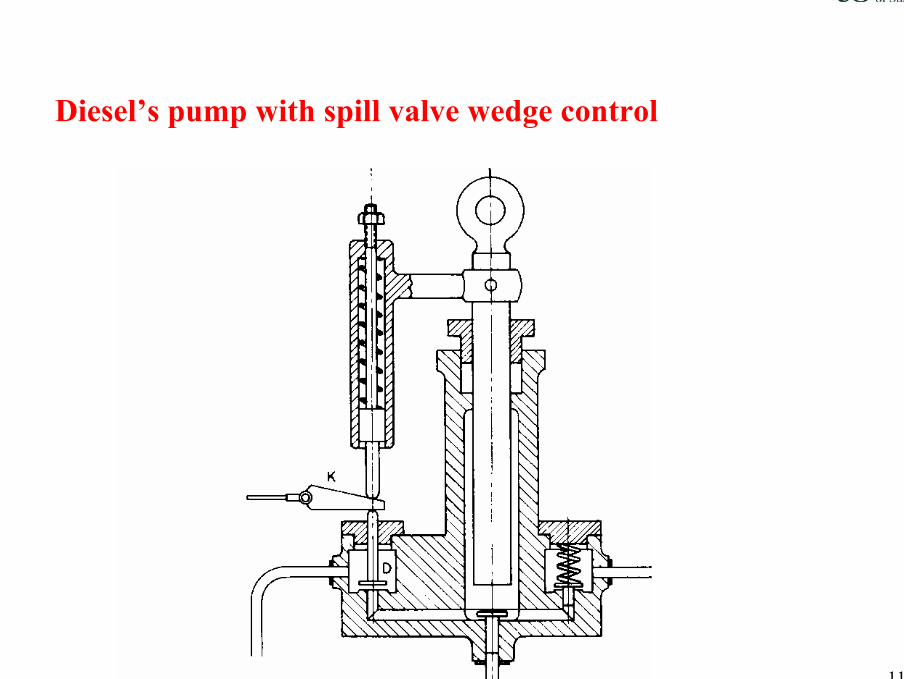
Diesel’s pump with spill valve wedge control

Engine Testing and Instrumentation 12
1914 Rotary valveFrancois Feyens of Belgium

Engine Testing and Instrumentation 13
1910 Peter Bowman DenmarkPintle valve. Bosch took on patent in 1935
Engine Testing and Instrumentation 14
Electro magnetic injector
• This was patented by Thomas T Gaff in the USA 1913

Engine Testing and Instrumentation 15
1905 Unit injectorcombined nozzle and pump

Engine Testing and Instrumentation 16
The pre-combustion chamber

Engine Testing and Instrumentation 17
The Wirl-chamber process

Engine Testing and Instrumentation 18
Sheathed element glow plug

Engine Testing and Instrumentation 19
DI Configuration
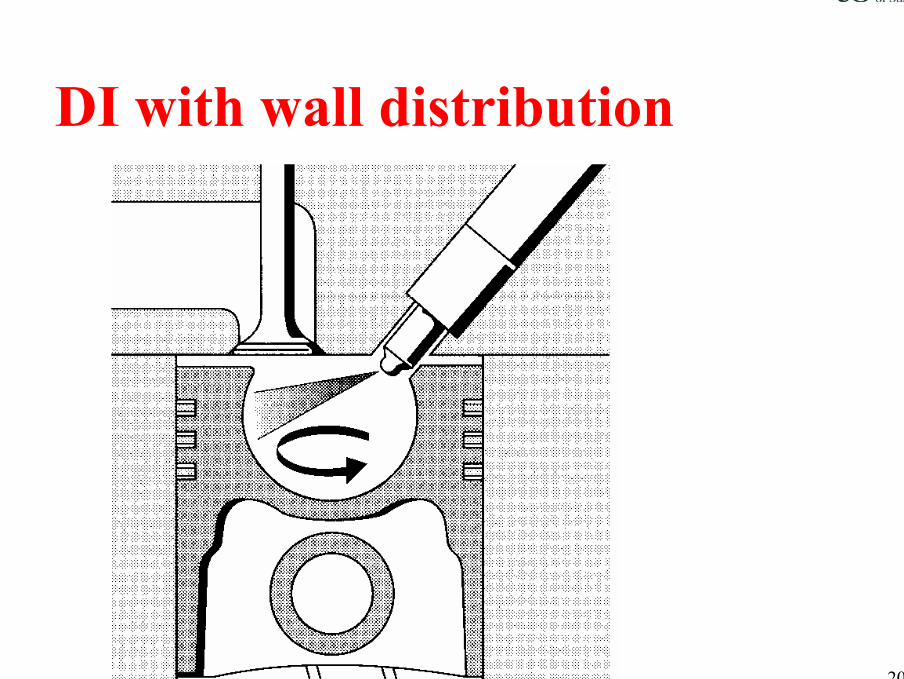
Engine Testing and Instrumentation 20
DI with wall distribution
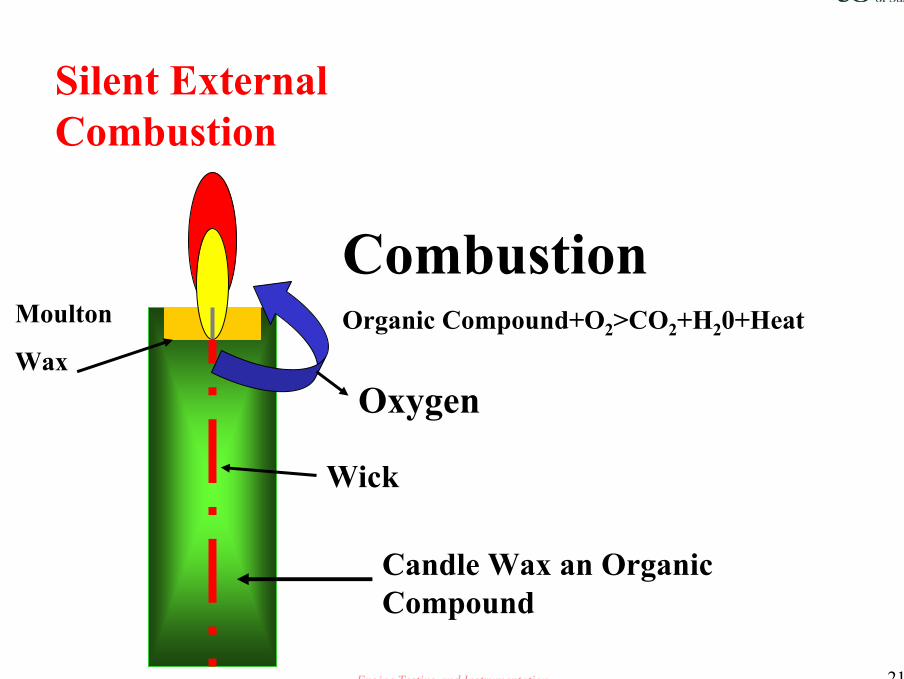
Engine Testing and Instrumentation 21
Silent External Combustion
CombustionOrganic Compound+O2>CO2+H20+Heat
Oxygen
Moulton
Wax
Wick
Candle Wax an Organic Compound
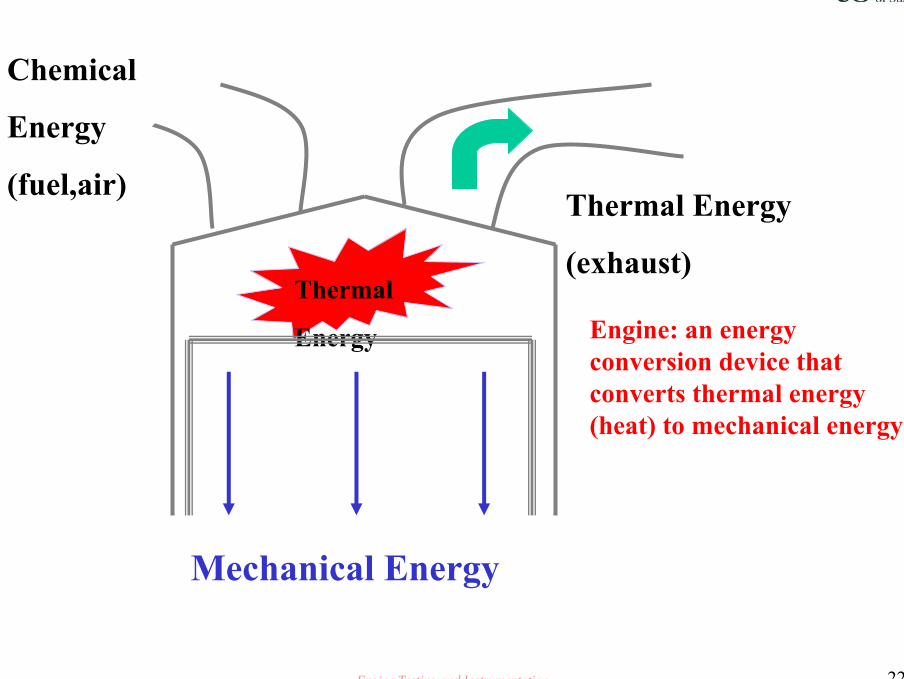
Engine Testing and Instrumentation 22
Thermal
Energy
Mechanical Energy
Thermal Energy
(exhaust)
Chemical
Energy
(fuel,air)
Engine: an energy conversion device that converts thermal energy (heat) to mechanical energy

Engine Testing and Instrumentation 23
PV Diagram
Clearance Volume
Swept volume
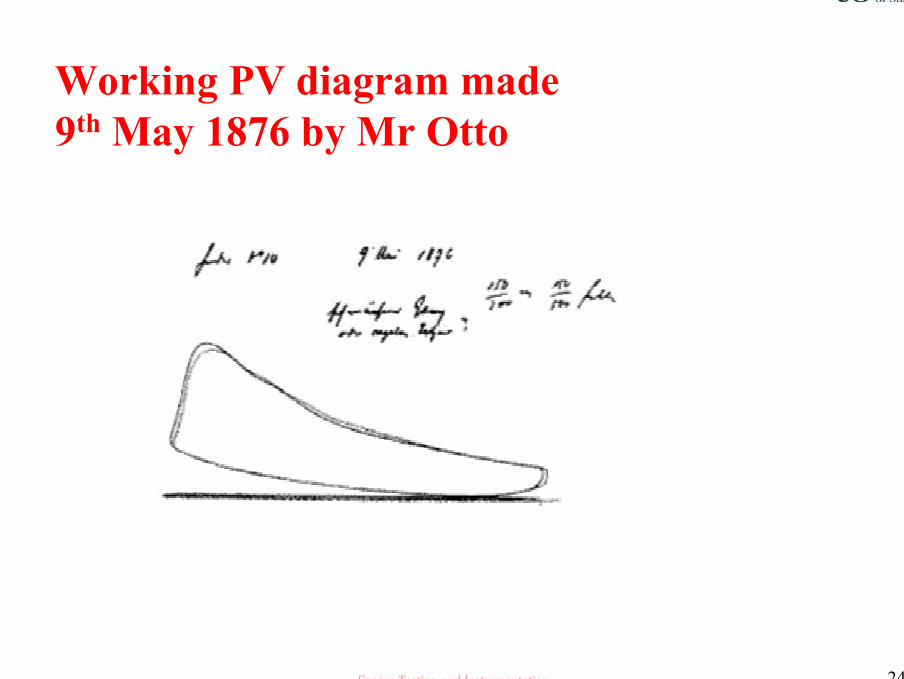
Engine Testing and Instrumentation 24
Working PV diagram made9th May 1876 by Mr Otto

Engine Testing and Instrumentation 25
What you would see on your screen

Engine Testing and Instrumentation 26
Phasing Efficiency
• Overall engine loss when spark timing differs from overall engine MBT
• Individual cylinder loss when individual cylinder MBT differs from overall engine MBT
• Individual cycle loss when individual cycle phasing (CA50) differs from optimal phasing
There will always be phasing efficiency loss

Engine Testing and Instrumentation 27
2000 4000 6000 8000 10000
Engine Speed rev/min
50
100
150
200
300
Ho r
sep o
wer
Power required to overcome rotating and reciprocating losses

Engine Testing and Instrumentation 28
Cylinder Pressure Measurements
Cylinder Pressure vs.Crank Angle
-450 -360 -270 -180 -90 0 90 180 270 360
TDC BDC TDC BDC TDC
Intake Stroke Compression Expansion Exhaust
400
800
1200
1600
kPa

Engine Testing and Instrumentation 29
Otto CycleCylinder Pressure (kPa) vs.Cylinder volume (cc)
0 100 200 300 400 500 600 700 800 900
1000
2000
3000
4000
5000
6000
Expansion
Exhaust&intake
Compression
ήth,ideal = 1- 1
rc γ-1
Where, ή =thermal efficiencyγ = specific heat ratio
rc = COMPRESSION ratio

Engine Testing and Instrumentation 30
Cylinder Pressure MeasurementsCylinder Volume vs.Crank Angle
-450 -360 -270 -180 -90 0 90 180 270 360
900
Cyl.Vol.cc
800700600500400300200100
0
TDC BDC TDC BDC TDC
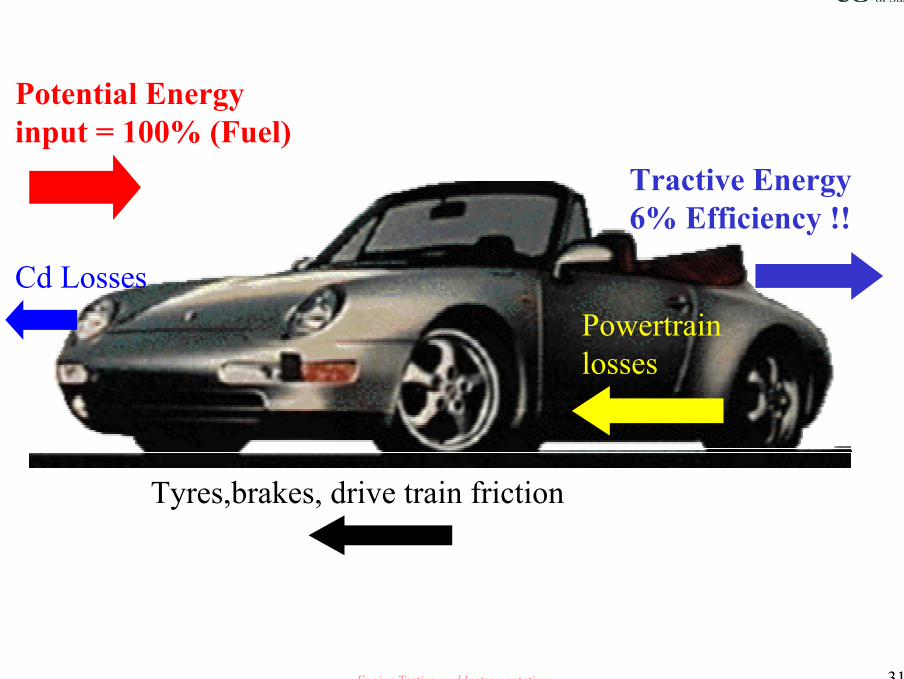
Engine Testing and Instrumentation 31
Potential Energy input = 100% (Fuel)
Cd Losses
Tyres,brakes, drive train friction
Powertrain losses
Tractive Energy 6% Efficiency !!

Engine Testing and Instrumentation 32
Induction
tract Exhaust manifold
EGR valve
Combustion System
Losses:•Thermodynamic cycle•Real gas•Heat•Mass•Time of event•Pumping•Valve overlap•Mechanical losses

Engine Testing and Instrumentation 33
PV Diagram
EXPINTAKE
EXH
COMP
Cyl
ind e
r P r
essu
re(k
P a)
Cylinder Volume (cc)

Engine Testing and Instrumentation 34
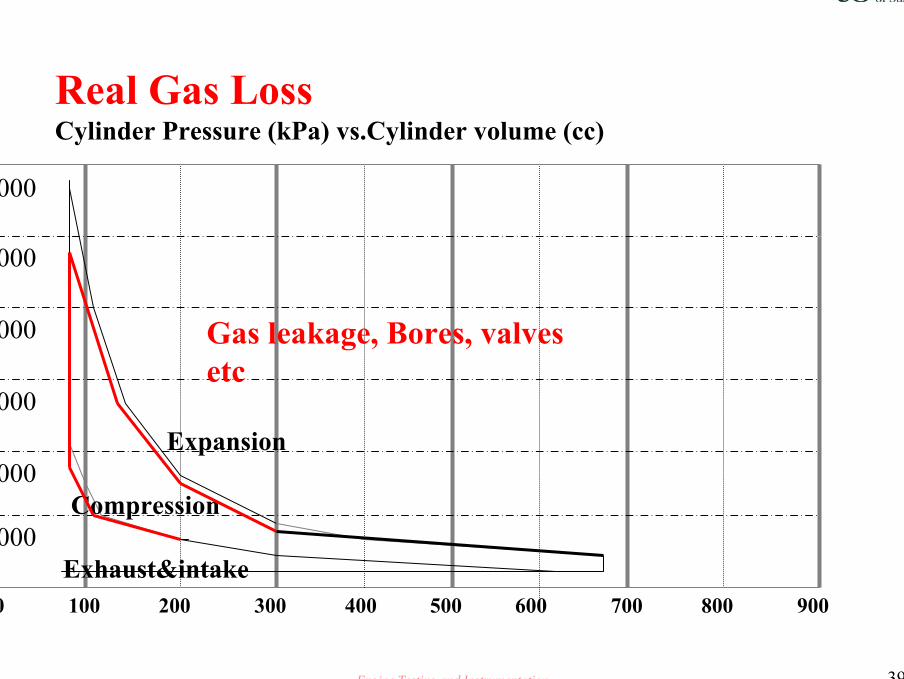
Real Gas LossCylinder Pressure (kPa) vs.Cylinder volume (cc)
0 100 200 300 400 500 600 700 800 900
1000
2000
3000
4000
5000
6000
Expansion
Exhaust&intake
Compression
Gas leakage, Bores, valves etc
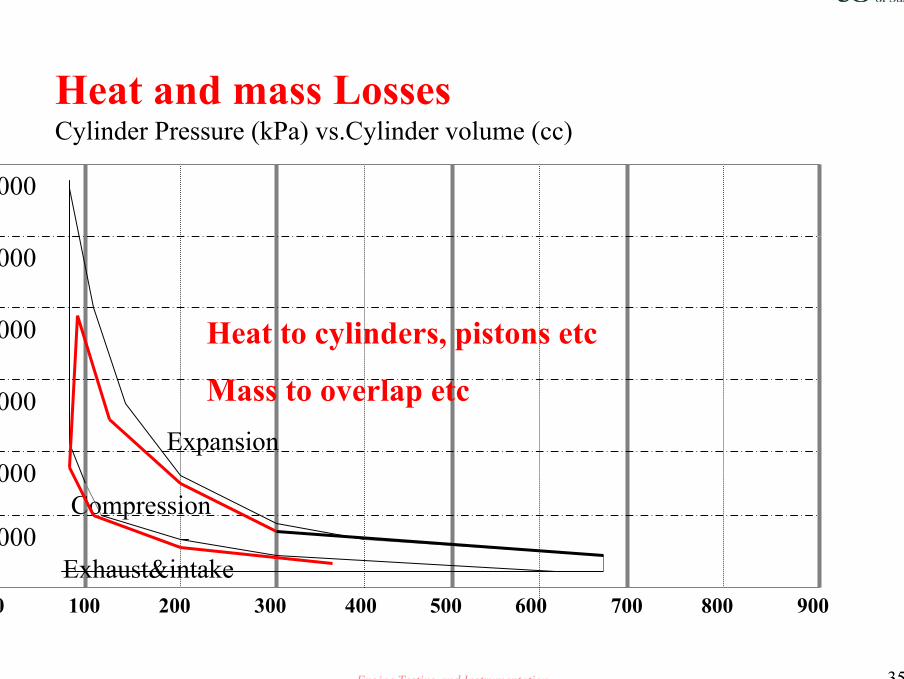
Engine Testing and Instrumentation 35
Heat and mass LossesCylinder Pressure (kPa) vs.Cylinder volume (cc)
0 100 200 300 400 500 600 700 800 900
1000
2000
3000
4000
5000
6000
Expansion
Exhaust&intake
Compression
Heat to cylinders, pistons etc
Mass to overlap etc

Engine Testing and Instrumentation 36
Incomplete combustionLosses
Cylinder Pressure (kPa) vs.Cylinder volume (cc)
0 100 200 300 400 500 600 700 800 900
1000
2000
3000
4000
5000
6000
Expansion
Exhaust&intake
Compression
Incomplete Combustion

Engine Testing and Instrumentation 37
Pumping LossesCylinder Pressure (kPa) vs.Cylinder volume (cc)
0 100 200 300 400 500 600 700 800 900
1000
2000
3000
4000
5000
6000
Expansion
Exhaust&intake
Compression
Pumping losses
Engine Testing and Instrumentation 38
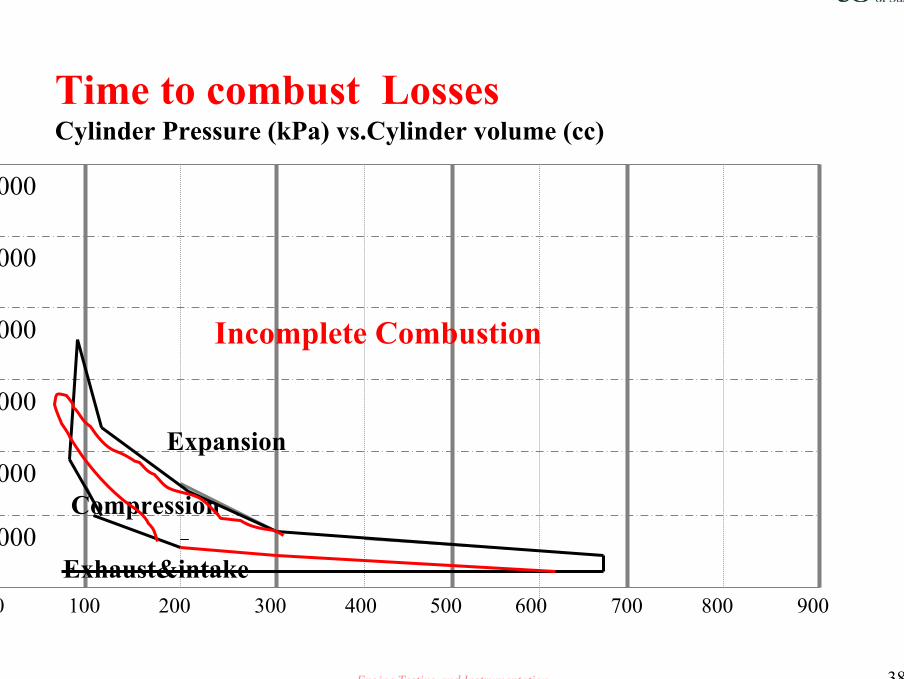
Time to combust LossesCylinder Pressure (kPa) vs.Cylinder volume (cc)
0 100 200 300 400 500 600 700 800 900
1000
2000
3000
4000
5000
6000
Expansion
Exhaust&intake
Compression
Incomplete Combustion
Engine Testing and Instrumentation 39
Real Gas LossCylinder Pressure (kPa) vs.Cylinder volume (cc)
0 100 200 300 400 500 600 700 800 900
1000
2000
3000
4000
5000
6000
Expansion
Exhaust&intake
Compression
Gas leakage, Bores, valves etc

Engine Testing and Instrumentation 40
Otto CycleCylinder Pressure (kPa) vs.Cylinder volume (cc)
0 100 200 300 400 500 600 700 800 900
1000
2000
3000
4000
5000
6000
Engine Testing and Instrumentation 41
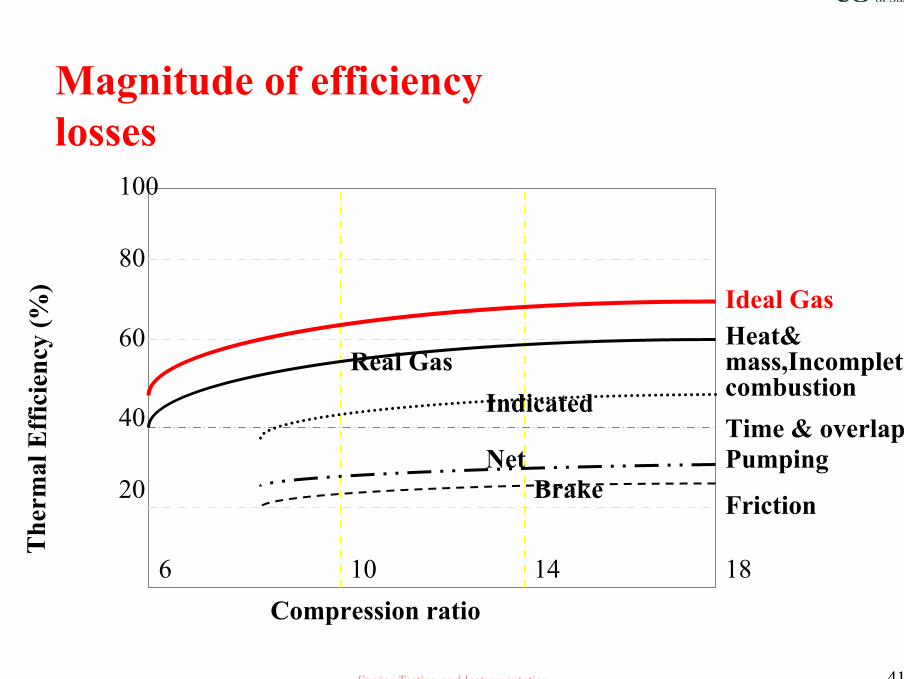
Magnitude of efficiencylosses
6 10 14 18Compression ratio
20
40
60
80
100
The
rmal
Eff
icie
ncy
(%) Ideal Gas
Real GasIndicated
NetBrake Friction
Pumping
Heat& mass,Incomplete combustionTime & overlap

Engine Testing and Instrumentation 42
Torque versus sparktiming for a complete engine
Spark Timing (Degrees before Top Dead Centre)
Tor
que
( Nm
)
MBT spark
Advance Retard
Combustion phasing loss away from MBT

Engine Testing and Instrumentation 43
Phasing loss Individual cylinder MBVT is notequal to the overall engine MBT
Tor
que
(Nm
)
Spark Timing (Degrees BTDC)
No4 No1No3 No2
Overall MBT

Engine Testing and Instrumentation 44
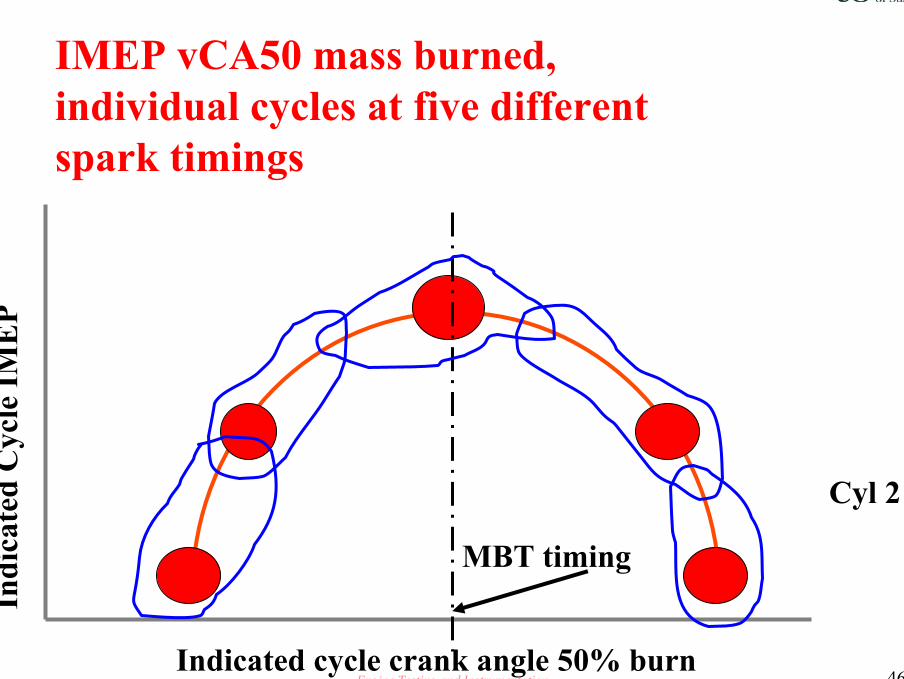
IMEP v CA of 50% mass burnedOne cylinder average at 5 different spark timings
MBT timing
Cyl 2
IME
P av
g.
CA50% Mass Burn average
RetardAdvance
Combustion phasing loss deducted from
individual cylinder MBT
Engine Testing and Instrumentation 45
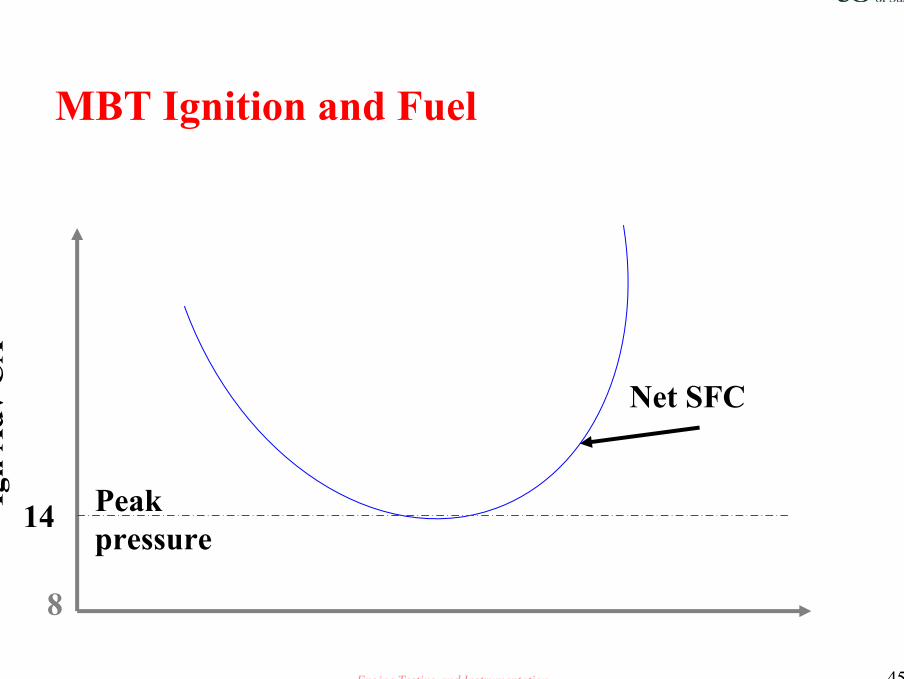
MBT Ignition and Fuel
Ign
Adv
CA
14
8
Peak pressure
Net SFC
Engine Testing and Instrumentation 46
IMEP vCA50 mass burned, individual cycles at five different spark timings
MBT timing
Cyl 2
Indi
cate
d C
ycle
IME
P
Indicated cycle crank angle 50% burn

Engine Testing and Instrumentation 47
Cyl 2
MBT spark timing
Indi
cate
d cy
cle
IME
P
Indicated cycle Crank angle 50% burn
RetardAdvance
Combustion phasing loss away from MBT

Engine Testing and Instrumentation 48
Phasing Efficiency Loss Summary
• Overall engine loss when spark timing differs from overall engine MBT
• Individual cylinder loss when individual cylinder MBT differs from overall engine MBT
• Individual cycle loss when individual cycle phasing (CA50) differs from optimal phasing
There will always be phasing efficiency loss
Engine Testing and Instrumentation 49
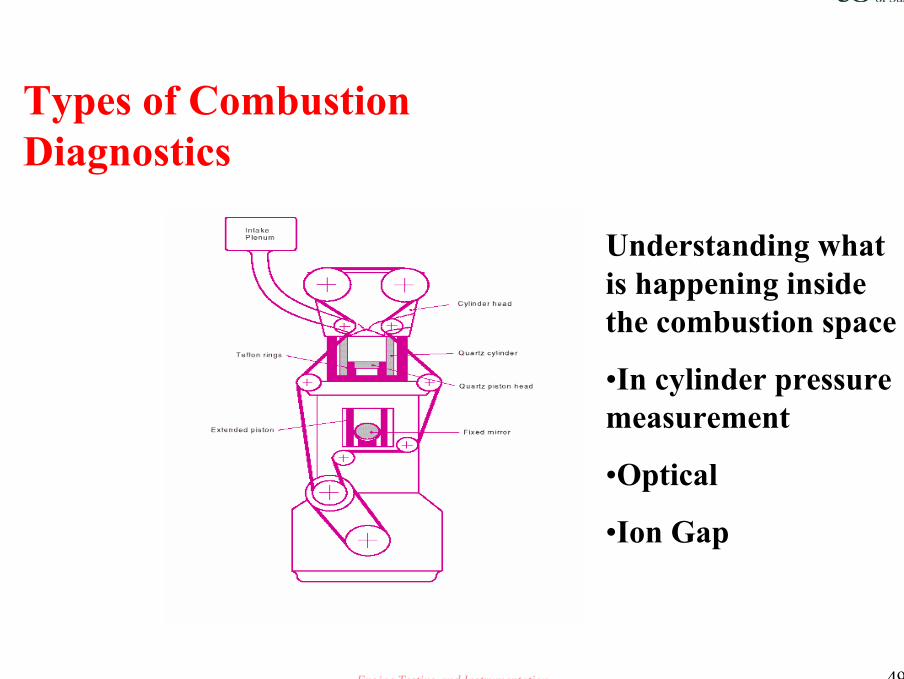
Understanding what is happening inside the combustion space
•In cylinder pressure measurement
•Optical
•Ion Gap
Types of Combustion Diagnostics
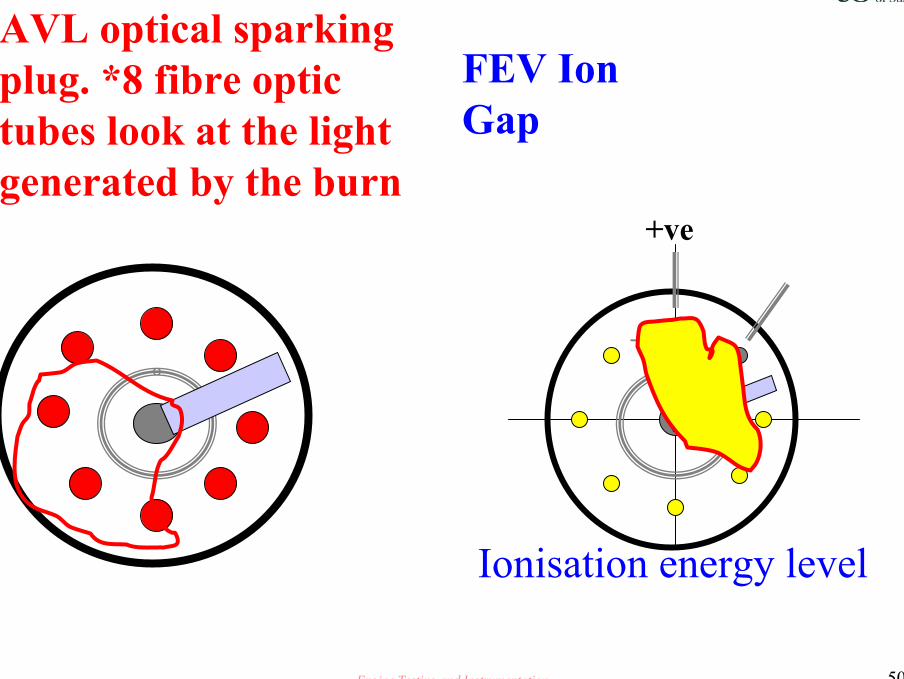
Engine Testing and Instrumentation 50
AVL optical sparking plug. *8 fibre optic tubes look at the light generated by the burn
FEV Ion Gap
+ve
-ve
Ionisation energy level

Engine Testing and Instrumentation 51
Cylinder-Pressure Based Combustion Analysis
Measurement and interpretation ofcombustion chamber pressure to determine:• Piston and crankshaft loads• Torque produced from the burning air/fuel charge• Torque required to induct the fresh charge and exhaust the burned
charge• Time required for the combustion flame to develop and propagate• Spark timing relative to MBT• Presence and magnitude of knock• Cycle to cycle and cylinder to cylinder variability

Engine Testing and Instrumentation 52
Cylinder-Pressure Based Combustion Analysis
Some uses of combustion analysis• Assessing inlet/exhaust port and manifold geometries• Optimising combustion chamber shape• Quantifying compression ratio trade offs• Comparing spark plug parameters• Selecting valve timing overlap and duration• Optimising fuel injector timing and opening duration• Investigating transient response• Measuring mechanical friction• Automated mapping (MBT,Knock/Pre ignition control)• Calibration optimisation

Engine Testing and Instrumentation 53
Combustion Performance Parameters
• Mean Effective Pressure
• Combustion Phasing
• Cyclic Variability
• Heat Release
• Equation Summary
Engine Testing and Instrumentation 54
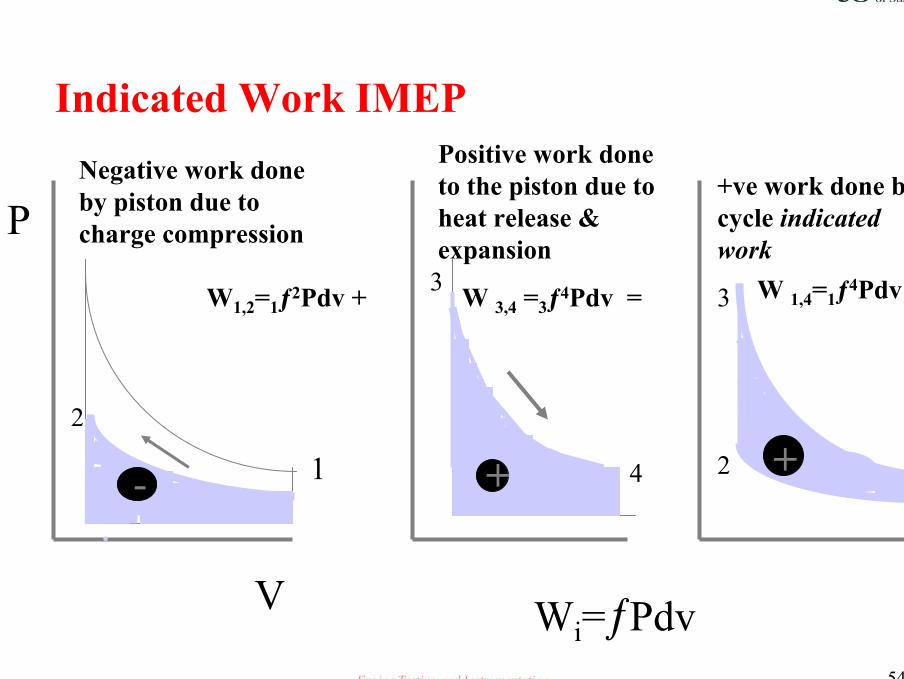
Indicated Work IMEP
.
.-
P
V
1
2
+
3
4 ++
3
2 4
1
W1,2=1ƒ2Pdv + W 3,4 =3ƒ4Pdv = W 1,4=1ƒ4Pdv
Negative work done by piston due to charge compression
Positive work done to the piston due to heat release & expansion
+ve work done by cycle indicated work
Wi=ƒPdv

Engine Testing and Instrumentation 55
Indicated Pressure IMEP
++
P P
V V
MEP
IMEP= +180ƒ-180
PdV/Vdisp
Note:PV areas are of equal area
Engine Testing and Instrumentation 56
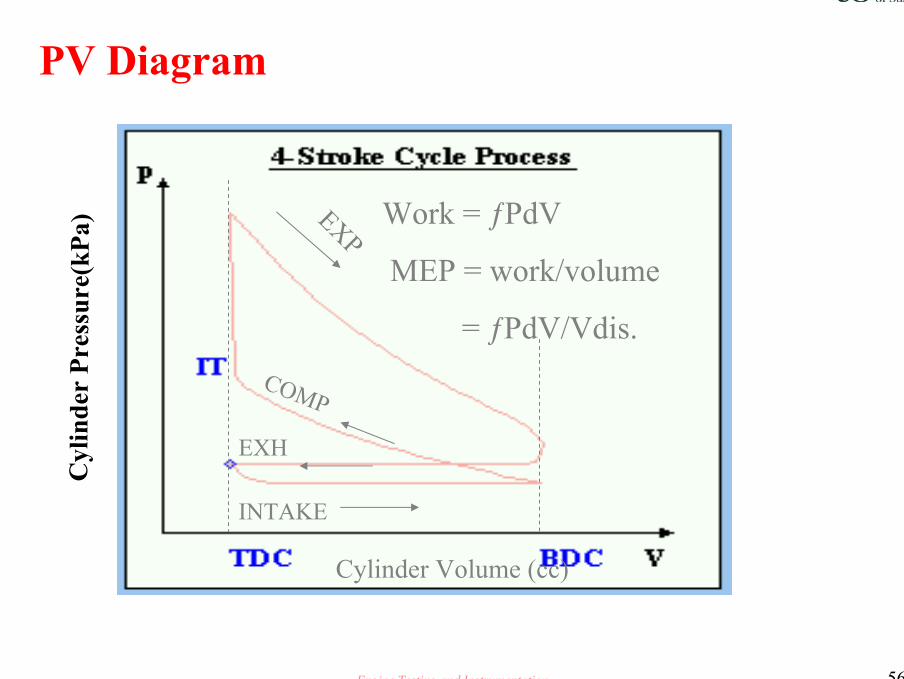
PV Diagram
EXPINTAKE
EXH
COMP
Cyl
ind e
r P r
essu
re(k
P a)
Cylinder Volume (cc)
Work = ƒPdV
MEP = work/volume
= ƒPdV/Vdis.
Engine Testing and Instrumentation 57
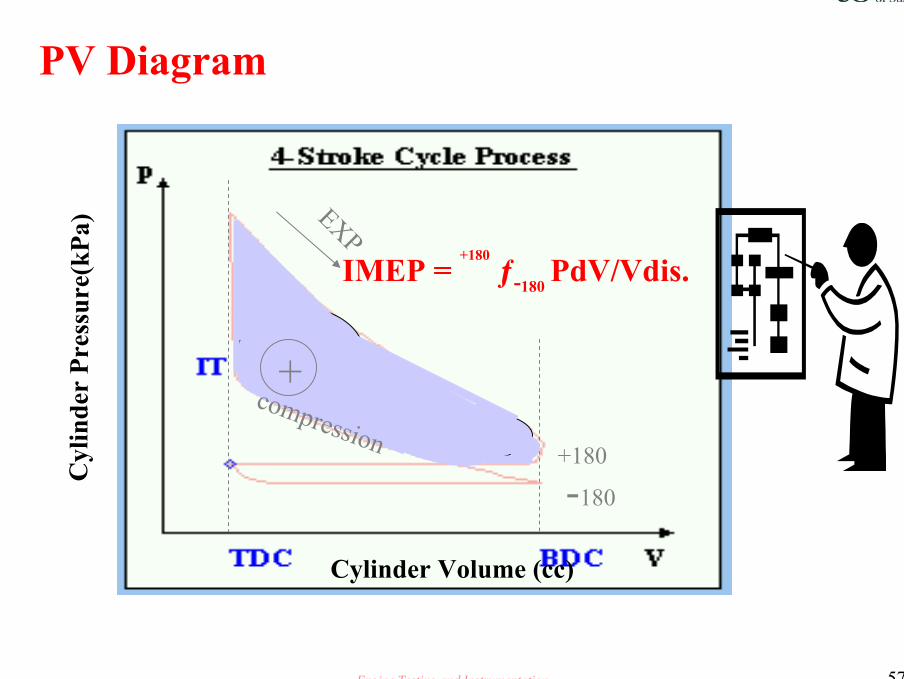
PV Diagram
EXP
COMP
Cyl
ind e
r P r
essu
re(k
P a)
Cylinder Volume (cc)
IMEP = +180
ƒ-180PdV/Vdis.
+compression +180
-180

Engine Testing and Instrumentation 58
–exhaust
intake
Cylinder volume (cc)
Cyl
inde
r Pr
essu
re (k
Pa) PMEP= +540ATDC
ƒ+180ATDCPdV/Vdisp

Engine Testing and Instrumentation 59
-
+
intake
Exhaust+180
-180+540
compression
expansion
NMEP = +540ƒ-180 PdV/Vdisp
= IMEP + PMEP
Cyl
inde
r Pr
essu
re (k
Pa)
Cylinder Volume (cc)

Engine Testing and Instrumentation 60
IndicatedCompression,Combustion and
expansionDiff= Pumping
Net Adds Intake & Exhaust Processes
Diff = Friction
Brake Adds Rubbing Friction Losses
MEP Summary

Engine Testing and Instrumentation 61
Combustion Performance ParametersCylinder Pressure vs Cylinder Volume-Influence of Load
Engine Testing and Instrumentation 62
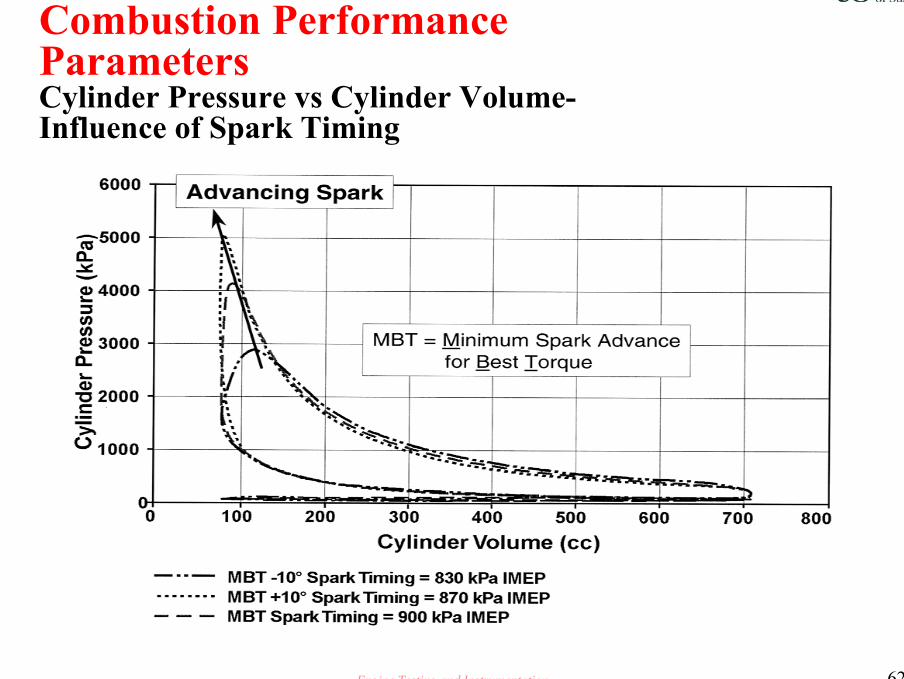
Combustion PerformanceParametersCylinder Pressure vs Cylinder Volume-Influence of Spark Timing

Engine Testing and Instrumentation 63
Combustion PerformanceParametersCylinder Pressure vs Crank Angle-Influence of Spark Timing
Engine Testing and Instrumentation 64
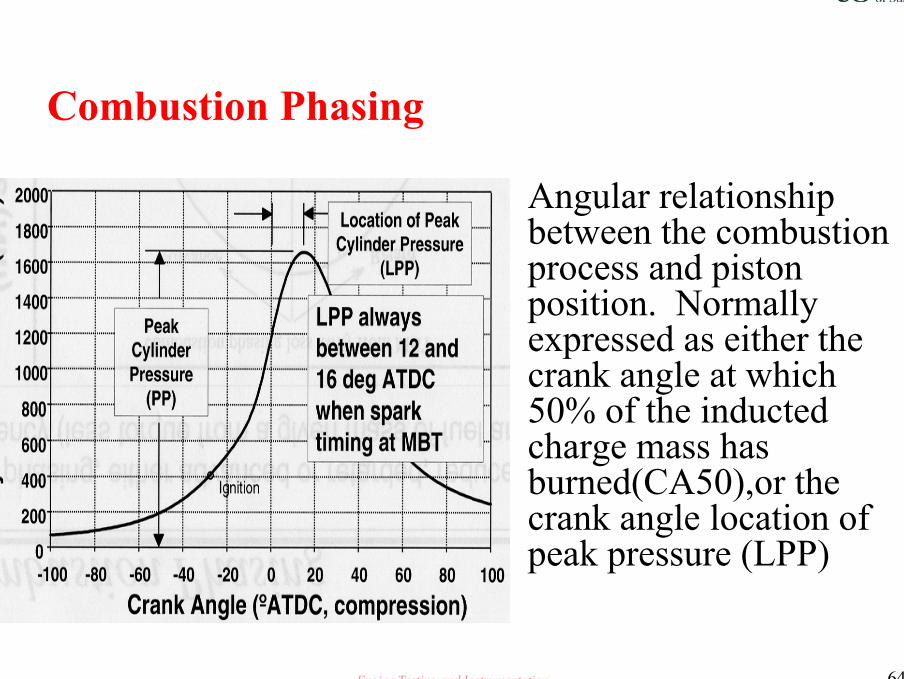
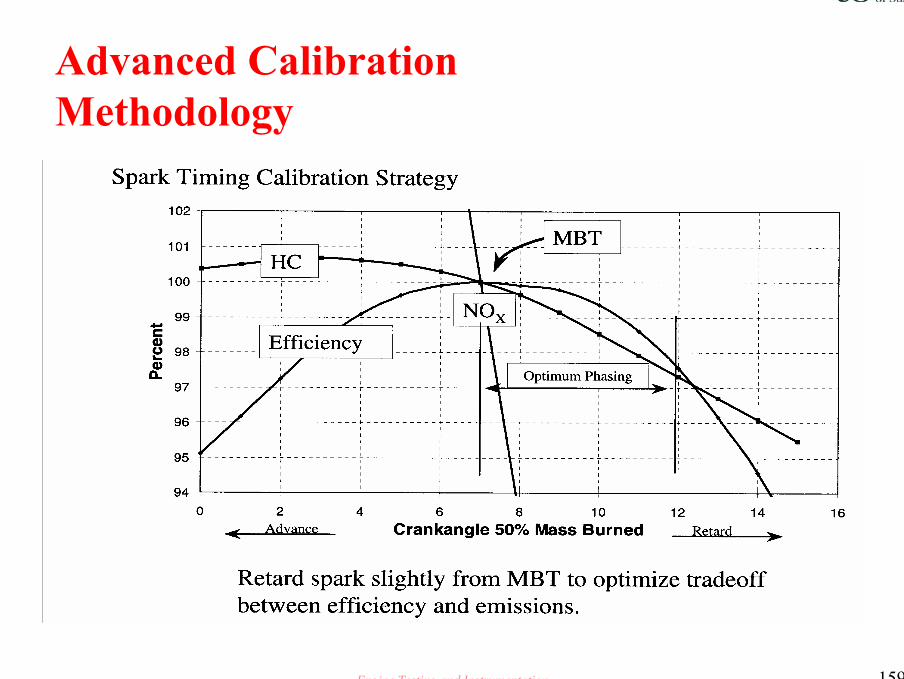
Combustion Phasing
Angular relationship between the combustion process and piston position. Normally expressed as either the crank angle at which 50% of the inducted charge mass has burned(CA50),or the crank angle location of peak pressure (LPP)
Engine Testing and Instrumentation 65
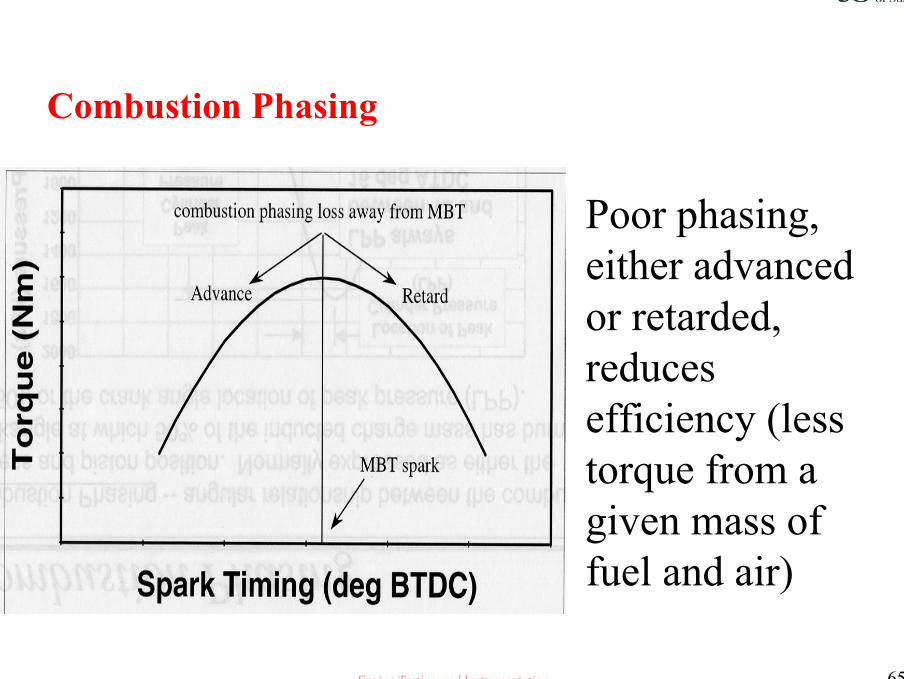
Combustion Phasing
Poor phasing, either advanced or retarded, reduces efficiency (less torque from a given mass of fuel and air)
Engine Testing and Instrumentation 66
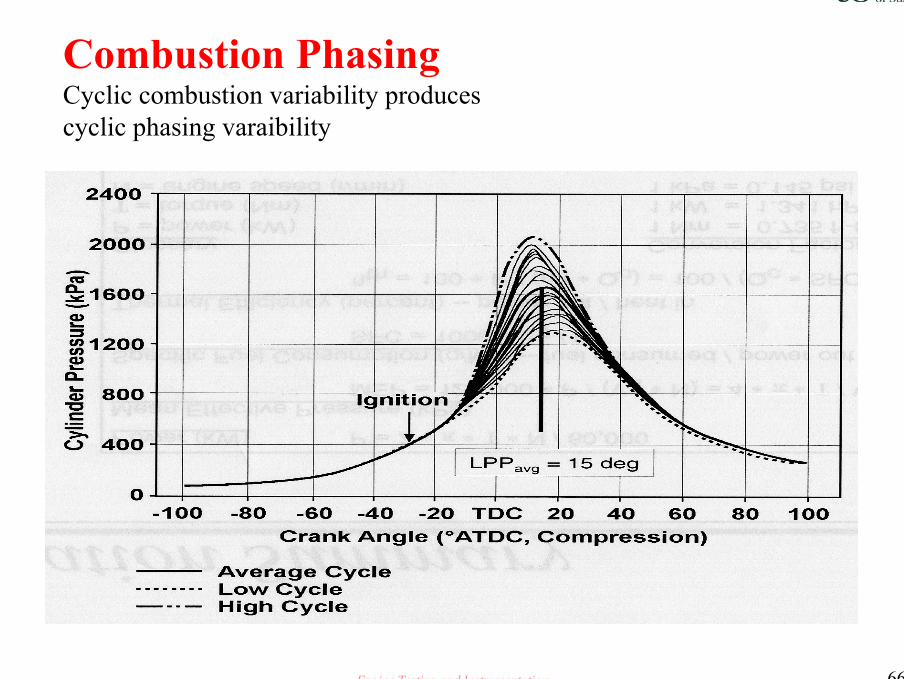
Combustion PhasingCyclic combustion variability producescyclic phasing varaibility
Engine Testing and Instrumentation 67
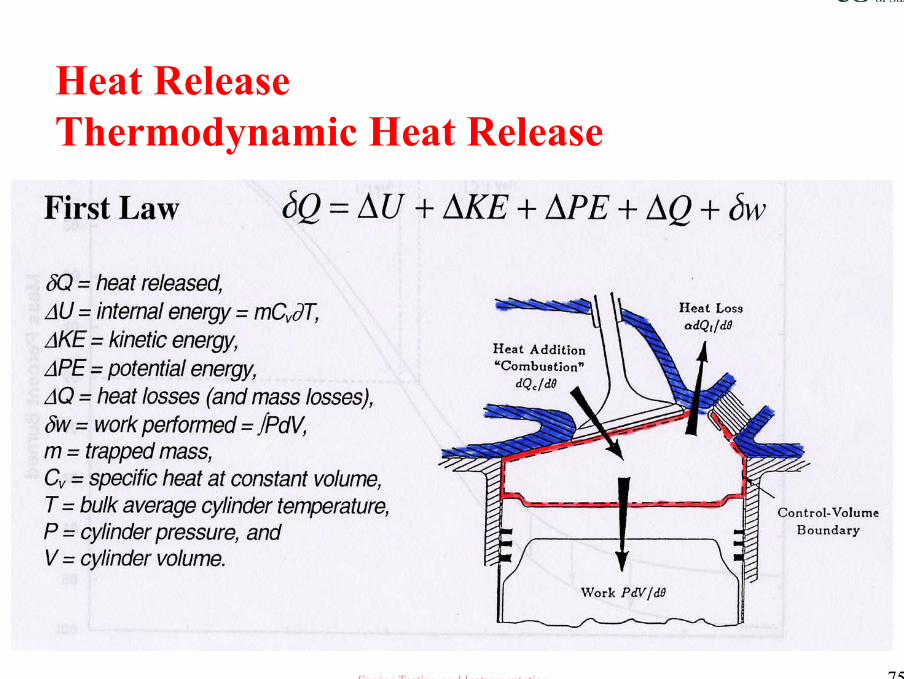
Heat Release
Analysis of cylinder pressure from a firing engine to determine the burn history of the combustion event on a crank-angle –by- crank-angle basis

Engine Testing and Instrumentation 68
Approximate Heat Release

Engine Testing and Instrumentation 69
Approximate Heat Release

Engine Testing and Instrumentation 70
Heat ReleaseApproximate Heat Release

Engine Testing and Instrumentation 71
Heat Release
Approximate Heat Release• Advantages
– Computationally simple—can be performed in real time– Requires relatively few, readily available inputs
• Major assumptions– All cycles have 100% combustion efficiency– Polytropic coefficients are equal and constant
• Recommended Application– Stable operating condition with no partial burns
Engine Testing and Instrumentation 72
Heat Release
Thermodynamic Heat ReleaseAdvantages:• Thermodynamically tracks the mass of fuel burned on an
individual – cycle basis, permitting..– Quantifying partial burns and misfires– Quantifying residual fraction and residual composition– Quantifying heat losses
• Provides accurate statistics on burn rate variability
Engine Testing and Instrumentation 73
Heat release
• Thermodynamic Heat Release• Assumptions:
– Heat transfer can be modelled by an empirical correlation (modified Woschni)
– Pressure data and other inputs are accurate• Other Inputs:
– Swirl number, fuel flow, stoichiometry,combustion efficiency, lower heating value of fuel, combustion chamber surface area, valve timing
• Recommendations:– Combustion evaluation at conditions with high cycle
variability

Engine Testing and Instrumentation 74
Heat Release
Engine Testing and Instrumentation 75
Heat ReleaseThermodynamic Heat Release

Engine Testing and Instrumentation 76
Heat ReleaseProcessing Options for CAS, cont..

Engine Testing and Instrumentation 77
Heat ReleaseProcessing Options for CAS cont.
Engine Testing and Instrumentation 78
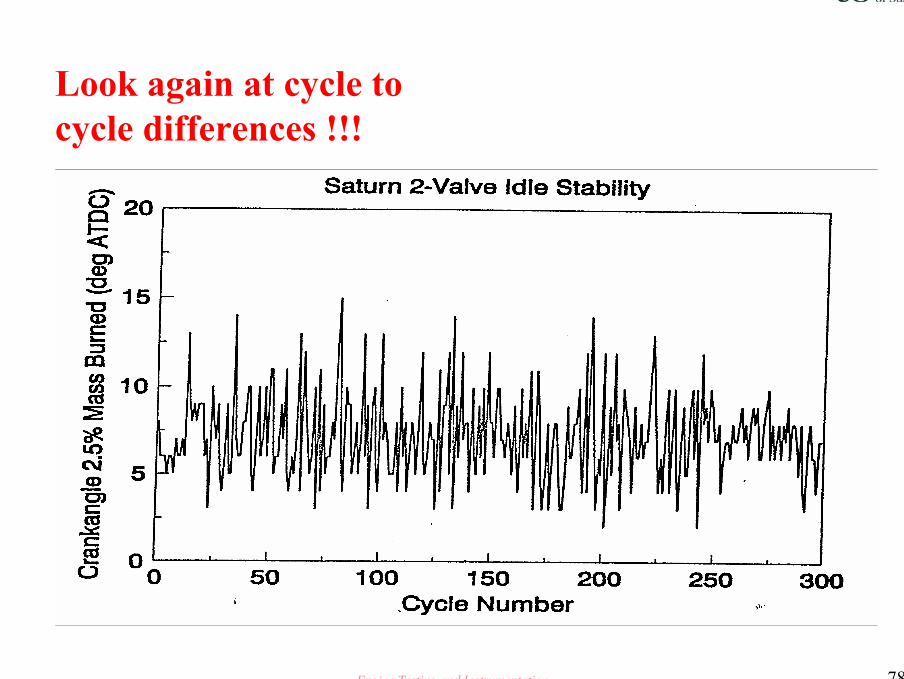
Look again at cycle tocycle differences !!!
Engine Testing and Instrumentation 79
Heat Release
Sample Analysis
• Idle assessment
• Combustion phasing
• Burn rate profile analysis for knock

Engine Testing and Instrumentation 80
Combustion Variability
What is it ?
Variation in combustion (IMEP) from cycle-to-cycle and cylinder-to-cylinder.
Engine cycles are like fingerprints--- no two are the same.
Engine Testing and Instrumentation 81
Combustion Variability
How does it manifest itself• Engine roughness
– Cyclic and cylinder-to –cylinder variations in torque and engine speed
• Compromised torque/power• Lower resistance to knock• Efficiency losses
– Higher emissions– Lower fuel consumption
• Compromised spark timing• Compromised dilution tolerance
Engine Testing and Instrumentation 82
Combustion Variability
Causes• Mixture motion at the location and time of spark• Variation in the amount of air and fuel inducted each cycle• Mixing of the air,fuel, and exhaust residuals• Fuel preparation(droplet size,cone angle,targeting)• Long burn duration due to poor combustion system
hardware design• Low ignition energy,small plug gap

Engine Testing and Instrumentation 83
Combustion Variability
• Combustion variability impacts engine performance at all operating conditions:– Idle
• Instability is typically driven by variations in fuel flow and exhaust residuals
– Part-Load• Variability is driven by fuel flow variations and EGR
– WOT• Combustion instability is typically dictated by variations in
airflow

Engine Testing and Instrumentation 84
Combustion Variability

Engine Testing and Instrumentation 85
Combustion Variability

Engine Testing and Instrumentation 86
Combustion Variability

Engine Testing and Instrumentation 87
Combustion Variability
How is it Quantified ?• The most common methods to quantify cycle-to-cycle and
cylinder-to-cylinder variability includes:– Standard deviation of IMEP– Coefficient of variation of IMEP– Lowest normalized value of IMEP– Standard deviation of rev/min– IMEP imbalance– RMS of the Delta IMEP– Variation of burn parameters
Engine Testing and Instrumentation 88
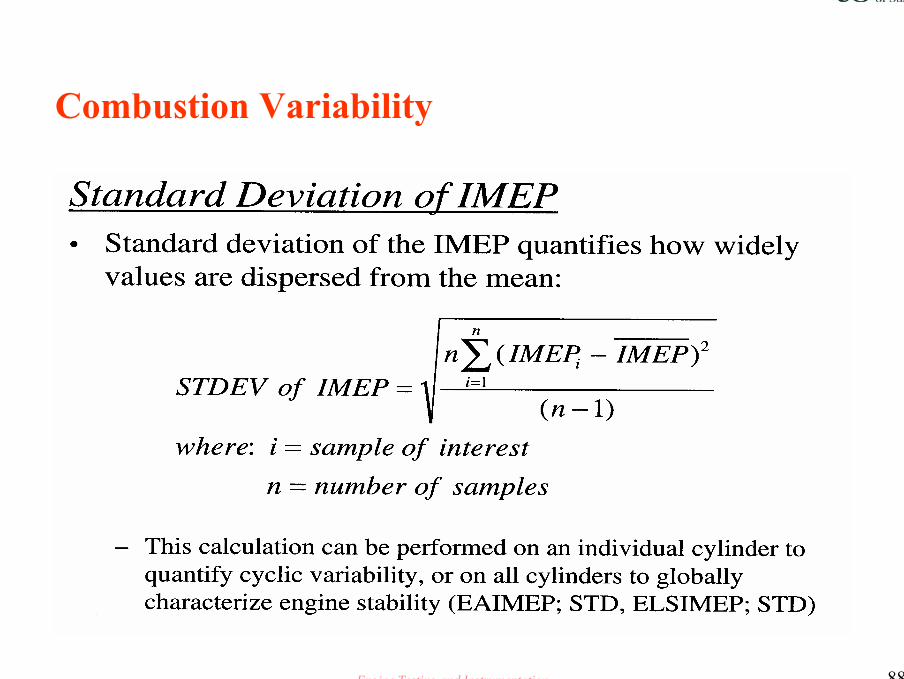
Combustion Variability

Engine Testing and Instrumentation 89
Combustion Variability
Coefficient of Variation of IMEP• COV of IMEP quantifies variability in indicated
work per cycle by expressing the standard deviation as a percentage of the mean IMEP:
COV of IMEP = STDEV of IMEP * 100IMEP
– While opinions vary, a degradation in vehicle driveability can typically be noticed when the COV of IMEP exceeds 3% - 5%.
Engine Testing and Instrumentation 90
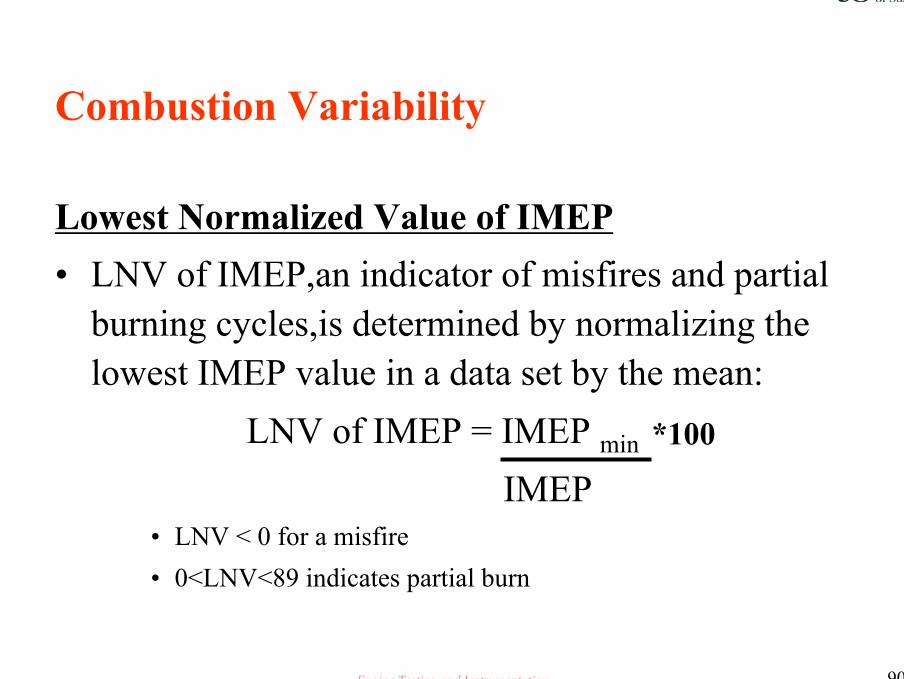
Combustion Variability
Lowest Normalized Value of IMEP• LNV of IMEP,an indicator of misfires and partial
burning cycles,is determined by normalizing the lowest IMEP value in a data set by the mean:
LNV of IMEP = IMEP min *100
IMEP• LNV < 0 for a misfire• 0<LNV<89 indicates partial burn

Engine Testing and Instrumentation 91
Combustion Variability
IMEP Imbalance• IMEP imbalance, a measure of cylinder-to-cylinder
variation, is quantified by subtracting the average IMEP in the weakest cylinder from the average IMEP in the strongest cylinder, and then normalising by the mean IMEP
IMEP imbalance=IMEP i,max – IMEP i,min * 100
IMEP engine

Engine Testing and Instrumentation 92
Combustion Variability

Engine Testing and Instrumentation 93
Combustion Variability
Some thoughts to ponder• Do the combustion stability metrics already discussed
provide the best measure of combustion stability?
• What does the driver feel?• What about the difference in work from each cylinder
event in firing order ?• Is the phasing of the cylinder events important

Engine Testing and Instrumentation 94
Combustion Variability

Engine Testing and Instrumentation 95
Combustion Variability

Engine Testing and Instrumentation 96
Combustion Variability

Engine Testing and Instrumentation 97
Combustion Variability
Engine Testing and Instrumentation 98
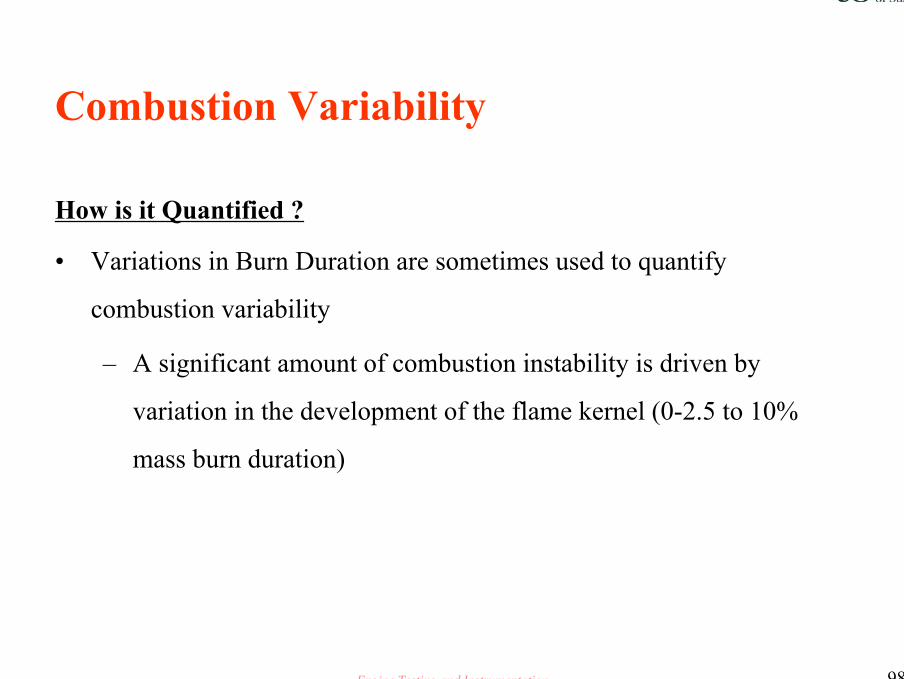
Combustion Variability
How is it Quantified ?
• Variations in Burn Duration are sometimes used to quantify
combustion variability
– A significant amount of combustion instability is driven by
variation in the development of the flame kernel (0-2.5 to 10%
mass burn duration)

Engine Testing and Instrumentation 99
Combustion Variability
• Still, none of the combustion stability metrics discussed comprehend
the physical phasing of the events
– What happens if the cylinder events are unevenly spaced ?
Engine Testing and Instrumentation 100
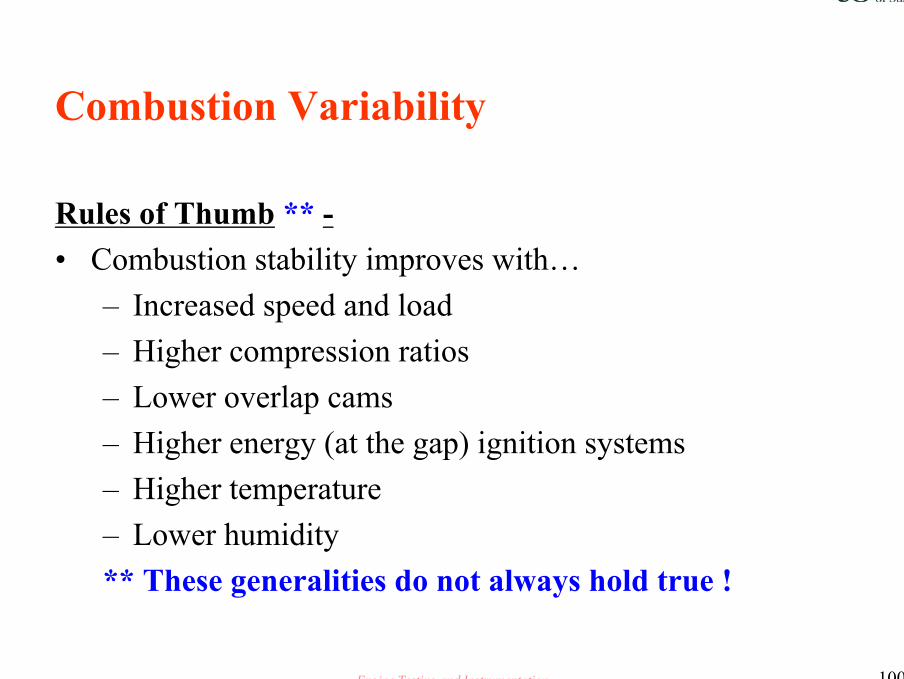
Combustion Variability
Rules of Thumb ** -• Combustion stability improves with…
– Increased speed and load– Higher compression ratios– Lower overlap cams– Higher energy (at the gap) ignition systems– Higher temperature– Lower humidity** These generalities do not always hold true !

Engine Testing and Instrumentation 101
Combustion VariabilityTrade offs-•Unfortunately, there is typically a trade off between high airflow for power and high in-cylinder motion for increased burn rates and less combustion variability

Engine Testing and Instrumentation 102
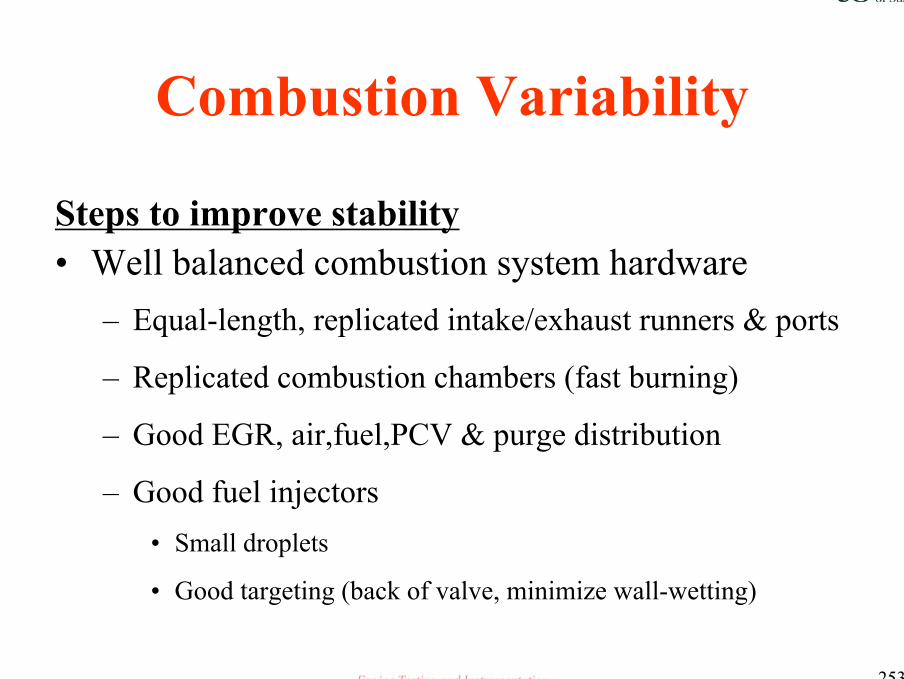
Combustion Variability
Steps to improve stability• Well balanced combustion system hardware
– Equal-length, replicated intake/exhaust runners & ports
– Replicated combustion chambers (fast burning)
– Good EGR, air,fuel,PCV & purge distribution
– Good fuel injectors
• Small droplets
• Good targeting (back of valve, minimize wall-wetting)

Engine Testing and Instrumentation 103
Combustion Variability
Steps to improve stability• Well balanced combustion system hardware
– Equal-length, replicated intake/exhaust runners & ports
– Replicated combustion chambers (fast burning)
– Good EGR, air,fuel,PCV & purge distribution
– Good fuel injectors
• Small droplets
• Good targeting (back of valve, minimize wall-wetting)
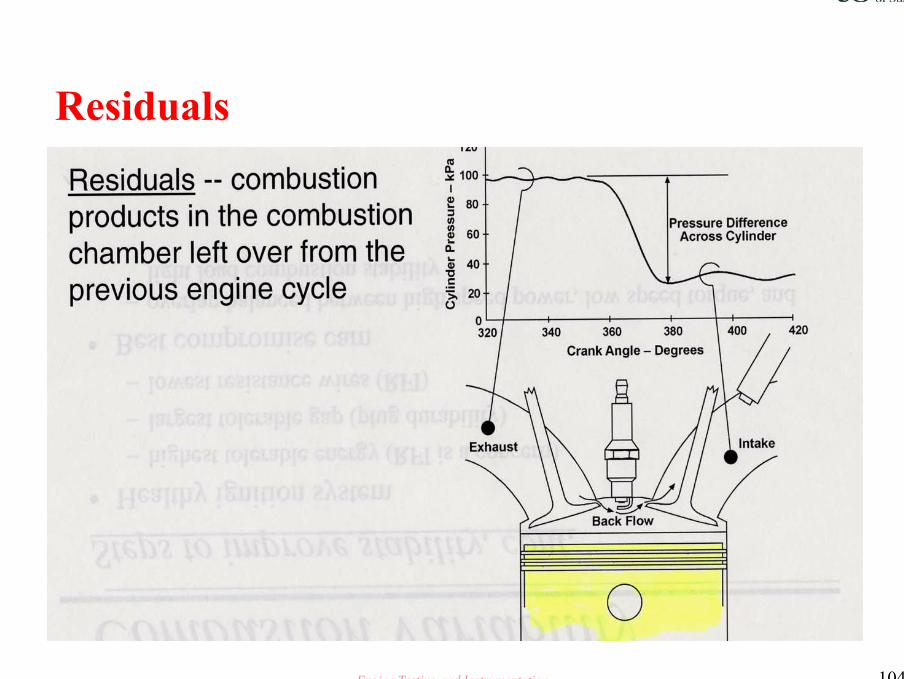
Engine Testing and Instrumentation 104
Residuals
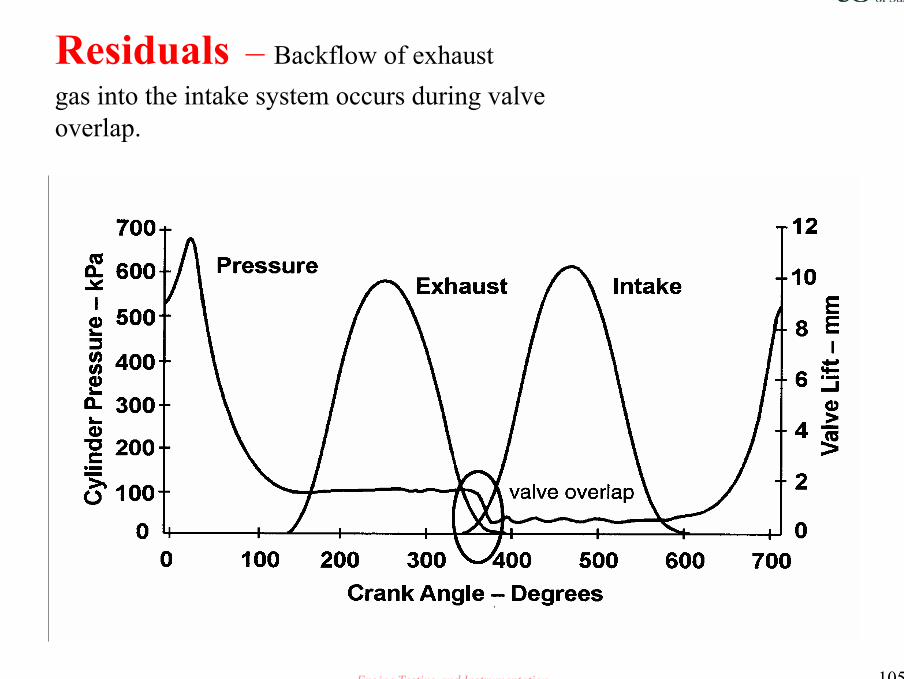
Engine Testing and Instrumentation 105
Residuals – Backflow of exhaustgas into the intake system occurs during valveoverlap.

Engine Testing and Instrumentation 106
Residuals

Engine Testing and Instrumentation 107
Residuals
Residuals are increased by:-• Large valve overlap area• Low engine speed ( more time for back flow)• Low induction manifold pressure• High exhaust back pressure• Low compression ratio

Engine Testing and Instrumentation 108
Residuals – SAE Paper 931025presents a regression equation derived to predict residual fraction as follows:-
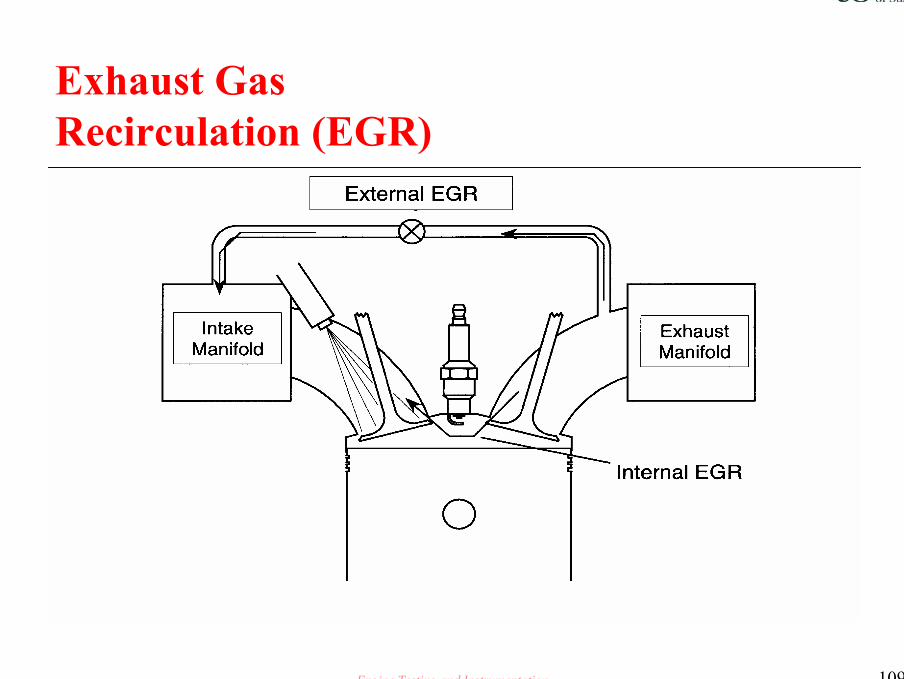
Engine Testing and Instrumentation 109
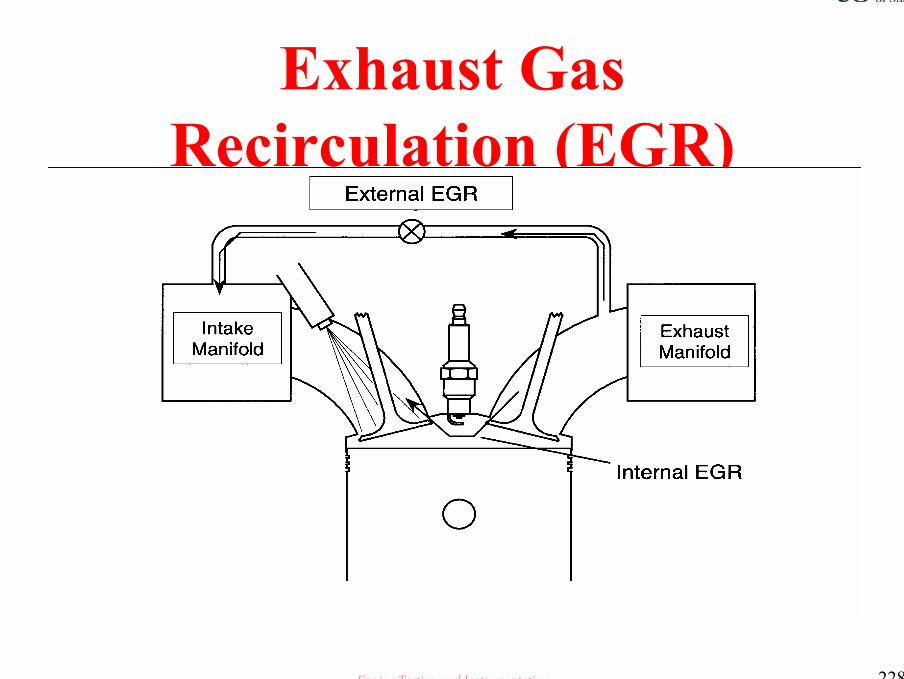
Exhaust Gas Recirculation (EGR)
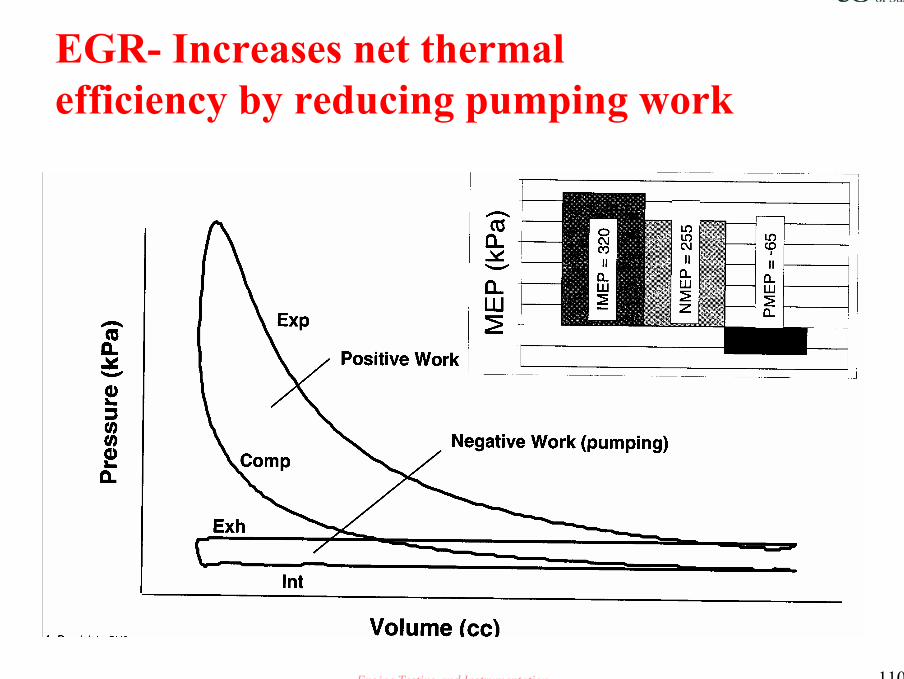
Engine Testing and Instrumentation 110
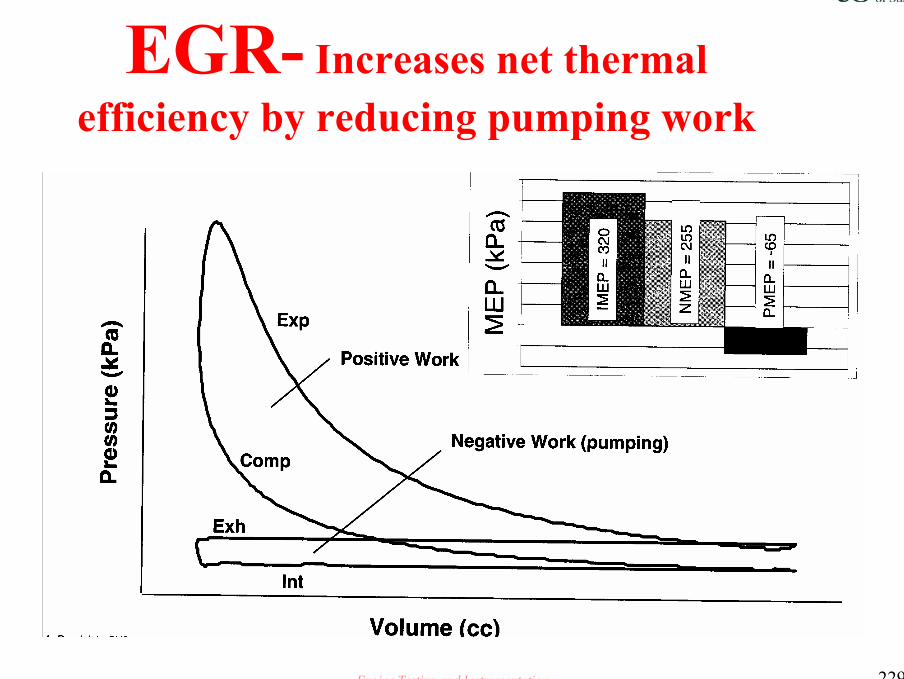
EGR- Increases net thermalefficiency by reducing pumping work

Engine Testing and Instrumentation 111
EGR-Output reduced with addition of EGR at constant manifoldpressure
Engine Testing and Instrumentation 112
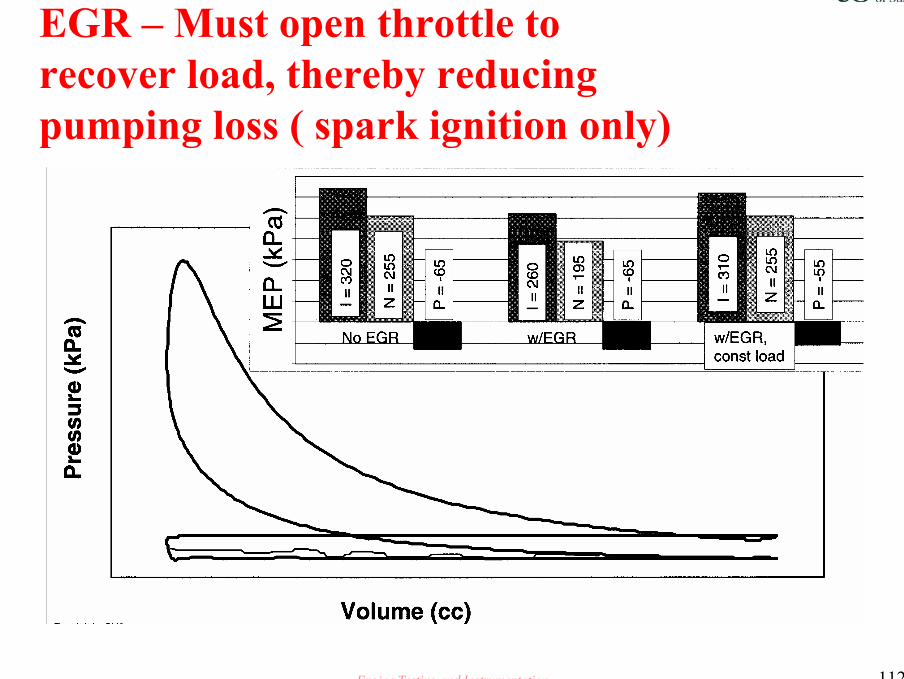
EGR – Must open throttle torecover load, thereby reducingpumping loss ( spark ignition only)

Engine Testing and Instrumentation 113
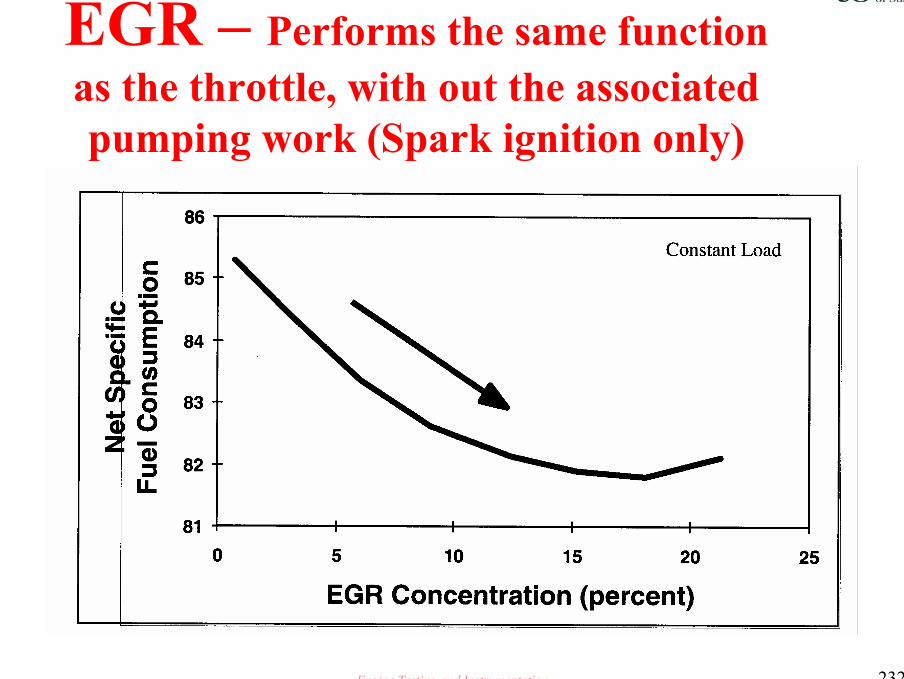
EGR – Performs the same functionas the throttle, with out the associatedpumping work (Spark ignition only)

Engine Testing and Instrumentation 114
EGR – Reduces NOx emissionsby reducing the combustion temperatures
Engine Testing and Instrumentation 115
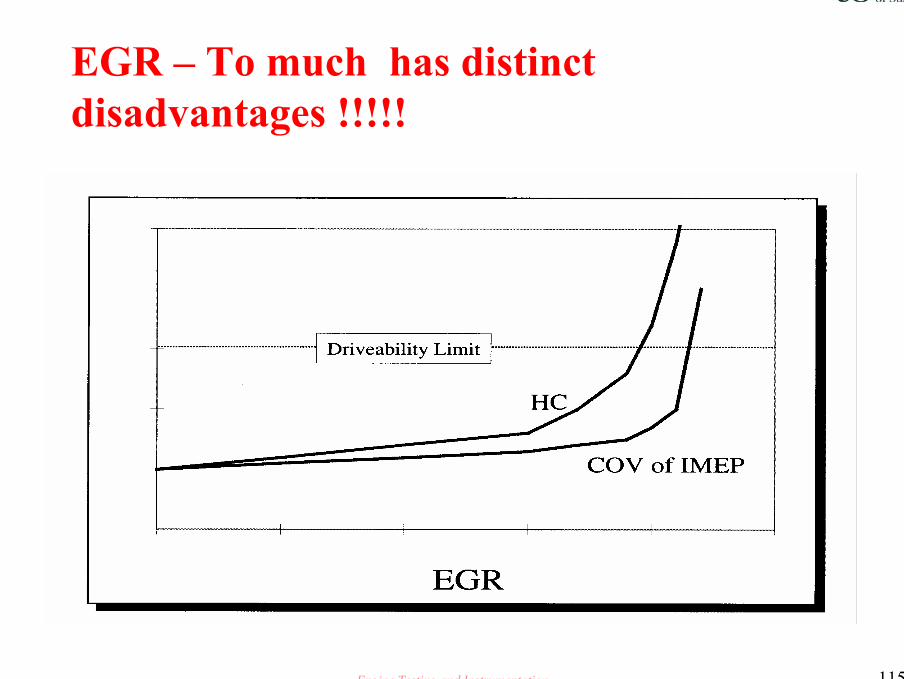
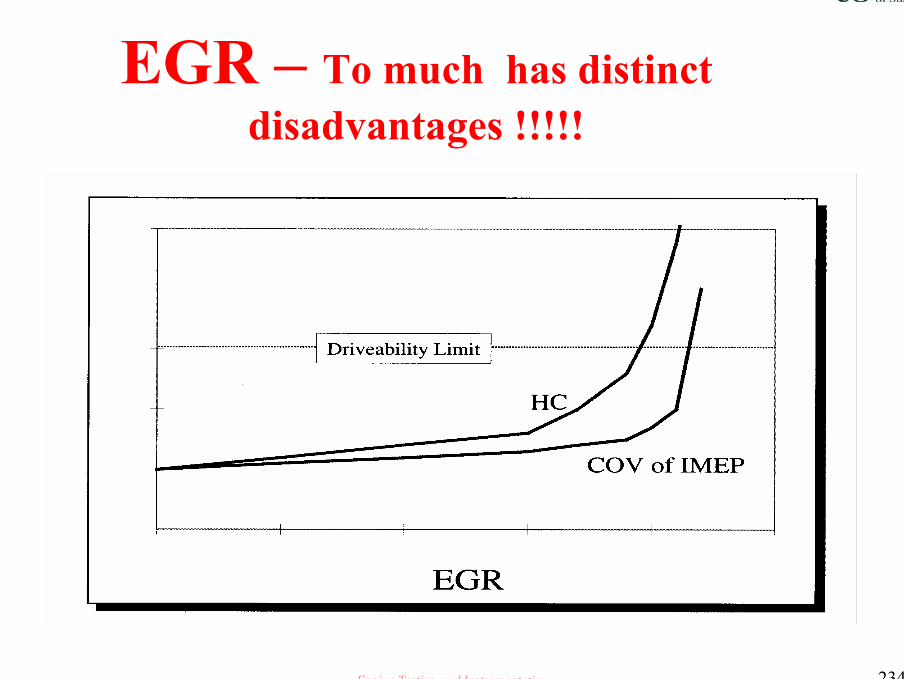
EGR – To much has distinctdisadvantages !!!!!

Engine Testing and Instrumentation 116
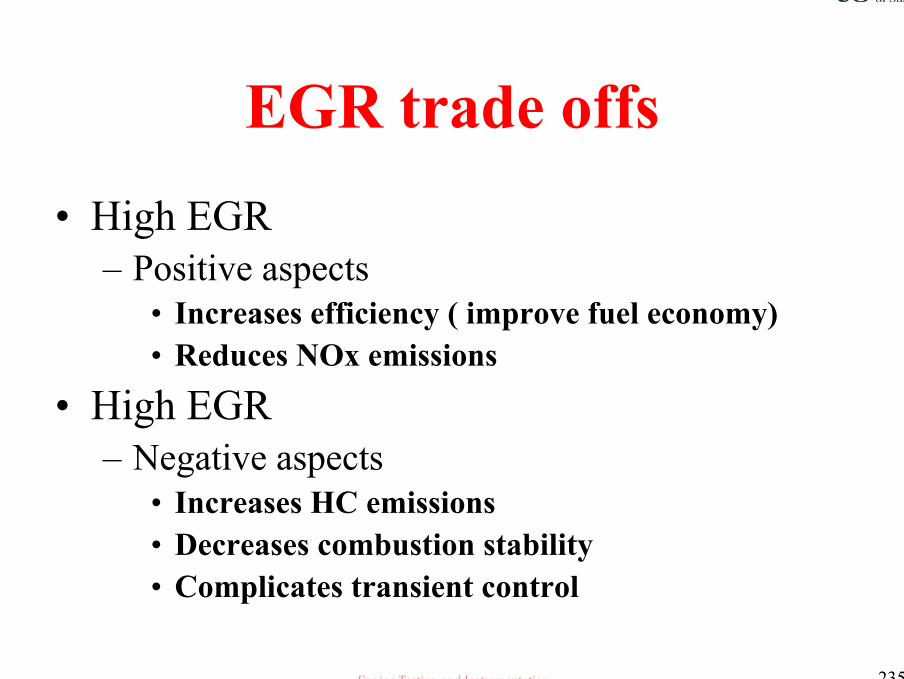
EGR trade offs
• High EGR– Positive aspects
• Increases efficiency ( improve fuel economy)• Reduces NOx emissions
• High EGR– Negative aspects
• Increases HC emissions• Decreases combustion stability• Complicates transient control

Engine Testing and Instrumentation 117
Abnormal Combustion
• Incomplete burn ( misfires and partial burns)
• Pre-ignition
• Knock

Engine Testing and Instrumentation 118
Incomplete Combustion
Misfires and Partial Burns occur when flame propagation is either
never properly initiated, or fails to propagate fully across the
combustion chamber prior to exhaust valve opening.
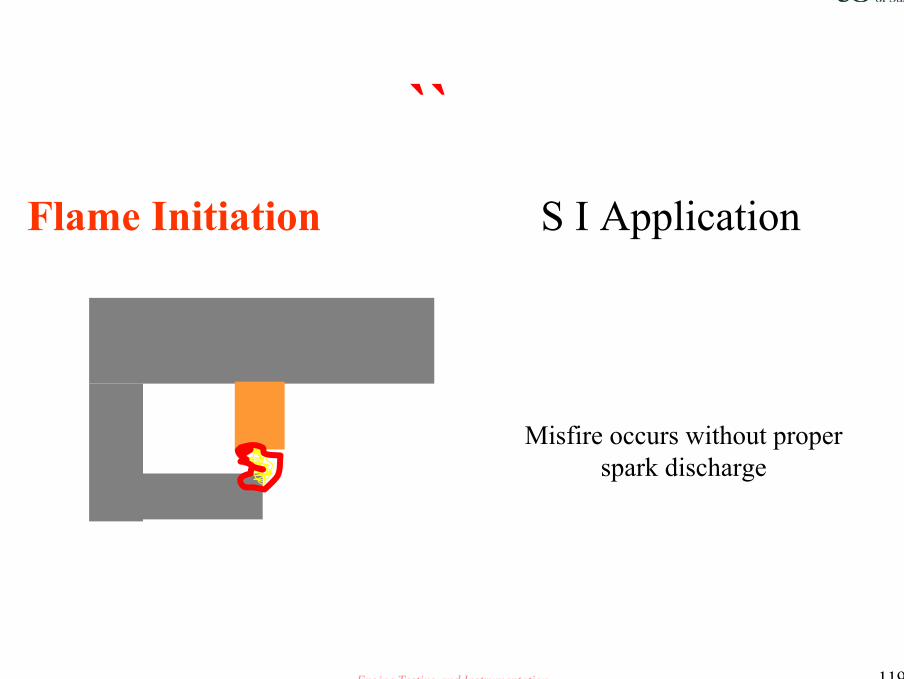
Engine Testing and Instrumentation 119
``Flame Initiation
Misfire occurs without proper spark discharge
S I Application

Engine Testing and Instrumentation 120
Incomplete Combustion
Flame Propagation
Misfire occurs likewise if the rate of conductive heat losses
exceeds the rate of heat production from combustion
Engine Testing and Instrumentation 121
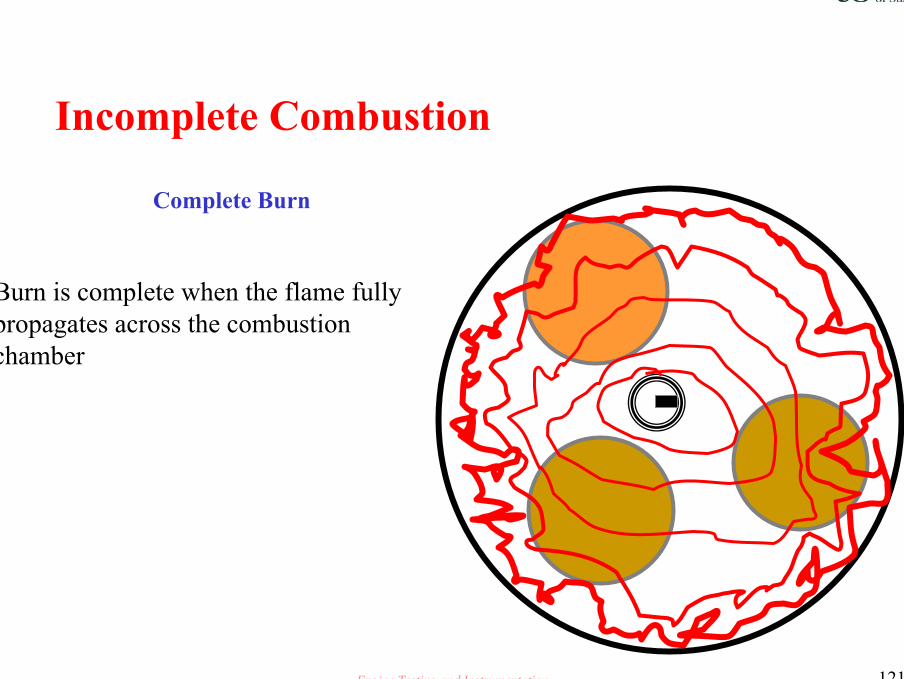
Incomplete Combustion
Complete Burn
Burn is complete when the flame fully propagates across the combustion chamber

Engine Testing and Instrumentation 122
Incomplete CombustionMisfire

Engine Testing and Instrumentation 123
Incomplete CombustionMisfire

Engine Testing and Instrumentation 124
Incomplete Combustion
Causes of Misfire• Insufficient ignition energy ( spark or compression ~ cetane number ! )• Conditions at the spark plug at time of spark(S.I.Engine)that are not
conductive to ignition– Excessive residuals– Excessive EGR– Air/fuel ratio ( Too lean or too rich )– High compression pressures– Low temperatures– Mean flow velocity too high (+ 320feet/min)– S.I.Engine excessive plug fouling
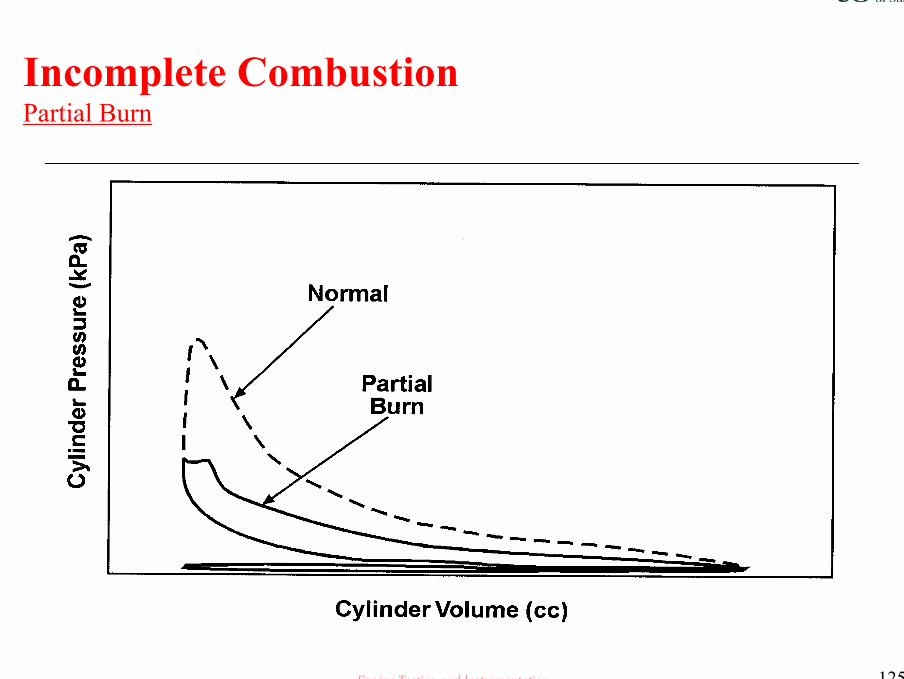
Engine Testing and Instrumentation 125
Incomplete CombustionPartial Burn

Engine Testing and Instrumentation 126
Incomplete CombustionPartial Burn
Engine Testing and Instrumentation 127
Incomplete Combustion
Causes of Partial Burns– Burn duration too long ( slow burn)
• Insufficient charge motion• Low compression pressures• Excessive dilution ( residual exhaust, air, EGR)
– Spark timing is too retarded ( Diesel injection is too retarded)– Fuel/air cylinder contents are not well mixed

Engine Testing and Instrumentation 128
Combustion Variability
Steps to improve stability• Well balanced combustion system hardware
– Equal-length, replicated intake/exhaust runners & ports
– Replicated combustion chambers (fast burning)
– Good EGR, air,fuel,PCV & purge distribution
– Good fuel injectors
• Small droplets
• Good targeting (back of valve, minimize wall-wetting)
Engine Testing and Instrumentation 129
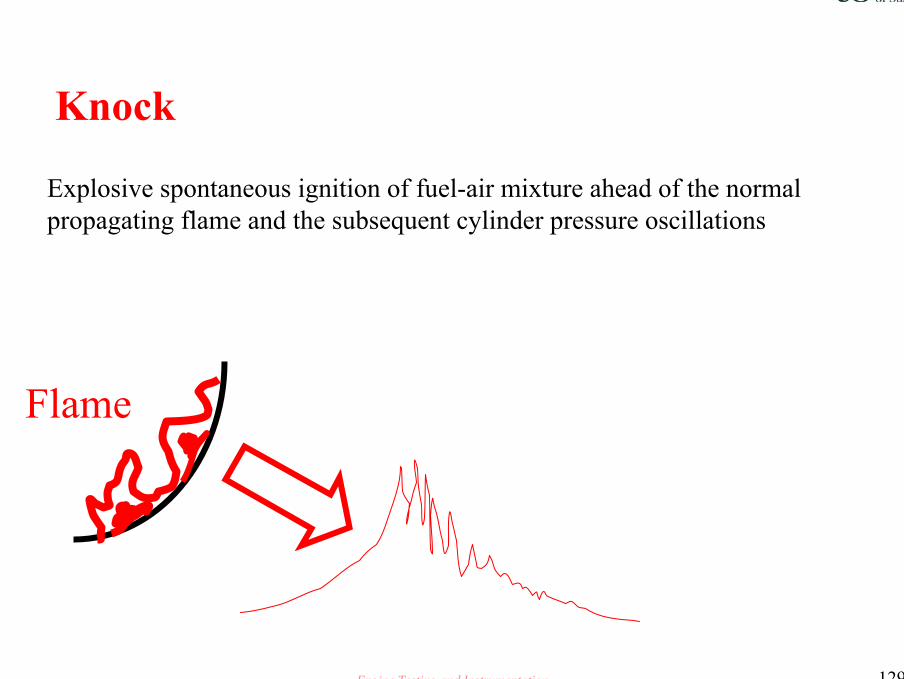
Knock
Explosive spontaneous ignition of fuel-air mixture ahead of the normal propagating flame and the subsequent cylinder pressure oscillations
Flame

Engine Testing and Instrumentation 130
KnockKnock is not:• Any combustion-induced noise
– Knock is the result of uncontrolled auto – ignition and will respond to changes in fuel octane
– Rumble is the result of high pressure rise rate and will not respond to changes in fuel octane
• Detonation– Typical knock induced pressure oscillations are
acoustic ( sonic). Detonation is supersonic !• Preignition
– Preignition is the initiation of combustion prior to spark discharge, often the result of a hot spot induced by knock

Engine Testing and Instrumentation 131
Knock
Who needs to worry about it ?
• Fuel Formulation Chemists
• Base Engine Designers
• Calibration Engineers
Engine Testing and Instrumentation 132
Knock
• When does knock occur ?ƒ Temp d t is high• Engine speed is low and MAP is high• Combustion duration is long• Temperatures are high (ambient,coolant, combustion
chamber surface) • Charge dilution is low• Many particulate deposits• Spark ( point of injection) advance is high
Engine Testing and Instrumentation 133
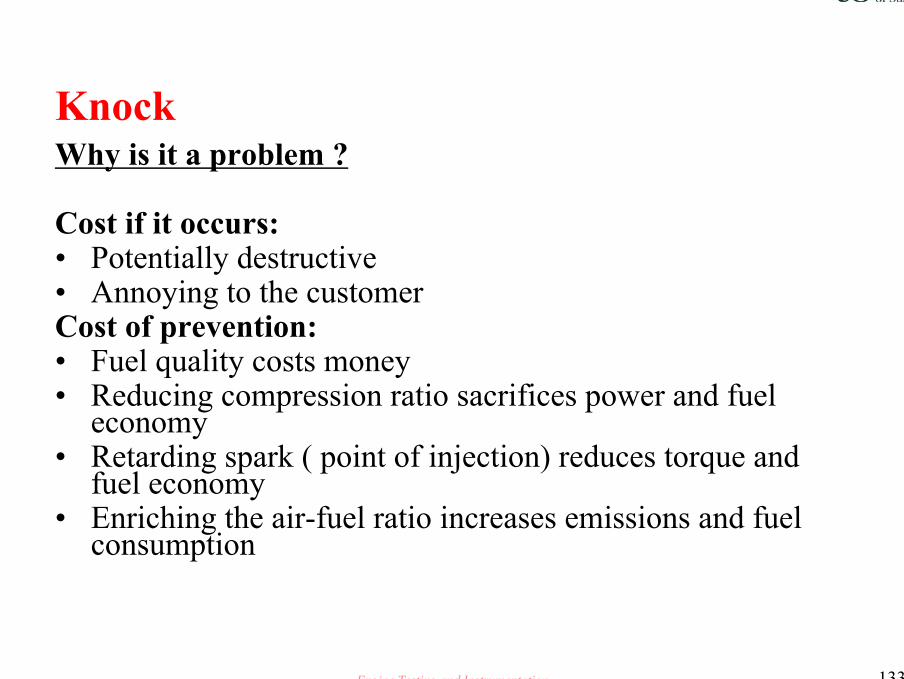
KnockWhy is it a problem ?
Cost if it occurs:• Potentially destructive• Annoying to the customerCost of prevention:• Fuel quality costs money• Reducing compression ratio sacrifices power and fuel
economy• Retarding spark ( point of injection) reduces torque and
fuel economy• Enriching the air-fuel ratio increases emissions and fuel
consumption
Engine Testing and Instrumentation 134
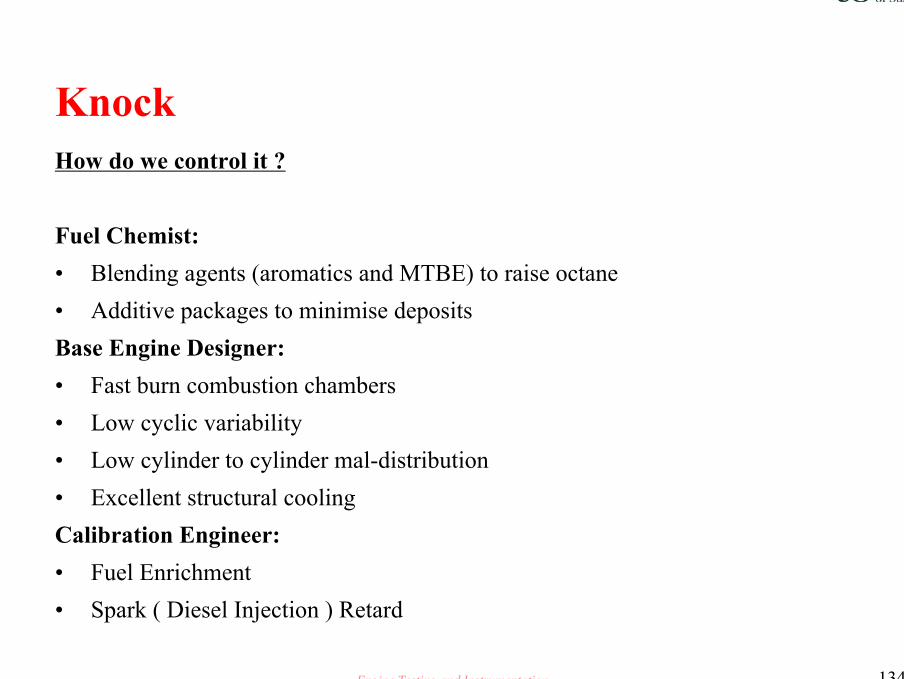
KnockHow do we control it ?
Fuel Chemist:• Blending agents (aromatics and MTBE) to raise octane• Additive packages to minimise depositsBase Engine Designer:• Fast burn combustion chambers• Low cyclic variability• Low cylinder to cylinder mal-distribution• Excellent structural coolingCalibration Engineer:• Fuel Enrichment• Spark ( Diesel Injection ) Retard

Engine Testing and Instrumentation 135
Knock
How does one quantify it ?• Trained ear(customer, historic development engineer)• Accelerometer (vehicle ECM)• Cylinder pressure measurement
( modern development engineer)– Maximum rate of pressure rise– Peak and hold on filtered pressure trace– Peak and hold on smoothed pressure trace
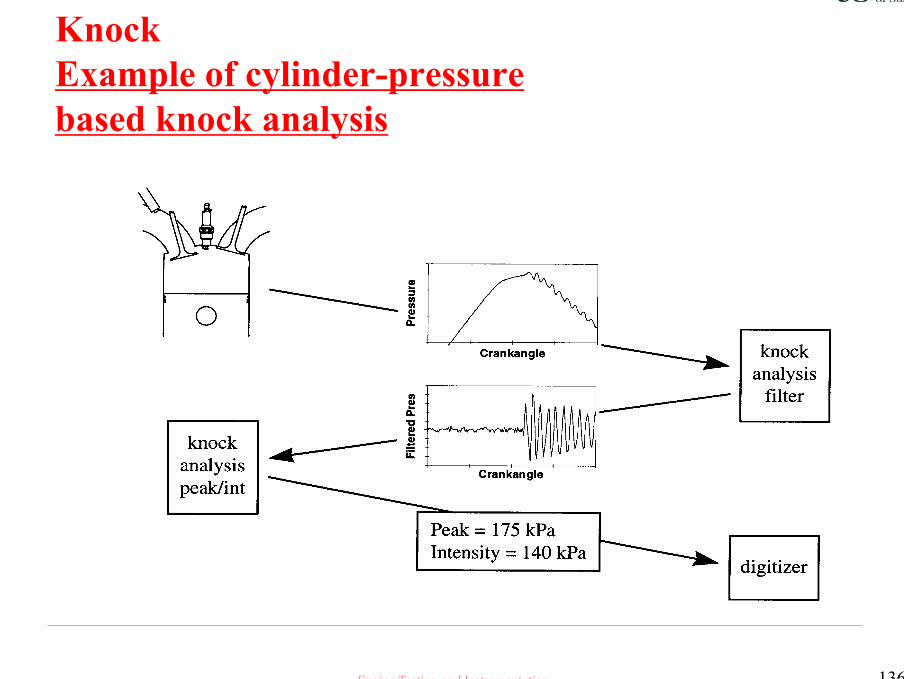
Engine Testing and Instrumentation 136
KnockExample of cylinder-pressurebased knock analysis

Engine Testing and Instrumentation 137
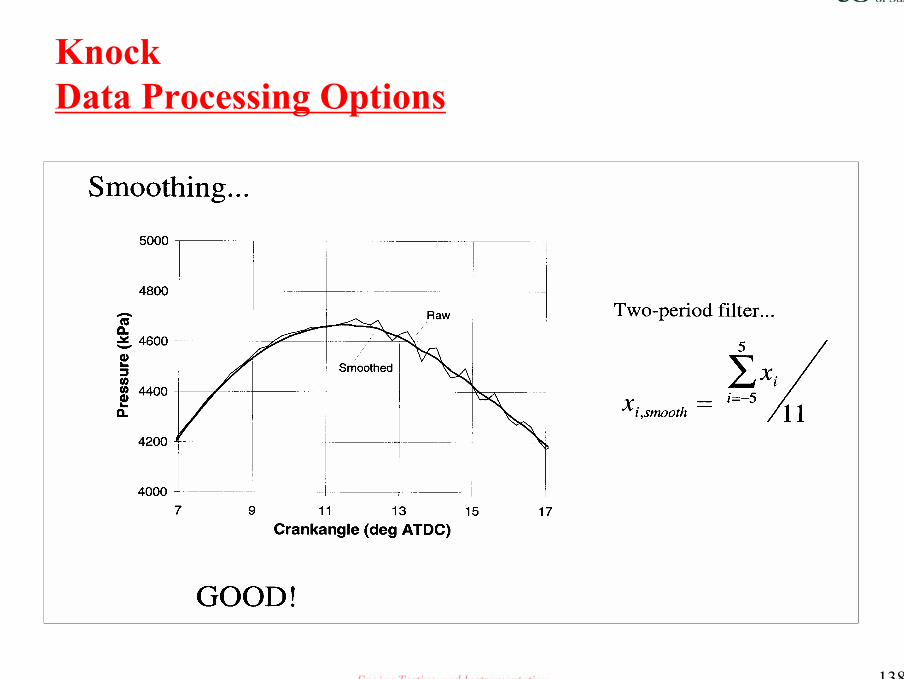
KnockData Processing Options
Engine Testing and Instrumentation 138
KnockData Processing Options
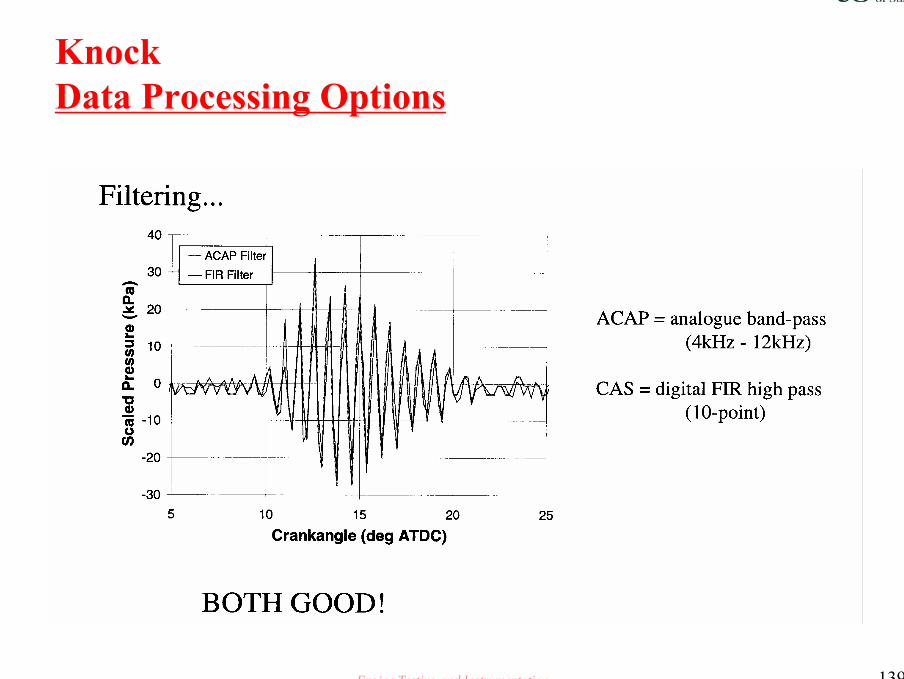
Engine Testing and Instrumentation 139
KnockData Processing Options
Engine Testing and Instrumentation 140
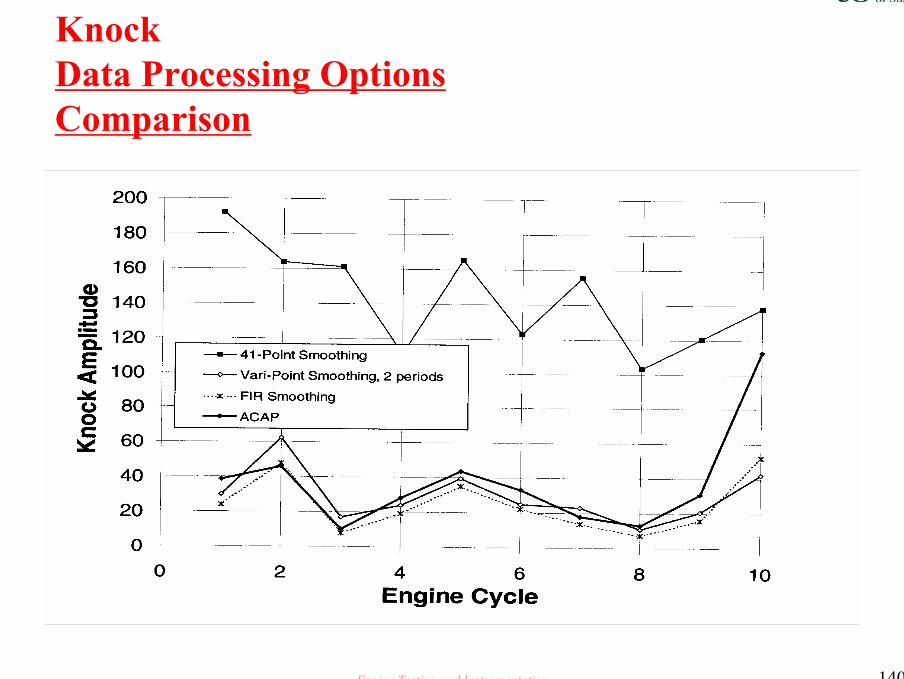
KnockData Processing OptionsComparison

Engine Testing and Instrumentation 141
KnockSystem Summary
ACAP:• Analogue band-pass filter in dedicated moduleCAS:• Smoothing to user-specified width}• Smoothing to two-period width }user selectable• Digital FIR filtering }ALL SOFTWARE—NO DEDICATED MODULE

Engine Testing and Instrumentation 142
KnockSystem Summary,continued
How does CAS ( combustion analysis system) determine knock
• Encoder decimation allows user to increase or decrease encoder resolution within software
• Knock software will reside in it’s own coprocessor, and will automatically set the encoder resolution to the appropriate level during the user-selected knock window
• Customer will need to purchase a knock coprocessor to enable knock calculations
Engine Testing and Instrumentation 143
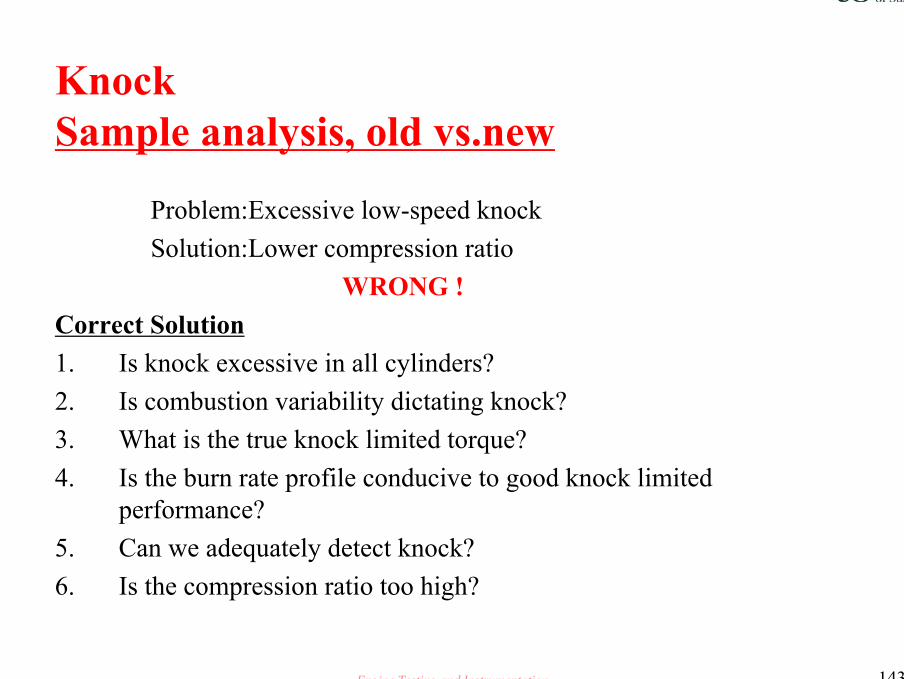
KnockSample analysis, old vs.new
Problem:Excessive low-speed knockSolution:Lower compression ratio
WRONG !Correct Solution1. Is knock excessive in all cylinders?2. Is combustion variability dictating knock? 3. What is the true knock limited torque?4. Is the burn rate profile conducive to good knock limited
performance?5. Can we adequately detect knock?6. Is the compression ratio too high?

Engine Testing and Instrumentation 144
Preignition –ignition in thecombustion chamber prior to sparkdischarge. Where will NOx start ?

Engine Testing and Instrumentation 145
Preignition
Preignition is undesirable because:• Rapidly produces very high pressures and temperatures in the
combustion chamber• May cause piston to melt or break in the middle of the piston crown (
top)• May lead to some other form of catastrophic failure ( crankshaft,
connecting rod, valves etc,….)

Engine Testing and Instrumentation 146
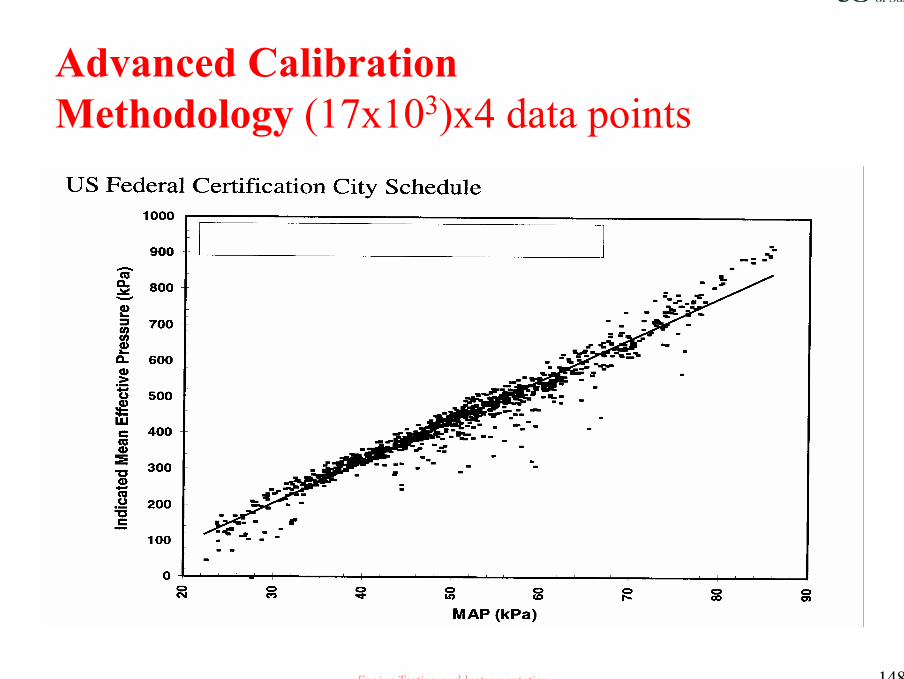
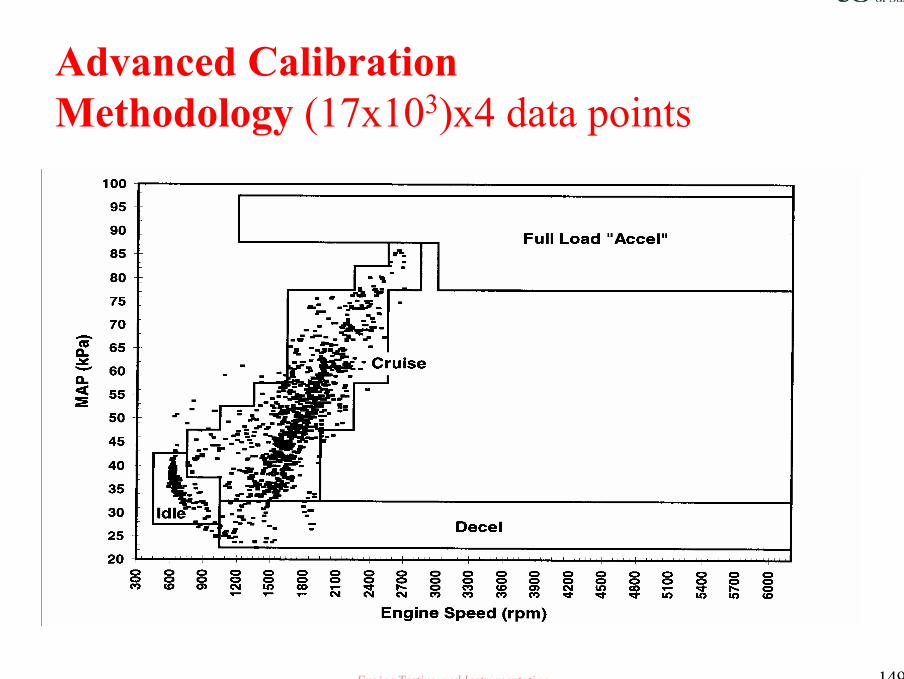
Advanced CalibrationMethodology (17x103)x4 data points

Engine Testing and Instrumentation 147
Advanced CalibrationMethodology (17x103)x4 data points
Engine Testing and Instrumentation 148
Advanced CalibrationMethodology (17x103)x4 data points
Engine Testing and Instrumentation 149
Advanced CalibrationMethodology (17x103)x4 data points
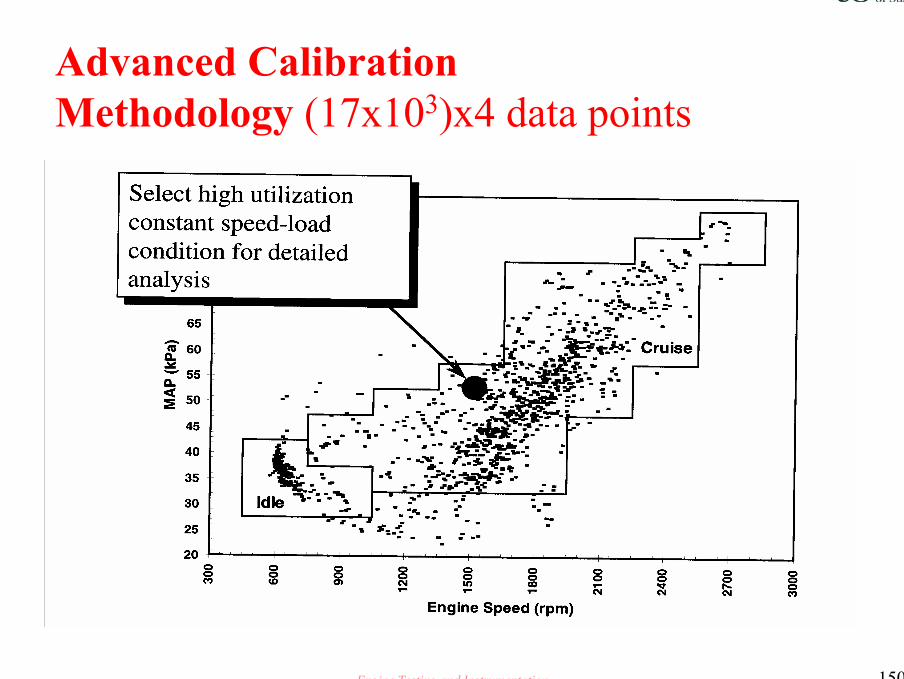
Engine Testing and Instrumentation 150
Advanced CalibrationMethodology (17x103)x4 data points

Engine Testing and Instrumentation 151
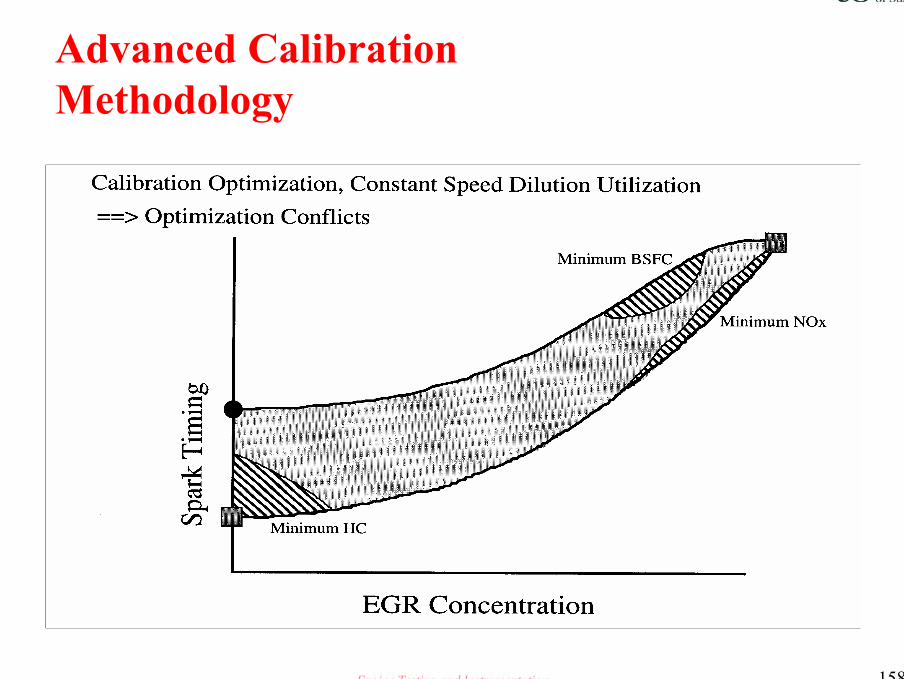
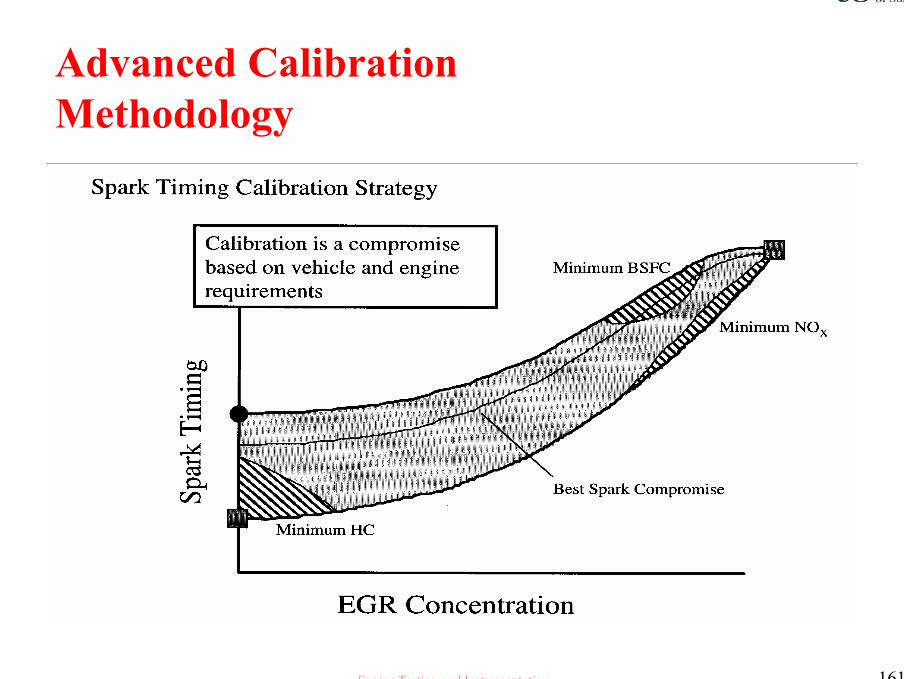
Advanced CalibrationMethodologyCalibration Optimisation, Constant Speed Dilution Utilisation

Engine Testing and Instrumentation 152
Advanced CalibrationMethodology
Calibration Optimisation, Constant Speed Dilution Utilisation

Engine Testing and Instrumentation 153
Advanced CalibrationMethodology
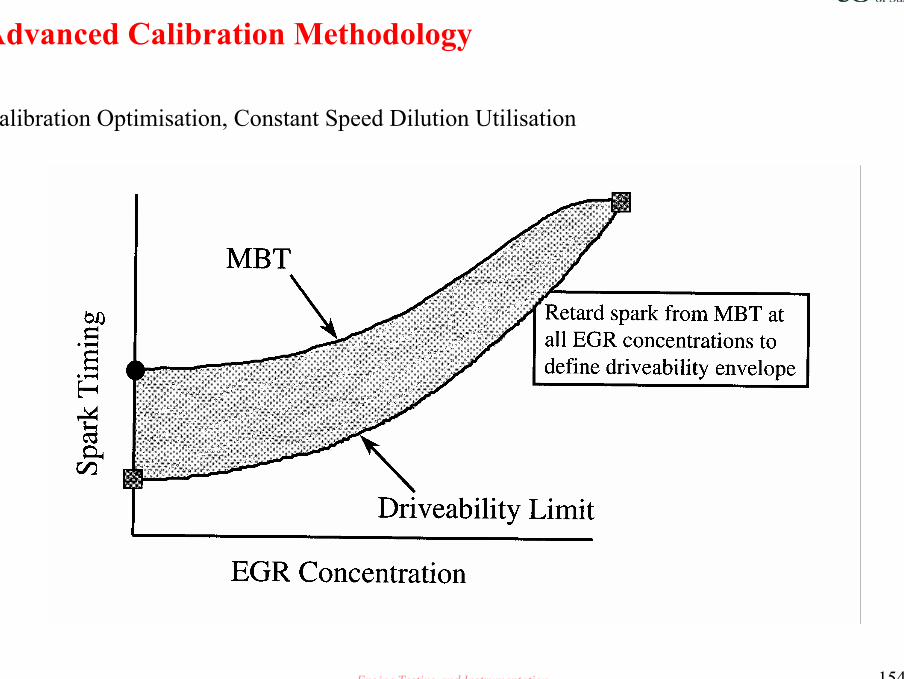
Engine Testing and Instrumentation 154
Advanced Calibration Methodology
Calibration Optimisation, Constant Speed Dilution Utilisation

Engine Testing and Instrumentation 155
Advanced CalibrationMethodology
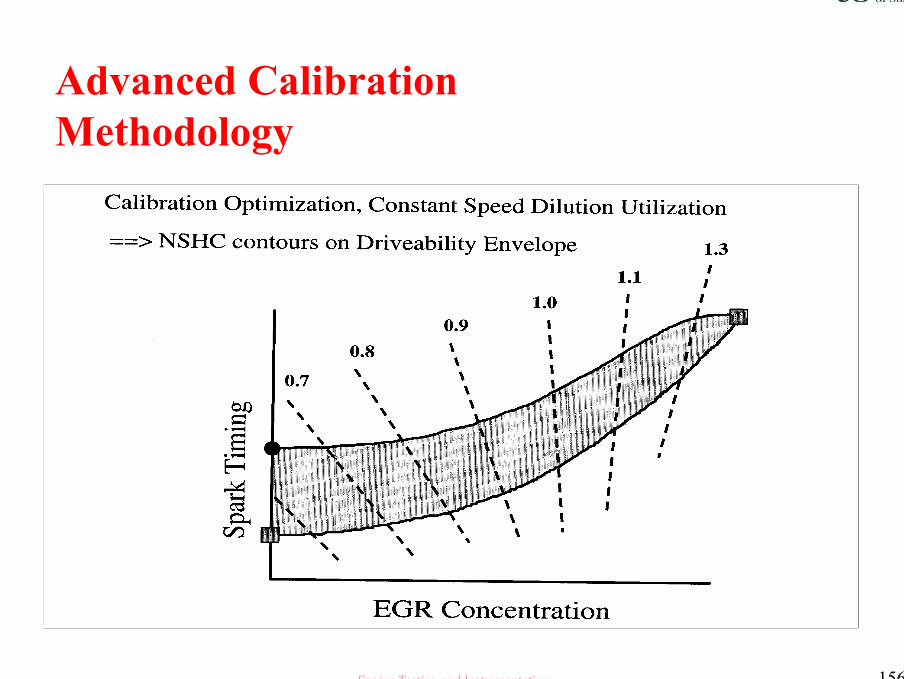
Engine Testing and Instrumentation 156
Advanced CalibrationMethodology

Engine Testing and Instrumentation 157
Advanced CalibrationMethodology
Engine Testing and Instrumentation 158
Advanced CalibrationMethodology
Engine Testing and Instrumentation 159
Advanced CalibrationMethodology
Engine Testing and Instrumentation 160
Advanced CalibrationMethodology
Engine Testing and Instrumentation 161
Advanced CalibrationMethodology
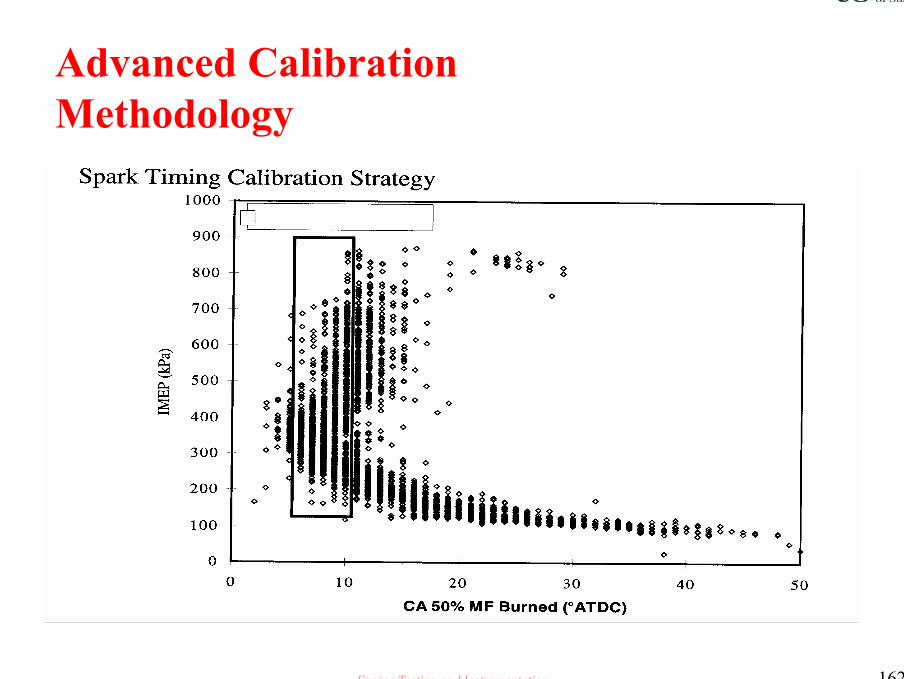
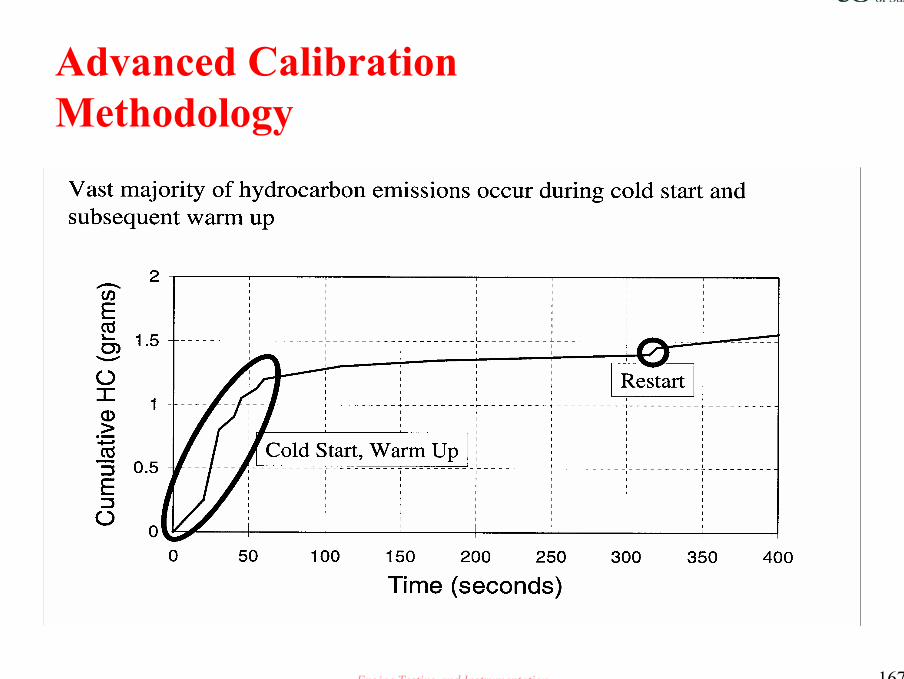
Engine Testing and Instrumentation 162
Advanced CalibrationMethodology

Engine Testing and Instrumentation 163
Advanced CalibrationMethodology

Engine Testing and Instrumentation 164
Advanced CalibrationMethodologyFTP City Cycle Engine out HC

Engine Testing and Instrumentation 165
Advanced CalibrationMethodology FTP City CycleEngine out NOx
Engine Testing and Instrumentation 166
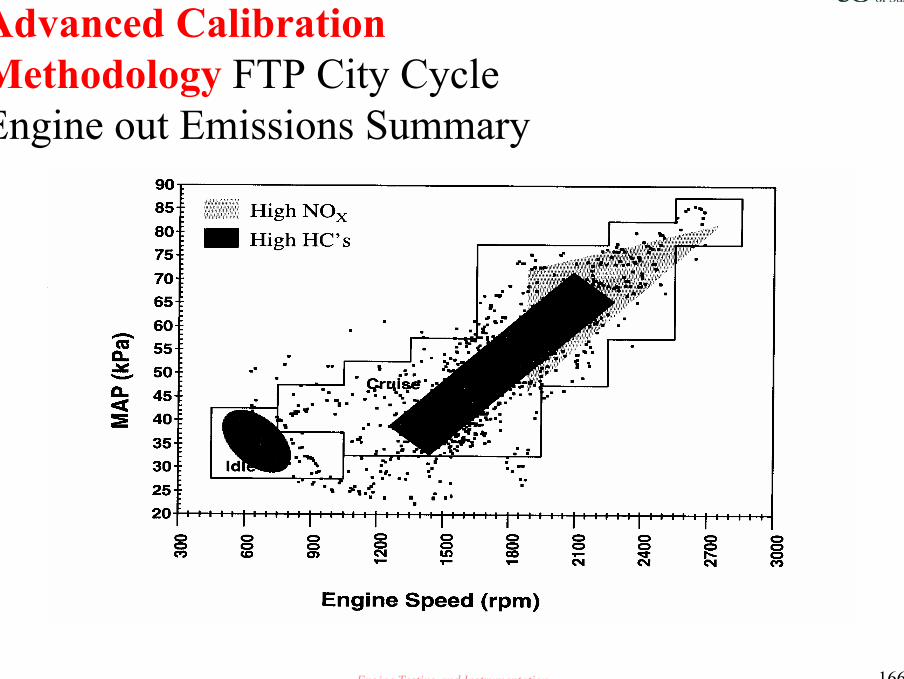
Advanced CalibrationMethodology FTP City CycleEngine out Emissions Summary
Engine Testing and Instrumentation 167
Advanced CalibrationMethodology

Engine Testing and Instrumentation 168
Degrees of crankshaft advance

Engine Testing and Instrumentation 169
Engine Testing and Instrumentation 170
Engine Testing and Instrumentation 171

Engine Testing and Instrumentation 172
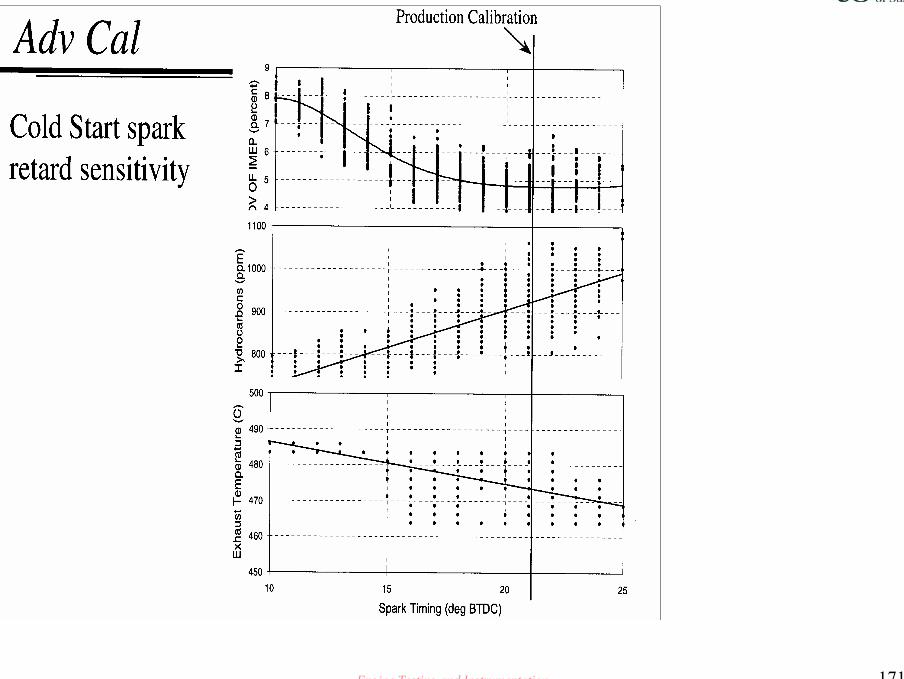
Advanced CalibrationMethodology
Sensitivity Summary
Lean off Retard
COV COVHC == engine out == HC
Temp.exh* = light off = Temp.exh*
*Heat flow

Engine Testing and Instrumentation 173
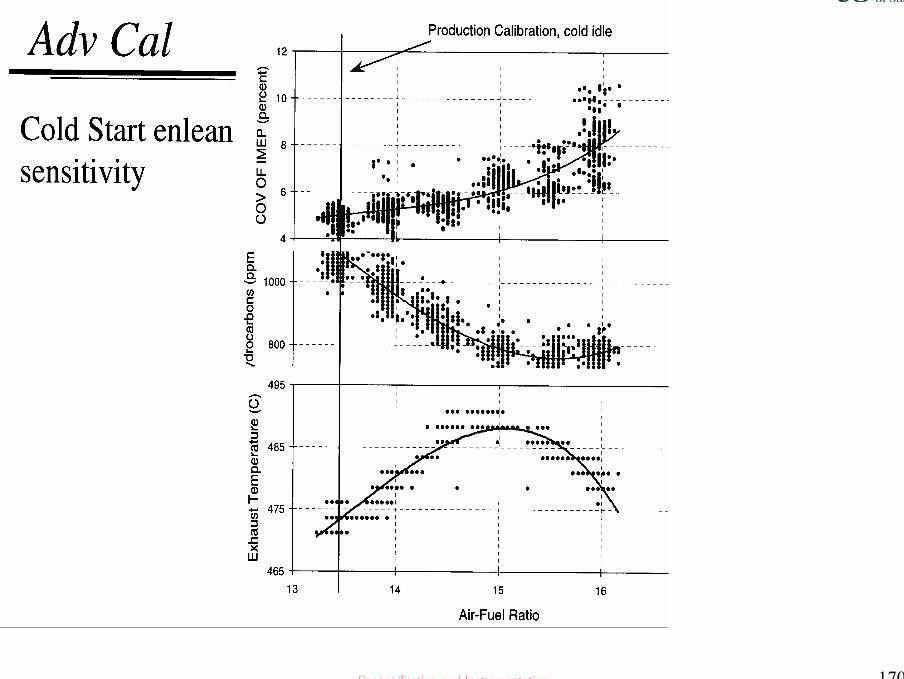
Advanced CalibrationMethodology
Cold Start Calibration – What to do ?• Calibrate to a specific combustion stability limit• Operate at the highest engine speed acceptable from a
noise and vibration perspective during the cold idle• Optimise trade off between spark retard and air-fuel en-
leanment to minimize cumulative HC emissions prior to catalyst light off
Engine Testing and Instrumentation 174
Advanced CalibrationMethodology
Combustion as a Calibration Tool• Combustion Phasing:map to an optimum phasing value ( crank angle
(CA) 50 of around 10deg.),use CA50 to check calibration ‘precision’• Combustion Stability:map within acceptable driveability limits, use
COV of IMEP and IMEP imbalance to check calibration drivability• Knock and Preignition Monitoring:map within acceptable knock
and pre-ignition limits• OBDII Misfire Diagnostic Tuning:tune diagnostic to trigger only on
true misfires

Engine Testing and Instrumentation 175
Data Integrity
How is it achieved ?By understanding the magnitude and causes
of variation present in the combustion data
acquisition process and then using that
knowledge to identify and remove causes that
do not occur naturally
Engine Testing and Instrumentation 176
Data Integrity
Understanding sources of variability• Daily checks
– Daily checks provide the information necessary to understand variability
– Record combustion data daily at the same test condition– Control all variables to the greatest extent possible
Engine Testing and Instrumentation 177
Data Integrity
Daily Checks• Ideally,record data under both firing and motoring conditions
– Select a firing condition representative of the majority of actual test conditions
• If most of your testing is done at low speeds and loads, select the daily check condition accordingly
– Perform the motoring test at the same speed and WOT ( Full rack)
Engine Testing and Instrumentation 178
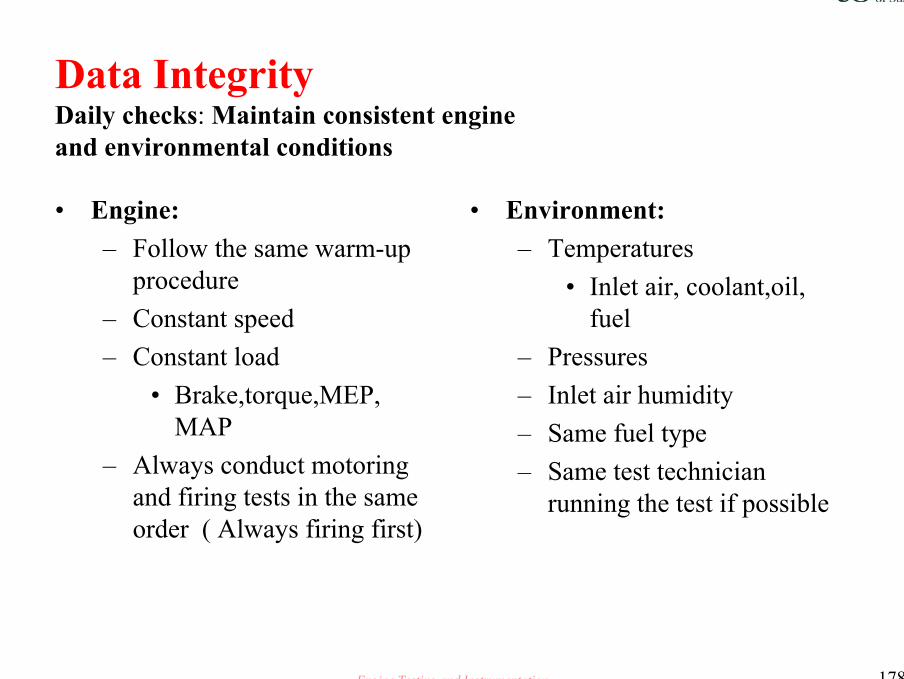
Data IntegrityDaily checks: Maintain consistent engineand environmental conditions
• Engine:– Follow the same warm-up
procedure– Constant speed– Constant load
• Brake,torque,MEP, MAP
– Always conduct motoring and firing tests in the same order ( Always firing first)
• Environment:– Temperatures
• Inlet air, coolant,oil, fuel
– Pressures– Inlet air humidity– Same fuel type– Same test technician
running the test if possible

Engine Testing and Instrumentation 179
Data Integrity
Daily Checks• Now that you are conducting daily checks and gathering lots of
interesting data, what are you going to do with it ?
Plot it on a Control Chart

Engine Testing and Instrumentation 180
Data Integrity
What is a control chart ?• A statistical tool used to distinguish naturally occurring
variation in a process from variation due to special causes.– Naturally occurring variation is inherent to any
process over time and effects all outcomes– Special causes, or assignable causes, such as a failed
pressure transducer or an air leak in an emission sampling tube,are not always present and do not affect all outcomes
Engine Testing and Instrumentation 181
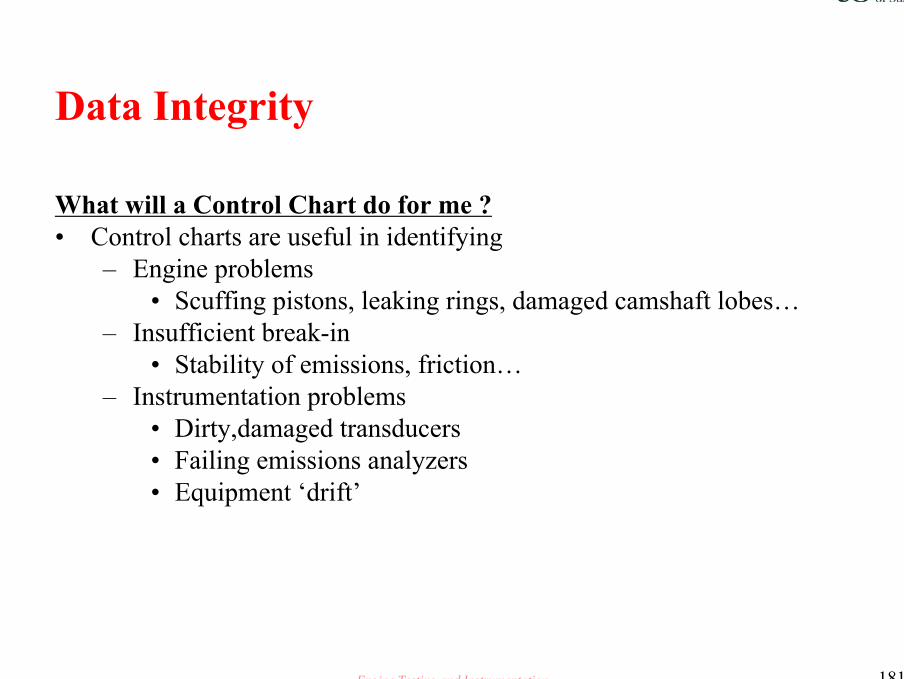
Data Integrity
What will a Control Chart do for me ?• Control charts are useful in identifying
– Engine problems• Scuffing pistons, leaking rings, damaged camshaft lobes…
– Insufficient break-in• Stability of emissions, friction…
– Instrumentation problems• Dirty,damaged transducers• Failing emissions analyzers• Equipment ‘drift’

Engine Testing and Instrumentation 182
Data Integrity
Control Charts• Two types of control charts prove most useful for
understanding variation in combustion data– X-bar
• Tracks the value of a particular variable ( engine average IMEP in following example)
– Range• In this example, it quantifies the range ( maximum
value –minimum value) of IMEP between six cylinders

Engine Testing and Instrumentation 183
Data Integrity: Control Charts
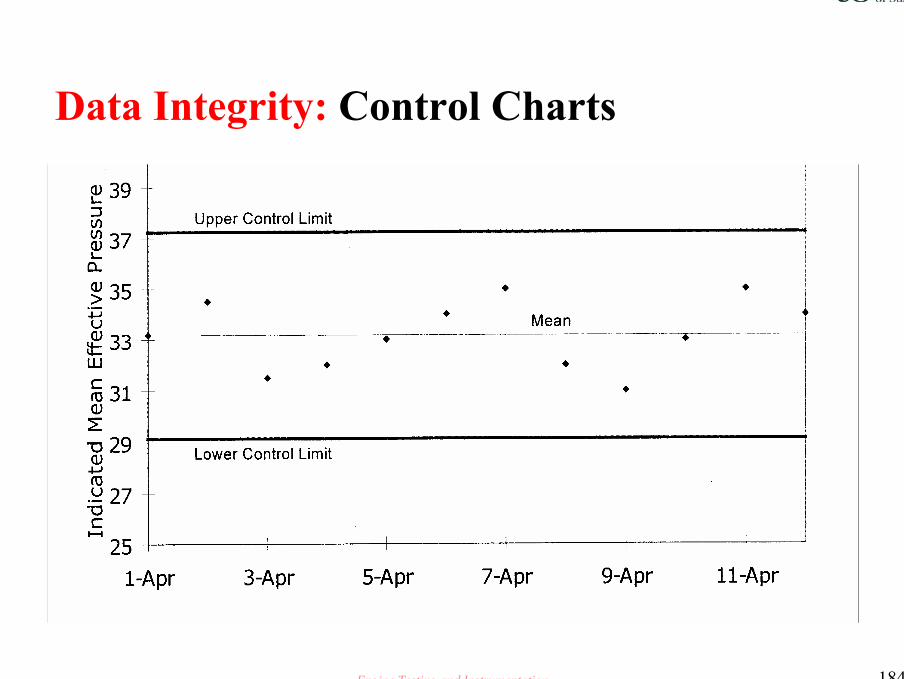
Engine Testing and Instrumentation 184
Data Integrity: Control Charts

Engine Testing and Instrumentation 185
Data Integrity
Control Chart Set up and Maintenance• Be diligent and keep good records
– When you detect a value ‘out of control’ record the findings in a log
– Review the charts regularly– Recalculate the limits only when a change has been made to the
engine/data acquisition system• New camshaft,cylinder head, new fuel batch etc….

Engine Testing and Instrumentation 186
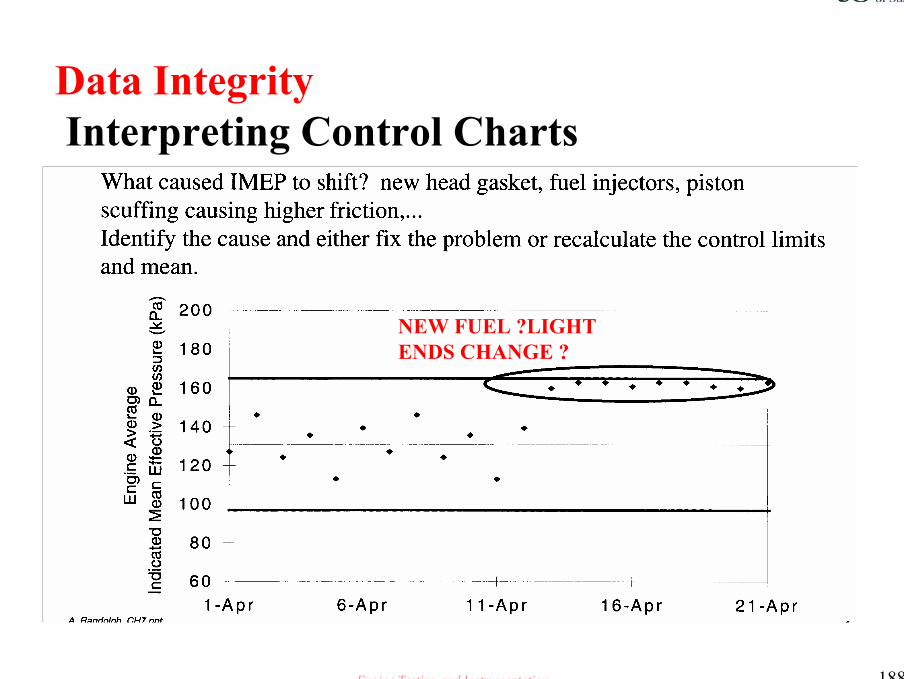
Data Integrity
Interpreting Control Charts• The control chart provides the basis for taking action to
improve a process– A process is considered in control when there is a
random distribution of the plotted points within the control limits
– If there are points outside the limits, or if the process is unstable
• Take action to remove the special cause of variation !

Engine Testing and Instrumentation 187
Data IntegrityInterpreting Control Charts
Engine Testing and Instrumentation 188
Data IntegrityInterpreting Control Charts
NEW FUEL ?LIGHT ENDS CHANGE ?

Engine Testing and Instrumentation 189
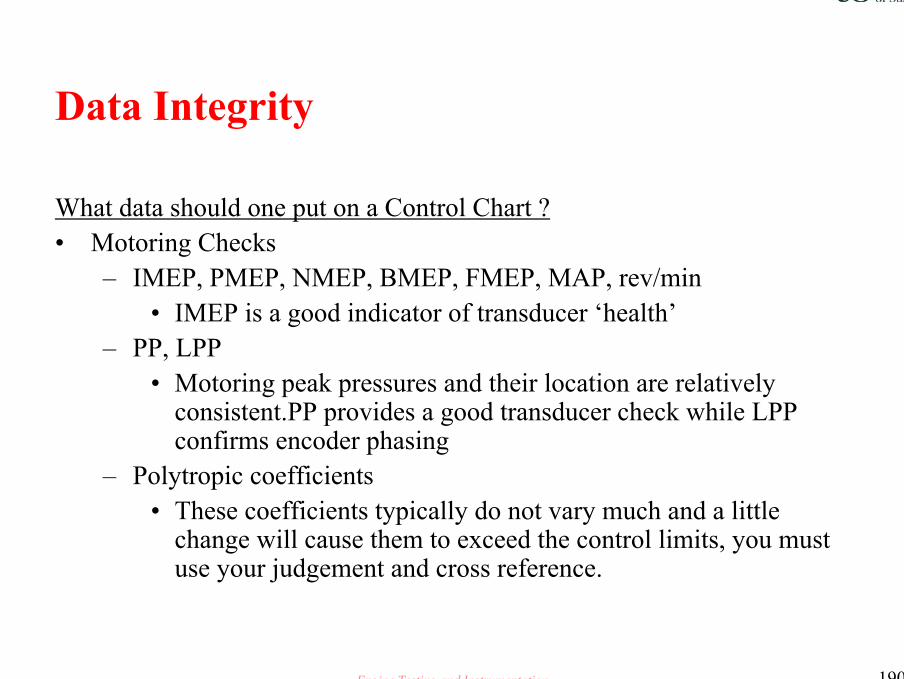
Data Integrity
What data should one put on a Control Chart ?• Firing Checks
– IMEP, PMEP, NMEP, BMEP, FMEP, MAP,rev/min• All load should be in agreement• Variation may indicate dirty transducers,recalibration for
torque meter.. Your conclusions can be supported with fuel flow or emissions data
– HC, NOx, CO, CO2
– Carbon and Oxygen balance, A/F ratios, A/F from O2 sensor, fuel flow rate, air flow rate, BSFC
– Polytropic coefficients, PP, LPP, CA50
Engine Testing and Instrumentation 190
Data Integrity
What data should one put on a Control Chart ?• Motoring Checks
– IMEP, PMEP, NMEP, BMEP, FMEP, MAP, rev/min• IMEP is a good indicator of transducer ‘health’
– PP, LPP• Motoring peak pressures and their location are relatively
consistent.PP provides a good transducer check while LPP confirms encoder phasing
– Polytropic coefficients• These coefficients typically do not vary much and a little
change will cause them to exceed the control limits, you must use your judgement and cross reference.

Engine Testing and Instrumentation 191
Data Integrity
Good test practises• Make redundant measures a part of normal testing !
– Typically, any one measurement can be supported by several devices or other measurements- an example being Air Fuel Ratio

Engine Testing and Instrumentation 192
Data Integrity
Redundant Measures• How many ways can you quantify/qualify your air fuel ratio ?
– Carbon and oxygen-balance air fuel ratio– Exhaust O2 sensor– Inlet air and fuel measurement– CO emissions– Specific fuel consumption, cylinder pressure, torque,..
Take the time to understand and apply redundant measures wherever possible
Engine Testing and Instrumentation 193
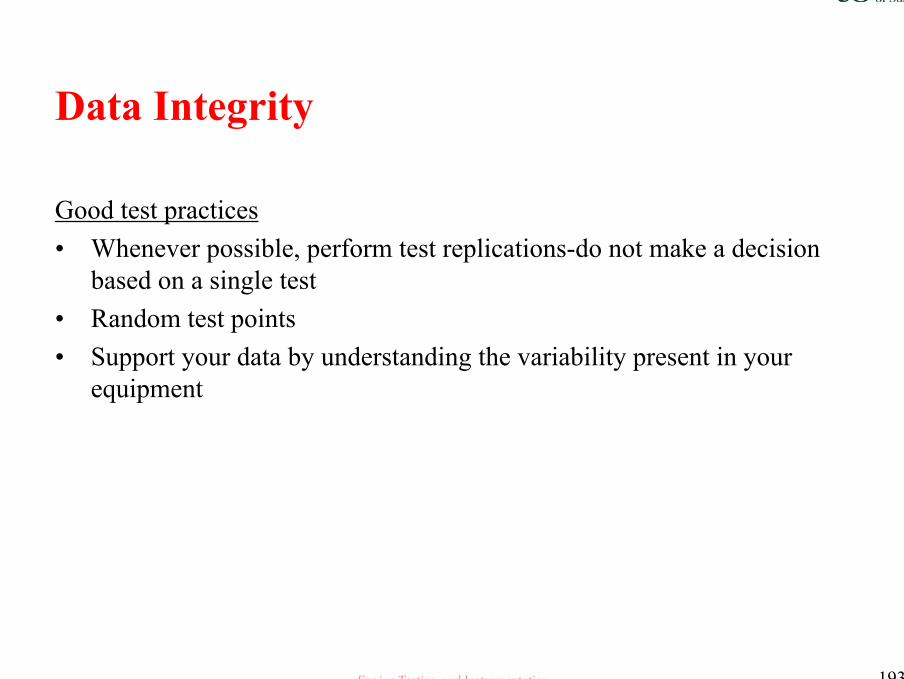
Data Integrity
Good test practices• Whenever possible, perform test replications-do not make a decision
based on a single test• Random test points• Support your data by understanding the variability present in your
equipment

Engine Testing and Instrumentation 194
Data Integrity
How many cycles of combustion data should one record ?• Rules of thumb:
– As variability increases, record more data• Idle-very low speed and light load >500-1000 cycles• Part-load-better combustion stability>300-500 cycles• High load,high speed >300 or fewer cycles-balance the number
of cycles against things like propensity to knock..• Motoring- very repeatable pressure traces>less than 300 cycles
Engine Testing and Instrumentation 195
Data Integrity
• Daily checks, control charting, and redundant measures require a small investment of time to establish and maintain, but save many times the capital investment by reducing development and test time throughimproved data quality

Engine Testing and Instrumentation 196
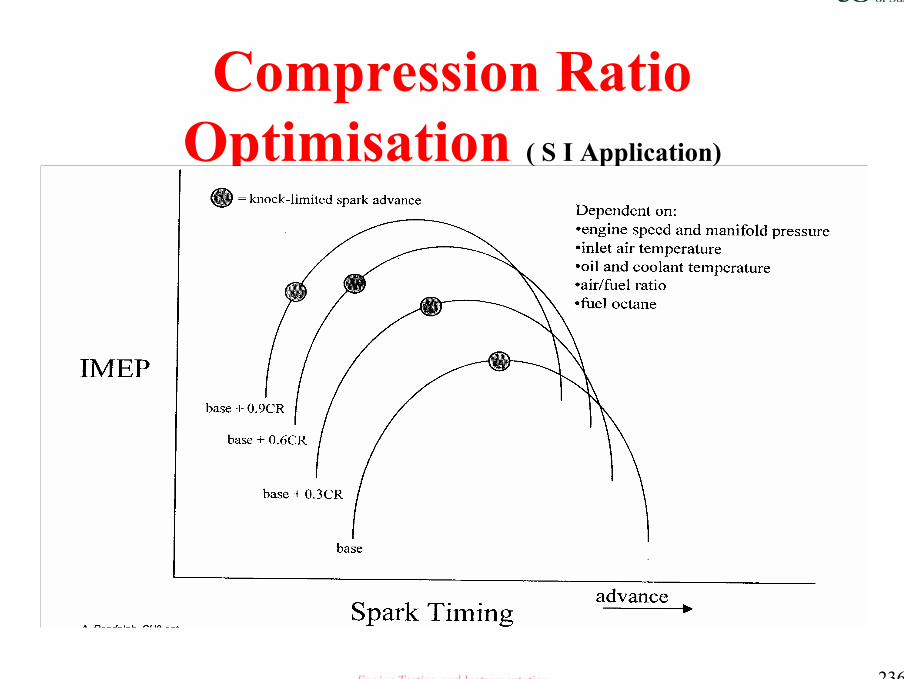
Compression RatioOptimisation ( S I Application)

Engine Testing and Instrumentation 197
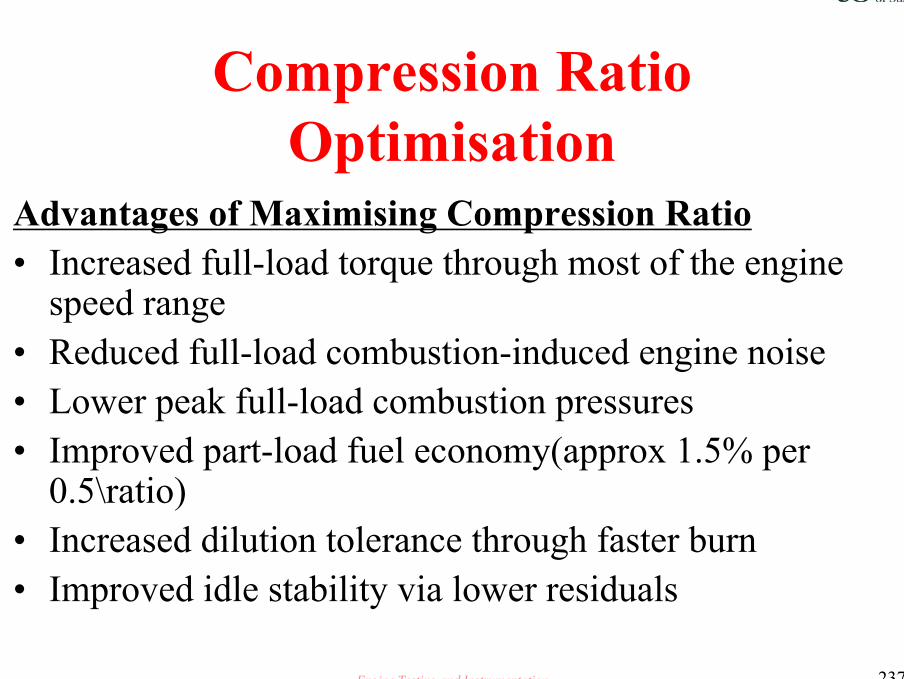
Compression RatioOptimisation
Advantages of Maximising Compression Ratio• Increased full-load torque through most of the engine speed range• Reduced full-load combustion-induced engine noise• Lower peak full-load combustion pressures• Improved part-load fuel economy(approx 1.5% per 0.5\ratio)• Increased dilution tolerance through faster burn• Improved idle stability via lower residuals

Engine Testing and Instrumentation 198
Compression RatioOptimisation
Disadvantages of Maximising Compression Ratio• Higher part-load hydrocarbon and NOx emissions• Greater reliance on knock sensing system• Higher full-load exhaust temperatures• Increased likelihood of pre-ignition

Engine Testing and Instrumentation 199
Compression RatioOptimisation
Enablers of High Compression Ratio• Precise fuel control• Good cooling of the chamber and combustion chamber• Reliable knock sensing and control methodology• Low engine – out emissions
Engine Testing and Instrumentation 200
Full Load Performance Optimisation
• Example from a NASCAR Winston Cup race engine development
exercise, which demonstrates the clear advantages of utilising
combustion analysis techniques to enable accelerated development.
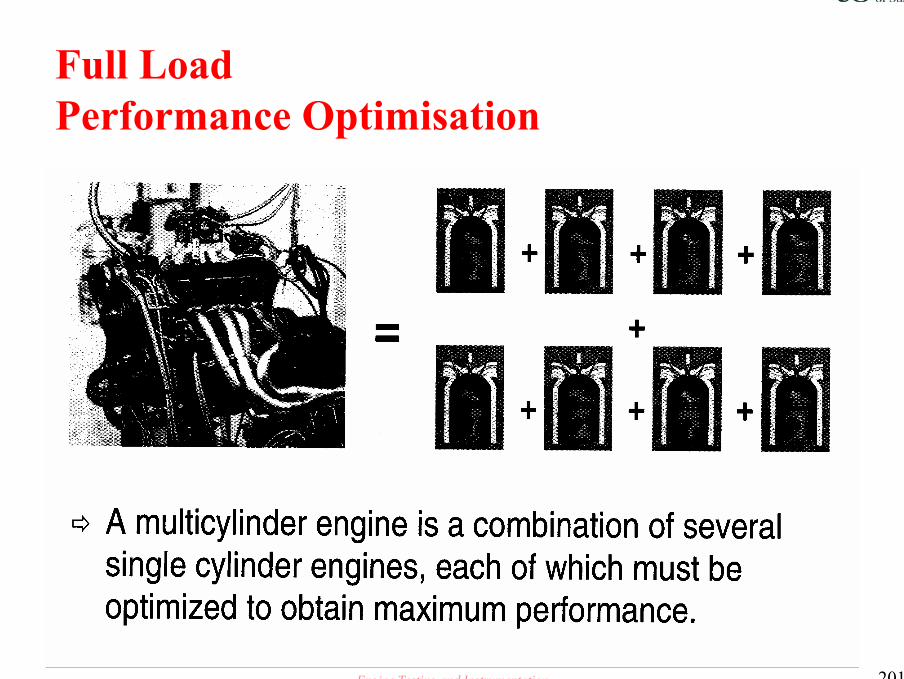
Engine Testing and Instrumentation 201
Full Load Performance Optimisation
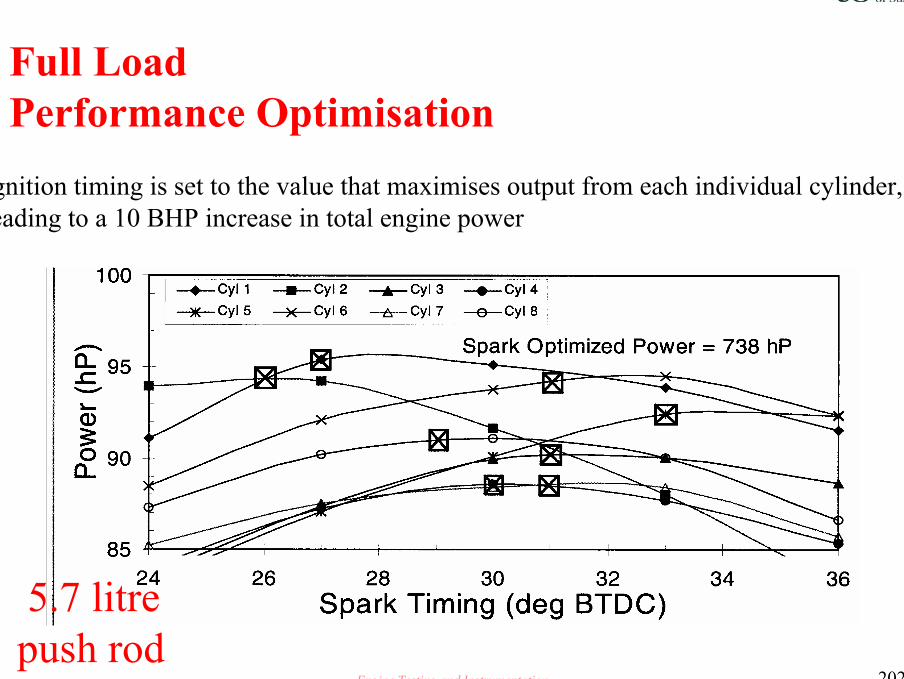
Engine Testing and Instrumentation 202
Full Load Performance Optimisation
Ignition timing is set to the value that maximises output from each individual cylinder, leading to a 10 BHP increase in total engine power
5.7 litre push rod

Engine Testing and Instrumentation 203
Peak Power:Sensitivity toAir-Fuel Ratio
Individual cylinder air-fuel ratio mal-distribution also reduces total engine peak power
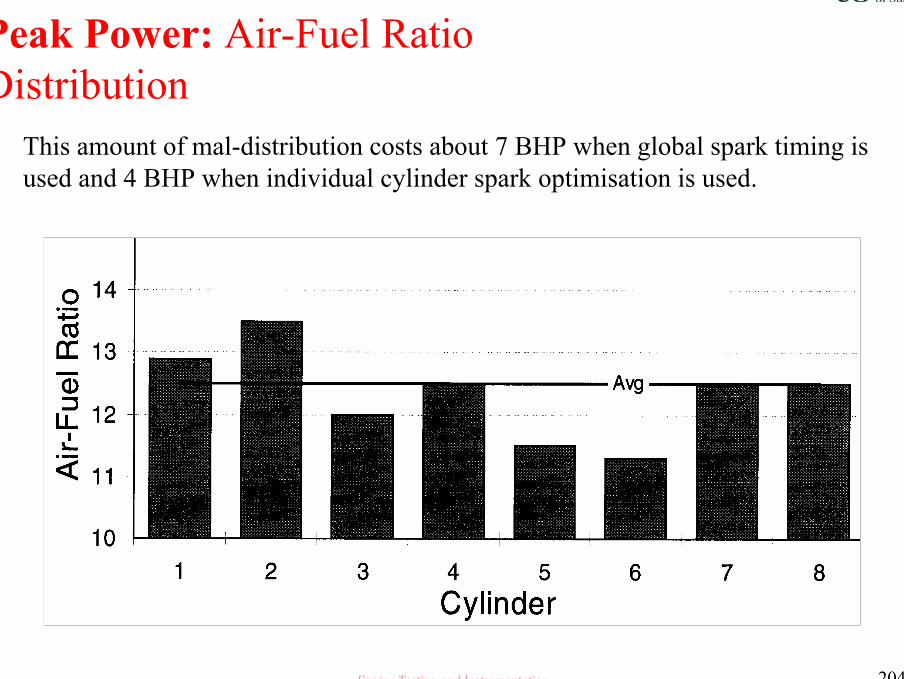
Engine Testing and Instrumentation 204
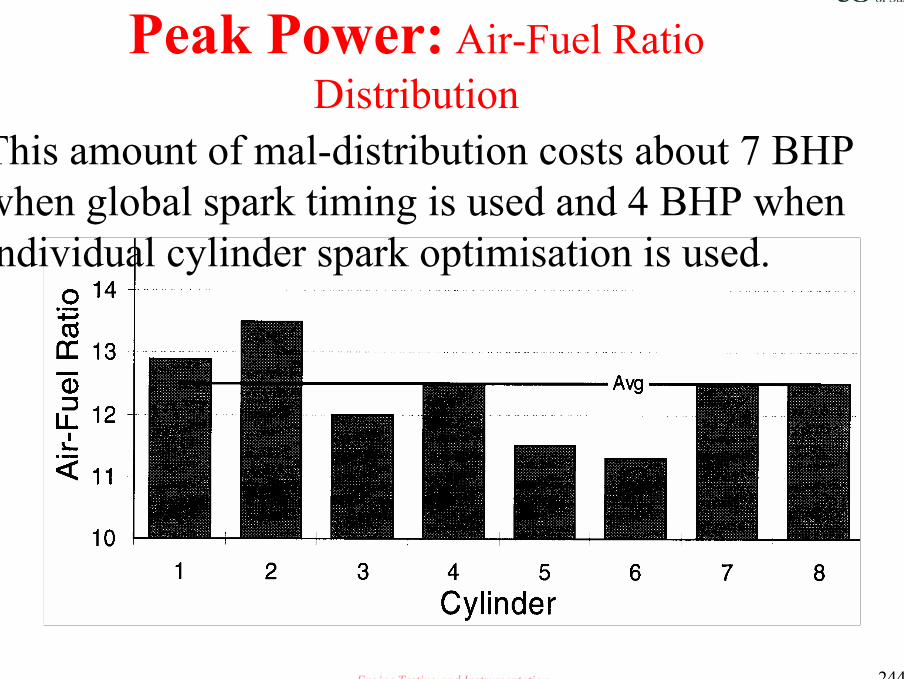
Peak Power: Air-Fuel RatioDistribution
This amount of mal-distribution costs about 7 BHP when global spark timing is used and 4 BHP when individual cylinder spark optimisation is used.
Engine Testing and Instrumentation 205
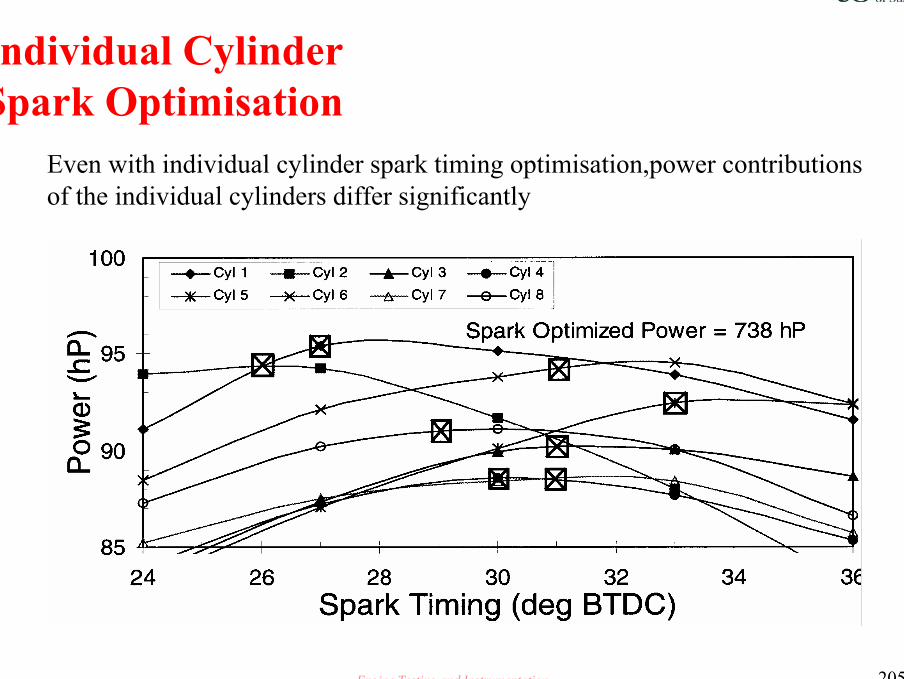
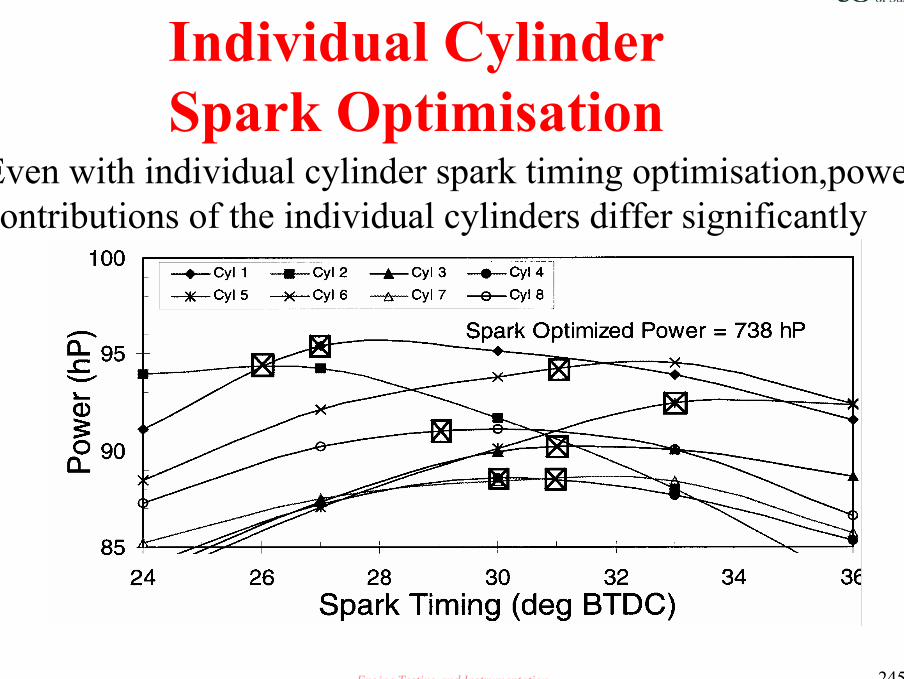
Individual CylinderSpark Optimisation
Even with individual cylinder spark timing optimisation,power contributions of the individual cylinders differ significantly

Engine Testing and Instrumentation 206
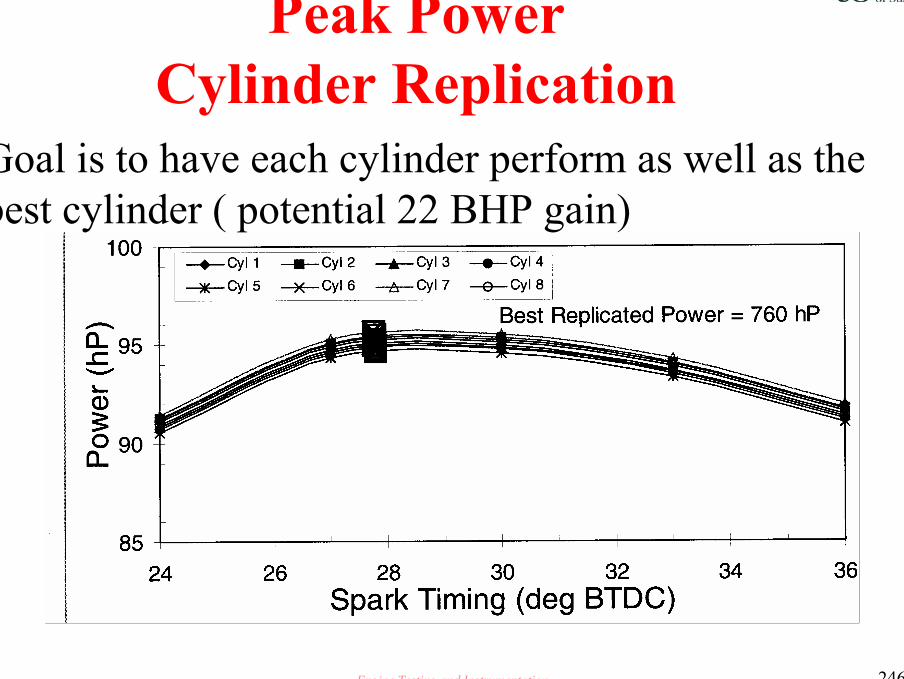
Peak Power Cylinder Replication
Goal is to have each cylinder perform as well as the best cylinder ( potential 22 BHP gain)

Engine Testing and Instrumentation 207
Replicated Chambers,Ports & RunnersCylinder-to-cylinder imbalance in any of a variety of areas degrades the
combustion system performance:• Air fuel ratio ( air flow / fuel flow )
– Intake restriction– Exhaust restriction– Tuning lengths– Fuel distribution
• Mixture motion• Valve timing• Compression ratio

Engine Testing and Instrumentation 208
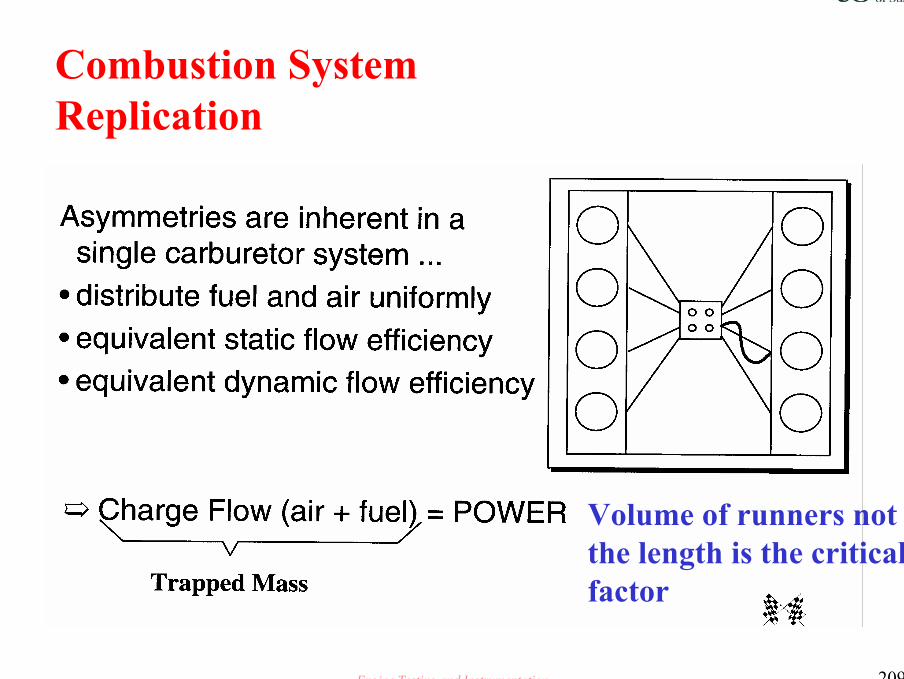
Combustion SystemReplication
Design issues to achieve
• Pastry cutter design replication of the combustion system,
inlet runners, and exhaust runners
• Even firing intervals
• Control of the manufacturing process
Engine Testing and Instrumentation 209
Combustion SystemReplication
Volume of runners not the length is the critical factor
Engine Testing and Instrumentation 210
Combustion Variability
Steps to improve stability• Well balanced combustion system hardware
– Equal-length, replicated intake/exhaust runners & ports
– Replicated combustion chambers (fast burning)
– Good EGR, air,fuel,PCV & purge distribution
– Good fuel injectors
• Small droplets
• Good targeting (back of valve, minimize wall-wetting)

Engine Testing and Instrumentation 211
Trapped MassReplication

Engine Testing and Instrumentation 212
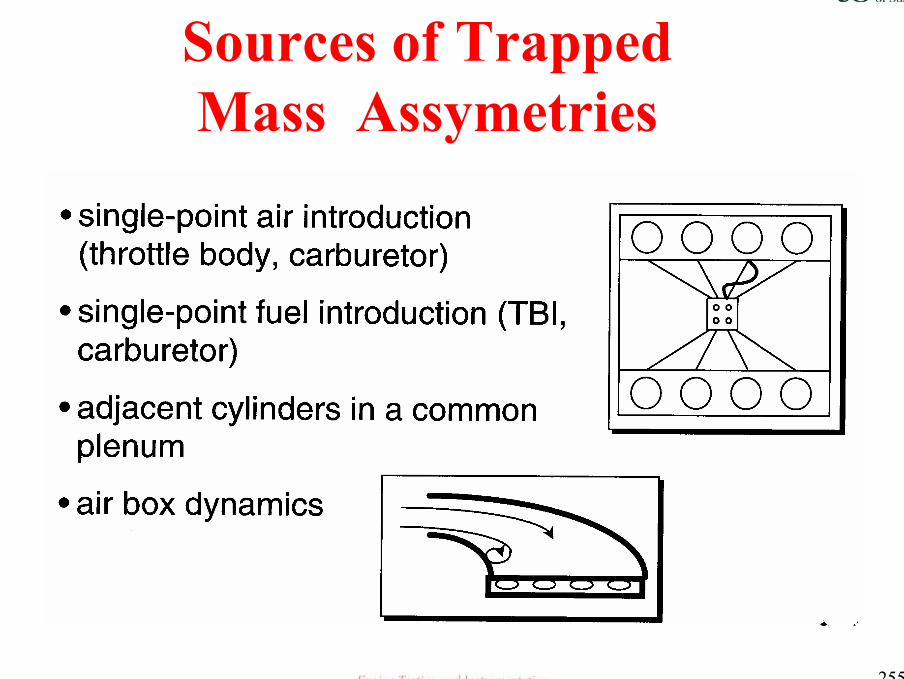
Sources of Trapped Mass Assymetries
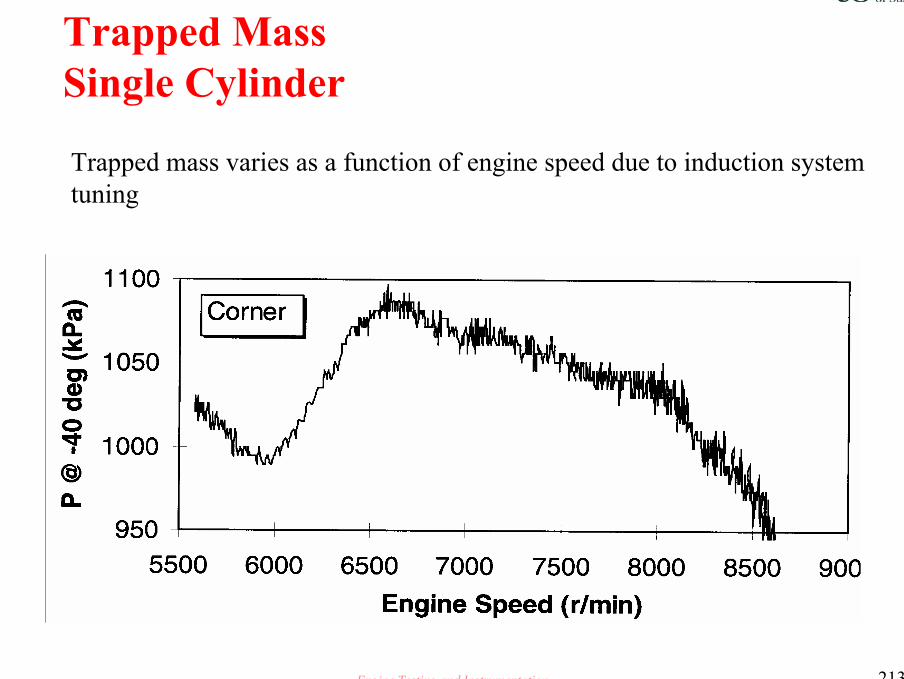
Engine Testing and Instrumentation 213
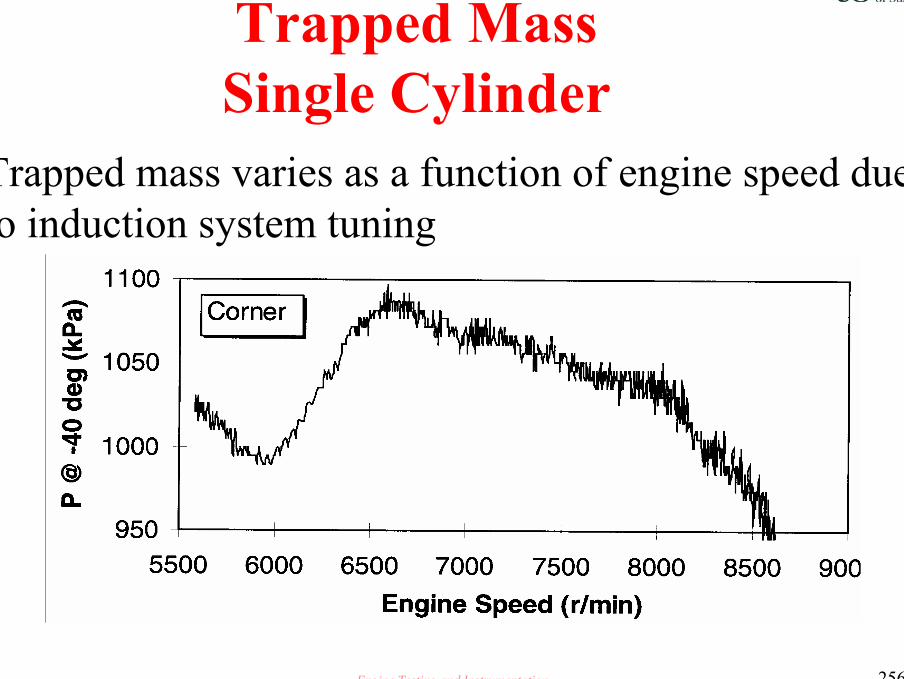
Trapped MassSingle Cylinder
Trapped mass varies as a function of engine speed due to induction system tuning

Engine Testing and Instrumentation 214
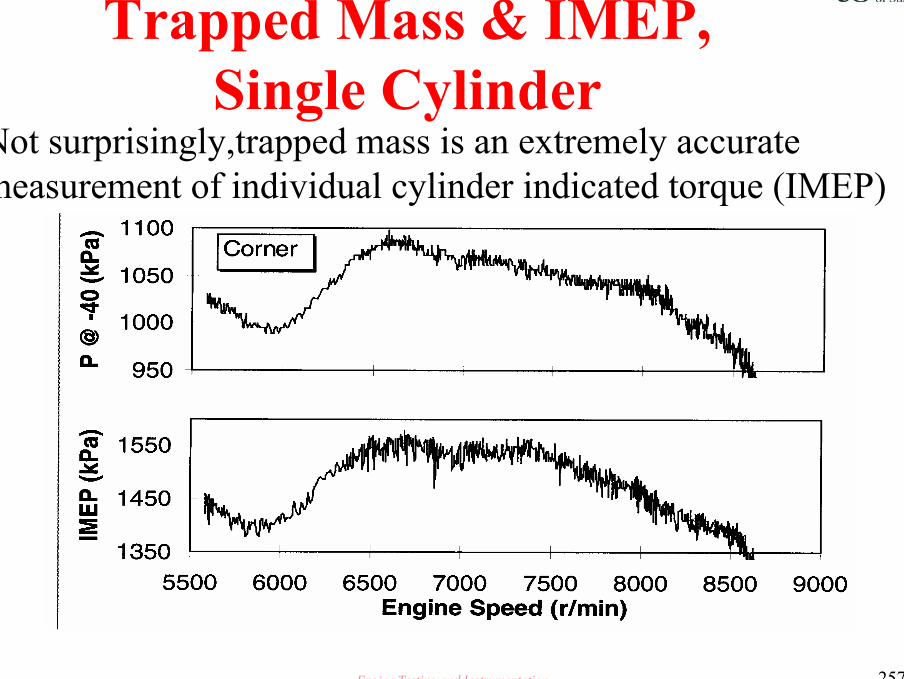
Trapped Mass & IMEP,Single Cylinder
Not surprisingly,trapped mass is an extremely accurate measurement of individual cylinder indicated torque (IMEP)
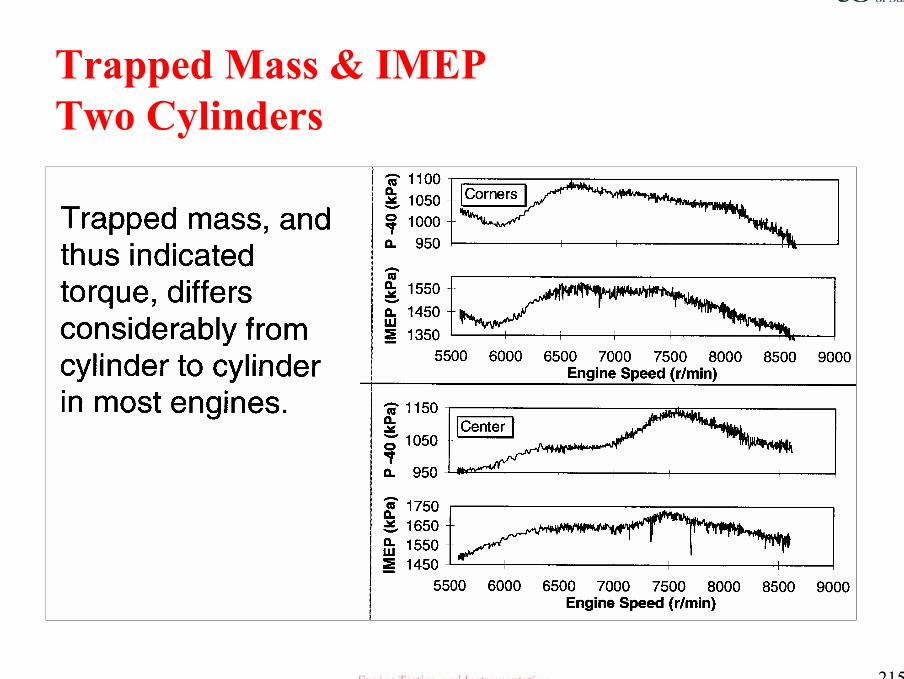
Engine Testing and Instrumentation 215
Trapped Mass & IMEPTwo Cylinders

Engine Testing and Instrumentation 216
Trapped Mass &Knock Propensity
Engine Testing and Instrumentation 217
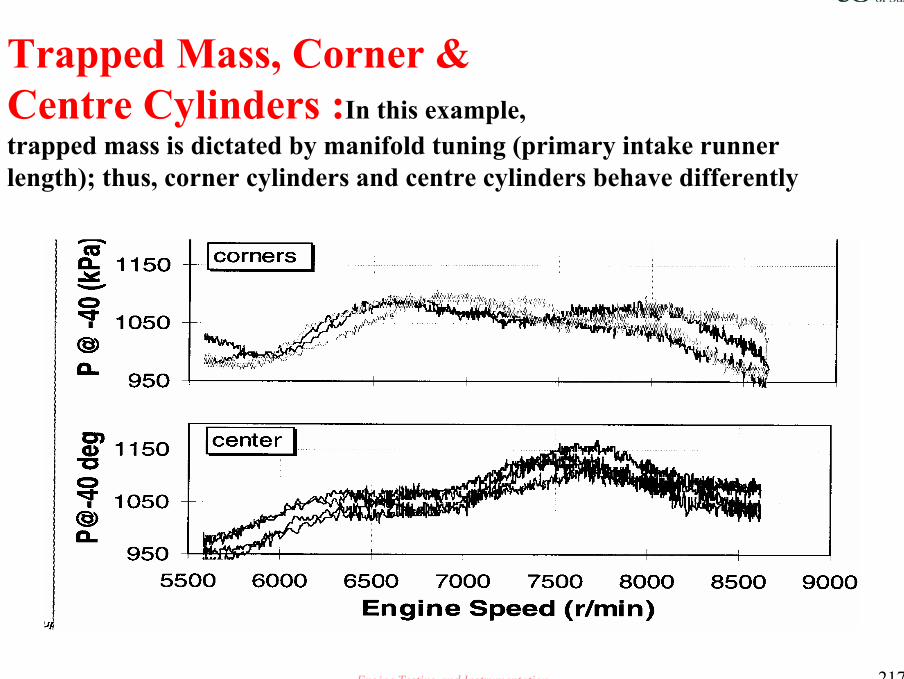
Trapped Mass, Corner &Centre Cylinders :In this example,trapped mass is dictated by manifold tuning (primary intake runner length); thus, corner cylinders and centre cylinders behave differently

Engine Testing and Instrumentation 218
Torque Curve Optimisation

Engine Testing and Instrumentation 219
Torque Curve OptimisationAverage torque curve is broad and non-optimum

Engine Testing and Instrumentation 220
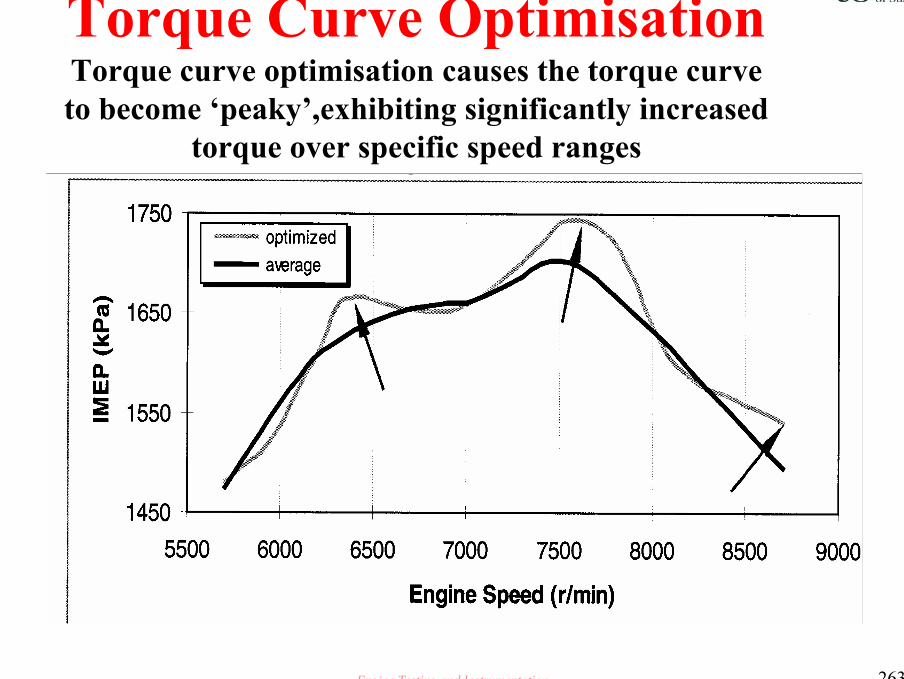
Torque Curve OptimisationTorque curve optimisation causes the torque curveto become ‘peaky’,exhibiting significantly increasedtorque over specific speed ranges

Engine Testing and Instrumentation 221
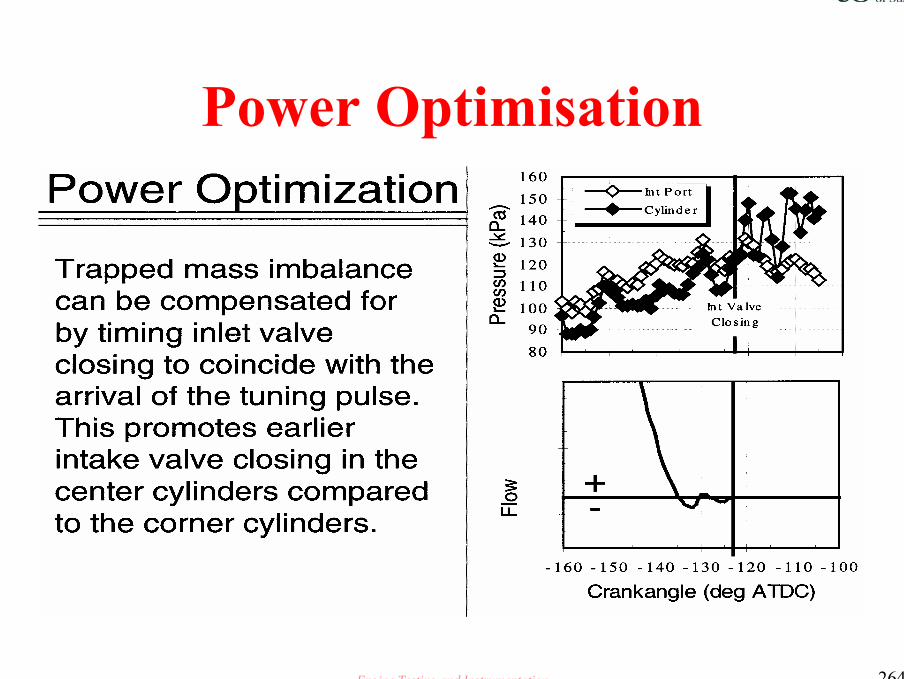
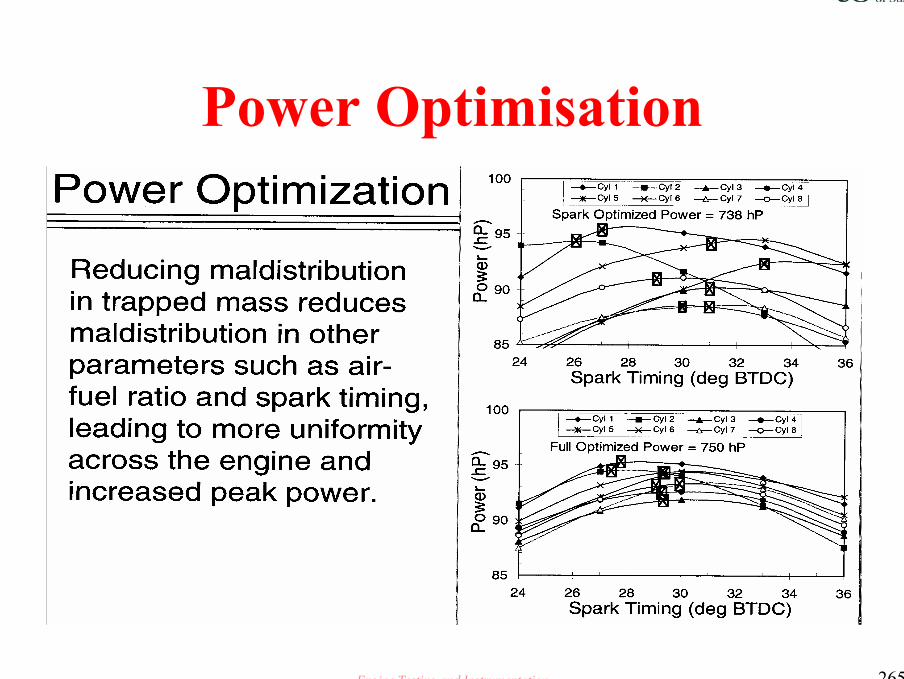
Power Optimisation

Engine Testing and Instrumentation 222
Power Optimisation

Engine Testing and Instrumentation 223
Tuning for PowerSummary• Power and torque from a multi-cylinder engine are dictated by the total
contributions of the individual cylinders• Some design features,such as single point air throttling and or single
point fuel injection,lead to inherent mal-distribution• Mal-distribution causes the torque curve to be broad and low. All
cylinders suffer compromised performance• Trapped mass mal-distribution is the single largest source of mal-
distribution in other parameters
Engine Testing and Instrumentation 224
Tuning for PowerSummary cont…
• Compensating for mal-distribution in trapped mass by optimising inlet valve closing reduces the amount of compensation required for other parameters such as ignition timing
• Achieving maximum individual cylinder performance by reducing mal-distribution substantially increases overall engine output
Engine Testing and Instrumentation 225
Automatic mapping
The trend toward automatic mapping is a ongoing cause for concern.There are many and disparate variables to be considered, for example
Fuel and ignition timing and durationVariable valve timingVariable Induction lengthVariable EGRVariable boost
Engine Testing and Instrumentation 226
Automatic mapping
Changing many parameters simultaneously runs contrary to the engineers training , the mantra was change one thing at a time.
Times have changed, and we must use the available tools effectively
In order to be able to identify major errors in Automatic mapping data, it is essential that the engineer has a deep understanding of the effect of individual parameter changes on all the associated outputs.
Steady state loop studies in the running envelope are still required, and again when running the tests, warning bells should ring if the results are too good

Engine Testing and Instrumentation 227
Thermal
Energy
Mechanical Energy
Thermal Energy
(exhaust)
Chemical
Energy
(fuel,air)
Engine: an energy conversion device that converts thermal energy (heat) to mechanical energy
Engine Testing and Instrumentation 228
Exhaust Gas Recirculation (EGR)
Engine Testing and Instrumentation 229
EGR- Increases net thermalefficiency by reducing pumping work

Engine Testing and Instrumentation 230
EGR-Output reduced with addition of EGR at constant manifold
pressure

Engine Testing and Instrumentation 231
EGR – Must open throttle torecover load, thereby reducing
pumping loss ( spark ignition only)
Engine Testing and Instrumentation 232
EGR – Performs the same functionas the throttle, with out the associatedpumping work (Spark ignition only)

Engine Testing and Instrumentation 233
EGR – Reduces NOx emissionsby reducing the combustion
temperatures
Engine Testing and Instrumentation 234
EGR – To much has distinctdisadvantages !!!!!
Engine Testing and Instrumentation 235
EGR trade offs• High EGR
– Positive aspects• Increases efficiency ( improve fuel economy)• Reduces NOx emissions
• High EGR– Negative aspects
• Increases HC emissions• Decreases combustion stability• Complicates transient control
Engine Testing and Instrumentation 236
Compression RatioOptimisation ( S I Application)
Engine Testing and Instrumentation 237
Compression RatioOptimisation
Advantages of Maximising Compression Ratio• Increased full-load torque through most of the engine
speed range• Reduced full-load combustion-induced engine noise• Lower peak full-load combustion pressures• Improved part-load fuel economy(approx 1.5% per
0.5\ratio)• Increased dilution tolerance through faster burn• Improved idle stability via lower residuals

Engine Testing and Instrumentation 238
Compression RatioOptimisation
Disadvantages of Maximising Compression Ratio
• Higher part-load hydrocarbon and NOx emissions
• Greater reliance on knock sensing system• Higher full-load exhaust temperatures• Increased likelihood of pre-ignition

Engine Testing and Instrumentation 239
Compression RatioOptimisation
Enablers of High Compression Ratio• Precise fuel control• Good cooling of the chamber and
combustion chamber• Reliable knock sensing and control
methodology• Low engine – out emissions

Engine Testing and Instrumentation 240
Full Load Performance Optimisation
• Example from a NASCAR Winston Cup
race engine development exercise, which
demonstrates the clear advantages of
utilising combustion analysis techniques to
enable accelerated development.

Engine Testing and Instrumentation 241
Full Load Performance Optimisation

Engine Testing and Instrumentation 242
Full Load Performance Optimisation
Ignition timing is set to the value that maximises output from each individual cylinder, leading to a 10 BHP increase in total engine power
5.7 litre push rod

Engine Testing and Instrumentation 243
Peak Power:Sensitivity toAir-Fuel Ratio
Individual cylinder air-fuel ratio mal-distribution also reduces total engine peak power
Engine Testing and Instrumentation 244
Peak Power: Air-Fuel RatioDistribution
This amount of mal-distribution costs about 7 BHP when global spark timing is used and 4 BHP when individual cylinder spark optimisation is used.
Engine Testing and Instrumentation 245
Individual CylinderSpark Optimisation
Even with individual cylinder spark timing optimisation,power contributions of the individual cylinders differ significantly
Engine Testing and Instrumentation 246
Peak Power Cylinder Replication
Goal is to have each cylinder perform as well as the best cylinder ( potential 22 BHP gain)

Engine Testing and Instrumentation 247
Replicated Chambers,Ports & Runners
Cylinder-to-cylinder imbalance in any of a variety of areas degrades the combustion system performance:
• Air fuel ratio ( air flow / fuel flow )– Intake restriction– Exhaust restriction– Tuning lengths– Fuel distribution
• Mixture motion• Valve timing• Compression ratio

Engine Testing and Instrumentation 248
Port/chamber replication ?

Engine Testing and Instrumentation 249
Port/chamber replication ?

Engine Testing and Instrumentation 250
Manifold ApproachReplication ?

Engine Testing and Instrumentation 251
Combustion SystemReplication
Design issues to achieve• Pastry cutter design replication of the
combustion system, inlet runners, and exhaust
runners
• Even firing intervals
• Control of the manufacturing process

Engine Testing and Instrumentation 252
Combustion SystemReplication
Volume of runners not the length is the critical factor
Engine Testing and Instrumentation 253
Combustion Variability
Steps to improve stability• Well balanced combustion system hardware
– Equal-length, replicated intake/exhaust runners & ports
– Replicated combustion chambers (fast burning)
– Good EGR, air,fuel,PCV & purge distribution
– Good fuel injectors• Small droplets
• Good targeting (back of valve, minimize wall-wetting)

Engine Testing and Instrumentation 254
Trapped MassReplication
Engine Testing and Instrumentation 255
Sources of Trapped Mass Assymetries
Engine Testing and Instrumentation 256
Trapped MassSingle Cylinder
Trapped mass varies as a function of engine speed due to induction system tuning
Engine Testing and Instrumentation 257
Trapped Mass & IMEP,Single Cylinder
Not surprisingly,trapped mass is an extremely accurate measurement of individual cylinder indicated torque (IMEP)

Engine Testing and Instrumentation 258
Trapped Mass & IMEPTwo Cylinders

Engine Testing and Instrumentation 259
Trapped Mass &Knock Propensity

Engine Testing and Instrumentation 260
Trapped Mass, Corner &Centre Cylinders :In this example,
trapped mass is dictated by manifold tuning (primary intake runner length); thus, corner cylinders and centre cylinders
behave differently

Engine Testing and Instrumentation 261
Torque Curve Optimisation

Engine Testing and Instrumentation 262
Torque Curve OptimisationAverage torque curve is broad and non-optimum
Engine Testing and Instrumentation 263
Torque Curve OptimisationTorque curve optimisation causes the torque curveto become ‘peaky’,exhibiting significantly increased
torque over specific speed ranges
Engine Testing and Instrumentation 264
Power Optimisation
Engine Testing and Instrumentation 265
Power Optimisation
Engine Testing and Instrumentation 266
Tuning for PowerSummary
• Power and torque from a multi-cylinder engine are dictated by the total contributions of the individual cylinders
• Some design features,such as single point air throttling and or single point fuel injection,lead to inherent mal-distribution
• Mal-distribution causes the torque curve to be broad and low. All cylinders suffer compromised performance
• Trapped mass mal-distribution is the single largest source of mal-distribution in other parameters
Engine Testing and Instrumentation 267
Tuning for PowerSummary cont…
• Compensating for mal-distribution in trapped mass by optimising inlet valve closing reduces the amount of compensation required for other parameters such as ignition timing
• Achieving maximum individual cylinder performance by reducing mal-distribution substantially increases overall engine output
Related Documents