Indian Equity Market WELCOME

Welcome message from author
This document is posted to help you gain knowledge. Please leave a comment to let me know what you think about it! Share it to your friends and learn new things together.
Transcript

Indian Equity Market
WELCOME
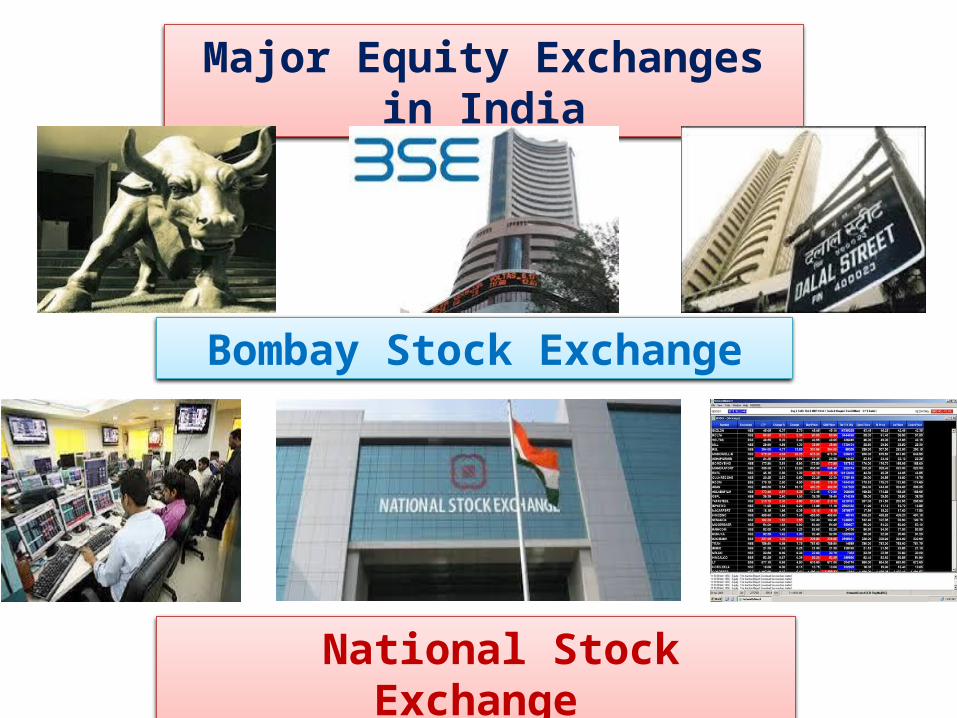
Major Equity Exchanges in India
Bombay Stock Exchange
National Stock Exchange
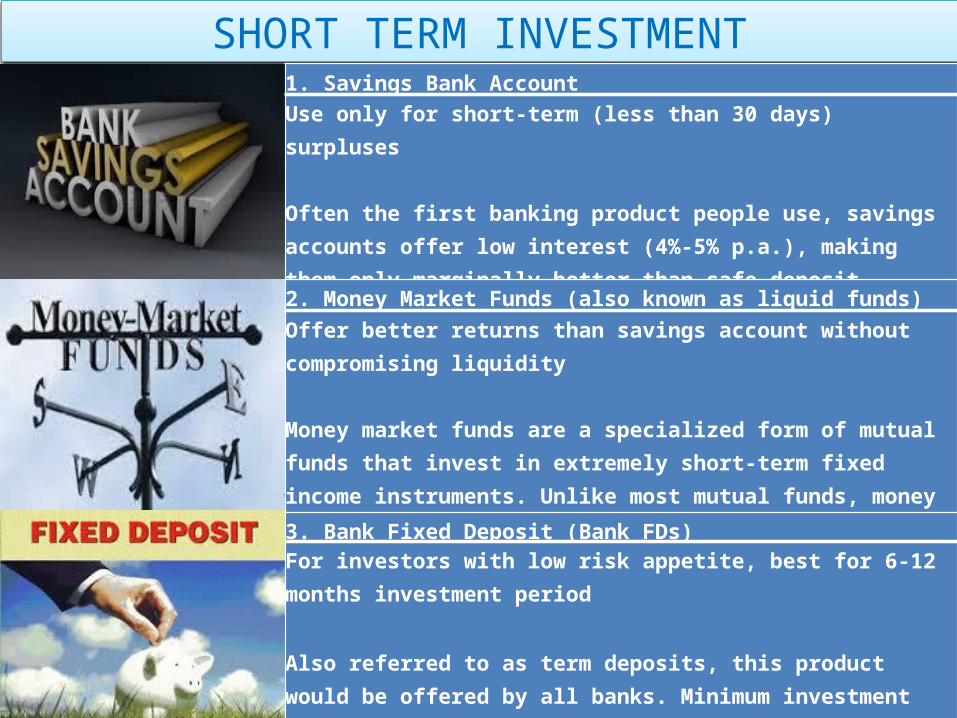
SHORT TERM INVESTMENT1. Savings Bank Account
Use only for short-term (less than 30 days) surpluses
Often the first banking product people use, savings accounts offer low interest (4%-5% p.a.), making them only marginally better than safe deposit lockers.
2. Money Market Funds (also known as liquid funds)
Offer better returns than savings account without compromising liquidity
Money market funds are a specialized form of mutual funds that invest in extremely short-term fixed income instruments. Unlike most mutual funds, money market funds are primarily oriented towards protecting your capital and then, aim to maximise returns
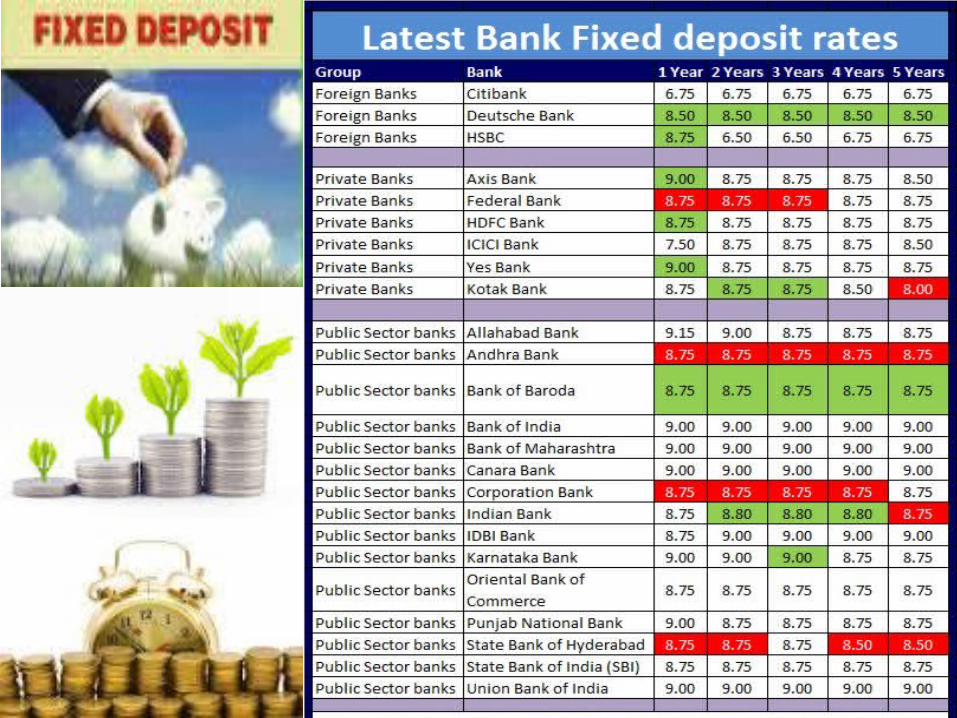
3. Bank Fixed Deposit (Bank FDs)
For investors with low risk appetite, best for 6-12 months investment period
Also referred to as term deposits, this product would be offered by all banks. Minimum investment period for bank FDs is 30 days. It is important to plan your investment time frame while investing in this instrument because early withdrawals typically carry a penalty.
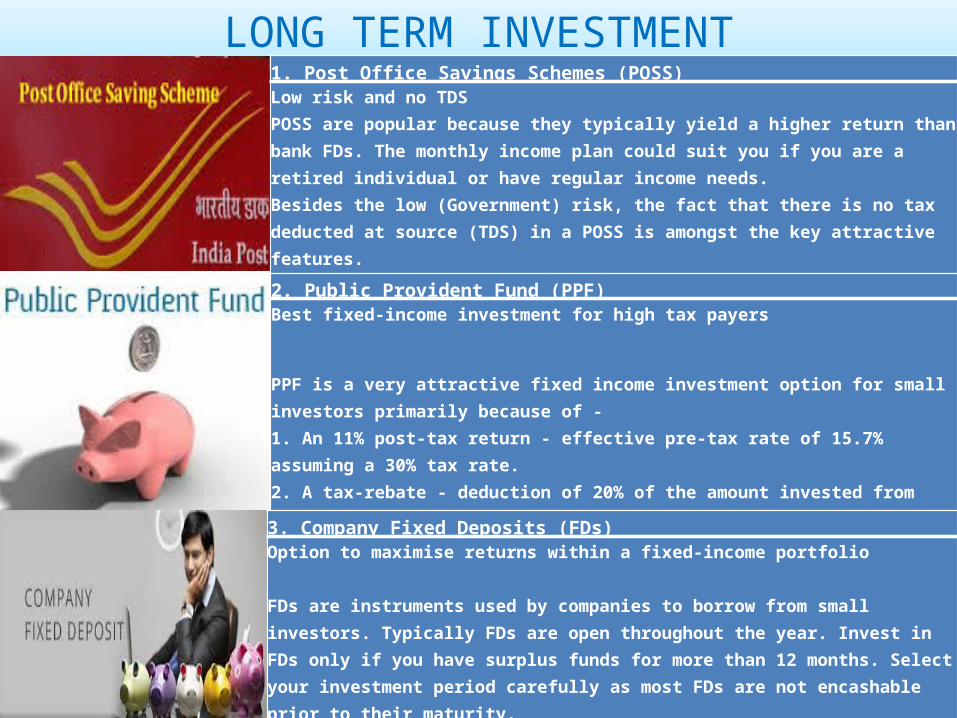
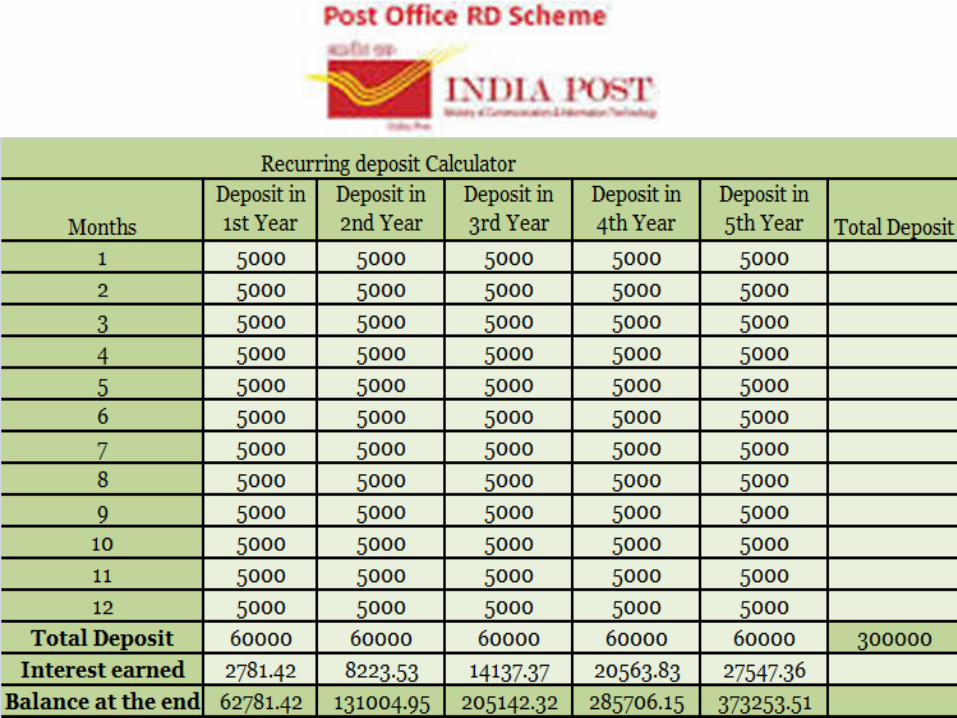
LONG TERM INVESTMENT1. Post Office Savings Schemes (POSS)
Low risk and no TDS POSS are popular because they typically yield a higher return than bank FDs. The monthly income plan could suit you if you are a retired individual or have regular income needs. Besides the low (Government) risk, the fact that there is no tax deducted at source (TDS) in a POSS is amongst the key attractive features. The Post Office offers various schemes that include National Savings Certificates (NSC), National Savings Scheme(NSS), Kisan Vikas Patra, Monthly Income Scheme and Recurring Deposit Scheme.
2. Public Provident Fund (PPF)
Best fixed-income investment for high tax payers
PPF is a very attractive fixed income investment option for small investors primarily because of - 1. An 11% post-tax return - effective pre-tax rate of 15.7% assuming a 30% tax rate.2. A tax-rebate - deduction of 20% of the amount invested from your tax liability for the year, subject to a maximum Rs60,000 for a tax rebate.3. Low risk - risk attached is Government risk .
3. Company Fixed Deposits (FDs)
Option to maximise returns within a fixed-income portfolio
FDs are instruments used by companies to borrow from small investors. Typically FDs are open throughout the year. Invest in FDs only if you have surplus funds for more than 12 months. Select your investment period carefully as most FDs are not encashable prior to their maturity.
Just as in any other instrument, risk is an embedded feature of FDs, more so because it is not mandatory for non-finance companies to get a credit rating for this instrument.
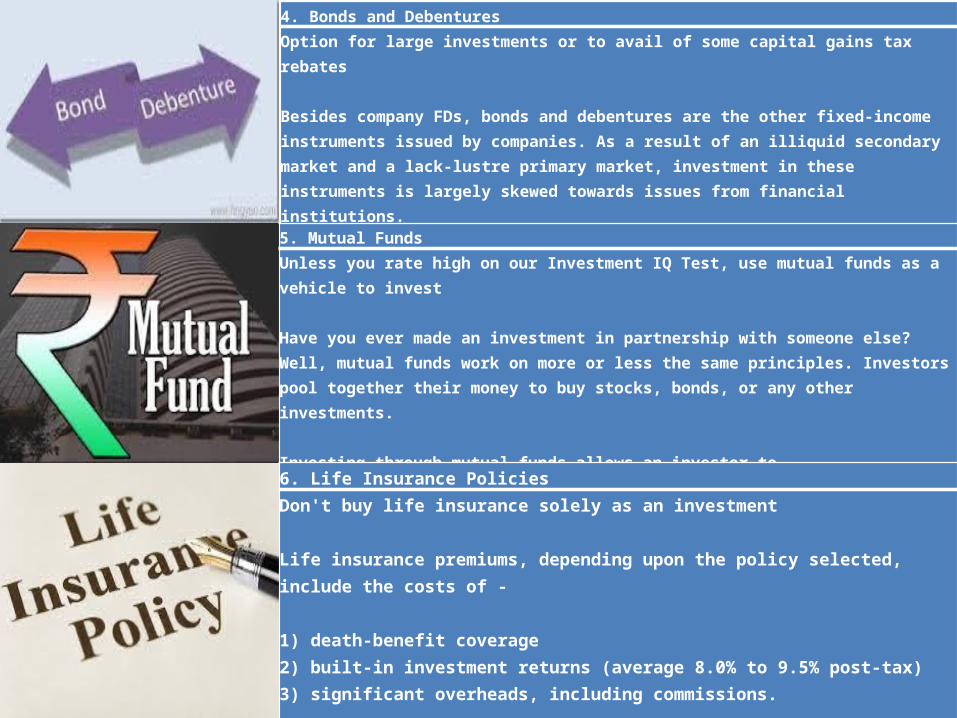
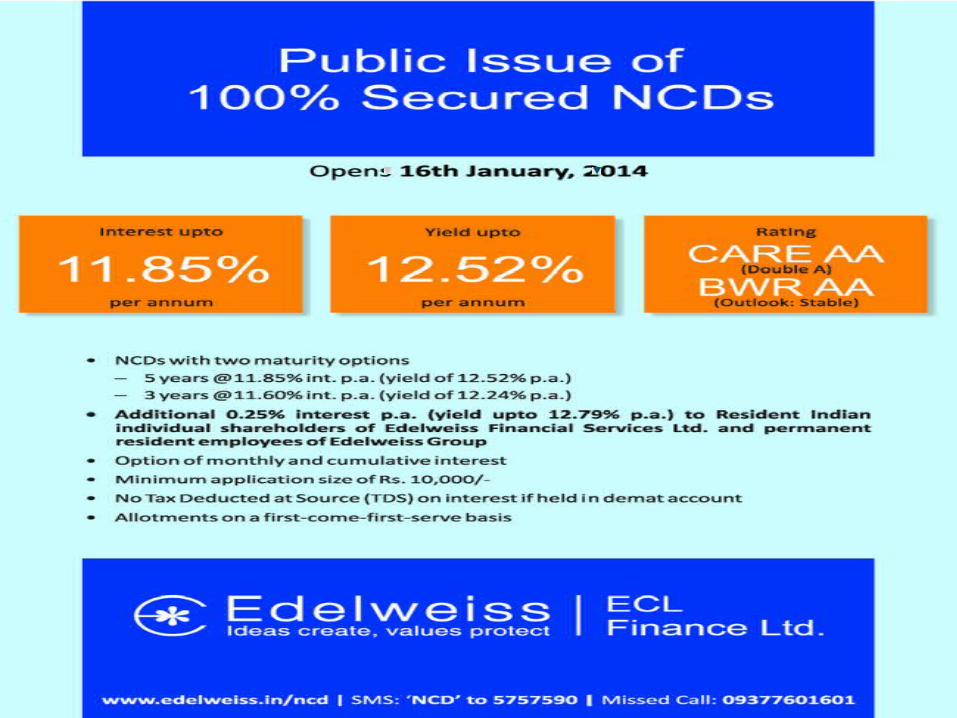
4. Bonds and Debentures Option for large investments or to avail of some capital gains tax rebates
Besides company FDs, bonds and debentures are the other fixed-income instruments issued by companies. As a result of an illiquid secondary market and a lack-lustre primary market, investment in these instruments is largely skewed towards issues from financial institutions.
While you might find some high-yielding options in the secondary market, if you do not want the problems associated with bad deliveries and the transfer process or you want to invest a large sum of money, the primary market is the better option.
5. Mutual Funds
Unless you rate high on our Investment IQ Test, use mutual funds as a vehicle to invest
Have you ever made an investment in partnership with someone else? Well, mutual funds work on more or less the same principles. Investors pool together their money to buy stocks, bonds, or any other investments.
Investing through mutual funds allows an investor to -
1. Avail the services of a professional money manager (who manages the mutual fund)2. Access a diversified portfolio despite making a limited investment .
6. Life Insurance Policies
Don't buy life insurance solely as an investment
Life insurance premiums, depending upon the policy selected, include the costs of -
1) death-benefit coverage 2) built-in investment returns (average 8.0% to 9.5% post-tax)3) significant overheads, including commissions.
This implies that if you buy insurance solely as an investment, you are incurring costs that you would not incur in alternate investment options.
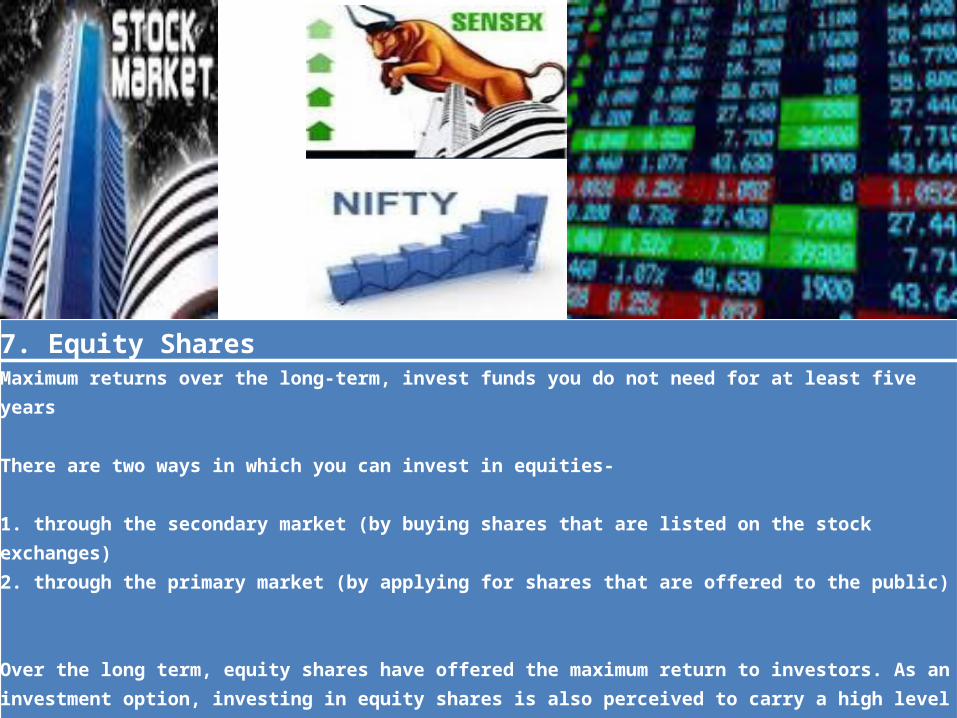
7. Equity Shares
Maximum returns over the long-term, invest funds you do not need for at least five years
There are two ways in which you can invest in equities-
1. through the secondary market (by buying shares that are listed on the stock exchanges) 2. through the primary market (by applying for shares that are offered to the public)
Over the long term, equity shares have offered the maximum return to investors. As an investment option, investing in equity shares is also perceived to carry a high level of risk.
Learn more about building an equity portfolio in Investing in Equities
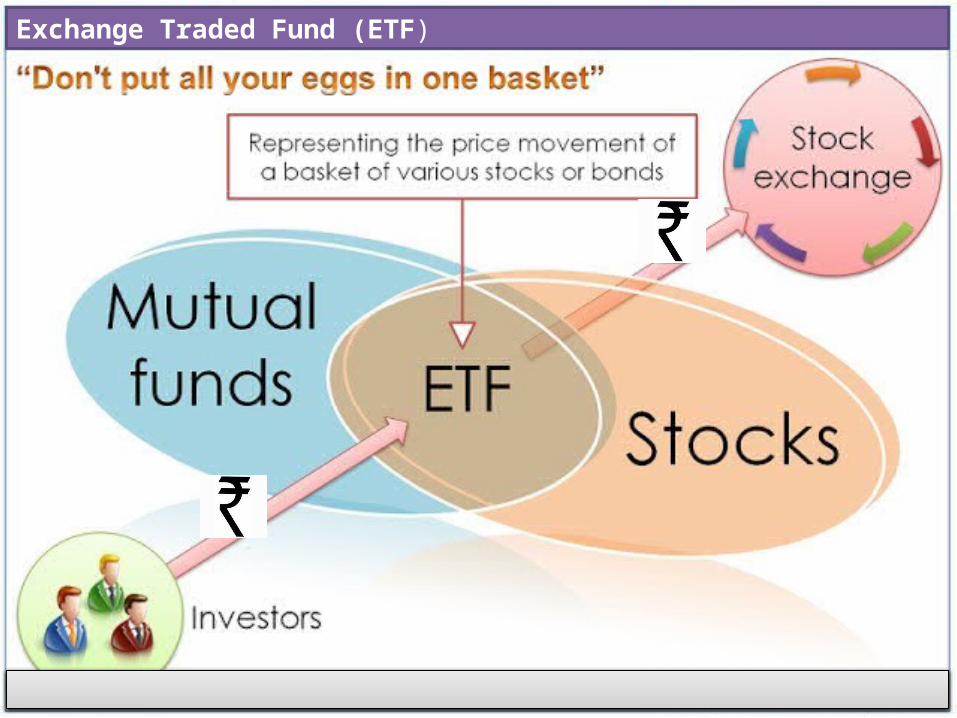
Exchange Traded Fund (ETF)
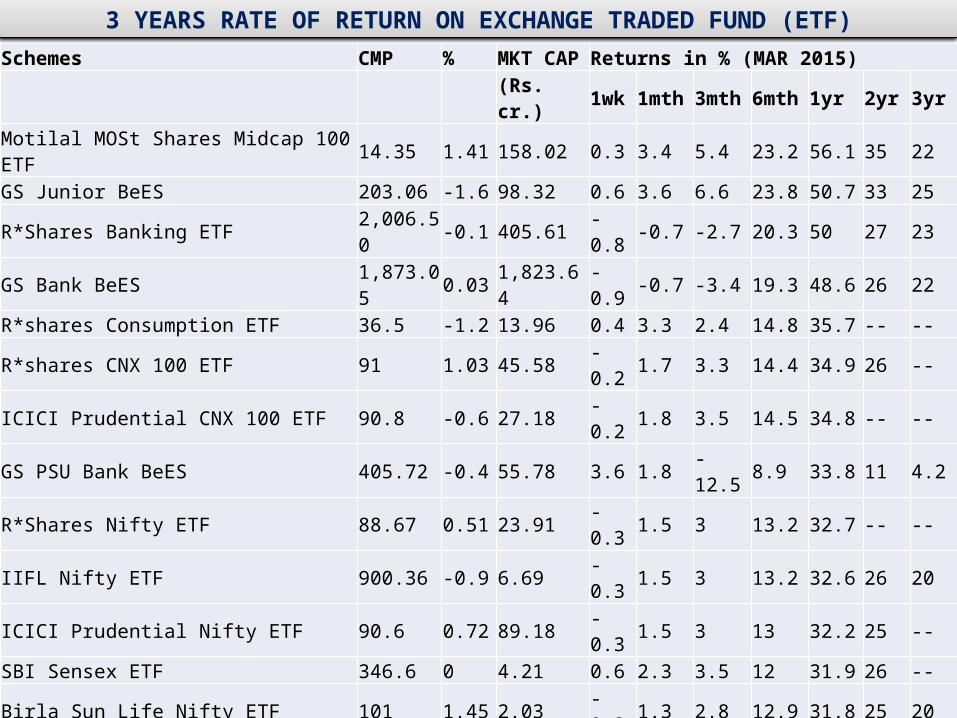
Schemes CMP % MKT CAP Returns in % (MAR 2015) (Rs. cr.) 1wk 1mth 3mth 6mth 1yr 2yr 3yrMotilal MOSt Shares Midcap 100 ETF 14.35 1.41 158.02 0.3 3.4 5.4 23.2 56.1 35 22GS Junior BeES 203.06 -1.6 98.32 0.6 3.6 6.6 23.8 50.7 33 25R*Shares Banking ETF 2,006.50 -0.1 405.61 -0.8 -0.7 -2.7 20.3 50 27 23GS Bank BeES 1,873.05 0.03 1,823.64 -0.9 -0.7 -3.4 19.3 48.6 26 22R*shares Consumption ETF 36.5 -1.2 13.96 0.4 3.3 2.4 14.8 35.7 -- --R*shares CNX 100 ETF 91 1.03 45.58 -0.2 1.7 3.3 14.4 34.9 26 --ICICI Prudential CNX 100 ETF 90.8 -0.6 27.18 -0.2 1.8 3.5 14.5 34.8 -- --GS PSU Bank BeES 405.72 -0.4 55.78 3.6 1.8 -12.5 8.9 33.8 11 4.2R*Shares Nifty ETF 88.67 0.51 23.91 -0.3 1.5 3 13.2 32.7 -- --IIFL Nifty ETF 900.36 -0.9 6.69 -0.3 1.5 3 13.2 32.6 26 20ICICI Prudential Nifty ETF 90.6 0.72 89.18 -0.3 1.5 3 13 32.2 25 --SBI Sensex ETF 346.6 0 4.21 0.6 2.3 3.5 12 31.9 26 --Birla Sun Life Nifty ETF 101 1.45 2.03 -0.3 1.3 2.8 12.9 31.8 25 20Religare Invesco Nifty ETF 832.55 -0.1 1.58 -0.3 1.4 2.8 12.8 31.8 25 19GS Nifty BeES 873.36 -0.5 764.2 -0.3 1.4 2 12 31.2 24 19Kotak Nifty ETF 875 -0.3 77.09 -0.3 1.5 3 11.9 31.1 23 18Motilal MOSt Shares NASDAQ 100 ETF 268.08 -0.9 67.03 0.9 1.1 8.2 18 30.6 34 26GS Infra BeES 339.92 -0.9 27.78 1.3 4.9 9.5 15.6 30.2 23 12GS Hang Seng BeES 2,260.00 0 6.84 2.7 14.5 15.7 21.9 29 24 20Kotak Sensex ETF 287 -2.1 8.1 -0.3 1.4 2.6 8.6 28 22 18Kotak PSU Bank ETF 381.39 1.49 21.74 3.6 1.8 -12.5 4.1 27.8 7.9 0.3Motilal MOSt Shares M50 ETF 82.49 -1.8 29.26 -0.3 1.2 2.6 11.2 27.1 25 18GS Shariah BeES 191.5 -1.4 1.15 -0.1 3.1 3.6 8.7 26 24 19R*Shares Dividend ETF - 13.05 0.4 2.9 -1.9 5.9 23.9 -- --ICICI Pru SPIcE Plan 286 -1.2 3.28 -0.3 1.4 2.5 10.7 18.1 19 16GS Liquid BeES 1,000.00 0 750.9 -- -- -- -- -- -- --
3 YEARS RATE OF RETURN ON EXCHANGE TRADED FUND (ETF)
.
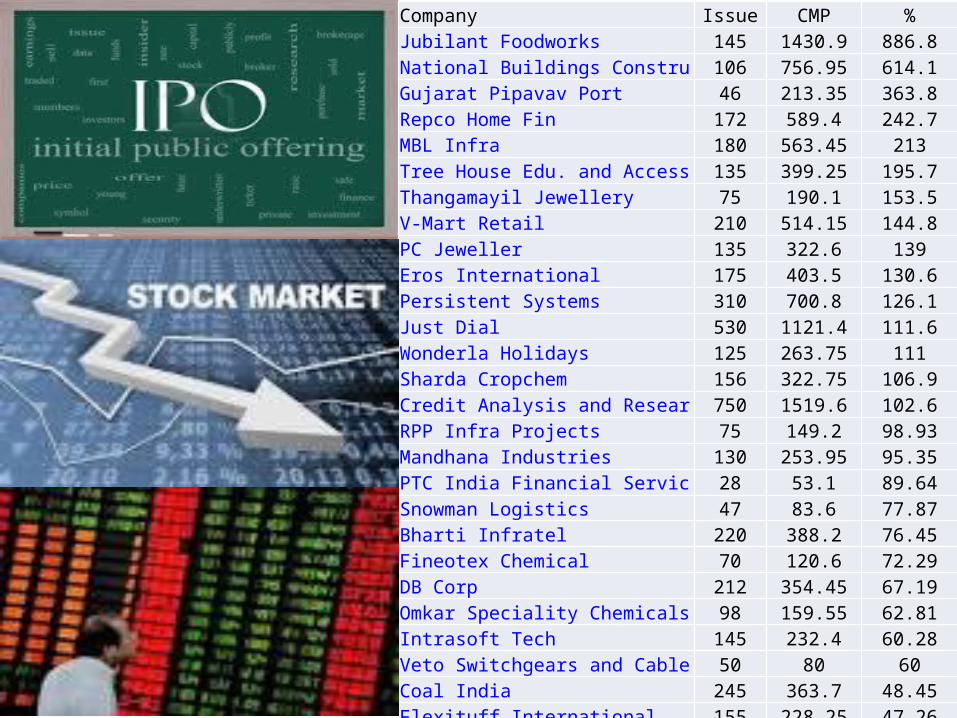
Company Issue CMP %Jubilant Foodworks 145 1430.9 886.8National Buildings Construction Corp 106 756.95 614.1Gujarat Pipavav Port 46 213.35 363.8Repco Home Fin 172 589.4 242.7MBL Infra 180 563.45 213Tree House Edu. and Accessories 135 399.25 195.7Thangamayil Jewellery 75 190.1 153.5V-Mart Retail 210 514.15 144.8PC Jeweller 135 322.6 139Eros International 175 403.5 130.6Persistent Systems 310 700.8 126.1Just Dial 530 1121.4 111.6Wonderla Holidays 125 263.75 111Sharda Cropchem 156 322.75 106.9Credit Analysis and Research 750 1519.6 102.6RPP Infra Projects 75 149.2 98.93Mandhana Industries 130 253.95 95.35PTC India Financial Services 28 53.1 89.64Snowman Logistics 47 83.6 77.87Bharti Infratel 220 388.2 76.45Fineotex Chemical 70 120.6 72.29DB Corp 212 354.45 67.19Omkar Speciality Chemicals 98 159.55 62.81Intrasoft Tech 145 232.4 60.28Veto Switchgears and Cables 50 80 60Coal India 245 363.7 48.45Flexituff International 155 228.25 47.26Prestige Estates 183 261.45 42.87Lovable Lingerie 205 285.7 39.37VRL Logistics 205 281 37.07
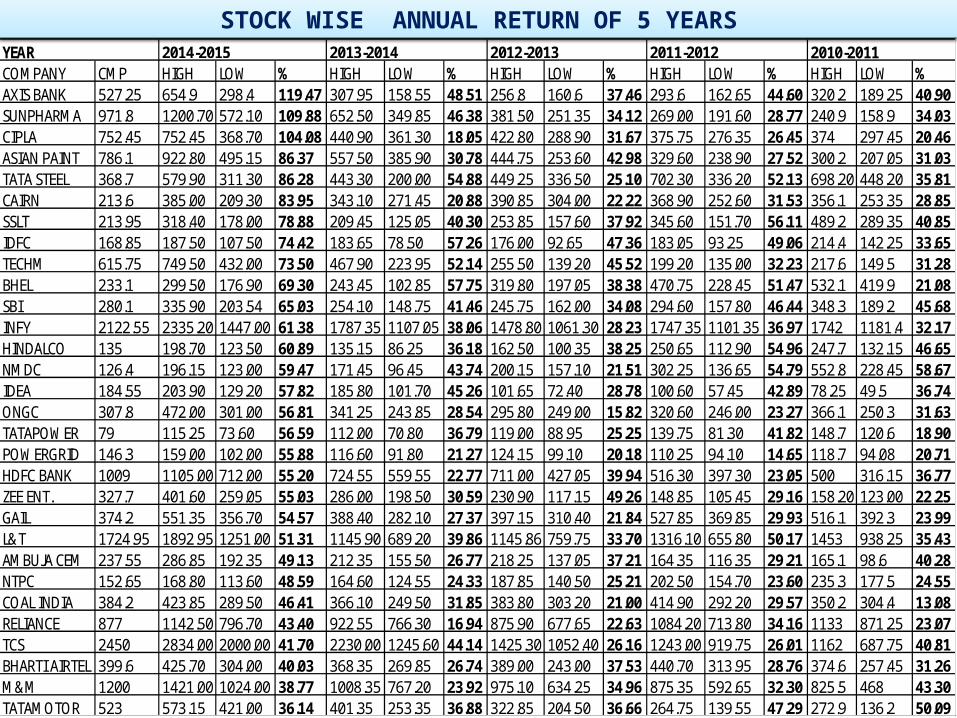
YEAR 2014-2015 2013-2014 2012-2013 2011-2012 2010-2011 COMPANY CMP HIGH LOW % HIGH LOW % HIGH LOW % HIGH LOW % HIGH LOW %AXIS BANK 527.25 654.9 298.4 119.47 307.95 158.55 48.51 256.8 160.6 37.46 293.6 162.65 44.60 320.2 189.25 40.90SUNPHARMA 971.8 1200.70 572.10 109.88 652.50 349.85 46.38 381.50 251.35 34.12 269.00 191.60 28.77 240.9 158.9 34.03CIPLA 752.45 752.45 368.70 104.08 440.90 361.30 18.05 422.80 288.90 31.67 375.75 276.35 26.45 374 297.45 20.46ASIAN PAINT 786.1 922.80 495.15 86.37 557.50 385.90 30.78 444.75 253.60 42.98 329.60 238.90 27.52 300.2 207.05 31.03TATA STEEL 368.7 579.90 311.30 86.28 443.30 200.00 54.88 449.25 336.50 25.10 702.30 336.20 52.13 698.20 448.20 35.81CAIRN 213.6 385.00 209.30 83.95 343.10 271.45 20.88 390.85 304.00 22.22 368.90 252.60 31.53 356.1 253.35 28.85SSLT 213.95 318.40 178.00 78.88 209.45 125.05 40.30 253.85 157.60 37.92 345.60 151.70 56.11 489.2 289.35 40.85IDFC 168.85 187.50 107.50 74.42 183.65 78.50 57.26 176.00 92.65 47.36 183.05 93.25 49.06 214.4 142.25 33.65TECHM 615.75 749.50 432.00 73.50 467.90 223.95 52.14 255.50 139.20 45.52 199.20 135.00 32.23 217.6 149.5 31.28BHEL 233.1 299.50 176.90 69.30 243.45 102.85 57.75 319.80 197.05 38.38 470.75 228.45 51.47 532.1 419.9 21.08SBI 280.1 335.90 203.54 65.03 254.10 148.75 41.46 245.75 162.00 34.08 294.60 157.80 46.44 348.3 189.2 45.68INFY 2122.55 2335.20 1447.00 61.38 1787.35 1107.05 38.06 1478.80 1061.30 28.23 1747.35 1101.35 36.97 1742 1181.4 32.17HINDALCO 135 198.70 123.50 60.89 135.15 86.25 36.18 162.50 100.35 38.25 250.65 112.90 54.96 247.7 132.15 46.65NMDC 126.4 196.15 123.00 59.47 171.45 96.45 43.74 200.15 157.10 21.51 302.25 136.65 54.79 552.8 228.45 58.67IDEA 184.55 203.90 129.20 57.82 185.80 101.70 45.26 101.65 72.40 28.78 100.60 57.45 42.89 78.25 49.5 36.74ONGC 307.8 472.00 301.00 56.81 341.25 243.85 28.54 295.80 249.00 15.82 320.60 246.00 23.27 366.1 250.3 31.63TATAPOWER 79 115.25 73.60 56.59 112.00 70.80 36.79 119.00 88.95 25.25 139.75 81.30 41.82 148.7 120.6 18.90POWERGRID 146.3 159.00 102.00 55.88 116.60 91.80 21.27 124.15 99.10 20.18 110.25 94.10 14.65 118.7 94.08 20.71HDFC BANK 1009 1105.00 712.00 55.20 724.55 559.55 22.77 711.00 427.05 39.94 516.30 397.30 23.05 500 316.15 36.77ZEE ENT. 327.7 401.60 259.05 55.03 286.00 198.50 30.59 230.90 117.15 49.26 148.85 105.45 29.16 158.20 123.00 22.25GAIL 374.2 551.35 356.70 54.57 388.40 282.10 27.37 397.15 310.40 21.84 527.85 369.85 29.93 516.1 392.3 23.99L&T 1724.95 1892.95 1251.00 51.31 1145.90 689.20 39.86 1145.86 759.75 33.70 1316.10 655.80 50.17 1453 938.25 35.43AMBUJA CEM 237.55 286.85 192.35 49.13 212.35 155.50 26.77 218.25 137.05 37.21 164.35 116.35 29.21 165.1 98.6 40.28NTPC 152.65 168.80 113.60 48.59 164.60 124.55 24.33 187.85 140.50 25.21 202.50 154.70 23.60 235.3 177.5 24.55COAL INDIA 384.2 423.85 289.50 46.41 366.10 249.50 31.85 383.80 303.20 21.00 414.90 292.20 29.57 350.2 304.4 13.08RELIANCE 877 1142.50 796.70 43.40 922.55 766.30 16.94 875.90 677.65 22.63 1084.20 713.80 34.16 1133 871.25 23.07TCS 2450 2834.00 2000.00 41.70 2230.00 1245.60 44.14 1425.30 1052.40 26.16 1243.00 919.75 26.01 1162 687.75 40.81BHARTI AIRTEL 399.6 425.70 304.00 40.03 368.35 269.85 26.74 389.00 243.00 37.53 440.70 313.95 28.76 374.6 257.45 31.26M&M 1200 1421.00 1024.00 38.77 1008.35 767.20 23.92 975.10 634.25 34.96 875.35 592.65 32.30 825.5 468 43.30TATAMOTOR 523 573.15 421.00 36.14 401.35 253.35 36.88 322.85 204.50 36.66 264.75 139.55 47.29 272.9 136.2 50.09
STOCK WISE ANNUAL RETURN OF 5 YEARS
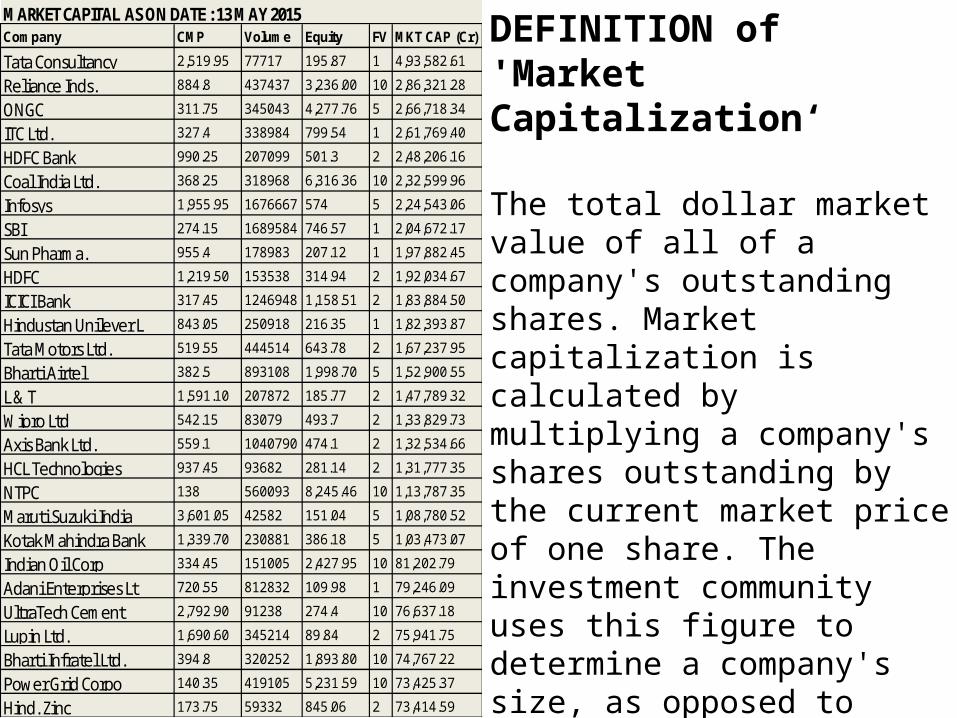
MARKET CAPITAL AS ON DATE : 13 MAY 2015 Company CMP Volume Equity FV MKT CAP (Cr)
Tata Consultancy 2,519.95 77717 195.87 1 4,93,582.61
Reliance Inds. 884.8 437437 3,236.00 10 2,86,321.28
ONGC 311.75 345043 4,277.76 5 2,66,718.34
ITC Ltd. 327.4 338984 799.54 1 2,61,769.40
HDFC Bank 990.25 207099 501.3 2 2,48,206.16
Coal India Ltd. 368.25 318968 6,316.36 10 2,32,599.96
Infosys 1,955.95 1676667 574 5 2,24,543.06
SBI 274.15 1689584 746.57 1 2,04,672.17
Sun Pharma. 955.4 178983 207.12 1 1,97,882.45
HDFC 1,219.50 153538 314.94 2 1,92,034.67
ICICI Bank 317.45 1246948 1,158.51 2 1,83,884.50
Hindustan Unilever L 843.05 250918 216.35 1 1,82,393.87
Tata Motors Ltd. 519.55 444514 643.78 2 1,67,237.95
Bharti Airtel 382.5 893108 1,998.70 5 1,52,900.55
L & T 1,591.10 207872 185.77 2 1,47,789.32
Wipro Ltd 542.15 83079 493.7 2 1,33,829.73
Axis Bank Ltd. 559.1 1040790 474.1 2 1,32,534.66
HCL Technologies 937.45 93682 281.14 2 1,31,777.35
NTPC 138 560093 8,245.46 10 1,13,787.35
Maruti Suzuki India 3,601.05 42582 151.04 5 1,08,780.52
Kotak Mahindra Bank 1,339.70 230881 386.18 5 1,03,473.07
Indian Oil Corp 334.45 151005 2,427.95 10 81,202.79
Adani Enterprises Lt 720.55 812832 109.98 1 79,246.09
UltraTech Cement 2,792.90 91238 274.4 10 76,637.18
Lupin Ltd. 1,690.60 345214 89.84 2 75,941.75
Bharti Infratel Ltd. 394.8 320252 1,893.80 10 74,767.22
Power Grid Corpo 140.35 419105 5,231.59 10 73,425.37
Hind. Zinc 173.75 59332 845.06 2 73,414.59
DEFINITION of 'Market Capitalization‘
The total dollar market value of all of a company's outstanding shares. Market capitalization is calculated by multiplying a company's shares outstanding by the current market price of one share. The investment community uses this figure to determine a company's size, as opposed to sales or total asset figures.Frequently referred to as "market cap."
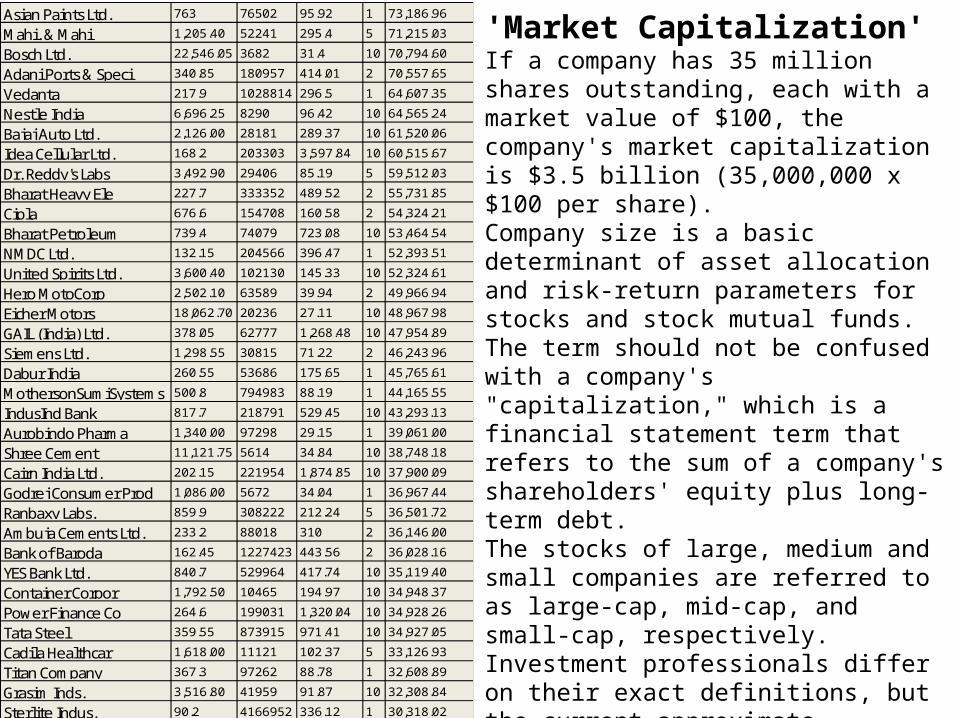
Asian Paints Ltd. 763 76502 95.92 1 73,186.96
Mahi. & Mahi 1,205.40 52241 295.4 5 71,215.03
Bosch Ltd. 22,546.05 3682 31.4 10 70,794.60
Adani Ports & Speci 340.85 180957 414.01 2 70,557.65
Vedanta 217.9 1028814 296.5 1 64,607.35
Nestle India 6,696.25 8290 96.42 10 64,565.24
Bajaj Auto Ltd. 2,126.00 28181 289.37 10 61,520.06
Idea Cellular Ltd. 168.2 203303 3,597.84 10 60,515.67
Dr. Reddy's Labs 3,492.90 29406 85.19 5 59,512.03
Bharat Heavy Ele 227.7 333352 489.52 2 55,731.85
Cipla 676.6 154708 160.58 2 54,324.21
Bharat Petroleum 739.4 74079 723.08 10 53,464.54
NMDC Ltd. 132.15 204566 396.47 1 52,393.51
United Spirits Ltd. 3,600.40 102130 145.33 10 52,324.61
Hero MotoCorp 2,502.10 63589 39.94 2 49,966.94
Eicher Motors 18,062.70 20236 27.11 10 48,967.98
GAIL (India) Ltd. 378.05 62777 1,268.48 10 47,954.89
Siemens Ltd. 1,298.55 30815 71.22 2 46,243.96
Dabur India 260.55 53686 175.65 1 45,765.61
MothersonSumiSystems 500.8 794983 88.19 1 44,165.55
IndusInd Bank 817.7 218791 529.45 10 43,293.13
Aurobindo Pharma 1,340.00 97298 29.15 1 39,061.00
Shree Cement 11,121.75 5614 34.84 10 38,748.18
Cairn India Ltd. 202.15 221954 1,874.85 10 37,900.09
Godrej Consumer Prod 1,086.00 5672 34.04 1 36,967.44
Ranbaxy Labs. 859.9 308222 212.24 5 36,501.72
Ambuja Cements Ltd. 233.2 88018 310 2 36,146.00
Bank of Baroda 162.45 1227423 443.56 2 36,028.16
YES Bank Ltd. 840.7 529964 417.74 10 35,119.40
Container Corpor 1,792.50 10465 194.97 10 34,948.37
Power Finance Co 264.6 199031 1,320.04 10 34,928.26
Tata Steel 359.55 873915 971.41 10 34,927.05
Cadila Healthcar 1,618.00 11121 102.37 5 33,126.93
Titan Company 367.3 97262 88.78 1 32,608.89
Grasim Inds. 3,516.80 41959 91.87 10 32,308.84
Sterlite Indus. 90.2 4166952 336.12 1 30,318.02
'Market Capitalization'If a company has 35 million shares outstanding, each with a market value of $100, the company's market capitalization is $3.5 billion (35,000,000 x $100 per share).Company size is a basic determinant of asset allocation and risk-return parameters for stocks and stock mutual funds. The term should not be confused with a company's "capitalization," which is a financial statement term that refers to the sum of a company's shareholders' equity plus long-term debt.The stocks of large, medium and small companies are referred to as large-cap, mid-cap, and small-cap, respectively. Investment professionals differ on their exact definitions, but the current approximate categories of market capitalization are:Large Cap: $10 billion plus and include the companies with the largest market capitalization.Mid Cap: $2 billion to $10 billionSmall Cap: Less than $2 billion
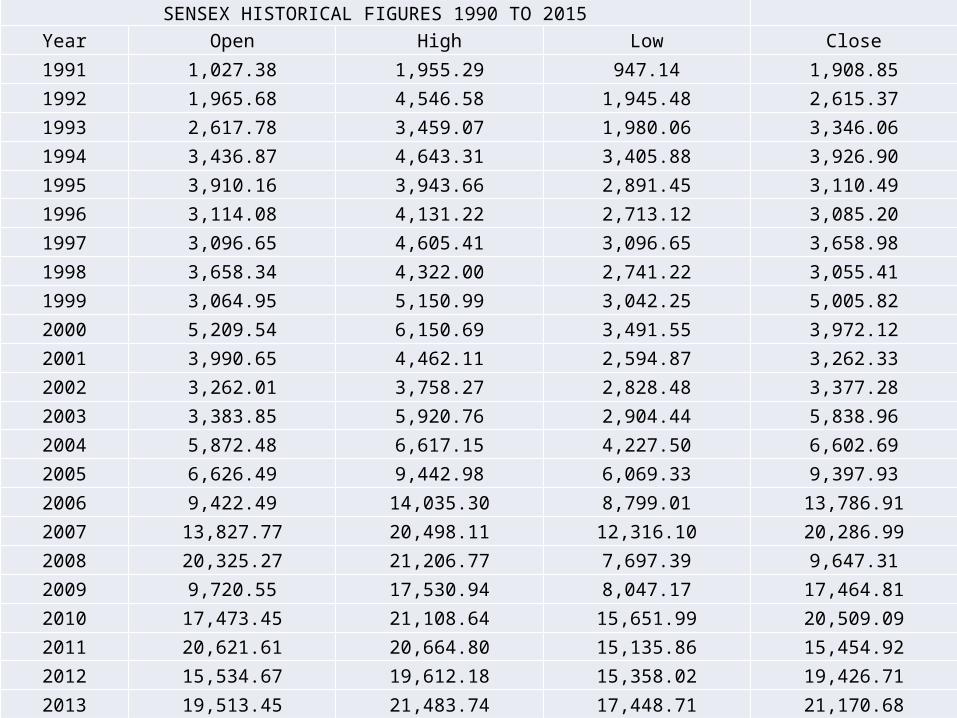
SENSEX HISTORICAL FIGURES 1990 TO 2015Year Open High Low Close1991 1,027.38 1,955.29 947.14 1,908.851992 1,965.68 4,546.58 1,945.48 2,615.371993 2,617.78 3,459.07 1,980.06 3,346.061994 3,436.87 4,643.31 3,405.88 3,926.901995 3,910.16 3,943.66 2,891.45 3,110.491996 3,114.08 4,131.22 2,713.12 3,085.201997 3,096.65 4,605.41 3,096.65 3,658.981998 3,658.34 4,322.00 2,741.22 3,055.411999 3,064.95 5,150.99 3,042.25 5,005.822000 5,209.54 6,150.69 3,491.55 3,972.122001 3,990.65 4,462.11 2,594.87 3,262.332002 3,262.01 3,758.27 2,828.48 3,377.282003 3,383.85 5,920.76 2,904.44 5,838.962004 5,872.48 6,617.15 4,227.50 6,602.692005 6,626.49 9,442.98 6,069.33 9,397.932006 9,422.49 14,035.30 8,799.01 13,786.912007 13,827.77 20,498.11 12,316.10 20,286.992008 20,325.27 21,206.77 7,697.39 9,647.312009 9,720.55 17,530.94 8,047.17 17,464.812010 17,473.45 21,108.64 15,651.99 20,509.092011 20,621.61 20,664.80 15,135.86 15,454.922012 15,534.67 19,612.18 15,358.02 19,426.712013 19,513.45 21,483.74 17,448.71 21,170.682014 21,222.19 28,822.37 19,963.12 27,499.422015 27,485.77 30,024.74 26,423.99 27,324.00
SOURCE - WWW.BSEINDIA.COM
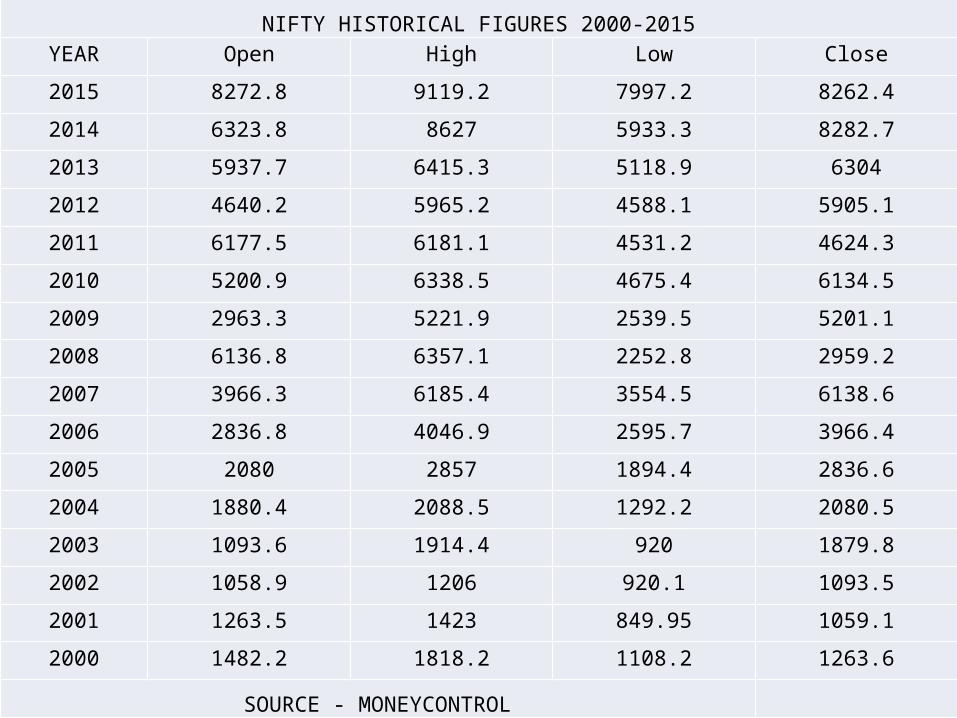
NIFTY HISTORICAL FIGURES 2000-2015YEAR Open High Low Close
2015 8272.8 9119.2 7997.2 8262.4
2014 6323.8 8627 5933.3 8282.7
2013 5937.7 6415.3 5118.9 6304
2012 4640.2 5965.2 4588.1 5905.1
2011 6177.5 6181.1 4531.2 4624.3
2010 5200.9 6338.5 4675.4 6134.5
2009 2963.3 5221.9 2539.5 5201.1
2008 6136.8 6357.1 2252.8 2959.2
2007 3966.3 6185.4 3554.5 6138.6
2006 2836.8 4046.9 2595.7 3966.4
2005 2080 2857 1894.4 2836.6
2004 1880.4 2088.5 1292.2 2080.5
2003 1093.6 1914.4 920 1879.8
2002 1058.9 1206 920.1 1093.5
2001 1263.5 1423 849.95 1059.1
2000 1482.2 1818.2 1108.2 1263.6
SOURCE - MONEYCONTROL
Plot No.24, 80 ft. Road,Uday Nagar, Ring Road,
Nagpur – 440024 9822401877
Related Documents