EPA's Data Analysis and Reporting Tool (DART) 915108 Presented by Jennifer DeWinter Sonoma Technology, Inc. Petaluma, CA on behalf of the EPA OAQPS PAMS Program National Air Toxics Workshop October 26, 2015

Welcome message from author
This document is posted to help you gain knowledge. Please leave a comment to let me know what you think about it! Share it to your friends and learn new things together.
Transcript
EPA's Data Analysis and
Reporting Tool (DART)
915108
Presented by Jennifer DeWinter Sonoma Technology, Inc.
Petaluma, CA
on behalf of the
EPA OAQPS PAMS Program
National Air Toxics Workshop
October 26, 2015
2
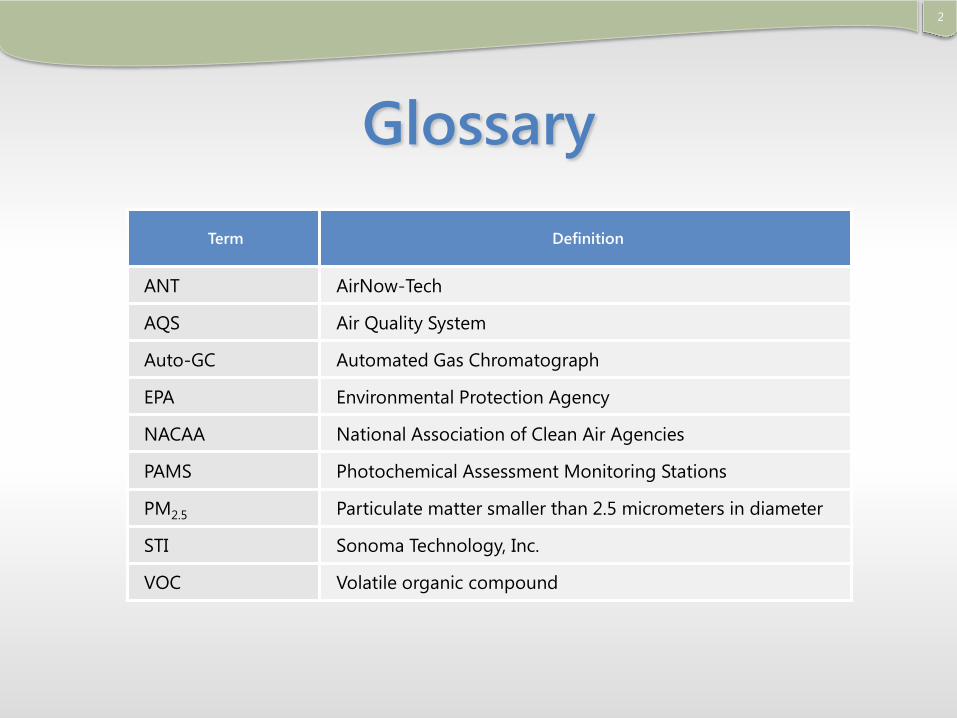
Glossary
Term Definition
ANT AirNow-Tech
AQS Air Quality System
Auto-GC Automated Gas Chromatograph
EPA Environmental Protection Agency
NACAA National Association of Clean Air Agencies
PAMS Photochemical Assessment Monitoring Stations
PM2.5 Particulate matter smaller than 2.5 micrometers in diameter
STI Sonoma Technology, Inc.
VOC Volatile organic compound
3
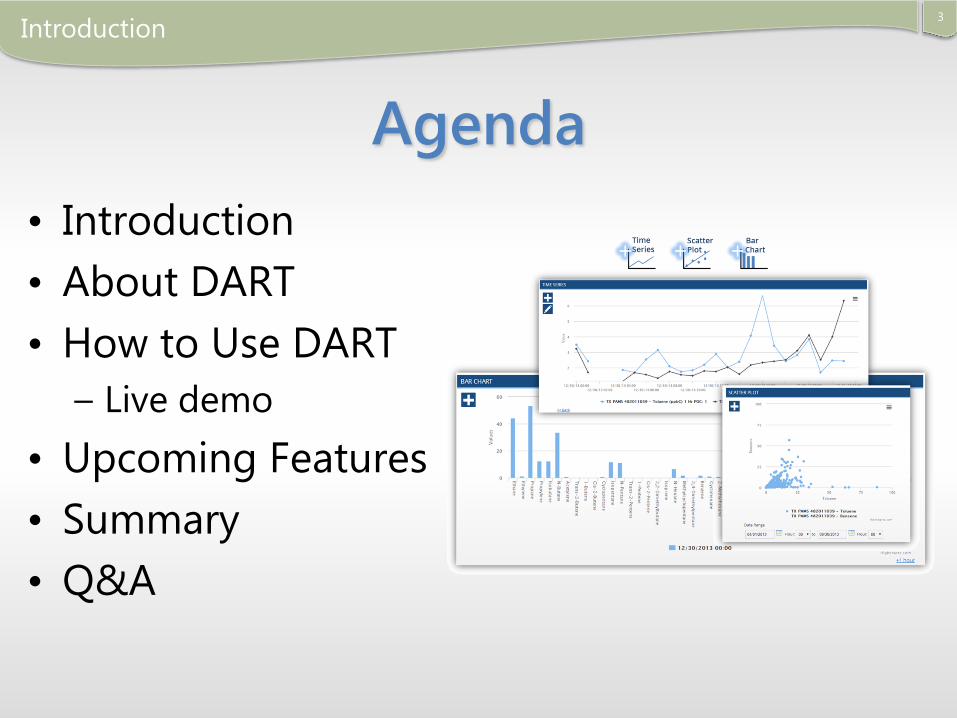
Agenda
• Introduction
• About DART
• How to Use DART
– Live demo
• Upcoming Features
• Summary
• Q&A
Introduction

4
Meet the Team
Kevin Cavender, EPA
Jennifer DeWinter, STI
Steve Brown, STI
With excellent
feedback and ideas
from NACAA Steering
Committee
Introduction
EPA
Office of Air
Quality
Planning and
Standards
Sonoma
Technology,
Inc.
National
Association
of Clean Air
Agencies
5
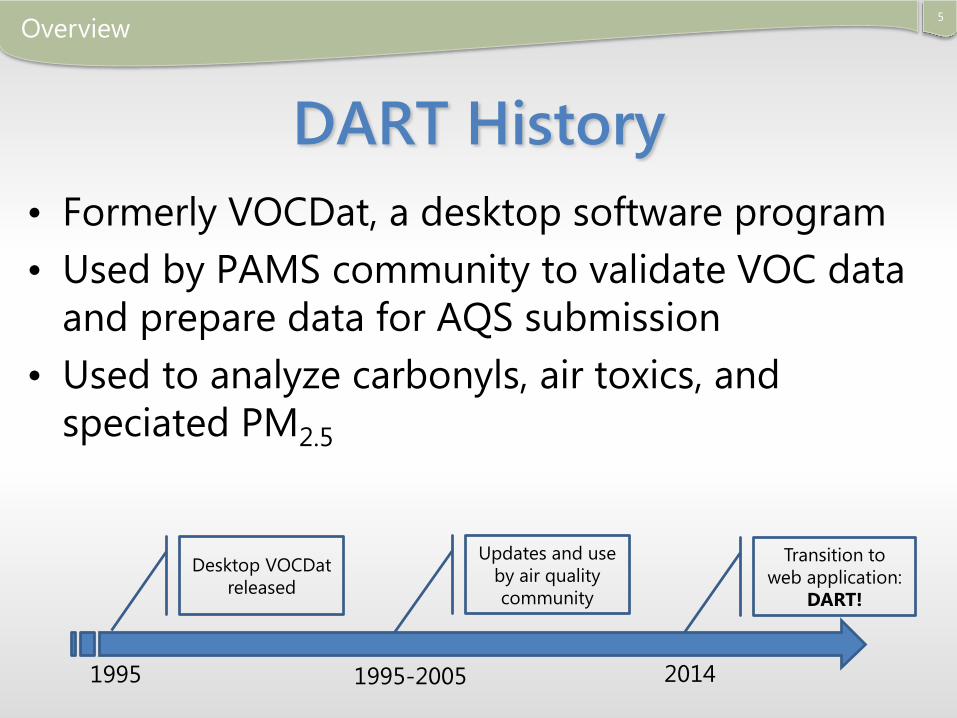
DART History
• Formerly VOCDat, a desktop software program
• Used by PAMS community to validate VOC data
and prepare data for AQS submission
• Used to analyze carbonyls, air toxics, and
speciated PM2.5
Overview
Desktop VOCDat
released
Transition to
web application:
DART!
1995 1995-2005 2014
Updates and use
by air quality
community
6
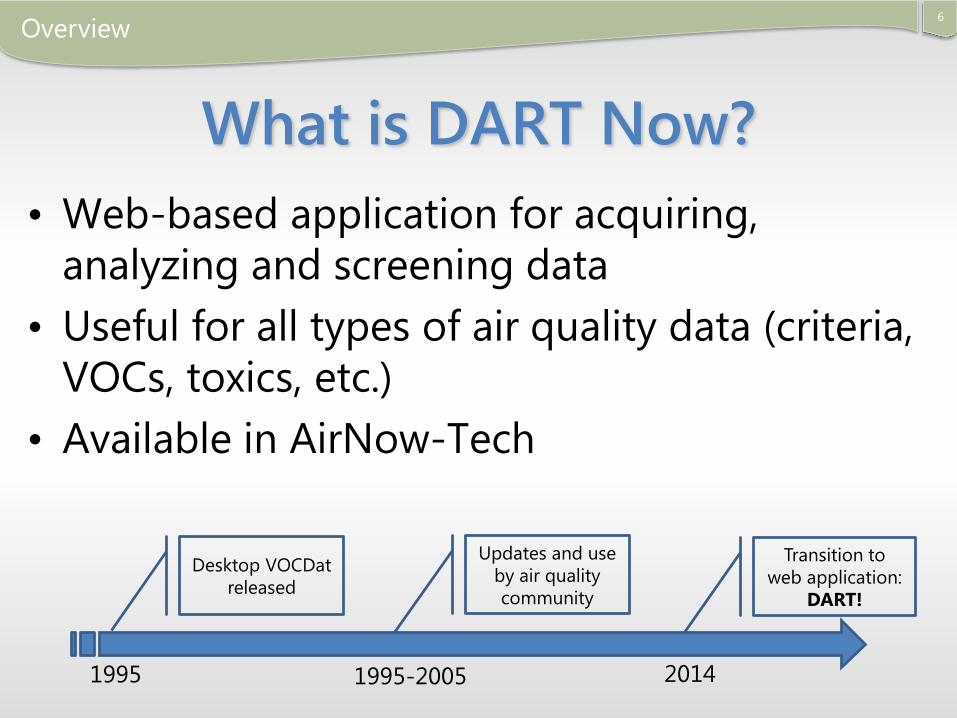
What is DART Now?
• Web-based application for acquiring,
analyzing and screening data
• Useful for all types of air quality data (criteria,
VOCs, toxics, etc.)
• Available in AirNow-Tech
Overview
Desktop VOCDat
released
Transition to
web application:
DART!
1995 1995-2005 2014
Updates and use
by air quality
community
• All-New Automated PAMS data screening
– “One-click” auto-screening provides interactive
tables and plots to evaluate PAMS data
– Screening checks based on recommended
procedures in PAMS Data Analysis Workbook
• Improved Data Imports
– Improved status information for data uploads and
AQS requests
– Unit conversions and customization of units on
graphics
7
DART Version 2.0 – New Features
Overview
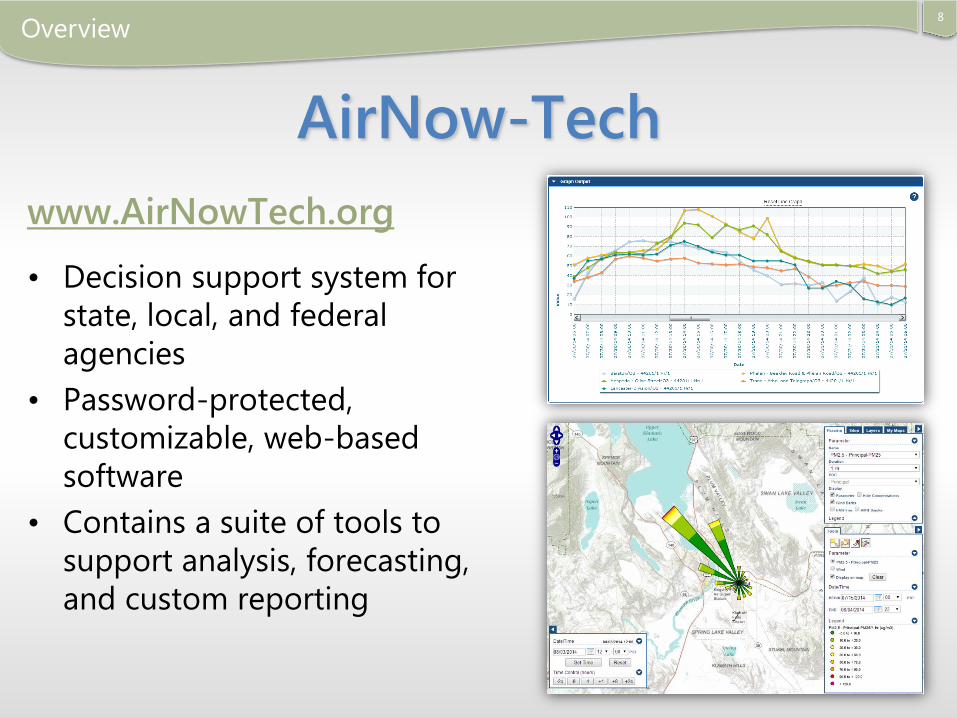
AirNow-Tech
www.AirNowTech.org
• Decision support system for
state, local, and federal
agencies
• Password-protected,
customizable, web-based
software
• Contains a suite of tools to
support analysis, forecasting,
and custom reporting
8
Overview
9
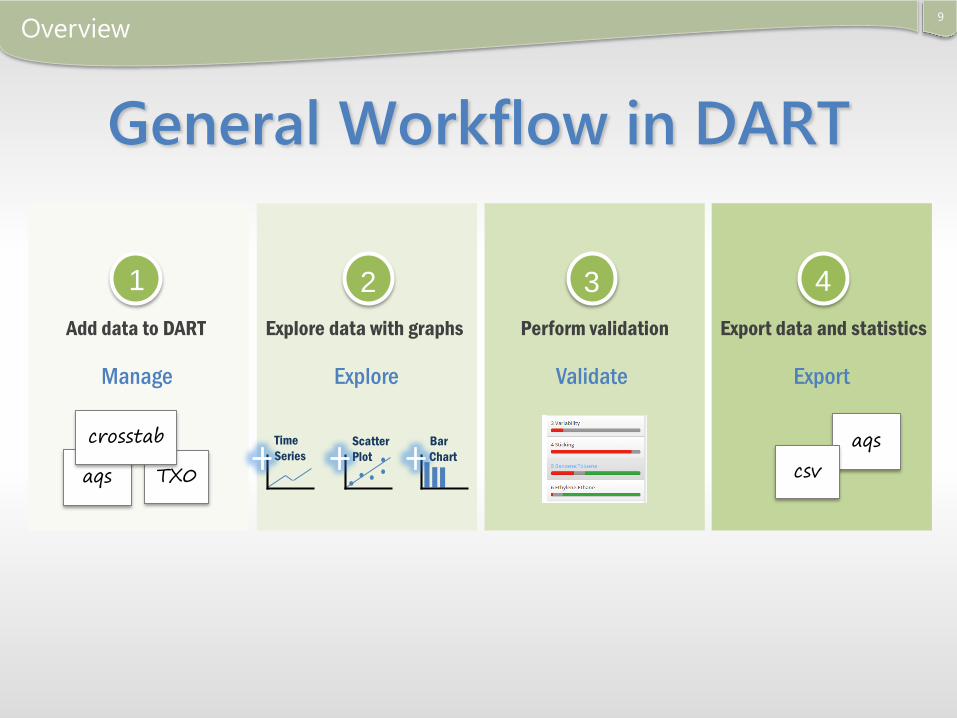
General Workflow in DART
Overview
TX0aqs
crosstab
Add data to DART Export data and statisticsExplore data with graphs
Scatter
Plot
Bar
Chart
Time
Seriesaqs
csv
1 42
Perform validation
3
Manage Explore Validate Export
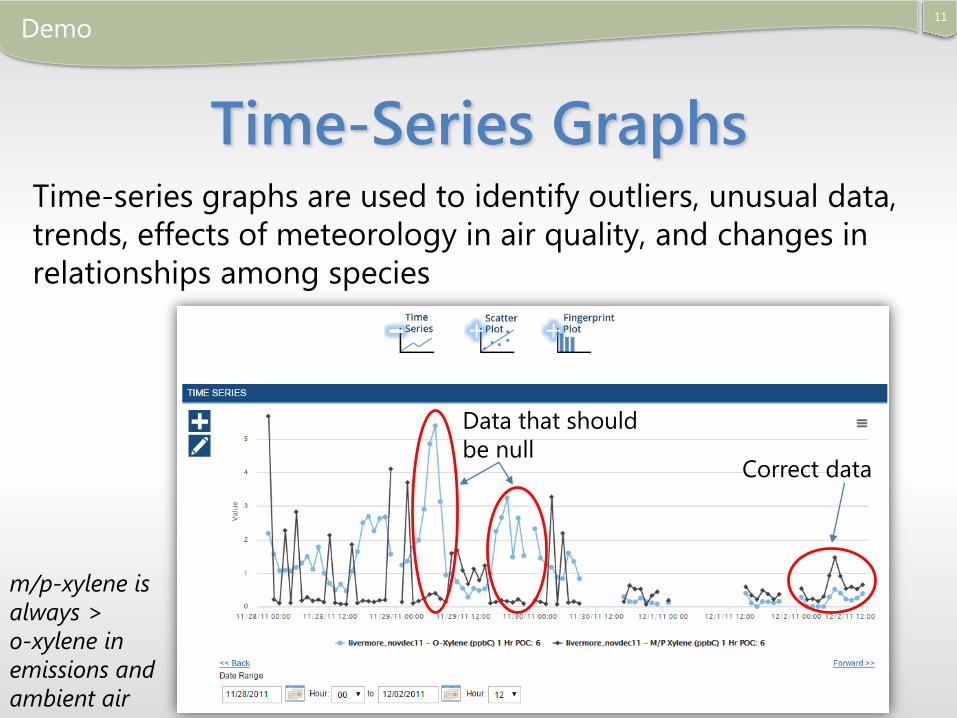
Data that should
be null
11
Time-Series GraphsTime-series graphs are used to identify outliers, unusual data,
trends, effects of meteorology in air quality, and changes in
relationships among species
Demo
Correct data
m/p-xylene is
always >
o-xylene in
emissions and
ambient air
12
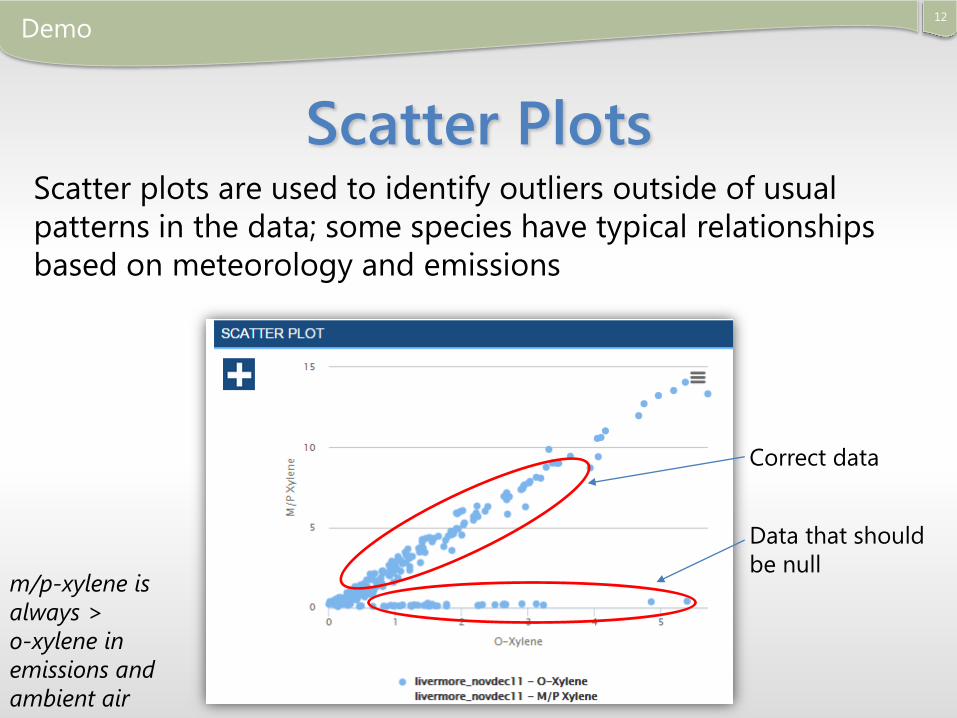
Scatter PlotsScatter plots are used to identify outliers outside of usual
patterns in the data; some species have typical relationships
based on meteorology and emissions
Demo
Data that should
be null
Correct data
m/p-xylene is
always >
o-xylene in
emissions and
ambient air
13
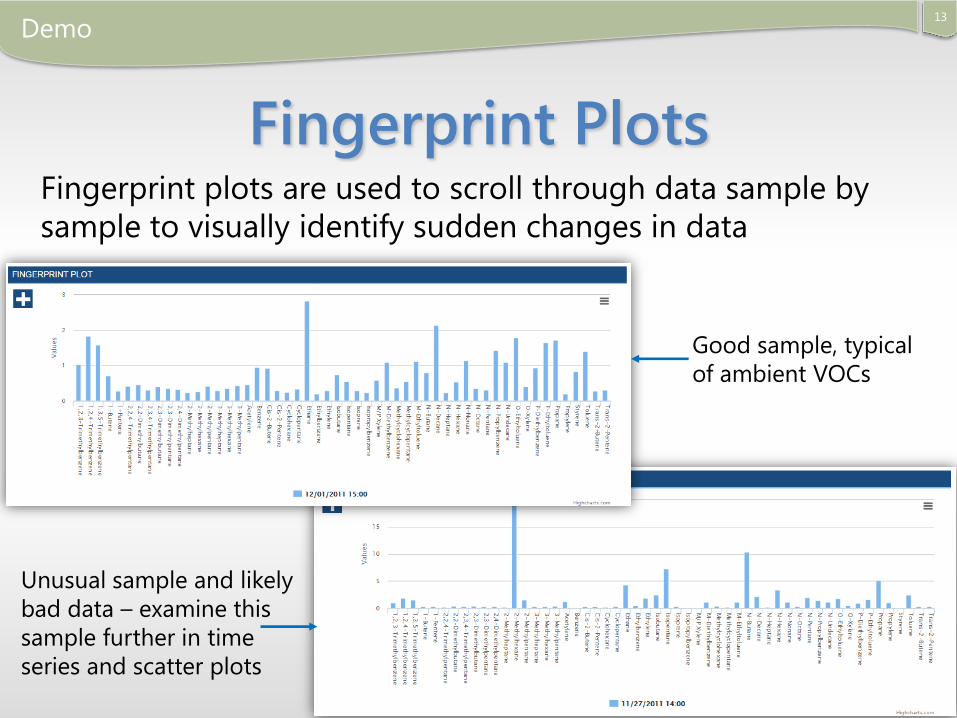
Fingerprint Plots
Demo
Fingerprint plots are used to scroll through data sample by
sample to visually identify sudden changes in data
Good sample, typical
of ambient VOCs
Unusual sample and likely
bad data – examine this
sample further in time
series and scatter plots
14
Screening Checks (1)
• Use screening checks to identify and export sample
records that don’t meet your conceptual model of
ambient air quality or your sites, or that are physically
unrealistic
• For example, look for samples with
– High unidentified fraction (possible error in GC column, or data
reporting error)
– O-xylene>m/p-xylene (physically unreasonable, likely error in
species identification)
– Carbon tetrachloride below global background levels (physically
unreasonable, likely error in sampling)
– Sulfate>3*sulfur (physically unreasonable, likely error on Nylon or
Teflon filter)
Demo
15
Screening Checks (2)
• Species Threshold – identify data values that exceed
threshold criteria
• Species Variability – identify data within a specified
variability range
• Species Comparison – compare data values between
parameters according to defined criteria
• Species Fraction – identify data values that are within
a specified fraction of another data parameter value
• Multi-Condition – create data screening queries that
meet more than one condition
Demo
16
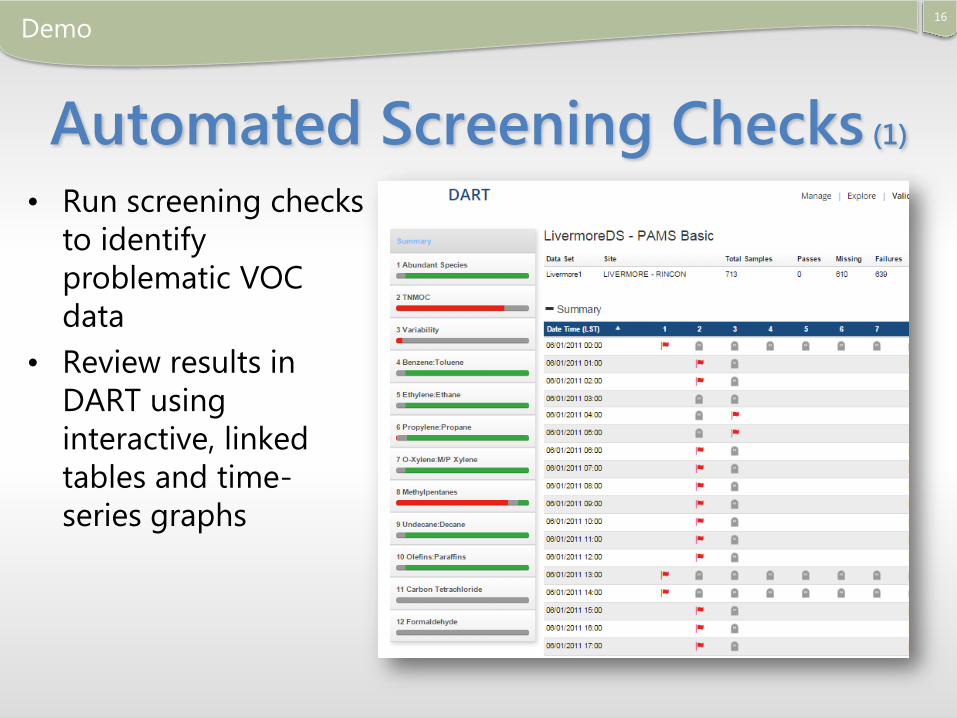
Automated Screening Checks (1)
Demo
• Run screening checks
to identify
problematic VOC
data
• Review results in
DART using
interactive, linked
tables and time-
series graphs
17
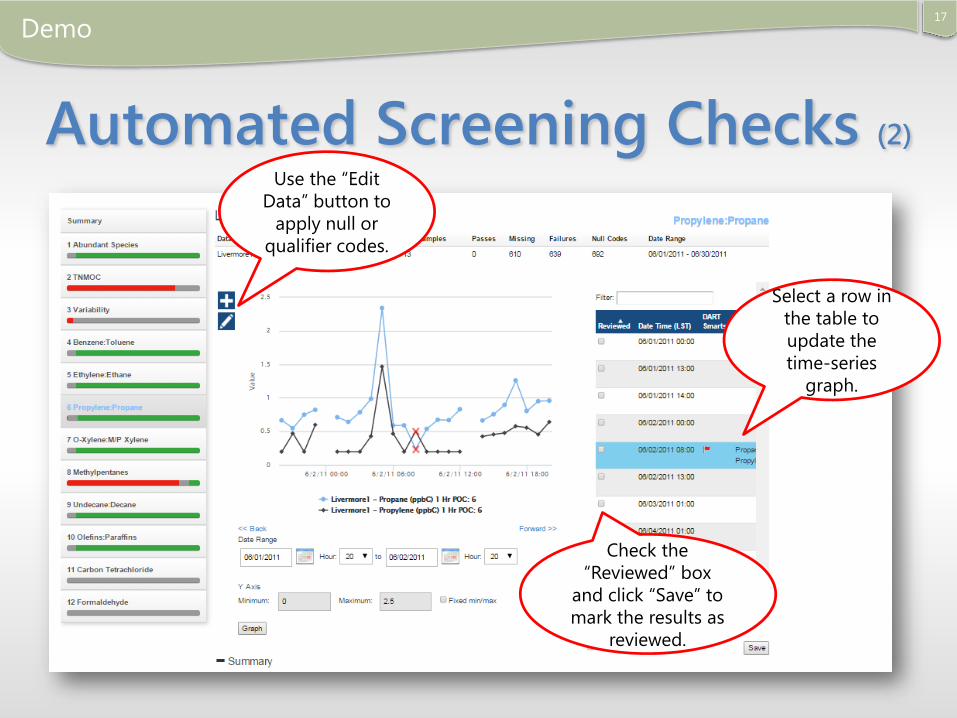
Automated Screening Checks (2)
Demo
Select a row in
the table to
update the
time-series
graph.
Check the
“Reviewed” box
and click “Save” to
mark the results as
reviewed.
Use the “Edit
Data” button to
apply null or
qualifier codes.
• Customized automated data screening
– Setup your own “One-click” auto-screening checks
• Secondary y-axis for time series
• Delete data sets
18
Upcoming Features
Next Steps
Future Feature Ideas
• Interactive map for Data Mart AQS
requests
• Suite of automated screening checks for air
toxics
• Compare site to national statistics
• New analyses and plot types
– Plot concentrations and MDL values
– Plot concentrations and annual averages
• Support for more import file formats
19
Next Steps
20
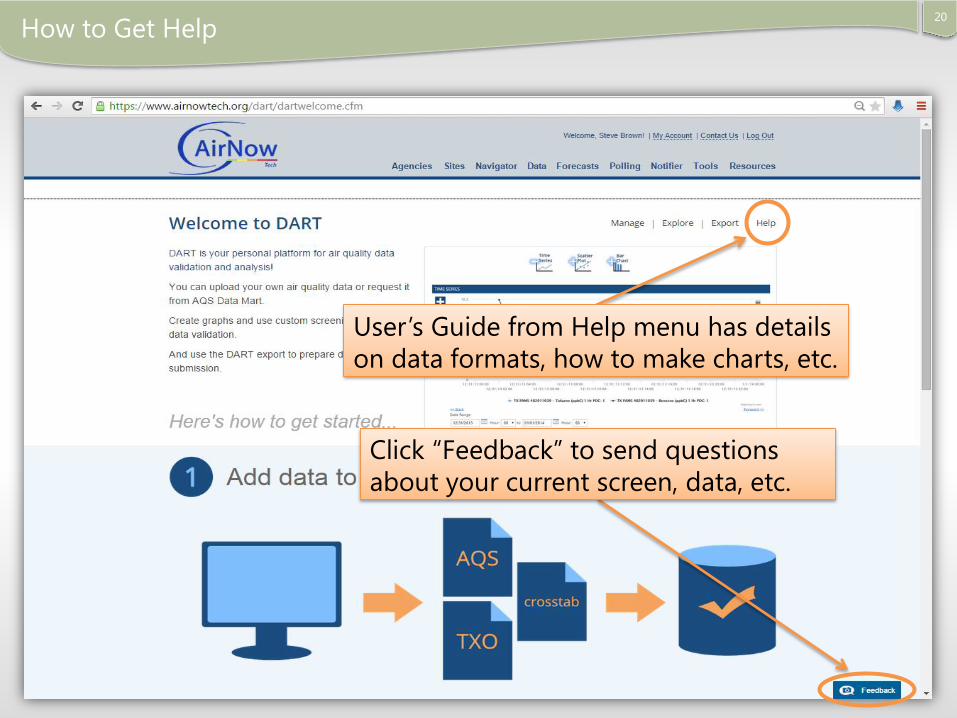
How to Get Help
User’s Guide from Help menu has details
on data formats, how to make charts, etc.
Click “Feedback” to send questions
about your current screen, data, etc.
Summary
• DART is ready to use! Please let us know if you
have questions or ideas for new features
• More new features to be deployed in November
2015
• After deployment, several webinars will be given
• Next phase of development to begin in 2016
21
Conclusion
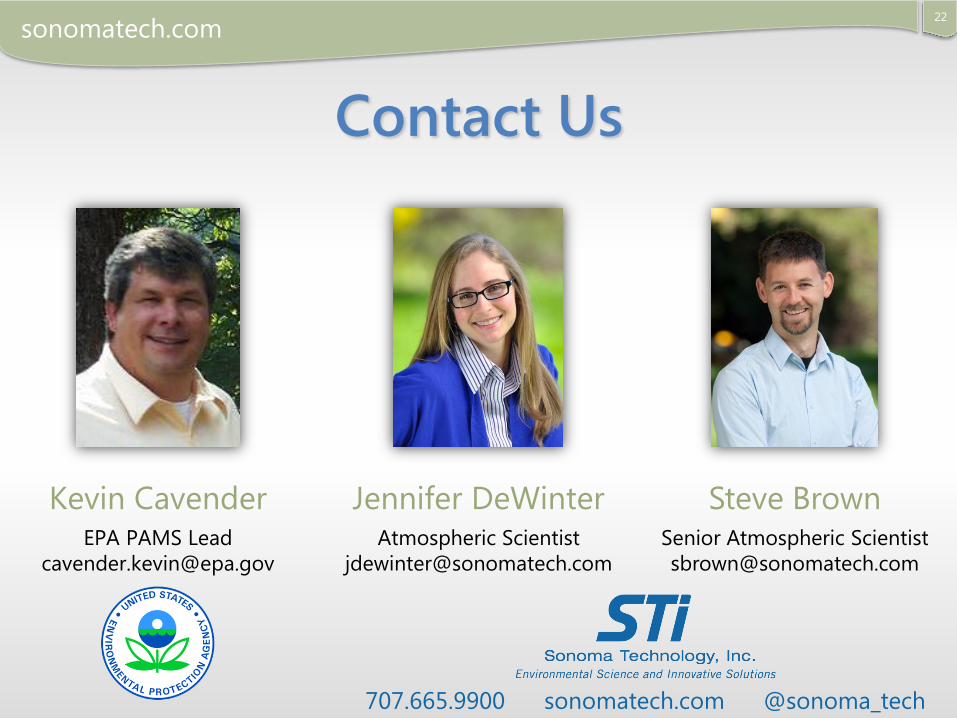
Contact Us
Jennifer DeWinterAtmospheric Scientist
707.665.9900 sonomatech.com @sonoma_tech
Steve BrownSenior Atmospheric Scientist
sonomatech.com
Kevin CavenderEPA PAMS Lead
22
Extra Slides
23
Conclusion
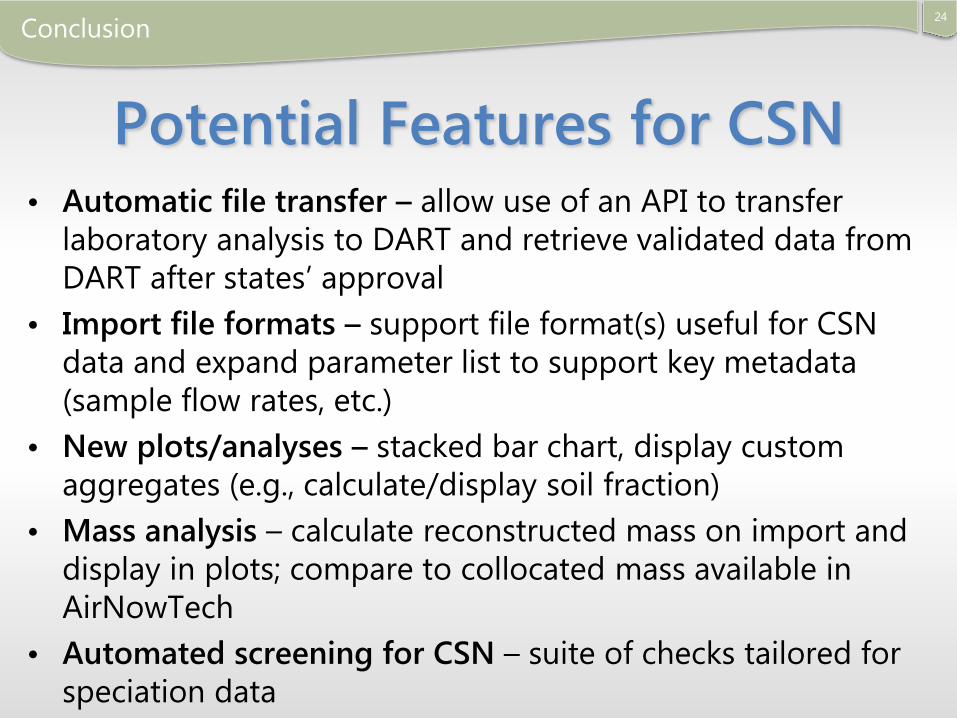
Potential Features for CSN
24
Conclusion
• Automatic file transfer – allow use of an API to transfer
laboratory analysis to DART and retrieve validated data from
DART after states’ approval
• Import file formats – support file format(s) useful for CSN
data and expand parameter list to support key metadata
(sample flow rates, etc.)
• New plots/analyses – stacked bar chart, display custom
aggregates (e.g., calculate/display soil fraction)
• Mass analysis – calculate reconstructed mass on import and
display in plots; compare to collocated mass available in
AirNowTech
• Automated screening for CSN – suite of checks tailored for
speciation data
More Potential Features
25
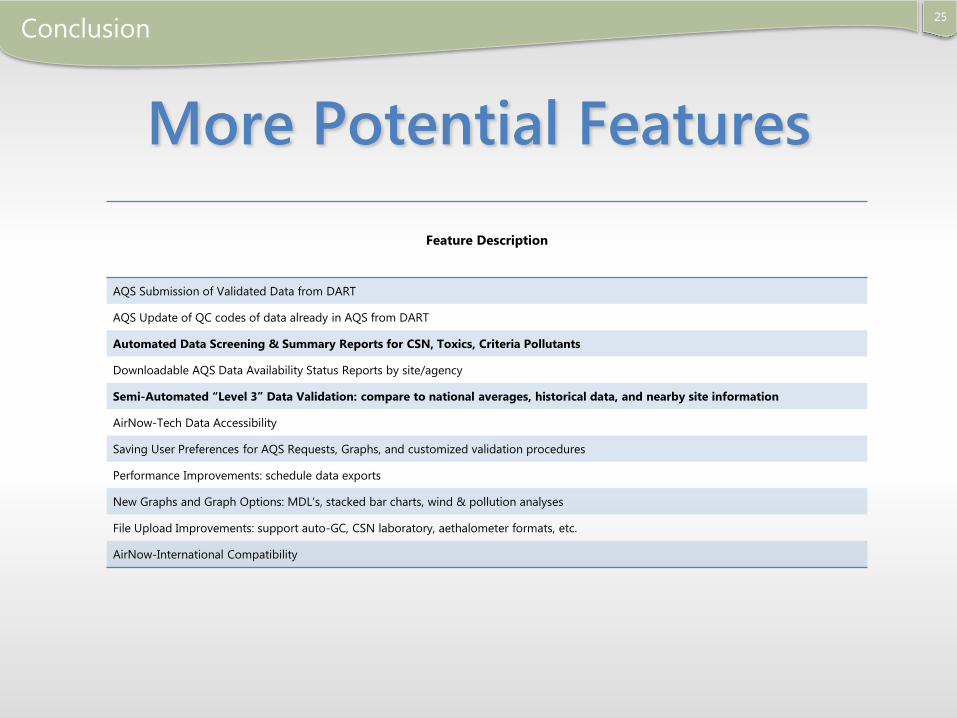
Conclusion
Feature Description
AQS Submission of Validated Data from DART
AQS Update of QC codes of data already in AQS from DART
Automated Data Screening & Summary Reports for CSN, Toxics, Criteria Pollutants
Downloadable AQS Data Availability Status Reports by site/agency
Semi-Automated “Level 3” Data Validation: compare to national averages, historical data, and nearby site information
AirNow-Tech Data Accessibility
Saving User Preferences for AQS Requests, Graphs, and customized validation procedures
Performance Improvements: schedule data exports
New Graphs and Graph Options: MDL’s, stacked bar charts, wind & pollution analyses
File Upload Improvements: support auto-GC, CSN laboratory, aethalometer formats, etc.
AirNow-International Compatibility
Even More Potential Features
26
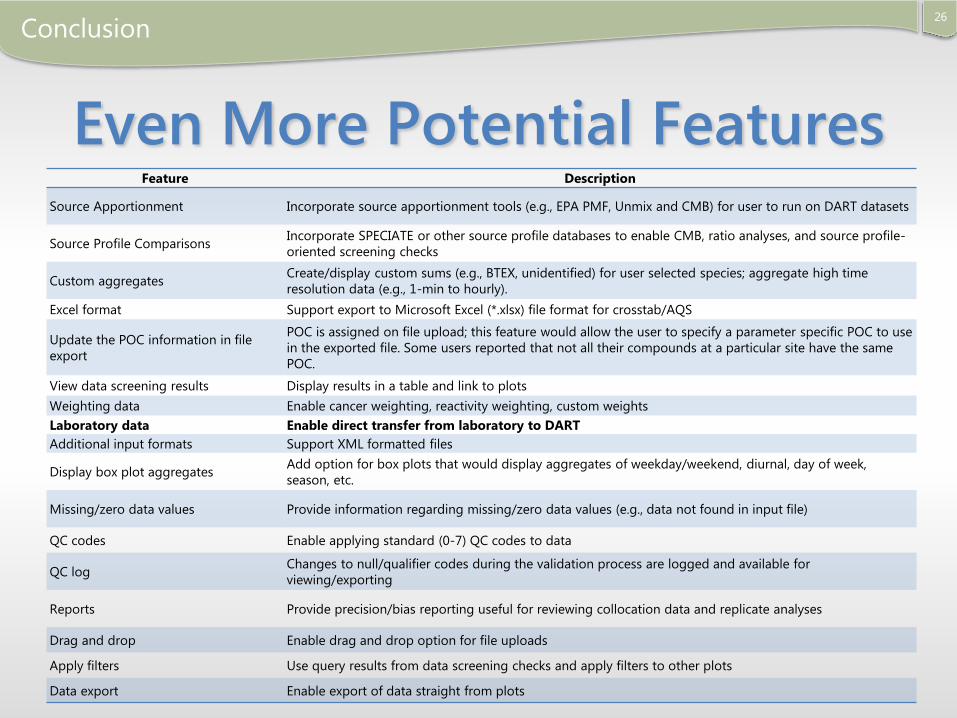
Conclusion
Feature Description
Source Apportionment Incorporate source apportionment tools (e.g., EPA PMF, Unmix and CMB) for user to run on DART datasets
Source Profile ComparisonsIncorporate SPECIATE or other source profile databases to enable CMB, ratio analyses, and source profile-
oriented screening checks
Custom aggregatesCreate/display custom sums (e.g., BTEX, unidentified) for user selected species; aggregate high time
resolution data (e.g., 1-min to hourly).
Excel format Support export to Microsoft Excel (*.xlsx) file format for crosstab/AQS
Update the POC information in file
export
POC is assigned on file upload; this feature would allow the user to specify a parameter specific POC to use
in the exported file. Some users reported that not all their compounds at a particular site have the same
POC.
View data screening results Display results in a table and link to plots
Weighting data Enable cancer weighting, reactivity weighting, custom weights
Laboratory data Enable direct transfer from laboratory to DART
Additional input formats Support XML formatted files
Display box plot aggregatesAdd option for box plots that would display aggregates of weekday/weekend, diurnal, day of week,
season, etc.
Missing/zero data values Provide information regarding missing/zero data values (e.g., data not found in input file)
QC codes Enable applying standard (0-7) QC codes to data
QC logChanges to null/qualifier codes during the validation process are logged and available for
viewing/exporting
Reports Provide precision/bias reporting useful for reviewing collocation data and replicate analyses
Drag and drop Enable drag and drop option for file uploads
Apply filters Use query results from data screening checks and apply filters to other plots
Data export Enable export of data straight from plots
Related Documents