WORKING PAPERS ENVIRONMENTAL FACTORS IN THE MENA REGION: A SWOT ANALYSIS Mark Mulligan, Martin Keulertz and Musa McKee This project has received funding from the European Union’s Horizon 2020 Research and Innovation programme under grant agreement No 693244 No. 4, November 2017

Welcome message from author
This document is posted to help you gain knowledge. Please leave a comment to let me know what you think about it! Share it to your friends and learn new things together.
Transcript

WORKING PAPERS
ENVIRONMENTAL FACTORS IN THE MENA REGION: A SWOT ANALYSIS
Mark Mulligan, Martin Keulertz and Musa McKee
This project has received funding from the European Union’s Horizon 2020 Research and Innovation programme under grant agreement No 693244
No. 4, November 2017
Middle East and North Africa Regional Architecture: Mapping Geopolitical Shifts, Regional Order and Domestic Transformations
2
WORKING PAPERSNo. 4, November 2017
ENVIRONMENTAL FACTORS IN THE MENA REGION: A SWOT ANALYSIS
Mark Mulligan, Martin Keulertz and Musa McKee1
ABSTRACTThe MENARA study area has undergone signifi cant transformation over twenty years decades, resulting from a combination of ideational and material factors. In this report, we examine the magnitude, distribution and trends in key environmental and energy factors that materially affect the economic, social and political profi le of the MENA region. We do this by conducting a geographical analysis and by building a web-based policy support system for understanding strengths, weaknesses, opportunities and threats (SWOT) at scales from pixel through regional to national considering environment, water, energy, food, economy and population, which we call the MENARA policy support system (PSS). It is a tool for scanning the horizon to identify material threats, opportunities and choke points that may precipitate confl ict, and it is designed to help thinking through locally appropriate policy responses. The MENARA PSS enables better understanding of material factors (climate, population, landscape, energy), which combine with elements of governance, politics and ideology to shape regions and determine trajectories of change at scales from local to global. We use the tool, combined with literature review and other available data, in order to examine strengths, weaknesses, opportunities and threats throughout the Middle East and North Africa (the MENARA study area) and in greater spatial detail for the country of Syria. Analyses indicate a complex pattern of strengths, weaknesses, opportunities and threats that produce challenges at the local scale, at the regional scale and, for some countries, also at the national scale. No one strength, weakness, opportunity or threat dominates, as different regions within each country have different SWOTs and different countries are affected by different magnitudes and types of SWOT. Understanding material factors and using them to generate a geographical prognosis at multiple scales for a region enables us to set the context for later ideational research in this region as part of the MENARA project. Ideational factors, after all, combine with material factors to generate trajectories for change which shape regions and their people. It is not the purpose of this report to analyse relationships between these environmental factors and confl ict or ideational factors: by providing an easily used environmental policy support system, we provide the tools by which local, national and regional experts may do that. The MENARA tool can be used by anyone with a web browser and knowledge of the region to dig deeper into these relationships, and should be useful both within the MENARA project and outside the MENARA project in a policy support context.
1 Mark Mulligan is Reader in Geography at King’s College London and Senior Fellow of UNEP-World Conservation Monitoring Centre. Martin Keulertz is Assistant Professor at the Faculty of Agricultural and Food Sciences, American University of Beirut (AUB). He is the director and chair of the AUB Food Security Programme. Musa McKee currently consults to the United Nations Economic and Social Commission for West Asia in Beirut on food security, technology and social protection.
Middle East and North Africa Regional Architecture: Mapping Geopolitical Shifts, Regional Order and Domestic Transformations
3
WORKING PAPERSNo. 4, November 2017
INTRODUCTION
The MENARA study area has undergone signifi cant transformation in recent decades, resulting from the combination of ideational and material factors including the following current and future states, events and trends:• Arab uprisings• Youth population bulge• Rural exodus/urbanization• Sectarian politics/confl ict• Non-state actors (both violent and non-violent)• Nuclear proliferation• Fragile states (Iraq, Lebanon, Egypt, Tunisia) and quasi-failed states (Syria, Yemen, Libya)• (Forced) migration• Pressure on natural resources• Environmental change, particularly land degradation, climate variability and change• Dependence in some countries on fossil energy/resources for revenue generation
The purpose of this report is to identify the driving forces (material factors) and assess the implications for the European Union (EU) and its policies for the region at domestic, regional and global levels. We focus particularly on three factors: (1) pressure on natural resources; (2) environmental change, particularly land degradation, climate variability and change; and (3) dependence on fossil energy/resources for revenue generation in some countries.
We bring together a range of datasets to carry out a geographical analysis of key material factors followed by a SWOT (strengths, weaknesses, opportunities and threats) analysis for the MENARA study area within the context of the wider world. This is supported by the MENARA policy support system (available at http://www.policysupport.org/menara) developed for this purpose. The MENARA PSS is a web-based tool for understanding strength, weakness, opportunity and threat (SWOT) at scales from pixel through regional to national considering environment, water, energy, food, economy and population. It is a horizon scanning tool to identify threats, opportunities and choke points that may create confl ict and is designed to help the thinking through of locally appropriate policy responses. MENARA is the Arabic word for lighthouse: the PSS is intended to shed light in turbulent waters. The tool is made available for regional experts to use in analyses of the role of material factors in the region.
STUDY AREA
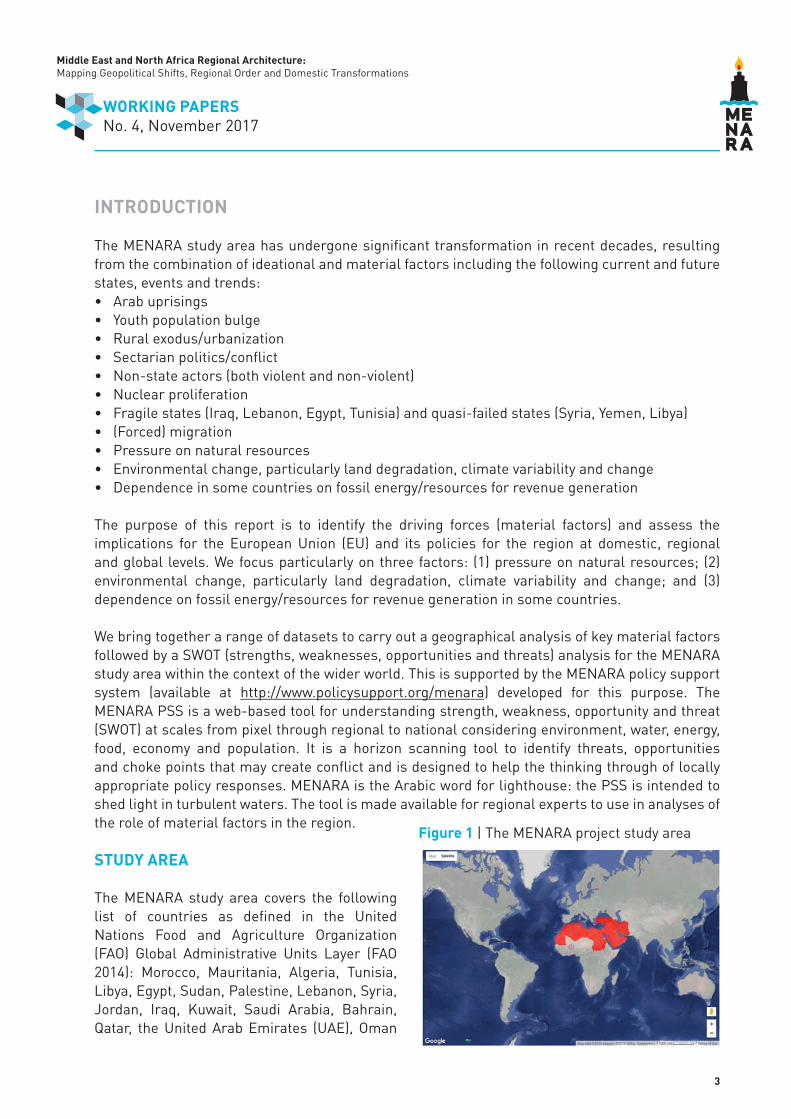
The MENARA study area covers the following list of countries as defi ned in the United Nations Food and Agriculture Organization (FAO) Global Administrative Units Layer (FAO 2014): Morocco, Mauritania, Algeria, Tunisia, Libya, Egypt, Sudan, Palestine, Lebanon, Syria, Jordan, Iraq, Kuwait, Saudi Arabia, Bahrain, Qatar, the United Arab Emirates (UAE), Oman
Figure 1 | The MENARA project study area
Middle East and North Africa Regional Architecture: Mapping Geopolitical Shifts, Regional Order and Domestic Transformations
4
WORKING PAPERSNo. 4, November 2017
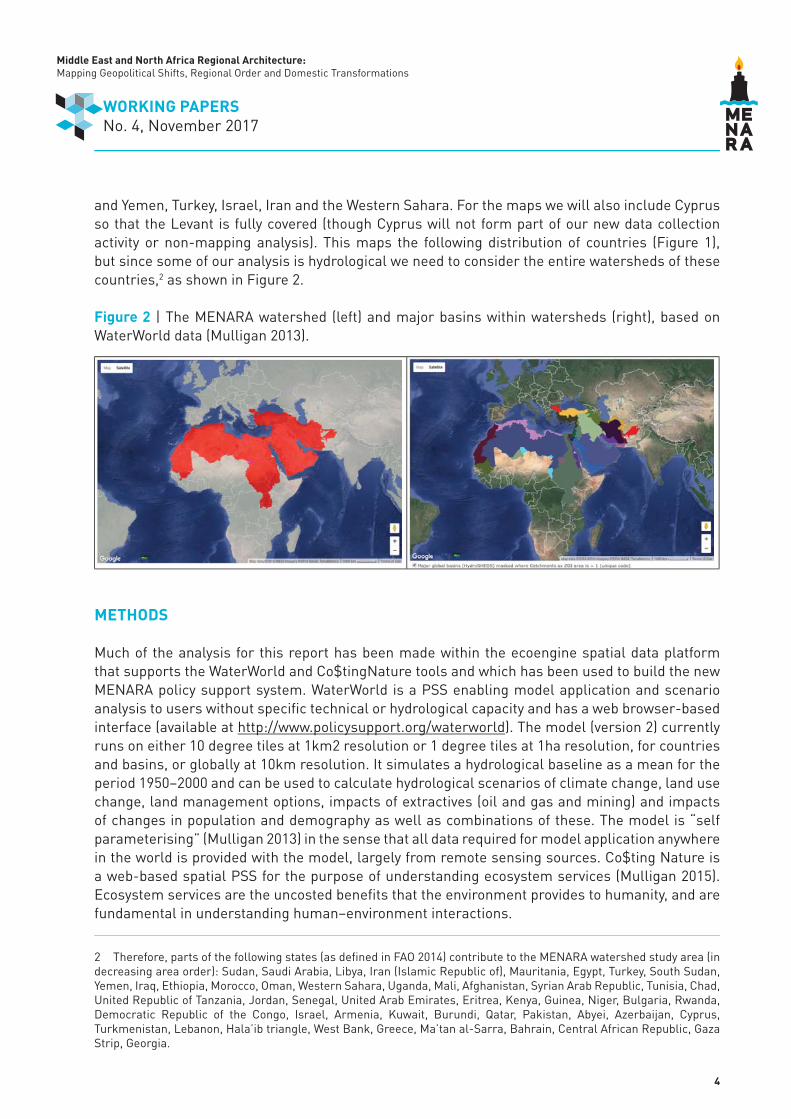
and Yemen, Turkey, Israel, Iran and the Western Sahara. For the maps we will also include Cyprus so that the Levant is fully covered (though Cyprus will not form part of our new data collection activity or non-mapping analysis). This maps the following distribution of countries (Figure 1), but since some of our analysis is hydrological we need to consider the entire watersheds of these countries,2 as shown in Figure 2.
Figure 2 | The MENARA watershed (left) and major basins within watersheds (right), based on WaterWorld data (Mulligan 2013).
METHODS
Much of the analysis for this report has been made within the ecoengine spatial data platform that supports the WaterWorld and Co$tingNature tools and which has been used to build the new MENARA policy support system. WaterWorld is a PSS enabling model application and scenario analysis to users without specifi c technical or hydrological capacity and has a web browser-based interface (available at http://www.policysupport.org/waterworld). The model (version 2) currently runs on either 10 degree tiles at 1km2 resolution or 1 degree tiles at 1ha resolution, for countries and basins, or globally at 10km resolution. It simulates a hydrological baseline as a mean for the period 1950–2000 and can be used to calculate hydrological scenarios of climate change, land use change, land management options, impacts of extractives (oil and gas and mining) and impacts of changes in population and demography as well as combinations of these. The model is “self parameterising” (Mulligan 2013) in the sense that all data required for model application anywhere in the world is provided with the model, largely from remote sensing sources. Co$ting Nature is a web-based spatial PSS for the purpose of understanding ecosystem services (Mulligan 2015). Ecosystem services are the uncosted benefi ts that the environment provides to humanity, and are fundamental in understanding human–environment interactions.
2 Therefore, parts of the following states (as defi ned in FAO 2014) contribute to the MENARA watershed study area (in decreasing area order): Sudan, Saudi Arabia, Libya, Iran (Islamic Republic of), Mauritania, Egypt, Turkey, South Sudan, Yemen, Iraq, Ethiopia, Morocco, Oman, Western Sahara, Uganda, Mali, Afghanistan, Syrian Arab Republic, Tunisia, Chad, United Republic of Tanzania, Jordan, Senegal, United Arab Emirates, Eritrea, Kenya, Guinea, Niger, Bulgaria, Rwanda, Democratic Republic of the Congo, Israel, Armenia, Kuwait, Burundi, Qatar, Pakistan, Abyei, Azerbaijan, Cyprus, Turkmenistan, Lebanon, Hala’ib triangle, West Bank, Greece, Ma’tan al-Sarra, Bahrain, Central African Republic, Gaza Strip, Georgia.
Middle East and North Africa Regional Architecture: Mapping Geopolitical Shifts, Regional Order and Domestic Transformations
5
WORKING PAPERSNo. 4, November 2017
We start by using WaterWorld and Co$ting Nature to conduct a geographical analysis of key material factors for the MENA region in a descriptive manner, by means of introduction to the environmental geography of the area. We then follow with the sophisticated multi-metric SWOT analysis, carried out with the MENARA PSS, fi rst for the region and second for a specifi c case study focusing on Syria. The SWOT analysis allows in-depth analysis of multiple factors and facilitates interpretation by those within and outside the MENARA project with knowledge on ideational, socio-economic political factors in the region.
1. AN INTRODUCTORY GEOGRAPHICAL ANALYSIS OF MATERIAL FACTORS FOR THE MENA REGION
In this section we describe the environmental context for the later SWOT analysis in order to introduce reader unfamiliar with the spatial heterogeneity of environmental factors in the region to the region’s diversity and complexity. This is followed by a sophisticated and analytical SWOT analysis of environmental and socio-economic factors, which lead towards a spatial prognosis for the region based on the combination of strength, weakness, opportunity and threat.
1.1 CLIMATE
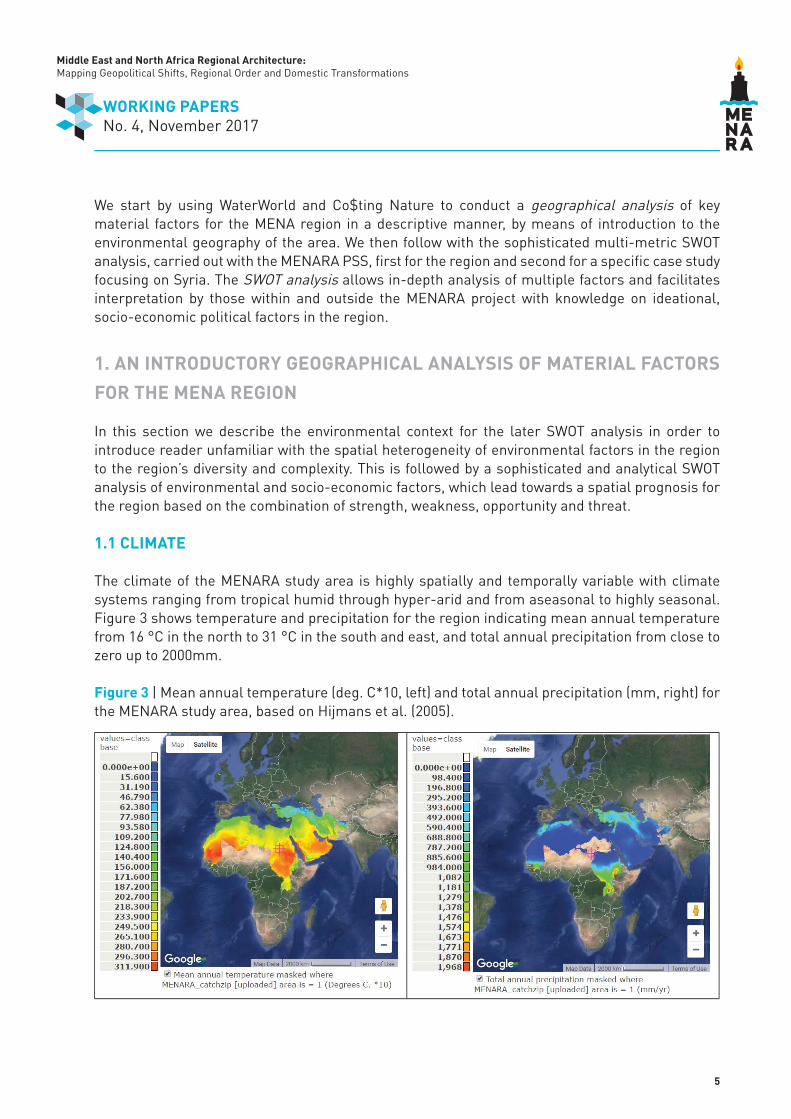
The climate of the MENARA study area is highly spatially and temporally variable with climate systems ranging from tropical humid through hyper-arid and from aseasonal to highly seasonal. Figure 3 shows temperature and precipitation for the region indicating mean annual temperature from 16 °C in the north to 31 °C in the south and east, and total annual precipitation from close to zero up to 2000mm.
Figure 3 | Mean annual temperature (deg. C*10, left) and total annual precipitation (mm, right) for the MENARA study area, based on Hijmans et al. (2005).
Middle East and North Africa Regional Architecture: Mapping Geopolitical Shifts, Regional Order and Domestic Transformations
6
WORKING PAPERSNo. 4, November 2017
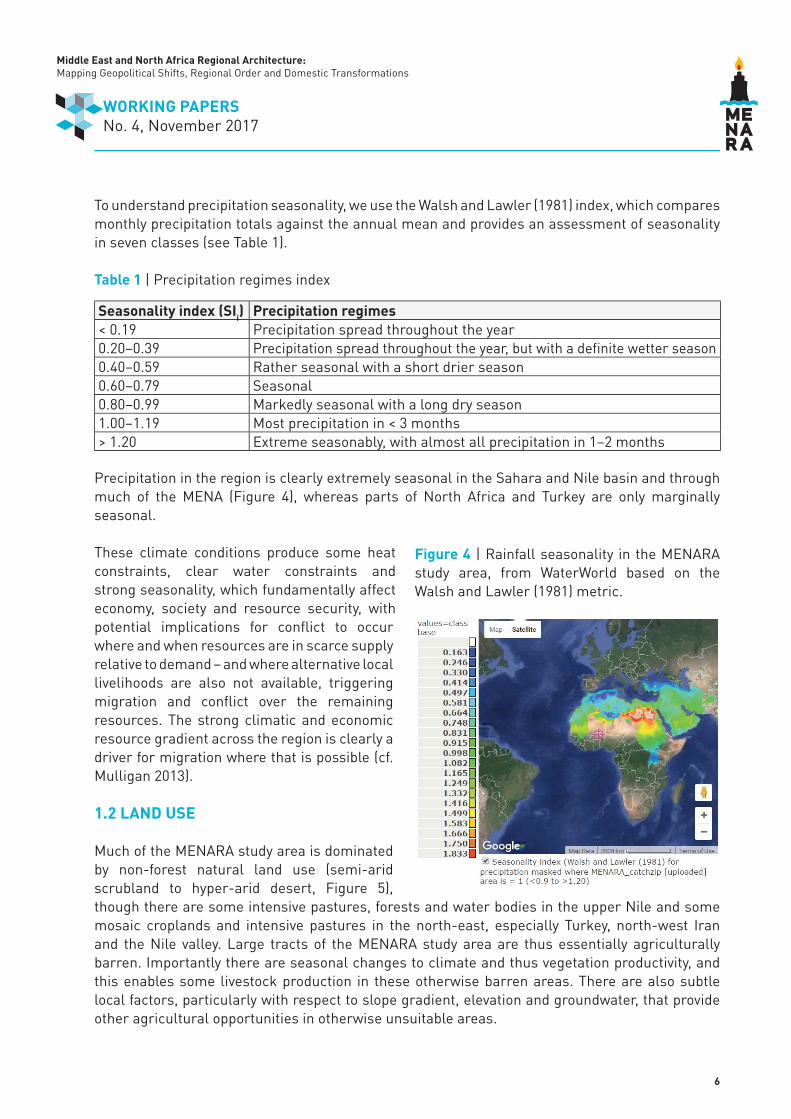
To understand precipitation seasonality, we use the Walsh and Lawler (1981) index, which compares monthly precipitation totals against the annual mean and provides an assessment of seasonality in seven classes (see Table 1).
Table 1 | Precipitation regimes index
Seasonality index (SIi) Precipitation regimes< 0.19 Precipitation spread throughout the year0.20–0.39 Precipitation spread throughout the year, but with a defi nite wetter season0.40–0.59 Rather seasonal with a short drier season0.60–0.79 Seasonal0.80–0.99 Markedly seasonal with a long dry season1.00–1.19 Most precipitation in < 3 months> 1.20 Extreme seasonably, with almost all precipitation in 1–2 months
Precipitation in the region is clearly extremely seasonal in the Sahara and Nile basin and through much of the MENA (Figure 4), whereas parts of North Africa and Turkey are only marginally seasonal.
These climate conditions produce some heat constraints, clear water constraints and strong seasonality, which fundamentally affect economy, society and resource security, with potential implications for confl ict to occur where and when resources are in scarce supply relative to demand – and where alternative local livelihoods are also not available, triggering migration and confl ict over the remaining resources. The strong climatic and economic resource gradient across the region is clearly a driver for migration where that is possible (cf. Mulligan 2013).
1.2 LAND USE
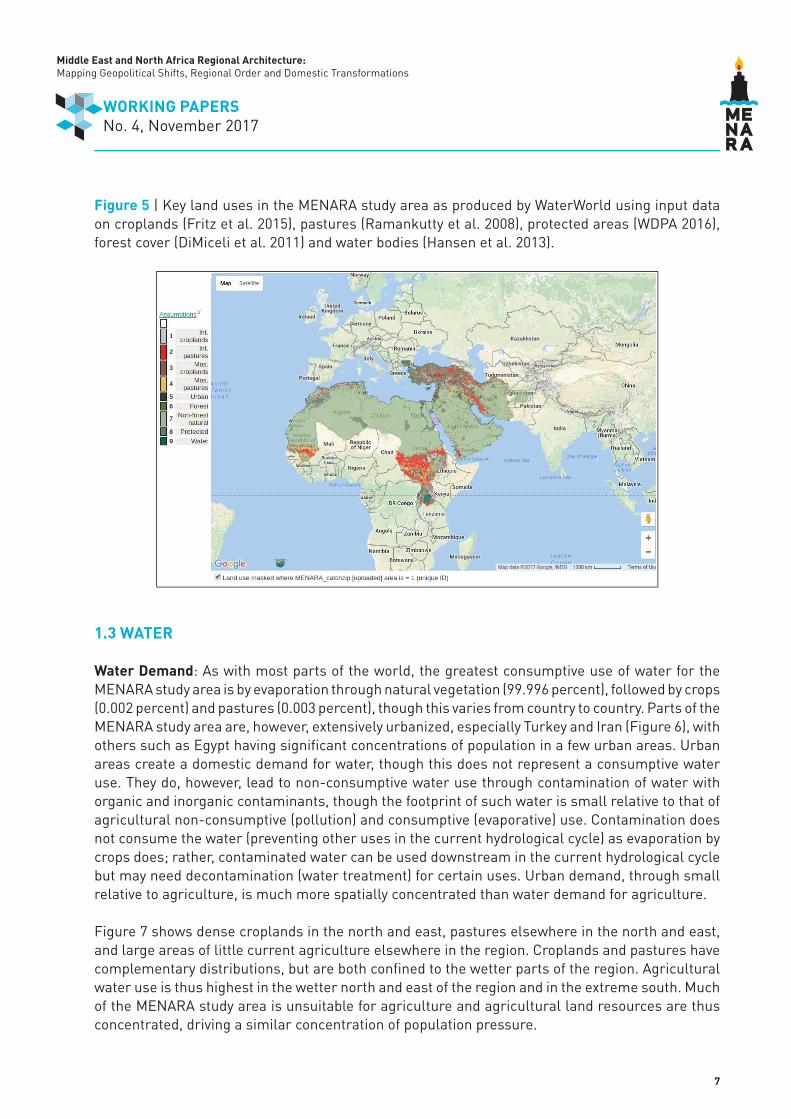
Much of the MENARA study area is dominated by non-forest natural land use (semi-arid scrubland to hyper-arid desert, Figure 5), though there are some intensive pastures, forests and water bodies in the upper Nile and some mosaic croplands and intensive pastures in the north-east, especially Turkey, north-west Iran and the Nile valley. Large tracts of the MENARA study area are thus essentially agriculturally barren. Importantly there are seasonal changes to climate and thus vegetation productivity, and this enables some livestock production in these otherwise barren areas. There are also subtle local factors, particularly with respect to slope gradient, elevation and groundwater, that provide other agricultural opportunities in otherwise unsuitable areas.
Figure 4 | Rainfall seasonality in the MENARA study area, from WaterWorld based on the Walsh and Lawler (1981) metric.
Middle East and North Africa Regional Architecture: Mapping Geopolitical Shifts, Regional Order and Domestic Transformations
7
WORKING PAPERSNo. 4, November 2017
Figure 5 | Key land uses in the MENARA study area as produced by WaterWorld using input data on croplands (Fritz et al. 2015), pastures (Ramankutty et al. 2008), protected areas (WDPA 2016), forest cover (DiMiceli et al. 2011) and water bodies (Hansen et al. 2013).
1.3 WATER
Water Demand: As with most parts of the world, the greatest consumptive use of water for the MENARA study area is by evaporation through natural vegetation (99.996 percent), followed by crops (0.002 percent) and pastures (0.003 percent), though this varies from country to country. Parts of the MENARA study area are, however, extensively urbanized, especially Turkey and Iran (Figure 6), with others such as Egypt having signifi cant concentrations of population in a few urban areas. Urban areas create a domestic demand for water, though this does not represent a consumptive water use. They do, however, lead to non-consumptive water use through contamination of water with organic and inorganic contaminants, though the footprint of such water is small relative to that of agricultural non-consumptive (pollution) and consumptive (evaporative) use. Contamination does not consume the water (preventing other uses in the current hydrological cycle) as evaporation by crops does; rather, contaminated water can be used downstream in the current hydrological cycle but may need decontamination (water treatment) for certain uses. Urban demand, through small relative to agriculture, is much more spatially concentrated than water demand for agriculture.
Figure 7 shows dense croplands in the north and east, pastures elsewhere in the north and east, and large areas of little current agriculture elsewhere in the region. Croplands and pastures have complementary distributions, but are both confi ned to the wetter parts of the region. Agricultural water use is thus highest in the wetter north and east of the region and in the extreme south. Much of the MENARA study area is unsuitable for agriculture and agricultural land resources are thus concentrated, driving a similar concentration of population pressure.

Middle East and North Africa Regional Architecture: Mapping Geopolitical Shifts, Regional Order and Domestic Transformations
8
WORKING PAPERSNo. 4, November 2017
Figure 6 | Urban areas (left, source: Schneider et al. 2009) and average by country (right) in the MENARA study area
Figure 7 | Croplands (left, source: Fritz et al. 2015) and pastures (right, source: Ramankutty et al. 2008) in the MENARA study area
Water Supply and Infrastructure: Water balance is the water remaining once evapotranspiration is taken from rainfall. It is thus the amount of water available for the generation of streamfl ow and all non-evaporative water uses (domestic, industrial, hydropower). According to WaterWorld (Mulligan 2013), the annual water balance in the study area varies from >1600mm to -1600mm locally, with a number of countries with negative local water balances (i.e. more evaporation than rainfall and thus sustained by fl ows from upstream), for example Egypt, Sudan, Libya, Algeria and Oman. Those with positive water balances at the national scale include Turkey, Lebanon and the contributing areas of the Democratic Republic of the Congo, Uganda, Kenya, Tanzania and Ethiopia. There are many water bodies (both reservoirs and lakes) in the East (especially Turkey and Iran).
Middle East and North Africa Regional Architecture: Mapping Geopolitical Shifts, Regional Order and Domestic Transformations
9
WORKING PAPERSNo. 4, November 2017
Groundwater reserves are important in North Africa. According to WaterWorld, snow and ice are signifi cant (>5 percent runoff) only in Morocco, Turkey, Iran, Lebanon and the contributing areas of peripheral countries such as Pakistan, Afghanistan, Bulgaria and Georgia.
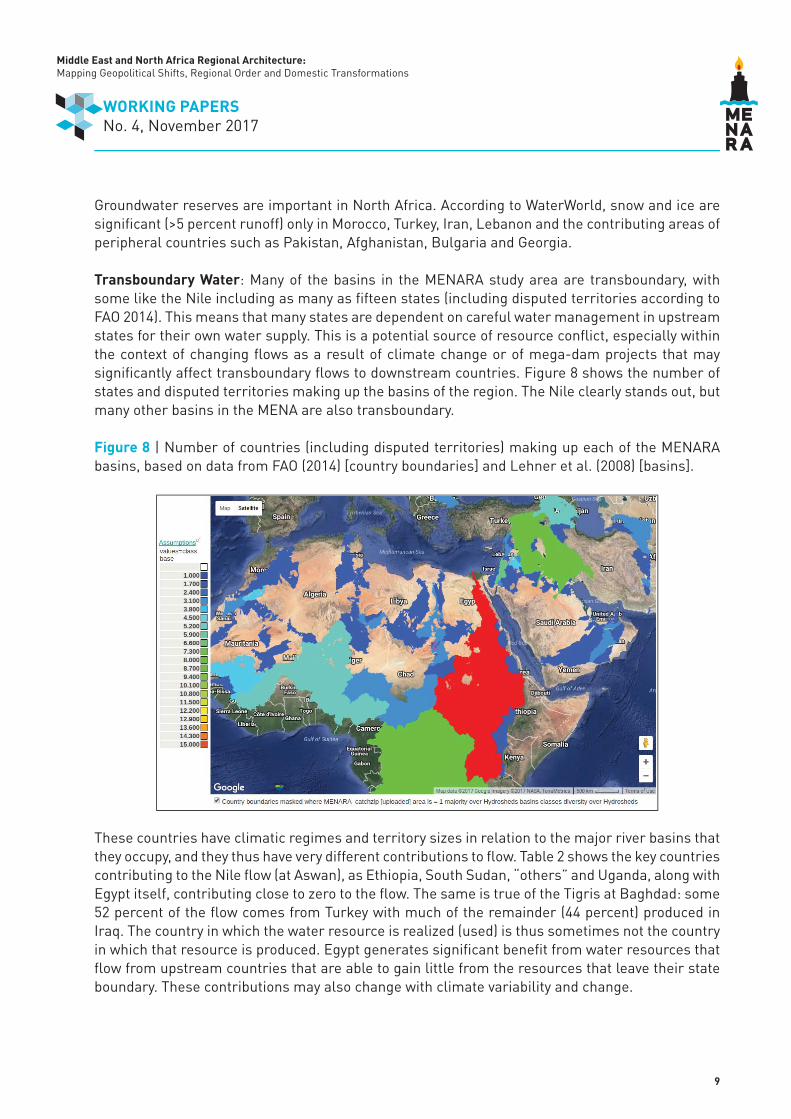
Transboundary Water: Many of the basins in the MENARA study area are transboundary, with some like the Nile including as many as fi fteen states (including disputed territories according to FAO 2014). This means that many states are dependent on careful water management in upstream states for their own water supply. This is a potential source of resource confl ict, especially within the context of changing fl ows as a result of climate change or of mega-dam projects that may signifi cantly affect transboundary fl ows to downstream countries. Figure 8 shows the number of states and disputed territories making up the basins of the region. The Nile clearly stands out, but many other basins in the MENA are also transboundary.
Figure 8 | Number of countries (including disputed territories) making up each of the MENARA basins, based on data from FAO (2014) [country boundaries] and Lehner et al. (2008) [basins].
These countries have climatic regimes and territory sizes in relation to the major river basins that they occupy, and they thus have very different contributions to fl ow. Table 2 shows the key countries contributing to the Nile fl ow (at Aswan), as Ethiopia, South Sudan, “others” and Uganda, along with Egypt itself, contributing close to zero to the fl ow. The same is true of the Tigris at Baghdad: some 52 percent of the fl ow comes from Turkey with much of the remainder (44 percent) produced in Iraq. The country in which the water resource is realized (used) is thus sometimes not the country in which that resource is produced. Egypt generates signifi cant benefi t from water resources that fl ow from upstream countries that are able to gain little from the resources that leave their state boundary. These contributions may also change with climate variability and change.

Middle East and North Africa Regional Architecture: Mapping Geopolitical Shifts, Regional Order and Domestic Transformations
10
WORKING PAPERSNo. 4, November 2017
Table 2 | Contributions to fl ow from different upstream countries for Nile and Tigris, based on the WaterWorld fl ow infl uence metric (Mulligan 2013).
Country % of annual Nile fl ow at Aswan Dam Country % of annual Tigris fl ow at BaghdadEthiopia 41.1 Iraq 43.8South Sudan 27.6 Iran 4.1Sudan 6.4 Syria 0.5Uganda 10.3 Turkey 51.5Others 14.6 Others 0.1Egypt 0
Water Infrastructure: Built water infrastructure includes many small, medium and large dams throughout the region, especially in Coastal North Africa, Turkey and parts of the Gulf (Figure 9). Dams mitigate against seasonal rainfall by allowing the storage of water produced in the wet season for consumption (irrigation, domestic, hydropower) in the dry season. There is clearly signifi cant development of this mitigating infrastructure for water supply in some areas but very poor development in others (refl ecting lack of investment and/or lack of rainfall or terrain-controlled suitability for damming). Whilst dams are clearly an important built infrastructure for agricultural, domestic and energy purposes, they can concentrate resource confl ict both within and between states, particularly for some of the highly transboundary basins identifi ed above. They are also an unworkable development or policy option for many parts of the MENA region that have insuffi cient water balance in the wet season to produce viable reservoirs for dry season use.
Figure 9 | Dams in the MENARA study area. Source: Mulligan et al. 2011.
Middle East and North Africa Regional Architecture: Mapping Geopolitical Shifts, Regional Order and Domestic Transformations
11
WORKING PAPERSNo. 4, November 2017
1.4 AGRICULTURE AND FOOD
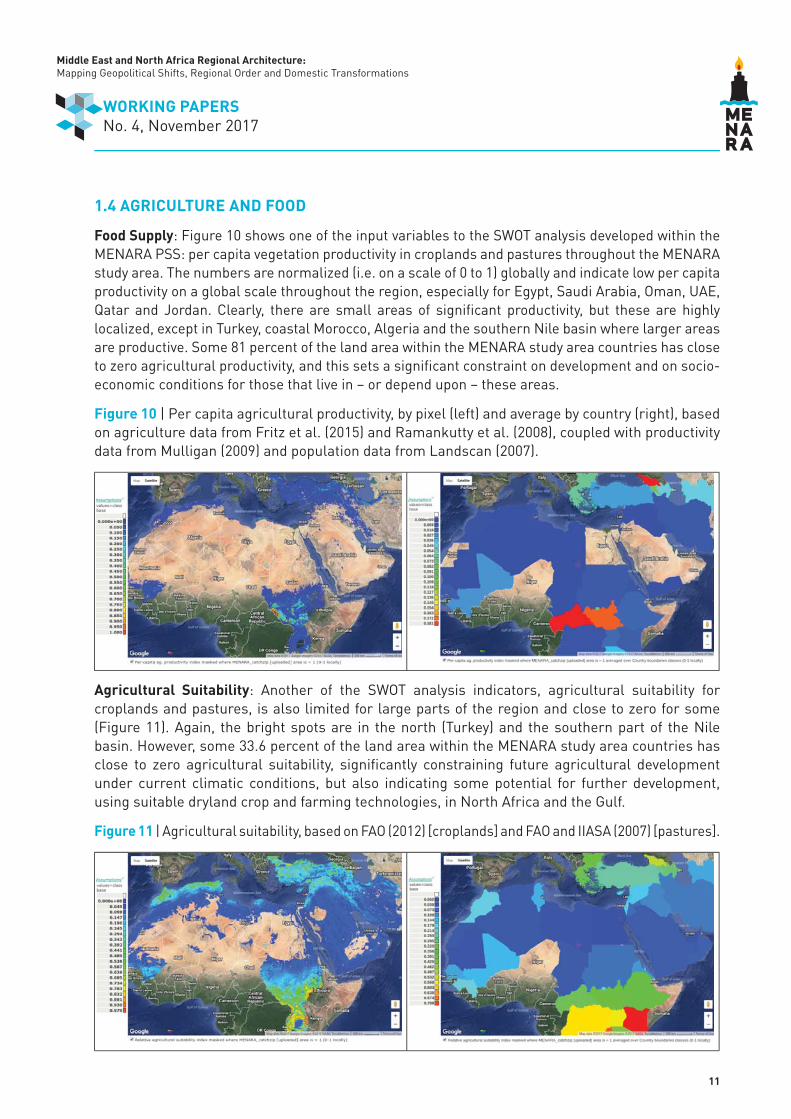
Food Supply: Figure 10 shows one of the input variables to the SWOT analysis developed within the MENARA PSS: per capita vegetation productivity in croplands and pastures throughout the MENARA study area. The numbers are normalized (i.e. on a scale of 0 to 1) globally and indicate low per capita productivity on a global scale throughout the region, especially for Egypt, Saudi Arabia, Oman, UAE, Qatar and Jordan. Clearly, there are small areas of signifi cant productivity, but these are highly localized, except in Turkey, coastal Morocco, Algeria and the southern Nile basin where larger areas are productive. Some 81 percent of the land area within the MENARA study area countries has close to zero agricultural productivity, and this sets a signifi cant constraint on development and on socio-economic conditions for those that live in – or depend upon – these areas.
Figure 10 | Per capita agricultural productivity, by pixel (left) and average by country (right), based on agriculture data from Fritz et al. (2015) and Ramankutty et al. (2008), coupled with productivity data from Mulligan (2009) and population data from Landscan (2007).
Agricultural Suitability: Another of the SWOT analysis indicators, agricultural suitability for croplands and pastures, is also limited for large parts of the region and close to zero for some (Figure 11). Again, the bright spots are in the north (Turkey) and the southern part of the Nile basin. However, some 33.6 percent of the land area within the MENARA study area countries has close to zero agricultural suitability, signifi cantly constraining future agricultural development under current climatic conditions, but also indicating some potential for further development, using suitable dryland crop and farming technologies, in North Africa and the Gulf.
Figure 11 | Agricultural suitability, based on FAO (2012) [croplands] and FAO and IIASA (2007) [pastures].

Middle East and North Africa Regional Architecture: Mapping Geopolitical Shifts, Regional Order and Domestic Transformations
12
WORKING PAPERSNo. 4, November 2017
Energy Demand and Potential Renewable Supply: The energy situation for the MENARA countries is summarized in Figure 12, based on the calculations of the MENARA PSS (Mulligan 2017) indicators for energy demand and renewable (electricity) energy supply. MENARA calculates both energy demand and potential renewable electricity production at the pixel level and above. Relative demand is calculated on DMSP (2015) nighttime lights data that are a clear indicator of electricity use, but also correlate with fossil fuel use for industry, cooling, heating and transport. Potential supply is calculated separately for solar, wind and hydropower. Solar potential is calculated as the relative solar insolation in areas with electrifi cation infrastructure (as indicated by DMSP 2015) but outside urban areas and areas of steep slope, where panel installation would be costly. Solar potential is also mediated by topographic exposure to account for shadowing by terrain. Wind potential is calculated as the relative wind speed also in areas with electrifi cation infrastructure (as indicated by DMSP 2015), but outside urban areas. Wind speed is corrected for topographic exposure, which is important in driving localized patterns of wind. Hydropower potential is calculated according to the power equation (head x velocity x gravity). Velocity is calculated from streamfl ow (runoff) data calculated by accumulating water balance along the Lehner et al. (2008) fl ow network in the MENARA PSS. Head is calculated for run-of-the river schemes as the downstream change in elevation using the SRTM digital elevation model (DEM) of Lehner et al. (2008). For reservoir schemes the potential head is calculated as the downstream elevational difference where topography permits a 15m or greater impoundment wall.
Total energy demand refl ects population distribution and is clearly very highly concentrated in a few urbanized areas, with the Nile delta being one of the brightest spots for energy consumption globally, but the national total of these bright spots is highest in Iran, Saudi Arabia and Turkey. Solar power production potential is highest along the Nile, in specifi c parts of the deserts in Algeria and Morocco (that have infrastructure) and in Saudi Arabia. These are some of the highest values for solar potential globally. National totals indicate solar potential as highest in Iran, Saudi Arabia and Turkey. Wind power is similarly distributed according to electrical grid infrastructure but values are generally much lower relative to elsewhere in the globe. The most signifi cant potential resources in the region at the national scale are again in Iran and Saudi Arabia but also Turkey and Algeria (concentrated on the Atlas mountains).
Figure 12 | Energy demand and energy production potential for solar, wind and hydropower, by pixel (left) and average by country (right), from the MENARA policy support system (Mulligan 2017).
Relative energy demand by pixel Total relative energy demand by country

Middle East and North Africa Regional Architecture: Mapping Geopolitical Shifts, Regional Order and Domestic Transformations
13
WORKING PAPERSNo. 4, November 2017
Solar power potential, by pixel Total solar power potential, by country
Wind power potential, by pixel Total wind power potential, by country
Hydro power potential, by pixel Total hydro power potential, by country
Combined renewable power potential, by pixel Total combined renewable power potential, by country

Middle East and North Africa Regional Architecture: Mapping Geopolitical Shifts, Regional Order and Domestic Transformations
14
WORKING PAPERSNo. 4, November 2017
Hydropower potential is much more sparsely distributed, confi ned to a few mountainous areas, especially in Turkey, the South and East Mediterranean coast and the north African coast. Turkey has the highest potential, followed by the Nile countries, especially Sudan. Combined renewable power potential shows highest values (wind and solar) in Saudi Arabia, with globally signifi cant values. By country, renewable power potential is highest for Iran, followed by Saudi Arabia, Turkey and Algeria.
1.5 NATURAL HAZARDS
Natural hazards are widely considered a material factor in confl ict (Maas and Tänzler 2009, Brauch et al. 2003) and migration Mulligan et al. (2013). Hence, we map hazard potential, hazard exposure, vulnerability and risk using Co$ting Nature – a web-based spatial policy support system designed for this purpose and for the purpose of understanding ecosystem services (Mulligan 2015). The hazards considered here are fl ood/drought, landslide/erosion, and inundation/tsunami/cyclone. Hazard potential is clearly highest in mountainous coastal zones and more generally through Turkey and Iran as well as the south-east Nile basin (Figure 13). The greatest hazard potential in the region is most often landslide as a result of steep slopes and/or unconsolidated soils. Socio-economic exposure to hazard is also highest in the areas with greatest hazard potential, with agriculture most exposed in Turkey, the north African coast and southern Nile basin. In the Gulf, infrastructure and gross domestic product (GDP) are more often the exposed asset (since there is little agriculture), and for the desert regions without signifi cant GDP or infrastructure, population is most exposed.
Figure 13 | Hazard potential (top), exposure (middle) and risk (bottom) by pixel (left) and average by country (right), according to Co$ting Nature.

Middle East and North Africa Regional Architecture: Mapping Geopolitical Shifts, Regional Order and Domestic Transformations
15
WORKING PAPERSNo. 4, November 2017
Risk is calculated as hazard exposure times vulnerability. More accessible exposures (populations, agriculture, infrastructure or GDP) are considered less vulnerable in the event of hazard than less accessible exposures. This is because accessibility will provide the opportunity for population to move away from the threat and for emergency services and post-disaster recovery to intervene, post-hazard. The pattern of risk clearly follows that for exposure. Average risk is low for the low-lying deserts but highest for Morocco, Turkey and the South and East Mediterranean as well as the contributing areas of the southern Nile countries.
Ecosystems providing Hazard Mitigation Services: Ecosystem services are the uncosted benefi ts that people derive from the natural environment. Intact ecosystems provide hazard mitigation services (Renaud et al. 2013), and it is important these ecosystems are well managed so that they can continue to mitigate the risk of natural hazards. The key areas providing these services are shown in Figure 14 and scale somewhat with the potential for hazard and exposure, so these services are greatest in Turkey and the South and East Mediterranean and least in the Sahara and Gulf states. The need to achieve the correct landscape balance of natural ecosystems for

Middle East and North Africa Regional Architecture: Mapping Geopolitical Shifts, Regional Order and Domestic Transformations
16
WORKING PAPERSNo. 4, November 2017
the provision of ecosystem services and agricultural systems for the production of food is a key constraint on further agricultural development upslope, upstream or near human populations. This is particularly an issue for further agricultural development in the north and east of the study area.
Figure 14 | Natural hazard mitigation by ecosystems in the MENARA study area, according to Co$ting Nature.
1.6 THE ROLE OF SPATIAL CONCENTRATION OF ENVIRONMENTAL AND SOCIAL MATERIAL FACTORS
In addition to the absolute magnitude of these material factors in the countries (see Appendix 3), their spatial concentration is also important in determining the concentration of pressure (e.g. for population) and of scarcity (e.g. for productivity). Spatial concentration can be as important as absolute magnitude, especially in “oasis” environments and is an understudied topic. Table 3 shows a metric of spatial concentration. At an index value of zero, the metric is evenly distributed across the whole of the study area, whereas an index value of 100 has all the material concentrated within one subdivision. Here our subdivisions are 10km pixels. Population, population change, productivity and energy demand are clearly highly spatially concentrated. Populations are especially concentrated in Libya and Egypt. Population growth is especially high in Mauritania, Western Sahara, Mauritania, Oman and Libya. Rainfall is much less concentrated but is especially concentrated in Egypt (60 percent) and Libya (57 percent). Vegetation productivity is most concentrated in Libya, Algeria and Egypt. Energy demand is most concentrated in Mauritania, Sudan and Libya. This high level of concentration of resources, growth and demand represent important choke points for sustainable development, and these choke points are particularly apparent in the countries showing red across a number of variables in Table 3.

Middle East and North Africa Regional Architecture: Mapping Geopolitical Shifts, Regional Order and Domestic Transformations
17
WORKING PAPERSNo. 4, November 2017
Table 3 | Concentration indices for key variables by country for the MENARA study area.
2. A COMPREHENSIVE SWOT ANALYSIS FOR THE MENARA STUDY AREA
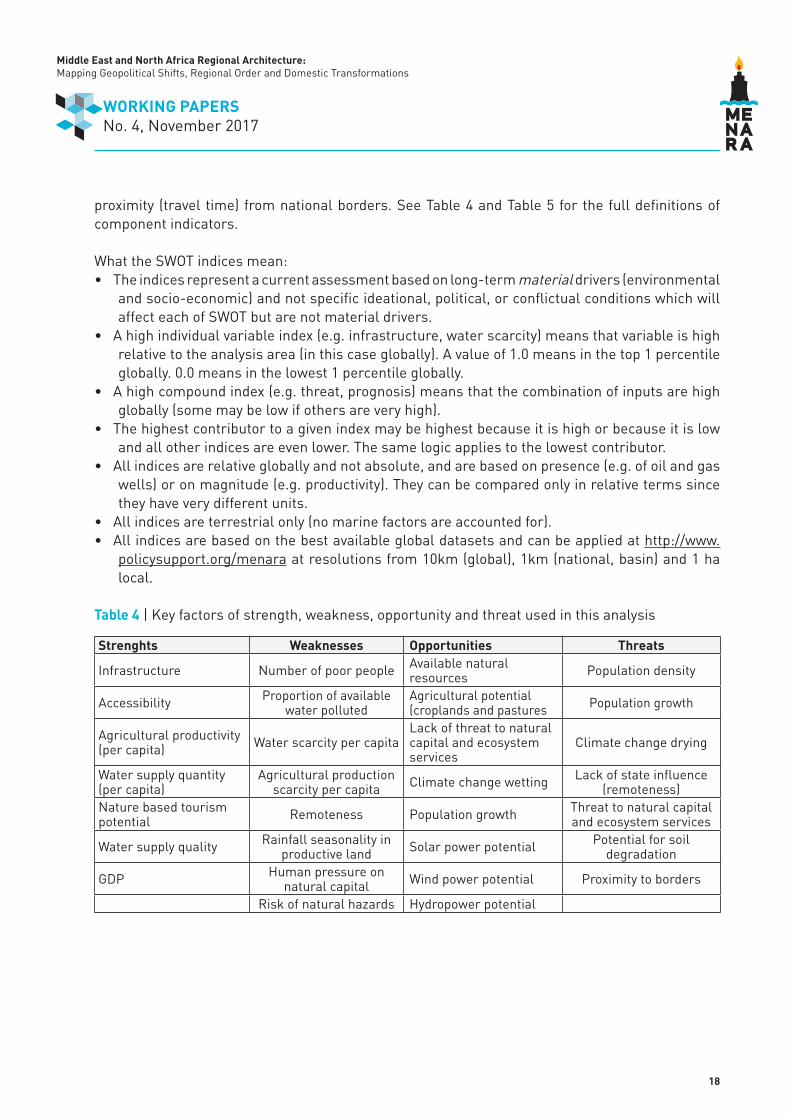
We have developed the MENARA policy support system to carry out a SWOT analysis of strengths, weaknesses, opportunities and threats for the MENARA study area. This formalizes the kinds of geographical analysis just presented by defi ning, mapping and combining a series of metrics that are indicative of environmental material factors and which can be used to derive a multi-variable spatial prognosis. The analysis produces a series of maps that are combined under the SWOT headings. An area’s strengths include its: infrastructure, accessibility, per capita agricultural productivity, per capita water supply, quality of water supply and GDP. Weaknesses include the number of poor people, proportion of water polluted, water scarcity per capita, scarcity of agricultural production per capita, remoteness from markets, rainfall seasonality, pressure on natural capital and, risk of natural hazards. Opportunities include natural resources, agricultural potential, absence of threat to natural capital, areas in which rainfall is expected to increase under climate change, growth in population, potential for solar, wind and hydro power renewable energy production. Threats include population density, population growth, areas in which climate change will reduce rainfall, threats to natural capital, potential for soil degradation under agriculture and
Middle East and North Africa Regional Architecture: Mapping Geopolitical Shifts, Regional Order and Domestic Transformations
18
WORKING PAPERSNo. 4, November 2017
proximity (travel time) from national borders. See Table 4 and Table 5 for the full defi nitions of component indicators.
What the SWOT indices mean:• The indices represent a current assessment based on long-term material drivers (environmental
and socio-economic) and not specifi c ideational, political, or confl ictual conditions which will affect each of SWOT but are not material drivers.
• A high individual variable index (e.g. infrastructure, water scarcity) means that variable is high relative to the analysis area (in this case globally). A value of 1.0 means in the top 1 percentile globally. 0.0 means in the lowest 1 percentile globally.
• A high compound index (e.g. threat, prognosis) means that the combination of inputs are high globally (some may be low if others are very high).
• The highest contributor to a given index may be highest because it is high or because it is low and all other indices are even lower. The same logic applies to the lowest contributor.
• All indices are relative globally and not absolute, and are based on presence (e.g. of oil and gas wells) or on magnitude (e.g. productivity). They can be compared only in relative terms since they have very different units.
• All indices are terrestrial only (no marine factors are accounted for).• All indices are based on the best available global datasets and can be applied at http://www.
policysupport.org/menara at resolutions from 10km (global), 1km (national, basin) and 1 ha local.
Table 4 | Key factors of strength, weakness, opportunity and threat used in this analysis
Strenghts Weaknesses Opportunities Threats
Infrastructure Number of poor people Available natural resources Population density
Accessibility Proportion of available water polluted
Agricultural potential (croplands and pastures Population growth
Agricultural productivity (per capita) Water scarcity per capita
Lack of threat to natural capital and ecosystem services
Climate change drying
Water supply quantity (per capita)
Agricultural production scarcity per capita Climate change wetting Lack of state infl uence
(remoteness)Nature based tourism potential Remoteness Population growth Threat to natural capital
and ecosystem services
Water supply quality Rainfall seasonality in productive land Solar power potential Potential for soil
degradation
GDP Human pressure on natural capital Wind power potential Proximity to borders
Risk of natural hazards Hydropower potential

Middle East and North Africa Regional Architecture: Mapping Geopolitical Shifts, Regional Order and Domestic Transformations
19
WORKING PAPERSNo. 4, November 2017
Table 5 | Indices used to represent strength, weakness, opportunity and threat.
Current strengths Current weaknesses Future opportunities Future threatsInfrastructure (mines, oil wells, pipelines, roads, dams, urban areas)
Number of poor people (<$2 per day)
Natural resources (coal, mining, surface waters, coasts, tree cover)
Population density
Accessibility (within three hours’ travel-time) to markets (towns) in resource providing areas
Proportion of available water polluted
Agricultural potential (mean suitability for croplands and pastures)
Population density growth
Per capita agricultural productivity
Water supply per capita (scarcity)
Absence of threat to natural capital (providing ecosystem services). Threat considered: planned roads, accessibility, distance from deforestation, GDP change, population change, temperature change, precipitation change, intensity of night-time light, presence of natural resources
Climate change: less rainfall
Volume of water supply per capita
Agricultural productivity per capita (scarcity)
Climate change: more rainfall
Ungovernable areas (remoteness from towns)
Nature-based tourism potential
Remoteness (travel time to populations centres) in resource providing areas
Population density growth
Threat to natural capital (providing ecosystem
services). Threat considered: planned roads, accessibility, distance from deforestation,
GDP change, population change, temperature change, precipitation
change, intensity of night-time light, presence of
natural resources
Clean water resource volume (quality of water supply)
Rainfall Seasonality in resource providing areas Solar power potential
Potential for soil degradation under agriculture based on observed degradation, slope steepness and agricultural
potential
GDP
Pressure on natural capital from population, fi re frequency, grazing, agricultural intensity,
dam density and human infrastructure
Wind power potential
Topography weighted proximity from national
borders (migration, refugees, confl ict)
Risk of natural hazards (cyclones, landslides,
coastal inundation and fl ood) considering GDP, population agricultural
and infrastructural exposure
Hydropower potential
Resource providing areas= cropland, pastures, watersheds of dams, roads, catchments of urban areas, populated places
Middle East and North Africa Regional Architecture: Mapping Geopolitical Shifts, Regional Order and Domestic Transformations
20
WORKING PAPERSNo. 4, November 2017
All these component indices are normalized from 0 (low) to 1 (high) globally (i.e. in comparison with all other pixels globally) using the 1st and 99th percentiles so as to reduce the effect of outliers. This means that on each metric we are assessing the state of a pixel in relation to that metric globally, whether the metric be an indicator of strength, weakness, opportunity or threat. The individual metrics are then combined into a series of summary metrics (e.g. the magnitude of the strength index) and the component of the given index that is greatest in each pixel (e.g. the greatest strength). These are visualized here for the MENARA study area and can be summarized at any level above the pixel (e.g. administrative region, basin, country). This full suite of metrics is mapped and described in detail in Appendix 1 for the whole MENARA study area and Appendix 2 for the country of Syria. The combination of strength (+), weakness (-), opportunity (+) and threat (-) produces the overall prognosis metric and the most signifi cant attribute metric (which of SWOT is the highest). These are presented in the main body of the report here.
2.1 PROGNOSIS
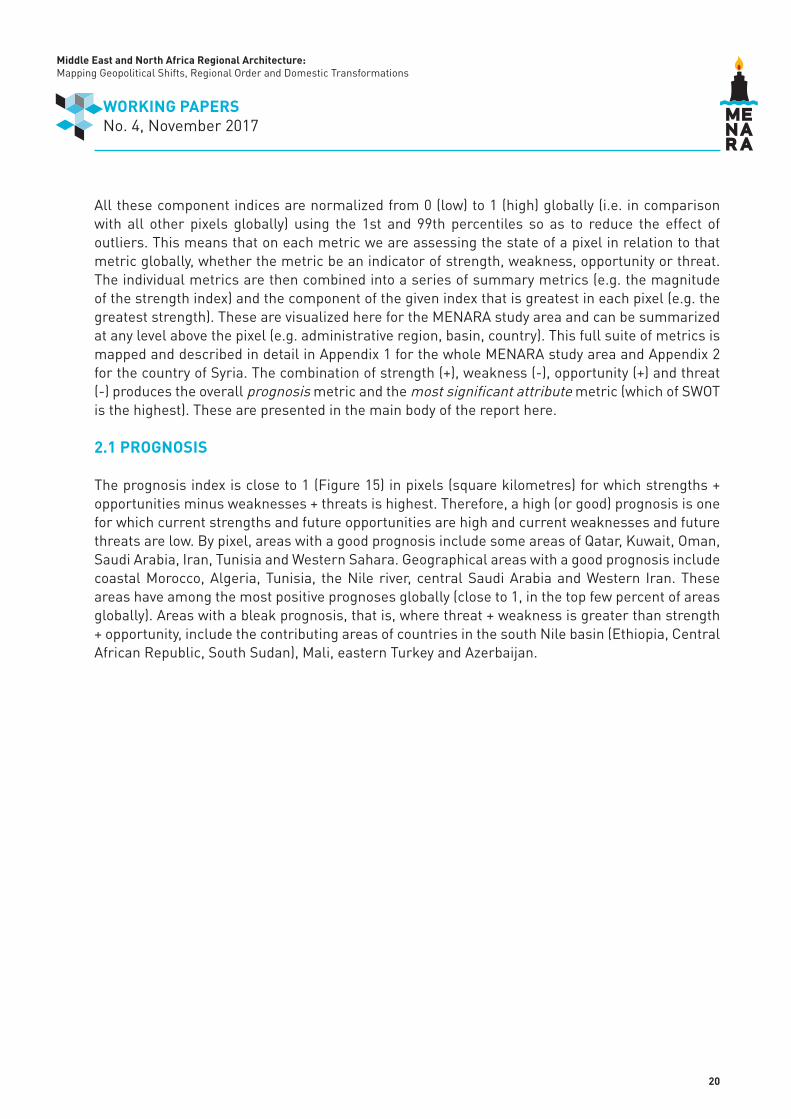
The prognosis index is close to 1 (Figure 15) in pixels (square kilometres) for which strengths + opportunities minus weaknesses + threats is highest. Therefore, a high (or good) prognosis is one for which current strengths and future opportunities are high and current weaknesses and future threats are low. By pixel, areas with a good prognosis include some areas of Qatar, Kuwait, Oman, Saudi Arabia, Iran, Tunisia and Western Sahara. Geographical areas with a good prognosis include coastal Morocco, Algeria, Tunisia, the Nile river, central Saudi Arabia and Western Iran. These areas have among the most positive prognoses globally (close to 1, in the top few percent of areas globally). Areas with a bleak prognosis, that is, where threat + weakness is greater than strength + opportunity, include the contributing areas of countries in the south Nile basin (Ethiopia, Central African Republic, South Sudan), Mali, eastern Turkey and Azerbaijan.
Middle East and North Africa Regional Architecture: Mapping Geopolitical Shifts, Regional Order and Domestic Transformations
21
WORKING PAPERSNo. 4, November 2017
Figure 15 | MENARA PSS Prognosis metric for the MENARA study area by pixel (top) and average by MENARA contributing area in each country (bottom). For non-MENARA countries these metrics refer to the part of the country contributing to MENARA countries (as is clear in the top map), not the whole of those countries.
2.2 MOST SIGNIFICANT PROGNOSTIC
The MENARA study area has a number of areas in which strength is the most signifi cant prognostic (e.g. northern coastal Africa, South Sudan and isolated areas in the Middle East as well as

Middle East and North Africa Regional Architecture: Mapping Geopolitical Shifts, Regional Order and Domestic Transformations
22
WORKING PAPERSNo. 4, November 2017
distributed pockets in Israel and Egypt for example (Figure 16). There are areas of opportunity in west Africa and the southern Nile basin as well as central Saudi Arabia. Western Iran and Turkey are landscapes of intermixed strength and opportunity. Most of the deserts of the MENARA study area have low opportunity and low strength, so are dominated by threat. These are areas in which signifi cant infrastructural and agricultural development will be necessary to change their fortune. The detailed analysis of which material environmental, social, energy and other factors lead to these outcomes is given in Appendix 1.
Figure 16 | Most signifi cant of (relative value of) strength, weakness, opportunity and threat by pixel for the MENARA study area
3. CONCLUSIONS: POTENTIAL ENVIRONMENTAL CHOKE POINTS FOR ECONOMIC AND SOCIETAL DEVELOPMENT
3.1 CONCENTRATION OF PRESSURE AND LACK OF INFRASTRUCTURE AS A THREAT TO GOVERNANCE
The MENA countries have signifi cant population growth and concentration in a largely challenging environment both physically and in terms of infrastructure and socio-economic development. This means that in many places there is an excess of water food and energy demand over supply. This is particularly the case in areas of extreme population concentration, along rivers and coasts for example, in otherwise dry and climatically challenging environments. This concentration of pressure is a characteristic of these environments and is shown to be more signifi cant in some countries than others. Dense populations in a few areas surrounded by vast expanses of virtually uninhabited land create pressures in the concentrated spaces and challenges in governance over the more remote areas.
Middle East and North Africa Regional Architecture: Mapping Geopolitical Shifts, Regional Order and Domestic Transformations
23
WORKING PAPERSNo. 4, November 2017
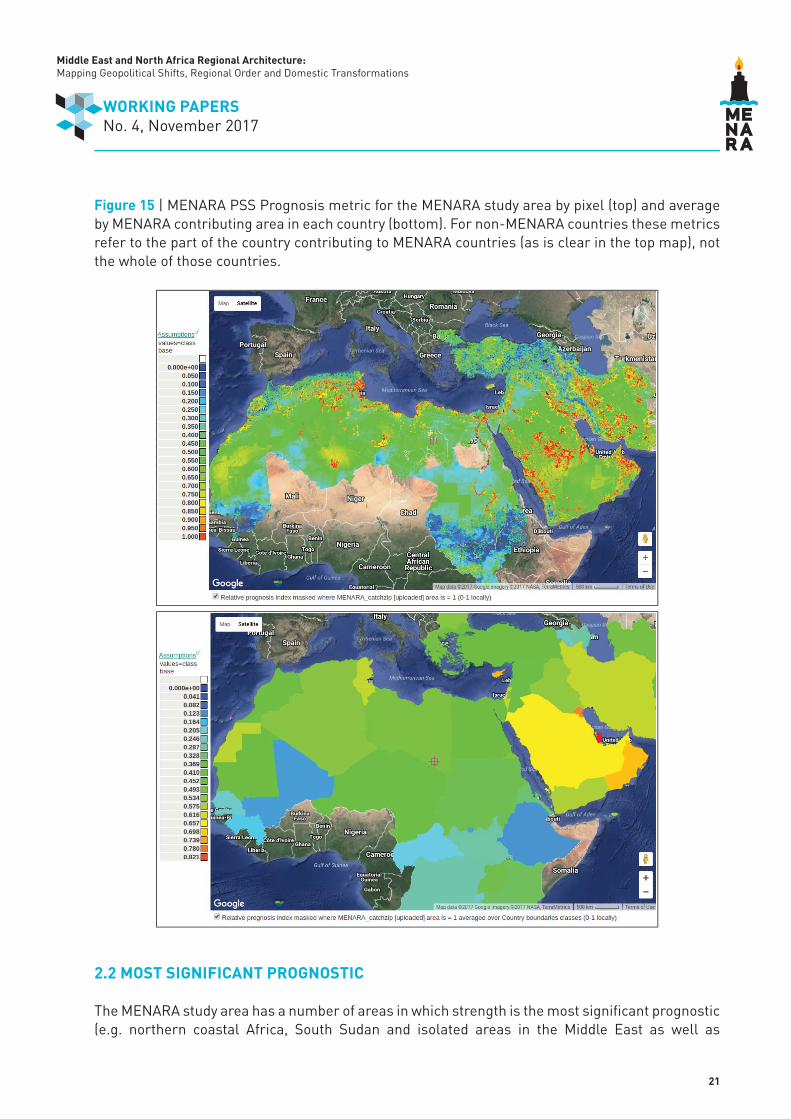
By examining the spatial concentration of SWOT indices we can better understand multi-variable drivers that are spatially concentrated. A high concentration index for strength (Figure 17, left) indicates that strength is highly focused on a few areas with little strength in the surrounding hinterland. This is true for all North African and most Middle Eastern countries, though strength is more widely distributed in Turkey and the South and East Mediterranean. Opportunity (Figure 17, right) is much less clustered overall, but its highest clustering is in Egypt and the South and East Mediterranean.
Figure 17 | Concentration index for strength (left) and opportunity (right)
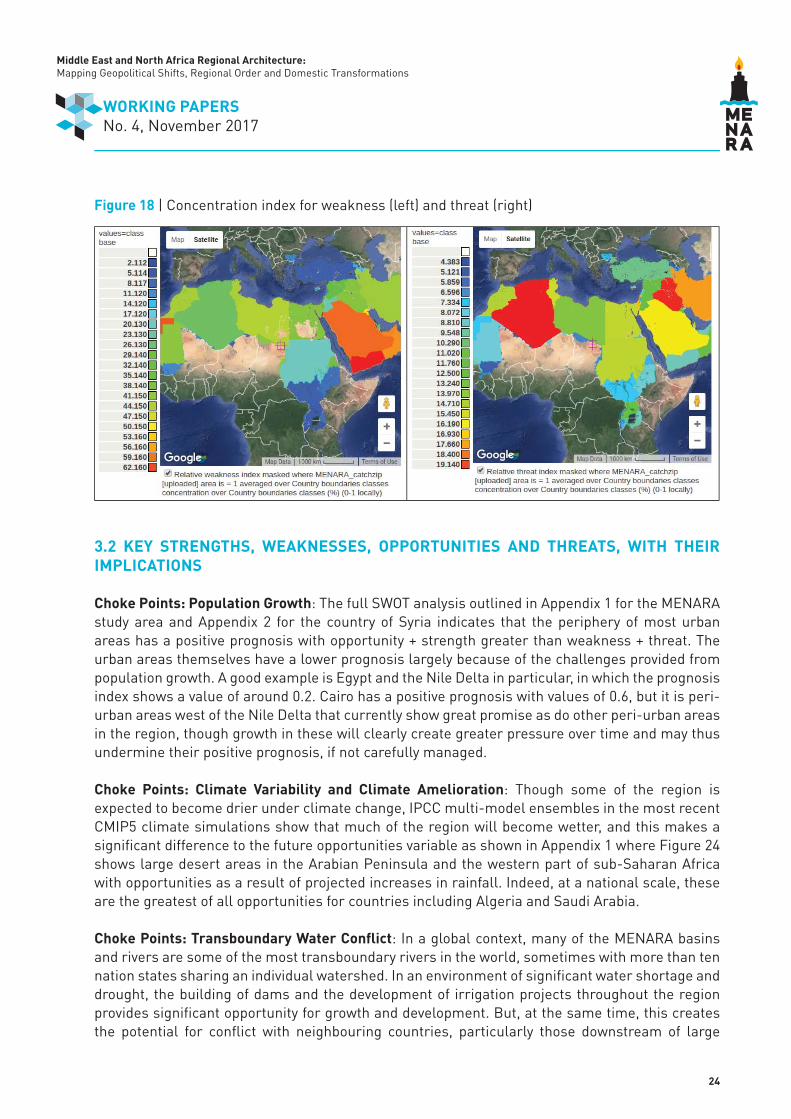
A low concentration of weakness and threat (Figure 18, left and right) indicates a weak hinterland and can be seen particularly clearly for weakness in Turkey and the southern Nile countries. A weak hinterland is to be avoided if countries are to develop economically, socially and politically. Weakness is more concentrated in the Gulf countries since they seem not to have this weak hinterland. Threat is most concentrated in Algeria and Iraq and least concentrated (most dispersed) in the southern Nile and north-west African countries. A concentration of threat is more easily managed than a dispersed threat, though of course the magnitude of threat is as important as its dispersion. Both weakness and threat are much less concentrated overall than strength and opportunity, further defi ning a key challenge of managing the very distinct challenges to urban versus rural populations. Governance and development for concentrated populations and infrastructures is much easier than for highly dispersed populations and infrastructures.
Middle East and North Africa Regional Architecture: Mapping Geopolitical Shifts, Regional Order and Domestic Transformations
24
WORKING PAPERSNo. 4, November 2017
Figure 18 | Concentration index for weakness (left) and threat (right)
3.2 KEY STRENGTHS, WEAKNESSES, OPPORTUNITIES AND THREATS, WITH THEIR IMPLICATIONS
Choke Points: Population Growth: The full SWOT analysis outlined in Appendix 1 for the MENARA study area and Appendix 2 for the country of Syria indicates that the periphery of most urban areas has a positive prognosis with opportunity + strength greater than weakness + threat. The urban areas themselves have a lower prognosis largely because of the challenges provided from population growth. A good example is Egypt and the Nile Delta in particular, in which the prognosis index shows a value of around 0.2. Cairo has a positive prognosis with values of 0.6, but it is peri-urban areas west of the Nile Delta that currently show great promise as do other peri-urban areas in the region, though growth in these will clearly create greater pressure over time and may thus undermine their positive prognosis, if not carefully managed.
Choke Points: Climate Variability and Climate Amelioration: Though some of the region is expected to become drier under climate change, IPCC multi-model ensembles in the most recent CMIP5 climate simulations show that much of the region will become wetter, and this makes a signifi cant difference to the future opportunities variable as shown in Appendix 1 where Figure 24 shows large desert areas in the Arabian Peninsula and the western part of sub-Saharan Africa with opportunities as a result of projected increases in rainfall. Indeed, at a national scale, these are the greatest of all opportunities for countries including Algeria and Saudi Arabia.
Choke Points: Transboundary Water Confl ict: In a global context, many of the MENARA basins and rivers are some of the most transboundary rivers in the world, sometimes with more than ten nation states sharing an individual watershed. In an environment of signifi cant water shortage and drought, the building of dams and the development of irrigation projects throughout the region provides signifi cant opportunity for growth and development. But, at the same time, this creates the potential for confl ict with neighbouring countries, particularly those downstream of large

Middle East and North Africa Regional Architecture: Mapping Geopolitical Shifts, Regional Order and Domestic Transformations
25
WORKING PAPERSNo. 4, November 2017
dam projects. The Nile River includes some sixteen states and disputed territories. The Danube includes twenty and the Tigris-Euphrates eight states. This is certainly at the high end globally, with most global basins having fewer than fi ve states within their watershed and many having just one or two.
Choke Points: Food Balance: Given the lack of water resources, agricultural expansion is unlikely over much of the region, and where agriculture is viable a careful balance between farming and nature conservation is important for the continued provision of important ecosystem services. Thus, the most viable approach to achieving food security in the MENA region in the short term will be a trade-based approach. This means the MENA region will further increase its dependence on world markets for the import of food to feed the increasing populations (Breisinger 2016, and see deeper discussion in McKee et al. 2017). This will require the MENA region to earn enough foreign exchange to procure food from the global market. There are risks in relying on global markets for food security, as became clear in the food crisis of 2008, so these risks need to be carefully managed. Longer-term climate wetting and improvements in agricultural and irrigation technology or of renewable energy available for groundwater pumping and/or desalination may provide new non-renewable or renewable water resources for food production.
4. GOING FORWARD
The MENARA policy support system provides a comprehensive analysis of material factors at multiple scales within the region. These can inform further work on ideational factors and scenarios within the MENARA project and beyond. It will be important for the project to engage with this tool and to make it accessible and available to policymakers focused on the region.
Setting ideational factors within their material context provides the opportunity to better understand triggers to confl ict, migration and unrest. These geopolitical, economic and societal issues are played out on complex geographical tapestries of strength, weakness, opportunity and threat. Demographic and economic issues are further discussed in the report on economic and demographic material factors.
Further analyses within the project should focus on understanding the relationship between these factors and the incidence and types of confl ict within the region. Further work on the impact of scenarios for change such as population growth, on the subnational, national and international trajectory of development within the region would also be useful.

Middle East and North Africa Regional Architecture: Mapping Geopolitical Shifts, Regional Order and Domestic Transformations
26
WORKING PAPERSNo. 4, November 2017
REFERENCES
Brauch, Hans Günter et al., eds. (2003), Security and Environment in the Mediterranean. Conceptualising Security and Environmental Confl icts, Berlin, Springer
Breisinger, Clemens (2016), Prospects for Food and Nutrition Security in MENA and the Role of Structural Transformation, Presentation given to the American University of Beirut conference “Celebration of Food & Nutrition Security in the Middle East and North Africa”, 30 September, https://www.aub.edu.lb/fafs/FoodSecurity/Resources/Conferences/Documents/AUB event 2016 - Breisinger.pdf
DiMiceli, C.M. et al. (2011), Annual Global Automated MODIS Vegetation Continuous Fields (MOD44B) at 250 m Spatial Resolution for Data Years Beginning Day 65, 2000-2010, College Park, University of Maryland
DMSP/Defense Meteorological Satellite Program (2015), Nighttime Lights of the World Data. Version 4 DMSP-OLS Nighttime Lights Time Series, https://ngdc.noaa.gov/eog/dmsp/downloadV4composites.html
FAO/Food and Agriculture Organization (2012), Agro-ecological Suitability and Productivity. Crop Suitability Index (Class), http://www.fao.org/nr/gaez/about-data-portal/agricultural-suitability-and-potential-yields/en
FAO/Food and Agriculture Organization (2014), Global Administrative Unit Layers (GAUL), http://www.fao.org/geonetwork/srv/en/metadata.show?id=12691
FAO/Food and Agriculture Organization and IIASA/International Institute of Applied Systems Analysis (2007), Suitability of Global Land Area for Pasture - Grid Format, http://www.fao.org/geonetwork/srv/en/metadata.show?id=14167
Fritz, Steffen et al. (2015), “Mapping Global Cropland and Field Size”, in Global Change Biology, Vol. 21, No. 5 (May), p. 1980-1992
Hansen, M.C. et al. (2013), “High-Resolution Global Maps of 21st-Century Forest Cover Change”, in Science, Vol. 342, No. 6160 (15 November), p. 850-853, Data available online: http://earthenginepartners.appspot.com/science-2013-global-forest
Hijmans, Robert J. et al. (2005), “Very High Resolution Interpolated Climate Surfaces for Global Land Areas”, in International Journal of Climatology, Vol. 25, No. 15 (December), p. 1965-1978, http://dx.doi.org/10.1002/joc.1276
LandScan Global Population Database 2007, Oak Ridge, Oak Ridge National Laboratory, http://web.ornl.gov/sci/landscan
Lehner, Bernhard, Kristine Verdin and Andy Jarvis (2008), “New Global Hydrography Derived from Spaceborne Elevation Data”, in Eos, Vol. 89, No. 10 (4 March), p. 93-94, http://dx.doi.

Middle East and North Africa Regional Architecture: Mapping Geopolitical Shifts, Regional Order and Domestic Transformations
27
WORKING PAPERSNo. 4, November 2017
org/10.1029/2008EO100001
Maas, Achim and Dennis Tänzler (2009), Regional Security Implications of Climate Change. A Synopsis, Berlin, Adelphi, https://www.adelphi.de/en/system/fi les/mediathek/bilder/us_514_-_adelphi_synopsis_on_climate_change_and_security_09-01-15.pdf
McKee, Musa et al. (2017), “Demographic and Economic Material Factors in the MENA Region”, in MENARA Working Papers, No. 3 (October), http://www.menaraproject.eu/?p=1040
Mulligan, Mark (2009), Global Mean Dry Matter Productivity Based on SPOT-VGT (1998-2008), http://geodata.policysupport.org/home/global-mean-dry-matter-productivity
Mulligan, Mark (2013), “WaterWorld: A Self-Parameterising, Physically-Based Model for Application in Data-Poor But Problem-Rich Environments Globally”, in Hydrology Research, Vol. 44, No. 5 (October), p. 748-769
Mulligan, Mark (2015), “Trading Off Agriculture With Nature’s Other Benefi ts, Spatially”, in Cornélio Alberto Zolin and Renato de A.R. Rodrigues, eds., Impact of Climate Change on Water Resources in Agriculture, Boca Raton, CRC Press, p. 184-204
Mulligan, Mark (2017), MENARA Policy Support System, http://www.policysupport.org/menara
Mulligan, Mark, Sophia Burke and Caitlin Douglas (2013), “Environmental Change and Migration between Europe and its Neighbours”, in Etienne Piguet and Frank Laczko, eds., People on the Move in a Changing Climate. The Regional Impact of Environmental Change on Migration, Dordrecht, Springer, p. 49-79
Mulligan, Mark, Leonardo Saenz and Arnout van Soesbergen (2011), Development and Validation of a Georeferenced Global Database of Dams
Ramankutty, Navin et al. (2008), “Farming the Planet: 1. Geographic Distribution of Global Agricultural Lands in the Year 2000”, in Global Biogeochemical Cycles, Vol. 22, No. 1 (March), http://dx.doi.org/10.1029/2007GB002952
Renaud, Fabrice G., Karen Sudmeier-Rieux and Marisol Estrella, eds. (2013), The Role of Ecosystems in Disaster Risk Reduction, Tokyo, United Nations University Press, http://collections.unu.edu/view/UNU:1995
Schneider, A., M.A. Friedl and D. Potere (2009), “A New Map of Global Urban Extent from MODIS Data”, in Environmental Research Letters, Vol. 4, No. 4, Article 044003, http://dx.doi.org/10.1088/1748-9326/4/4/044003
Walsh, P.D. and D.M. Lawler (1981), “Rainfall Seasonality: Description, Spatial Patterns and Change through Time”, in Weather, Vol. 36, No. 7 (July), p. 201-208
WDPA/World Database on Protected Areas (2016), Annual Release, December, https://www.protectedplanet.net/c/world-database-on-protected-areas

Middle East and North Africa Regional Architecture: Mapping Geopolitical Shifts, Regional Order and Domestic Transformations
28
WORKING PAPERSNo. 4, November 2017
Appendix 1 | Detail of the MENARA PSS SWOT Analysis for the MENARA Study Area
In this appendix we present the component indices of the MENARA PSS prognosis metric described in the main report. The component indices of strength, weakness, opportunity and threat are important for contextualizing the prognosis and for understanding the spatial distribution of key strengths, weakness, opportunities and threats.
Strength is a function of infrastructure, accessibility, per capita agricultural productivity, per capita total water supply, nature-based tourism potential, volume of clean water and GDP. The combination of these is clearly greatest (Figure 19) at the Nile delta and along the coast of Israel and Lebanon, through there are areas of very high strength on the Algerian coast and in western Turkey. High levels of strength are concentrated along the north African coast, throughout most of Turkey and the north and east Persian Gulf with areas of lower strength in the southern Nile basin and very low values of strength elsewhere.
Figure 19 | Strength index
Middle East and North Africa Regional Architecture: Mapping Geopolitical Shifts, Regional Order and Domestic Transformations
29
WORKING PAPERSNo. 4, November 2017
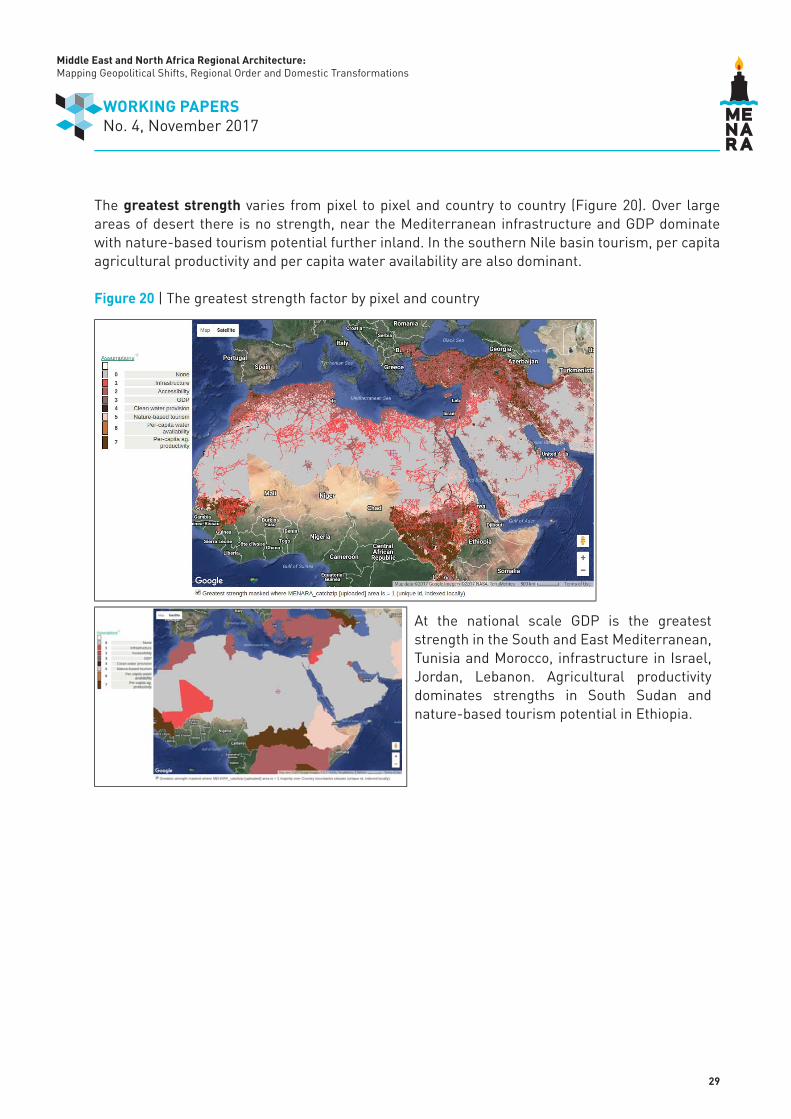
The greatest strength varies from pixel to pixel and country to country (Figure 20). Over large areas of desert there is no strength, near the Mediterranean infrastructure and GDP dominate with nature-based tourism potential further inland. In the southern Nile basin tourism, per capita agricultural productivity and per capita water availability are also dominant.
Figure 20 | The greatest strength factor by pixel and country
At the national scale GDP is the greatest strength in the South and East Mediterranean, Tunisia and Morocco, infrastructure in Israel, Jordan, Lebanon. Agricultural productivity dominates strengths in South Sudan and nature-based tourism potential in Ethiopia.

Middle East and North Africa Regional Architecture: Mapping Geopolitical Shifts, Regional Order and Domestic Transformations
30
WORKING PAPERSNo. 4, November 2017
Weakness is a function of poverty, water pollution, per capita water supply scarcity, per capita agricultural production scarcity, remoteness, rainfall seasonality, pressure on natural capital and risk from natural hazards. Weakness has a much broader distribution than strength and is high in some areas that are also strong; see Figure 21 (where for example high human populations create stresses on the provision of water and food). Weakness is high throughout coastal Morocco and Algeria, throughout coastal Israel, Lebanon and Syria, western Turkey and south-west Iran as well as the Ethiopian highlands, Rwanda, Burundi and western Kenya. The Middle East has very little weakness, except in western Yemen.
Figure 21 | Weakness by pixel and country
By country, Sudan, Algeria and Turkey are weakest, followed by Iran, Ethiopia and South Sudan.
Middle East and North Africa Regional Architecture: Mapping Geopolitical Shifts, Regional Order and Domestic Transformations
31
WORKING PAPERSNo. 4, November 2017
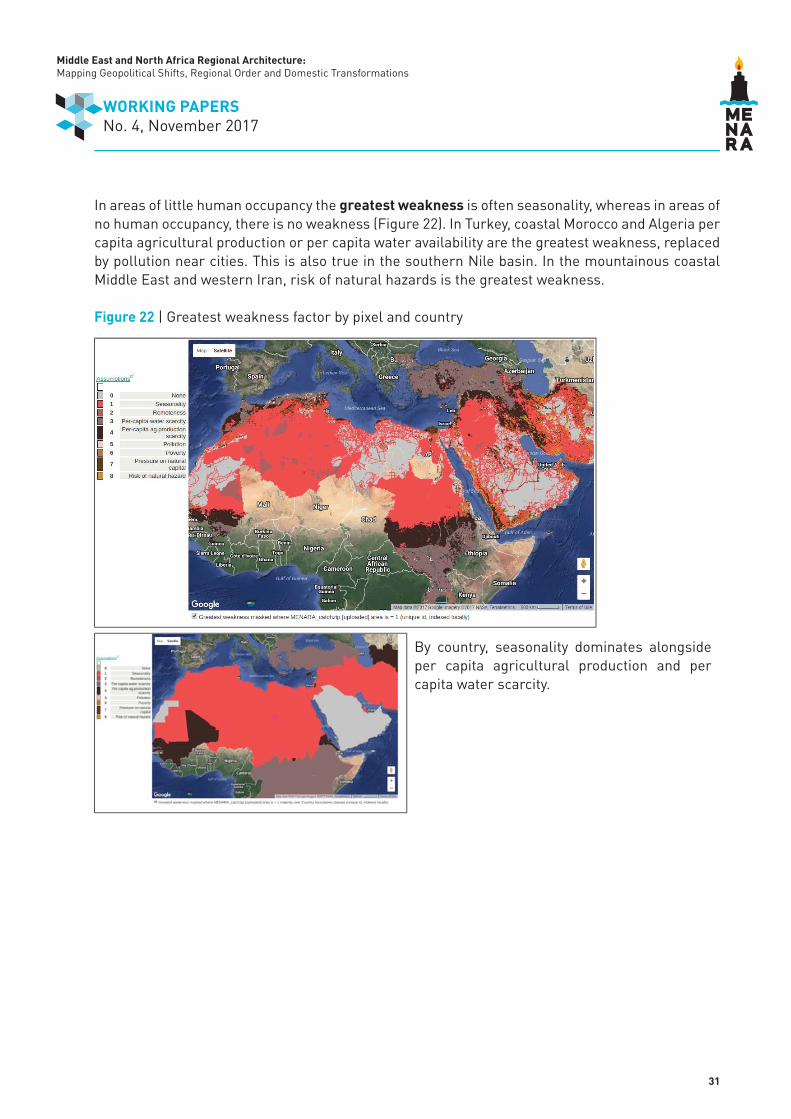
In areas of little human occupancy the greatest weakness is often seasonality, whereas in areas of no human occupancy, there is no weakness (Figure 22). In Turkey, coastal Morocco and Algeria per capita agricultural production or per capita water availability are the greatest weakness, replaced by pollution near cities. This is also true in the southern Nile basin. In the mountainous coastal Middle East and western Iran, risk of natural hazards is the greatest weakness.
Figure 22 | Greatest weakness factor by pixel and country
By country, seasonality dominates alongside per capita agricultural production and per capita water scarcity.

Middle East and North Africa Regional Architecture: Mapping Geopolitical Shifts, Regional Order and Domestic Transformations
32
WORKING PAPERSNo. 4, November 2017
Opportunity is a function of available natural resources, agricultural potential, areas of climate change leading to more rainfall, population growth, solar power potential, wind power potential, hydropower potential. There is opportunity throughout most of the MENARA study area but particularly along the Mediterranean coast, along the Nile river and in the southern Nile basin (Figure 23). Turkey and Iran also show considerable opportunity as do the South and East Mediterranean and areas of the Arabian peninsula.
Figure 23 | Opportunity index by pixel and country
By country, opportunity is greatest for Saudi Arabia, Algeria and Iran, followed by Turkey and Mauritius.

Middle East and North Africa Regional Architecture: Mapping Geopolitical Shifts, Regional Order and Domestic Transformations
33
WORKING PAPERSNo. 4, November 2017
The greatest opportunity by pixel is natural capital security throughout most of the region: because of the absence of human pressure, the natural capital will remain intact. In some other large desert areas climate change is expected to increase rainfall, and this is an opportunity (Figure 24). In coastal north Africa and the southern Nile, natural resources are the greatest opportunity whereas in specifi c areas of the Nile Delta, the coastal South and East Mediterranean, Turkey and Iraq population growth is a signifi cant opportunity (but also a threat). Where there is infrastructure, wind and solar energy potential (or hydropower along steep rivers) are the greatest opportunity.
Figure 24 | Greatest opportunity factor by pixel and country
By country, natural capital security is the dominant opportunity for most countries (on a global scale, this region is still relatively unimpacted). In the southern Nile, agricultural potential takes over and in a number of countries, including Saudi Arabia, the impact of an increasingly wet climate is the greatest opportunity.

Middle East and North Africa Regional Architecture: Mapping Geopolitical Shifts, Regional Order and Domestic Transformations
34
WORKING PAPERSNo. 4, November 2017
Threat is a function of population density, population density growth, areas where climate change leads to less rainfall, governance challenges (related to remoteness), threat of natural capital depletion, current and potential environmental degradation (Figure 25). Threat is highest in densely populated and developed areas such as the Nile delta, the coastal South and East Mediterranean and coastal Algeria and Morocco as well as east of Lake Victoria. These are amongst the highest threat levels in the world. Threat is much lower in the desert regions, except where there are mining/oil and gas concessions. Nowhere in the MENARA countries has a threat level of zero.
Figure 25 | Threat index by pixel and country
By country, the threat level is highest for the small contributing areas of countries outside the MENARA list or for small countries such as Israel and Lebanon but also Turkey, Morocco and Tunisia.
Middle East and North Africa Regional Architecture: Mapping Geopolitical Shifts, Regional Order and Domestic Transformations
35
WORKING PAPERSNo. 4, November 2017
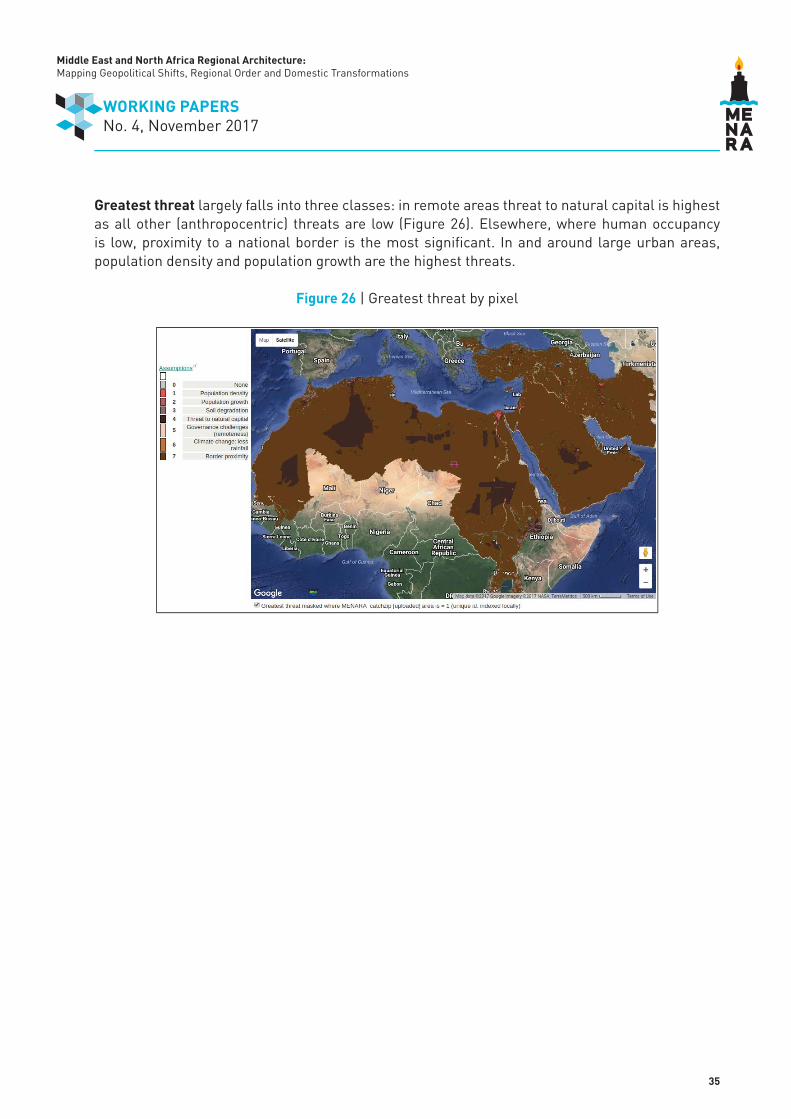
Greatest threat largely falls into three classes: in remote areas threat to natural capital is highest as all other (anthropocentric) threats are low (Figure 26). Elsewhere, where human occupancy is low, proximity to a national border is the most signifi cant. In and around large urban areas, population density and population growth are the highest threats.
Figure 26 | Greatest threat by pixel
Middle East and North Africa Regional Architecture: Mapping Geopolitical Shifts, Regional Order and Domestic Transformations
36
WORKING PAPERSNo. 4, November 2017
Appendix 2 | The MENARA PSS SWOT Analysis: A Case Study for Syria
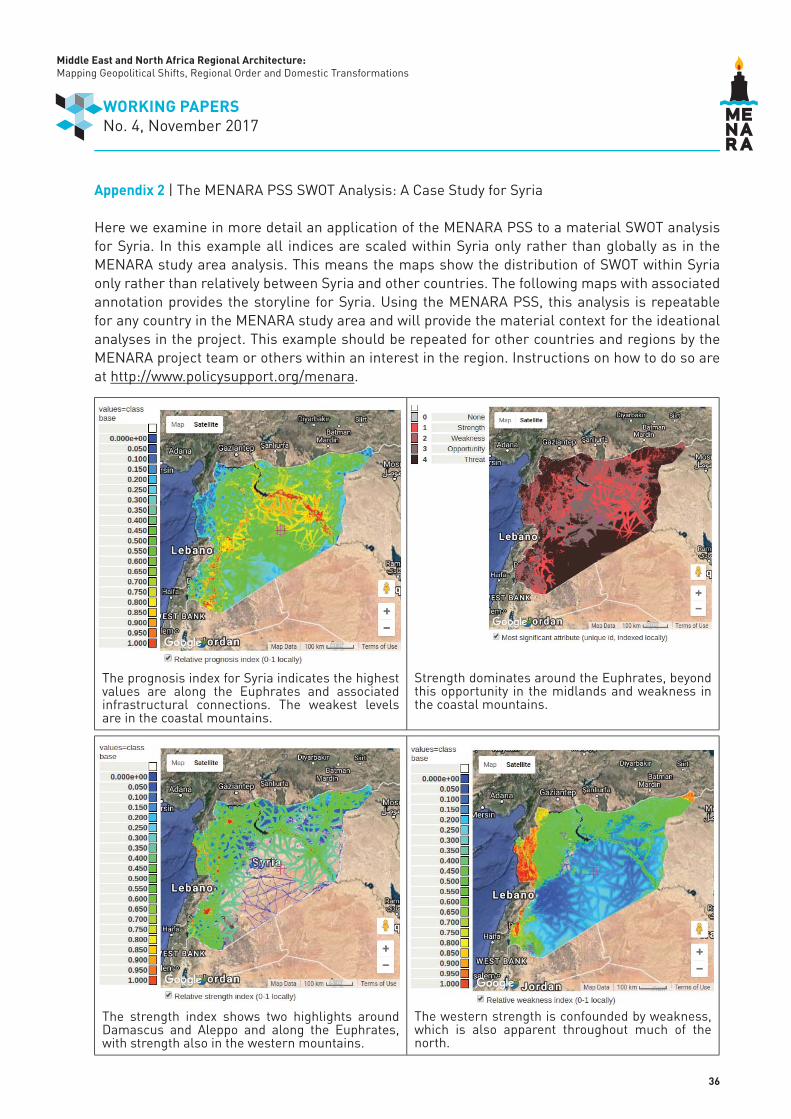
Here we examine in more detail an application of the MENARA PSS to a material SWOT analysis for Syria. In this example all indices are scaled within Syria only rather than globally as in the MENARA study area analysis. This means the maps show the distribution of SWOT within Syria only rather than relatively between Syria and other countries. The following maps with associated annotation provides the storyline for Syria. Using the MENARA PSS, this analysis is repeatable for any country in the MENARA study area and will provide the material context for the ideational analyses in the project. This example should be repeated for other countries and regions by the MENARA project team or others within an interest in the region. Instructions on how to do so are at http://www.policysupport.org/menara.
The prognosis index for Syria indicates the highest values are along the Euphrates and associated infrastructural connections. The weakest levels are in the coastal mountains.
Strength dominates around the Euphrates, beyond this opportunity in the midlands and weakness in the coastal mountains.
The strength index shows two highlights around Damascus and Aleppo and along the Euphrates, with strength also in the western mountains.
The western strength is confounded by weakness, which is also apparent throughout much of the north.

Middle East and North Africa Regional Architecture: Mapping Geopolitical Shifts, Regional Order and Domestic Transformations
37
WORKING PAPERSNo. 4, November 2017
Opportunity is highest in the south-west near Damascus and the border with Lebanon and along the Euphrates.
Threat is highest throughout the west and in all border areas.
The greatest strength for most of the country is either infrastructure or accessibility.
The greatest weakness varies between remoteness in the south, per capita agricultural production in the north, per capita water scarcity and risk of natural hazard in the west and seasonality elsewhere (indicating no anthropocentric weakness).

Middle East and North Africa Regional Architecture: Mapping Geopolitical Shifts, Regional Order and Domestic Transformations
38
WORKING PAPERSNo. 4, November 2017
The greatest opportunity varies between agricultural potential in the west and north, natural capital security in the areas of low population and a mixture of wind and hydropower potential in the mountainous south-west, population growth and solar energy potential along the Euphrates.
The greatest threats are governance challenges (remoteness) in the midlands, border proximity towards the periphery, climatic drying in the north and parts of the west and population density in urban areas.
Combining relative wind, solar and hydropower potentials indicates the highest potential along the Euphrates (dominated by solar potential in proximity to infrastructure) and in the mountainous south-east (wind and solar).
Wind potential is highest in the coastal north whilst solar dominates elsewhere. Large areas have no renewable energy potential (the grey area) because they are far from infrastructure.
Middle East and North Africa Regional Architecture: Mapping Geopolitical Shifts, Regional Order and Domestic Transformations
39
WORKING PAPERSNo. 4, November 2017
Appendix 3 | A Comparative National Scale Analysis of Material Factors
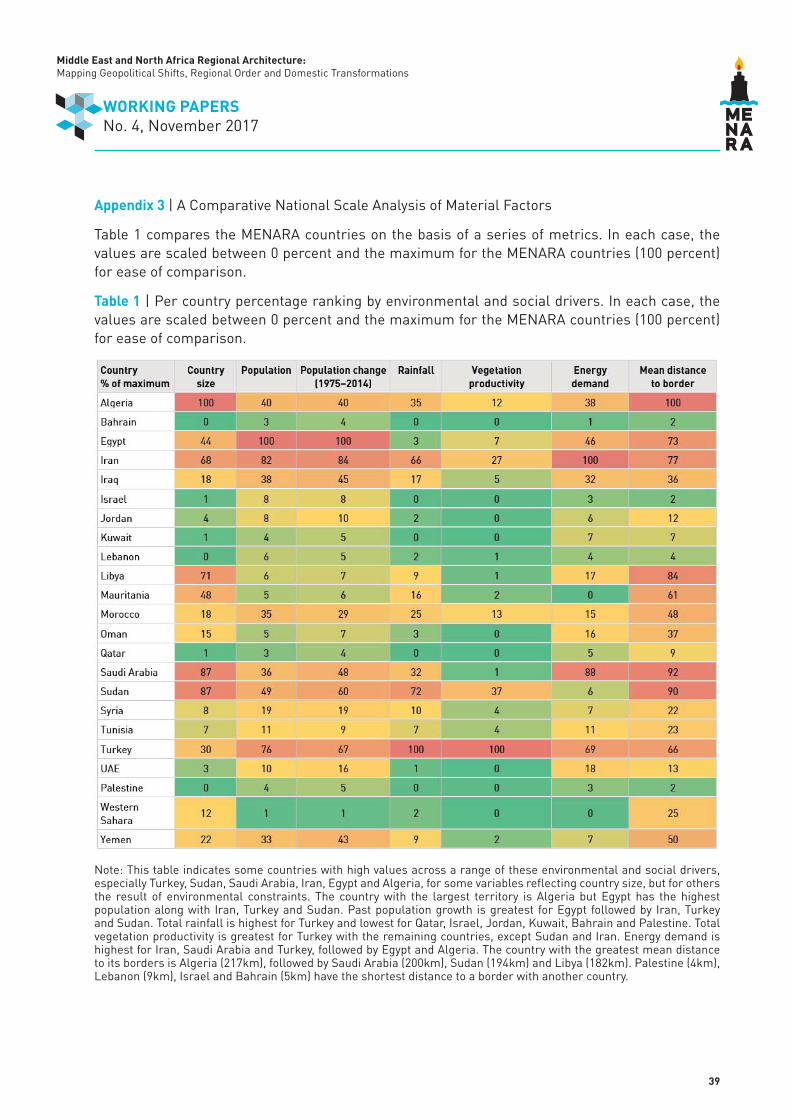
Table 1 compares the MENARA countries on the basis of a series of metrics. In each case, the values are scaled between 0 percent and the maximum for the MENARA countries (100 percent) for ease of comparison.
Table 1 | Per country percentage ranking by environmental and social drivers. In each case, the values are scaled between 0 percent and the maximum for the MENARA countries (100 percent) for ease of comparison.
Note: This table indicates some countries with high values across a range of these environmental and social drivers, especially Turkey, Sudan, Saudi Arabia, Iran, Egypt and Algeria, for some variables refl ecting country size, but for others the result of environmental constraints. The country with the largest territory is Algeria but Egypt has the highest population along with Iran, Turkey and Sudan. Past population growth is greatest for Egypt followed by Iran, Turkey and Sudan. Total rainfall is highest for Turkey and lowest for Qatar, Israel, Jordan, Kuwait, Bahrain and Palestine. Total vegetation productivity is greatest for Turkey with the remaining countries, except Sudan and Iran. Energy demand is highest for Iran, Saudi Arabia and Turkey, followed by Egypt and Algeria. The country with the greatest mean distance to its borders is Algeria (217km), followed by Saudi Arabia (200km), Sudan (194km) and Libya (182km). Palestine (4km), Lebanon (9km), Israel and Bahrain (5km) have the shortest distance to a border with another country.
Middle East and North Africa Regional Architecture: Mapping geopolitical shifts, regional order and domestic transformations (MENARA) is a research project that aims to shed light on domestic dynamics and bottom-up perspectives in the Middle East and North Africa amid increasingly volatile and uncertain times.
MENARA maps the driving variables and forces behind these dynamics and poses a single all-encompassing research question: Will the geopolitical future of the region be marked by either centrifugal or centripetal dynamics or a combination of both? In answering this question, the project is articulated around three levels of analysis (domestic, regional and global) and outlines future scenarios for 2025 and 2050. Its fi nal objective is to provide EU Member States policy makers with valuable insights.
MENARA is carried out by a consortium of leading research institutions in the fi eld of international relations, identity and religion politics, history, political sociology, demography, energy, economy, military and environmental studies.
This project has received funding from the European Union’s Horizon 2020 Research and Innovation programme under grant agreement No 693244. This project has been funded with support from the European Commission. This publication refl ects the views only of the author, and the Commission cannot be held responsible for any use which may be made of the information contained therein.
Related Documents