ENHANCİNG NATİONAL CAPACİTİES İN POVERTY STATİSTİCS REPORT OUTLINE & PRELIMINARY QUESTIONNAIRE 7- 8 August 2014 Ankara, Turkey

ENHANCING NATIONAL CAPACITIES IN POVERTY STATISTICS REPORT OUTLINE & PRELIMINARY QUESTIONNAIRE 7- 8 August 2014 Ankara, Turkey.
Dec 24, 2015
Welcome message from author
This document is posted to help you gain knowledge. Please leave a comment to let me know what you think about it! Share it to your friends and learn new things together.
Transcript
ENHANCİNG NATİONAL CAPACİTİES İN POVERTY STATİSTİCS
REPORT OUTLINE & PRELIMINARY QUESTIONNAIRE
7- 8 August 2014Ankara, Turkey
WHO IS THE POOR?• Many people struggle with poverty around the
world. But statisticians and researchers have hard time to have reliable, consistent, and comparable measures of poverty.
WHY?• It is not easy to define and measure poverty both
conceptually and empirically.
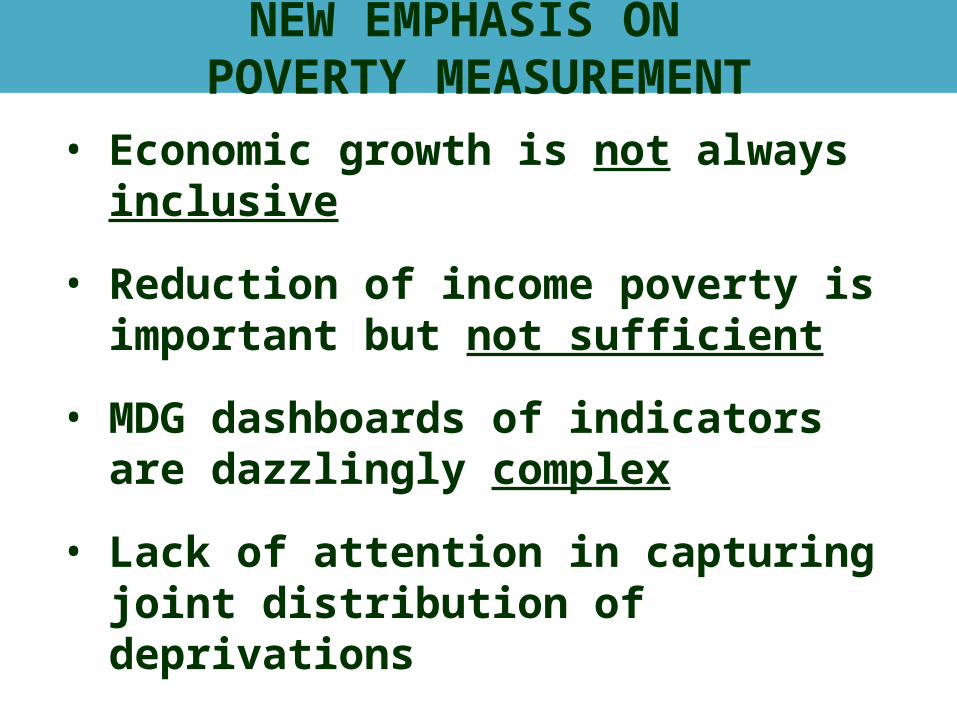
• Economic growth is not always inclusive
• Reduction of income poverty is important but not sufficient
• MDG dashboards of indicators are dazzlingly complex
• Lack of attention in capturing joint distribution of deprivations
NEW EMPHASIS ON POVERTY MEASUREMENT
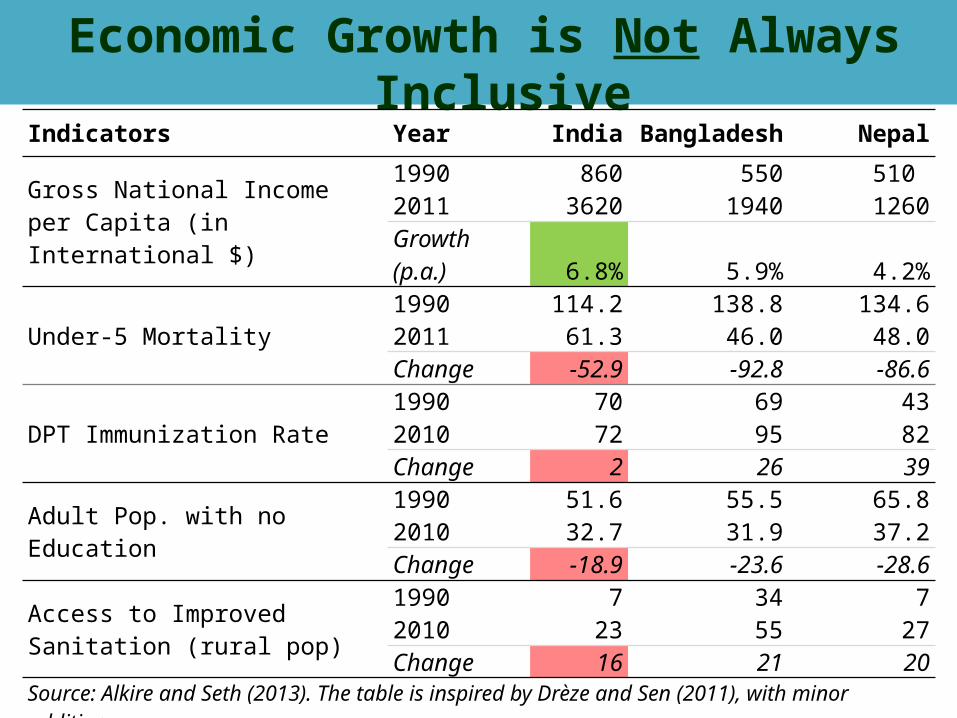
Economic Growth is Not Always Inclusive
Indicators Year India Bangladesh Nepal
Gross National Income per Capita (in International $)
1990 860 550 510 2011 3620 1940 1260Growth (p.a.) 6.8% 5.9% 4.2%
Under-5 Mortality1990 114.2 138.8 134.62011 61.3 46.0 48.0Change -52.9 -92.8 -86.6
DPT Immunization Rate1990 70 69 432010 72 95 82Change 2 26 39
Adult Pop. with no Education1990 51.6 55.5 65.82010 32.7 31.9 37.2Change -18.9 -23.6 -28.6
Access to Improved Sanitation (rural pop)
1990 7 34 72010 23 55 27Change 16 21 20
Source: Alkire and Seth (2013). The table is inspired by Drèze and Sen (2011), with minor additions.
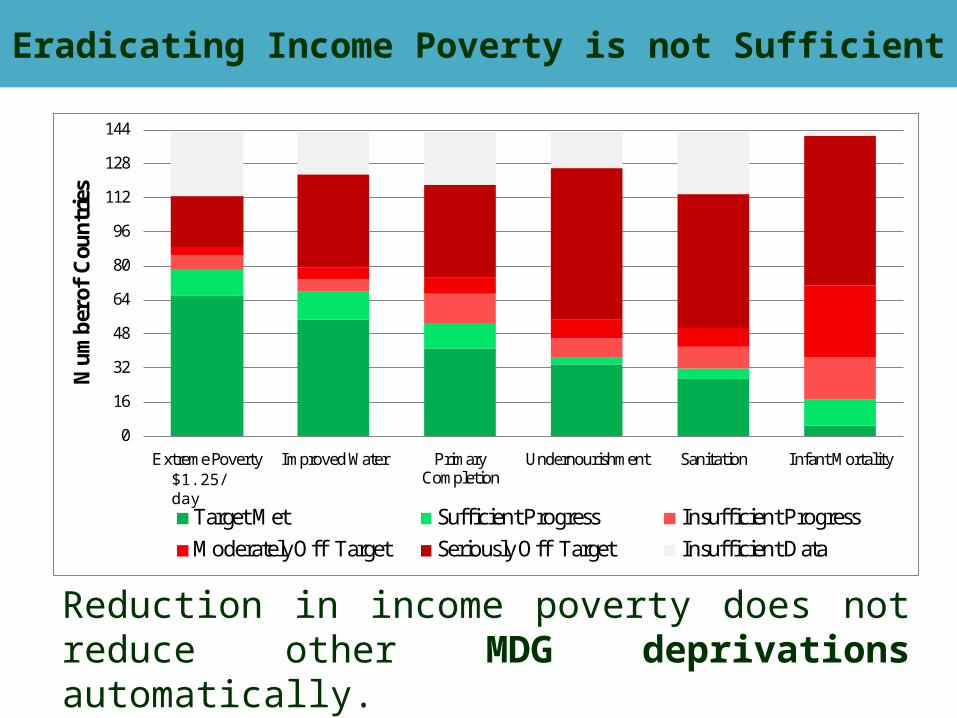
Eradicating Income Poverty is not Sufficient
Reduction in income poverty does not reduce other MDG deprivations automatically. Source: World Bank Data & Global Monitoring Report Progress Status, 2013
0
16
32
48
64
80
96
112
128
144
Extreme Poverty Improved Water Primary Completion
Undernourishment Sanitation Infant Mortality
Num
ber o
f Cou
ntries
Target Met Sufficient Progress Insufficient Progress
Moderately Off Target Seriously Off Target Insufficient Data
$1.25/day
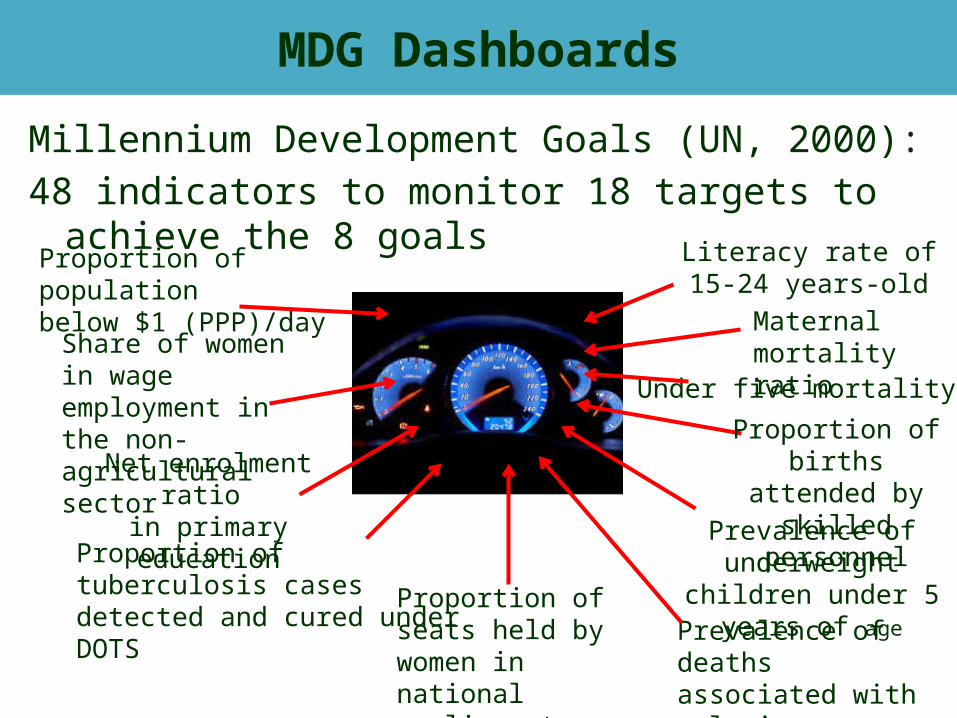
MDG Dashboards
Millennium Development Goals (UN, 2000):
48 indicators to monitor 18 targets to achieve the 8 goals
Proportion of population below $1 (PPP)/day
Prevalence of underweight children under 5 years of age
Net enrolment ratio in primary education
Literacy rate of 15-24 years-old
Share of women in wage employment in the non-agricultural sector
Proportion of seats held by women in national parliament
Maternal mortality ratio
Under five mortality rate
Prevalence of deaths associated with malaria
Proportion of tuberculosis cases detected and cured under DOTS
Proportion of births attended by skilled personnel
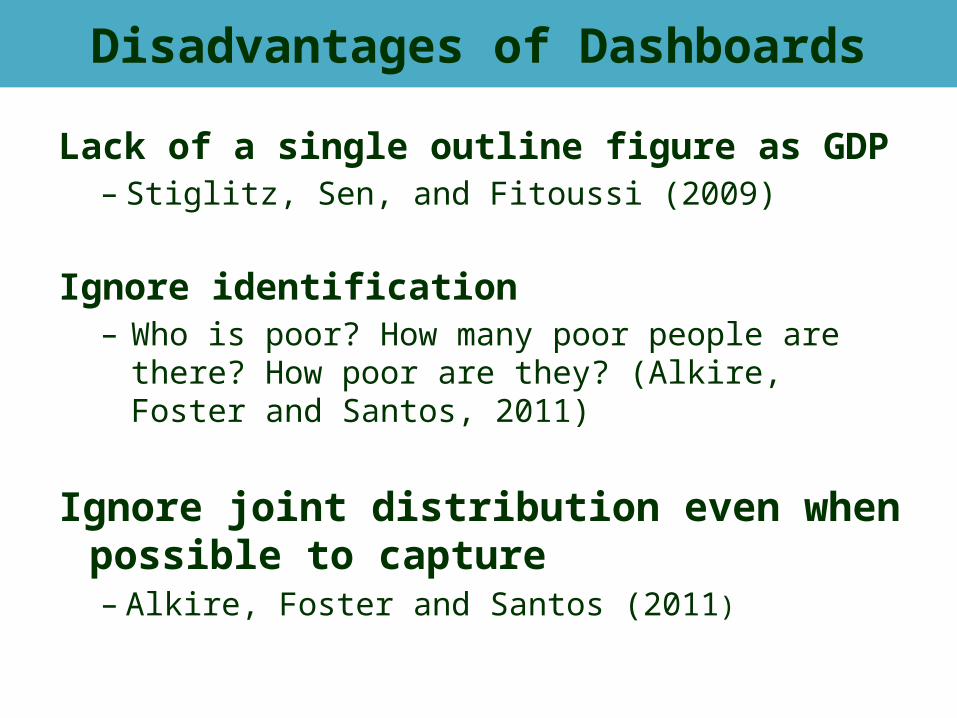
Disadvantages of Dashboards
Lack of a single outline figure as GDP – Stiglitz, Sen, and Fitoussi (2009)
Ignore identification– Who is poor? How many poor people are there? How
poor are they? (Alkire, Foster and Santos, 2011)
Ignore joint distribution even when possible to capture– Alkire, Foster and Santos (2011)
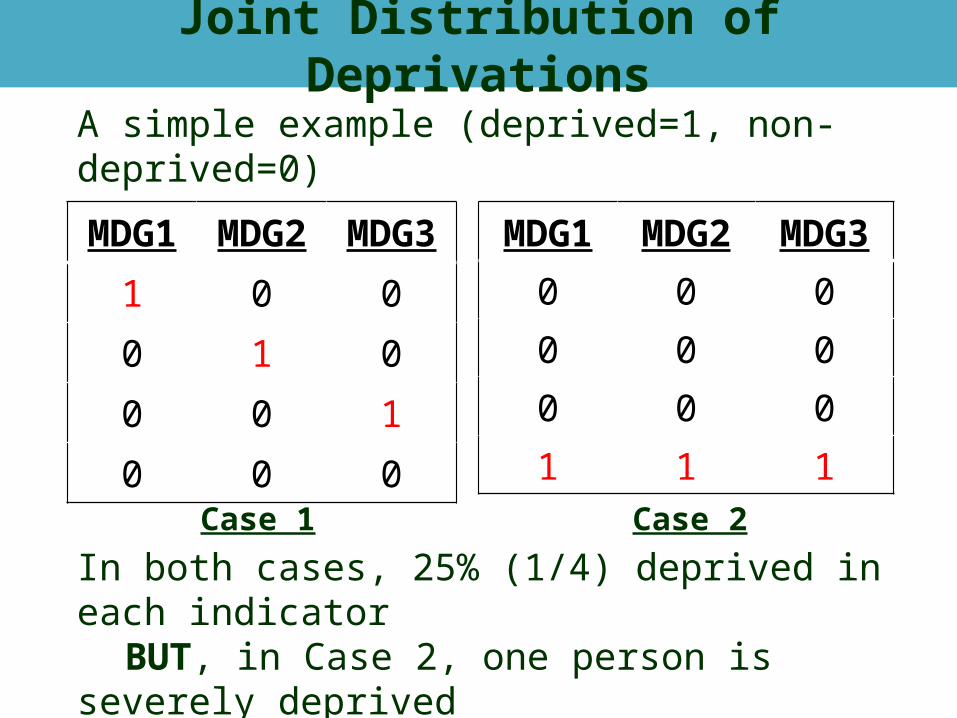
Joint Distribution of Deprivations
MDG1 MDG2 MDG3
1 0 0
0 1 0
0 0 1
0 0 0
A simple example (deprived=1, non-deprived=0)
MDG1 MDG2 MDG3
0 0 0
0 0 0
0 0 0
1 1 1
Case 1 Case 2
In both cases, 25% (1/4) deprived in each indicatorBUT, in Case 2, one person is severely deprived
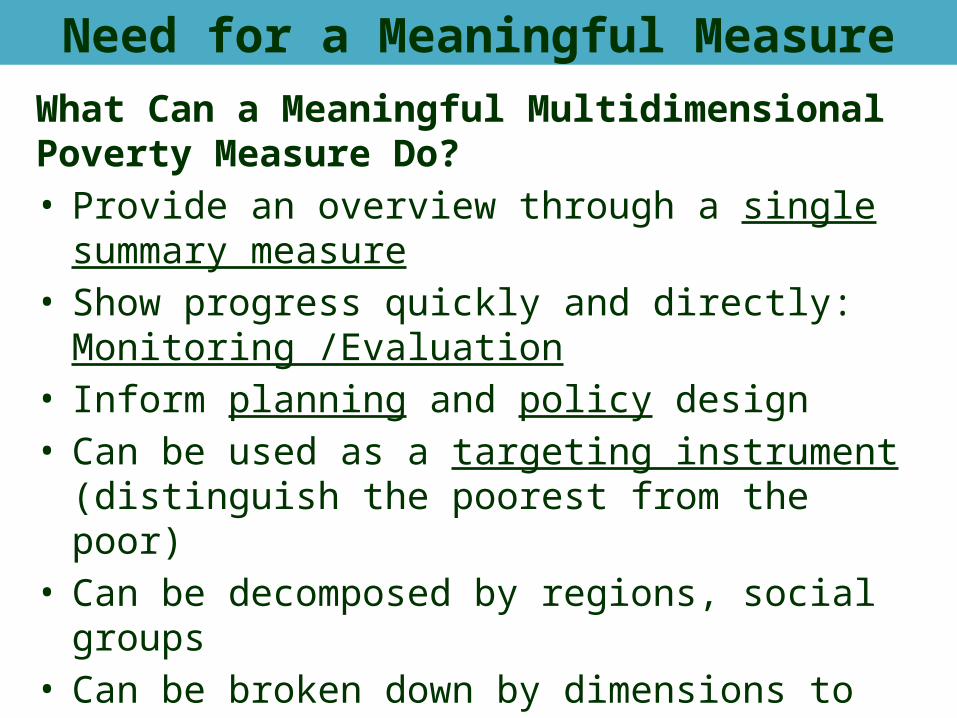
Need for a Meaningful Measure
What Can a Meaningful Multidimensional Poverty Measure Do?• Provide an overview through a single summary measure• Show progress quickly and directly: Monitoring
/Evaluation• Inform planning and policy design• Can be used as a targeting instrument (distinguish the
poorest from the poor)• Can be decomposed by regions, social groups• Can be broken down by dimensions to see contributions
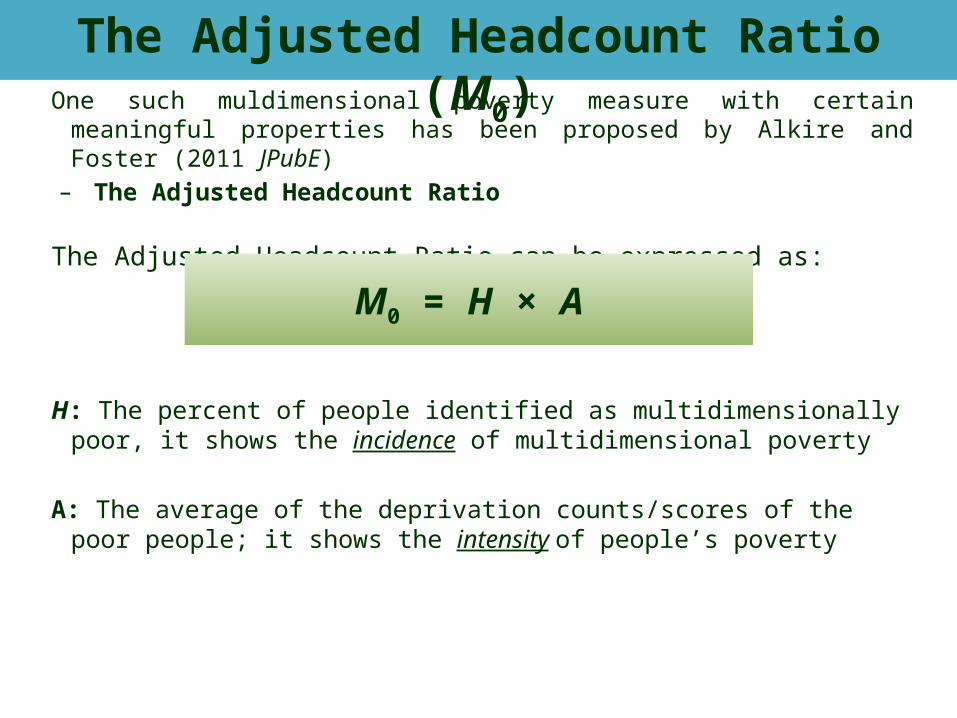
The Adjusted Headcount Ratio (M0)One such muldimensional poverty measure with certain meaningful
properties has been proposed by Alkire and Foster (2011 JPubE)– The Adjusted Headcount Ratio
The Adjusted Headcount Ratio can be expressed as:
H: The percent of people identified as multidimensionally poor, it shows the incidence of multidimensional poverty
A: The average of the deprivation counts/scores of the poor people; it shows the intensity of people’s poverty
M0 = H × A
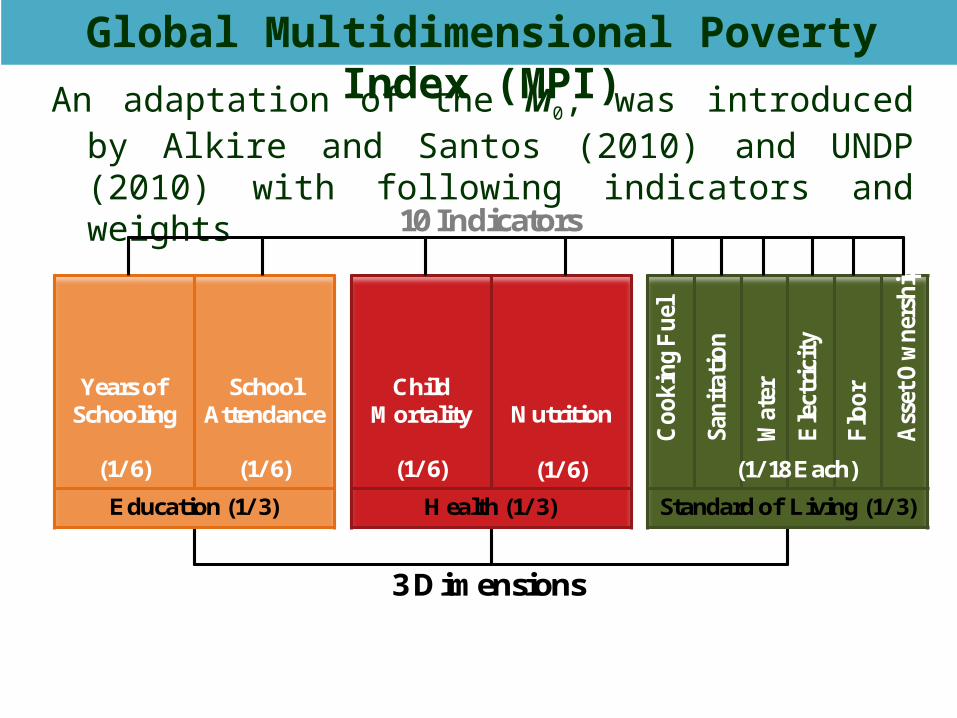
Global Multidimensional Poverty Index (MPI)
An adaptation of the M0, was introduced by Alkire and Santos (2010) and UNDP (2010) with following indicators and weights
3 Dimensions
10 Indicators
Years of Schooling
(1/ 6)
School Attendance
(1/ 6)
Education (1/ 3)
Child Mortality
(1/ 6)
Nutrition
(1/ 6)
Health (1/ 3) Standard of Living (1/ 3)
Coo
king
Fue
l
Sani
tation
Wat
er
Ele
ctrici
ty
Flo
or
Ass
et O
wne
rshi
p
(1/ 18 Each)
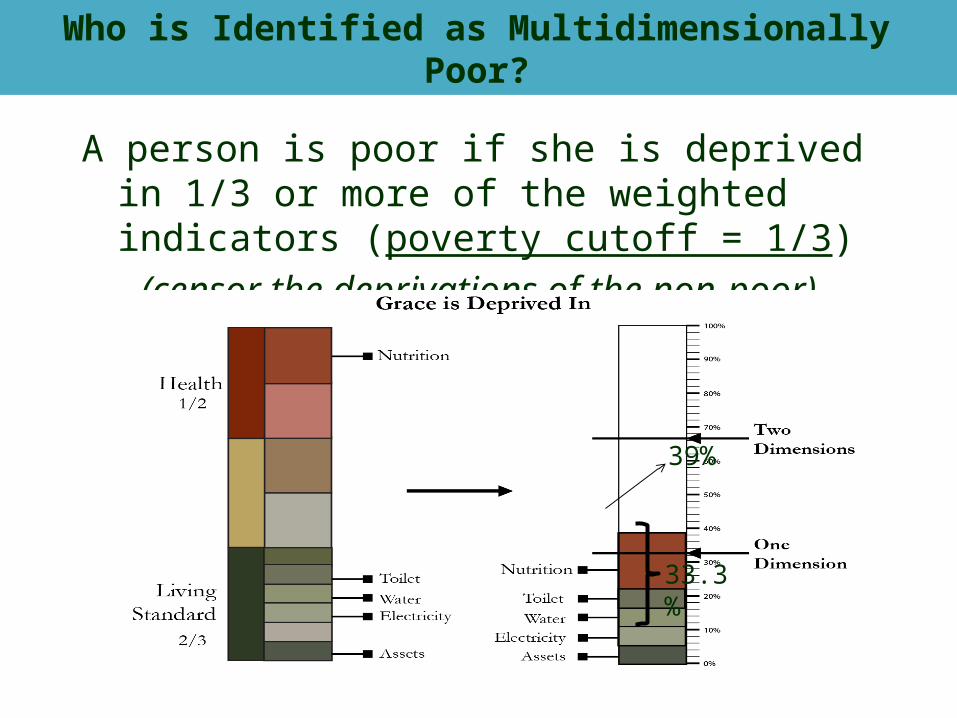
Who is Identified as Multidimensionally Poor?
A person is poor if she is deprived in 1/3 or more of the weighted indicators (poverty cutoff = 1/3)
(censor the deprivations of the non-poor)
33.3%
39%
0%
10%
20%
30%
40%
50%
60%
70%
80%
90%
100%
Nig
erE
thio
pia
Mal
iBu
rund
iBu
rkin
a Fa
soLi
beria
Gui
nea
Som
alia
Moz
ambi
que
Sier
ra L
eone
Sene
gal
DR
Cong
oBe
nin
Uga
nda
Rwan
daTi
mor
-Les
teM
adag
asca
rM
alaw
iTa
nzan
iaZ
ambi
aCh
adM
aurit
ania
Cote
d'Iv
oire
Gam
bia
Bang
lade
shH
aiti
Togo
Nig
eria
Indi
aCa
mer
oon
Yem
enPa
kist
anK
enya
Lao
Cam
bodi
aN
epal
Repu
blic
of C
ongo
Nam
ibia
Zim
babw
eLe
soth
oSa
o To
me
and
Prin
cipe
Hon
dura
sG
hana
Van
uatu
Djib
outi
Nic
arag
uaBh
utan
Gua
tem
ala
Indo
nesi
aBo
livia
Swaz
iland
Tajik
ista
nM
ongo
liaPe
ruIra
qPh
ilipp
ines
Sout
h A
frica
Para
guay
Chin
aM
oroc
coSu
rinam
eG
uyan
aE
ston
iaTu
rkey
Egy
ptTr
inid
ad a
nd T
obag
oBe
lize
Syria
n A
rab
Repu
blic
Colo
mbi
aSr
i Lan
kaA
zerb
aija
nM
aldi
ves
Kyr
gyzs
tan
Dom
inic
an R
epub
licH
unga
ryCr
oatia
Vie
t Nam
Mex
ico
Czec
h Re
publ
icA
rgen
tina
Tuni
sia
Braz
ilJo
rdan
Uzb
ekis
tan
Ecu
ador
Ukr
aine
Mac
edon
iaM
oldo
vaU
rugu
ayTh
aila
ndLa
tvia
Mon
tene
gro
Pale
stin
ian
Terri
torie
sA
lban
iaRu
ssia
n Fe
dera
tion
Serb
iaBo
snia
and
Her
zego
vina
Geo
rgia
Kaz
akhs
tan
Uni
ted
Ara
b E
mira
tes
Arm
enia
Bela
rus
Slov
enia
Slov
akia
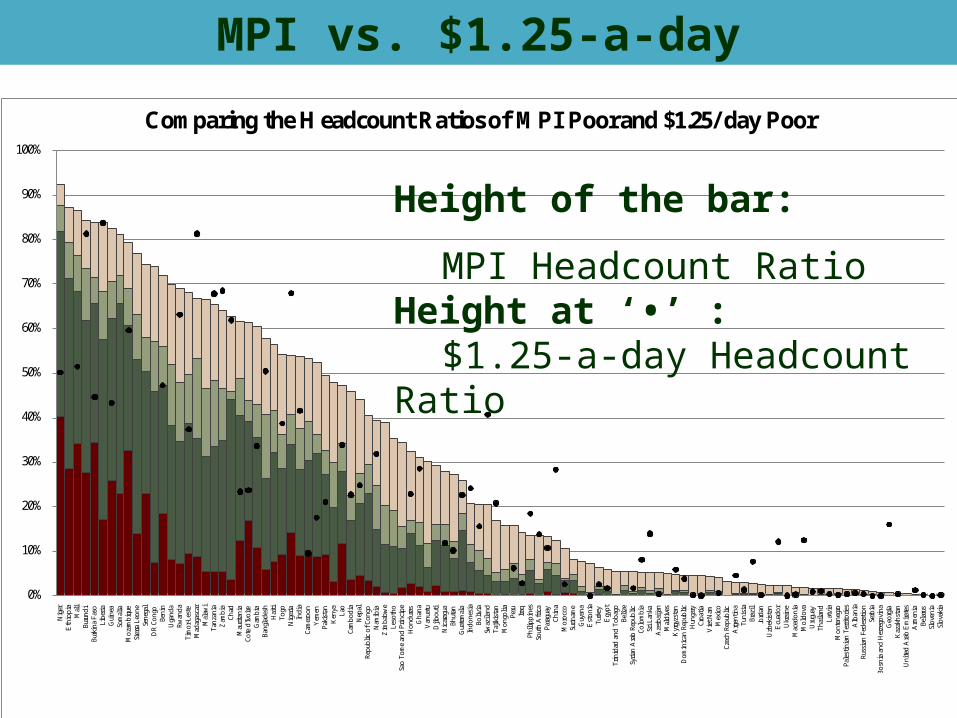
Comparing the Headcount Ratios of MPI Poor and $1.25/ day Poor
Intensity 69.4% & More Intensity 50-69.4% Intensity 44.4-50% Intensity 33.3-44.4% $1.25 a day
MPI vs. $1.25-a-day
Height of the bar:
MPI Headcount RatioHeight at ‘•’ :
$1.25-a-day Headcount Ratio
How Can MPI Help?
• Can reflect on joint distribution of deprivations
• National MPIs can be tailored to context & priorities
• National MPI can be reported like national income poverty measure
• Political incentives from MPI are more direct
• Data needs: Global MPI uses only 39 of 625 questions in Demographic Health Survey
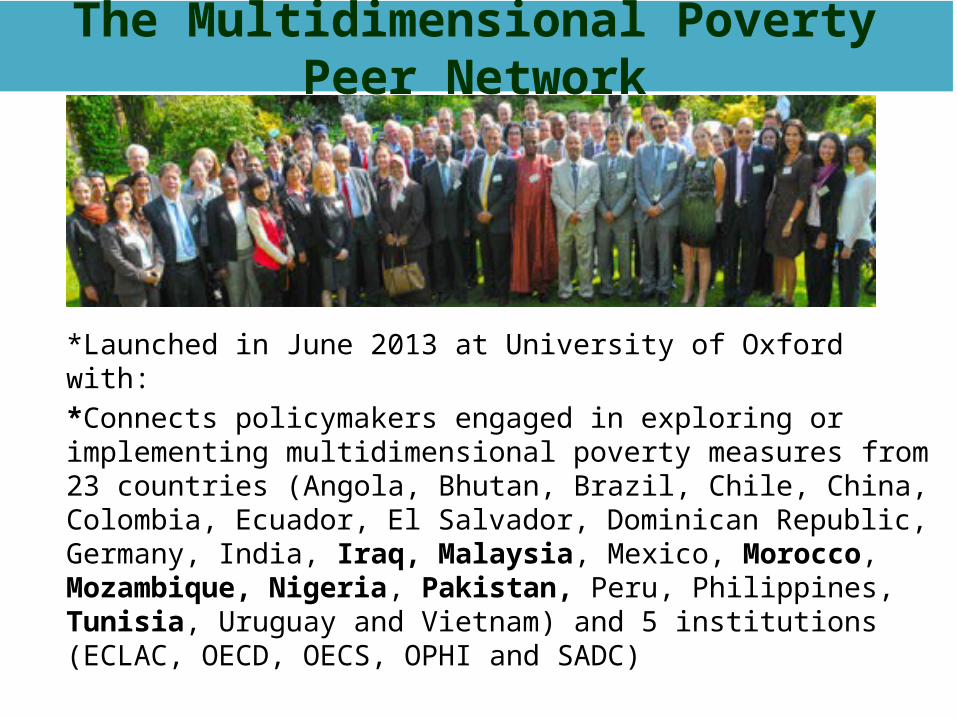
The Multidimensional Poverty Peer Network
*Launched in June 2013 at University of Oxford with:
*Connects policymakers engaged in exploring or implementing multidimensional poverty measures from 23 countries (Angola, Bhutan, Brazil, Chile, China, Colombia, Ecuador, El Salvador, Dominican Republic, Germany, India, Iraq, Malaysia, Mexico, Morocco, Mozambique, Nigeria, Pakistan, Peru, Philippines, Tunisia, Uruguay and Vietnam) and 5 institutions (ECLAC, OECD, OECS, OPHI and SADC)
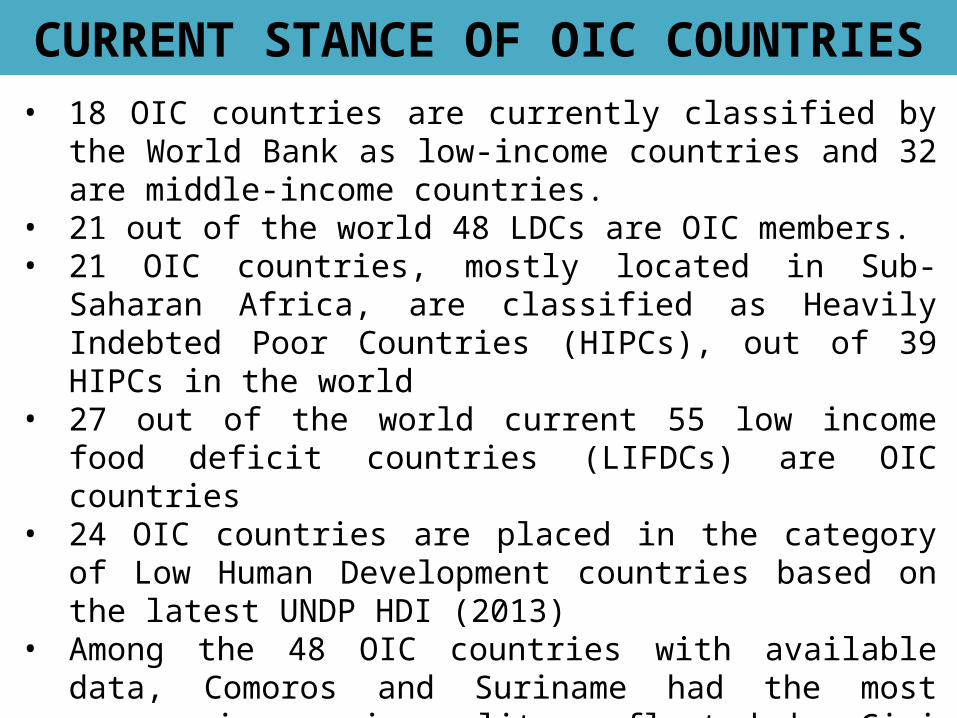
CURRENT STANCE OF OIC COUNTRIES• 18 OIC countries are currently classified by the World Bank as
low-income countries and 32 are middle-income countries. • 21 out of the world 48 LDCs are OIC members. • 21 OIC countries, mostly located in Sub-Saharan Africa, are
classified as Heavily Indebted Poor Countries (HIPCs), out of 39 HIPCs in the world
• 27 out of the world current 55 low income food deficit countries (LIFDCs) are OIC countries
• 24 OIC countries are placed in the category of Low Human Development countries based on the latest UNDP HDI (2013)
• Among the 48 OIC countries with available data, Comoros and Suriname had the most severe income inequality reflected by Gini coefficients of 64.3 and 52.9, respectively. The income inequality in 15 of the member countries were measured to be “high”(GI between 40-49.9) while 29 of them were placed within medium inequality group (GI between 30-39.9).
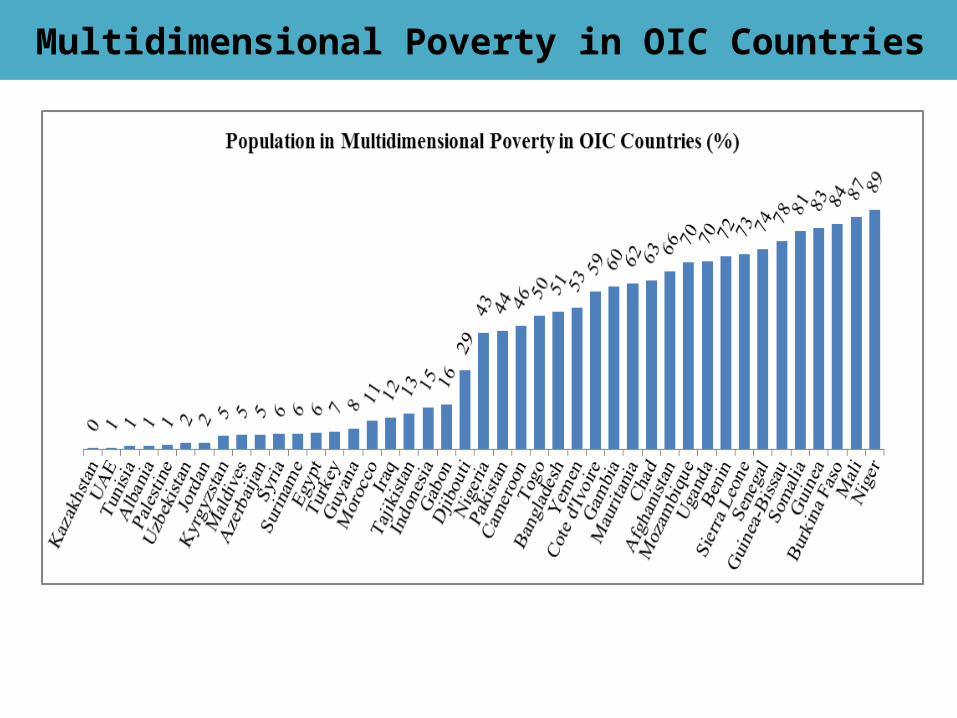
Multidimensional Poverty in OIC Countries
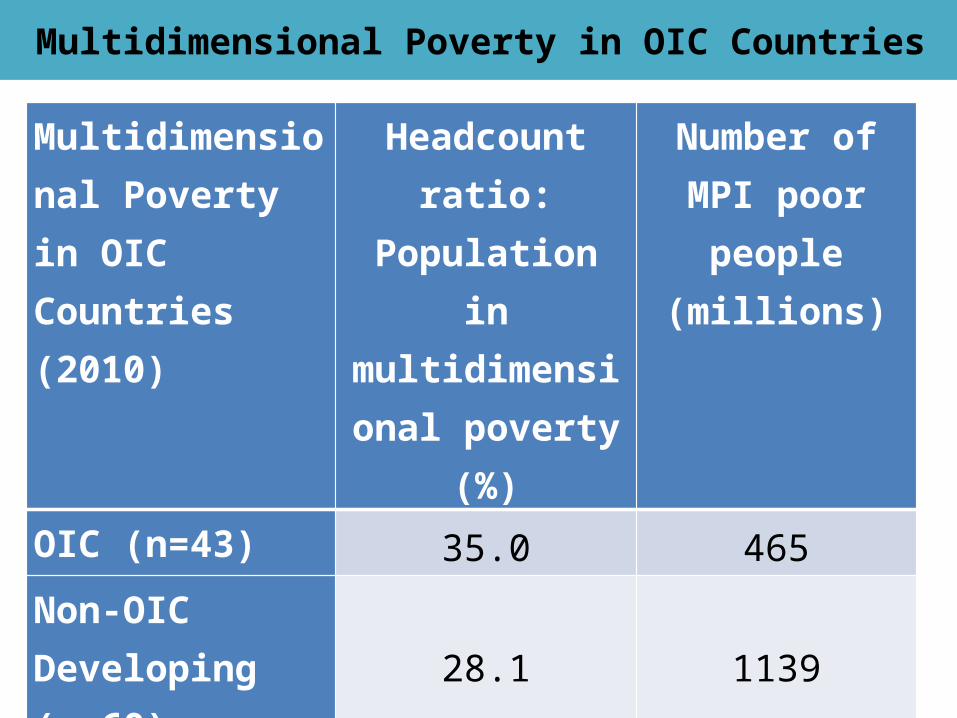
Multidimensional Poverty in OIC Countries
Multidimensional Poverty in OIC Countries (2010)
Headcount ratio: Population in
multidimensional poverty (%)
Number of MPI poor people (millions)
OIC (n=43) 35.0 465
Non-OIC Developing (n=60) 28.1 1139
Developed (n=5) 2.1 0.45
World (n=108) 29.7 1604
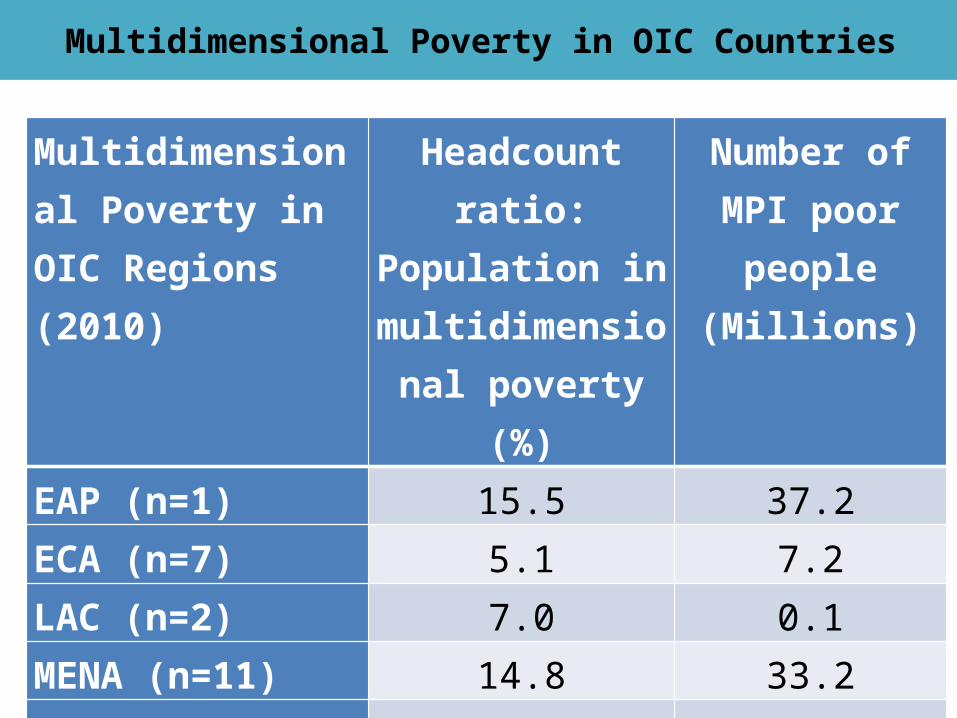
Multidimensional Poverty in OIC Countries
Multidimensional Poverty in OIC Regions (2010)
Headcount ratio: Population in
multidimensional poverty (%)
Number of MPI poor people (Millions)
EAP (n=1) 15.5 37.2ECA (n=7) 5.1 7.2LAC (n=2) 7.0 0.1MENA (n=11) 14.8 33.2SA(n=4) 48.9 172.8SSA (n=18) 58.3 214.5
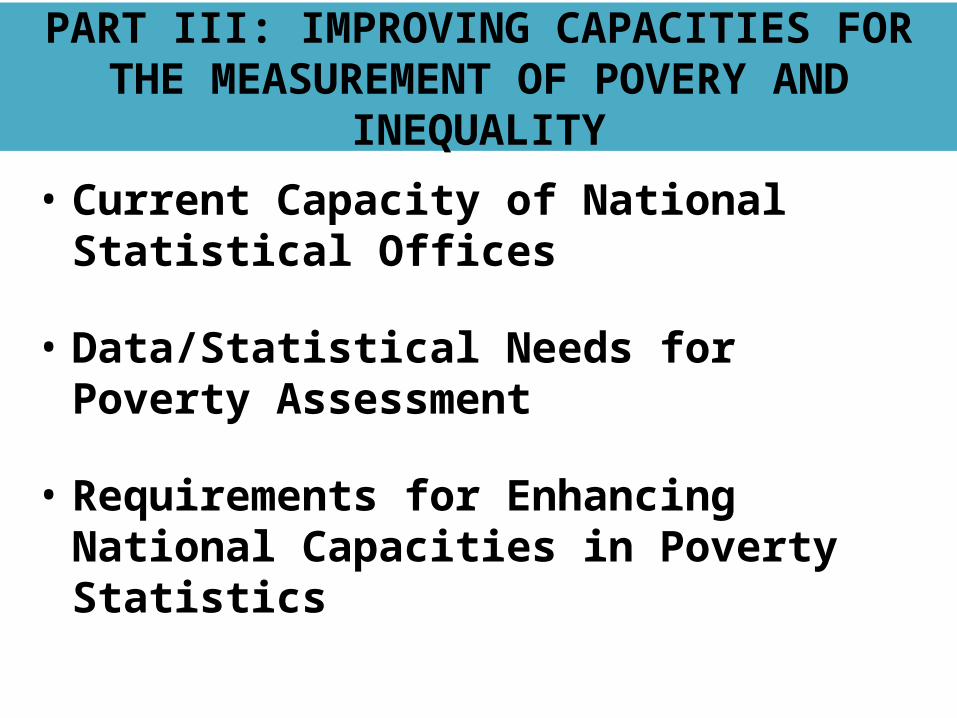
PART III: IMPROVING CAPACITIES FOR THE MEASUREMENT OF POVERY AND
INEQUALITY
• Current Capacity of National Statistical Offices
• Data/Statistical Needs for Poverty Assessment
• Requirements for Enhancing National Capacities in Poverty Statistics
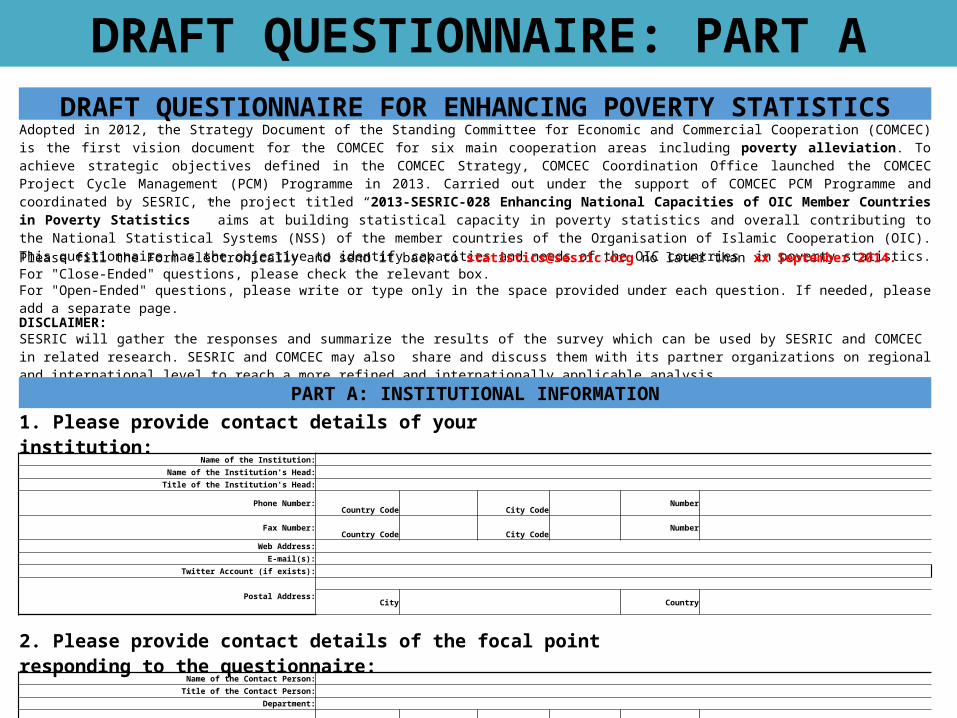
DRAFT QUESTIONNAIRE: PART ADRAFT QUESTIONNAIRE FOR ENHANCING POVERTY STATISTICS
Adopted in 2012, the Strategy Document of the Standing Committee for Economic and Commercial Cooperation (COMCEC) is the first vision document for the COMCEC for six main cooperation areas including poverty alleviation. To achieve strategic objectives defined in the COMCEC Strategy, COMCEC Coordination Office launched the COMCEC Project Cycle Management (PCM) Programme in 2013. Carried out under the support of COMCEC PCM Programme and coordinated by SESRIC, the project titled “2013-SESRIC-028 Enhancing National Capacities of OIC Member Countries in Poverty Statistics ” aims at building statistical capacity in poverty statistics and overall contributing to the National Statistical Systems (NSS) of the member countries of the Organisation of Islamic Cooperation (OIC). This questionnaire has the objective to identify capacities and needs of the OIC countries in poverty statistics.
Please fill the Form electronically and send it back to [email protected] no later than xx September 2014.For "Close-Ended" questions, please check the relevant box.
For "Open-Ended" questions, please write or type only in the space provided under each question. If needed, please add a separate page.
DISCLAIMER:
SESRIC will gather the responses and summarize the results of the survey which can be used by SESRIC and COMCEC in related research. SESRIC and COMCEC may also share and discuss them with its partner organizations on regional and international level to reach a more refined and internationally applicable analysis.
PART A: INSTITUTIONAL INFORMATION
1. Please provide contact details of your institution:Name of the Institution:
Name of the Institution's Head: Title of the Institution's Head:
Phone Number:Country Code City Code
Number
Fax Number:Country Code City Code
Number
Web Address: E-mail(s):
Twitter Account (if exists):
Postal Address:
City
Country
2. Please provide contact details of the focal point responding to the questionnaire:Name of the Contact Person:
Title of the Contact Person: Department:
Phone Number:Country Code City Code
Number
Fax Number:Country Code City Code
Number
E-mail(s):
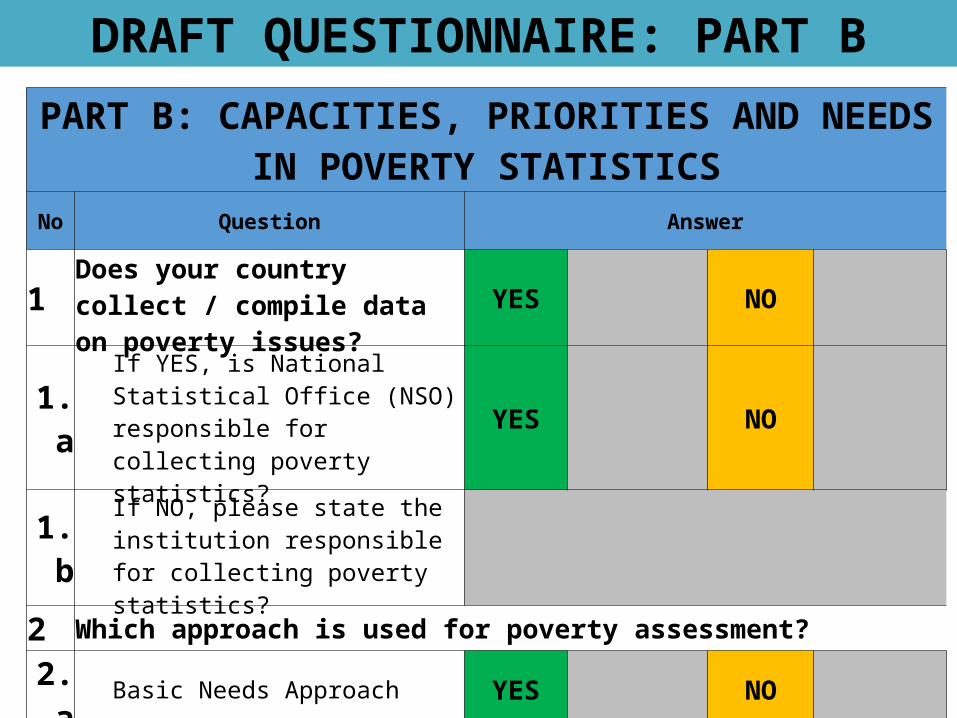
DRAFT QUESTIONNAIRE: PART B
PART B: CAPACITIES, PRIORITIES AND NEEDS IN POVERTY STATISTICS
No Question Answer
1 Does your country collect / compile data on poverty issues?
YES NO
1.aIf YES, is National Statistical Office (NSO) responsible for collecting poverty statistics?
YES NO
1.bIf NO, please state the institution responsible for collecting poverty statistics?
2 Which approach is used for poverty assessment?
2.a Basic Needs Approach YES NO
2.b Unmet Basic Needs Approach YES NO
2.c Other (please specify)
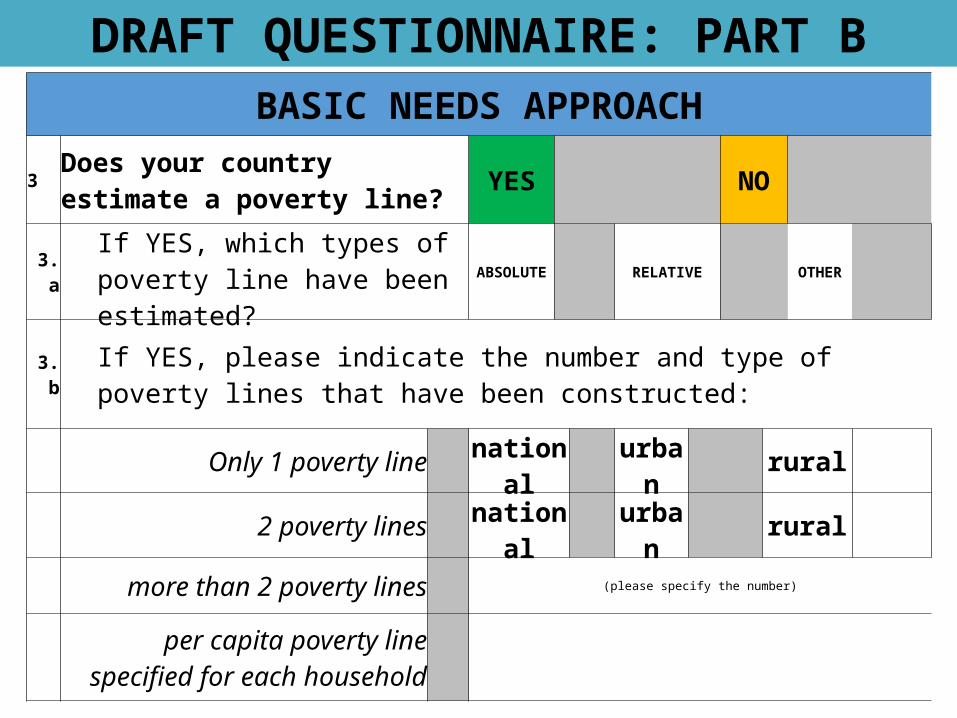
DRAFT QUESTIONNAIRE: PART BBASIC NEEDS APPROACH
3Does your country estimate a poverty line?
YES NO
3.aIf YES, which types of poverty line have been estimated?
ABSOLUTE RELATIVE OTHER
3.bIf YES, please indicate the number and type of poverty lines that have been constructed:
Only 1 poverty line national urban rural
2 poverty lines national urban rural
more than 2 poverty lines (please specify the number)
per capita poverty line specified
for each household
DRAFT QUESTIONNAIRE: PART B
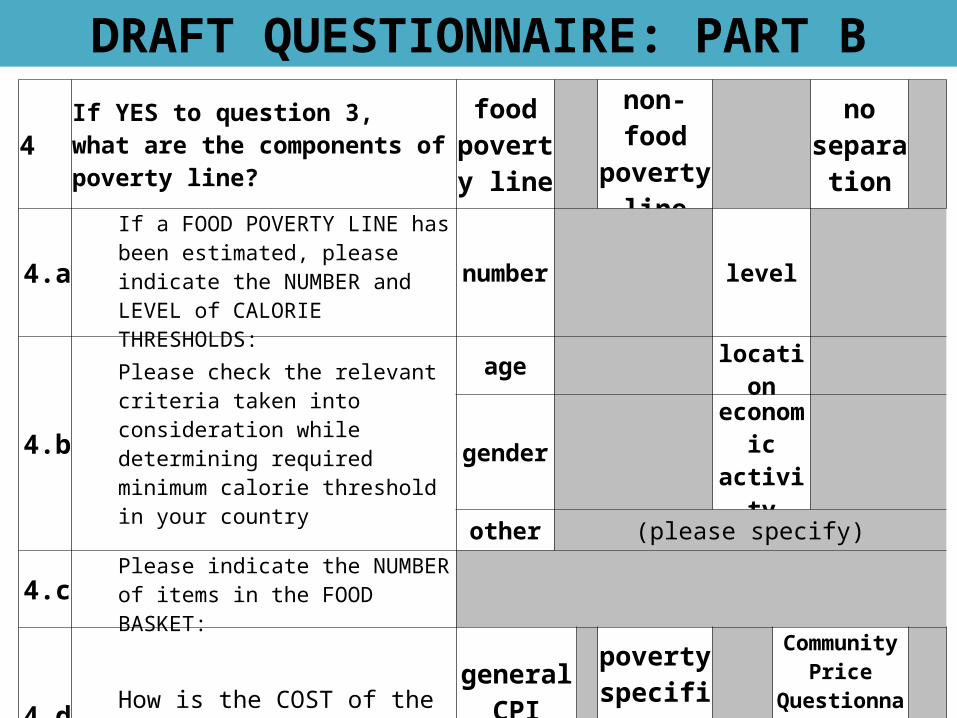
4 If YES to question 3, what are the components of poverty line?
food poverty
line
non- food poverty
line
no separati
on
4.a
If a FOOD POVERTY LINE has been estimated, please indicate the NUMBER and LEVEL of CALORIE THRESHOLDS:
number level
4.b
Please check the relevant criteria taken into consideration while determining required minimum calorie threshold in your country
age location
gender economic activity
other (please specify)
4.c Please indicate the NUMBER of items in the FOOD BASKET:
4.d How is the COST of the FOOD BASKET estimated?
general CPI
poverty specific
CPI
Community Price
Questionnaire of HH Survey
other (please specify)
4.eIf a NON-FOOD POVERTY LINE has been estimated, please indicate the method of estimation:
DIRECT INDIRECT
DRAFT QUESTIONNAIRE: PART B
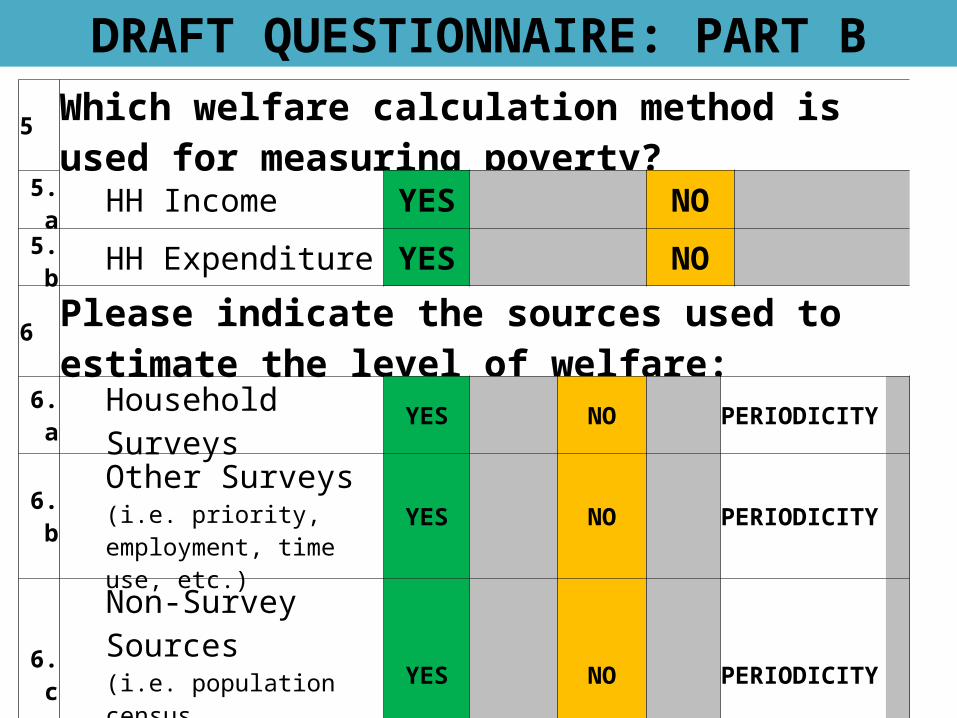
5Which welfare calculation method is used for measuring poverty?
5.a HH Income YES NO 5.b HH Expenditure YES NO
6Please indicate the sources used to estimate the level of welfare:
6.a Household Surveys YES NO PERIODICITY
6.bOther Surveys(i.e. priority, employment, time use, etc.)
YES NO PERIODICITY
6.cNon-Survey Sources(i.e. population census, administrative records, etc.)
YES NO PERIODICITY
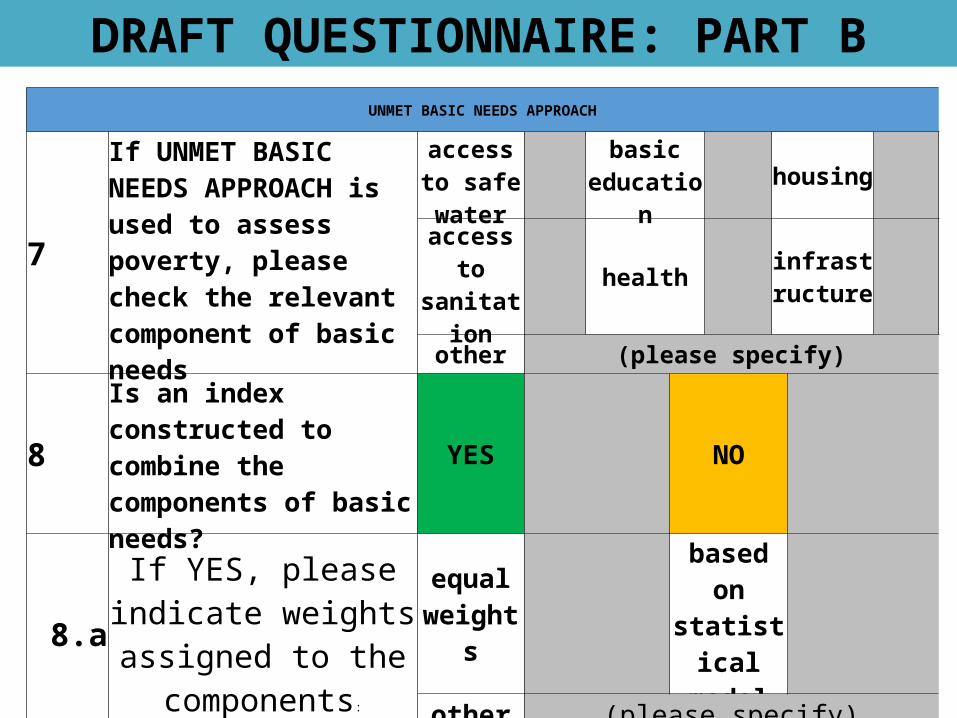
DRAFT QUESTIONNAIRE: PART BUNMET BASIC NEEDS APPROACH
7
If UNMET BASIC NEEDS APPROACH is used to assess poverty, please check the relevant component of basic needs
access to safe water
basic education housing
access to sanitation health
infrastructure
other (please specify)
8Is an index constructed to combine the components of basic needs?
YES NO
8.aIf YES, please indicate weights assigned to the
components:
equal weights
based on statistical
model
other (please specify)
9 What is the base for measuring poverty?
9.a Income YES NO
9.b Consumption YES NO
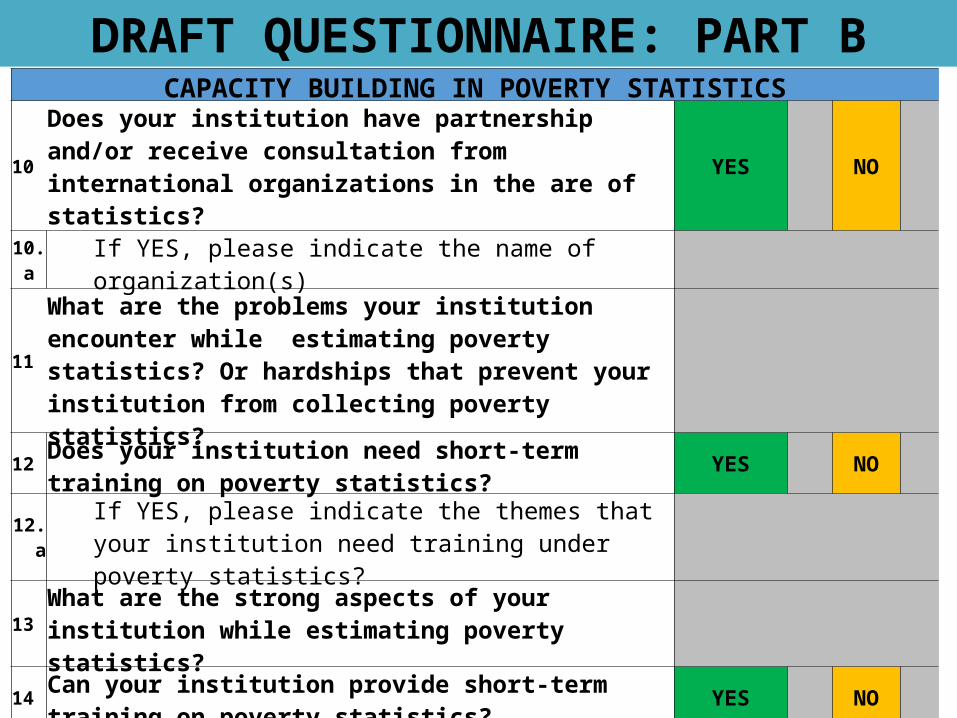
DRAFT QUESTIONNAIRE: PART BCAPACITY BUILDING IN POVERTY STATISTICS
10
Does your institution have partnership and/or receive consultation from international organizations in the are of statistics?
YES NO
10.a If YES, please indicate the name of organization(s)
11What are the problems your institution encounter while estimating poverty statistics? Or hardships that prevent your institution from collecting poverty statistics?
12Does your institution need short-term training on poverty statistics?
YES NO
12.aIf YES, please indicate the themes that your institution need training under poverty statistics?
13What are the strong aspects of your institution while estimating poverty statistics?
14Can your institution provide short-term training on poverty statistics?
YES NO
14.aIf YES, please indicate the themes that your institution can provide training under poverty statistics?
15Please specify language preference for STATCAB trainings on poverty statistics (use 1: the first, 2: second, 3: third preference)
Arabic English French
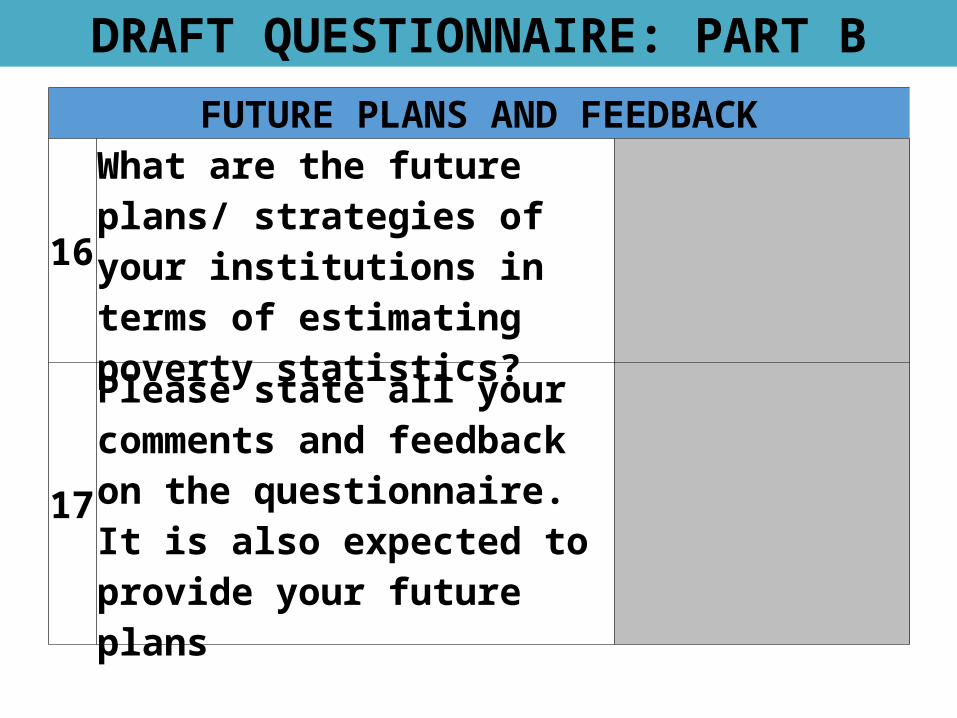
DRAFT QUESTIONNAIRE: PART B
FUTURE PLANS AND FEEDBACK
16
What are the future plans/ strategies of your institutions in terms of estimating poverty statistics?
17
Please state all your comments and feedback on the questionnaire. It is also expected to provide your future plans
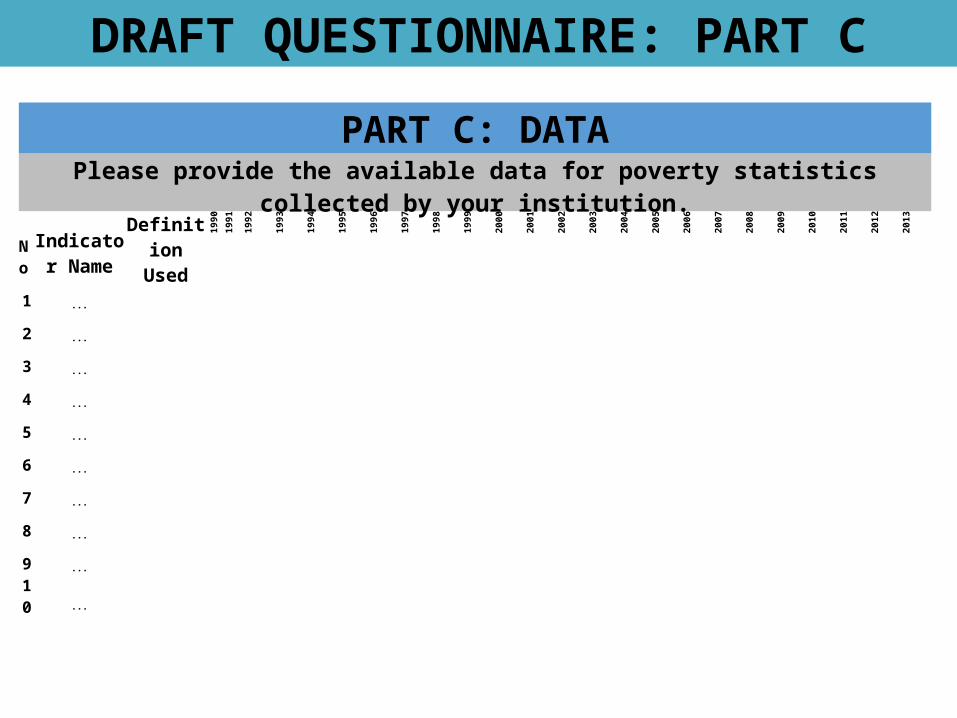
DRAFT QUESTIONNAIRE: PART C
PART C: DATAPlease provide the available data for poverty statistics collected by your institution.
No
Indicator Name
Definition Used
1990
1991 1992 1993 1994 1995 1996 1997 1998 1999 2000 2001 2002 2003 2004 2005 2006 2007 2008 2009 2010 2011 2012 2013
1 ...
2 ...
3 ...
4 ...
5 ...
6 ...
7 ...
8 ...
9 ...
10 ...
THANK YOU!
www.sesric.orgwww.oicstatcom.org
Related Documents