End of Year Revision Packet Mathematics – Level J Page 1 of 46 SABIS® Proprietary SABIS ® School Network Mathematics Level J / Grade 8 End of Year Revision Packet Highlights: Extend the definition of rational numbers to include negative numbers. Convert between mixed numbers and improper fractions. Express rational numbers as decimals and as fractions. Locate a rational number between 0 and 1 on a number line. Generate equivalent fractions. Add and subtract rational numbers / repeating decimals. Multiply and divide rational numbers. Calculate the product of two repeating decimals. Calculate the square of a rational number. Compute the quotient of two fractions or mixed numerals. Simplify complex fractions. Divide repeating decimals. Simplify numerical expressions involving rational numbers. Describe ratios in different forms. Write a ratio of three mixed numerals as a ratio of three whole numbers. Decide whether ratios form a proportion. Apply the cross product property. Express the parts in a ratio as percentages. Find the ratio of two or more parts given the percentage. Find the decimal expansion. Express a rational number as the ratio of two integers. Find the square root and cube root of a given number. Determine two consecutive integers between which the square root or the cube root of a number lies. Find an approximate value of a given irrational number and locate it between two numbers. Compare irrational numbers. Locate the approximate position of an irrational number on a number line. Solve the equation x 2 = c and x 3 = c. Express the prime factorization of a number in exponent form. Simplify an expression with negative or zero exponents. Apply order of operations. Complete patterns involving exponents. Multiply and divide integer exponents. Write numbers in scientific notation. Compute the product, quotient, sum, and difference of numbers in scientific notation. Compare numbers in scientific notation.

Welcome message from author
This document is posted to help you gain knowledge. Please leave a comment to let me know what you think about it! Share it to your friends and learn new things together.
Transcript
End of Year Revision Packet Mathematics – Level J Page 1 of 46
SABIS® Proprietary
SABIS® School Network Mathematics
Level J / Grade 8
End of Year Revision Packet
Highlights:
Extend the definition of rational numbers to include negative numbers.
Convert between mixed numbers and improper fractions.
Express rational numbers as decimals and as fractions.
Locate a rational number between 0 and 1 on a number line.
Generate equivalent fractions.
Add and subtract rational numbers / repeating decimals.
Multiply and divide rational numbers.
Calculate the product of two repeating decimals.
Calculate the square of a rational number.
Compute the quotient of two fractions or mixed numerals.
Simplify complex fractions.
Divide repeating decimals.
Simplify numerical expressions involving rational numbers.
Describe ratios in different forms.
Write a ratio of three mixed numerals as a ratio of three whole numbers.
Decide whether ratios form a proportion.
Apply the cross product property.
Express the parts in a ratio as percentages.
Find the ratio of two or more parts given the percentage.
Find the decimal expansion.
Express a rational number as the ratio of two integers.
Find the square root and cube root of a given number.
Determine two consecutive integers between which the square root or the cube root of a
number lies.
Find an approximate value of a given irrational number and locate it between two numbers.
Compare irrational numbers.
Locate the approximate position of an irrational number on a number line.
Solve the equation x2 = c and x3 = c.
Express the prime factorization of a number in exponent form.
Simplify an expression with negative or zero exponents.
Apply order of operations.
Complete patterns involving exponents.
Multiply and divide integer exponents.
Write numbers in scientific notation.
Compute the product, quotient, sum, and difference of numbers in scientific notation.
Compare numbers in scientific notation.
End of Year Revision Packet Mathematics – Level J Page 2 of 46
SABIS® Proprietary
Express units of measurements using scientific notation.
Extend the definition of exponents to a power of a power, powers of products, and powers of
quotients.
Locate points in all four quadrants of the coordinate plane.
Recognize linear and nonlinear patterns.
Use the slope formula for a straight line.
Classify slopes of straight lines as positive, negative, zero, or undefined.
Analyze proportional relationships.
Compute the proportionality constant from a pair of values of the variables and write the
corresponding equation.
Use tabular representations of proportional relationships.
Verify whether a set of points represents a proportional relationship.
Draw a graph of a proportional relationship given as a rule or in context.
Sketch and compare graphs of y = mx.
Find the equation of a line passing through the origin, given one point on the line.
Translate the proportionality constant/slope as a unit rate.
Identify equivalent rates and interpret unit rates and the reciprocal.
Compare proportional relationships from their graphs.
Compare unit rates given in different representation: table of values, graphs, rule, or context,
and interpret the results.
Analyze a linear equation in two variables.
Locate the intercepts of the graph of a linear equation.
Analyze the slope-intercept form of a straight line.
Determine whether a point belongs to a line from its equation.
Write the equation of a line given a point and the slope or two points.
Draw the graph of y = mx + c.
Analyze the effect of m and c on the graph of y = mx + c.
Graph a line whose equation is given in the general form.
Test the balance of an equation for a given value of the unknown.
Solve a linear equation with variable on one side.
Recognize the possible solution sets of a linear equation.
Recognize allowable solutions of a linear equation in a real-life situation.
Solve a linear equation with variable on both sides.
Simplify the coefficients of a linear equation.
Solve a linear equation in more than one variable.
Find the solution of systems of linear equations in two variables.
Solve graphically a linear system of two equations.
Solve systems of linear equations by substitution and elimination.
Graphically estimate the solution of a linear system of two equations.
Set up a linear system of two equations from a mathematical situation and from a real-life situation.
Compare linear equations.
End of Year Revision Packet Mathematics – Level J Page 3 of 46
SABIS® Proprietary
Distinguish relations that are functions.
Suggest a rule of a function from given input-output values.
Discover a numerical rule for a function from given input-output values.
Complete input-output tables.
Classify the relation between any two of three or more variables as a function or not.
Define a function graphically and algebraically.
Identify linear functions.
Examine a linear function by looking at its algebraic rule.
Analyze and interpret the rate of change of a linear function.
Identify a non-linear function.
Compare and contrast two linear functions.
Demonstrate knowledge of congruency among segments and angles.
Demonstrate knowledge of congruency among polygons.
Interpret the definition of a translation.
Apply the angle sum theorem.
Solve multi-step problems involving the angle sum theorem.
Apply the exterior angle theorem.
Discover pairs of corresponding angles formed by two parallel lines and a transversal.
Describe the image of a point or a polygon in a coordinate plane under a translation.
Interpret the definition of a rotation.
Apply the relationship between vertically opposite angles.
Discover pairs of interior angles formed by two parallel lines and a transversal.
Describe the image of a point in a coordinate plane under a rotation.
Interpret the definition of a reflection over a line.
Know and apply the relation between the base angles of an isosceles triangle.
Describe the image of a point in a coordinate plane under a reflection.
Produce the image of a point under a dilation in the coordinate plane.
Describe similar polygons and produce the image of a polygon under a dilation.
Define a sequence of transformations that relate two similar polygons.
Explain and apply the AA criterion for similar triangles.
Recognize and apply the metric relations in a right triangle.
Discover and solve applications of the Pythagorean Theorem.
Explain a proof of the converse of the Pythagorean Theorem and identify Pythagorean triplets.
Know and apply the distance formula in the coordinate plane.
Know the volume of a sphere, hemisphere, cylinder, hemicylinder, cone, and truncated cone.
Solve for missing parts.
Compute volumes of composite solids.
Differentiate between dependent and independent variables in a bivariate data set.
Read / Construct a scatterplot to summarize and illustrate related data sets.
End of Year Revision Packet Mathematics – Level J Page 4 of 46
SABIS® Proprietary
Analyze the existence of a trend in a scatterplot and identify positive and negative trends.
Identify outliers of a set of data points and understand their effect on the shape of the data
distribution.
Identify a linear association and discuss the properties of the relationship between two data
sets represented in a scatterplot.
Draw the line of best fit for a data set represented in a scatterplot.
Approximate an equation of the line of best fit of a data set of points represented in a
scatterplot.
Compare the relation between two data sets to a linear model and interpret the components of
the equation of the line in context.
Use the linear model to forecast an approximation of the hidden values in a set of data points.
Identify categorical data variables.
Read and interpret associated categorical data sets represented in a two-way table.
Calculate relative frequencies to compare categories and to make inferences about data sets.
End of Year Revision Packet Mathematics – Level J Page 5 of 46
SABIS® Proprietary
Vocabulary:
Rational numbers, Integers, Positive rational number, Negative rational number, Additive
inverse, Proper fraction, Improper fraction, Mixed number, Decimal form, Terminating
decimal, Repeating decimal, Repeating string, Graphical representation, Number line,
Equivalence of fractions, Simplest form, Square of a fraction, Complex fractions, Numerical
rational expressions, Ratios, Proportions, Cross product property, Percentages
Irrational numbers, Decimal expansion, Square roots, Perfect square, Cube roots, Equation,
Non-terminating non-repeating decimals, Non-terminating repeating decimals, Rational
approximations of irrational numbers, Factors, Properties of exponents, Integer exponents,
Exponent form, Prime factorization, Negative bases, Zero and negative exponents, Order of
operations, Scientific notation, Standard form, Standard notation, Units of measurement,
Prefix, Powers, Index
Coordinate plane, Quadrants, Linear patterns, Nonlinear patterns, Similarity of triangles,
Slope, Slope formula, Straight line, Positive and negative slopes, Proportional relationship,
Proportional constant, Tabular representation, Graph, Unit rate, Horizontal line, Vertical line,
Slope-intercept form, y-intercept, x-intercept, Rate of change, General form, Axes
Linear equations, Variable, Algebraic sentence, Unknown, LHS, RHS, Balance method,
Solutions, Solution set, Equivalent, Additive inverse, Multiplicative inverse, Rational
coefficients, Fractional coefficients, Distributive property, Like terms, Unique solution,
Infinitely many solutions, No solution, Rejected solutions, Common factors
System of linear equations in two variables, Point of intersection, Solution of a system of
linear equations, Graphical solution, Substitution method, Elimination method, Mathematical
applications, Real-life applications, Comparing linear equations, Comparing plans
Relations, Functions, Input, Output, Rule of a function, Ordered pairs, Input-output tables,
Linear functions, Rate of change, Nonlinear functions
Congruent line segments, Congruent angles, Congruency properties of line segments and
angles, Congruent polygons, Translation, Angle sum theorem, Exterior angle theorem,
Parallel lines and transversals, Rotation, Vertically opposite angles, Reflection, Base angles of
an isosceles triangle
Dilation, Similar, Reflexive property, Symmetric property, Transitive property, AA criterion,
Pythagorean theorem, Converse of Pythagorean theorem, Pythagorean triplet, Distance
formula
Sphere, Hemisphere, Cylinder, Hemicylinder, Cone, Truncated cone
Bivariate data, Independent variable, Dependent variable, Scatterplot, Association, Linear
association, Nonlinear association, Positive association, Negative association, Outliers, Line
of best fit, Linear model, Categorical variables, Relative frequencies
End of Year Revision Packet Mathematics – Level J Page 6 of 46
SABIS® Proprietary
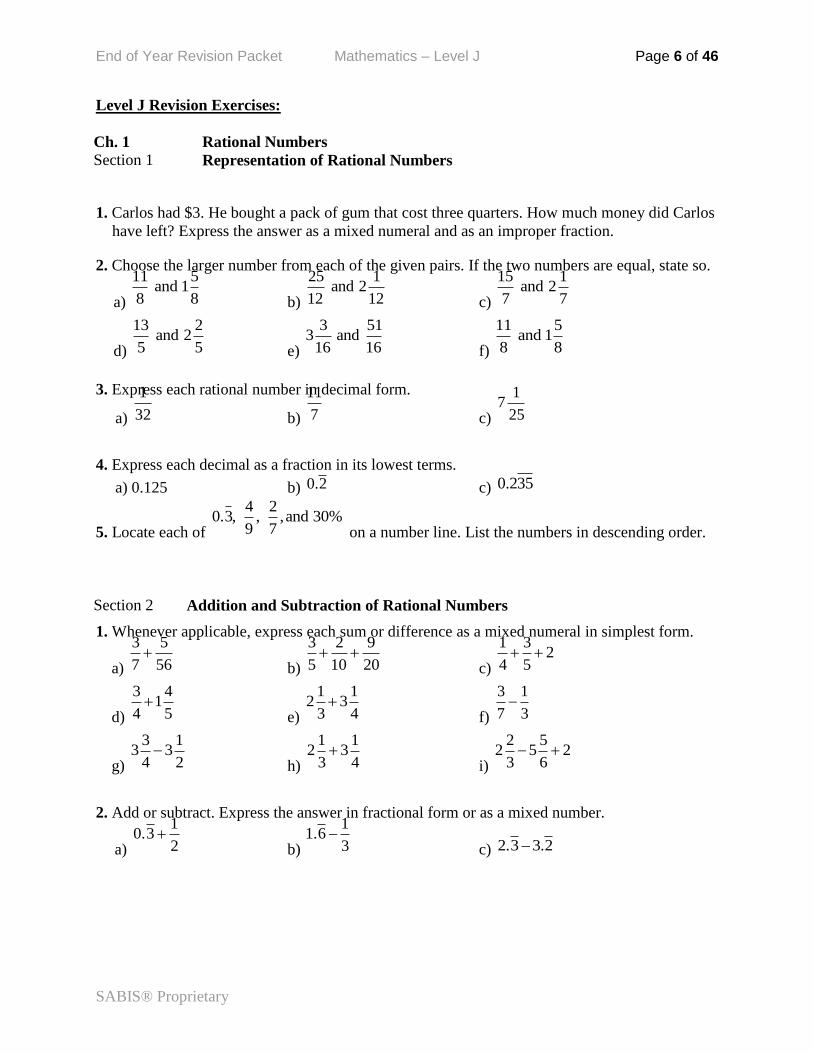
Level J Revision Exercises:
Ch. 1 Rational Numbers Section 1 Representation of Rational Numbers
1. Carlos had $3. He bought a pack of gum that cost three quarters. How much money did Carlos
have left? Express the answer as a mixed numeral and as an improper fraction.
2. Choose the larger number from each of the given pairs. If the two numbers are equal, state so.
a)
11 5 and 1
8 8 b)
25 1 and 2
12 12 c)
15 1 and 2
7 7
d)
13 2 and 2
5 5 e)
3 513 and
16 16 f)
11 5 and 1
8 8
3. Express each rational number in decimal form.
a)
1
32 b)
11
7 c)
17
25
4. Express each decimal as a fraction in its lowest terms.
a) 0.125 b) 0.2 c) 0.235
5. Locate each of
4 20.3, , ,and 30%
9 7 on a number line. List the numbers in descending order.
Section 2 Addition and Subtraction of Rational Numbers
1. Whenever applicable, express each sum or difference as a mixed numeral in simplest form.
a)
3 5
7 56
b)
3 2 9
5 10 20
c)
1 32
4 5
d)
3 41
4 5
e)
1 12 3
3 4
f)
3 1
7 3
g)
3 13 3
4 2
h)
1 12 3
3 4
i)
2 52 5 2
3 6
2. Add or subtract. Express the answer in fractional form or as a mixed number.
a)
10.3
2
b)
11.6
3
c) 2.3 3.2
End of Year Revision Packet Mathematics – Level J Page 7 of 46
SABIS® Proprietary
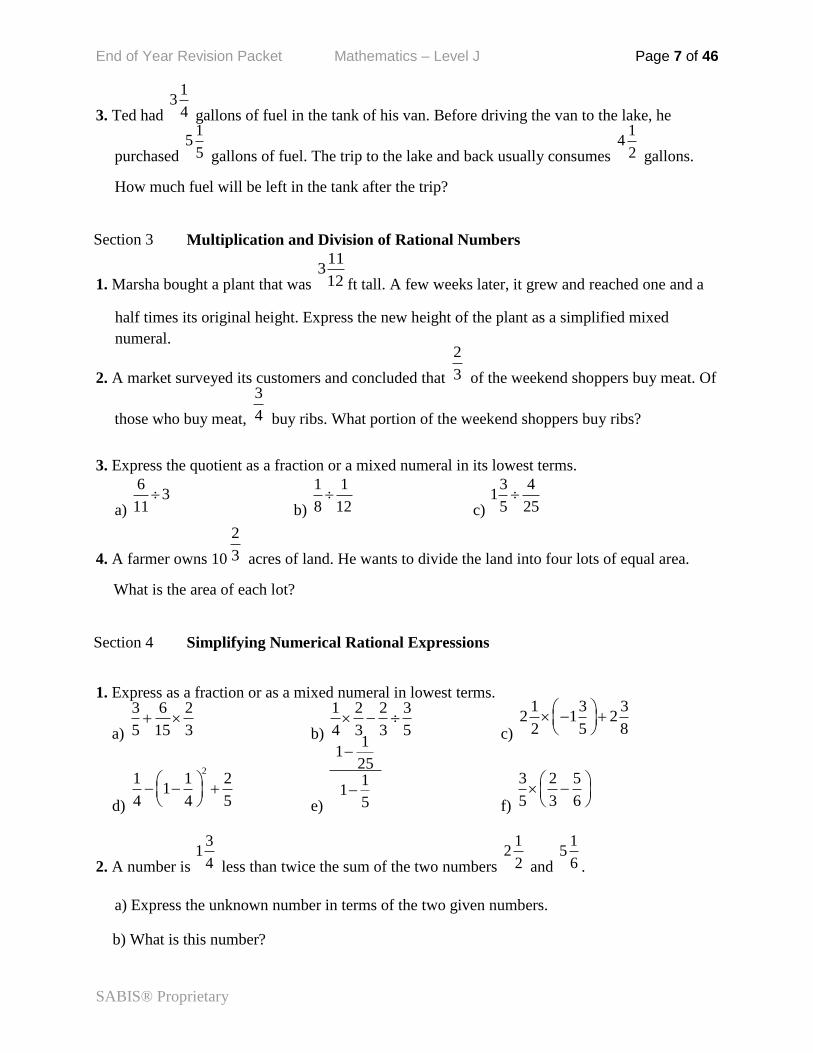
3. Ted had
13
4 gallons of fuel in the tank of his van. Before driving the van to the lake, he
purchased
15
5 gallons of fuel. The trip to the lake and back usually consumes
14
2 gallons.
How much fuel will be left in the tank after the trip?
Section 3 Multiplication and Division of Rational Numbers
1. Marsha bought a plant that was
113
12 ft tall. A few weeks later, it grew and reached one and a
half times its original height. Express the new height of the plant as a simplified mixed
numeral.
2. A market surveyed its customers and concluded that
2
3 of the weekend shoppers buy meat. Of
those who buy meat,
3
4 buy ribs. What portion of the weekend shoppers buy ribs?
3. Express the quotient as a fraction or a mixed numeral in its lowest terms.
a)
63
11
b)
1 1
8 12
c)
3 41
5 25
4. A farmer owns 10
2
3 acres of land. He wants to divide the land into four lots of equal area.
What is the area of each lot?
Section 4 Simplifying Numerical Rational Expressions
1. Express as a fraction or as a mixed numeral in lowest terms.
a)
3 6 2
5 15 3
b)
1 2 2 3
4 3 3 5
c)
1 3 32 1 2
2 5 8
d)
21 1 2
14 4 5
e)
11
251
15
f)
3 2 5
5 3 6
2. A number is
31
4 less than twice the sum of the two numbers
12
2 and
15
6 .
a) Express the unknown number in terms of the two given numbers.
b) What is this number?
End of Year Revision Packet Mathematics – Level J Page 8 of 46
SABIS® Proprietary
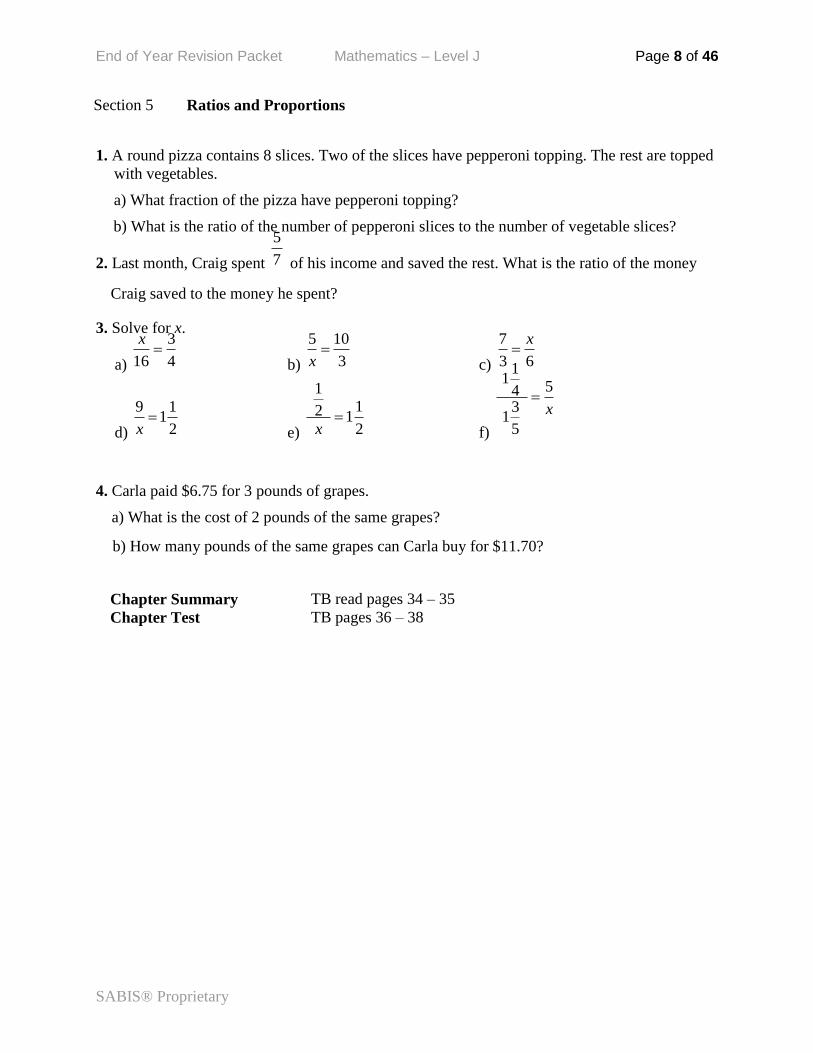
Section 5 Ratios and Proportions
1. A round pizza contains 8 slices. Two of the slices have pepperoni topping. The rest are topped
with vegetables.
a) What fraction of the pizza have pepperoni topping?
b) What is the ratio of the number of pepperoni slices to the number of vegetable slices?
2. Last month, Craig spent
5
7 of his income and saved the rest. What is the ratio of the money
Craig saved to the money he spent?
3. Solve for x.
a)
3
16 4
x
b)
5 10
3
x c)
7
3 6
x
d)
9 11
2
x e)
112 12
x f)
11
543
15
x
4. Carla paid $6.75 for 3 pounds of grapes.
a) What is the cost of 2 pounds of the same grapes?
b) How many pounds of the same grapes can Carla buy for $11.70?
Chapter Summary
TB read pages 34 – 35 Chapter Test TB pages 36 – 38
End of Year Revision Packet Mathematics – Level J Page 9 of 46
SABIS® Proprietary
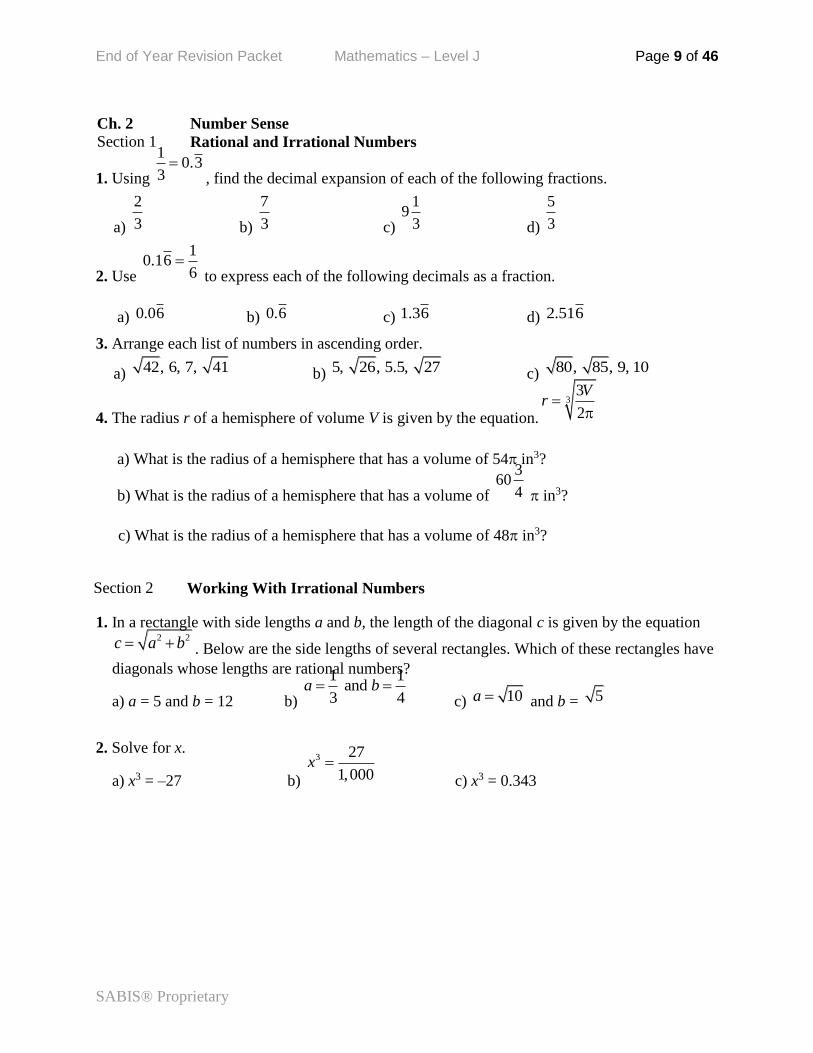
Ch. 2 Number Sense Section 1 Rational and Irrational Numbers
1. Using
10.3
3
, find the decimal expansion of each of the following fractions.
a)
2
3 b)
7
3 c)
19
3 d)
5
3
2. Use
10.16
6
to express each of the following decimals as a fraction.
a) 0.06 b) 0.6 c) 1.36 d) 2.516
3. Arrange each list of numbers in ascending order.
a) 42, 6, 7, 41 b) 5, 26, 5.5, 27 c) 80, 85, 9, 10
4. The radius r of a hemisphere of volume V is given by the equation.
33
2
Vr
a) What is the radius of a hemisphere that has a volume of 54 in3?
b) What is the radius of a hemisphere that has a volume of
360
4 in3?
c) What is the radius of a hemisphere that has a volume of 48 in3?
Section 2 Working With Irrational Numbers
1. In a rectangle with side lengths a and b, the length of the diagonal c is given by the equation 2 2 c a b . Below are the side lengths of several rectangles. Which of these rectangles have
diagonals whose lengths are rational numbers?
a) a = 5 and b = 12 b)
1 1 and
3 4 a b
c) 10a and b = 5
2. Solve for x.
a) x3 = –27 b)
3 27
1,000x
c) x3 = 0.343
End of Year Revision Packet Mathematics – Level J Page 10 of 46
SABIS® Proprietary
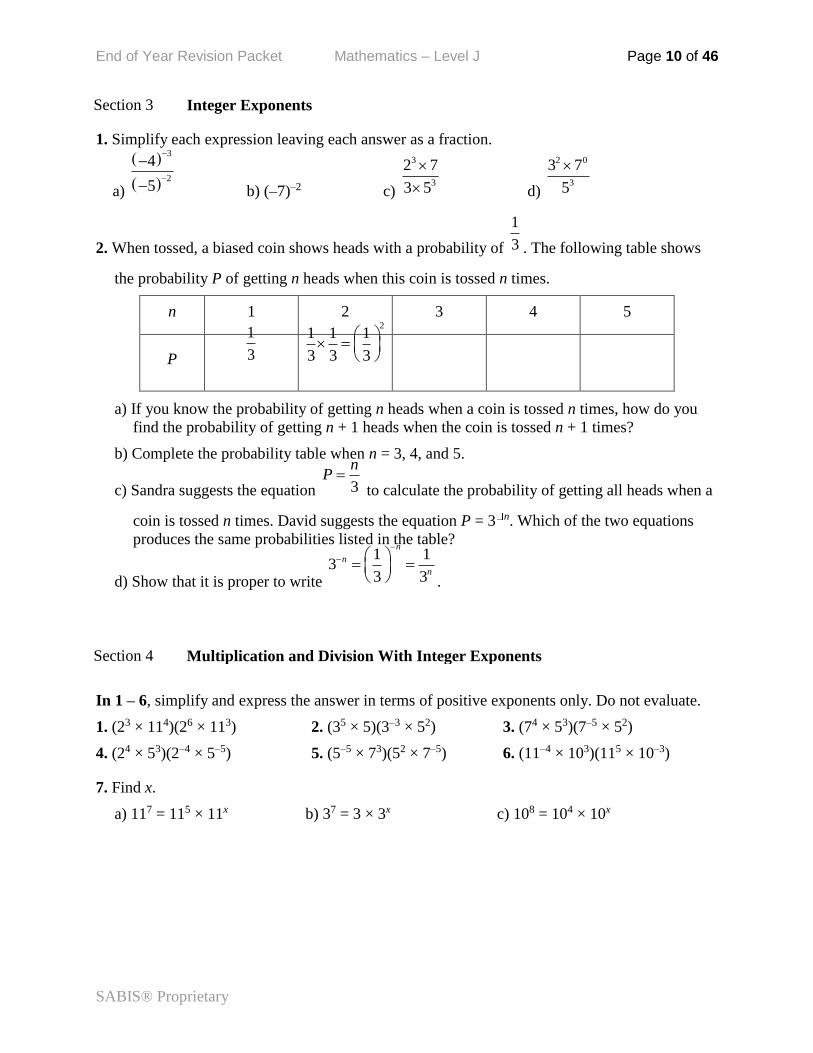
Section 3 Integer Exponents
1. Simplify each expression leaving each answer as a fraction.
a)
3
2
4
5
b) (–7)–2 c)
3
3
2 7
3 5
d)
2 0
3
3 7
5
2. When tossed, a biased coin shows heads with a probability of
1
3 . The following table shows
the probability P of getting n heads when this coin is tossed n times.
n 1 2 3 4 5
P
1
3
21 1 1
3 3 3
a) If you know the probability of getting n heads when a coin is tossed n times, how do you
find the probability of getting n + 1 heads when the coin is tossed n + 1 times?
b) Complete the probability table when n = 3, 4, and 5.
c) Sandra suggests the equation 3
nP
to calculate the probability of getting all heads when a
coin is tossed n times. David suggests the equation P = 3 n. Which of the two equations
produces the same probabilities listed in the table?
d) Show that it is proper to write
1 13
3 3
n
n
n
.
Section 4 Multiplication and Division With Integer Exponents
In 1 – 6, simplify and express the answer in terms of positive exponents only. Do not evaluate.
1. (23 × 114)(26 × 113) 2. (35 × 5)(3–3 × 52) 3. (74 × 53)(7–5 × 52)
4. (24 × 53)(2–4 × 5–5) 5. (5–5 × 73)(52 × 7–5) 6. (11–4 × 10³)(115 × 10–3)
7. Find x.
a) 117 = 115 × 11x b) 37 = 3 × 3x c) 108 = 104 × 10x
End of Year Revision Packet Mathematics – Level J Page 11 of 46
SABIS® Proprietary
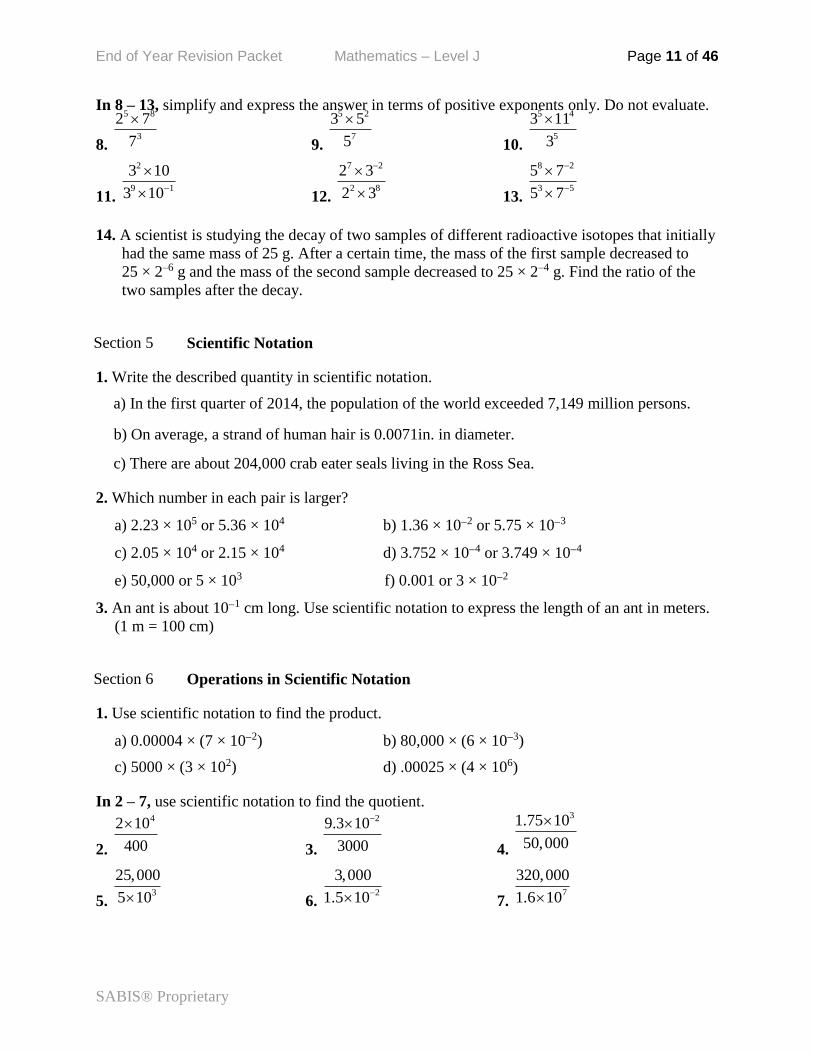
In 8 – 13, simplify and express the answer in terms of positive exponents only. Do not evaluate.
8.
5 8
3
2 7
7
9.
5 2
7
3 5
5
10.
5 4
5
3 11
3
11.
2
9 1
3 10
3 10
12.
7 2
2 8
2 3
2 3
13.
8 2
3 5
5 7
5 7
14. A scientist is studying the decay of two samples of different radioactive isotopes that initially
had the same mass of 25 g. After a certain time, the mass of the first sample decreased to
25 × 2–6 g and the mass of the second sample decreased to 25 × 2–4 g. Find the ratio of the
two samples after the decay.
Section 5 Scientific Notation
1. Write the described quantity in scientific notation.
a) In the first quarter of 2014, the population of the world exceeded 7,149 million persons.
b) On average, a strand of human hair is 0.0071in. in diameter.
c) There are about 204,000 crab eater seals living in the Ross Sea.
2. Which number in each pair is larger?
a) 2.23 × 10⁵ or 5.36 × 10⁴ b) 1.36 × 10² or 5.75 × 10³
c) 2.05 × 10⁴ or 2.15 × 10⁴ d) 3.752 × 10⁴ or 3.749 × 10⁴
e) 50,000 or 5 × 10³ f) 0.001 or 3 × 10²
3. An ant is about 101 cm long. Use scientific notation to express the length of an ant in meters.
(1 m = 100 cm)
Section 6 Operations in Scientific Notation
1. Use scientific notation to find the product.
a) 0.00004 × (7 × 102) b) 80,000 × (6 × 103)
c) 5000 × (3 × 102) d) .00025 × (4 × 106)
In 2 – 7, use scientific notation to find the quotient.
2.
42 10
400
3.
29.3 10
3000
4.
31.75 10
50,000
5. 3
25,000
5 10 6. 2
3,000
1.5 10 7. 7
320,000
1.6 10
End of Year Revision Packet Mathematics – Level J Page 12 of 46
SABIS® Proprietary
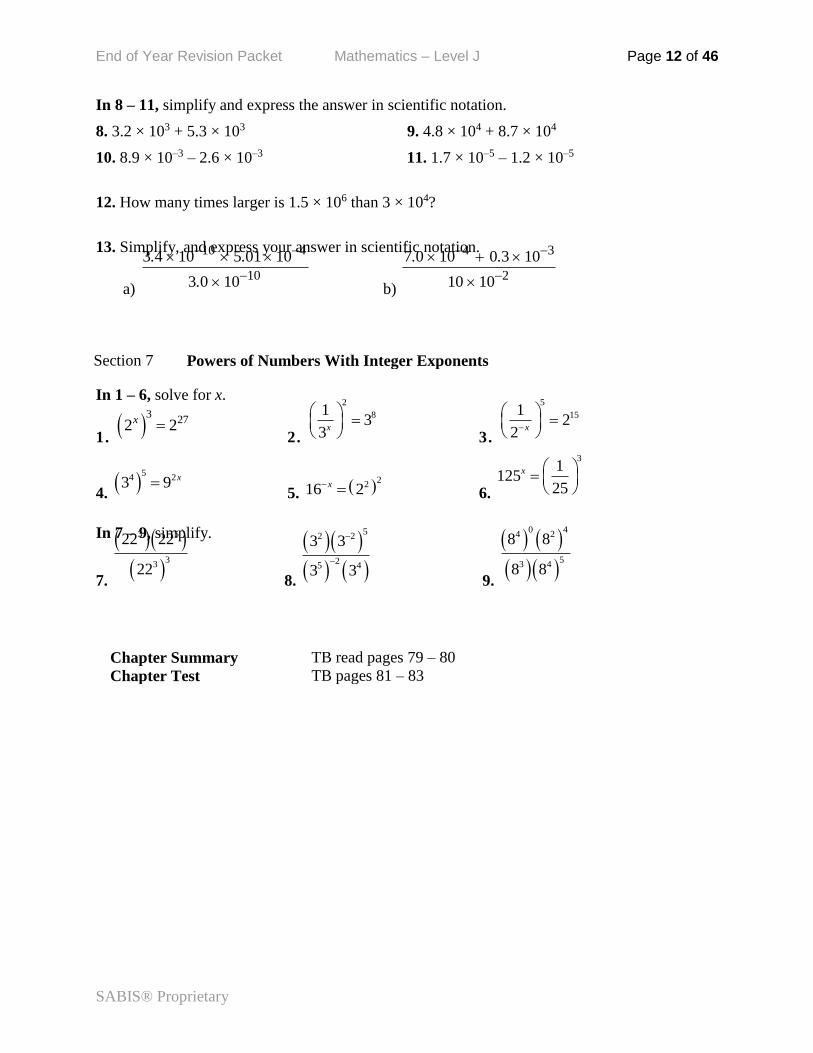
In 8 – 11, simplify and express the answer in scientific notation.
8. 3.2 × 10³ + 5.3 × 10³ 9. 4.8 × 10⁴ + 8.7 × 10⁴
10. 8.9 × 10⁻³ – 2.6 × 10⁻³ 11. 1.7 × 10⁻⁵ – 1.2 × 10⁻⁵
12. How many times larger is 1.5 × 10⁶ than 3 × 10⁴?
13. Simplify, and express your answer in scientific notation.
a)
10 4
10
3 4 10 5 01 10
3 0 10
. .
.
b)
4 3
2
7 0 10 0 3 10
10 10
. .
Section 7 Powers of Numbers With Integer Exponents
In 1 – 6, solve for x.
1.
3272 2x
2.
2
813
3x
3.
5
1512
2 x
4.
54 23 9 x
5. 2
216 2x 6.
31
12525
x
In 7 – 9, simplify.
7.
3 5
33
22 22
22 8.
52 2
25 4
3 3
3 3
9.
0 44 2
53 4
8 8
8 8
Chapter Summary
TB read pages 79 – 80 Chapter Test TB pages 81 – 83
End of Year Revision Packet Mathematics – Level J Page 13 of 46
SABIS® Proprietary
Ch. 3 Linear Relationships Section 1 Linear Patterns
In 1 – 2, three vertices of a rectangle are given. Plot the points in a coordinate plane and
determine the coordinates of the fourth vertex.
1. (4, 1), (4, 2), (1, 1) 2. (1, 2), ( 4, 2), ( 4, 6)
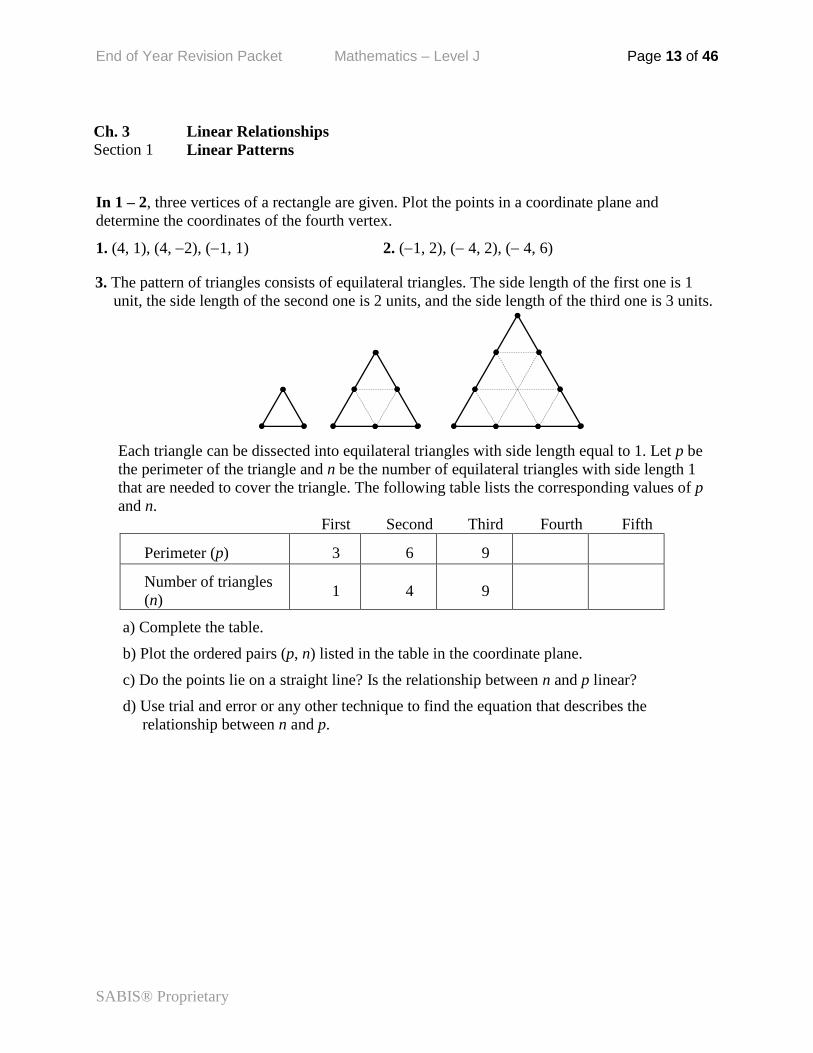
3. The pattern of triangles consists of equilateral triangles. The side length of the first one is 1
unit, the side length of the second one is 2 units, and the side length of the third one is 3 units.
Each triangle can be dissected into equilateral triangles with side length equal to 1. Let p be
the perimeter of the triangle and n be the number of equilateral triangles with side length 1
that are needed to cover the triangle. The following table lists the corresponding values of p
and n.
First Second Third Fourth Fifth
Perimeter (p) 3 6 9
Number of triangles
(n) 1 4 9
a) Complete the table.
b) Plot the ordered pairs (p, n) listed in the table in the coordinate plane.
c) Do the points lie on a straight line? Is the relationship between n and p linear?
d) Use trial and error or any other technique to find the equation that describes the
relationship between n and p.
End of Year Revision Packet Mathematics – Level J Page 14 of 46
SABIS® Proprietary
Section 2 The Slope of a Straight Line
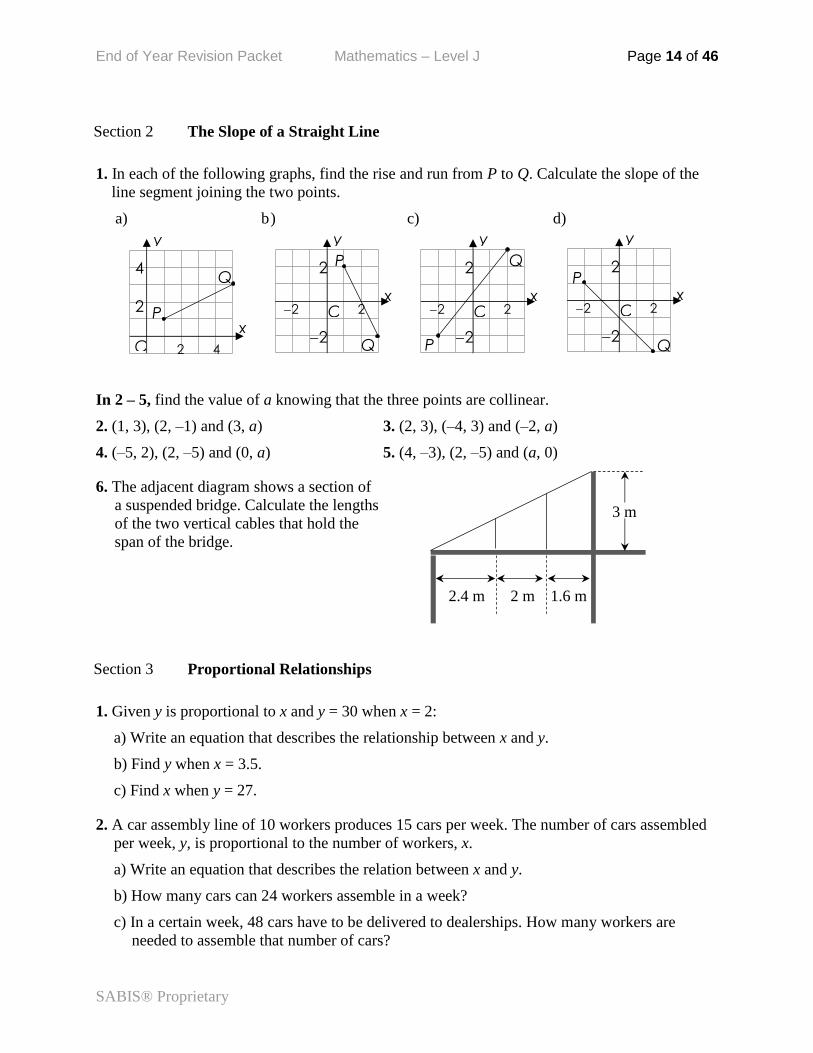
1. In each of the following graphs, find the rise and run from P to Q. Calculate the slope of the
line segment joining the two points.
a) b) c) d)
In 2 – 5, find the value of a knowing that the three points are collinear.
2. (1, 3), (2, –1) and (3, a) 3. (2, 3), (–4, 3) and (–2, a)
4. (–5, 2), (2, –5) and (0, a) 5. (4, –3), (2, –5) and (a, 0)
6. The adjacent diagram shows a section of
a suspended bridge. Calculate the lengths
of the two vertical cables that hold the
span of the bridge.
Section 3 Proportional Relationships
1. Given y is proportional to x and y = 30 when x = 2:
a) Write an equation that describes the relationship between x and y.
b) Find y when x = 3.5.
c) Find x when y = 27.
2. A car assembly line of 10 workers produces 15 cars per week. The number of cars assembled
per week, y, is proportional to the number of workers, x.
a) Write an equation that describes the relation between x and y.
b) How many cars can 24 workers assemble in a week?
c) In a certain week, 48 cars have to be delivered to dealerships. How many workers are
needed to assemble that number of cars?
P
Q
2 4
x
y
4
2
O
P
Q
2 2 x
y
2
2
O
P
Q
2 2 x
y
2
2
O
P
Q
2 2 x
y
2
2
O
1.6 m 2 m 2.4 m
3 m
End of Year Revision Packet Mathematics – Level J Page 15 of 46
SABIS® Proprietary
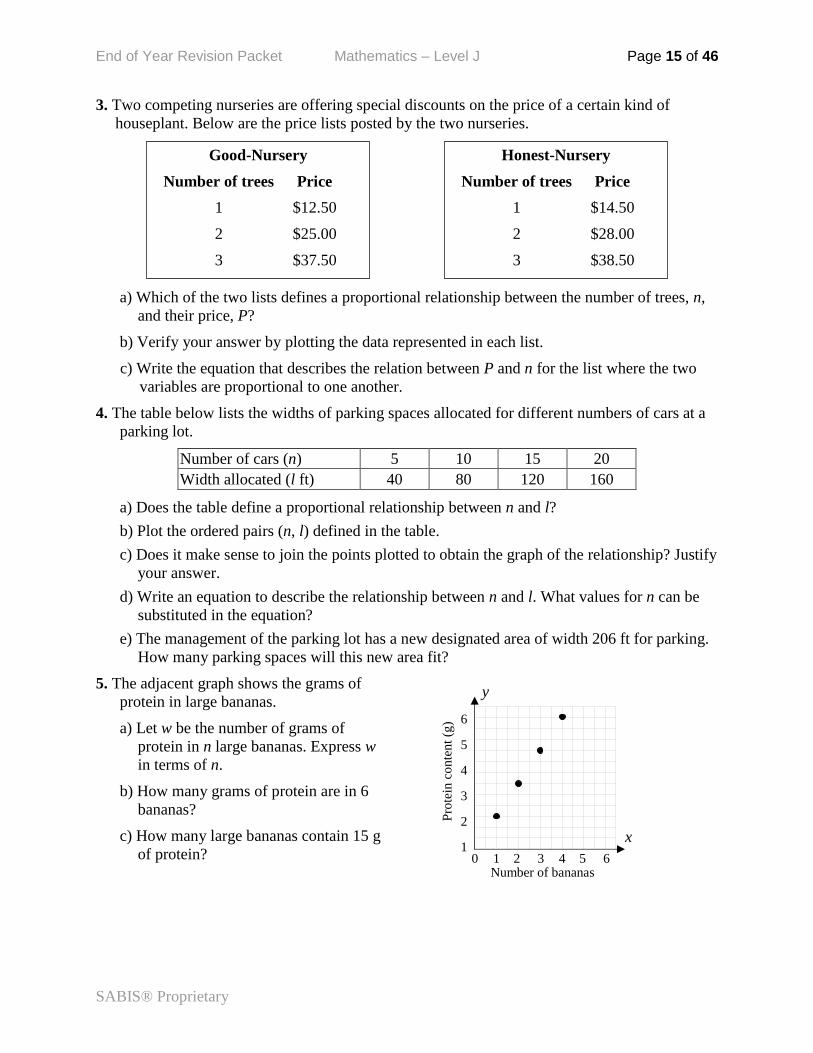
3. Two competing nurseries are offering special discounts on the price of a certain kind of
houseplant. Below are the price lists posted by the two nurseries.
a) Which of the two lists defines a proportional relationship between the number of trees, n,
and their price, P?
b) Verify your answer by plotting the data represented in each list.
c) Write the equation that describes the relation between P and n for the list where the two
variables are proportional to one another.
4. The table below lists the widths of parking spaces allocated for different numbers of cars at a
parking lot.
Number of cars (n) 5 10 15 20
Width allocated (l ft) 40 80 120 160
a) Does the table define a proportional relationship between n and l?
b) Plot the ordered pairs (n, l) defined in the table.
c) Does it make sense to join the points plotted to obtain the graph of the relationship? Justify
your answer.
d) Write an equation to describe the relationship between n and l. What values for n can be
substituted in the equation?
e) The management of the parking lot has a new designated area of width 206 ft for parking.
How many parking spaces will this new area fit?
5. The adjacent graph shows the grams of
protein in large bananas.
a) Let w be the number of grams of
protein in n large bananas. Express w
in terms of n.
b) How many grams of protein are in 6
bananas?
c) How many large bananas contain 15 g
of protein?
x
y
Number of bananas
Pro
tein
co
nte
nt
(g)
0 1 2 3 4 5 6
6
5
4
3
2
1
Good-Nursery
Number of trees Price
1 $12.50
2 $25.00
3 $37.50
4 $50.00
Honest-Nursery
Number of trees Price
1 $14.50
2 $28.00
3 $38.50
4 $49.00
End of Year Revision Packet Mathematics – Level J Page 16 of 46
SABIS® Proprietary
Section 4 Unit Rates
1. Katy used 4 pounds of ground beef to prepare 12 servings of sloppy Joes. Calculate the unit
rate. What does it represent in this situation?9. What is the average of six negative integers
and their opposites? Explain how you got your answer.
2. A store has dark chocolate on special. A customer pays $6 for 12 ounces of dark chocolate.
a) What is the cost of an ounce of dark chocolate?
b) How many ounces of dark chocolate does 1 dollar buy?
c) Sketch a graph of the relationship between the number of ounces of chocolate and the
price.
d) What does the slope of the graph represent?
e) Write the equation that defines the relationship between the number of ounces of chocolate
and the price.
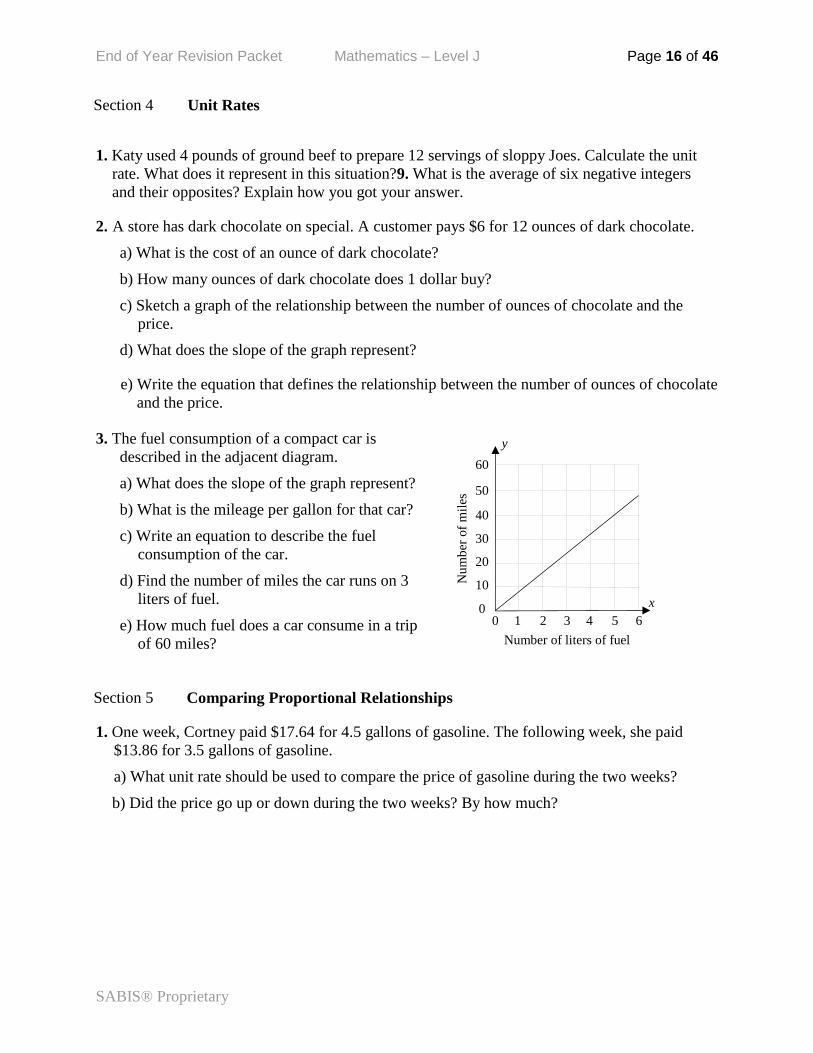
3. The fuel consumption of a compact car is
described in the adjacent diagram.
a) What does the slope of the graph represent?
b) What is the mileage per gallon for that car?
c) Write an equation to describe the fuel
consumption of the car.
d) Find the number of miles the car runs on 3
liters of fuel.
e) How much fuel does a car consume in a trip
of 60 miles?
Section 5 Comparing Proportional Relationships
1. One week, Cortney paid $17.64 for 4.5 gallons of gasoline. The following week, she paid
$13.86 for 3.5 gallons of gasoline.
a) What unit rate should be used to compare the price of gasoline during the two weeks?
b) Did the price go up or down during the two weeks? By how much?
0 1 2 3 4 5 6
Number of liters of fuel
Nu
mb
er o
f m
iles
60
50
40
30
20
10
0 x
y
End of Year Revision Packet Mathematics – Level J Page 17 of 46
SABIS® Proprietary
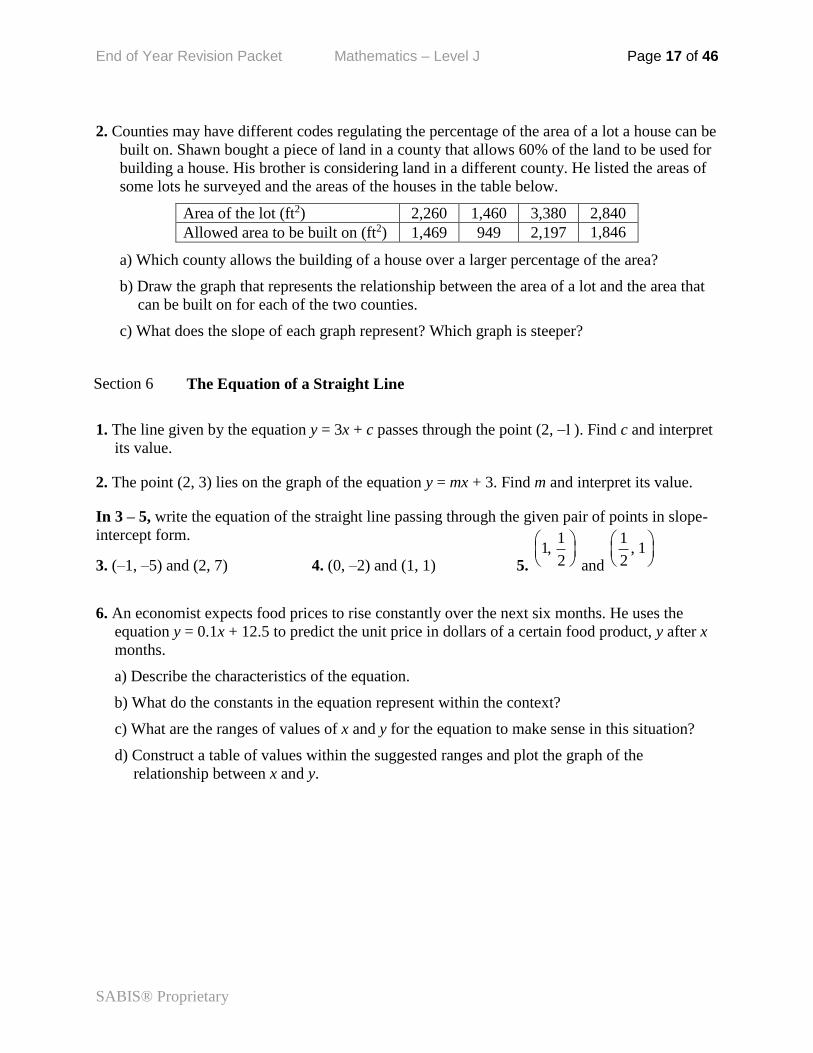
2. Counties may have different codes regulating the percentage of the area of a lot a house can be
built on. Shawn bought a piece of land in a county that allows 60% of the land to be used for
building a house. His brother is considering land in a different county. He listed the areas of
some lots he surveyed and the areas of the houses in the table below.
Area of the lot (ft2) 2,260 1,460 3,380 2,840
Allowed area to be built on (ft2) 1,469 949 2,197 1,846
a) Which county allows the building of a house over a larger percentage of the area?
b) Draw the graph that represents the relationship between the area of a lot and the area that
can be built on for each of the two counties.
c) What does the slope of each graph represent? Which graph is steeper?
Section 6 The Equation of a Straight Line
1. The line given by the equation y = 3x + c passes through the point (2, ). Find c and interpret
its value.
2. The point (2, 3) lies on the graph of the equation y = mx + 3. Find m and interpret its value.
In 3 – 5, write the equation of the straight line passing through the given pair of points in slope-
intercept form.
3. (–1, –5) and (2, 7) 4. (0, –2) and (1, 1) 5.
11,
2
and
1, 1
2
6. An economist expects food prices to rise constantly over the next six months. He uses the
equation y = 0.1x + 12.5 to predict the unit price in dollars of a certain food product, y after x
months.
a) Describe the characteristics of the equation.
b) What do the constants in the equation represent within the context?
c) What are the ranges of values of x and y for the equation to make sense in this situation?
d) Construct a table of values within the suggested ranges and plot the graph of the
relationship between x and y.
End of Year Revision Packet Mathematics – Level J Page 18 of 46
SABIS® Proprietary
Section 7 Graphing the Equation y = mx + c
In 1 – 6, use the slope and the y-intercept to graph the given equation.
1. y = 5 – 2x 2. y = –3x + 2 3.
2 3
6
xy
4. y =
1
2 x – 2 5.
3 5
5
xy
6. y =
11
4 –
3
4 x
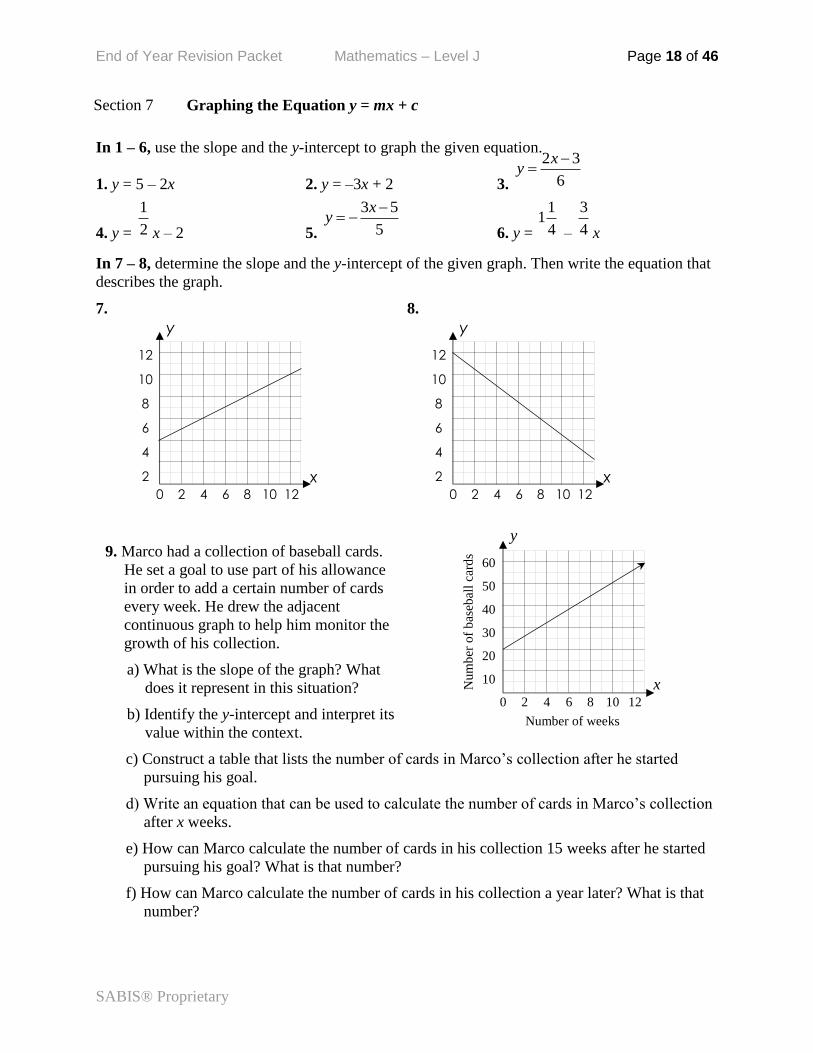
In 7 – 8, determine the slope and the y-intercept of the given graph. Then write the equation that
describes the graph.
7. 8.
9. Marco had a collection of baseball cards.
He set a goal to use part of his allowance
in order to add a certain number of cards
every week. He drew the adjacent
continuous graph to help him monitor the
growth of his collection.
a) What is the slope of the graph? What
does it represent in this situation?
b) Identify the y-intercept and interpret its
value within the context.
c) Construct a table that lists the number of cards in Marco’s collection after he started
pursuing his goal.
d) Write an equation that can be used to calculate the number of cards in Marco’s collection
after x weeks.
e) How can Marco calculate the number of cards in his collection 15 weeks after he started
pursuing his goal? What is that number?
f) How can Marco calculate the number of cards in his collection a year later? What is that
number?
x
y
Number of weeks
Nu
mb
er o
f b
aseb
all
card
s
0 2 4 6 8 10 12
60
50
40
30
20
10
0
x
y
0 2 4 6 8 10 12
12
10
8
6
4
2 x
y
0 2 4 6 8 10 12
12
10
8
6
4
2
End of Year Revision Packet Mathematics – Level J Page 19 of 46
SABIS® Proprietary
Section 8 The Equation of the Straight Line in General Form
In 1 – 6, rewrite the equation in the slope-intercept form and identify the slope of the graph.
1. 2x + 4y = 1 2. 3x – y = 4 3. 3y – 4x = 5
4. 4x + 5y = –2 5. y – x = 1 6. 1
2 5
x y
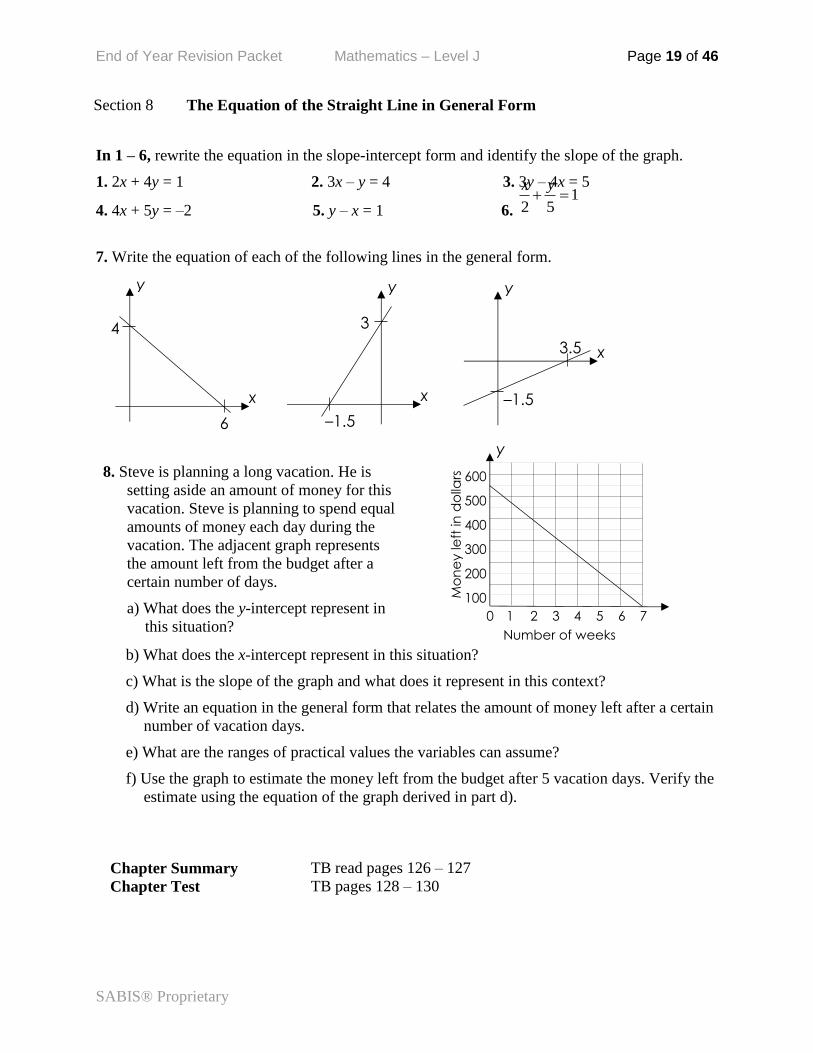
7. Write the equation of each of the following lines in the general form.
8. Steve is planning a long vacation. He is
setting aside an amount of money for this
vacation. Steve is planning to spend equal
amounts of money each day during the
vacation. The adjacent graph represents
the amount left from the budget after a
certain number of days.
a) What does the y-intercept represent in
this situation?
b) What does the x-intercept represent in this situation?
c) What is the slope of the graph and what does it represent in this context?
d) Write an equation in the general form that relates the amount of money left after a certain
number of vacation days.
e) What are the ranges of practical values the variables can assume?
f) Use the graph to estimate the money left from the budget after 5 vacation days. Verify the
estimate using the equation of the graph derived in part d).
Chapter Summary
TB read pages 126 – 127 Chapter Test TB pages 128 – 130
x
y
6
4
x
y
–1.5
3
x
y
–1.5
3.5
x
y
Number of weeks
Mo
ne
y le
ft in
do
llars
0 1 2 3 4 5 6 7
600
500
400
300
200
100
End of Year Revision Packet Mathematics – Level J Page 20 of 46
SABIS® Proprietary
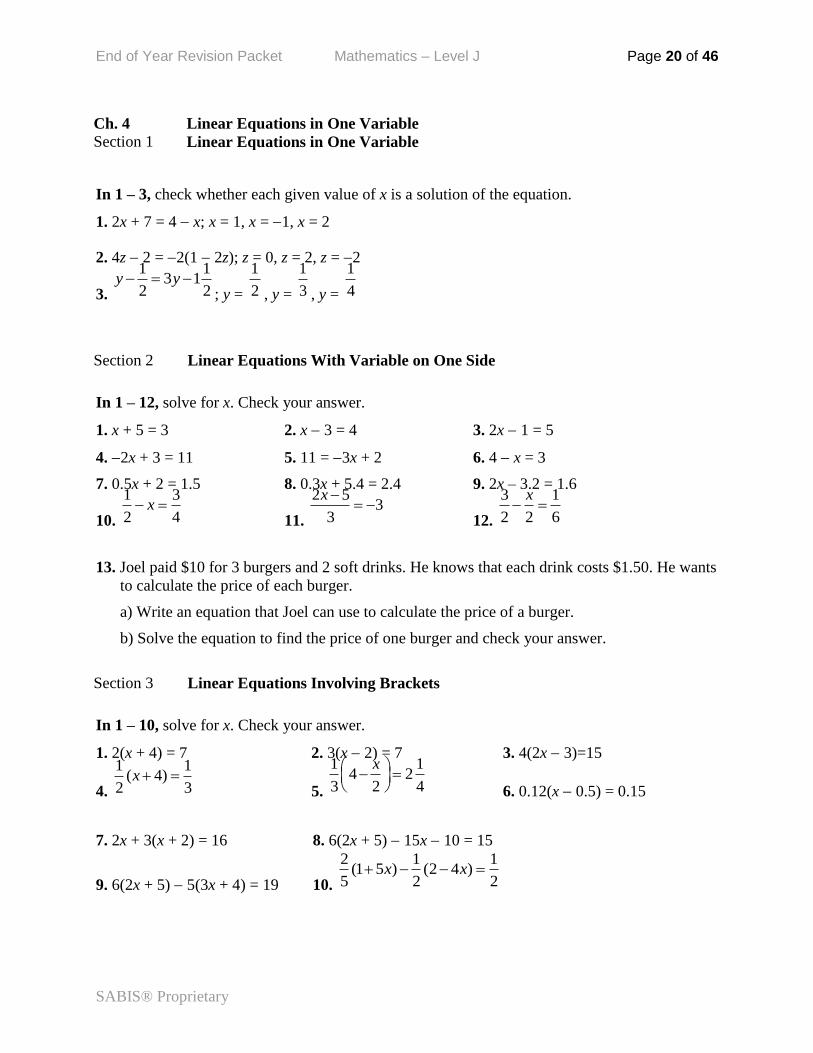
Ch. 4 Linear Equations in One Variable Section 1 Linear Equations in One Variable
In 1 – 3, check whether each given value of x is a solution of the equation.
1. 2x + 7 = 4 x; x = 1, x = 1, x = 2
2. 4z 2 = 2(1 2z); z = 0, z = 2, z = 2
3.
1 13 1
2 2 y y
; y =
1
2 , y =
1
3 , y =
1
4
Section 2 Linear Equations With Variable on One Side
In 1 – 12, solve for x. Check your answer.
1. x + 5 = 3 2. x 3 = 4 3. 2x 1 = 5
4. 2x + 3 = 11 5. 11 = 3x + 2 6. 4 x = 3
7. 0.5x + 2 = 1.5 8. 0.3x + 5.4 = 2.4 9. 2x – 3.2 = 1.6
10.
1 3
2 4 x
11.
2 53
3
x
12.
3 1
2 2 6
x
13. Joel paid $10 for 3 burgers and 2 soft drinks. He knows that each drink costs $1.50. He wants
to calculate the price of each burger.
a) Write an equation that Joel can use to calculate the price of a burger.
b) Solve the equation to find the price of one burger and check your answer.
Section 3 Linear Equations Involving Brackets
In 1 – 10, solve for x. Check your answer.
1. 2(x + 4) = 7 2. 3(x 2) = 7 3. 4(2x 3)=15
4.
1 1( 4)
2 3 x
5.
1 14 2
3 2 4
x
6. 0.12(x 0.5) = 0.15
7. 2x + 3(x + 2) = 16 8. 6(2x + 5) 15x 10 = 15
9. 6(2x + 5) 5(3x + 4) = 19 10.
2 1 1(1 5 ) (2 4 )
5 2 2 x x
End of Year Revision Packet Mathematics – Level J Page 21 of 46
SABIS® Proprietary
In 11 – 16, determine without solving whether the linear equation has a unique solution,
infinitely many solutions, or no solution. Justify your answer.
11. 5a 2 9 12. 2x 6 = 2(x 3) 13. w 3 w 3
14. 3x + 0.5 = 0.2 15. 11
1 1
2 4 x
16.
1 1
2 3 2
x
17. Three times the sum of a number and 2 added to twice the difference between the same
number and 2 equals 12.
a) Write an equation to use for finding the missing number.
b) Solve the equation and verify the answer.
Section 4 Linear Equations With Variable on Both Sides
In 1 – 10, solve for x. Check your answer when the equation has a unique solution.
1. 3x 4 = 3x + 4 2. 2x = 15 – 3x 3. –2x – 3 = 2(4 x)
4.
1
3 x
=
1
5 x
5.
2 2 13 2
x x
6.
2 3 3 2
3 2
x x
7. 0.2x = 0.8x – 1.2 8. 0.3x + 0.4 = 0.1 + 0.3x
9. 3(3 + x) = 5(3 – x) + 6x 10. 7 –3(1 – x) = 4 – 3x
11. Find all possible values of a, if any, for which the equation a(x 1) = 2(x 1) has:
i- a unique solution ii- infinitely many solutions iii- no solution
12. Find all possible values of a, if any, for which the equation 3x + 2 = 3x + a has:
i- a unique solution ii- infinitely many solutions iii- no solution
13. When a number is added to both the numerator and the denominator of the fraction
2
5 , it
becomes equivalent to
3
4 .
a) Set up an equation to find that number.
b) Solve the equation and verify the answer.
In 14 – 15, multiply the equation by the least common denominator and find its solution.
14.
1 1 1( 3) ( 1)
3 2 6 x x
15.
1 2 7(2 ) ( 2)
2 5 10 x x x
End of Year Revision Packet Mathematics – Level J Page 22 of 46
SABIS® Proprietary
Section 5 Linear Equations in More Than One Variable
In 1 – 3, solve the equation once for x and a second time for y.
1. 2y = 3x + 4 2. 0.2x + 0.5y = 1 3.
1
2 3
yx
Chapter Summary
TB read pages 152 – 153 Chapter Test TB pages 154 – 156
Ch. 5 Systems of Linear Equations Section 1 Systems of Linear Equations in Two Variables
1. The lines l: 3y = 2x and m: 2x + 3y = 12 intersect at P.
a) Draw l and m and identify the coordinates of P.
b) Explain why P is the midpoint of the segment joining the intercepts of 2x + 3y = 12.
c) Show that the region bounded by l and m and the y-axis is an isosceles triangle with vertex
P.
d) Show that the region bounded by l and m and the x-axis is also an isosceles triangle with
vertex P.
e) Find graphically the slope of PQ , where Q is at (1, 5).
Section 2 Graphical Solution of Systems of Linear Equations
In 1 – 6, graph the pair of equations to determine the number of solutions in each case.
1.
2 1
2 1
y x
y x
2.
2
2 2 4
y x
y x
3.
2 3
1
y x
y x
4.
1.6 0.4 2
0.4 0.1 0.5
y x
y x
5.
3 3
3 6
x y
x y
6.
3 6
6 6
x y
x y
7. Without solving, determine whether each system has a unique solution, infinitely many
solutions, or no solution. Justify your answer.
a)
3 2 5
3 2 1
x y
x y
b)
3 3 6
4 4 8
x y
x y
c)
2 4
2 4
x y
x y
End of Year Revision Packet Mathematics – Level J Page 23 of 46
SABIS® Proprietary
8. Consider the system 2x + 3y = 4 and 2x + 3y = c.
a) For what values of c does the system have no solution? Explain why.
b) For what value of c does the system have infinitely many solutions? Explain why.
c) Is there any value of c for which the system has a unique solution?
Section 3 Solving Systems of Linear Equations By Substitution
In 1 – 6, solve the system of linear equations using the substitution method and verify the
solution.
1. 2 6
y x
x y
2.
2 2
3 2 16
y x
x y
3.
2 0
3 10
y x
x y
4.
0.2 0.3 12
0.3 0.5 56
x y
x y
5.
11
3
3 7
y x
y x
6.
2 3 3
2 15
3
x y
xy
7. The point of intersection of the two lines ax + 2by = 2 and 2ax – by = 9 is (2, –3).
a) Find the values of a and b.
b) Graph the two lines and verify the coordinates of their point of intersection.
Section 4 Solving Systems of Linear Equations By Elimination
In 1 – 3, use the elimination method to determine whether the system has a unique solution,
infinitely many solutions, or no solution. Verify the solution in the case when it is unique.
1.
3 5
9
y x
y x
2.
3 2 7
8 7 12
x y
x y
3.
0.1 3 8
0.2 5 5
x y
x y
4. The sum of two numbers is 50 and their difference is 15.
a) Write a system of linear equations that describes this situation.
b) Solve the system of linear equations obtained above to determine the two numbers. Is the
solution unique?
c) Verify that the solution satisfies the given conditions.
5. Collin paid $4 for 2 pounds of mangos and one-half pound of bananas. His friend Julia paid $6
for 3 pounds of mangos and one and a half pounds of bananas.
a) Write a system of two equations that describes the given situation.
b) Solve the system obtained using the elimination method. What do you conclude?
End of Year Revision Packet Mathematics – Level J Page 24 of 46
SABIS® Proprietary
Section 5 Applications
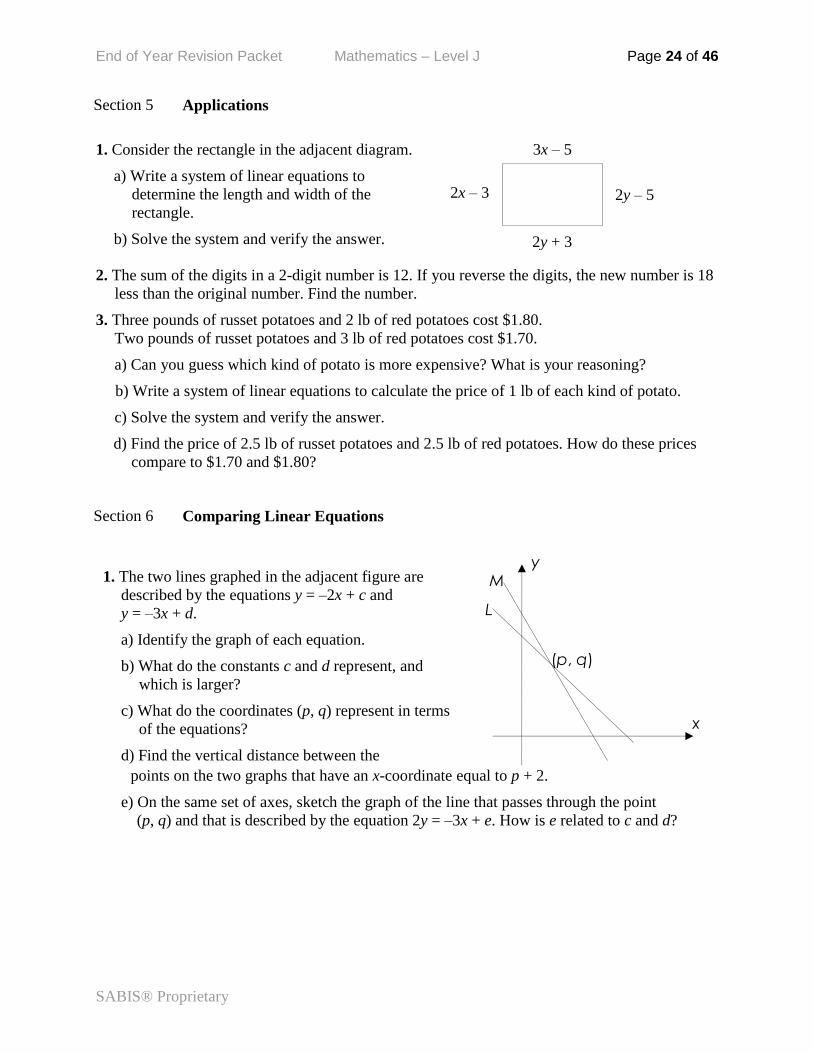
1. Consider the rectangle in the adjacent diagram.
a) Write a system of linear equations to
determine the length and width of the
rectangle.
b) Solve the system and verify the answer.
3x – 5
2y + 3
2x – 3 2y – 5
2. The sum of the digits in a 2-digit number is 12. If you reverse the digits, the new number is 18
less than the original number. Find the number.
3. Three pounds of russet potatoes and 2 lb of red potatoes cost $1.80.
Two pounds of russet potatoes and 3 lb of red potatoes cost $1.70.
a) Can you guess which kind of potato is more expensive? What is your reasoning?
b) Write a system of linear equations to calculate the price of 1 lb of each kind of potato.
c) Solve the system and verify the answer.
d) Find the price of 2.5 lb of russet potatoes and 2.5 lb of red potatoes. How do these prices
compare to $1.70 and $1.80?
Section 6 Comparing Linear Equations
1. The two lines graphed in the adjacent figure are
described by the equations y = –2x + c and
y = –3x + d.
a) Identify the graph of each equation.
b) What do the constants c and d represent, and
which is larger?
c) What do the coordinates (p, q) represent in terms
of the equations?
d) Find the vertical distance between the points on the two graphs that have an x-coordinate equal to p + 2.
e) On the same set of axes, sketch the graph of the line that passes through the point
(p, q) and that is described by the equation 2y = –3x + e. How is e related to c and d?
y
(p, q)
x
L
M
End of Year Revision Packet Mathematics – Level J Page 25 of 46
SABIS® Proprietary
2. Chloe is planning her birthday party. She has the choice between three ballrooms that offer
complementary DJ music.
- The first ballroom offers a banquet buffet at $16 per person.
- The second ballroom charges $300 for the room rental in addition to $11 per person for the
buffet.
- The third ballroom charges $500 for the room rental in addition to $9 per person for the
buffet.
Chloe does not know exactly how many guests she will invite, but she anticipates no more
than 120.
a) Draw the graph that represents the relationship between the number of guests and the total
cost for each room.
b) What do the y-intercept and the slope represent for each graph?
c) Derive an equation that describes the relationship between the number of guests and the
total cost for each room.
d) How would Chloe make her choice between the three ballrooms based on the number of
guests she will invite?
Chapter Summary
TB read page 189 – 190 Chapter Test TB pages 191 – 193
Ch. 6 Functions Section 1 Definition of a Function
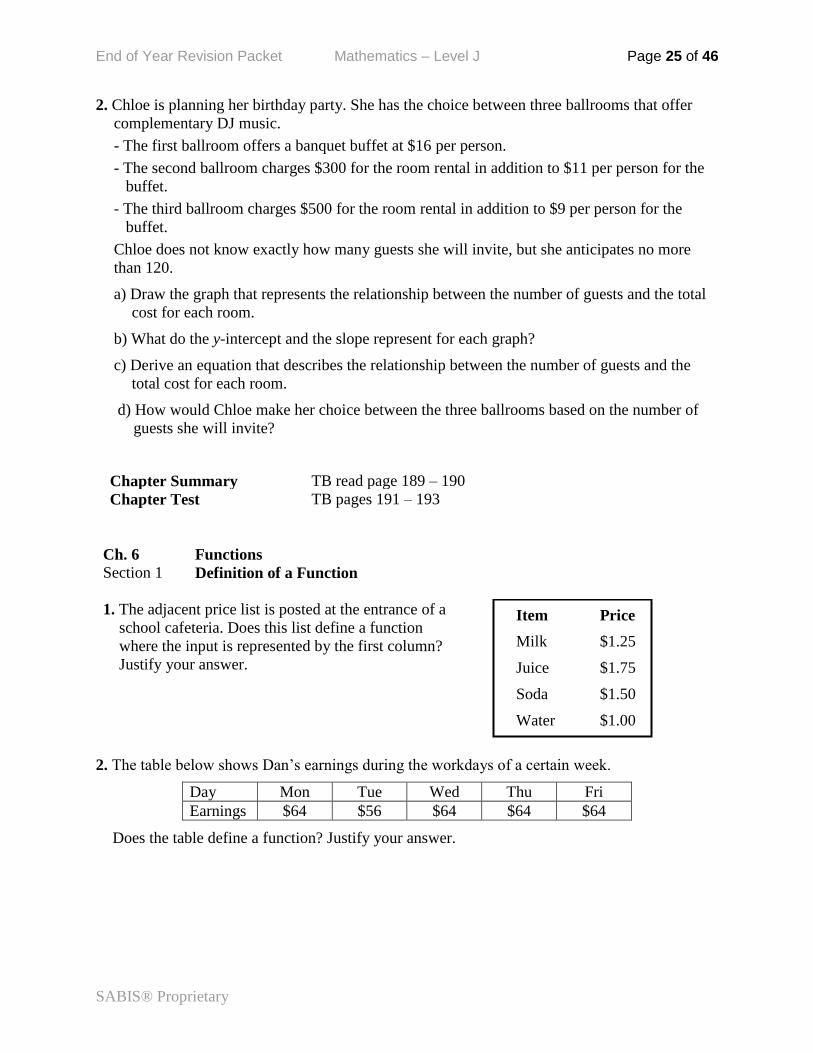
1. The adjacent price list is posted at the entrance of a
school cafeteria. Does this list define a function
where the input is represented by the first column?
Justify your answer.
2. The table below shows Dan’s earnings during the workdays of a certain week.
Day Mon Tue Wed Thu Fri
Earnings $64 $56 $64 $64 $64
Does the table define a function? Justify your answer.
Item Price
Milk $1.25
Juice $1.75
Soda $1.50
Water $1.00
End of Year Revision Packet Mathematics – Level J Page 26 of 46
SABIS® Proprietary
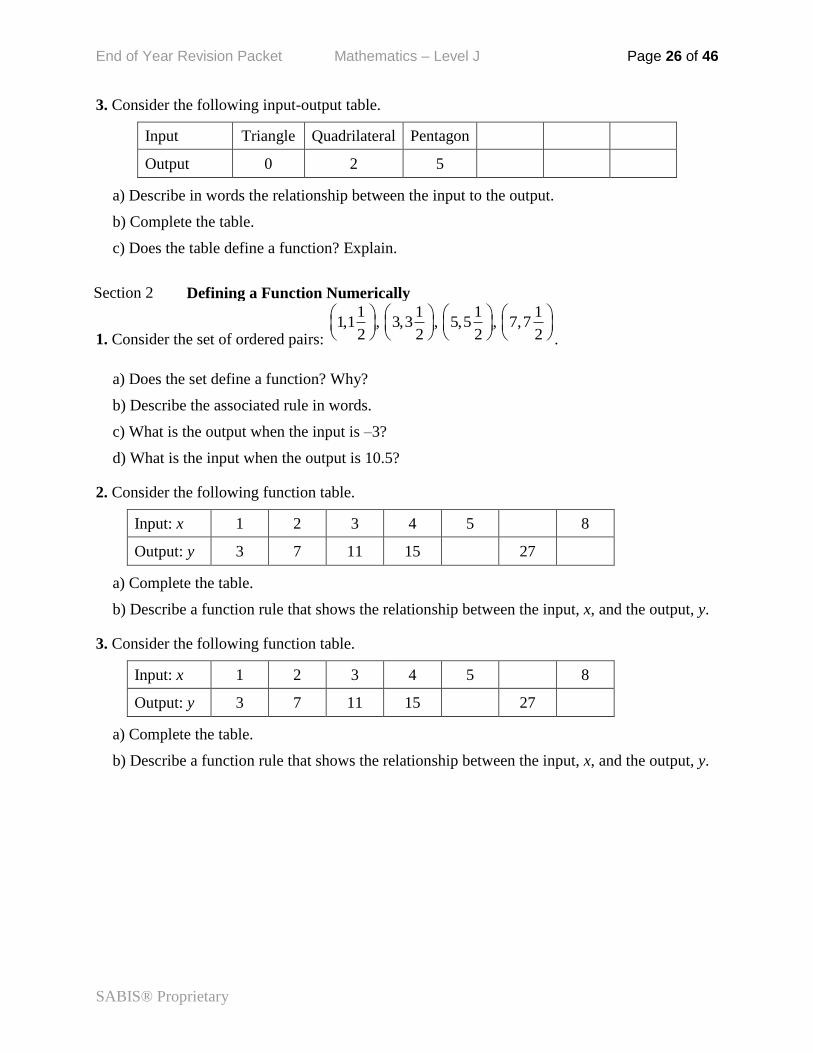
3. Consider the following input-output table.
Input Triangle Quadrilateral Pentagon
Output 0 2 5
a) Describe in words the relationship between the input to the output.
b) Complete the table.
c) Does the table define a function? Explain.
Section 2 Defining a Function Numerically
1. Consider the set of ordered pairs:
1 1 1 11,1 , 3,3 , 5,5 , 7,7
2 2 2 2
.
a) Does the set define a function? Why?
b) Describe the associated rule in words.
c) What is the output when the input is –3?
d) What is the input when the output is 10.5?
2. Consider the following function table.
Input: x 1 2 3 4 5 8
Output: y 3 7 11 15 27
a) Complete the table.
b) Describe a function rule that shows the relationship between the input, x, and the output, y.
3. Consider the following function table.
Input: x 1 2 3 4 5 8
Output: y 3 7 11 15 27
a) Complete the table.
b) Describe a function rule that shows the relationship between the input, x, and the output, y.
End of Year Revision Packet Mathematics – Level J Page 27 of 46
SABIS® Proprietary
Section 3 Defining a Function Graphically
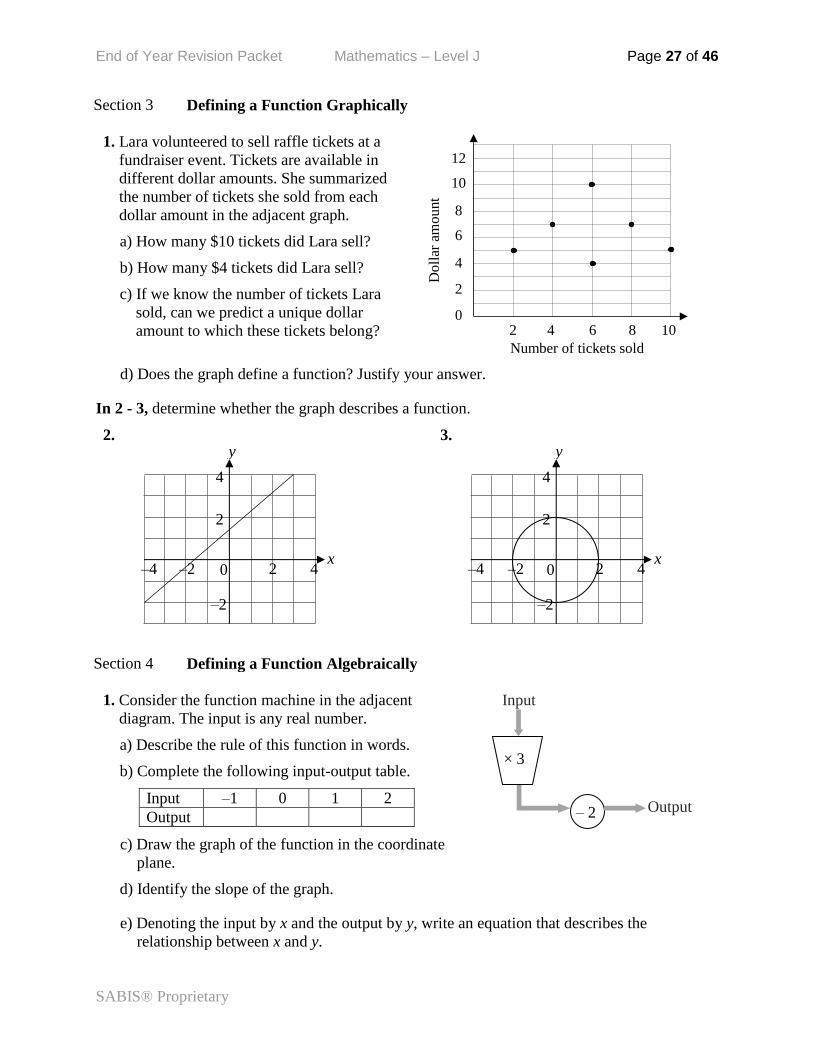
1. Lara volunteered to sell raffle tickets at a
fundraiser event. Tickets are available in
different dollar amounts. She summarized
the number of tickets she sold from each
dollar amount in the adjacent graph.
a) How many $10 tickets did Lara sell?
b) How many $4 tickets did Lara sell?
c) If we know the number of tickets Lara
sold, can we predict a unique dollar
amount to which these tickets belong?
d) Does the graph define a function? Justify your answer.
In 2 - 3, determine whether the graph describes a function.
2. 3.
Section 4 Defining a Function Algebraically
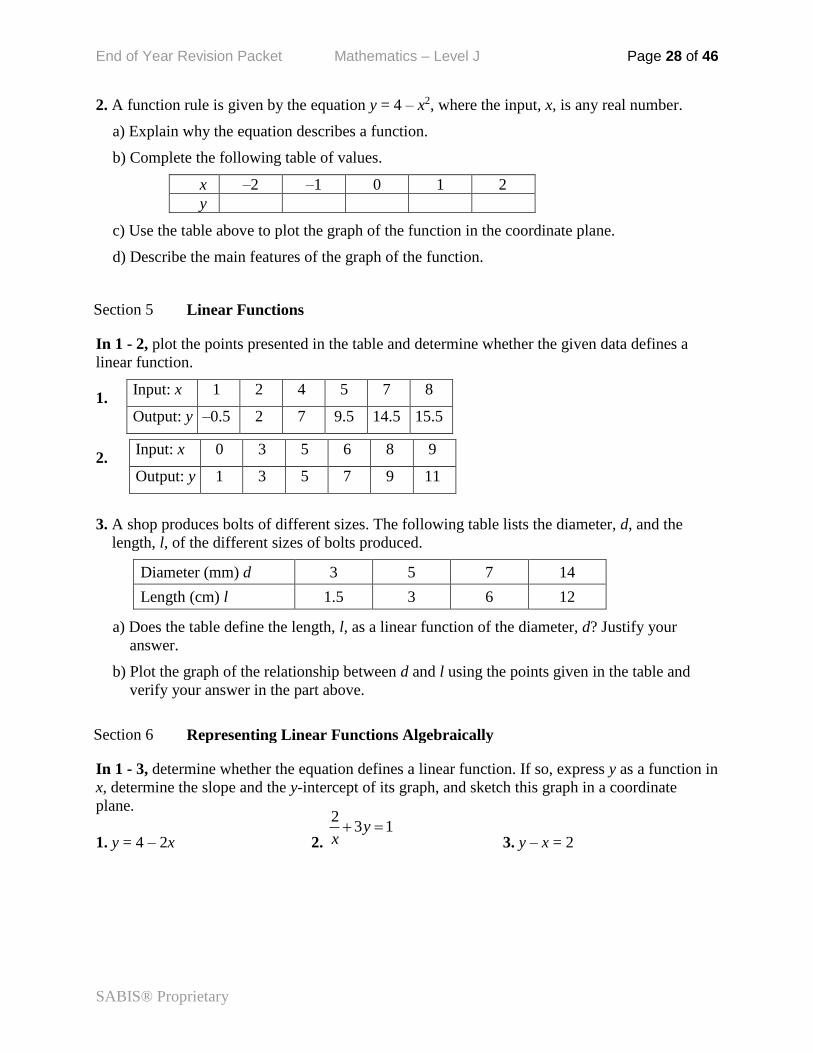
1. Consider the function machine in the adjacent
diagram. The input is any real number.
a) Describe the rule of this function in words.
b) Complete the following input-output table.
Input –1 0 1 2
Output
c) Draw the graph of the function in the coordinate
plane.
d) Identify the slope of the graph.
e) Denoting the input by x and the output by y, write an equation that describes the
relationship between x and y.
2 4 6 8 10
12
10
8
6
4
2
0
Do
llar
am
ou
nt
Number of tickets sold
–4 –2 2 4
4
2
0
–2
x
y
–4 –2 2 4
4
2
0
–2
x
y
– 2
× 3
Input
Output
End of Year Revision Packet Mathematics – Level J Page 28 of 46
SABIS® Proprietary
2. A function rule is given by the equation y = 4 – x2, where the input, x, is any real number.
a) Explain why the equation describes a function.
b) Complete the following table of values.
x –2 –1 0 1 2
y
c) Use the table above to plot the graph of the function in the coordinate plane.
d) Describe the main features of the graph of the function.
Section 5 Linear Functions
In 1 - 2, plot the points presented in the table and determine whether the given data defines a
linear function.
1.
2.
3. A shop produces bolts of different sizes. The following table lists the diameter, d, and the
length, l, of the different sizes of bolts produced.
Diameter (mm) d 3 5 7 14
Length (cm) l 1.5 3 6 12
a) Does the table define the length, l, as a linear function of the diameter, d? Justify your
answer.
b) Plot the graph of the relationship between d and l using the points given in the table and
verify your answer in the part above.
Section 6 Representing Linear Functions Algebraically
In 1 - 3, determine whether the equation defines a linear function. If so, express y as a function in
x, determine the slope and the y-intercept of its graph, and sketch this graph in a coordinate
plane.
1. y = 4 – 2x 2.
23 1y
x
3. y – x = 2
Input: x 1 2 4 5 7 8
Output: y –0.5 2 7 9.5 14.5 15.5
Input: x 0 3 5 6 8 9
Output: y 1 3 5 7 9 11
End of Year Revision Packet Mathematics – Level J Page 29 of 46
SABIS® Proprietary
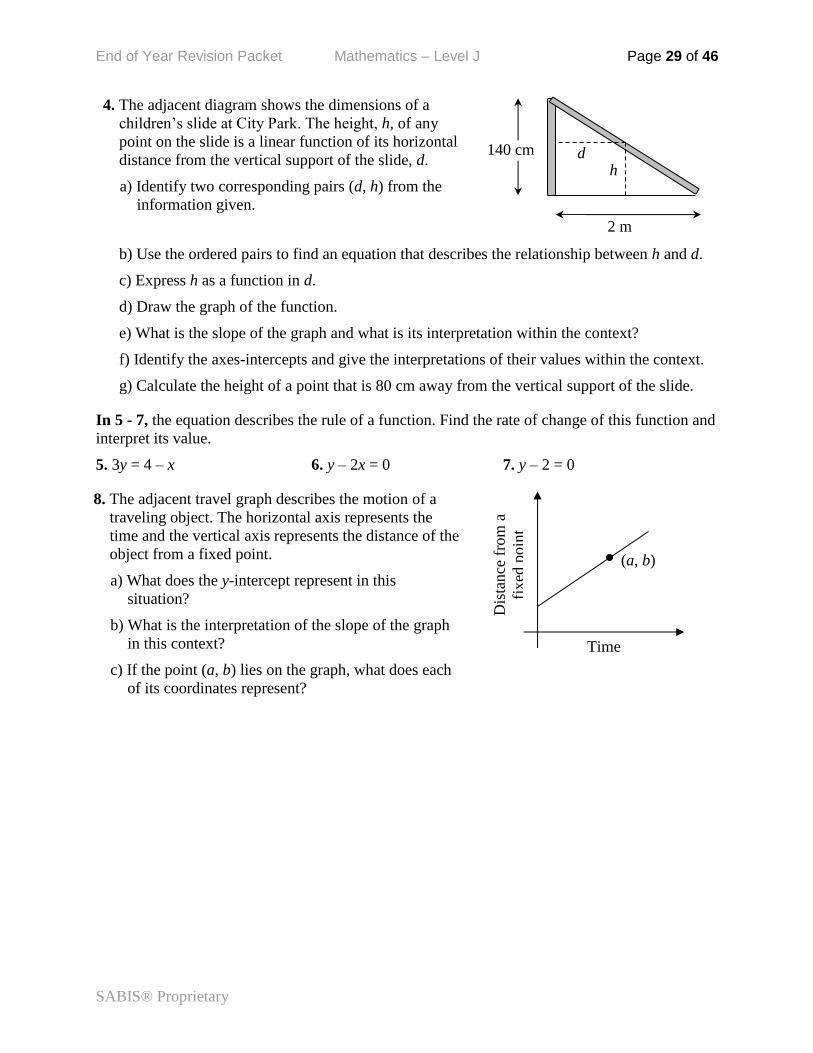
4. The adjacent diagram shows the dimensions of a
children’s slide at City Park. The height, h, of any
point on the slide is a linear function of its horizontal
distance from the vertical support of the slide, d.
a) Identify two corresponding pairs (d, h) from the
information given.
b) Use the ordered pairs to find an equation that describes the relationship between h and d.
c) Express h as a function in d.
d) Draw the graph of the function.
e) What is the slope of the graph and what is its interpretation within the context?
f) Identify the axes-intercepts and give the interpretations of their values within the context.
g) Calculate the height of a point that is 80 cm away from the vertical support of the slide.
In 5 - 7, the equation describes the rule of a function. Find the rate of change of this function and
interpret its value.
5. 3y = 4 – x 6. y – 2x = 0 7. y – 2 = 0
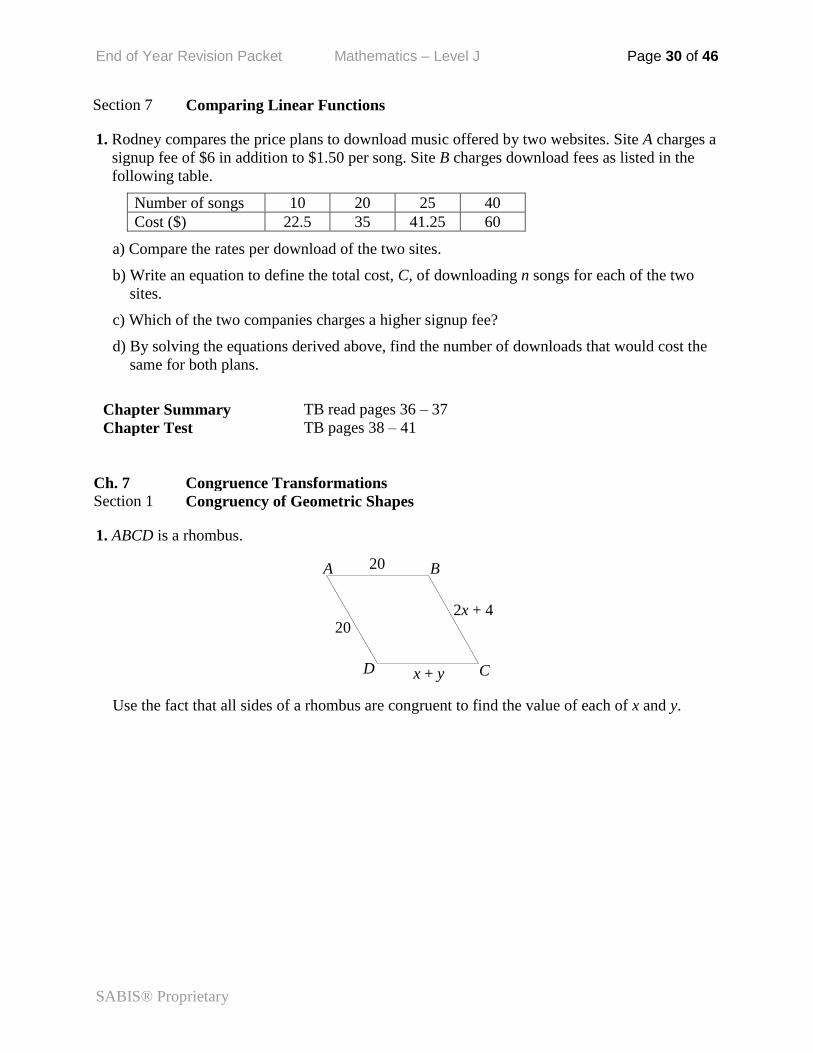
8. The adjacent travel graph describes the motion of a
traveling object. The horizontal axis represents the
time and the vertical axis represents the distance of the
object from a fixed point.
a) What does the y-intercept represent in this
situation?
b) What is the interpretation of the slope of the graph
in this context?
c) If the point (a, b) lies on the graph, what does each
of its coordinates represent?
d h
2 m
140 cm
Time
Dis
tance
fro
m a
fixed
poin
t
(a, b)
End of Year Revision Packet Mathematics – Level J Page 30 of 46
SABIS® Proprietary
Section 7 Comparing Linear Functions
1. Rodney compares the price plans to download music offered by two websites. Site A charges a
signup fee of $6 in addition to $1.50 per song. Site B charges download fees as listed in the
following table.
Number of songs 10 20 25 40
Cost ($) 22.5 35 41.25 60
a) Compare the rates per download of the two sites.
b) Write an equation to define the total cost, C, of downloading n songs for each of the two
sites.
c) Which of the two companies charges a higher signup fee?
d) By solving the equations derived above, find the number of downloads that would cost the
same for both plans.
Chapter Summary
TB read pages 36 – 37 Chapter Test TB pages 38 – 41
Ch. 7 Congruence Transformations Section 1 Congruency of Geometric Shapes
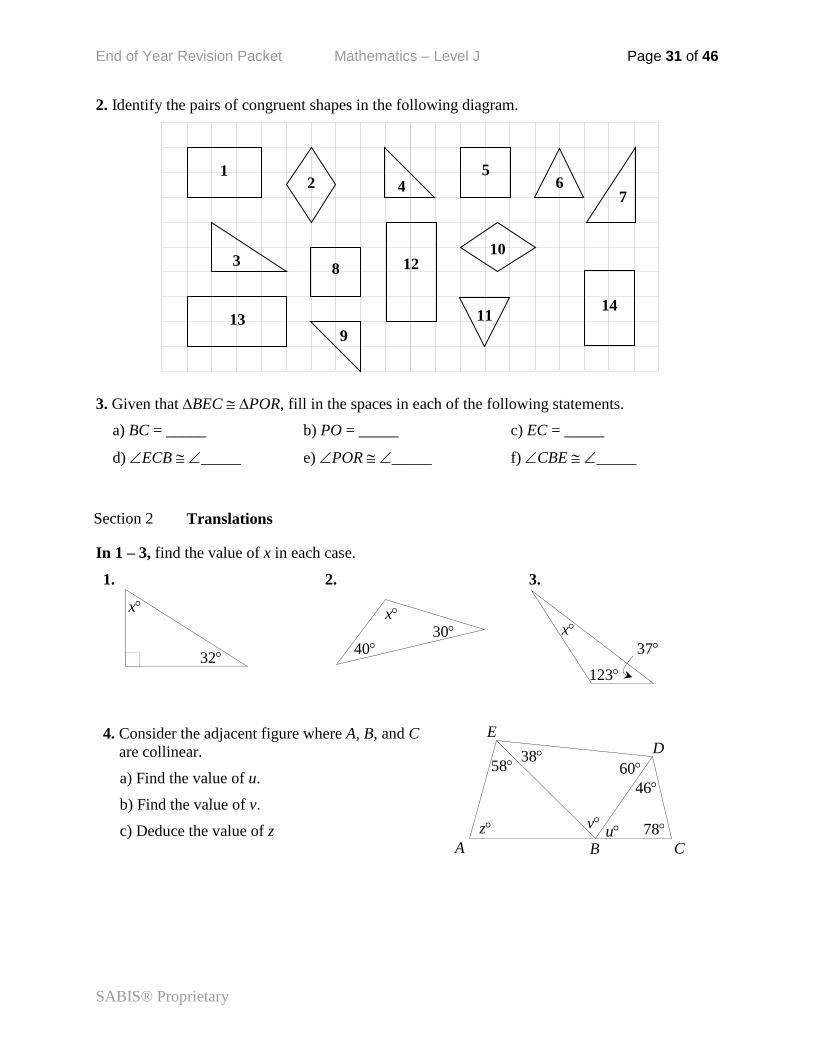
1. ABCD is a rhombus.
2x + 4
20
x + y D
A B
C
20
Use the fact that all sides of a rhombus are congruent to find the value of each of x and y.
End of Year Revision Packet Mathematics – Level J Page 31 of 46
SABIS® Proprietary
2. Identify the pairs of congruent shapes in the following diagram.
1
14
2
10 3
7 4
9
5
8 12
13
6
11
3. Given that BEC POR, fill in the spaces in each of the following statements.
a) BC = _____ b) PO = _____ c) EC = _____
d) ECB _____ e) POR _____ f) CBE _____
Section 2 Translations
In 1 – 3, find the value of x in each case.
1. 2. 3.
4. Consider the adjacent figure where A, B, and C
are collinear.
a) Find the value of u.
b) Find the value of v.
c) Deduce the value of z
78
58
46
60 38
u v z
A B C
D E
32
x
40 30
x
37
123
x
End of Year Revision Packet Mathematics – Level J Page 32 of 46
SABIS® Proprietary
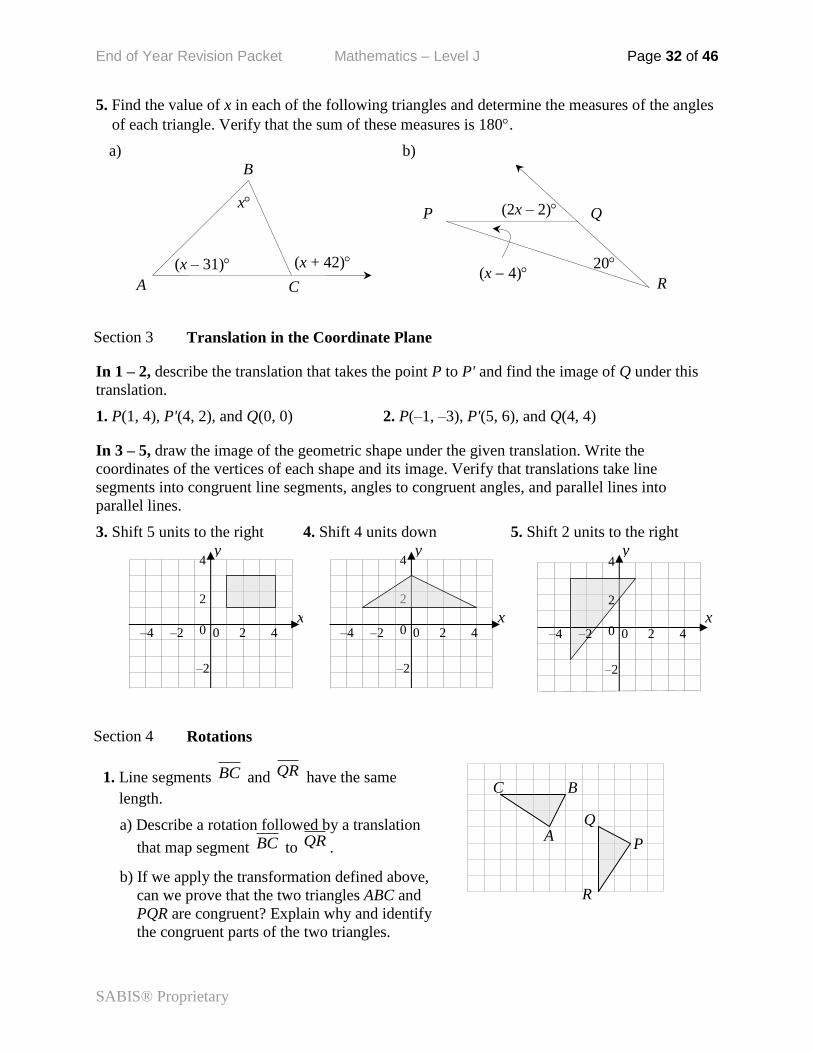
5. Find the value of x in each of the following triangles and determine the measures of the angles
of each triangle. Verify that the sum of these measures is 180.
a) b)
Section 3 Translation in the Coordinate Plane
In 1 – 2, describe the translation that takes the point P to P' and find the image of Q under this
translation.
1. P(1, 4), P'(4, 2), and Q(0, 0) 2. P(–1, –3), P'(5, 6), and Q(4, 4)
In 3 – 5, draw the image of the geometric shape under the given translation. Write the
coordinates of the vertices of each shape and its image. Verify that translations take line
segments into congruent line segments, angles to congruent angles, and parallel lines into
parallel lines.
3. Shift 5 units to the right 4. Shift 4 units down 5. Shift 2 units to the right
Section 4 Rotations
1. Line segments BC and QR have the same
length.
a) Describe a rotation followed by a translation
that map segment BC to QR .
b) If we apply the transformation defined above,
can we prove that the two triangles ABC and
PQR are congruent? Explain why and identify
the congruent parts of the two triangles.
(x + 42) (x – 31)
x
A
B
C
P Q
R
(2x – 2)
(x 4) 20
x
y
–4 –2 0 2 4
4
2
0
–2
–4 –2 0 2 4
4
2
0
–2
x
y
x
y
–4 –2 0 2 4
4
2
0
–2
R
B
A
C
P
Q
End of Year Revision Packet Mathematics – Level J Page 33 of 46
SABIS® Proprietary
End of Year Revision Packet Mathematics – Level J Page 34 of 46
SABIS® Proprietary
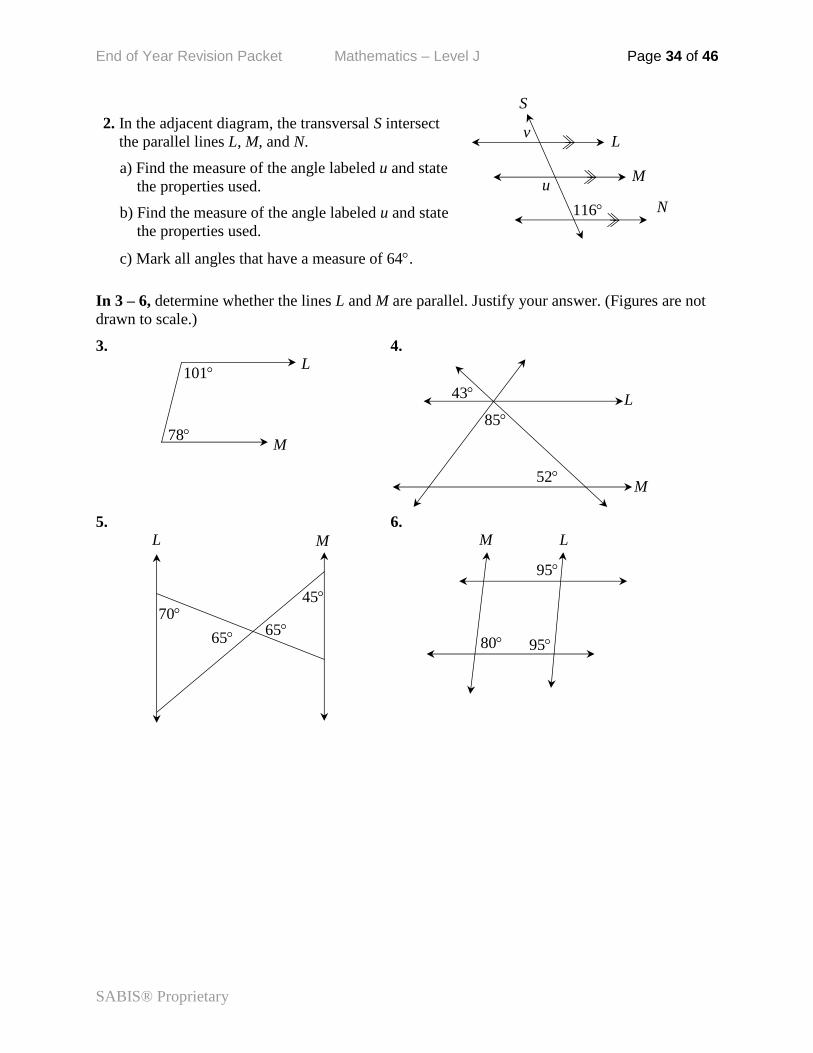
2. In the adjacent diagram, the transversal S intersect
the parallel lines L, M, and N.
a) Find the measure of the angle labeled u and state
the properties used.
b) Find the measure of the angle labeled u and state
the properties used.
c) Mark all angles that have a measure of 64.
In 3 – 6, determine whether the lines L and M are parallel. Justify your answer. (Figures are not
drawn to scale.)
3. 4.
5. 6.
u
L
M
S
116 N
v
L
M 78
101
52
43
85
L
M
L M
65 65
70 45
L M
95
95 80
End of Year Revision Packet Mathematics – Level J Page 35 of 46
SABIS® Proprietary
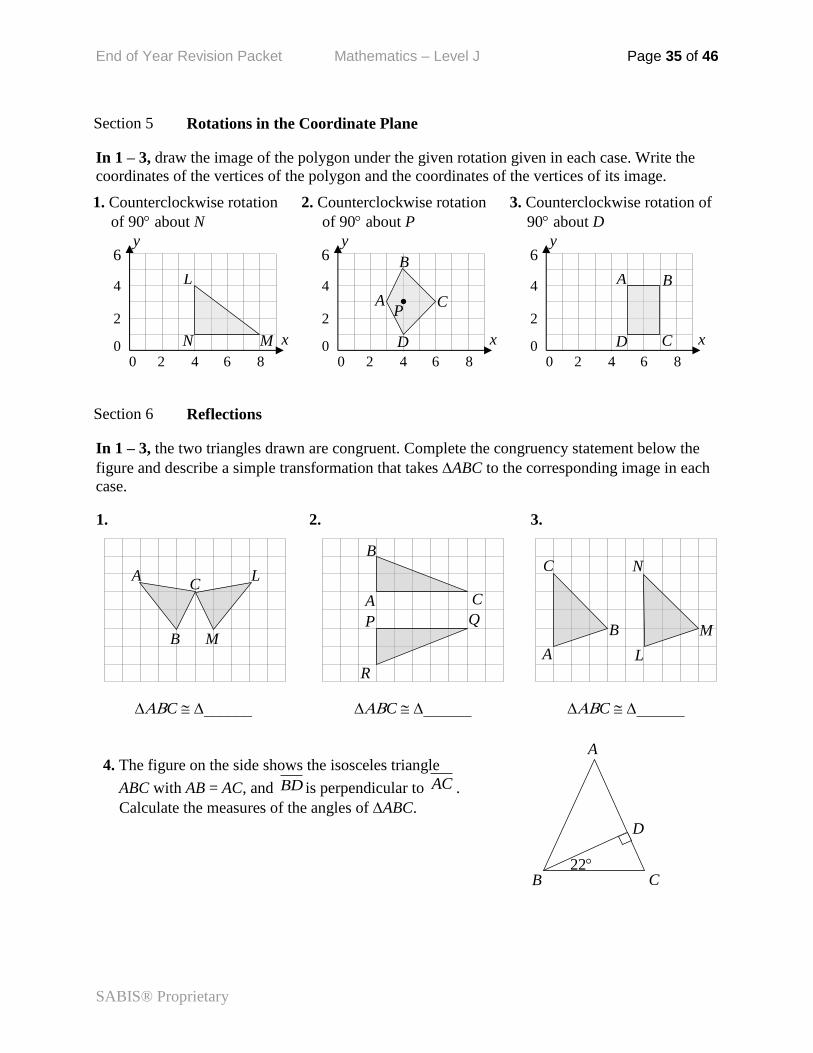
Section 5 Rotations in the Coordinate Plane
In 1 – 3, draw the image of the polygon under the given rotation given in each case. Write the
coordinates of the vertices of the polygon and the coordinates of the vertices of its image.
1. Counterclockwise rotation
of 90 about N
2. Counterclockwise rotation
of 90 about P
3. Counterclockwise rotation of
90 about D
Section 6 Reflections
In 1 – 3, the two triangles drawn are congruent. Complete the congruency statement below the
figure and describe a simple transformation that takes ABC to the corresponding image in each
case.
4. The figure on the side shows the isosceles triangle
ABC with AB = AC, and BD is perpendicular to AC .
Calculate the measures of the angles of ABC.
1. 2. 3.
C C C
0 2 4 6 8
6
4
2
0
y
x
L
M N
0 2 4 6 8
6
4
2
0
y
x
A
B
C
D
P
D
0 2 4 6 8
6
4
2
0
y
x
A B
C
A C
B
L
M
A
B
Q P
C
R
C
A
B
L
M
N
22 B C
A
D
End of Year Revision Packet Mathematics – Level J Page 36 of 46
SABIS® Proprietary
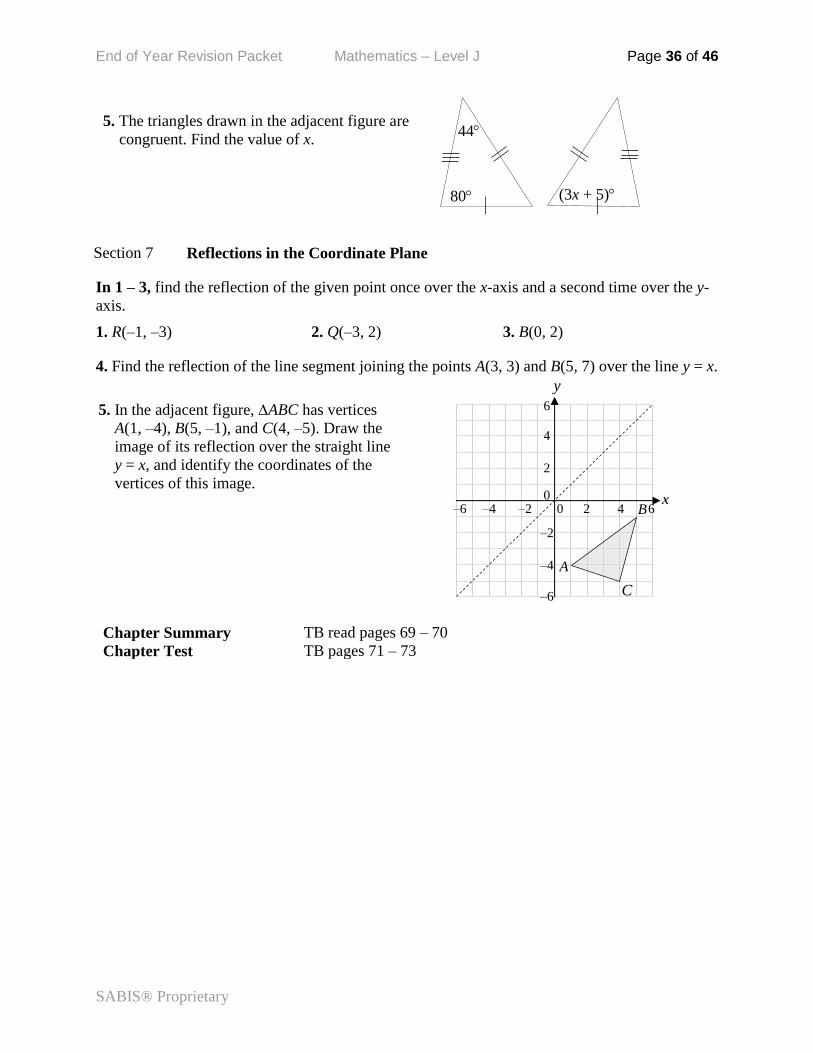
5. The triangles drawn in the adjacent figure are
congruent. Find the value of x.
(3x + 5) 80
44
Section 7 Reflections in the Coordinate Plane
In 1 – 3, find the reflection of the given point once over the x-axis and a second time over the y-
axis.
1. R(–1, –3) 2. Q(–3, 2) 3. B(0, 2)
4. Find the reflection of the line segment joining the points A(3, 3) and B(5, 7) over the line y = x.
5. In the adjacent figure, ABC has vertices
A(1, –4), B(5, –1), and C(4, –5). Draw the
image of its reflection over the straight line
y = x, and identify the coordinates of the
vertices of this image.
Chapter Summary
TB read pages 69 – 70 Chapter Test TB pages 71 – 73
x
y
–6 –4 –2 0 2 4 6
6
4
2
0
–2
–4
–6
A
B
C
End of Year Revision Packet Mathematics – Level J Page 37 of 46
SABIS® Proprietary
Ch. 8 Similarity Transformations Section 1 Dilation
In 1 – 3, apply a dilation centered at the origin with the given scale factor, k, to find the image of
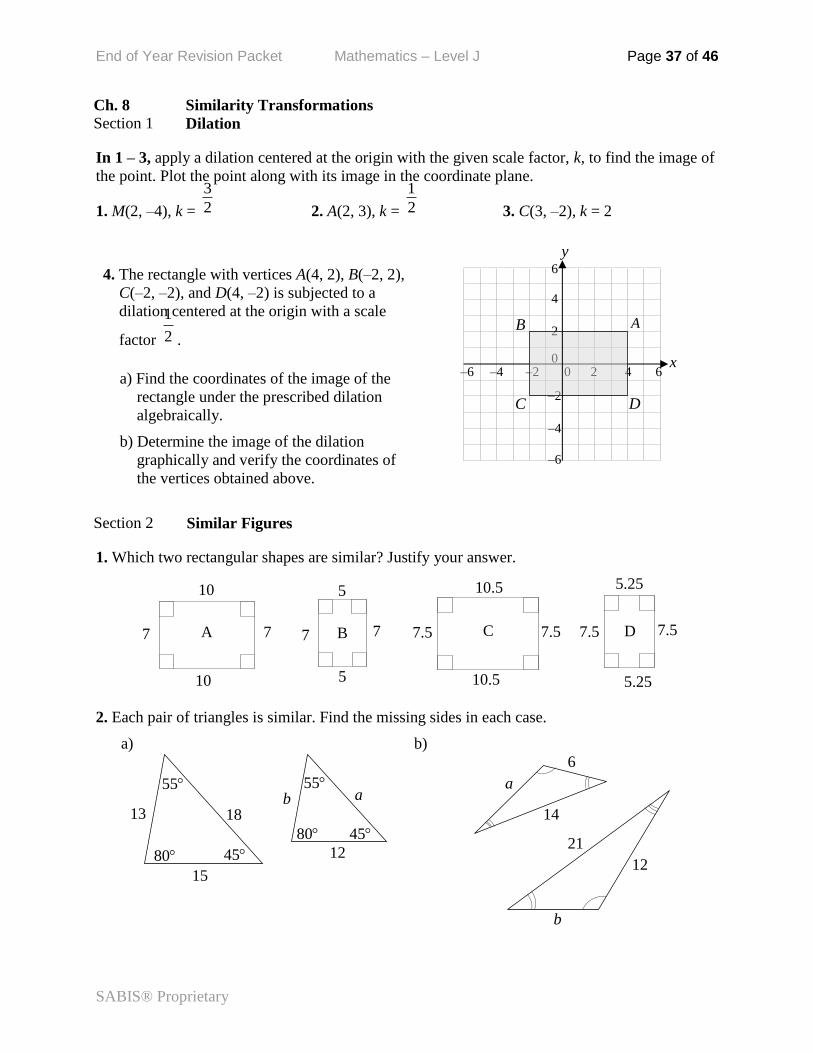
the point. Plot the point along with its image in the coordinate plane.
1. M(2, –4), k =
3
2 2. A(2, 3), k =
1
2 3. C(3, –2), k = 2
4. The rectangle with vertices A(4, 2), B(–2, 2),
C(–2, –2), and D(4, –2) is subjected to a
dilation centered at the origin with a scale
factor
1
2 .
a) Find the coordinates of the image of the
rectangle under the prescribed dilation
algebraically.
b) Determine the image of the dilation
graphically and verify the coordinates of
the vertices obtained above.
Section 2 Similar Figures
1. Which two rectangular shapes are similar? Justify your answer.
10
10
7 7 A
10.5
10.5
7.5 7.5 C
5.25
5.25
7.5 7.5 D
5
5
7 7 B
2. Each pair of triangles is similar. Find the missing sides in each case.
a) b)
D
x
y
–6 –4 –2 0 2 4 6
6
4
2
0
–2
–4
–6
A
C
B
45 80
55
15
13 18
45 80
55
12
a b
21
12
b
14
a
6
End of Year Revision Packet Mathematics – Level J Page 38 of 46
SABIS® Proprietary
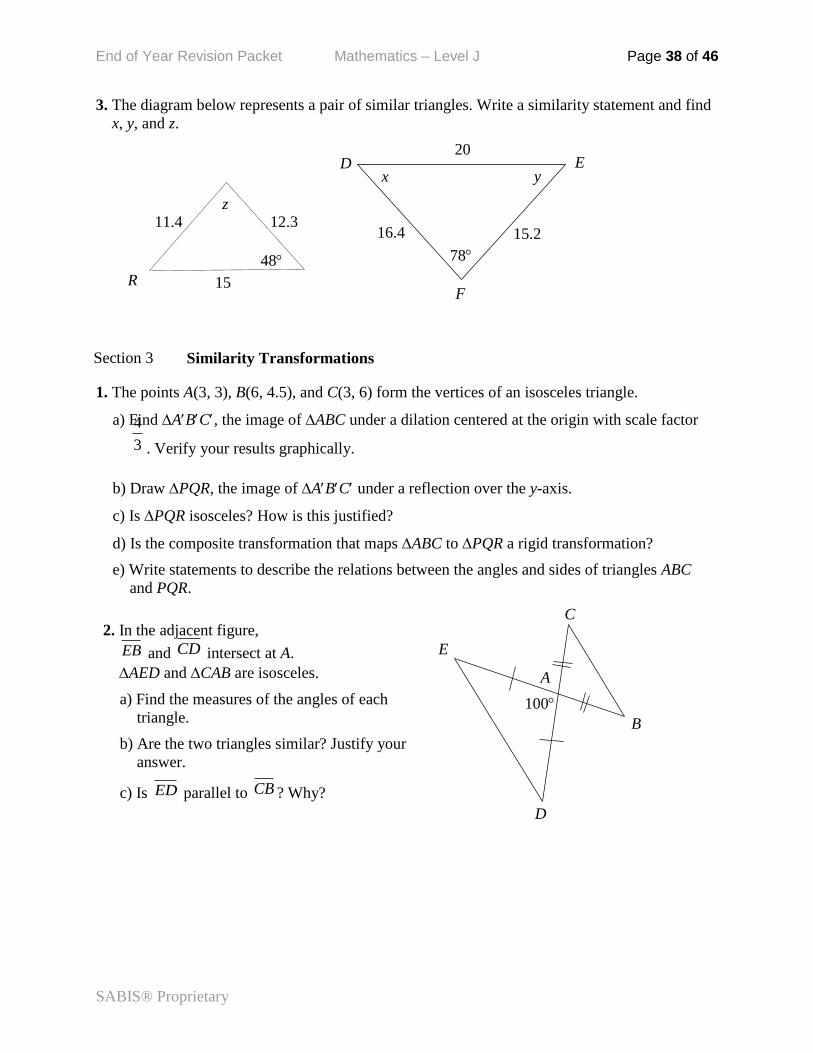
3. The diagram below represents a pair of similar triangles. Write a similarity statement and find
x, y, and z.
R
12.3 11.4
15
48
z
78
E 20
x y D
F
15.2 16.4
Section 3 Similarity Transformations
1. The points A(3, 3), B(6, 4.5), and C(3, 6) form the vertices of an isosceles triangle.
a) Find ABC, the image of ABC under a dilation centered at the origin with scale factor 4
3 . Verify your results graphically.
b) Draw PQR, the image of ABC under a reflection over the y-axis.
c) Is PQR isosceles? How is this justified?
d) Is the composite transformation that maps ABC to PQR a rigid transformation?
e) Write statements to describe the relations between the angles and sides of triangles ABC
and PQR.
2. In the adjacent figure,
EB and CD intersect at A.
AED and CAB are isosceles.
a) Find the measures of the angles of each
triangle.
b) Are the two triangles similar? Justify your
answer.
c) Is ED parallel to CB ? Why?
100
A
B
C
D
E
End of Year Revision Packet Mathematics – Level J Page 39 of 46
SABIS® Proprietary
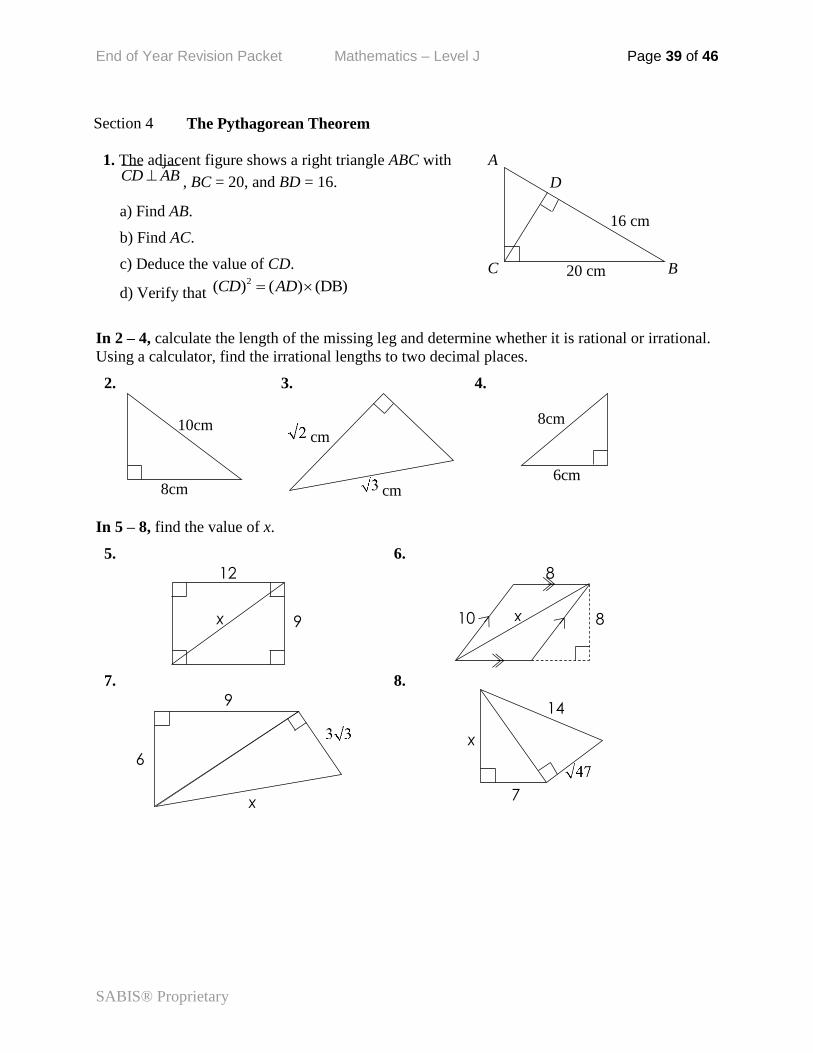
Section 4 The Pythagorean Theorem
1. The adjacent figure shows a right triangle ABC with CD AB , BC = 20, and BD = 16.
a) Find AB.
b) Find AC.
c) Deduce the value of CD.
d) Verify that 2( ) ( ) (DB)CD AD
In 2 – 4, calculate the length of the missing leg and determine whether it is rational or irrational.
Using a calculator, find the irrational lengths to two decimal places.
2. 3. 4.
In 5 – 8, find the value of x.
5. 6.
7. 8.
16 cm
20 cm
A
C B
D
10cm
8cm cm
cm
8cm
6cm
9
12
x
8
8 10 x
6
9
x 7
x
14
End of Year Revision Packet Mathematics – Level J Page 40 of 46
SABIS® Proprietary
Section 5 Applications of the Pythagorean Theorem
In 1 - 2, show that the triangle with vertices P, Q, and R is right.
1. P(2, 6), Q(7, 6) and R(3, 4) 2. P(–4, 3), Q(–2, 8) and R(3, 6)
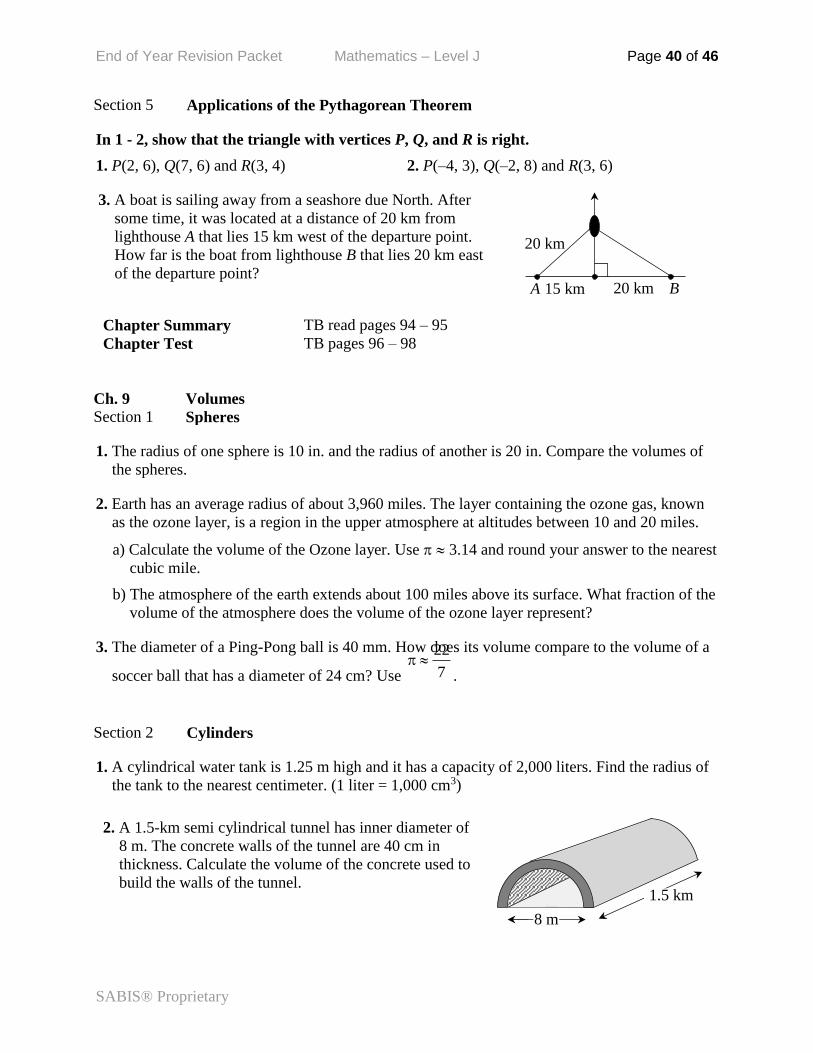
3. A boat is sailing away from a seashore due North. After
some time, it was located at a distance of 20 km from
lighthouse A that lies 15 km west of the departure point.
How far is the boat from lighthouse B that lies 20 km east
of the departure point?
Chapter Summary
TB read pages 94 – 95 Chapter Test TB pages 96 – 98
Ch. 9 Volumes Section 1 Spheres
1. The radius of one sphere is 10 in. and the radius of another is 20 in. Compare the volumes of
the spheres.
2. Earth has an average radius of about 3,960 miles. The layer containing the ozone gas, known
as the ozone layer, is a region in the upper atmosphere at altitudes between 10 and 20 miles.
a) Calculate the volume of the Ozone layer. Use 3.14 and round your answer to the nearest
cubic mile.
b) The atmosphere of the earth extends about 100 miles above its surface. What fraction of the
volume of the atmosphere does the volume of the ozone layer represent?
3. The diameter of a Ping-Pong ball is 40 mm. How does its volume compare to the volume of a
soccer ball that has a diameter of 24 cm? Use
22
7
.
Section 2 Cylinders
1. A cylindrical water tank is 1.25 m high and it has a capacity of 2,000 liters. Find the radius of
the tank to the nearest centimeter. (1 liter = 1,000 cm3)
2. A 1.5-km semi cylindrical tunnel has inner diameter of
8 m. The concrete walls of the tunnel are 40 cm in
thickness. Calculate the volume of the concrete used to
build the walls of the tunnel.
15 km 20 km
20 km
A B
8 m
1.5 km
End of Year Revision Packet Mathematics – Level J Page 41 of 46
SABIS® Proprietary
3. A cubic piece of brass that has a side of 10 cm is melted and shaped as a cylinder.
a) Calculate the height of the cylinder if it has diameter is 10 cm.
b) If instead the cylinder formed has a height of 10 cm, find its diameter.
Section 3 Cones
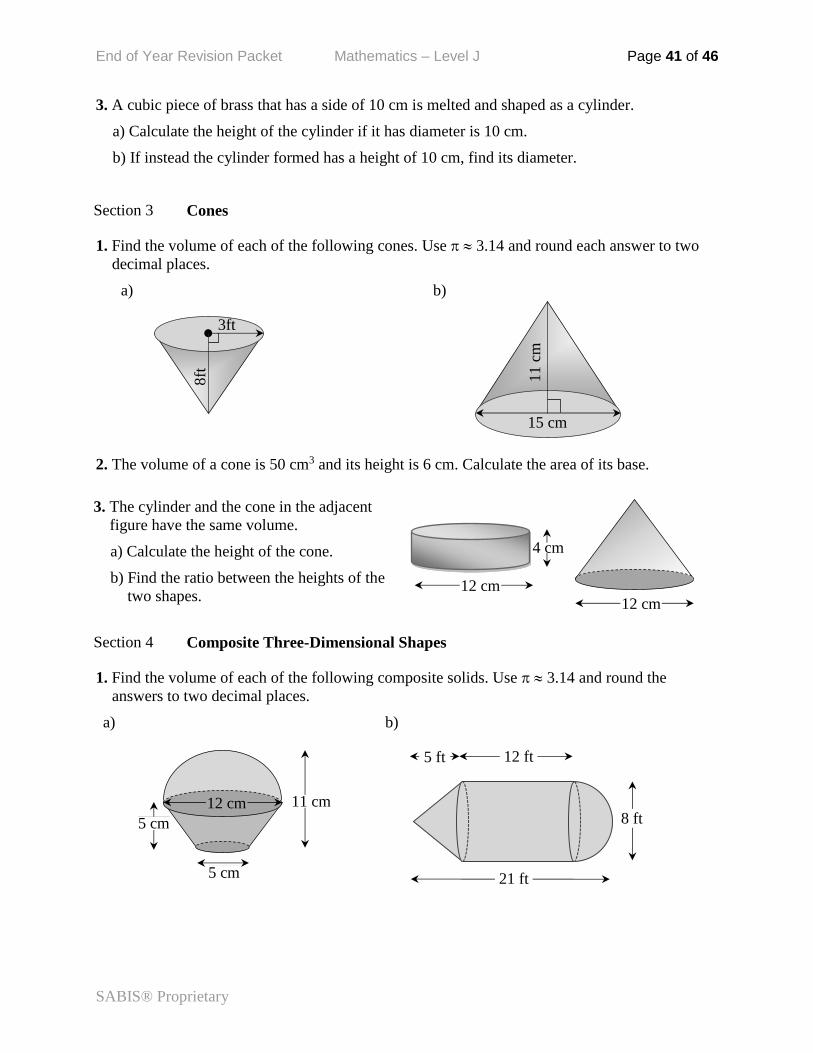
1. Find the volume of each of the following cones. Use 3.14 and round each answer to two
decimal places.
a) b)
2. The volume of a cone is 50 cm3 and its height is 6 cm. Calculate the area of its base.
3. The cylinder and the cone in the adjacent
figure have the same volume.
a) Calculate the height of the cone.
b) Find the ratio between the heights of the
two shapes.
Section 4 Composite Three-Dimensional Shapes
1. Find the volume of each of the following composite solids. Use 3.14 and round the
answers to two decimal places.
a) b)
8ft
3ft
11 c
m
15 cm
12 cm 12 cm
4 cm
12 cm
5 cm
11 cm
v v 5 cm
12 ft 5 ft
8 ft
21 ft
End of Year Revision Packet Mathematics – Level J Page 42 of 46
SABIS® Proprietary
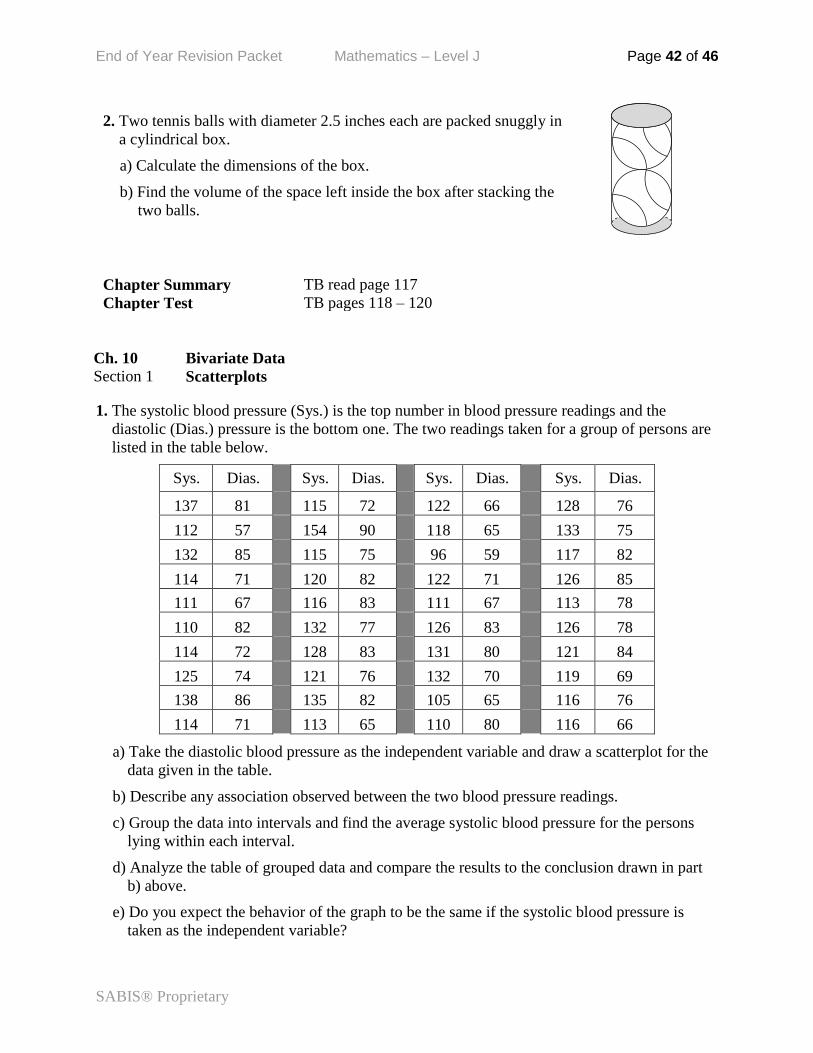
2. Two tennis balls with diameter 2.5 inches each are packed snuggly in
a cylindrical box.
a) Calculate the dimensions of the box.
b) Find the volume of the space left inside the box after stacking the
two balls.
Chapter Summary
TB read page 117 Chapter Test TB pages 118 – 120
Ch. 10 Bivariate Data Section 1 Scatterplots
1. The systolic blood pressure (Sys.) is the top number in blood pressure readings and the
diastolic (Dias.) pressure is the bottom one. The two readings taken for a group of persons are
listed in the table below.
Sys. Dias. Sys. Dias. Sys. Dias. Sys. Dias.
137 81 115 72 122 66 128 76
112 57 154 90 118 65 133 75
132 85 115 75 96 59 117 82
114 71 120 82 122 71 126 85
111 67 116 83 111 67 113 78
110 82 132 77 126 83 126 78
114 72 128 83 131 80 121 84
125 74 121 76 132 70 119 69
138 86 135 82 105 65 116 76
114 71 113 65 110 80 116 66
a) Take the diastolic blood pressure as the independent variable and draw a scatterplot for the
data given in the table.
b) Describe any association observed between the two blood pressure readings.
c) Group the data into intervals and find the average systolic blood pressure for the persons
lying within each interval.
d) Analyze the table of grouped data and compare the results to the conclusion drawn in part
b) above.
e) Do you expect the behavior of the graph to be the same if the systolic blood pressure is
taken as the independent variable?
End of Year Revision Packet Mathematics – Level J Page 43 of 46
SABIS® Proprietary
In 2 - 5, identify the dependent and the independent variables and discuss the cases where you
think the variables do not depend on each other.
2. The green areas in neighborhoods and the levels of carbon dioxide
3. The average temperature during a summer week and the number of people going to the lake
4. The circumference of the trunk of a tree and its height
5. The price of gas over a weekend and the average number of miles driven by families going on
trips
Section 2 Types of Associations
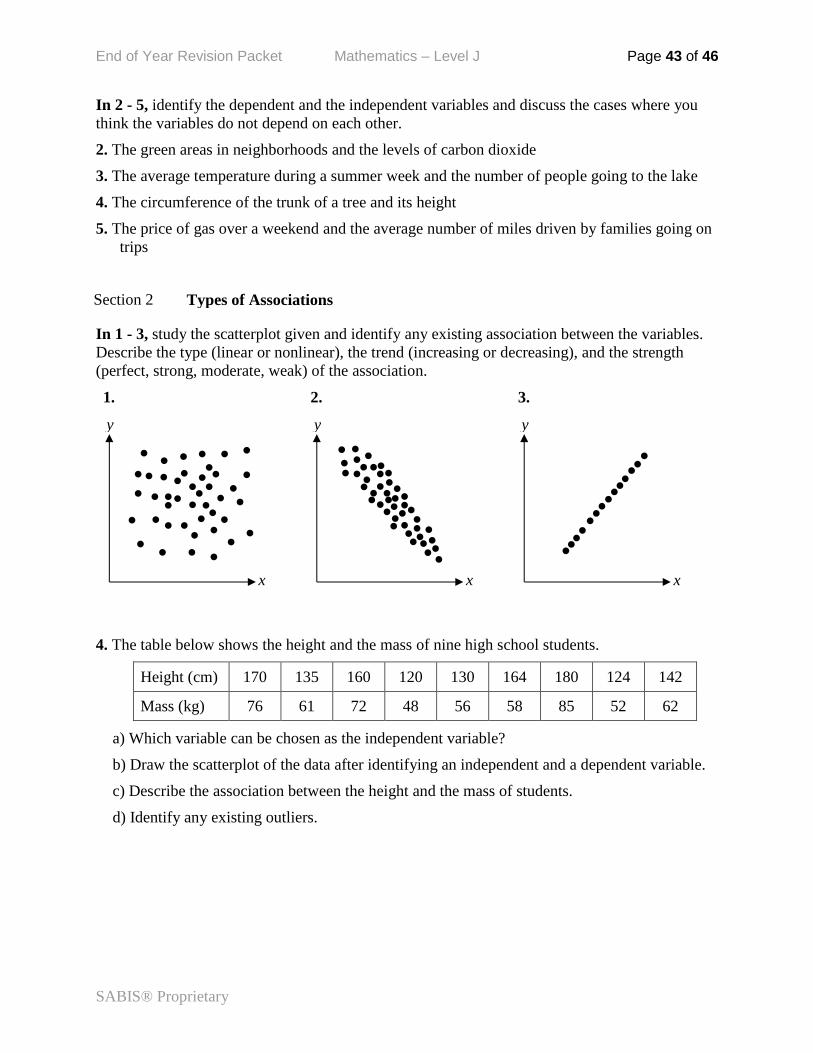
In 1 - 3, study the scatterplot given and identify any existing association between the variables.
Describe the type (linear or nonlinear), the trend (increasing or decreasing), and the strength
(perfect, strong, moderate, weak) of the association.
1. 2. 3.
4. The table below shows the height and the mass of nine high school students.
Height (cm) 170 135 160 120 130 164 180 124 142
Mass (kg) 76 61 72 48 56 58 85 52 62
a) Which variable can be chosen as the independent variable?
b) Draw the scatterplot of the data after identifying an independent and a dependent variable.
c) Describe the association between the height and the mass of students.
d) Identify any existing outliers.
x
y
x
y
x
y
End of Year Revision Packet Mathematics – Level J Page 44 of 46
SABIS® Proprietary
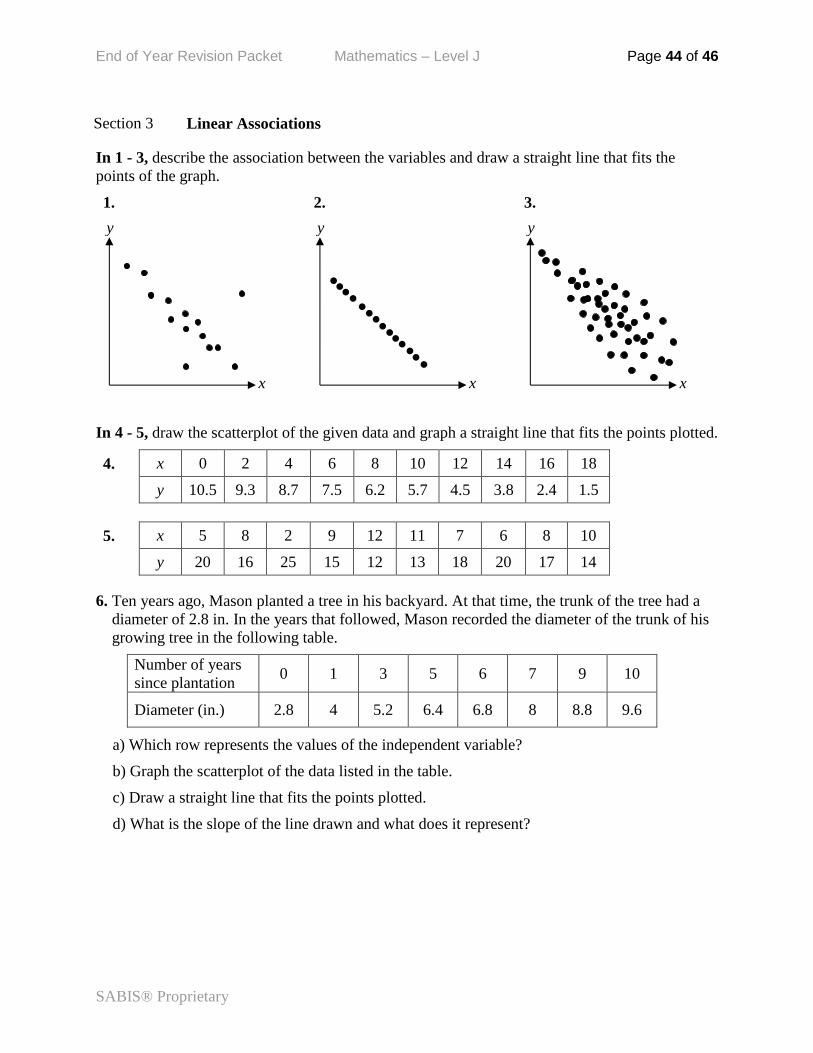
Section 3 Linear Associations
In 1 - 3, describe the association between the variables and draw a straight line that fits the
points of the graph.
1. 2. 3.
In 4 - 5, draw the scatterplot of the given data and graph a straight line that fits the points plotted.
4. x 0 2 4 6 8 10 12 14 16 18
y 10.5 9.3 8.7 7.5 6.2 5.7 4.5 3.8 2.4 1.5
5. x 5 8 2 9 12 11 7 6 8 10
y 20 16 25 15 12 13 18 20 17 14
6. Ten years ago, Mason planted a tree in his backyard. At that time, the trunk of the tree had a
diameter of 2.8 in. In the years that followed, Mason recorded the diameter of the trunk of his
growing tree in the following table.
Number of years
since plantation 0 1 3 5 6 7 9 10
Diameter (in.) 2.8 4 5.2 6.4 6.8 8 8.8 9.6
a) Which row represents the values of the independent variable?
b) Graph the scatterplot of the data listed in the table.
c) Draw a straight line that fits the points plotted.
d) What is the slope of the line drawn and what does it represent?
x
y
x
y
x
y
End of Year Revision Packet Mathematics – Level J Page 45 of 46
SABIS® Proprietary
Section 4 Linear Models
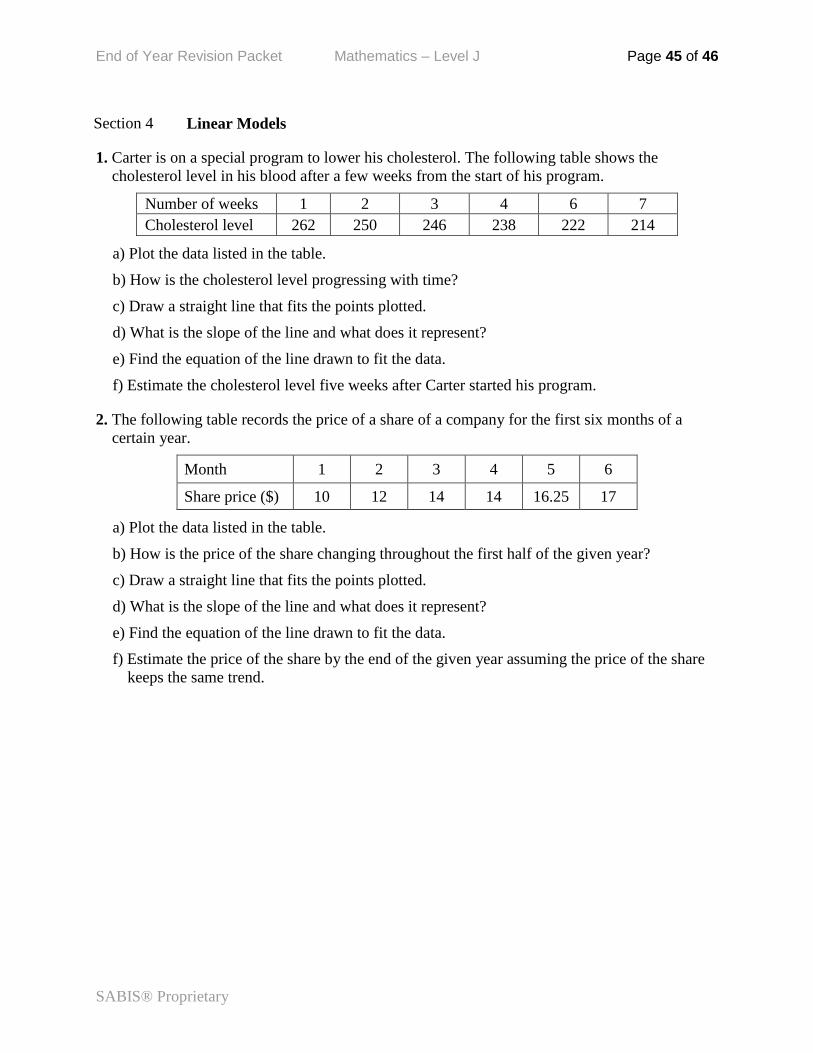
1. Carter is on a special program to lower his cholesterol. The following table shows the
cholesterol level in his blood after a few weeks from the start of his program.
Number of weeks 1 2 3 4 6 7
Cholesterol level 262 250 246 238 222 214
a) Plot the data listed in the table.
b) How is the cholesterol level progressing with time?
c) Draw a straight line that fits the points plotted.
d) What is the slope of the line and what does it represent?
e) Find the equation of the line drawn to fit the data.
f) Estimate the cholesterol level five weeks after Carter started his program.
2. The following table records the price of a share of a company for the first six months of a
certain year.
Month 1 2 3 4 5 6
Share price ($) 10 12 14 14 16.25 17
a) Plot the data listed in the table.
b) How is the price of the share changing throughout the first half of the given year?
c) Draw a straight line that fits the points plotted.
d) What is the slope of the line and what does it represent?
e) Find the equation of the line drawn to fit the data.
f) Estimate the price of the share by the end of the given year assuming the price of the share
keeps the same trend.
End of Year Revision Packet Mathematics – Level J Page 46 of 46
SABIS® Proprietary
Section 5 Associations in Categorical Data
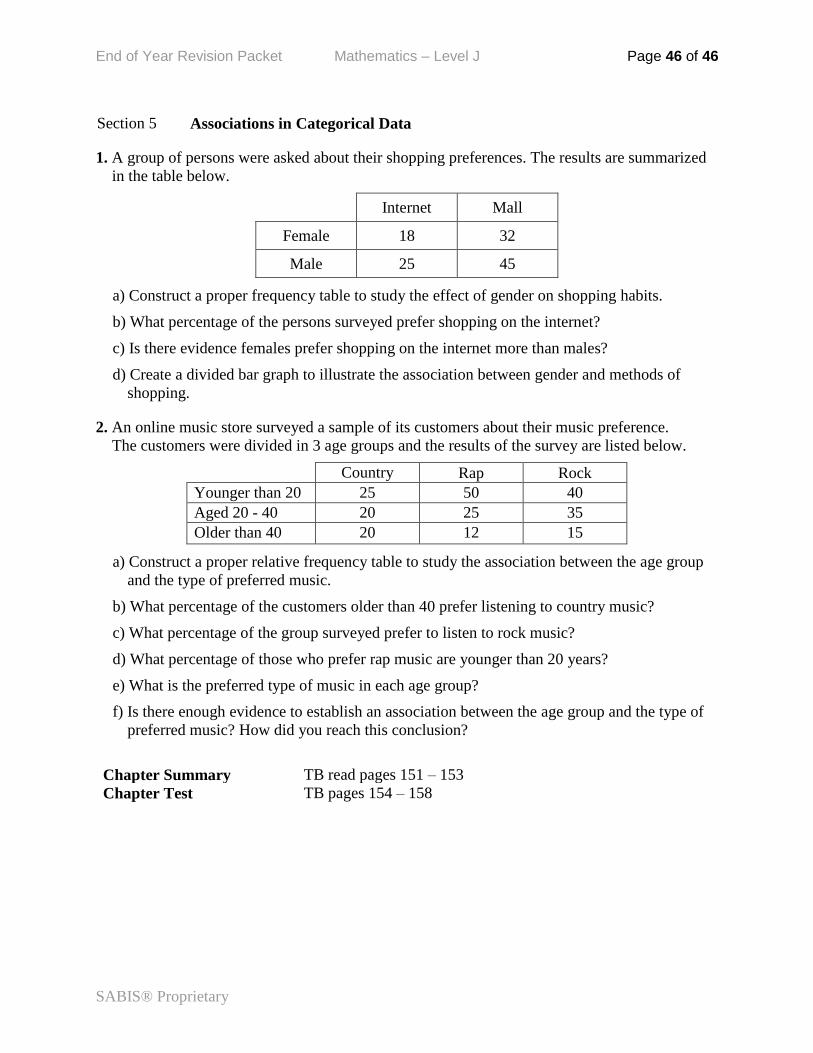
1. A group of persons were asked about their shopping preferences. The results are summarized
in the table below.
Internet Mall
Female 18 32
Male 25 45
a) Construct a proper frequency table to study the effect of gender on shopping habits.
b) What percentage of the persons surveyed prefer shopping on the internet?
c) Is there evidence females prefer shopping on the internet more than males?
d) Create a divided bar graph to illustrate the association between gender and methods of
shopping.
2. An online music store surveyed a sample of its customers about their music preference.
The customers were divided in 3 age groups and the results of the survey are listed below.
Country Rap Rock
Younger than 20 25 50 40
Aged 20 - 40 20 25 35
Older than 40 20 12 15
a) Construct a proper relative frequency table to study the association between the age group
and the type of preferred music.
b) What percentage of the customers older than 40 prefer listening to country music?
c) What percentage of the group surveyed prefer to listen to rock music?
d) What percentage of those who prefer rap music are younger than 20 years?
e) What is the preferred type of music in each age group?
f) Is there enough evidence to establish an association between the age group and the type of
preferred music? How did you reach this conclusion?
Chapter Summary
TB read pages 151 – 153 Chapter Test TB pages 154 – 158
Related Documents