EMPLOYMENT PROMOTION International Labour Organization DECENT WORK TECHNICAL SUPPORT TEAM AND COUNTRY OFFICE FOR CENTRAL AND EASTERN EUROPE Report on the Methodology, Organization and Results of a Modular Sample Survey on Labour Migration in Ukraine

Welcome message from author
This document is posted to help you gain knowledge. Please leave a comment to let me know what you think about it! Share it to your friends and learn new things together.
Transcript
EMPLOYMENT
PROMOTION
InternationalLabourOrganization
DECENT WORK TECHNICAL SUPPORT TEAM AND COUNTRY OFFICE FOR CENTRAL AND EASTERN EUROPE
Report on the Methodology, Organization and Results ofa Modular Sample Survey on Labour Migration in Ukraine

Report on the Methodology, Organization and Results of a Modular Sample Survey on Labour Migration in Ukraine
State Statistics Service of Ukraine
Ptoukha Institute for Demography and Social Studies, National Academy of Sciences of Ukraine
International Labour Organization
Copyright © International Labour Organization 2013First published 2013
Publications of the International Labour Office enjoy copyright under Protocol 2 of the Universal Copyright Convention. Nevertheless, short excerpts from them may be reproduced without authorization, on condition that the source is indicated. For rights of reproduction or translation, application should be made to ILO Publications (Rights and Permissions), International Labour Office, CH-1211 Geneva 22, Switzerland, or by email: [email protected]. The International Labour Office welcomes such applications.
Libraries, institutions and other users registered with reproduction rights organizations may make copies in accordance with the licences issued to them for this purpose. Visit www.ifrro.org to find the reproduction rights organization in your country.
ILO Cataloguing in Publication Data
Report on the Methodology, Organization and Results of a Modular Sample Survey on Labour Migration in Ukraine / International Labour Organization, Decent Work Technical Support Team and Country Office for Central and Eastern Europe (DWT/CO-Budapest). – Budapest: ILO, 2013
ISBN 978-92-2-127892-4 (print); 978-92-2-127893-1 (web pdf)
International Labour Organization; ILO Decent Work Technical Support Team and Country Office for Central and Eastern Europe
labour migration / migrant worker / survey / data collecting / methodology
14.09.1
Also available in Ukrainian: Звіт щодо методології, організації проведення та результатів модульного вибіркового обстеження з питань трудової міграції в Україні (ISBN 978-92-2-827892-7, Budapest, 2013).
This publication has been produced with the assistance of the European Union. The contents of this publication are the sole responsibility of the authors and can in no way be taken to reflect the views of the European Union.
The designations employed in ILO publications, which are in conformity with United Nations practice, and the presentation of material therein do not imply the expression of any opinion whatsoever on the part of the International Labour Office concerning the legal status of any country, area or territory or of its authorities, or concerning the delimitation of its frontiers.
The responsibility for opinions expressed in signed articles, studies and other contributions rests solely with their authors, and publication does not constitute an endorsement by the International Labour Office of the opinions expressed in them.
Reference to names of firms and commercial products and processes does not imply their endorsement by the International Labour Office, and any failure to mention a particular firm, commercial product or process is not a sign of disapproval.
ILO publications and electronic products can be obtained through major booksellers or ILO local offices in many countries, or direct from ILO Publications, International Labour Office, CH-1211 Geneva 22, Switzerland. Catalogues or lists of new publications are available free of charge from the above address, or by email: [email protected]
Visit our website: www.ilo.org/publns
Printed in Ukraine
3
Project funded by the European Union
EU-ILO Project «Effective Governance of Labour Migration and its Skill Dimensions»
The publication was developed and printed within the framework of the EU-ILO Project “Effective Governance of Labour Migration and its Skill Dimensions”.
For more detailed information contact the Project by e-mail:
http://ilo.org.ua/ProjectsIloArticles/EU-ILO_Migrant.aspx
http://www.ilo.org/budapest/lang--en/index.htm
Project Brief: EU-ILO Project in Moldova and Ukraine “Effective Governance of Labour Migration and its Skill Dimensions”
This project is implemented by the International Labour Organization in cooperation with Moldovan and Ukrainian tripartite partners, the International Organization for Migration and the World Bank. The project is in the framework of the European Commission’s thematic programme of cooperation with third countries in the areas of migration and asylum.
The overall objective of the project is to strengthen Moldova’s and Ukraine’s capacity to regulate labour migration and promote sustainable return, with a particular focus on enhancing human resources capital and preventing skills waste.
This publication was printed with the support of the European Union

4
5
Table of Contents
Page
Foreword ..................................................................................................................... 7
Introduction .................................................................................................................. 9
Chapter 1: Methodological Basics of the Labour Migration Survey ............................. 11
1.1 Definition of the Term “Migrant Worker” and Its Use for the Survey Purposes ................................................................................ 11
1.2 Survey Program ............................................................................................ 13
1.3 Organizational Aspects of the Survey ........................................................... 15
1.3.1 Survey Team ....................................................................................... 15
1.3.2 Survey Toolkit Appraisal ...................................................................... 16
1.4 Description of the Sample Design and Data Processing Procedures ........... 19
1.4.1 Sample Design ................................................................................... 19
1.4.2 Estimation of Indicators Based on the LMS Results ........................... 23
1.4.3 Sampling Error Estimates ................................................................... 25
1.4.4 Overall Characteristic of the Survey Results ...................................... 26
Chapter 2: Analysis of the Labour Migration Survey Results ...................................... 29
2.1 Socio-demographic Characteristics and Geographical Destinations of Migrant Workers ............................................................................................ 29
2.1.1 Marital Status ...................................................................................... 30
2.1.2 Age Structure ...................................................................................... 31
2.1.3 Education ............................................................................................ 32
2.1.4 Geographical Trends .......................................................................... 36
2.1.5 Territorial Differentiation of Ukrainian Labour Migration ...................... 37
2.1.6 Frequency and Duration of Labour Migrations ................................... 40
Report on the Methodology, Organization and Results of a Modular Sample Survey on Labour Migration in Ukraine
6
2.2 Socio-economic Characteristics of Migrant Workers ..................................... 41
2.2.1 Legal Migration Status ........................................................................ 41
2.2.2 Ways of Job Placement Abroad .......................................................... 43
2.2.3 Employment Status ............................................................................ 44
2.2.4 Economic Activity Types ..................................................................... 45
2.2.5 Occupational Groups .......................................................................... 47
2.2.6 Employment Agreement ..................................................................... 50
2.2.7 Working Conditions ............................................................................. 51
2.2.8 Labour Remuneration ......................................................................... 55
2.2.9 Accommodation Expenses and Directions of the Use of Funds ......... 57
2.3 Impact of Labour Migration on Household Welfare ....................................... 60
2.4 Intentions of Ukrainians Concerning Labour Migration Abroad ..................... 63
Conclusions ................................................................................................................. 69
Annex A: Tables of Reliability Estimates of Labour Migration Survey Data ................. 73
Annex B: Statistical Tables of Main Findings Labour Migration Survey ....................... 75
7
Foreword
In a globalized economy, international migration is becoming an increasingly complex phenomenon that directly or indirectly relates to the world of work. Migration for employment is very much a part of the global agenda of the International Labour Organization, which is based on the vision of decent work for all.
Effective, credible and enforceable national policies and practices regarding labour migration and the protection of migrant workers require a comprehensive statistical base to ensure effective governance and policy implementation. Labour migration statistics allow us to assess the scope and structure of migration. They also reveal the characteristics of migrant workers in order to be able to address their needs and challenges, including those of their families.
This report contains the results of a survey on labour migration conducted within the EU-funded ILO Project “Effective Governance of Labour Migration and its Skill Dimensions”. The survey was made possible by the effective collaboration of the State Statistics Service of Ukraine, Ptoukha Institute for Demography and Social Studies of National Academy of Sciences of Ukraine and comprehensive methodological support by Ms. Elisa Benes, Senior expert at the ILO Department of Statistics in Geneva. Special thanks are due to the ILO project team for their support and valuable contributions along the entire survey process, in particular to Ms. Natalia Popova, Senior Employment and Skills specialist, Ms. Tetyana Minenko, national project coordinator, and to Mr. Francesco Panzica, an international expert on migration and employment. We trust that the results of this report will serve as a valuable information base for making informed policy decisions on labour migration regulation, the promotion of a sustainable return of migrant workers and prevent deskilling and skills waste.
Antonio GraziosiDirectorILO DWT/CO–Budapest

9
Introduction
Emigration for labour or employment purposes by Ukrainian nationals is an issue of particular significance in the system of migratory processes in Ukraine. Ukraine is currently one of the largest migrant sending countries in Europe. Its nationals work in West European countries, in new European Union member states, in the CIS and even further abroad. A critical factor prompting the spread of labour migration is the considerable wage gap between Ukraine and main foreign destination countries (especially if calculated in a foreign currency at the official exchange rate).
Most indicators of Ukraine’s socio-economic development suffer markedly in comparison to European standards; job placement opportunities in Ukraine’s official labour market remain limited; employment in the formal economy fails to guarantee adequate social protection. Under such conditions, labour migration is one of the few options for securing acceptable living standards for a considerable portion of Ukraine’s economically active population.
Although Ukraine is a migrant sending country, governance and regulation of labour migration has not been given due regard until recently. Throughout the past twenty years, a number of laws have been passed in Ukraine aimed at regulating migration processes. Provisions dealing with regulation of migration have been included in the Concept and Strategy of Demographic Development of Ukraine for 2006–2015 approved by the Cabinet of Ministers of Ukraine. On the whole, formulation of Ukraine’s migration policy has still evolving.
The State’s activity on the issue of migration became more apparent only at the end of 2010 and early 2011. In early 2011, the Government of Ukraine expressed noteworthy interest in developing policies regulating labour migration and protecting migrants’ rights, particularly as regards encouraging the return of migrants to their homeland. In 2011, the Concept of the Migration Policy of Ukraine was drafted and approved by a Decree of the President of Ukraine and an Action Plan for its realization was developed and adopted. Implementation of the approved migration policy measures is of contemporary relevance. The availability of appropriate information and support is a necessary precondition for achieving higher efficiencies in labour migration regulation and governance.
In the framework of the European Union’s Effective Governance of Labour Migration and Its Skill Dimensions Project implemented by the International Labour Organization (ILO) together with Moldovan and Ukrainian constituents and its partners, the International
Report on the Methodology, Organization and Results of a Modular Sample Survey on Labour Migration in Ukraine
10
Organization for Migration (IOM) and the World Bank (WB) in Ukraine and Moldova, the M.V. Ptoukha Institute for Demography and Social Studies NAS of Ukraine and the State Statistics Service of Ukraine, conducted a modular sample population (household) survey on labour migration (hereinafter referred to as the labour migration survey) in April–June 2012. This survey is the second nation-wide labour migration survey. The first survey on this subject was conducted within the framework of the Labour Migration Survey in Ukraine Project by the Ukrainian Centre for Social Reforms and the State Statistics Committee of Ukraine in June 2008 with financial and technical support from the Open Ukraine Arseniy Yatseniuk Foundation in association with the Victor Pinchuk Foundation and the World Bank Office in Ukraine.
The labour migration survey programme in 2012 considered the lessons learnt from the 2008 survey and was further refined by ILO experts’ recommendations.
The survey was based on a sample set of households used to conduct a sample population (household) economic activity survey. The sample set size ensures the representative data for the population of the country as a whole.
Based on the survey findings, Ukrainian emigration for employment purposes were estimated on a scientifically grounded basis, main directions of labour migration were determined, and data were obtained concerning socio-economic and demographic profiles of Ukrainian migrant workers. Further, their educational attainments, areas of pre-departure training, working conditions and income levels, and the impact of foreign earnings upon household well-being were collected.
Additionally, estimates were obtained for five territorial zones (North, Centre, South, East, West) which can be applied for qualitative analysis.
The project findings ensure the formation of a reliable analytical base that can be used to make more efficient decisions on state regulation of labour migration, to promote sustainable return of migrant workers and prevent loss of skilled personnel.
The methodology and results of the labour migration survey presented in this report will be useful to a wide range of experts engaged in studies of demography and the labour market in Ukraine as well as to developers of strategic measures in these fields.
The report was prepared by a team of authors under the scientific supervision of E.M. Libanova, Member of the National Academy of Sciences of Ukraine, which consisted of the following experts and scientists:
State Statistics Service of UkraineN.S. VlasenkoI.V. SenykA.V. SolopN.O. KobrianskaL.A. Neverovska
Institute for Demography and Social Studies, NAS of UkraineI.P. Maydanik, Cand. Sc. (Soc.)V.G. Sarioglo, D. Sc. (Econ.)O.V. Pozniak, Cand. Sc. (Econ.)O.V. LysaH.I. Tereshchenko, Cand. Sc. (Econ.)
National Institute for Strategic StudiesO.A. Malynovska, D. Sc. (Pub. Adm.)
11
Chapter 1: Methodological Basics of the Labour Migration Survey
1.1 Definition of the Term “Migrant Worker” and Its Use for the Survey Purposes
International labour migration is a key subject on the agenda of the International Labour Organization (ILO). The 92nd session of the International Labour Conference outlined labour migration-related problems, objectives and opportunities. A comprehensive approach to labour migration governance was included in the ILO Multilateral Framework on Labour Migration (2005) that contains norms, guiding principles and examples of best practice in the sphere of labour migration.
The need for improved labour migration data collection and quality is prompted by numerous factors. They include a lack of focused concepts and definitions concerning migration generally, and labour migration in particular, as well as an absence of information on socio-economic profiles of migrant workers and on the influence of labour migration upon the countries of origin and destination.
The ILO report “Statistics of International Labour Migration” from 1996 aimed to estimate the scope of international migrant workers. It provided the definition of migrant workers as “… persons, who within the determined date or reference period were searching for the job or worked in the country other than of their origin”.
In 1997, the ILO, with financial support from the UN Population Fund, issued a publication entitled International Migration Statistics: Guidelines for Improving Data Collection Systems. It contained sample migration modules for the countries of destination and countries of origin as well as modules for obtaining information on remittances from household members and returning migrant workers.
The UN Recommendation on the Statistics of International Migration, adopted in 1998, determine categories of international migrants for demographic information and reflect the needs of labour migration governance. According to the above-mentioned recommendations, labour migrant (citizens departing to work abroad) – “foreigners admitted by the receiving State for the specific purpose of exercising an economic activity
Report on the Methodology, Organization and Results of a Modular Sample Survey on Labour Migration in Ukraine
12
.
remunerated from within the receiving country. Their length of stay is usually restricted as is the type of employment they can hold”.
Household surveys have an important role to play in collection and improvement of labour migration data, especially concerning socio-economic profiles of migrant workers. For that purpose, the ILO, with financial support from the World Bank, developed a list of questions on labour migration and suggested using it as a labour force survey module as part of population (household) surveys. The said module was piloted in 2006–2007 in four countries (Armenia, Thailand, Ecuador and Egypt).
The development of terminology for the labour migration survey in 2012 used the lessons learnt from the first nationwide survey conducted in 2008, as well as having due regard to the ILO experts’ recommendations on improving the methodology for definition of labour migrant categories and the list of questions.
The survey was specifically directed to migrant workers (including persons searching for a job abroad).
According to the UN Convention on the Protection of the Rights of All Migrant Workers and Members of Their Families, the definition of a migrant worker, as formulated for the use in this survey, included both persons who were or currently are employed abroad and self-employed ones. The survey covered both migrants in a regular or irregular situation, i.e. persons who found employment abroad without a proper permit.
Pursuant to the methodology adopted for this survey, migrant workers are persons, who during the reference period (1 January 2010–17 June 2012) worked abroad or searched for a job abroad. They are also persons who within the reference period had a job abroad but have already returned to Ukraine and also those who were abroad during the survey due to the job performance or search abroad.
Temporary migrant workers and those who have a job and receive a salary in Ukraine, but on business travel abroad, were not included in the survey.
Development of the labour migration survey program took account of labour migration observation peculiarities, particularly their irregular character and different duration, which dictated the need for distinguishing between several respondent groups.
• Returned migrant workers to Ukraine are household members aged 15–70 who returned to Ukraine within the specified reference period after having worked abroad or having searched a job abroad.
• Short-term migrant workers are defined as household members aged 15–70 who were absent from their household for less than a year at least once during the specified observation period (with likely return during the next 12 months) due to working or searching a job abroad (e.g. persons with seasonal or temporary jobs, etc.). Based on the survey results, this category does not include frontier commuting migrants and persons working and receiving wages in Ukraine and making trips abroad for business reasons (e.g. workers of international transport companies, persons on missions, and so forth).
13
Methodological Basics of the Labour Migration Survey
• Emigrant workers are household members aged 15–70 who were working abroad or searching for a job and were absent from their household for 12 months or longer during the specified observation period (including persons absent for less than a year and not planning to return to their household during the next 12 months). This category also includes persons who visited their relatives from time to time on weekends or holidays when being on leave, maintaining the possibility of going back abroad for job continuation or search.
1.2 Survey Program
The labour migration survey is conducted as an additional module of the sample (household) economically active population survey (hereinafter referred to as the EAP survey).
The purpose of the survey is to assess the scale, scope and geographic coverage of Ukrainian citizens’ migration for employment purposes, the socio-demographic composition of migrant workers, including their educational attainment, areas of training before departure abroad, their economic activities, working conditions, frequency and duration of their migration cycles, among others.
The labour migration survey has been developed on the basis of the experience gained in the course of a similar survey in 2008, with due account of the recommendations given by ILO experts.
Subsequently, the age group for which the labour migration issue is examined has been expanded, the reporting period has been revised and the survey toolkit has been amended.
The 2012 survey encompassed persons aged 15–70 permanently residing in their house-holds.
This survey was conducted during the period from April through June 2012.
The reporting period for which the labour migration issues were examined has been set from 1 January 2010 until the start of population surveys in corresponding months of 2012 (depending on the round, through 15 April, 20 May, and 17 June 2012, respectively).
In view of the rather high probability of migrant workers’ absence in households at the time of the survey, it was assumed that answers to the questionnaires could be provided (in addition to the migrant worker him/herself) instead by a household member in possession of information pursuant to the survey program.
The basic survey toolkit includes two survey questionnaires and an interviewer’s methodological guide on the survey organization and methodology.
To ensure a comprehensive level of information on labour migration and of survey organization, the State Statistics Service of Ukraine staff, in cooperation with experts of the M.V. Ptoukha Institute for Demography and Social Studies, NAS of Ukraine, developed a toolkit in the form of annexes to the EAP survey toolkit, namely forms No. 2–EAP
Report on the Methodology, Organization and Results of a Modular Sample Survey on Labour Migration in Ukraine
14
Household questionnaire, No. 1–EAP Questionnaire for sample population (household) economic activity survey, and explanations for an interviewer.
• Annex to form No. 2–EAP consists of Sections A and D.
Section A Migrant worker categories assumes identification of the persons aged 15–70 who, beginning from January 2010 until the start of the survey period in 2012, left for another country for some reasons or returned from abroad. Based on the above-mentioned information, persons who worked or looked for a job abroad are identified as migrant worker.
Section D Remittances from abroad and household well-being examines the issue on receiving any aid from abroad by a household (in cash or in kind) and its impact upon the household’s well-being.
• Annex to form No. 1–EAP consists of Sections B and C.
Section B Migrant worker profiles assumes obtaining information on the persons aged 15–70 who, beginning from January until the start of the survey period, returned after having worked or searched for a job abroad, and who are included in the three following categories:
– returned migrant worker;
– a migrant worker having stayed abroad for less than 12 months (including persons expected to return within a year) – a short-term migrant worker;
– a migrant worker having stayed abroad for 12 months or longer (including persons not expected to return within a year) – an emigrant worker.
Section C Plans of leaving abroad allows studying the intentions of persons aged 15–70 for leaving abroad for a certain purpose within the next 6 months.
Interviewers used information on household composition and socio-demographic profiles of respondents according to form No. 2–EAP Household questionnaire. The questionnaire also allowed for the identification of respondents, namely persons aged 15–70, and grouped absent household members of that age by absence duration (less than 12 months and 12 months or longer).
• Explanation for an interviewer on the organization and methodology of a modular sample (household) survey (hereinafter referred to as the explanation) includes a description of the organizational and methodological basics of the modular survey.
The explanation for an interviewer consists of the following 9 sections:
– goal of the modular sample population survey on labour migration;
– selection of households for the survey;
– survey period;
– survey toolkit;
– interviewer’s work organization procedure;
– modular survey procedure;
15
Methodological Basics of the Labour Migration Survey
– completion procedure for Annex to form No. 2–EAP;
– completion procedure for Annex to form No. 1–EAP.
The above-mentioned explanation contains definitions of key terms used in the questionnaires, information on specifities of provision of answers to the questions, and an organizational chart of the population (household) survey on labour migration.
1.3 Organizational Aspects of the Survey
1.3.1 Survey Team
Staff involved in the organization and conduct of the survey included specialists from the Labour Statistics Department of the State Statistics Service of Ukraine; coordinators (supervisors) – representatives of the labour statistics directorates (sections) of the territorial statistics offices in the Autonomous Republic of Crimea, 24 oblasts, cities of Kyiv and Sevastopol; and interviewers involved in state sample population (household) surveys conducted by the State Statistics Service of Ukraine.
To ensure proper organization of the work of the territorial statistics directorates in the course of surveys conducted by the State Statistics Service of Ukraine, detailed instructions have been developed on work organization for field staff involved in the survey, interviewers selection, survey specificities, questionnaire completion and supervision, and so on.
During the preparation of the labour migration survey program, use was made of the information on the EAP survey concerning household composition to identify persons aged 15–70, categorize them by duration of absence from the households, and obtain socio-demographic profiles of migrant workers.
In the survey preparation stage, the State Statistics Service of Ukraine held a training seminar on “Organizational and methodological aspects of a sample modular population (household) survey on labour migration” for supervisors – representatives of territorial statistics offices on 13–16 March 2012 in Kyiv.
The seminar discussed results of the appraisal performed in 11 pilot regions as well as methodological and organizational aspects of the modular survey and having regard to the recommendations provided by the ILO experts. In particular, attention was focused on main migrant worker’s categories and their determination procedure; the period under survey; question formulation specificities, interviewing sequence and practical lessons on the interviewing sequence, among others.
Prior to commencement of fieldwork, work coordinators (supervisors) held one-day training seminars with 970 interviewers in all 27 regions of Ukraine. The seminars covered the organization and methodology of the labour migration survey, and provided instruction on questionnaire completion procedures and specificities of population survey along with the principal EAP survey.
Report on the Methodology, Organization and Results of a Modular Sample Survey on Labour Migration in Ukraine
16
1.3.2 Survey Toolkit Appraisal
In order to elaborate the organizational and methodological basics of the modular survey program, the State Statistics Service of Ukraine conducted a pilot survey (hereinafter referred to as the program appraisal) from 20 February through 1 March 2012.
The survey program appraisal was performed in 11 regions of the country and covered 20 per cent of the households selected for the EAP survey, which is 1,180 households overall, including 490 in rural areas.
Selection of the areas took regional specificity into consideration, particularly their territorial location relative to state borders of other countries.
The list of oblasts selected for the pilot survey included:
• Vinnytsia oblast – borders on Moldova, and has access to Romania through the neighbouring Odessa oblast and Chernivtsi oblast;
• Volyn oblast – borders on Poland and Belarus;
• Zakarpattia oblast – borders on Poland, Slovakia, Hungary and Romania;
• Ivano-Frankivsk oblast – borders on Romania, and has access to Poland, Slovakia and Hungary through the neighbouring Zakarpattia oblast;
• Luhansk oblast – borders on the Russian Federation;
• Lviv oblast – borders on Poland, and has access to Romania, Slovakia and Hungary through the neighbouring Zakarpattia oblast;
• Rivne oblast – borders on Belarus, and has access to Poland through the neighbouring Volyn oblast and Lviv oblast;
• Ternopil oblast – has no direct access to the state border, but is contiguous to four border oblasts – Rivne oblast, Lviv oblast, Ivano-Frankivsk oblast and Chernivtsi oblast;
• Khmelnytskyi oblast – has no direct access to the state border, but is contiguous to border Chernivtsi oblast;
• Chernivtsi oblast – borders on Moldova and Romania;
• Chernihiv oblast – borders on Belarus and the Russian Federation.
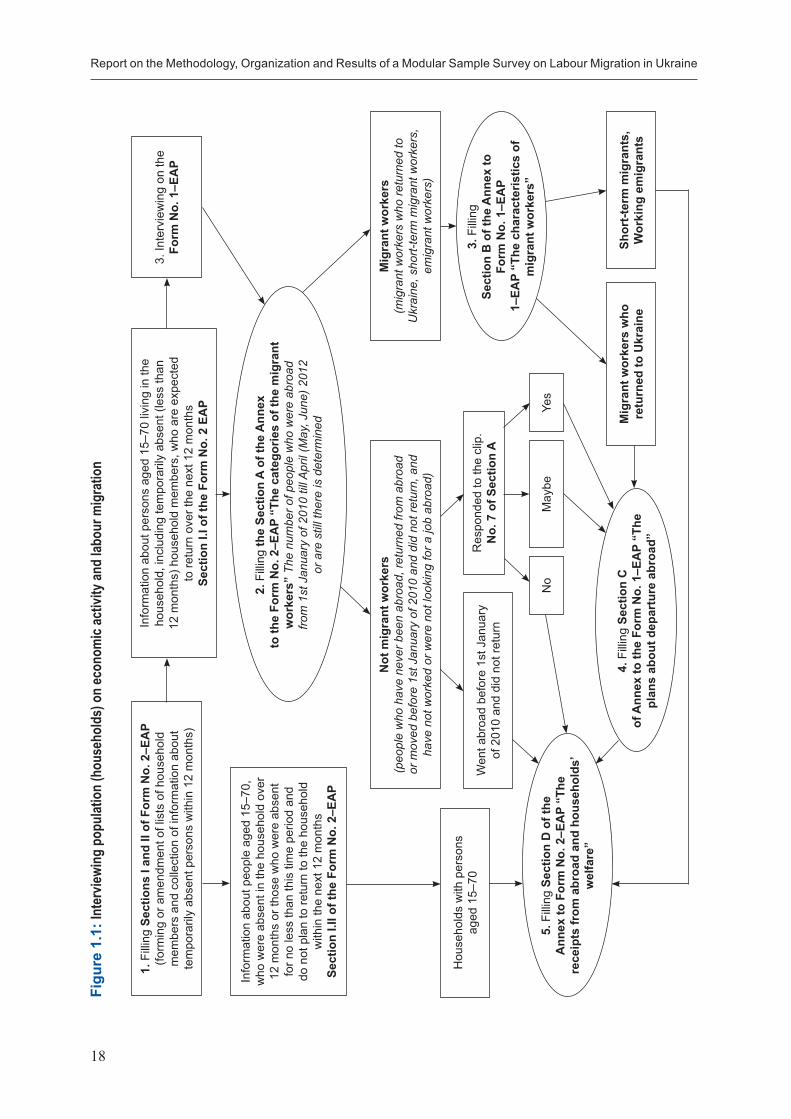
To ensure proper performance of the work, the State Statistics Service of Ukraine circulated detailed instructions to the territorial statistics offices concerning the organization of work in the field, interviewers selection, and peculiarities of population survey along with the EAP survey according to the developed organizational chart (Figure 1.1).
In the course of interviewing, 1,000 households, or 91.5 per cent of the selected quantity, were actually interviewed on labour migration in 11 pilot regions of Ukraine in February 2012.
17
Methodological Basics of the Labour Migration Survey
In the said households, 2.4 thousand persons aged 15–70 were surveyed, of which 5.4 per cent left abroad for employment during the period under survey, 69.3 per cent of them being rural residents.
During the pilot survey, the territorial statistics directorates worked through methodological and organizational aspects of the survey and the contents of the questionnaires (procedure and duration of interviewing, question formulation, questionnaire logic transition rules, special situations and the need to examine them). Based on the appraisal results, the territorial statistics offices summarized and analyzed the comments received from the interviewers and sent them to the State Statistics Service of Ukraine.
The State Statistics Service of Ukraine took consideration of the comments submitted by the territorial statistics directorates (sections) on the survey organization and methodology, and amended the labour migration survey toolkit accordingly.
Report on the Methodology, Organization and Results of a Modular Sample Survey on Labour Migration in Ukraine
18
Figu
re 1
.1: I
nter
viewi
ng p
opul
atio
n (h
ouse
hold
s) o
n ec
onom
ic ac
tivity
and
labou
r mig
ratio
n
1. F
illin
g Se
ctio
ns I
and
II of
For
m N
o. 2
–EA
P (fo
rmin
g or
am
endm
ent o
f lis
ts o
f hou
seho
ld
mem
bers
and
col
lect
ion
of in
form
atio
n ab
out
tem
pora
rily
abse
nt p
erso
ns w
ithin
12
mon
ths)
Info
rmat
ion
abou
t per
sons
age
d 15
–70
livin
g in
the
hous
ehol
d, in
clud
ing
tem
pora
rily
abse
nt (l
ess
than
12
mon
ths)
hou
seho
ld m
embe
rs, w
ho a
re e
xpec
ted
to re
turn
ove
r the
nex
t 12
mon
ths
Sect
ion
I.I o
f the
For
m N
o. 2
EA
P
3. In
terv
iew
ing
on th
e Fo
rm N
o. 1
–EA
P
2. F
illin
g th
e Se
ctio
n A
of th
e A
nnex
to
the
Form
No.
2–E
AP
“The
cat
egor
ies
of th
e m
igra
nt
wor
kers
” Th
e nu
mbe
r of p
eopl
e w
ho w
ere
abro
ad
from
1st
Jan
uary
of 2
010
till A
pril
(May
, Jun
e) 2
012
or a
re s
till t
here
is d
eter
min
ed
Info
rmat
ion
abou
t peo
ple
aged
15–
70,
who
wer
e ab
sent
in th
e ho
useh
old
over
12
mon
ths
or th
ose
who
wer
e ab
sent
fo
r no
less
than
this
tim
e pe
riod
and
do n
ot p
lan
to re
turn
to th
e ho
useh
old
with
in th
e ne
xt 1
2 m
onth
s Se
ctio
n I.I
I of t
he F
orm
No.
2–E
AP
Hou
seho
lds
with
per
sons
ag
ed 1
5–70
Not
mig
rant
wor
kers
(p
eopl
e w
ho h
ave
neve
r bee
n ab
road
, ret
urne
d fro
m a
broa
d or
mov
ed b
efor
e 1s
t Jan
uary
of 2
010
and
did
not r
etur
n, a
nd
have
not
wor
ked
or w
ere
not l
ooki
ng fo
r a jo
b ab
road
)
Mig
rant
wor
kers
(m
igra
nt w
orke
rs w
ho re
turn
ed to
U
krai
ne, s
hort-
term
mig
rant
wor
kers
, em
igra
nt w
orke
rs)
5. F
illin
g Se
ctio
n D
of t
he
Ann
ex to
For
m N
o. 2
–EA
P “T
he
rece
ipts
from
abr
oad
and
hous
ehol
ds’
wel
fare
”
Wen
t abr
oad
befo
re 1
st J
anua
ry
of 2
010
and
did
not r
etur
nR
espo
nded
to th
e cl
ip.
No.
7 o
f Sec
tion
A
No
May
beYe
s
3. F
illin
g Se
ctio
n B
of t
he A
nnex
to
Form
No.
1–E
AP
1–EA
P “T
he c
hara
cter
istic
s of
m
igra
nt w
orke
rs”
4. F
illin
g Se
ctio
n C
of A
nnex
to th
e Fo
rm N
o. 1
–EA
P “T
he
plan
s ab
out d
epar
ture
abr
oad”
Mig
rant
wor
kers
who
re
turn
ed to
Ukr
aine
Shor
t-ter
m m
igra
nts,
W
orki
ng e
mig
rant
s
19
Methodological Basics of the Labour Migration Survey
1.4 Description of the Sample Design and Data Processing Procedures
1.4.1 Sample Design
The sample population (household) survey on labour migration (hereinafter referred to as LMS) was conducted on the basis of a nation-wide representative area sample of households formed to conduct the EAP survey in 20121.
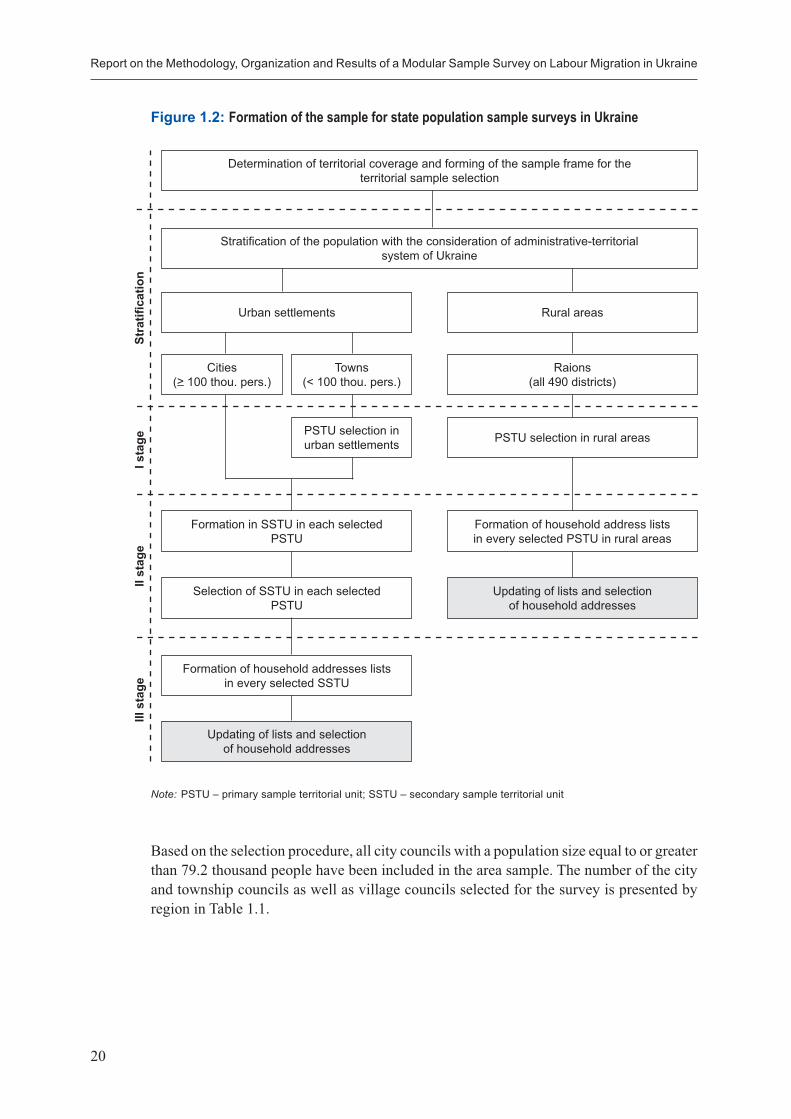
When organizing the EAP survey, the sample is formed according to a stratified multistage selection procedure. The general chart for the formation of sample household populations for the above-mentioned surveys is presented in Figure 1.2.
The sample population forming procedure consists of the following major stages: 1) exclusion of the territories that cannot be surveyed; 2) exclusion of the population ineligible for survey; 3) stratification of the general population; 4) selection of primary sample territorial units; 5) selection of secondary sample territorial units (only for urban settlements); 6) selection of households.
When forming an area sample, rural settlements (village councils) situated in the exclusion zone (zone I of radioactive contamination) and the unconditional (compulsory) relocation zone (zone II) due to the Chernobyl Nuclear Power Plant accident are excluded from the territory of Ukraine. Accordingly, the population living in that territory is also uncounted in the population of Ukraine and respective oblasts. In addition, the institutional population is also uncounted in the population size (fixed-term military servicepersons; persons in places of confinement; persons permanently residing in boarding houses, residential homes for the elderly, and so forth).
The following strata are defined within the boundaries of each region of Ukraine (AR of Crimea, 24 oblasts, cities of Kyiv and Sevastopol) when stratifying the general population: city councils of 100 thousand population or more, city and village councils with less than 100 thousand population, and administrative districts in rural areas (district urban population is not included in rural area strata). The sample size is divided into strata having taken into account the population living therein and the reliability level of the main indicators of the population’s economic activity measures on the basis of the EAP results.
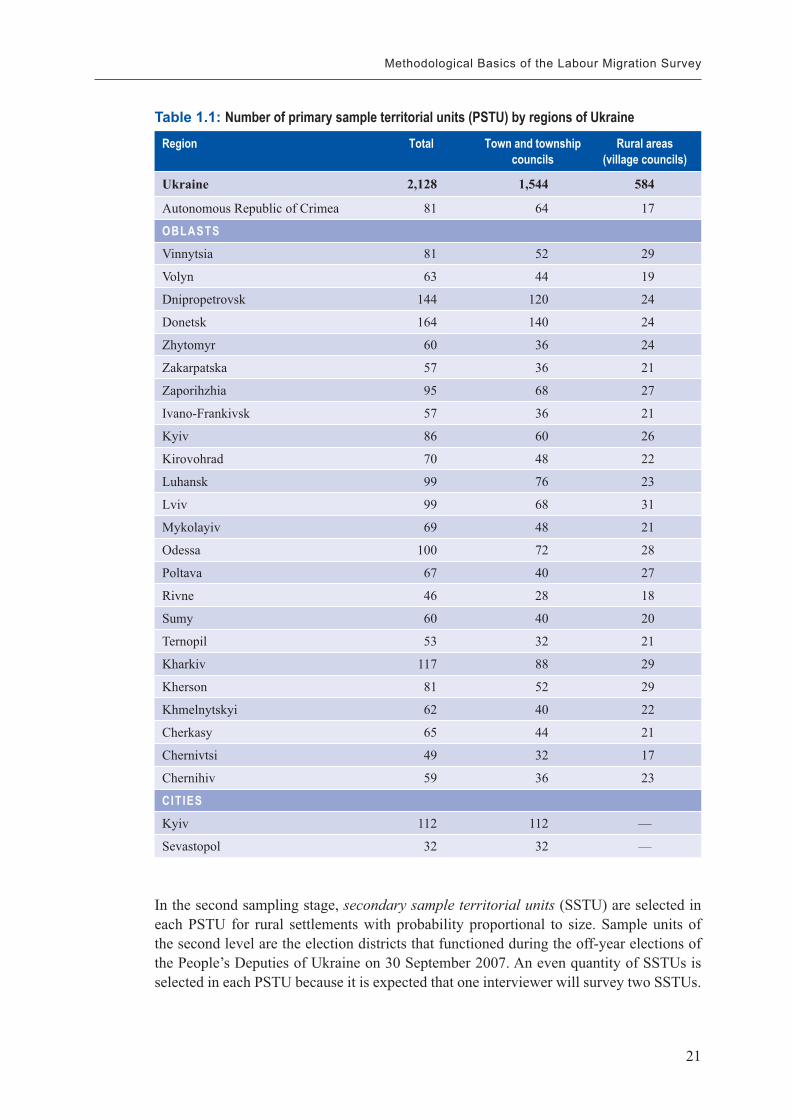
In the first sampling stage, city and township councils in urban settlements and village councils in rural areas are selected with probability proportional to their size (population). The selected territorial units of the first level are primary sample territorial units (PSTU).
1. The methodology for the formation of sample populations for sample population (household) surveys in 2009–2013 on: living conditions, economic activity, and agricultural activity in rural areas, approved by the State Statistics Committee Order No. 308 of 14.08.09.
Report on the Methodology, Organization and Results of a Modular Sample Survey on Labour Migration in Ukraine
20
Figure 1.2: Formation of the sample for state population sample surveys in Ukraine
Note: PSTU – primary sample territorial unit; SSTU – secondary sample territorial unit
Based on the selection procedure, all city councils with a population size equal to or greater than 79.2 thousand people have been included in the area sample. The number of the city and township councils as well as village councils selected for the survey is presented by region in Table 1.1.
Determination of territorial coverage and forming of the sample frame for theterritorial sample selection
Stratifi cation of the population with the consideration of administrative-territorialsystem of Ukraine
Urban settlements
Formation in SSTU in each selectedPSTU
Rural areas
Formation of household address listsin every selected PSTU in rural areas
Raions(all 490 districts)
Cities(>– 100 thou. pers.)
Towns(< 100 thou. pers.)
PSTU selection inurban settlements PSTU selection in rural areas
Selection of SSTU in each selectedPSTU
Updating of lists and selection of household addresses
Formation of household addresses listsin every selected SSTU
Updating of lists and selection of household addresses
Stra
tifi c
atio
nI s
tage
II st
age
III s
tage
21
Methodological Basics of the Labour Migration Survey
Table 1.1: Number of primary sample territorial units (PSTU) by regions of UkraineRegion Total Town and township
councilsRural areas
(village councils)
Ukraine 2,128 1,544 584
Autonomous Republic of Crimea 81 64 17
OBLASTS
Vinnytsia 81 52 29
Volyn 63 44 19
Dnipropetrovsk 144 120 24
Donetsk 164 140 24
Zhytomyr 60 36 24
Zakarpatska 57 36 21
Zaporihzhia 95 68 27
Ivano-Frankivsk 57 36 21
Kyiv 86 60 26
Kirovohrad 70 48 22
Luhansk 99 76 23
Lviv 99 68 31
Mykolayiv 69 48 21
Odessa 100 72 28
Poltava 67 40 27
Rivne 46 28 18
Sumy 60 40 20
Ternopil 53 32 21
Kharkiv 117 88 29
Kherson 81 52 29
Khmelnytskyi 62 40 22
Cherkasy 65 44 21
Chernivtsi 49 32 17
Chernihiv 59 36 23
CITIES
Kyiv 112 112 —
Sevastopol 32 32 —
In the second sampling stage, secondary sample territorial units (SSTU) are selected in each PSTU for rural settlements with probability proportional to size. Sample units of the second level are the election districts that functioned during the off-year elections of the People’s Deputies of Ukraine on 30 September 2007. An even quantity of SSTUs is selected in each PSTU because it is expected that one interviewer will survey two SSTUs.
Report on the Methodology, Organization and Results of a Modular Sample Survey on Labour Migration in Ukraine
22
Households are selected in the final sampling stage. For that purpose, a complete list of household addresses (updated lists of residents or updated lists based on rural household registers) is compiled in each PSTU in rural areas and each SSTU in urban settlements.
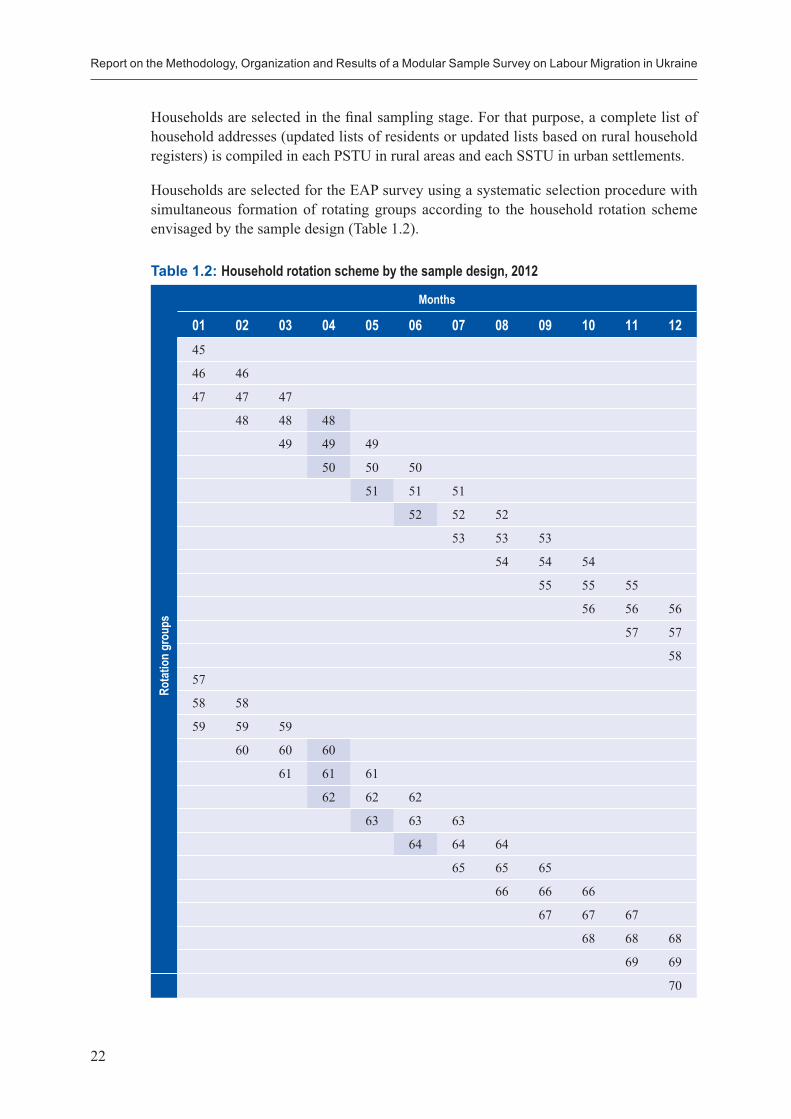
Households are selected for the EAP survey using a systematic selection procedure with simultaneous formation of rotating groups according to the household rotation scheme envisaged by the sample design (Table 1.2).
Table 1.2: Household rotation scheme by the sample design, 2012
Months
01 02 03 04 05 06 07 08 09 10 11 12
Rota
tion
grou
ps
45
46 46
47 47 47
48 48 48
49 49 49
50 50 50
51 51 51
52 52 52
53 53 53
54 54 54
55 55 55
56 56 56
57 57
58
57
58 58
59 59 59
60 60 60
61 61 61
62 62 62
63 63 63
64 64 64
65 65 65
66 66 66
67 67 67
68 68 68
69 69
70
23
Methodological Basics of the Labour Migration Survey
Every rotating group for one interviewer consists of four or five households in urban settlements and of one or two households in rural areas. According to the sampling principle, every rotating group is an independent representative household sample at a certain data aggregation level (e.g. national or regional level). Every month, six rotating groups including 16.6 thousand households take part in the EAP survey.
According to the household rotation scheme in the EAP survey, the LMS involved six rotating groups in April (16.6 thousand households in rotating groups Nos. 48–50 and 60–62) and two rotating groups (about 5.6 thousand households) in May (rotating groups Nos. 51 and 63) and June 2012 (rotating groups Nos. 52 and 64).
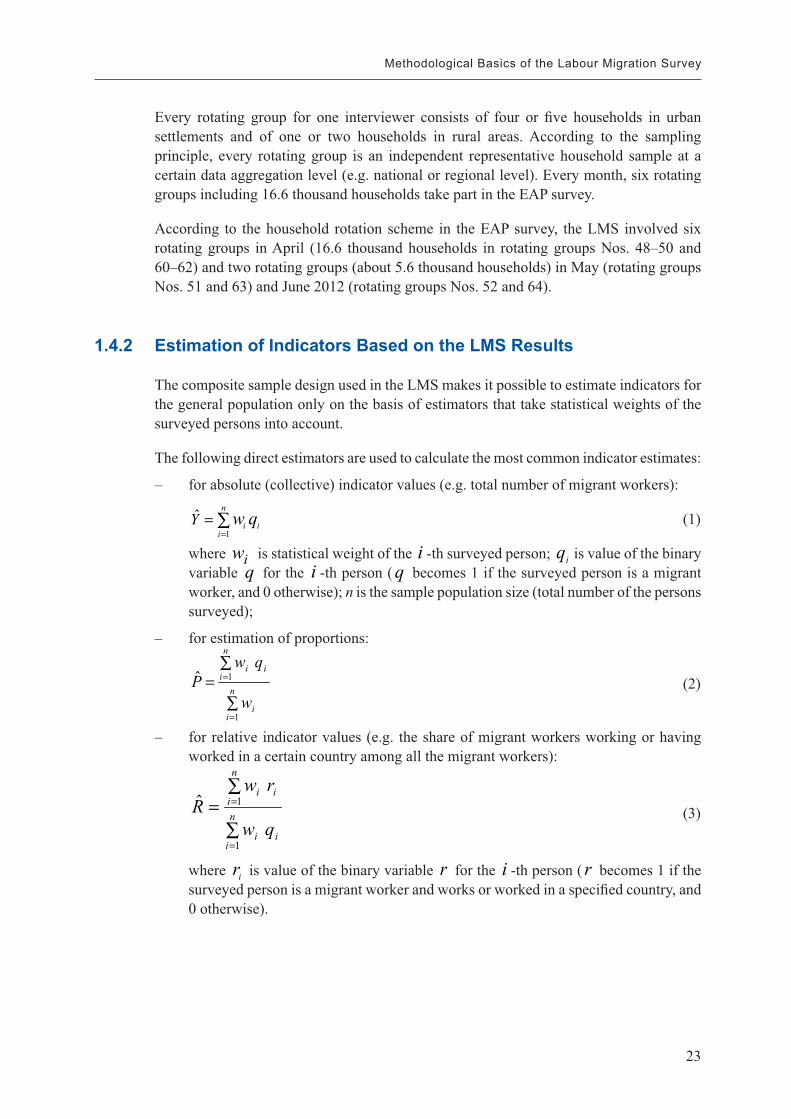
1.4.2 Estimation of Indicators Based on the LMS Results
The composite sample design used in the LMS makes it possible to estimate indicators for the general population only on the basis of estimators that take statistical weights of the surveyed persons into account.
The following direct estimators are used to calculate the most common indicator estimates:
– for absolute (collective) indicator values (e.g. total number of migrant workers):
∑=
=n
iii qwY
1
ˆ (1)
where iw is statistical weight of the i -th surveyed person; iq is value of the binary variable q for the i -th person ( q becomes 1 if the surveyed person is a migrant worker, and 0 otherwise); n is the sample population size (total number of the persons surveyed);
– for estimation of proportions:
∑
∑=
=
=n
ii
n
iii
w
qwP
1
1ˆ (2)
– for relative indicator values (e.g. the share of migrant workers working or having worked in a certain country among all the migrant workers):
∑
∑=
=
=n
iii
n
iii
qw
rwR
1
1ˆ (3)
where ir is value of the binary variable r for the i -th person ( r becomes 1 if the surveyed person is a migrant worker and works or worked in a specified country, and 0 otherwise).
Report on the Methodology, Organization and Results of a Modular Sample Survey on Labour Migration in Ukraine
24
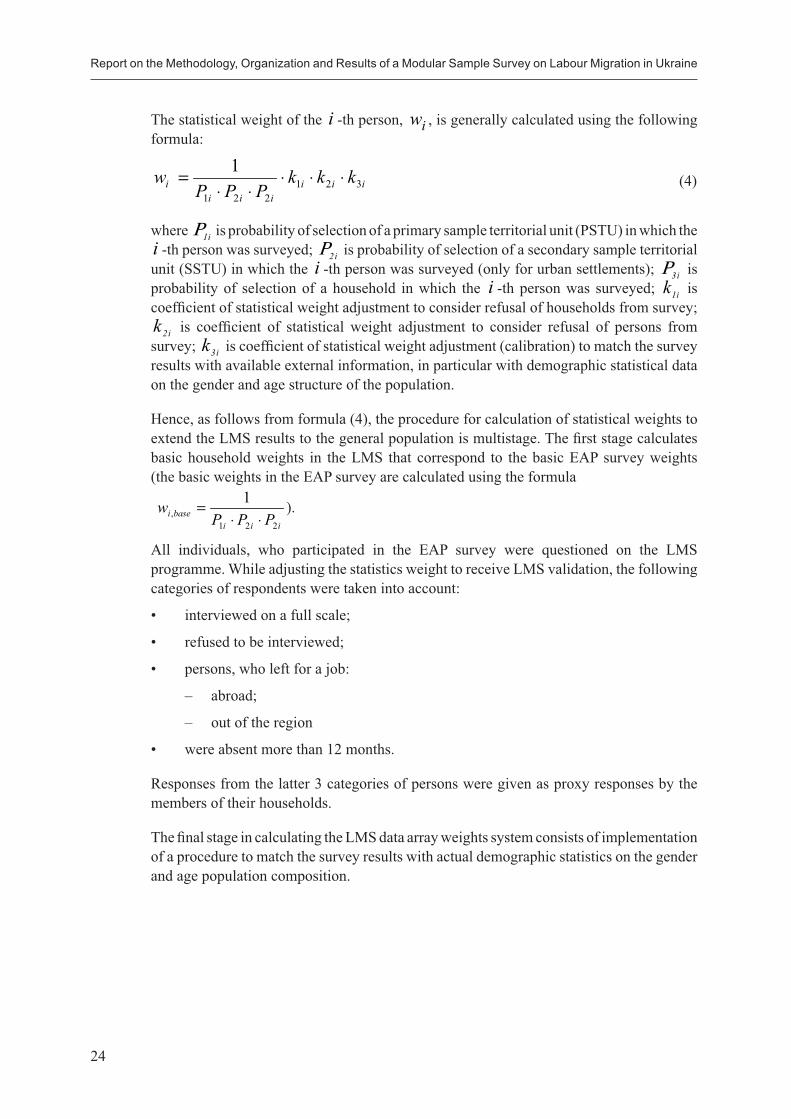
The statistical weight of the i -th person, iw , is generally calculated using the following formula:
iiiiii
i kkkPPP
w 321221
1 ⋅⋅⋅⋅⋅
= (4)
where i1Ρ is probability of selection of a primary sample territorial unit (PSTU) in which the i -th person was surveyed; i2Ρ is probability of selection of a secondary sample territorial unit (SSTU) in which the i -th person was surveyed (only for urban settlements); i3Ρ is probability of selection of a household in which the i -th person was surveyed; i1k is coefficient of statistical weight adjustment to consider refusal of households from survey;
i2k is coefficient of statistical weight adjustment to consider refusal of persons from survey; i3k is coefficient of statistical weight adjustment (calibration) to match the survey results with available external information, in particular with demographic statistical data on the gender and age structure of the population.
Hence, as follows from formula (4), the procedure for calculation of statistical weights to extend the LMS results to the general population is multistage. The first stage calculates basic household weights in the LMS that correspond to the basic EAP survey weights (the basic weights in the EAP survey are calculated using the formula
iii
basei PPPw
221,
1⋅⋅
= ).
All individuals, who participated in the EAP survey were questioned on the LMS programme. While adjusting the statistics weight to receive LMS validation, the following categories of respondents were taken into account:
• interviewed on a full scale;
• refused to be interviewed;
• persons, who left for a job:
– abroad;
– out of the region
• were absent more than 12 months.
Responses from the latter 3 categories of persons were given as proxy responses by the members of their households.
The final stage in calculating the LMS data array weights system consists of implementation of a procedure to match the survey results with actual demographic statistics on the gender and age population composition.
25
Methodological Basics of the Labour Migration Survey
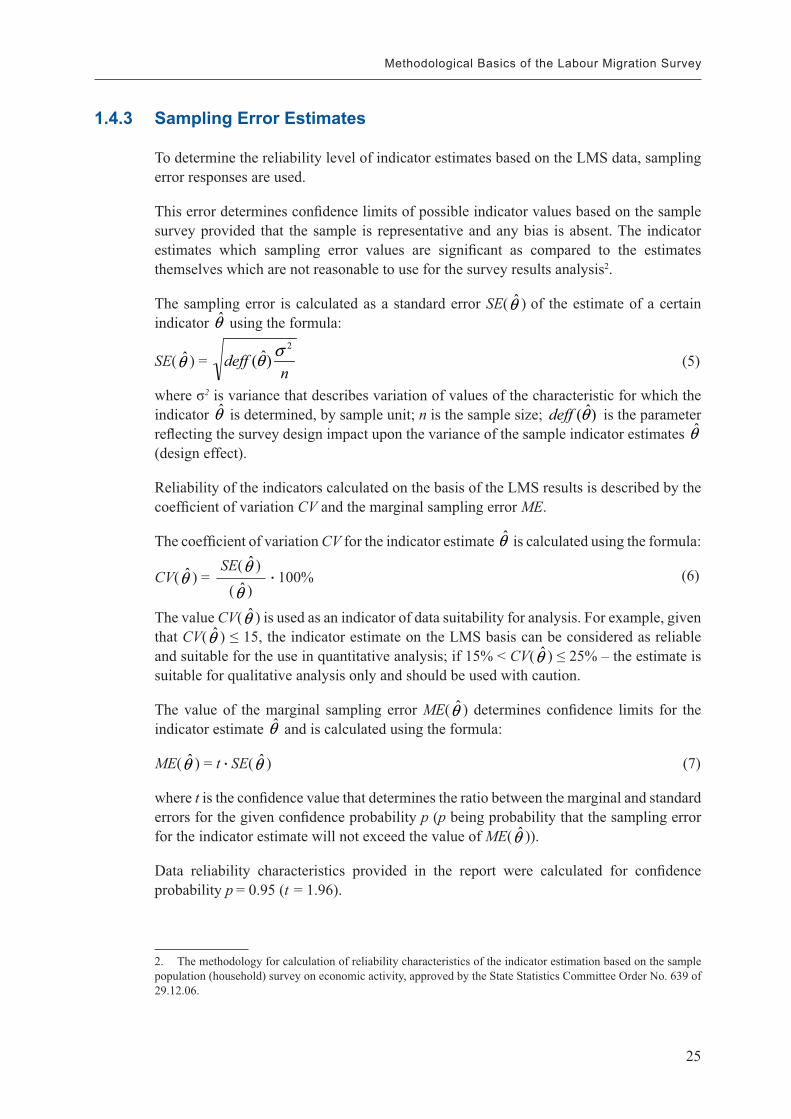
1.4.3 Sampling Error Estimates
To determine the reliability level of indicator estimates based on the LMS data, sampling error responses are used.
This error determines confidence limits of possible indicator values based on the sample survey provided that the sample is representative and any bias is absent. The indicator estimates which sampling error values are significant as compared to the estimates themselves which are not reasonable to use for the survey results analysis2.
The sampling error is calculated as a standard error SE(θ̂ ) of the estimate of a certain indicator θ̂ using the formula:
SE(θ̂ ) = n
deff2
)ˆ( σθ (5)
where σ2 is variance that describes variation of values of the characteristic for which the indicator θ̂ is determined, by sample unit; n is the sample size; )ˆ(θdeff is the parameter reflecting the survey design impact upon the variance of the sample indicator estimates θ̂ (design effect).
Reliability of the indicators calculated on the basis of the LMS results is described by the coefficient of variation CV and the marginal sampling error ME.
The coefficient of variation CV for the indicator estimate θ̂ is calculated using the formula:SE(θ̂ )
(θ̂ )CV(θ̂ ) = • 100%
(6)
The value CV(θ̂ ) is used as an indicator of data suitability for analysis. For example, given that CV(θ̂ ) ≤ 15, the indicator estimate on the LMS basis can be considered as reliable and suitable for the use in quantitative analysis; if 15% < CV(θ̂ ) ≤ 25% – the estimate is suitable for qualitative analysis only and should be used with caution.
The value of the marginal sampling error ME(θ̂ ) determines confidence limits for the indicator estimate θ̂ and is calculated using the formula:
ME(θ̂ ) = t • SE(θ̂ ) (7)
where t is the confidence value that determines the ratio between the marginal and standard errors for the given confidence probability p (p being probability that the sampling error for the indicator estimate will not exceed the value of ME(θ̂ )).
Data reliability characteristics provided in the report were calculated for confidence probability p = 0.95 (t = 1.96).
2. The methodology for calculation of reliability characteristics of the indicator estimation based on the sample population (household) survey on economic activity, approved by the State Statistics Committee Order No. 639 of 29.12.06.
Report on the Methodology, Organization and Results of a Modular Sample Survey on Labour Migration in Ukraine
26
Considering the complex design of the LMS sample, the calculation of standard errors and design effect values for indicator estimates uses the replication method of balanced repeated replications (BRR) implemented in the WesVarPC standard software package. This method is a rather complicated calculation procedure. It implies that the complete LMS sample consists of H strata, each containing two clusters of surveyed units. Every replication (“half-sample”) is built by random selection and elimination of one cluster from each stratum and doubling of statistical weights of the remaining cluster units. Hence, 2H-1 replications are formed, each of which is used for independent estimation of target indicators.
Variance of the sample estimates of indicator θ̂ is calculated using the formula:
T)ˆvar(θ = SE2(θ̂ ) = ⋅T1 2
1
~̂~̂∑
=⎟⎠⎞⎜⎝
⎛ −T
tt θθ , (8)
where t
~̂θ is the estimate of indicator θ for replication t; θ
~̂ is the estimate of indicator θ
for the entire sample; t is the current replication number, t = 1,2,...,T.
As can be seen from the data given in Annex А, estimation reliability of the indicators concerning the number of migrant workers by key section (urban settlements–rural areas, men–women) on the national level is sufficient for further use in quantitative calculations and analysis. The value of coefficients of variation here is about 10 per cent on average. Estimates by area type are less reliable. Data on the number of migrants by 10-year age groups is reliable enough, except for the age group of 60 years and above. This is explained by the low indicator value because this group includes persons of retirement age, and few of them are among migrants.
It should be noted that although the sample population for the LSM was stratified by administrative region, the regions were grouped into five major territorial zones (East, West, Centre, South, and North) during the analysis of the labour migration survey results, considering the relatively small sample size. It enabled more reliable measurement of labour migration indicators by geographic area. It is worth mentioning that the labour migration number estimates obtained for territorial zones are generally not reliable enough and can only be used for qualitative analysis. Only data on the total number of migrant workers for the West territorial zone, where the largest number of migrant workers is found, can be used for quantitative analysis. For other territorial zones, the labour migrant number indicator value is 7–10 times less and, accordingly, insufficiently reliable.
Hence, given the achieved level of the LSM result reliability, quantitative analysis of key indicators can be conducted mainly on the national level broken down by gender, settlement type, 10-year age group (for persons aged 15–59) and for the West territorial zone.
1.4.4 Overall Characteristic of the Survey Results
The survey on labour migration was conducted in all regions of the country.
Out of the 27.1 thousand households selected for the survey, 23.5 thousand were interviewed. Within the latter number of households, 45.5 thousand persons aged 15–70
27
Methodological Basics of the Labour Migration Survey
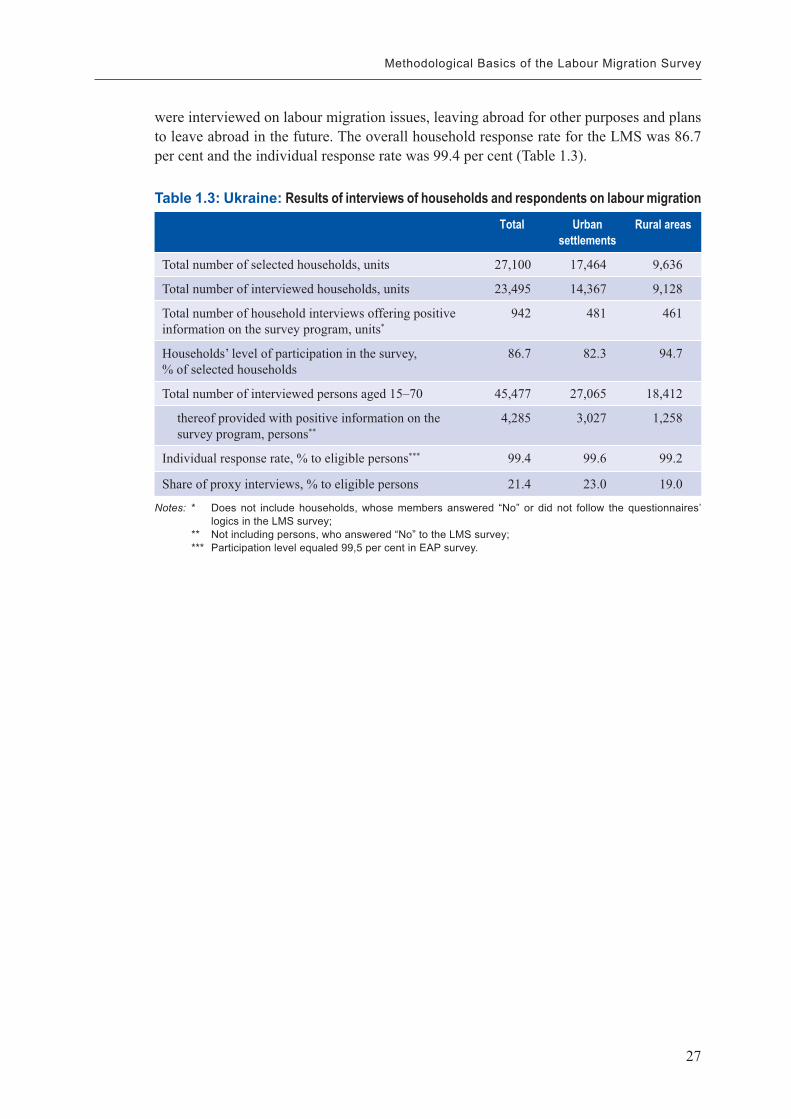
were interviewed on labour migration issues, leaving abroad for other purposes and plans to leave abroad in the future. The overall household response rate for the LMS was 86.7 per cent and the individual response rate was 99.4 per cent (Table 1.3).
Table 1.3: Ukraine: Results of interviews of households and respondents on labour migration Total Urban
settlementsRural areas
Total number of selected households, units 27,100 17,464 9,636
Total number of interviewed households, units 23,495 14,367 9,128
Total number of household interviews offering positive information on the survey program, units*
942 481 461
Households’ level of participation in the survey, % of selected households
86.7 82.3 94.7
Total number of interviewed persons aged 15–70 45,477 27,065 18,412
thereof provided with positive information on the survey program, persons**
4,285 3,027 1,258
Individual response rate, % to eligible persons*** 99.4 99.6 99.2
Share of proxy interviews, % to eligible persons 21.4 23.0 19.0
Notes: * Does not include households, whose members answered “No” or did not follow the questionnaires’ logics in the LMS survey;
** Not including persons, who answered “No” to the LMS survey; *** Participation level equaled 99,5 per cent in EAP survey.

29
Chapter 2: Analysis of the Labour Migration Survey Results
2.1 Socio-demographic Characteristics and Geographical Destinations of Migrant Workers
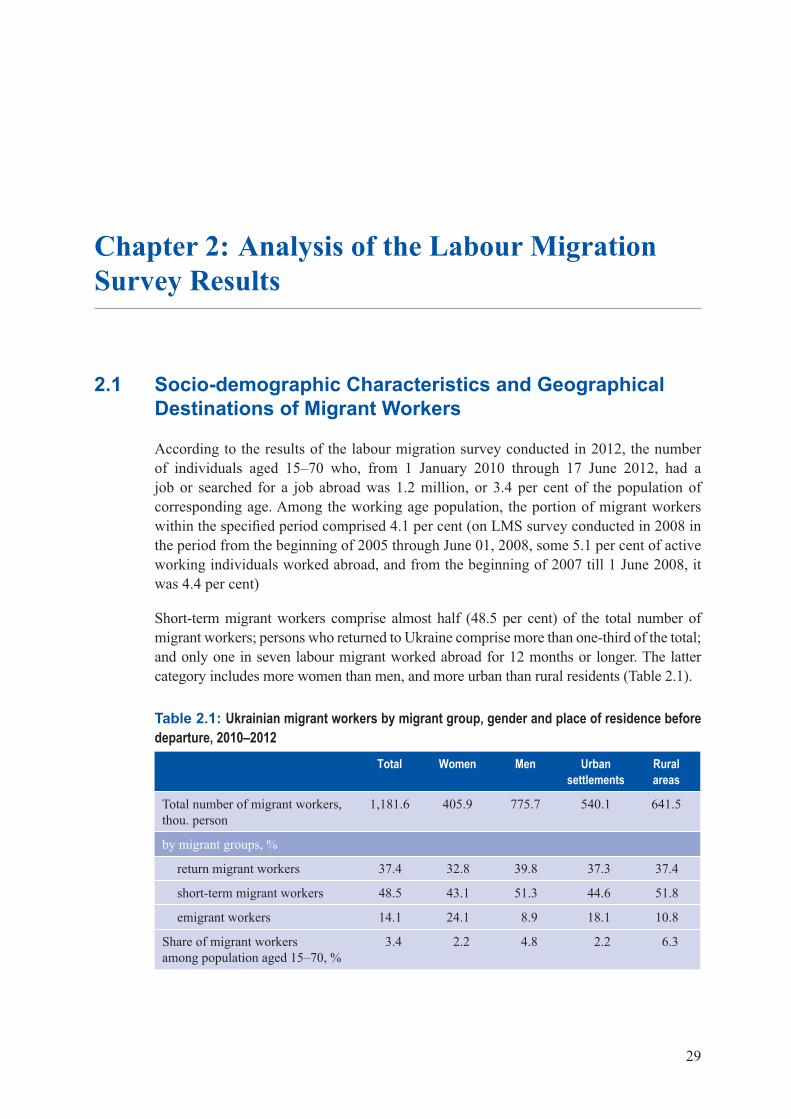
According to the results of the labour migration survey conducted in 2012, the number of individuals aged 15–70 who, from 1 January 2010 through 17 June 2012, had a job or searched for a job abroad was 1.2 million, or 3.4 per cent of the population of corresponding age. Among the working age population, the portion of migrant workers within the specified period comprised 4.1 per cent (on LMS survey conducted in 2008 in the period from the beginning of 2005 through June 01, 2008, some 5.1 per cent of active working individuals worked abroad, and from the beginning of 2007 till 1 June 2008, it was 4.4 per cent)
Short-term migrant workers comprise almost half (48.5 per cent) of the total number of migrant workers; persons who returned to Ukraine comprise more than one-third of the total; and only one in seven labour migrant worked abroad for 12 months or longer. The latter category includes more women than men, and more urban than rural residents (Table 2.1).
Table 2.1: Ukrainian migrant workers by migrant group, gender and place of residence before departure, 2010–2012
Total Women Men Urban settlements
Rural areas
Total number of migrant workers, thou. person
1,181.6 405.9 775.7 540.1 641.5
by migrant groups, %
return migrant workers 37.4 32.8 39.8 37.3 37.4
short-term migrant workers 48.5 43.1 51.3 44.6 51.8
emigrant workers 14.1 24.1 8.9 18.1 10.8
Share of migrant workersamong population aged 15–70, %
3.4 2.2 4.8 2.2 6.3
Report on the Methodology, Organization and Results of a Modular Sample Survey on Labour Migration in Ukraine
30
The overwhelming majority of migrant workers (1,160.9 thousand, or 98.2 per cent) worked abroad during the specified period of time while only 20.7 thousand (1.8 per cent) were looking for employment. The share of persons looking for employment abroad is more than 3 times greater among men than among women, and almost 1.5 times greater among urban than rural residents.
So it can be concluded that almost all persons involved in labour migration found a job and had paid employment due to preliminary contracts on job placement (this is especially true for short-term migrant workers). This in turn indicates rather high employment participation rates on the part of economically active Ukrainians abroad.
Migration for employment purposes are more common among men – they make up two-thirds of the total number of migrant workers. The share of migrant workers in the total number of men aged 15–70 is 4.8 per cent whereas the percentage for women is almost half of this, at 2.2 per cent.
Labour migrations are more common among men – they make up two-thirds of the total number of migrant workers. The share of migrant workers in the total number of men aged 15–70 is 4.8 per cent whereas the percentage for women is almost half of this, at 2.2 per cent.
Overall, rural residents comprise 54.3 per cent of the entire migrant worker contingent. The rural population’s rate of participation in labour migrations is 2.9 times higher than the urban population’s: 6.3 per cent of rural residents aged 15–70 are involved in labour migration whereas the figure for urban residents is 2.2 per cent.
This higher concentration of labour migration among the rural population can be largely explained by the rural people’s limited employment opportunities. In addition, the higher rate of rural population participation in labour migration observed in Ukraine as a whole comes mainly from its western regions.
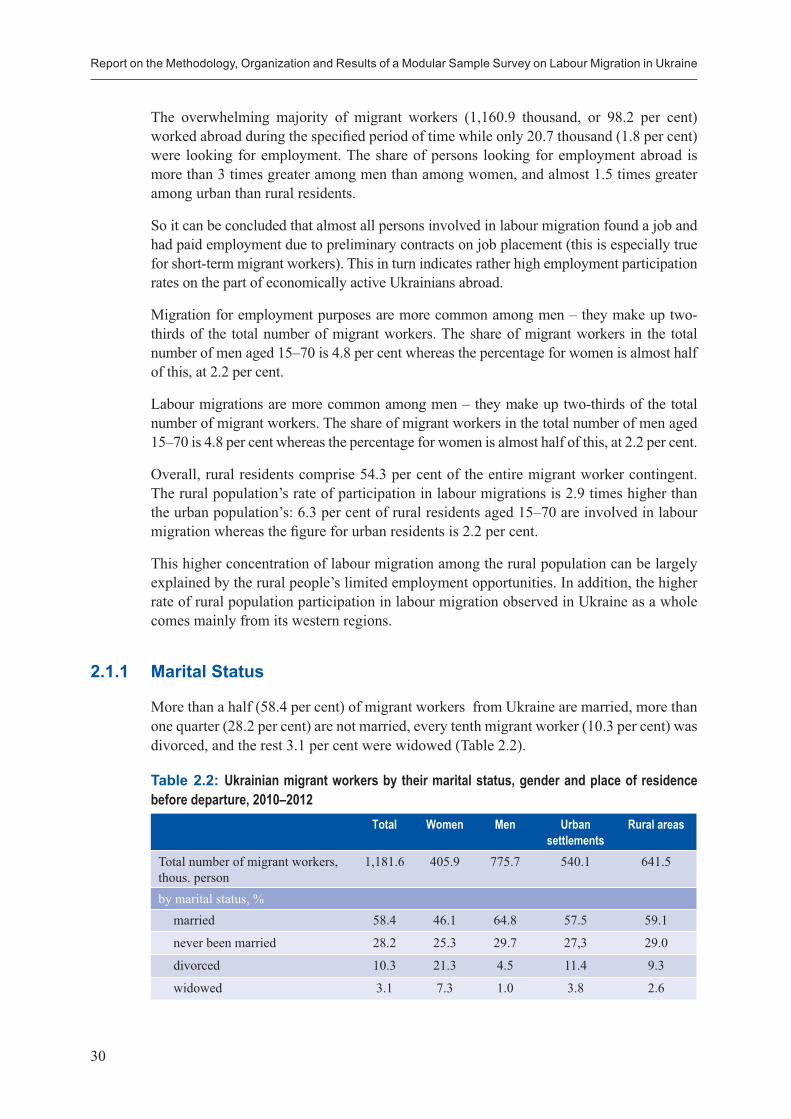
2.1.1 Marital Status
More than a half (58.4 per cent) of migrant workers from Ukraine are married, more than one quarter (28.2 per cent) are not married, every tenth migrant worker (10.3 per cent) was divorced, and the rest 3.1 per cent were widowed (Table 2.2).
Table 2.2: Ukrainian migrant workers by their marital status, gender and place of residence before departure, 2010–2012
Total Women Men Urban settlements
Rural areas
Total number of migrant workers, thous. person
1,181.6 405.9 775.7 540.1 641.5
by marital status, % married 58.4 46.1 64.8 57.5 59.1
never been married 28.2 25.3 29.7 27,3 29.0
divorced 10.3 21.3 4.5 11.4 9.3
widowed 3.1 7.3 1.0 3.8 2.6
31
Analysis of the Labour Migration Survey Results
A breakdown of migrant workers by marital status shows no marked variations depending on the migrants’ origin or locality. Among urban residents, the percentages of married ones and never-married individuals are somewhat lower and, accordingly, the shares of divorced and widowed persons are higher.
At the same time, the survey recorded a notable gender-based variance in the marital status indicators. Almost two-thirds (64.8 per cent) of male migrants and less than half (46.1 per cent) of female ones were married. By contrast, among the women working or looking for employment abroad, they were 2.5 times more likely to be divorced and 4 times more likely to be widowed as compared to men. Such results can be explained by family relationships in Ukraine where patriarchal traditions, according to which a man is assigned a breadwinner’s role, are still common. Under such conditions, wives feel more protected financially but if male support is lost they have to take control of material support of their families and find their place in the labour market of Ukraine or foreign countries.
2.1.2 Age Structure
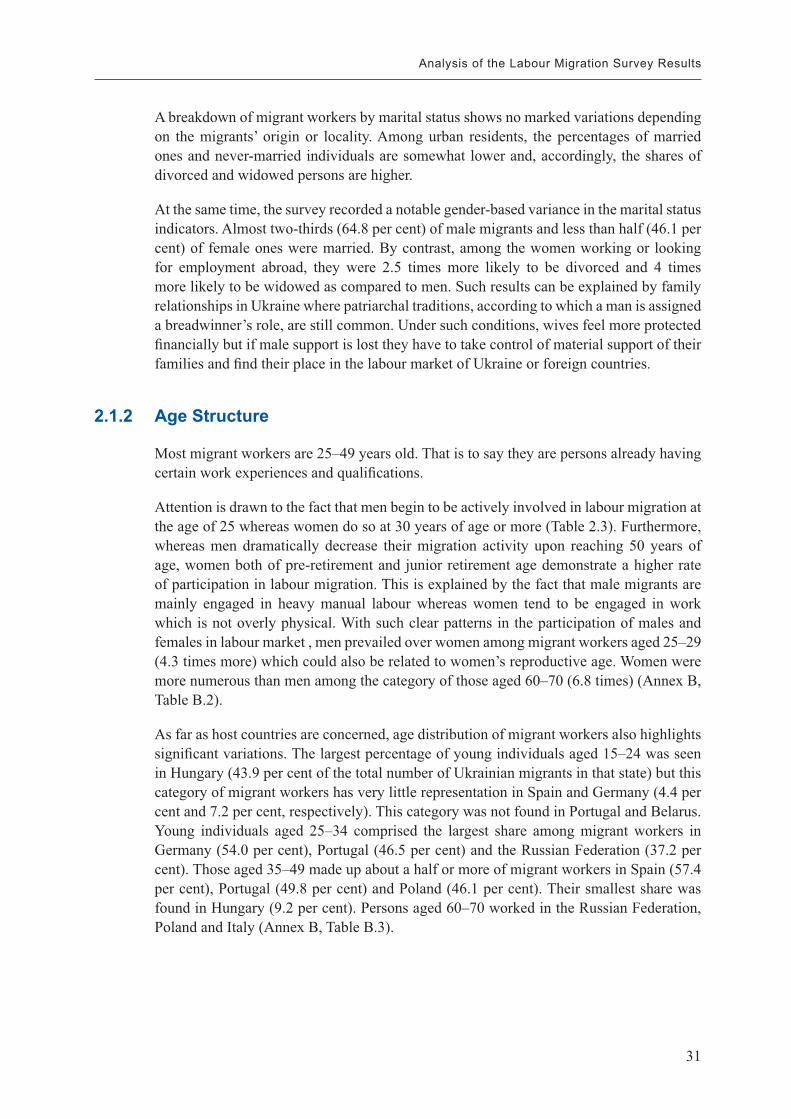
Most migrant workers are 25–49 years old. That is to say they are persons already having certain work experiences and qualifications.
Attention is drawn to the fact that men begin to be actively involved in labour migration at the age of 25 whereas women do so at 30 years of age or more (Table 2.3). Furthermore, whereas men dramatically decrease their migration activity upon reaching 50 years of age, women both of pre-retirement and junior retirement age demonstrate a higher rate of participation in labour migration. This is explained by the fact that male migrants are mainly engaged in heavy manual labour whereas women tend to be engaged in work which is not overly physical. With such clear patterns in the participation of males and females in labour market , men prevailed over women among migrant workers aged 25–29 (4.3 times more) which could also be related to women’s reproductive age. Women were more numerous than men among the category of those aged 60–70 (6.8 times) (Annex B, Table B.2).
As far as host countries are concerned, age distribution of migrant workers also highlights significant variations. The largest percentage of young individuals aged 15–24 was seen in Hungary (43.9 per cent of the total number of Ukrainian migrants in that state) but this category of migrant workers has very little representation in Spain and Germany (4.4 per cent and 7.2 per cent, respectively). This category was not found in Portugal and Belarus. Young individuals aged 25–34 comprised the largest share among migrant workers in Germany (54.0 per cent), Portugal (46.5 per cent) and the Russian Federation (37.2 per cent). Those aged 35–49 made up about a half or more of migrant workers in Spain (57.4 per cent), Portugal (49.8 per cent) and Poland (46.1 per cent). Their smallest share was found in Hungary (9.2 per cent). Persons aged 60–70 worked in the Russian Federation, Poland and Italy (Annex B, Table B.3).
Report on the Methodology, Organization and Results of a Modular Sample Survey on Labour Migration in Ukraine
32
Table 2.3: Ukrainian migrant workers by age group, gender and place of residence before departure, 2010–2012
Total Women Men Urban settlements
Rural areas
Total number of migrant workers, thous. person
1,181.6 405.9 775.7 540.1 641.5
by age group, %
15−24 years 11.0 12.0 10.3 9.2 12.6
25−29 years 15.8 8.7 19.5 15,5 15.9
30−34 years 18.3 17.4 18.8 20.3 16.6
35−39 years 13.4 13.1 13.6 13.7 13.1
40−49 years 25.3 24.2 25.9 23.3 27.0
50−59 years 14.8 20.9 11.6 15.2 14.5
60−70 years 1.4 3.7 0.3 2.8 0.3
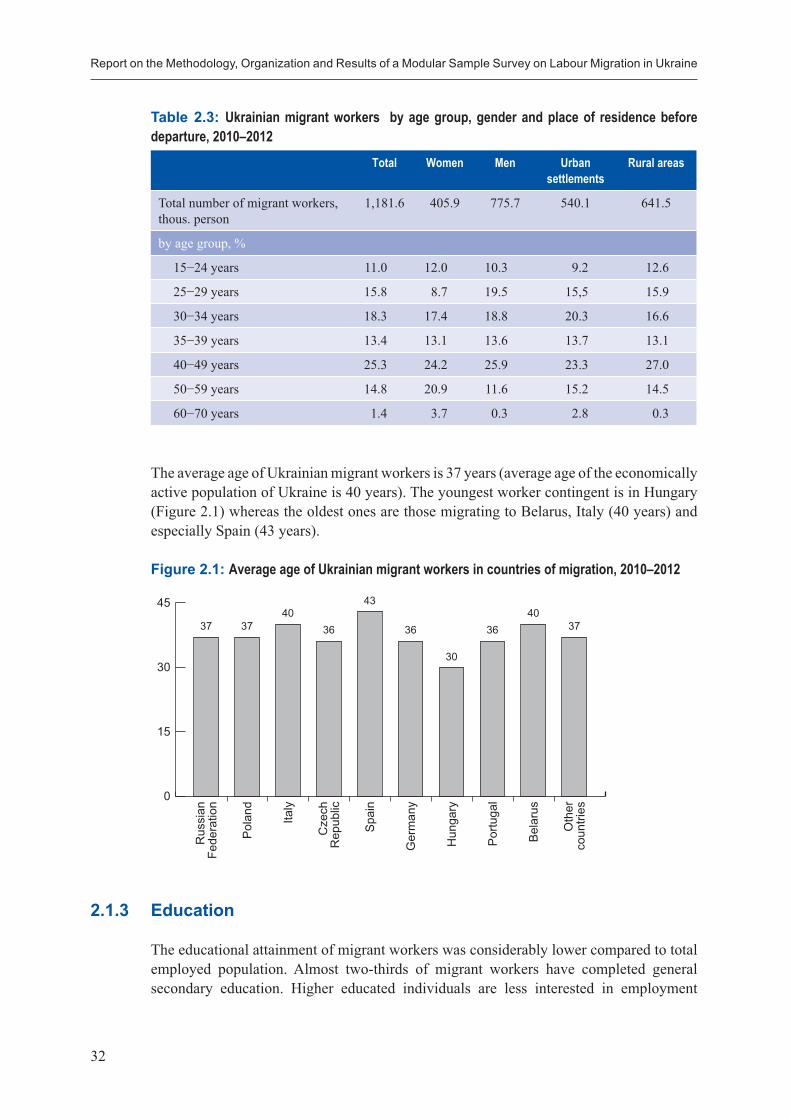
The average age of Ukrainian migrant workers is 37 years (average age of the economically active population of Ukraine is 40 years). The youngest worker contingent is in Hungary (Figure 2.1) whereas the oldest ones are those migrating to Belarus, Italy (40 years) and especially Spain (43 years).
Figure 2.1: Average age of Ukrainian migrant workers in countries of migration, 2010–2012
45
30
15
0
Rus
sian
Fe
dera
tion
Pol
and
Italy
Cze
ch
Rep
ublic
Spa
in
Ger
man
y
Hun
gary
Por
tuga
l
Bel
arus
Oth
er
coun
tries
37 3740
36
43
36
30
3640
37
2.1.3 Education
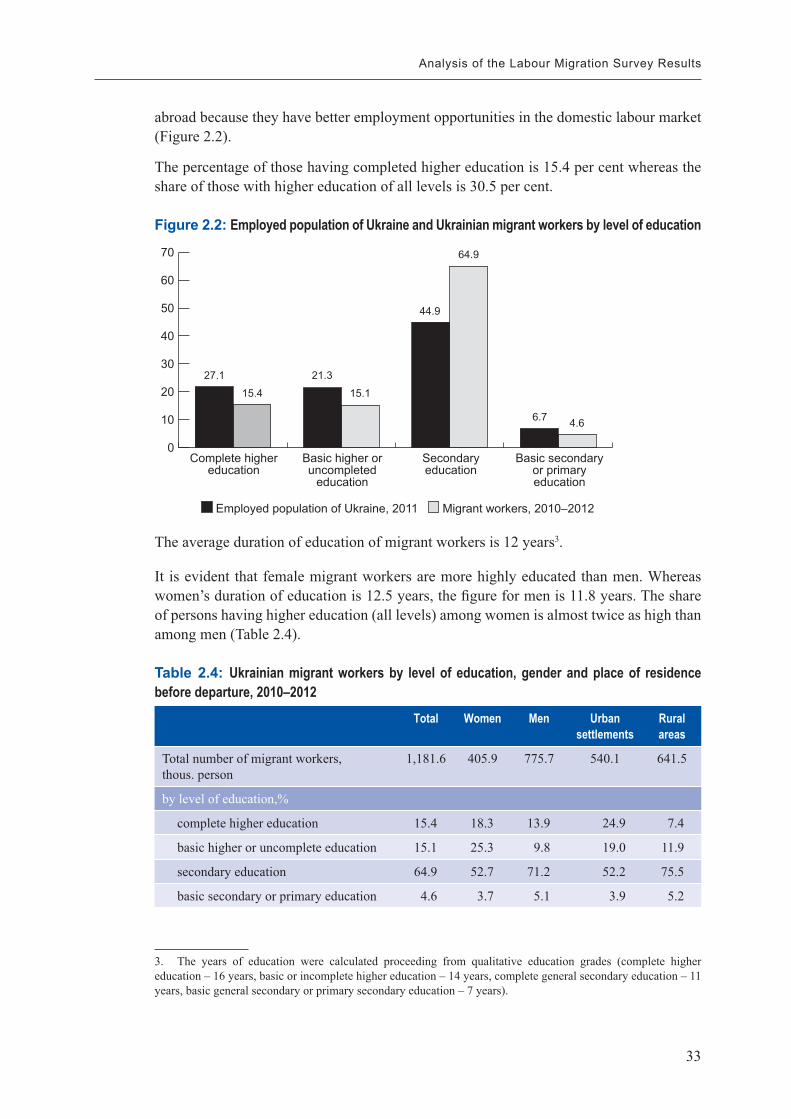
The educational attainment of migrant workers was considerably lower compared to total employed population. Almost two-thirds of migrant workers have completed general secondary education. Higher educated individuals are less interested in employment
33
Analysis of the Labour Migration Survey Results
abroad because they have better employment opportunities in the domestic labour market (Figure 2.2).
The percentage of those having completed higher education is 15.4 per cent whereas the share of those with higher education of all levels is 30.5 per cent.
Figure 2.2: Employed population of Ukraine and Ukrainian migrant workers by level of education
70
60
50
40
30
20
10
0Complete higher
educationBasic higher or uncompleted
education
Secondary education
Basic secondary or primary education
27.1 21.3
44.9
6.7
15.4 15.1
64.9
4.6
Employed population of Ukraine, 2011 Migrant workers, 2010–2012
The average duration of education of migrant workers is 12 years3.
It is evident that female migrant workers are more highly educated than men. Whereas women’s duration of education is 12.5 years, the figure for men is 11.8 years. The share of persons having higher education (all levels) among women is almost twice as high than among men (Table 2.4).
Table 2.4: Ukrainian migrant workers by level of education, gender and place of residence before departure, 2010–2012
Total Women Men Urban settlements
Rural areas
Total number of migrant workers, thous. person
1,181.6 405.9 775.7 540.1 641.5
by level of education,%
complete higher education 15.4 18.3 13.9 24.9 7.4
basic higher or uncomplete education 15.1 25.3 9.8 19.0 11.9
secondary education 64.9 52.7 71.2 52.2 75.5
basic secondary or primary education 4.6 3.7 5.1 3.9 5.2
3. The years of education were calculated proceeding from qualitative education grades (complete higher education – 16 years, basic or incomplete higher education – 14 years, complete general secondary education – 11 years, basic general secondary or primary secondary education – 7 years).
Report on the Methodology, Organization and Results of a Modular Sample Survey on Labour Migration in Ukraine
34
The largest share of migrant workers having higher education was recorded in Germany (89.6 per cent of the total number of Ukrainian migrants in that country) (Table 2.5). In Hungary and Spain, just every fifth labour migrant had such higher educational attainment.
A considerable number of migrant workers who had completed general education was recorded in Portugal (93.5 per cent of all migrant workers) whereas the indicator value in Belarus, the Czech Republic and the Russian Federation was between 72.1 per cent and 76.7 per cent.
Table 2.5: Ukrainian migrant workers by countries of migration and level of education, 2010–2012Total, thous.
personby level of education, %
complete higher
education
basic higher or
uncompleted education
secondary education
basic secondary or primary education
Total number of labour migrant workers
1,181.6 15.4 15.1 64.9 4.6
by countries of migration
Russian Federation 511.0 12.5 10.0 72.1 5.4
Poland 168.4 12.4 18.0 61.8 7.8
Italy 156.0 14.9 28.7 54.0 2.4
Czech Republic 153.0 9.5 11.1 74.1 5.3
Spain 52.6 19.8 33.3 46.9 —
Germany 27.8 89.6 3.2 7.2 —
Hungary 23.0 19.6 14.3 66.1 —
Portugal 21.7 — 6.5 93.5 —
Belarus 21.5 — 23.3 76.7 —
Other countries 46.6 42.3 16.3 38.2 3.2
Among migrant workers’ contingents formed by economic zone, representatives of the South are the most educated (average duration of education is 13.0 years, while the share of persons with higher education is 53.7 per cent). By contrast the Centre residents have 11.1 years and 6.6 per cent, respectively (Annex B, Table B.5). Ukrainian migrants working in Germany are notable for their educational attainments; the share of persons having higher education among this group is 92.8 per cent, including 89.6 per cent with complete higher education, whereas their duration in education reaches 15.6 years (with 16.0 maximum). To a lesser extent, other principal destinations for persons with high educational attainment are Spain, Italy and Hungary.
Pre-departure training has not become a widespread phenomenon in Ukraine. Only 47.3 thousand (4.0 per cent) migrants attended courses or underwent training as preparation for travel to a foreign country. Usually it was representatives of senior youth contingents who did that; persons aged 25–34 comprised almost two-thirds of course attendees. In 4 out
35
Analysis of the Labour Migration Survey Results
of 9 main recipient countries for the Ukrainian labour force (Belarus, Germany, Hungary and Spain), not one worker was found who underwent pre-migration educational training. However, courses were attended or training was undertaken prior to a trip by every fourth person migrating to Italy and every third migrant worker going to countries not among the main recipients of the Ukrainian labour force. Among the persons undergoing educational training prior to a migratory experience abroad, there were more urban than rural residents and more men than women.
The overwhelming majority of those who underwent pre-departure training chose language courses (78.9 per cent); 29.8 per cent participated in highly specialized courses aimed at acquiring certain skills or professional knowledge; and 9.9 per cent attended courses within the framework of a university/college curriculum. Men studied a foreign language more often than women; in terms of migrant groups by employment country, the greatest numbers of such workers went to Italy, the Czech Republic, Portugal and Poland. Among male migrants who worked outside a main recipient country, some attended navigation or English language courses for seamen, which indicates a certain respondent group’s activity area. Among other pre-departure training subjects of note, some respondents cited agronomy.
Only 26.8 per cent of migrants were fluent in the host country’s language, another 26.9 per cent could communicate, 22.9 per cent understood and spoke it a little, whereas 9.8 per cent understood it but could not speak, and 13.6 per cent neither spoke nor understood it (Annex B, Table B.6).
If we transform the respondent answers from qualitative into quantitative ones and evaluate them with the aforementioned criteria (e.g.: fluency – 5 points; ability of communicating – 4 points; understanding and some communication – 3 points; only understanding but inability of communicating – 2 points; no skills of understanding and communication at all – 1 point), then the average level of language competence of migrant workers is 3.4 points. This indicator is higher among men than women (3.7 vs. 2.9).
Among migrant groups by employment country, Ukrainians working in Hungary are the leaders in terms of language competencies: all members of that group were fluent in the host country’s language, accordingly the average rating was 5.0 points. This finding establishes that it is ethnic Hungarians and members of other ethnic groups also living in areas of compact settlement of Transcarpathian Hungarians who go to work in Hungary from Ukraine. Perhaps unsurprisingly, Ukrainian migrant workers in Russia and Belarus show higher knowledge of the recipient country languages (with average ratings of 4.5 and 4.0 points, respectively). On the other hand, the indicator was only 1.8 points for the migrant group working in Italy and 1.7 for those in Portugal (54.3 per cent and 67.7 per cent of migrants working in those countries, respectively, did not understand and speak the local language) (Annex B, Table B.7).
Some 7.9 per cent of respondents reported attempts to clarify the required educational attainment (certification) in a host country and how it may equate with that acquired in Ukraine (Table 2.6). As of the moment of observation, 1.6 per cent of migrants had already learned of the equivalence degree, 3.7 per cent were trying to determine it and 2.6 per cent had concluded that determining equivalence was too difficult to achieve.
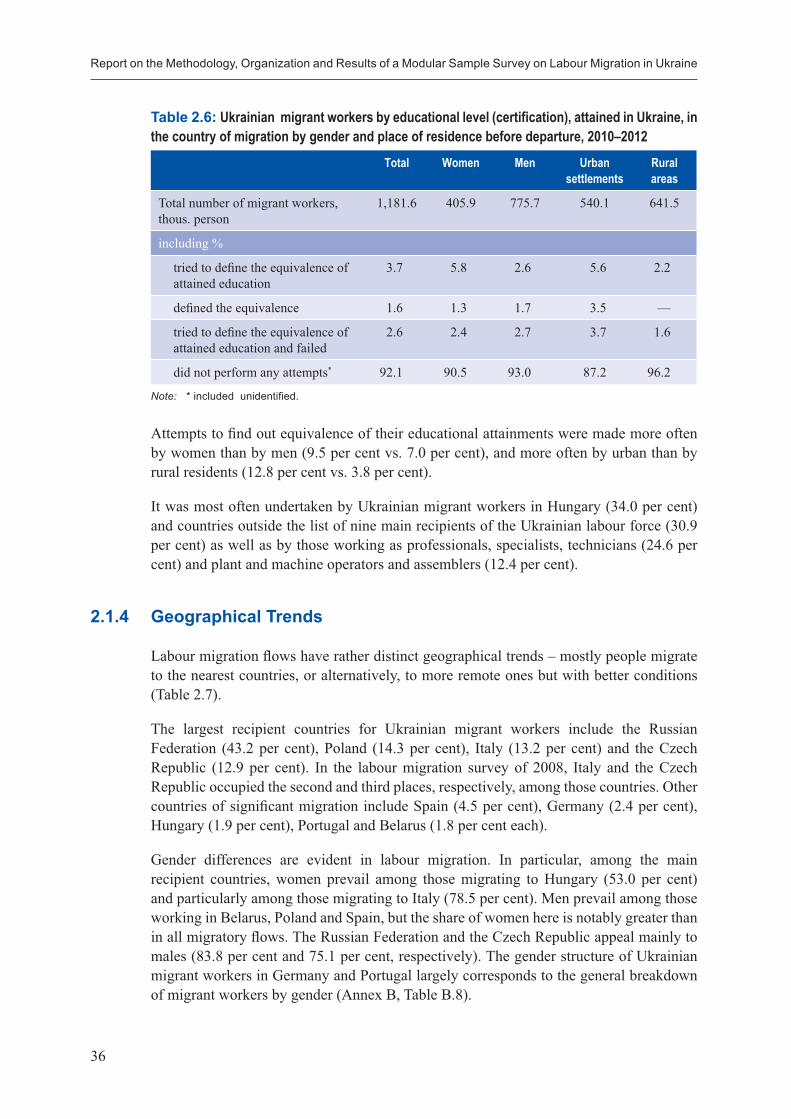
Report on the Methodology, Organization and Results of a Modular Sample Survey on Labour Migration in Ukraine
36
Table 2.6: Ukrainian migrant workers by educational level (certification), attained in Ukraine, in the country of migration by gender and place of residence before departure, 2010–2012
Total Women Men Urban settlements
Rural areas
Total number of migrant workers, thous. person
1,181.6 405.9 775.7 540.1 641.5
including %
tried to define the equivalence of attained education
3.7 5.8 2.6 5.6 2.2
defined the equivalence 1.6 1.3 1.7 3.5 —
tried to define the equivalence of attained education and failed
2.6 2.4 2.7 3.7 1.6
did not perform any attempts* 92.1 90.5 93.0 87.2 96.2
Note: * included unidentified.
Attempts to find out equivalence of their educational attainments were made more often by women than by men (9.5 per cent vs. 7.0 per cent), and more often by urban than by rural residents (12.8 per cent vs. 3.8 per cent).
It was most often undertaken by Ukrainian migrant workers in Hungary (34.0 per cent) and countries outside the list of nine main recipients of the Ukrainian labour force (30.9 per cent) as well as by those working as professionals, specialists, technicians (24.6 per cent) and plant and machine operators and assemblers (12.4 per cent).
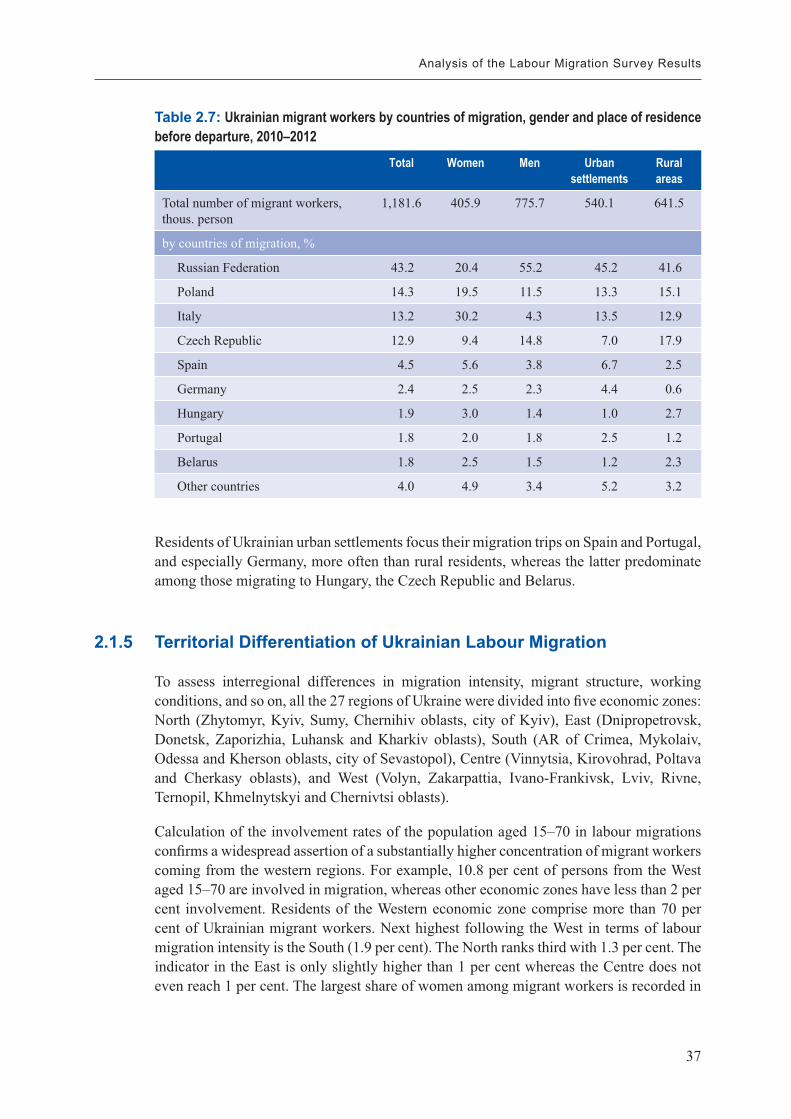
2.1.4 Geographical Trends
Labour migration flows have rather distinct geographical trends – mostly people migrate to the nearest countries, or alternatively, to more remote ones but with better conditions (Table 2.7).
The largest recipient countries for Ukrainian migrant workers include the Russian Federation (43.2 per cent), Poland (14.3 per cent), Italy (13.2 per cent) and the Czech Republic (12.9 per cent). In the labour migration survey of 2008, Italy and the Czech Republic occupied the second and third places, respectively, among those countries. Other countries of significant migration include Spain (4.5 per cent), Germany (2.4 per cent), Hungary (1.9 per cent), Portugal and Belarus (1.8 per cent each).
Gender differences are evident in labour migration. In particular, among the main recipient countries, women prevail among those migrating to Hungary (53.0 per cent) and particularly among those migrating to Italy (78.5 per cent). Men prevail among those working in Belarus, Poland and Spain, but the share of women here is notably greater than in all migratory flows. The Russian Federation and the Czech Republic appeal mainly to males (83.8 per cent and 75.1 per cent, respectively). The gender structure of Ukrainian migrant workers in Germany and Portugal largely corresponds to the general breakdown of migrant workers by gender (Annex B, Table B.8).
37
Analysis of the Labour Migration Survey Results
Table 2.7: Ukrainian migrant workers by countries of migration, gender and place of residence before departure, 2010–2012
Total Women Men Urban settlements
Rural areas
Total number of migrant workers, thous. person
1,181.6 405.9 775.7 540.1 641.5
by countries of migration, %
Russian Federation 43.2 20.4 55.2 45.2 41.6
Poland 14.3 19.5 11.5 13.3 15.1
Italy 13.2 30.2 4.3 13.5 12.9
Czech Republic 12.9 9.4 14.8 7.0 17.9
Spain 4.5 5.6 3.8 6.7 2.5
Germany 2.4 2.5 2.3 4.4 0.6
Hungary 1.9 3.0 1.4 1.0 2.7
Portugal 1.8 2.0 1.8 2.5 1.2
Belarus 1.8 2.5 1.5 1.2 2.3
Other countries 4.0 4.9 3.4 5.2 3.2
Residents of Ukrainian urban settlements focus their migration trips on Spain and Portugal, and especially Germany, more often than rural residents, whereas the latter predominate among those migrating to Hungary, the Czech Republic and Belarus.
2.1.5 Territorial Differentiation of Ukrainian Labour Migration
To assess interregional differences in migration intensity, migrant structure, working conditions, and so on, all the 27 regions of Ukraine were divided into five economic zones: North (Zhytomyr, Kyiv, Sumy, Chernihiv oblasts, city of Kyiv), East (Dnipropetrovsk, Donetsk, Zaporizhia, Luhansk and Kharkiv oblasts), South (AR of Crimea, Mykolaiv, Odessa and Kherson oblasts, city of Sevastopol), Centre (Vinnytsia, Kirovohrad, Poltava and Cherkasy oblasts), and West (Volyn, Zakarpattia, Ivano-Frankivsk, Lviv, Rivne, Ternopil, Khmelnytskyi and Chernivtsi oblasts).
Calculation of the involvement rates of the population aged 15–70 in labour migrations confirms a widespread assertion of a substantially higher concentration of migrant workers coming from the western regions. For example, 10.8 per cent of persons from the West aged 15–70 are involved in migration, whereas other economic zones have less than 2 per cent involvement. Residents of the Western economic zone comprise more than 70 per cent of Ukrainian migrant workers. Next highest following the West in terms of labour migration intensity is the South (1.9 per cent). The North ranks third with 1.3 per cent. The indicator in the East is only slightly higher than 1 per cent whereas the Centre does not even reach 1 per cent. The largest share of women among migrant workers is recorded in
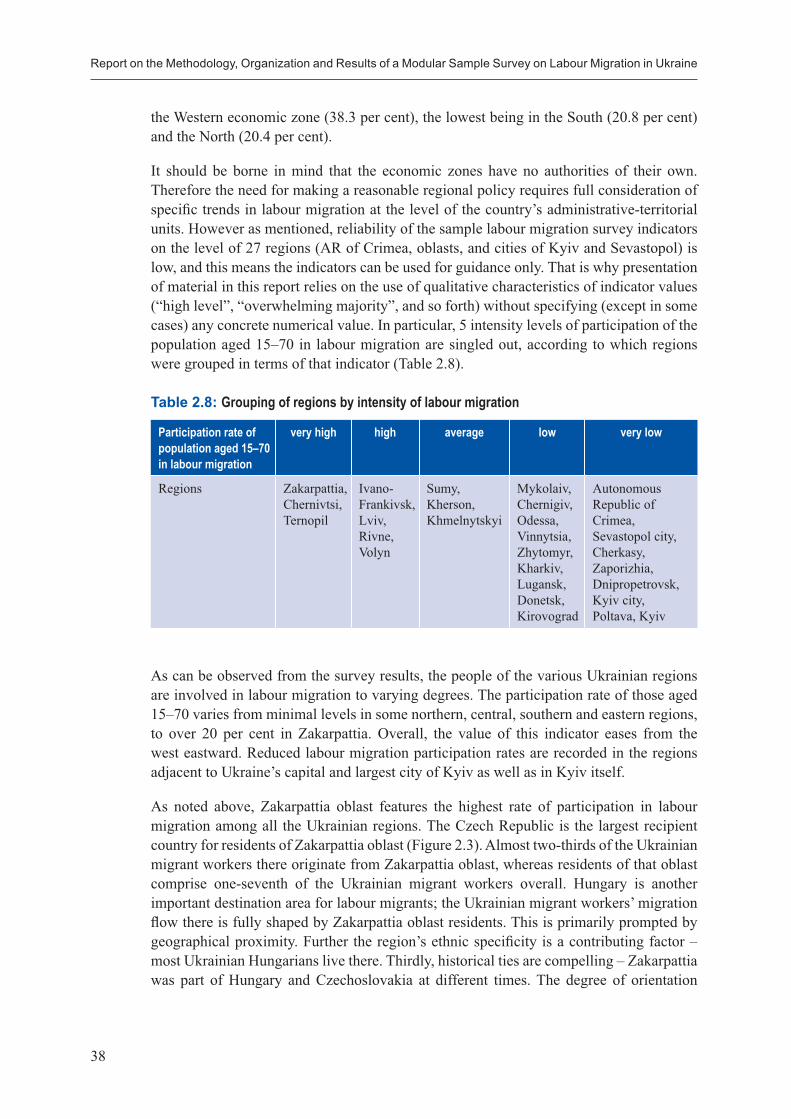
Report on the Methodology, Organization and Results of a Modular Sample Survey on Labour Migration in Ukraine
38
the Western economic zone (38.3 per cent), the lowest being in the South (20.8 per cent) and the North (20.4 per cent).
It should be borne in mind that the economic zones have no authorities of their own. Therefore the need for making a reasonable regional policy requires full consideration of specific trends in labour migration at the level of the country’s administrative-territorial units. However as mentioned, reliability of the sample labour migration survey indicators on the level of 27 regions (AR of Crimea, oblasts, and cities of Kyiv and Sevastopol) is low, and this means the indicators can be used for guidance only. That is why presentation of material in this report relies on the use of qualitative characteristics of indicator values (“high level”, “overwhelming majority”, and so forth) without specifying (except in some cases) any concrete numerical value. In particular, 5 intensity levels of participation of the population aged 15–70 in labour migration are singled out, according to which regions were grouped in terms of that indicator (Table 2.8).
Table 2.8: Grouping of regions by intensity of labour migration
Participation rate of population aged 15–70 in labour migration
very high high average low very low
Regions Zakarpattia,Chernivtsi,Ternopil
Ivano-Frankivsk,Lviv,Rivne,Volyn
Sumy,Kherson,Khmelnytskyi
Mykolaiv,Chernigiv,Odessa,Vinnytsia,Zhytomyr,Kharkiv,Lugansk,Donetsk,Kirovograd
Autonomous Republic of Crimea,Sevastopol сity,Cherkasy,Zaporizhia,Dnipropetrovsk,Kyiv сity,Poltava, Kyiv
As can be observed from the survey results, the people of the various Ukrainian regions are involved in labour migration to varying degrees. The participation rate of those aged 15–70 varies from minimal levels in some northern, central, southern and eastern regions, to over 20 per cent in Zakarpattia. Overall, the value of this indicator eases from the west eastward. Reduced labour migration participation rates are recorded in the regions adjacent to Ukraine’s capital and largest city of Kyiv as well as in Kyiv itself.
As noted above, Zakarpattia oblast features the highest rate of participation in labour migration among all the Ukrainian regions. The Czech Republic is the largest recipient country for residents of Zakarpattia oblast (Figure 2.3). Almost two-thirds of the Ukrainian migrant workers there originate from Zakarpattia oblast, whereas residents of that oblast comprise one-seventh of the Ukrainian migrant workers overall. Hungary is another important destination area for labour migrants; the Ukrainian migrant workers’ migration flow there is fully shaped by Zakarpattia oblast residents. This is primarily prompted by geographical proximity. Further the region’s ethnic specificity is a contributing factor – most Ukrainian Hungarians live there. Thirdly, historical ties are compelling – Zakarpattia was part of Hungary and Czechoslovakia at different times. The degree of orientation
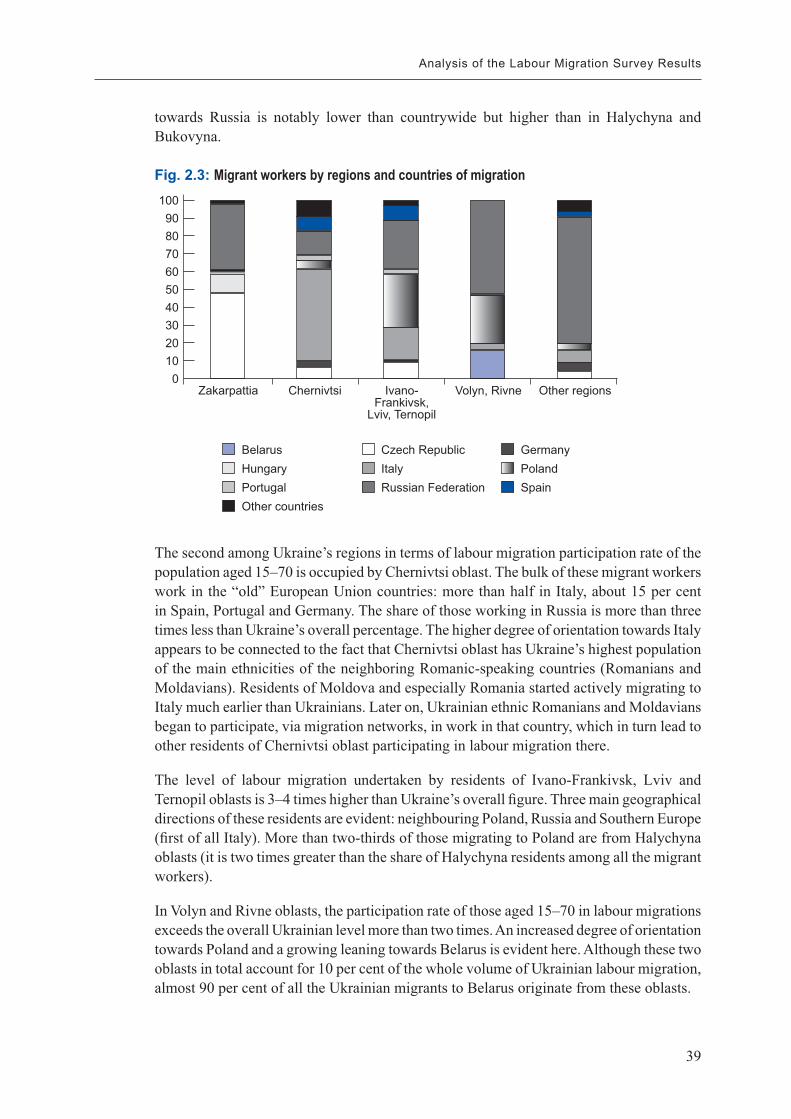
39
Analysis of the Labour Migration Survey Results
towards Russia is notably lower than countrywide but higher than in Halychyna and Bukovyna.
Fig. 2.3: Migrant workers by regions and countries of migration 100
908070605040302010
0Zakarpattia Chernivtsi Ivano-
Frankivsk,Lviv, Ternopil
Volyn, Rivne Other regions
BelarusHungaryPortugalOther countries
Czech RepublicItalyRussian Federation
GermanyPolandSpain
The second among Ukraine’s regions in terms of labour migration participation rate of the population aged 15–70 is occupied by Chernivtsi oblast. The bulk of these migrant workers work in the “old” European Union countries: more than half in Italy, about 15 per cent in Spain, Portugal and Germany. The share of those working in Russia is more than three times less than Ukraine’s overall percentage. The higher degree of orientation towards Italy appears to be connected to the fact that Chernivtsi oblast has Ukraine’s highest population of the main ethnicities of the neighboring Romanic-speaking countries (Romanians and Moldavians). Residents of Moldova and especially Romania started actively migrating to Italy much earlier than Ukrainians. Later on, Ukrainian ethnic Romanians and Moldavians began to participate, via migration networks, in work in that country, which in turn lead to other residents of Chernivtsi oblast participating in labour migration there.
The level of labour migration undertaken by residents of Ivano-Frankivsk, Lviv and Ternopil oblasts is 3–4 times higher than Ukraine’s overall figure. Three main geographical directions of these residents are evident: neighbouring Poland, Russia and Southern Europe (first of all Italy). More than two-thirds of those migrating to Poland are from Halychyna oblasts (it is two times greater than the share of Halychyna residents among all the migrant workers).
In Volyn and Rivne oblasts, the participation rate of those aged 15–70 in labour migrations exceeds the overall Ukrainian level more than two times. An increased degree of orientation towards Poland and a growing leaning towards Belarus is evident here. Although these two oblasts in total account for 10 per cent of the whole volume of Ukrainian labour migration, almost 90 per cent of all the Ukrainian migrants to Belarus originate from these oblasts.
Report on the Methodology, Organization and Results of a Modular Sample Survey on Labour Migration in Ukraine
40
In most central, northern, eastern and southern oblasts of Ukraine, the Russian Federation is the main country of destination for migrant workers. Overall, half of Ukrainian migrant workers employed in Russia are residents of non-western regions. The share of those migrating to those countries outside the list of the 9 main recipient countries for the Ukrainian labour force is especially higher in the southern oblasts. A considerable share of this migrant category evidently consists of Ukrainian seamen employed on other countries’ ships.
Thus, key factors determining intensity and geographical trends of labour migration in Ukraine’s regions can be highlighted as follows:
• a region’s geographical location, proximity to Ukraine’s borders: this makes labour migration easier and cheaper; greater migration activity is especially appealing when there is proximity to borders with the European Union member states;
• historical and ethnic ties between Ukraine’s regions and foreign countries; • specific features of the population’s culture: it is generally known that a low level
of paternalistic attitudes, and persistent orientation on addressing topical problems using one’s own resources (including by migrating abroad) are typical values of people residing in the western regions of Ukraine;
• a region’s proximity to the capital of Ukraine, Kyiv; work in the capital becomes a real alternative to trips to foreign countries for many Ukrainian citizens;
• language proximity can also facilitate labour migration; • existence of social networks which could facilitate finding employment.
2.1.6 Frequency and Duration of Labour Migrations
Labour migration in Ukraine is mostly of cyclical and seasonal character. According to the survey data, one migrant within the reference period made on average three trips abroad for work, and the average duration of stay abroad (during the most recent labour trip taken) was 5 months. Almost half of the total number of migrants (45.9 per cent) made one trip each, 43.5 per cent made a few trips per year, and 7.3 per cent travelled once or more per month (Annex B, Table B.11).
During their most recent trip, one in three migrants stayed abroad for 1–3 months, and one in four stayed for 3–6 months. Migrants with longer durations of stay were less in number – only one in six stayed in a receiving country for 6–12 months or for a year or longer.
Persons migrating to neighbouring countries (Russia, Belarus, Poland, the Czech Republic, Hungary) focus on periodic short trips with a permanent return to Ukraine. However, those travelling to the South European countries and Germany usually stay on working there for a longer period of time. The survey results indicate that the number of migrants in Ukraine’s neighbouring countries decreases as the duration of their trip increases. However the number of migrants in more remote countries (Italy, Spain, Portugal and Germany), on the contrary, increases as the period of stay becomes longer (Table 2.9).
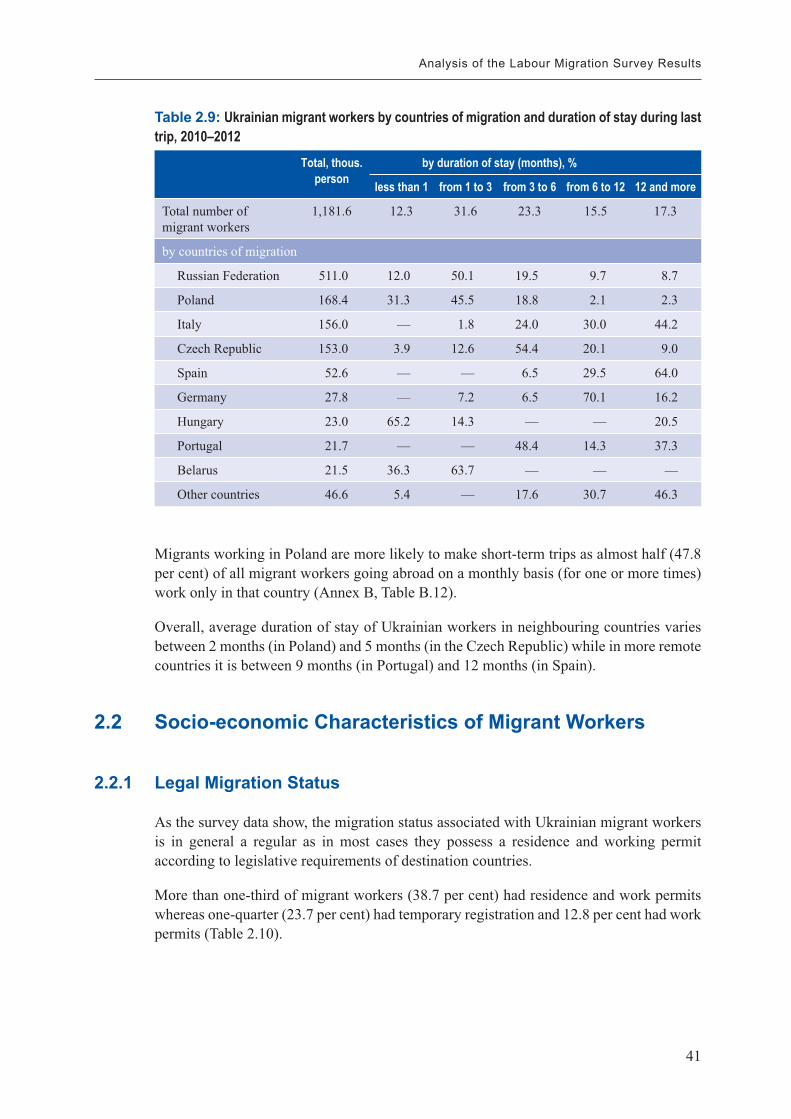
41
Analysis of the Labour Migration Survey Results
Table 2.9: Ukrainian migrant workers by countries of migration and duration of stay during last trip, 2010–2012
Total, thous. person
by duration of stay (months), %
less than 1 from 1 to 3 from 3 to 6 from 6 to 12 12 and more
Total number of migrant workers
1,181.6 12.3 31.6 23.3 15.5 17.3
by countries of migration
Russian Federation 511.0 12.0 50.1 19.5 9.7 8.7
Poland 168.4 31.3 45.5 18.8 2.1 2.3
Italy 156.0 — 1.8 24.0 30.0 44.2
Czech Republic 153.0 3.9 12.6 54.4 20.1 9.0
Spain 52.6 — — 6.5 29.5 64.0
Germany 27.8 — 7.2 6.5 70.1 16.2
Hungary 23.0 65.2 14.3 — — 20.5
Portugal 21.7 — — 48.4 14.3 37.3
Belarus 21.5 36.3 63.7 — — —
Other countries 46.6 5.4 — 17.6 30.7 46.3
Migrants working in Poland are more likely to make short-term trips as almost half (47.8 per cent) of all migrant workers going abroad on a monthly basis (for one or more times) work only in that country (Annex B, Table B.12).
Overall, average duration of stay of Ukrainian workers in neighbouring countries varies between 2 months (in Poland) and 5 months (in the Czech Republic) while in more remote countries it is between 9 months (in Portugal) and 12 months (in Spain).
2.2 Socio-economic Characteristics of Migrant Workers
2.2.1 Legal Migration Status
As the survey data show, the migration status associated with Ukrainian migrant workers is in general a regular as in most cases they possess a residence and working permit according to legislative requirements of destination countries.
More than one-third of migrant workers (38.7 per cent) had residence and work permits whereas one-quarter (23.7 per cent) had temporary registration and 12.8 per cent had work permits (Table 2.10).
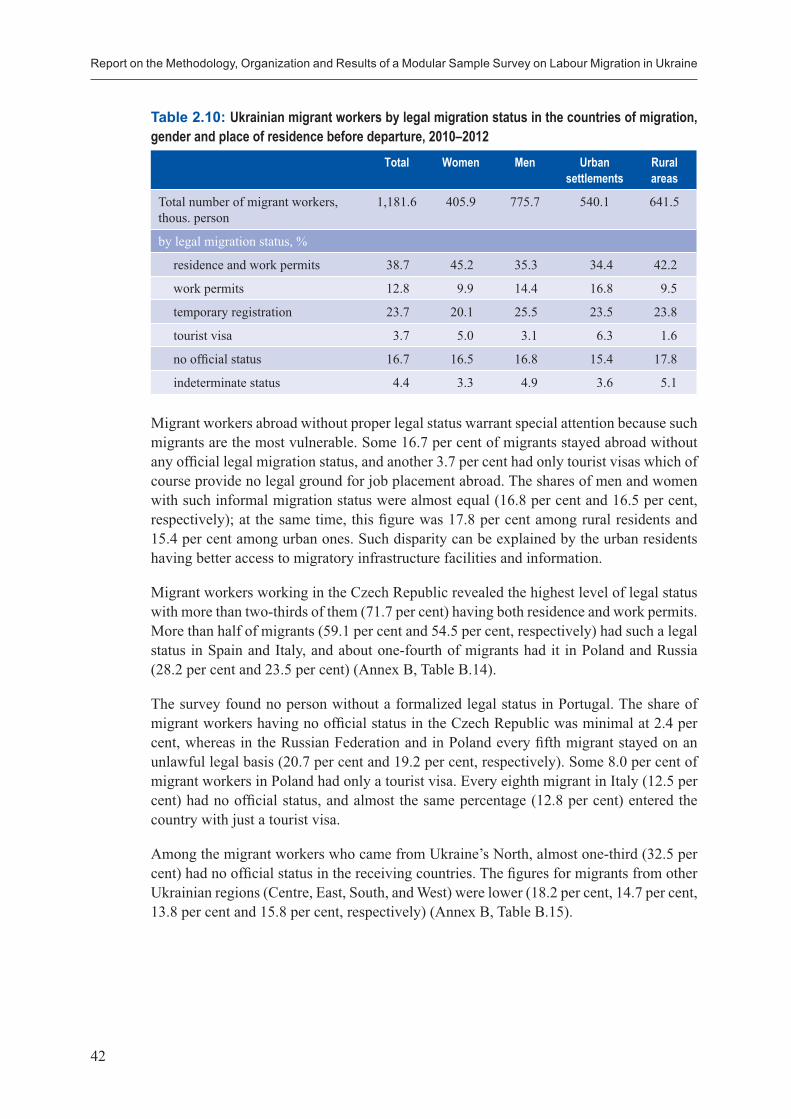
Report on the Methodology, Organization and Results of a Modular Sample Survey on Labour Migration in Ukraine
42
Table 2.10: Ukrainian migrant workers by legal migration status in the countries of migration, gender and place of residence before departure, 2010–2012
Total Women Men Urban settlements
Rural areas
Total number of migrant workers, thous. person
1,181.6 405.9 775.7 540.1 641.5
by legal migration status, %
residence and work permits 38.7 45.2 35.3 34.4 42.2
work permits 12.8 9.9 14.4 16.8 9.5
temporary registration 23.7 20.1 25.5 23.5 23.8
tourist visa 3.7 5.0 3.1 6.3 1.6
no official status 16.7 16.5 16.8 15.4 17.8
indeterminate status 4.4 3.3 4.9 3.6 5.1
Migrant workers abroad without proper legal status warrant special attention because such migrants are the most vulnerable. Some 16.7 per cent of migrants stayed abroad without any official legal migration status, and another 3.7 per cent had only tourist visas which of course provide no legal ground for job placement abroad. The shares of men and women with such informal migration status were almost equal (16.8 per cent and 16.5 per cent, respectively); at the same time, this figure was 17.8 per cent among rural residents and 15.4 per cent among urban ones. Such disparity can be explained by the urban residents having better access to migratory infrastructure facilities and information.
Migrant workers working in the Czech Republic revealed the highest level of legal status with more than two-thirds of them (71.7 per cent) having both residence and work permits. More than half of migrants (59.1 per cent and 54.5 per cent, respectively) had such a legal status in Spain and Italy, and about one-fourth of migrants had it in Poland and Russia (28.2 per cent and 23.5 per cent) (Annex B, Table B.14).
The survey found no person without a formalized legal status in Portugal. The share of migrant workers having no official status in the Czech Republic was minimal at 2.4 per cent, whereas in the Russian Federation and in Poland every fifth migrant stayed on an unlawful legal basis (20.7 per cent and 19.2 per cent, respectively). Some 8.0 per cent of migrant workers in Poland had only a tourist visa. Every eighth migrant in Italy (12.5 per cent) had no official status, and almost the same percentage (12.8 per cent) entered the country with just a tourist visa.
Among the migrant workers who came from Ukraine’s North, almost one-third (32.5 per cent) had no official status in the receiving countries. The figures for migrants from other Ukrainian regions (Centre, East, South, and West) were lower (18.2 per cent, 14.7 per cent, 13.8 per cent and 15.8 per cent, respectively) (Annex B, Table B.15).
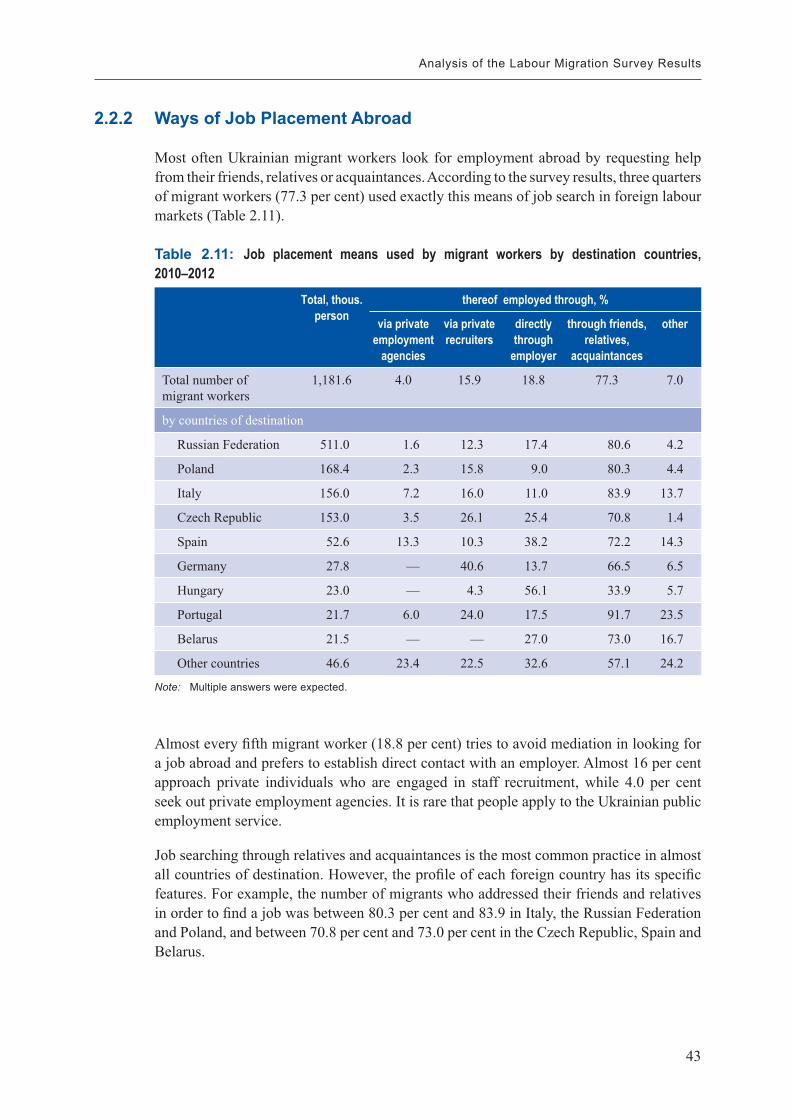
43
Analysis of the Labour Migration Survey Results
2.2.2 Ways of Job Placement Abroad
Most often Ukrainian migrant workers look for employment abroad by requesting help from their friends, relatives or acquaintances. According to the survey results, three quarters of migrant workers (77.3 per cent) used exactly this means of job search in foreign labour markets (Table 2.11).
Table 2.11: Job placement means used by migrant workers by destination countries, 2010–2012
Total, thous. person
thereof employed through, %
via private employment
agencies
via private recruiters
directly through
employer
through friends, relatives,
acquaintances
other
Total number of migrant workers
1,181.6 4.0 15.9 18.8 77.3 7.0
by countries of destination
Russian Federation 511.0 1.6 12.3 17.4 80.6 4.2
Poland 168.4 2.3 15.8 9.0 80.3 4.4
Italy 156.0 7.2 16.0 11.0 83.9 13.7
Czech Republic 153.0 3.5 26.1 25.4 70.8 1.4
Spain 52.6 13.3 10.3 38.2 72.2 14.3
Germany 27.8 — 40.6 13.7 66.5 6.5
Hungary 23.0 — 4.3 56.1 33.9 5.7
Portugal 21.7 6.0 24.0 17.5 91.7 23.5
Belarus 21.5 — — 27.0 73.0 16.7
Other countries 46.6 23.4 22.5 32.6 57.1 24.2
Note: Multiple answers were expected.
Almost every fifth migrant worker (18.8 per cent) tries to avoid mediation in looking for a job abroad and prefers to establish direct contact with an employer. Almost 16 per cent approach private individuals who are engaged in staff recruitment, while 4.0 per cent seek out private employment agencies. It is rare that people apply to the Ukrainian public employment service.
Job searching through relatives and acquaintances is the most common practice in almost all countries of destination. However, the profile of each foreign country has its specific features. For example, the number of migrants who addressed their friends and relatives in order to find a job was between 80.3 per cent and 83.9 in Italy, the Russian Federation and Poland, and between 70.8 per cent and 73.0 per cent in the Czech Republic, Spain and Belarus.
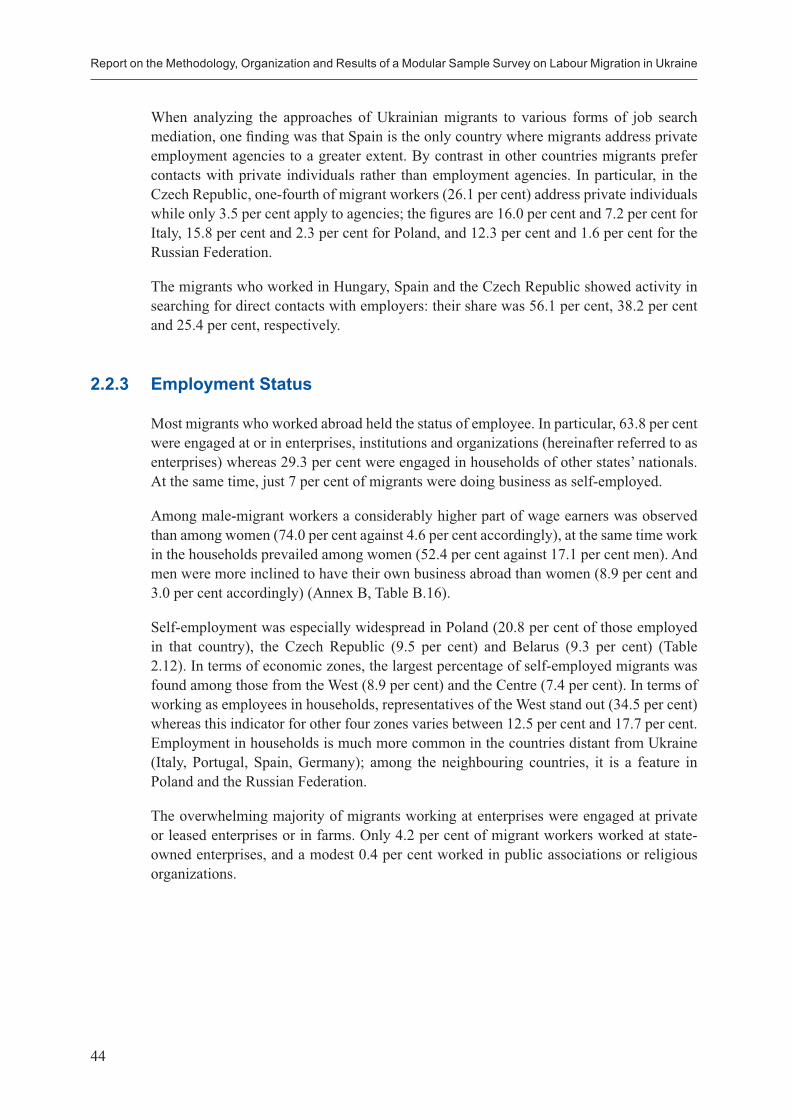
Report on the Methodology, Organization and Results of a Modular Sample Survey on Labour Migration in Ukraine
44
When analyzing the approaches of Ukrainian migrants to various forms of job search mediation, one finding was that Spain is the only country where migrants address private employment agencies to a greater extent. By contrast in other countries migrants prefer contacts with private individuals rather than employment agencies. In particular, in the Czech Republic, one-fourth of migrant workers (26.1 per cent) address private individuals while only 3.5 per cent apply to agencies; the figures are 16.0 per cent and 7.2 per cent for Italy, 15.8 per cent and 2.3 per cent for Poland, and 12.3 per cent and 1.6 per cent for the Russian Federation.
The migrants who worked in Hungary, Spain and the Czech Republic showed activity in searching for direct contacts with employers: their share was 56.1 per cent, 38.2 per cent and 25.4 per cent, respectively.
2.2.3 Employment Status
Most migrants who worked abroad held the status of employee. In particular, 63.8 per cent were engaged at or in enterprises, institutions and organizations (hereinafter referred to as enterprises) whereas 29.3 per cent were engaged in households of other states’ nationals. At the same time, just 7 per cent of migrants were doing business as self-employed.
Among male-migrant workers a considerably higher part of wage earners was observed than among women (74.0 per cent against 4.6 per cent accordingly), at the same time work in the households prevailed among women (52.4 per cent against 17.1 per cent men). And men were more inclined to have their own business abroad than women (8.9 per cent and 3.0 per cent accordingly) (Annex B, Table B.16).
Self-employment was especially widespread in Poland (20.8 per cent of those employed in that country), the Czech Republic (9.5 per cent) and Belarus (9.3 per cent) (Table 2.12). In terms of economic zones, the largest percentage of self-employed migrants was found among those from the West (8.9 per cent) and the Centre (7.4 per cent). In terms of working as employees in households, representatives of the West stand out (34.5 per cent) whereas this indicator for other four zones varies between 12.5 per cent and 17.7 per cent. Employment in households is much more common in the countries distant from Ukraine (Italy, Portugal, Spain, Germany); among the neighbouring countries, it is a feature in Poland and the Russian Federation.
The overwhelming majority of migrants working at enterprises were engaged at private or leased enterprises or in farms. Only 4.2 per cent of migrant workers worked at state-owned enterprises, and a modest 0.4 per cent worked in public associations or religious organizations.
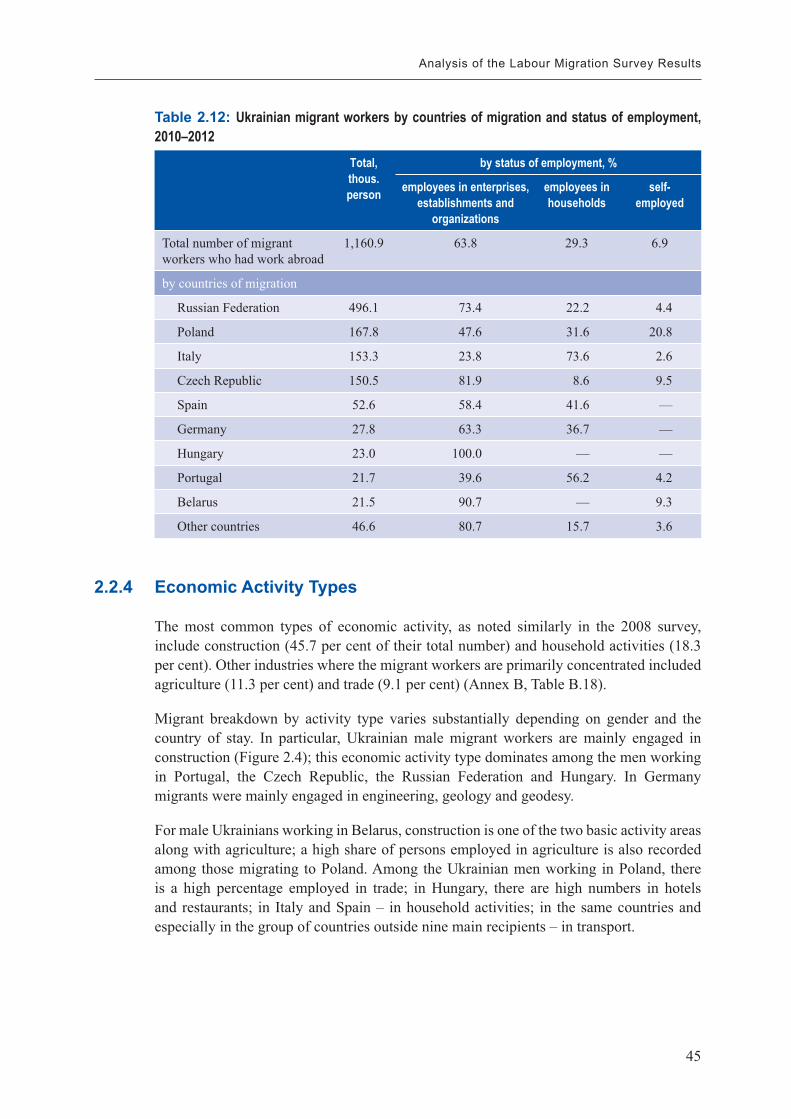
45
Analysis of the Labour Migration Survey Results
Table 2.12: Ukrainian migrant workers by countries of migration and status of employment, 2010–2012
Total, thous. person
by status of employment, %
employees in enterprises, establishments and
organizations
employees in households
self-employed
Total number of migrant workers who had work abroad
1,160.9 63.8 29.3 6.9
by countries of migration
Russian Federation 496.1 73.4 22.2 4.4
Poland 167.8 47.6 31.6 20.8
Italy 153.3 23.8 73.6 2.6
Czech Republic 150.5 81.9 8.6 9.5
Spain 52.6 58.4 41.6 —
Germany 27.8 63.3 36.7 —
Hungary 23.0 100.0 — —
Portugal 21.7 39.6 56.2 4.2
Belarus 21.5 90.7 — 9.3
Other countries 46.6 80.7 15.7 3.6
2.2.4 Economic Activity Types
The most common types of economic activity, as noted similarly in the 2008 survey, include construction (45.7 per cent of their total number) and household activities (18.3 per cent). Other industries where the migrant workers are primarily concentrated included agriculture (11.3 per cent) and trade (9.1 per cent) (Annex B, Table B.18).
Migrant breakdown by activity type varies substantially depending on gender and the country of stay. In particular, Ukrainian male migrant workers are mainly engaged in construction (Figure 2.4); this economic activity type dominates among the men working in Portugal, the Czech Republic, the Russian Federation and Hungary. In Germany migrants were mainly engaged in engineering, geology and geodesy.
For male Ukrainians working in Belarus, construction is one of the two basic activity areas along with agriculture; a high share of persons employed in agriculture is also recorded among those migrating to Poland. Among the Ukrainian men working in Poland, there is a high percentage employed in trade; in Hungary, there are high numbers in hotels and restaurants; in Italy and Spain – in household activities; in the same countries and especially in the group of countries outside nine main recipients – in transport.
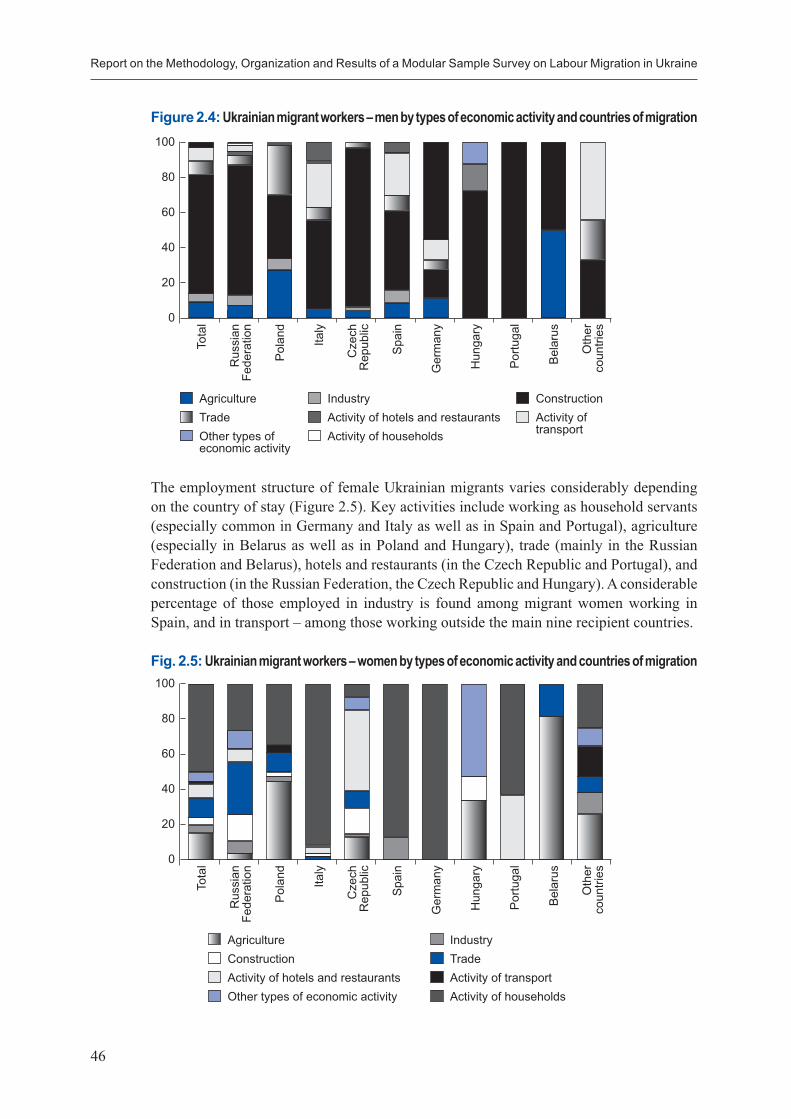
Report on the Methodology, Organization and Results of a Modular Sample Survey on Labour Migration in Ukraine
46
Figure 2.4: Ukrainian migrant workers – men by types of economic activity and countries of migration100
80
60
40
20
0
Tota
l
Rus
sian
Fe
dera
tion
Pol
and
Italy
Cze
ch
Rep
ublic
Spa
in
Ger
man
y
Hun
gary
Por
tuga
l
Bel
arus
Oth
er
coun
tries
AgricultureTradeOther types of economic activity
IndustryActivity of hotels and restaurantsActivity of households
ConstructionActivity of transport
The employment structure of female Ukrainian migrants varies considerably depending on the country of stay (Figure 2.5). Key activities include working as household servants (especially common in Germany and Italy as well as in Spain and Portugal), agriculture (especially in Belarus as well as in Poland and Hungary), trade (mainly in the Russian Federation and Belarus), hotels and restaurants (in the Czech Republic and Portugal), and construction (in the Russian Federation, the Czech Republic and Hungary). A considerable percentage of those employed in industry is found among migrant women working in Spain, and in transport – among those working outside the main nine recipient countries.
Fig. 2.5: Ukrainian migrant workers – women by types of economic activity and countries of migration100
80
60
40
20
0
Tota
l
Rus
sian
Fe
dera
tion
Pol
and
Italy
Cze
ch
Rep
ublic
Spa
in
Ger
man
y
Hun
gary
Por
tuga
l
Bel
arus
Oth
er
coun
tries
AgricultureConstructionActivity of hotels and restaurants
IndustryTradeActivity of transport
Other types of economic activity Activity of households
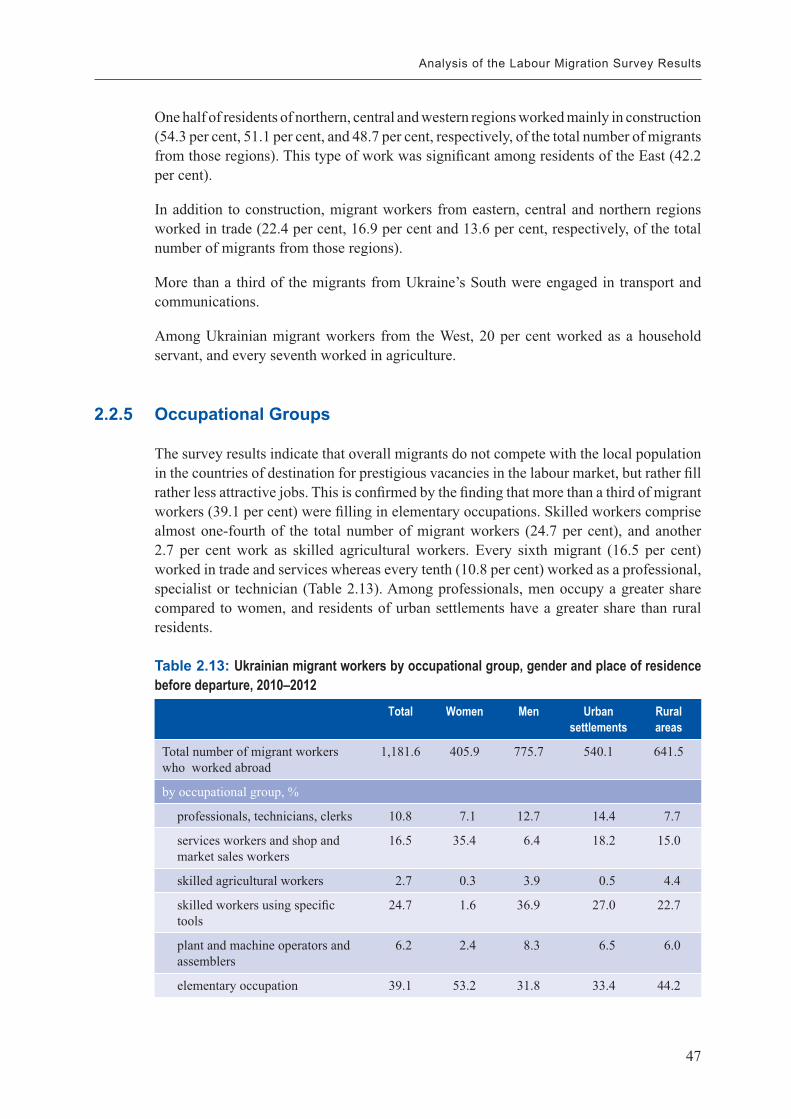
47
Analysis of the Labour Migration Survey Results
One half of residents of northern, central and western regions worked mainly in construction (54.3 per cent, 51.1 per cent, and 48.7 per cent, respectively, of the total number of migrants from those regions). This type of work was significant among residents of the East (42.2 per cent).
In addition to construction, migrant workers from eastern, central and northern regions worked in trade (22.4 per cent, 16.9 per cent and 13.6 per cent, respectively, of the total number of migrants from those regions).
More than a third of the migrants from Ukraine’s South were engaged in transport and communications.
Among Ukrainian migrant workers from the West, 20 per cent worked as a household servant, and every seventh worked in agriculture.
2.2.5 Occupational Groups
The survey results indicate that overall migrants do not compete with the local population in the countries of destination for prestigious vacancies in the labour market, but rather fill rather less attractive jobs. This is confirmed by the finding that more than a third of migrant workers (39.1 per cent) were filling in elementary occupations. Skilled workers comprise almost one-fourth of the total number of migrant workers (24.7 per cent), and another 2.7 per cent work as skilled agricultural workers. Every sixth migrant (16.5 per cent) worked in trade and services whereas every tenth (10.8 per cent) worked as a professional, specialist or technician (Table 2.13). Among professionals, men occupy a greater share compared to women, and residents of urban settlements have a greater share than rural residents.
Table 2.13: Ukrainian migrant workers by occupational group, gender and place of residence before departure, 2010–2012
Total Women Men Urban settlements
Rural areas
Total number of migrant workers who worked abroad
1,181.6 405.9 775.7 540.1 641.5
by occupational group, %
professionals, technicians, clerks 10.8 7.1 12.7 14.4 7.7
services workers and shop and market sales workers
16.5 35.4 6.4 18.2 15.0
skilled agricultural workers 2.7 0.3 3.9 0.5 4.4
skilled workers using specific tools
24.7 1.6 36.9 27.0 22.7
plant and machine operators and assemblers
6.2 2.4 8.3 6.5 6.0
elementary occupation 39.1 53.2 31.8 33.4 44.2
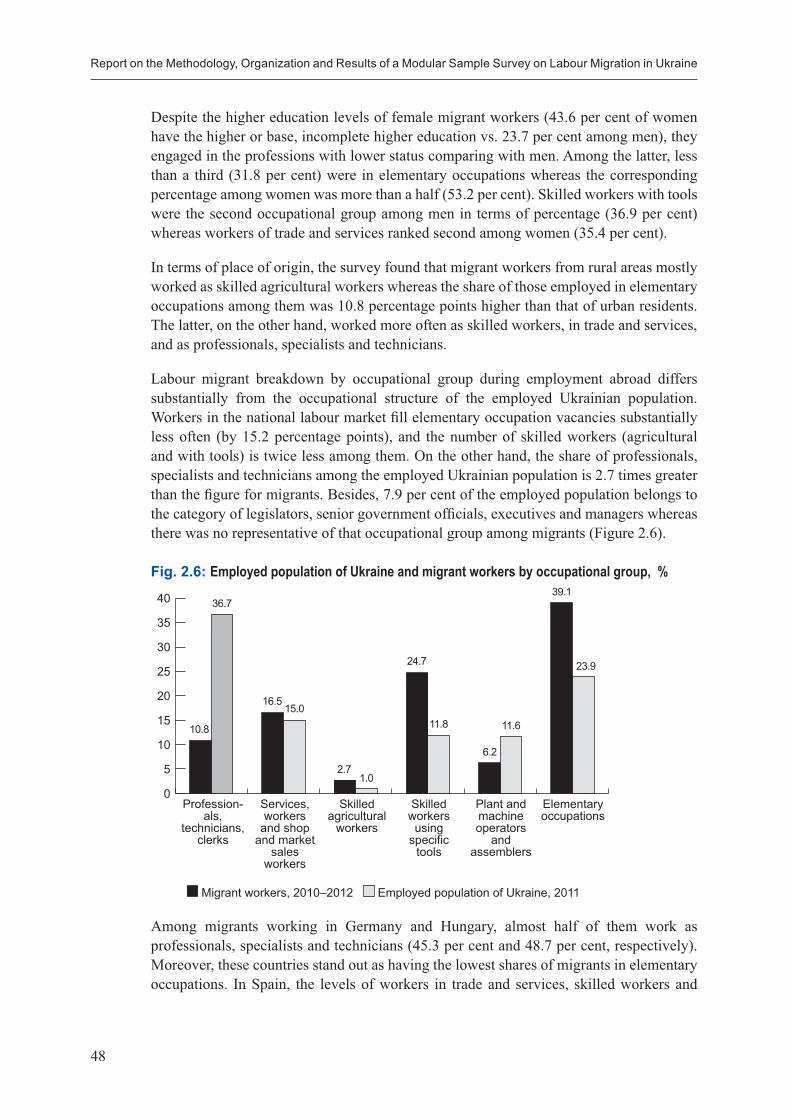
Report on the Methodology, Organization and Results of a Modular Sample Survey on Labour Migration in Ukraine
48
Despite the higher education levels of female migrant workers (43.6 per cent of women have the higher or base, incomplete higher education vs. 23.7 per cent among men), they engaged in the professions with lower status comparing with men. Among the latter, less than a third (31.8 per cent) were in elementary occupations whereas the corresponding percentage among women was more than a half (53.2 per cent). Skilled workers with tools were the second occupational group among men in terms of percentage (36.9 per cent) whereas workers of trade and services ranked second among women (35.4 per cent).
In terms of place of origin, the survey found that migrant workers from rural areas mostly worked as skilled agricultural workers whereas the share of those employed in elementary occupations among them was 10.8 percentage points higher than that of urban residents. The latter, on the other hand, worked more often as skilled workers, in trade and services, and as professionals, specialists and technicians.
Labour migrant breakdown by occupational group during employment abroad differs substantially from the occupational structure of the employed Ukrainian population. Workers in the national labour market fill elementary occupation vacancies substantially less often (by 15.2 percentage points), and the number of skilled workers (agricultural and with tools) is twice less among them. On the other hand, the share of professionals, specialists and technicians among the employed Ukrainian population is 2.7 times greater than the figure for migrants. Besides, 7.9 per cent of the employed population belongs to the category of legislators, senior government officials, executives and managers whereas there was no representative of that occupational group among migrants (Figure 2.6).
Fig. 2.6: Employed population of Ukraine and migrant workers by occupational group, %
Migrant workers, 2010–2012 Employed population of Ukraine, 2011
40
35
30
25
20
15
10
5
0Profession-
als, technicians,
clerks
Services, workers
and shop and market
sales workers
Skilled agricultural
workers
Skilled workers using
specific tools
Plant and machine operators
and assemblers
Elementary occupations
10.8
36.7
16.515.0
2.71.0
24.7
11.8
6.2
11.6
39.1
23.9
Among migrants working in Germany and Hungary, almost half of them work as professionals, specialists and technicians (45.3 per cent and 48.7 per cent, respectively). Moreover, these countries stand out as having the lowest shares of migrants in elementary occupations. In Spain, the levels of workers in trade and services, skilled workers and
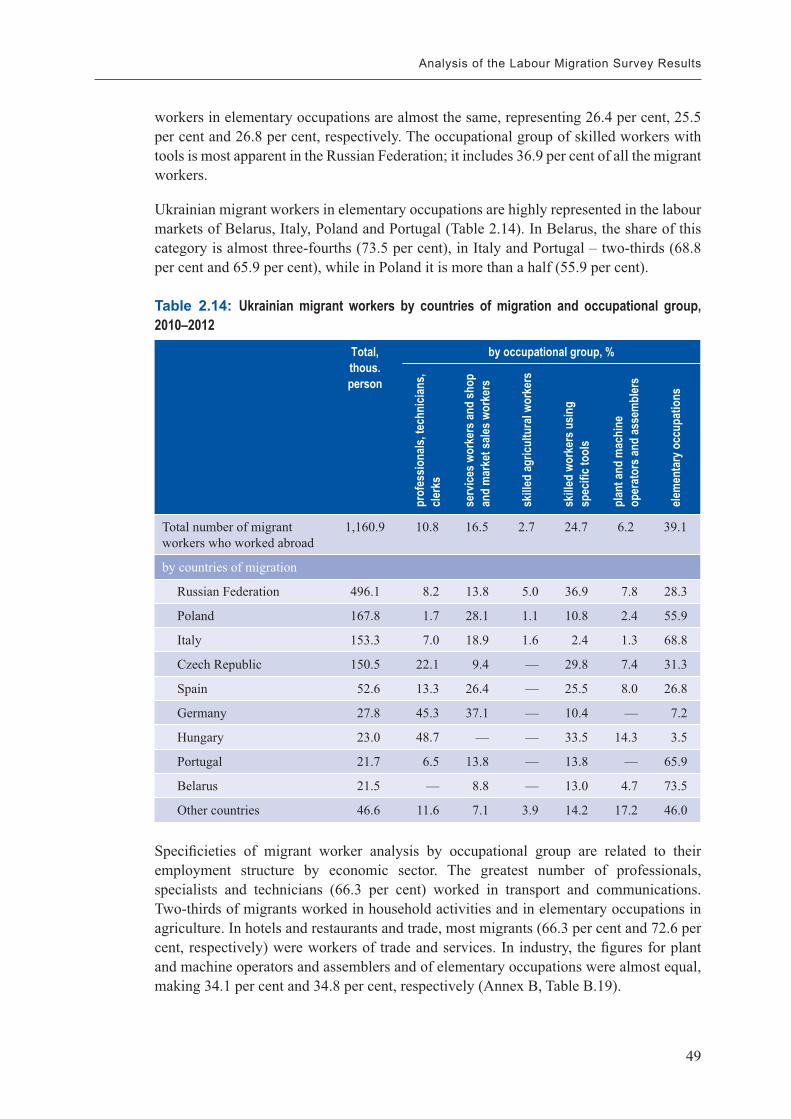
49
Analysis of the Labour Migration Survey Results
workers in elementary occupations are almost the same, representing 26.4 per cent, 25.5 per cent and 26.8 per cent, respectively. The occupational group of skilled workers with tools is most apparent in the Russian Federation; it includes 36.9 per cent of all the migrant workers.
Ukrainian migrant workers in elementary occupations are highly represented in the labour markets of Belarus, Italy, Poland and Portugal (Table 2.14). In Belarus, the share of this category is almost three-fourths (73.5 per cent), in Italy and Portugal – two-thirds (68.8 per cent and 65.9 per cent), while in Poland it is more than a half (55.9 per cent).
Table 2.14: Ukrainian migrant workers by countries of migration and occupational group, 2010–2012
Total, thous. person
by occupational group, %
prof
essio
nals,
tech
nicia
ns,
clerk
s
serv
ices w
orke
rs an
d sh
op
and
mar
ket s
ales w
orke
rs
skille
d ag
ricul
tura
l wor
kers
skille
d wo
rker
s usin
g sp
ecifi
c too
ls
plan
t and
mac
hine
op
erat
ors a
nd as
sem
bler
s
elem
enta
ry o
ccup
atio
ns
Total number of migrant workers who worked abroad
1,160.9 10.8 16.5 2.7 24.7 6.2 39.1
by countries of migration
Russian Federation 496.1 8.2 13.8 5.0 36.9 7.8 28.3
Poland 167.8 1.7 28.1 1.1 10.8 2.4 55.9
Italy 153.3 7.0 18.9 1.6 2.4 1.3 68.8
Czech Republic 150.5 22.1 9.4 — 29.8 7.4 31.3
Spain 52.6 13.3 26.4 — 25.5 8.0 26.8
Germany 27.8 45.3 37.1 — 10.4 — 7.2
Hungary 23.0 48.7 — — 33.5 14.3 3.5
Portugal 21.7 6.5 13.8 — 13.8 — 65.9
Belarus 21.5 — 8.8 — 13.0 4.7 73.5
Other countries 46.6 11.6 7.1 3.9 14.2 17.2 46.0
Specificieties of migrant worker analysis by occupational group are related to their employment structure by economic sector. The greatest number of professionals, specialists and technicians (66.3 per cent) worked in transport and communications. Two-thirds of migrants worked in household activities and in elementary occupations in agriculture. In hotels and restaurants and trade, most migrants (66.3 per cent and 72.6 per cent, respectively) were workers of trade and services. In industry, the figures for plant and machine operators and assemblers and of elementary occupations were almost equal, making 34.1 per cent and 34.8 per cent, respectively (Annex B, Table B.19).
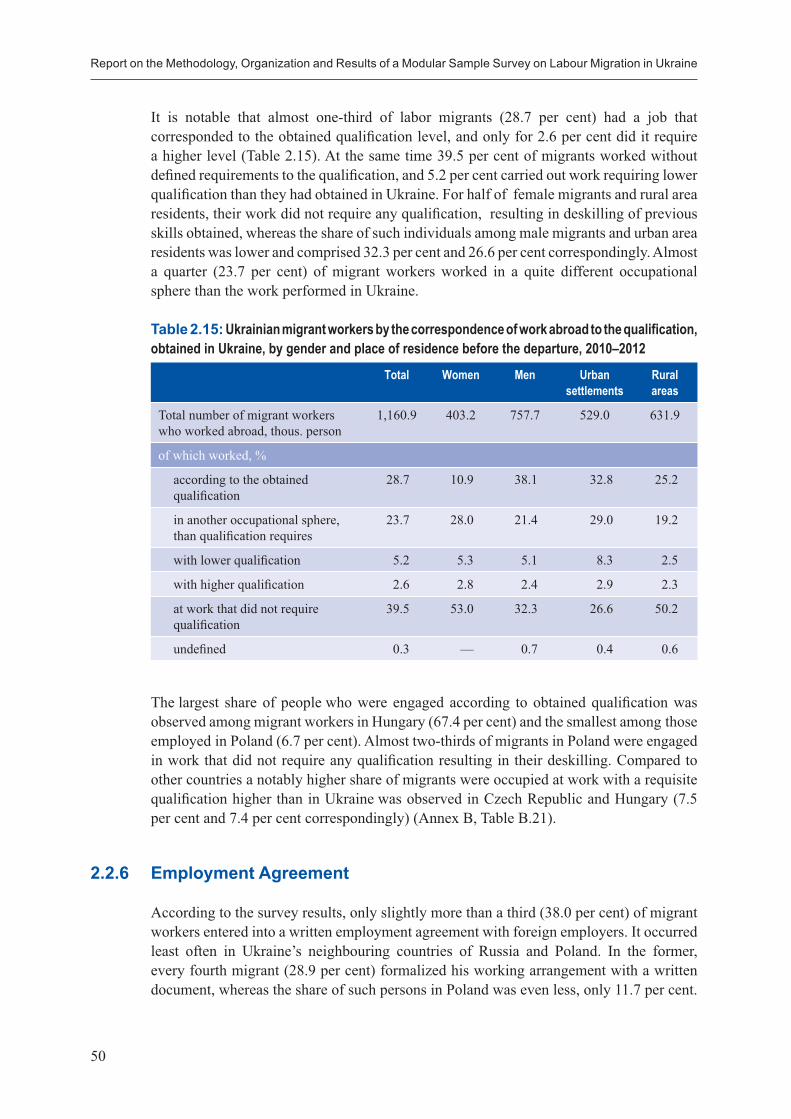
Report on the Methodology, Organization and Results of a Modular Sample Survey on Labour Migration in Ukraine
50
It is notable that almost one-third of labor migrants (28.7 per cent) had a job that corresponded to the obtained qualification level, and only for 2.6 per cent did it require a higher level (Table 2.15). At the same time 39.5 per cent of migrants worked without defined requirements to the qualification, and 5.2 per cent carried out work requiring lower qualification than they had obtained in Ukraine. For half of female migrants and rural area residents, their work did not require any qualification, resulting in deskilling of previous skills obtained, whereas the share of such individuals among male migrants and urban area residents was lower and comprised 32.3 per cent and 26.6 per cent correspondingly. Almost a quarter (23.7 per cent) of migrant workers worked in a quite different occupational sphere than the work performed in Ukraine.
Table 2.15: Ukrainian migrant workers by the correspondence of work abroad to the qualification, obtained in Ukraine, by gender and place of residence before the departure, 2010–2012
Total Women Men Urban settlements
Rural areas
Total number of migrant workers who worked abroad, thous. person
1,160.9 403.2 757.7 529.0 631.9
of which worked, %
according to the obtained qualification
28.7 10.9 38.1 32.8 25.2
in another occupational sphere, than qualification requires
23.7 28.0 21.4 29.0 19.2
with lower qualification 5.2 5.3 5.1 8.3 2.5
with higher qualification 2.6 2.8 2.4 2.9 2.3
at work that did not require qualification
39.5 53.0 32.3 26.6 50.2
undefined 0.3 — 0.7 0.4 0.6
The largest share of people who were engaged according to obtained qualification was observed among migrant workers in Hungary (67.4 per cent) and the smallest among those employed in Poland (6.7 per cent). Almost two-thirds of migrants in Poland were engaged in work that did not require any qualification resulting in their deskilling. Compared to other countries a notably higher share of migrants were occupied at work with a requisite qualification higher than in Ukraine was observed in Czech Republic and Hungary (7.5 per cent and 7.4 per cent correspondingly) (Annex B, Table B.21).
2.2.6 Employment Agreement
According to the survey results, only slightly more than a third (38.0 per cent) of migrant workers entered into a written employment agreement with foreign employers. It occurred least often in Ukraine’s neighbouring countries of Russia and Poland. In the former, every fourth migrant (28.9 per cent) formalized his working arrangement with a written document, whereas the share of such persons in Poland was even less, only 11.7 per cent.
51
Analysis of the Labour Migration Survey Results
Only in the Czech Republic, Belarus and Germany did more than a half of Ukrainian migrants (58.1 per cent, 56.9 per cent and 52.9 per cent, respectively) concluded written employment agreements (contracts) (Annex B, Table B.23).
In most cases a written employment agreement was concluded between migrant workers and employers in the language of the country of employment, and only in 25 per cent was it translated into Ukrainian. The frequency of translation of employment agreements into Ukrainian depends on the migrants’ fluency in the language of the country of employment: e.g. in Russia only 8.5 per cent of contracts had a Ukrainian translation; in Belarus, the survey found none of such cases; in Poland, the share of such agreements was 46.5 per cent. Almost the same number was found in Portugal (40.5 per cent), and in all other countries of destination the share of translated agreements was about 25 per cent. Although the agreements were mainly entered into in the languages of the countries of destination, almost all the Ukrainian migrants stated that they completely understood the contract terms, namely the rights and responsibilities of the parties, preferences, remuneration and so forth. Only minor groups of persons employed in Spain were an exception.
Migrant workers working in private households abroad (domestic work) are especially vulnerable to violation of their labour rights because of the specificity of national legislation application. This category of Ukrainian migrants (mainly women) formalizes their employment arrangements only rarely (in 16.5 per cent of cases) with a written document.
Among migrants working as employees in organizations, institutions or enterprises, the number of persons having concluded written employment agreements reached almost half, 47.8 per cent.
In terms of the prevalence of written agreements, among all the major sectors where Ukrainian migrant workers work, transport and communications is the leading one. The overwhelming majority of Ukrainians in that sector (95.1 per cent) worked under a written employment agreement. The relevant indicator was high for migrants employed in industry (71.9 per cent) and hotels and restaurants (70.4 per cent). Migrants working in construction had written employment contracts far less often, only in 26.4 per cent of cases.
2.2.7 Working Conditions
Given the unregulated legal status of many Ukrainian migrant workers working abroad, employment conditions do not always comply with labour standards. In particular, a considerable number of them have no access to necessary resting time provisions that would allow them to recuperate properly after production work. For example, one-quarter of the migrants work without any weekly days off. Working conditions for Ukrainian migrants vary depending on country of destination. In the Czech Republic, the percentage of Ukrainians working without weekly days off is relatively low – 7.8 per cent; in Italy, the number of such persons is almost twice that (12.5 per cent). Almost every fifth migrant in Poland (21.1 per cent) had no days off; in Russia it was every third (34.2 per cent); in Hungary, the survey found more than half of the migrants were denied this basic entitlement (58.7 per cent) (Table 2.16).
Report on the Methodology, Organization and Results of a Modular Sample Survey on Labour Migration in Ukraine
52
Table 2.16: Ukrainian migrant workers by migration working conditions and level of social security, 2010–2012
Total, thous. person
thereof by benefits provided in labour contracts, %
healt
h in
sura
nce
paid
annu
al lea
ve
paid
sick
leav
e
week
ly re
st d
ay
pay f
or o
verti
me
socia
l sec
urity
ineli
gibl
e an
y
unde
fined
Total number of hired migrant workers
1,081.2 20.8 18.7 11.2 74.1 28.3 24.7 17.0 3.0
by countries of migration
Russian Federation 474.0 9.4 10.0 5.5 65.8 19.9 13.1 23.4 4.5
Poland 132.9 10.8 7.4 6.3 78.9 36.6 11.9 19.3 —
Italy 149.4 19.9 40.9 8.1 87.5 27.4 10.0 6.8 1.6
Czech Republic 136.3 51.1 34.3 34.2 92.2 42.6 70.3 0.8 1.1
Spain 52.6 29.7 14.1 4.0 81.4 41.4 20.5 8.2 5.7
Germany 27.8 49.6 3.2 38.8 75.5 25.9 6.5 10.4 —
Hungary 23.0 41.3 41.3 19.6 41.3 41.3 100.0 51.3 7.4
Portugal 20.8 28.8 14.4 14.4 70.7 40.4 72.0 6.3 8.2
Belarus 19.5 16.4 — 4.6 71.3 — 16.4 29.2 —
Other countries 44.9 41.2 36.5 14.0 58.6 37.6 54.3 22.3 2.4
Note: Multiple answers were expected.
Work schedules for migrants depend on the type of work. About half of those engaged in trade, transport and communications worked without any day off whereas every seventh one among those employed in hotels and restaurants shared this characteristic.
Every fourth migrant had access to social insurance abroad. In the Czech Republic, Hungary and Portugal, numbers having access to these preference types were several times greater than the general figure. Health insurance was a feature of work arrangements for every fifth migrant (20.8 per cent); most often it happened in the Czech Republic, least often in the Russian Federation.
Most migrants are motivated by a desire to earn as much money as possible from employment abroad. It is disappointing to note therefore that only slightly over a quarter (28.3 per cent) of them had a provision for overtime work pay in their employment agreements. Overtime provisions are usual in such countries as the Czech Republic, Hungary, Portugal and Spain. They are also a feature in such activity types as agriculture (36.3 per cent), hotels and restaurants (35.7 per cent), and transport and communications (33.3 per cent).
The survey revealed that only 18.7 per cent of migrant workers had access to annual paid leave. However, it needs to be noted that a great number of migrant workers stay
53
Analysis of the Labour Migration Survey Results
abroad for less than a year, so the significance of annual leave to such migrants diminishes or disappears entirely. This conclusion is confirmed by the information obtained during the survey on access to that preference in various countries of destination and activity types. For example, in the Czech Republic and Italy, where work duration of the Ukrainian migrants is relatively long, the shares of migrants whose employment agreements contain a provision on annual paid leave are greater than the general indicator. However it is not confirmed in the case of Spain and Portugal. Among various activity types where Ukrainian migrants work, leave entitlement was enjoyed only rarely by those working in sectors where employment is mainly seasonal and temporary – agriculture (10.6 per cent) and construction (10.0 per cent).
There is wide disparity with regard to social insurance. Some migrants had access to several categories of social insurance and preferences at once. However, by the same token, almost every sixth migrant (17.0 per cent) had no access to any of them. Whereas almost no person of the latter category was found in the Czech Republic, and they were relatively few in Italy and Spain (6.8 per cent and 8.2 per cent, respectively), in Hungary such workers numbered more than half of the total (51.3 per cent).
According to the survey data, 52.6 thousand persons, or 4.5 per cent of the total number of migrant workers, paid contributions to the Pension Fund of Ukraine. Most were persons aged 50–59 and aged 25–34 among which the rate of participation in payment of contributions to the Fund was 6.7 per cent and 6.2 per cent, respectively. The lowest value of this indicator was recorded among migrant workers aged 40–49 (2.2 per cent of the number of migrant workers of this age). Male migrants contributed more actively than women, and residents of urban settlements were more participatory than rural residents.
Duration of working time is one of the key indicators depicting working conditions of employed persons both in Ukraine and abroad. Considering that many migrants employed outside Ukraine have no access to social insurance and often work without days off, their working week is much longer than generally accepted standards. Almost two-thirds (62.6 per cent) of the Ukrainian migrants worked abroad for 41–60 hours a week, and almost every fifth (18.9 per cent) worked even longer. Of them, 14.3 per cent had a working week of 61–80 hours, and the remainder, 4.6 per cent, even exceeded 80 hours (Table 2.17).
The number of migrant workers working less than 40 hours a week was 17.8 per cent. In some countries this characteristic reached one-third (Hungary – 35.2 per cent, Poland – 35.0 per cent), elsewhere it was much lower (the Czech Republic – 11.2 per cent, Italy – 13.6 per cent). By contrast, in Spain and Germany the survey found no migrant with such a shorter working week duration.
Longer working weeks were typical of employment in Germany (86.0 per cent of them worked for 41–60 hours a week, 7.6 per cent worked for 61–80 hours, and 6.4 per cent worked for over 80 hours) and the Czech Republic (80.9 per cent and 6.9 per cent, respectively). However, having regard to the fact that Ukrainian migrants in the Czech Republic are more favourably covered by social insurance and only rarely hold an informal legal status, no examples of longer working weeks (over 80 hours) were detected there.
Report on the Methodology, Organization and Results of a Modular Sample Survey on Labour Migration in Ukraine
54
Table 2.17: Ukrainian migrant workers by countries of migration and duration of working time, 2010–2012
Total, thous. person
by duration of working time per week, %
less than 40 hours
41–60 hours
61–80 hours
over 80 hours
undefined
Total number of migrant workers who worked abroad
1,160.9 17.8 62.6 14.3 4.6 0.7
by countries of migration
Russian Federation 496.1 16.2 62.4 18.4 2.6 0.4
Poland 167.8 35.0 46.1 15.8 3.1 —
Italy 153.3 13.6 65.9 9.0 11.0 0.5
Czech Republic 150.5 11.2 80.9 6.9 — 1.0
Spain 52.6 — 71.7 22.6 — 5.7
Germany 27.8 — 86.0 7.6 6.4 —
Hungary 23.0 35.2 40.0 19.1 — 5.7
Portugal 21.7 22.6 60.4 — 17.0 —
Belarus 21.5 18.1 70.7 — 11.2 —
Other countries 46.6 26.8 39.7 11,6 21.9 —
Wholesale and retail trade is the only economic activity type where the working week duration of most Ukrainian migrants (57.7 per cent) is not longer than 40 hours. This is evident by the limited hours of work of trade establishments in the EU countries employing Ukrainian migrants. Almost one-third (31.1 per cent) of migrants working in transport also work less than 40 hours per week while the numbers of workers with such a reduced working week duration in all other surveyed sectors are comparatively small (Annex B, Table B.24).
When searching for employment abroad, every seventh migrant (13.6 per cent) encountered problems related to remuneration, namely delay of payment or incomplete payment. Similar numbers incurred unfavourable working conditions and were asked to undertake duties that differed from what had been promised (12.7 per cent and 11.5 per cent, respectively). Some 6.0 per cent of migrant workers worked overtime without proper remuneration, while 5.0 per cent encountered instances of transfer from one employer to another without their consent. Having observed that, it must by contrast be noted that two-thirds of migrants (66.3 per cent) never found themselves in such situations; Countries such as Belarus (92.3 per cent), Germany (89.2 per cent) and Italy (80.1 per cent) reflected more positive experiences and were more favourably regarded by those surveyed. Less well regarded were the Czech Republic and Russia (57.8 per cent and 58.7 per cent, respectively) (Annex B, table B.26). By activity group, the smallest share of persons who never encountered infringement of their rights was found in hotels and restaurants (54.5 per cent) and construction (55.5 per cent) (Annex B, Table B.27).
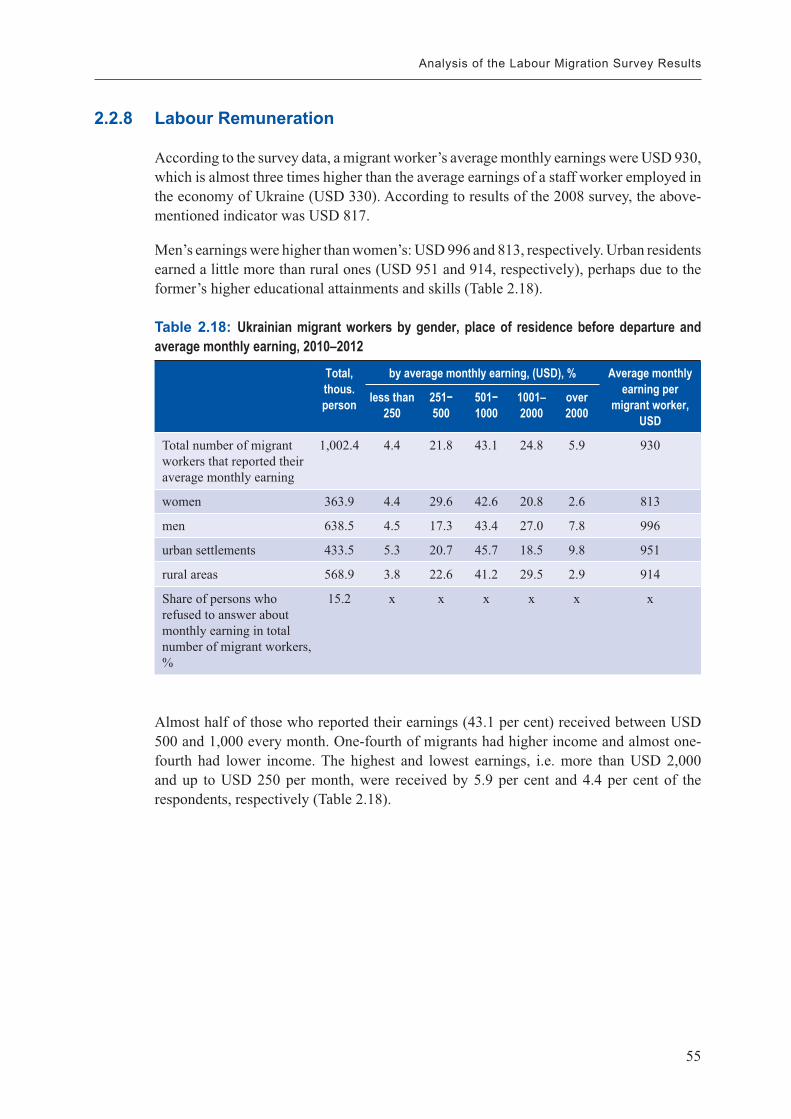
55
Analysis of the Labour Migration Survey Results
2.2.8 Labour Remuneration
According to the survey data, a migrant worker’s average monthly earnings were USD 930, which is almost three times higher than the average earnings of a staff worker employed in the economy of Ukraine (USD 330). According to results of the 2008 survey, the above-mentioned indicator was USD 817.
Men’s earnings were higher than women’s: USD 996 and 813, respectively. Urban residents earned a little more than rural ones (USD 951 and 914, respectively), perhaps due to the former’s higher educational attainments and skills (Table 2.18).
Table 2.18: Ukrainian migrant workers by gender, place of residence before departure and average monthly earning, 2010–2012
Total, thous. person
by average monthly earning, (USD), % Average monthly earning per
migrant worker, USD
less than 250
251−500
501−1000
1001–2000
over 2000
Total number of migrant workers that reported their average monthly earning
1,002.4 4.4 21.8 43.1 24.8 5.9 930
women 363.9 4.4 29.6 42.6 20.8 2.6 813
men 638.5 4.5 17.3 43.4 27.0 7.8 996
urban settlements 433.5 5.3 20.7 45.7 18.5 9.8 951
rural areas 568.9 3.8 22.6 41.2 29.5 2.9 914
Share of persons who refused to answer about monthly earning in total number of migrant workers, %
15.2 х х х х х х
Almost half of those who reported their earnings (43.1 per cent) received between USD 500 and 1,000 every month. One-fourth of migrants had higher income and almost one-fourth had lower income. The highest and lowest earnings, i.e. more than USD 2,000 and up to USD 250 per month, were received by 5.9 per cent and 4.4 per cent of the respondents, respectively (Table 2.18).
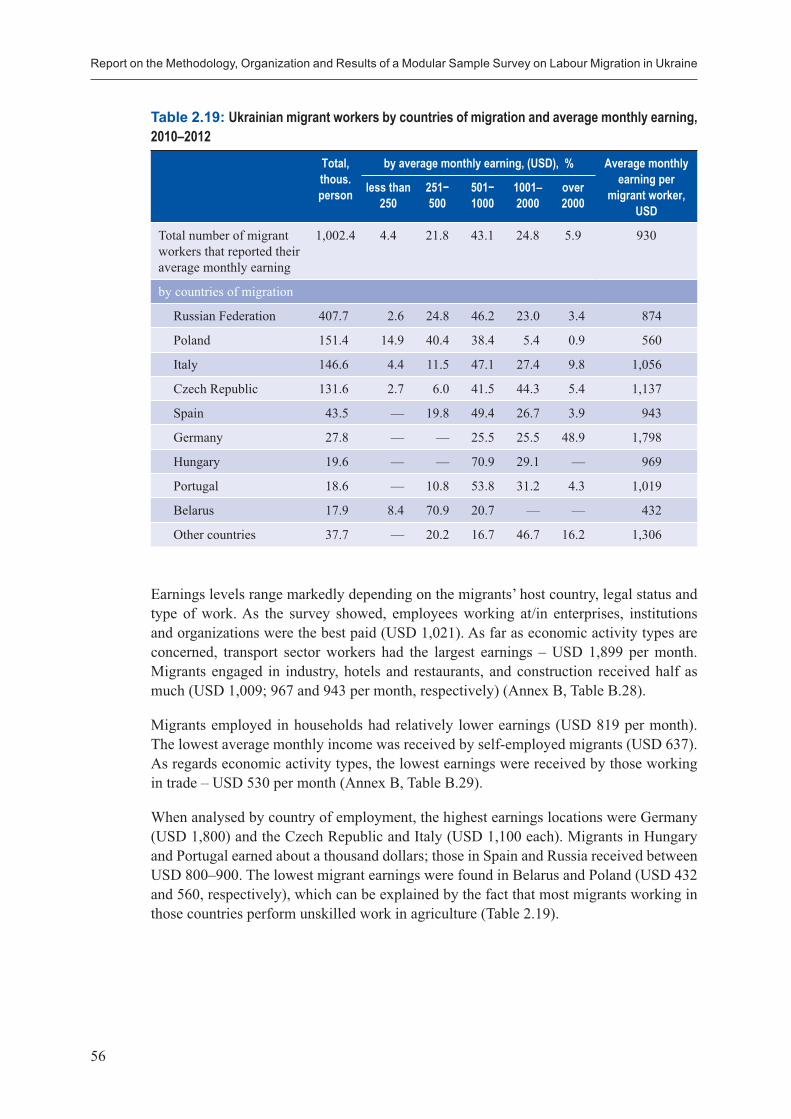
Report on the Methodology, Organization and Results of a Modular Sample Survey on Labour Migration in Ukraine
56
Table 2.19: Ukrainian migrant workers by countries of migration and average monthly earning, 2010–2012
Total, thous. person
by average monthly earning, (USD), % Average monthly earning per
migrant worker, USD
less than 250
251−500
501−1000
1001–2000
over 2000
Total number of migrant workers that reported their average monthly earning
1,002.4 4.4 21.8 43.1 24.8 5.9 930
by countries of migration
Russian Federation 407.7 2.6 24.8 46.2 23.0 3.4 874
Poland 151.4 14.9 40.4 38.4 5.4 0.9 560
Italy 146.6 4.4 11.5 47.1 27.4 9.8 1,056
Czech Republic 131.6 2.7 6.0 41.5 44.3 5.4 1,137
Spain 43.5 — 19.8 49.4 26.7 3.9 943
Germany 27.8 — — 25.5 25.5 48.9 1,798
Hungary 19.6 — — 70.9 29.1 — 969
Portugal 18.6 — 10.8 53.8 31.2 4.3 1,019
Belarus 17.9 8.4 70.9 20.7 — — 432
Other countries 37.7 — 20.2 16.7 46.7 16.2 1,306
Earnings levels range markedly depending on the migrants’ host country, legal status and type of work. As the survey showed, employees working at/in enterprises, institutions and organizations were the best paid (USD 1,021). As far as economic activity types are concerned, transport sector workers had the largest earnings – USD 1,899 per month. Migrants engaged in industry, hotels and restaurants, and construction received half as much (USD 1,009; 967 and 943 per month, respectively) (Annex B, Table B.28).
Migrants employed in households had relatively lower earnings (USD 819 per month). The lowest average monthly income was received by self-employed migrants (USD 637). As regards economic activity types, the lowest earnings were received by those working in trade – USD 530 per month (Annex B, Table B.29).
When analysed by country of employment, the highest earnings locations were Germany (USD 1,800) and the Czech Republic and Italy (USD 1,100 each). Migrants in Hungary and Portugal earned about a thousand dollars; those in Spain and Russia received between USD 800–900. The lowest migrant earnings were found in Belarus and Poland (USD 432 and 560, respectively), which can be explained by the fact that most migrants working in those countries perform unskilled work in agriculture (Table 2.19).
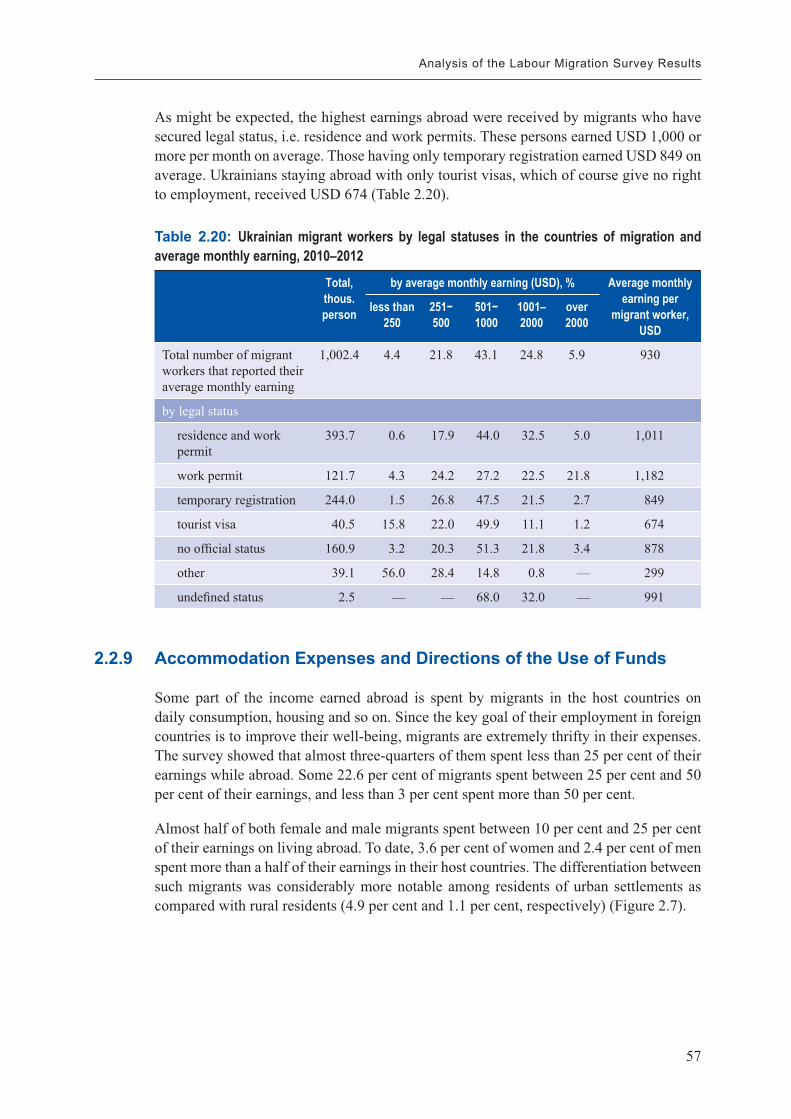
57
Analysis of the Labour Migration Survey Results
As might be expected, the highest earnings abroad were received by migrants who have secured legal status, i.e. residence and work permits. These persons earned USD 1,000 or more per month on average. Those having only temporary registration earned USD 849 on average. Ukrainians staying abroad with only tourist visas, which of course give no right to employment, received USD 674 (Table 2.20).
Table 2.20: Ukrainian migrant workers by legal statuses in the countries of migration and average monthly earning, 2010–2012
Total, thous. person
by average monthly earning (USD), % Average monthly earning per
migrant worker, USD
less than 250
251−500
501−1000
1001–2000
over 2000
Total number of migrant workers that reported their average monthly earning
1,002.4 4.4 21.8 43.1 24.8 5.9 930
by legal status
residence and work permit
393.7 0.6 17.9 44.0 32.5 5.0 1,011
work permit 121.7 4.3 24.2 27.2 22.5 21.8 1,182
temporary registration 244.0 1.5 26.8 47.5 21.5 2.7 849
tourist visa 40.5 15.8 22.0 49.9 11.1 1.2 674
no official status 160.9 3.2 20.3 51.3 21.8 3.4 878
other 39.1 56.0 28.4 14.8 0.8 — 299
undefined status 2.5 — — 68.0 32.0 — 991
2.2.9 Accommodation Expenses and Directions of the Use of Funds
Some part of the income earned abroad is spent by migrants in the host countries on daily consumption, housing and so on. Since the key goal of their employment in foreign countries is to improve their well-being, migrants are extremely thrifty in their expenses. The survey showed that almost three-quarters of them spent less than 25 per cent of their earnings while abroad. Some 22.6 per cent of migrants spent between 25 per cent and 50 per cent of their earnings, and less than 3 per cent spent more than 50 per cent.
Almost half of both female and male migrants spent between 10 per cent and 25 per cent of their earnings on living abroad. To date, 3.6 per cent of women and 2.4 per cent of men spent more than a half of their earnings in their host countries. The differentiation between such migrants was considerably more notable among residents of urban settlements as compared with rural residents (4.9 per cent and 1.1 per cent, respectively) (Figure 2.7).
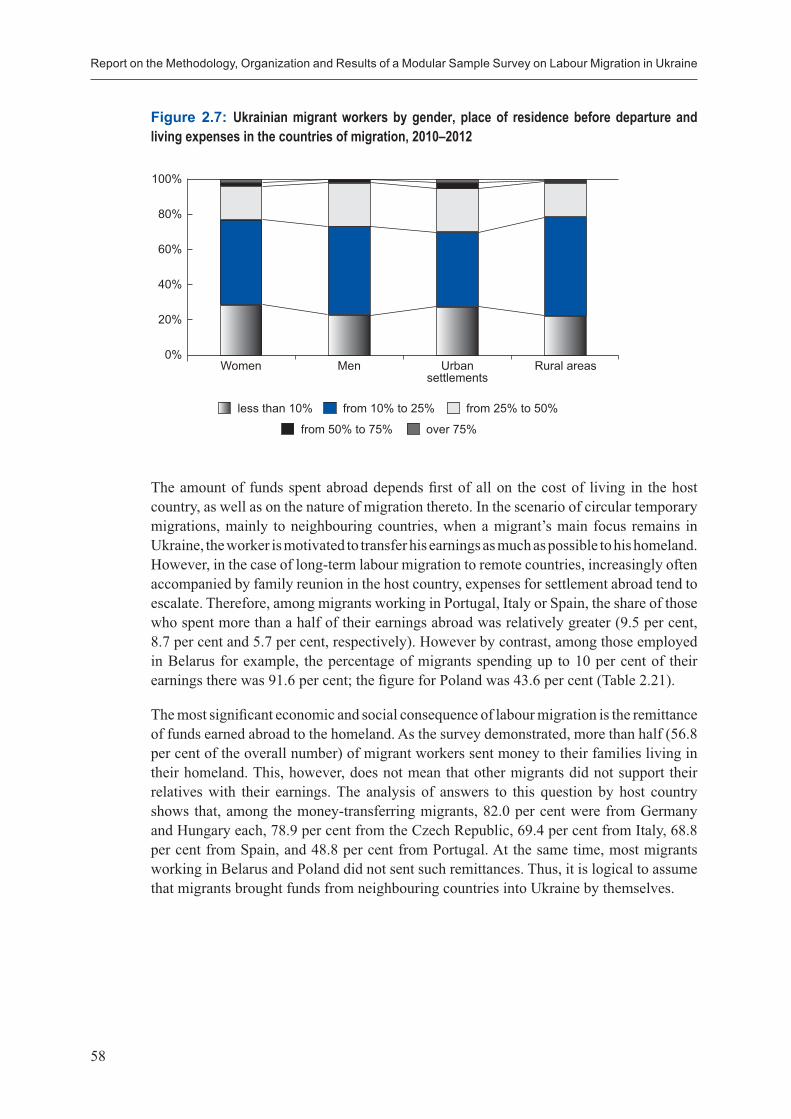
Report on the Methodology, Organization and Results of a Modular Sample Survey on Labour Migration in Ukraine
58
Figure 2.7: Ukrainian migrant workers by gender, place of residence before departure and living expenses in the countries of migration, 2010–2012
100%
80%
60%
40%
20%
0%
less than 10% from 10% to 25% from 25% to 50%
Women Men Urban settlements
Rural areas
from 50% to 75% over 75%
The amount of funds spent abroad depends first of all on the cost of living in the host country, as well as on the nature of migration thereto. In the scenario of circular temporary migrations, mainly to neighbouring countries, when a migrant’s main focus remains in Ukraine, the worker is motivated to transfer his earnings as much as possible to his homeland. However, in the case of long-term labour migration to remote countries, increasingly often accompanied by family reunion in the host country, expenses for settlement abroad tend to escalate. Therefore, among migrants working in Portugal, Italy or Spain, the share of those who spent more than a half of their earnings abroad was relatively greater (9.5 per cent, 8.7 per cent and 5.7 per cent, respectively). However by contrast, among those employed in Belarus for example, the percentage of migrants spending up to 10 per cent of their earnings there was 91.6 per cent; the figure for Poland was 43.6 per cent (Table 2.21).
The most significant economic and social consequence of labour migration is the remittance of funds earned abroad to the homeland. As the survey demonstrated, more than half (56.8 per cent of the overall number) of migrant workers sent money to their families living in their homeland. This, however, does not mean that other migrants did not support their relatives with their earnings. The analysis of answers to this question by host country shows that, among the money-transferring migrants, 82.0 per cent were from Germany and Hungary each, 78.9 per cent from the Czech Republic, 69.4 per cent from Italy, 68.8 per cent from Spain, and 48.8 per cent from Portugal. At the same time, most migrants working in Belarus and Poland did not sent such remittances. Thus, it is logical to assume that migrants brought funds from neighbouring countries into Ukraine by themselves.
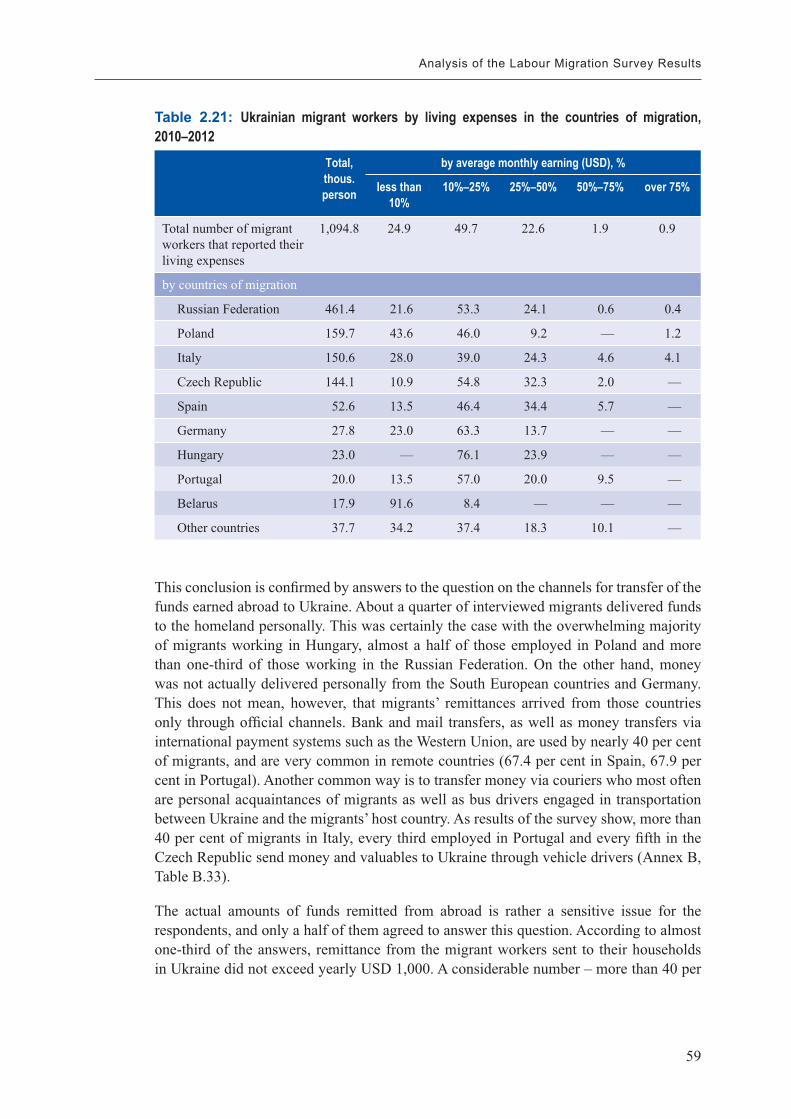
59
Analysis of the Labour Migration Survey Results
Table 2.21: Ukrainian migrant workers by living expenses in the countries of migration, 2010–2012
Total, thous. person
by average monthly earning (USD), %
less than 10%
10%–25% 25%–50% 50%–75% over 75%
Total number of migrant workers that reported their living expenses
1,094.8 24.9 49.7 22.6 1.9 0.9
by countries of migration
Russian Federation 461.4 21.6 53.3 24.1 0.6 0.4
Poland 159.7 43.6 46.0 9.2 — 1.2
Italy 150.6 28.0 39.0 24.3 4.6 4.1
Czech Republic 144.1 10.9 54.8 32.3 2.0 —
Spain 52.6 13.5 46.4 34.4 5.7 —
Germany 27.8 23.0 63.3 13.7 — —
Hungary 23.0 — 76.1 23.9 — —
Portugal 20.0 13.5 57.0 20.0 9.5 —
Belarus 17.9 91.6 8.4 — — —
Other countries 37.7 34.2 37.4 18.3 10.1 —
This conclusion is confirmed by answers to the question on the channels for transfer of the funds earned abroad to Ukraine. About a quarter of interviewed migrants delivered funds to the homeland personally. This was certainly the case with the overwhelming majority of migrants working in Hungary, almost a half of those employed in Poland and more than one-third of those working in the Russian Federation. On the other hand, money was not actually delivered personally from the South European countries and Germany. This does not mean, however, that migrants’ remittances arrived from those countries only through official channels. Bank and mail transfers, as well as money transfers via international payment systems such as the Western Union, are used by nearly 40 per cent of migrants, and are very common in remote countries (67.4 per cent in Spain, 67.9 per cent in Portugal). Another common way is to transfer money via couriers who most often are personal acquaintances of migrants as well as bus drivers engaged in transportation between Ukraine and the migrants’ host country. As results of the survey show, more than 40 per cent of migrants in Italy, every third employed in Portugal and every fifth in the Czech Republic send money and valuables to Ukraine through vehicle drivers (Annex B, Table B.33).
The actual amounts of funds remitted from abroad is rather a sensitive issue for the respondents, and only a half of them agreed to answer this question. According to almost one-third of the answers, remittance from the migrant workers sent to their households in Ukraine did not exceed yearly USD 1,000. A considerable number – more than 40 per
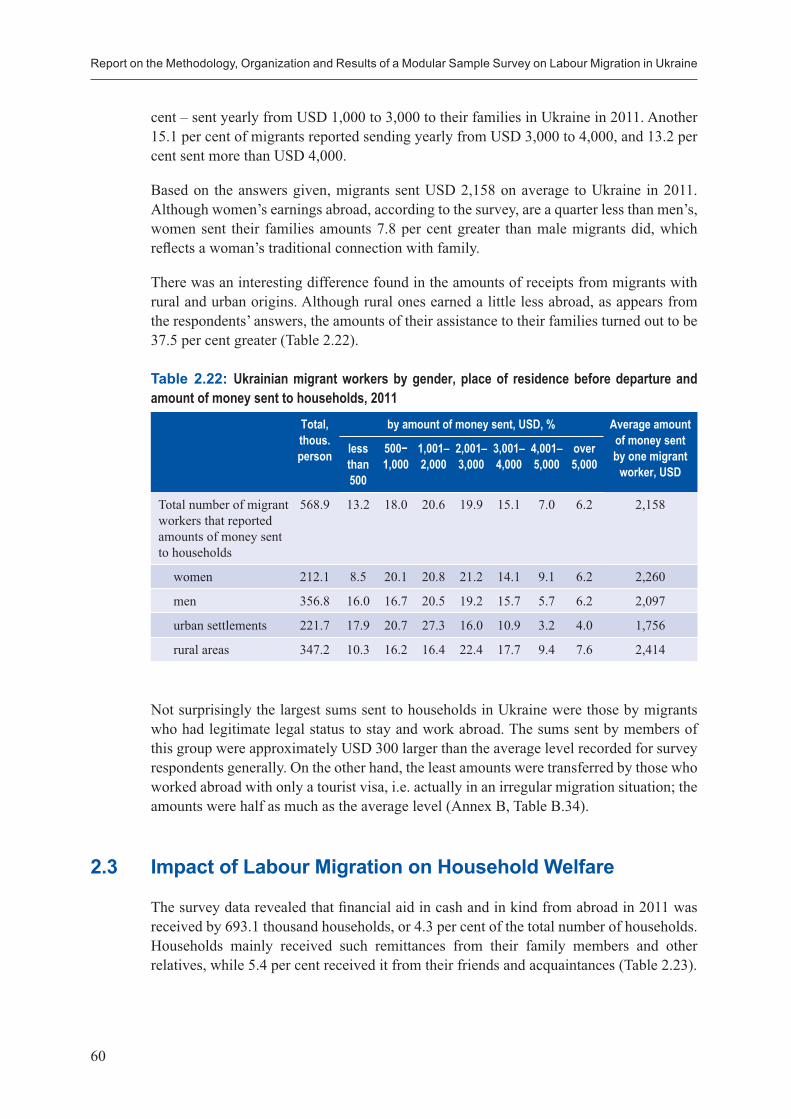
Report on the Methodology, Organization and Results of a Modular Sample Survey on Labour Migration in Ukraine
60
cent – sent yearly from USD 1,000 to 3,000 to their families in Ukraine in 2011. Another 15.1 per cent of migrants reported sending yearly from USD 3,000 to 4,000, and 13.2 per cent sent more than USD 4,000.
Based on the answers given, migrants sent USD 2,158 on average to Ukraine in 2011. Although women’s earnings abroad, according to the survey, are a quarter less than men’s, women sent their families amounts 7.8 per cent greater than male migrants did, which reflects a woman’s traditional connection with family.
There was an interesting difference found in the amounts of receipts from migrants with rural and urban origins. Although rural ones earned a little less abroad, as appears from the respondents’ answers, the amounts of their assistance to their families turned out to be 37.5 per cent greater (Table 2.22).
Table 2.22: Ukrainian migrant workers by gender, place of residence before departure and amount of money sent to households, 2011
Total, thous. person
by amount of money sent, USD, % Average amount of money sent by one migrant
worker, USD
less than 500
500−1,000
1,001–2,000
2,001–3,000
3,001–4,000
4,001–5,000
over 5,000
Total number of migrant workers that reported amounts of money sent to households
568.9 13.2 18.0 20.6 19.9 15.1 7.0 6.2 2,158
women 212.1 8.5 20.1 20.8 21.2 14.1 9.1 6.2 2,260
men 356.8 16.0 16.7 20.5 19.2 15.7 5.7 6.2 2,097
urban settlements 221.7 17.9 20.7 27.3 16.0 10.9 3.2 4.0 1,756
rural areas 347.2 10.3 16.2 16.4 22.4 17.7 9.4 7.6 2,414
Not surprisingly the largest sums sent to households in Ukraine were those by migrants who had legitimate legal status to stay and work abroad. The sums sent by members of this group were approximately USD 300 larger than the average level recorded for survey respondents generally. On the other hand, the least amounts were transferred by those who worked abroad with only a tourist visa, i.e. actually in an irregular migration situation; the amounts were half as much as the average level (Annex B, Table B.34).
2.3 Impact of Labour Migration on Household Welfare
The survey data revealed that financial aid in cash and in kind from abroad in 2011 was received by 693.1 thousand households, or 4.3 per cent of the total number of households. Households mainly received such remittances from their family members and other relatives, while 5.4 per cent received it from their friends and acquaintances (Table 2.23).
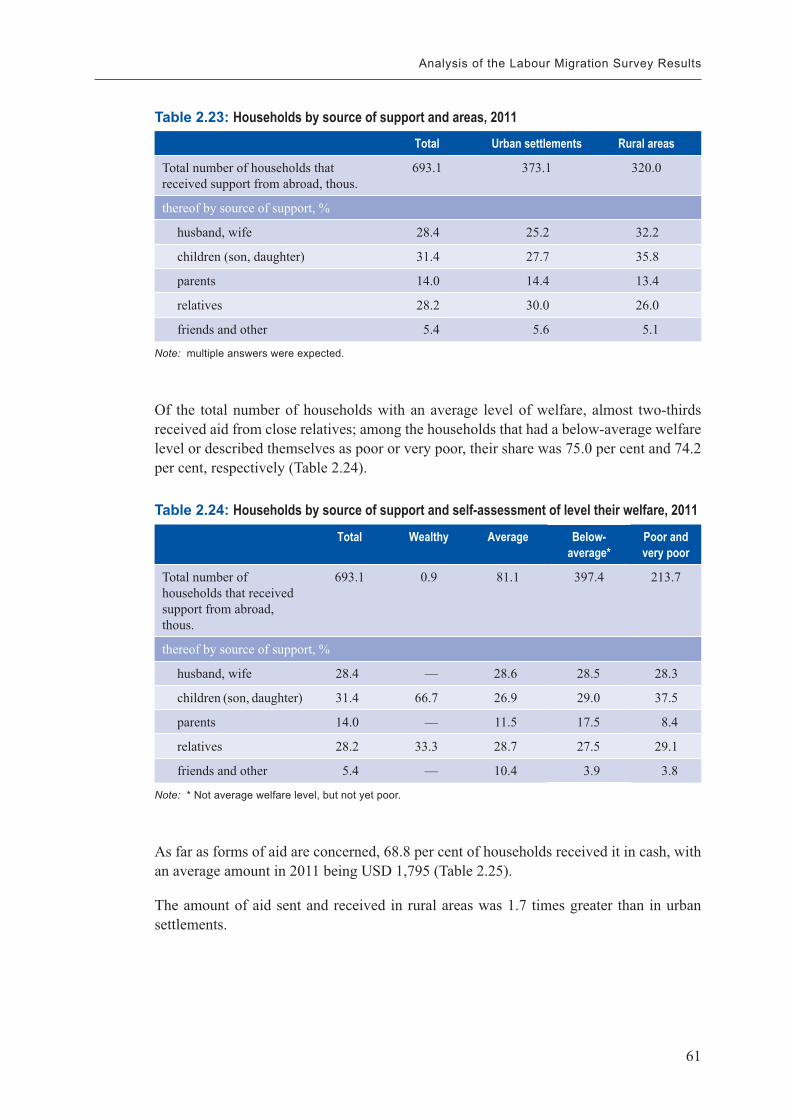
61
Analysis of the Labour Migration Survey Results
Table 2.23: Households by source of support and areas, 2011Total Urban settlements Rural areas
Total number of households that received support from abroad, thous.
693.1 373.1 320.0
thereof by source of support, %
husband, wife 28.4 25.2 32.2
children (son, daughter) 31.4 27.7 35.8
parents 14.0 14.4 13.4
relatives 28.2 30.0 26.0
friends and other 5.4 5.6 5.1
Note: multiple answers were expected.
Of the total number of households with an average level of welfare, almost two-thirds received aid from close relatives; among the households that had a below-average welfare level or described themselves as poor or very poor, their share was 75.0 per cent and 74.2 per cent, respectively (Table 2.24).
Table 2.24: Households by source of support and self-assessment of level their welfare, 2011
Total Wealthy Average Below-average*
Poor and very poor
Total number of households that received support from abroad, thous.
693.1 0.9 81.1 397.4 213.7
thereof by source of support, %
husband, wife 28.4 — 28.6 28.5 28.3
children (son, daughter) 31.4 66.7 26.9 29.0 37.5
parents 14.0 — 11.5 17.5 8.4
relatives 28.2 33.3 28.7 27.5 29.1
friends and other 5.4 — 10.4 3.9 3.8
Note: * Not average welfare level, but not yet poor.
As far as forms of aid are concerned, 68.8 per cent of households received it in cash, with an average amount in 2011 being USD 1,795 (Table 2.25).
The amount of aid sent and received in rural areas was 1.7 times greater than in urban settlements.
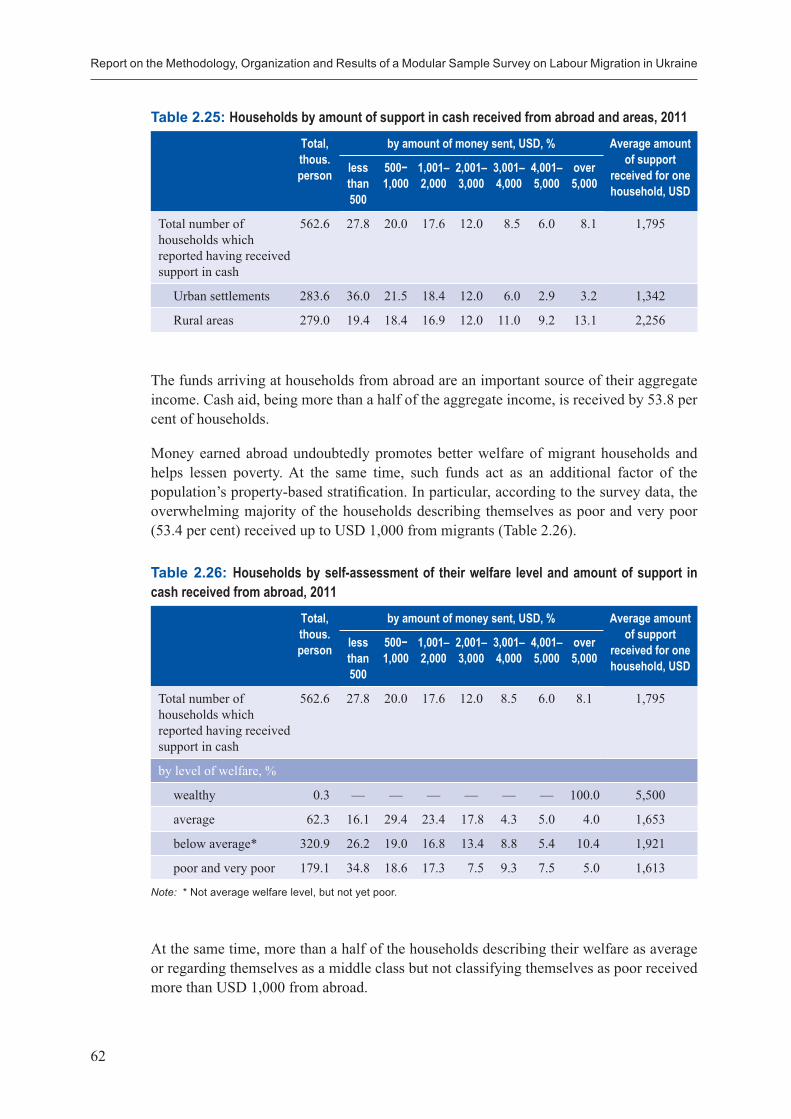
Report on the Methodology, Organization and Results of a Modular Sample Survey on Labour Migration in Ukraine
62
.
Table 2.25: Households by amount of support in cash received from abroad and areas, 2011 Total, thous. person
by amount of money sent, USD, % Average amount of support
received for one household, USD
less than 500
500−1,000
1,001–2,000
2,001–3,000
3,001–4,000
4,001–5,000
over 5,000
Total number of households which reported having received support in cash
562.6 27.8 20.0 17.6 12.0 8.5 6.0 8.1 1,795
Urban settlements 283.6 36.0 21.5 18.4 12.0 6.0 2.9 3.2 1,342
Rural areas 279.0 19.4 18.4 16.9 12.0 11.0 9.2 13.1 2,256
The funds arriving at households from abroad are an important source of their aggregate income. Cash aid, being more than a half of the aggregate income, is received by 53.8 per cent of households.
Money earned abroad undoubtedly promotes better welfare of migrant households and helps lessen poverty. At the same time, such funds act as an additional factor of the population’s property-based stratification. In particular, according to the survey data, the overwhelming majority of the households describing themselves as poor and very poor (53.4 per cent) received up to USD 1,000 from migrants (Table 2.26).
Table 2.26: Households by self-assessment of their welfare level and amount of support in cash received from abroad, 2011
Total, thous. person
by amount of money sent, USD, % Average amount of support
received for one household, USD
less than 500
500−1,000
1,001–2,000
2,001–3,000
3,001–4,000
4,001–5,000
over 5,000
Total number of households which reported having received support in cash
562.6 27.8 20.0 17.6 12.0 8.5 6.0 8.1 1,795
by level of welfare, %
wealthy 0.3 — — — — — — 100.0 5,500
average 62.3 16.1 29.4 23.4 17.8 4.3 5.0 4.0 1,653
below average* 320.9 26.2 19.0 16.8 13.4 8.8 5.4 10.4 1,921
poor and very poor 179.1 34.8 18.6 17.3 7.5 9.3 7.5 5.0 1,613
Note: * Not average welfare level, but not yet poor.
At the same time, more than a half of the households describing their welfare as average or regarding themselves as a middle class but not classifying themselves as poor received more than USD 1,000 from abroad.
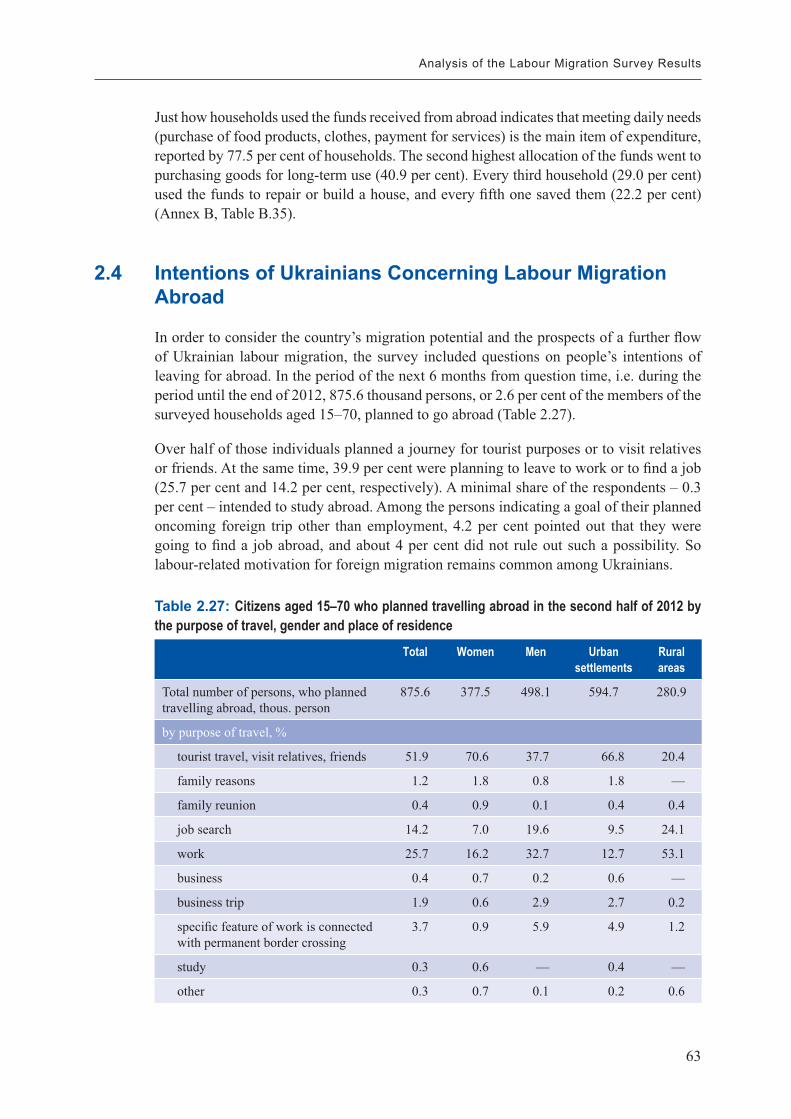
63
Analysis of the Labour Migration Survey Results
Just how households used the funds received from abroad indicates that meeting daily needs (purchase of food products, clothes, payment for services) is the main item of expenditure, reported by 77.5 per cent of households. The second highest allocation of the funds went to purchasing goods for long-term use (40.9 per cent). Every third household (29.0 per cent) used the funds to repair or build a house, and every fifth one saved them (22.2 per cent) (Annex B, Table B.35).
2.4 Intentions of Ukrainians Concerning Labour Migration Abroad
In order to consider the country’s migration potential and the prospects of a further flow of Ukrainian labour migration, the survey included questions on people’s intentions of leaving for abroad. In the period of the next 6 months from question time, i.e. during the period until the end of 2012, 875.6 thousand persons, or 2.6 per cent of the members of the surveyed households aged 15–70, planned to go abroad (Table 2.27).
Over half of those individuals planned a journey for tourist purposes or to visit relatives or friends. At the same time, 39.9 per cent were planning to leave to work or to find a job (25.7 per cent and 14.2 per cent, respectively). A minimal share of the respondents – 0.3 per cent – intended to study abroad. Among the persons indicating a goal of their planned oncoming foreign trip other than employment, 4.2 per cent pointed out that they were going to find a job abroad, and about 4 per cent did not rule out such a possibility. So labour-related motivation for foreign migration remains common among Ukrainians.
Table 2.27: Сitizens aged 15–70 who planned travelling abroad in the second half of 2012 by the purpose of travel, gender and place of residence
Total Women Men Urban settlements
Rural areas
Total number of persons, who planned travelling abroad, thous. person
875.6 377.5 498.1 594.7 280.9
by purpose of travel, %
tourist travel, visit relatives, friends 51.9 70.6 37.7 66.8 20.4
family reasons 1.2 1.8 0.8 1.8 —
family reunion 0.4 0.9 0.1 0.4 0.4
job search 14.2 7.0 19.6 9.5 24.1
work 25.7 16.2 32.7 12.7 53.1
business 0.4 0.7 0.2 0.6 —
business trip 1.9 0.6 2.9 2.7 0.2
specific feature of work is connected with permanent border crossing
3.7 0.9 5.9 4.9 1.2
study 0.3 0.6 — 0.4 —
other 0.3 0.7 0.1 0.2 0.6
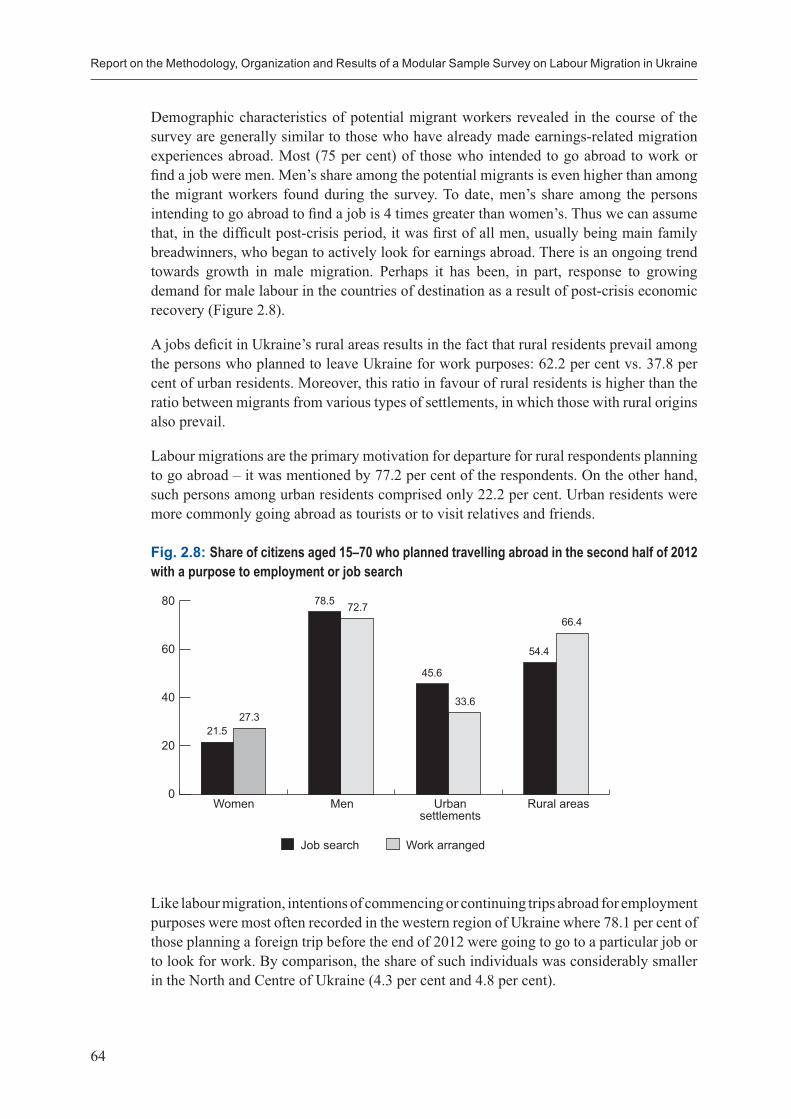
Report on the Methodology, Organization and Results of a Modular Sample Survey on Labour Migration in Ukraine
64
Demographic characteristics of potential migrant workers revealed in the course of the survey are generally similar to those who have already made earnings-related migration experiences abroad. Most (75 per cent) of those who intended to go abroad to work or find a job were men. Men’s share among the potential migrants is even higher than among the migrant workers found during the survey. To date, men’s share among the persons intending to go abroad to find a job is 4 times greater than women’s. Thus we can assume that, in the difficult post-crisis period, it was first of all men, usually being main family breadwinners, who began to actively look for earnings abroad. There is an ongoing trend towards growth in male migration. Perhaps it has been, in part, response to growing demand for male labour in the countries of destination as a result of post-crisis economic recovery (Figure 2.8).
A jobs deficit in Ukraine’s rural areas results in the fact that rural residents prevail among the persons who planned to leave Ukraine for work purposes: 62.2 per cent vs. 37.8 per cent of urban residents. Moreover, this ratio in favour of rural residents is higher than the ratio between migrants from various types of settlements, in which those with rural origins also prevail.
Labour migrations are the primary motivation for departure for rural respondents planning to go abroad – it was mentioned by 77.2 per cent of the respondents. On the other hand, such persons among urban residents comprised only 22.2 per cent. Urban residents were more commonly going abroad as tourists or to visit relatives and friends.
Fig. 2.8: Share of citizens aged 15–70 who planned travelling abroad in the second half of 2012 with a purpose to employment or job search
80
60
40
20
0
Job search Work arranged
Women Men Urban settlements
Rural areas
21.527.3
78.5 72.7
45.6
33.6
54.4
66.4
Like labour migration, intentions of commencing or continuing trips abroad for employment purposes were most often recorded in the western region of Ukraine where 78.1 per cent of those planning a foreign trip before the end of 2012 were going to go to a particular job or to look for work. By comparison, the share of such individuals was considerably smaller in the North and Centre of Ukraine (4.3 per cent and 4.8 per cent).
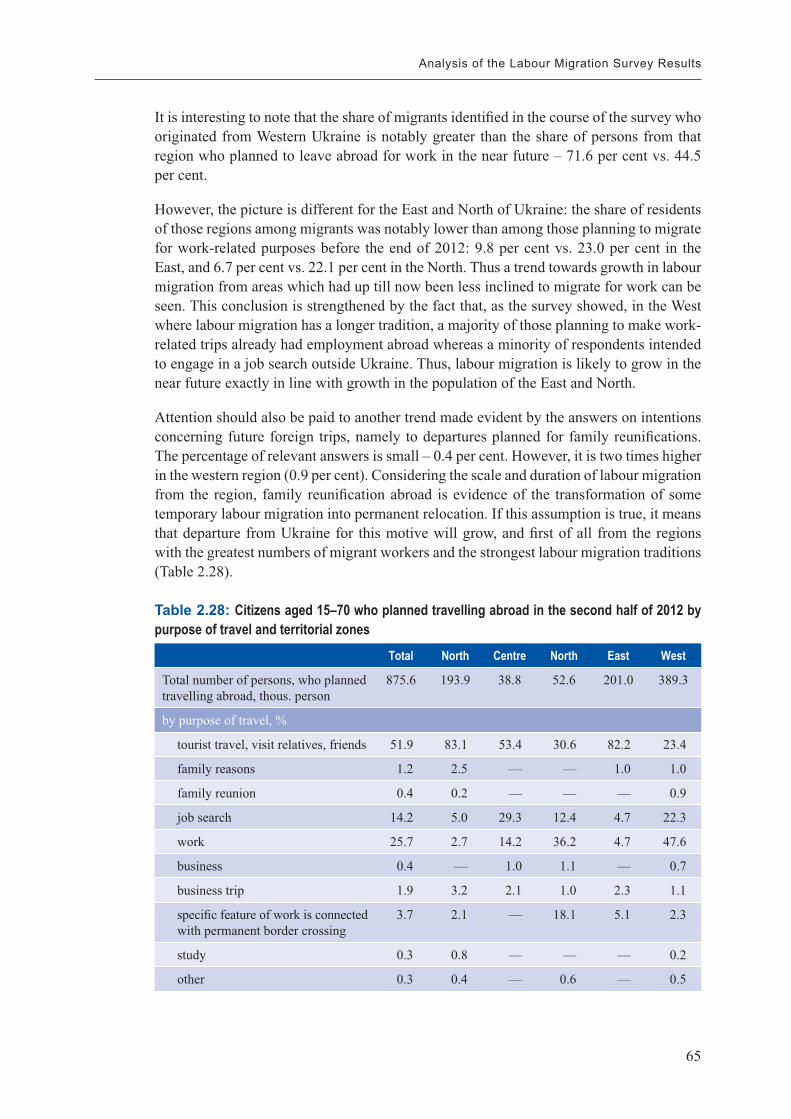
65
Analysis of the Labour Migration Survey Results
It is interesting to note that the share of migrants identified in the course of the survey who originated from Western Ukraine is notably greater than the share of persons from that region who planned to leave abroad for work in the near future – 71.6 per cent vs. 44.5 per cent.
However, the picture is different for the East and North of Ukraine: the share of residents of those regions among migrants was notably lower than among those planning to migrate for work-related purposes before the end of 2012: 9.8 per cent vs. 23.0 per cent in the East, and 6.7 per cent vs. 22.1 per cent in the North. Thus a trend towards growth in labour migration from areas which had up till now been less inclined to migrate for work can be seen. This conclusion is strengthened by the fact that, as the survey showed, in the West where labour migration has a longer tradition, a majority of those planning to make work-related trips already had employment abroad whereas a minority of respondents intended to engage in a job search outside Ukraine. Thus, labour migration is likely to grow in the near future exactly in line with growth in the population of the East and North.
Attention should also be paid to another trend made evident by the answers on intentions concerning future foreign trips, namely to departures planned for family reunifications. The percentage of relevant answers is small – 0.4 per cent. However, it is two times higher in the western region (0.9 per cent). Considering the scale and duration of labour migration from the region, family reunification abroad is evidence of the transformation of some temporary labour migration into permanent relocation. If this assumption is true, it means that departure from Ukraine for this motive will grow, and first of all from the regions with the greatest numbers of migrant workers and the strongest labour migration traditions (Table 2.28).
Table 2.28: Citizens aged 15–70 who planned travelling abroad in the second half of 2012 by purpose of travel and territorial zones
Total North Centre North East West
Total number of persons, who planned travelling abroad, thous. person
875.6 193.9 38.8 52.6 201.0 389.3
by purpose of travel, %
tourist travel, visit relatives, friends 51.9 83.1 53.4 30.6 82.2 23.4
family reasons 1.2 2.5 — — 1.0 1.0
family reunion 0.4 0.2 — — — 0.9
job search 14.2 5.0 29.3 12.4 4.7 22.3
work 25.7 2.7 14.2 36.2 4.7 47.6
business 0.4 — 1.0 1.1 — 0.7
business trip 1.9 3.2 2.1 1.0 2.3 1.1
specific feature of work is connected with permanent border crossing
3.7 2.1 — 18.1 5.1 2.3
study 0.3 0.8 — — — 0.2
other 0.3 0.4 — 0.6 — 0.5
Report on the Methodology, Organization and Results of a Modular Sample Survey on Labour Migration in Ukraine
66
.
In terms of age groups, potential migrants were distributed more or less evenly. It should be noted, however, that over a third (39.6 per cent) of those planning to find a job abroad consists of young persons up to 29 years of age. Meanwhile, persons in this age category make up one-fourth among the confirmed migrants. The share of persons aged 40–59 planning to leave to work was almost the same (38.1 per cent).
Migrants planning to go abroad for employment before the end of 2012 indicated good command of the language of the destination country. Only 5.1 per cent of them reported not having any language competencies; a majority, however, understood the language of the country they were going to work in (7.6 per cent), could communicate in it (59.8 per cent) and even were fluent (27.5 per cent).
Language competence, like orientation on foreign work-related trips, is to some degree a result of a legacy or history of labour migration from Ukraine to the said countries, and of the formation of migration networks connecting home and abroad. According to the survey data, one-third of potential migrant workers had no relative, acquaintance or connection abroad. Instead, the overwhelming majority of respondents (women relatively more than men, and urban residents relatively more than rural ones) reported having connections in the country of their future employment.
The preferred duration of anticipated foreign travel specified by the respondents indicates that they plan short-term trips and seasonal work: more than 60 per cent of them were going to stay outside Ukraine for the period between 1 and 6 months. Long-term trips for more than a year were only planned by every tenth respondent of those going abroad to work before the end of 2012. Moreover, 16.7 per cent of them were looking for employment in foreign countries, and two times less (7.4 per cent) already had work arrangements. Hence, two conclusions can be made. First of all, seasonal, temporary work abroad, often on a temporary, i.e. repeated basis, will remain the prevailing form of the Ukrainian population’s labour migration in the future. At the same time, the potential for longer migration is rather high, and with changes in the labour market of the destination countries and growing demand for foreign labour for permanent employment, departure from Ukraine for longer periods is likely to increase.
In estimating the likelihood of the respondents’ subsequent departures abroad to work, attention should be paid to what concrete measures to organize the trip they in actual fact have taken. In particular, as the survey showed, 4.0 per cent of the persons intending to go abroad to work or to find a job before the end of 2012 attended certain preparation courses; most of them attended language lessons (69.9 per cent).
As regards execution of documents, purchase of tickets, and so forth, such preparatory actions were more often taken by women than men, and more often by urban than rural residents. However, as the survey showed, more than a half of potential migrants had not yet made any preparation of the moment of the interviews, which means that labour migration remained as an idea rather than a reality to them (Table 2.29). The changing dynamics either in Ukraine or in the countries of destination may either discourage or encourage people’s departure abroad for work.
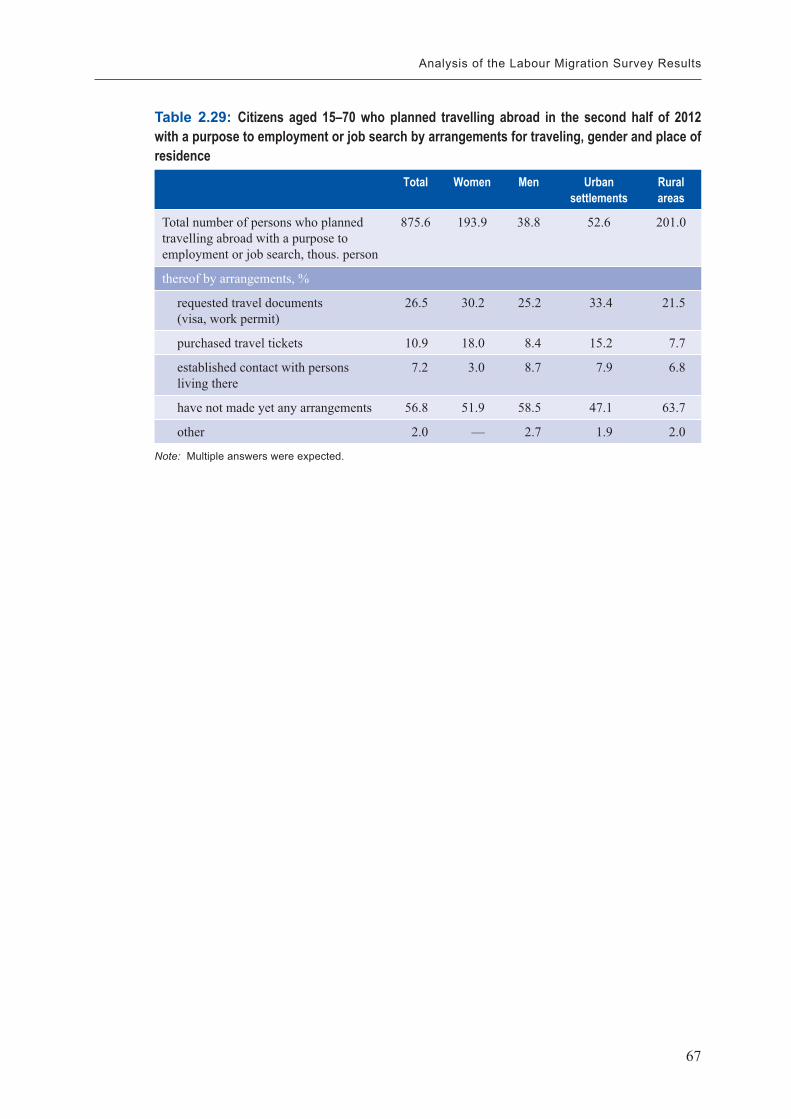
67
Analysis of the Labour Migration Survey Results
Table 2.29: Citizens aged 15–70 who planned travelling abroad in the second half of 2012 with a purpose to employment or job search by arrangements for traveling, gender and place of residence
Total Women Men Urban settlements
Rural areas
Total number of persons who planned travelling abroad with a purpose to employment or job search, thous. person
875.6 193.9 38.8 52.6 201.0
thereof by arrangements, %
requested travel documents (visa, work permit)
26.5 30.2 25.2 33.4 21.5
purchased travel tickets 10.9 18.0 8.4 15.2 7.7
established contact with persons living there
7.2 3.0 8.7 7.9 6.8
have not made yet any arrangements 56.8 51.9 58.5 47.1 63.7
other 2.0 — 2.7 1.9 2.0
Note: Multiple answers were expected.

69
Conclusions
The labour migration survey conducted by the State Statistics Service of Ukraine in cooperation with the M.V. Ptoukha Institute for Demography and Social Studies, NAS of Ukraine in April–June 2012 with ILO technical support and EU funds has been the second full-scale survey in Ukraine on this subject. Both were based on an area probability household sample, which allows for estimating the reliability of the results obtained.
The first survey on this subject was conducted in 2008 and covered the economically active population.
In the LMS 2012, migrant workers were defined as persons, who during the reference period (1 January 2010 to 17 June 2012) had worked or searched for a job abroad. They also include persons who within the reference period had a job abroad but had already returned to Ukraine and those who were working abroad during the survey.
Temporary migrant workers and those who had a job and receive a salary in Ukraine, but on business needs travel abroad, were excluded from the survey.
According to the survey results, 1.2 million, or 3.4 per cent of the Ukrainian population aged 15–70 were identified as migrant workers from January 2010 until June 2012. Among the working age population, the portion of migrant workers within the specified period comprised 4.1 per cent (as per the LMS survey conducted in 2008 in the period from the beginning of 2005 to 1 June, 2008 5.1 per cent of active working individuals worked abroad, and from the beginning of 2007 till 1 June 2008 – 4.4 per cent)
As in the previous survey, most migrant workers are men, and the rural population shows a higher level of participation in migrations. This is related to the rural residents’ limited opportunities of finding a job in rural areas.
Educational attainments of migrant workers aged 15–70 was lower than that of the employed population of the same age. Almost two-thirds of migrant workers have completed general secondary education.
Labour migration flows have distinct geographical trends: they mainly take place to neighbouring countries or conversely to more remote ones which beckon with more
Report on the Methodology, Organization and Results of a Modular Sample Survey on Labour Migration in Ukraine
70
attractive conditions of work. Generally, most labour migrations are to the CIS and EU countries. The main destinations for Ukrainian migrant workers include the Russian Federation, Poland, Italy, the Czech Republic, Germany, Hungary, Spain, Portugal and Belarus. According to the findings of 2008, three main countries of labour migrants destination are Russian Federation, Italy and Czech Republic.
Most labour migrations for Ukrainians are cyclical and seasonal. During a two and a half year period, each migrant surveyed made on average three trips to work abroad (previous survey provided for the same number of trips to work abroad from the beginning of 2005 to 1 June 2008).
The migrant workers going to Russia, Belarus, Poland, the Czech Republic and Hungary focus on periodic short trips with permanent return to Ukraine. However, those travelling to and working in Southern Europe and Germany usually remain there for a longer period of time.
Most Ukrainian migrant workers have regular status of stay and employment, formalized according to local legislative requirements of their destination countries. They obtain a residence and work permit, temporary registration, or a work permit. However, every fifth labour migrant surveyed had no official legal migration status and arrived in a country of destination on a tourist visa that provides no legal entitlement to a job/working permit. Compared with the LMS 2008, from the beginning of 2007 to 1 June 2008 every forth resident of Ukraine has worked abroad in an irregular situation.
According to the survey results, only slightly more than a third (38.0 per cent) of labour migrants entered into a written employment agreement with foreign employers. It occurred least often in Ukraine’s neighbouring countries of Russia and Poland. In the former, every fourth migrant (28.9 per cent) formalized his working arrangement with a written document, whereas the share of such persons in Poland was even less, only 11.7 per cent. Only in the Czech Republic, Belarus and Germany did more than a half of Ukrainian migrants (58.1 per cent, 56.9 per cent and 52.9 per cent, respectively) concluded written employment contracts.
In most cases a written employment agreement was concluded between labour migrants and employers in the language of the country of employment, and only in 25 per cent was it translated into Ukrainian. Migrant workers working in private households abroad (domestic work) are especially vulnerable to violation of their labour rights because of the specificity of national legislation application. This category of Ukrainian migrants (mainly women) formalizes their employment arrangements only rarely (in 16.5 per cent of cases) with a written document. There is wide disparity with regard to social insurance. According to the survey data, 4.5 per cent of the total number of migrant workers, paid contributions to the Pension Fund of Ukraine.
Male migrants are mainly engaged in construction whereas women work as domestic help or in agriculture. A considerable share of migrants worked as employees, and only every fourteenth was self-employed. Self-employment was especially widespread in Poland, the Czech Republic and Belarus.
71
Conclusions
In terms of occupational structure, migrants mainly fill less attractive jobs. More than a third of them are engaged in elementary occupations; skilled workers with tools comprise one-fourth; every sixth works in trade and services; and every tenth works as a professional, specialist, or technician. The rest work as skilled agricultural workers.
According to the survey findings, migrant workers earned USD 930 per month on average, which is almost three times higher than the average monthly wage of staff workers employed in the Ukrainian economy (according to the 2008 year survey the average monthly wage amounted to USD 817). Men’s earnings were higher than women’s: USD 996 and 813, respectively. Urban residents earned a little more than rural ones (USD 951 and 914, respectively), perhaps due to the former’s higher educational attainments and skills. Migrants employed in households had relatively lower earnings (USD 819 per month). The lowest average monthly income was received by self-employed migrants (USD 637). As regards economic activity types, the lowest earnings were received by those working in trade – USD 530 per month. The highest earnings abroad were received by migrants who have secured legal status, i.e. residence and work permits.
Most funds earned by migrants arrive in Ukraine through informal channels: they are sent through acquaintances or vehicle drivers or delivered personally. Migrants’ earnings are of great importance to the well-being of their households. Based on the survey results, migrants sent USD 2,158 on average to Ukraine in 2011. Although women’s earnings abroad, according to the survey, are a quarter less than men’s, women sent their families amounts 7.8 per cent greater than male migrants did, which reflects a woman’s traditional connection with family.
The labour migration phenomenon has been occurring in Ukraine for more than a decade. As global experience shows, the longer the duration of work-related trips and the more often they take place, the higher the probability of the migrant’s permanent settlement in the recipient country. Therefore, a differentiated approach to regulation of labour migrations is necessary. Persons returning to Ukraine should be assisted in adapting back to Ukrainian society and in job placement. To pledge efficient implementation of migration policy requires concerted actions of the State, non-governmental migrant organizations, trade unions, employers’ organizations, employment agencies, banking institutions of Ukraine and civil society as a whole.
The labour migration survey within the EU–ILO Effective Governance of Labour Migration and Its Skill Dimensions Project framework helped improve the methodology and implementation of household surveys on labour migration in order to mainstream them into statistical practice on a periodic basis. Its results present a reliable analytical base on which to take informed decisions on the regulation of labour migration, social and legal protection of the Ukrainian nationals working abroad, improvement of reintegration of returning migrants and more efficient use of Ukraine’s labour potential.

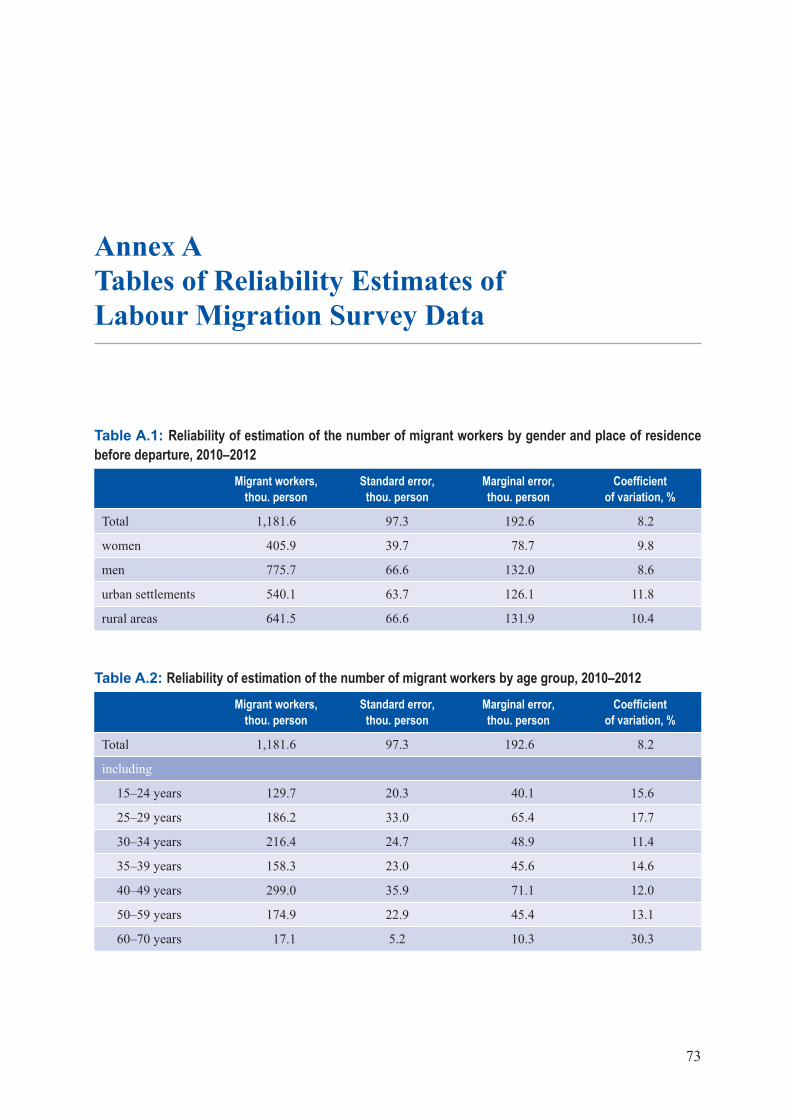
73
Annex ATables of Reliability Estimates of Labour Migration Survey Data
Table A.1: Reliability of estimation of the number of migrant workers by gender and place of residence before departure, 2010–2012
Migrant workers, thou. person
Standard error, thou. person
Marginal error, thou. person
Coefficient of variation, %
Total 1,181.6 97.3 192.6 8.2
women 405.9 39.7 78.7 9.8
men 775.7 66.6 132.0 8.6
urban settlements 540.1 63.7 126.1 11.8
rural areas 641.5 66.6 131.9 10.4
Table A.2: Reliability of estimation of the number of migrant workers by age group, 2010–2012 Migrant workers,
thou. personStandard error,
thou. personMarginal error, thou. person
Coefficient of variation, %
Total 1,181.6 97.3 192.6 8.2
including
15–24 years 129.7 20.3 40.1 15.6
25–29 years 186.2 33.0 65.4 17.7
30–34 years 216.4 24.7 48.9 11.4
35–39 years 158.3 23.0 45.6 14.6
40–49 years 299.0 35.9 71.1 12.0
50–59 years 174.9 22.9 45.4 13.1
60–70 years 17.1 5.2 10.3 30.3
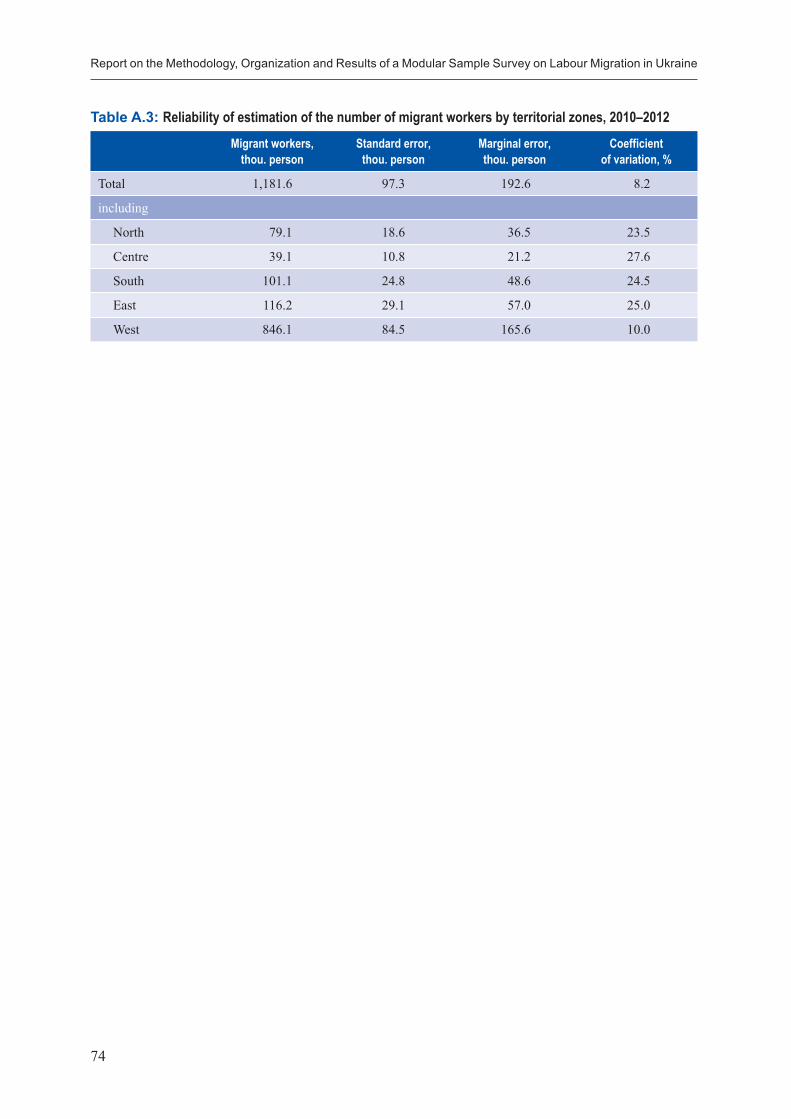
Report on the Methodology, Organization and Results of a Modular Sample Survey on Labour Migration in Ukraine
74
Table A.3: Reliability of estimation of the number of migrant workers by territorial zones, 2010–2012 Migrant workers,
thou. personStandard error,
thou. personMarginal error, thou. person
Coefficient of variation, %
Total 1,181.6 97.3 192.6 8.2
including
North 79.1 18.6 36.5 23.5
Centre 39.1 10.8 21.2 27.6
South 101.1 24.8 48.6 24.5
East 116.2 29.1 57.0 25.0
West 846.1 84.5 165.6 10.0
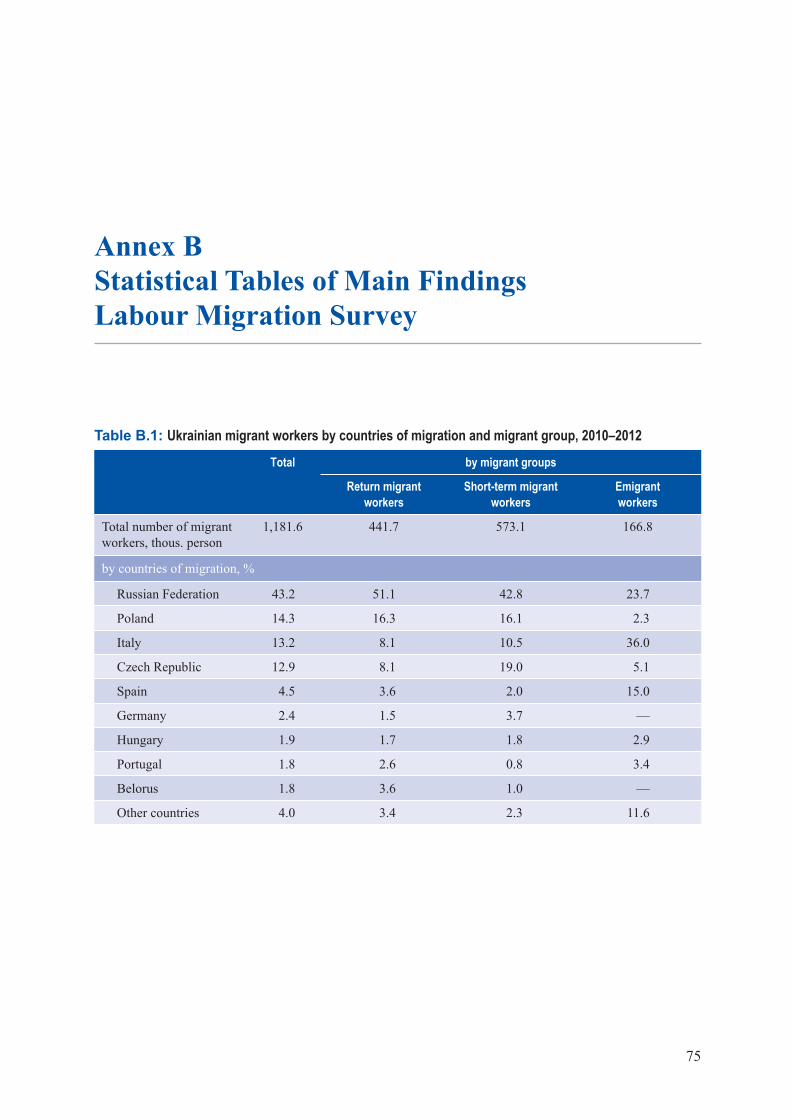
75
Annex BStatistical Tables of Main FindingsLabour Migration Survey
Table B.1: Ukrainian migrant workers by countries of migration and migrant group, 2010–2012
Total by migrant groups
Return migrant workers
Short-term migrant workers
Emigrant workers
Total number of migrant workers, thous. person
1,181.6 441.7 573.1 166.8
by countries of migration, %
Russian Federation 43.2 51.1 42.8 23.7
Poland 14.3 16.3 16.1 2.3
Italy 13.2 8.1 10.5 36.0
Czech Republic 12.9 8.1 19.0 5.1
Spain 4.5 3.6 2.0 15.0
Germany 2.4 1.5 3.7 —
Hungary 1.9 1.7 1.8 2.9
Portugal 1.8 2.6 0.8 3.4
Belorus 1.8 3.6 1.0 —
Other countries 4.0 3.4 2.3 11.6
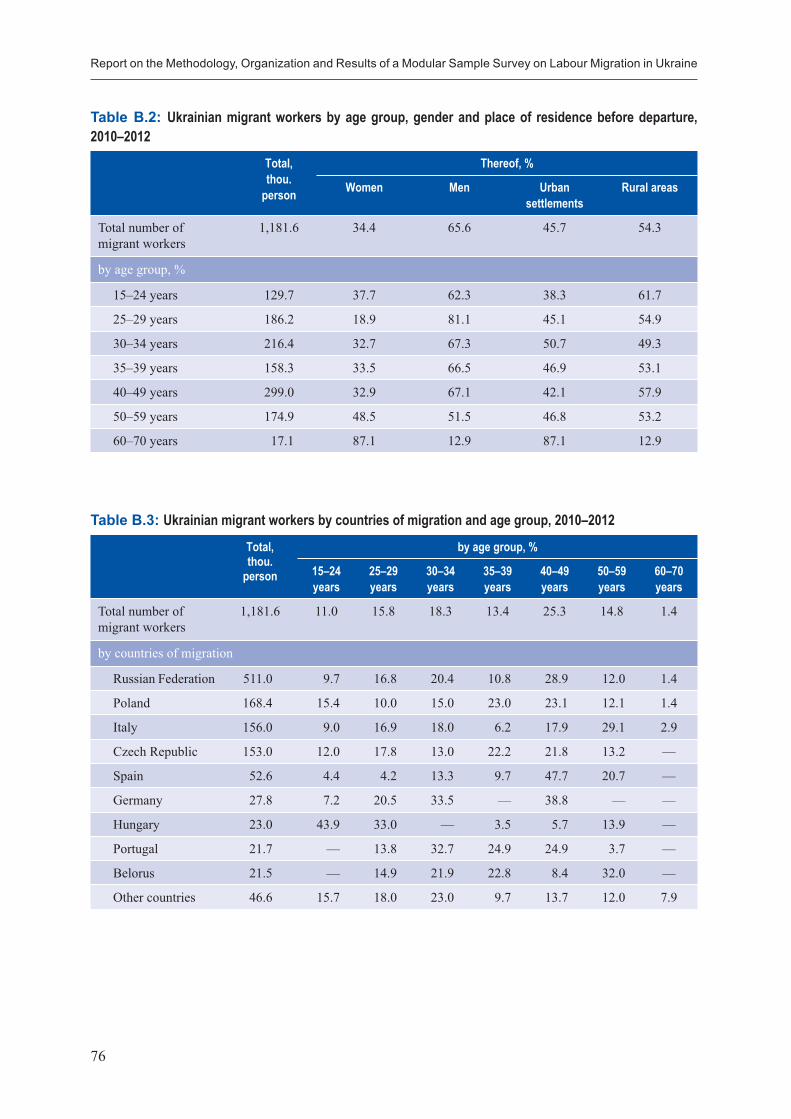
Report on the Methodology, Organization and Results of a Modular Sample Survey on Labour Migration in Ukraine
76
Table B.2: Ukrainian migrant workers by age group, gender and place of residence before departure, 2010–2012
Total, thou.
person
Thereof, %
Women Men Urban settlements
Rural areas
Total number of migrant workers
1,181.6 34.4 65.6 45.7 54.3
by age group, %
15–24 years 129.7 37.7 62.3 38.3 61.7
25–29 years 186.2 18.9 81.1 45.1 54.9
30–34 years 216.4 32.7 67.3 50.7 49.3
35–39 years 158.3 33.5 66.5 46.9 53.1
40–49 years 299.0 32.9 67.1 42.1 57.9
50–59 years 174.9 48.5 51.5 46.8 53.2
60–70 years 17.1 87.1 12.9 87.1 12.9
Table B.3: Ukrainian migrant workers by countries of migration and age group, 2010–2012
Total, thou.
person
by age group, %
15–24 years
25–29 years
30–34 years
35–39 years
40–49 years
50–59 years
60–70 years
Total number of migrant workers
1,181.6 11.0 15.8 18.3 13.4 25.3 14.8 1.4
by countries of migration
Russian Federation 511.0 9.7 16.8 20.4 10.8 28.9 12.0 1.4
Poland 168.4 15.4 10.0 15.0 23.0 23.1 12.1 1.4
Italy 156.0 9.0 16.9 18.0 6.2 17.9 29.1 2.9
Czech Republic 153.0 12.0 17.8 13.0 22.2 21.8 13.2 —
Spain 52.6 4.4 4.2 13.3 9.7 47.7 20.7 —
Germany 27.8 7.2 20.5 33.5 — 38.8 — —
Hungary 23.0 43.9 33.0 — 3.5 5.7 13.9 —
Portugal 21.7 — 13.8 32.7 24.9 24.9 3.7 —
Belorus 21.5 — 14.9 21.9 22.8 8.4 32.0 —
Other countries 46.6 15.7 18.0 23.0 9.7 13.7 12.0 7.9
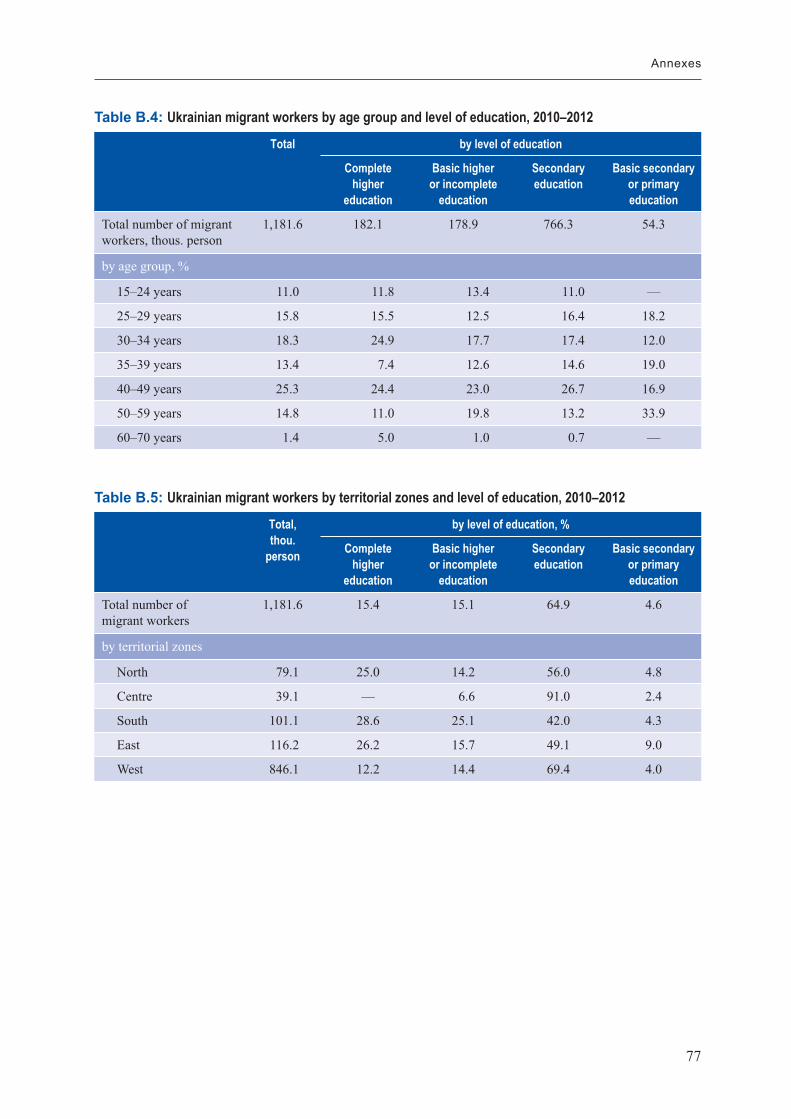
77
Annexes
Table B.4: Ukrainian migrant workers by age group and level of education, 2010–2012
Total by level of education
Complete higher
education
Basic higher or incomplete
education
Secondary education
Basic secondary or primary education
Total number of migrant workers, thous. person
1,181.6 182.1 178.9 766.3 54.3
by age group, %
15–24 years 11.0 11.8 13.4 11.0 —
25–29 years 15.8 15.5 12.5 16.4 18.2
30–34 years 18.3 24.9 17.7 17.4 12.0
35–39 years 13.4 7.4 12.6 14.6 19.0
40–49 years 25.3 24.4 23.0 26.7 16.9
50–59 years 14.8 11.0 19.8 13.2 33.9
60–70 years 1.4 5.0 1.0 0.7 —
Table B.5: Ukrainian migrant workers by territorial zones and level of education, 2010–2012
Total, thou.
person
by level of education, %
Complete higher
education
Basic higher or incomplete
education
Secondary education
Basic secondary or primary education
Total number of migrant workers
1,181.6 15.4 15.1 64.9 4.6
by territorial zones
North 79.1 25.0 14.2 56.0 4.8
Centre 39.1 — 6.6 91.0 2.4
South 101.1 28.6 25.1 42.0 4.3
East 116.2 26.2 15.7 49.1 9.0
West 846.1 12.2 14.4 69.4 4.0
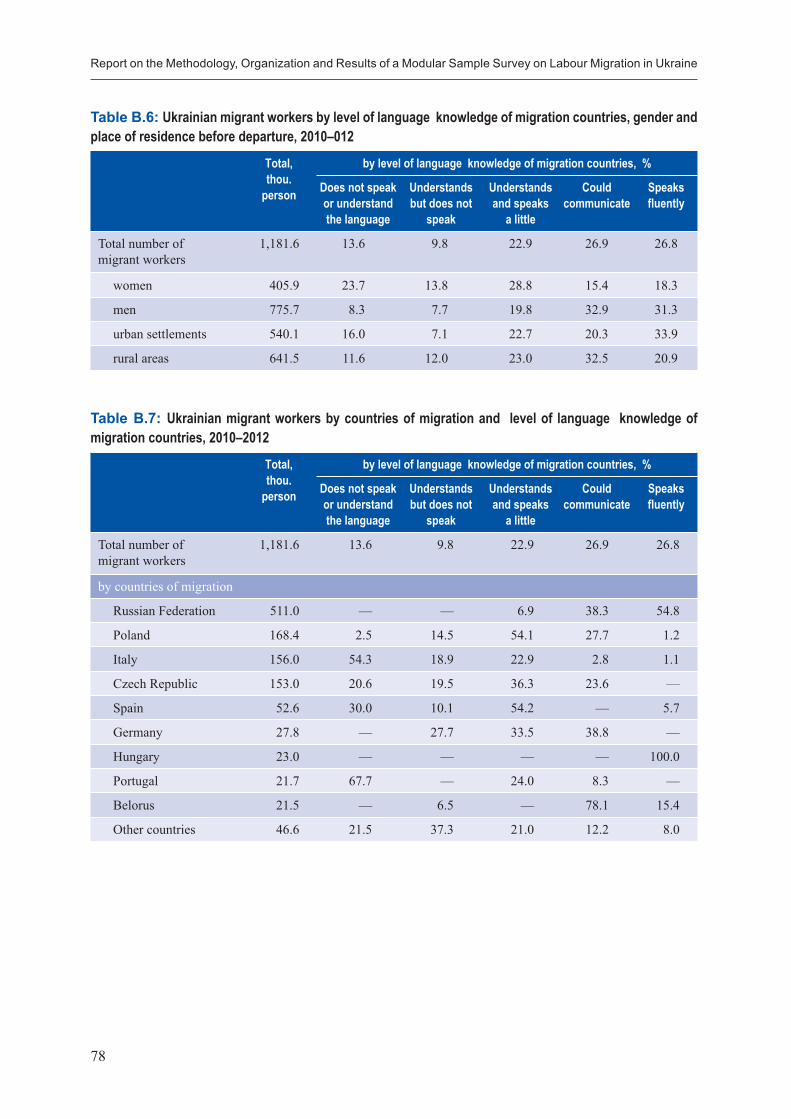
Report on the Methodology, Organization and Results of a Modular Sample Survey on Labour Migration in Ukraine
78
Table B.6: Ukrainian migrant workers by level of language knowledge of migration countries, gender and place of residence before departure, 2010–012
Total, thou.
person
by level of language knowledge of migration countries, %
Does not speak or understand the language
Understands but does not
speak
Understands and speaks
a little
Could communicate
Speaks fluently
Total number of migrant workers
1,181.6 13.6 9.8 22.9 26.9 26.8
women 405.9 23.7 13.8 28.8 15.4 18.3
men 775.7 8.3 7.7 19.8 32.9 31.3
urban settlements 540.1 16.0 7.1 22.7 20.3 33.9
rural areas 641.5 11.6 12.0 23.0 32.5 20.9
Table B.7: Ukrainian migrant workers by countries of migration and level of language knowledge of migration countries, 2010–2012
Total, thou.
person
by level of language knowledge of migration countries, %
Does not speak or understand the language
Understands but does not
speak
Understands and speaks
a little
Could communicate
Speaks fluently
Total number of migrant workers
1,181.6 13.6 9.8 22.9 26.9 26.8
by countries of migration
Russian Federation 511.0 — — 6.9 38.3 54.8
Poland 168.4 2.5 14.5 54.1 27.7 1.2
Italy 156.0 54.3 18.9 22.9 2.8 1.1
Czech Republic 153.0 20.6 19.5 36.3 23.6 —
Spain 52.6 30.0 10.1 54.2 — 5.7
Germany 27.8 — 27.7 33.5 38.8 —
Hungary 23.0 — — — — 100.0
Portugal 21.7 67.7 — 24.0 8.3 —
Belorus 21.5 — 6.5 — 78.1 15.4
Other countries 46.6 21.5 37.3 21.0 12.2 8.0
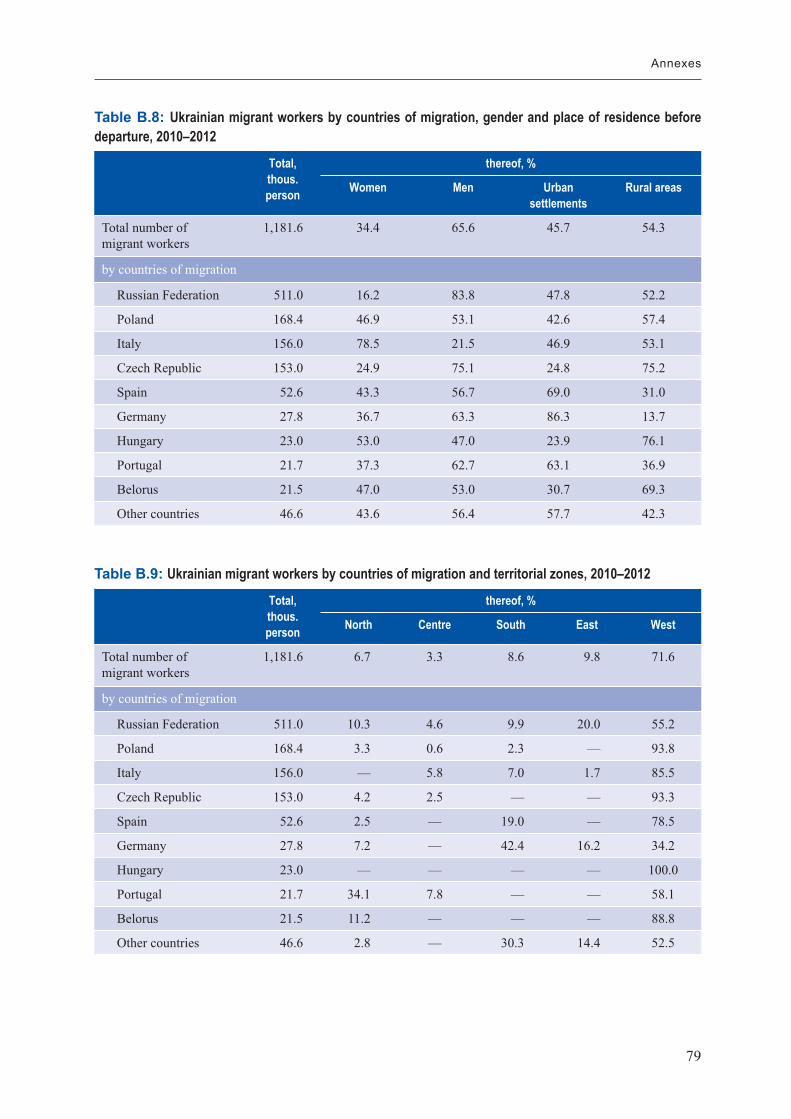
79
Annexes
Table B.8: Ukrainian migrant workers by countries of migration, gender and place of residence before departure, 2010–2012
Total, thous. person
thereof, %
Women Men Urban settlements
Rural areas
Total number of migrant workers
1,181.6 34.4 65.6 45.7 54.3
by countries of migration
Russian Federation 511.0 16.2 83.8 47.8 52.2
Poland 168.4 46.9 53.1 42.6 57.4
Italy 156.0 78.5 21.5 46.9 53.1
Czech Republic 153.0 24.9 75.1 24.8 75.2
Spain 52.6 43.3 56.7 69.0 31.0
Germany 27.8 36.7 63.3 86.3 13.7
Hungary 23.0 53.0 47.0 23.9 76.1
Portugal 21.7 37.3 62.7 63.1 36.9
Belorus 21.5 47.0 53.0 30.7 69.3
Other countries 46.6 43.6 56.4 57.7 42.3
Table B.9: Ukrainian migrant workers by countries of migration and territorial zones, 2010–2012
Total, thous. person
thereof, %
North Centre South East West
Total number of migrant workers
1,181.6 6.7 3.3 8.6 9.8 71.6
by countries of migration
Russian Federation 511.0 10.3 4.6 9.9 20.0 55.2
Poland 168.4 3.3 0.6 2.3 — 93.8
Italy 156.0 — 5.8 7.0 1.7 85.5
Czech Republic 153.0 4.2 2.5 — — 93.3
Spain 52.6 2.5 — 19.0 — 78.5
Germany 27.8 7.2 — 42.4 16.2 34.2
Hungary 23.0 — — — — 100.0
Portugal 21.7 34.1 7.8 — — 58.1
Belorus 21.5 11.2 — — — 88.8
Other countries 46.6 2.8 — 30.3 14.4 52.5
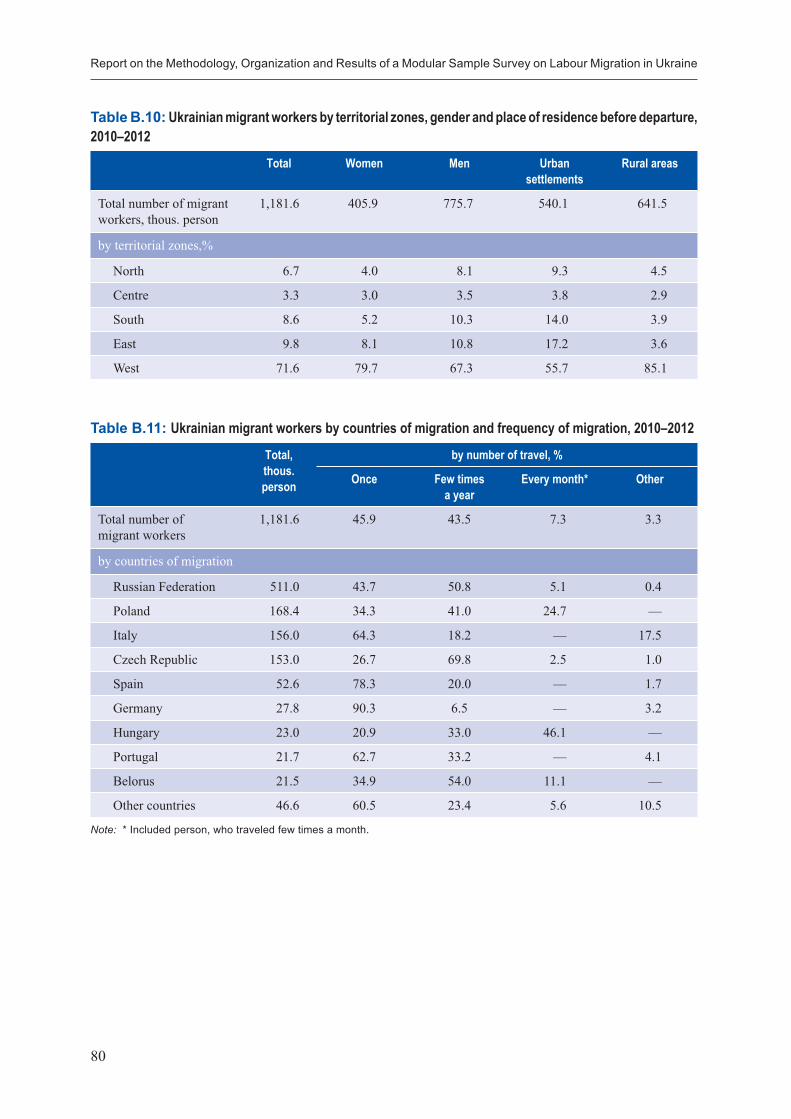
Report on the Methodology, Organization and Results of a Modular Sample Survey on Labour Migration in Ukraine
80
Table B.10: Ukrainian migrant workers by territorial zones, gender and place of residence before departure, 2010–2012
Total Women Men Urban settlements
Rural areas
Total number of migrant workers, thous. person
1,181.6 405.9 775.7 540.1 641.5
by territorial zones,%
North 6.7 4.0 8.1 9.3 4.5
Centre 3.3 3.0 3.5 3.8 2.9
South 8.6 5.2 10.3 14.0 3.9
East 9.8 8.1 10.8 17.2 3.6
West 71.6 79.7 67.3 55.7 85.1
Table B.11: Ukrainian migrant workers by countries of migration and frequency of migration, 2010–2012
Total, thous. person
by number of travel, %
Once Few times a year
Every month* Other
Total number of migrant workers
1,181.6 45.9 43.5 7.3 3.3
by countries of migration
Russian Federation 511.0 43.7 50.8 5.1 0.4
Poland 168.4 34.3 41.0 24.7 —
Italy 156.0 64.3 18.2 — 17.5
Czech Republic 153.0 26.7 69.8 2.5 1.0
Spain 52.6 78.3 20.0 — 1.7
Germany 27.8 90.3 6.5 — 3.2
Hungary 23.0 20.9 33.0 46.1 —
Portugal 21.7 62.7 33.2 — 4.1
Belorus 21.5 34.9 54.0 11.1 —
Other countries 46.6 60.5 23.4 5.6 10.5
Note: * Included person, who traveled few times a month.
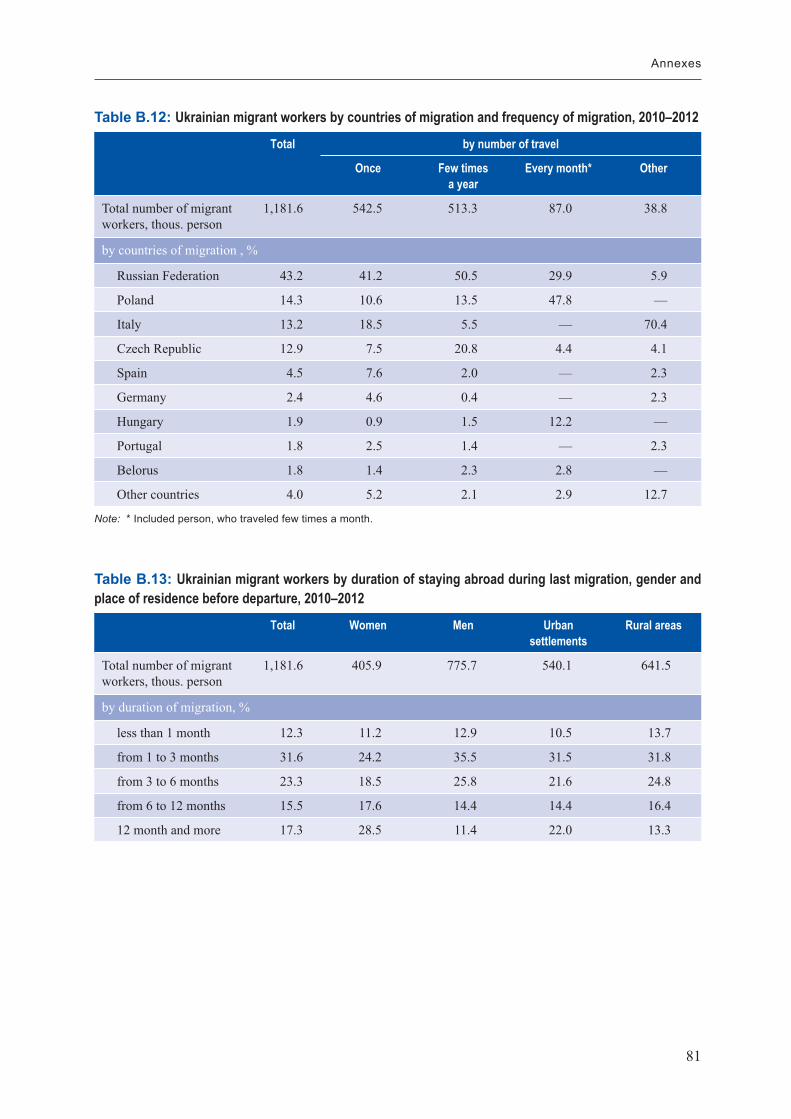
81
Annexes
Table B.12: Ukrainian migrant workers by countries of migration and frequency of migration, 2010–2012
Total by number of travel
Once Few times a year
Every month* Other
Total number of migrant workers, thous. person
1,181.6 542.5 513.3 87.0 38.8
by countries of migration , %
Russian Federation 43.2 41.2 50.5 29.9 5.9
Poland 14.3 10.6 13.5 47.8 —
Italy 13.2 18.5 5.5 — 70.4
Czech Republic 12.9 7.5 20.8 4.4 4.1
Spain 4.5 7.6 2.0 — 2.3
Germany 2.4 4.6 0.4 — 2.3
Hungary 1.9 0.9 1.5 12.2 —
Portugal 1.8 2.5 1.4 — 2.3
Belorus 1.8 1.4 2.3 2.8 —
Other countries 4.0 5.2 2.1 2.9 12.7
Note: * Included person, who traveled few times a month.
Table B.13: Ukrainian migrant workers by duration of staying abroad during last migration, gender and place of residence before departure, 2010–2012
Total Women Men Urban settlements
Rural areas
Total number of migrant workers, thous. person
1,181.6 405.9 775.7 540.1 641.5
by duration of migration, %
less than 1 month 12.3 11.2 12.9 10.5 13.7
from 1 to 3 months 31.6 24.2 35.5 31.5 31.8
from 3 to 6 months 23.3 18.5 25.8 21.6 24.8
from 6 to 12 months 15.5 17.6 14.4 14.4 16.4
12 month and more 17.3 28.5 11.4 22.0 13.3
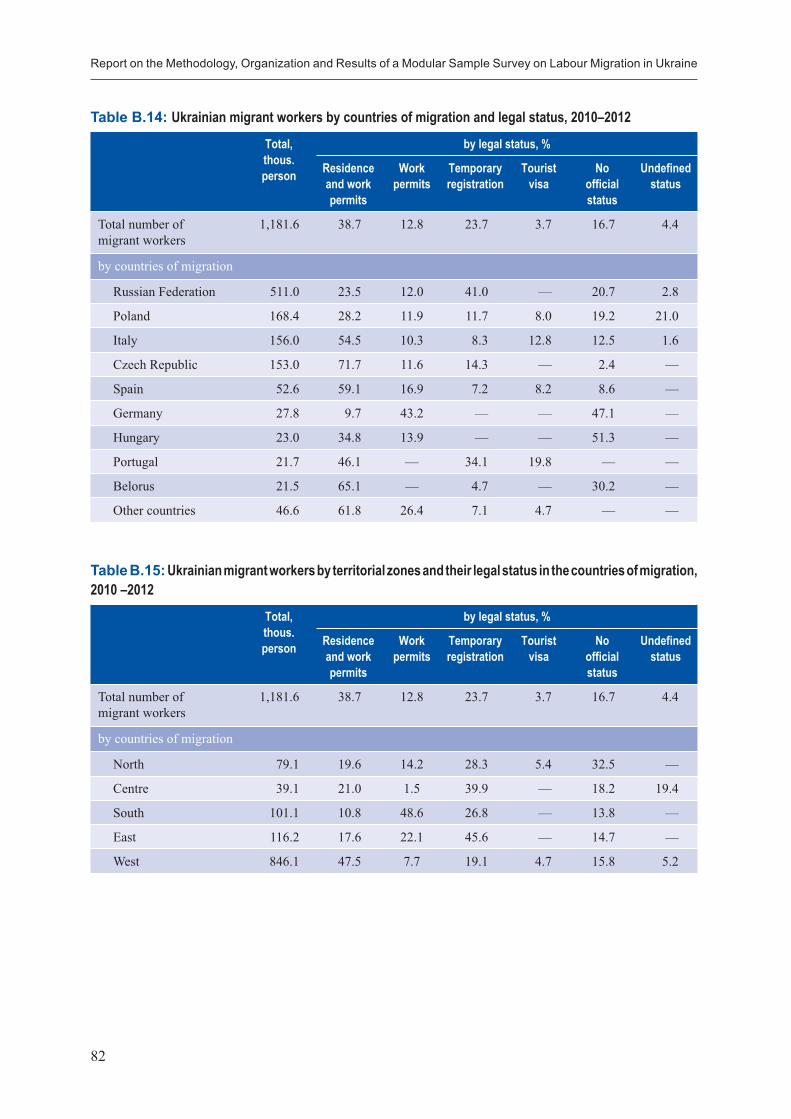
Report on the Methodology, Organization and Results of a Modular Sample Survey on Labour Migration in Ukraine
82
Table B.14: Ukrainian migrant workers by countries of migration and legal status, 2010–2012
Total, thous. person
by legal status, %
Residence and work permits
Work permits
Temporary registration
Tourist visa
No official status
Undefined status
Total number of migrant workers
1,181.6 38.7 12.8 23.7 3.7 16.7 4.4
by countries of migration
Russian Federation 511.0 23.5 12.0 41.0 — 20.7 2.8
Poland 168.4 28.2 11.9 11.7 8.0 19.2 21.0
Italy 156.0 54.5 10.3 8.3 12.8 12.5 1.6
Czech Republic 153.0 71.7 11.6 14.3 — 2.4 —
Spain 52.6 59.1 16.9 7.2 8.2 8.6 —
Germany 27.8 9.7 43.2 — — 47.1 —
Hungary 23.0 34.8 13.9 — — 51.3 —
Portugal 21.7 46.1 — 34.1 19.8 — —
Belorus 21.5 65.1 — 4.7 — 30.2 —
Other countries 46.6 61.8 26.4 7.1 4.7 — —
Table B.15: Ukrainian migrant workers by territorial zones and their legal status in the countries of migration, 2010 –2012
Total, thous. person
by legal status, %
Residence and work permits
Work permits
Temporary registration
Tourist visa
No official status
Undefined status
Total number of migrant workers
1,181.6 38.7 12.8 23.7 3.7 16.7 4.4
by countries of migration
North 79.1 19.6 14.2 28.3 5.4 32.5 —
Centre 39.1 21.0 1.5 39.9 — 18.2 19.4
South 101.1 10.8 48.6 26.8 — 13.8 —
East 116.2 17.6 22.1 45.6 — 14.7 —
West 846.1 47.5 7.7 19.1 4.7 15.8 5.2
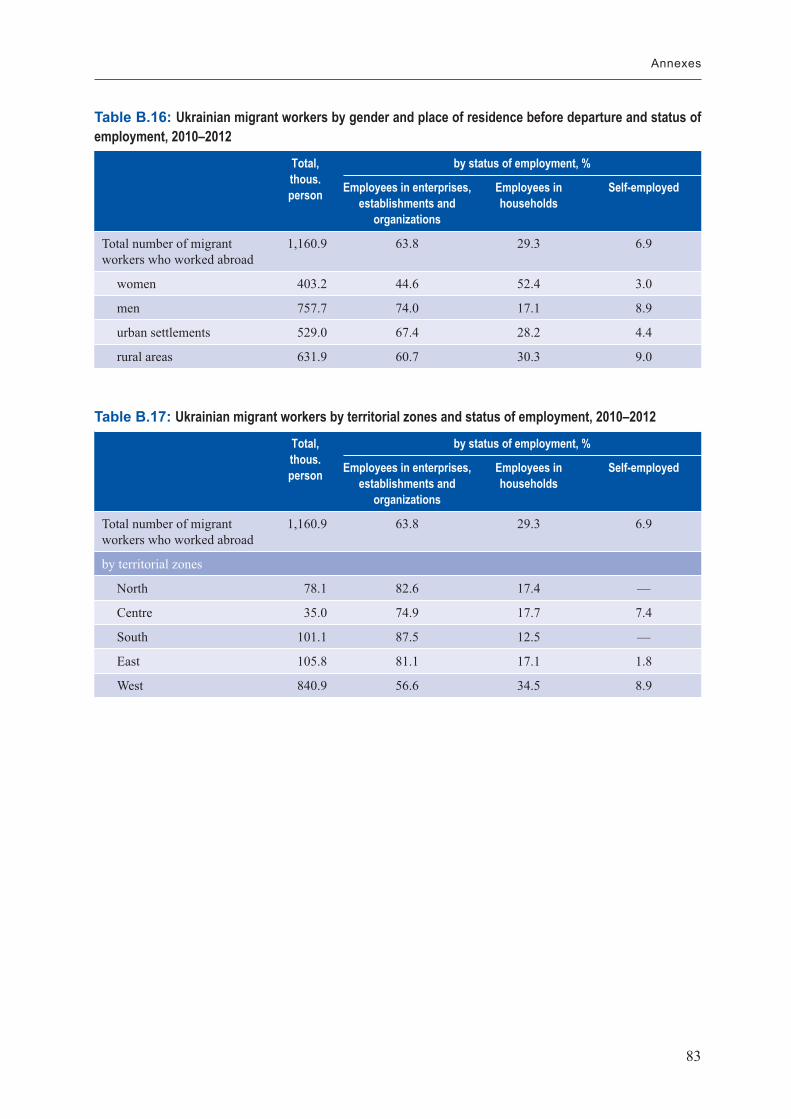
83
Annexes
Table B.16: Ukrainian migrant workers by gender and place of residence before departure and status of employment, 2010–2012
Total, thous. person
by status of employment, %
Employees in enterprises, establishments and
organizations
Employees in households
Self-employed
Total number of migrant workers who worked abroad
1,160.9 63.8 29.3 6.9
women 403.2 44.6 52.4 3.0
men 757.7 74.0 17.1 8.9
urban settlements 529.0 67.4 28.2 4.4
rural areas 631.9 60.7 30.3 9.0
Table B.17: Ukrainian migrant workers by territorial zones and status of employment, 2010–2012
Total, thous. person
by status of employment, %
Employees in enterprises, establishments and
organizations
Employees in households
Self-employed
Total number of migrant workers who worked abroad
1,160.9 63.8 29.3 6.9
by territorial zones
North 78.1 82.6 17.4 —
Centre 35.0 74.9 17.7 7.4
South 101.1 87.5 12.5 —
East 105.8 81.1 17.1 1.8
West 840.9 56.6 34.5 8.9
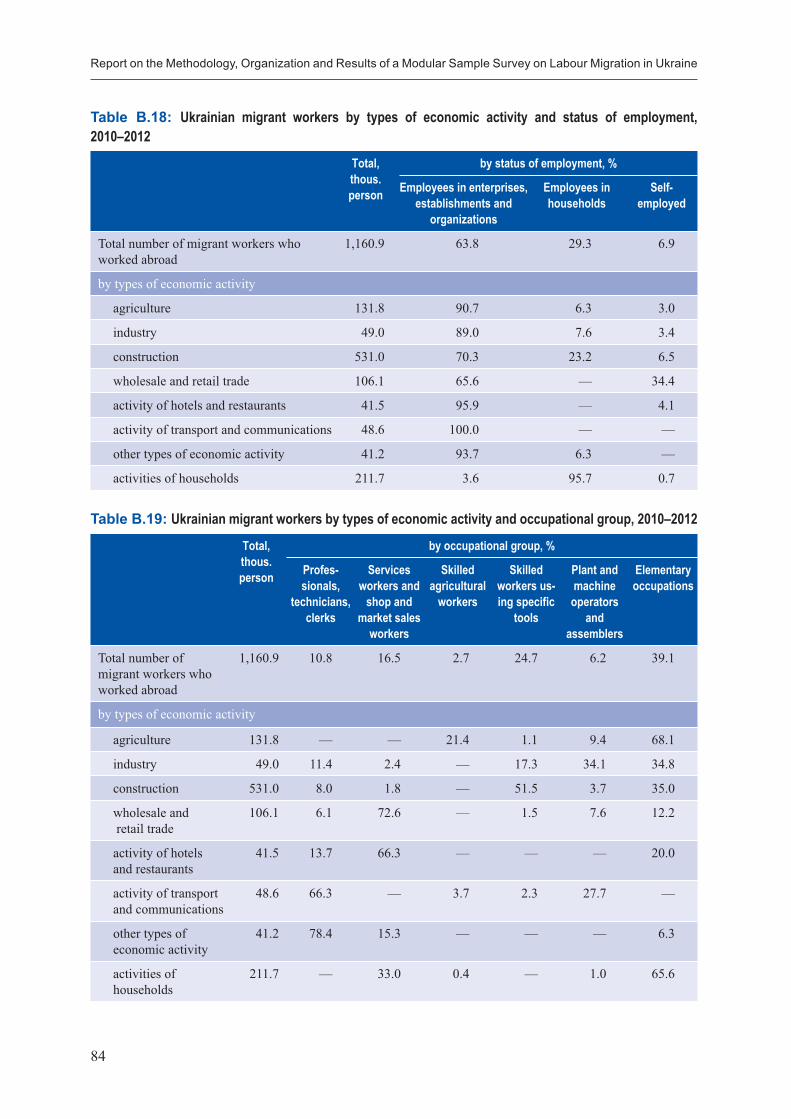
Report on the Methodology, Organization and Results of a Modular Sample Survey on Labour Migration in Ukraine
84
Table B.18: Ukrainian migrant workers by types of economic activity and status of employment, 2010–2012
Total, thous. person
by status of employment, %
Employees in enterprises, establishments and
organizations
Employees in households
Self-employed
Total number of migrant workers who worked abroad
1,160.9 63.8 29.3 6.9
by types of economic activity
agriculture 131.8 90.7 6.3 3.0
industry 49.0 89.0 7.6 3.4
construction 531.0 70.3 23.2 6.5
wholesale and retail trade 106.1 65.6 — 34.4
activity of hotels and restaurants 41.5 95.9 — 4.1
activity of transport and communications 48.6 100.0 — —
other types of economic activity 41.2 93.7 6.3 —
activities of households 211.7 3.6 95.7 0.7
Table B.19: Ukrainian migrant workers by types of economic activity and occupational group, 2010–2012
Total, thous. person
by occupational group, %
Profes-sionals,
technicians, clerks
Services workers and
shop and market sales
workers
Skilled agricultural
workers
Skilled workers us-ing specific
tools
Plant and machine operators
and assemblers
Elementary occupations
Total number of migrant workers who worked abroad
1,160.9 10.8 16.5 2.7 24.7 6.2 39.1
by types of economic activity
agriculture 131.8 — — 21.4 1.1 9.4 68.1
industry 49.0 11.4 2.4 — 17.3 34.1 34.8
construction 531.0 8.0 1.8 — 51.5 3.7 35.0
wholesale and retail trade
106.1 6.1 72.6 — 1.5 7.6 12.2
activity of hotels and restaurants
41.5 13.7 66.3 — — — 20.0
activity of transport and communications
48.6 66.3 — 3.7 2.3 27.7 —
other types of economic activity
41.2 78.4 15.3 — — — 6.3
activities of households
211.7 — 33.0 0.4 — 1.0 65.6
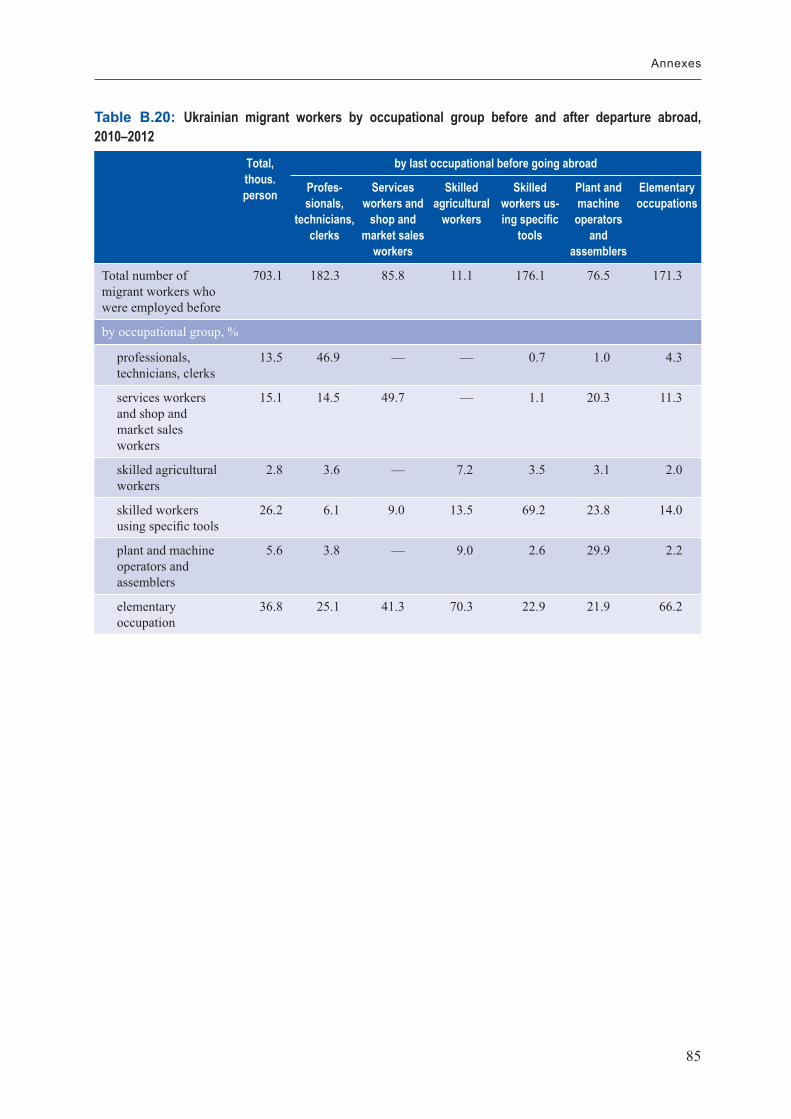
85
Annexes
Table B.20: Ukrainian migrant workers by occupational group before and after departure abroad, 2010–2012
Total, thous. person
by last occupational before going abroad
Profes-sionals,
technicians, clerks
Services workers and
shop and market sales
workers
Skilled agricultural
workers
Skilled workers us-ing specific
tools
Plant and machine operators
and assemblers
Elementary occupations
Total number of migrant workers who were employed before
703.1 182.3 85.8 11.1 176.1 76.5 171.3
by occupational group, %
professionals, technicians, clerks
13.5 46.9 — — 0.7 1.0 4.3
services workers and shop and market sales workers
15.1 14.5 49.7 — 1.1 20.3 11.3
skilled agricultural workers
2.8 3.6 — 7.2 3.5 3.1 2.0
skilled workers using specific tools
26.2 6.1 9.0 13.5 69.2 23.8 14.0
plant and machine operators and assemblers
5.6 3.8 — 9.0 2.6 29.9 2.2
elementary occupation
36.8 25.1 41.3 70.3 22.9 21.9 66.2
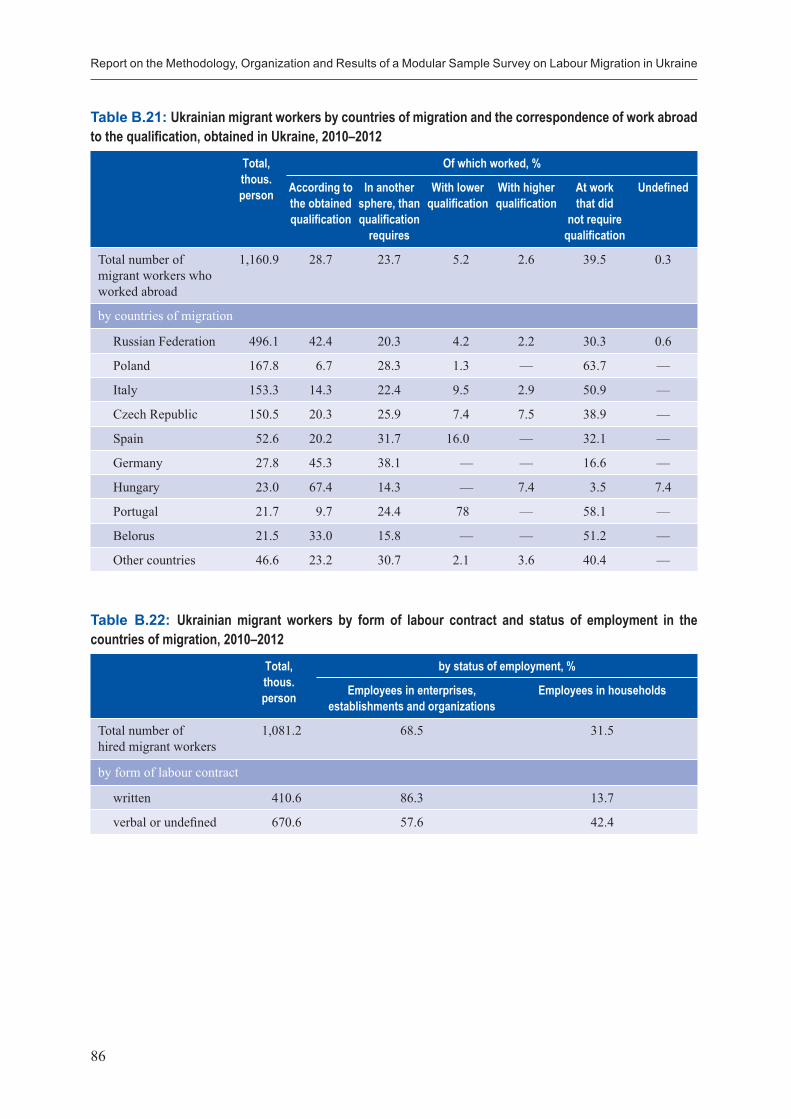
Report on the Methodology, Organization and Results of a Modular Sample Survey on Labour Migration in Ukraine
86
Table B.21: Ukrainian migrant workers by countries of migration and the correspondence of work abroad to the qualification, obtained in Ukraine, 2010–2012
Total, thous. person
Of which worked, %
According to the obtained qualification
In another sphere, than qualification
requires
With lower qualification
With higher qualification
At work that did
not require qualification
Undefined
Total number of migrant workers who worked abroad
1,160.9 28.7 23.7 5.2 2.6 39.5 0.3
by countries of migration
Russian Federation 496.1 42.4 20.3 4.2 2.2 30.3 0.6
Poland 167.8 6.7 28.3 1.3 — 63.7 —
Italy 153.3 14.3 22.4 9.5 2.9 50.9 —
Czech Republic 150.5 20.3 25.9 7.4 7.5 38.9 —
Spain 52.6 20.2 31.7 16.0 — 32.1 —
Germany 27.8 45.3 38.1 — — 16.6 —
Hungary 23.0 67.4 14.3 — 7.4 3.5 7.4
Portugal 21.7 9.7 24.4 78 — 58.1 —
Belorus 21.5 33.0 15.8 — — 51.2 —
Other countries 46.6 23.2 30.7 2.1 3.6 40.4 —
Table B.22: Ukrainian migrant workers by form of labour contract and status of employment in the countries of migration, 2010–2012
Total, thous. person
by status of employment, %
Employees in enterprises, establishments and organizations
Employees in households
Total number of hired migrant workers
1,081.2 68.5 31.5
by form of labour contract
written 410.6 86.3 13.7
verbal or undefined 670.6 57.6 42.4
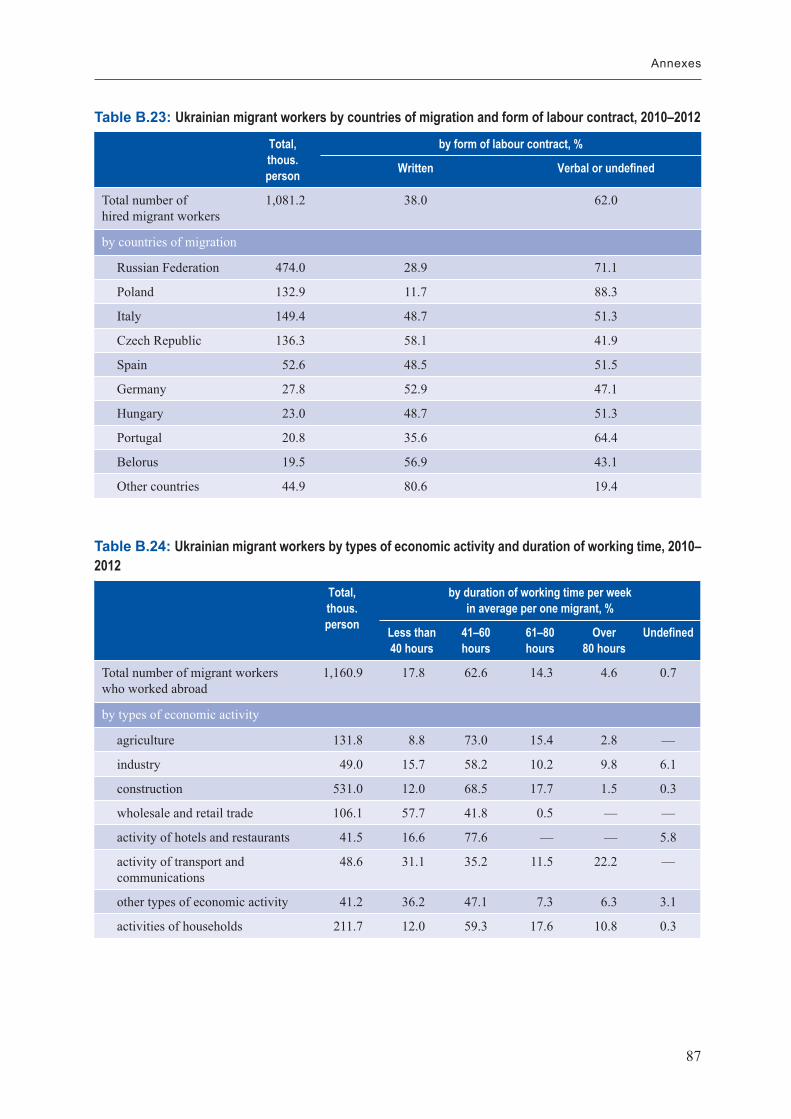
87
Annexes
Table B.23: Ukrainian migrant workers by countries of migration and form of labour contract, 2010–2012
Total, thous. person
by form of labour contract, %
Written Verbal or undefined
Total number of hired migrant workers
1,081.2 38.0 62.0
by countries of migration
Russian Federation 474.0 28.9 71.1
Poland 132.9 11.7 88.3
Italy 149.4 48.7 51.3
Czech Republic 136.3 58.1 41.9
Spain 52.6 48.5 51.5
Germany 27.8 52.9 47.1
Hungary 23.0 48.7 51.3
Portugal 20.8 35.6 64.4
Belorus 19.5 56.9 43.1
Other countries 44.9 80.6 19.4
Table B.24: Ukrainian migrant workers by types of economic activity and duration of working time, 2010–2012
Total, thous. person
by duration of working time per week in average per one migrant, %
Less than 40 hours
41–60 hours
61–80 hours
Over 80 hours
Undefined
Total number of migrant workers who worked abroad
1,160.9 17.8 62.6 14.3 4.6 0.7
by types of economic activity
agriculture 131.8 8.8 73.0 15.4 2.8 —
industry 49.0 15.7 58.2 10.2 9.8 6.1
construction 531.0 12.0 68.5 17.7 1.5 0.3
wholesale and retail trade 106.1 57.7 41.8 0.5 — —
activity of hotels and restaurants 41.5 16.6 77.6 — — 5.8
activity of transport and communications
48.6 31.1 35.2 11.5 22.2 —
other types of economic activity 41.2 36.2 47.1 7.3 6.3 3.1
activities of households 211.7 12.0 59.3 17.6 10.8 0.3
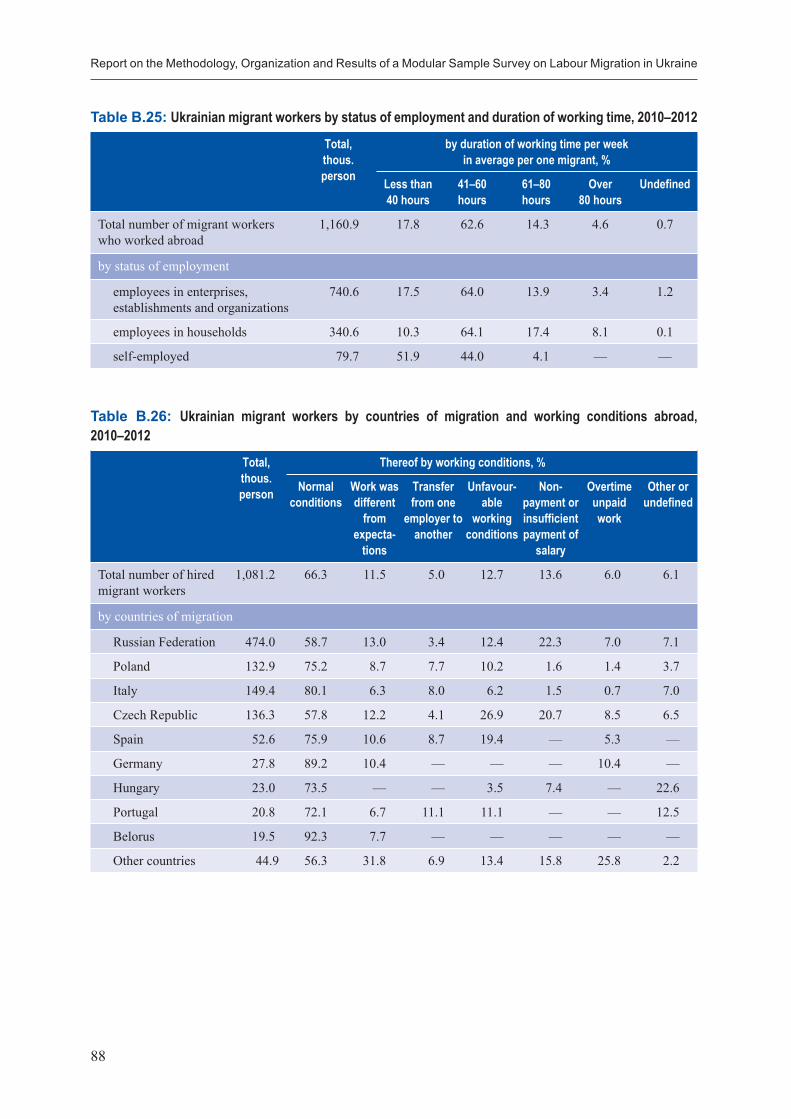
Report on the Methodology, Organization and Results of a Modular Sample Survey on Labour Migration in Ukraine
88
Table B.25: Ukrainian migrant workers by status of employment and duration of working time, 2010–2012
Total, thous. person
by duration of working time per week in average per one migrant, %
Less than 40 hours
41–60 hours
61–80 hours
Over 80 hours
Undefined
Total number of migrant workers who worked abroad
1,160.9 17.8 62.6 14.3 4.6 0.7
by status of employment
employees in enterprises, establishments and organizations
740.6 17.5 64.0 13.9 3.4 1.2
employees in households 340.6 10.3 64.1 17.4 8.1 0.1
self-employed 79.7 51.9 44.0 4.1 — —
Table B.26: Ukrainian migrant workers by countries of migration and working conditions abroad, 2010–2012
Total, thous. person
Thereof by working conditions, %
Normal conditions
Work was different
from expecta-
tions
Transfer from one
employer to another
Unfavour-able
working conditions
Non-payment or insufficient payment of
salary
Overtime unpaid work
Other or undefined
Total number of hired migrant workers
1,081.2 66.3 11.5 5.0 12.7 13.6 6.0 6.1
by countries of migration
Russian Federation 474.0 58.7 13.0 3.4 12.4 22.3 7.0 7.1
Poland 132.9 75.2 8.7 7.7 10.2 1.6 1.4 3.7
Italy 149.4 80.1 6.3 8.0 6.2 1.5 0.7 7.0
Czech Republic 136.3 57.8 12.2 4.1 26.9 20.7 8.5 6.5
Spain 52.6 75.9 10.6 8.7 19.4 — 5.3 —
Germany 27.8 89.2 10.4 — — — 10.4 —
Hungary 23.0 73.5 — — 3.5 7.4 — 22.6
Portugal 20.8 72.1 6.7 11.1 11.1 — — 12.5
Belorus 19.5 92.3 7.7 — — — — —
Other countries 44.9 56.3 31.8 6.9 13.4 15.8 25.8 2.2
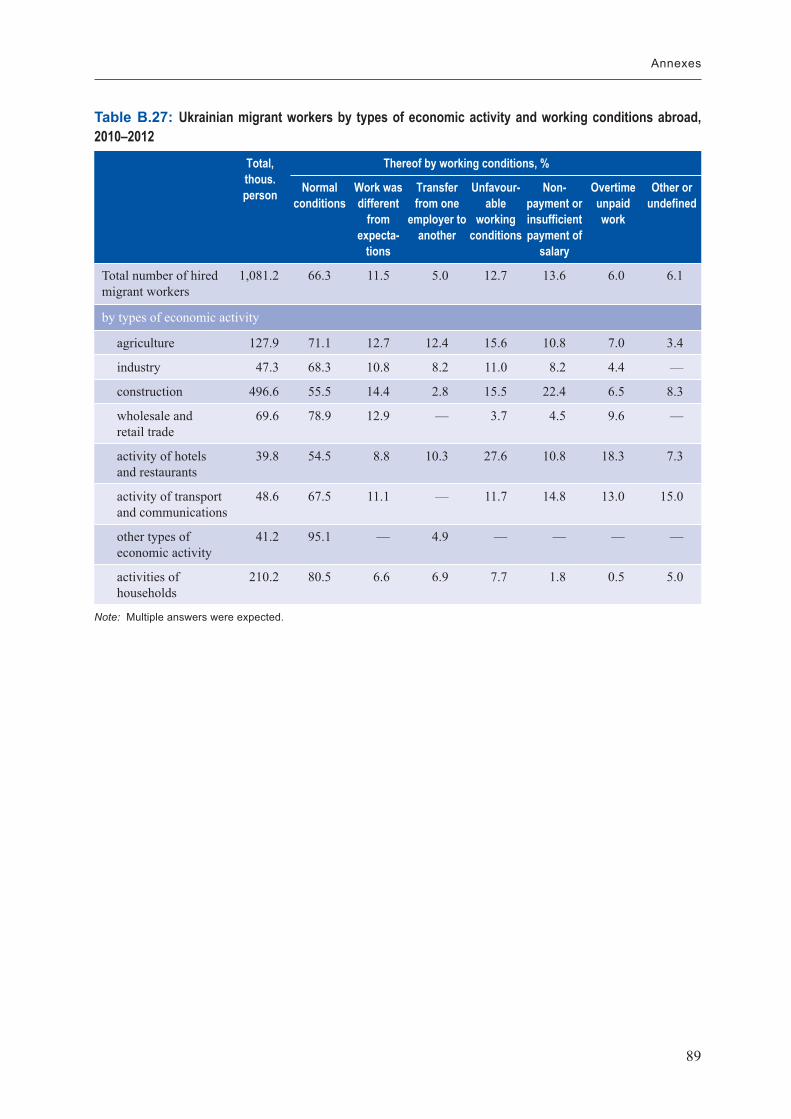
89
Annexes
Table B.27: Ukrainian migrant workers by types of economic activity and working conditions abroad, 2010–2012
Total, thous. person
Thereof by working conditions, %
Normal conditions
Work was different
from expecta-
tions
Transfer from one
employer to another
Unfavour-able
working conditions
Non-payment or insufficient payment of
salary
Overtime unpaid work
Other or undefined
Total number of hired migrant workers
1,081.2 66.3 11.5 5.0 12.7 13.6 6.0 6.1
by types of economic activity
agriculture 127.9 71.1 12.7 12.4 15.6 10.8 7.0 3.4
industry 47.3 68.3 10.8 8.2 11.0 8.2 4.4 —
construction 496.6 55.5 14.4 2.8 15.5 22.4 6.5 8.3
wholesale and retail trade
69.6 78.9 12.9 — 3.7 4.5 9.6 —
activity of hotels and restaurants
39.8 54.5 8.8 10.3 27.6 10.8 18.3 7.3
activity of transport and communications
48.6 67.5 11.1 — 11.7 14.8 13.0 15.0
other types of economic activity
41.2 95.1 — 4.9 — — — —
activities of households
210.2 80.5 6.6 6.9 7.7 1.8 0.5 5.0
Note: Multiple answers were expected.
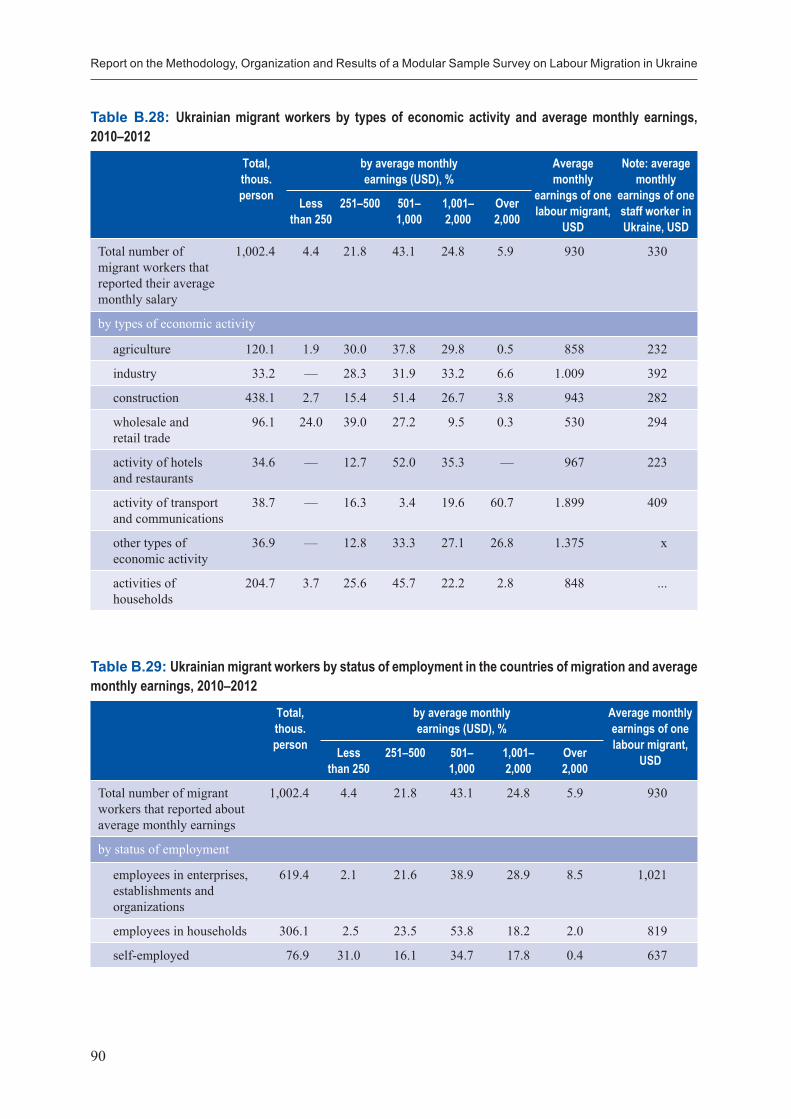
Report on the Methodology, Organization and Results of a Modular Sample Survey on Labour Migration in Ukraine
90
Table B.28: Ukrainian migrant workers by types of economic activity and average monthly earnings, 2010–2012
Total, thous. person
by average monthly earnings (USD), %
Average monthly
earnings of one labour migrant,
USD
Note: average monthly
earnings of one staff worker in Ukraine, USD
Less than 250
251–500 501–1,000
1,001–2,000
Over 2,000
Total number of migrant workers that reported their average monthly salary
1,002.4 4.4 21.8 43.1 24.8 5.9 930 330
by types of economic activity
agriculture 120.1 1.9 30.0 37.8 29.8 0.5 858 232
industry 33.2 — 28.3 31.9 33.2 6.6 1.009 392
construction 438.1 2.7 15.4 51.4 26.7 3.8 943 282
wholesale and retail trade
96.1 24.0 39.0 27.2 9.5 0.3 530 294
activity of hotels and restaurants
34.6 — 12.7 52.0 35.3 — 967 223
activity of transport and communications
38.7 — 16.3 3.4 19.6 60.7 1.899 409
other types of economic activity
36.9 — 12.8 33.3 27.1 26.8 1.375 х
activities of households
204.7 3.7 25.6 45.7 22.2 2.8 848 ...
Table B.29: Ukrainian migrant workers by status of employment in the countries of migration and average monthly earnings, 2010–2012
Total, thous. person
by average monthly earnings (USD), %
Average monthly earnings of one labour migrant,
USDLess than 250
251–500 501–1,000
1,001–2,000
Over 2,000
Total number of migrant workers that reported about average monthly earnings
1,002.4 4.4 21.8 43.1 24.8 5.9 930
by status of employment
employees in enterprises, establishments and organizations
619.4 2.1 21.6 38.9 28.9 8.5 1,021
employees in households 306.1 2.5 23.5 53.8 18.2 2.0 819
self-employed 76.9 31.0 16.1 34.7 17.8 0.4 637
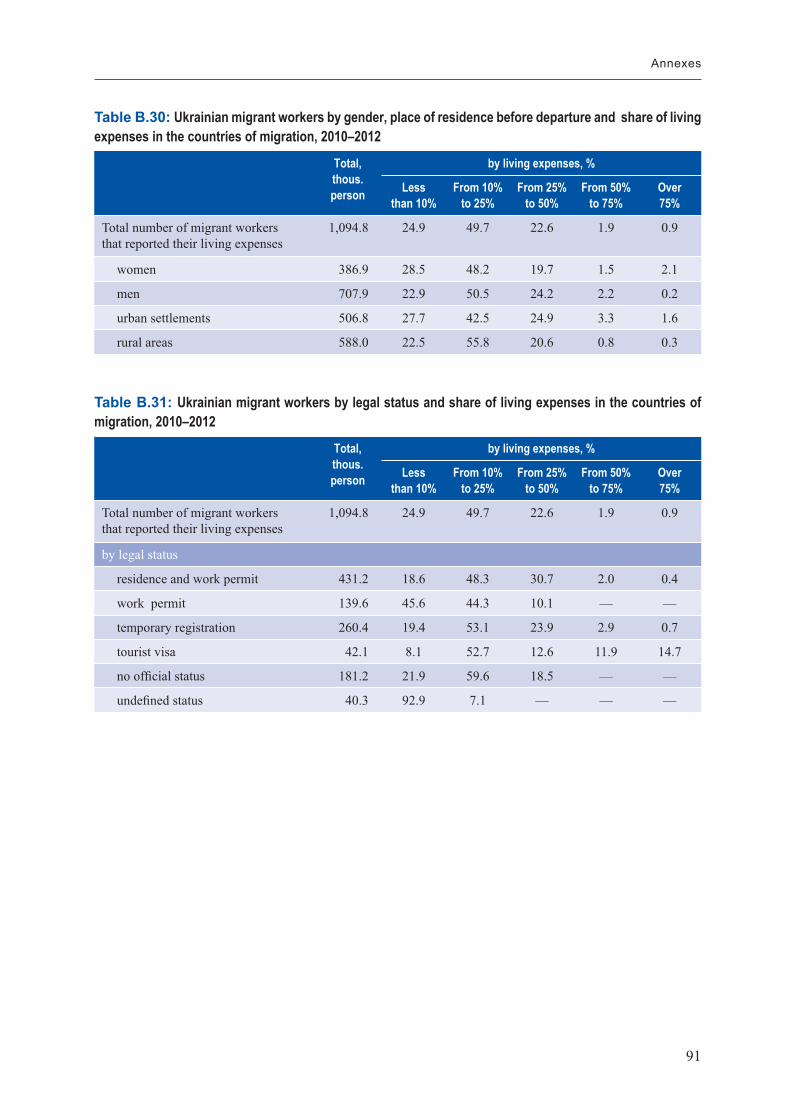
91
Annexes
Table B.30: Ukrainian migrant workers by gender, place of residence before departure and share of living expenses in the countries of migration, 2010–2012
Total, thous. person
by living expenses, %
Less than 10%
From 10% to 25%
From 25% to 50%
From 50% to 75%
Over 75%
Total number of migrant workers that reported their living expenses
1,094.8 24.9 49.7 22.6 1.9 0.9
women 386.9 28.5 48.2 19.7 1.5 2.1
men 707.9 22.9 50.5 24.2 2.2 0.2
urban settlements 506.8 27.7 42.5 24.9 3.3 1.6
rural areas 588.0 22.5 55.8 20.6 0.8 0.3
Table B.31: Ukrainian migrant workers by legal status and share of living expenses in the countries of migration, 2010–2012
Total, thous. person
by living expenses, %
Less than 10%
From 10% to 25%
From 25% to 50%
From 50% to 75%
Over 75%
Total number of migrant workers that reported their living expenses
1,094.8 24.9 49.7 22.6 1.9 0.9
by legal status
residence and work permit 431.2 18.6 48.3 30.7 2.0 0.4
work permit 139.6 45.6 44.3 10.1 — —
temporary registration 260.4 19.4 53.1 23.9 2.9 0.7
tourist visa 42.1 8.1 52.7 12.6 11.9 14.7
no official status 181.2 21.9 59.6 18.5 — —
undefined status 40.3 92.9 7.1 — — —
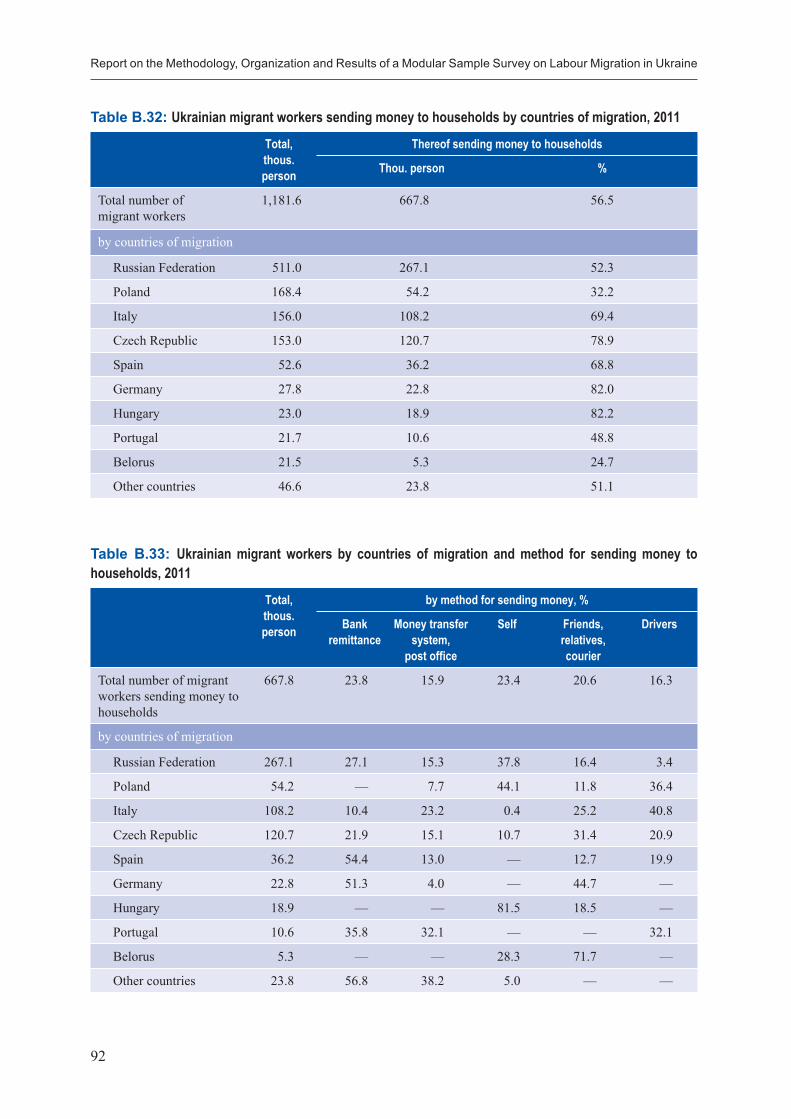
Report on the Methodology, Organization and Results of a Modular Sample Survey on Labour Migration in Ukraine
92
Table B.32: Ukrainian migrant workers sending money to households by countries of migration, 2011
Total, thous. person
Thereof sending money to households
Thou. person %
Total number of migrant workers
1,181.6 667.8 56.5
by countries of migration
Russian Federation 511.0 267.1 52.3
Poland 168.4 54.2 32.2
Italy 156.0 108.2 69.4
Czech Republic 153.0 120.7 78.9
Spain 52.6 36.2 68.8
Germany 27.8 22.8 82.0
Hungary 23.0 18.9 82.2
Portugal 21.7 10.6 48.8
Belorus 21.5 5.3 24.7
Other countries 46.6 23.8 51.1
Table B.33: Ukrainian migrant workers by countries of migration and method for sending money to households, 2011
Total, thous. person
by method for sending money, %
Bank remittance
Money transfer system,
post office
Self Friends, relatives, courier
Drivers
Total number of migrant workers sending money to households
667.8 23.8 15.9 23.4 20.6 16.3
by countries of migration
Russian Federation 267.1 27.1 15.3 37.8 16.4 3.4
Poland 54.2 — 7.7 44.1 11.8 36.4
Italy 108.2 10.4 23.2 0.4 25.2 40.8
Czech Republic 120.7 21.9 15.1 10.7 31.4 20.9
Spain 36.2 54.4 13.0 — 12.7 19.9
Germany 22.8 51.3 4.0 — 44.7 —
Hungary 18.9 — — 81.5 18.5 —
Portugal 10.6 35.8 32.1 — — 32.1
Belorus 5.3 — — 28.3 71.7 —
Other countries 23.8 56.8 38.2 5.0 — —
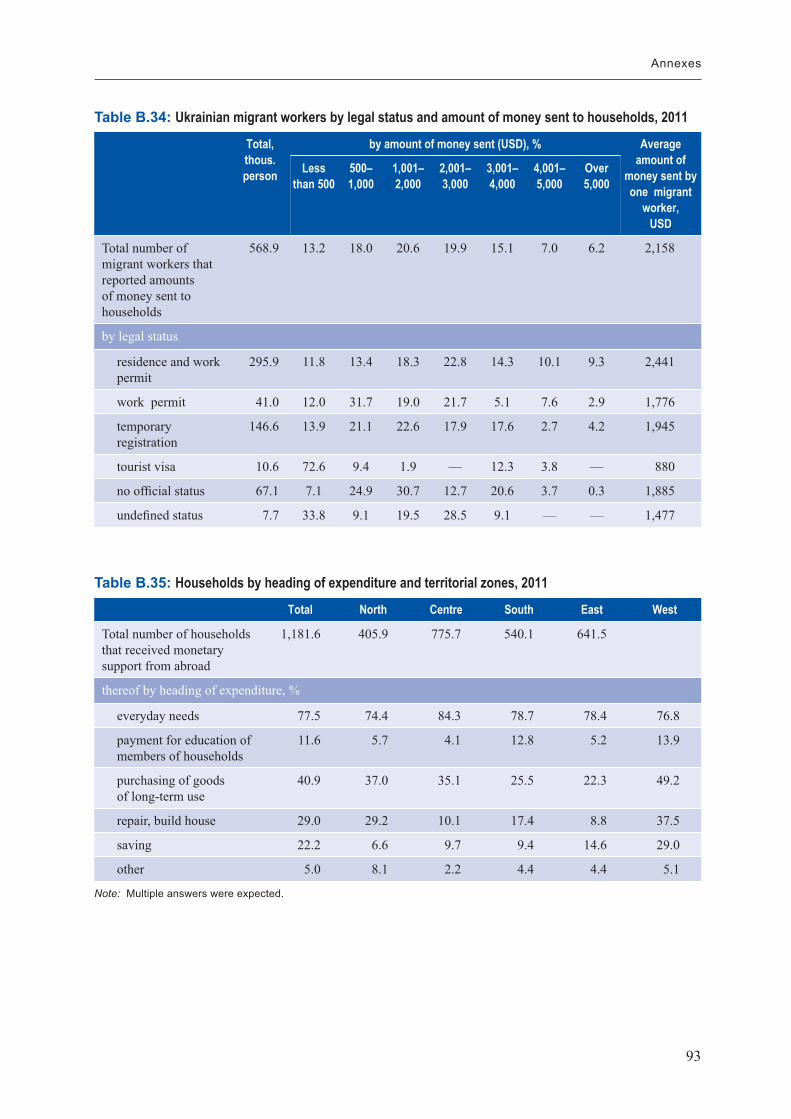
93
Annexes
Table B.34: Ukrainian migrant workers by legal status and amount of money sent to households, 2011
Total, thous. person
by amount of money sent (USD), % Average amount of
money sent by one migrant
worker, USD
Less than 500
500–1,000
1,001–2,000
2,001–3,000
3,001–4,000
4,001–5,000
Over 5,000
Total number of migrant workers that reported amounts of money sent to households
568.9 13.2 18.0 20.6 19.9 15.1 7.0 6.2 2,158
by legal status
residence and work permit
295.9 11.8 13.4 18.3 22.8 14.3 10.1 9.3 2,441
work permit 41.0 12.0 31.7 19.0 21.7 5.1 7.6 2.9 1,776
temporary registration
146.6 13.9 21.1 22.6 17.9 17.6 2.7 4.2 1,945
tourist visa 10.6 72.6 9.4 1.9 — 12.3 3.8 — 880
no official status 67.1 7.1 24.9 30.7 12.7 20.6 3.7 0.3 1,885
undefined status 7.7 33.8 9.1 19.5 28.5 9.1 — — 1,477
Table B.35: H ouseholds by heading of expenditure and territorial zones, 2011
Total North Centre South East West
Total number of households that received monetary support from abroad
1,181.6 405.9 775.7 540.1 641.5
thereof by heading of expenditure, %
everyday needs 77.5 74.4 84.3 78.7 78.4 76.8
payment for education of members of households
11.6 5.7 4.1 12.8 5.2 13.9
purchasing of goods of long-term use
40.9 37.0 35.1 25.5 22.3 49.2
repair, build house 29.0 29.2 10.1 17.4 8.8 37.5
saving 22.2 6.6 9.7 9.4 14.6 29.0
other 5.0 8.1 2.2 4.4 4.4 5.1
Note: Multiple answers were expected.
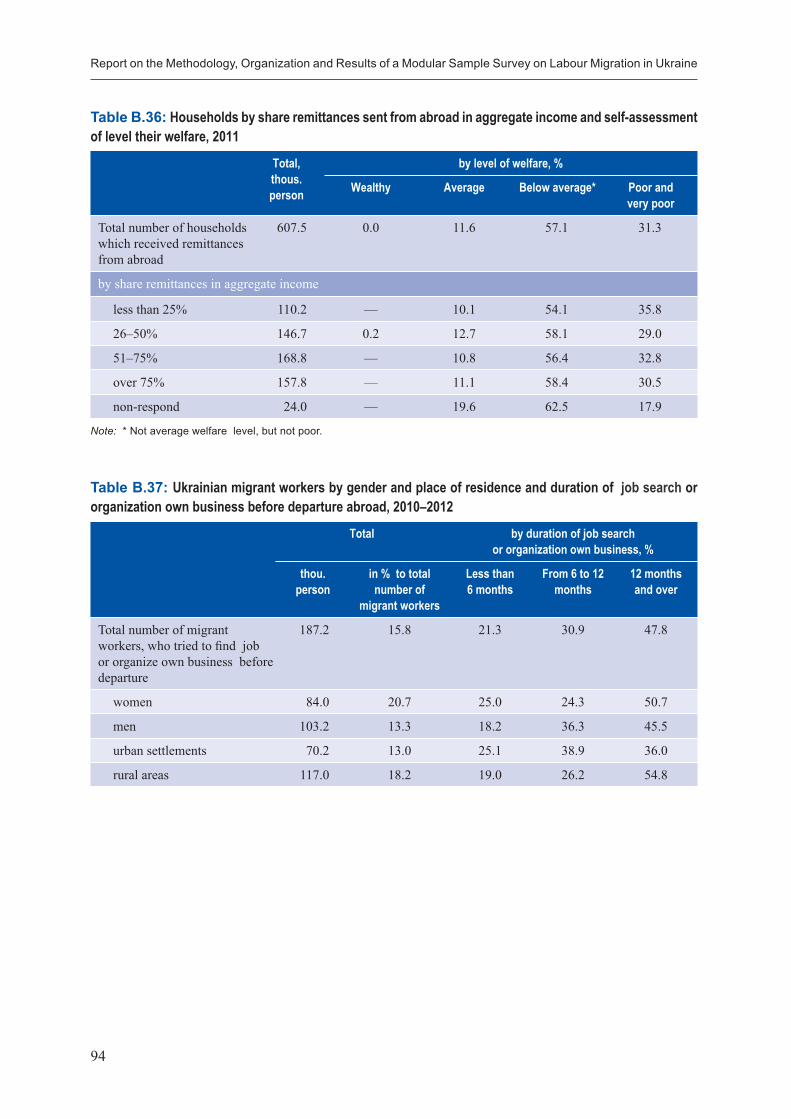
Report on the Methodology, Organization and Results of a Modular Sample Survey on Labour Migration in Ukraine
94
Table B.36: Households by share remittances sent from abroad in aggregate income and self-assessment of level their welfare, 2011
Total, thous. person
by level of welfare, %
Wealthy Average Below average* Poor and very poor
Total number of households which received remittances from abroad
607.5 0.0 11.6 57.1 31.3
by share remittances in aggregate income
less than 25% 110.2 — 10.1 54.1 35.8
26–50% 146.7 0.2 12.7 58.1 29.0
51–75% 168.8 — 10.8 56.4 32.8
over 75% 157.8 — 11.1 58.4 30.5
non-respond 24.0 — 19.6 62.5 17.9
Note: * Not average welfare level, but not poor.
Table B.37: Ukrainian migrant workers by gender and place of residence and duration of job search or organization own business before departure abroad, 2010–2012
Total by duration of job search or organization own business, %
thou. person
in % to total number of
migrant workers
Less than6 months
From 6 to 12 months
12 months and over
Total number of migrant workers, who tried to find job or organize own business before departure
187.2 15.8 21.3 30.9 47.8
women 84.0 20.7 25.0 24.3 50.7
men 103.2 13.3 18.2 36.3 45.5
urban settlements 70.2 13.0 25.1 38.9 36.0
rural areas 117.0 18.2 19.0 26.2 54.8
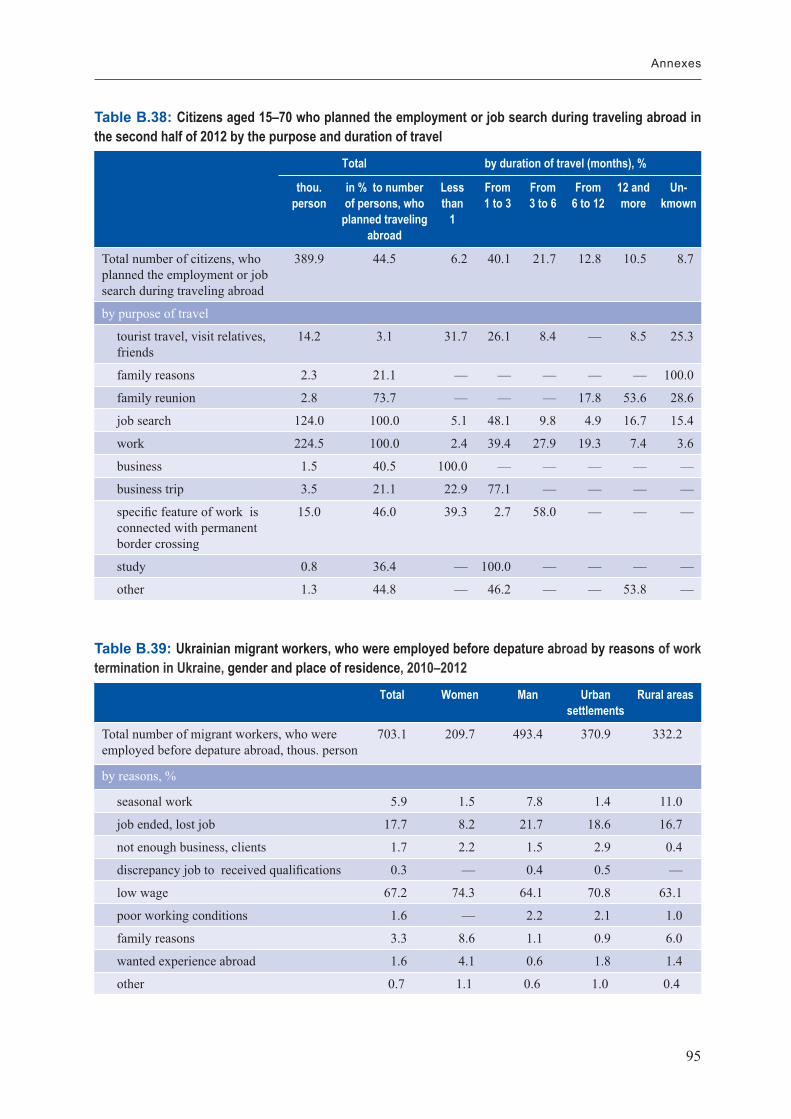
95
Annexes
Table B.38: Сitizens aged 15–70 who planned the employment or job search during traveling abroad in the second half of 2012 by the purpose and duration of travel
Total by duration of travel (months), %
thou. person
in % to number of persons, who
planned traveling abroad
Less than
1
From 1 to 3
From 3 to 6
From 6 to 12
12 and more
Un-kmown
Total number of сitizens, who planned the employment or job search during traveling abroad
389.9 44.5 6.2 40.1 21.7 12.8 10.5 8.7
by purpose of travel
tourist travel, visit relatives, friends
14.2 3.1 31.7 26.1 8.4 — 8.5 25.3
family reasons 2.3 21.1 — — — — — 100.0
family reunion 2.8 73.7 — — — 17.8 53.6 28.6
job search 124.0 100.0 5.1 48.1 9.8 4.9 16.7 15.4
work 224.5 100.0 2.4 39.4 27.9 19.3 7.4 3.6
business 1.5 40.5 100.0 — — — — —
business trip 3.5 21.1 22.9 77.1 — — — —
specific feature of work is connected with permanent border crossing
15.0 46.0 39.3 2.7 58.0 — — —
study 0.8 36.4 — 100.0 — — — —
other 1.3 44.8 — 46.2 — — 53.8 —
Table B.39: Ukrainian migrant workers, who were employed before depature abroad by reasons of work termination іn Ukraine, gender and place of residence, 2010–2012
Total Women Man Urban settlements
Rural areas
Total number of migrant workers, who were employed before depature abroad, thous. person
703.1 209.7 493.4 370.9 332.2
by reasons, %
seasonal work 5.9 1.5 7.8 1.4 11.0
job ended, lost job 17.7 8.2 21.7 18.6 16.7
not enough business, clients 1.7 2.2 1.5 2.9 0.4
discrepancy job to received qualifications 0.3 — 0.4 0.5 —
low wage 67.2 74.3 64.1 70.8 63.1
poor working conditions 1.6 — 2.2 2.1 1.0
family reasons 3.3 8.6 1.1 0.9 6.0
wanted experience abroad 1.6 4.1 0.6 1.8 1.4
other 0.7 1.1 0.6 1.0 0.4
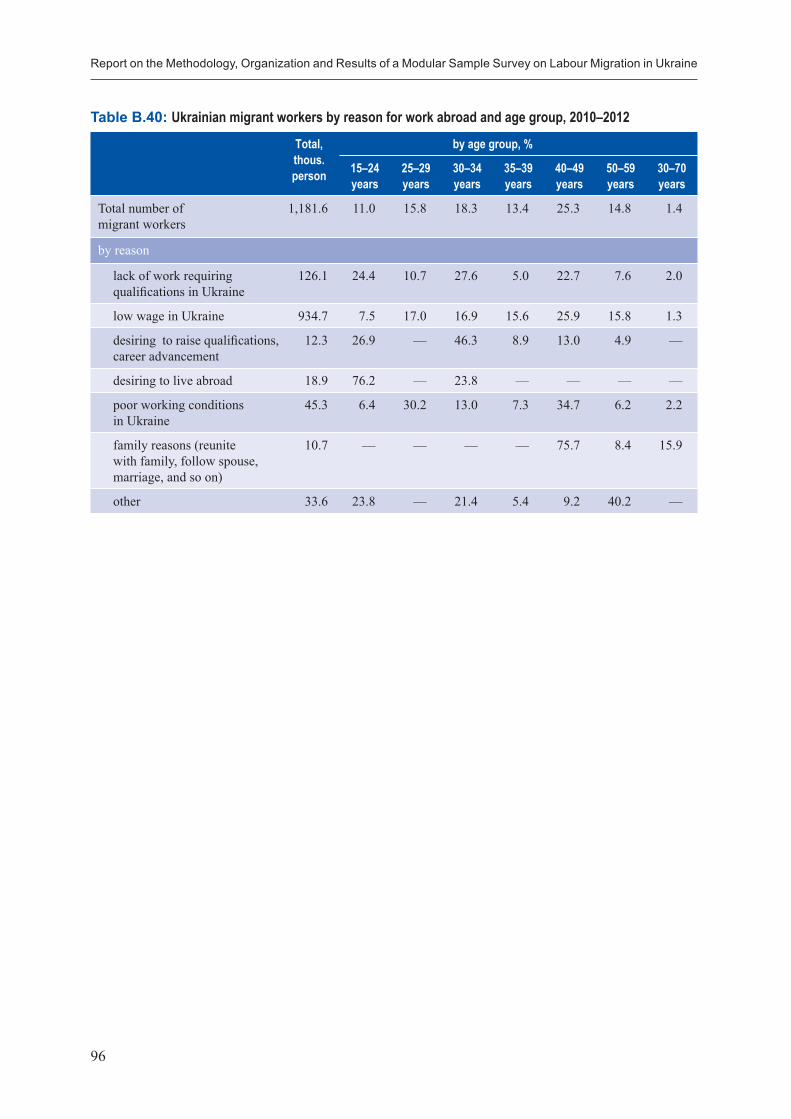
Report on the Methodology, Organization and Results of a Modular Sample Survey on Labour Migration in Ukraine
96
Table B.40: Ukrainian migrant workers by reason for work abroad and age group, 2010–2012
Total, thous. person
by age group, %
15–24 years
25–29 years
30–34 years
35–39 years
40–49 years
50–59 years
30–70 years
Total number of migrant workers
1,181.6 11.0 15.8 18.3 13.4 25.3 14.8 1.4
by reason
lack of work requiring qualifications in Ukraine
126.1 24.4 10.7 27.6 5.0 22.7 7.6 2.0
low wage in Ukraine 934.7 7.5 17.0 16.9 15.6 25.9 15.8 1.3
desiring to raise qualifications, career advancement
12.3 26.9 — 46.3 8.9 13.0 4.9 —
desiring to live abroad 18.9 76.2 — 23.8 — — — —
poor working conditions in Ukraine
45.3 6.4 30.2 13.0 7.3 34.7 6.2 2.2
family reasons (reunite with family, follow spouse, marriage, and so on)
10.7 — — — — 75.7 8.4 15.9
other 33.6 23.8 — 21.4 5.4 9.2 40.2 —


ISBN 978-92-2-127892-4
9 7 8 9 2 2 1 2 7 8 9 2 4
Related Documents


![ILO Indicators of forced labour - ilo. · PDF fileILO Indicators of forced labour ... •Physical abduction or kidnapping. 5. ... Microsoft PowerPoint - PPT_Indicators [호환 모드]](https://static.cupdf.com/doc/110x72/5aadc13e7f8b9a3a038b537c/ilo-indicators-of-forced-labour-ilo-indicators-of-forced-labour-physical.jpg)
