OECD Employment Outlook 2014 Stefano Scarpetta, Director for Employment, Labour and Social Affairs, OECD

Welcome message from author
This document is posted to help you gain knowledge. Please leave a comment to let me know what you think about it! Share it to your friends and learn new things together.
Transcript
OECD Employment Outlook 2014
Stefano Scarpetta, Director for Employment, Labour and Social Affairs, OECD
The recovery is gaining momentum but there is no time for complacency
• Unemployment has started to decline, but further progress is required as the job recovery has not gone very far yet
• People have borne considerable personal, economic and social costs that may prove to be long-lasting: – long-term unemployment remains persistently high – many workers have experienced falls in the real value of their earnings
• Fixed term contracts are increasingly used for new hires, but they are not an automatic stepping-stone to permanent work
• Not just more jobs but also better jobs are needed. The good news is that there is little sign of a trade-off between job quantity and job quality across countries
• Skills are the key to better jobs, but this requires giving people the opportunity to acquire the right skills needed in the labour market. It is not just educational attainment that matters
2
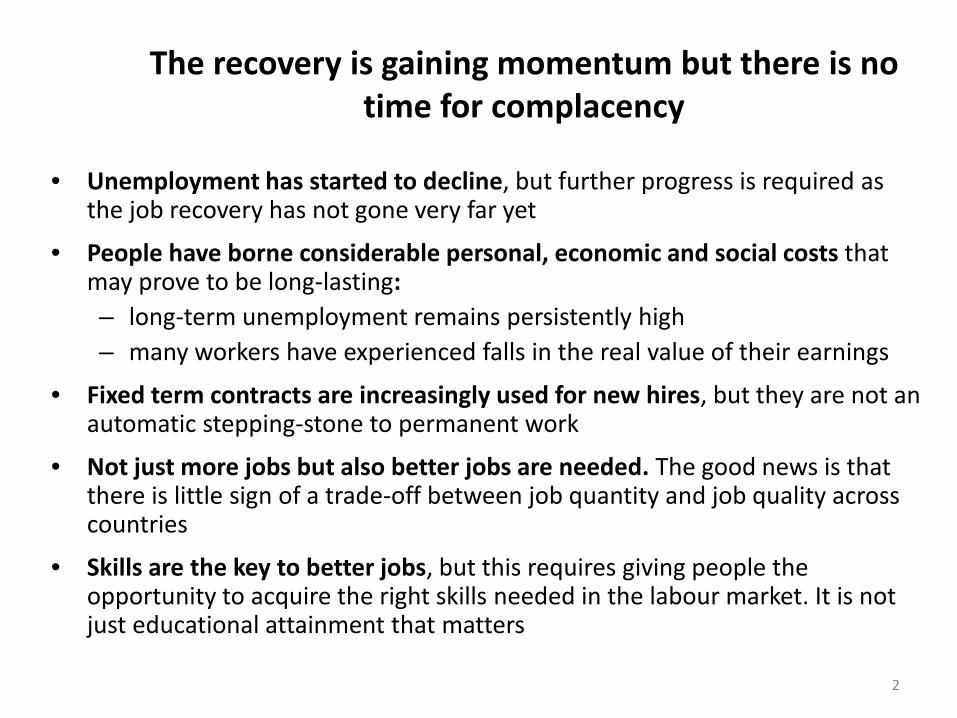
Unemployment has started to decline, but further progress is required…
3
0
2
4
6
8
10
12
14
Italy Euro area France OECD United Kingdom United States Canada Germany Japan
% Unemployment rate
Percentage of the labour force
Current value (Q4 2013) Start of the crisis (Q4 2007)
Country-specific peak Projected value (Q4 2015)
4
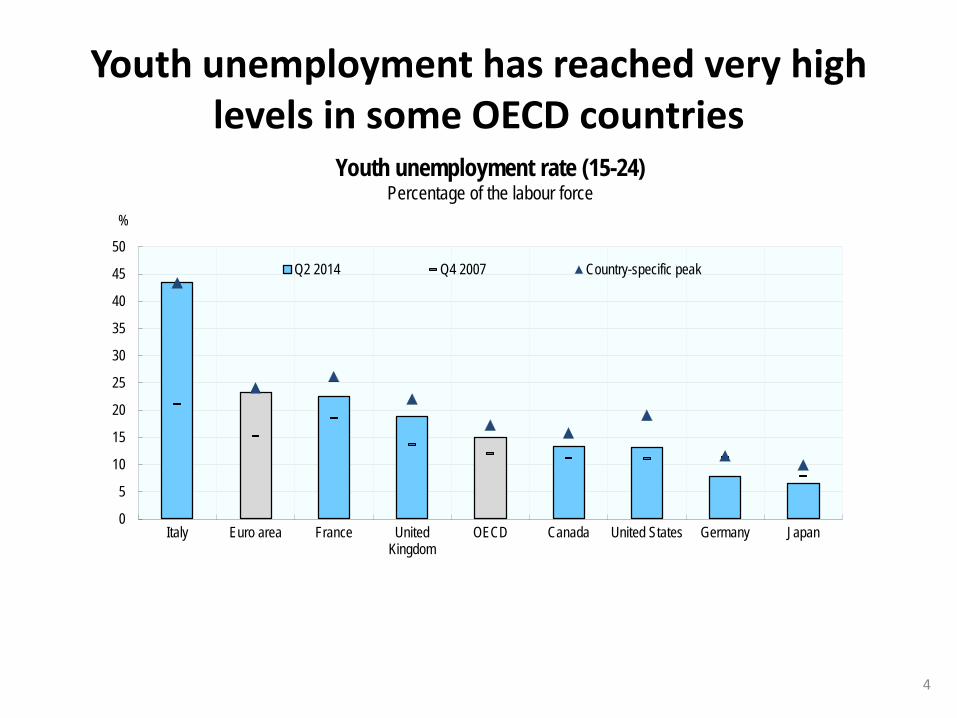
Youth unemployment has reached very high levels in some OECD countries
Youth unemployment rate (15-24) Percentage of the labour force
0
5
10
15
20
25
30
35
40
45
50
Italy Euro area France UnitedKingdom
OECD Canada United States Germany Japan
%
Q2 2014 Q4 2007 Country-specific peak
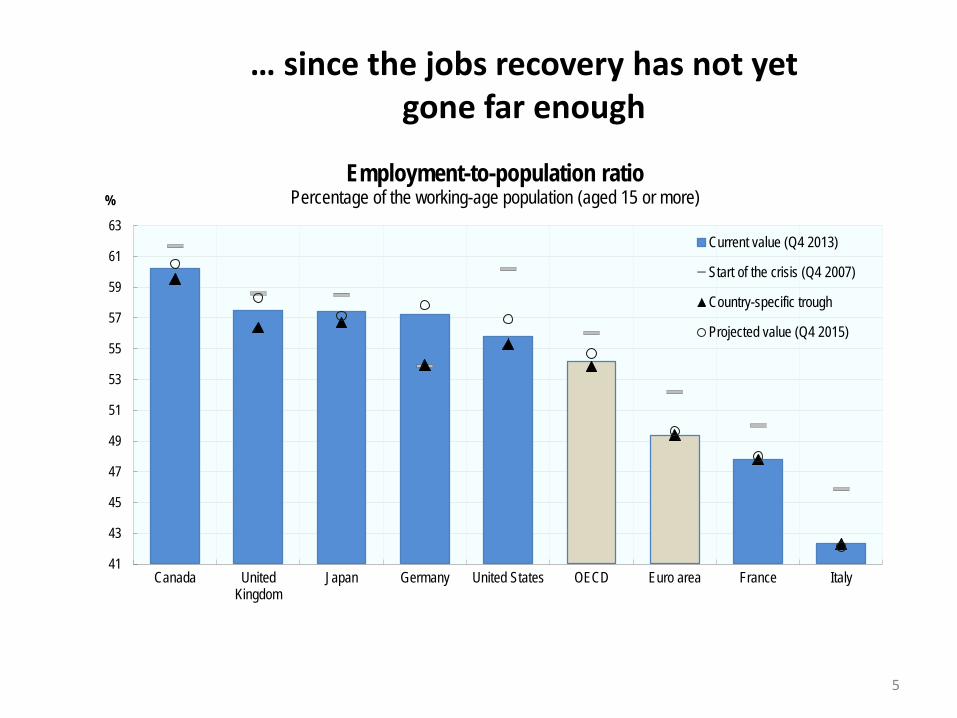
… since the jobs recovery has not yet gone far enough
5
41
43
45
47
49
51
53
55
57
59
61
63
Canada UnitedKingdom
Japan Germany United States OECD Euro area France Italy
% Employment-to-population ratio
Percentage of the working-age population (aged 15 or more)
Current value (Q4 2013)
Start of the crisis (Q4 2007)
Country-specific trough
Projected value (Q4 2015)
The personal, economic and social costs of the crisis have been considerable
• Among those who are unemployed, an increasing number of persons are out of work for 12 months or more, facing a depreciation of their skills and a risk of labour market exclusion
• Among those who have kept their jobs, many low-paid workers and their families have experienced economic hardship as a result of declines in the spending power of their earnings
6
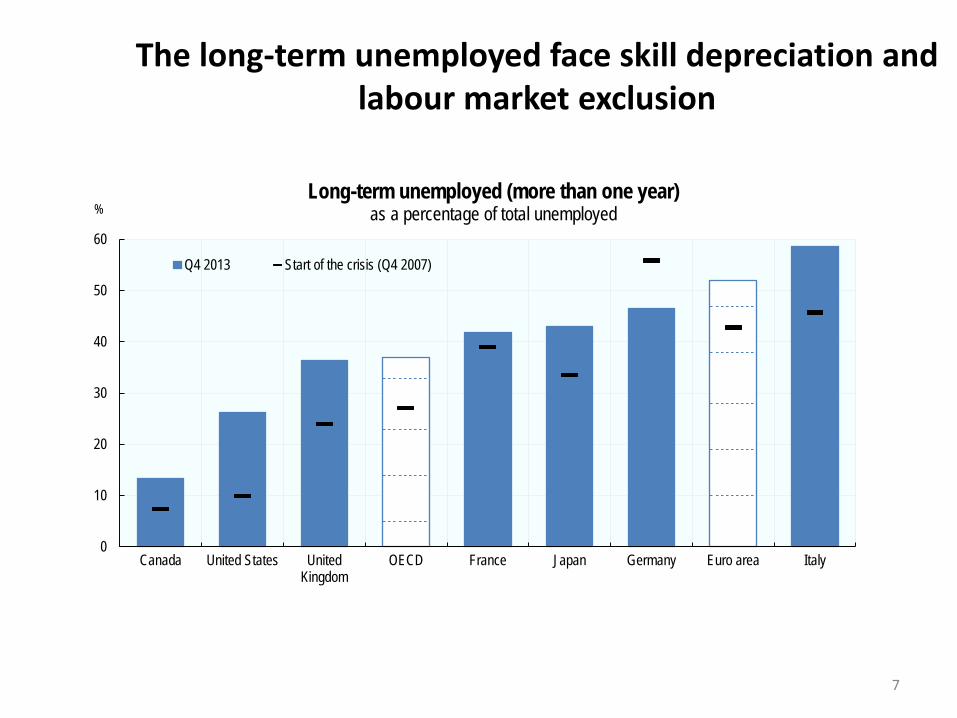
The long-term unemployed face skill depreciation and labour market exclusion
7
0
10
20
30
40
50
60
Canada United States UnitedKingdom
OECD France Japan Germany Euro area Italy
% Long-term unemployed (more than one year)
as a percentage of total unemployed
Q4 2013 Start of the crisis (Q4 2007)
8
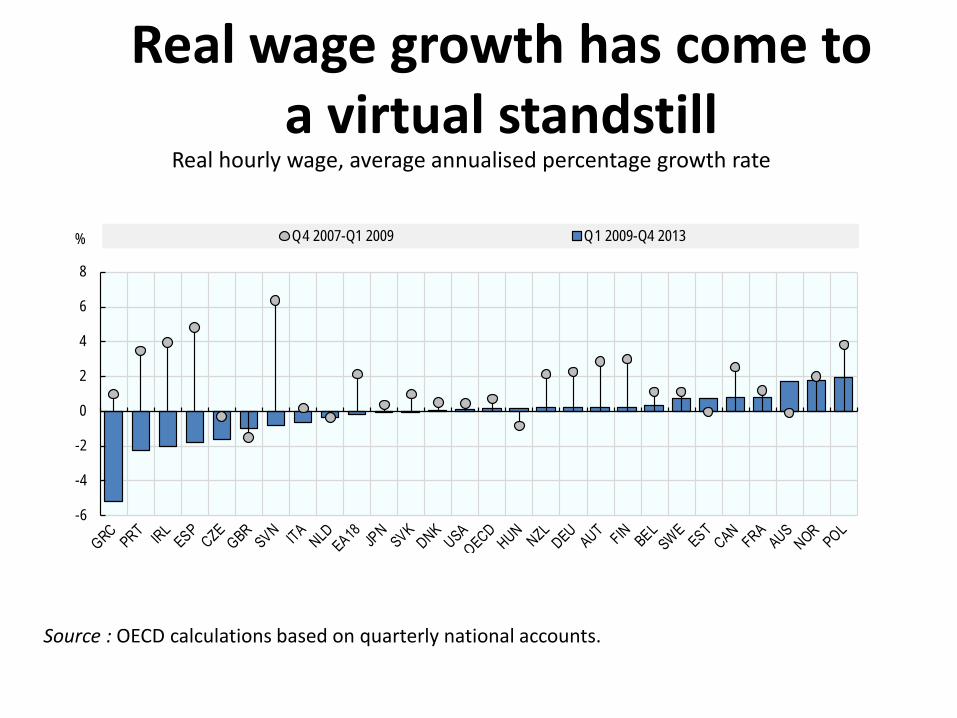
Real wage growth has come to a virtual standstill
-6
-4
-2
0
2
4
6
8
% Q4 2007-Q1 2009 Q1 2009-Q4 2013
Real hourly wage, average annualised percentage growth rate
Source : OECD calculations based on quarterly national accounts.
9
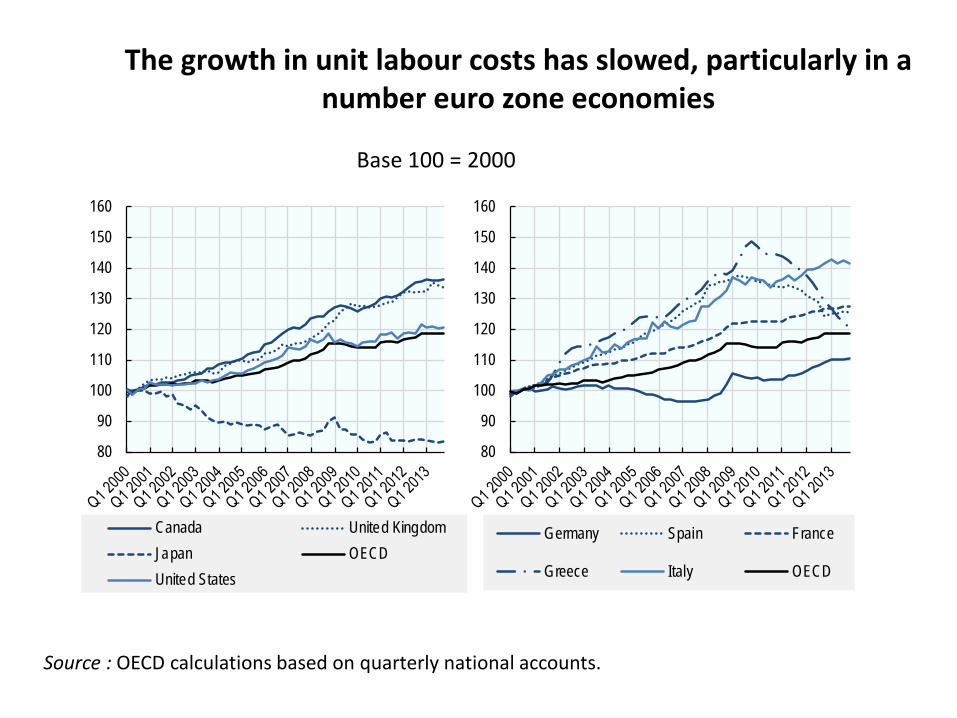
The growth in unit labour costs has slowed, particularly in a number euro zone economies
Base 100 = 2000
Source : OECD calculations based on quarterly national accounts.
80
90
100
110
120
130
140
150
160
Canada United KingdomJapan OECDUnited States
80
90
100
110
120
130
140
150
160
Germany Spain France
Greece Italy OECD
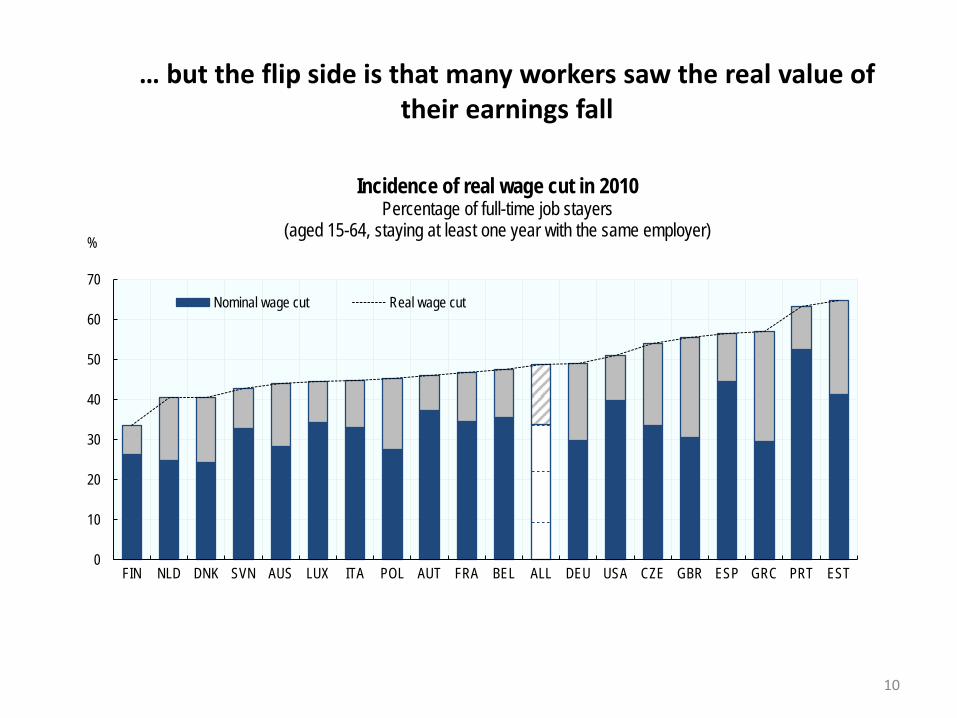
… but the flip side is that many workers saw the real value of their earnings fall
10
0
10
20
30
40
50
60
70
FIN NLD DNK SVN AUS LUX ITA POL AUT FRA BEL ALL DEU USA CZE GBR ESP GRC PRT EST
%
Incidence of real wage cut in 2010 Percentage of full-time job stayers
(aged 15-64, staying at least one year with the same employer)
Nominal wage cut Real wage cut
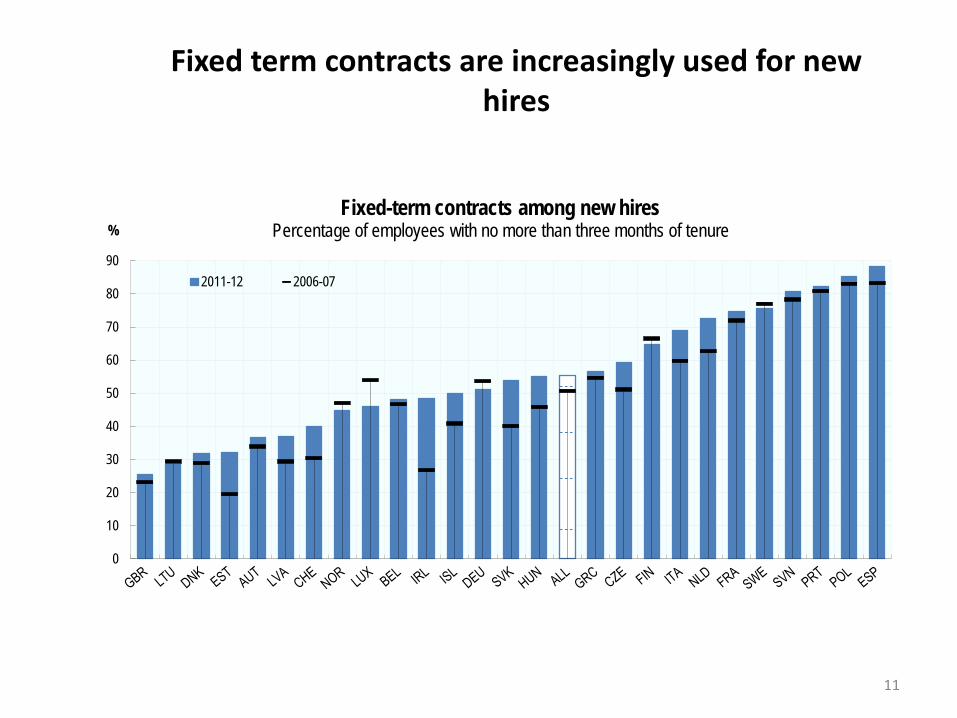
Fixed term contracts are increasingly used for new hires
11
0
10
20
30
40
50
60
70
80
90
% Fixed-term contracts among new hires
Percentage of employees with no more than three months of tenure
2011-12 2006-07
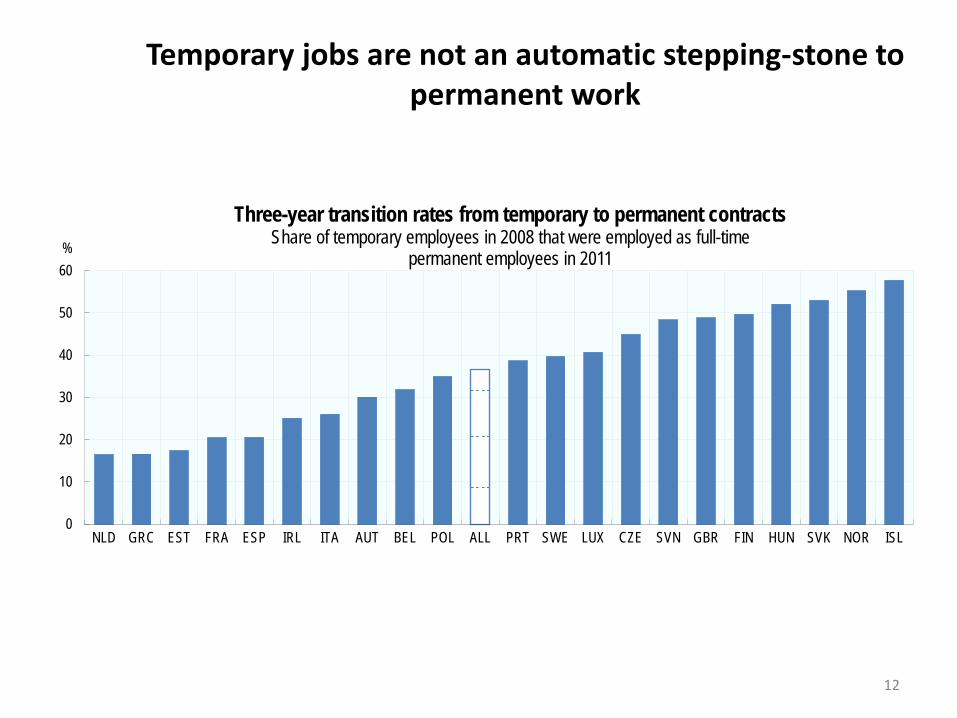
Temporary jobs are not an automatic stepping-stone to permanent work
12
0
10
20
30
40
50
60
NLD GRC EST FRA ESP IRL ITA AUT BEL POL ALL PRT SWE LUX CZE SVN GBR FIN HUN SVK NOR ISL
%
Three-year transition rates from temporary to permanent contracts Share of temporary employees in 2008 that were employed as full-time
permanent employees in 2011
Gaps in employment protection between permanent and temporary workers should be reduced…
• When these gaps are excessive, the job losses in a downturn are greater, especially for temporary workers. They also reinforce labour market segmentation and undermine employment prospects for temporary workers
• Reducing these gaps could be done by: ─ Lowering the level of protection for permanent contracts (which could raise labour
churning) or raising protection for temporary contracts (which would reduce labour adjustment)
─ Or by introducing a single or unified contract. But these options involves overcoming implementation difficulties, especially where employment protection of permanent contracts is very strict
• Reducing labour market segmentation also requires complementary reforms to be effective
13
Both more jobs and better jobs are needed
Job quality embraces a range of aspects that matter for well-being:
• Earnings quality: level and distribution of earnings
• Labour market security: risk and consequence of job loss in terms of lost income
• Quality of the working environment: extent to which workers have the resources they need to meet the demands of their jobs
14
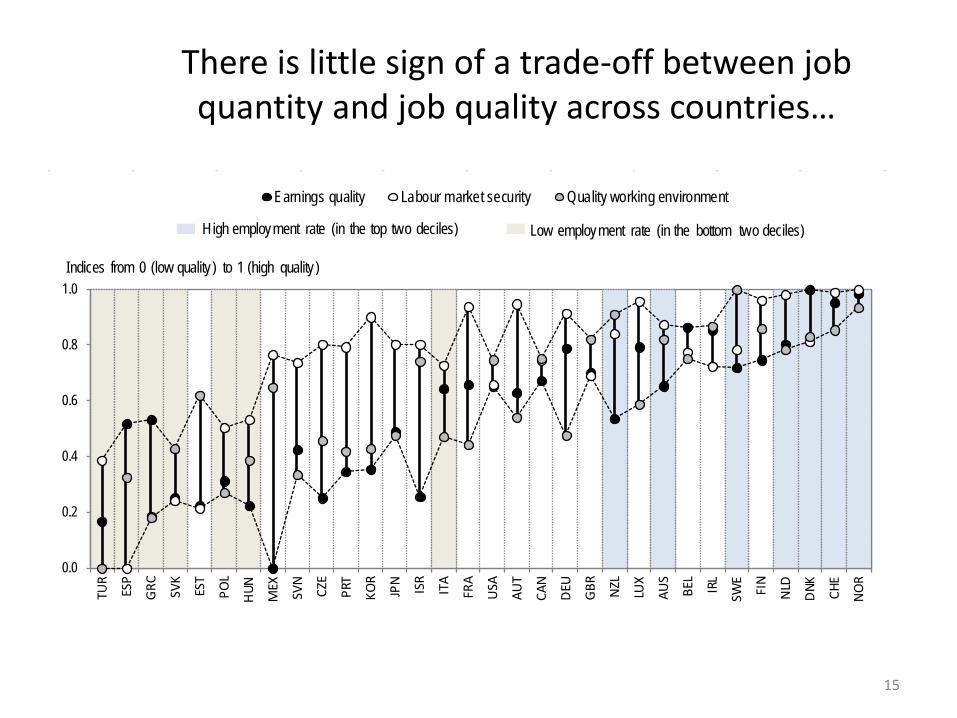
There is little sign of a trade-off between job quantity and job quality across countries…
15
0.0
0.2
0.4
0.6
0.8
1.0
TUR
ESP
GRC SV
K
EST
POL
HUN MEX
SVN
CZE
PRT
KOR
JPN ISR
ITA
FRA
USA
AUT
CAN
DEU GBR NZL
LUX
AUS
BEL
IRL
SWE
FIN
NLD
DNK CH
E
NO
R
Indices from 0 (low quality ) to 1 (high quality )
Earnings quality Labour market security Quality working environment
High employment rate (in the top two deciles) Low employment rate (in the bottom two deciles)
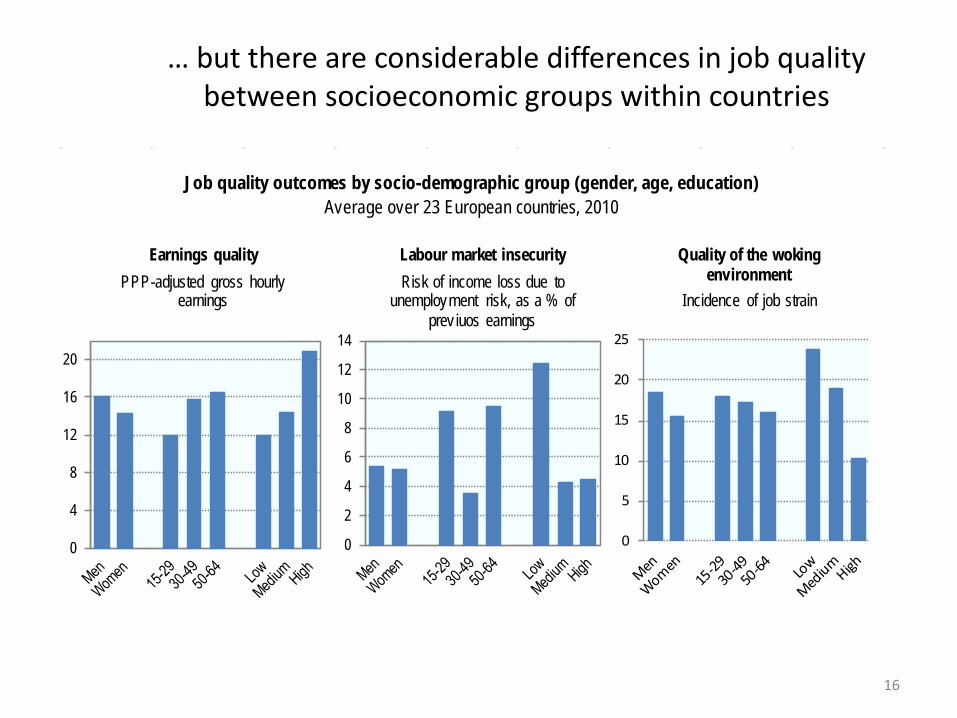
… but there are considerable differences in job quality between socioeconomic groups within countries
16
Job quality outcomes by socio-demographic group (gender, age, education)Average over 23 European countries, 2010
0
4
8
12
16
20
Earnings qualityPPP-adjusted gross hourly
earnings
0
2
4
6
8
10
12
14
Labour market insecurityRisk of income loss due to
unemployment risk, as a % of prev iuos earnings
0
5
10
15
20
25
Quality of the woking environment
Incidence of job strain
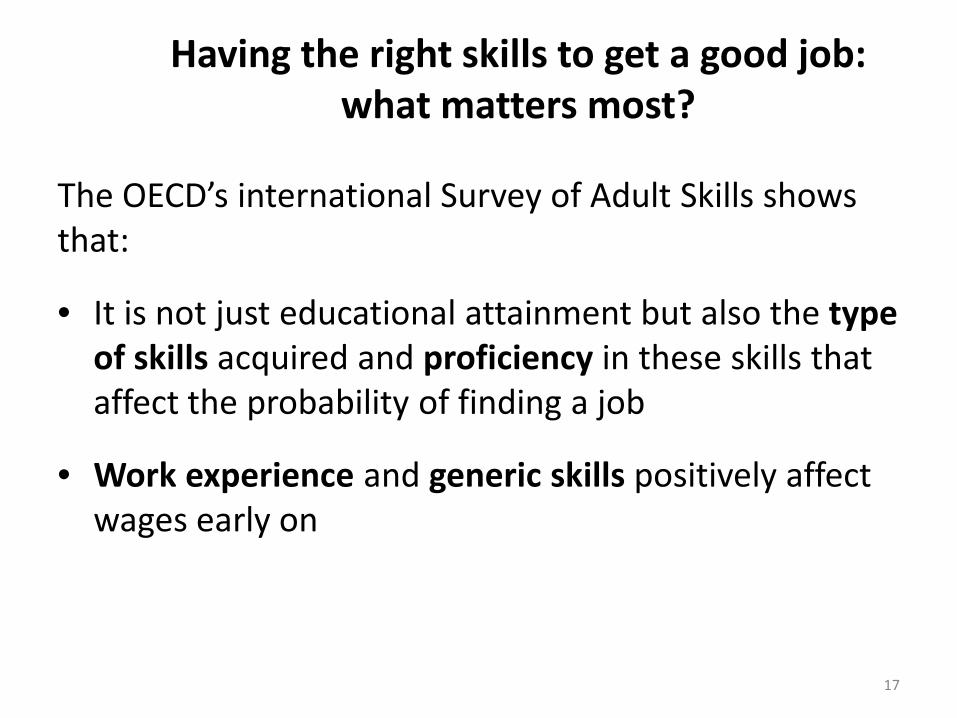
Having the right skills to get a good job: what matters most?
The OECD’s international Survey of Adult Skills shows that:
• It is not just educational attainment but also the type of skills acquired and proficiency in these skills that affect the probability of finding a job
• Work experience and generic skills positively affect wages early on
17
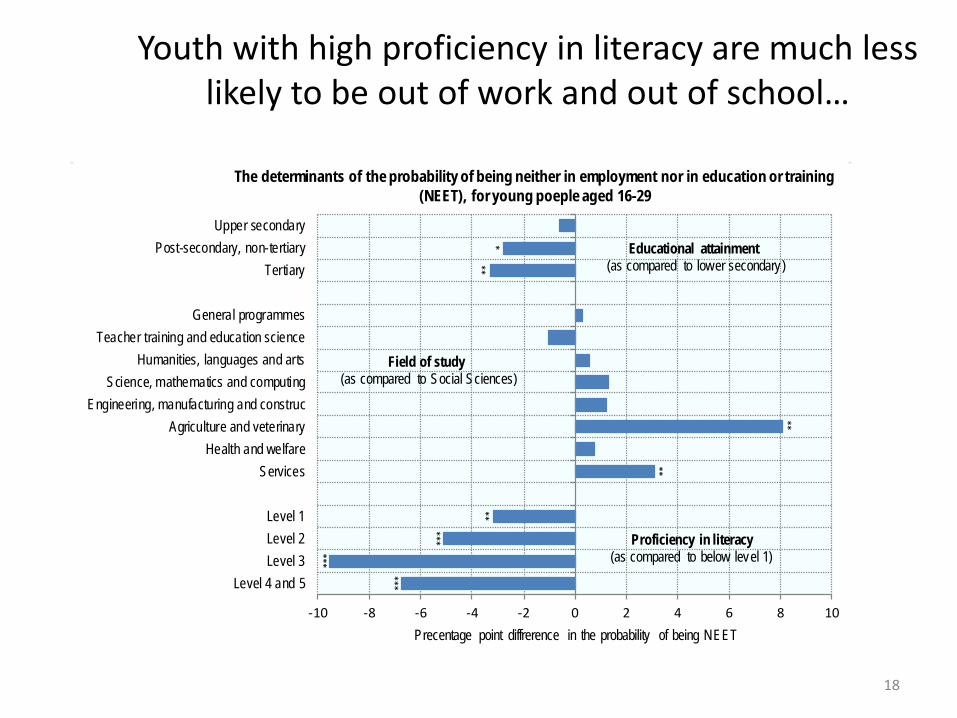
Youth with high proficiency in literacy are much less likely to be out of work and out of school…
18
***
***
***
**
**
**
***
-10 -8 -6 -4 -2 0 2 4 6 8 10
Level 4 and 5Level 3Level 2Level 1
ServicesHealth and welfare
Agriculture and veterinaryEngineering, manufacturing and construc
Science, mathematics and computingHumanities, languages and arts
Teacher training and education scienceGeneral programmes
TertiaryPost-secondary, non-tertiary
Upper secondary
Precentage point diffrerence in the probability of being NEET
The determinants of the probability of being neither in employment nor in education or training (NEET), for young poeple aged 16-29
Proficiency in literacy(as compared to below level 1)
Field of study(as compared to Social Sciences)
Educational attainment(as compared to lower secondary)
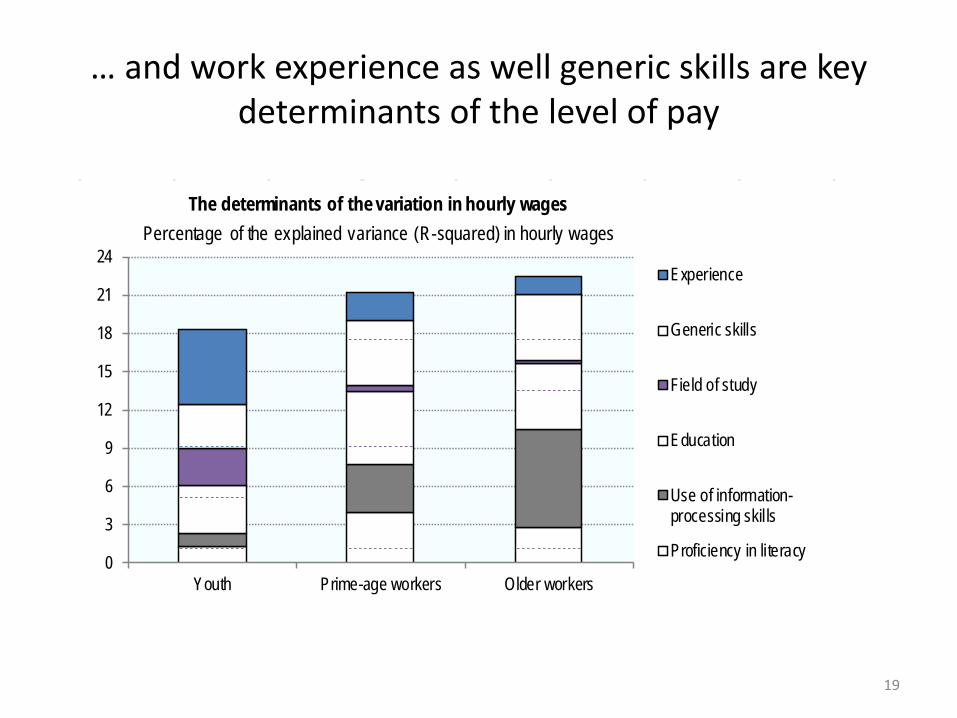
… and work experience as well generic skills are key determinants of the level of pay
19
0
3
6
9
12
15
18
21
24
Youth Prime-age workers Older workers
The determinants of the variation in hourly wagesPercentage of the explained variance (R-squared) in hourly wages
Experience
Generic skills
Field of study
Education
Use of information-processing skil ls
Proficiency in li teracy
Thank you
Read more about our work
Website: www.oecd.org/employment/outlook Follow us on Twitter : @OECD_Social
Related Documents