36 CENTER CITY DISTRICT & CENTRAL PHILADELPHIA DEVELOPMENT CORPORATION | CENTERCITYPHILA.ORG Philadelphia is enjoying the longest period of expansion since the Federal Bureau of Labor Statistics started keeping track in 1969, adding 40,000 jobs in the last 11 years with positive growth in all but one year since 2005. In 2016, Philadelphia’s employ- ment grew by 2.4%, adding 16,000 jobs and outpacing the region and the nation as a whole. Growth has been driven entirely by private-sector gains, with public-sector employment continuing a 25-year trend of contraction. However, this follows a long period where Philadelphia steadily lost jobs and recently has seen a comparatively modest recovery. As the Great Recession came to an end, large cities outper- formed the overall economy between 2010 and 2015. Nationally, while private-sector jobs grew annually at 2.1%, the 25 most populous cities grew at 2.8% per year. Philadelphia lagged at 1.1% per year. To be sure, the national urban average is pulled up by Sun Belt cities like Austin, San Francisco, and San Jose. But Detroit and Memphis have outperformed Philadelphia recently, as did major Northeast corridor cities — Boston, New York, Washington, D.C. and Baltimore. Recent local news is very positive, but limited to a few areas within the city. Center City accounts for 42% of all Philadelphia jobs; anoth- er 11% are concentrated in University City. Center City holds 292,746 wage and salaried positions and approximately 8,500 more individuals compensated as partners, self-employed, or working freelance. Located at the center of the region’s tran- sit and highway network, 49% of downtown jobs are held by commuters from outside the city; 51% are held by Philadelphia residents. Transit makes possible a level of density and accessi- bility unmatched in the region. Jobs are concentrated at 59 per acre in Center City and at 38 per acre in University City, com- pared to just 4 per acre in the rest of Philadelphia and less than 1 per acre in the suburbs. Density and transit accessibility enable 25% of the workers from city neighborhoods outside of Greater Center City to commute to jobs downtown, while another 6% work in University City. In all of these neighborhoods, more people work downtown than in the area in which they live. This is made possible by the broad range of opportunities downtown. While 38% of Center City jobs require at least a bachelor’s degree, 30% are accessible to those with an associate degree, while another 32% require no more than a high school diploma. EMPLOYMENT Matt Stanley

Welcome message from author
This document is posted to help you gain knowledge. Please leave a comment to let me know what you think about it! Share it to your friends and learn new things together.
Transcript
36 CENTER CITY DISTRICT & CENTRAL PHILADELPHIA DEVELOPMENT CORPORATION | CENTERCITYPHILA.ORG
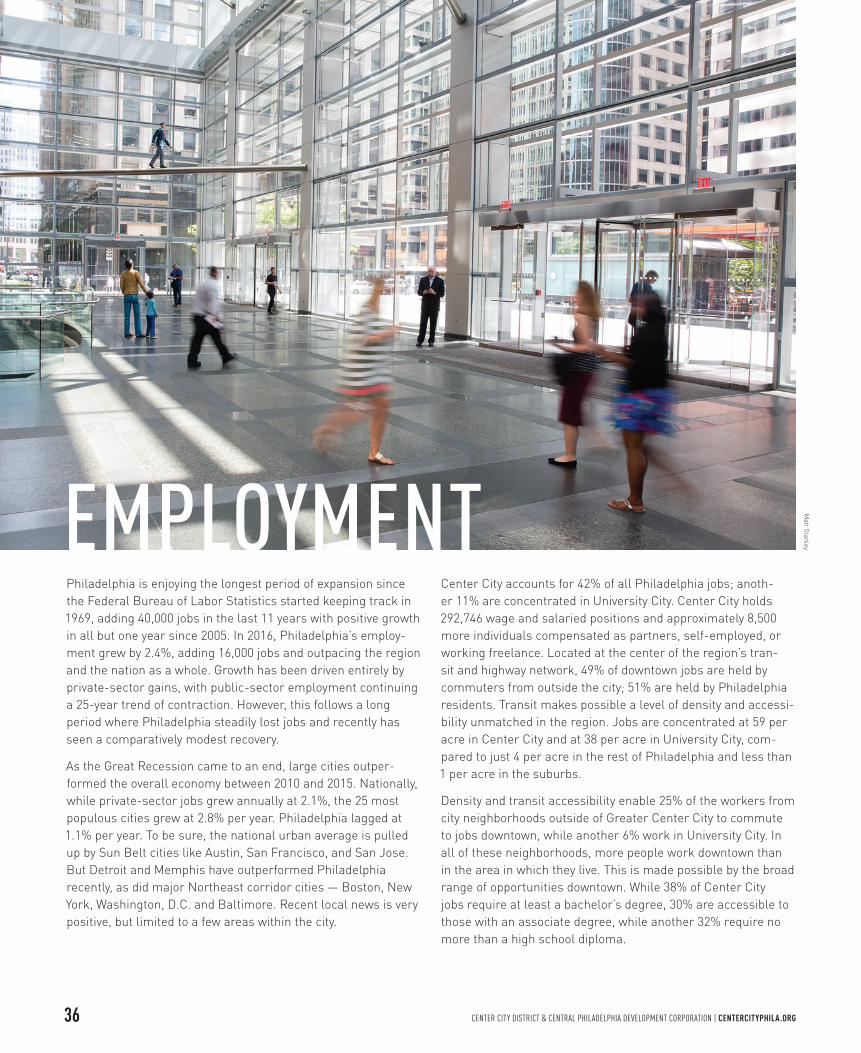
Philadelphia is enjoying the longest period of expansion since the Federal Bureau of Labor Statistics started keeping track in 1969, adding 40,000 jobs in the last 11 years with positive growth in all but one year since 2005. In 2016, Philadelphia’s employ-ment grew by 2.4%, adding 16,000 jobs and outpacing the region and the nation as a whole. Growth has been driven entirely by private-sector gains, with public-sector employment continuing a 25-year trend of contraction. However, this follows a long period where Philadelphia steadily lost jobs and recently has seen a comparatively modest recovery.
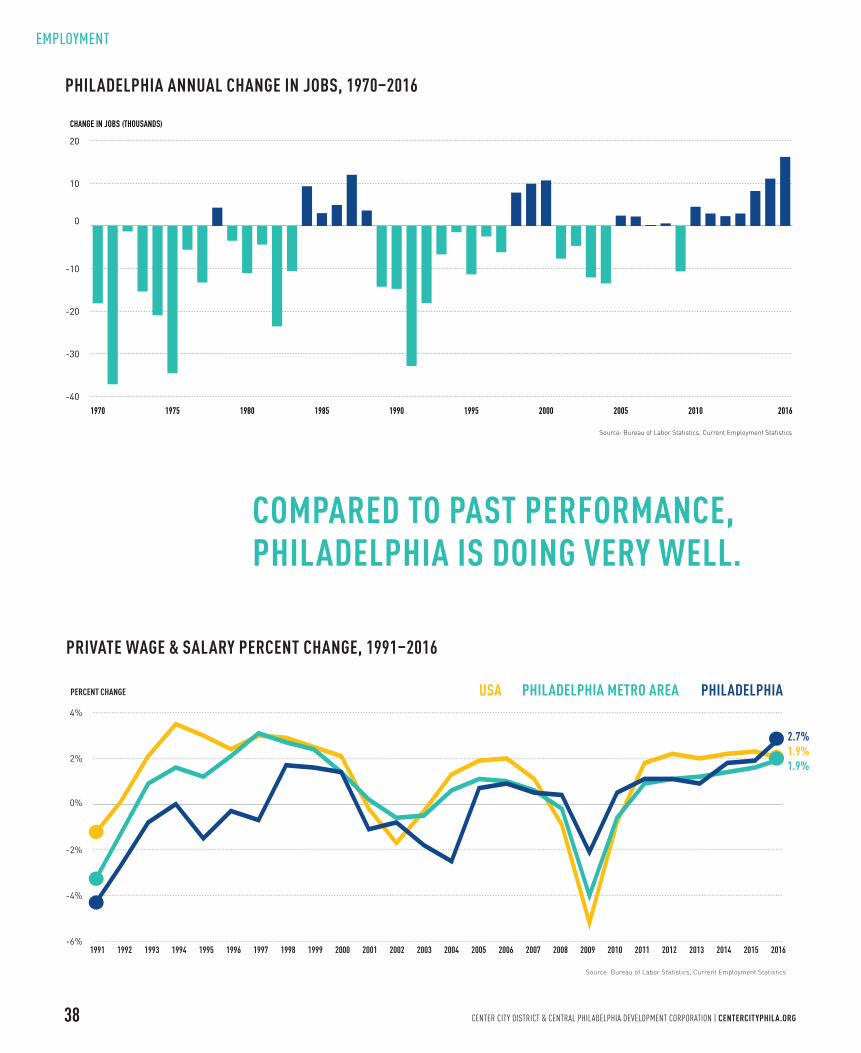
As the Great Recession came to an end, large cities outper-formed the overall economy between 2010 and 2015. Nationally, while private-sector jobs grew annually at 2.1%, the 25 most populous cities grew at 2.8% per year. Philadelphia lagged at 1.1% per year. To be sure, the national urban average is pulled up by Sun Belt cities like Austin, San Francisco, and San Jose. But Detroit and Memphis have outperformed Philadelphia recently, as did major Northeast corridor cities — Boston, New York, Washington, D.C. and Baltimore. Recent local news is very positive, but limited to a few areas within the city.
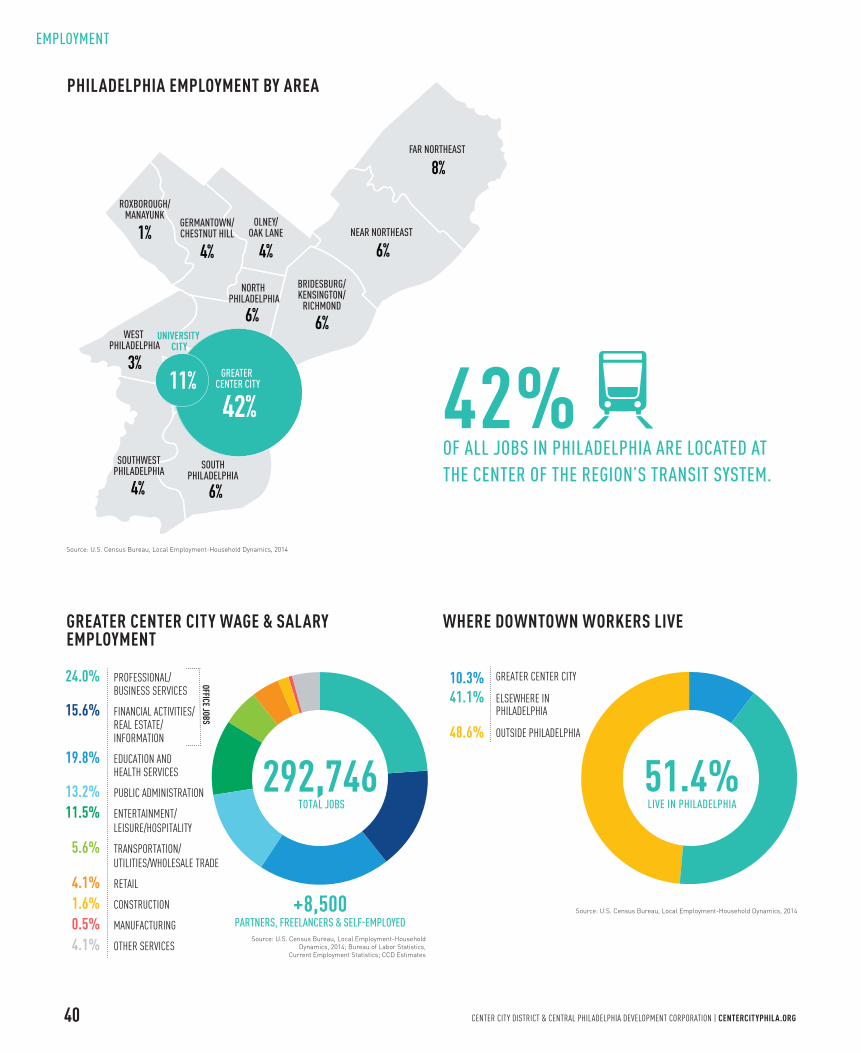
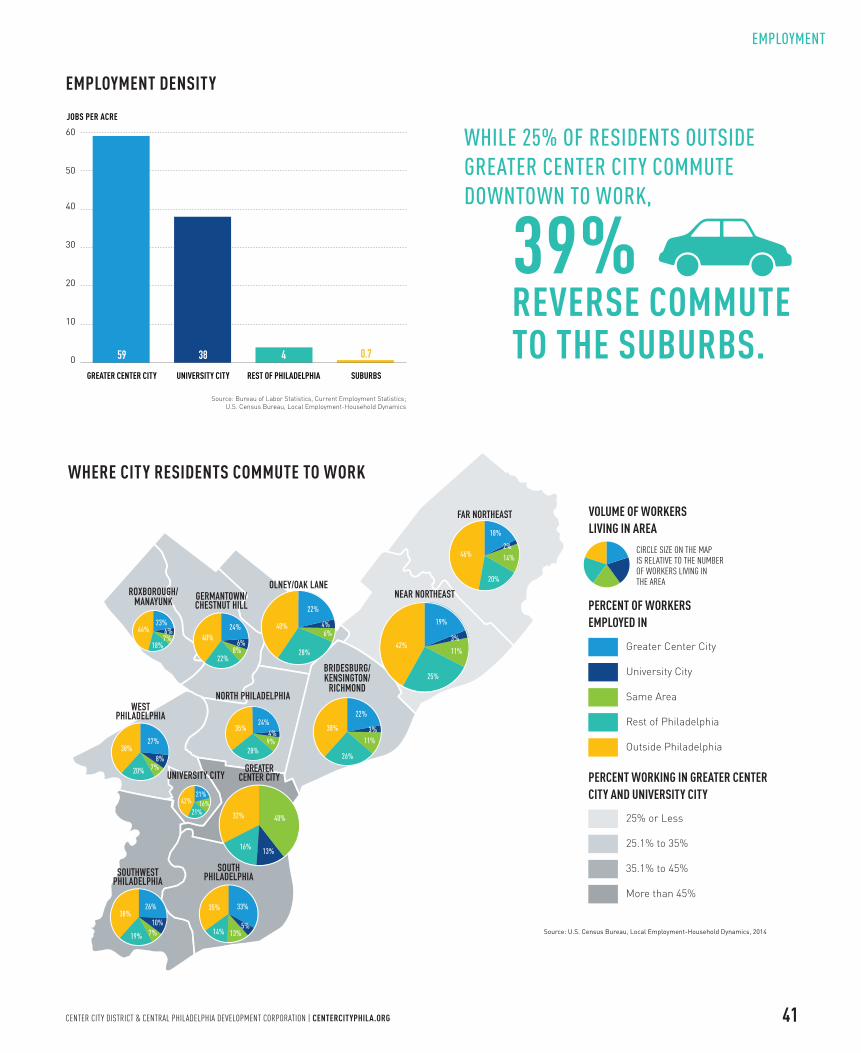
Center City accounts for 42% of all Philadelphia jobs; anoth-er 11% are concentrated in University City. Center City holds 292,746 wage and salaried positions and approximately 8,500 more individuals compensated as partners, self-employed, or working freelance. Located at the center of the region’s tran-sit and highway network, 49% of downtown jobs are held by commuters from outside the city; 51% are held by Philadelphia residents. Transit makes possible a level of density and accessi-bility unmatched in the region. Jobs are concentrated at 59 per acre in Center City and at 38 per acre in University City, com-pared to just 4 per acre in the rest of Philadelphia and less than 1 per acre in the suburbs.
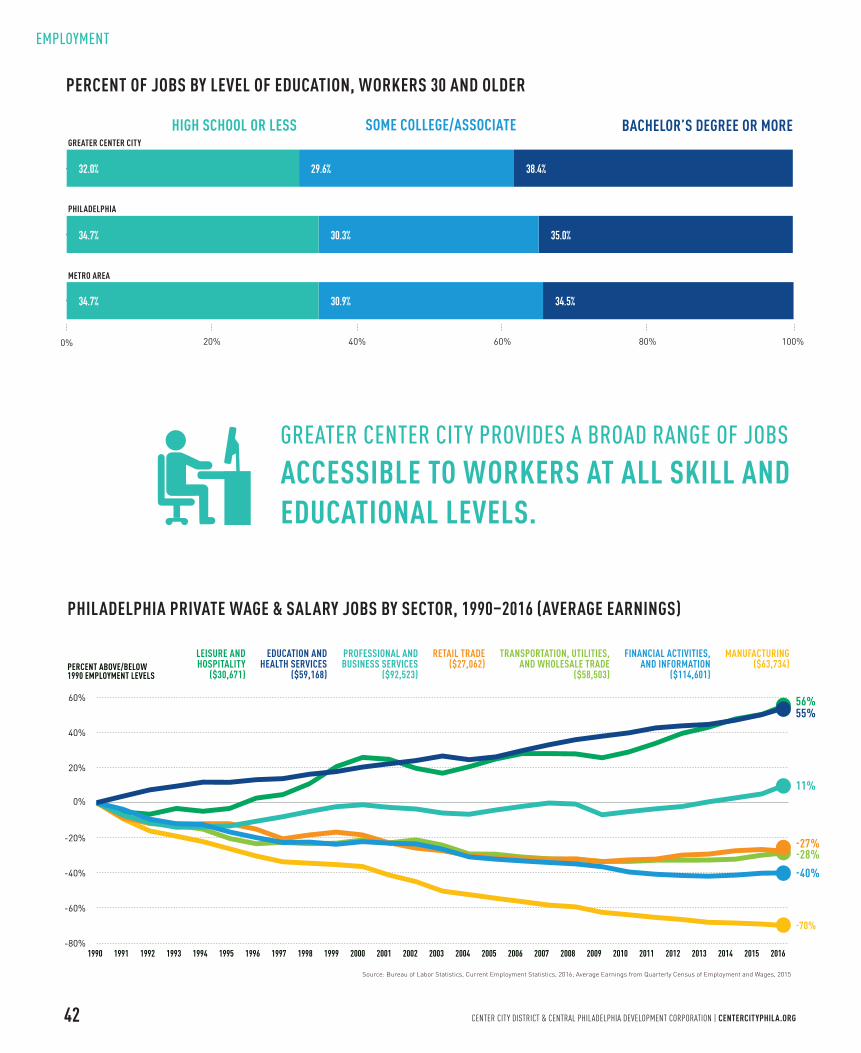
Density and transit accessibility enable 25% of the workers from city neighborhoods outside of Greater Center City to commute to jobs downtown, while another 6% work in University City. In all of these neighborhoods, more people work downtown than in the area in which they live. This is made possible by the broad range of opportunities downtown. While 38% of Center City jobs require at least a bachelor’s degree, 30% are accessible to those with an associate degree, while another 32% require no more than a high school diploma.
EMPLOYMENT Matt Stanley

37CENTER CITY DISTRICT & CENTRAL PHILADELPHIA DEVELOPMENT CORPORATION | CENTERCITYPHILA.ORG
Diversification is a defining strength of the downtown economy. Professional, business and financial services, real estate and information — the prime office-using industries — comprise 40% of downtown jobs. Education and health services, the largest sector citywide, is second largest downtown, with 20% of all jobs. Entertainment, leisure, hospitality and retail hold a 16% share, while federal, state and local government employ-ment provides 13% of all Center City jobs.
But job growth in Philadelphia has been uneven. Leisure and hospitality employment is up 56% since 1990; education and health services have grown by 55%; professional and business services are now 11% above 1990 job levels. Manufacturing, however, has continued its historic contraction, shedding 70% of its remaining jobs since 1990. More troubling, jobs in finance and information services — prime growth sectors for most 21st century cities and the city’s highest paying jobs — are down 40% citywide since 1990. Overall, between 1990 and 2016, the percent of regional jobs located in Philadelphia contracted from 30% to 24%.
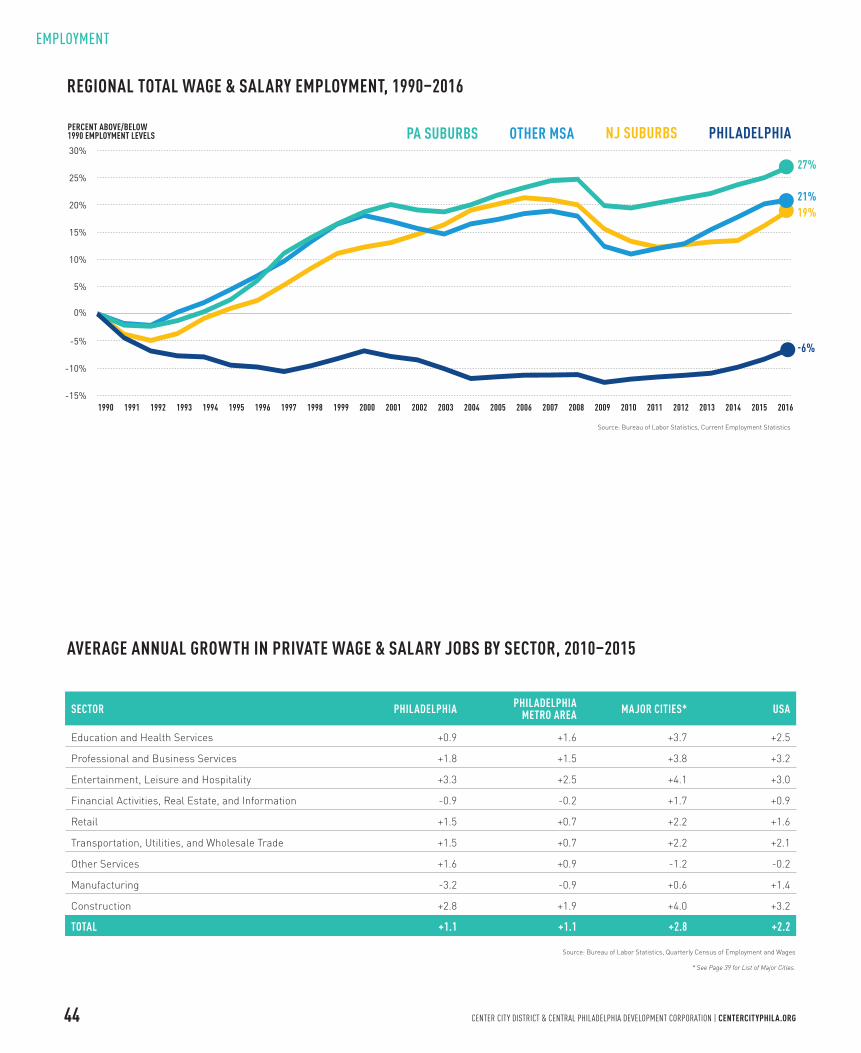
Between 2010 and 2015, professional and business services employment was up 1.8% per annum in Philadelphia, surpass-ing the regional figure of 1.5%, but well below both the national rate of 3.2% and the 3.8% per year growth rate in the 25 largest cities. In Philadelphia’s largest employment sector — Education and Health services — the annual growth rate of 0.9% lags the region (1.6%), the nation (2.5%) and the 25 largest cities (3.7%). Our fastest growing sector has been Entertainment, Leisure, and Hospitality, expanding by 3.3% per year, but lower than the trends in other large cities. This sector provides valuable entry-level jobs for residents. But they are the by-product of a growing downtown population and increased visitation, not prime drivers of other jobs.
A comparison of Philadelphia with East Coast peers tells the broader story of incomplete revival. Other northeast cities that hemorrhaged manufacturing employment rebounded more
strongly with post-industrial growth. Using 1970 as the baseline, New York’s total employment is up 12%, Boston’s is up 21% and Washington, D.C.’s is up 24%. By contrast, Philadelphia has 25% fewer jobs than it did in 1970 and is still 6% below 1990 levels.
This is a prime reason why 39% of working residents from each Council District are reverse commuting to the suburbs. Educa-tion levels required for jobs in the suburbs are not significantly different than those in the city. The suburbs simply have more jobs and have continued to add them faster. Philadelphia still has 6% fewer jobs than in 1990, while the suburbs are up 24%. Without more dynamic growth of transit-accessible jobs in the city, we stand little chance of achieving major reductions in un-employment and poverty and older neighborhoods will continue to see residents moving out to be closer to their jobs.
Philadelphia’s growth has been constrained by a tax structure that hasn’t kept pace with the changing economy. Reliance on wage and business taxes may have made sense in the industrial age, built on fixed assets like factories and railroads. But in to-day’s highly mobile, digital economy, our tax structure depress-es job growth at the very moment the city’s inherent advantages have come to the fore.
Mayor Jim Kenney has supported modest reductions to wage and business taxes. But state legislation endorsed by the Mayor and sponsored by bi-partisan leadership in Harrisburg and a broad cross-section of business, labor and civic leaders in Philadelphia will enable the City to reduce more significantly its dependency on highly mobile wages and business revenues and rely more on the property tax — also the foundation for funding schools. With this plan in place, Philadelphia could grow many more transit-accessible jobs, helping to achieve major reduc-tions in unemployment and poverty, while retaining a far larger number of existing residents and recent college graduates.
RECENT JOB GROWTH IN PHILADELPHIA HAS BEEN QUITE POSITIVE. BUT OUR RATE OF REBOUND FROM MANUFACTURING DECLINE LAGS BEHIND EAST COAST PEERS. THE MORE TRANSIT-ACCESSIBLE JOBS THE CITY CREATES, THE MORE OPPORTUNITIES ARE PROVIDED FOR EXISTING RESIDENTS AND FOR LOCAL COLLEGE GRADUATES FROM OTHER REGIONS.
EMPLOYMENT
38 CENTER CITY DISTRICT & CENTRAL PHILADELPHIA DEVELOPMENT CORPORATION | CENTERCITYPHILA.ORG
-40
-30
-20
-10
0
10
20
2016201020052000199519901985198019751970
CHANGE IN JOBS (THOUSANDS)
Source: Bureau of Labor Statistics, Current Employment Statistics
PHILADELPHIA ANNUAL CHANGE IN JOBS, 1970–2016
PRIVATE WAGE & SALARY PERCENT CHANGE, 1991–2016
PHILADELPHIAUSA PHILADELPHIA METRO AREA
-6%
-4%
-2%
0%
2%
4%
20162015201420132012201120102009200820072006200520042003200220012000199919981997199619951994199319921991
1.9%2.7%
1.9%
Source: Bureau of Labor Statistics, Current Employment Statistics
PERCENT CHANGE
COMPARED TO PAST PERFORMANCE, PHILADELPHIA IS DOING VERY WELL.
EMPLOYMENT
39CENTER CITY DISTRICT & CENTRAL PHILADELPHIA DEVELOPMENT CORPORATION | CENTERCITYPHILA.ORG
PHILADELPHIA
PHILADELPHIA METRO
MEMPHIS
BALTIMORE
INDIANAPOLIS
CHICAGO
DETROIT
JACKSONVILLE
NATIONAL AVERAGE
LOS ANGELES
EL PASO
WASHINGTON, D.C.
SAN DIEGO
BOSTON
COLUMBUS
FORT WORTH
CITIES AVERAGE
DALLAS
SEATTLE
PHOENIX
SAN ANTONIO
NEW YORK CITY
HOUSTON
DENVER
NASHVILLE
CHARLOTTE
SAN JOSE
SAN FRANCISCO
AUSTIN
AVERAGE ANNUAL GROWTH RATE
Source: Bureau of Labor Statistics, Quarterly Census of Employment and Wages
5.2%5.1%
4.2%3.8%
3.4%3.3%3.3%
3.1%
3.0%3.0%3.0%3.0%
2.6%2.6%2.6%
2.5%2.4%
2.3%
2.2%2.0%
1.8%1.6%1.6%
1.2%
1.1%1.1%
2.8%2.8%
2.2%
MAJOR CITIES: AVERAGE ANNUAL GROWTH IN PRIVATE WAGE & SALARY JOBS, 2010–2015
THE NATIONAL ECONOMIC REVIVAL HAS BEEN LED BY CITIES, BUT PHILADELPHIA IS GROWING SLOWEST AMONG THE 26 LARGEST CITIES.
EMPLOYMENT
40 CENTER CITY DISTRICT & CENTRAL PHILADELPHIA DEVELOPMENT CORPORATION | CENTERCITYPHILA.ORG
WHERE DOWNTOWN WORKERS LIVE
Source: U.S. Census Bureau, Local Employment-Household Dynamics, 2014
51.4%LIVE IN PHILADELPHIA
GREATER CENTER CITY
ELSEWHERE IN PHILADELPHIA
OUTSIDE PHILADELPHIA
10.3%41.1%
48.6%
GREATER CENTER CITY WAGE & SALARY EMPLOYMENT
Source: U.S. Census Bureau, Local Employment-HouseholdDynamics, 2014; Bureau of Labor Statistics,
Current Employment Statistics; CCD Estimates
292,746TOTAL JOBS
+8,500PARTNERS, FREELANCERS & SELF-EMPLOYED
OFFICE JOBS
24.0% PROFESSIONAL/ BUSINESS SERVICES
15.6% FINANCIAL ACTIVITIES/ REAL ESTATE/ INFORMATION
19.8% EDUCATION AND HEALTH SERVICES
13.2% PUBLIC ADMINISTRATION
11.5% ENTERTAINMENT/ LEISURE/HOSPITALITY
5.6% TRANSPORTATION/ UTILITIES/WHOLESALE TRADE
4.1% RETAIL
1.6% CONSTRUCTION
0.5% MANUFACTURING
4.1% OTHER SERVICES
42% OF ALL JOBS IN PHILADELPHIA ARE LOCATED AT THE CENTER OF THE REGION’S TRANSIT SYSTEM.
PHILADELPHIA EMPLOYMENT BY AREA
ROXBOROUGH/MANAYUNK
GERMANTOWN/CHESTNUT HILL
OLNEY/OAK LANE NEAR NORTHEAST
BRIDESBURG/KENSINGTON/
RICHMOND
SOUTHPHILADELPHIA
SOUTHWESTPHILADELPHIA
WEST PHILADELPHIA
NORTH PHILADELPHIA
FAR NORTHEAST
GREATER CENTER CITY
6%4%
6%
8%
4%
6%
3%
1%4% 6%
42%
UNIVERSITY CITY
11%
EMPLOYMENT
Source: U.S. Census Bureau, Local Employment-Household Dynamics, 2014
41CENTER CITY DISTRICT & CENTRAL PHILADELPHIA DEVELOPMENT CORPORATION | CENTERCITYPHILA.ORG
PERCENT OF WORKERSEMPLOYED IN
PERCENT WORKING IN GREATER CENTER CITY AND UNIVERSITY CITY
25% or Less
25.1% to 35%
35.1% to 45%
More than 45%
University City
CIRCLE SIZE ON THE MAP IS RELATIVE TO THE NUMBER OF WORKERS LIVING IN THE AREA
Greater Center City
Same Area
Rest of Philadelphia
Outside Philadelphia
ROXBOROUGH/MANAYUNK GERMANTOWN/
CHESTNUT HILL
OLNEY/OAK LANENEAR NORTHEAST
BRIDESBURG/KENSINGTON/
RICHMOND
UNIVERSITY CITY
SOUTHPHILADELPHIASOUTHWEST
PHILADELPHIA
WESTPHILADELPHIA
NORTH PHILADELPHIA
GREATERCENTER CITY
FAR NORTHEAST
Source: U.S. Census Bureau, Local Employment-Household Dynamics, 2014
VOLUME OF WORKERS LIVING IN AREA
32%
26%38%
19% 7%10%
22%
3%
19%
22%
24%40%
22%8%6%
23%46%
18%7%6%
4%6%
28%
40%
18%
14%2%
20%
46%
42%11%
25%
3%
11%
26%
21%16%42%
21%
38%
13%16%
40%
33%
24%35%
4%27%
8%7%20%
38% 28%9%
5%13%14%
35%
WHERE CITY RESIDENTS COMMUTE TO WORK
EMPLOYMENT DENSITY
0
10
20
30
40
50
60
59 38 4 0.7
GREATER CENTER CITY UNIVERSITY CITY REST OF PHILADELPHIA SUBURBS
Source: Bureau of Labor Statistics, Current Employment Statistics;U.S. Census Bureau, Local Employment-Household Dynamics
JOBS PER ACRE
WHILE 25% OF RESIDENTS OUTSIDE GREATER CENTER CITY COMMUTE DOWNTOWN TO WORK,
39% REVERSE COMMUTE TO THE SUBURBS.
EMPLOYMENT
42 CENTER CITY DISTRICT & CENTRAL PHILADELPHIA DEVELOPMENT CORPORATION | CENTERCITYPHILA.ORG
GREATER CENTER CITY PROVIDES A BROAD RANGE OF JOBS
ACCESSIBLE TO WORKERS AT ALL SKILL AND EDUCATIONAL LEVELS.
PERCENT OF JOBS BY LEVEL OF EDUCATION, WORKERS 30 AND OLDER
GREATER CENTER CITY
PHILADELPHIA
METRO AREA
0% 20% 40% 60% 80% 100%
34.7% 30.9% 34.5%
35.0%30.3%34.7%
38.4%29.6%32.0%
Source: U.S. Census Bureau, Local Employment-Household Dynamics, 2014
HIGH SCHOOL OR LESS SOME COLLEGE/ASSOCIATE BACHELOR’S DEGREE OR MORE
PHILADELPHIA PRIVATE WAGE & SALARY JOBS BY SECTOR, 1990–2016 (AVERAGE EARNINGS)
Source: Bureau of Labor Statistics, Current Employment Statistics, 2016; Average Earnings from Quarterly Census of Employment and Wages, 2015
PERCENT ABOVE/BELOW1990 EMPLOYMENT LEVELS
-80%
-60%
-40%
-20%
0%
20%
40%
60%
201620152014201320122011201020092008200720062005200420032002200120001999199819971996199519941993199219911990
-40%
-28%-27%
11%
-70%
56%
LEISURE ANDHOSPITALITY
($30,671)
EDUCATION ANDHEALTH SERVICES
($59,168)
MANUFACTURING($63,734)
RETAIL TRADE($27,062)
TRANSPORTATION, UTILITIES,AND WHOLESALE TRADE
($58,503)
PROFESSIONAL ANDBUSINESS SERVICES
($92,523)
FINANCIAL ACTIVITIES,AND INFORMATION
($114,601)
55%
EMPLOYMENT

43CENTER CITY DISTRICT & CENTRAL PHILADELPHIA DEVELOPMENT CORPORATION | CENTERCITYPHILA.ORG
BOSTONWASHINGTON, D.C. PHILADELPHIANEW YORK CITY DETROITPERCENT ABOVE/BELOW1970 EMPLOYMENT LEVELS
-25%
12%
24%21%
-32%
Source: Bureau of Economic Analysis, Total Full & Part-Time Employment by Industry
-40%
-30%
-20%
-10%
0%
10%
20%
30%
2016201020052000199519901985198019751970
MAJOR CITIES TOTAL WAGE & SALARY EMPLOYMENT, 1970–2016
PHILADELPHIA AND METRO AREA JOB COUNTS BY SECTOR, 2016
PHILADELPHIA (PERCENT OF REGIONAL JOBS)
Source: Bureau of Labor Statistics, Current Employment Statistics
0 100 200 300 400 500 600
METRO AREA OUTSIDE PHILADELPHIA
EDUCATION & HEALTH SERVICES
JOBS (THOUSANDS)
OFFICE
OTHER SERVICES
LEISURE AND HOSPITALITY
RETAIL TRADE
TRANSPORTATION, UTILITIES,AND WHOLESALE TRADE
MANUFACTURING
NATURAL RESOURCES & MINING
398223.9 (36%)
569149.8 (21%)
93 (18%)430.2
70.8 (27%)188.4
49.8 (17%)251
91.4 27.8 (23%)
20.4 (11%) 158.2
101.612 (11%)
PHILADELPHIA’S LARGEST MARKET SHARE OF REGIONAL JOBS: EDUCATION AND HEALTH SERVICES, LEISURE AND HOSPITALITY.
EMPLOYMENT
44 CENTER CITY DISTRICT & CENTRAL PHILADELPHIA DEVELOPMENT CORPORATION | CENTERCITYPHILA.ORG
SECTOR PHILADELPHIA PHILADELPHIA METRO AREA MAJOR CITIES* USA
Education and Health Services +0.9 +1.6 +3.7 +2.5
Professional and Business Services +1.8 +1.5 +3.8 +3.2
Entertainment, Leisure and Hospitality +3.3 +2.5 +4.1 +3.0
Financial Activities, Real Estate, and Information -0.9 -0.2 +1.7 +0.9
Retail +1.5 +0.7 +2.2 +1.6
Transportation, Utilities, and Wholesale Trade +1.5 +0.7 +2.2 +2.1
Other Services +1.6 +0.9 -1.2 -0.2
Manufacturing -3.2 -0.9 +0.6 +1.4
Construction +2.8 +1.9 +4.0 +3.2
TOTAL +1.1 +1.1 +2.8 +2.2
AVERAGE ANNUAL GROWTH IN PRIVATE WAGE & SALARY JOBS BY SECTOR, 2010–2015
Source: Bureau of Labor Statistics, Quarterly Census of Employment and Wages
* See Page 39 for List of Major Cities.
REGIONAL TOTAL WAGE & SALARY EMPLOYMENT, 1990–2016
PA SUBURBS OTHER MSA PHILADELPHIANJ SUBURBS
-15%
-10%
-5%
0%
5%
10%
15%
20%
25%
30%
-6%
19%
27%
21%
Source: Bureau of Labor Statistics, Current Employment Statistics
PERCENT ABOVE/BELOW1990 EMPLOYMENT LEVELS
201620152014201320122011201020092008200720062005200420032002200120001999199819971996199519941993199219911990
EMPLOYMENT
45CENTER CITY DISTRICT & CENTRAL PHILADELPHIA DEVELOPMENT CORPORATION | CENTERCITYPHILA.ORG
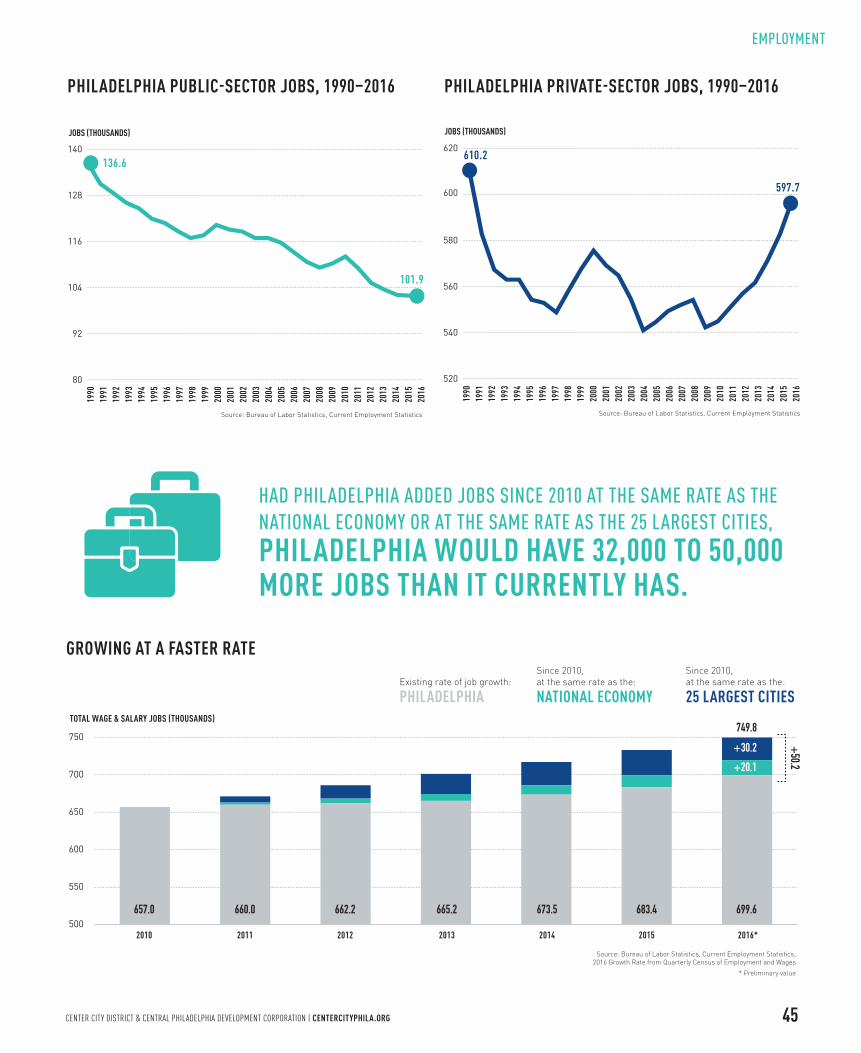
PHILADELPHIA PRIVATE-SECTOR JOBS, 1990–2016
520
540
560
580
600
620610.2
597.7
Source: Bureau of Labor Statistics, Current Employment Statistics
JOBS (THOUSANDS)
2016
2015
2014
2013
2012
2011
2010
2009
2008
2007
2006
2005
2004
2003
2002
2001
2000
1999
1998
1997
1996
1995
1994
1993
1992
1991
1990
PHILADELPHIA PUBLIC-SECTOR JOBS, 1990–2016
80
92
104
116
128
140
136.6
101.9
2015
2016
2014
2013
2012
2011
2010
2009
2008
2007
2006
2005
2004
2003
2002
2001
2000
1999
1998
1997
1996
1995
1994
1993
1992
1991
1990
Source: Bureau of Labor Statistics, Current Employment Statistics
JOBS (THOUSANDS)
GROWING AT A FASTER RATE
500
550
600
650
700
750
Since 2010, at the same rate as the:
NATIONAL ECONOMY
Since 2010, at the same rate as the:
25 LARGEST CITIESExisting rate of job growth:
PHILADELPHIA
2010 2011 2012 2013 2014 2015 2016*
TOTAL WAGE & SALARY JOBS (THOUSANDS)
Source: Bureau of Labor Statistics, Current Employment Statistics; 2016 Growth Rate from Quarterly Census of Employment and Wages
* Preliminary value
+30.2
657.0 660.0 662.2 665.2 673.5 683.4 699.6
+20.1
749.8
+50.2
EMPLOYMENT
HAD PHILADELPHIA ADDED JOBS SINCE 2010 AT THE SAME RATE AS THE NATIONAL ECONOMY OR AT THE SAME RATE AS THE 25 LARGEST CITIES,
PHILADELPHIA WOULD HAVE 32,000 TO 50,000 MORE JOBS THAN IT CURRENTLY HAS.
Related Documents