1 THE EFFECT OF SEMANTIC MAPPING STRATEGY ON VOCABULARY MASTERY AT THE GRADE VII SMP N 5 PADANGSIDIMPUAN A THESIS Submitted to the State Institute for Islamic Studies Padangsidimpuanas Partial Fulfillment of the Requirement for the Degree of Education Scholar (S.Pd) in English Program Written by: EMI FITRIYANI Reg. Number. 14 203 00033 ENGLISH EDUCATION DEPARTMENT TARBIYAH AND TEACHERS TRAINING FACULTY STATE INSTITUTE FOR ISLAMIC STUDIES PADANGSIDIMPUAN 2020

Welcome message from author
This document is posted to help you gain knowledge. Please leave a comment to let me know what you think about it! Share it to your friends and learn new things together.
Transcript
1
THE EFFECT OF SEMANTIC MAPPING STRATEGY ON
VOCABULARY MASTERY AT THE GRADE VII
SMP N 5 PADANGSIDIMPUAN
A THESIS
Submitted to the State Institute for Islamic Studies Padangsidimpuanas Partial
Fulfillment of the Requirement for the Degree of Education Scholar (S.Pd)
in English Program
Written by:
EMI FITRIYANI Reg. Number. 14 203 00033
ENGLISH EDUCATION DEPARTMENT
TARBIYAH AND TEACHERS TRAINING FACULTY
STATE INSTITUTE FOR ISLAMIC STUDIES
PADANGSIDIMPUAN
2020
2
3
4
5
6
7
8
Name : Emi Fitriyani
Reg. Number : 14 203 00033
Faculty : Tarbiyah and Teacher Training
Department : English Education (TBI-3)
Title of Thesis: The Effect of Semantic Mapping Strategy on Vocabulary
Mastery at Grade VII SMP Negeri 5 Padangsidimpuan
ABSTRACT
This research focuses on The effect of semantic mapping on vocabulary
mastery at the grade VII SMP N 5 Padangsidimpuan.The problems of this
research are of the students in vocabulary mastery were: 1) Most of the students
still poor vocabulary. 2) Most of the students was lazy for bring dictionary. 3)
they prefer to wait for the teacher to translate the vocabulary. 4)and they also tend
to forget the meaning of the word which have been taught or particed in berief. 5)
students vocabulary mastery does not fulfill. The aim of this research is to know
the effect of semantic mapping strategy on vocabulary mastery at the grade VII
SMP N 5 Padangsidimpuan.
The method that is used in this research is experimental research. Two
classes were chosen randomly as the sample. They were VII-3 as experimental
class that consisted of 25 students and VII-8 as control class that consisted of 25
students. It was taken after conducting normality and homogeneity test. The data
was derived from pre test and post test. To analyze the data, the researcher used t-
test formula.
After analyzing the data, the researcher found that the mean score of
experimental class after semantic mapping strategy was higher than control class.
Mean score of experimental class before using semantic mapping strategy was
61.19 and mean score after using semantic mapping strategy was 76.1 and it had
gain 14.91. The effect of semantic mapping strategy on vocabulary mastery was
2.205 with tcount was higher than ttable (2.205 > 1.67155). It meant that Ha was
accepted and H0 was rejected. There was effect of semantic mapping strategy on
vocabulary mastery at the grade VII SMP Negeri 5 Padangsidimpuan.
Key Words: Semantic Mapping Strategy, Students Vocabulary Mastery
i
9
ACKNOWLEDGEMENT
Praised to Allah Swt, the most creator and merciful who has given me the
healt, time, knowledge and strength to finish the thesis entitles “The Effect of
Semantic Mapping Strategy on Vocabulary Mastery at The Grade VII SMP N 5
Padangsidimpuan”.Besides, peace and greeting be upon to the prophet
Muhammad saw, that has brought the human from the darkness era into the
lightness era.
It is a pleasure to acknowledge the help and constribution to all of lectures,
institution, family and friends who have contributed in defferent ways hence this
thesis is processed until it becomes a complete writing. In the process of finishing
this thesis, I got a lot of guidance and motivation from many people. Especially
from my beloved parents and also my big family who have tought me how to be
patient, praying and survive with my own hand who never be tired to give me the
advise and always support me in any condition. Additionally, in this chance I
would like to express my deepest gratitude to the following people:
1. Mr.Dr. FitriadiLubis,M.Pd., as my first advisor and Mrs.
FitriRayaniSiregar,M.Hum., as my second advisor whoguided me to make a
good thesis, who have been the great advisors for me and gave me many ideas
and criticsms in writing this thesis.
2. Mr. Prof. Dr. H. Ibrahim Siregar, MCL., as the Rector of IAIN
Padangsidimpuan.
v
10
3. Mrs. Dr. Lelya Hilda, M.Si., as the Dean of Tarbiyah and Teacher Training
Faculty.
4. Mrs. Fitri Rayani, M.Hum, as the Chief of English Education Department who
supported me and also all of her students in finishing the thesis and always be
patient in facing our problem and as my lovely Academic Advisor who always
helped and supported me till finishing this thesis.
5. All lecturers and all the academic cavities of IAIN Padangsidimpuan who have
given so much knowledge and helped during I studied in this institute.
6. IAIN Padangsidimpuan Librarion (Yusri Fahmi, S.Ag, M.Hum and staffs), for
their cooperative and permission to use their books.
7. My beloved parents, Mr.Syaparuddin,and Mrs.Rostini who always give me
motivation, and also praying for me. Also my Little
brotherPuadAdiSaputra,ZulHamdi, Ahmad Ridho, and my Little
sisters,RinaSafitri thanks for giving support and give spirit in writing my
thesis.
8. Mr. Drs. Jamali, S.Pd, as Headmaster of SMP N 1 Padangsidimpuan, and
English teacher Mrs. MarlinaHasibuan,S.Pd., who have helped me in doing my
research.
9. My beloved friends (RahayuSakinahPurba,SitiRembulanTarihoran, Sari
Wulandari Hasibuan, Tania nasution,Risna Sari Rambe,Nur Lela Sari
Pulungan, Leli Soraya Nasution, Siti Fatimah Lubis,) who always support
and give me spirit in writing this thesis. Also for all of my friends, especially

11
TBI-3, thank you so much for happiness, your support and good luck for all of
you.
10. My best friends and sisters kosimoet(Tania, Resviana, RisnaWatiSiregar,
JustikaLubis, SaripaHannumSiregar, Fitri, Minni, Khofifah, Yuli)
11. All people who have helped me to finish my study that I can not mention one
by one thank you thank you for your support, may Allah bless them. Amin.
I realize this thesis cannot be considered perfect without critiques and
suggestions. Therefore, it is such a pleasure for me to get critiques and
suggestions from the readers to make this thesis better.
Padangsidimpuan, November 2020
Researcher
EMI FITRIYANI
Reg. No. 14 203 00033
12
TABLE OF CONTENTS
TITLE PAGE ........................................................................................................... i
LEGALIZATION ADVISORS SHEET ................................................................ ii
AGREEMENT ADVISORS SHEET ..................................................................... iii
DECLARATION OF SELF THESIS COMPLETION ........................................ iv
AGREEMENT PUBLICATION OF FINAL TASK FOR ACADEMIC
CIVITY .................................................................................................................... v
SCHOLAR MUNAQOSYAH EXAMINATION .................................................. vi
LEGALIZATION OF DEAN OF TARBIYAH AND TEACHER
TRAINING FACULTY ........................................................................................... vii
ABSTRACT .............................................................................................................. viii
ACKNOWLEDGEMENT ...................................................................................... ix
TABLE OF CONTENTS ........................................................................................ x
LIST OF TABLES .................................................................................................. xi
LIST OF FIGURES ................................................................................................ xii
LIST OF APPENDIXES.......................................................................................... xiii
CHAPTER I:INTRODUCTION
A. Background of the Problem ................................................................... 1
B. Identification of the Problem.................................................................. 4
C. Limitation of the Problem ...................................................................... 5
D. Formulation of the Problem ................................................................... 5
E. Aim of the Research ............................................................................... 6
G. Significances of the Research ................................................................ 6
H. The syistematic of the thesis .................................................................. 6
CHAPTER II : THEORETICAL REVIEW
A. Theoritical Description .......................................................................... 8
1. Vocabulary .................................................................................... 8
a. Defenitions of Vocabulary ........................................................ 8
b. The Purpose of Vocabulary ..................................................... 10
c. Kind of Vocabulary .................................................................. 12
d. Advantages of Vocabulary....................................................... 14
e. Material of the Vocabulary ...................................................... 15
2. Semantic Mapping Technique ...................................................... 19
a. Defenitions of Semantic Mapping ........................................... 19
b. Kind of Semantic Mapping ...................................................... 20
c. The Purpose of Semantic Mapping .......................................... 23
d. The Advantages of Semantic Mapping .................................... 23
f. Teaching Vocabulary by using Semantic Mapping Strategy ... 25
3. Conventional Strategy .................................................................. 28
a. Defenition of Conventional ...................................................... 28
b. Classification of Conventional Strategy .................................. 28
13
B. Review of Related Findings .................................................................. 29
C. Conceptual Frame Work ....................................................................... 31
D. Hypothesis ............................................................................................. 32
CHAPTER III: RESEARCH METHODOLOGY
A. Place and Time of the Research .......................................................... 33
B. Research Design ................................................................................. 33
C. Population and Sample ....................................................................... 34
D. Defenition of operational variables ..................................................... 36
E. Instrument of Collecting Data ............................................................. 37
F. Validity and Reliability instrument ..................................................... 39
G. Procedures of Collecting Data ........................................................... 41
H. Technique of analyzing Data ............................................................. 43
I. Hypothesis ........................................................................................... 43
CHAPTER IV: THE RESULT OF RESEARCH
A. Description of Data ............................................................................. 45
B. Technique of Data Analysis ................................................................ 60
C. Discussion .......................................................................................... 63
D. Threats of the Research ....................................................................... 65
CHAPTER V: CONCLUSION AND SUGGESTION
A. Conclusions ........................................................................................ 67
B. Suggestions ......................................................................................... 68
REFERENCES
APPENDIXES
CURRICULUM VITAE
14
LIST OF TABLES
Page
Table 1 Teaching Vocabulary by Using Mapping ...................................... 26
Table 2 Pre-test and Post-test Group Design .............................................. 35
Table 3 The Population of the Grade VII Students of SMP N 5
Padangsidimpuan .......................................................................... 36
Table 4 Sample of the Research .................................................................. 37
Table 5 Indicator of Vocabulary Mastery Pre-test ...................................... 39
Table 6 Indicator of Vocabulary Mastery Post-test .................................... 40
Table 7 The Score of Experimental Class in Pre-test ................................. 46
Table 8 Frequncy Distribution of Experimental Class (Pre-test) ................ 47
Table 9 The Score of Control Class in Pre-test ........................................... 49
Table 10 Frequency Distribution of Students Score ................................... 50
Table 11 The Score of Experimental Class in Post-test .............................. 51
Table 12 Frequency Distribution of Students Score ................................... 52
Table 13 The Score of Control Class in Post-test ....................................... 54
Table 14 Frequency Distribution of Students Score ................................... 54
Table 15 The Comparison Data of Experimental Class in Pre-test and
Post-test ...................................................................................... 56
Table 16 The Comparison Data of Control Class in Pre-test and Post-test 58
Table 17 Normality and Homogenity in Pre-test ........................................ 61
Table 18 Normality and Homogenity in Post-tesy ...................................... 62
Table 19 Result of T-test from the Both Averages ..................................... 64
15
LIST OF CHARTS
Page
Chart 1 : Diagram the result score of students vocabulary mastery in
experimental class (Pre-test) ......................................................... 48
Chart 2 : Diagram the result score of students vocabulary mastery in
control class (Pre-test)................................................................... 50
Chart 3 : Histogram the result of students vocabulary mastery in
experimental class (Post test) ........................................................ 53
Chart 4 : Diagram the result score of students vocabulary mastery in
control class (Post=test) ................................................................ 55
Chart 5 : Diagram the comparison data of students vocabulary in
pre-test and post-test (Experimental Class) .................................. 57
Chart 6 : Diagram the comparison data of students vocabulary mastery in
pre-test and post-test (Control Class ............................................. 59
Chart 7 : Diagram the comparison data of students vocabulary mastery in
experimental class and control class (Pre-test) ............................. 60
Chart 8 : Diagram the comparison data of students vocabulary mastery in
experimental and control class (Post-test) .................................... 61
16
LIST OF APPENDIXES
Appendix 1 : Experimental Class by Using Semantic Mapping
Appendix 2 : Control Class By Using Conventional Strategy
Appendix 3 : Validity Instruments For Pre-test
Appendix 4 : Validity Instruments for Post-test
Appendix 5 : Keyword Pre-test and Keyword Post-test
Appendix 6 : Validity of Pre-test
Appendix 7 : Validity of Post-test
Appendix 8 : Calculation of Validity Pre-test
Appendix 9 : Calculation of Validity Post-test
Appendix 10 : Table Validity of test
Appendix 11 : Reability Pre-test
Appendix 12 : Reability Post-test
Appendix 13 : Score of Experimental Class and Control class on Pre-test
Appendix 14 : Result of Normality Test in Pre-test
Appendix 15 : Homogenity Test (Pre-test)
Appendix 16 :Score of Experimental Class and Control Class on Post-test
Appendix 17 : Result of Normality Test in Post-test
Appendix 18 :Homogenity Test (Post-test)
Appendix 19 : T-test of the Both Averages in Pre-test
Appendix 20 : T-test of the Both Averages in Post-test
Appendix 21 : Chi-Square Table
Appendix 22 : Z-Table
Appendix 23 : Percentage Points of the t Distribution
Appendix 24 : Gain Score of Experimental Class and Control Class
Appendix 25 : Documantation of the Research
1
CHAPTER I
INTRODUCTION
A. Background of the Research
English is general of language that used as international language. It is a
tool of communcation among nations. Without English, someone will be old
fashion because they cannot communicate with people arround the the world,
they can not use technology media and they will be lack of information in
science world because many scientific books are written in English.
The position of English in the curriculum 2013, English is important
subject because students of junior high school up to the senior high school
obligated to learn it. It is considered as one of complusory subject in junior
high school up to senior high school level. English is one of subject that must
be based on educational curriculum.
In teaching and learning process, they are many materials of English
teaching. They are listening skill, speaking skiil, reading skill, and writing skill.
Beside that is another aspect in material of English teaching is vocabulary.
Vocabulary is an activity to transfer the knowledge from the text to mind. It is
impossible to gain information from many sources without proportional
amount of vocabulary, anyone will get trouble in listening, speaking, reading
and writing a foreign text without knowing the vocabulary inside the text.
Vocabulary is all the words in language list of words in lesson or books,
and other activities in English. It is difficult to master other competencies
without mastering and understanding vocabulary.
1
2
The important of vocabulary as a support or as a tool for communication
with another people. Vocabulary can make easier to understand what the
people’s speech or writing and easier to be able to the conntens. Vocabulary
can explore new things.They are also can not communicate effectively.
There are some efforts that has been done by the goverment to increase
student’s vocabulary mastery. Firstly, begin from prepare the good facilities
and tool for studying in English. Second, manage the classroom be confortable
so students can be focus in learning English. Finally, giving task about new
words that they have not learned yet, until use the various media in theaching
English for fun English class.
Condition of English vocabulary mastery in seventh students of SMP
Negeri 5 Padangsidimpun vocabulary mastery still poor. Based on interview
with the teacher in SMP Negeri 5 Padangsidimpuan.
The teacher said that students“ was lazy for bring the dictionary, they
prefer to wait for the teacher to translate the vocabulary, and they also tend to
forget the meaning of the word wich have been taught or particed in berief,
students vocabulary mastery does nit fullfill the expectation”.1
The researcher also interviewed some of students in seventh of SMP
Negeri 5 Padangsidimpuan.The students said” we have difficulty in
remembering new vocabularies because of the differences between what is
written and what is spoken so the students were easy to fell bored in learning of
vocabulary not interested in learning process. The teacher still used the
command way in teaching vocabulary such as giving then a list of vocabulary
and asked the students to remember”.2
1Private Interview, MissHapsyah Sri Mei Siregar, Teacher of SMP Negeri 5
Padangsidimpuan, (Padang Matinggi, October 23th
2017). 2Private Interview, Nazwa Putri FadilaHarahap Students of SMP Negeri 5
Padangsidimpuan, (Palopat, October 25th
2017).
3
Based on interview at school, it can be concluded that the problem is the
students felt boring in learning vocabulary, because their theacher do not use
media in teaching vocabulary. So that, teaching not is effective.
There are many factors of vocabulary mastery such as, motivation,
classrom interaction, learning style, students interest, psycological, and
strategy.3 Strategy is a teaching and learning tool . it can be used to stimulate
thoughts, feelings, concerns and abilities or skills of learners so as facilities the
process of learning.
Strategy is simply and interesting which can make teaching, and it can
help the teacher and it make students enjoyable. It is a specific method of
approaching a problem of a task, model of operation for achieving a particular
abd panned designed for controling and manipulating certain information.
Kinds of teaching vocabulary strategy such as scrabble, chrades and
semantic mapping strategy. Based on strategies mention above, the researcher
interested to semantic mapping strategy. While, semantic mapping is more
simply to make students enrich their vocabularies.4
Semantic mapping is to promote the students’ deeper understanding of
words through depicting varying relationship between and among words. So,
semantic mapping was helpful for developing students’ understanding of
almost any concept, it had been used to develop concepts.5
4Judi Willis, Teaching The Braing to Read: Startegies For Improving Fluency,
Vocabulary and Comprehension (London: ASCD Oybkucatub, 2008). 5Austin, Promoting Vocabulary Depelopment: Component of Effective Vocabulary
Intrucion (Texaz: Education Agency Publisher, 2002).
4
The role of semantic mapping in teaching vocabulary because semantic
mapping can make students easier to develop their knowledge about
vocabulary that will be learned. So, it can help the students easy for
understanding the vocabulary.
Based on the explanation above, the researcherwant to do a research the
title “The Effect of Semantic Mapping Strategy on Vocabulay Mastery At
The Grade SMP Negeri 5 Padangsidimpuan”
B. Identification of the problem
Vocabulary is basic competence that must reach by students in order to
get other competencies like reading, listening, speaking, and other activities in
English. It is difficult to master other cometencies without mastering and
undrestanding vocabulary.
Based on background of the problem above there are some factors
influencing the students vocabulary mastery are motivation, classroom
interaction, learning style, students interest, psylogycal, and strategy.
C. Limitationof the Problem
As mention above, there are some factors that influence of students’
vocabulary mastery are listening ability, speaking ability, students interest,
psychological such as (motivation, courage, and culture), and media.
5
In this research the researcher wants to make a study about how to teach
vocabulary for students in junior high school with the sematic mapping. There
are many semantic mapping that can be used in teaching vocabulary as mention
above, but the researcher does not discuss allof the media. Researcher discused
only media.
There some reason why researcher choose the semantic mapping
strategy. First semantic maping is a simple media can be used to teach inside or
outside the room. Second, it is easy to present learning message in a consis and
practical manner. Third, it make students can remember the new vocabulary
easily, and the last semantic mapping can to make students activities in the
classroom.
D. The Formulation of the Problem
Based on limitation of the problem mentioned above, the reseacher
formulation the problem is this research as follow: “is there a significant effect
of semantic mapping strategy on vocabulary mastery at the grade VII students
of SMPN 5 Padangsidimpuan ?”
E. Aim of the research
Based on formulation above the aim of the research is to know whether
there is the significant effect of Semantic Mapping strategy on vocabulary
mastery or not at grade VII students of SMPN 5 Padangsidimpuan.
6
F. Significances of the Research
The result of the research expected to be userful for:
1. For headmaster, as an information especially about teaching vocabulary
by using semantic mapping strategy at the grade VII students’ of SMP
Negeri 5 Padangsidimpuan.
2. For English teachers, as an information to add his technique in teaching
English especially in teaching vocabulary by using semantic mapping
strategy at the grade VII students’ of SMP Negeri 5 Padangsidimpuan.
3. For other researcher, as an information in conducting further research in
the same topic.
G. The Systematic of the Thesis
This research is organized into five chapters. Every chapter is subdivided
into subtopics to elaborate the given issue. First chapter, it consists of
background of the problem, identification of the problem, formulation of the
problem, limitation of the problem, aim of research, significances of the
research, definition of operational variables, and the systematic of the thesis.
Second chapter, it consists of the theoretical description. It is divided into
subchapters which consist of description of ice breaking games and description
of vocabulary. Second chapter also consists of related findings, conceptual
framework and hypothesis.
Third chapter, it consists of research methodology which is divided into
sub chapter; time and place of the research, research methodology, population

7
and sample, instrument of research, techniques of data collection, techniques of
data analysis and outline of the thesis.
Fourth chapter, it consists of data description, hypothesis testing,
discussion and the threats of research.
Fifth chapter, it consists of conclusion about the result of this research
and suggestions that are given by the researcher.
8
CHAPTER II
LITERATURE REVIEW
A. Theoretical Description
1. Vocabulary Mastery
a) Definition of Vocabulary
Vocabulary is one of component for the language, where is
vocabulary help people to speaking and language in communication. It
is a part of language that so important to all aspect in life and
vocabulary as a major part in English has to be taught effectively,
because students should feel glad and interesting in learning
vocabulary.6
In general of vocabulary is one aspect should be owned by
every student’s to make them understand and master in English
vocabulary. Vocabulary is important part of language. People can not
understand something without knowing the meaning first and it can be
constructed from knowing word by word.
The core in English is vocabulary.7 The learners should master
it firstly for mastering the four skills in English, speaking, listening,
reading, and writing. According to jack C. Richard and Willy a
Renandya “Vocabulary is a core component of language proficiency
6 Fitri Rayani Siregar, Improving Students’ Vocabulary Mastery Through Crossword
Puzzle Technique At SD Muhammadiyah 1 Padangsidimpuan, Jurnal Bahasa Inggris IAIN
Padangsidimpuan Vol. 04 No. 1 Juni 2018, http://jurnal.iain-
padangsidimpuan.ac.id/index.php/TZ/Vol. 04 No. 1 june 2018.accessed on Monday 14th of
December 2020. P. 94. 7 Jack C. Richard and Willy A. Renandya, Methodology in Language Teaching and
Anthology of Current Practice (USA: Cambridge University Press, 2000).
8
9
and provides much of the basis for how well learners speak, listen,
reand, and write”. It means vocabulary is very important aspect in
language. Someone can speak, listen, read, and write by using a
language because they have had , known, and mastered much
vocabularies.
According to A.S. Hornoby, vocabulary is a person’s
knowledge about all the words using.8 Vocabulary may be defined as
the total number of words in language and vocabulary is a list of words
with their meanings.
Schmit Broadly says, “ we must consider what mean by
vocabulary. The first idea that probably springs to mind is words, a
formulation yhat is admirably aduquate foe the layperson”.9 It means
we should use the vocabulary in the right placement. We must known
what we mean by using the vocabulary.
According to Elfrieda H. Hiebert and Michael L. Kamil,
“Vocabulary is the knowledge of meaning of words”.10
The some thing
is also delivered by Caroline T. Linse that vocabulary is the individual’s
knowledge about the collection of words.11
It means that vocabulary is
someone’s knowledge about words.
8 A.S Hornby, Oxford Advance Learner’s Dictionary (New York: Oxford University Press,
2000). 9 Norbeth Schmitt, Vocabulary in Language Teaching (Cambridge: Cambridge University
Press, 2000). 10
Hiebert, Elfriede H., and Michael L. Kamil, Teaching and Learning Vocabulary:
Brinnging Research to Practice (New Jersie: Lawrence Erubaum Associates Publishers, 2005). 11
Caroline T. Linse, Practical English Language Teaching : Young Learners (New York:
McGraw-Hill Companie, Inc, 2005).
10
So it can be concluded that, vocabulary is someone’s knowledge
about the words with the meaning of word it self that is used to master
the skills in language such as speaking, listening, reading, and writing.
In the other hand, based on the curriculum junior high school.
Vocabulary is a large numbers of words that students have to know, not
only memorizing the form of the word but also understand the meaning.
It makes the students are able to identify the meaning of the words,
students are able to communicate and understand the meaning. It is
widely accepted that vocabulary teaching should be part of the syllabus,
and taught in a well-planned and regular basis. It seems that the
teachers’ task to arrange such kind of lesson pland based on the current
syllabus in order to help students master English vocabulary. It must be
taught in an English class vocabulry.
Based on explanation above, it can be comcluded that
vocabulary is a core component of language propeciency and provides
much of the basis how well learners listen, speak, read, and write.
Vocabulary is very important in languae acquistion and the first
languages as the words. Vocabulary is a large numbers of words that
students have to know, not only memorizing the from of the word but
also understand the meaning.
b) Purpose of Vocabulary
11
In general purpose of vocabulary is often views as a critical tool
for second language learners because a limited vocabulary in a second
language impedes successful communication. Undesrcoring the
importance of vocabulary acquestion, schmitt emphasizes that
“lexcical knowledge is central to communicative competence and to
the acquestion of a second language”.12
It means vocabulary is
important to students. It more important than grammar for
communication purpose, particular in early stages when students are
motivated to learn the basic words they need to get by in language.
In specific purpose of vocabulary based on curriculum 2013 in
junior high school is to increase students vocabulary mastery, to
identifying a meaning of word in the text, to understand the function,
structure, and linguistic elements of the text to state and ask for the
name of the day, month, time name in days, time in the form of
numbers, dates and years, to develop communication competencies in
oral and written forms to achieve functional literacy levels.13
It means
vocabulary is important for students to comprehend four skill such as
listening, speaking, reading and writing.
Vocabulary is important for students. There are several purposes
of vocabulary:
1) To express their opinion thingking
12
Schmitt, Vocabulary in Language Teaching. 13
Siti Wachidah et al., Buku Bahasa Inggris: When English Rings a Bell (Jakarta:
Balitbang Kemendikbud, 2017).
12
2) To express idea in their society
3) Particulary in early stages when students are motivated
4) To learn the basic words they need to get by in language
5) To understand nuances of meaning
6) To be come more proficient in their own choice of words and
expressions.14
According to Michael J. Wallace, the purpose of mastering
vocabulary is divided into three purpose of vocabulary, they are :
1) Quantity means number of words to counting a lesson. In
minimal number of words for junior high school is around
words, while senior high school is about 4000 words.
2) Need to determine the students’ vocabulary for business.
3) Presentation to spesific understanding in the meaning of the
words being learn since meaning involves many things, this
requires the teaching in which the words are presented.15
So it can be conclude that the purpose of vocabulary is the way
to express our opinion thingking, to express to an idea in our
society, make early to learn the basic loord that our need to get by in
language, make us more propecient in our own choice of words and
expressions.
Meanwhile, the purpose of vocabulary in junior high school
institution are: students are able to memories vocabulary around
250 words, students are able to enrich vocabulary in daily activity,
and students able to know the meaning of words.16
c) Kinds of Vocabulary
14
Roger Gower, Teaching Practical Handbook (Thailand: Macmilian, 1995). 15
Michael J. Wallace, Eaching Vocabulary (ELBS, 1989).
16 Syllabus at SMP Negeri 5 Padangsidimpuan.
13
According to Harmer, there are two kinds of vocabulary, they are:
1. Receptive Vocabulary or Passive Vocabulary
Receptive vocabulary can be understood ony through listening
and reading. Someone does not need to know much about the
receptive vocabulary and it is impossible for someone to memorize
all the vocabularies of a certain language but someone can
understand that ideas of the utterance contextually not word by
word.
2. Productive Vocabulary or Active Vocabulary
Productive vocabulary involves of knowing how to pronounce
the word, how to write and spell it, how to use it in correct
gramatical patterns along with the words that usually collocate
with.17
According to Azimar Enang that there are two types of
vocabulary, they are:
1) General Vocabulary
2) Special Vocabulary.18
According Scail says that there are types of vocabulary, they
are:
1) Active Vocabulary
2) Reserve Vocabulary
17
Jeremy Harmer, The Practical of English Language Teaching (New York: Longman,
2000). 18
Azimar Enang, Kinds of Vocabulary (Bandung: PT. Pustaka Media, 2001).
14
3) Passive Vocabulary.19
Based on the explanation above, there are some types of
vocabulary. They are: active vocabulary, passive vocabulary,
reserve vocabulary, general vocabulary, and special vocabulary.
In this discussion research limits the types of vocabulary
into two points:
First, active vocabulary refers to the words that are used in
speaking and writing. It means that involves of knowing how to
pronounce the word, how to write and spell it, how to use it in
correct gramatical patterns along with the words that usually
collocated.
Second, passive vocabulary means that words that are used
in reading and listening. Someone can understand the ideas of the
utterance contextually not word by word.
d) Advantages of Vocabulary
In language, vocabulary is very important to convey the idea,
express desire and feelings; and to communicate with others.
Vocabulary is one of the components which supports the speakers in
communication, whenever we want to communicate with other people
using a language.
Tarigan points out the importances of vocabulary in language is
essential for successfull language use, because without an extensive
19
Schail, Seven Days to Faster Reading (New York: Oxford University Press, 1967).
15
someone will be unable to use structure and function that has learned
for comprehesible communication. Someone uses vocabulary to listen,
speak, read, and write effectively.20
So, the students must have much
vocabularies for successful in language use.
Students learn vocabulary inderectly and directly. They can
express their ideas and comprehend other people idea if they have good
vocabulary mastery.
e) Material of Vocabulary
There are some materials in vocabulary teaching. Based on
explanation above there are some kinds of vocabulary, such as receptive
vocabulary and productive vocabulary. So, the English lerarner can
learn or understand vocabulary while listening to a spoken or reading a
passage and produce it when do speaking or writing.
The book used SMPN 5 Padangsidimpuan ”BahasaInggris When
English Rings A Bell”. It divide into thirteen chapters, they are; chapter
I Good Morning. How are You, chapter II It’s Me, chapter III What
Time Is It?, chapter IV This is My Word, chapter V It’s a Beautiful
day!, chapter VI We love what we do, chapter VII I’m Proud of
Indonesia, chapter VIII That’s what friends are supposed to do.
From those material, the researcher did not talk about all topic. The
researcher only focus on chapter IV with sub topic This is My Word.
This topic talk about things and transportation. The vocabulary in this
20
H. G. Tarigan, Pengajaran Kosa Kata (Bandung: Aksara, 1985).
16
topic also include into speaking not only as a especially vocabulary
lesson.
In this research, to know the students’ vocabulary mastery,
researcher limit the materials of teaching vocabulary they are; name of
thing in outside home, name of thing in the home, name of thing in the
school and animal we can see in the below.21
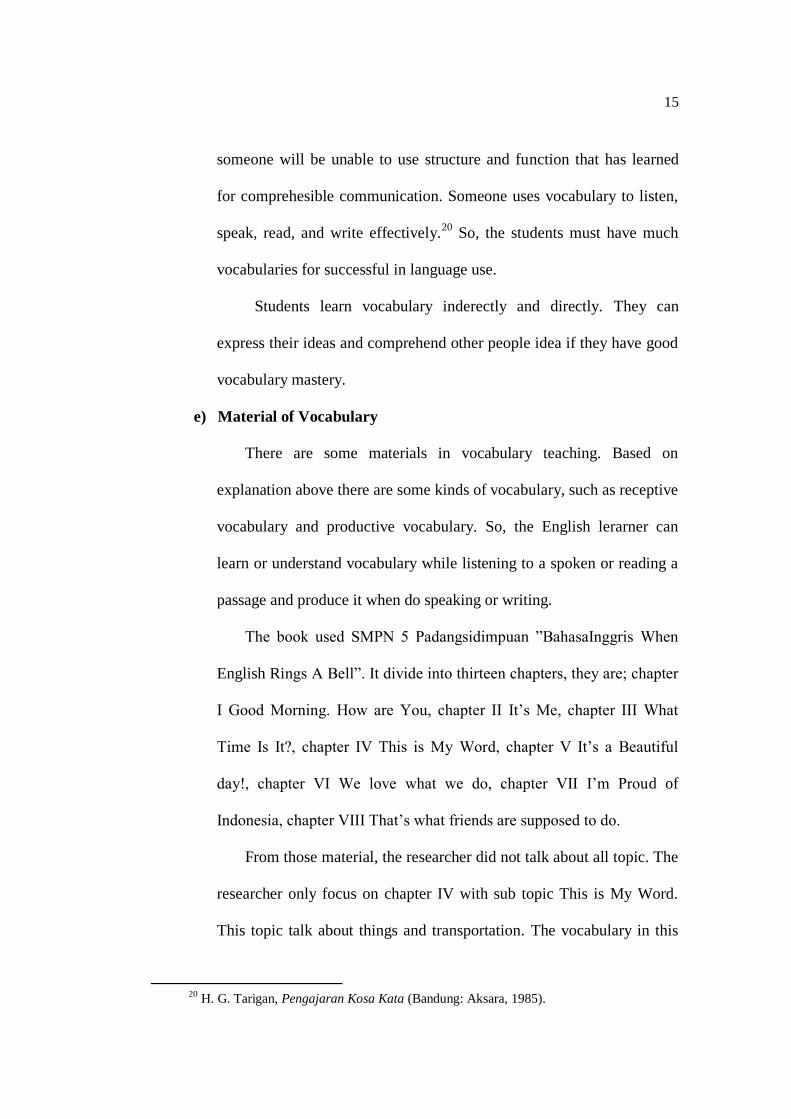
1) Name of thing in outside home
Exercise
21
Syllabus Seventh Grade Junior High School Based On K13.
17
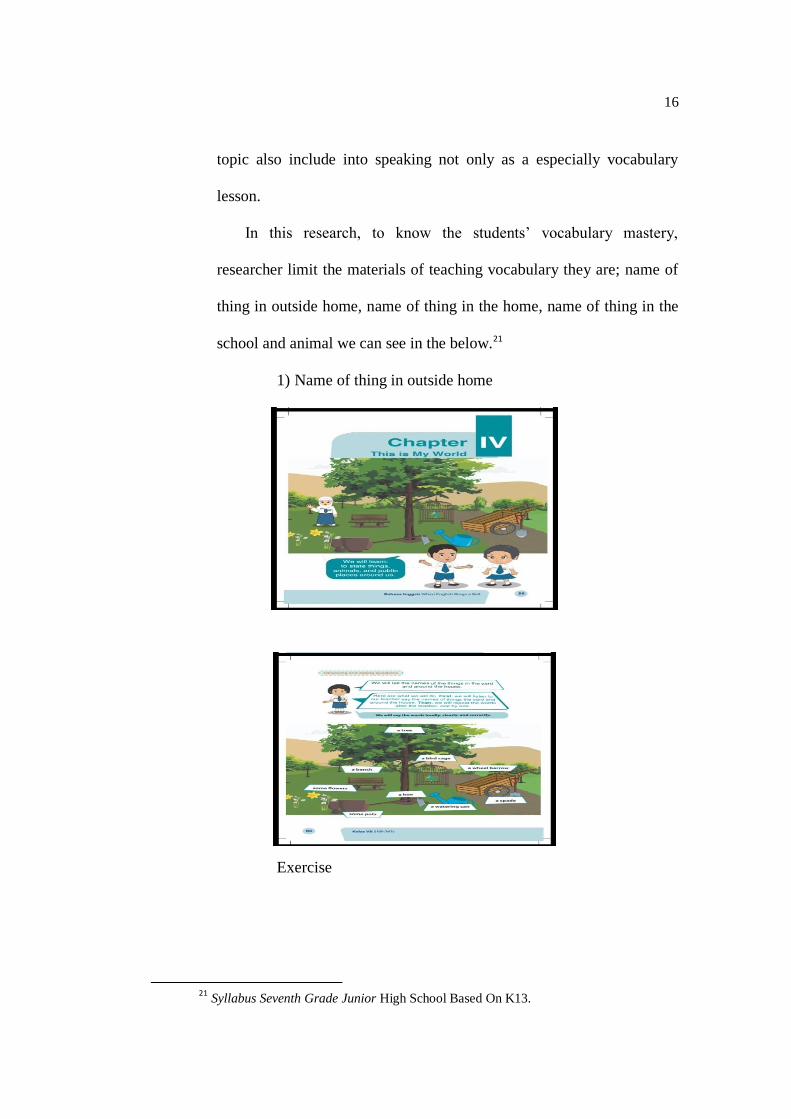
2) Name of thing in the home
Exercise
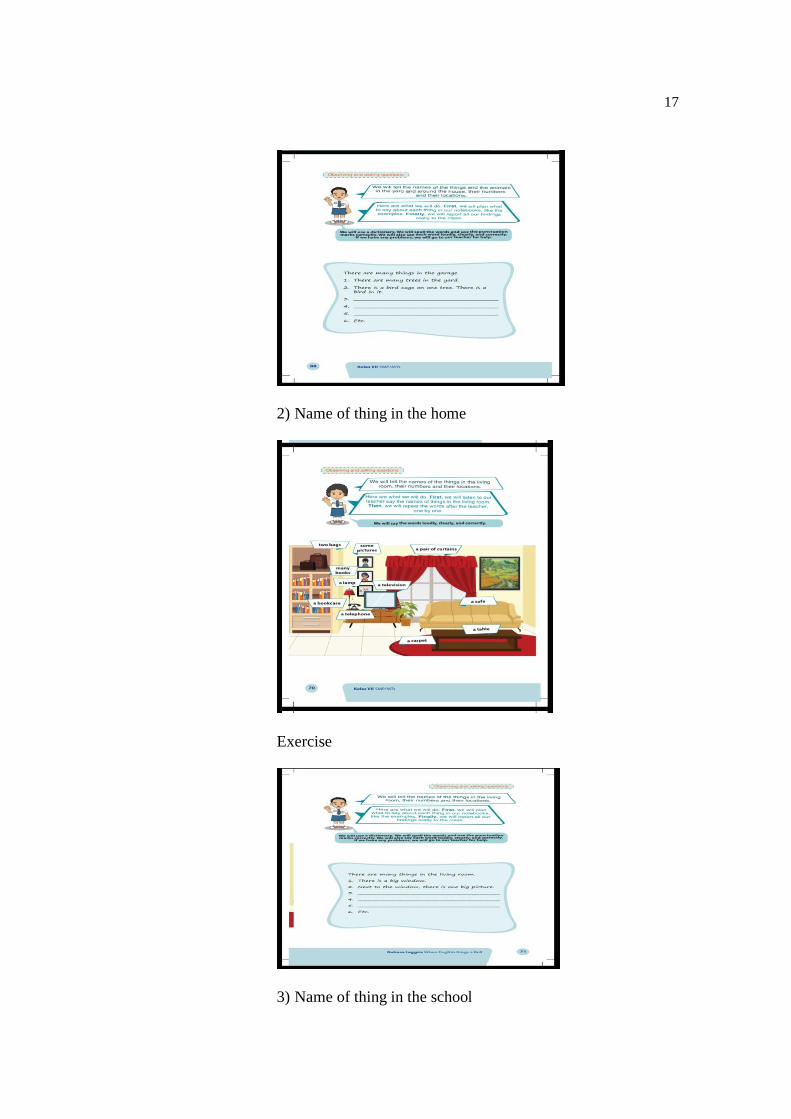
3) Name of thing in the school
18
Exercise
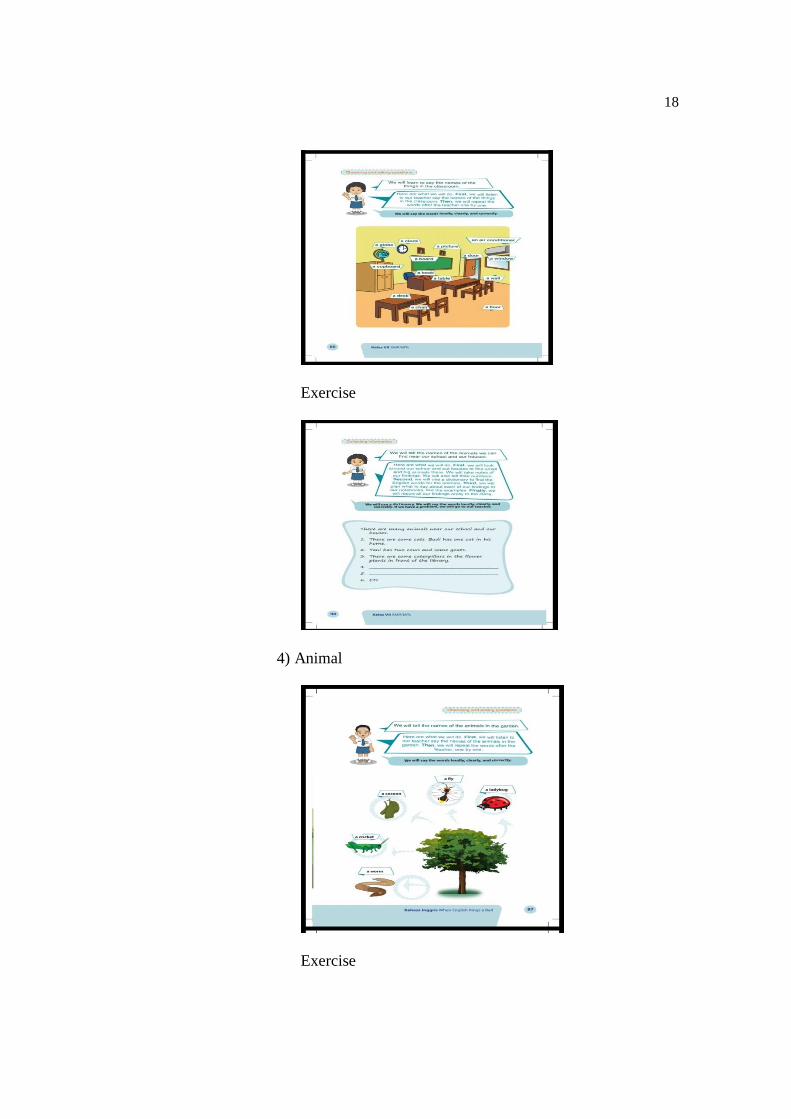
4) Animal
Exercise
19
2. Semantic Mapping Strategy
a. Defenition of Semantic Mapping
According to Heimlich and Pittelman 1986 Semantic mapping is
is a teacherdirected study of a word or concept in relation to other
related words and ideas. The teacher begins a Semantic Mapping
activity by providing a word or concept about to be studied and students
brainstorm characteristics, attributes, related words and ideas, and
specific examples of the word. The map is a graphic representation of
this thinking and discussion.
Discussion is a significant aspect of a Semantic Mapping activity
. In addition, there is a significant line of research that supports the
positive impact of Semantic Mapping in terms of students’ memory of
the targeted word and recognition of that word in a variety of contexts
(Johnson, Toms Bronowski, and Pittelman 1982).22
Semantic mapping is
a strategy that can be used in all disciplines to demonstrate the
22
Johnson, Toms Bronowski, and Pitelman, Inside Words: Tools for Teaching Academic
Vocabulary Grades 4-12 (Portland: Stenhouse Publishers, 2007).
20
relationship between ideas. It is an activity that helps bring into
consciousness relationship among word in a text and help deepen
understanding by creating associative networks for words.23
From the definitions above, it can be conclude semantic mapping
as a graph or diagram that represents ideas verbally. These ideas consists
of the main ideas is a subject that will be discussed and sub-sub ideas
that describe the subject. Sub-sub ideas can take the form of words or
phrases that are interconnected. Usually, the main idea is placed in the
middle while the sub-sub ideas emitted from the main idea with the
fingers. These ideas can be placed in a circle, square, or triangle.
Semantic mapping can also be shaped tree trunk while the idea is
basically as sub-sub ideas that are in the branch.
b. Kinds of Semantic Mapping
Semantic mapping is one of strategy can be use to teach
vocabulary. Semantic mapping is stategy which can make teaching
strategy more simply and interesting, and it make students’ enjoyable
because there are four kind of semantic mapping that cannot make
students’ boring. They are : network tree, star, cycle concept map and
spider concept map:
1) Network Tree
23
Marianne Celce Murcia, Teaching English as a Second of Foreign Language Teaching
(USA: Heinle&Heinle Thompson Learning, 2001).
21
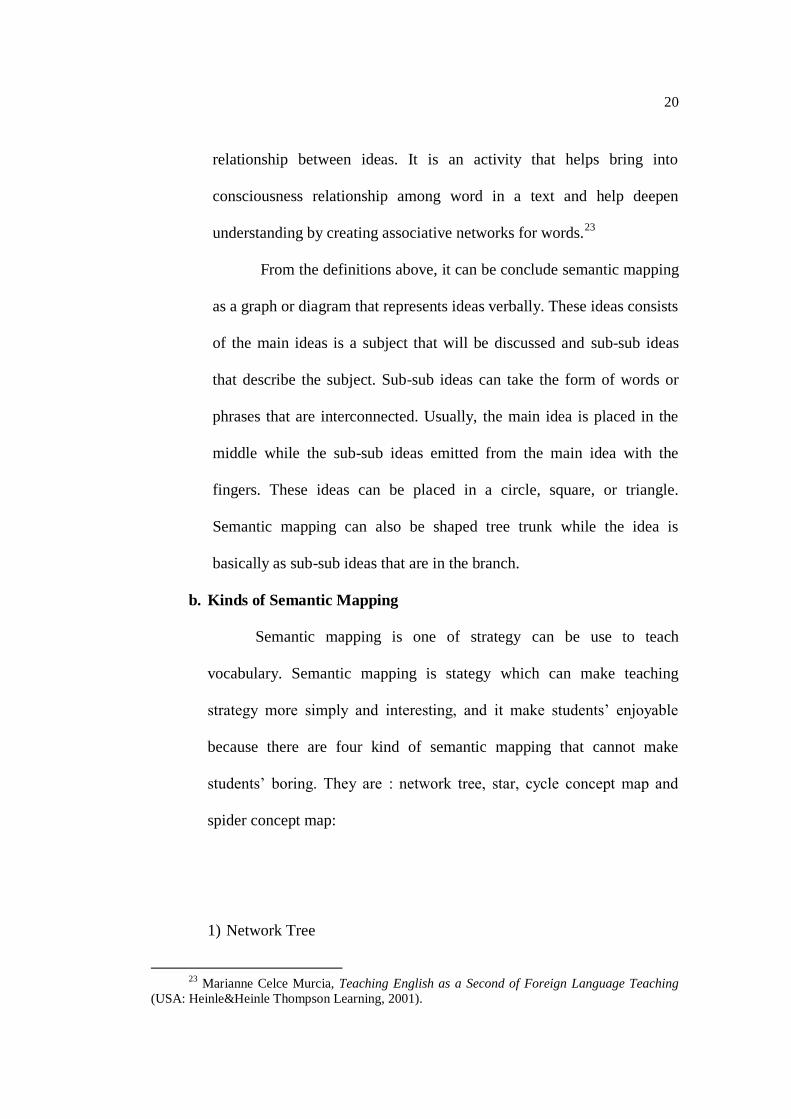
Network tree is one of the kind of the research,the way for
making network tree is so easy. Keyword and idea of topic is making
in rectangle,and another word is writing in line connection, this line is
showing that concept has related one word with other word.24
Appropriate with name of graphic, network tree is like as tree.
Picture 1.Network Tree
(source: Schoarly research journal)
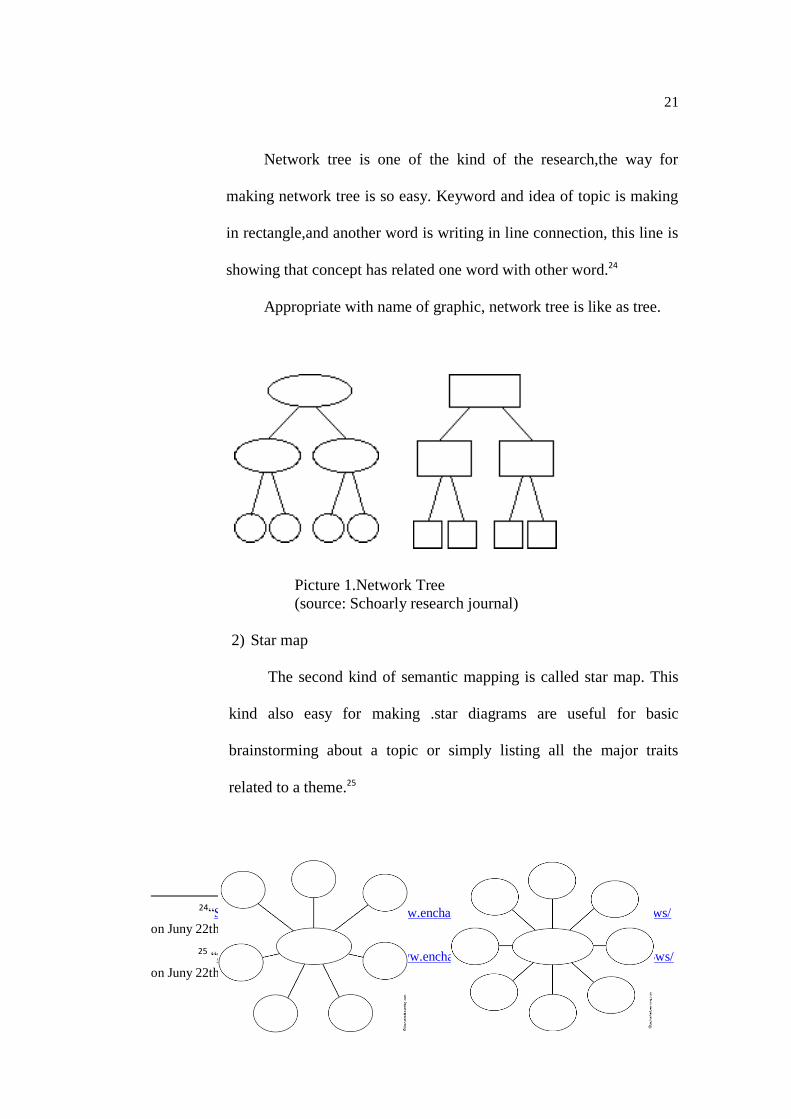
2) Star map
The second kind of semantic mapping is called star map. This
kind also easy for making .star diagrams are useful for basic
brainstorming about a topic or simply listing all the major traits
related to a theme.25
24
“Schoarly research journal”http://www.enchantedlearning.com/graphicorganizers/5ws/
on Juny 22th, 2014 at 21:00p.m.
25 “Schoarly research journal”http://www.enchantedlearning.com/graphicorganizers/5ws/
on Juny 22th, 2014 at 21:00p.m.
22
Picture 2.Star Map
(source: Schoarly research journal)
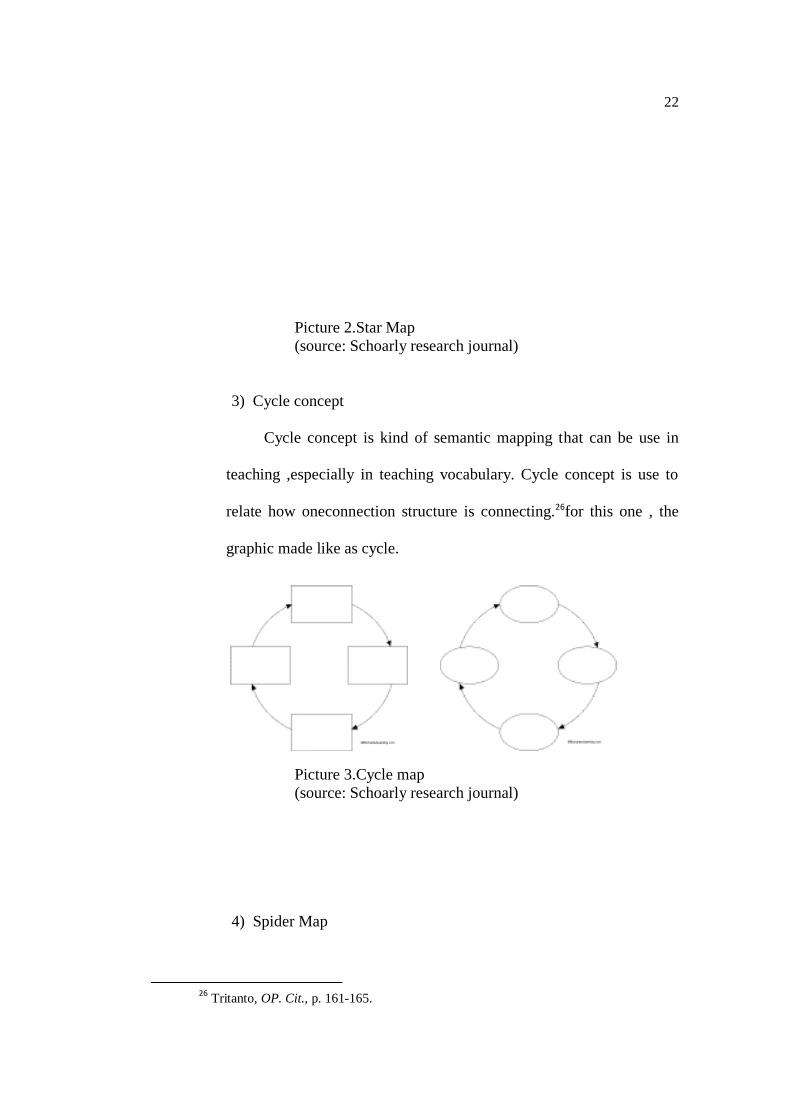
3) Cycle concept
Cycle concept is kind of semantic mapping that can be use in
teaching ,especially in teaching vocabulary. Cycle concept is use to
relate how oneconnection structure is connecting.26for this one , the
graphic made like as cycle.
Picture 3.Cycle map
(source: Schoarly research journal)
4) Spider Map
26
Tritanto, OP. Cit., p. 161-165.
23
Spider map is the last kind of semantic mapping strategy. The
spider Map always used to effuse opinion. This graphic is made like
as spiSder map
Picture 4.Spider map
(source: Schoarly research journal)
The kind of semantic mapping above can be used to teach
vocabulary ; it canbe done appropriate that vocabulary with
vocabulary that will be learned.With some kind of semantic mapping
above, the teacher can make class more innovative, so that, teaching
vocabulary with semantic mapping strategy is not monotonous, and
here, researcher choose star map concept to teach students because
more easy to understand it.
c. The purpose of Semantic Mapping
The major purpose of the semantic map is to allow students to
organize their prior knowledge into these formal relations and thus to
provide themselves a basis for understanding what they are re about to
read and study. Comprehension can be thought of as the elaboration and
refinement of prior knowledge. What the semantic map provides is a
graphic structure of that knowledge to be used as the basis for organizing
24
new ideas as they areunderstood.27 The students will associate new word
meaning with prior knowledge through the use of a semantic map.
The framework of semantic mapping strategy, to to concept of
word, two categories example and another examples. This is a very
interactive process and should be modeled by the teacher first. The step
involved in semantic mapping strategy are: write the concept word on the
board, explain the steps involved and have students think of as many
words as they can for the concept word, write the list on the board or
overhead and have students copy it, and finally in group have students
put the words into categories.
d. Advantages and Disvantages of Semantic Mapping Strategy
Semantic mapping is strategy that can be used for teaching
vocabulary, because semantic mapping can make students easier to
develop their knowledge about vocabulary that will be learned. Another
ways, semantic mapping strategy cam make abstract to be come
concrete. So, it can help the students easy for understanding the
vocabulary, below are some advantages of semantic mapping strategy:
1). Advantages of Semantic Mapping Strategy
There are some advantages of semantic mapping strategy like as
below:
a) Students easier to comprehend the learning material.
27
http://yoga4rifwijaya.blogspot.co.id/2012/03/semantics-mapping.html(online) taken 18
july 2016
25
b) Students can develop the learning after teacher give the
learning material to students.
c) Students can relate their leaning in one category.
d) Semantic strategy can grow students’ creativity.
e) With semantic mapping students are not feel boring, because if
the learning material is excessively. It makes students so hard
to relate.
Their learning, but if students just look their learning in semantic
mapping They know where the aims of their learning.28
Based on all of the advantages of semantic mapping above, it
shows that semantic mapping is strategy that can help the students to easy
understand their learning, and can develop their learning with their
creativity. However, semantic mapping also has some disadvantages like
as below:
2) Disadvantages of Semantic Mapping Strategy
Semantic mapping not only has advantages but also has
disadvantages. There are three disadvantages of semantic mapping below:
a) Teacher is not preparing enough these concept itself.
b) Object of reading was less.
c) Semantic mapping can make students difficult to think concrete.
28
Istarani, OP. Cit., p.247.
26
So that, semantic mapping makes teacher less in preparing the
concept, and makes the students easier to think abstract, and it make
students just think abstract only.
e. Teaching Vocabulary by Using Semantic Mapping
Teaching Vocabulary by using Semantic Mapping include three Phases,
They are :Pre teaching is the teaching of the language learners need before
an activity, then while teaching, is the process of teacher activities when
giving lesson to students, and the last, post teaching is teacher activities to
make summaries and conclusions about what has been learned to close the
learning process.
In the teaching learning process there must be interaction, interaction
teaching and learning is engangement reciprocal between teacher and
students who have to show the connection that is educate. The function of
interaction not only as the exchange of information and the message, but as
the individual and the exchange of data, fact and aideas. For more detail
see table below :
27
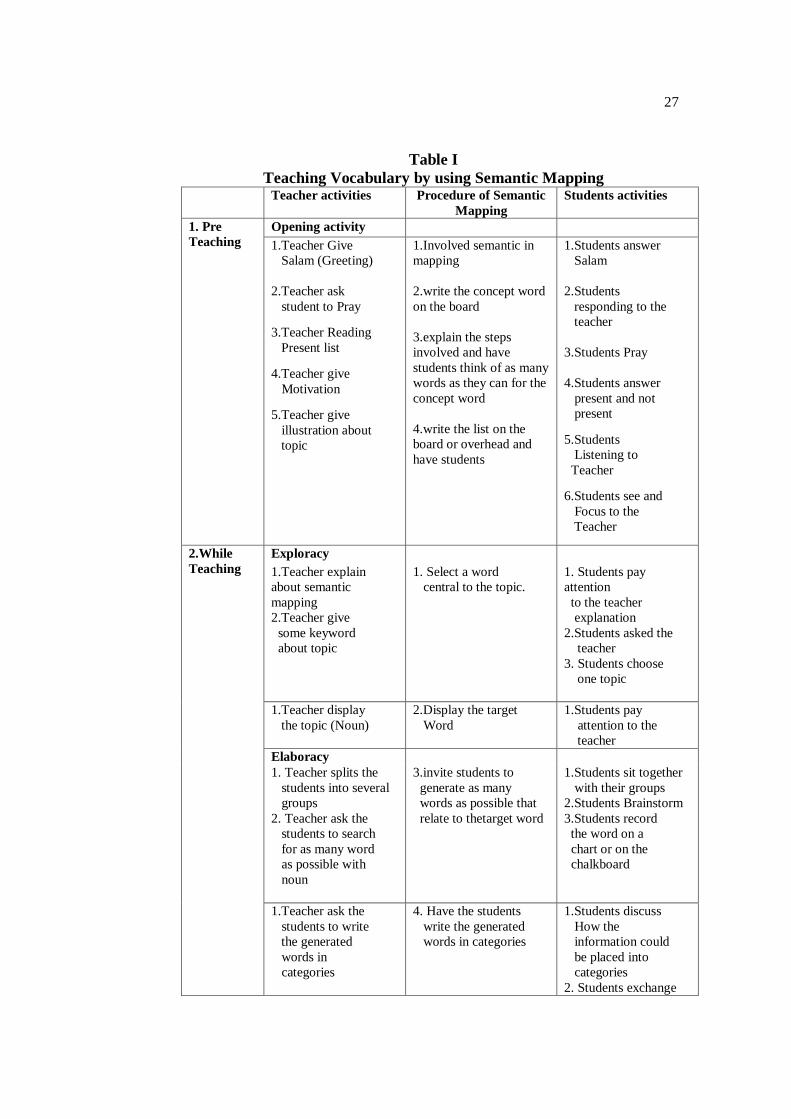
Table I
Teaching Vocabulary by using Semantic Mapping Teacher activities Procedure of Semantic
Mapping
Students activities
1. Pre
Teaching
Opening activity
1.Teacher Give
Salam (Greeting)
2.Teacher ask
student to Pray
3.Teacher Reading
Present list
4.Teacher give
Motivation
5.Teacher give
illustration about
topic
1.Involved semantic in
mapping
2.write the concept word
on the board
3.explain the steps
involved and have
students think of as many
words as they can for the
concept word
4.write the list on the
board or overhead and
have students
1.Students answer
Salam
2.Students
responding to the
teacher
3.Students Pray
4.Students answer
present and not
present
5.Students
Listening to
Teacher
6.Students see and
Focus to the
Teacher
3. 2.While
Teaching
Exploracy
1.Teacher explain
about semantic
mapping
2.Teacher give
some keyword
about topic
1. Select a word
central to the topic.
1. Students pay
attention
to the teacher
explanation
2.Students asked the
teacher
3. Students choose
one topic
1.Teacher display
the topic (Noun)
2.Display the target
Word
1.Students pay
attention to the
teacher
Elaboracy
1. Teacher splits the
students into several
groups
2. Teacher ask the
students to search
for as many word
as possible with
noun
3.invite students to
generate as many
words as possible that relate to thetarget word
1.Students sit together
with their groups
2.Students Brainstorm
3.Students record
the word on a
chart or on the
chalkboard
1.Teacher ask the
students to write
the generated
words in
categories
4. Have the students
write the generated
words in categories
1.Students discuss
How the
information could
be placed into
categories
2. Students exchange
28
ideas with each other
1.Teacher ask
students label
categories
5. Have the students
label categories
1.Students label and
add extra
information to
each category
1.Teacher ask
students to
construct a map
6.From this list,
construct a map
1. Students construct
a map
1.Teacher give a test to
Students
2.Teacher give time to
students for doing the
test
3.Teacher lead the
class in discussion
7.Lead the class in a
Discussion
1. Students answer the
Test
2. Students discussion
with their groups
Confirmacy
1.Teacher collect the
Test
2.Teacher examine
students answer
3. Teacher discuss the
answer of students
together
1. Students give paper
test to teacher
2.Students focuses
on identifying
meaning and uses
of word clarifying
ideas,
highlightingmajor
conclusion,
identifying key
elements and
expanding ideas
3. Post
Teaching
Clossing activity
1.Teacher make a
learning summary
and conclussion
2.Praying at the end
of learning
1.Students repeat,
write and
remember the
learning
2.Students Praying
to end of learning
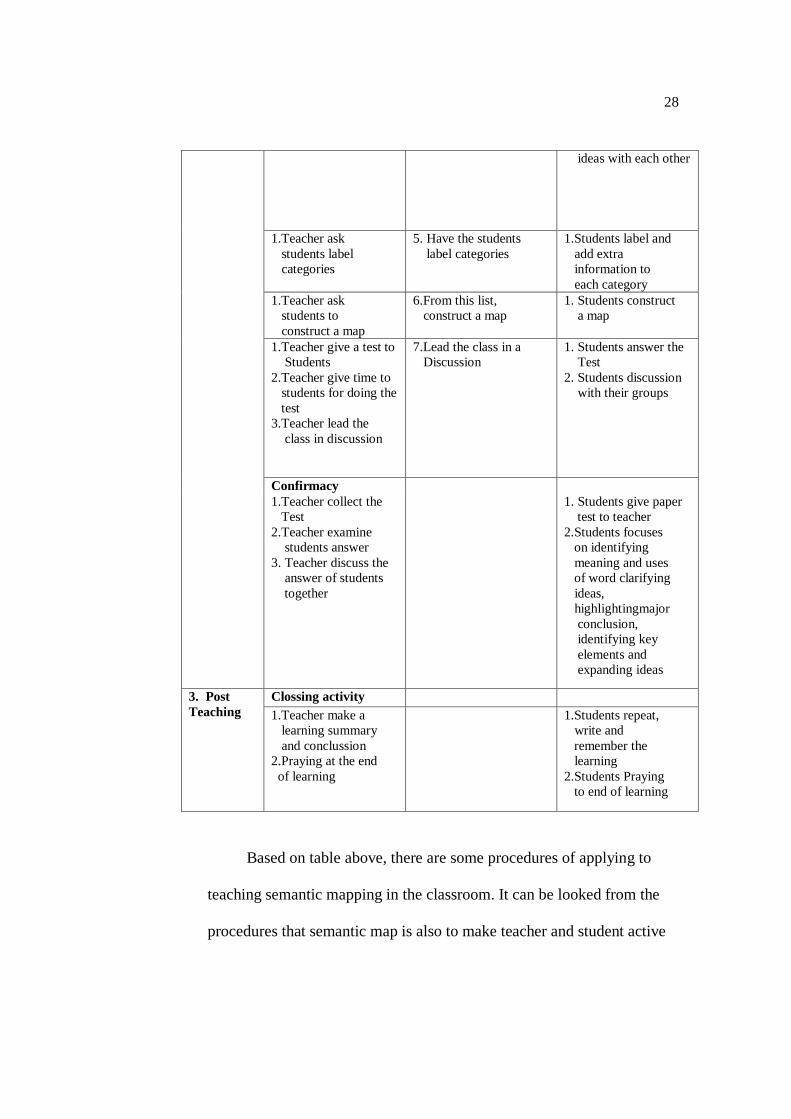
Based on table above, there are some procedures of applying to
teaching semantic mapping in the classroom. It can be looked from the
procedures that semantic map is also to make teacher and student active
29
and have interaction in teaching learning process in the classroom,
especially in learning vocabulary.
3. Conventional Strategy
a. Defenition of Conventional
According to Hudson that “conventional teaching is a method that
used by the teachers based on mutual agreement in a school.29 It used
traditional way in teaching and learning process where the teacher will
use the common way in teaching and learning. Conventional or
traditional teaching is concered with the teacher being the controller of
the learning envirorment. The teacher actually is the leader in the class.
b. Classification of Conventional Strategy
There are many teaching strategies that we can use in teaching and
learning process. One of them is conventional or traditional strategy.
Conventional strategy can be divided into some strategies, such as:
lecture, project, catechize, discuss, problem solving, homework,
recitation, demonstration and experiment, role play, and so on.30
From
those strategies, there is a strategy that is often used by the teacher, such
as lecture strategy. It is a traditional strategy because it has been used for
a long time in teaching and learning process. In this strategy, the teacher
usually gives all of the explanation of the materials or it is a teacher
centered. This traditional strategy, sometimes, will make the students be
easier to feel bored.
29
Hudson, The meaning of Conventional Teaching, accased on http://www.conventional-
strategy/topic/54372-strategy, retrieved on november, 29-11-2018. 30
Syaiful Bahri Djamara, Strategy Belajar Mengajar (Jakarta: PT. Asdi Mhasatya, 2006).
30
Strategy of the teacher at the scholl, any of a wide variety of
exercise, activity, or task used in the language classroom for realizing
lesson objectives. Teacher’s understanding on the learners will
determine the strategy to use in their teaching.teachers’s understanding
of how he learns will determine their philosopy or education, teaching
style, approach, methods, and classroom strategy. Therefor, strategy is
variety or activities or procedure that used in the language classroom for
theaching lesson objectives.
Based on the explanation above, it can be stated the approach is a
belief about the language learning, applicability, and pedagogical. In
addition, method is teacher and student’s role with such features as
linguistic and subject matter objectives. Furthermore, strategy is activity
used in the language classroom for achieving the lesson goal.
B. Review of Related Findings
There are some related findings related to this research. The first is
AhmadinAzhar. He concluded that there is the effect of using media video
Dore The Explorer, where the mean score is 93.26 and control class is
83.04, with t0 is higher than tt (12.77 > 1.68). So, the implication of media
video Dora the Explorer is better than conventional strategy.31
31
Ahmadin Azhari, “The Effect of Using Media Video Dora The Explorer to Students’
Vocabulary Mastery at SD Negeri 200201/4 Padangsidimpuan 2011/2012 Academic Year”
(STAIN Padangsidimpuan, 2012).
31
The second is Ahmad NurulFurqon “.32
He concluded that there is no
the effect of direct method, with t0 is smaller than tt( 1,882> 87) . So, the
null hypothesis is accepted and the alternative hypothesis is rejected, or it
can be said that there is no significant influence of using direct method in
teaching vocabulary.
The Third is SitiJuhaeriyah . She concluded that there is the effect of
direct method, with t0 is higher than tt (5.758 > 2.65). So, the implication
of direct method in teaching vocabulary is better than conventional
strategy.33
The Fourth is Putri Ziko Mamura’s . She concluded that the different
result of students’ vocabulary mastery. It is because the students’ average
scores of the post test after giving treatment increase 1,0517 from the
students’ average scores of the pre-test before giving the treatment.34
The Fifth is from Nidajumaliana . The result of comparison between
the students’ understanding in reading ability before and after using of
Semantic mapping is using pre-tet and post-test, the score are 69.3 and
75.2. So there is significant influence of using of Semantic mapping on the
32
Ahmad Nurul Furqon, “Using Direct Method in Teaching Vocabulary at First Grade of
Private Junior High School Muhammadiyah 44 Pamulang” (Syarif Hidayatullah State Islamic
University, 2007).
33
SitiJuhaeriyah 34
Putri Ziko Mamura, “The Use of Semantic Mapping to Improve Vocabulary Mastery of
The Fourth Grade Students’ of SD Muhammadiyah Ngijon 1 in The Academic Year 2009/2010”
(State University of Yogyakarta, 2011), http://eprints.uny.ac.id.
32
students understanding in reading ability at the eighth grade students of
SMPN 1 KadipatenMajalengka.35
In summary, from the description above, the researcher concludes
that strategy or methods can increase the students’ vocabulary mastery. So,
the researcher hopes that Semantic Mapping can increase the students’
vocabulary mastery and this research was complete and contribute
previous findings. Moreover, the researcher wants to research about “The
Effect of Semantic Mapping Strategy On Vocabulary Mastery at Grade
VII Students’ of SMP N 5 Padangsidimpuan.
C. Conceptual Frame Work
Strategy in teaching vocabulary is the important thing that must be
considered by the teacher to succeed the learning vocabulary. The teacher
must choose the suitable strategy for the students so they are not easy to feel
bored when following the vocabulary lesson. For junior high school’s
students, the teacher can choose the strategy which does not only ask them
to learn. In the other word, the teacher creats some of strategy to teach
vocabulary. One of them is semantic mapping. Semantic mapping is a
strategy for reoresenting word concepts graphically. It helps the students to
develop their vocabulary through a deeper understanding conceptual
knowledge by displaying words into categories to show how they are related
to each other. In additiom, semantic mapping is strategy that can be used in
all disciplines to demonstrate the relationship among words in a text and
35
Nida Jumaliana, “The Influence of Using of Semantic Mapping OnThe Students
Understanding in Reading Ability at The Eight Grade Students of SMP N 1 Kadipaten
Majalengka” (Syekh Nurjati State Institute For Isamic Students, n.d.).
33
help deepen understending by creating associative network of word.The
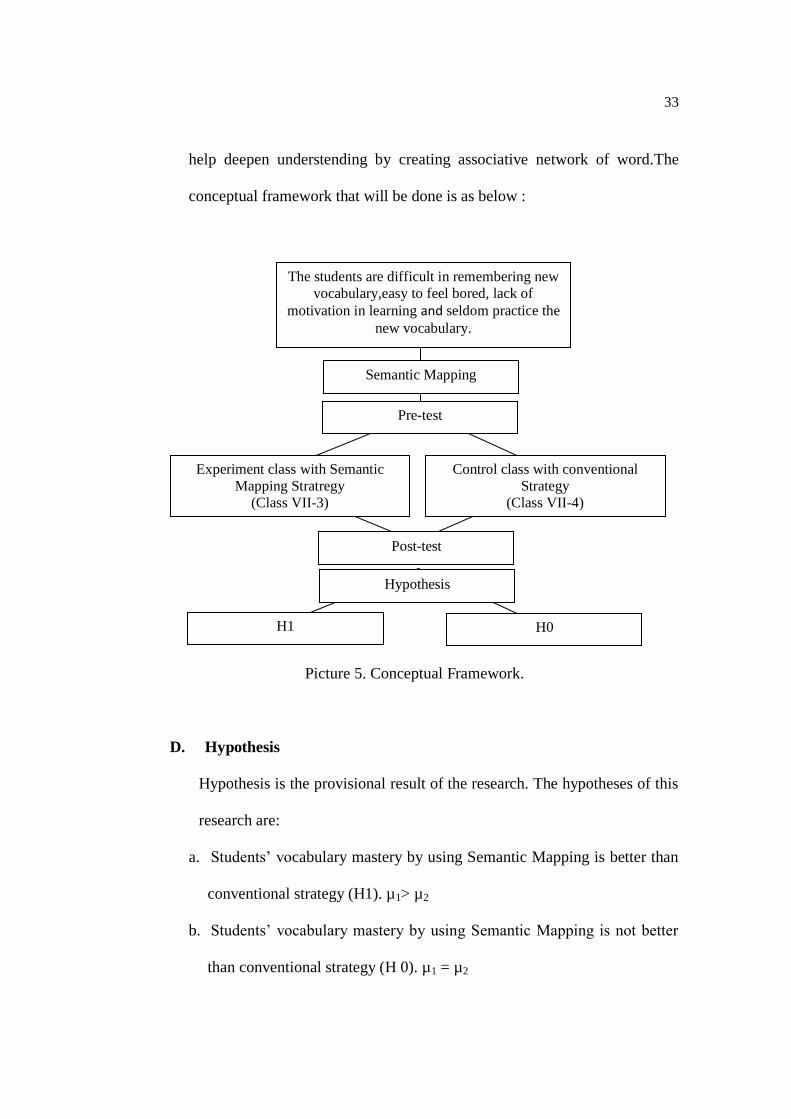
conceptual framework that will be done is as below :
Picture 5. Conceptual Framework.
D. Hypothesis
Hypothesis is the provisional result of the research. The hypotheses of this
research are:
a. Students’ vocabulary mastery by using Semantic Mapping is better than
conventional strategy (H1). µ1> µ2
b. Students’ vocabulary mastery by using Semantic Mapping is not better
than conventional strategy (H 0). µ1 = µ2
The students are difficult in remembering new
vocabulary,easy to feel bored, lack of
motivation in learning and seldom practice the
new vocabulary.
Semantic Mapping
Pre-test
Experiment class with Semantic
Mapping Stratregy
(Class VII-3)
Control class with conventional
Strategy
(Class VII-4)
Post-test
Hypothesis
H1 H0
34
CHAPTER III
RESEARCH METHODOLOGY
A. Place and Schedule of the Research
This research will done at SMP Negeri 5 Padangsidimpuan. It is located
at Perintis Kemerdekaan Street, Padangsidimpuan. It is number in
Padangmatinggi. It is about 4 kilometers from the central town.
The subject of this research was seventh grade of students in SMP Negeri
5 Padangsidimpuan The schedule of this research was from October until
finished.
B. Research Design
The kind of this research is experimental research. Experimental research
is a research with a purpose to find the effect of one or more variables to the
other variable. Gay and Airasian experimental research is the only type of
research that can test hypotheses to establish cause and effect relationship.36
Besides, Burhan stated that experimental research is a research to manipulate
and control the variables to find the relationship, effect, or the differences
among the variables to the other variable.37
In this research, the researcher have choosen two classes as experiment
class and control class. The classes are VII-3 as experimental class and VII-8
as control class. For VII-3 class as experiment class, they will be taught by
using semantic mapping strategy and VII-8 class as control class will be taught
36
L.R. Gay and Peter Airasian, Educational Reasearch: Competences for Analysis and
Aplication Sixt Edition (USA: Prentice Hall, Inc., 2000). 37
Burhan Bungin, Metode Penelitian Kuantitatif (Jakarta: Kencana, 2005).
34
35
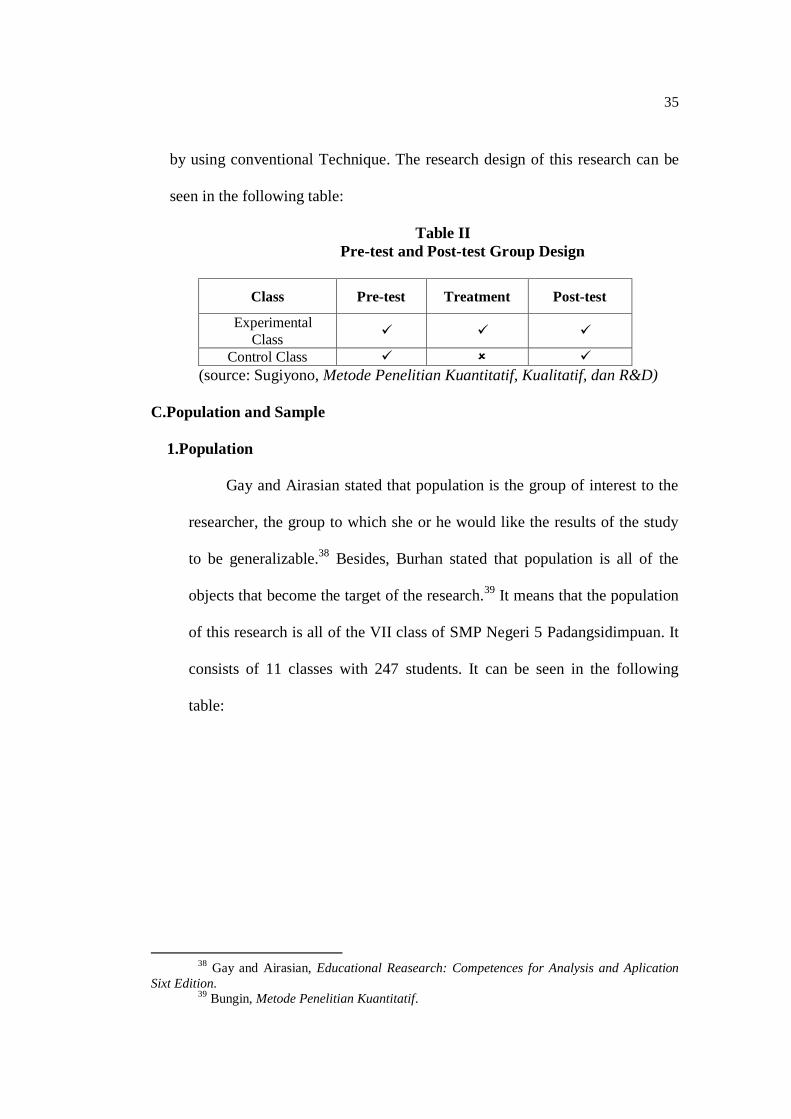
by using conventional Technique. The research design of this research can be
seen in the following table:
Table II
Pre-test and Post-test Group Design
Class Pre-test Treatment Post-test
Experimental
Class
Control Class
(source: Sugiyono, Metode Penelitian Kuantitatif, Kualitatif, dan R&D)
C.Population and Sample
1.Population
Gay and Airasian stated that population is the group of interest to the
researcher, the group to which she or he would like the results of the study
to be generalizable.38
Besides, Burhan stated that population is all of the
objects that become the target of the research.39
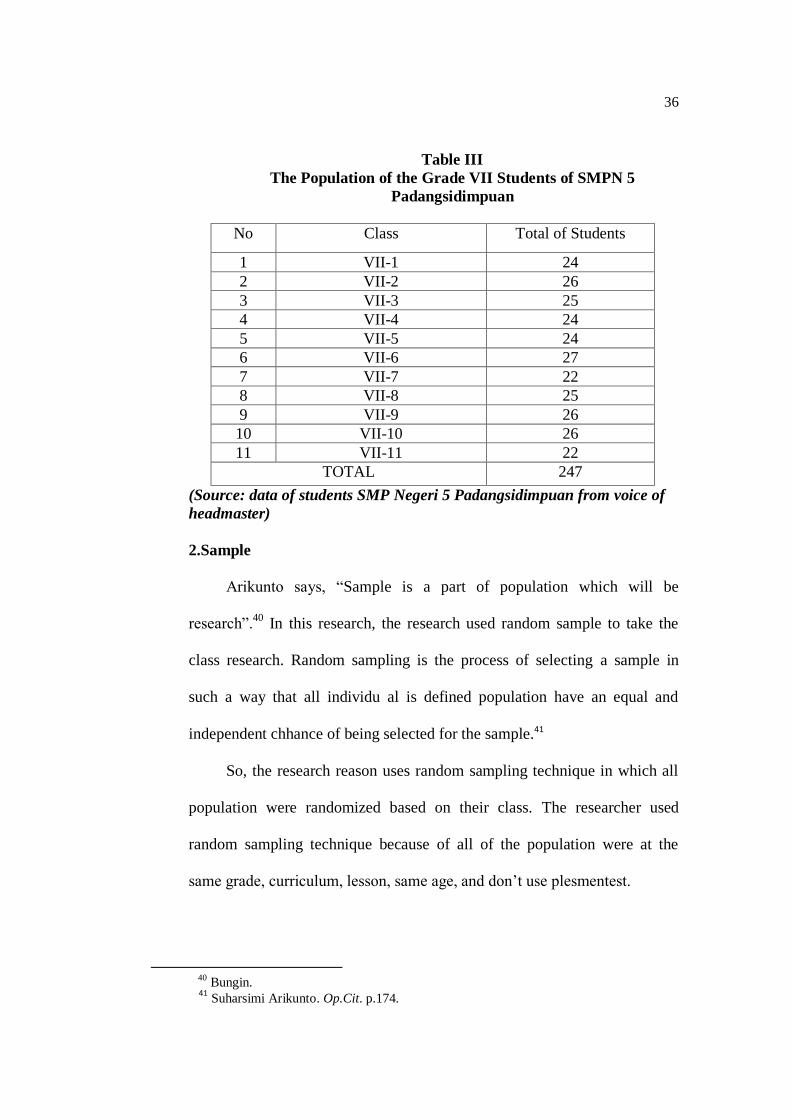
It means that the population
of this research is all of the VII class of SMP Negeri 5 Padangsidimpuan. It
consists of 11 classes with 247 students. It can be seen in the following
table:
38
Gay and Airasian, Educational Reasearch: Competences for Analysis and Aplication
Sixt Edition. 39
Bungin, Metode Penelitian Kuantitatif.
36
Table III
The Population of the Grade VII Students of SMPN 5
Padangsidimpuan
No Class Total of Students
1 VII-1 24
2 VII-2 26
3 VII-3 25
4 VII-4 24
5 VII-5 24
6 VII-6 27
7 VII-7 22
8 VII-8 25
9 VII-9 26
10 VII-10 26
11 VII-11 22
TOTAL 247
(Source: data of students SMP Negeri 5 Padangsidimpuan from voice of
headmaster)
2.Sample
Arikunto says, “Sample is a part of population which will be
research”.40
In this research, the research used random sample to take the
class research. Random sampling is the process of selecting a sample in
such a way that all individu al is defined population have an equal and
independent chhance of being selected for the sample.41
So, the research reason uses random sampling technique in which all
population were randomized based on their class. The researcher used
random sampling technique because of all of the population were at the
same grade, curriculum, lesson, same age, and don’t use plesmentest.
40
Bungin. 41
Suharsimi Arikunto. Op.Cit. p.174.
37
Then, the research used the trick to take the sample using a lottery
technique of taking random sampling. All the population or all the grade VII
class are folded, then, the research shake them. After that, the research took
2 folded classses.42
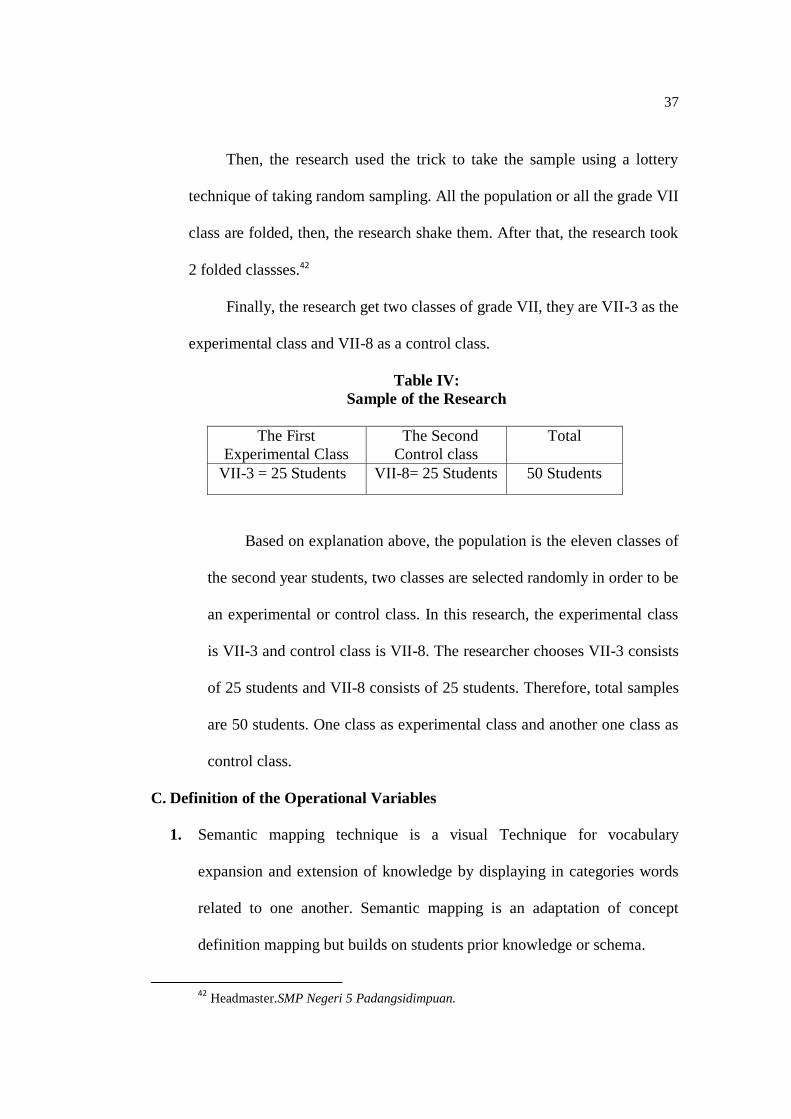
Finally, the research get two classes of grade VII, they are VII-3 as the
experimental class and VII-8 as a control class.
Table IV:
Sample of the Research
The First
Experimental Class
The Second
Control class
Total
VII-3 = 25 Students VII-8= 25 Students 50 Students
Based on explanation above, the population is the eleven classes of
the second year students, two classes are selected randomly in order to be
an experimental or control class. In this research, the experimental class
is VII-3 and control class is VII-8. The researcher chooses VII-3 consists
of 25 students and VII-8 consists of 25 students. Therefore, total samples
are 50 students. One class as experimental class and another one class as
control class.
C. Definition of the Operational Variables
1. Semantic mapping technique is a visual Technique for vocabulary
expansion and extension of knowledge by displaying in categories words
related to one another. Semantic mapping is an adaptation of concept
definition mapping but builds on students prior knowledge or schema.
42
Headmaster.SMP Negeri 5 Padangsidimpuan.

38
2. Students’ vocabulary mastery is students’ knowledge about the meaning of
word that use to identify Identify out side home, Identify in home, Identify
the school, Identify animal.
D. Instrument of Collecting Data
Good instruments certify the validity of the data. The researcher uses
instrument of validity and reliability for the taking the valid data. The research
uses test as instrumentation. Test is some of question or view or other tool used
for measure skill, knowledge, intelligence and ability.
The researcher was collect by giving multiple choice question. In this
research, the test consist of 100 questions, where 50 for pre-test, and 50 for
post-test. This test gives to both group, experiment and control class. To find
out the scores of the students’ answer, the researcher gives 2 score for each
item. Thus, the maximum score of test is 100.
39
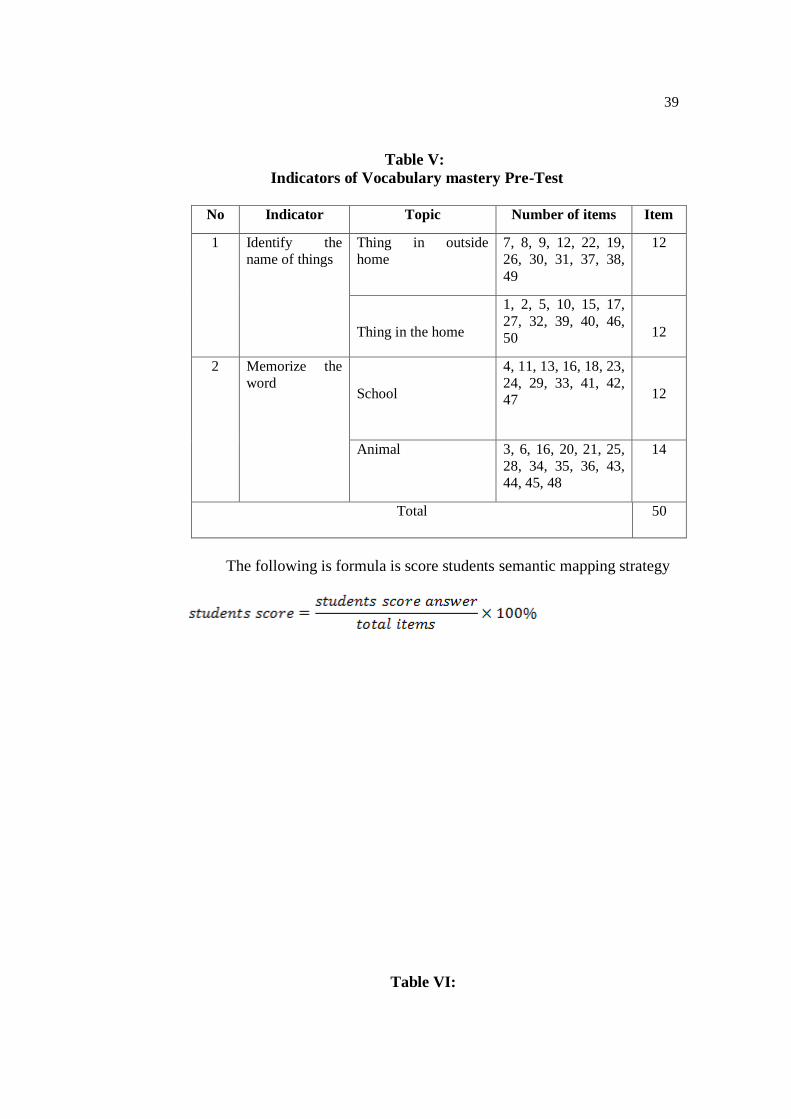
Table V:
Indicators of Vocabulary mastery Pre-Test
No Indicator Topic Number of items Item
1 Identify the
name of things
Thing in outside
home
7, 8, 9, 12, 22, 19,
26, 30, 31, 37, 38,
49
12
Thing in the home
1, 2, 5, 10, 15, 17,
27, 32, 39, 40, 46,
50
12
2 Memorize the
word
School
4, 11, 13, 16, 18, 23,
24, 29, 33, 41, 42,
47
12
Animal 3, 6, 16, 20, 21, 25,
28, 34, 35, 36, 43,
44, 45, 48
14
Total 50
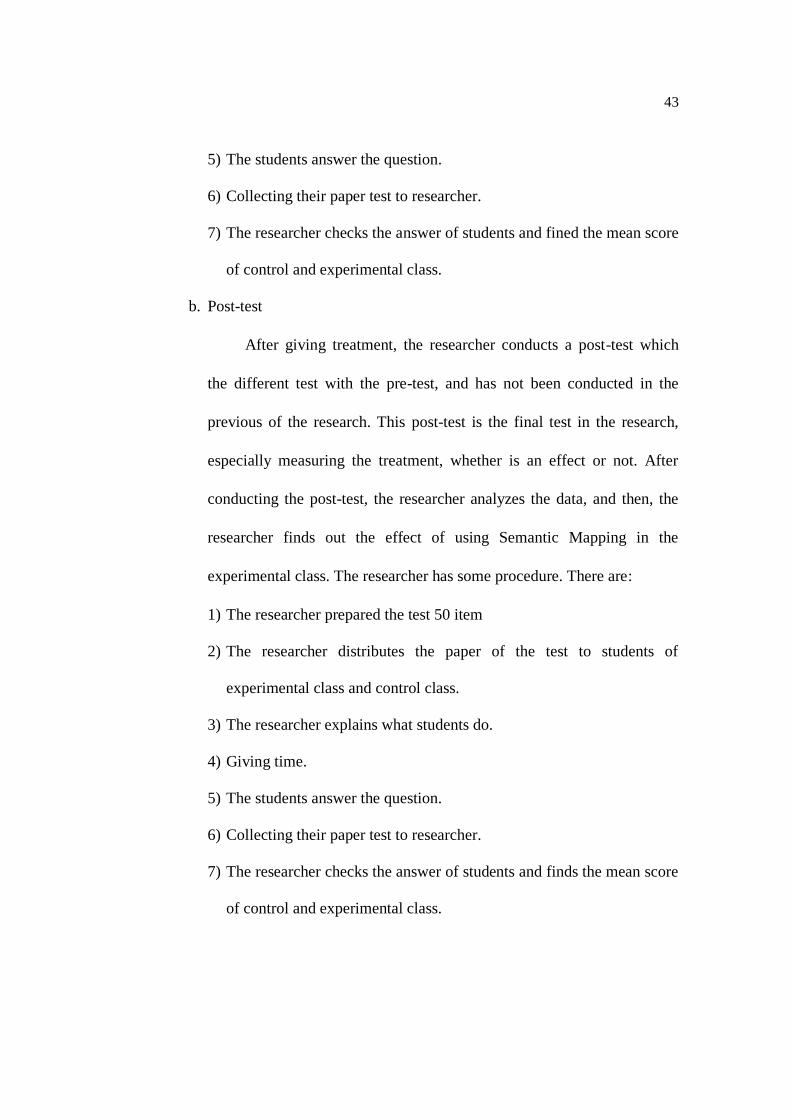
The following is formula is score students semantic mapping strategy
Table VI:
40
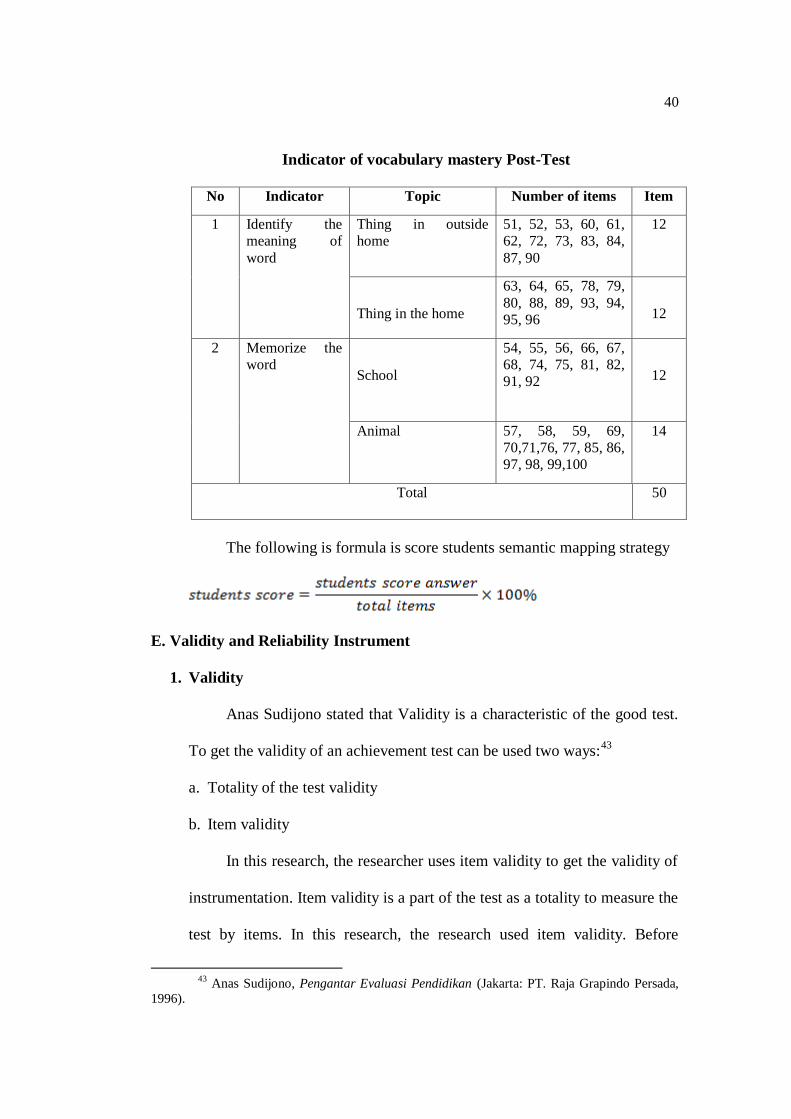
Indicator of vocabulary mastery Post-Test
No Indicator Topic Number of items Item
1 Identify the
meaning of
word
Thing in outside
home
51, 52, 53, 60, 61,
62, 72, 73, 83, 84,
87, 90
12
Thing in the home
63, 64, 65, 78, 79,
80, 88, 89, 93, 94,
95, 96
12
2 Memorize the
word
School
54, 55, 56, 66, 67,
68, 74, 75, 81, 82,
91, 92
12
Animal 57, 58, 59, 69,
70,71,76, 77, 85, 86,
97, 98, 99,100
14
Total 50
The following is formula is score students semantic mapping strategy
E. Validity and Reliability Instrument
1. Validity
Anas Sudijono stated that Validity is a characteristic of the good test.
To get the validity of an achievement test can be used two ways:43
a. Totality of the test validity
b. Item validity
In this research, the researcher uses item validity to get the validity of
instrumentation. Item validity is a part of the test as a totality to measure the
test by items. In this research, the research used item validity. Before
43
Anas Sudijono, Pengantar Evaluasi Pendidikan (Jakarta: PT. Raja Grapindo Persada,
1996).
41
validity, the test consist of questions 100 of multiple choice questions, 50
for pre-test and 50 for post-test. Meanwhile, after validity the test consist of
70 questions, 35 for pre-test and 35 for post-test.
To know the validity of the each question will be refer to list r biserial
with r t in 5% significant: 0, 361 and 1% significant: 0, 463. So, if r account>r
tablethe test is classified valid.
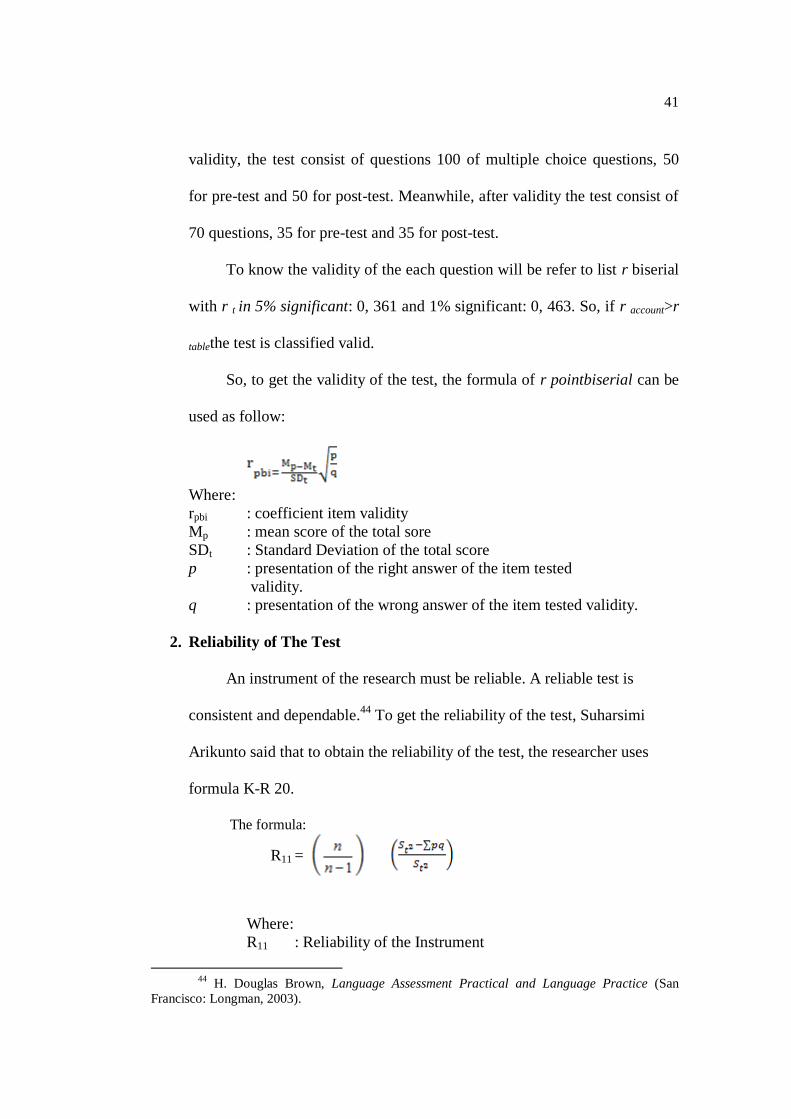
So, to get the validity of the test, the formula of r pointbiserial can be
used as follow:
Where:
rpbi : coefficient item validity
Mp : mean score of the total sore
SDt : Standard Deviation of the total score
p : presentation of the right answer of the item tested
validity.
q : presentation of the wrong answer of the item tested validity.
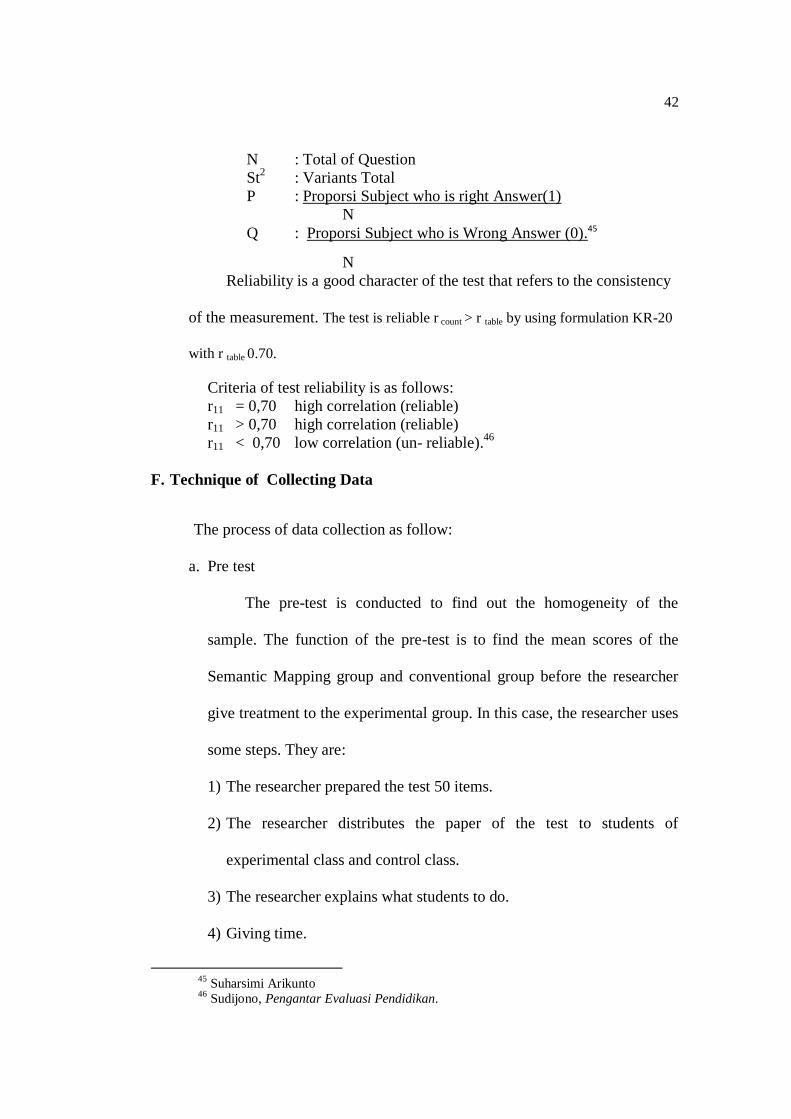
2. Reliability of The Test
An instrument of the research must be reliable. A reliable test is
consistent and dependable.44
To get the reliability of the test, Suharsimi
Arikunto said that to obtain the reliability of the test, the researcher uses
formula K-R 20.
The formula:
R11 =
Where:
R11 : Reliability of the Instrument
44
H. Douglas Brown, Language Assessment Practical and Language Practice (San
Francisco: Longman, 2003).
42
N : Total of Question
St2 : Variants Total
P : Proporsi Subject who is right Answer(1)
N
Q : Proporsi Subject who is Wrong Answer (0).45
N
Reliability is a good character of the test that refers to the consistency
of the measurement. The test is reliable r count > r table by using formulation KR-20
with r table 0.70.
Criteria of test reliability is as follows:
r11 = 0,70 high correlation (reliable)
r11 > 0,70 high correlation (reliable)
r11 < 0,70 low correlation (un- reliable).46
F. Technique of Collecting Data
The process of data collection as follow:
a. Pre test
The pre-test is conducted to find out the homogeneity of the
sample. The function of the pre-test is to find the mean scores of the
Semantic Mapping group and conventional group before the researcher
give treatment to the experimental group. In this case, the researcher uses
some steps. They are:
1) The researcher prepared the test 50 items.
2) The researcher distributes the paper of the test to students of
experimental class and control class.
3) The researcher explains what students to do.
4) Giving time.
45
Suharsimi Arikunto 46
Sudijono, Pengantar Evaluasi Pendidikan.
43
5) The students answer the question.
6) Collecting their paper test to researcher.
7) The researcher checks the answer of students and fined the mean score
of control and experimental class.
b. Post-test
After giving treatment, the researcher conducts a post-test which
the different test with the pre-test, and has not been conducted in the
previous of the research. This post-test is the final test in the research,
especially measuring the treatment, whether is an effect or not. After
conducting the post-test, the researcher analyzes the data, and then, the
researcher finds out the effect of using Semantic Mapping in the
experimental class. The researcher has some procedure. There are:
1) The researcher prepared the test 50 item
2) The researcher distributes the paper of the test to students of
experimental class and control class.
3) The researcher explains what students do.
4) Giving time.
5) The students answer the question.
6) Collecting their paper test to researcher.
7) The researcher checks the answer of students and finds the mean score
of control and experimental class.
44
G. Technique of Analyzing Data
In this research, the researcher uses the technique of data analysis as
follow:
Requirement Test
a. Normality test by using Chi – Quadrat formula, as follow:
h
ho
f
ffx2
Where:
x2 =Chi-Quadrate
fo =Frequency is gotten from the sample/result of observation
(questioner).
fh = Frequency is gotten from the sample as image from
frequency is hoped from the population
b. Homogeneity test
To test the data whether homogeny or not, the researcher uses
Harley rest, as follow:
F =
Hypotheses is accepted if tablecount FF
Hypotheses is rejected if tablecount FF .47
H. Hypothesis test
Based on the hypothesis, the analysis of the data was be done to find
out the ability of two groups that have been divided into experiment class
and control class. From the hypothesis is to answer the result of the
47
Agus Irianto, Sttistik Konsep Dasar Dan Aplikasinya (Padang: P2LPTK Departemen, Pendidikan Nasional, 2003).
45
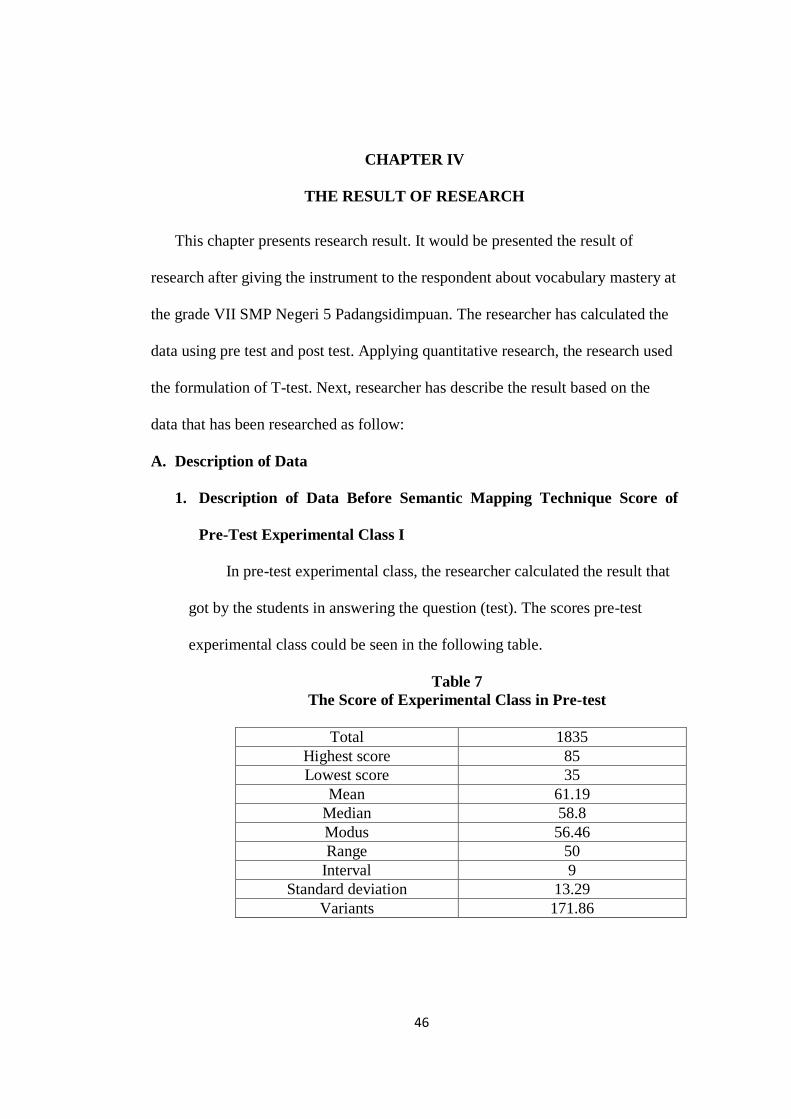
research. So, the data will be analyzed by using the following t-test
formula:48
Ha : 21
Ho : 21
If Ha: 21 , it means the result of students’ vocabulary mastery by
using Semantic Mapping at grade VII SMPN 3 Padangsidimpuan is better
than conventional Technique. But, if the H0: 21 , it means the result of
students’ vocabulary mastery by using Semantic Mapping at grade VII
SMPN 3 Padangsidimpuan was not better than conventional Technique. To
test the hypothesis, researcher uses the formula as follow:
s
nn
XXt
21
21
11
Where:
1x = Mean of experimental class sample
2x = Mean of control class sample
n1 = Total of experimental class sample
n2 = Total of control class sample.49
48
Suharsimi Arikunto 49
Sugiyono, Statistika Untuk Penelitian (Bandung: Alfabeta, 2011).
46
CHAPTER IV
THE RESULT OF RESEARCH
This chapter presents research result. It would be presented the result of
research after giving the instrument to the respondent about vocabulary mastery at
the grade VII SMP Negeri 5 Padangsidimpuan. The researcher has calculated the
data using pre test and post test. Applying quantitative research, the research used
the formulation of T-test. Next, researcher has describe the result based on the
data that has been researched as follow:
A. Description of Data
1. Description of Data Before Semantic Mapping Technique Score of
Pre-Test Experimental Class I
In pre-test experimental class, the researcher calculated the result that
got by the students in answering the question (test). The scores pre-test
experimental class could be seen in the following table.
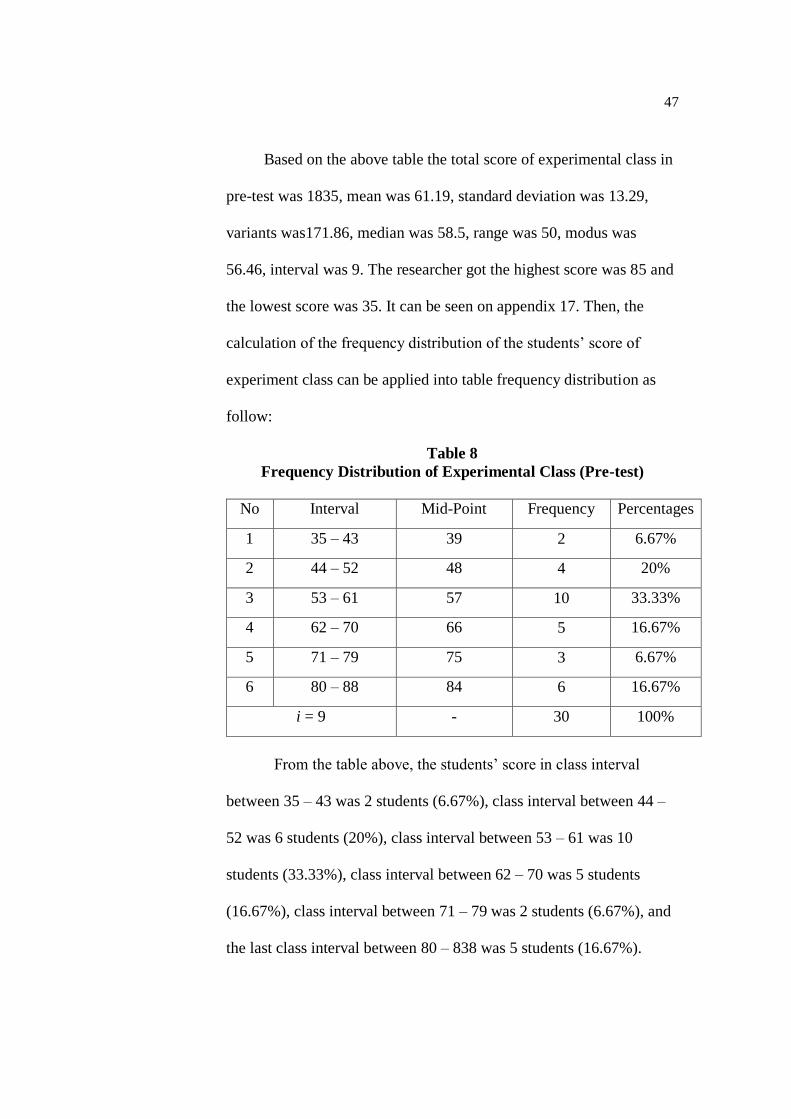
Table 7
The Score of Experimental Class in Pre-test
Total 1835
Highest score 85
Lowest score 35
Mean 61.19
Median 58.8
Modus 56.46
Range 50
Interval 9
Standard deviation 13.29
Variants 171.86
46
47
Based on the above table the total score of experimental class in
pre-test was 1835, mean was 61.19, standard deviation was 13.29,
variants was171.86, median was 58.5, range was 50, modus was
56.46, interval was 9. The researcher got the highest score was 85 and
the lowest score was 35. It can be seen on appendix 17. Then, the
calculation of the frequency distribution of the students’ score of
experiment class can be applied into table frequency distribution as
follow:
Table 8
Frequency Distribution of Experimental Class (Pre-test)
No Interval Mid-Point Frequency Percentages
1 35 – 43 39 2 6.67%
2 44 – 52 48 4 20%
3 53 – 61 57 10 33.33%
4 62 – 70 66 5 16.67%
5 71 – 79 75 3 6.67%
6 80 – 88 84 6 16.67%
i = 9 - 30 100%
From the table above, the students’ score in class interval
between 35 – 43 was 2 students (6.67%), class interval between 44 –
52 was 6 students (20%), class interval between 53 – 61 was 10
students (33.33%), class interval between 62 – 70 was 5 students
(16.67%), class interval between 71 – 79 was 2 students (6.67%), and
the last class interval between 80 – 838 was 5 students (16.67%).
48
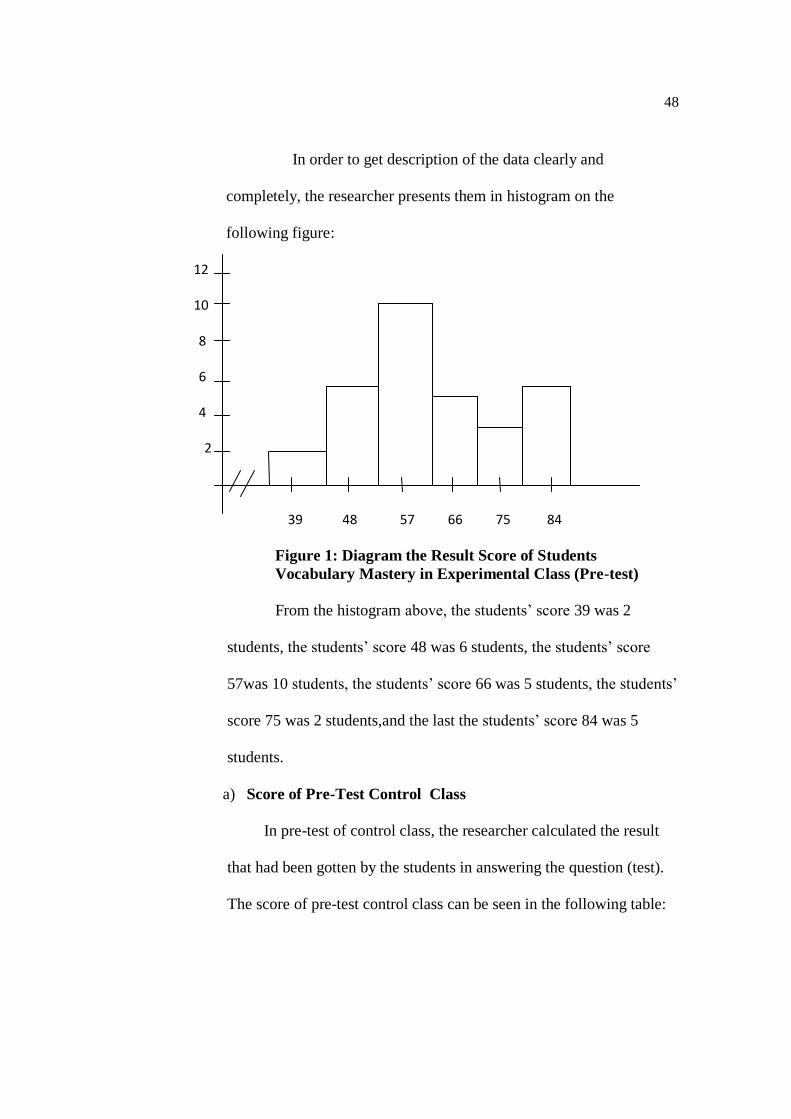
In order to get description of the data clearly and
completely, the researcher presents them in histogram on the
following figure:
12
10
8
6
4
2
39 48 57 66 75 84
Figure 1: Diagram the Result Score of Students
Vocabulary Mastery in Experimental Class (Pre-test)
From the histogram above, the students’ score 39 was 2
students, the students’ score 48 was 6 students, the students’ score
57was 10 students, the students’ score 66 was 5 students, the students’
score 75 was 2 students,and the last the students’ score 84 was 5
students.
a) Score of Pre-Test Control Class
In pre-test of control class, the researcher calculated the result
that had been gotten by the students in answering the question (test).
The score of pre-test control class can be seen in the following table:
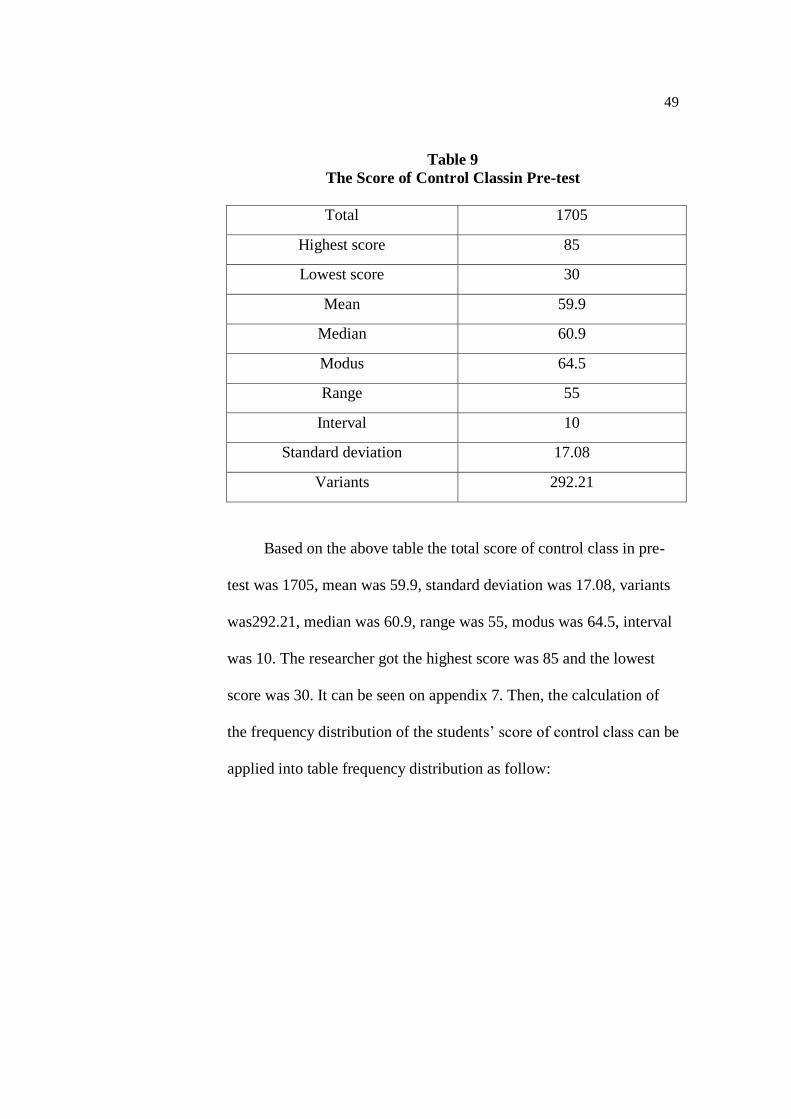
49
Table 9
The Score of Control Classin Pre-test
Total 1705
Highest score 85
Lowest score 30
Mean 59.9
Median 60.9
Modus 64.5
Range 55
Interval 10
Standard deviation 17.08
Variants 292.21
Based on the above table the total score of control class in pre-
test was 1705, mean was 59.9, standard deviation was 17.08, variants
was292.21, median was 60.9, range was 55, modus was 64.5, interval
was 10. The researcher got the highest score was 85 and the lowest
score was 30. It can be seen on appendix 7. Then, the calculation of
the frequency distribution of the students’ score of control class can be
applied into table frequency distribution as follow:
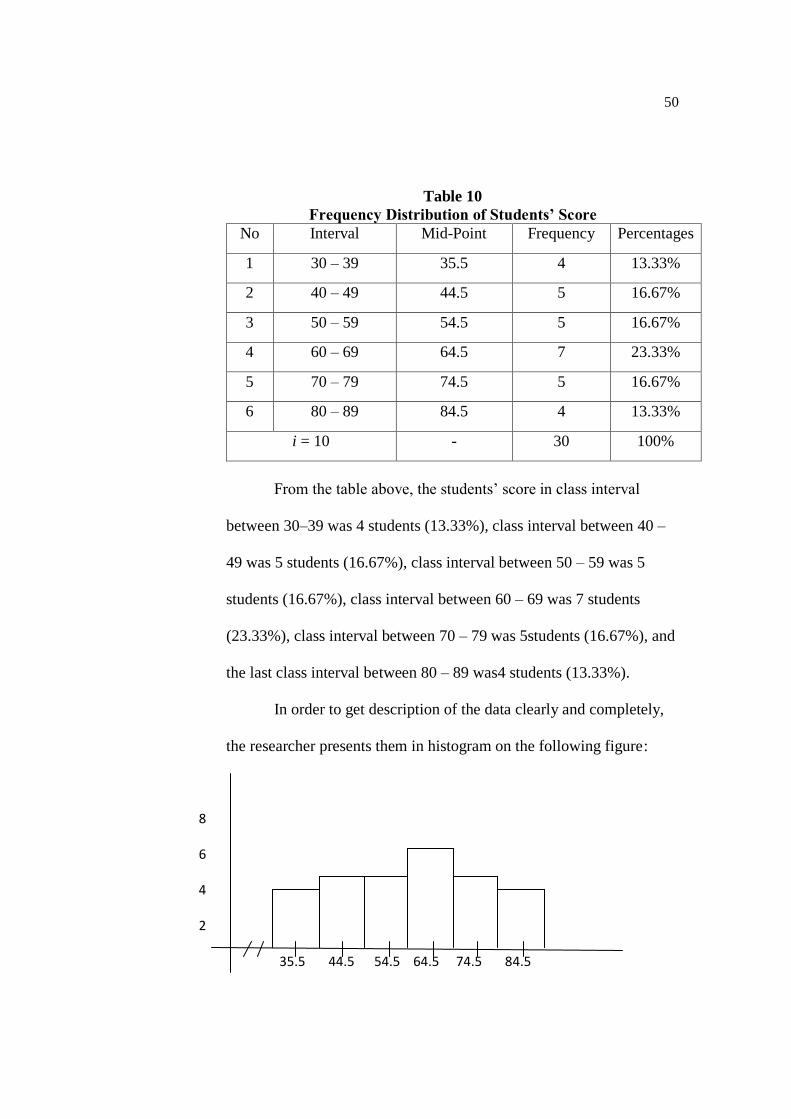
50
Table 10
Frequency Distribution of Students’ Score
No Interval Mid-Point Frequency Percentages
1 30 – 39 35.5 4 13.33%
2 40 – 49 44.5 5 16.67%
3 50 – 59 54.5 5 16.67%
4 60 – 69 64.5 7 23.33%
5 70 – 79 74.5 5 16.67%
6 80 – 89 84.5 4 13.33%
i = 10 - 30 100%
From the table above, the students’ score in class interval
between 30–39 was 4 students (13.33%), class interval between 40 –
49 was 5 students (16.67%), class interval between 50 – 59 was 5
students (16.67%), class interval between 60 – 69 was 7 students
(23.33%), class interval between 70 – 79 was 5students (16.67%), and
the last class interval between 80 – 89 was4 students (13.33%).
In order to get description of the data clearly and completely,
the researcher presents them in histogram on the following figure:
8
6
4
2
35.5 44.5 54.5 64.5 74.5 84.5
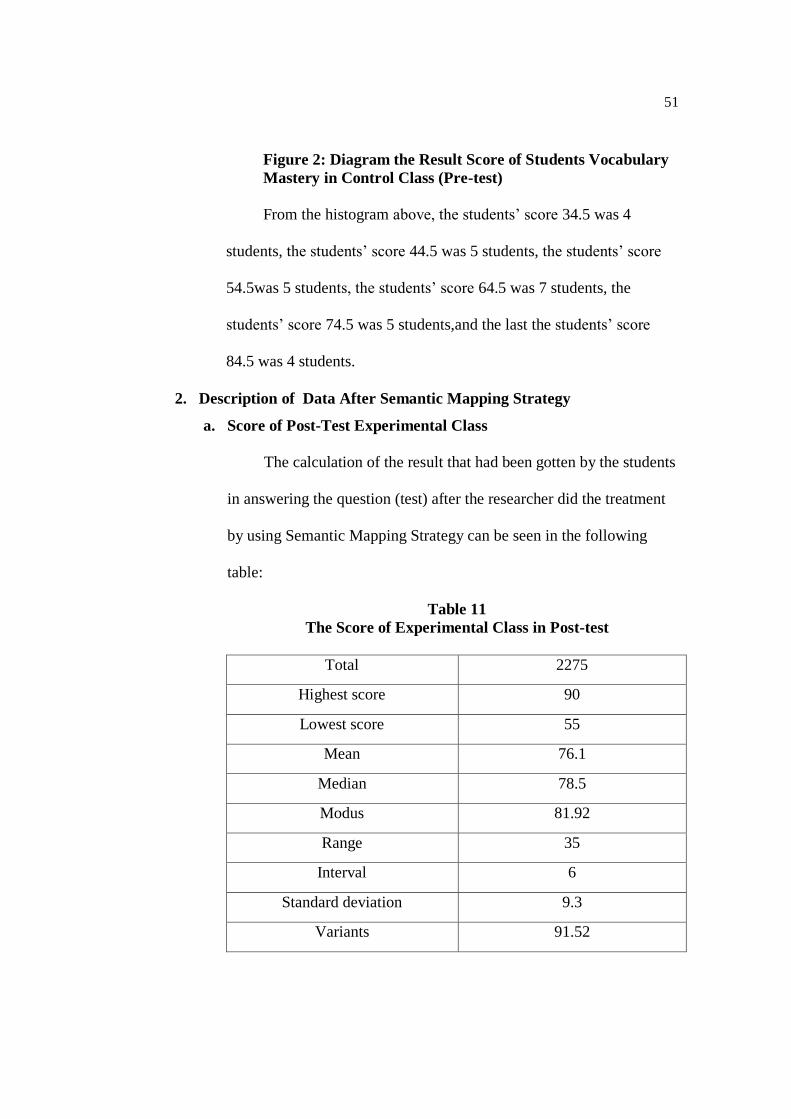
51
Figure 2: Diagram the Result Score of Students Vocabulary
Mastery in Control Class (Pre-test)
From the histogram above, the students’ score 34.5 was 4
students, the students’ score 44.5 was 5 students, the students’ score
54.5was 5 students, the students’ score 64.5 was 7 students, the
students’ score 74.5 was 5 students,and the last the students’ score
84.5 was 4 students.
2. Description of Data After Semantic Mapping Strategy
a. Score of Post-Test Experimental Class
The calculation of the result that had been gotten by the students
in answering the question (test) after the researcher did the treatment
by using Semantic Mapping Strategy can be seen in the following
table:
Table 11
The Score of Experimental Class in Post-test
Total 2275
Highest score 90
Lowest score 55
Mean 76.1
Median 78.5
Modus 81.92
Range 35
Interval 6
Standard deviation 9.3
Variants 91.52
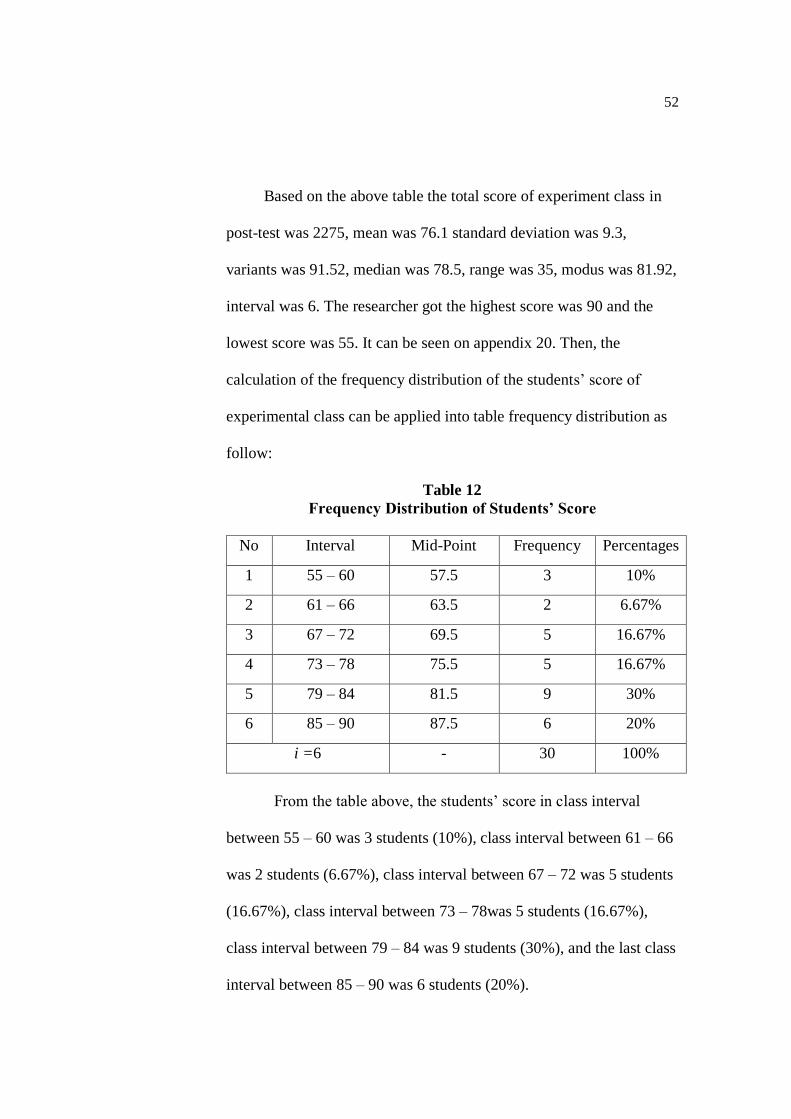
52
Based on the above table the total score of experiment class in
post-test was 2275, mean was 76.1 standard deviation was 9.3,
variants was 91.52, median was 78.5, range was 35, modus was 81.92,
interval was 6. The researcher got the highest score was 90 and the
lowest score was 55. It can be seen on appendix 20. Then, the
calculation of the frequency distribution of the students’ score of
experimental class can be applied into table frequency distribution as
follow:
Table 12
Frequency Distribution of Students’ Score
No Interval Mid-Point Frequency Percentages
1 55 – 60 57.5 3 10%
2 61 – 66 63.5 2 6.67%
3 67 – 72 69.5 5 16.67%
4 73 – 78 75.5 5 16.67%
5 79 – 84 81.5 9 30%
6 85 – 90 87.5 6 20%
i =6 - 30 100%
From the table above, the students’ score in class interval
between 55 – 60 was 3 students (10%), class interval between 61 – 66
was 2 students (6.67%), class interval between 67 – 72 was 5 students
(16.67%), class interval between 73 – 78was 5 students (16.67%),
class interval between 79 – 84 was 9 students (30%), and the last class
interval between 85 – 90 was 6 students (20%).
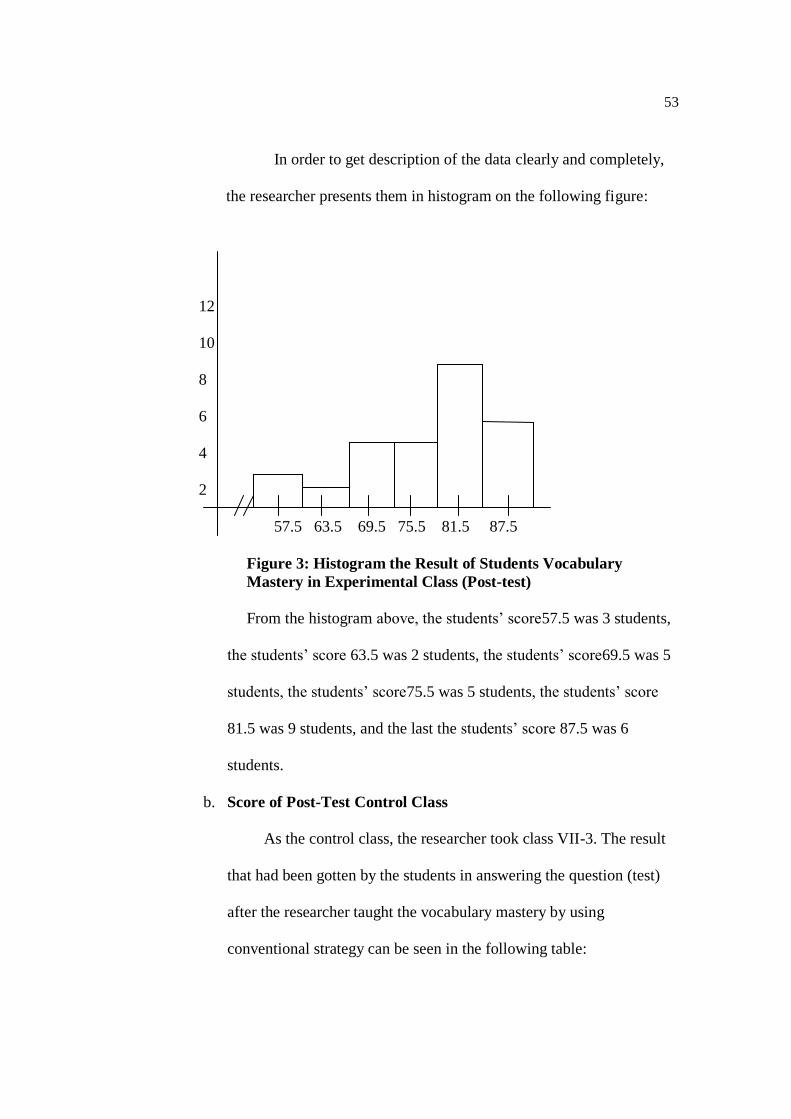
53
In order to get description of the data clearly and completely,
the researcher presents them in histogram on the following figure:
12
10
8
6
4
2
57.5 63.5 69.5 75.5 81.5 87.5
Figure 3: Histogram the Result of Students Vocabulary
Mastery in Experimental Class (Post-test)
From the histogram above, the students’ score57.5 was 3 students,
the students’ score 63.5 was 2 students, the students’ score69.5 was 5
students, the students’ score75.5 was 5 students, the students’ score
81.5 was 9 students, and the last the students’ score 87.5 was 6
students.
b. Score of Post-Test Control Class
As the control class, the researcher took class VII-3. The result
that had been gotten by the students in answering the question (test)
after the researcher taught the vocabulary mastery by using
conventional strategy can be seen in the following table:
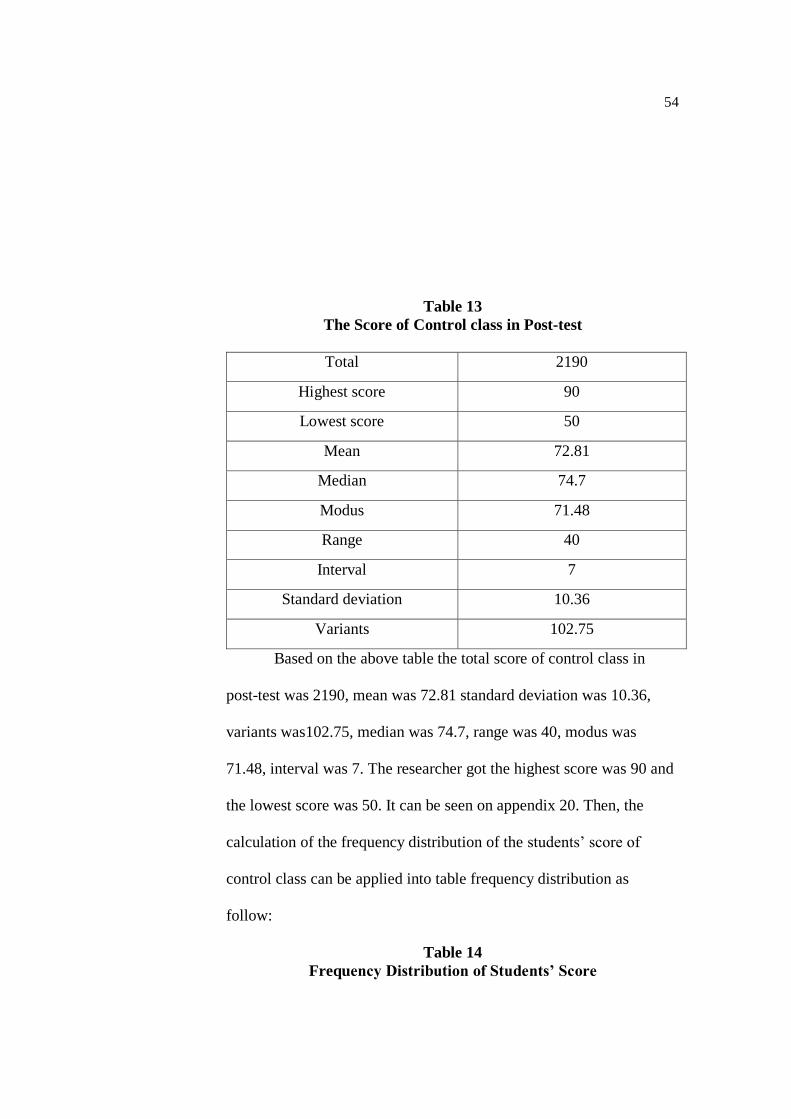
54
Table 13
The Score of Control class in Post-test
Total 2190
Highest score 90
Lowest score 50
Mean 72.81
Median 74.7
Modus 71.48
Range 40
Interval 7
Standard deviation 10.36
Variants 102.75
Based on the above table the total score of control class in
post-test was 2190, mean was 72.81 standard deviation was 10.36,
variants was102.75, median was 74.7, range was 40, modus was
71.48, interval was 7. The researcher got the highest score was 90 and
the lowest score was 50. It can be seen on appendix 20. Then, the
calculation of the frequency distribution of the students’ score of
control class can be applied into table frequency distribution as
follow:
Table 14
Frequency Distribution of Students’ Score
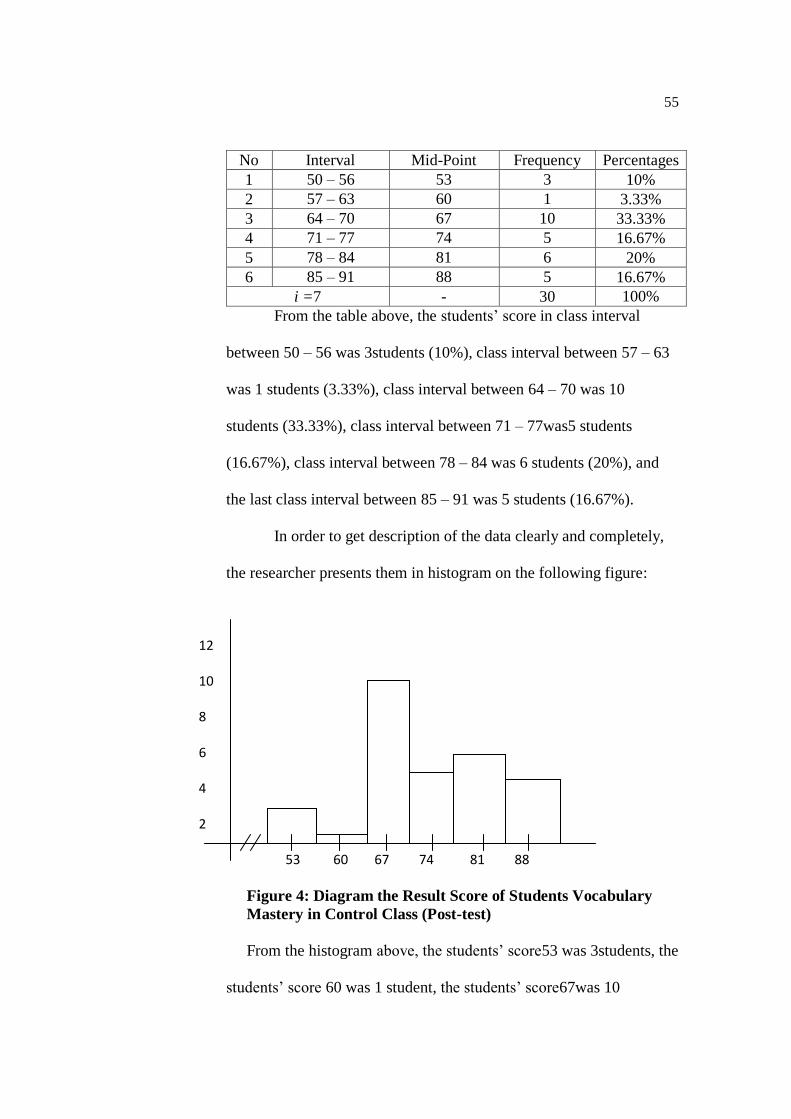
55
No Interval Mid-Point Frequency Percentages
1 50 – 56 53 3 10%
2 57 – 63 60 1 3.33%
3 64 – 70 67 10 33.33%
4 71 – 77 74 5 16.67%
5 78 – 84 81 6 20%
6 85 – 91 88 5 16.67%
i =7 - 30 100%
From the table above, the students’ score in class interval
between 50 – 56 was 3students (10%), class interval between 57 – 63
was 1 students (3.33%), class interval between 64 – 70 was 10
students (33.33%), class interval between 71 – 77was5 students
(16.67%), class interval between 78 – 84 was 6 students (20%), and
the last class interval between 85 – 91 was 5 students (16.67%).
In order to get description of the data clearly and completely,
the researcher presents them in histogram on the following figure:
12
10
8
6
4
2
53 60 67 74 81 88
Figure 4: Diagram the Result Score of Students Vocabulary
Mastery in Control Class (Post-test)
From the histogram above, the students’ score53 was 3students, the
students’ score 60 was 1 student, the students’ score67was 10
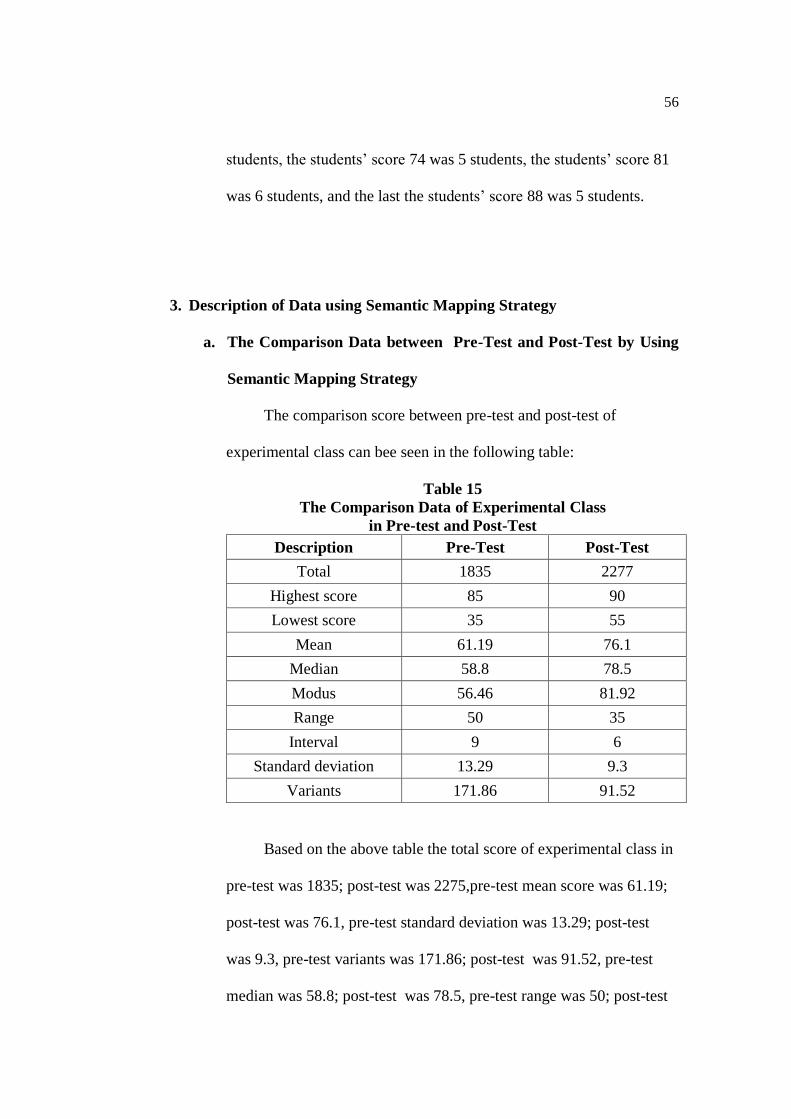
56
students, the students’ score 74 was 5 students, the students’ score 81
was 6 students, and the last the students’ score 88 was 5 students.
3. Description of Data using Semantic Mapping Strategy
a. The Comparison Data between Pre-Test and Post-Test by Using
Semantic Mapping Strategy
The comparison score between pre-test and post-test of
experimental class can bee seen in the following table:
Table 15
The Comparison Data of Experimental Class
in Pre-test and Post-Test
Description Pre-Test Post-Test
Total 1835 2277
Highest score 85 90
Lowest score 35 55
Mean 61.19 76.1
Median 58.8 78.5
Modus 56.46 81.92
Range 50 35
Interval 9 6
Standard deviation 13.29 9.3
Variants 171.86 91.52
Based on the above table the total score of experimental class in
pre-test was 1835; post-test was 2275,pre-test mean score was 61.19;
post-test was 76.1, pre-test standard deviation was 13.29; post-test
was 9.3, pre-test variants was 171.86; post-test was 91.52, pre-test
median was 58.8; post-test was 78.5, pre-test range was 50; post-test
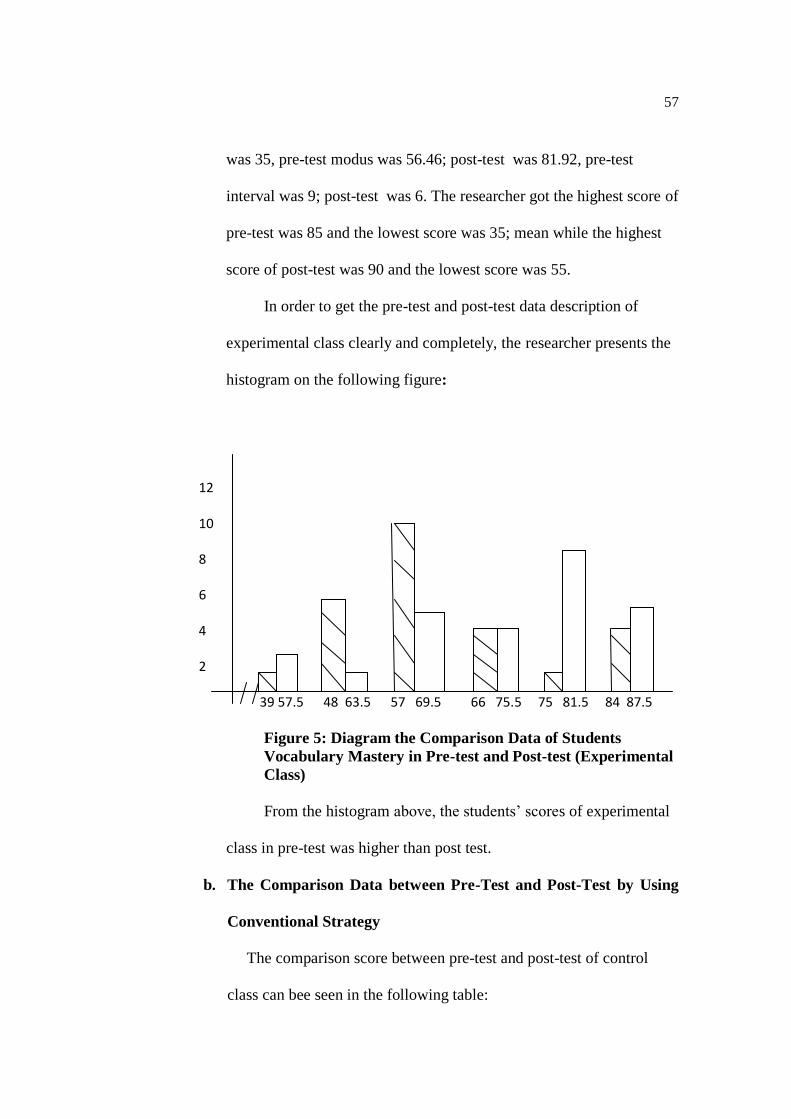
57
was 35, pre-test modus was 56.46; post-test was 81.92, pre-test
interval was 9; post-test was 6. The researcher got the highest score of
pre-test was 85 and the lowest score was 35; mean while the highest
score of post-test was 90 and the lowest score was 55.
In order to get the pre-test and post-test data description of
experimental class clearly and completely, the researcher presents the
histogram on the following figure:
12
10
8
6
4
2
39 57.5 48 63.5 57 69.5 66 75.5 75 81.5 84 87.5
Figure 5: Diagram the Comparison Data of Students
Vocabulary Mastery in Pre-test and Post-test (Experimental
Class)
From the histogram above, the students’ scores of experimental
class in pre-test was higher than post test.
b. The Comparison Data between Pre-Test and Post-Test by Using
Conventional Strategy
The comparison score between pre-test and post-test of control
class can bee seen in the following table:
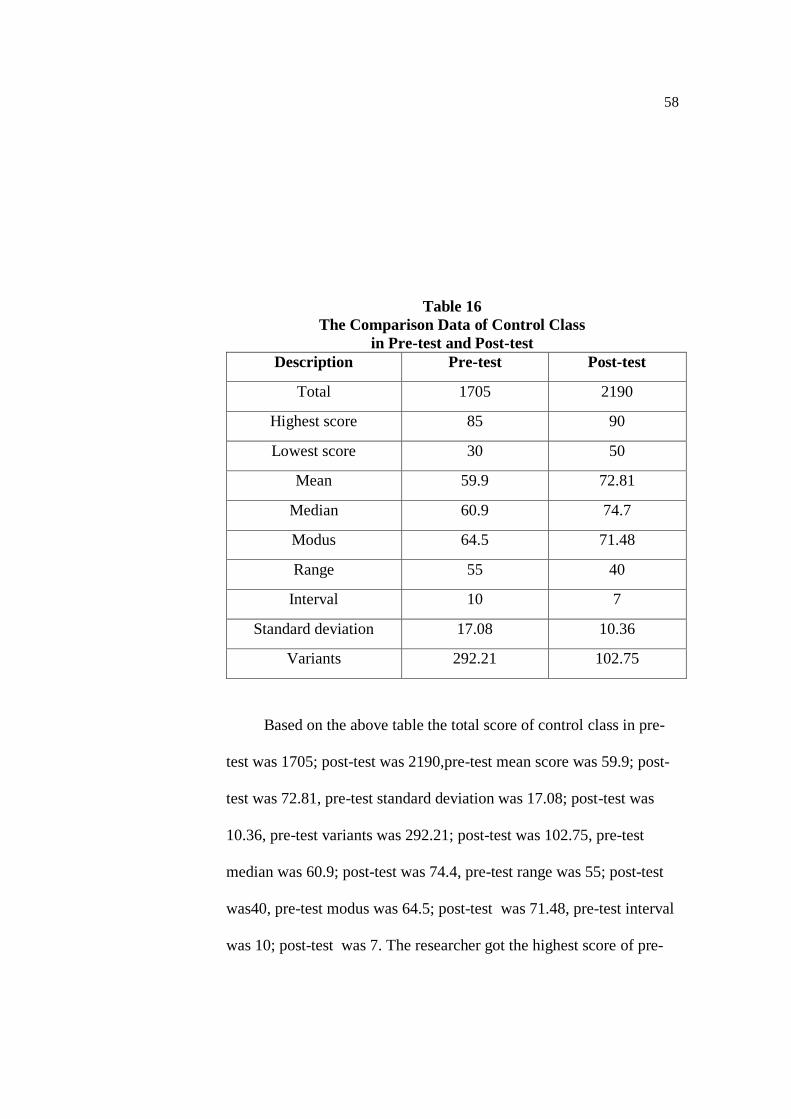
58
Table 16
The Comparison Data of Control Class
in Pre-test and Post-test
Description Pre-test Post-test
Total 1705 2190
Highest score 85 90
Lowest score 30 50
Mean 59.9 72.81
Median 60.9 74.7
Modus 64.5 71.48
Range 55 40
Interval 10 7
Standard deviation 17.08 10.36
Variants 292.21 102.75
Based on the above table the total score of control class in pre-
test was 1705; post-test was 2190,pre-test mean score was 59.9; post-
test was 72.81, pre-test standard deviation was 17.08; post-test was
10.36, pre-test variants was 292.21; post-test was 102.75, pre-test
median was 60.9; post-test was 74.4, pre-test range was 55; post-test
was40, pre-test modus was 64.5; post-test was 71.48, pre-test interval
was 10; post-test was 7. The researcher got the highest score of pre-
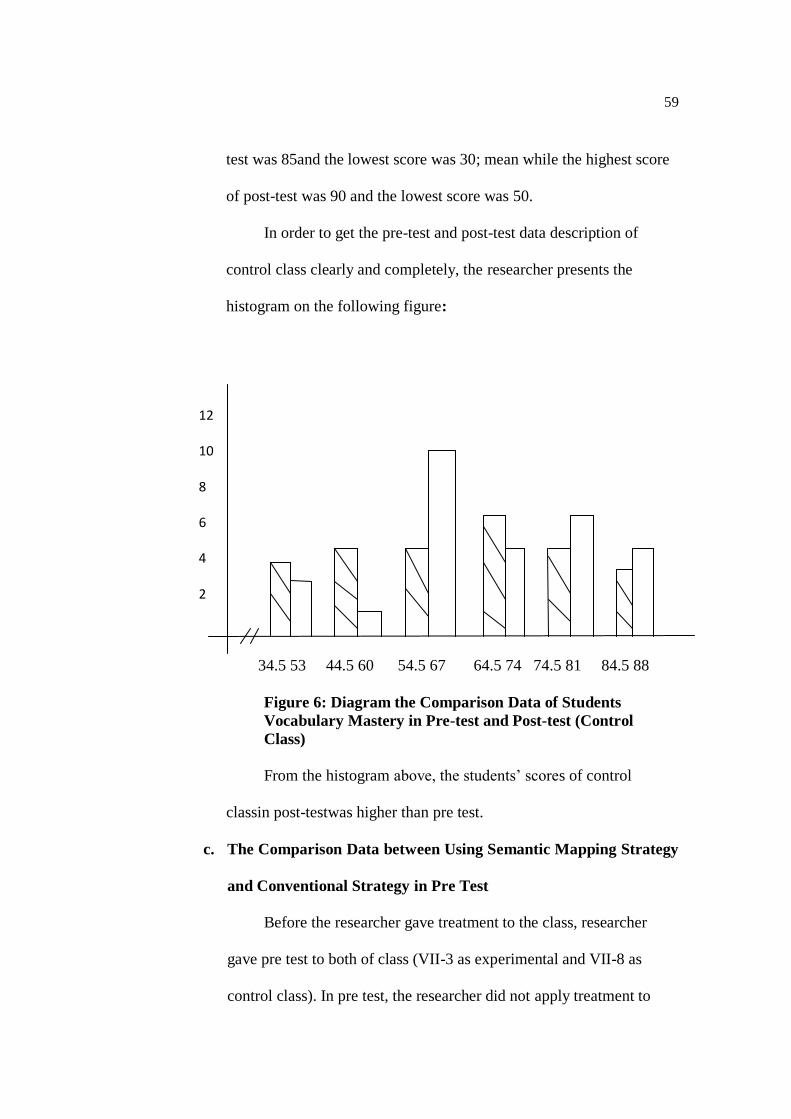
59
test was 85and the lowest score was 30; mean while the highest score
of post-test was 90 and the lowest score was 50.
In order to get the pre-test and post-test data description of
control class clearly and completely, the researcher presents the
histogram on the following figure:
12
10
8
6
4
2
34.5 53 44.5 60 54.5 67 64.5 74 74.5 81 84.5 88
Figure 6: Diagram the Comparison Data of Students
Vocabulary Mastery in Pre-test and Post-test (Control
Class)
From the histogram above, the students’ scores of control
classin post-testwas higher than pre test.
c. The Comparison Data between Using Semantic Mapping Strategy
and Conventional Strategy in Pre Test
Before the researcher gave treatment to the class, researcher
gave pre test to both of class (VII-3 as experimental and VII-8 as
control class). In pre test, the researcher did not apply treatment to
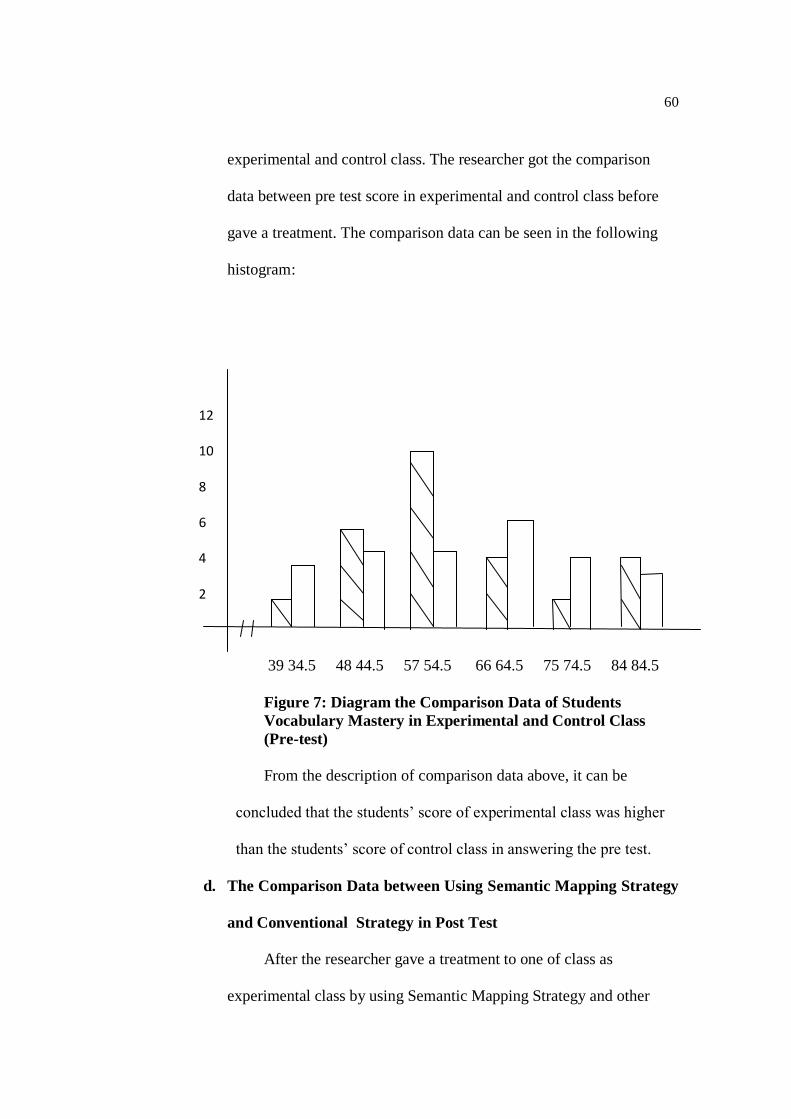
60
experimental and control class. The researcher got the comparison
data between pre test score in experimental and control class before
gave a treatment. The comparison data can be seen in the following
histogram:
12
10
8
6
4
2
39 34.5 48 44.5 57 54.5 66 64.5 75 74.5 84 84.5
Figure 7: Diagram the Comparison Data of Students
Vocabulary Mastery in Experimental and Control Class
(Pre-test)
From the description of comparison data above, it can be
concluded that the students’ score of experimental class was higher
than the students’ score of control class in answering the pre test.
d. The Comparison Data between Using Semantic Mapping Strategy
and Conventional Strategy in Post Test
After the researcher gave a treatment to one of class as
experimental class by using Semantic Mapping Strategy and other
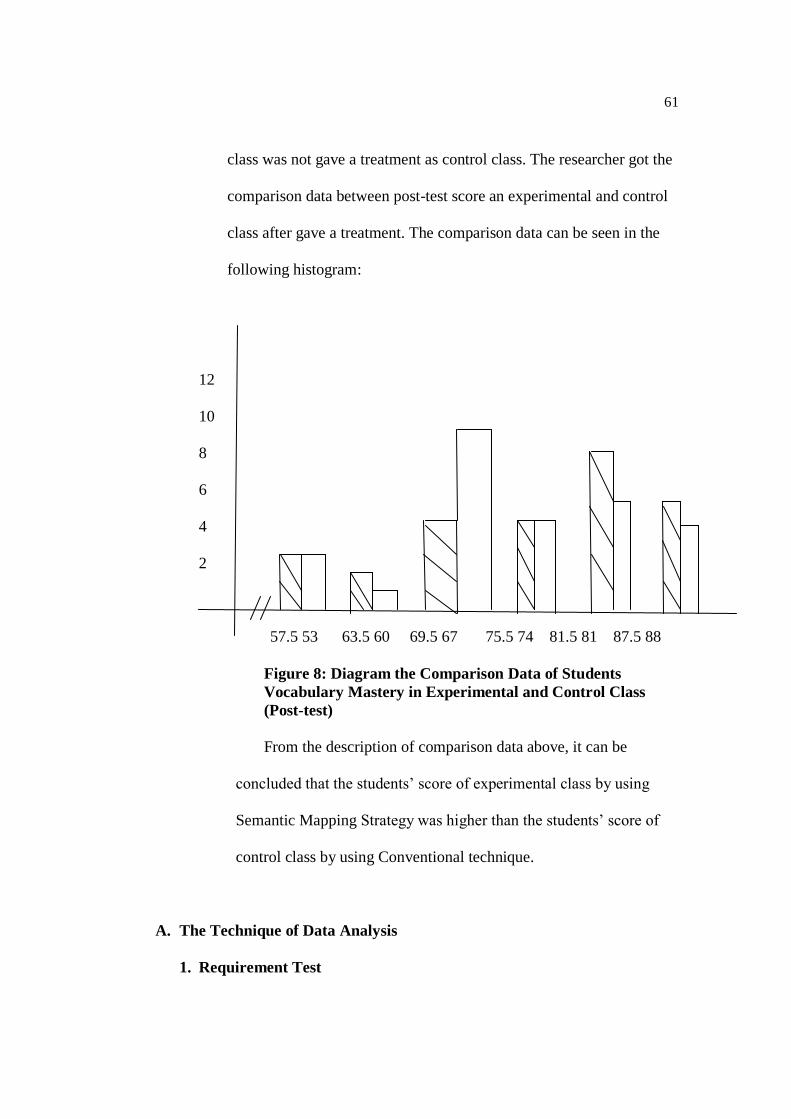
61
class was not gave a treatment as control class. The researcher got the
comparison data between post-test score an experimental and control
class after gave a treatment. The comparison data can be seen in the
following histogram:
12
10
8
6
4
2
57.5 53 63.5 60 69.5 67 75.5 74 81.5 81 87.5 88
Figure 8: Diagram the Comparison Data of Students
Vocabulary Mastery in Experimental and Control Class
(Post-test)
From the description of comparison data above, it can be
concluded that the students’ score of experimental class by using
Semantic Mapping Strategy was higher than the students’ score of
control class by using Conventional technique.
A. The Technique of Data Analysis
1. Requirement Test
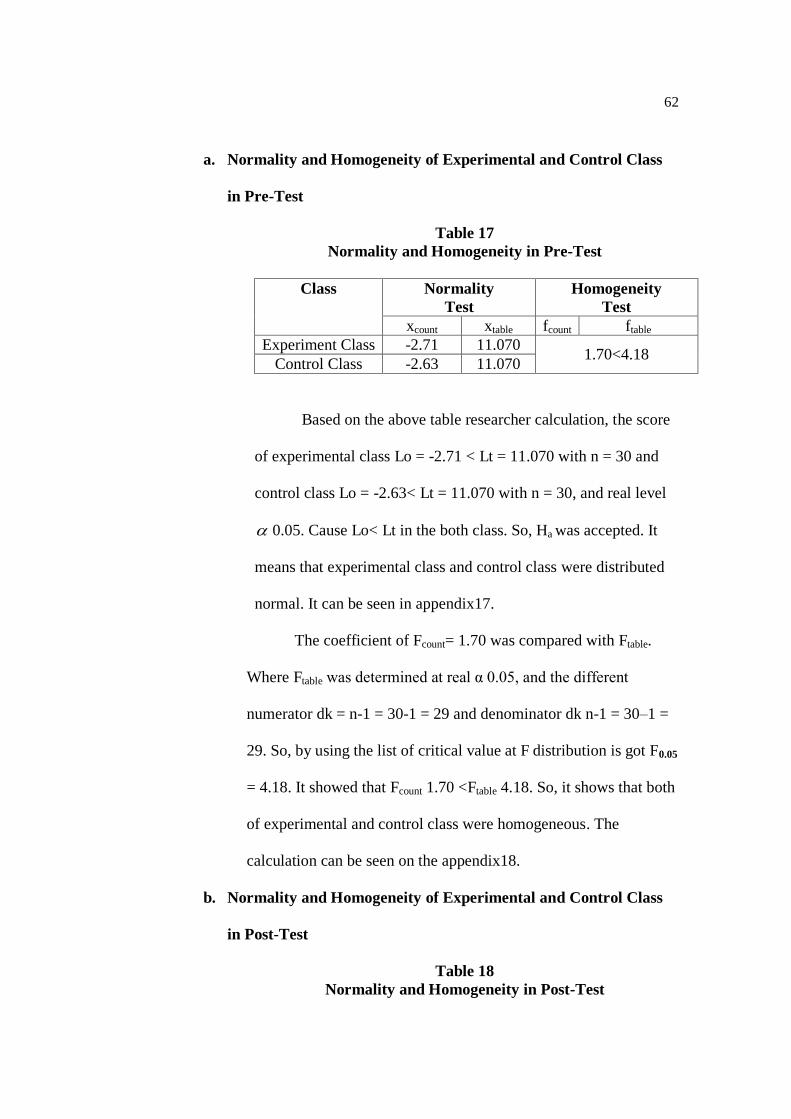
62
a. Normality and Homogeneity of Experimental and Control Class
in Pre-Test
Table 17
Normality and Homogeneity in Pre-Test
Class Normality
Test
Homogeneity
Test
xcount xtable fcount ftable
Experiment Class -2.71 11.070 1.70<4.18
Control Class -2.63 11.070
Based on the above table researcher calculation, the score
of experimental class Lo = -2.71 < Lt = 11.070 with n = 30 and
control class Lo = -2.63< Lt = 11.070 with n = 30, and real level
0.05. Cause Lo< Lt in the both class. So, Ha was accepted. It
means that experimental class and control class were distributed
normal. It can be seen in appendix17.
The coefficient of Fcount= 1.70 was compared with Ftable.
Where Ftable was determined at real α 0.05, and the different
numerator dk = n-1 = 30-1 = 29 and denominator dk n-1 = 30–1 =
29. So, by using the list of critical value at F distribution is got F0.05
= 4.18. It showed that Fcount 1.70 <Ftable 4.18. So, it shows that both
of experimental and control class were homogeneous. The
calculation can be seen on the appendix18.
b. Normality and Homogeneity of Experimental and Control Class
in Post-Test
Table 18
Normality and Homogeneity in Post-Test
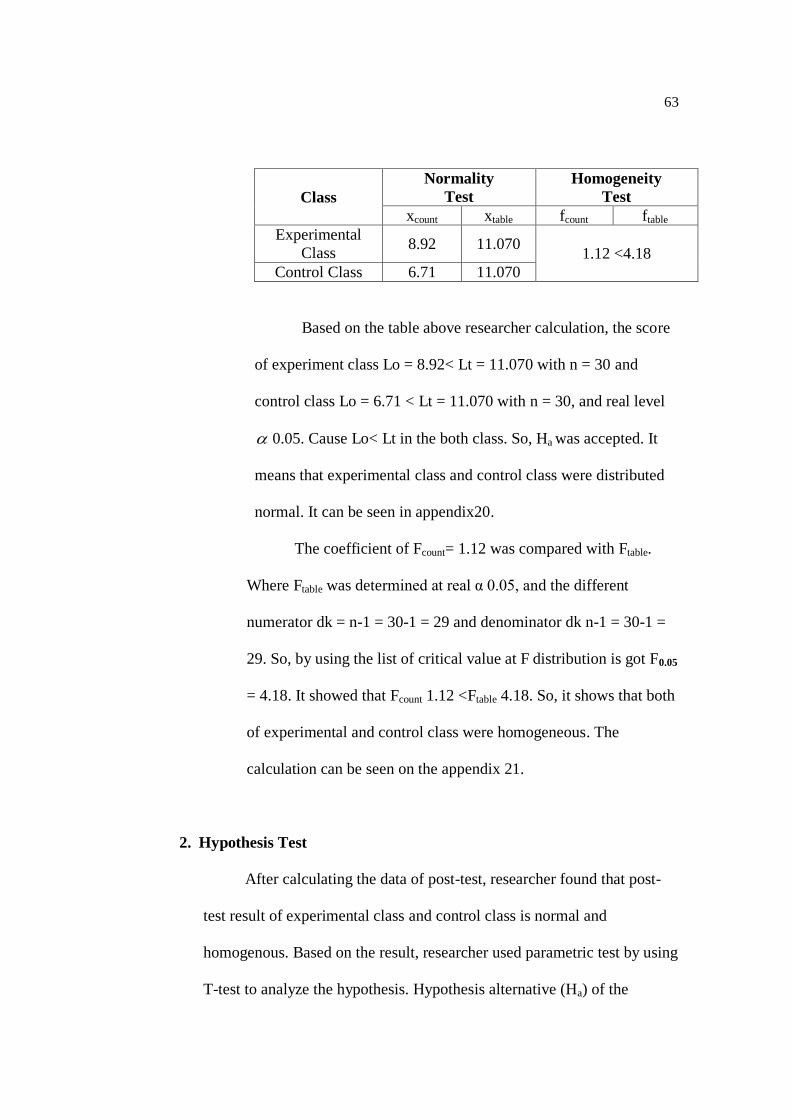
63
Class
Normality
Test
Homogeneity
Test
xcount xtable fcount ftable
Experimental
Class 8.92 11.070
1.12 <4.18
Control Class 6.71 11.070
Based on the table above researcher calculation, the score
of experiment class Lo = 8.92< Lt = 11.070 with n = 30 and
control class Lo = 6.71 < Lt = 11.070 with n = 30, and real level
0.05. Cause Lo< Lt in the both class. So, Ha was accepted. It
means that experimental class and control class were distributed
normal. It can be seen in appendix20.
The coefficient of Fcount= 1.12 was compared with Ftable.
Where Ftable was determined at real α 0.05, and the different
numerator dk = n-1 = 30-1 = 29 and denominator dk n-1 = 30-1 =
29. So, by using the list of critical value at F distribution is got F0.05
= 4.18. It showed that Fcount 1.12 <Ftable 4.18. So, it shows that both
of experimental and control class were homogeneous. The
calculation can be seen on the appendix 21.
2. Hypothesis Test
After calculating the data of post-test, researcher found that post-
test result of experimental class and control class is normal and
homogenous. Based on the result, researcher used parametric test by using
T-test to analyze the hypothesis. Hypothesis alternative (Ha) of the
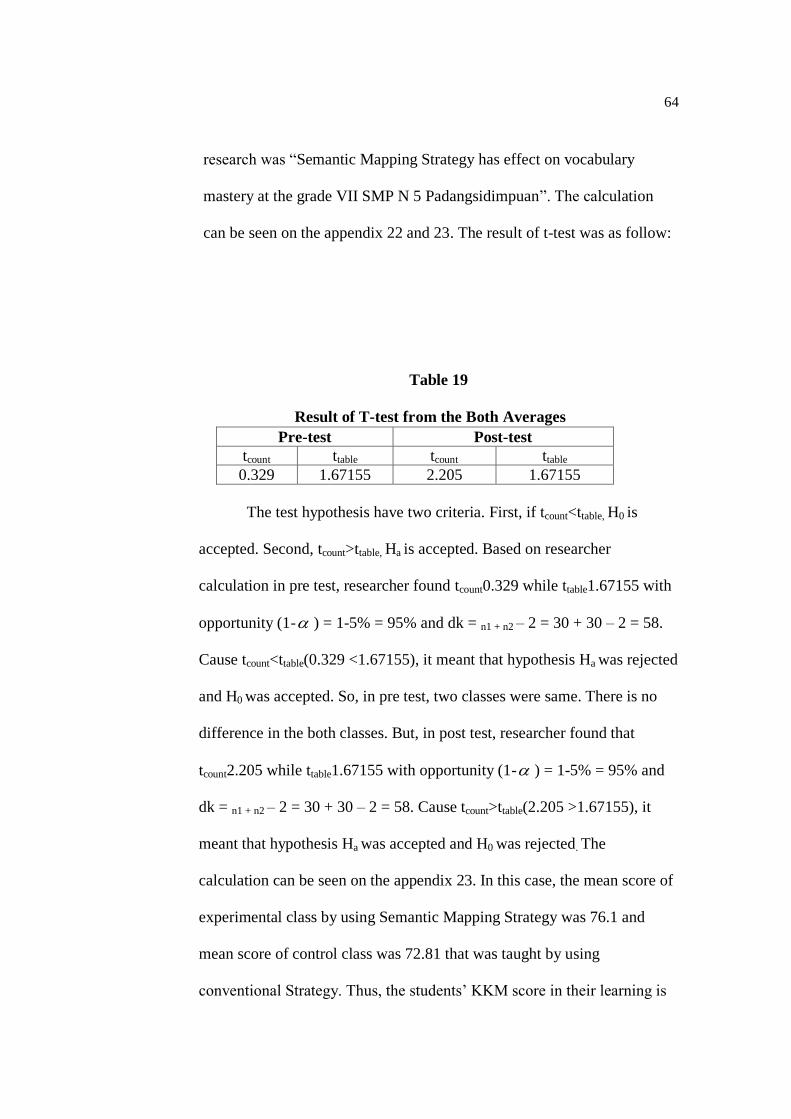
64
research was “Semantic Mapping Strategy has effect on vocabulary
mastery at the grade VII SMP N 5 Padangsidimpuan”. The calculation
can be seen on the appendix 22 and 23. The result of t-test was as follow:
Table 19
Result of T-test from the Both Averages
Pre-test Post-test
tcount ttable tcount ttable
0.329 1.67155 2.205 1.67155
The test hypothesis have two criteria. First, if tcount<ttable, H0 is
accepted. Second, tcount>ttable, Ha is accepted. Based on researcher
calculation in pre test, researcher found tcount0.329 while ttable1.67155 with
opportunity (1- ) = 1-5% = 95% and dk = n1 + n2 – 2 = 30 + 30 – 2 = 58.
Cause tcount<ttable(0.329 <1.67155), it meant that hypothesis Ha was rejected
and H0 was accepted. So, in pre test, two classes were same. There is no
difference in the both classes. But, in post test, researcher found that
tcount2.205 while ttable1.67155 with opportunity (1- ) = 1-5% = 95% and
dk = n1 + n2 – 2 = 30 + 30 – 2 = 58. Cause tcount>ttable(2.205 >1.67155), it
meant that hypothesis Ha was accepted and H0 was rejected. The
calculation can be seen on the appendix 23. In this case, the mean score of
experimental class by using Semantic Mapping Strategy was 76.1 and
mean score of control class was 72.81 that was taught by using
conventional Strategy. Thus, the students’ KKM score in their learning is
65
75 that become their category in achievement. So, there was the effect of
Semantic Mapping Strategy on vocabulary mastery at the grade VII SMP
N 5 Padangsidimpuan.
B. The Discussion
There are some related findings related to this research. The first is
Ahmadin Azhar “The Effect of Using Media Video Dora the Explorer to
Students’ Vocabulary Mastery at SD Negeri 200201/4 Padangsidimpuan”. He
concluded that there is the effect of using media video Dore The Explorer,
where the mean score is 93.26 and control class is 83.04, with t0 is higher than
tt (12.77 > 1.68). So, the implication of media video Dora the Explorer is better
than conventional strategy.50
The second is Ahmad Nurul Furqon “Using Direct method in Teaching
Vocabulary at First Grade of Private Junior High School Muhammadiyah 44
Pamulang.51
He concluded that there is no the effect of direct method, with t0 is
smaller than tt ( 1,882 > 87) . So, the null hypothesis is accepted and the
alternative hypothesis is rejected, or it can be said that there is no significant
influence of using direct method in teaching vocabulary.
50
Ahmadin Azhari, “The Effect of Using Media Video Dora The Explorer to Students’
Vocabulary Mastery at SD Negeri 200201/4 Padangsidimpuan 2011/2012 Academic Year”
(STAIN Padangsidimpuan, 2012). 51
Ahmad Nurul Furqon, “Using Direct Method in Teaching Vocabulary at First Grade of
Private Junior High School Muhammadiyah 44 Pamulang” (Syarif Hidayatullah State Islamic
University, 2007).
66
The Third is Siti Juhaeriyah “The Influence of Using Direct Method in
Teaching Vocabulary at the First Grade of SMP YPI Bintaro”. She concluded
that there is the effect of direct method, with t0 is higher than tt (5.758 > 2.65).
So, the implication of direct method in teaching vocabulary is better than
conventional strategy.52
The Fourth is Putri Ziko Mamura’s “The Use of Semantic Mapping to
Improve Vocabulary Mastery of The Fourth Grade Students of SD
Muhammadiyah Ngijon 1 in The Academic Year of 2009/2010”. She
concluded that the different result of students’ vocabulary mastery. It is
because the students’ average scores of the post test after giving treatment
increase 1,0517 from the students’ average scores of the pre-test before giving
the treatment.53
The Fifth is from Nida jumaliana “The influence of using of Semantic
Mapping on the students understanding in Reading Ability at the Eight Grade
Students of SMP N 1 Kadipaten Majalengka”. The result of comparison
between the students’ understanding in reading ability before and after using
of Semantic mapping is using pre-tet and post-test, the score are 69.3 and 75.2.
So there is significant influence of using of Semantic mapping on the students
52 Siti Juhaeriyah
53 Putri Ziko Mamura, “The Use of Semantic Mapping to Improve Vocabulary Mastery of
The Fourth Grade Students’ of SD Muhammadiyah Ngijon 1 in The Academic Year 2009/2010”
(State University of Yogyakarta, 2011), http://eprints.uny.ac.id.
67
understanding in reading ability at the eighth grade students of SMP N 1
Kadipaten Majalengka.54
C. The Threats of the Research
The researcher found the threats of this research as follows:
1. The result of learning could not be considered as the result of treatment at
all because the variations of students’ learning activity outside of school.
For example there were some students who followed English course,
diligent to study at home, or some of them learnt at school only. So that,
there was possibility for bias in the result of research.
2. There were some students that were lack of serious to answer the test in
pre-test and post-test. It would be possible threat the research. So that,
there was possibility the researcher cannot reach the validity of
trustworthiness of data.
3. Students’ attitude could be change to be better or worse when the teacher
who teaches them changes. So that it would be possible give the
influence to the result of the research.
54
Nida Jumaliana, “The Influence of Using of Semantic Mapping OnThe Students
Understanding in Reading Ability at The Eight Grade Students of SMP N 1 Kadipaten
Majalengka” (Syekh Nurjati State Institute For Isamic Students, n.d.).
68
CHAPTER V
CONCLUSION AND SUGGESTION
A. Conclusions
Based on the result of data analysis, the researcher take some concluded
as follow:
1. Before using Semantic Mapping Strategy, on vocabulary mastery was
unsatisfied. The mean score of pre-test for the experimental class that used
Semantic Mapping Strategy was 61.19.
2. After using Semantic Mapping Strategy, the mean score of experimental
class was higher than before using Semantic Mappig Strategy. The mean
score of post-test for the experimental class was 76.1.
3. The researcher found the research result of t-test where tcount was higher
than tt, tcount was 2.205 and tt was 1.67155 (2.205 > 1.67155). It meant that
there was effect of Semantic Mapping Strategy on vocabulary mastery at
the grade VII SMP N 5 Padangsidimpuan where Ha was accepted and H0
was rejected.
B. Suggestions
After finishing this research, the researcher got much information in
English teaching and Learning Proccess. Therefore, the researcher has
suggestion to:
1. For the teacher, especially teachers of SMP Negeri 5 Padangsidimpuan to
always used the semantic mapping strategy the teaching process especially
in vocabulary mastery.
68
69
2. To the headmaster, especially the headmaster of SMP Negeri 5
Padangsidimpuan can be given the espionage to the educator that there are
many strategy can be used in teaching and learning process. And the
semantic mapping strategy is suitable strategy in vocabulary mastery.
3. The students’ mastery of using semantic mapping strategy is necessary to
be developed, it was useful toward students’ vocabulary mastery.
4. The writer hoped that this research was continued by other writer by
taking one of the variables of this research to develop knowledge.
70
REFERENCES
Austin. Promoting Vocabulary Depelopment: Component of Effective Vocabulary
Intrucion. Texaz: Education Agency Publisher, 2002.
Azhari, Ahmadin. “The Effect of Using Media Video Dora The Explorer to Students’
Vocabulary Mastery at SD Negeri 200201/4 Padangsidimpuan 2011/2012 Academic
Year.” STAIN Padangsidimpuan, 2012.
Brown, H. Douglas. Language Assessment Practical and Language Practice. San
Francisco: Longman, 2003.
Bungin, Burhan. Metode Penelitian Kuantitatif. Jakarta: Kencana, 2005.
Djamara, Syaiful Bahri. Strategy Belajar Mengajar. Jakarta: PT. Asdi Mhasatya, 2006.
Enang, Azimar. Kinds of Vocabulary. Bandung: PT. Pustaka Media, 2001.
Furqon, Ahmad Nurul. “Using Direct Method in Teaching Vocabulary at First Grade of
Private Junior High School Muhammadiyah 44 Pamulang.” Syarif Hidayatullah
State Islamic University, 2007.
Gay, L.R., and Peter Airasian. Educational Reasearch: Competences for Analysis and
Aplication Sixt Edition. USA: Prentice Hall, Inc., 2000.
Gower, Roger. Teaching Practical Handbook. Thailand: Macmilian, 1995.
Harmer, Jeremy. The Practical of English Language Teaching. New York: Longman,
2000.
Hiebert, Elfriede H., and Michael L. Kamil. Teaching and Learning Vocabulary:
Brinnging Research to Practice. New Jersie: Lawrence Erubaum Associates
Publishers, 2005.
Hornby, A.S. Oxford Advance Learner’s Dictionary. New York: Oxford University Press,
2000.
Irianto, Agus. Sttistik Konsep Dasar Dan Aplikasinya. Padang: P2LPTK Departemen,
Pendidikan Nasional, 2003.
Johnson, Toms Bronowski, and Pitelman. Inside Words: Tools for Teaching Academic
Vocabulary Grades 4-12. Portland: Stenhouse Publishers, 2007.
Jumaliana, Nida. “The Influence of Using of Semantic Mapping OnThe Students
Understanding in Reading Ability at The Eight Grade Students of SMP N 1
Kadipaten Majalengka.” Syekh Nurjati State Institute For Isamic Students, n.d.
Mamura, Putri Ziko. “The Use of Semantic Mapping to Improve Vocabulary Mastery of
The Fourth Grade Students’ of SD Muhammadiyah Ngijon 1 in The Academic Year
2009/2010.” State University of Yogyakarta, 2011. http://eprints.uny.ac.id.
Murcia, Marianne Celce. Teaching English as a Second of Foreign Language Teaching.
USA: Heinle&Heinle Thompson Learning, 2001.
71
Richard, Jack C., and Willy A. Renandya. Methodology in Language Teaching and
Anthology of Current Practice. USA: Cambridge University Press, 2000.
Siregar, FitriRayani, Improving Students’ Vocabulary Mastery Through Crossword Puzzle
Technique At SD Muhammadiyah 1 Padangsidimpuan, JurnalBahasaInggris IAIN
Padangsidimpuan Vol. 04 No. 1 Juni 2018, http://jurnal.iain-
padangsidimpuan.ac.id/index.php/TZ/Vol. 04 No. 1 june 2018.accessed on Monday 14th of
December 2020. P. 94.
Sudijono, Anas. Pengantar Evaluasi Pendidikan. Jakarta: PT. Raja Grapindo Persada,
1996.
Sugiyono. Statistika Untuk Penelitian. Bandung: Alfabeta, 2011.
Schail. Seven Days to Faster Reading. New York: Oxford University Press, 1967.
Schmitt, Norbeth. Vocabulary in Language Teaching. Cambridge: Cambridge University
Press, 2000.
T. Linse, Caroline. Practical English Language Teaching : Young Learners. New York:
McGraw-Hill Companie, Inc, 2005.
Tarigan, H. G. Pengajaran Kosa Kata. Bandung: Aksara, 1985.
Wachidah, Siti, Asep Gunawan, Diyantari, and Yuli Rulani Khatimah. Buku Bahasa
Inggris: When English Rings a Bell. Jakarta: Balitbang Kemendikbud, 2017.
Wallace, Michael J. Eaching Vocabulary. ELBS, 1989.
Willis, Judi. Teaching The Braing to Read: Startegies For Improving Fluency,
Vocabulary and Comprehension. London: ASCD Oybkucatub, 2008.
72
CURRICULUM VITAE
A. Identify
Name : Emi Fitriyani
Reg. Nim : 1420300033
Place/Birth : Padangsidimpuan/ 28 August 1995
Sex : Female
Religion : Moeslim
Address: Tamiang Ampalu, Kec. Koto Balingka Pasaman Barat.
B. Parents
Father’s Name :Syaparuddin
Mother’s Name : Rostini
C. Education Background
1. Graduated from Elementary School SD Negeri 200211 Padang
Matinggi 2007.
2. Graduated from Junior High School SMP N 1 Koto Balingka 2011.
3. Graduated from Senior High School SMA N 1 Koto Balingka 2014.
4. Be University student IAIN Padangsidimpuan 2014.
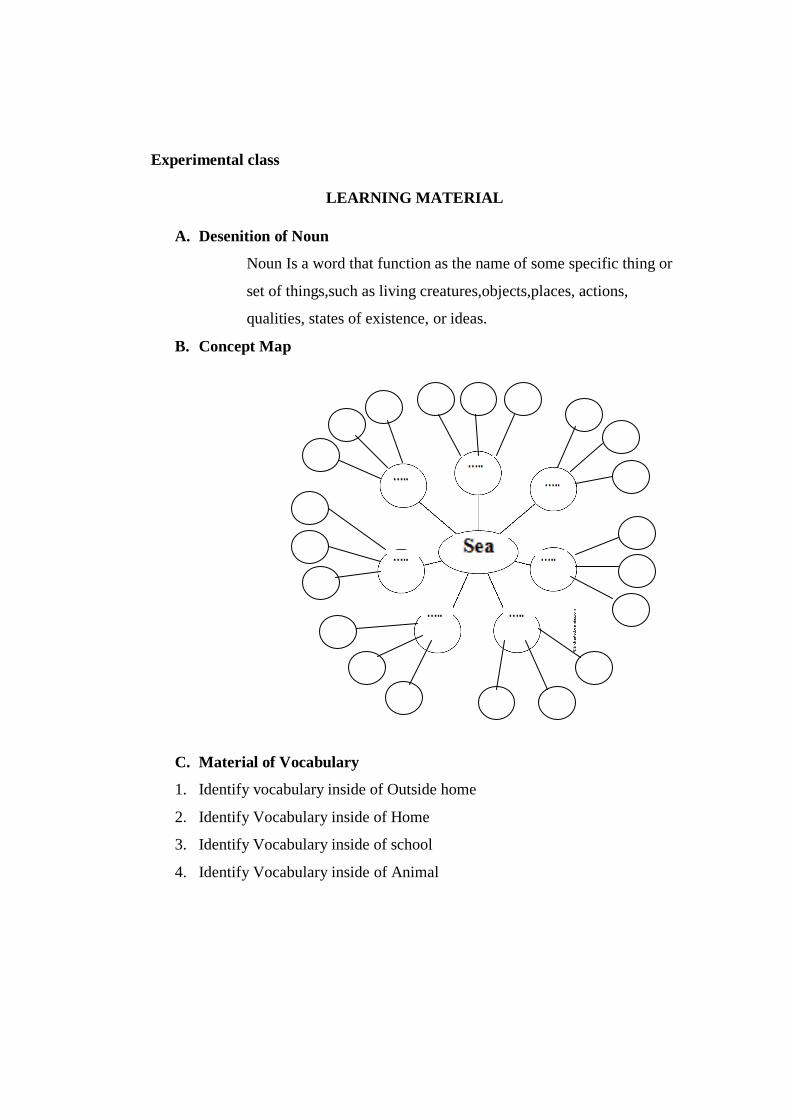
73
Experimental class
LEARNING MATERIAL
A. Desenition of Noun
Noun Is a word that function as the name of some specific thing or
set of things,such as living creatures,objects,places, actions,
qualities, states of existence, or ideas.
B. Concept Map
C. Material of Vocabulary
1. Identify vocabulary inside of Outside home
2. Identify Vocabulary inside of Home
3. Identify Vocabulary inside of school
4. Identify Vocabulary inside of Animal
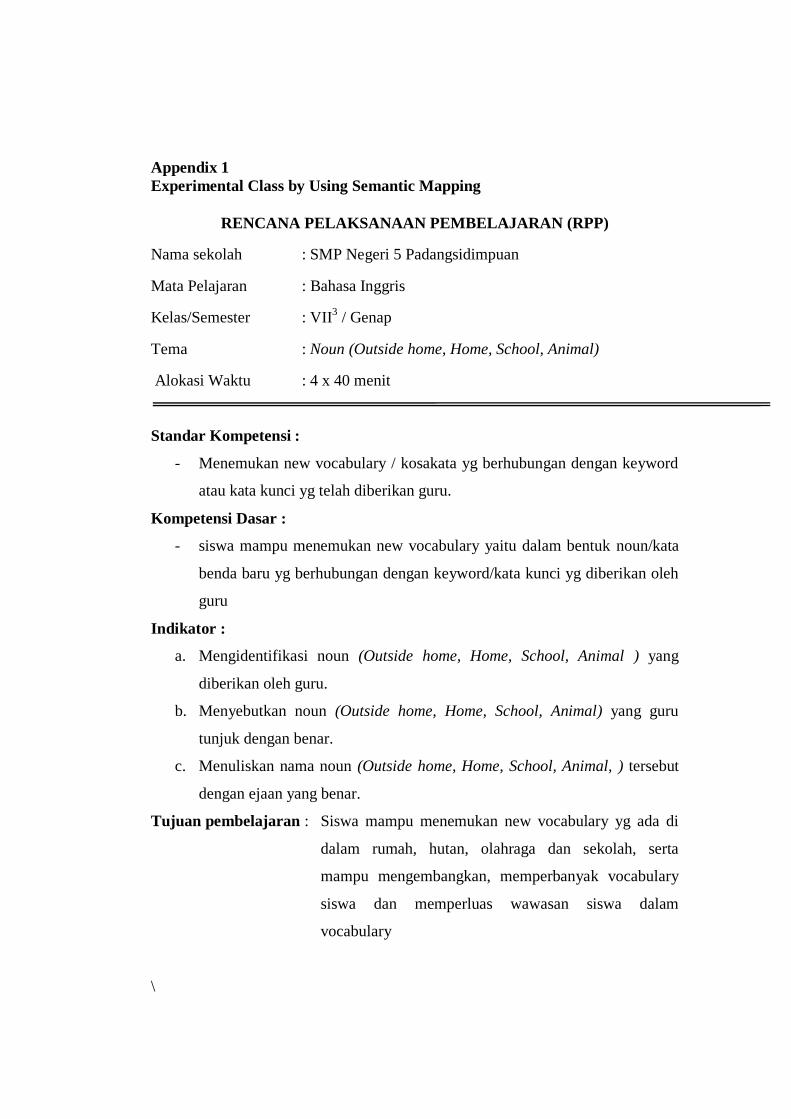
74
Appendix 1
Experimental Class by Using Semantic Mapping
RENCANA PELAKSANAAN PEMBELAJARAN (RPP)
Nama sekolah : SMP Negeri 5 Padangsidimpuan
Mata Pelajaran : Bahasa Inggris
Kelas/Semester : VII3 / Genap
Tema : Noun (Outside home, Home, School, Animal)
Alokasi Waktu : 4 x 40 menit
Standar Kompetensi :
- Menemukan new vocabulary / kosakata yg berhubungan dengan keyword
atau kata kunci yg telah diberikan guru.
Kompetensi Dasar :
- siswa mampu menemukan new vocabulary yaitu dalam bentuk noun/kata
benda baru yg berhubungan dengan keyword/kata kunci yg diberikan oleh
guru
Indikator :
a. Mengidentifikasi noun (Outside home, Home, School, Animal ) yang
diberikan oleh guru.
b. Menyebutkan noun (Outside home, Home, School, Animal) yang guru
tunjuk dengan benar.
c. Menuliskan nama noun (Outside home, Home, School, Animal, ) tersebut
dengan ejaan yang benar.
Tujuan pembelajaran : Siswa mampu menemukan new vocabulary yg ada di
dalam rumah, hutan, olahraga dan sekolah, serta
mampu mengembangkan, memperbanyak vocabulary
siswa dan memperluas wawasan siswa dalam
vocabulary
\
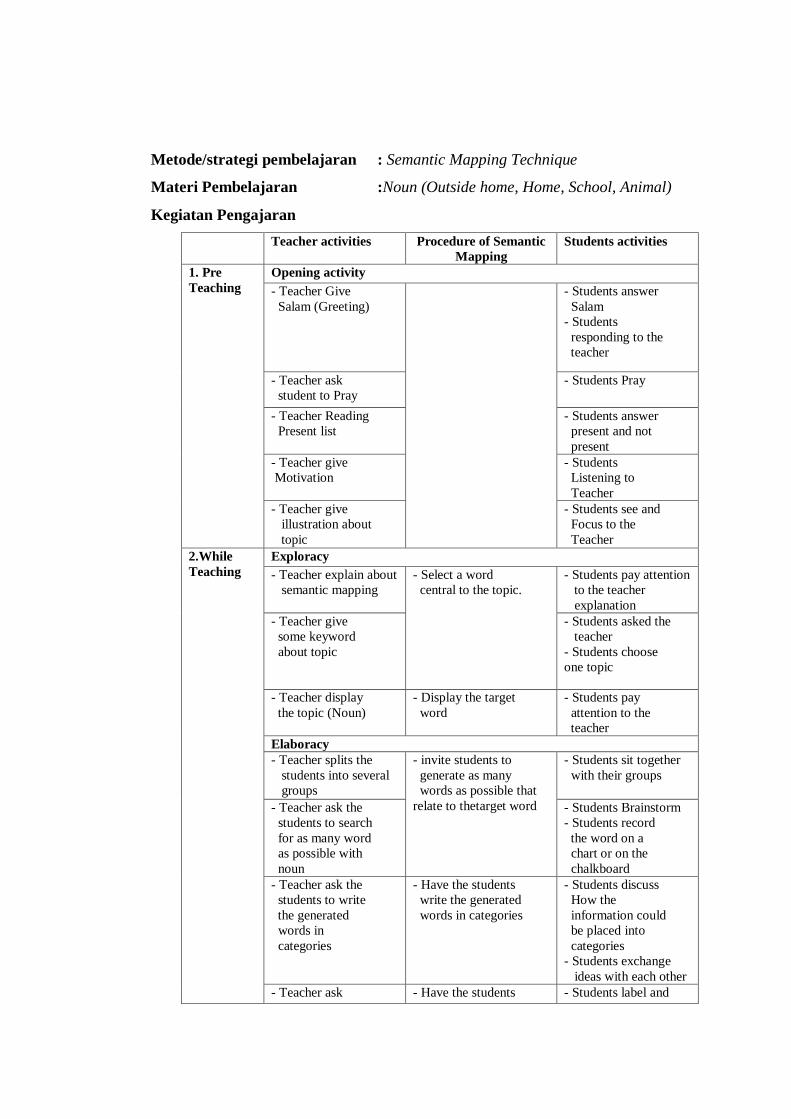
75
Metode/strategi pembelajaran : Semantic Mapping Technique
Materi Pembelajaran :Noun (Outside home, Home, School, Animal)
Kegiatan Pengajaran
Teacher activities Procedure of Semantic
Mapping
Students activities
1. Pre
Teaching
Opening activity
- Teacher Give
Salam (Greeting)
- Students answer
Salam
- Students
responding to the
teacher
- Teacher ask
student to Pray
- Students Pray
- Teacher Reading
Present list
- Students answer
present and not
present
- Teacher give
Motivation
- Students
Listening to
Teacher
- Teacher give
illustration about
topic
- Students see and
Focus to the
Teacher
4. 2.While
Teaching
Exploracy
- Teacher explain about
semantic mapping
- Select a word
central to the topic.
- Students pay attention
to the teacher
explanation
- Teacher give
some keyword
about topic
- Students asked the
teacher
- Students choose
one topic
- Teacher display
the topic (Noun)
- Display the target
word
- Students pay
attention to the
teacher
Elaboracy
- Teacher splits the
students into several
groups
- invite students to
generate as many
words as possible that relate to thetarget word
- Students sit together
with their groups
- Teacher ask the
students to search
for as many word
as possible with
noun
- Students Brainstorm
- Students record
the word on a
chart or on the
chalkboard
- Teacher ask the
students to write
the generated
words in
categories
- Have the students
write the generated
words in categories
- Students discuss
How the
information could
be placed into
categories
- Students exchange
ideas with each other
- Teacher ask - Have the students - Students label and
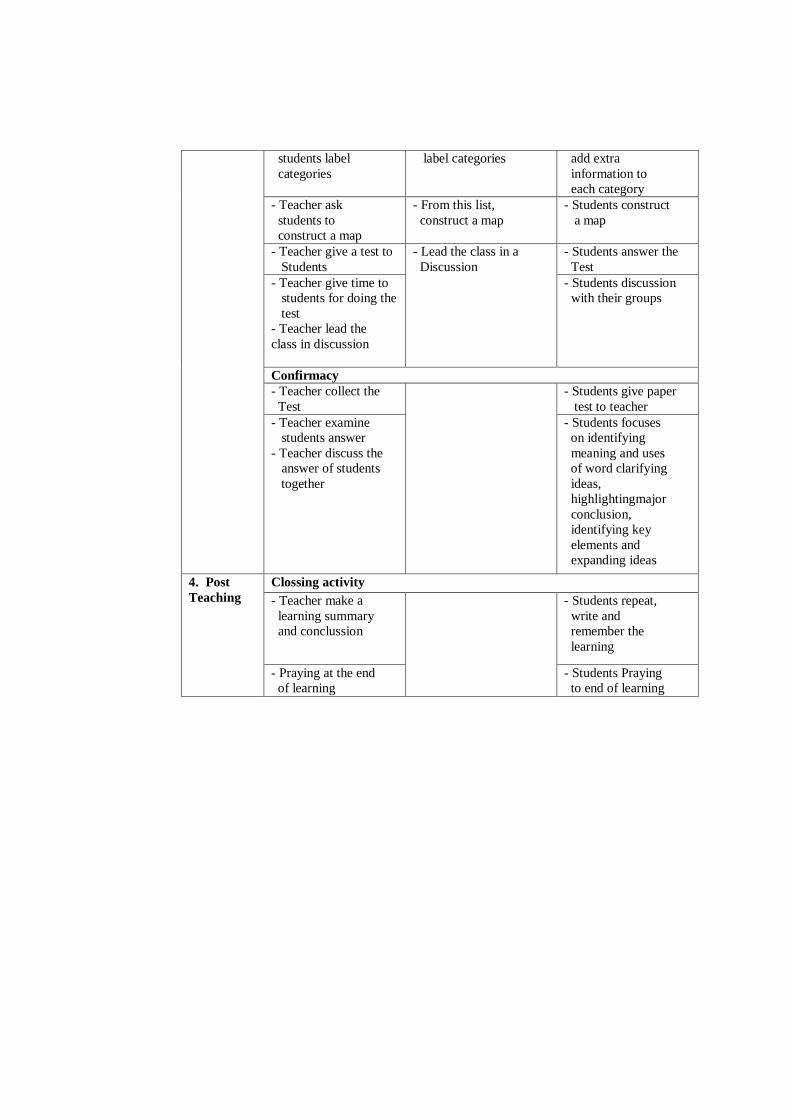
76
students label
categories
label categories
add extra
information to
each category
- Teacher ask
students to
construct a map
- From this list,
construct a map
- Students construct
a map
- Teacher give a test to
Students
- Lead the class in a
Discussion
- Students answer the
Test
- Teacher give time to
students for doing the
test
- Teacher lead the
class in discussion
- Students discussion
with their groups
Confirmacy
- Teacher collect the
Test
- Students give paper
test to teacher
- Teacher examine
students answer
- Teacher discuss the
answer of students
together
- Students focuses
on identifying
meaning and uses
of word clarifying
ideas,
highlightingmajor
conclusion,
identifying key
elements and
expanding ideas
4. Post
Teaching
Clossing activity
- Teacher make a
learning summary
and conclussion
- Students repeat,
write and
remember the
learning
- Praying at the end
of learning
- Students Praying
to end of learning
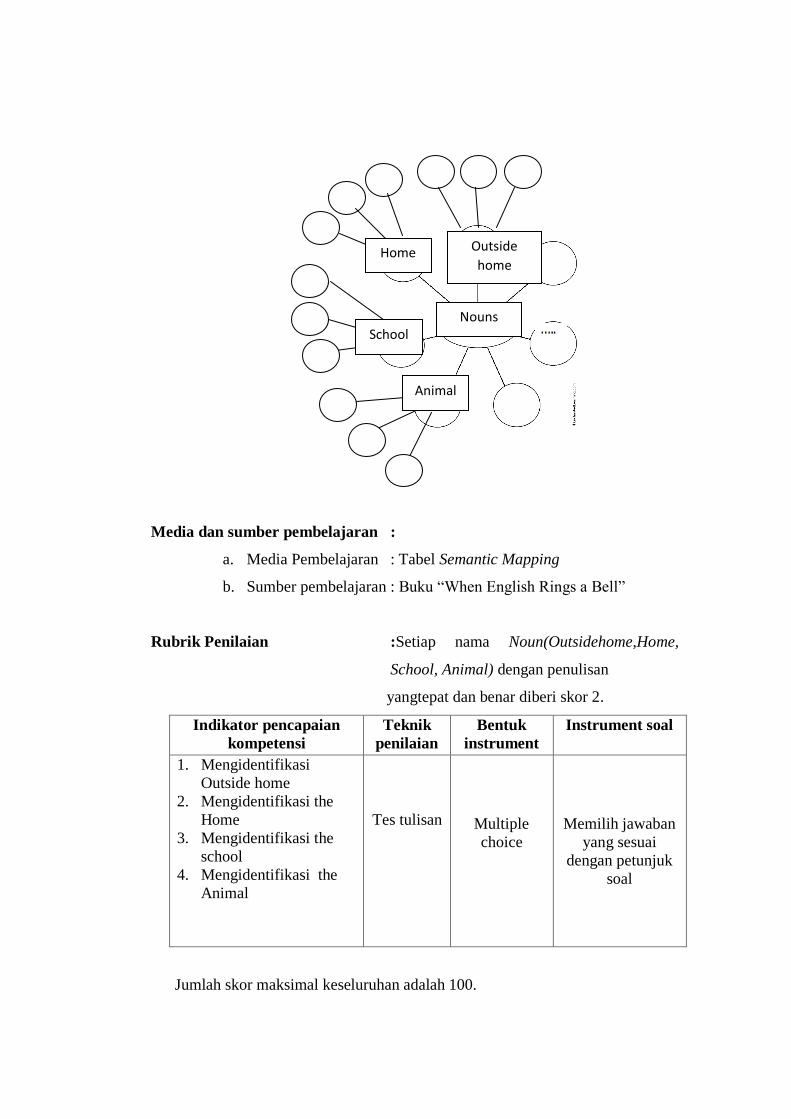
77
Media dan sumber pembelajaran :
a. Media Pembelajaran : Tabel Semantic Mapping
b. Sumber pembelajaran : Buku “When English Rings a Bell”
Rubrik Penilaian :Setiap nama Noun(Outsidehome,Home,
School, Animal) dengan penulisan
yangtepat dan benar diberi skor 2.
Indikator pencapaian
kompetensi
Teknik
penilaian
Bentuk
instrument
Instrument soal
1. Mengidentifikasi
Outside home
2. Mengidentifikasi the
Home
3. Mengidentifikasi the
school
4. Mengidentifikasi the
Animal
Tes tulisan Multiple
choice
Memilih jawaban
yang sesuai
dengan petunjuk
soal
Jumlah skor maksimal keseluruhan adalah 100.
Nouns
Outside
home
School
Animal
Home
78
Setiap jawaban yang benar diberi skor 2.
Jumlah skor keseluruhan 2 x 50 =100.
Padangidimpuan, 2019
Validator Researcher
Marlina Hasibuan, S.Pd EMI FITRIYANI
NIP. 19780921 2000604 2 017 14 203 000 33
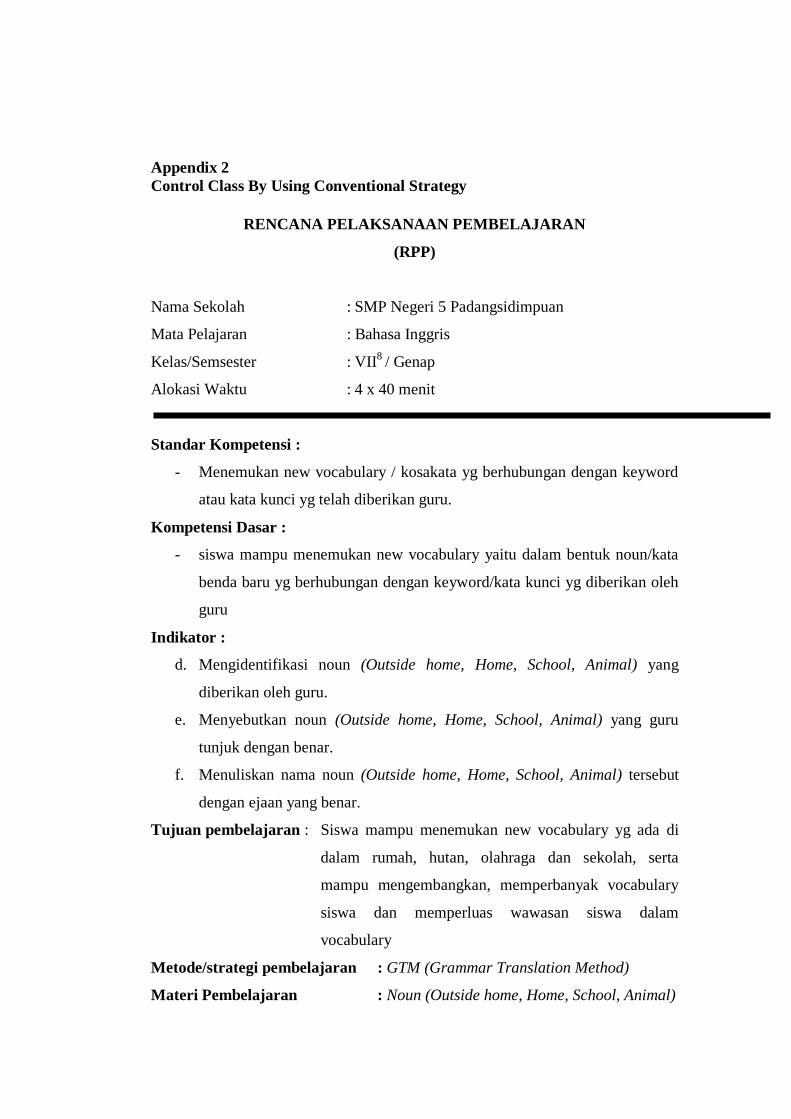
79
Appendix 2
Control Class By Using Conventional Strategy
RENCANA PELAKSANAAN PEMBELAJARAN
(RPP)
Nama Sekolah : SMP Negeri 5 Padangsidimpuan
Mata Pelajaran : Bahasa Inggris
Kelas/Semsester : VII8
/ Genap
Alokasi Waktu : 4 x 40 menit
Standar Kompetensi :
- Menemukan new vocabulary / kosakata yg berhubungan dengan keyword
atau kata kunci yg telah diberikan guru.
Kompetensi Dasar :
- siswa mampu menemukan new vocabulary yaitu dalam bentuk noun/kata
benda baru yg berhubungan dengan keyword/kata kunci yg diberikan oleh
guru
Indikator :
d. Mengidentifikasi noun (Outside home, Home, School, Animal) yang
diberikan oleh guru.
e. Menyebutkan noun (Outside home, Home, School, Animal) yang guru
tunjuk dengan benar.
f. Menuliskan nama noun (Outside home, Home, School, Animal) tersebut
dengan ejaan yang benar.
Tujuan pembelajaran : Siswa mampu menemukan new vocabulary yg ada di
dalam rumah, hutan, olahraga dan sekolah, serta
mampu mengembangkan, memperbanyak vocabulary
siswa dan memperluas wawasan siswa dalam
vocabulary
Metode/strategi pembelajaran : GTM (Grammar Translation Method)
Materi Pembelajaran : Noun (Outside home, Home, School, Animal)
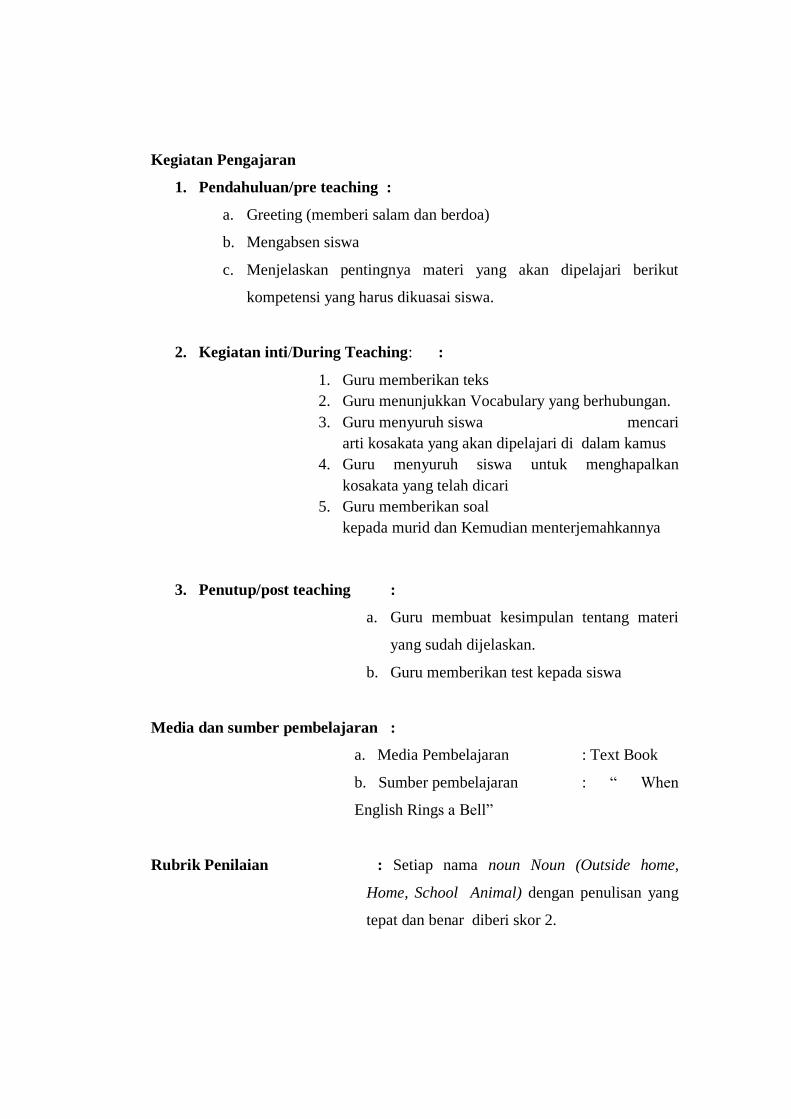
80
Kegiatan Pengajaran
1. Pendahuluan/pre teaching :
a. Greeting (memberi salam dan berdoa)
b. Mengabsen siswa
c. Menjelaskan pentingnya materi yang akan dipelajari berikut
kompetensi yang harus dikuasai siswa.
2. Kegiatan inti/During Teaching: :
1. Guru memberikan teks
2. Guru menunjukkan Vocabulary yang berhubungan.
3. Guru menyuruh siswa mencari
arti kosakata yang akan dipelajari di dalam kamus
4. Guru menyuruh siswa untuk menghapalkan
kosakata yang telah dicari
5. Guru memberikan soal
kepada murid dan Kemudian menterjemahkannya
3. Penutup/post teaching :
a. Guru membuat kesimpulan tentang materi
yang sudah dijelaskan.
b. Guru memberikan test kepada siswa
Media dan sumber pembelajaran :
a. Media Pembelajaran : Text Book
b. Sumber pembelajaran : “ When
English Rings a Bell”
Rubrik Penilaian : Setiap nama noun Noun (Outside home,
Home, School Animal) dengan penulisan yang
tepat dan benar diberi skor 2.
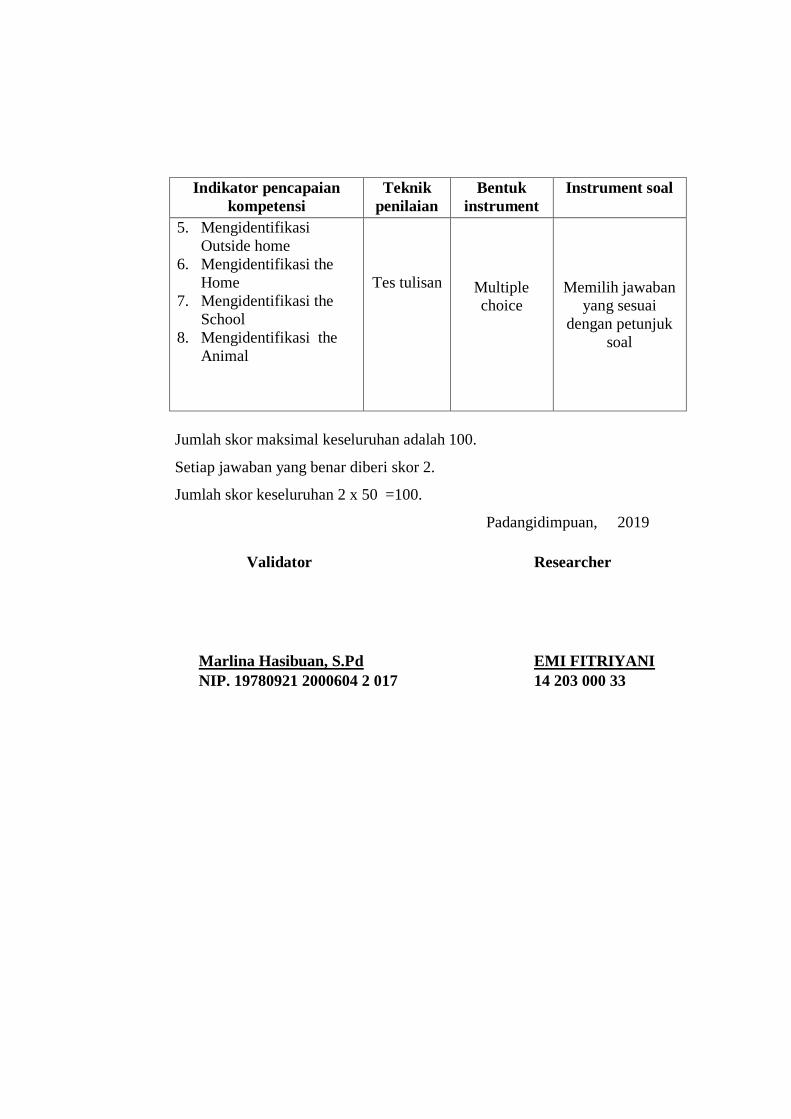
81
Indikator pencapaian
kompetensi
Teknik
penilaian
Bentuk
instrument
Instrument soal
5. Mengidentifikasi
Outside home
6. Mengidentifikasi the
Home
7. Mengidentifikasi the
School
8. Mengidentifikasi the
Animal
Tes tulisan Multiple choice
Memilih jawaban yang sesuai
dengan petunjuk
soal
Jumlah skor maksimal keseluruhan adalah 100.
Setiap jawaban yang benar diberi skor 2.
Jumlah skor keseluruhan 2 x 50 =100.
Padangidimpuan, 2019
Validator Researcher
Marlina Hasibuan, S.Pd EMI FITRIYANI
NIP. 19780921 2000604 2 017 14 203 000 33
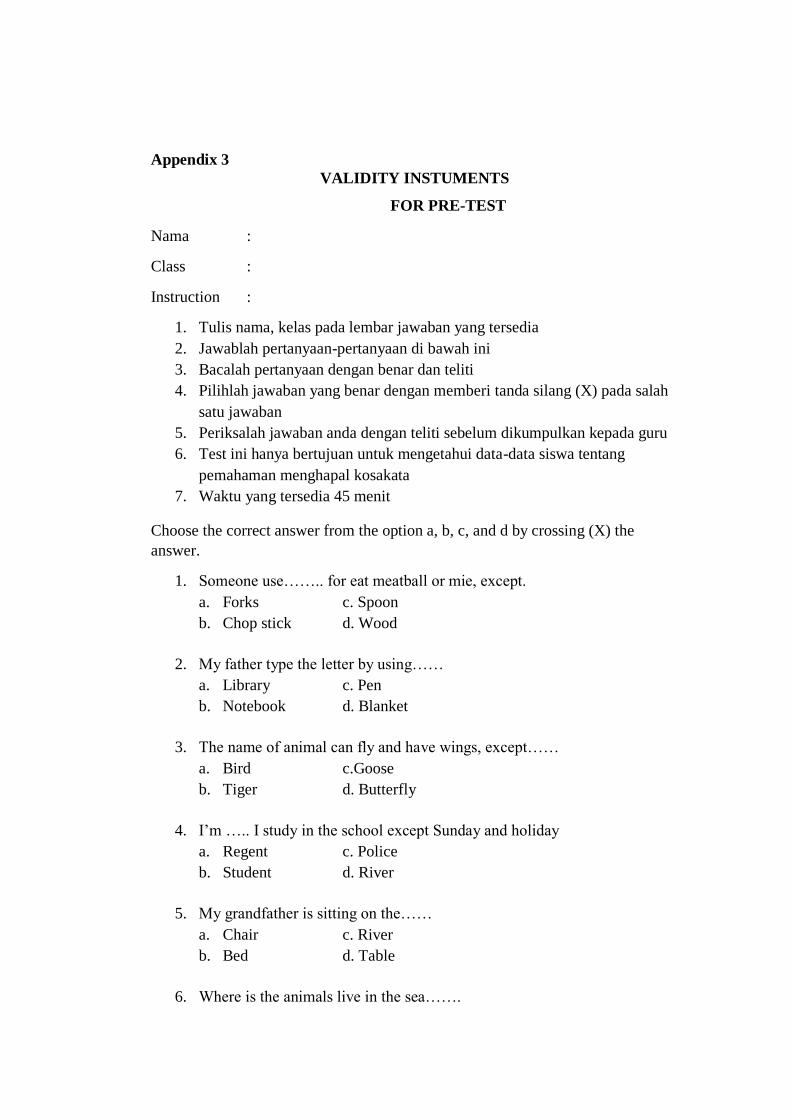
82
Appendix 3
VALIDITY INSTUMENTS
FOR PRE-TEST
Nama :
Class :
Instruction :
1. Tulis nama, kelas pada lembar jawaban yang tersedia
2. Jawablah pertanyaan-pertanyaan di bawah ini
3. Bacalah pertanyaan dengan benar dan teliti
4. Pilihlah jawaban yang benar dengan memberi tanda silang (X) pada salah
satu jawaban
5. Periksalah jawaban anda dengan teliti sebelum dikumpulkan kepada guru
6. Test ini hanya bertujuan untuk mengetahui data-data siswa tentang
pemahaman menghapal kosakata
7. Waktu yang tersedia 45 menit
Choose the correct answer from the option a, b, c, and d by crossing (X) the
answer.
1. Someone use…….. for eat meatball or mie, except.
a. Forks c. Spoon
b. Chop stick d. Wood
2. My father type the letter by using……
a. Library c. Pen
b. Notebook d. Blanket
3. The name of animal can fly and have wings, except……
a. Bird c.Goose
b. Tiger d. Butterfly
4. I’m ….. I study in the school except Sunday and holiday
a. Regent c. Police
b. Student d. River
5. My grandfather is sitting on the……
a. Chair c. River
b. Bed d. Table
6. Where is the animals live in the sea…….
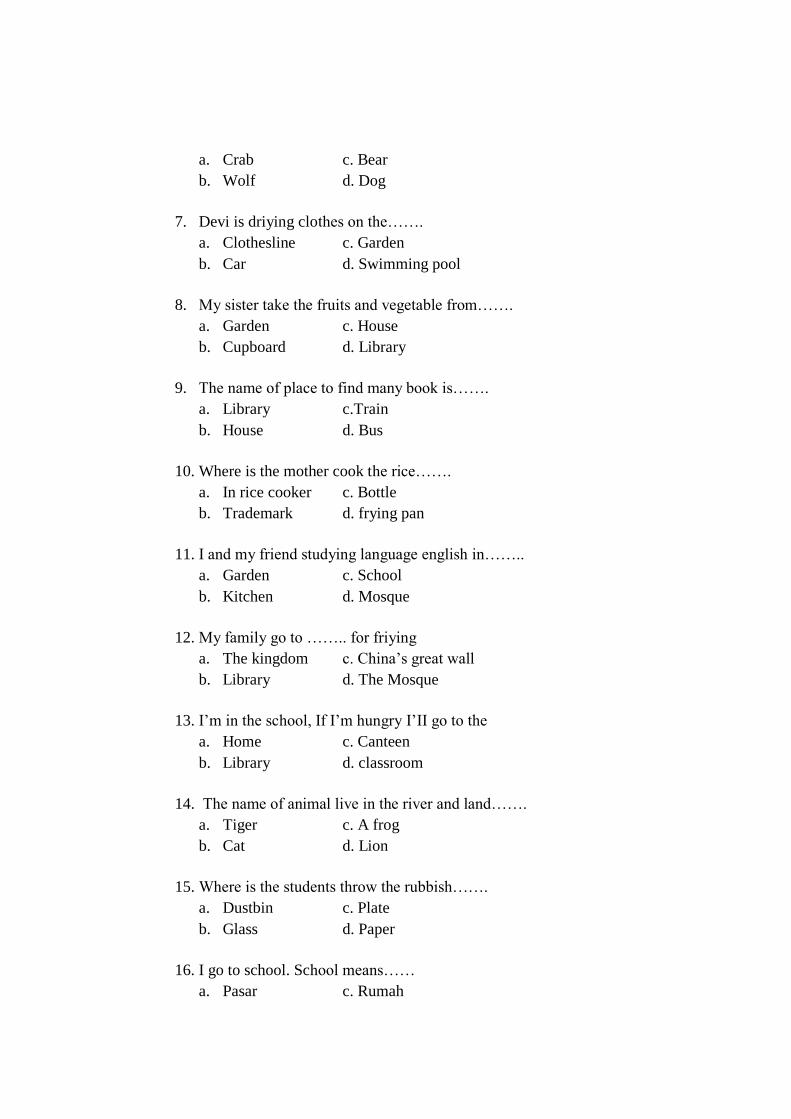
83
a. Crab c. Bear
b. Wolf d. Dog
7. Devi is driying clothes on the…….
a. Clothesline c. Garden
b. Car d. Swimming pool
8. My sister take the fruits and vegetable from…….
a. Garden c. House
b. Cupboard d. Library
9. The name of place to find many book is…….
a. Library c.Train
b. House d. Bus
10. Where is the mother cook the rice…….
a. In rice cooker c. Bottle
b. Trademark d. frying pan
11. I and my friend studying language english in……..
a. Garden c. School
b. Kitchen d. Mosque
12. My family go to …….. for friying
a. The kingdom c. China’s great wall
b. Library d. The Mosque
13. I’m in the school, If I’m hungry I’II go to the
a. Home c. Canteen
b. Library d. classroom
14. The name of animal live in the river and land…….
a. Tiger c. A frog
b. Cat d. Lion
15. Where is the students throw the rubbish…….
a. Dustbin c. Plate
b. Glass d. Paper
16. I go to school. School means……
a. Pasar c. Rumah
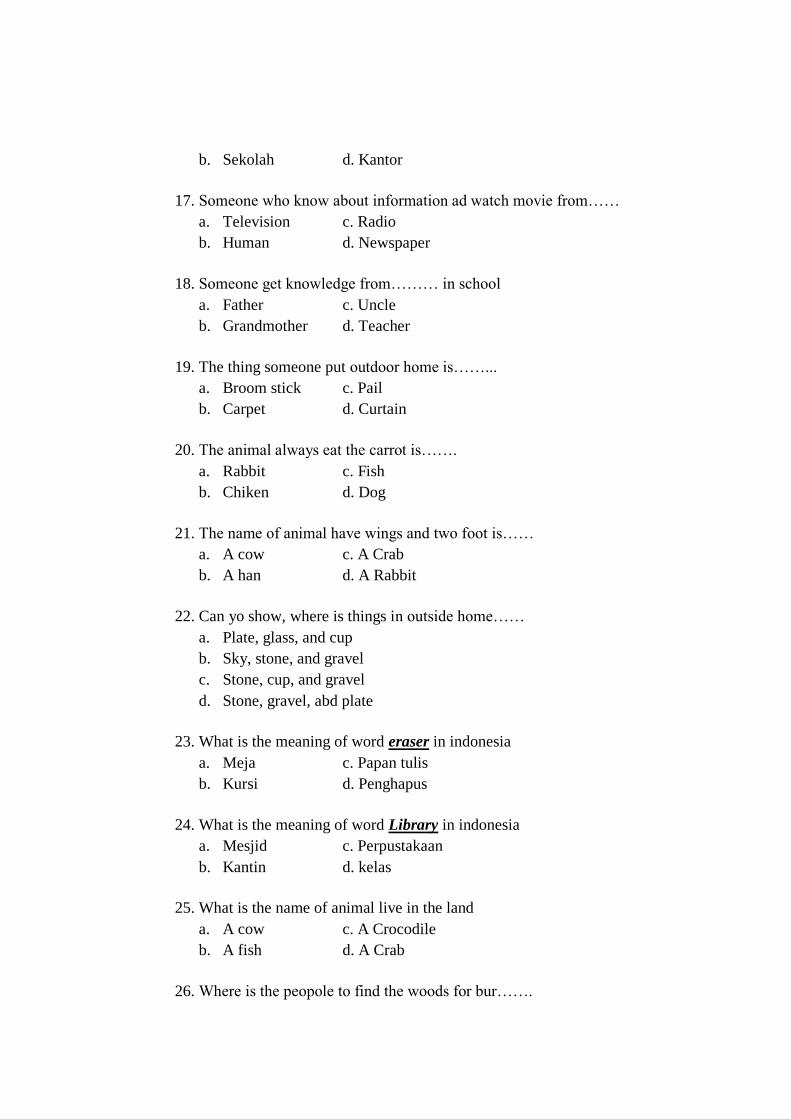
84
b. Sekolah d. Kantor
17. Someone who know about information ad watch movie from……
a. Television c. Radio
b. Human d. Newspaper
18. Someone get knowledge from……… in school
a. Father c. Uncle
b. Grandmother d. Teacher
19. The thing someone put outdoor home is……...
a. Broom stick c. Pail
b. Carpet d. Curtain
20. The animal always eat the carrot is…….
a. Rabbit c. Fish
b. Chiken d. Dog
21. The name of animal have wings and two foot is……
a. A cow c. A Crab
b. A han d. A Rabbit
22. Can yo show, where is things in outside home……
a. Plate, glass, and cup
b. Sky, stone, and gravel
c. Stone, cup, and gravel
d. Stone, gravel, abd plate
23. What is the meaning of word eraser in indonesia
a. Meja c. Papan tulis
b. Kursi d. Penghapus
24. What is the meaning of word Library in indonesia
a. Mesjid c. Perpustakaan
b. Kantin d. kelas
25. What is the name of animal live in the land
a. A cow c. A Crocodile
b. A fish d. A Crab
26. Where is the peopole to find the woods for bur…….
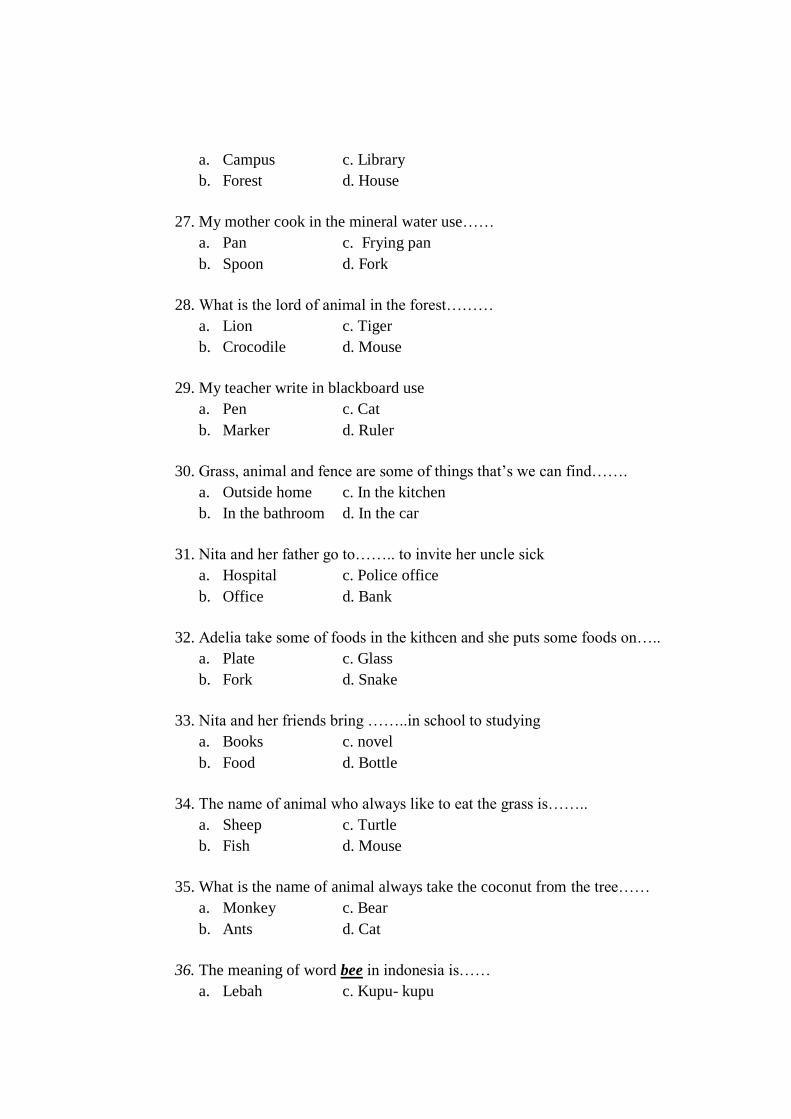
85
a. Campus c. Library
b. Forest d. House
27. My mother cook in the mineral water use……
a. Pan c. Frying pan
b. Spoon d. Fork
28. What is the lord of animal in the forest………
a. Lion c. Tiger
b. Crocodile d. Mouse
29. My teacher write in blackboard use
a. Pen c. Cat
b. Marker d. Ruler
30. Grass, animal and fence are some of things that’s we can find…….
a. Outside home c. In the kitchen
b. In the bathroom d. In the car
31. Nita and her father go to…….. to invite her uncle sick
a. Hospital c. Police office
b. Office d. Bank
32. Adelia take some of foods in the kithcen and she puts some foods on…..
a. Plate c. Glass
b. Fork d. Snake
33. Nita and her friends bring ……..in school to studying
a. Books c. novel
b. Food d. Bottle
34. The name of animal who always like to eat the grass is……..
a. Sheep c. Turtle
b. Fish d. Mouse
35. What is the name of animal always take the coconut from the tree……
a. Monkey c. Bear
b. Ants d. Cat
36. The meaning of word bee in indonesia is……
a. Lebah c. Kupu- kupu
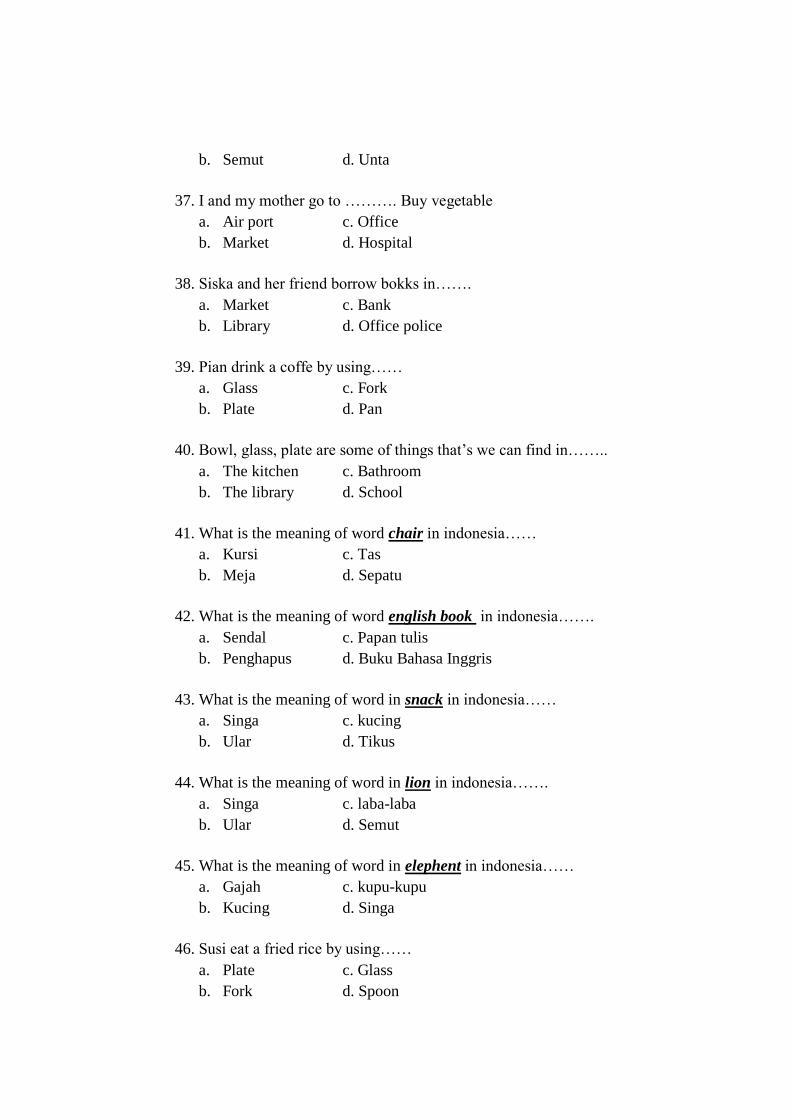
86
b. Semut d. Unta
37. I and my mother go to ………. Buy vegetable
a. Air port c. Office
b. Market d. Hospital
38. Siska and her friend borrow bokks in…….
a. Market c. Bank
b. Library d. Office police
39. Pian drink a coffe by using……
a. Glass c. Fork
b. Plate d. Pan
40. Bowl, glass, plate are some of things that’s we can find in……..
a. The kitchen c. Bathroom
b. The library d. School
41. What is the meaning of word chair in indonesia……
a. Kursi c. Tas
b. Meja d. Sepatu
42. What is the meaning of word english book in indonesia…….
a. Sendal c. Papan tulis
b. Penghapus d. Buku Bahasa Inggris
43. What is the meaning of word in snack in indonesia……
a. Singa c. kucing
b. Ular d. Tikus
44. What is the meaning of word in lion in indonesia…….
a. Singa c. laba-laba
b. Ular d. Semut
45. What is the meaning of word in elephent in indonesia……
a. Gajah c. kupu-kupu
b. Kucing d. Singa
46. Susi eat a fried rice by using……
a. Plate c. Glass
b. Fork d. Spoon
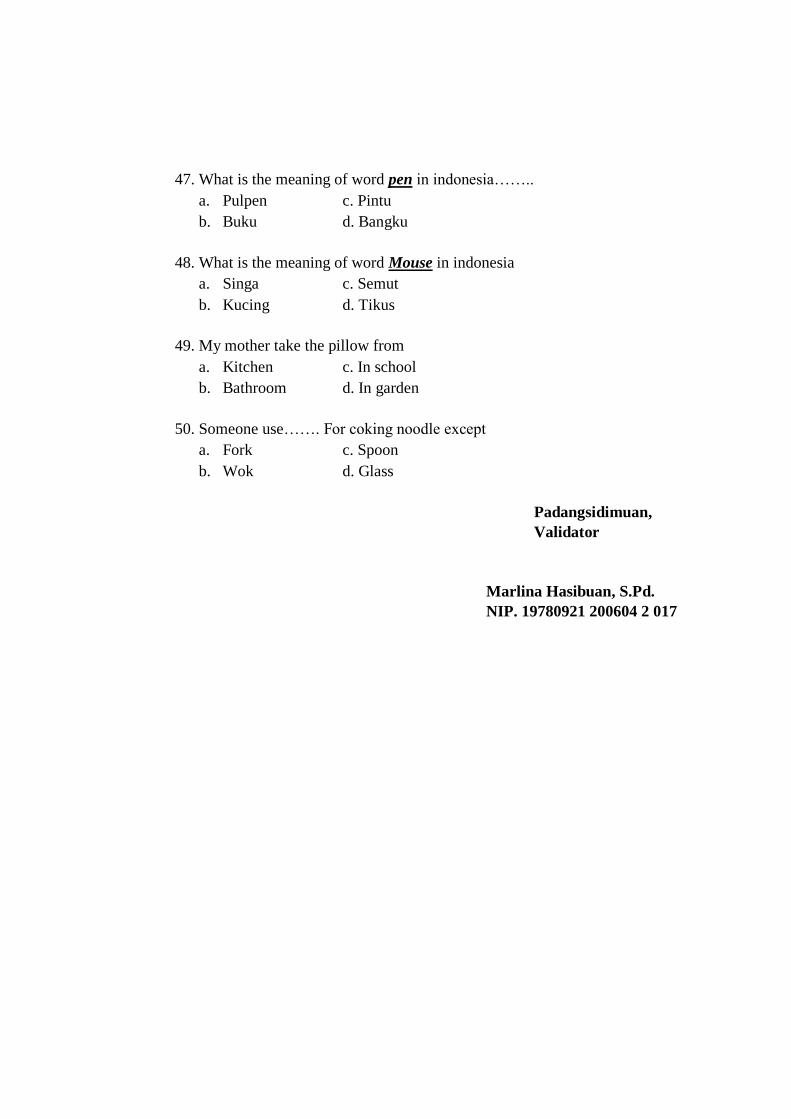
87
47. What is the meaning of word pen in indonesia……..
a. Pulpen c. Pintu
b. Buku d. Bangku
48. What is the meaning of word Mouse in indonesia
a. Singa c. Semut
b. Kucing d. Tikus
49. My mother take the pillow from
a. Kitchen c. In school
b. Bathroom d. In garden
50. Someone use……. For coking noodle except
a. Fork c. Spoon
b. Wok d. Glass
Padangsidimuan,
Validator
Marlina Hasibuan, S.Pd.
NIP. 19780921 200604 2 017
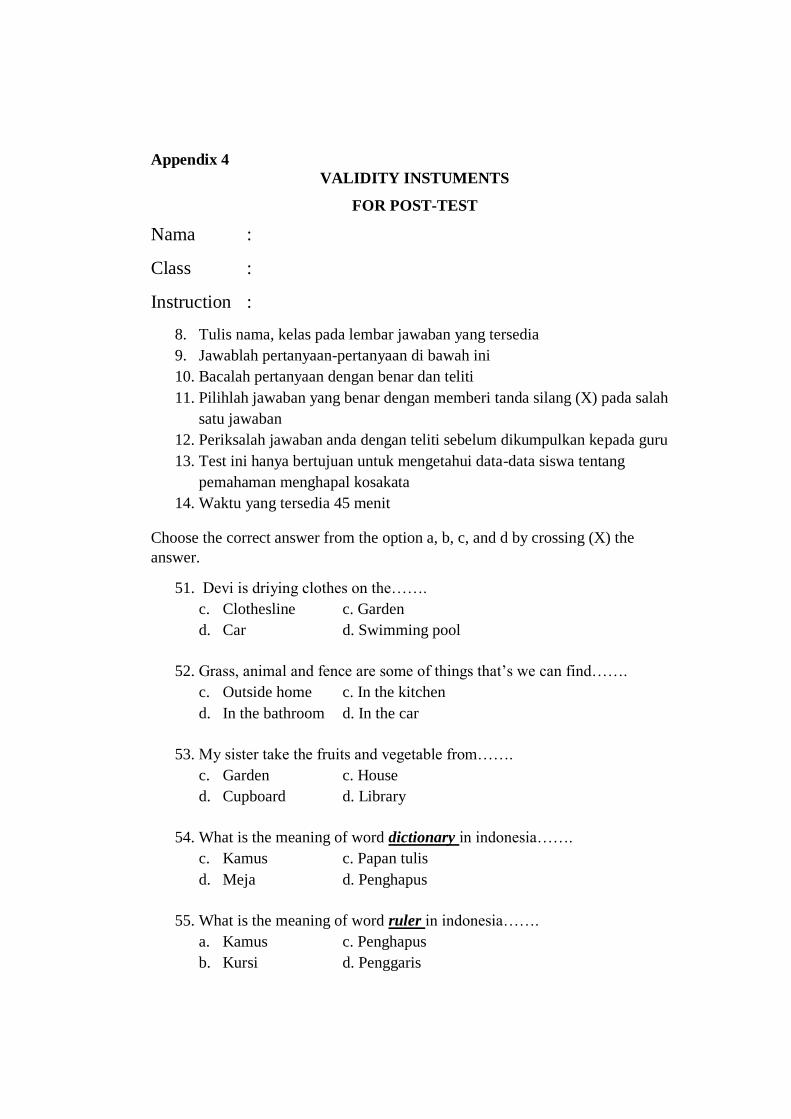
88
Appendix 4
VALIDITY INSTUMENTS
FOR POST-TEST
Nama :
Class :
Instruction :
8. Tulis nama, kelas pada lembar jawaban yang tersedia
9. Jawablah pertanyaan-pertanyaan di bawah ini
10. Bacalah pertanyaan dengan benar dan teliti
11. Pilihlah jawaban yang benar dengan memberi tanda silang (X) pada salah
satu jawaban
12. Periksalah jawaban anda dengan teliti sebelum dikumpulkan kepada guru
13. Test ini hanya bertujuan untuk mengetahui data-data siswa tentang
pemahaman menghapal kosakata
14. Waktu yang tersedia 45 menit
Choose the correct answer from the option a, b, c, and d by crossing (X) the
answer.
51. Devi is driying clothes on the…….
c. Clothesline c. Garden
d. Car d. Swimming pool
52. Grass, animal and fence are some of things that’s we can find…….
c. Outside home c. In the kitchen
d. In the bathroom d. In the car
53. My sister take the fruits and vegetable from…….
c. Garden c. House
d. Cupboard d. Library
54. What is the meaning of word dictionary in indonesia…….
c. Kamus c. Papan tulis
d. Meja d. Penghapus
55. What is the meaning of word ruler in indonesia…….
a. Kamus c. Penghapus
b. Kursi d. Penggaris
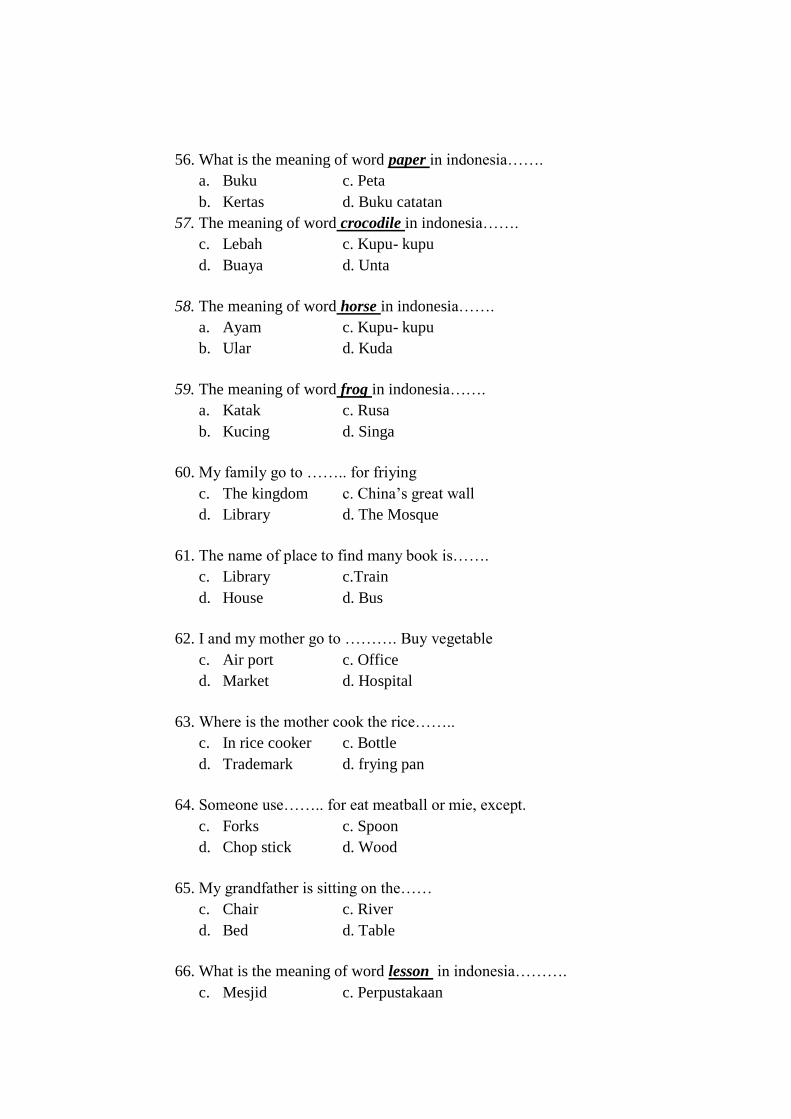
89
56. What is the meaning of word paper in indonesia…….
a. Buku c. Peta
b. Kertas d. Buku catatan
57. The meaning of word crocodile in indonesia…….
c. Lebah c. Kupu- kupu
d. Buaya d. Unta
58. The meaning of word horse in indonesia…….
a. Ayam c. Kupu- kupu
b. Ular d. Kuda
59. The meaning of word frog in indonesia…….
a. Katak c. Rusa
b. Kucing d. Singa
60. My family go to …….. for friying
c. The kingdom c. China’s great wall
d. Library d. The Mosque
61. The name of place to find many book is…….
c. Library c.Train
d. House d. Bus
62. I and my mother go to ………. Buy vegetable
c. Air port c. Office
d. Market d. Hospital
63. Where is the mother cook the rice……..
c. In rice cooker c. Bottle
d. Trademark d. frying pan
64. Someone use…….. for eat meatball or mie, except.
c. Forks c. Spoon
d. Chop stick d. Wood
65. My grandfather is sitting on the……
c. Chair c. River
d. Bed d. Table
66. What is the meaning of word lesson in indonesia……….
c. Mesjid c. Perpustakaan
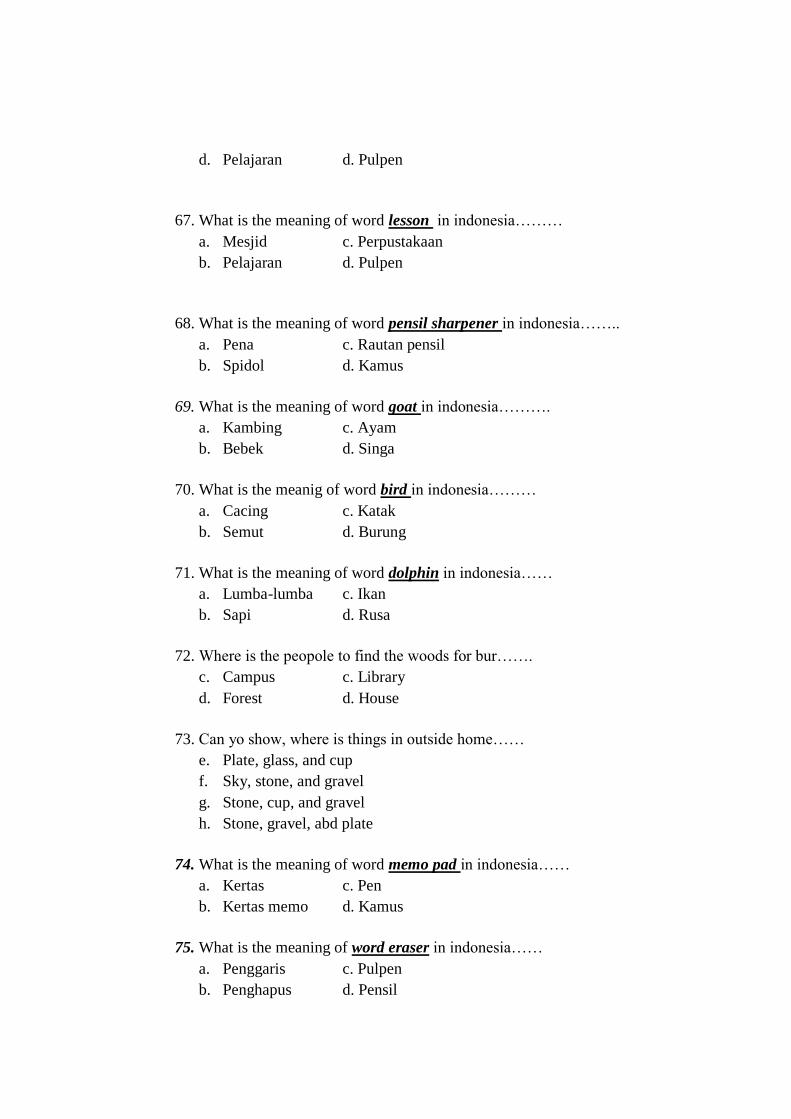
90
d. Pelajaran d. Pulpen
67. What is the meaning of word lesson in indonesia………
a. Mesjid c. Perpustakaan
b. Pelajaran d. Pulpen
68. What is the meaning of word pensil sharpener in indonesia……..
a. Pena c. Rautan pensil
b. Spidol d. Kamus
69. What is the meaning of word goat in indonesia……….
a. Kambing c. Ayam
b. Bebek d. Singa
70. What is the meanig of word bird in indonesia………
a. Cacing c. Katak
b. Semut d. Burung
71. What is the meaning of word dolphin in indonesia……
a. Lumba-lumba c. Ikan
b. Sapi d. Rusa
72. Where is the peopole to find the woods for bur…….
c. Campus c. Library
d. Forest d. House
73. Can yo show, where is things in outside home……
e. Plate, glass, and cup
f. Sky, stone, and gravel
g. Stone, cup, and gravel
h. Stone, gravel, abd plate
74. What is the meaning of word memo pad in indonesia……
a. Kertas c. Pen
b. Kertas memo d. Kamus
75. What is the meaning of word eraser in indonesia……
a. Penggaris c. Pulpen
b. Penghapus d. Pensil
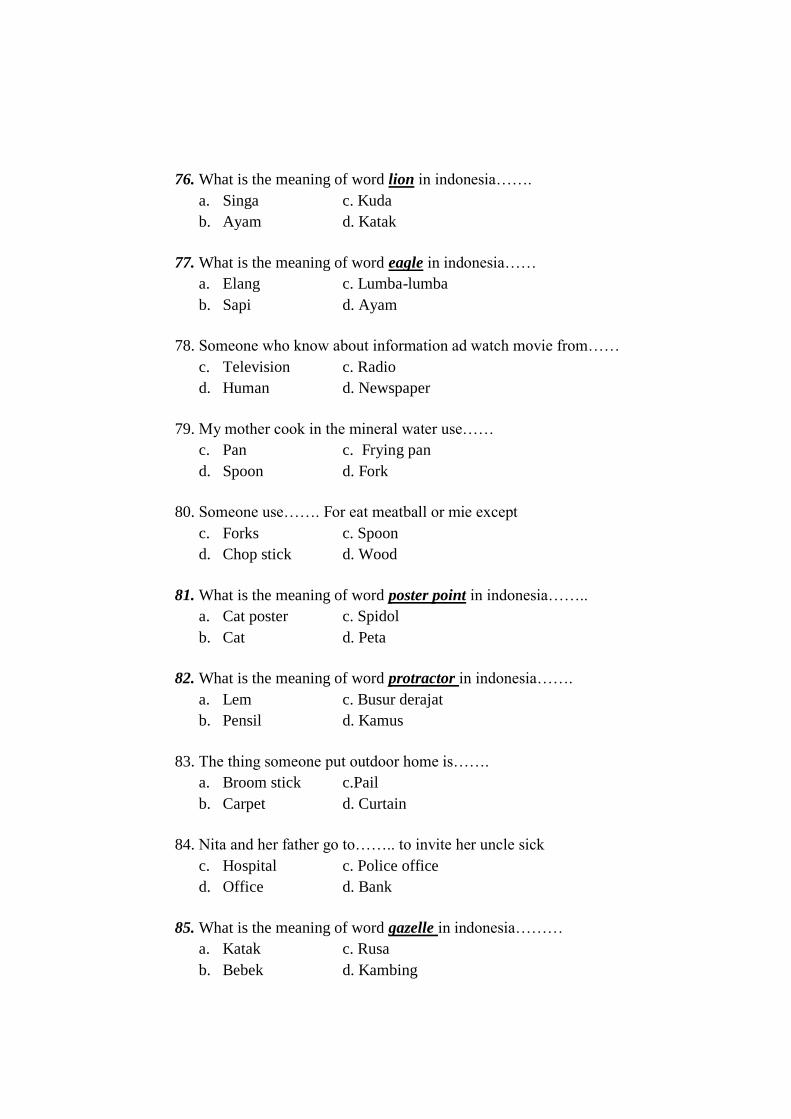
91
76. What is the meaning of word lion in indonesia…….
a. Singa c. Kuda
b. Ayam d. Katak
77. What is the meaning of word eagle in indonesia……
a. Elang c. Lumba-lumba
b. Sapi d. Ayam
78. Someone who know about information ad watch movie from……
c. Television c. Radio
d. Human d. Newspaper
79. My mother cook in the mineral water use……
c. Pan c. Frying pan
d. Spoon d. Fork
80. Someone use……. For eat meatball or mie except
c. Forks c. Spoon
d. Chop stick d. Wood
81. What is the meaning of word poster point in indonesia……..
a. Cat poster c. Spidol
b. Cat d. Peta
82. What is the meaning of word protractor in indonesia…….
a. Lem c. Busur derajat
b. Pensil d. Kamus
83. The thing someone put outdoor home is…….
a. Broom stick c.Pail
b. Carpet d. Curtain
84. Nita and her father go to…….. to invite her uncle sick
c. Hospital c. Police office
d. Office d. Bank
85. What is the meaning of word gazelle in indonesia………
a. Katak c. Rusa
b. Bebek d. Kambing
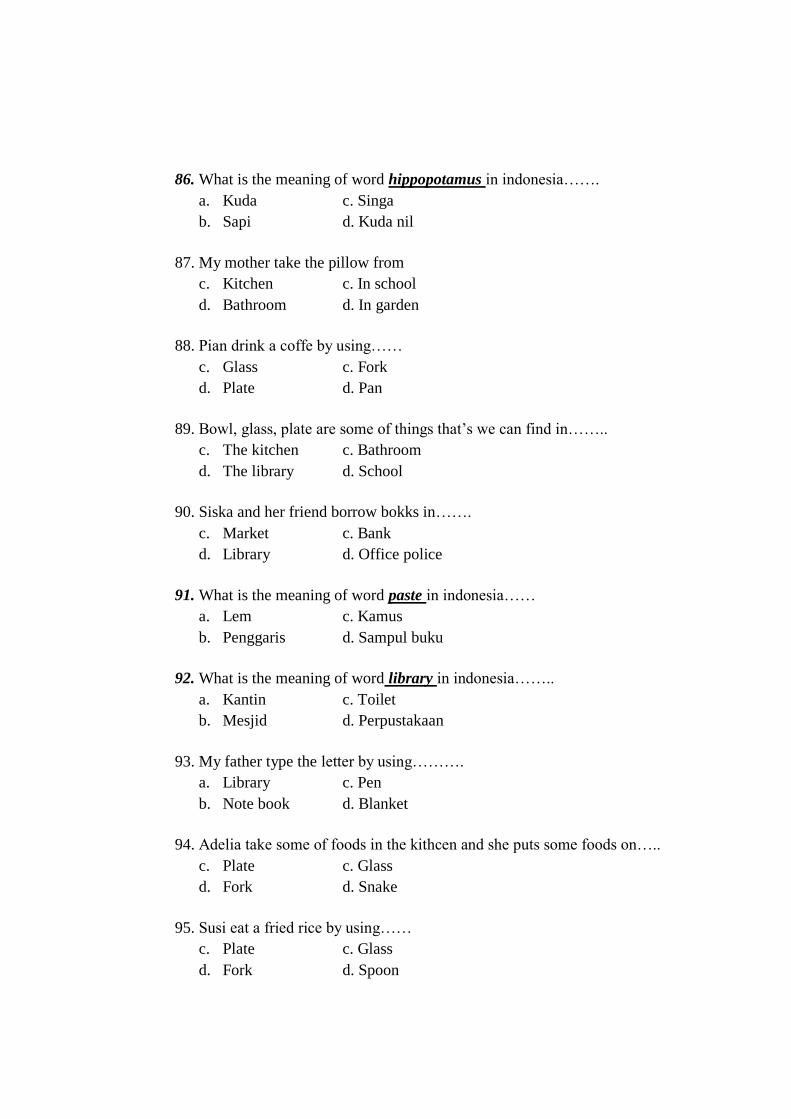
92
86. What is the meaning of word hippopotamus in indonesia…….
a. Kuda c. Singa
b. Sapi d. Kuda nil
87. My mother take the pillow from
c. Kitchen c. In school
d. Bathroom d. In garden
88. Pian drink a coffe by using……
c. Glass c. Fork
d. Plate d. Pan
89. Bowl, glass, plate are some of things that’s we can find in……..
c. The kitchen c. Bathroom
d. The library d. School
90. Siska and her friend borrow bokks in…….
c. Market c. Bank
d. Library d. Office police
91. What is the meaning of word paste in indonesia……
a. Lem c. Kamus
b. Penggaris d. Sampul buku
92. What is the meaning of word library in indonesia……..
a. Kantin c. Toilet
b. Mesjid d. Perpustakaan
93. My father type the letter by using……….
a. Library c. Pen
b. Note book d. Blanket
94. Adelia take some of foods in the kithcen and she puts some foods on…..
c. Plate c. Glass
d. Fork d. Snake
95. Susi eat a fried rice by using……
c. Plate c. Glass
d. Fork d. Spoon
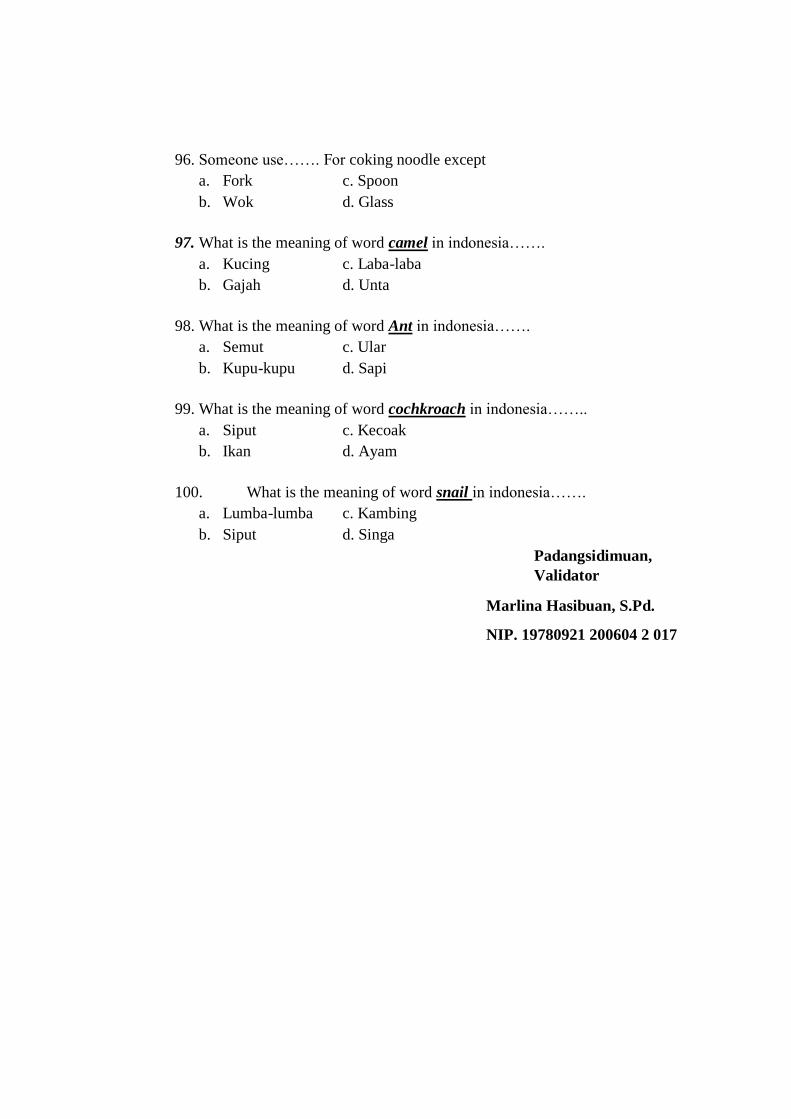
93
96. Someone use……. For coking noodle except
a. Fork c. Spoon
b. Wok d. Glass
97. What is the meaning of word camel in indonesia…….
a. Kucing c. Laba-laba
b. Gajah d. Unta
98. What is the meaning of word Ant in indonesia…….
a. Semut c. Ular
b. Kupu-kupu d. Sapi
99. What is the meaning of word cochkroach in indonesia……..
a. Siput c. Kecoak
b. Ikan d. Ayam
100. What is the meaning of word snail in indonesia…….
a. Lumba-lumba c. Kambing
b. Siput d. Singa
Padangsidimuan,
Validator
Marlina Hasibuan, S.Pd.
NIP. 19780921 200604 2 017
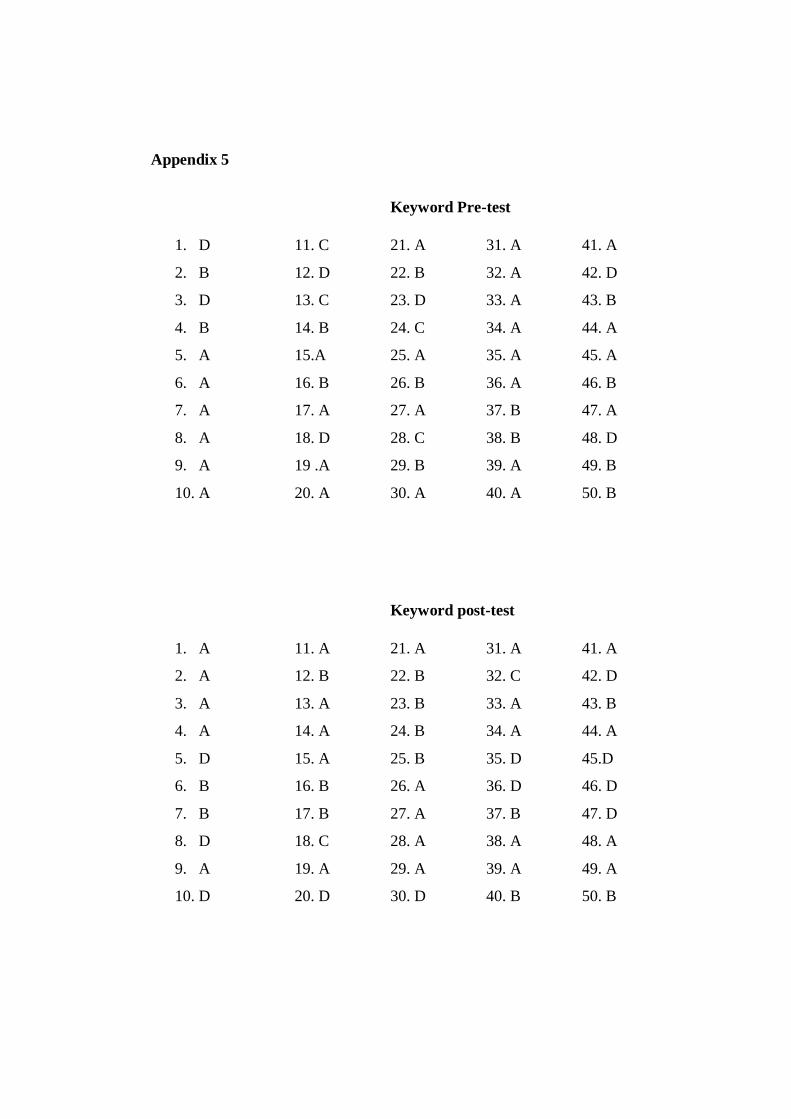
94
Appendix 5
Keyword Pre-test
1. D 11. C 21. A 31. A 41. A
2. B 12. D 22. B 32. A 42. D
3. D 13. C 23. D 33. A 43. B
4. B 14. B 24. C 34. A 44. A
5. A 15.A 25. A 35. A 45. A
6. A 16. B 26. B 36. A 46. B
7. A 17. A 27. A 37. B 47. A
8. A 18. D 28. C 38. B 48. D
9. A 19 .A 29. B 39. A 49. B
10. A 20. A 30. A 40. A 50. B
Keyword post-test
1. A 11. A 21. A 31. A 41. A
2. A 12. B 22. B 32. C 42. D
3. A 13. A 23. B 33. A 43. B
4. A 14. A 24. B 34. A 44. A
5. D 15. A 25. B 35. D 45.D
6. B 16. B 26. A 36. D 46. D
7. B 17. B 27. A 37. B 47. D
8. D 18. C 28. A 38. A 48. A
9. A 19. A 29. A 39. A 49. A
10. D 20. D 30. D 40. B 50. B
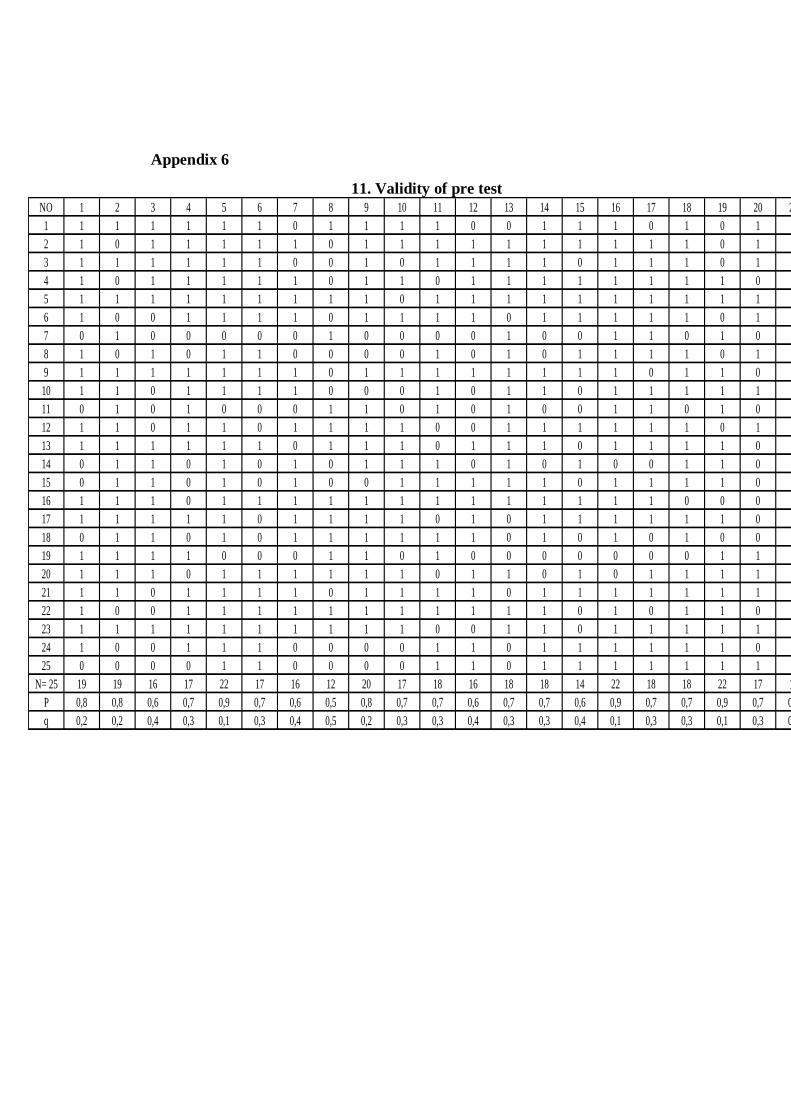
95
Appendix 6
11. Validity of pre test
NO 1 2 3 4 5 6 7 8 9 10 11 12 13 14 15 16 17 18 19 20 21 22 23 24 25
1 1 1 1 1 1 1 0 1 1 1 1 0 0 1 1 1 0 1 0 1 1 0 1 1 0
2 1 0 1 1 1 1 1 0 1 1 1 1 1 1 1 1 1 1 0 1 0 1 0 1 0
3 1 1 1 1 1 1 0 0 1 0 1 1 1 1 0 1 1 1 0 1 1 1 1 1 1
4 1 0 1 1 1 1 1 0 1 1 0 1 1 1 1 1 1 1 1 0 0 1 1 1 1
5 1 1 1 1 1 1 1 1 1 0 1 1 1 1 1 1 1 1 1 1 1 0 1 1 0
6 1 0 0 1 1 1 1 0 1 1 1 1 0 1 1 1 1 1 0 1 1 1 1 1 0
7 0 1 0 0 0 0 0 1 0 0 0 0 1 0 0 1 1 0 1 0 1 0 0 1 1
8 1 0 1 0 1 1 0 0 0 0 1 0 1 0 1 1 1 1 0 1 1 1 0 1 1
9 1 1 1 1 1 1 1 0 1 1 1 1 1 1 1 1 0 1 1 0 1 1 0 1 1
10 1 1 0 1 1 1 1 0 0 0 1 0 1 1 0 1 1 1 1 1 0 0 1 1 1
11 0 1 0 1 0 0 0 1 1 0 1 0 1 0 0 1 1 0 1 0 1 1 0 1 0
12 1 1 0 1 1 0 1 1 1 1 0 0 1 1 1 1 1 1 0 1 0 1 0 1 1
13 1 1 1 1 1 1 0 1 1 1 0 1 1 1 0 1 1 1 1 0 1 1 0 1 1
14 0 1 1 0 1 0 1 0 1 1 1 0 1 0 1 0 0 1 1 0 1 1 1 0 1
15 0 1 1 0 1 0 1 0 0 1 1 1 1 1 0 1 1 1 1 0 1 1 1 1 1
16 1 1 1 0 1 1 1 1 1 1 1 1 1 1 1 1 1 0 0 0 1 1 0 1 1
17 1 1 1 1 1 0 1 1 1 1 0 1 0 1 1 1 1 1 1 0 0 1 1 1 1
18 0 1 1 0 1 0 1 1 1 1 1 1 0 1 0 1 0 1 0 0 1 1 1 1 1
19 1 1 1 1 0 0 0 1 1 0 1 0 0 0 0 0 0 0 1 1 0 0 0 0 0
20 1 1 1 0 1 1 1 1 1 1 0 1 1 0 1 0 1 1 1 1 1 1 1 1 0
21 1 1 0 1 1 1 1 0 1 1 1 1 0 1 1 1 1 1 1 1 1 0 1 1 0
22 1 0 0 1 1 1 1 1 1 1 1 1 1 1 0 1 0 1 1 0 1 1 0 0 1
23 1 1 1 1 1 1 1 1 1 1 0 0 1 1 0 1 1 1 1 1 1 1 0 0 1
24 1 0 0 1 1 1 0 0 0 0 1 1 0 1 1 1 1 1 1 0 1 0 0 1 1
25 0 0 0 0 1 1 0 0 0 0 1 1 0 1 1 1 1 1 1 1 0 0 0 1 1
N= 25 19 19 16 17 22 17 16 12 20 17 18 16 18 18 14 22 18 18 22 17 14 18 14 20 18
P 0,8 0,8 0,6 0,7 0,9 0,7 0,6 0,5 0,8 0,7 0,7 0,6 0,7 0,7 0,6 0,9 0,7 0,7 0,9 0,7 0,6 0,7 0,6 0,8 0,7
q 0,2 0,2 0,4 0,3 0,1 0,3 0,4 0,5 0,2 0,3 0,3 0,4 0,3 0,3 0,4 0,1 0,3 0,3 0,1 0,3 0,4 0,3 0,4 0,2 0,3
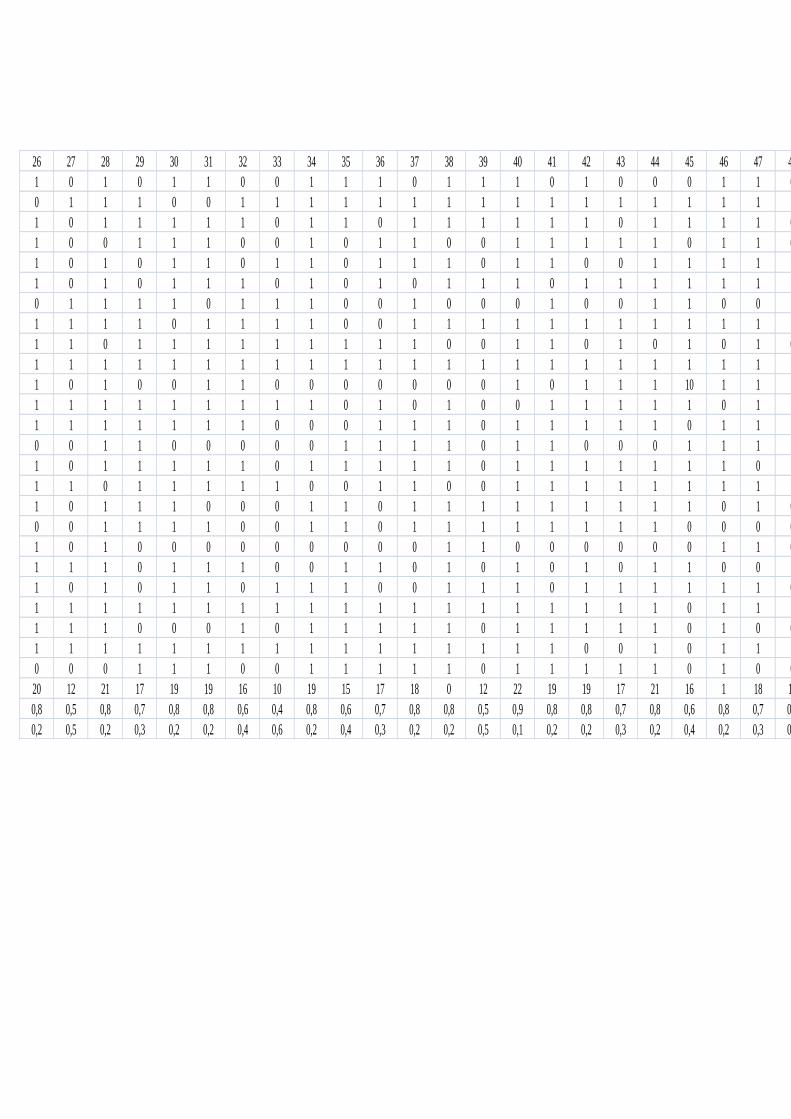
96
26 27 28 29 30 31 32 33 34 35 36 37 38 39 40 41 42 43 44 45 46 47 48 49 50 Xt Xt²
1 0 1 0 1 1 0 0 1 1 1 0 1 1 1 0 1 0 0 0 1 1 0 1 1 33 1089
0 1 1 1 0 0 1 1 1 1 1 1 1 1 1 1 1 1 1 1 1 1 1 1 1 41 1763
1 0 1 1 1 1 1 0 1 1 0 1 1 1 1 1 1 0 1 1 1 1 0 1 1 40 1600
1 0 0 1 1 1 0 0 1 0 1 1 0 0 1 1 1 1 1 0 1 1 0 1 1 36 1476
1 0 1 0 1 1 0 1 1 0 1 1 1 0 1 1 0 0 1 1 1 1 1 1 1 40 1600
1 0 1 0 1 1 1 0 1 0 1 0 1 1 1 0 1 1 1 1 1 1 1 1 1 38 1368
0 1 1 1 1 0 1 1 1 0 0 1 0 0 0 1 0 0 1 1 0 0 1 1 0 22 484
1 1 1 1 0 1 1 1 1 0 0 1 1 1 1 1 1 1 1 1 1 1 1 1 1 37 1406
1 1 0 1 1 1 1 1 1 1 1 1 0 0 1 1 0 1 0 1 0 1 0 1 1 39 1521
1 1 1 1 1 1 1 1 1 1 1 1 1 1 1 1 1 1 1 1 1 1 1 1 1 42 1764
1 0 1 0 0 1 1 0 0 0 0 0 0 0 1 0 1 1 1 10 1 1 1 1 0 25 625
1 1 1 1 1 1 1 1 1 0 1 0 1 0 0 1 1 1 1 1 0 1 1 0 0 36 1476
1 1 1 1 1 1 1 0 0 0 1 1 1 0 1 1 1 1 1 0 1 1 1 1 1 40 1600
0 0 1 1 0 0 0 0 0 1 1 1 1 0 1 1 0 0 0 1 1 1 1 1 0 25 625
1 0 1 1 1 1 1 0 1 1 1 1 1 0 1 1 1 1 1 1 1 0 1 1 1 39 1131
1 1 0 1 1 1 1 1 0 0 1 1 0 0 1 1 1 1 1 1 1 1 1 1 1 40 1600
1 0 1 1 1 0 0 0 1 1 0 1 1 1 1 1 1 1 1 1 0 1 0 1 1 37 1406
0 0 1 1 1 1 0 0 1 1 0 1 1 1 1 1 1 1 1 0 0 0 0 1 1 33 1056
1 0 1 0 0 0 0 0 0 0 0 0 1 1 0 0 0 0 0 0 1 1 0 0 0 14 154
1 1 1 0 1 1 1 0 0 1 1 0 1 0 1 0 1 0 1 1 0 0 1 1 1 38 1368
1 0 1 0 1 1 0 1 1 1 0 0 1 1 1 0 1 1 1 1 1 1 0 1 1 38 1368
1 1 1 1 1 1 1 1 1 1 1 1 1 1 1 1 1 1 1 0 1 1 1 1 1 41 1476
1 1 1 0 0 0 1 0 1 1 1 1 1 0 1 1 1 1 1 0 1 0 0 1 1 38 1596
1 1 1 1 1 1 1 1 1 1 1 1 1 1 1 1 0 0 1 0 1 1 1 1 0 38 1368
0 0 0 1 1 1 0 0 1 1 1 1 1 0 1 1 1 1 1 0 1 0 0 1 1 28 756
20 12 21 17 19 19 16 10 19 15 17 18 0 12 22 19 19 17 21 16 1 18 14 22 19 Xt= 878Xt²= 31255
0,8 0,5 0,8 0,7 0,8 0,8 0,6 0,4 0,8 0,6 0,7 0,8 0,8 0,5 0,9 0,8 0,8 0,7 0,8 0,6 0,8 0,7 0,6 0,9 0,8
0,2 0,5 0,2 0,3 0,2 0,2 0,4 0,6 0,2 0,4 0,3 0,2 0,2 0,5 0,1 0,2 0,2 0,3 0,2 0,4 0,2 0,3 0,4 0,1 0,2
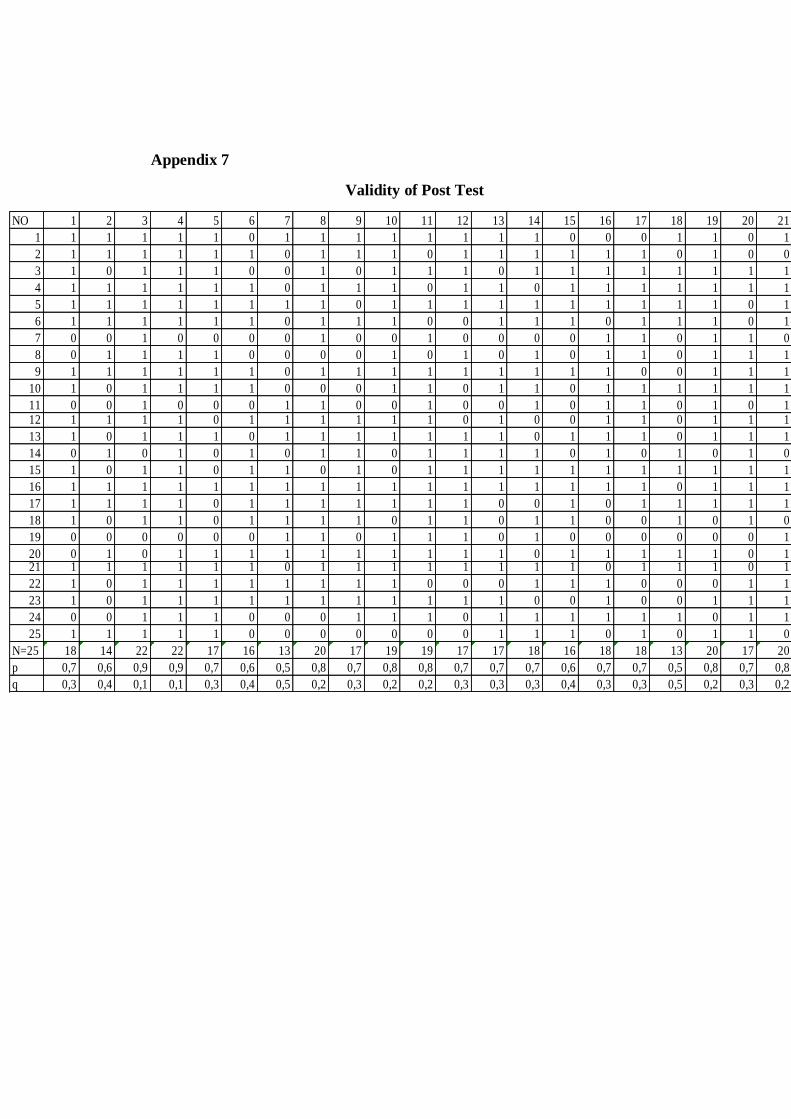
97
Appendix 7
Validity of Post Test
NO 1 2 3 4 5 6 7 8 9 10 11 12 13 14 15 16 17 18 19 20 21 22 23 24 25
1 1 1 1 1 1 0 1 1 1 1 1 1 1 1 0 0 0 1 1 0 1 0 1 0 1
2 1 1 1 1 1 1 0 1 1 1 0 1 1 1 1 1 1 0 1 0 0 1 1 1 0
3 1 0 1 1 1 0 0 1 0 1 1 1 0 1 1 1 1 1 1 1 1 0 1 1 1
4 1 1 1 1 1 1 0 1 1 1 0 1 1 0 1 1 1 1 1 1 1 0 0 1 1
5 1 1 1 1 1 1 1 1 0 1 1 1 1 1 1 1 1 1 1 0 1 0 1 0 1
6 1 1 1 1 1 1 0 1 1 1 0 0 1 1 1 0 1 1 1 0 1 0 1 0 1
7 0 0 1 0 0 0 0 1 0 0 1 0 0 0 0 1 1 0 1 1 0 1 1 1 1
8 0 1 1 1 1 0 0 0 0 1 0 1 0 1 0 1 1 0 1 1 1 1 1 1 0
9 1 1 1 1 1 1 0 1 1 1 1 1 1 1 1 1 0 0 1 1 1 1 0 1 1
10 1 0 1 1 1 1 0 0 0 1 1 0 1 1 0 1 1 1 1 1 1 1 1 1 1
11 0 0 1 0 0 0 1 1 0 0 1 0 0 1 0 1 1 0 1 0 1 0 1 0 012 1 1 1 1 0 1 1 1 1 1 1 0 1 0 0 1 1 0 1 1 1 1 1 1 1
13 1 0 1 1 1 0 1 1 1 1 1 1 1 0 1 1 1 0 1 1 1 1 1 1 1
14 0 1 0 1 0 1 0 1 1 0 1 1 1 1 0 1 0 1 0 1 0 0 1 1 0
15 1 0 1 1 0 1 1 0 1 0 1 1 1 1 1 1 1 1 1 1 1 0 1 1 1
16 1 1 1 1 1 1 1 1 1 1 1 1 1 1 1 1 1 0 1 1 1 1 0 1 1
17 1 1 1 1 0 1 1 1 1 1 1 1 0 0 1 0 1 1 1 1 1 0 1 1 1
18 1 0 1 1 0 1 1 1 1 0 1 1 0 1 1 0 0 1 0 1 0 0 1 1 1
19 0 0 0 0 0 0 1 1 0 1 1 1 0 1 0 0 0 0 0 0 1 0 1 0 0
20 0 1 0 1 1 1 1 1 1 1 1 1 1 0 1 1 1 1 1 0 1 1 1 0 121 1 1 1 1 1 1 0 1 1 1 1 1 1 1 1 0 1 1 1 0 1 0 1 0 1
22 1 0 1 1 1 1 1 1 1 1 0 0 0 1 1 1 0 0 0 1 1 1 1 1 1
23 1 0 1 1 1 1 1 1 1 1 1 1 1 0 0 1 0 0 1 1 1 1 1 0 0
24 0 0 1 1 1 0 0 0 1 1 1 0 1 1 1 1 1 1 0 1 1 1 1 1 1
25 1 1 1 1 1 0 0 0 0 0 0 0 1 1 1 0 1 0 1 1 0 0 0 1 1
N=25 18 14 22 22 17 16 13 20 17 19 19 17 17 18 16 18 18 13 20 17 20 12 21 17 19
p 0,7 0,6 0,9 0,9 0,7 0,6 0,5 0,8 0,7 0,8 0,8 0,7 0,7 0,7 0,6 0,7 0,7 0,5 0,8 0,7 0,8 0,5 0,8 0,7 0,8
q 0,3 0,4 0,1 0,1 0,3 0,4 0,5 0,2 0,3 0,2 0,2 0,3 0,3 0,3 0,4 0,3 0,3 0,5 0,2 0,3 0,2 0,5 0,2 0,3 0,2
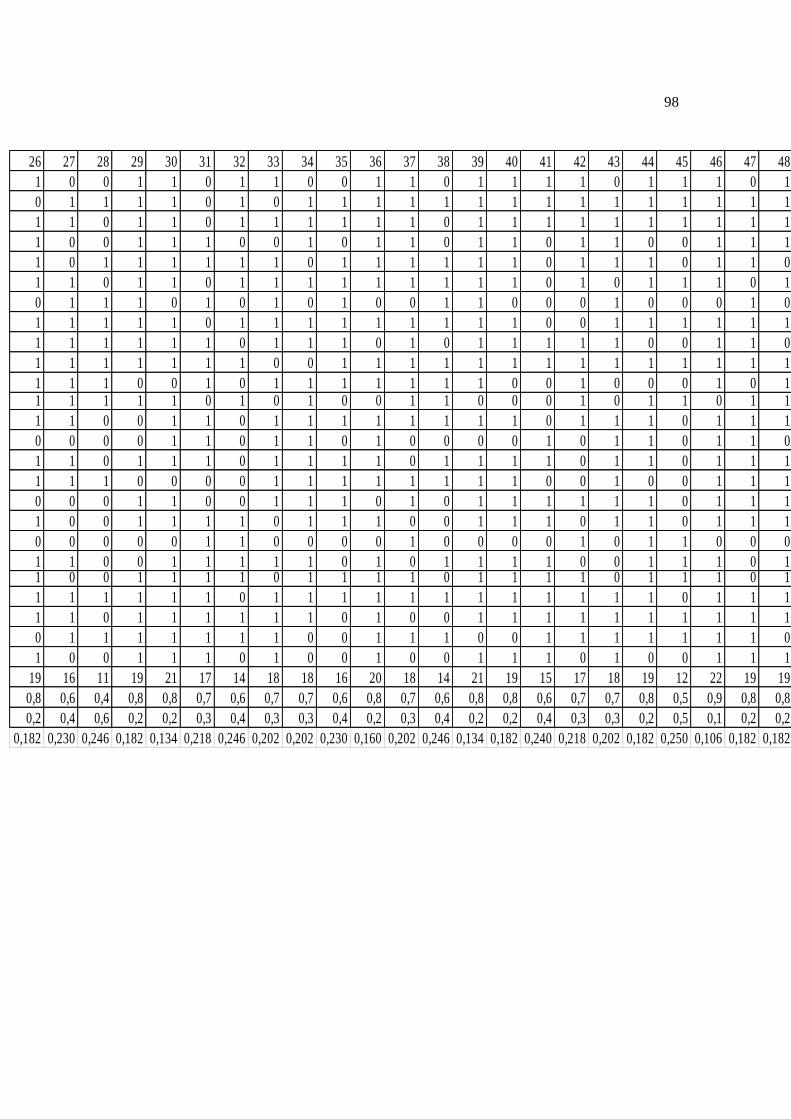
98
26 27 28 29 30 31 32 33 34 35 36 37 38 39 40 41 42 43 44 45 46 47 48 49 50 Xt Xt2
1 0 0 1 1 0 1 1 0 0 1 1 0 1 1 1 1 0 1 1 1 0 1 0 0 33 1089
0 1 1 1 1 0 1 0 1 1 1 1 1 1 1 1 1 1 1 1 1 1 1 1 1 41 1763
1 1 0 1 1 0 1 1 1 1 1 1 0 1 1 1 1 1 1 1 1 1 1 0 1 40 1480
1 0 0 1 1 1 0 0 1 0 1 1 0 1 1 0 1 1 0 0 1 1 1 1 1 36 1188
1 0 1 1 1 1 1 1 0 1 1 1 1 1 1 0 1 1 1 0 1 1 0 0 1 40 2000
1 1 0 1 1 0 1 1 1 1 1 1 1 1 1 0 1 0 1 1 1 0 1 1 1 38 1330
0 1 1 1 0 1 0 1 0 1 0 0 1 1 0 0 0 1 0 0 0 1 0 0 1 22 396
1 1 1 1 1 0 1 1 1 1 1 1 1 1 1 0 0 1 1 1 1 1 1 1 1 37 1480
1 1 1 1 1 1 0 1 1 1 0 1 0 1 1 1 1 1 0 0 1 1 0 1 0 39 1599
1 1 1 1 1 1 1 0 0 1 1 1 1 1 1 1 1 1 1 1 1 1 1 1 1 42 1596
1 1 1 0 0 1 0 1 1 1 1 1 1 1 0 0 1 0 0 0 1 0 1 1 1 26 1301 1 1 1 1 0 1 0 1 0 0 1 1 0 0 0 1 0 1 1 0 1 1 1 1 36 1476
1 1 0 0 1 1 0 1 1 1 1 1 1 1 1 0 1 1 1 0 1 1 1 0 1 40 1520
0 0 0 0 1 1 0 1 1 0 1 0 0 0 0 1 0 1 1 0 1 1 0 1 0 25 550
1 1 0 1 1 1 0 1 1 1 1 0 1 1 1 1 0 1 1 0 1 1 1 1 1 40 1160
1 1 1 0 0 0 0 1 1 1 1 1 1 1 1 0 0 1 0 0 1 1 1 1 1 40 1680
0 0 0 1 1 0 0 1 1 1 0 1 0 1 1 1 1 1 1 0 1 1 1 1 1 37 1406
1 0 0 1 1 1 1 0 1 1 1 0 0 1 1 1 0 1 1 0 1 1 1 0 1 33 1056
0 0 0 0 0 1 1 0 0 0 0 1 0 0 0 0 1 0 1 1 0 0 0 0 0 14 154
1 1 0 0 1 1 1 1 1 0 1 0 1 1 1 1 0 0 1 1 1 0 1 1 1 38 16721 0 0 1 1 1 1 0 1 1 1 1 0 1 1 1 1 0 1 1 1 0 1 1 1 39 1404
1 1 1 1 1 1 0 1 1 1 1 1 1 1 1 1 1 1 1 0 1 1 1 1 1 41 1476
1 1 0 1 1 1 1 1 1 0 1 0 0 1 1 1 1 1 1 1 1 1 1 0 1 38 1596
0 1 1 1 1 1 1 1 0 0 1 1 1 0 0 1 1 1 1 1 1 1 0 1 1 37 1332
1 0 0 1 1 1 0 1 0 0 1 0 0 1 1 1 0 1 0 0 1 1 1 1 1 28 756
19 16 11 19 21 17 14 18 18 16 20 18 14 21 19 15 17 18 19 12 22 19 19 17 21 880 31289
0,8 0,6 0,4 0,8 0,8 0,7 0,6 0,7 0,7 0,6 0,8 0,7 0,6 0,8 0,8 0,6 0,7 0,7 0,8 0,5 0,9 0,8 0,8 0,7 0,8 ∑Xt ∑Xt2
0,2 0,4 0,6 0,2 0,2 0,3 0,4 0,3 0,3 0,4 0,2 0,3 0,4 0,2 0,2 0,4 0,3 0,3 0,2 0,5 0,1 0,2 0,2 0,3 0,2
0,182 0,230 0,246 0,182 0,134 0,218 0,246 0,202 0,202 0,230 0,160 0,202 0,246 0,134 0,182 0,240 0,218 0,202 0,182 0,250 0,106 0,182 0,182 0,218 0,134 9,853
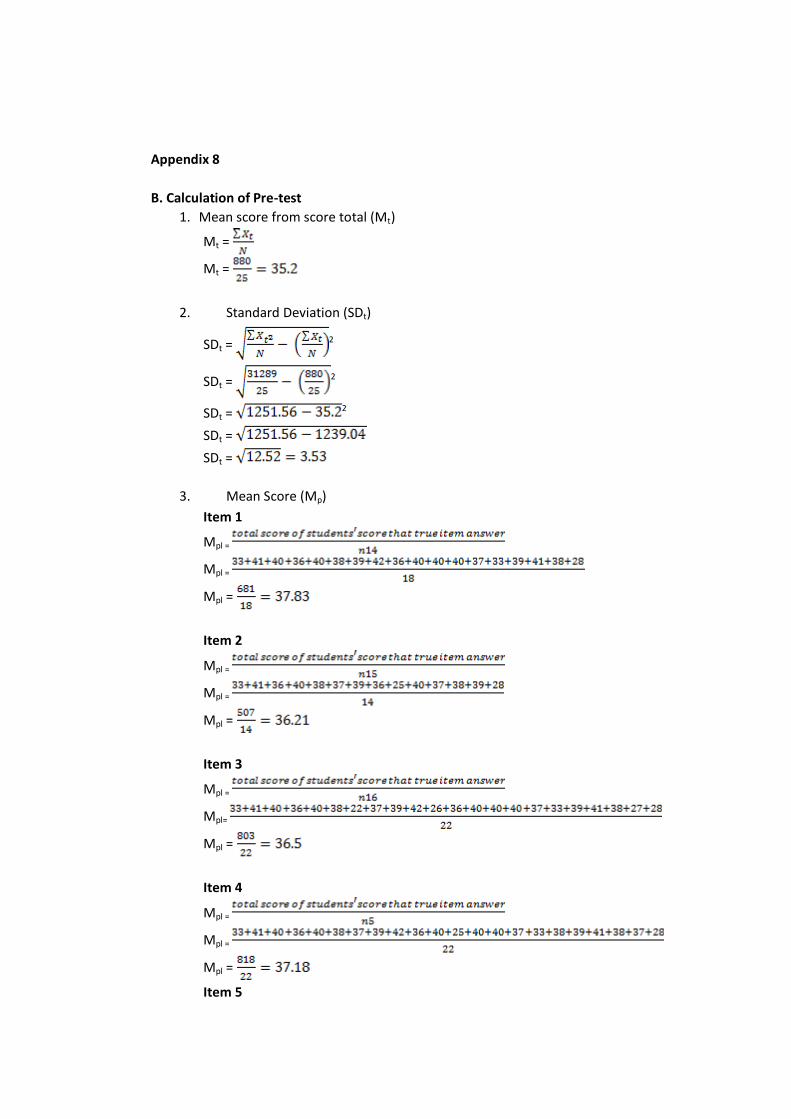
99
Appendix 8
B. Calculation of Pre-test
1. Mean score from score total (Mt)
Mt =
Mt =
2. Standard Deviation (SDt)
SDt = 2
SDt = 2
SDt = 2
SDt =
SDt =
3. Mean Score (Mp)
Item 1
Mpl =
Mpl =
Mpl =
Item 2
Mpl =
Mpl =
Mpl =
Item 3
Mpl =
Mpl=
Mpl =
Item 4
Mpl =
Mpl =
Mpl =
Item 5
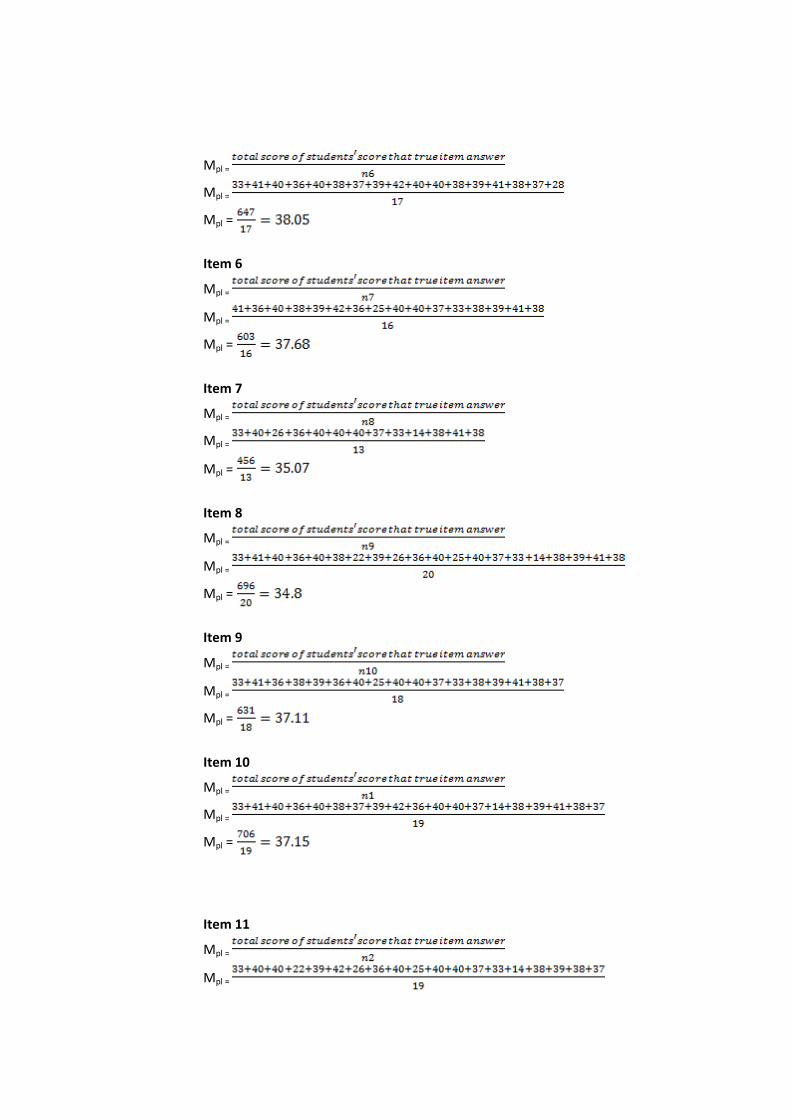
100
Mpl =
Mpl =
Mpl =
Item 6
Mpl =
Mpl =
Mpl =
Item 7
Mpl =
Mpl =
Mpl =
Item 8
Mpl =
Mpl =
Mpl =
Item 9
Mpl =
Mpl =
Mpl =
Item 10
Mpl =
Mpl =
Mpl =
Item 11
Mpl =
Mpl =
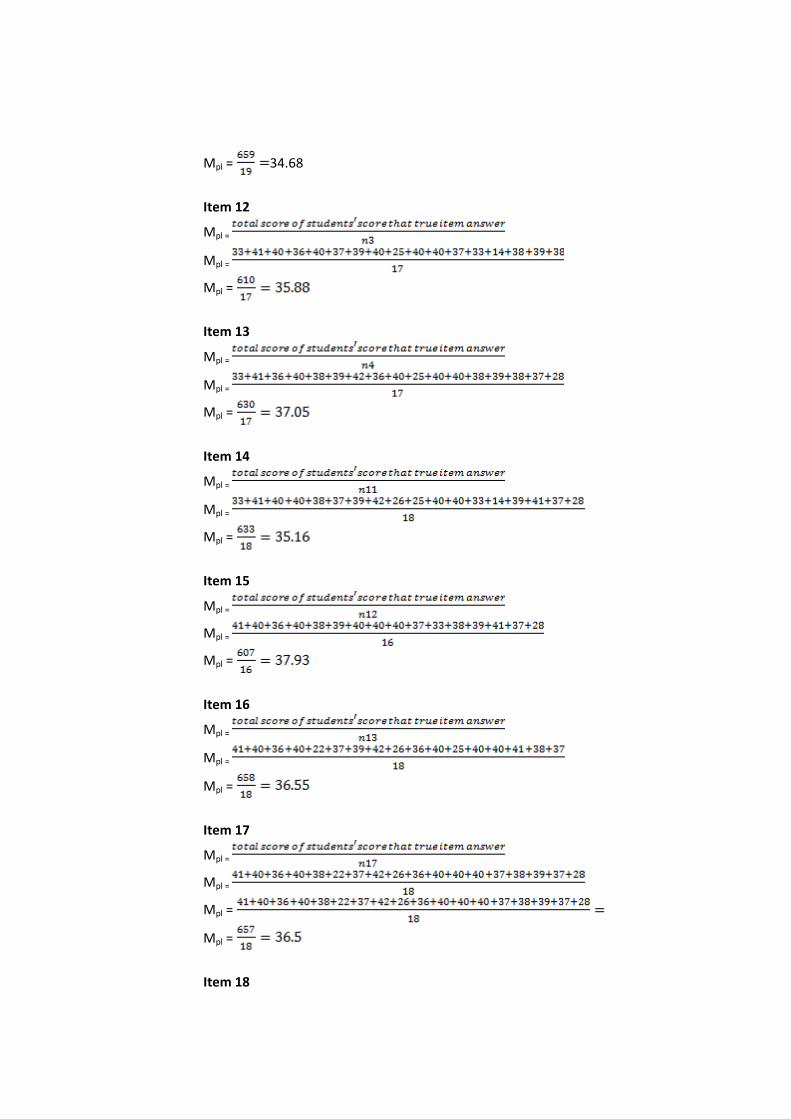
101
Mpl = 34.68
Item 12
Mpl =
Mpl =
Mpl =
Item 13
Mpl =
Mpl =
Mpl =
Item 14
Mpl =
Mpl =
Mpl =
Item 15
Mpl =
Mpl =
Mpl =
Item 16
Mpl =
Mpl =
Mpl =
Item 17
Mpl =
Mpl =
Mpl =
Mpl =
Item 18
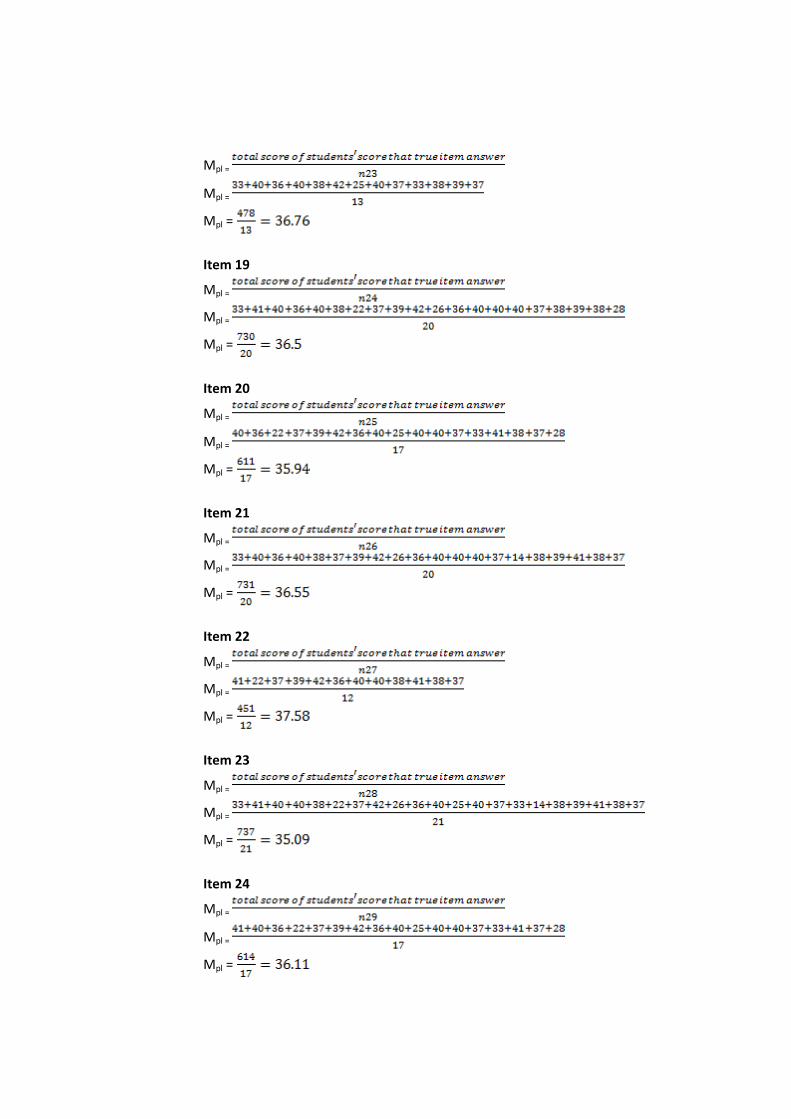
102
Mpl =
Mpl =
Mpl =
Item 19
Mpl =
Mpl =
Mpl =
Item 20
Mpl =
Mpl =
Mpl =
Item 21
Mpl =
Mpl =
Mpl =
Item 22
Mpl =
Mpl =
Mpl =
Item 23
Mpl =
Mpl =
Mpl =
Item 24
Mpl =
Mpl =
Mpl =
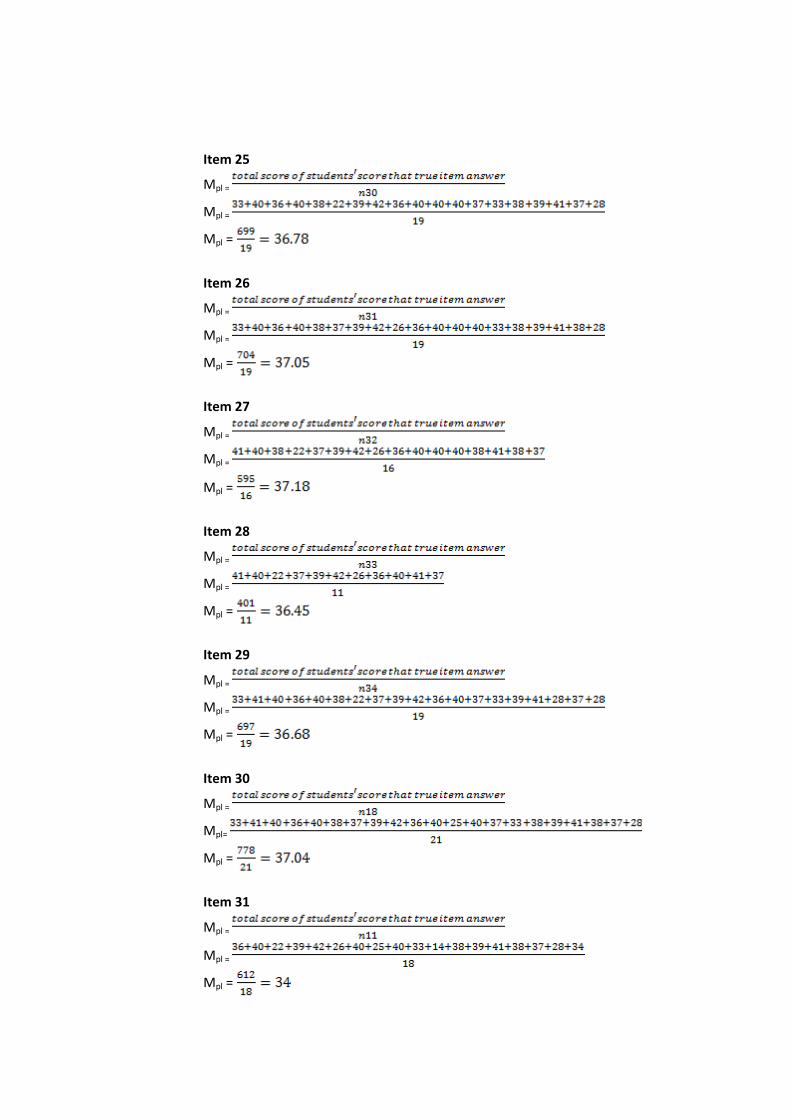
103
Item 25
Mpl =
Mpl =
Mpl =
Item 26
Mpl =
Mpl =
Mpl =
Item 27
Mpl =
Mpl =
Mpl =
Item 28
Mpl =
Mpl =
Mpl =
Item 29
Mpl =
Mpl =
Mpl =
Item 30
Mpl =
Mpl=
Mpl =
Item 31
Mpl =
Mpl =
Mpl =
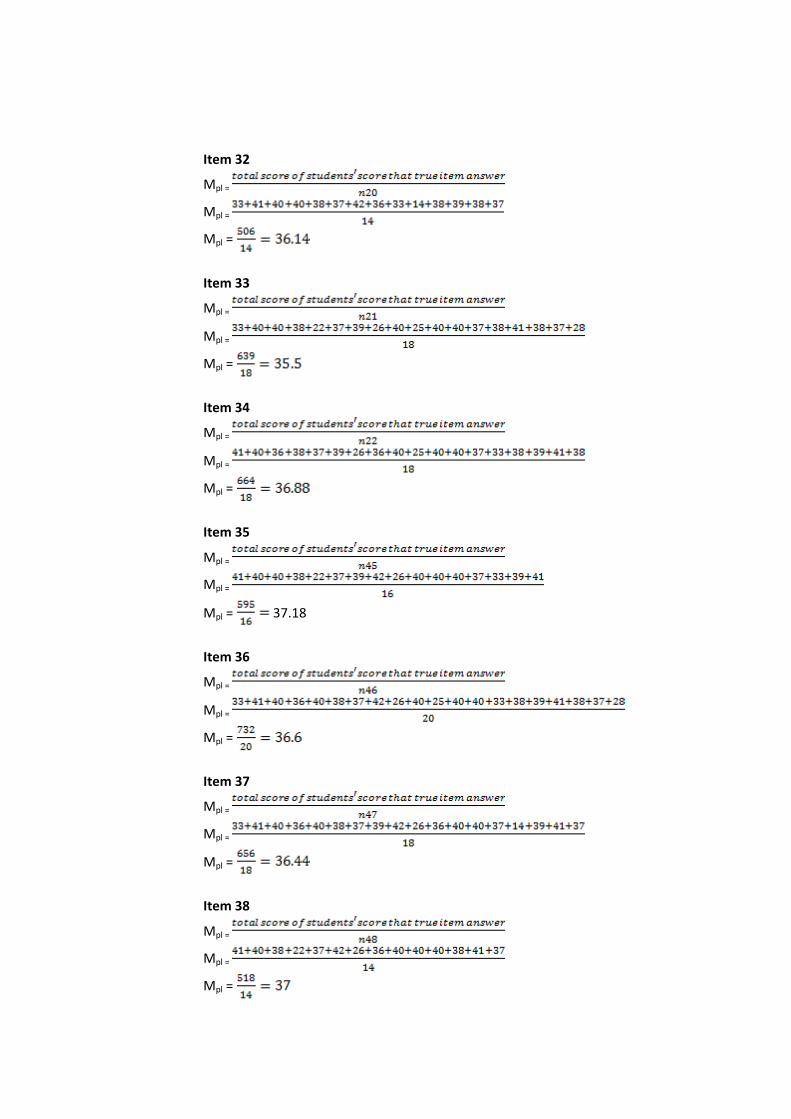
104
Item 32
Mpl =
Mpl =
Mpl =
Item 33
Mpl =
Mpl =
Mpl =
Item 34
Mpl =
Mpl =
Mpl =
Item 35
Mpl =
Mpl =
Mpl = 37.18
Item 36
Mpl =
Mpl =
Mpl =
Item 37
Mpl =
Mpl =
Mpl =
Item 38
Mpl =
Mpl =
Mpl =
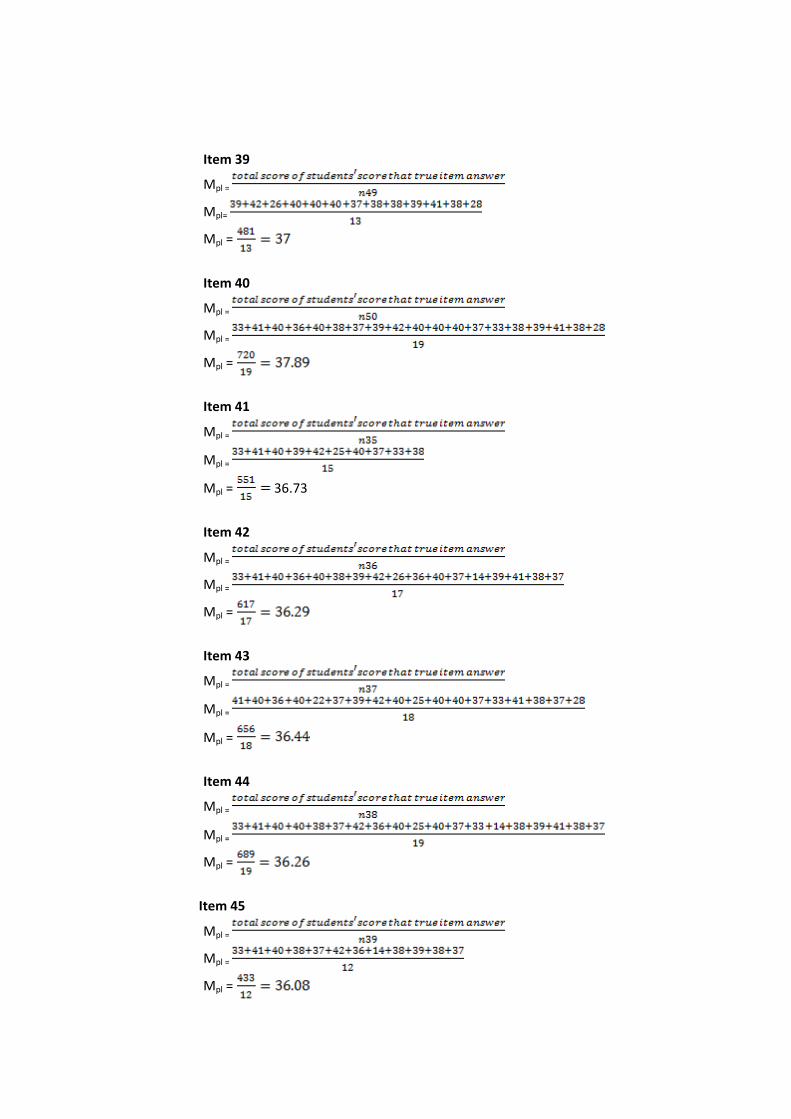
105
Item 39
Mpl =
Mpl=
Mpl =
Item 40
Mpl =
Mpl =
Mpl =
Item 41
Mpl =
Mpl =
Mpl = 36.73
Item 42
Mpl =
Mpl =
Mpl =
Item 43
Mpl =
Mpl =
Mpl =
Item 44
Mpl =
Mpl =
Mpl =
Item 45
Mpl =
Mpl =
Mpl =
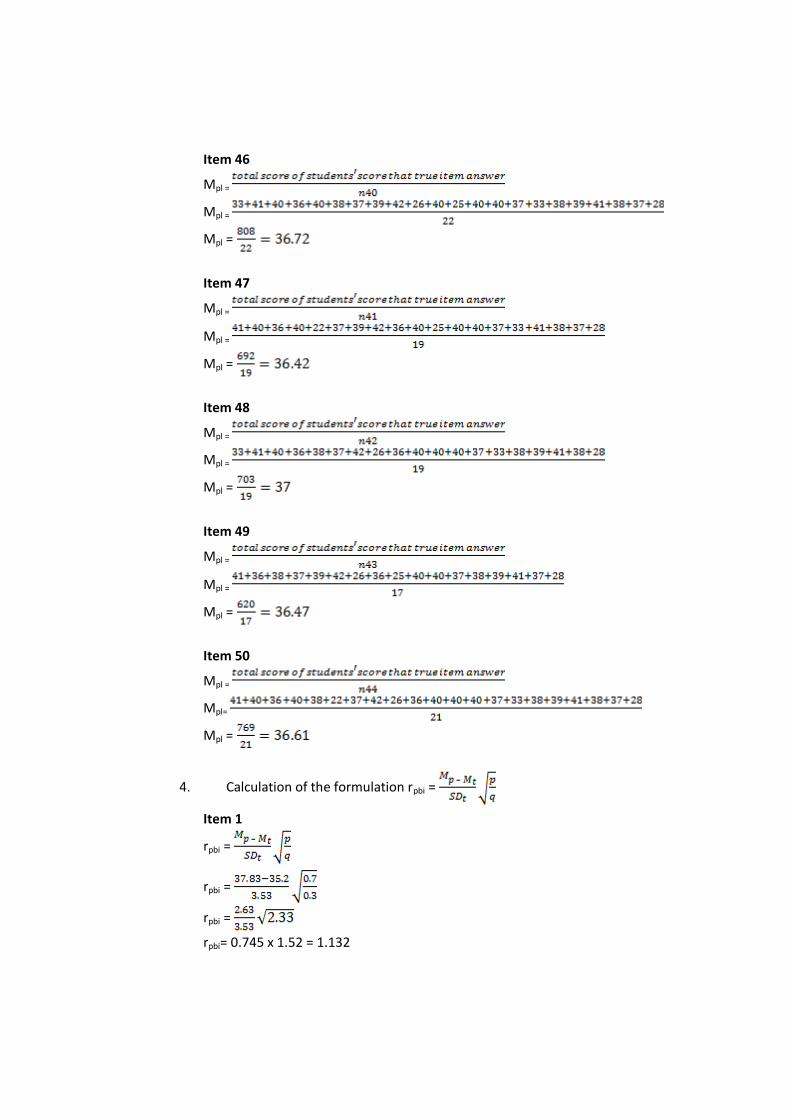
106
Item 46
Mpl =
Mpl =
Mpl =
Item 47
Mpl =
Mpl =
Mpl =
Item 48
Mpl =
Mpl =
Mpl =
Item 49
Mpl =
Mpl =
Mpl =
Item 50
Mpl =
Mpl=
Mpl =
4. Calculation of the formulation rpbi =
Item 1
rpbi =
rpbi =
rpbi =
rpbi= 0.745 x 1.52 = 1.132
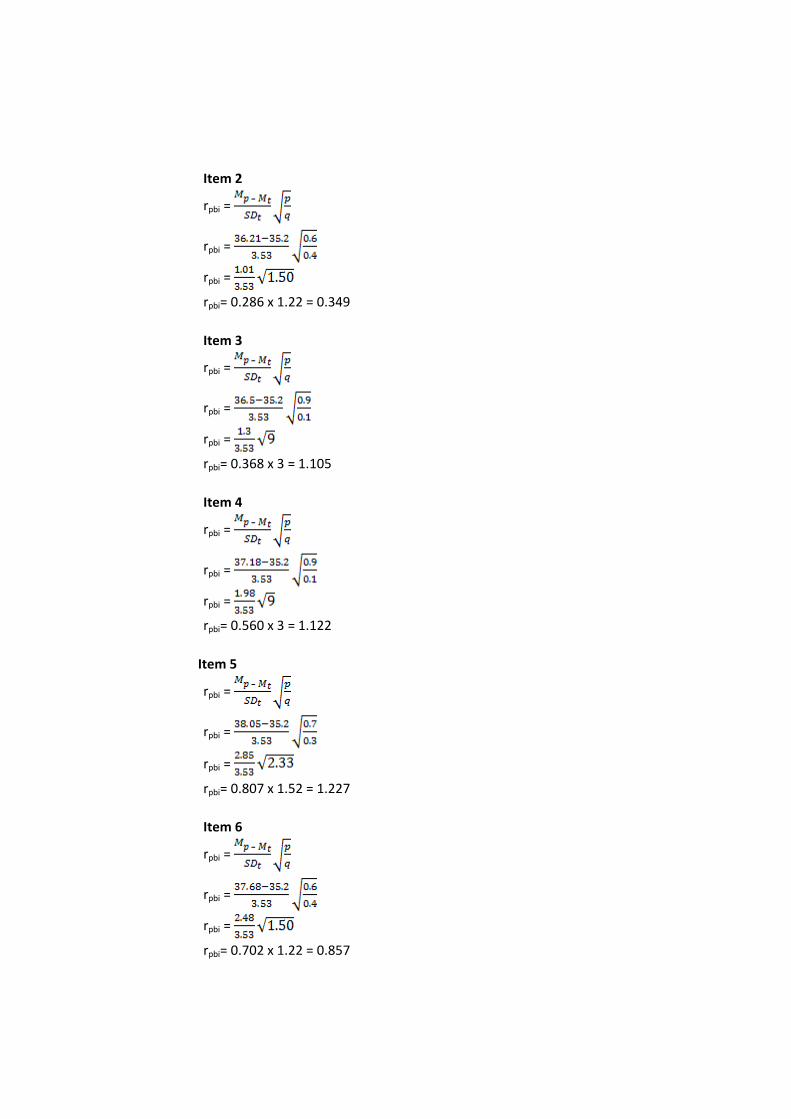
107
Item 2
rpbi =
rpbi =
rpbi =
rpbi= 0.286 x 1.22 = 0.349
Item 3
rpbi =
rpbi =
rpbi =
rpbi= 0.368 x 3 = 1.105
Item 4
rpbi =
rpbi =
rpbi =
rpbi= 0.560 x 3 = 1.122
Item 5
rpbi =
rpbi =
rpbi =
rpbi= 0.807 x 1.52 = 1.227
Item 6
rpbi =
rpbi =
rpbi =
rpbi= 0.702 x 1.22 = 0.857
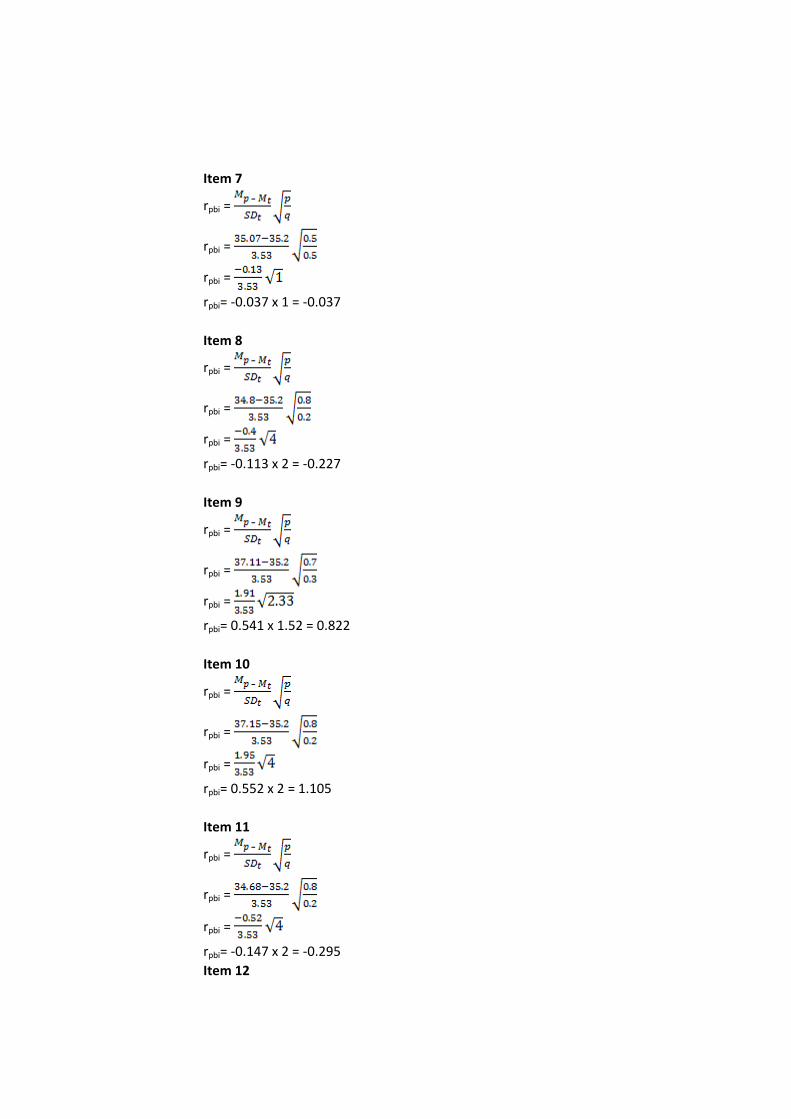
108
Item 7
rpbi =
rpbi =
rpbi =
rpbi= -0.037 x 1 = -0.037
Item 8
rpbi =
rpbi =
rpbi =
rpbi= -0.113 x 2 = -0.227
Item 9
rpbi =
rpbi =
rpbi =
rpbi= 0.541 x 1.52 = 0.822
Item 10
rpbi =
rpbi =
rpbi =
rpbi= 0.552 x 2 = 1.105
Item 11
rpbi =
rpbi =
rpbi =
rpbi= -0.147 x 2 = -0.295
Item 12
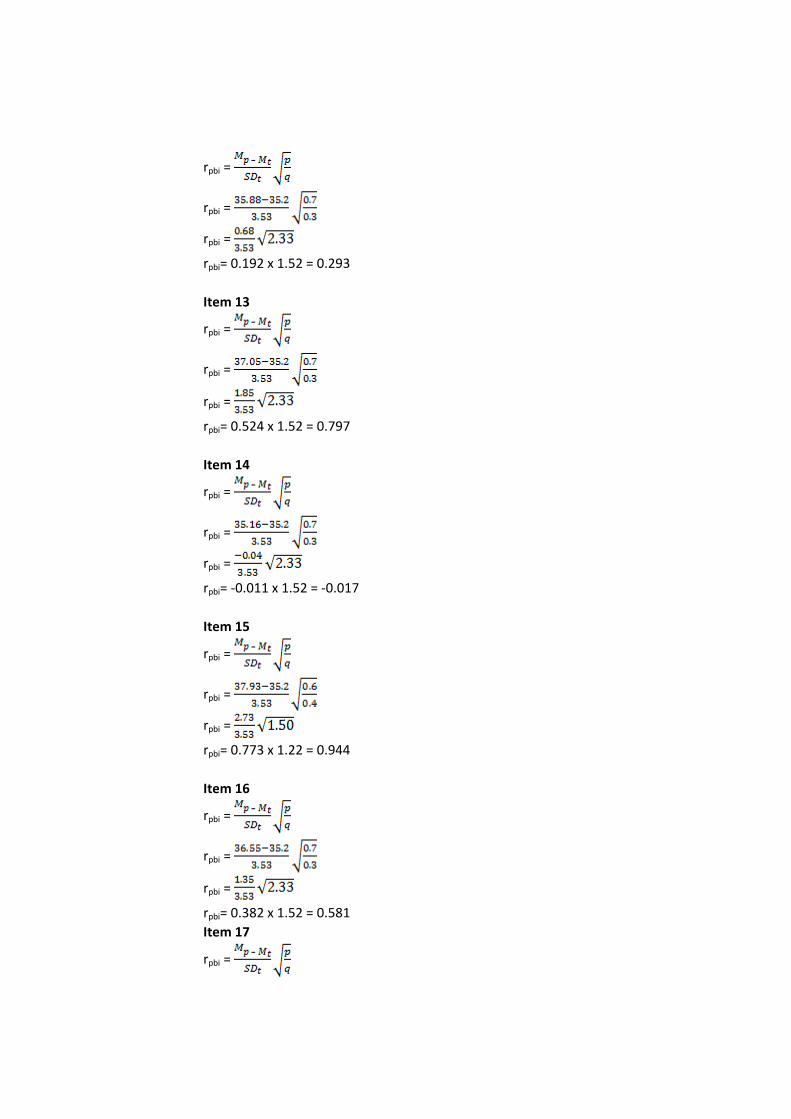
109
rpbi =
rpbi =
rpbi =
rpbi= 0.192 x 1.52 = 0.293
Item 13
rpbi =
rpbi =
rpbi =
rpbi= 0.524 x 1.52 = 0.797
Item 14
rpbi =
rpbi =
rpbi =
rpbi= -0.011 x 1.52 = -0.017
Item 15
rpbi =
rpbi =
rpbi =
rpbi= 0.773 x 1.22 = 0.944
Item 16
rpbi =
rpbi =
rpbi =
rpbi= 0.382 x 1.52 = 0.581
Item 17
rpbi =
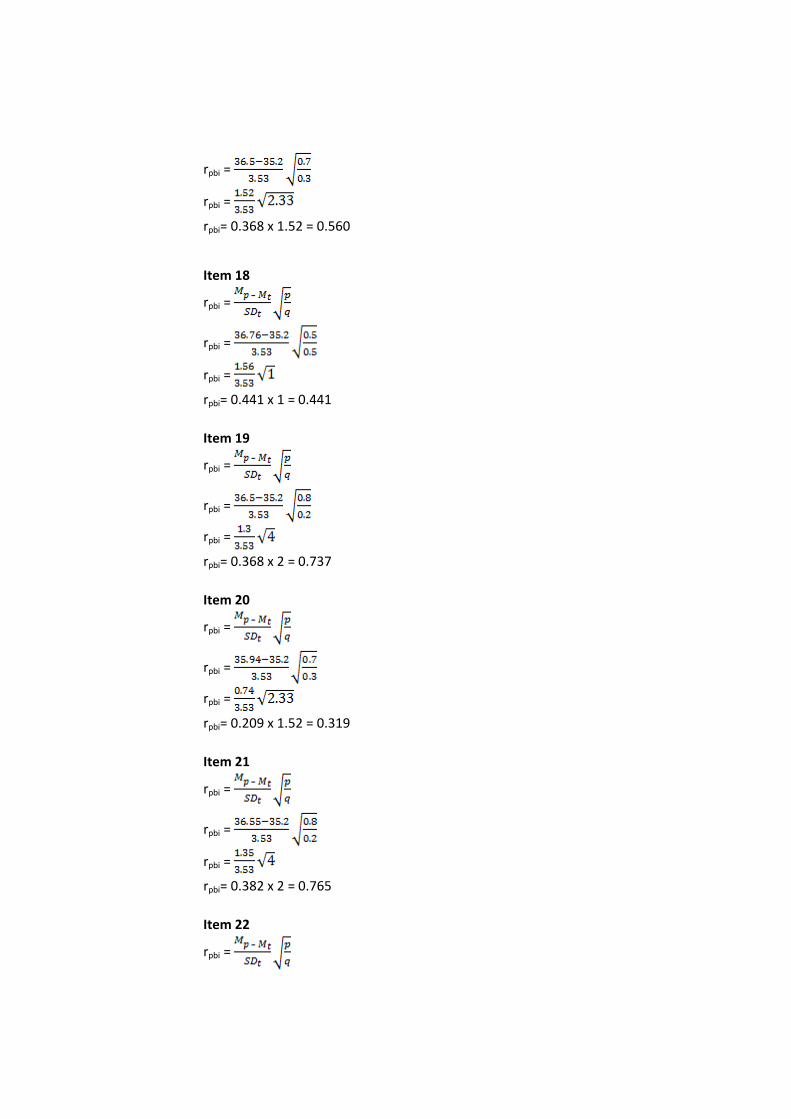
110
rpbi =
rpbi =
rpbi= 0.368 x 1.52 = 0.560
Item 18
rpbi =
rpbi =
rpbi =
rpbi= 0.441 x 1 = 0.441
Item 19
rpbi =
rpbi =
rpbi =
rpbi= 0.368 x 2 = 0.737
Item 20
rpbi =
rpbi =
rpbi =
rpbi= 0.209 x 1.52 = 0.319
Item 21
rpbi =
rpbi =
rpbi =
rpbi= 0.382 x 2 = 0.765
Item 22
rpbi =
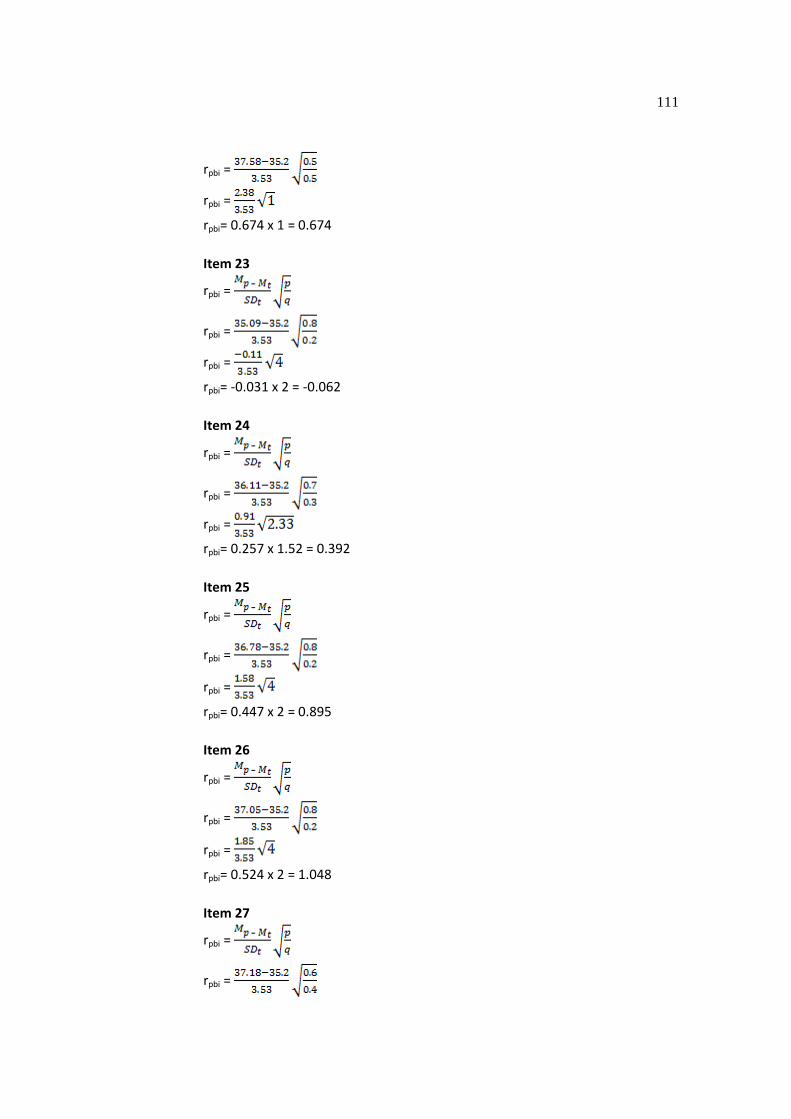
111
rpbi =
rpbi =
rpbi= 0.674 x 1 = 0.674
Item 23
rpbi =
rpbi =
rpbi =
rpbi= -0.031 x 2 = -0.062
Item 24
rpbi =
rpbi =
rpbi =
rpbi= 0.257 x 1.52 = 0.392
Item 25
rpbi =
rpbi =
rpbi =
rpbi= 0.447 x 2 = 0.895
Item 26
rpbi =
rpbi =
rpbi =
rpbi= 0.524 x 2 = 1.048
Item 27
rpbi =
rpbi =
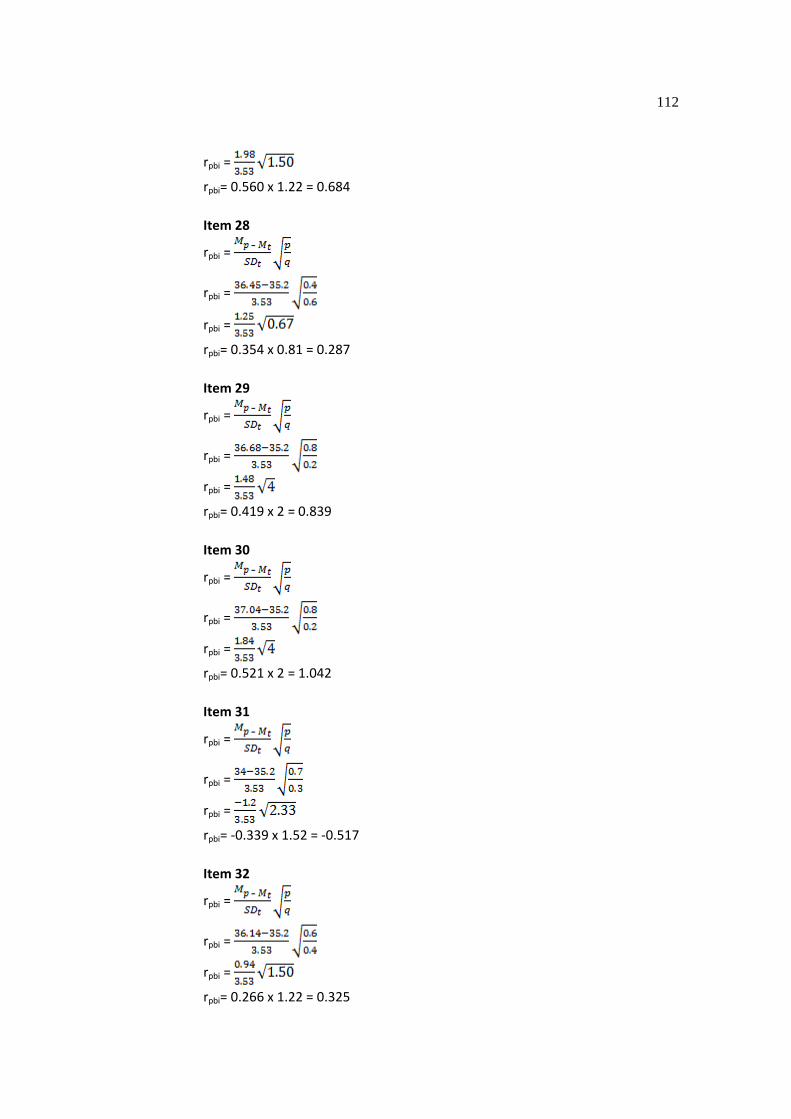
112
rpbi =
rpbi= 0.560 x 1.22 = 0.684
Item 28
rpbi =
rpbi =
rpbi =
rpbi= 0.354 x 0.81 = 0.287
Item 29
rpbi =
rpbi =
rpbi =
rpbi= 0.419 x 2 = 0.839
Item 30
rpbi =
rpbi =
rpbi =
rpbi= 0.521 x 2 = 1.042
Item 31
rpbi =
rpbi =
rpbi =
rpbi= -0.339 x 1.52 = -0.517
Item 32
rpbi =
rpbi =
rpbi =
rpbi= 0.266 x 1.22 = 0.325
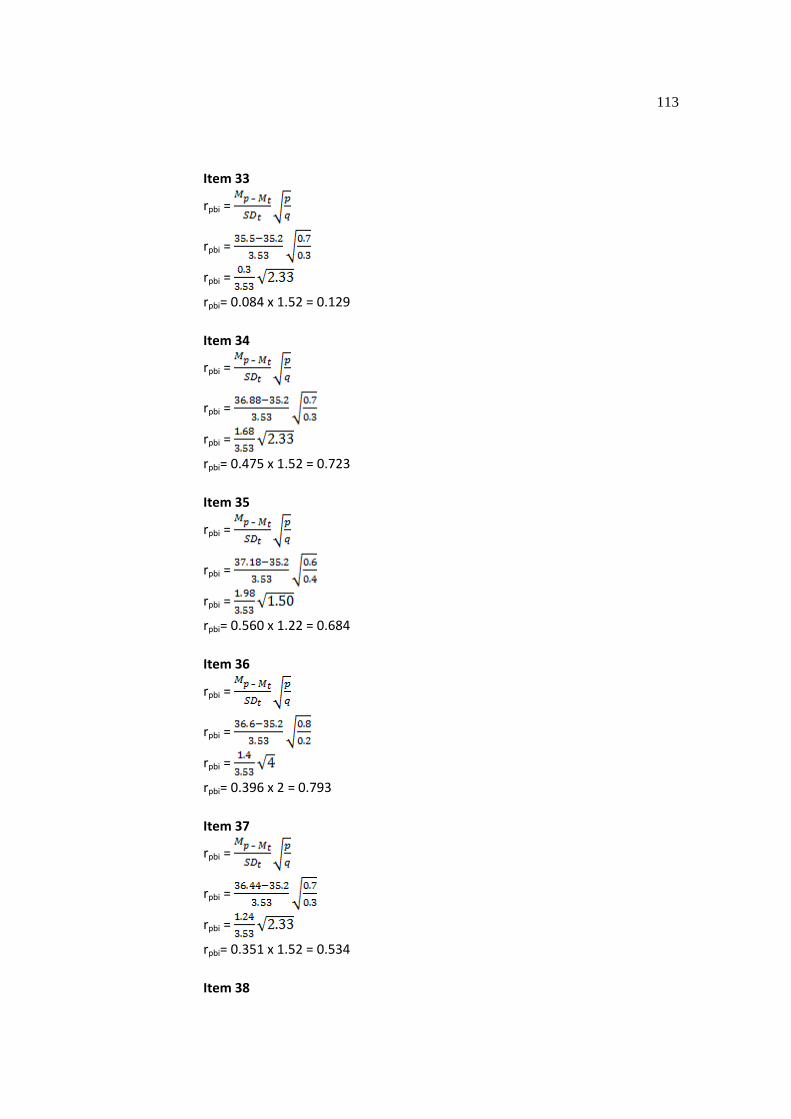
113
Item 33
rpbi =
rpbi =
rpbi =
rpbi= 0.084 x 1.52 = 0.129
Item 34
rpbi =
rpbi =
rpbi =
rpbi= 0.475 x 1.52 = 0.723
Item 35
rpbi =
rpbi =
rpbi =
rpbi= 0.560 x 1.22 = 0.684
Item 36
rpbi =
rpbi =
rpbi =
rpbi= 0.396 x 2 = 0.793
Item 37
rpbi =
rpbi =
rpbi =
rpbi= 0.351 x 1.52 = 0.534
Item 38
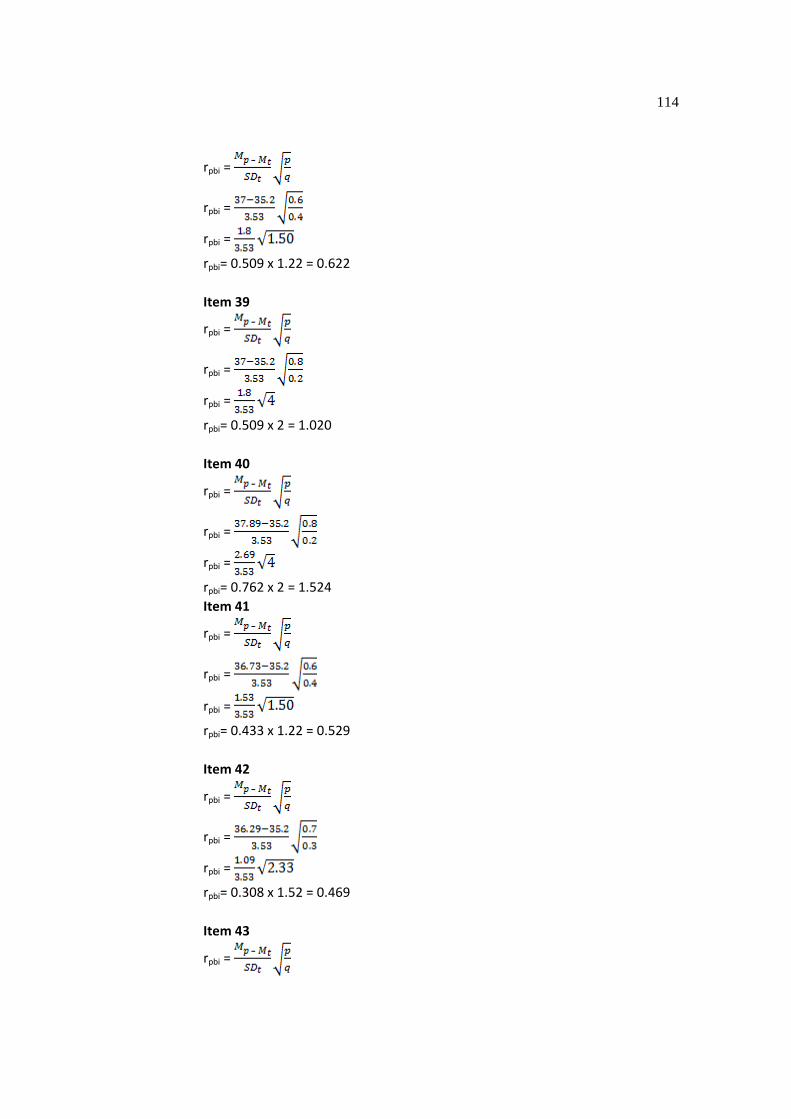
114
rpbi =
rpbi =
rpbi =
rpbi= 0.509 x 1.22 = 0.622
Item 39
rpbi =
rpbi =
rpbi =
rpbi= 0.509 x 2 = 1.020
Item 40
rpbi =
rpbi =
rpbi =
rpbi= 0.762 x 2 = 1.524
Item 41
rpbi =
rpbi =
rpbi =
rpbi= 0.433 x 1.22 = 0.529
Item 42
rpbi =
rpbi =
rpbi =
rpbi= 0.308 x 1.52 = 0.469
Item 43
rpbi =

115
rpbi =
rpbi =
rpbi= 0.351 x 1.52 = 0.534
Item 44
rpbi =
rpbi =
rpbi =
rpbi= 0.300 x 2 = 0.601
Item 45
rpbi =
rpbi =
rpbi =
rpbi= 0.249 x 1 = 0.249
Item 46
rpbi =
rpbi =
rpbi =
rpbi= 0.430 x 3 = 1.292
Item 47
rpbi =
rpbi =
rpbi =
rpbi= 0.345 x 2 = 0.691
Item 48
rpbi =
rpbi =
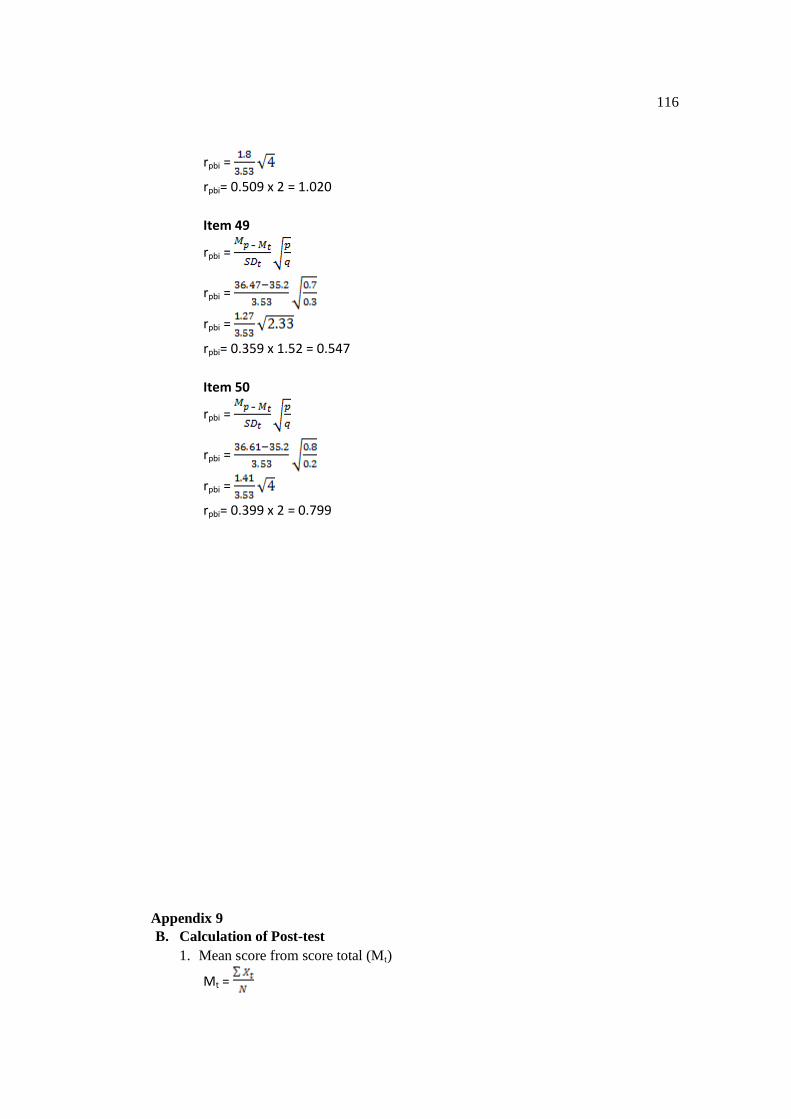
116
rpbi =
rpbi= 0.509 x 2 = 1.020
Item 49
rpbi =
rpbi =
rpbi =
rpbi= 0.359 x 1.52 = 0.547
Item 50
rpbi =
rpbi =
rpbi =
rpbi= 0.399 x 2 = 0.799
Appendix 9
B. Calculation of Post-test
1. Mean score from score total (Mt)
Mt =
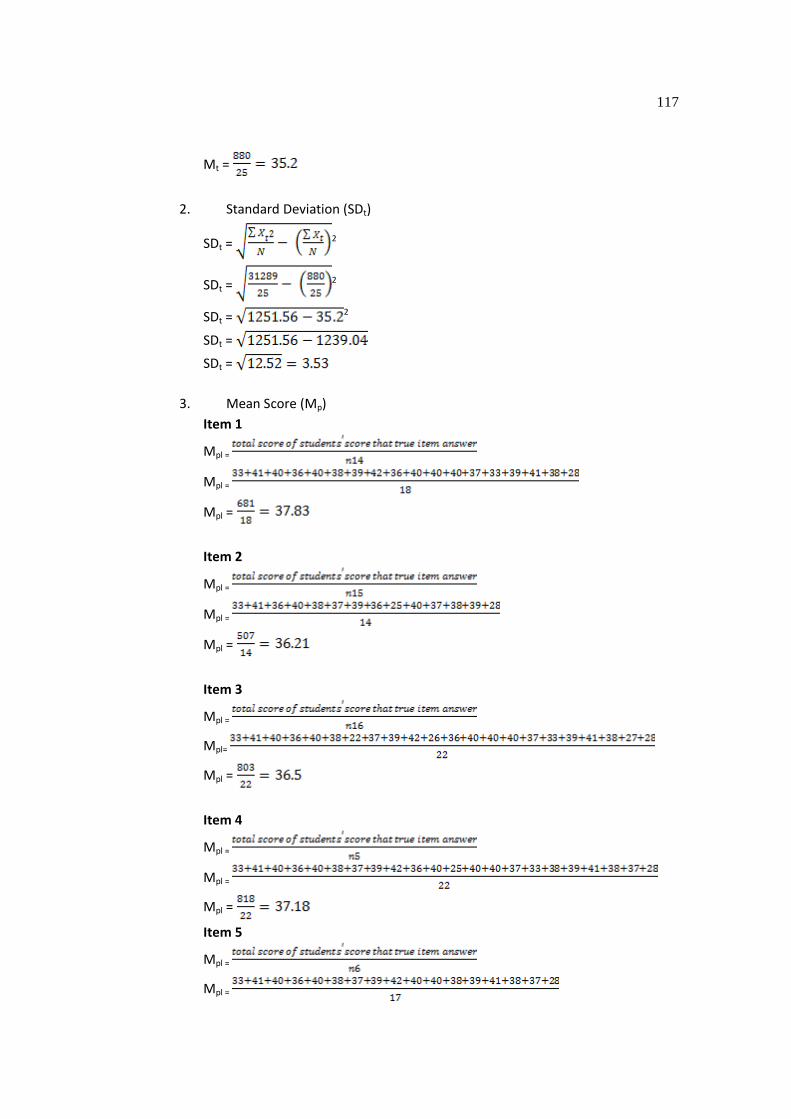
117
Mt =
2. Standard Deviation (SDt)
SDt = 2
SDt = 2
SDt = 2
SDt =
SDt =
3. Mean Score (Mp)
Item 1
Mpl =
Mpl =
Mpl =
Item 2
Mpl =
Mpl =
Mpl =
Item 3
Mpl =
Mpl=
Mpl =
Item 4
Mpl =
Mpl =
Mpl =
Item 5
Mpl =
Mpl =
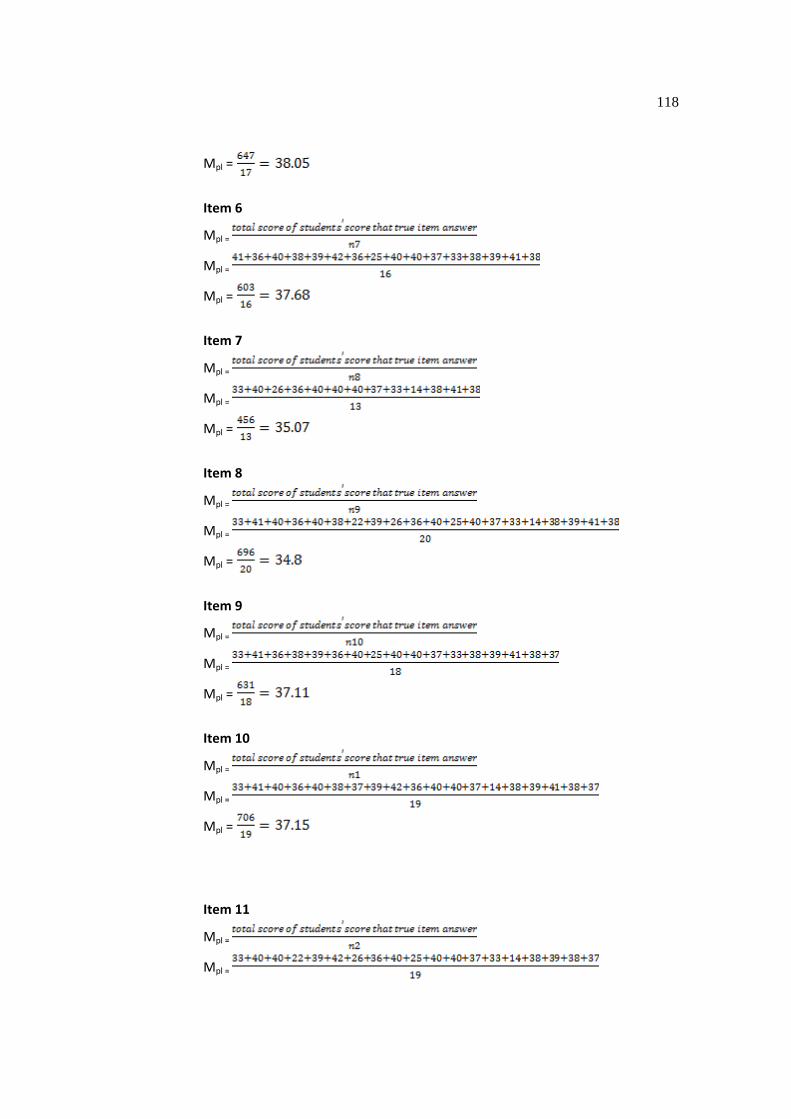
118
Mpl =
Item 6
Mpl =
Mpl =
Mpl =
Item 7
Mpl =
Mpl =
Mpl =
Item 8
Mpl =
Mpl =
Mpl =
Item 9
Mpl =
Mpl =
Mpl =
Item 10
Mpl =
Mpl =
Mpl =
Item 11
Mpl =
Mpl =
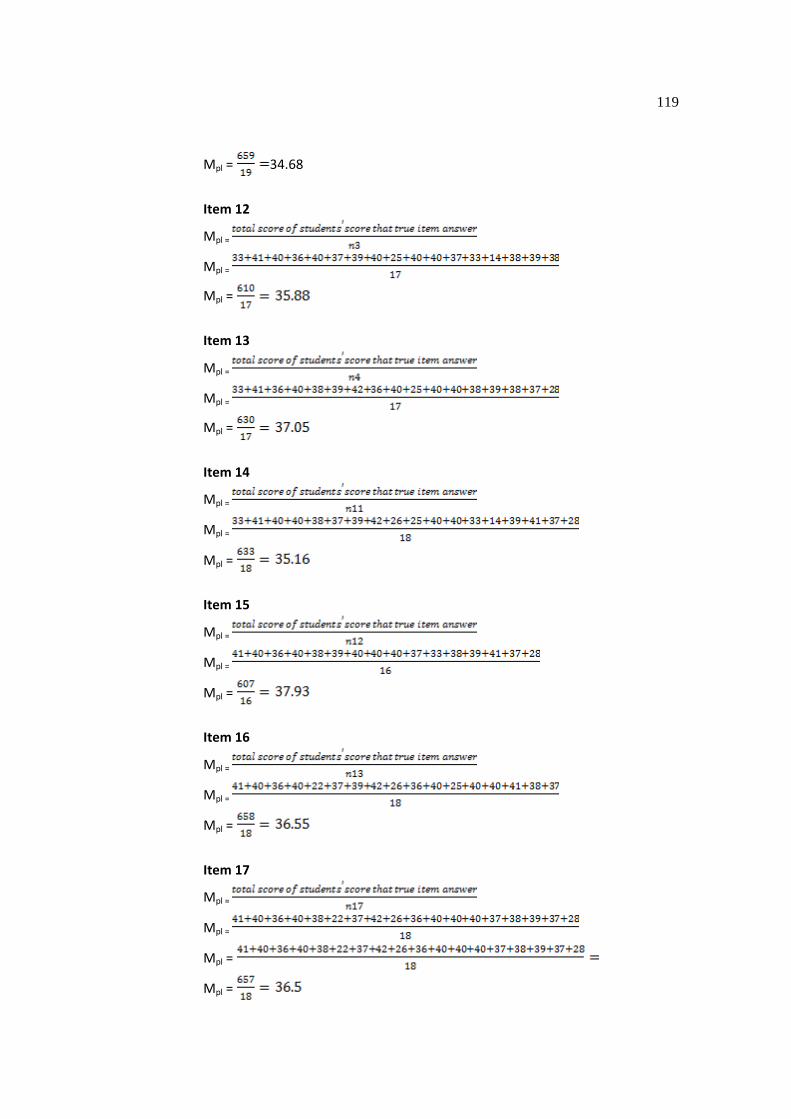
119
Mpl = 34.68
Item 12
Mpl =
Mpl =
Mpl =
Item 13
Mpl =
Mpl =
Mpl =
Item 14
Mpl =
Mpl =
Mpl =
Item 15
Mpl =
Mpl =
Mpl =
Item 16
Mpl =
Mpl =
Mpl =
Item 17
Mpl =
Mpl =
Mpl =
Mpl =
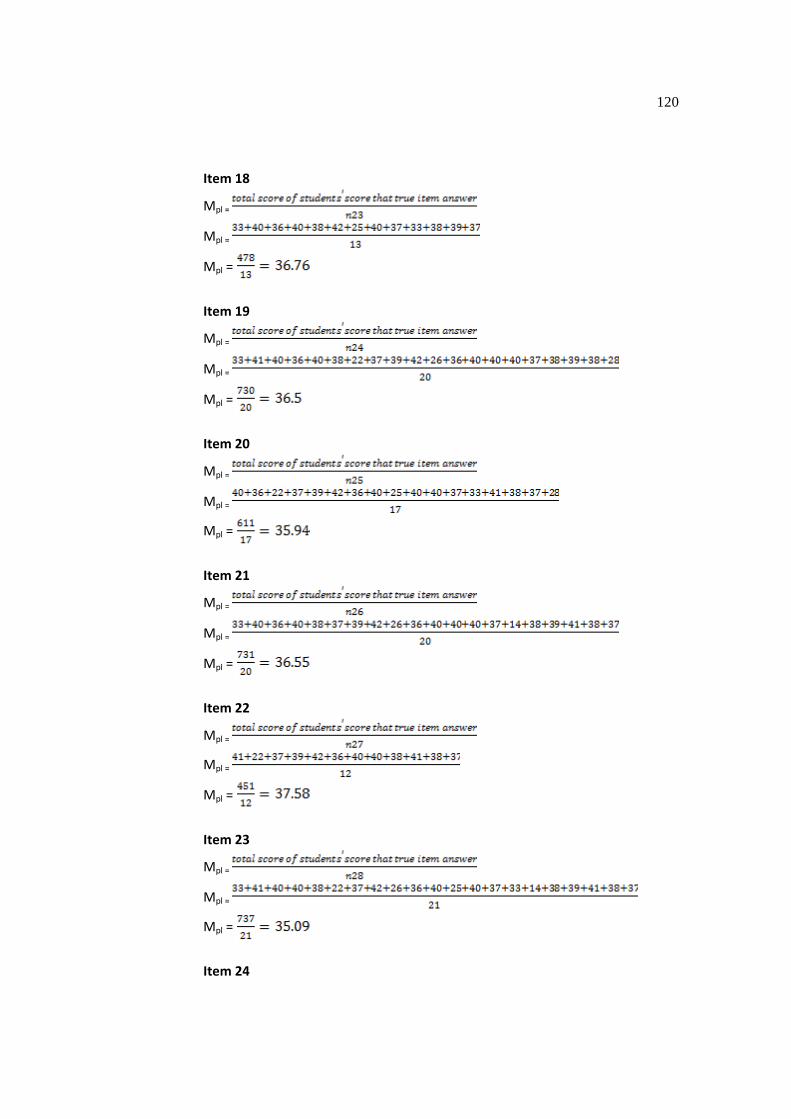
120
Item 18
Mpl =
Mpl =
Mpl =
Item 19
Mpl =
Mpl =
Mpl =
Item 20
Mpl =
Mpl =
Mpl =
Item 21
Mpl =
Mpl =
Mpl =
Item 22
Mpl =
Mpl =
Mpl =
Item 23
Mpl =
Mpl =
Mpl =
Item 24
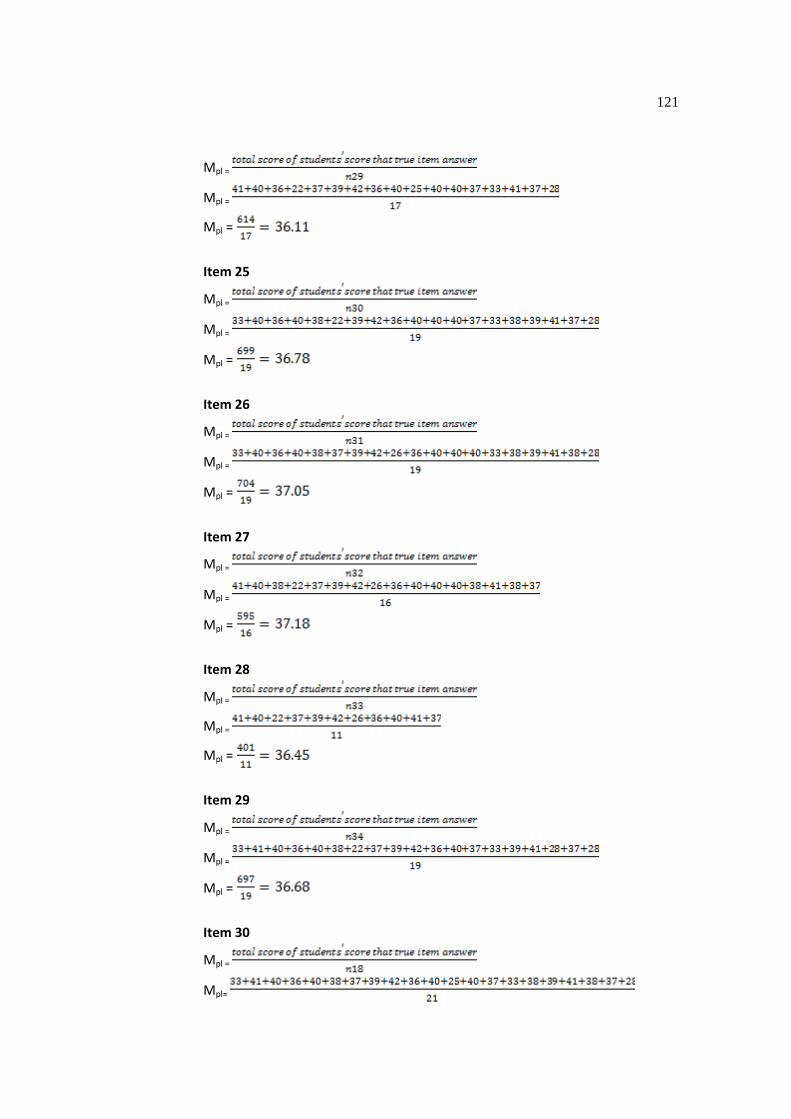
121
Mpl =
Mpl =
Mpl =
Item 25
Mpl =
Mpl =
Mpl =
Item 26
Mpl =
Mpl =
Mpl =
Item 27
Mpl =
Mpl =
Mpl =
Item 28
Mpl =
Mpl =
Mpl =
Item 29
Mpl =
Mpl =
Mpl =
Item 30
Mpl =
Mpl=
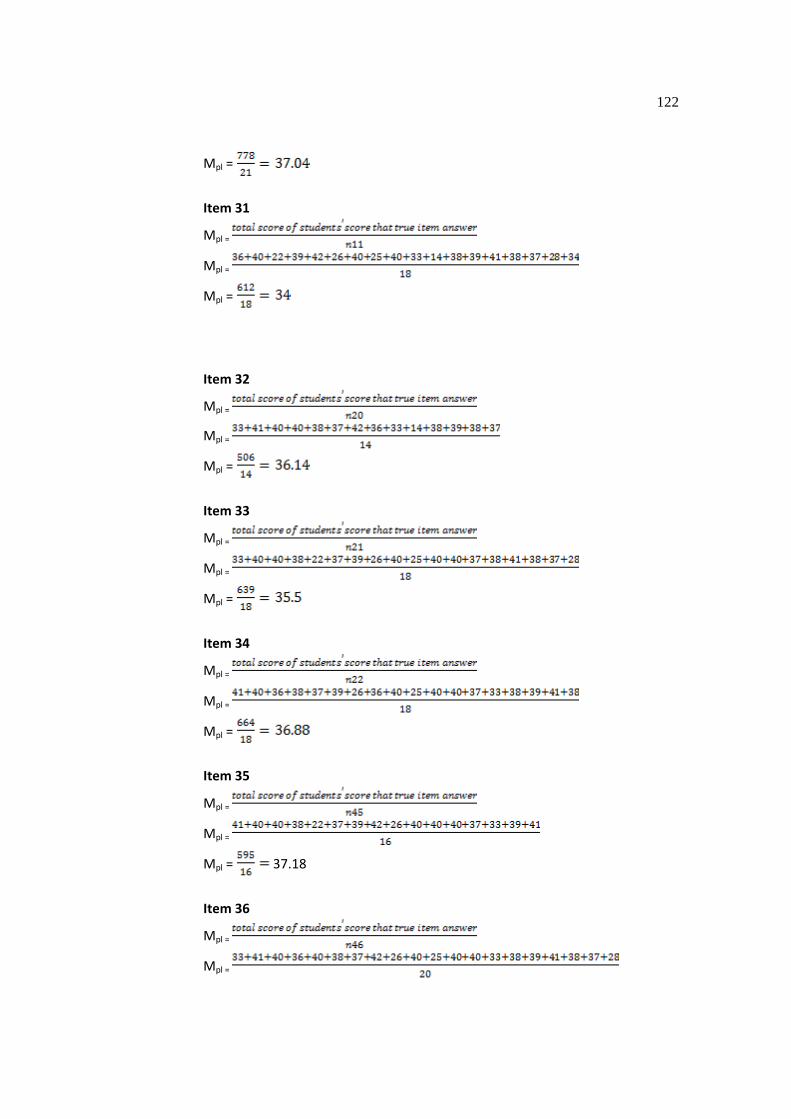
122
Mpl =
Item 31
Mpl =
Mpl =
Mpl =
Item 32
Mpl =
Mpl =
Mpl =
Item 33
Mpl =
Mpl =
Mpl =
Item 34
Mpl =
Mpl =
Mpl =
Item 35
Mpl =
Mpl =
Mpl = 37.18
Item 36
Mpl =
Mpl =
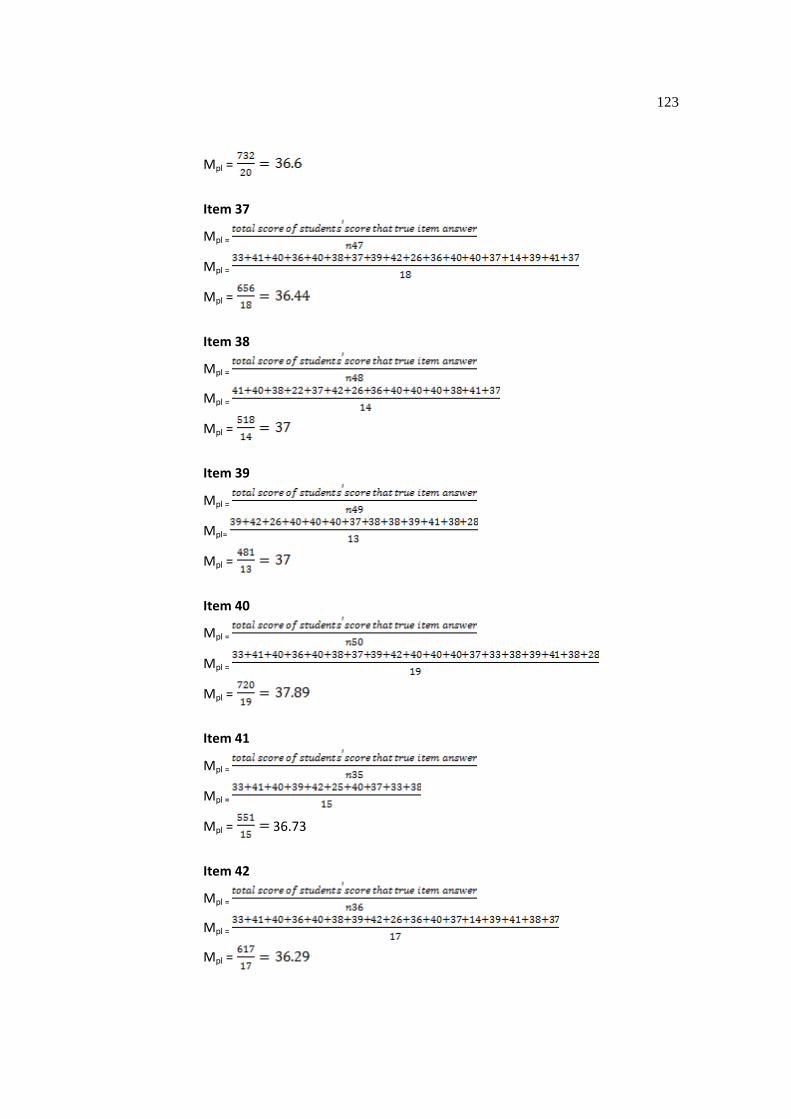
123
Mpl =
Item 37
Mpl =
Mpl =
Mpl =
Item 38
Mpl =
Mpl =
Mpl =
Item 39
Mpl =
Mpl=
Mpl =
Item 40
Mpl =
Mpl =
Mpl =
Item 41
Mpl =
Mpl =
Mpl = 36.73
Item 42
Mpl =
Mpl =
Mpl =
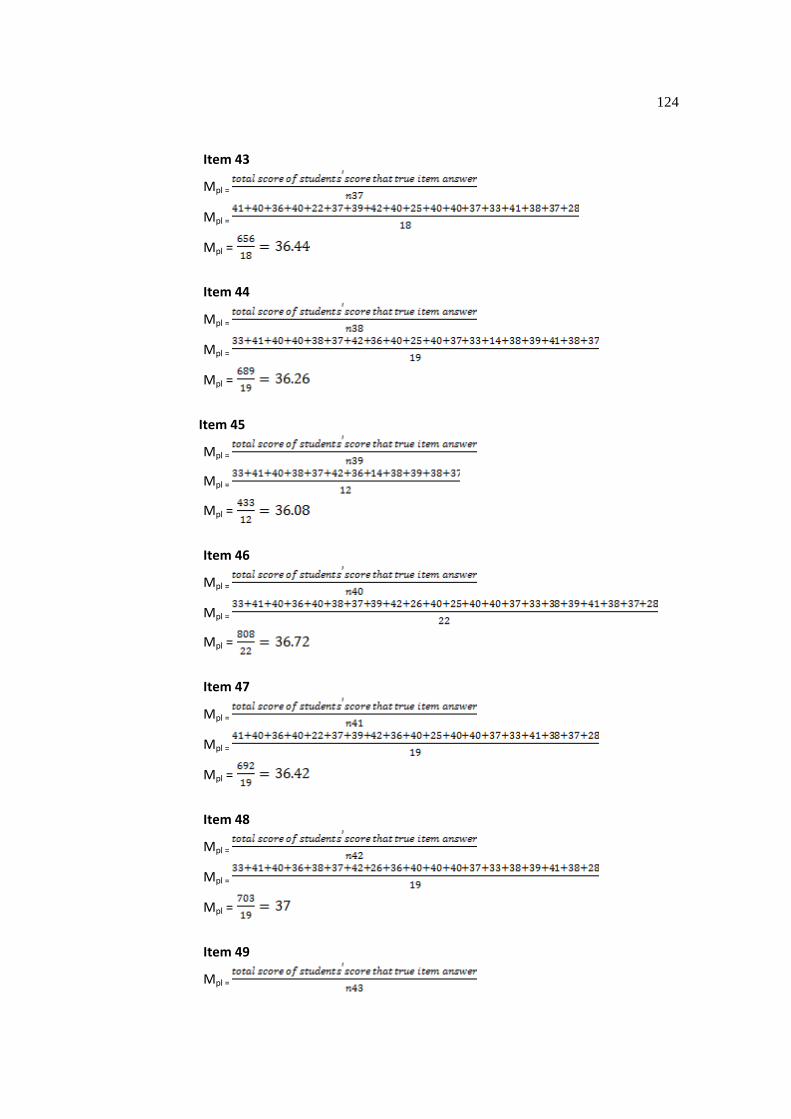
124
Item 43
Mpl =
Mpl =
Mpl =
Item 44
Mpl =
Mpl =
Mpl =
Item 45
Mpl =
Mpl =
Mpl =
Item 46
Mpl =
Mpl =
Mpl =
Item 47
Mpl =
Mpl =
Mpl =
Item 48
Mpl =
Mpl =
Mpl =
Item 49
Mpl =
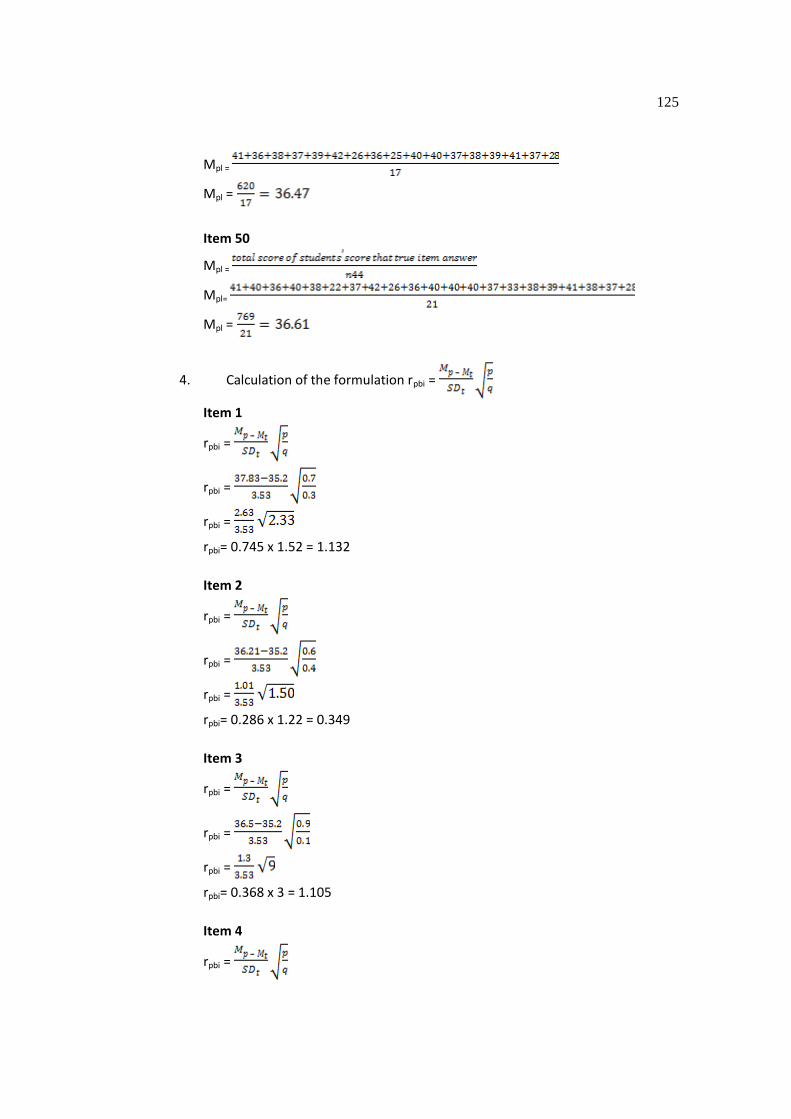
125
Mpl =
Mpl =
Item 50
Mpl =
Mpl=
Mpl =
4. Calculation of the formulation rpbi =
Item 1
rpbi =
rpbi =
rpbi =
rpbi= 0.745 x 1.52 = 1.132
Item 2
rpbi =
rpbi =
rpbi =
rpbi= 0.286 x 1.22 = 0.349
Item 3
rpbi =
rpbi =
rpbi =
rpbi= 0.368 x 3 = 1.105
Item 4
rpbi =
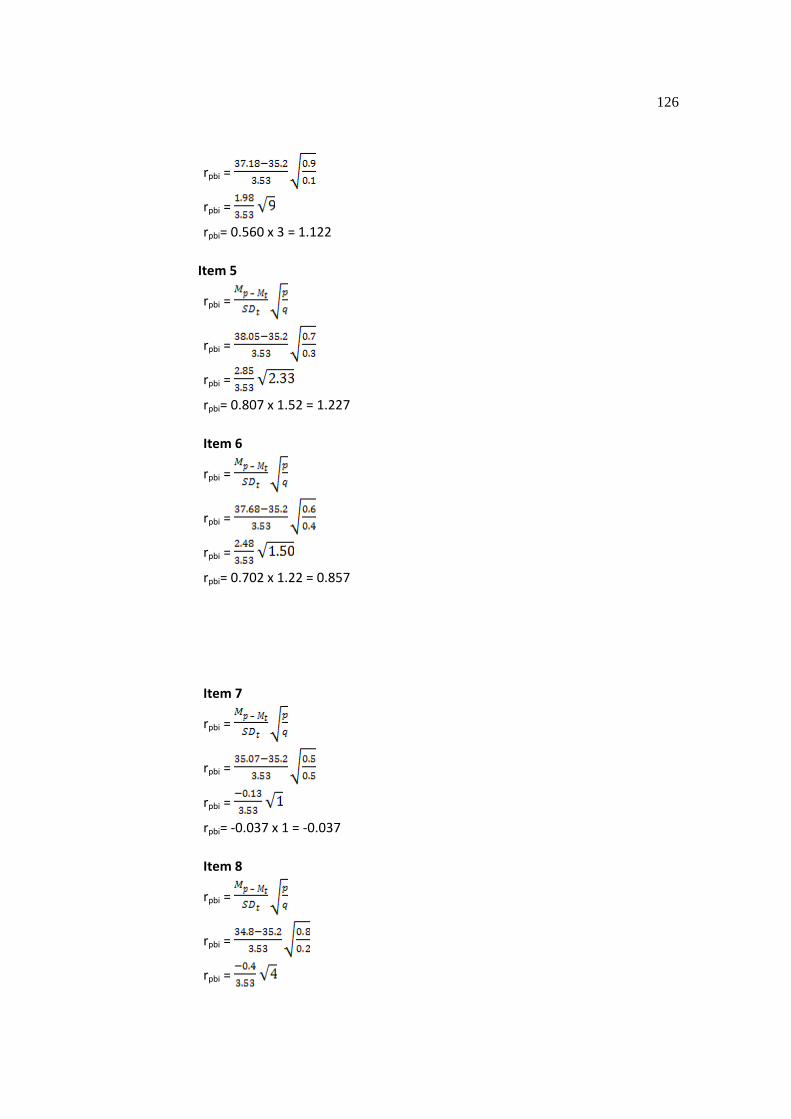
126
rpbi =
rpbi =
rpbi= 0.560 x 3 = 1.122
Item 5
rpbi =
rpbi =
rpbi =
rpbi= 0.807 x 1.52 = 1.227
Item 6
rpbi =
rpbi =
rpbi =
rpbi= 0.702 x 1.22 = 0.857
Item 7
rpbi =
rpbi =
rpbi =
rpbi= -0.037 x 1 = -0.037
Item 8
rpbi =
rpbi =
rpbi =
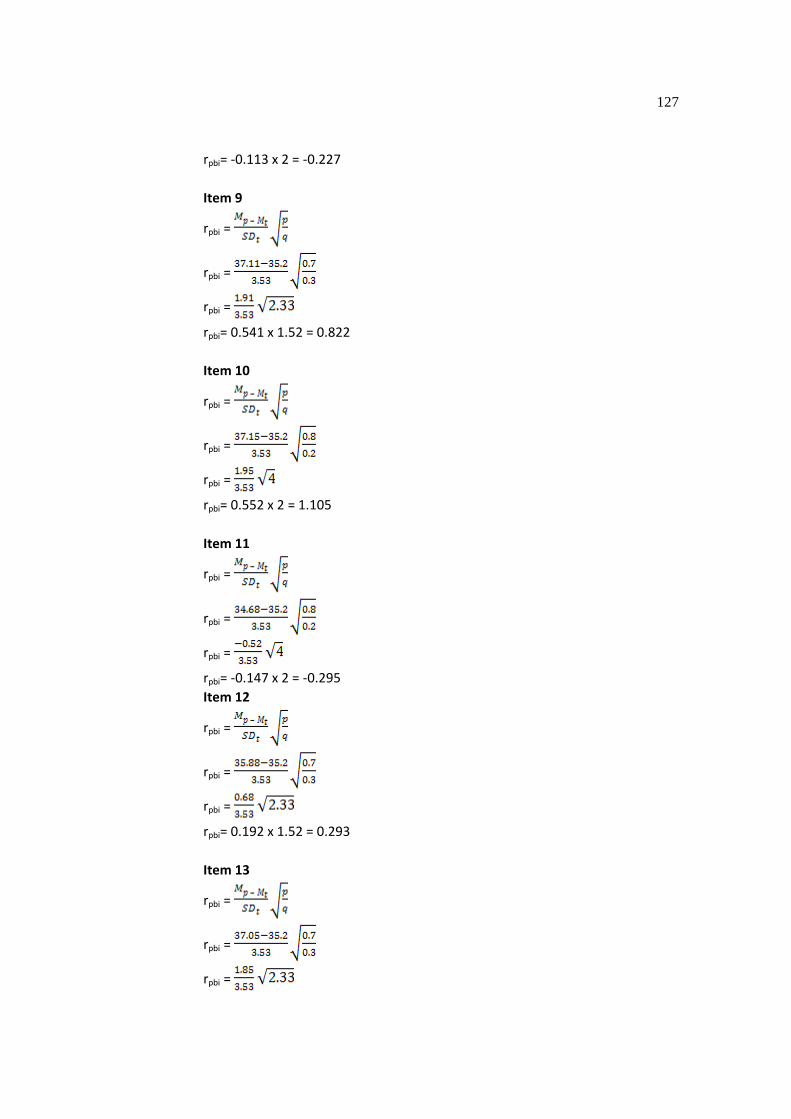
127
rpbi= -0.113 x 2 = -0.227
Item 9
rpbi =
rpbi =
rpbi =
rpbi= 0.541 x 1.52 = 0.822
Item 10
rpbi =
rpbi =
rpbi =
rpbi= 0.552 x 2 = 1.105
Item 11
rpbi =
rpbi =
rpbi =
rpbi= -0.147 x 2 = -0.295
Item 12
rpbi =
rpbi =
rpbi =
rpbi= 0.192 x 1.52 = 0.293
Item 13
rpbi =
rpbi =
rpbi =
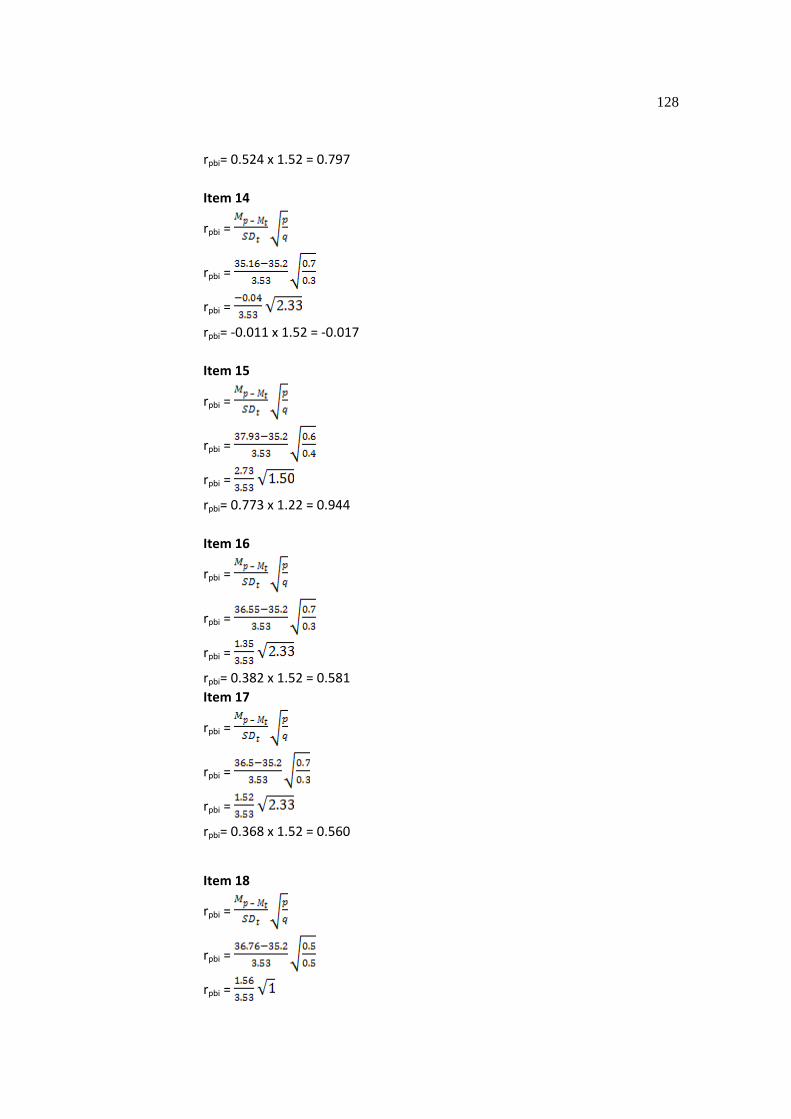
128
rpbi= 0.524 x 1.52 = 0.797
Item 14
rpbi =
rpbi =
rpbi =
rpbi= -0.011 x 1.52 = -0.017
Item 15
rpbi =
rpbi =
rpbi =
rpbi= 0.773 x 1.22 = 0.944
Item 16
rpbi =
rpbi =
rpbi =
rpbi= 0.382 x 1.52 = 0.581
Item 17
rpbi =
rpbi =
rpbi =
rpbi= 0.368 x 1.52 = 0.560
Item 18
rpbi =
rpbi =
rpbi =
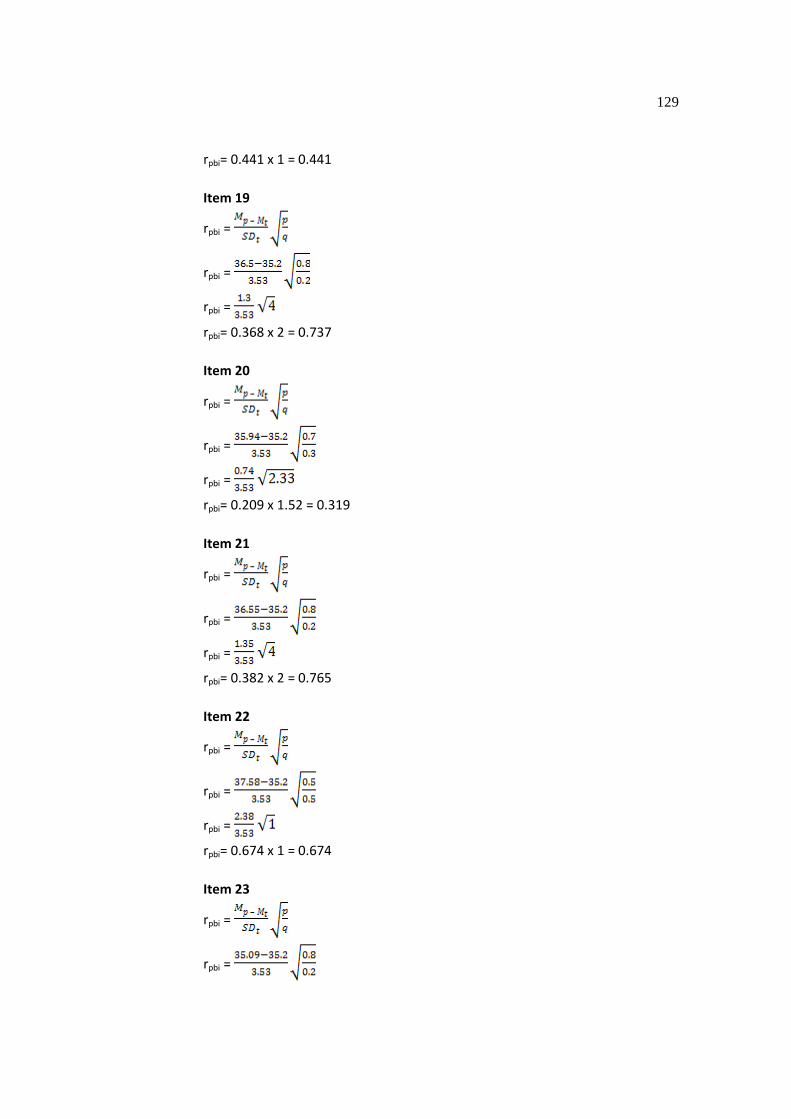
129
rpbi= 0.441 x 1 = 0.441
Item 19
rpbi =
rpbi =
rpbi =
rpbi= 0.368 x 2 = 0.737
Item 20
rpbi =
rpbi =
rpbi =
rpbi= 0.209 x 1.52 = 0.319
Item 21
rpbi =
rpbi =
rpbi =
rpbi= 0.382 x 2 = 0.765
Item 22
rpbi =
rpbi =
rpbi =
rpbi= 0.674 x 1 = 0.674
Item 23
rpbi =
rpbi =

130
rpbi =
rpbi= -0.031 x 2 = -0.062
Item 24
rpbi =
rpbi =
rpbi =
rpbi= 0.257 x 1.52 = 0.392
Item 25
rpbi =
rpbi =
rpbi =
rpbi= 0.447 x 2 = 0.895
Item 26
rpbi =
rpbi =
rpbi =
rpbi= 0.524 x 2 = 1.048
Item 27
rpbi =
rpbi =
rpbi =
rpbi= 0.560 x 1.22 = 0.684
Item 28
rpbi =
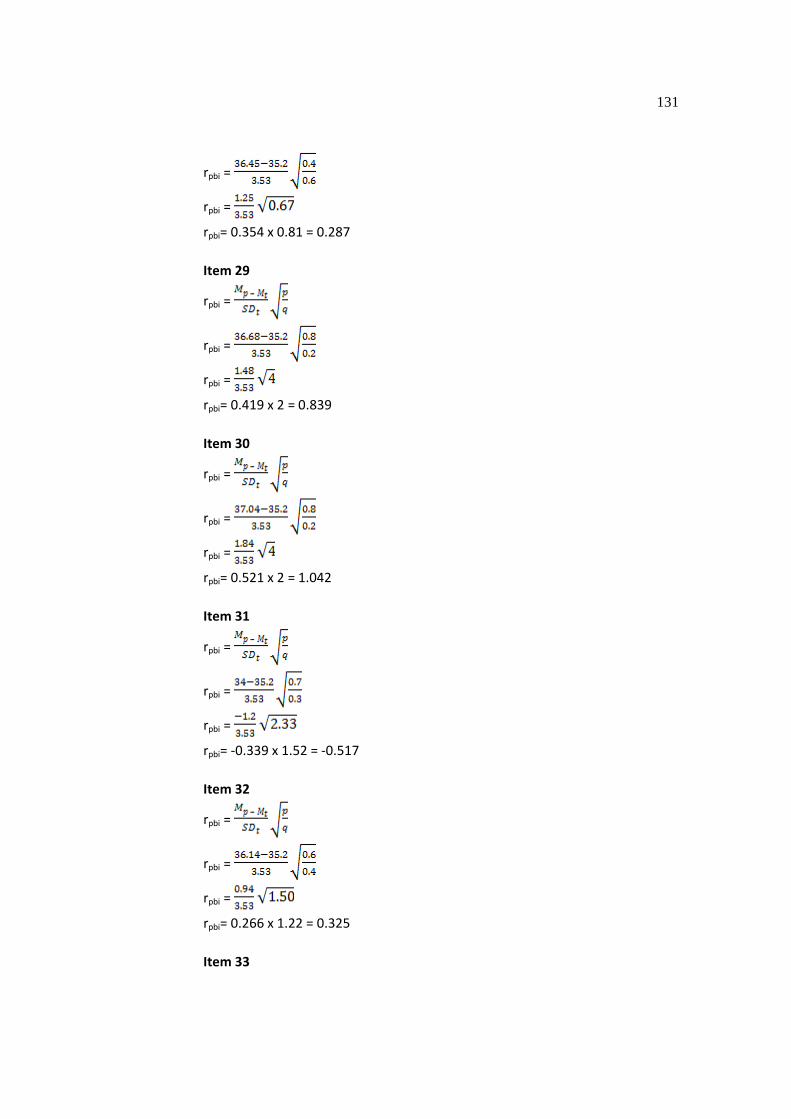
131
rpbi =
rpbi =
rpbi= 0.354 x 0.81 = 0.287
Item 29
rpbi =
rpbi =
rpbi =
rpbi= 0.419 x 2 = 0.839
Item 30
rpbi =
rpbi =
rpbi =
rpbi= 0.521 x 2 = 1.042
Item 31
rpbi =
rpbi =
rpbi =
rpbi= -0.339 x 1.52 = -0.517
Item 32
rpbi =
rpbi =
rpbi =
rpbi= 0.266 x 1.22 = 0.325
Item 33
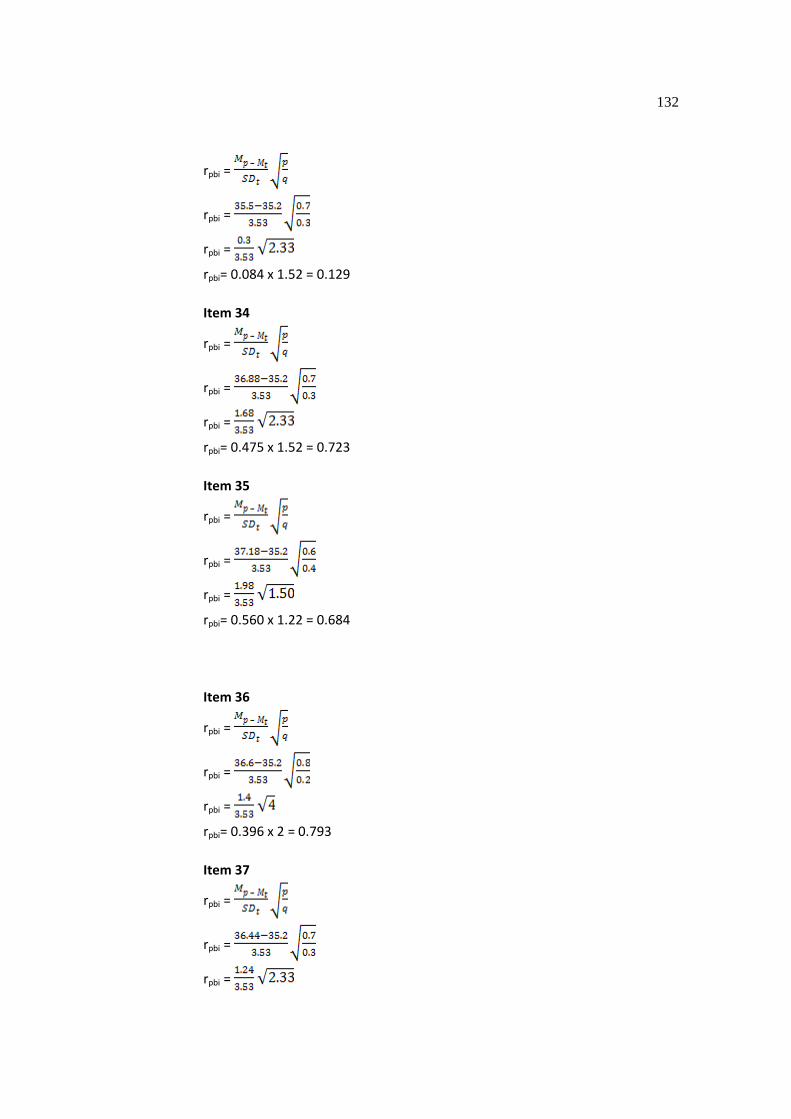
132
rpbi =
rpbi =
rpbi =
rpbi= 0.084 x 1.52 = 0.129
Item 34
rpbi =
rpbi =
rpbi =
rpbi= 0.475 x 1.52 = 0.723
Item 35
rpbi =
rpbi =
rpbi =
rpbi= 0.560 x 1.22 = 0.684
Item 36
rpbi =
rpbi =
rpbi =
rpbi= 0.396 x 2 = 0.793
Item 37
rpbi =
rpbi =
rpbi =
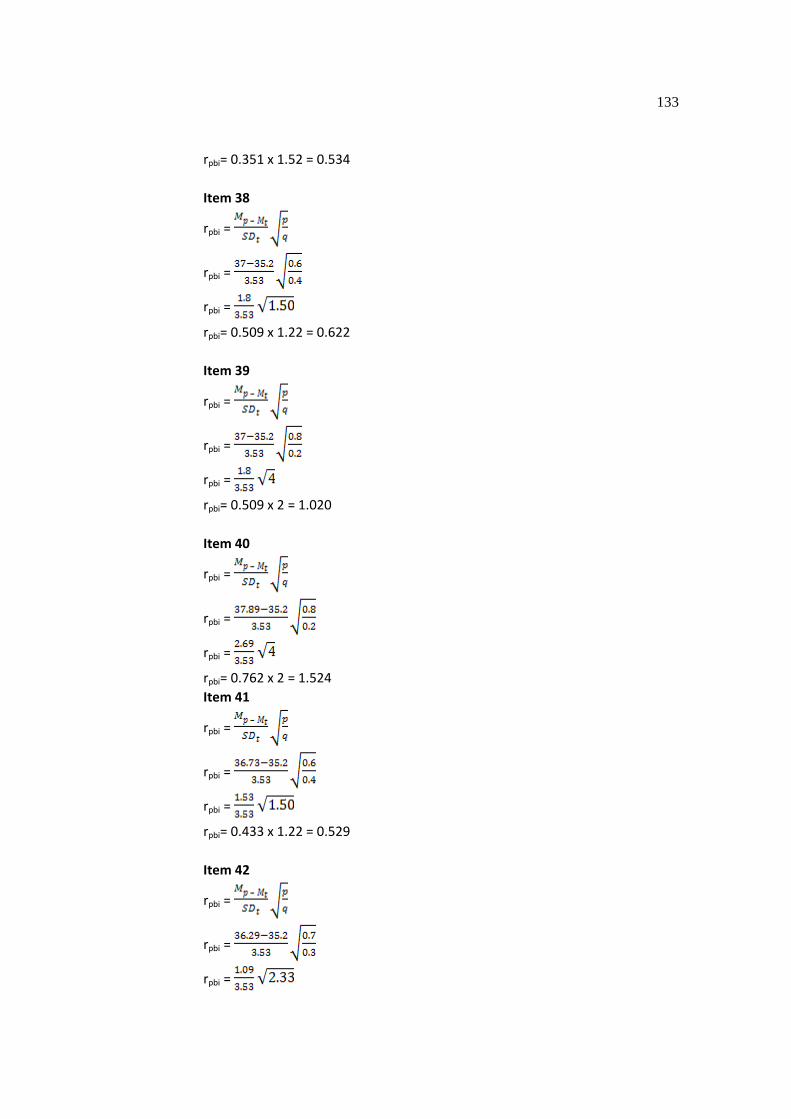
133
rpbi= 0.351 x 1.52 = 0.534
Item 38
rpbi =
rpbi =
rpbi =
rpbi= 0.509 x 1.22 = 0.622
Item 39
rpbi =
rpbi =
rpbi =
rpbi= 0.509 x 2 = 1.020
Item 40
rpbi =
rpbi =
rpbi =
rpbi= 0.762 x 2 = 1.524
Item 41
rpbi =
rpbi =
rpbi =
rpbi= 0.433 x 1.22 = 0.529
Item 42
rpbi =
rpbi =
rpbi =
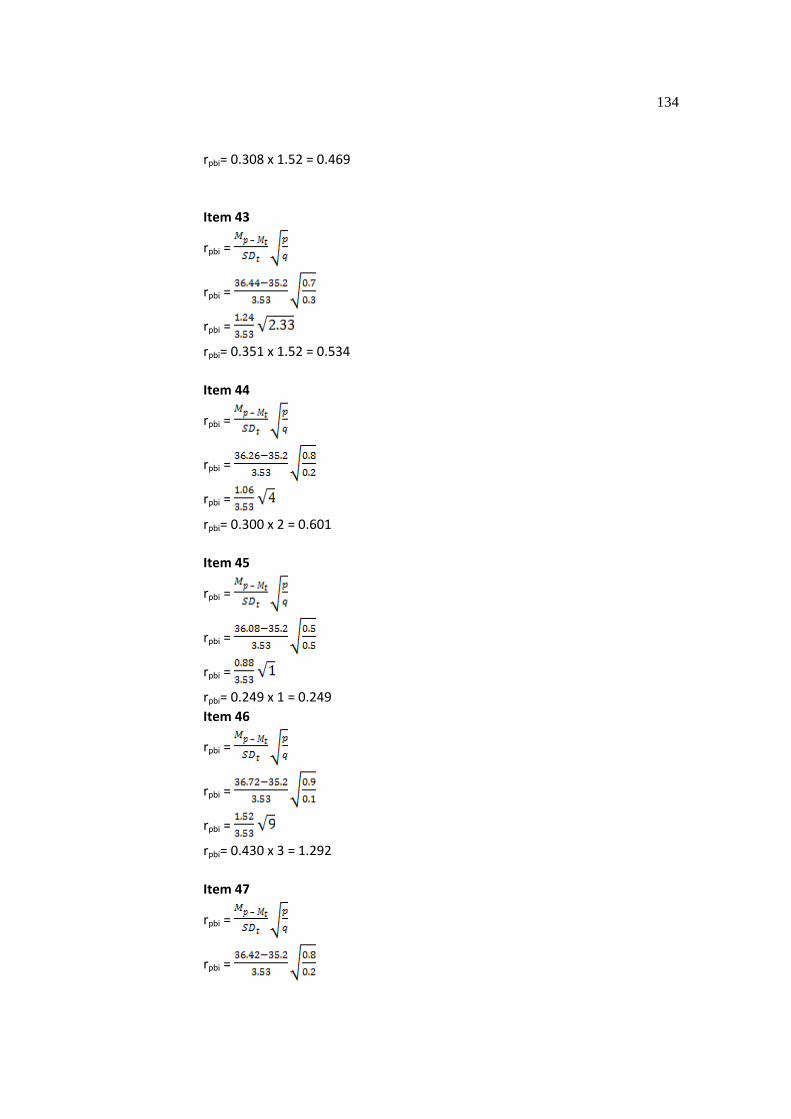
134
rpbi= 0.308 x 1.52 = 0.469
Item 43
rpbi =
rpbi =
rpbi =
rpbi= 0.351 x 1.52 = 0.534
Item 44
rpbi =
rpbi =
rpbi =
rpbi= 0.300 x 2 = 0.601
Item 45
rpbi =
rpbi =
rpbi =
rpbi= 0.249 x 1 = 0.249
Item 46
rpbi =
rpbi =
rpbi =
rpbi= 0.430 x 3 = 1.292
Item 47
rpbi =
rpbi =
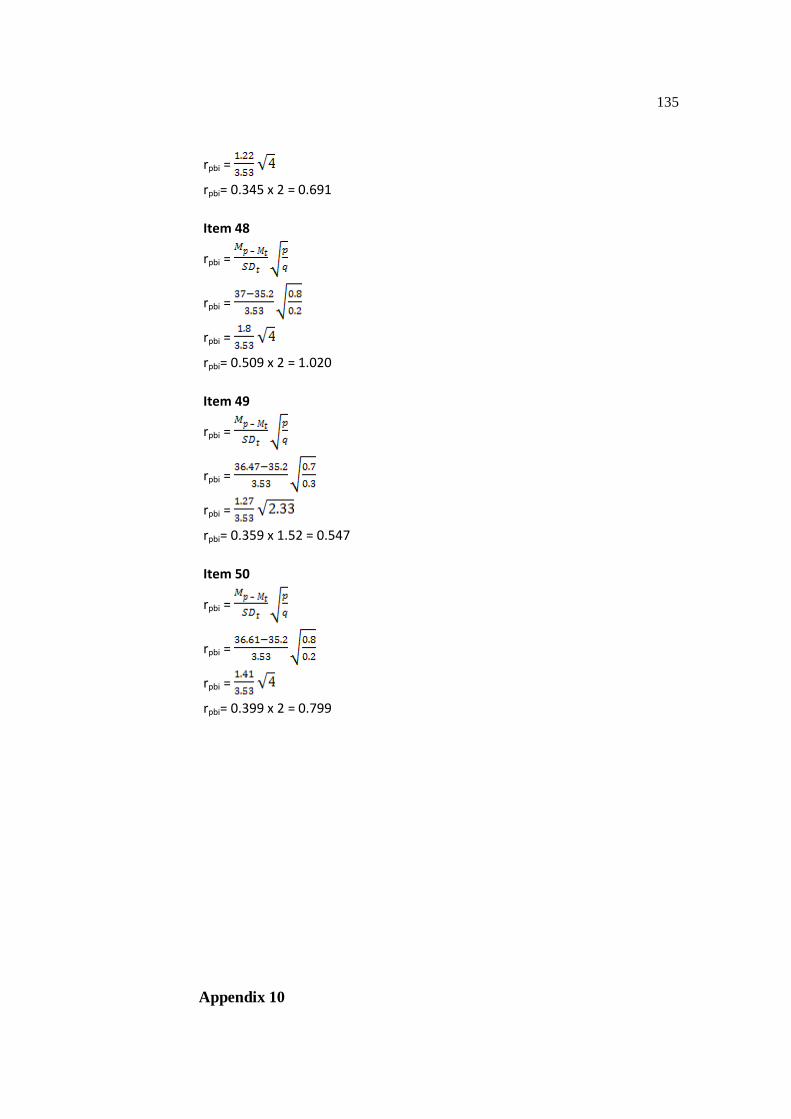
135
rpbi =
rpbi= 0.345 x 2 = 0.691
Item 48
rpbi =
rpbi =
rpbi =
rpbi= 0.509 x 2 = 1.020
Item 49
rpbi =
rpbi =
rpbi =
rpbi= 0.359 x 1.52 = 0.547
Item 50
rpbi =
rpbi =
rpbi =
rpbi= 0.399 x 2 = 0.799
Appendix 10
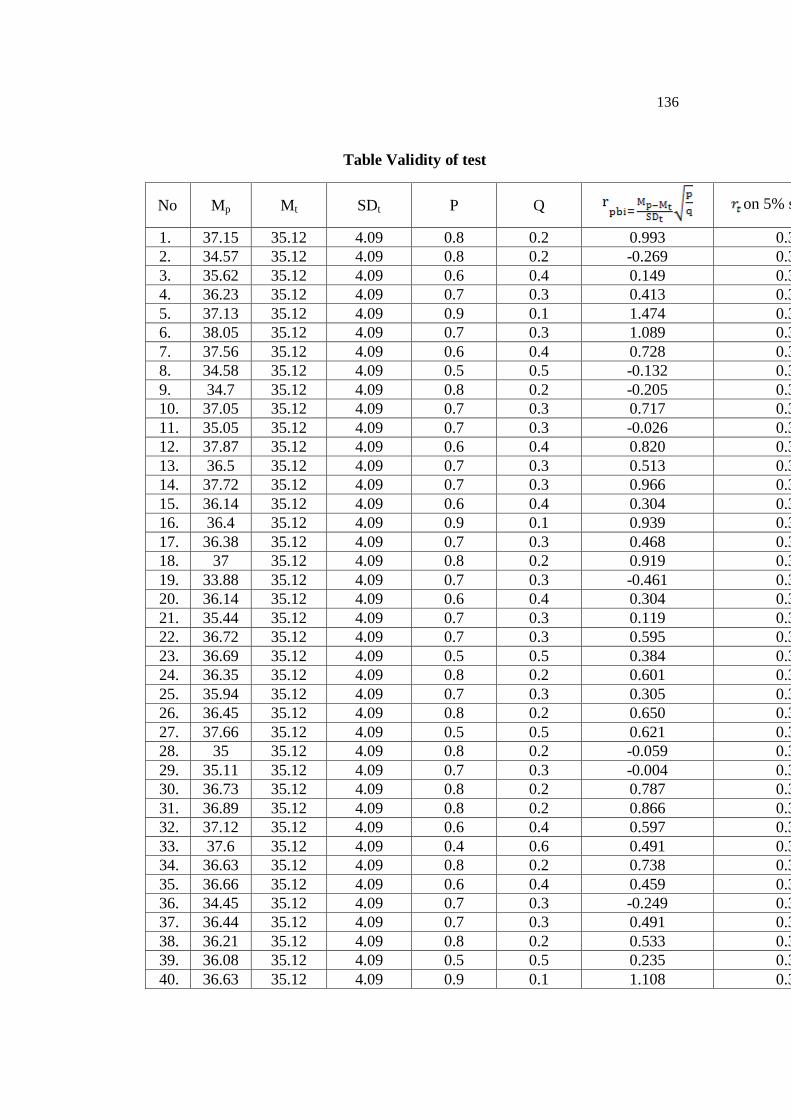
136
Table Validity of test
No Mp Mt SDt P Q
on 5% significant Interpretation
1. 37.15 35.12 4.09 0.8 0.2 0.993 0.361 Valid
2. 34.57 35.12 4.09 0.8 0.2 -0.269 0.361 Invalid
3. 35.62 35.12 4.09 0.6 0.4 0.149 0.361 Invalid
4. 36.23 35.12 4.09 0.7 0.3 0.413 0.361 Valid
5. 37.13 35.12 4.09 0.9 0.1 1.474 0.361 Valid
6. 38.05 35.12 4.09 0.7 0.3 1.089 0.361 Valid
7. 37.56 35.12 4.09 0.6 0.4 0.728 0.361 Valid
8. 34.58 35.12 4.09 0.5 0.5 -0.132 0.361 Invalid
9. 34.7 35.12 4.09 0.8 0.2 -0.205 0.361 Invalid
10. 37.05 35.12 4.09 0.7 0.3 0.717 0.361 Valid
11. 35.05 35.12 4.09 0.7 0.3 -0.026 0.361 Invalid
12. 37.87 35.12 4.09 0.6 0.4 0.820 0.361 Valid
13. 36.5 35.12 4.09 0.7 0.3 0.513 0.361 Valid
14. 37.72 35.12 4.09 0.7 0.3 0.966 0.361 Valid
15. 36.14 35.12 4.09 0.6 0.4 0.304 0.361 Invalid
16. 36.4 35.12 4.09 0.9 0.1 0.939 0.361 Valid
17. 36.38 35.12 4.09 0.7 0.3 0.468 0.361 Valid
18. 37 35.12 4.09 0.8 0.2 0.919 0.361 Valid
19. 33.88 35.12 4.09 0.7 0.3 -0.461 0.361 Invalid
20. 36.14 35.12 4.09 0.6 0.4 0.304 0.361 Invalid
21. 35.44 35.12 4.09 0.7 0.3 0.119 0.361 Invalid
22. 36.72 35.12 4.09 0.7 0.3 0.595 0.361 Valid
23. 36.69 35.12 4.09 0.5 0.5 0.384 0.361 Invalid
24. 36.35 35.12 4.09 0.8 0.2 0.601 0.361 Valid
25. 35.94 35.12 4.09 0.7 0.3 0.305 0.361 Invalid
26. 36.45 35.12 4.09 0.8 0.2 0.650 0.361 Valid
27. 37.66 35.12 4.09 0.5 0.5 0.621 0.361 Valid
28. 35 35.12 4.09 0.8 0.2 -0.059 0.361 Invalid
29. 35.11 35.12 4.09 0.7 0.3 -0.004 0.361 Invalid
30. 36.73 35.12 4.09 0.8 0.2 0.787 0.361 Valid
31. 36.89 35.12 4.09 0.8 0.2 0.866 0.361 Valid
32. 37.12 35.12 4.09 0.6 0.4 0.597 0.361 Valid
33. 37.6 35.12 4.09 0.4 0.6 0.491 0.361 Valid
34. 36.63 35.12 4.09 0.8 0.2 0.738 0.361 Valid
35. 36.66 35.12 4.09 0.6 0.4 0.459 0.361 Valid
36. 34.45 35.12 4.09 0.7 0.3 -0.249 0.361 Invalid
37. 36.44 35.12 4.09 0.7 0.3 0.491 0.361 Valid
38. 36.21 35.12 4.09 0.8 0.2 0.533 0.361 Valid
39. 36.08 35.12 4.09 0.5 0.5 0.235 0.361 Invalid
40. 36.63 35.12 4.09 0.9 0.1 1.108 0.361 Valid
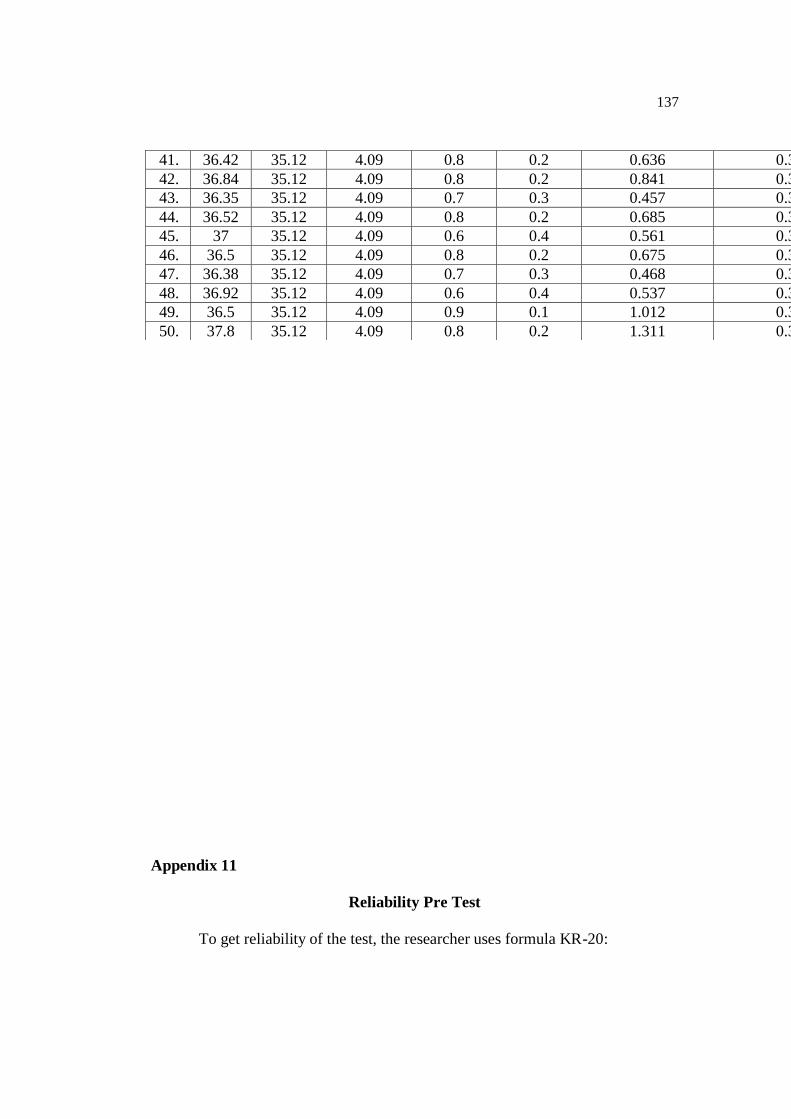
137
Appendix 11
Reliability Pre Test
To get reliability of the test, the researcher uses formula KR-20:
41. 36.42 35.12 4.09 0.8 0.2 0.636 0.361 Valid
42. 36.84 35.12 4.09 0.8 0.2 0.841 0.361 Valid
43. 36.35 35.12 4.09 0.7 0.3 0.457 0.361 Valid
44. 36.52 35.12 4.09 0.8 0.2 0.685 0.361 Valid
45. 37 35.12 4.09 0.6 0.4 0.561 0.361 Valid
46. 36.5 35.12 4.09 0.8 0.2 0.675 0.361 Valid
47. 36.38 35.12 4.09 0.7 0.3 0.468 0.361 Valid
48. 36.92 35.12 4.09 0.6 0.4 0.537 0.361 Valid
49. 36.5 35.12 4.09 0.9 0.1 1.012 0.361 Valid
50. 37.8 35.12 4.09 0.8 0.2 1.311 0.361 Valid
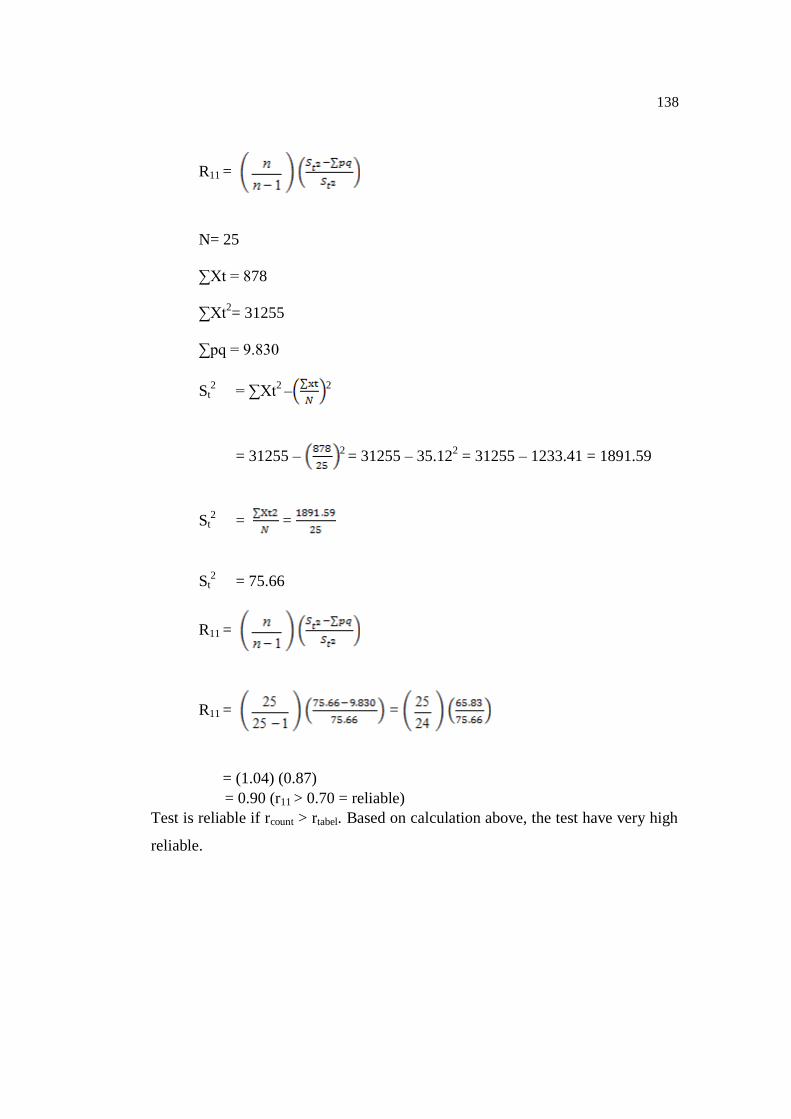
138
R11 =
N= 25
∑Xt = 878
∑Xt2= 31255
∑pq = 9.830
St2 = ∑Xt
2 –
2
= 31255 – 2
= 31255 – 35.122 = 31255 – 1233.41 = 1891.59
St2 = =
St2 = 75.66
R11 =
R11 = =
= (1.04) (0.87)
= 0.90 (r11 > 0.70 = reliable)
Test is reliable if rcount > rtabel. Based on calculation above, the test have very high
reliable.
139
Appendix 12
Reliability Post Test
To get reliability of the test, the researcher uses formula KR-20:
R11 =
N= 25
∑Xt = 880
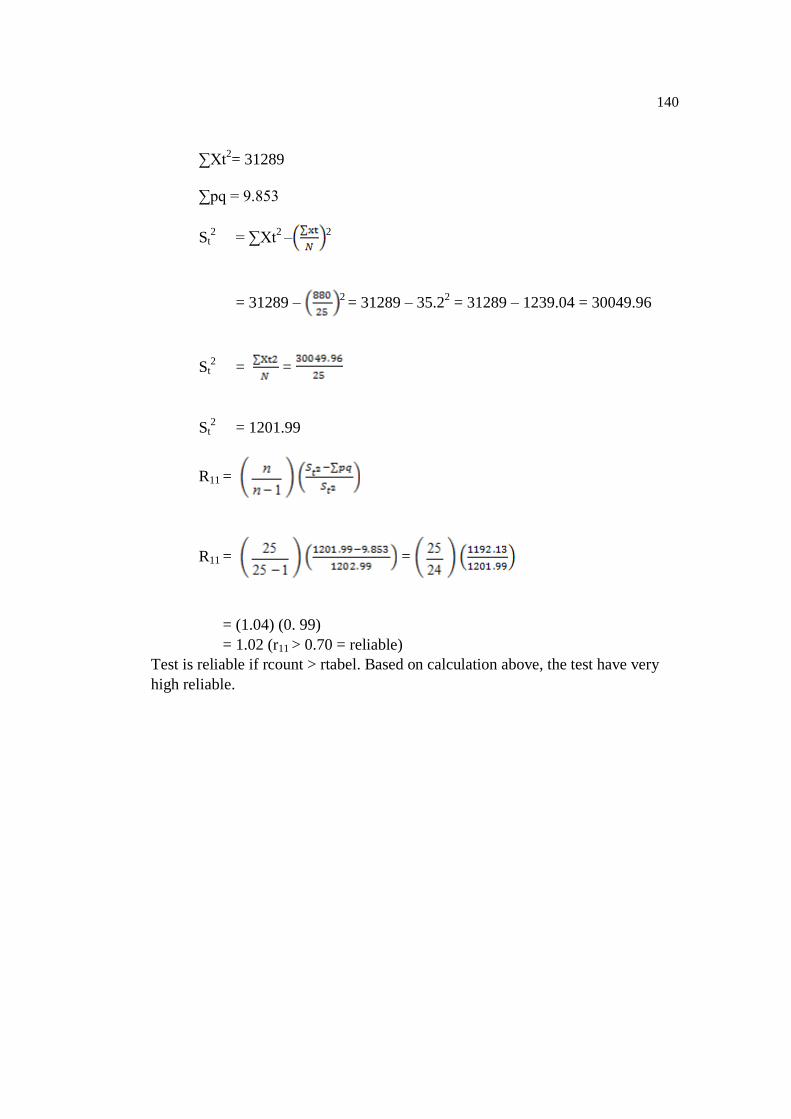
140
∑Xt2= 31289
∑pq = 9.853
St2 = ∑Xt
2 –
2
= 31289 – 2
= 31289 – 35.22 = 31289 – 1239.04 = 30049.96
St2 = =
St2 = 1201.99
R11 =
R11 = =
= (1.04) (0. 99)
= 1.02 (r11 > 0.70 = reliable)
Test is reliable if rcount > rtabel. Based on calculation above, the test have very
high reliable.
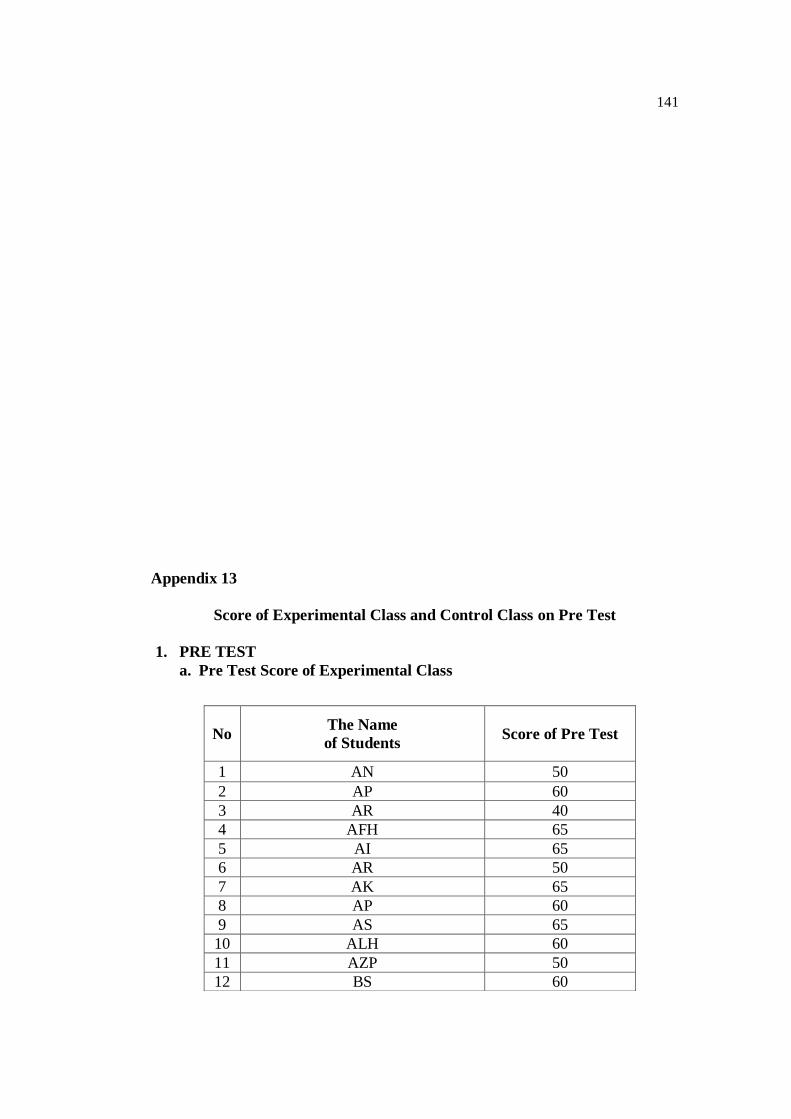
141
Appendix 13
Score of Experimental Class and Control Class on Pre Test
1. PRE TEST
a. Pre Test Score of Experimental Class
No The Name
of Students Score of Pre Test
1 AN 50
2 AP 60
3 AR 40
4 AFH 65
5 AI 65
6 AR 50
7 AK 65
8 AP 60
9 AS 65
10 ALH 60
11 AZP 50
12 BS 60
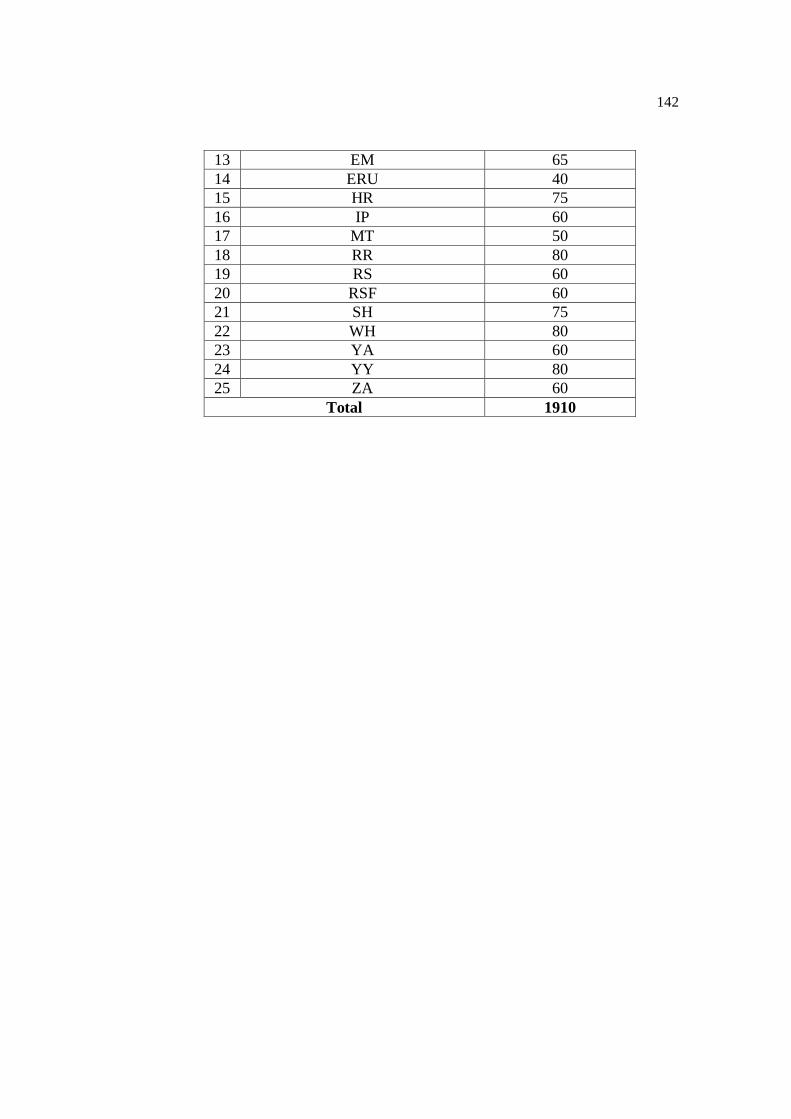
142
13 EM 65
14 ERU 40
15 HR 75
16 IP 60
17 MT 50
18 RR 80
19 RS 60
20 RSF 60
21 SH 75
22 WH 80
23 YA 60
24 YY 80
25 ZA 60
Total 1910
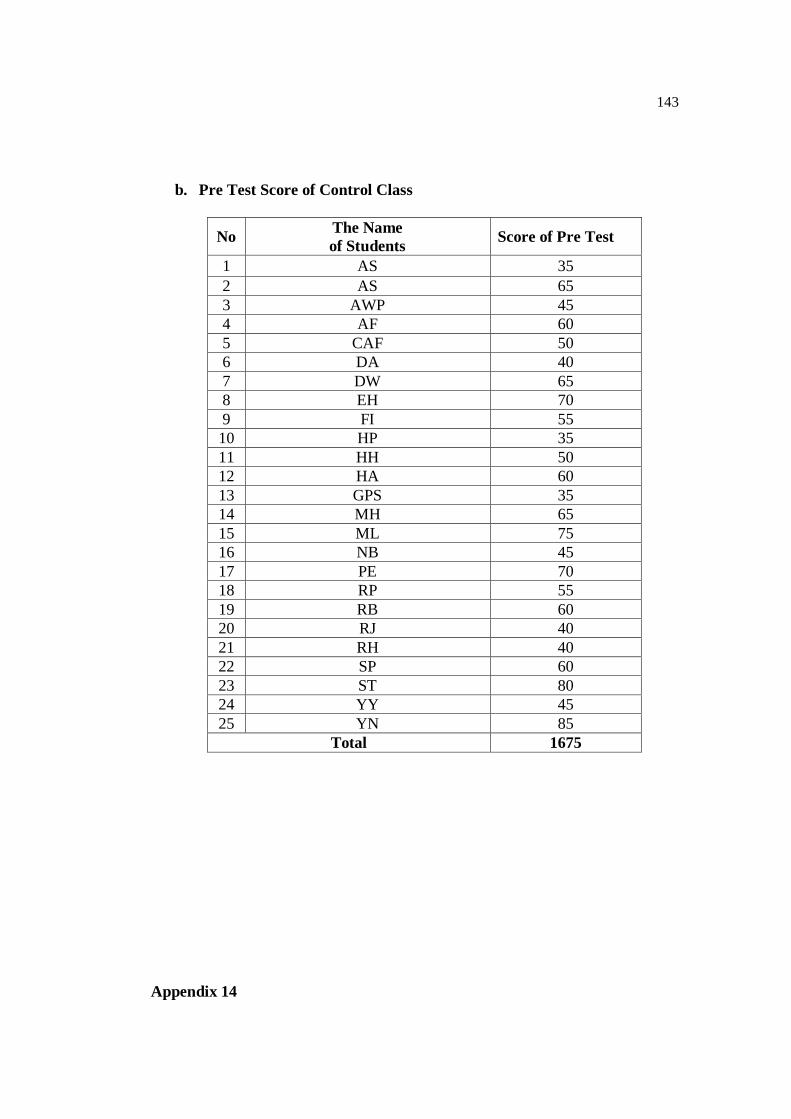
143
b. Pre Test Score of Control Class
No The Name
of Students Score of Pre Test
1 AS 35
2 AS 65
3 AWP 45
4 AF 60
5 CAF 50
6 DA 40
7 DW 65
8 EH 70
9 FI 55
10 HP 35
11 HH 50
12 HA 60
13 GPS 35
14 MH 65
15 ML 75
16 NB 45
17 PE 70
18 RP 55
19 RB 60
20 RJ 40
21 RH 40
22 SP 60
23 ST 80
24 YY 45
25 YN 85
Total 1675
Appendix 14
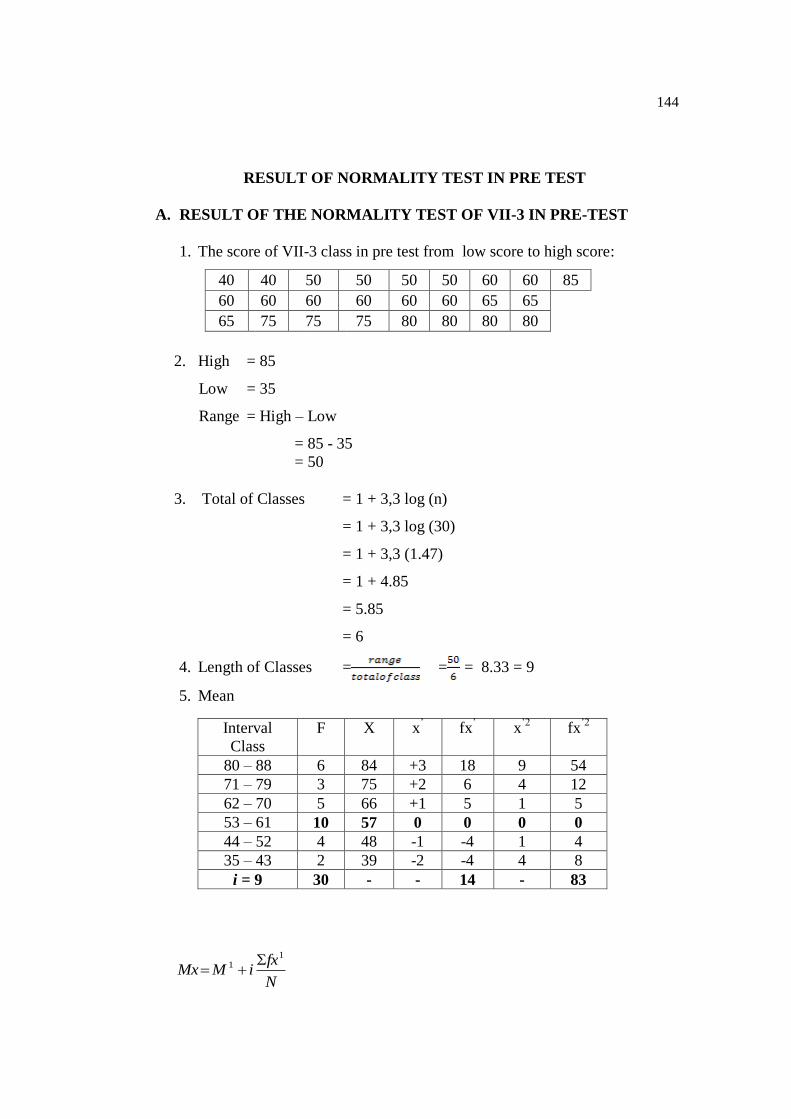
144
RESULT OF NORMALITY TEST IN PRE TEST
A. RESULT OF THE NORMALITY TEST OF VII-3 IN PRE-TEST
1. The score of VII-3 class in pre test from low score to high score:
40 40 50 50 50 50 60 60 85
60 60 60 60 60 60 65 65
65 75 75 75 80 80 80 80
2. High = 85
Low = 35
Range = High – Low
= 85 - 35
= 50
3. Total of Classes = 1 + 3,3 log (n)
= 1 + 3,3 log (30)
= 1 + 3,3 (1.47)
= 1 + 4.85
= 5.85
= 6
4. Length of Classes = = = 8.33 = 9
5. Mean
Interval
Class
F X x’
fx’ x
’2 fx
’2
80 – 88 6 84 +3 18 9 54
71 – 79 3 75 +2 6 4 12
62 – 70 5 66 +1 5 1 5
53 – 61 10 57 0 0 0 0
44 – 52 4 48 -1 -4 1 4
35 – 43 2 39 -2 -4 4 8
i = 9 30 - - 14 - 83
N
fxiMMx
11
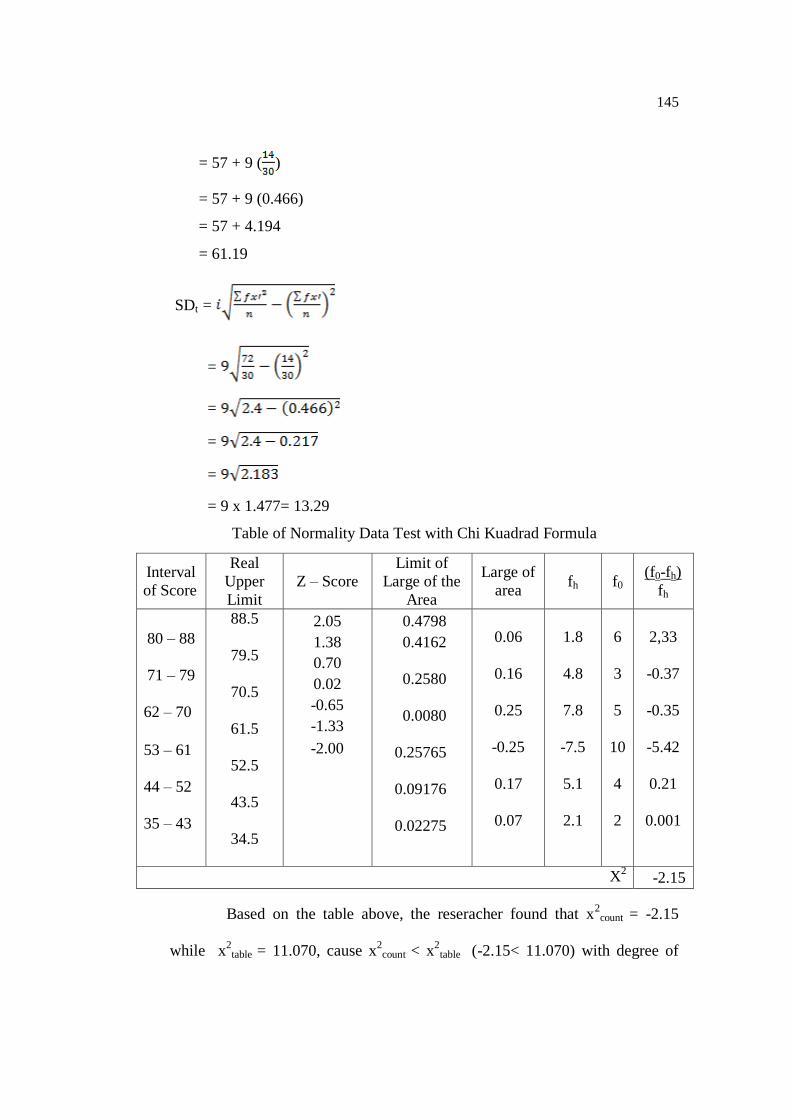
145
= 57 + 9 ( )
= 57 + 9 (0.466)
= 57 + 4.194
= 61.19
SDt =
=
=
=
=
= 9 x 1.477= 13.29
Table of Normality Data Test with Chi Kuadrad Formula
Interval
of Score
Real
Upper
Limit
Z – Score
Limit of
Large of the
Area
Large of
area fh f0
(f0-fh)
fh
80 – 88
71 – 79
62 – 70
53 – 61
44 – 52
35 – 43
88.5
79.5
70.5
61.5
52.5
43.5
34.5
2.05
1.38
0.70
0.02
-0.65
-1.33
-2.00
0.4798
0.4162
0.2580
0.0080
0.25765
0.09176
0.02275
0.06
0.16
0.25
-0.25
0.17
0.07
1.8
4.8
7.8
-7.5
5.1
2.1
6
3
5
10
4
2
2,33
-0.37
-0.35
-5.42
0.21
0.001
X2
-2.15
Based on the table above, the reseracher found that x2count = -2.15
while x2table = 11.070, cause x
2count < x
2table (-2.15< 11.070) with degree of
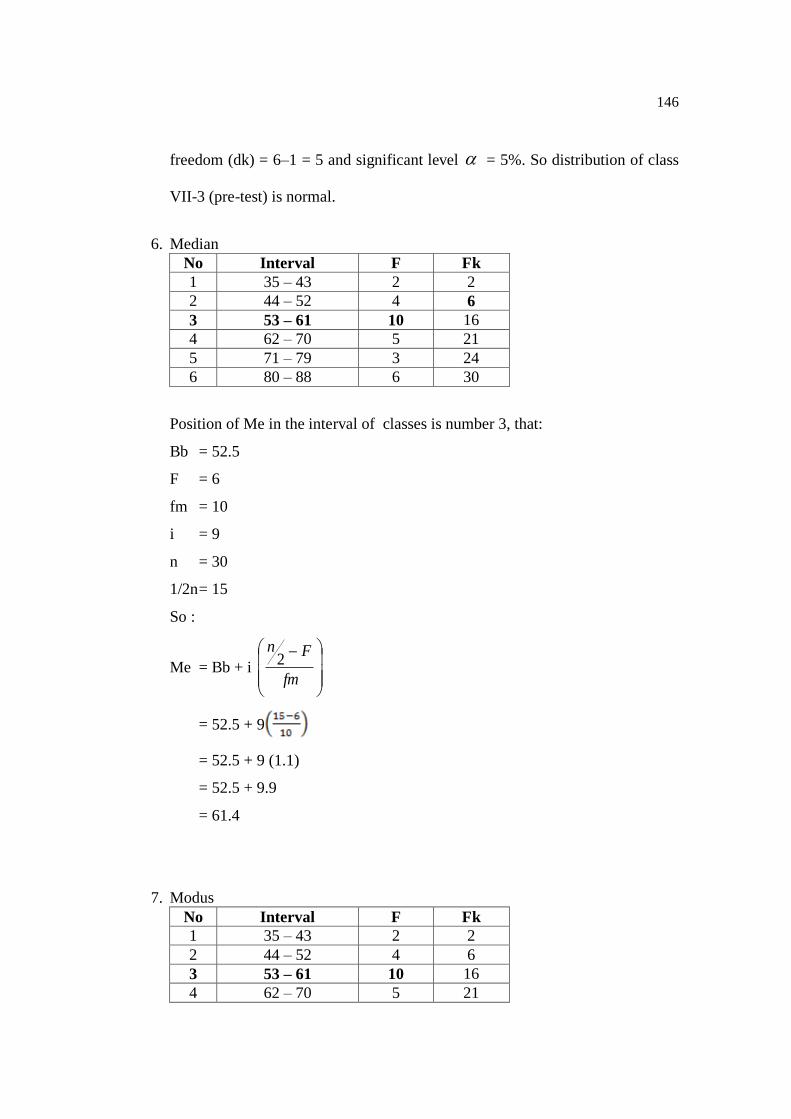
146
freedom (dk) = 6–1 = 5 and significant level = 5%. So distribution of class
VII-3 (pre-test) is normal.
6. Median
No Interval F Fk
1 35 – 43 2 2
2 44 – 52 4 6
3 53 – 61 10 16
4 62 – 70 5 21
5 71 – 79 3 24
6 80 – 88 6 30
Position of Me in the interval of classes is number 3, that:
Bb = 52.5
F = 6
fm = 10
i = 9
n = 30
1/2n = 15
So :
Me = Bb + i
fm
Fn2
= 52.5 + 9
= 52.5 + 9 (1.1)
= 52.5 + 9.9
= 61.4
7. Modus
No Interval F Fk
1 35 – 43 2 2
2 44 – 52 4 6
3 53 – 61 10 16
4 62 – 70 5 21
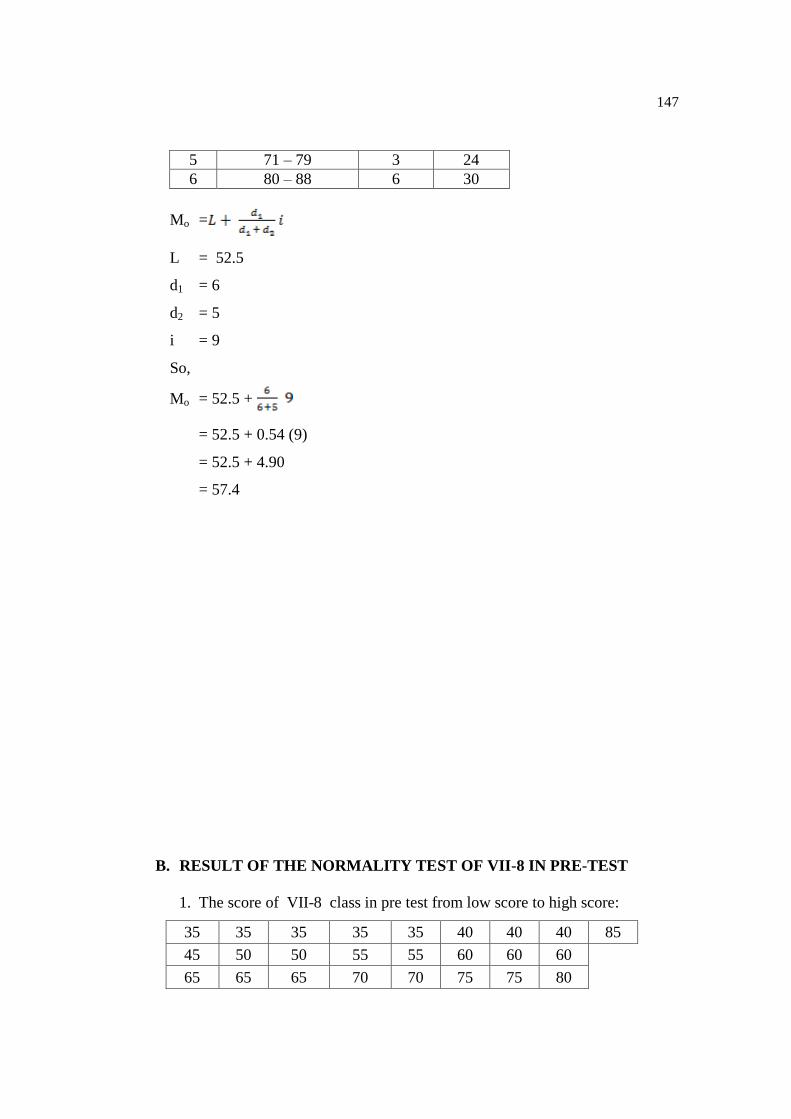
147
5 71 – 79 3 24
6 80 – 88 6 30
Mo =
L = 52.5
d1 = 6
d2 = 5
i = 9
So,
Mo = 52.5 +
= 52.5 + 0.54 (9)
= 52.5 + 4.90
= 57.4
B. RESULT OF THE NORMALITY TEST OF VII-8 IN PRE-TEST
1. The score of VII-8 class in pre test from low score to high score:
35 35 35 35 35 40 40 40 85
45 50 50 55 55 60 60 60
65 65 65 70 70 75 75 80
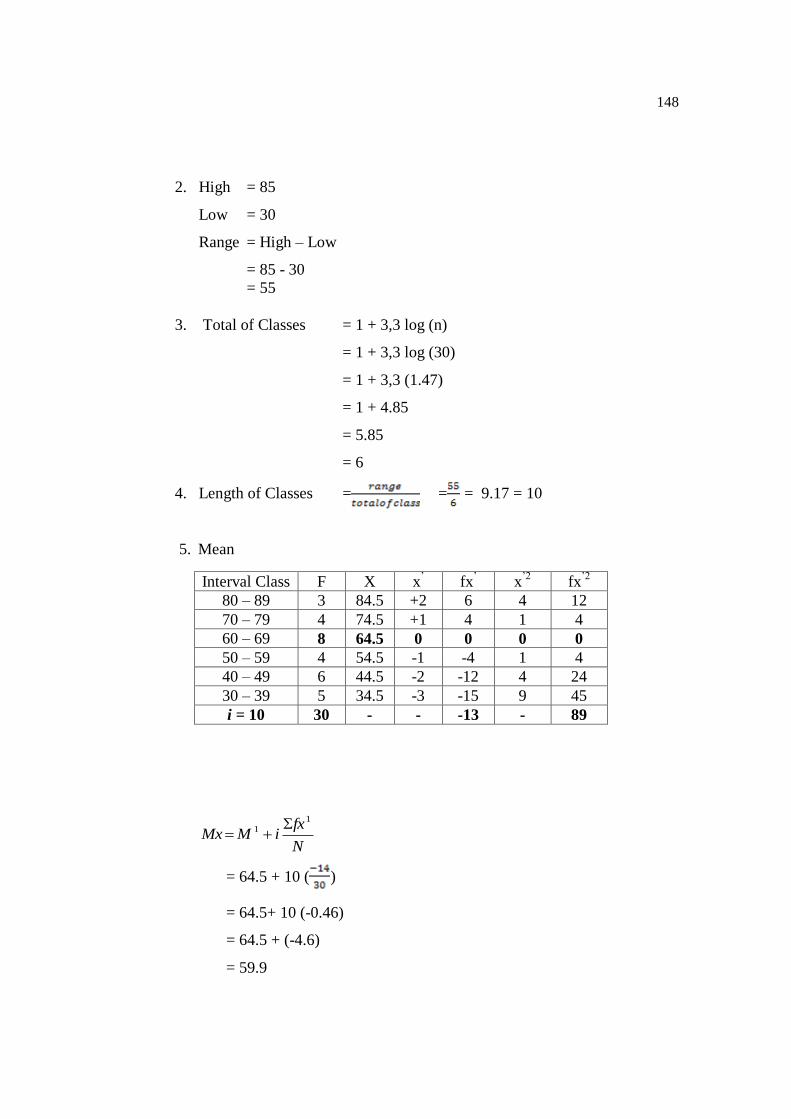
148
2. High = 85
Low = 30
Range = High – Low
= 85 - 30
= 55
3. Total of Classes = 1 + 3,3 log (n)
= 1 + 3,3 log (30)
= 1 + 3,3 (1.47)
= 1 + 4.85
= 5.85
= 6
4. Length of Classes = = = 9.17 = 10
5. Mean
Interval Class F X x’
fx’ x
’2 fx
’2
80 – 89 3 84.5 +2 6 4 12
70 – 79 4 74.5 +1 4 1 4
60 – 69 8 64.5 0 0 0 0
50 – 59 4 54.5 -1 -4 1 4
40 – 49 6 44.5 -2 -12 4 24
30 – 39 5 34.5 -3 -15 9 45
i = 10 30 - - -13 - 89
N
fxiMMx
11
= 64.5 + 10 ( )
= 64.5+ 10 (-0.46)
= 64.5 + (-4.6)
= 59.9
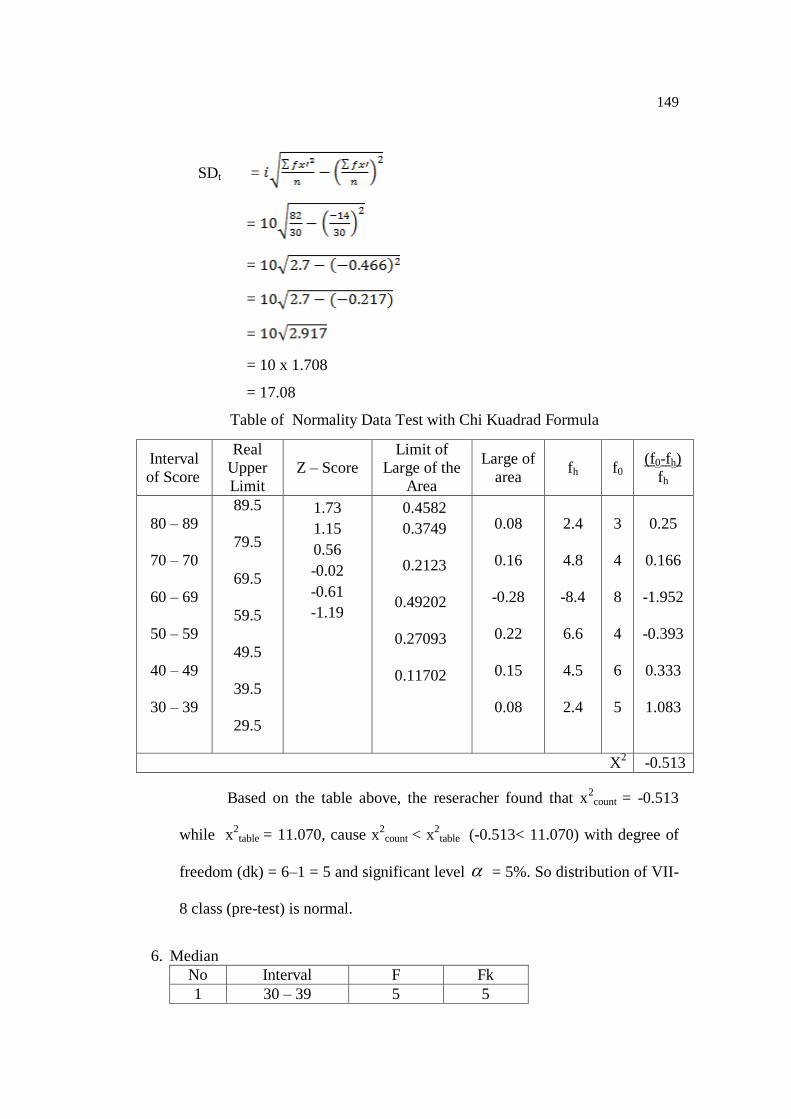
149
SDt =
=
=
=
=
= 10 x 1.708
= 17.08
Table of Normality Data Test with Chi Kuadrad Formula
Interval
of Score
Real
Upper
Limit
Z – Score
Limit of
Large of the
Area
Large of
area fh f0
(f0-fh)
fh
80 – 89
70 – 70
60 – 69
50 – 59
40 – 49
30 – 39
89.5
79.5
69.5
59.5
49.5
39.5
29.5
1.73
1.15
0.56
-0.02
-0.61
-1.19
0.4582
0.3749
0.2123
0.49202
0.27093
0.11702
0.08
0.16
-0.28
0.22
0.15
0.08
2.4
4.8
-8.4
6.6
4.5
2.4
3
4
8
4
6
5
0.25
0.166
-1.952
-0.393
0.333
1.083
X2
-0.513
Based on the table above, the reseracher found that x2count = -0.513
while x2table = 11.070, cause x
2count < x
2table (-0.513< 11.070) with degree of
freedom (dk) = 6–1 = 5 and significant level = 5%. So distribution of VII-
8 class (pre-test) is normal.
6. Median
No Interval F Fk
1 30 – 39 5 5
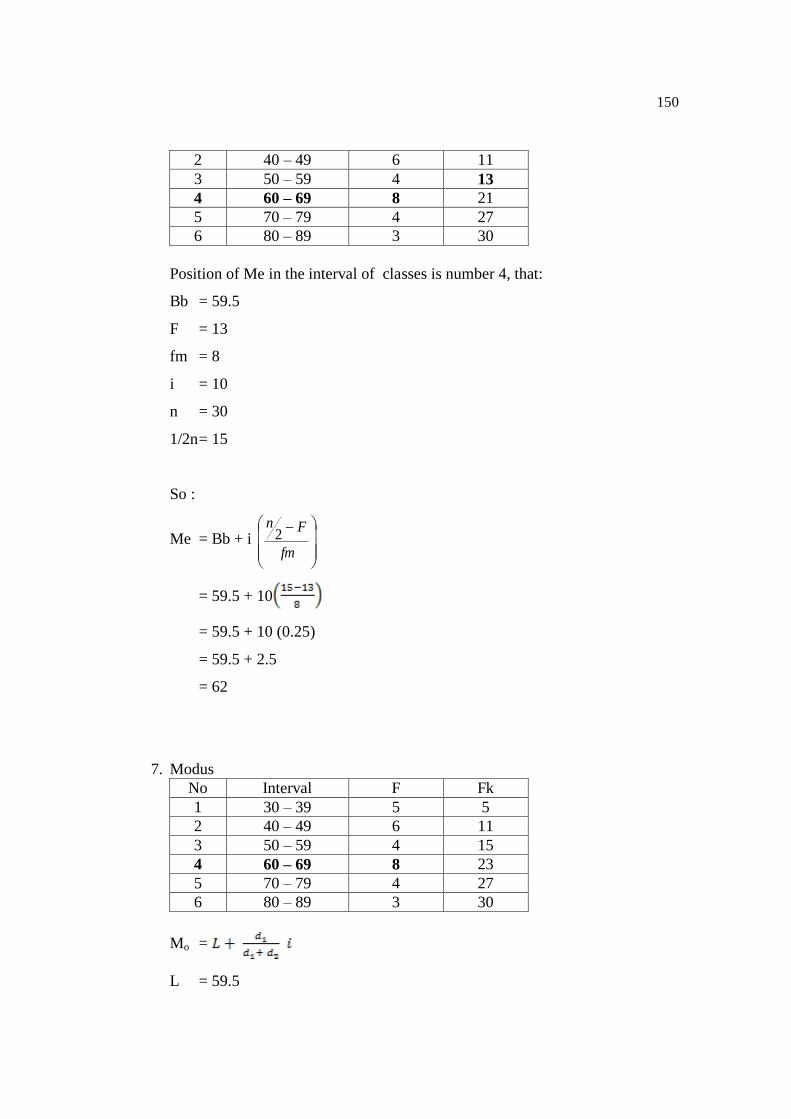
150
2 40 – 49 6 11
3 50 – 59 4 13
4 60 – 69 8 21
5 70 – 79 4 27
6 80 – 89 3 30
Position of Me in the interval of classes is number 4, that:
Bb = 59.5
F = 13
fm = 8
i = 10
n = 30
1/2n = 15
So :
Me = Bb + i
fm
Fn2
= 59.5 + 10
= 59.5 + 10 (0.25)
= 59.5 + 2.5
= 62
7. Modus
No Interval F Fk
1 30 – 39 5 5
2 40 – 49 6 11
3 50 – 59 4 15
4 60 – 69 8 23
5 70 – 79 4 27
6 80 – 89 3 30
Mo =
L = 59.5
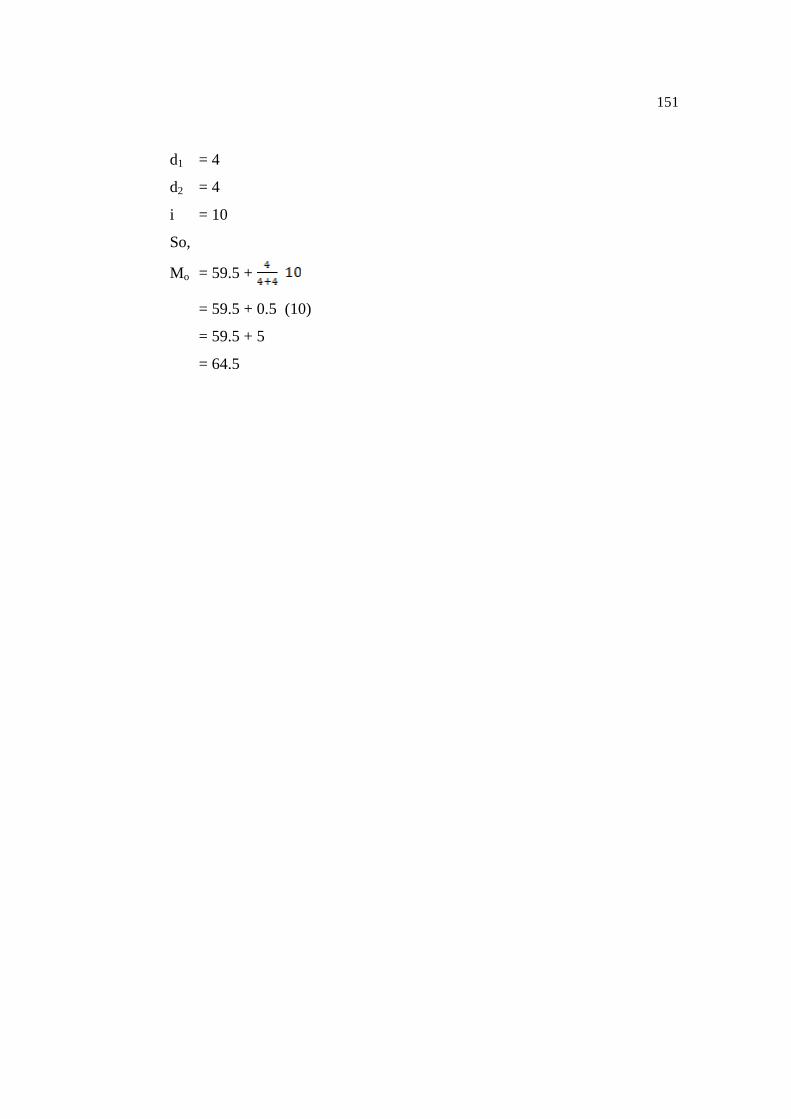
151
d1 = 4
d2 = 4
i = 10
So,
Mo = 59.5 +
= 59.5 + 0.5 (10)
= 59.5 + 5
= 64.5
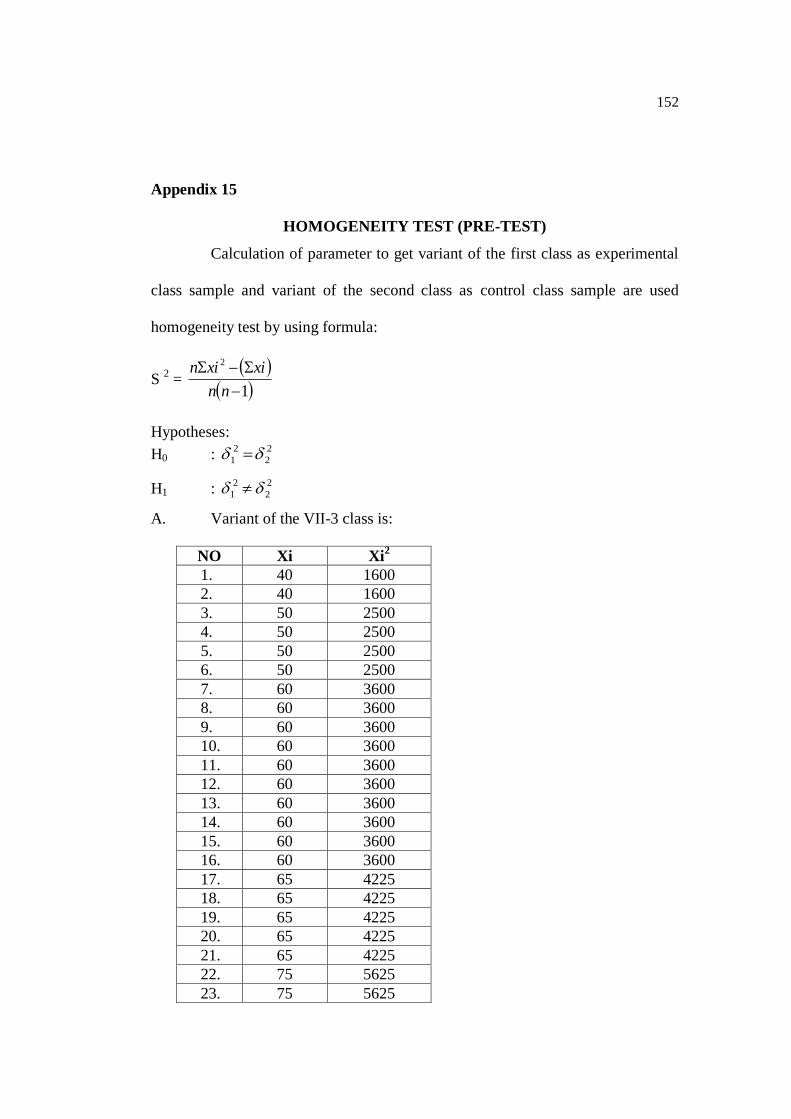
152
Appendix 15
HOMOGENEITY TEST (PRE-TEST)
Calculation of parameter to get variant of the first class as experimental
class sample and variant of the second class as control class sample are used
homogeneity test by using formula:
S 2 =
1
2
nn
xixin
Hypotheses:
H0 : 2
2
2
1
H1 : 2
2
2
1
A. Variant of the VII-3 class is:
NO Xi Xi2
1. 40 1600
2. 40 1600
3. 50 2500
4. 50 2500
5. 50 2500
6. 50 2500
7. 60 3600
8. 60 3600
9. 60 3600
10. 60 3600
11. 60 3600
12. 60 3600
13. 60 3600
14. 60 3600
15. 60 3600
16. 60 3600
17. 65 4225
18. 65 4225
19. 65 4225
20. 65 4225
21. 65 4225
22. 75 5625
23. 75 5625
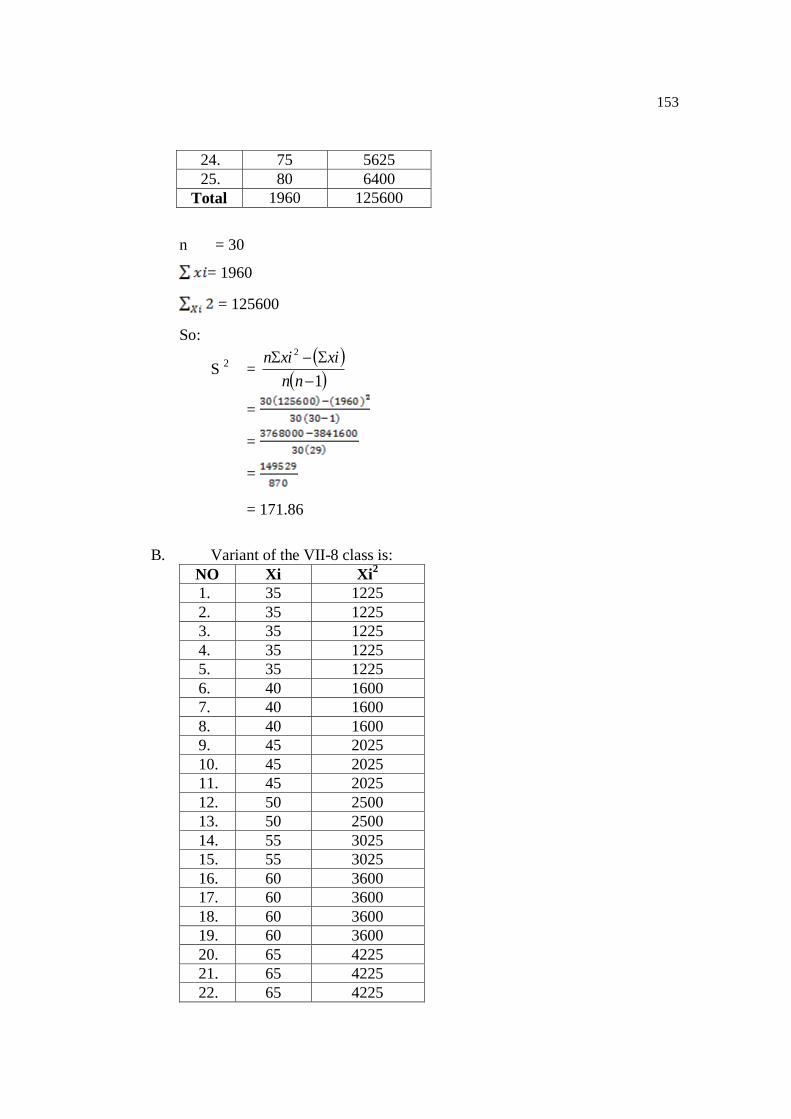
153
24. 75 5625
25. 80 6400
Total 1960 125600
n = 30
= 1960
= 125600
So:
S 2 =
1
2
nn
xixin
=
=
=
= 171.86
B. Variant of the VII-8 class is:
NO Xi Xi2
1. 35 1225
2. 35 1225
3. 35 1225
4. 35 1225
5. 35 1225
6. 40 1600
7. 40 1600
8. 40 1600
9. 45 2025
10. 45 2025
11. 45 2025
12. 50 2500
13. 50 2500
14. 55 3025
15. 55 3025
16. 60 3600
17. 60 3600
18. 60 3600
19. 60 3600
20. 65 4225
21. 65 4225
22. 65 4225
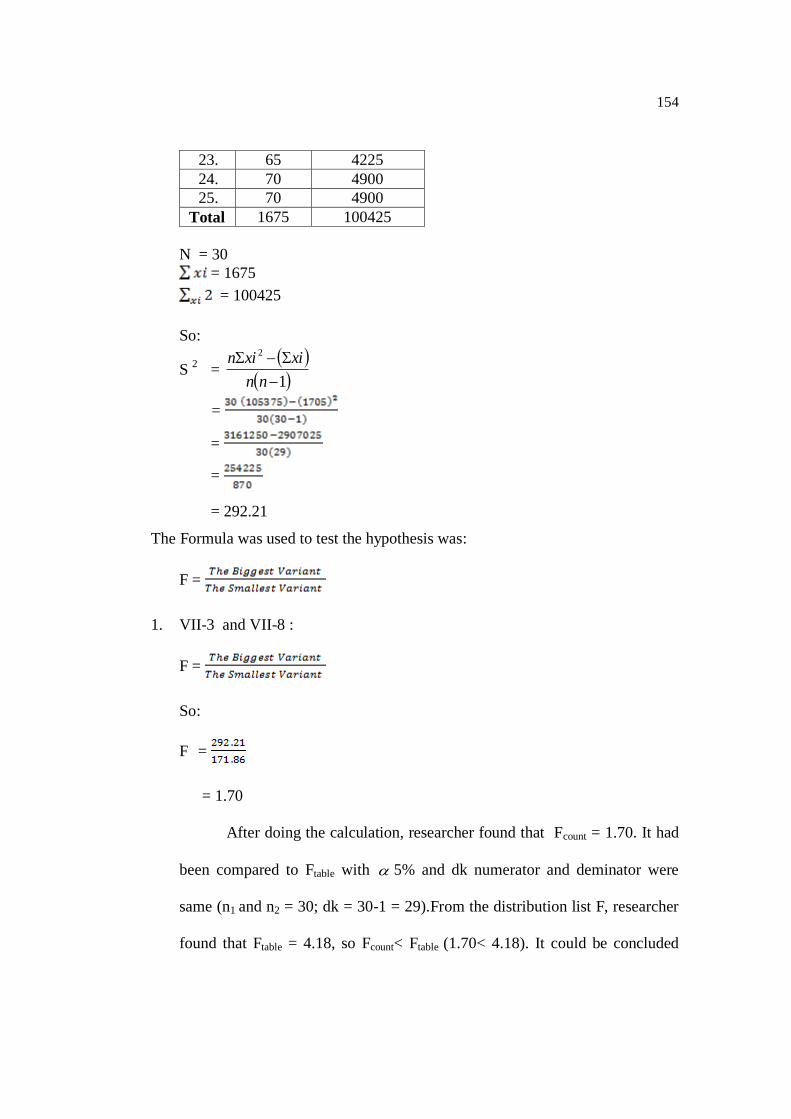
154
23. 65 4225
24. 70 4900
25. 70 4900
Total 1675 100425
N = 30
= 1675
= 100425
So:
S 2 =
1
2
nn
xixin
=
=
=
= 292.21
The Formula was used to test the hypothesis was:
F =
1. VII-3 and VII-8 :
F =
So:
F =
= 1.70
After doing the calculation, researcher found that Fcount = 1.70. It had
been compared to Ftable with 5% and dk numerator and deminator were
same (n1 and n2 = 30; dk = 30-1 = 29).From the distribution list F, researcher
found that Ftable = 4.18, so Fcount< Ftable (1.70< 4.18). It could be concluded
155
that there is no difference variant between the VII-3 class and VII-8 class. It
means that the variant is homogenous.
Appendix 16
Score of Experimental Class and Control Class on Post Test
1. Score of Experimental Class Post Test Using Semantic Mapping
Strategy
No The Name
of Students Score of Post Test
1 AS 80
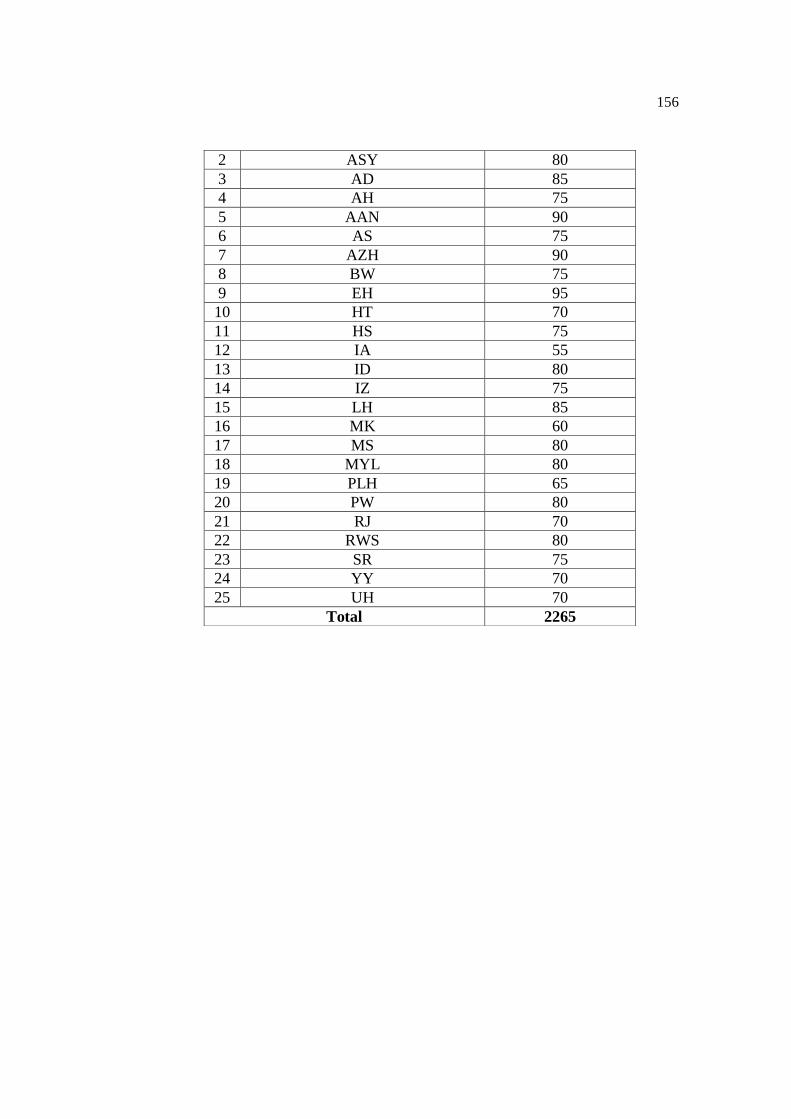
156
2 ASY 80
3 AD 85
4 AH 75
5 AAN 90
6 AS 75
7 AZH 90
8 BW 75
9 EH 95
10 HT 70
11 HS 75
12 IA 55
13 ID 80
14 IZ 75
15 LH 85
16 MK 60
17 MS 80
18 MYL 80
19 PLH 65
20 PW 80
21 RJ 70
22 RWS 80
23 SR 75
24 YY 70
25 UH 70
Total 2265
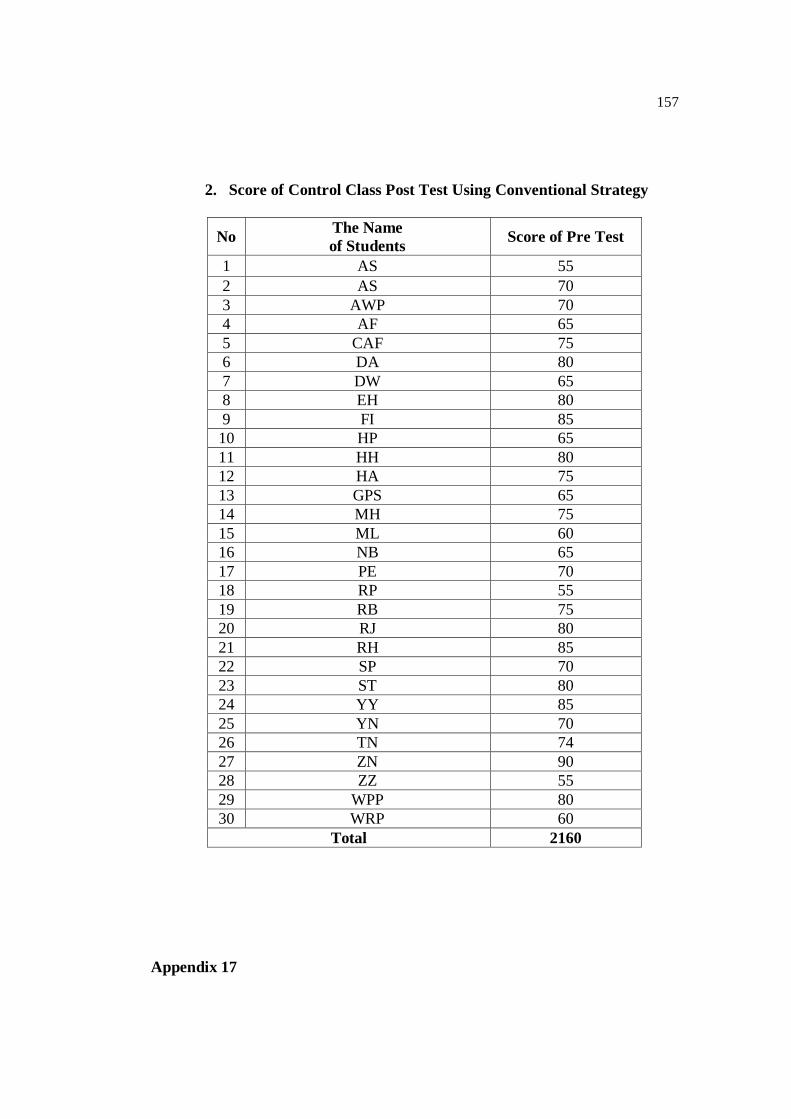
157
2. Score of Control Class Post Test Using Conventional Strategy
No The Name
of Students Score of Pre Test
1 AS 55
2 AS 70
3 AWP 70
4 AF 65
5 CAF 75
6 DA 80
7 DW 65
8 EH 80
9 FI 85
10 HP 65
11 HH 80
12 HA 75
13 GPS 65
14 MH 75
15 ML 60
16 NB 65
17 PE 70
18 RP 55
19 RB 75
20 RJ 80
21 RH 85
22 SP 70
23 ST 80
24 YY 85
25 YN 70
26 TN 74
27 ZN 90
28 ZZ 55
29 WPP 80
30 WRP 60
Total 2160
Appendix 17
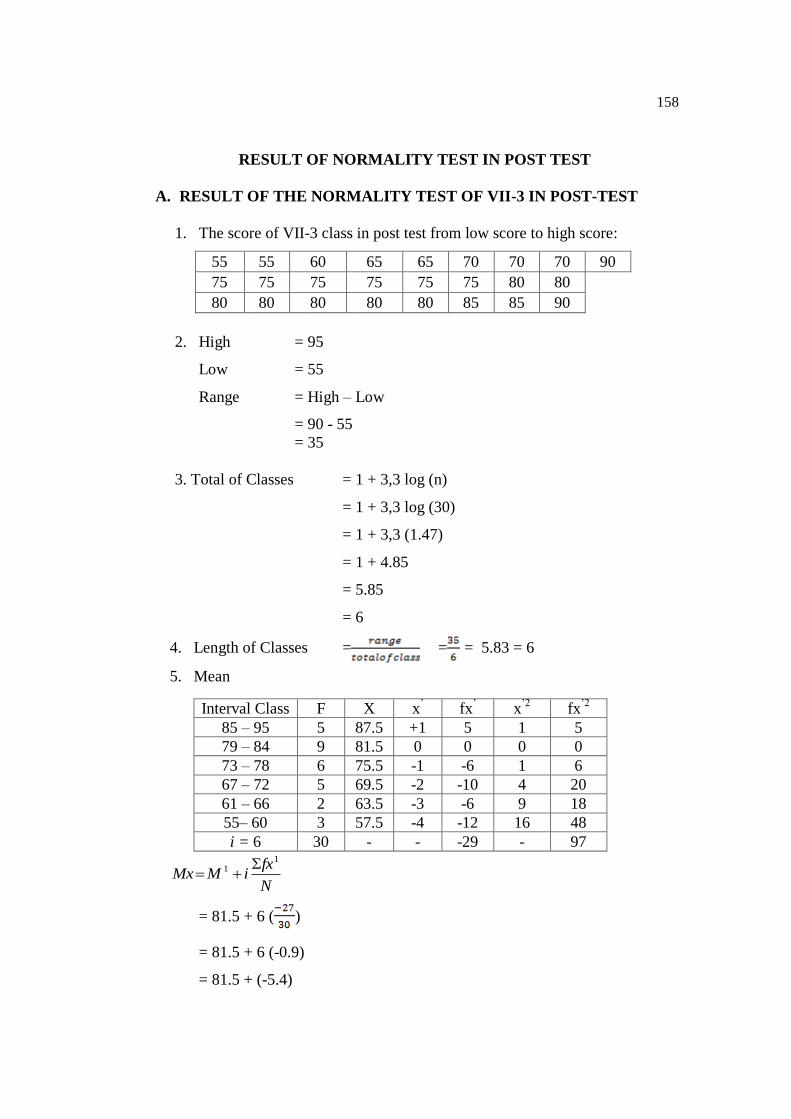
158
RESULT OF NORMALITY TEST IN POST TEST
A. RESULT OF THE NORMALITY TEST OF VII-3 IN POST-TEST
1. The score of VII-3 class in post test from low score to high score:
55 55 60 65 65 70 70 70 90
75 75 75 75 75 75 80 80
80 80 80 80 80 85 85 90
2. High = 95
Low = 55
Range = High – Low
= 90 - 55
= 35
3. Total of Classes = 1 + 3,3 log (n)
= 1 + 3,3 log (30)
= 1 + 3,3 (1.47)
= 1 + 4.85
= 5.85
= 6
4. Length of Classes = = = 5.83 = 6
5. Mean
Interval Class F X x’
fx’ x
’2 fx
’2
85 – 95 5 87.5 +1 5 1 5
79 – 84 9 81.5 0 0 0 0
73 – 78 6 75.5 -1 -6 1 6
67 – 72 5 69.5 -2 -10 4 20
61 – 66 2 63.5 -3 -6 9 18
55– 60 3 57.5 -4 -12 16 48
i = 6 30 - - -29 - 97
N
fxiMMx
11
= 81.5 + 6 ( )
= 81.5 + 6 (-0.9)
= 81.5 + (-5.4)
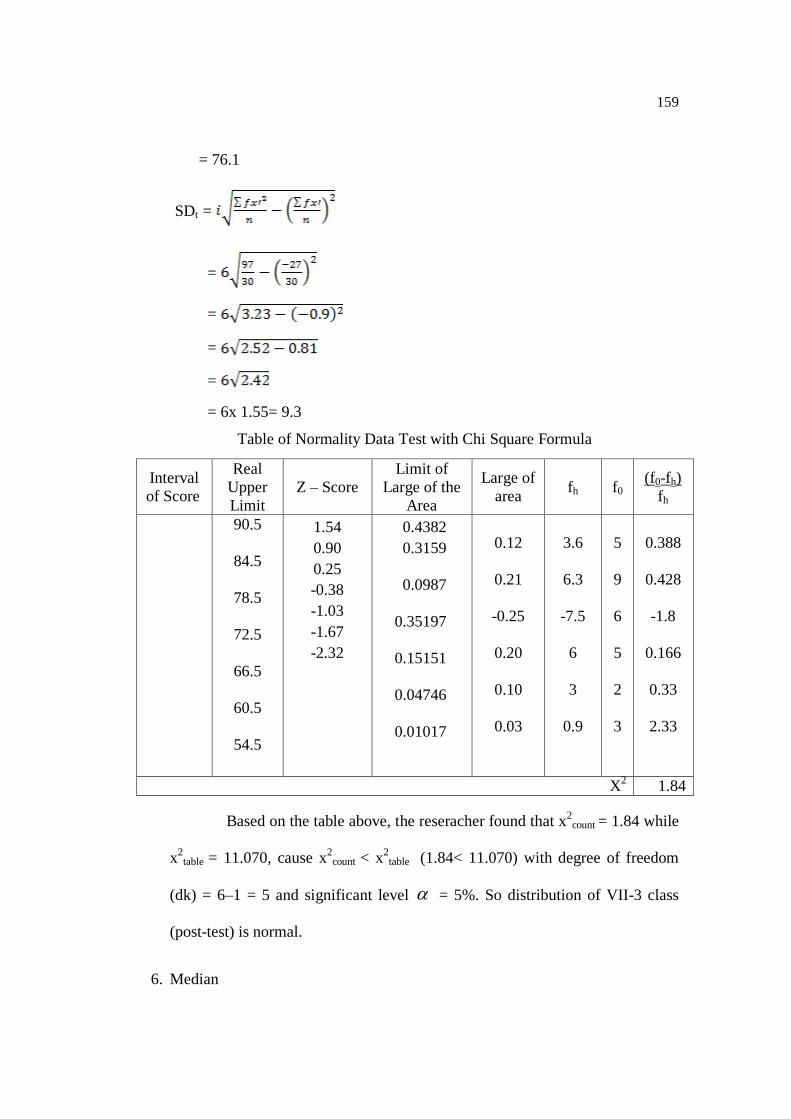
159
= 76.1
SDt =
=
=
=
=
= 6x 1.55= 9.3
Table of Normality Data Test with Chi Square Formula
Interval
of Score
Real
Upper
Limit
Z – Score
Limit of
Large of the
Area
Large of
area fh f0
(f0-fh)
fh
90.5
84.5
78.5
72.5
66.5
60.5
54.5
1.54
0.90
0.25
-0.38
-1.03
-1.67
-2.32
0.4382
0.3159
0.0987
0.35197
0.15151
0.04746
0.01017
0.12
0.21
-0.25
0.20
0.10
0.03
3.6
6.3
-7.5
6
3
0.9
5
9
6
5
2
3
0.388
0.428
-1.8
0.166
0.33
2.33
X2
1.84
Based on the table above, the reseracher found that x2count = 1.84 while
x2table = 11.070, cause x
2count < x
2table (1.84< 11.070) with degree of freedom
(dk) = 6–1 = 5 and significant level = 5%. So distribution of VII-3 class
(post-test) is normal.
6. Median
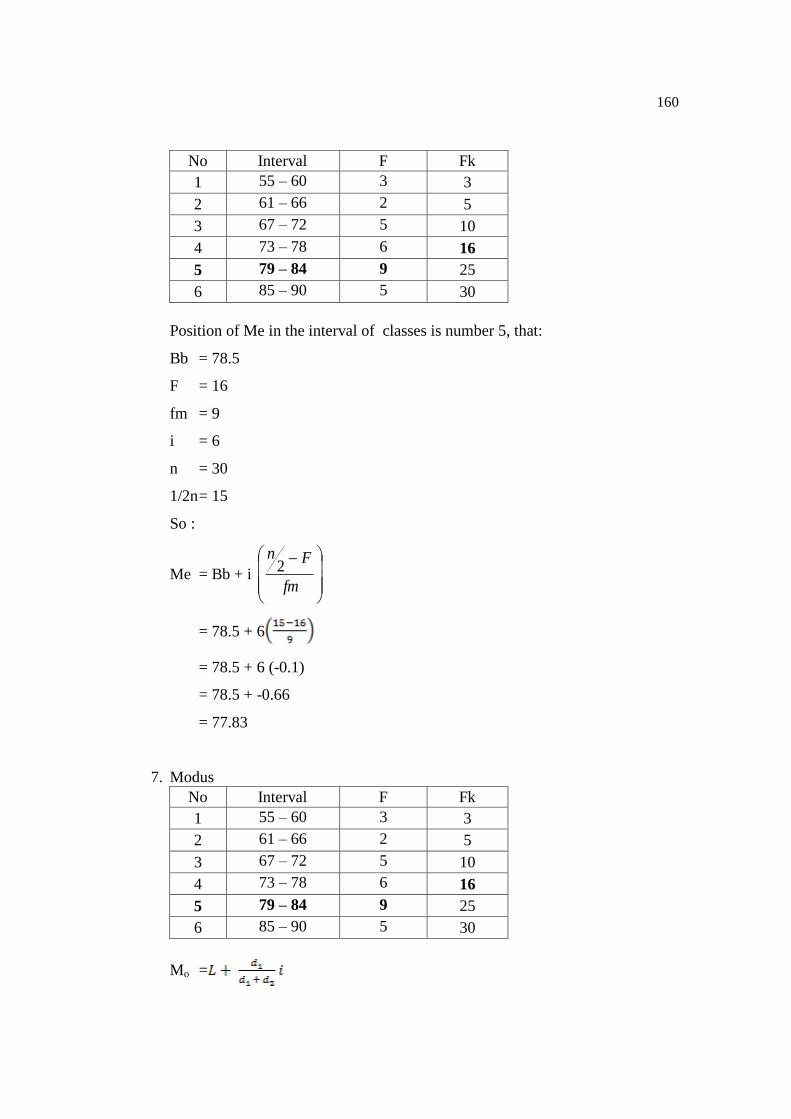
160
No Interval F Fk
1 55 – 60 3 3
2 61 – 66 2 5
3 67 – 72 5 10
4 73 – 78 6 16
5 79 – 84 9 25
6 85 – 90 5 30
Position of Me in the interval of classes is number 5, that:
Bb = 78.5
F = 16
fm = 9
i = 6
n = 30
1/2n = 15
So :
Me = Bb + i
fm
Fn2
= 78.5 + 6
= 78.5 + 6 (-0.1)
= 78.5 + -0.66
= 77.83
7. Modus
No Interval F Fk
1 55 – 60 3 3
2 61 – 66 2 5
3 67 – 72 5 10
4 73 – 78 6 16
5 79 – 84 9 25
6 85 – 90 5 30
Mo =
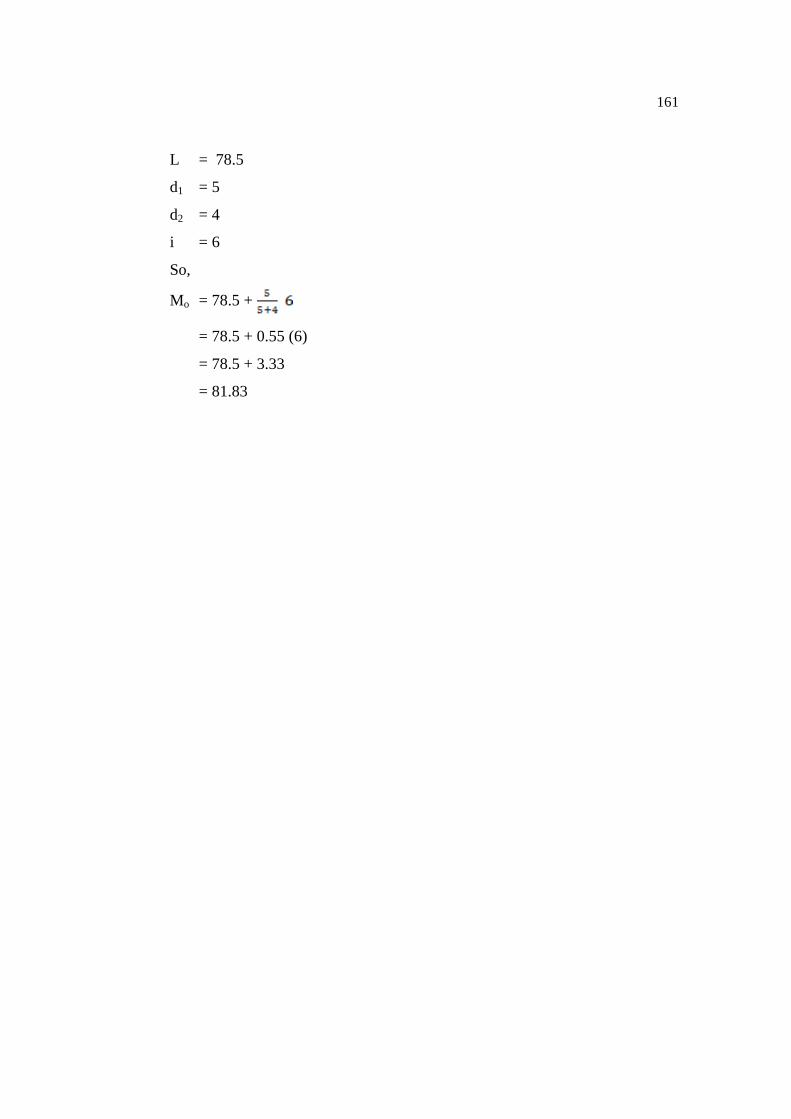
161
L = 78.5
d1 = 5
d2 = 4
i = 6
So,
Mo = 78.5 +
= 78.5 + 0.55 (6)
= 78.5 + 3.33
= 81.83
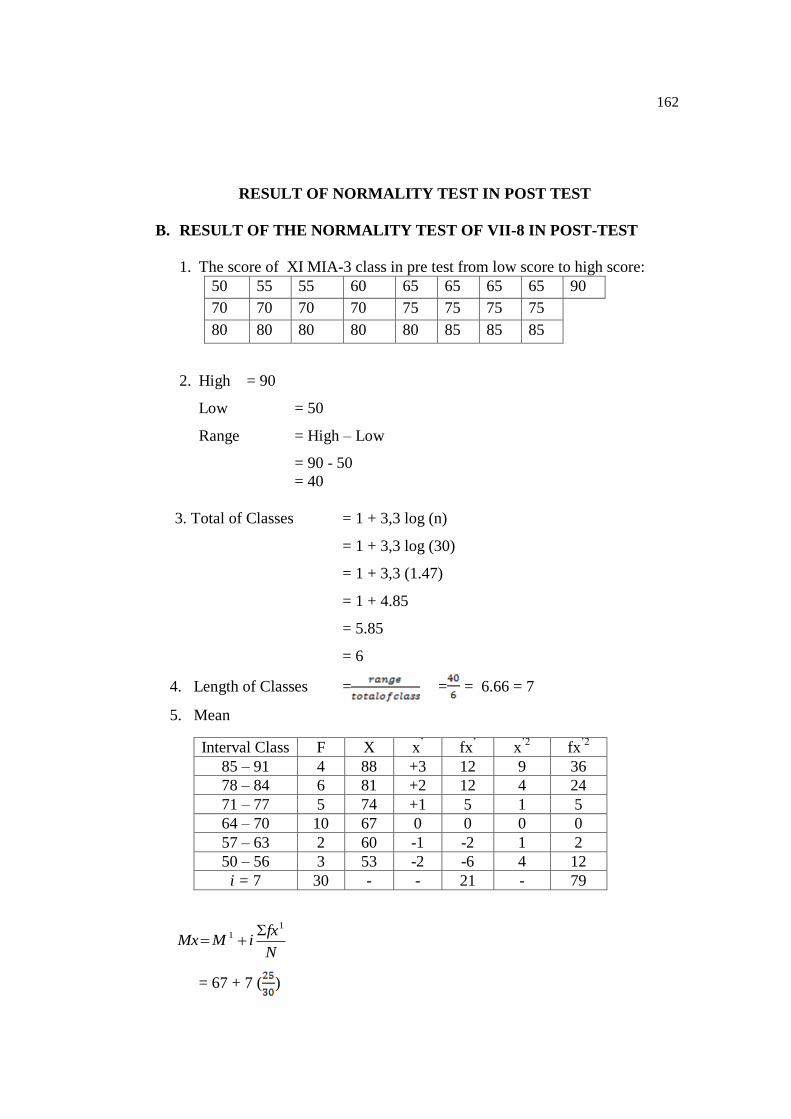
162
RESULT OF NORMALITY TEST IN POST TEST
B. RESULT OF THE NORMALITY TEST OF VII-8 IN POST-TEST
1. The score of XI MIA-3 class in pre test from low score to high score:
50 55 55 60 65 65 65 65 90
70 70 70 70 75 75 75 75
80 80 80 80 80 85 85 85
2. High = 90
Low = 50
Range = High – Low
= 90 - 50
= 40
3. Total of Classes = 1 + 3,3 log (n)
= 1 + 3,3 log (30)
= 1 + 3,3 (1.47)
= 1 + 4.85
= 5.85
= 6
4. Length of Classes = = = 6.66 = 7
5. Mean
Interval Class F X x’
fx’ x
’2 fx
’2
85 – 91 4 88 +3 12 9 36
78 – 84 6 81 +2 12 4 24
71 – 77 5 74 +1 5 1 5
64 – 70 10 67 0 0 0 0
57 – 63 2 60 -1 -2 1 2
50 – 56 3 53 -2 -6 4 12
i = 7 30 - - 21 - 79
N
fxiMMx
11
= 67 + 7 ( )
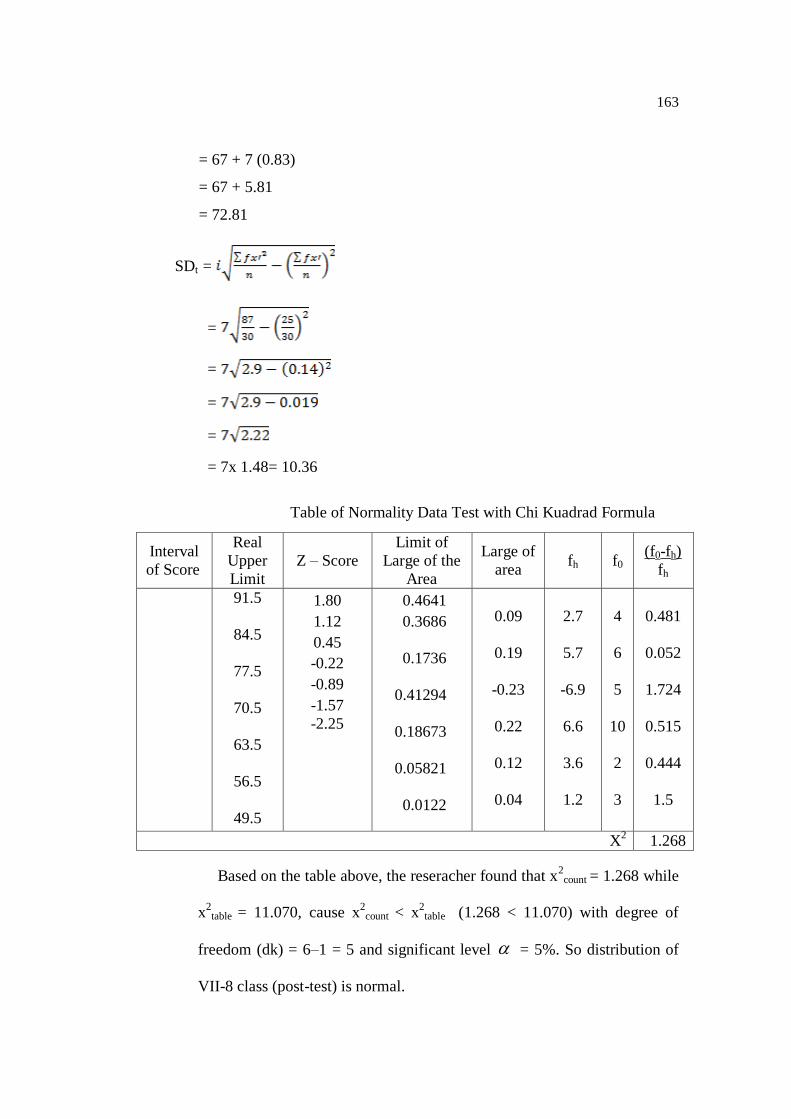
163
= 67 + 7 (0.83)
= 67 + 5.81
= 72.81
SDt =
=
=
=
=
= 7x 1.48= 10.36
Table of Normality Data Test with Chi Kuadrad Formula
Interval
of Score
Real
Upper
Limit
Z – Score
Limit of
Large of the
Area
Large of
area fh f0
(f0-fh)
fh
91.5
84.5
77.5
70.5
63.5
56.5
49.5
1.80
1.12
0.45
-0.22
-0.89
-1.57
-2.25
0.4641
0.3686
0.1736
0.41294
0.18673
0.05821
0.0122
0.09
0.19
-0.23
0.22
0.12
0.04
2.7
5.7
-6.9
6.6
3.6
1.2
4
6
5
10
2
3
0.481
0.052
1.724
0.515
0.444
1.5
X2
1.268
Based on the table above, the reseracher found that x2count = 1.268 while
x2table = 11.070, cause x
2count < x
2table (1.268 < 11.070) with degree of
freedom (dk) = 6–1 = 5 and significant level = 5%. So distribution of
VII-8 class (post-test) is normal.
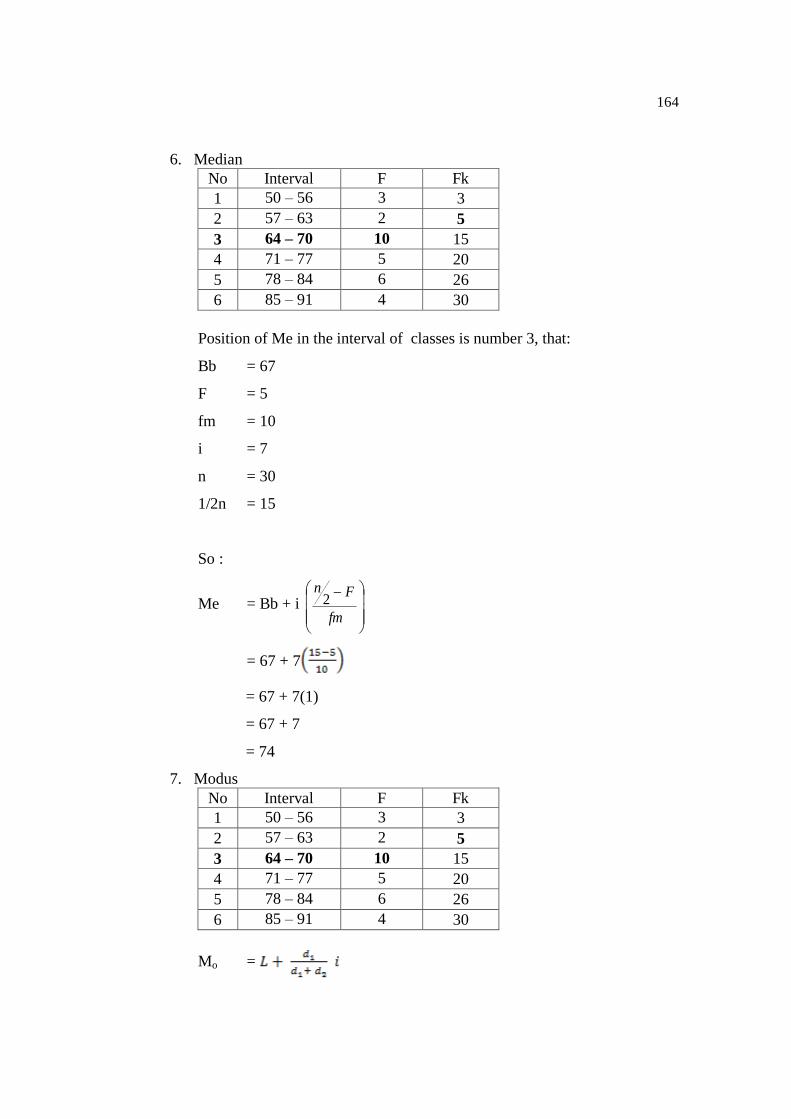
164
6. Median
No Interval F Fk
1 50 – 56 3 3
2 57 – 63 2 5
3 64 – 70 10 15
4 71 – 77 5 20
5 78 – 84 6 26
6 85 – 91 4 30
Position of Me in the interval of classes is number 3, that:
Bb = 67
F = 5
fm = 10
i = 7
n = 30
1/2n = 15
So :
Me = Bb + i
fm
Fn2
= 67 + 7
= 67 + 7(1)
= 67 + 7
= 74
7. Modus
No Interval F Fk
1 50 – 56 3 3
2 57 – 63 2 5
3 64 – 70 10 15
4 71 – 77 5 20
5 78 – 84 6 26
6 85 – 91 4 30
Mo =
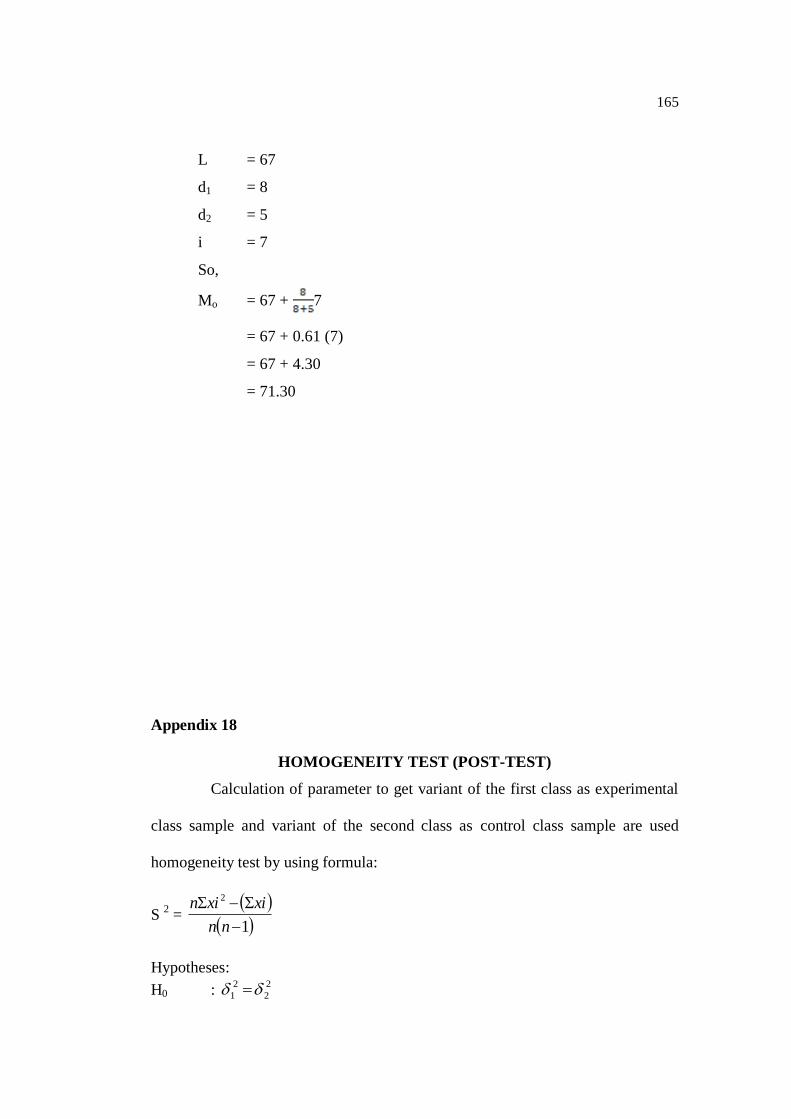
165
L = 67
d1 = 8
d2 = 5
i = 7
So,
Mo = 67 + 7
= 67 + 0.61 (7)
= 67 + 4.30
= 71.30
Appendix 18
HOMOGENEITY TEST (POST-TEST)
Calculation of parameter to get variant of the first class as experimental
class sample and variant of the second class as control class sample are used
homogeneity test by using formula:
S 2 =
1
2
nn
xixin
Hypotheses:
H0 : 2
2
2
1
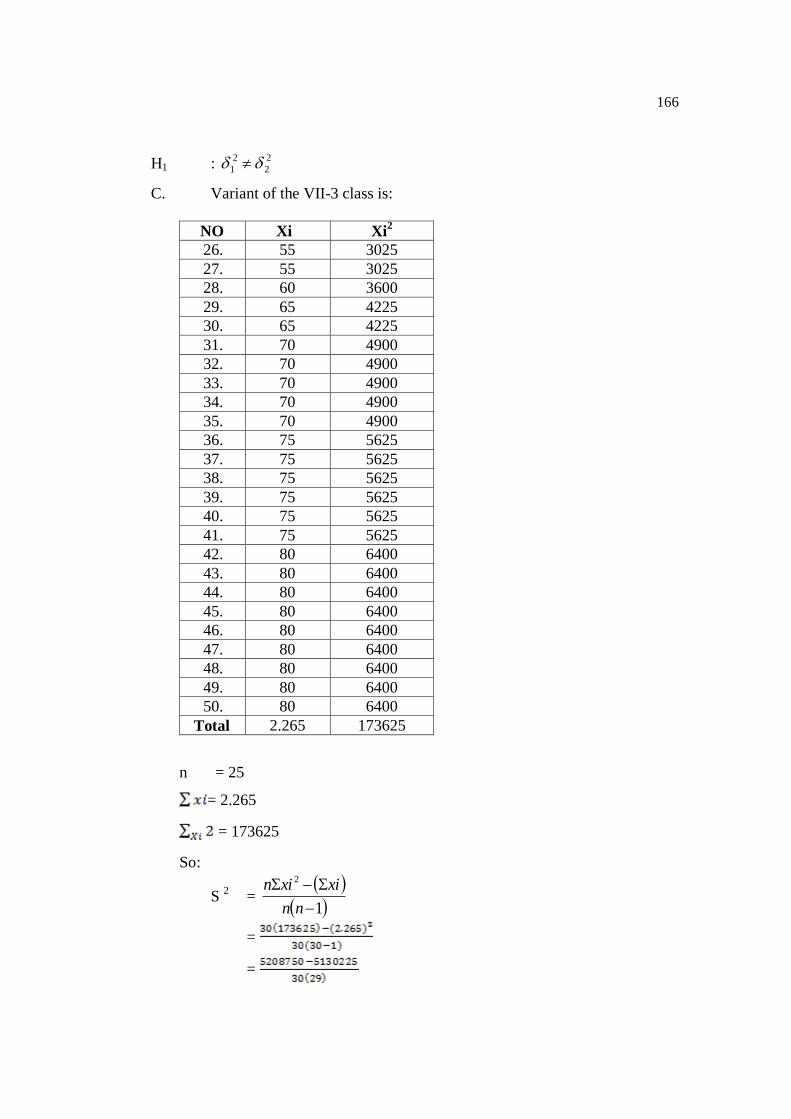
166
H1 : 2
2
2
1
C. Variant of the VII-3 class is:
NO Xi Xi2
26. 55 3025
27. 55 3025
28. 60 3600
29. 65 4225
30. 65 4225
31. 70 4900
32. 70 4900
33. 70 4900
34. 70 4900
35. 70 4900
36. 75 5625
37. 75 5625
38. 75 5625
39. 75 5625
40. 75 5625
41. 75 5625
42. 80 6400
43. 80 6400
44. 80 6400
45. 80 6400
46. 80 6400
47. 80 6400
48. 80 6400
49. 80 6400
50. 80 6400
Total 2.265 173625
n = 25
= 2.265
= 173625
So:
S 2 =
1
2
nn
xixin
=
=
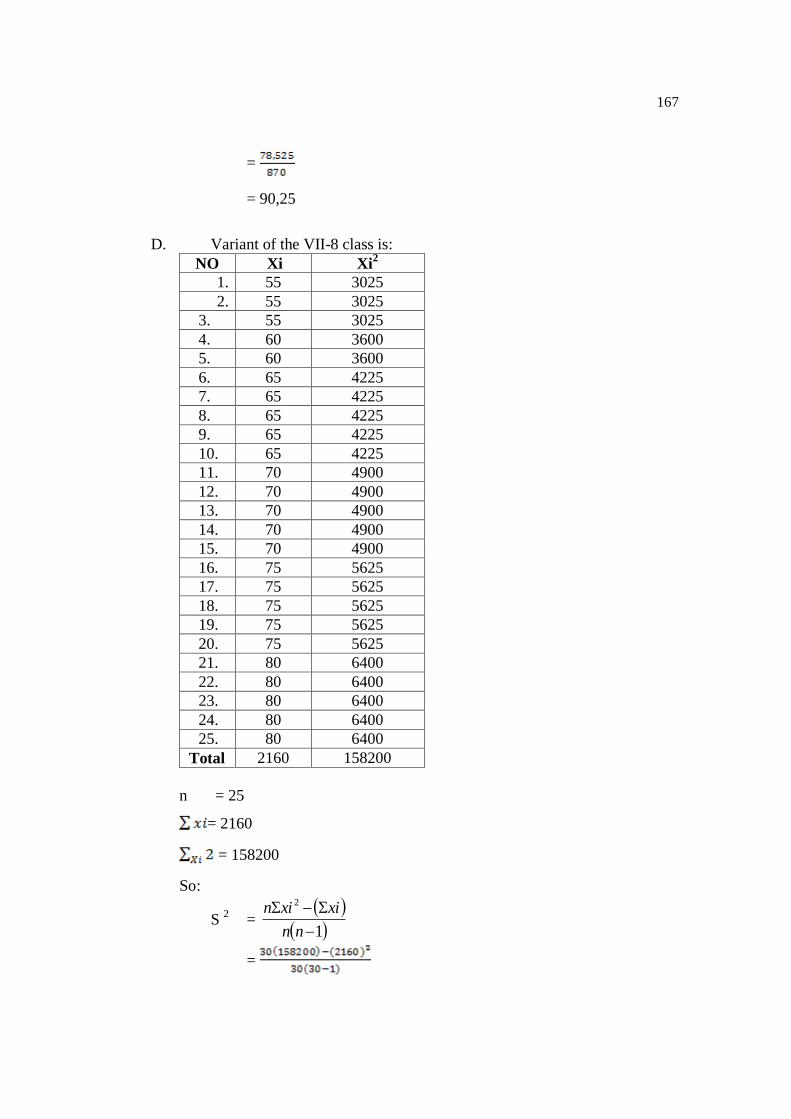
167
=
= 90,25
D. Variant of the VII-8 class is:
NO Xi Xi2
1. 55 3025
2. 55 3025
3. 55 3025
4. 60 3600
5. 60 3600
6. 65 4225
7. 65 4225
8. 65 4225
9. 65 4225
10. 65 4225
11. 70 4900
12. 70 4900
13. 70 4900
14. 70 4900
15. 70 4900
16. 75 5625
17. 75 5625
18. 75 5625
19. 75 5625
20. 75 5625
21. 80 6400
22. 80 6400
23. 80 6400
24. 80 6400
25. 80 6400
Total 2160 158200
n = 25
= 2160
= 158200
So:
S 2 =
1
2
nn
xixin
=
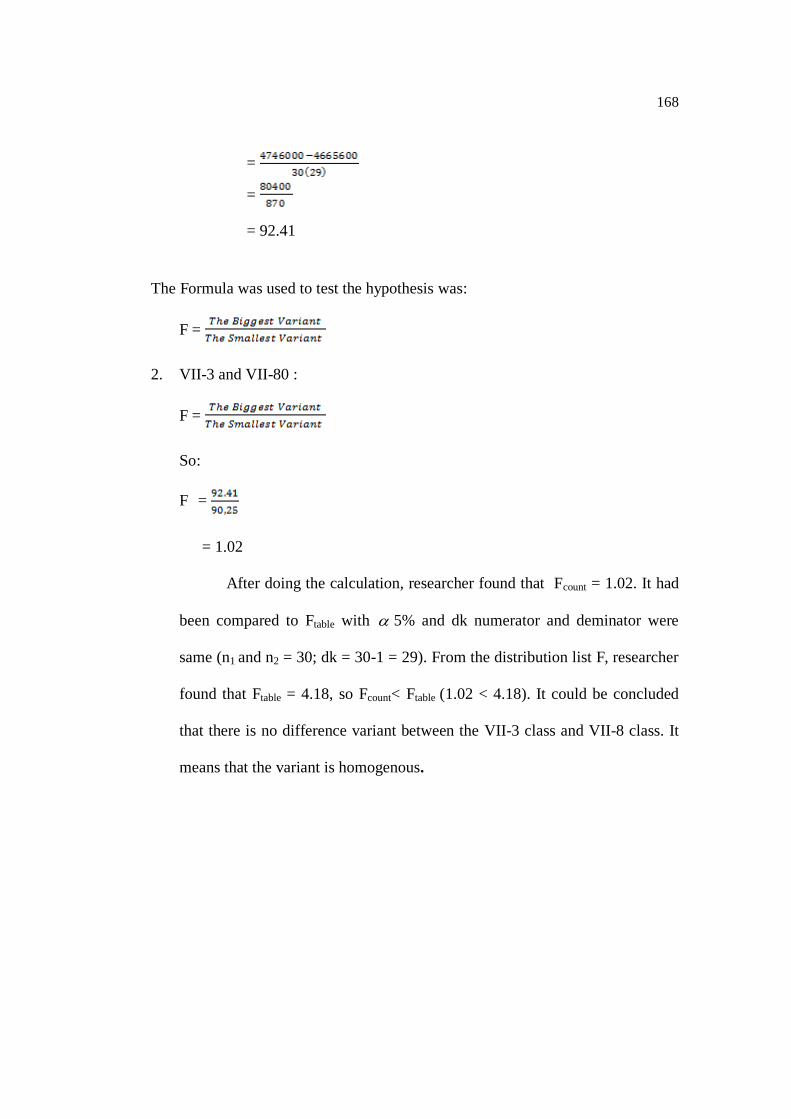
168
=
=
= 92.41
The Formula was used to test the hypothesis was:
F =
2. VII-3 and VII-80 :
F =
So:
F =
= 1.02
After doing the calculation, researcher found that Fcount = 1.02. It had
been compared to Ftable with 5% and dk numerator and deminator were
same (n1 and n2 = 30; dk = 30-1 = 29). From the distribution list F, researcher
found that Ftable = 4.18, so Fcount< Ftable (1.02 < 4.18). It could be concluded
that there is no difference variant between the VII-3 class and VII-8 class. It
means that the variant is homogenous.
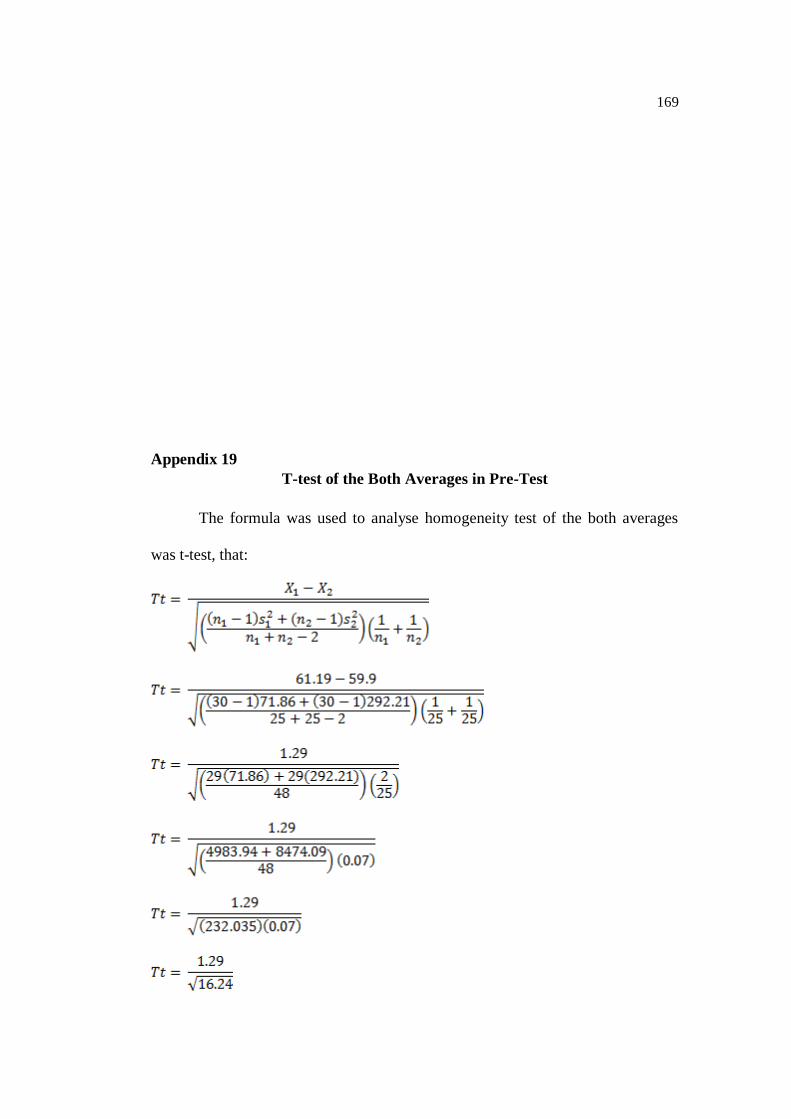
169
Appendix 19
T-test of the Both Averages in Pre-Test
The formula was used to analyse homogeneity test of the both averages
was t-test, that:
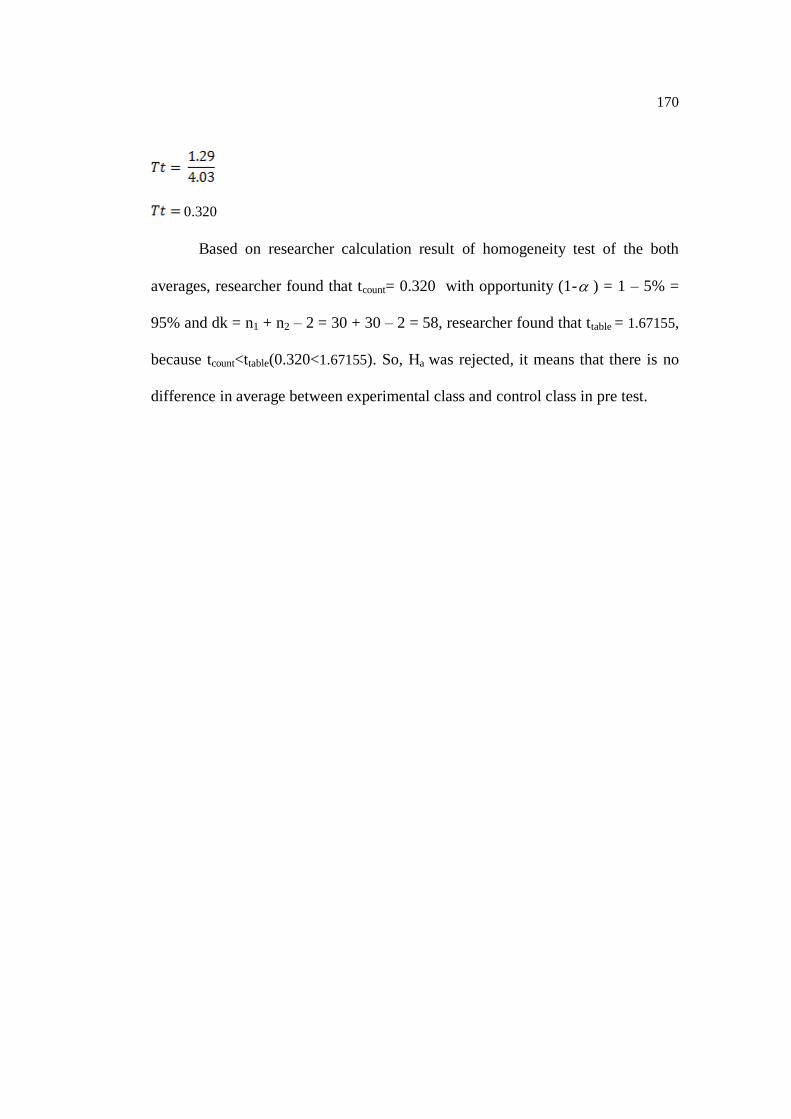
170
0.320
Based on researcher calculation result of homogeneity test of the both
averages, researcher found that tcount= 0.320 with opportunity (1- ) = 1 – 5% =
95% and dk = n1 + n2 – 2 = 30 + 30 – 2 = 58, researcher found that ttable = 1.67155,
because tcount<ttable(0.320<1.67155). So, Ha was rejected, it means that there is no
difference in average between experimental class and control class in pre test.
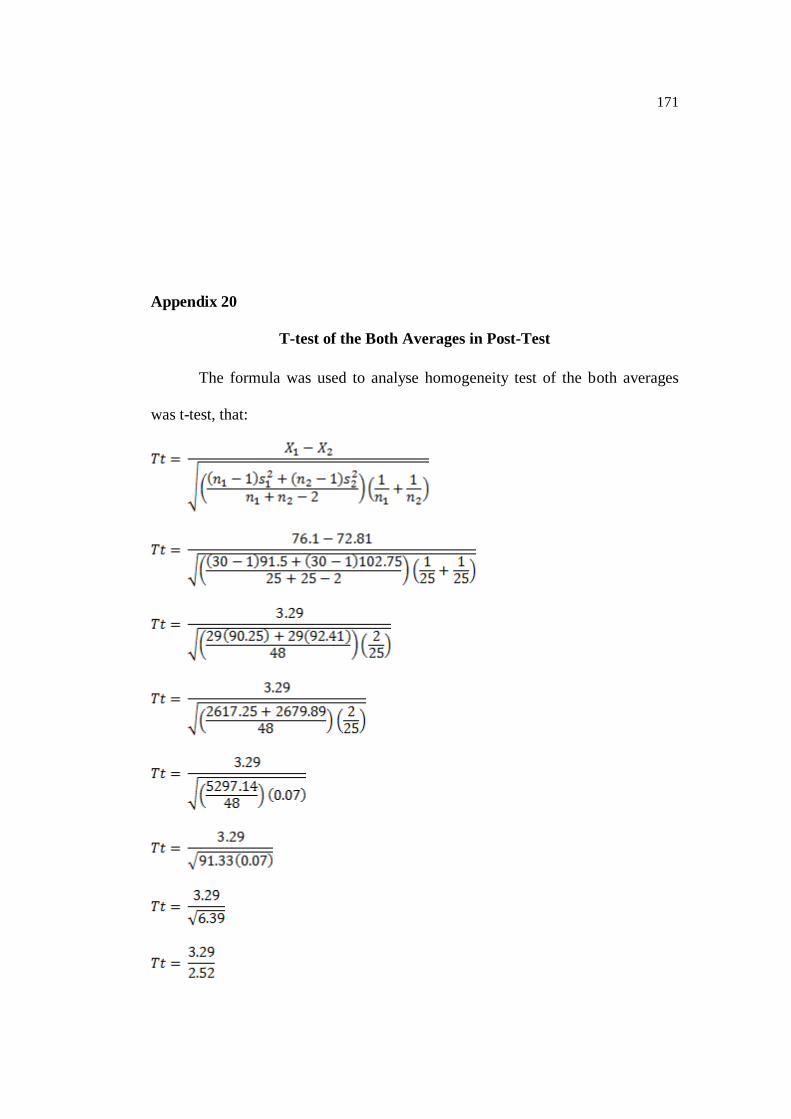
171
Appendix 20
T-test of the Both Averages in Post-Test
The formula was used to analyse homogeneity test of the both averages
was t-test, that:
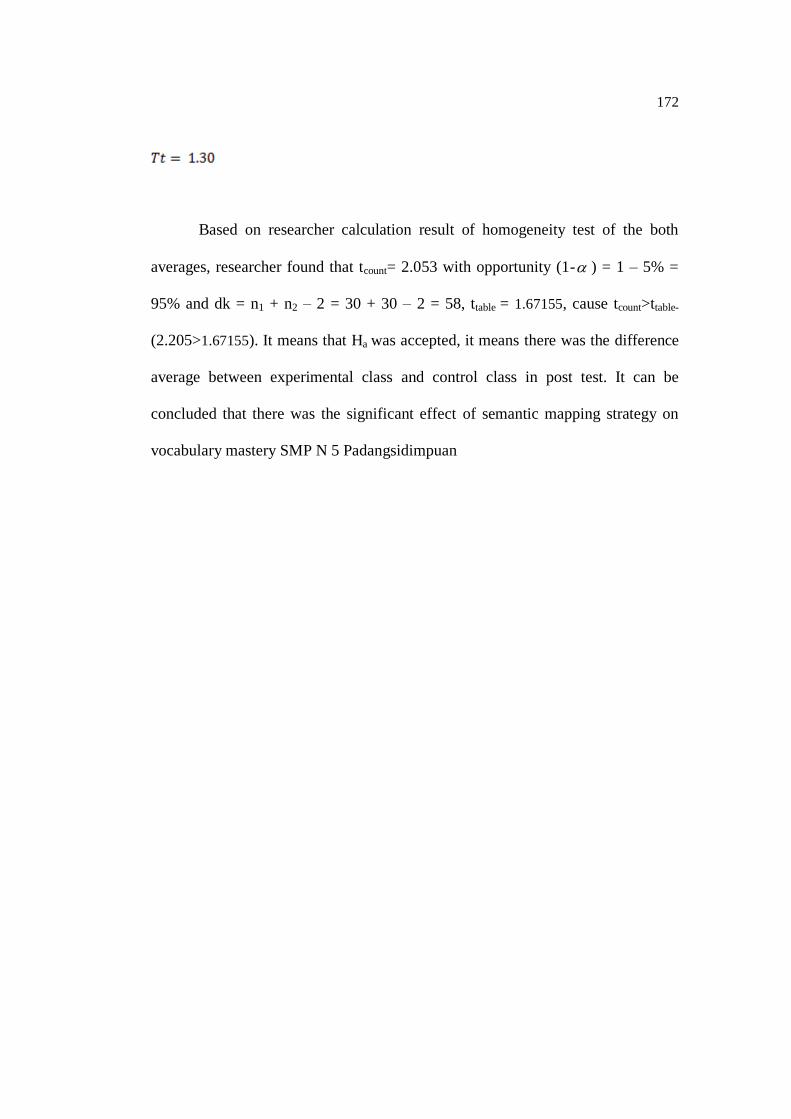
172
Based on researcher calculation result of homogeneity test of the both
averages, researcher found that tcount= 2.053 with opportunity (1- ) = 1 – 5% =
95% and dk = n1 + n2 – 2 = 30 + 30 – 2 = 58, ttable = 1.67155, cause tcount>ttable-
(2.205>1.67155). It means that Ha was accepted, it means there was the difference
average between experimental class and control class in post test. It can be
concluded that there was the significant effect of semantic mapping strategy on
vocabulary mastery SMP N 5 Padangsidimpuan
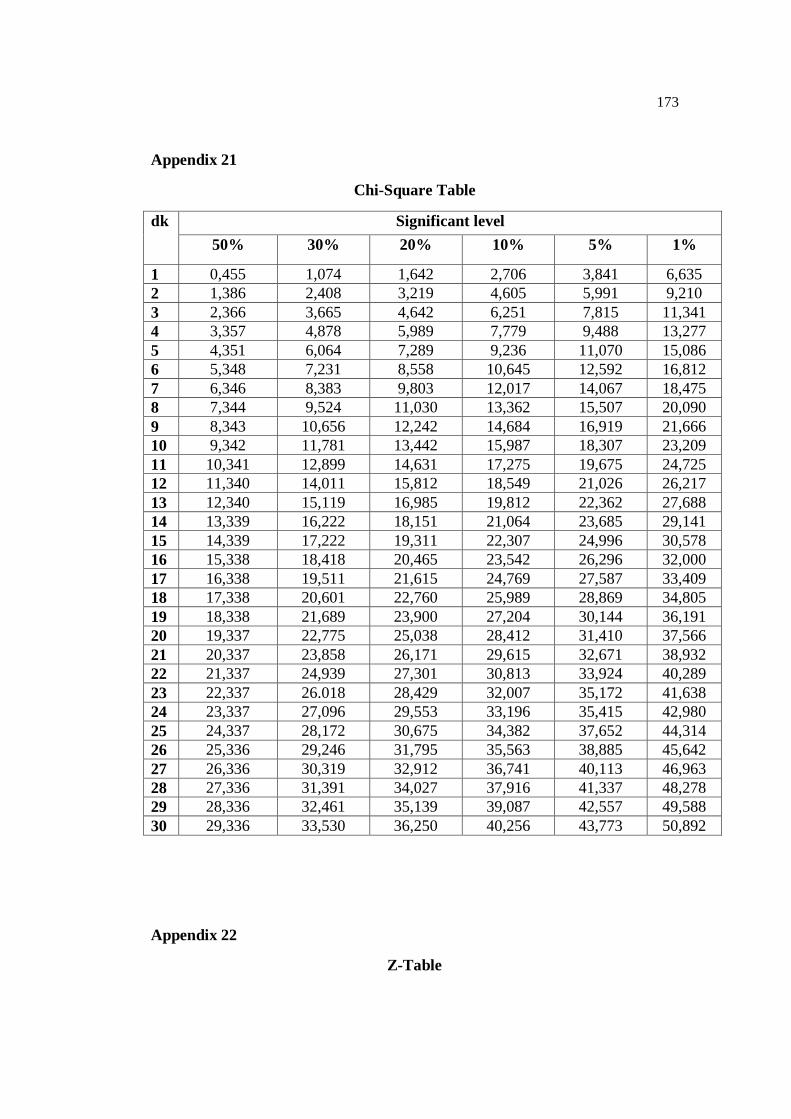
173
Appendix 21
Chi-Square Table
dk Significant level
50% 30% 20% 10% 5% 1%
1 0,455 1,074 1,642 2,706 3,841 6,635
2 1,386 2,408 3,219 4,605 5,991 9,210
3 2,366 3,665 4,642 6,251 7,815 11,341
4 3,357 4,878 5,989 7,779 9,488 13,277
5 4,351 6,064 7,289 9,236 11,070 15,086
6 5,348 7,231 8,558 10,645 12,592 16,812
7 6,346 8,383 9,803 12,017 14,067 18,475
8 7,344 9,524 11,030 13,362 15,507 20,090
9 8,343 10,656 12,242 14,684 16,919 21,666
10 9,342 11,781 13,442 15,987 18,307 23,209
11 10,341 12,899 14,631 17,275 19,675 24,725
12 11,340 14,011 15,812 18,549 21,026 26,217
13 12,340 15,119 16,985 19,812 22,362 27,688
14 13,339 16,222 18,151 21,064 23,685 29,141
15 14,339 17,222 19,311 22,307 24,996 30,578
16 15,338 18,418 20,465 23,542 26,296 32,000
17 16,338 19,511 21,615 24,769 27,587 33,409
18 17,338 20,601 22,760 25,989 28,869 34,805
19 18,338 21,689 23,900 27,204 30,144 36,191
20 19,337 22,775 25,038 28,412 31,410 37,566
21 20,337 23,858 26,171 29,615 32,671 38,932
22 21,337 24,939 27,301 30,813 33,924 40,289
23 22,337 26.018 28,429 32,007 35,172 41,638
24 23,337 27,096 29,553 33,196 35,415 42,980
25 24,337 28,172 30,675 34,382 37,652 44,314
26 25,336 29,246 31,795 35,563 38,885 45,642
27 26,336 30,319 32,912 36,741 40,113 46,963
28 27,336 31,391 34,027 37,916 41,337 48,278
29 28,336 32,461 35,139 39,087 42,557 49,588
30 29,336 33,530 36,250 40,256 43,773 50,892
Appendix 22
Z-Table
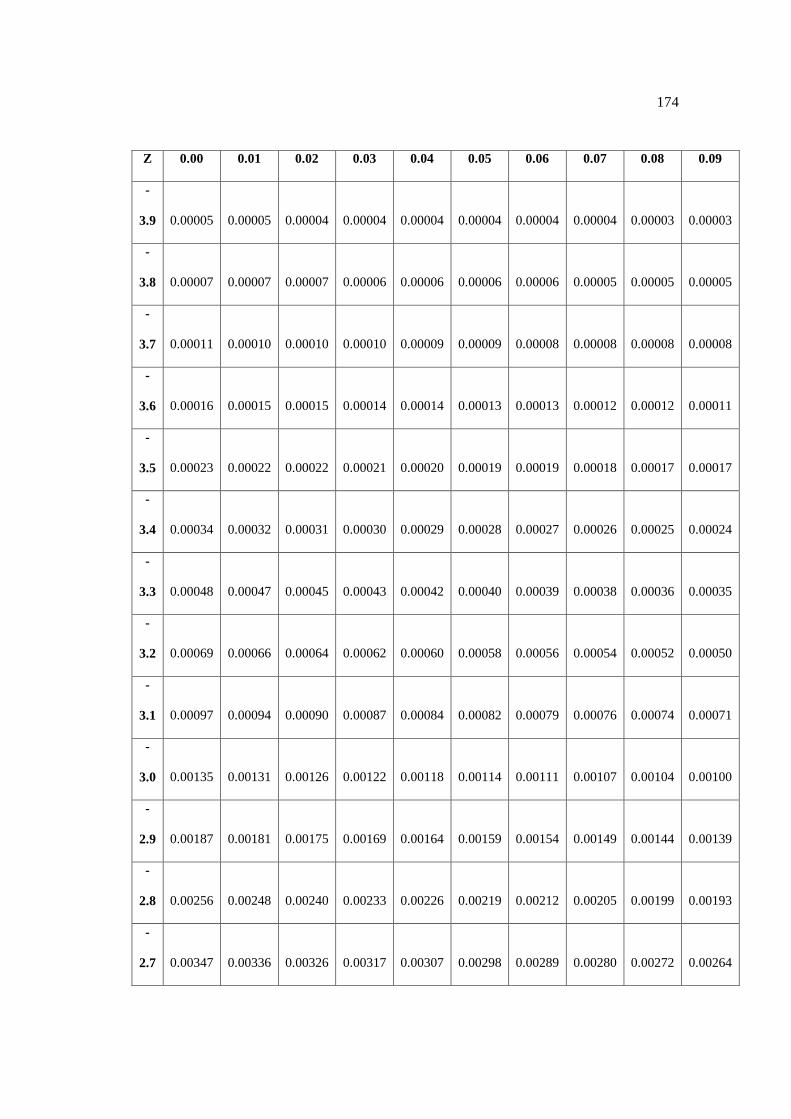
174
Z 0.00 0.01 0.02 0.03 0.04 0.05 0.06 0.07 0.08 0.09
-
3.9 0.00005 0.00005 0.00004 0.00004 0.00004 0.00004 0.00004 0.00004 0.00003 0.00003
-
3.8 0.00007 0.00007 0.00007 0.00006 0.00006 0.00006 0.00006 0.00005 0.00005 0.00005
-
3.7 0.00011 0.00010 0.00010 0.00010 0.00009 0.00009 0.00008 0.00008 0.00008 0.00008
-
3.6 0.00016 0.00015 0.00015 0.00014 0.00014 0.00013 0.00013 0.00012 0.00012 0.00011
-
3.5 0.00023 0.00022 0.00022 0.00021 0.00020 0.00019 0.00019 0.00018 0.00017 0.00017
-
3.4 0.00034 0.00032 0.00031 0.00030 0.00029 0.00028 0.00027 0.00026 0.00025 0.00024
-
3.3 0.00048 0.00047 0.00045 0.00043 0.00042 0.00040 0.00039 0.00038 0.00036 0.00035
-
3.2 0.00069 0.00066 0.00064 0.00062 0.00060 0.00058 0.00056 0.00054 0.00052 0.00050
-
3.1 0.00097 0.00094 0.00090 0.00087 0.00084 0.00082 0.00079 0.00076 0.00074 0.00071
-
3.0 0.00135 0.00131 0.00126 0.00122 0.00118 0.00114 0.00111 0.00107 0.00104 0.00100
-
2.9 0.00187 0.00181 0.00175 0.00169 0.00164 0.00159 0.00154 0.00149 0.00144 0.00139
-
2.8 0.00256 0.00248 0.00240 0.00233 0.00226 0.00219 0.00212 0.00205 0.00199 0.00193
-
2.7 0.00347 0.00336 0.00326 0.00317 0.00307 0.00298 0.00289 0.00280 0.00272 0.00264
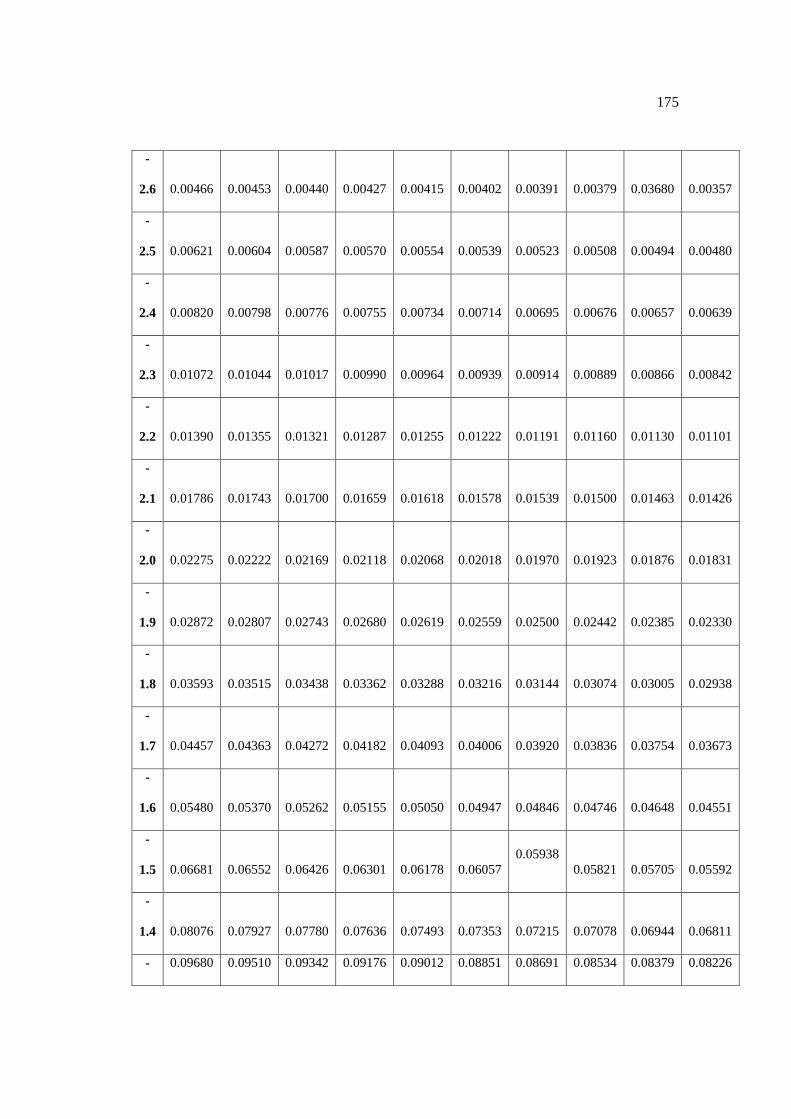
175
-
2.6 0.00466 0.00453 0.00440 0.00427 0.00415 0.00402 0.00391 0.00379 0.03680 0.00357
-
2.5 0.00621 0.00604 0.00587 0.00570 0.00554 0.00539 0.00523 0.00508 0.00494 0.00480
-
2.4 0.00820 0.00798 0.00776 0.00755 0.00734 0.00714 0.00695 0.00676 0.00657 0.00639
-
2.3 0.01072 0.01044 0.01017 0.00990 0.00964 0.00939 0.00914 0.00889 0.00866 0.00842
-
2.2 0.01390 0.01355 0.01321 0.01287 0.01255 0.01222 0.01191 0.01160 0.01130 0.01101
-
2.1 0.01786 0.01743 0.01700 0.01659 0.01618 0.01578 0.01539 0.01500 0.01463 0.01426
-
2.0 0.02275 0.02222 0.02169 0.02118 0.02068 0.02018 0.01970 0.01923 0.01876 0.01831
-
1.9 0.02872 0.02807 0.02743 0.02680 0.02619 0.02559 0.02500 0.02442 0.02385 0.02330
-
1.8 0.03593 0.03515 0.03438 0.03362 0.03288 0.03216 0.03144 0.03074 0.03005 0.02938
-
1.7 0.04457 0.04363 0.04272 0.04182 0.04093 0.04006 0.03920 0.03836 0.03754 0.03673
-
1.6 0.05480 0.05370 0.05262 0.05155 0.05050 0.04947 0.04846 0.04746 0.04648 0.04551
-
1.5 0.06681 0.06552 0.06426 0.06301 0.06178 0.06057
0.05938
0.05821 0.05705 0.05592
-
1.4 0.08076 0.07927 0.07780 0.07636 0.07493 0.07353 0.07215 0.07078 0.06944 0.06811
- 0.09680 0.09510 0.09342 0.09176 0.09012 0.08851 0.08691 0.08534 0.08379 0.08226
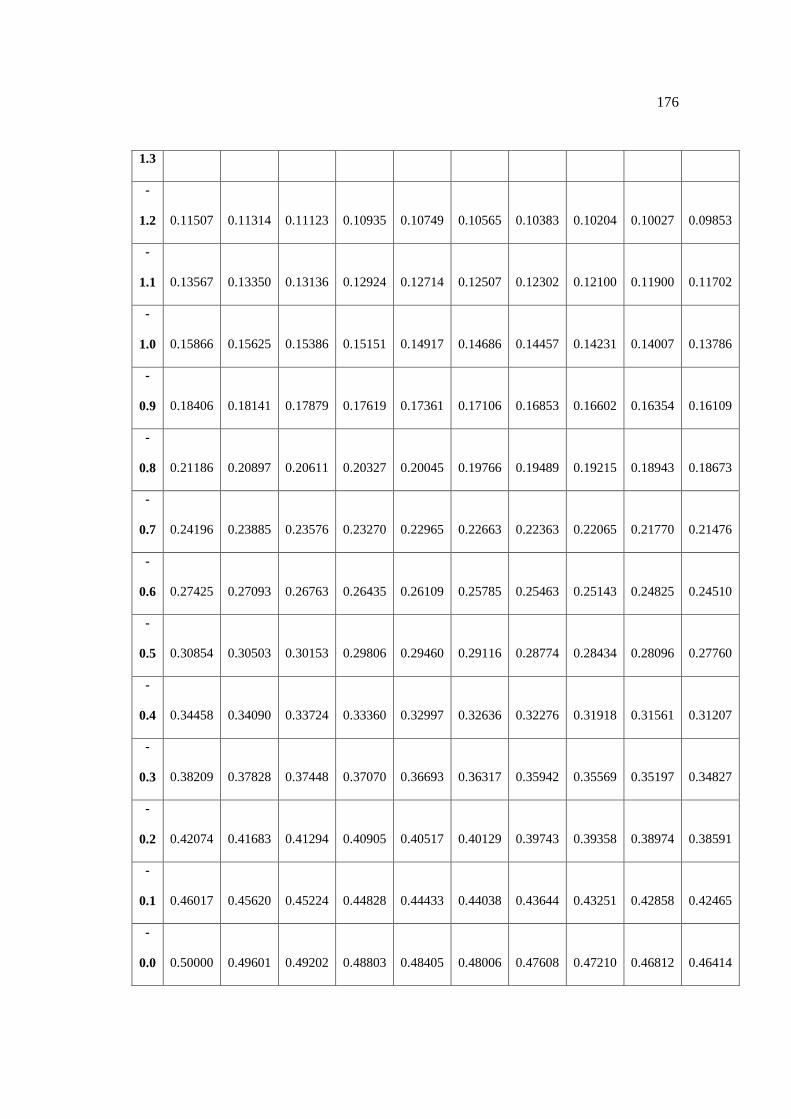
176
1.3
-
1.2 0.11507 0.11314 0.11123 0.10935 0.10749 0.10565 0.10383 0.10204 0.10027 0.09853
-
1.1 0.13567 0.13350 0.13136 0.12924 0.12714 0.12507 0.12302 0.12100 0.11900 0.11702
-
1.0 0.15866 0.15625 0.15386 0.15151 0.14917 0.14686 0.14457 0.14231 0.14007 0.13786
-
0.9 0.18406 0.18141 0.17879 0.17619 0.17361 0.17106 0.16853 0.16602 0.16354 0.16109
-
0.8 0.21186 0.20897 0.20611 0.20327 0.20045 0.19766 0.19489 0.19215 0.18943 0.18673
-
0.7 0.24196 0.23885 0.23576 0.23270 0.22965 0.22663 0.22363 0.22065 0.21770 0.21476
-
0.6 0.27425 0.27093 0.26763 0.26435 0.26109 0.25785 0.25463 0.25143 0.24825 0.24510
-
0.5 0.30854 0.30503 0.30153 0.29806 0.29460 0.29116 0.28774 0.28434 0.28096 0.27760
-
0.4 0.34458 0.34090 0.33724 0.33360 0.32997 0.32636 0.32276 0.31918 0.31561 0.31207
-
0.3 0.38209 0.37828 0.37448 0.37070 0.36693 0.36317 0.35942 0.35569 0.35197 0.34827
-
0.2 0.42074 0.41683 0.41294 0.40905 0.40517 0.40129 0.39743 0.39358 0.38974 0.38591
-
0.1 0.46017 0.45620 0.45224 0.44828 0.44433 0.44038 0.43644 0.43251 0.42858 0.42465
-
0.0 0.50000 0.49601 0.49202 0.48803 0.48405 0.48006 0.47608 0.47210 0.46812 0.46414
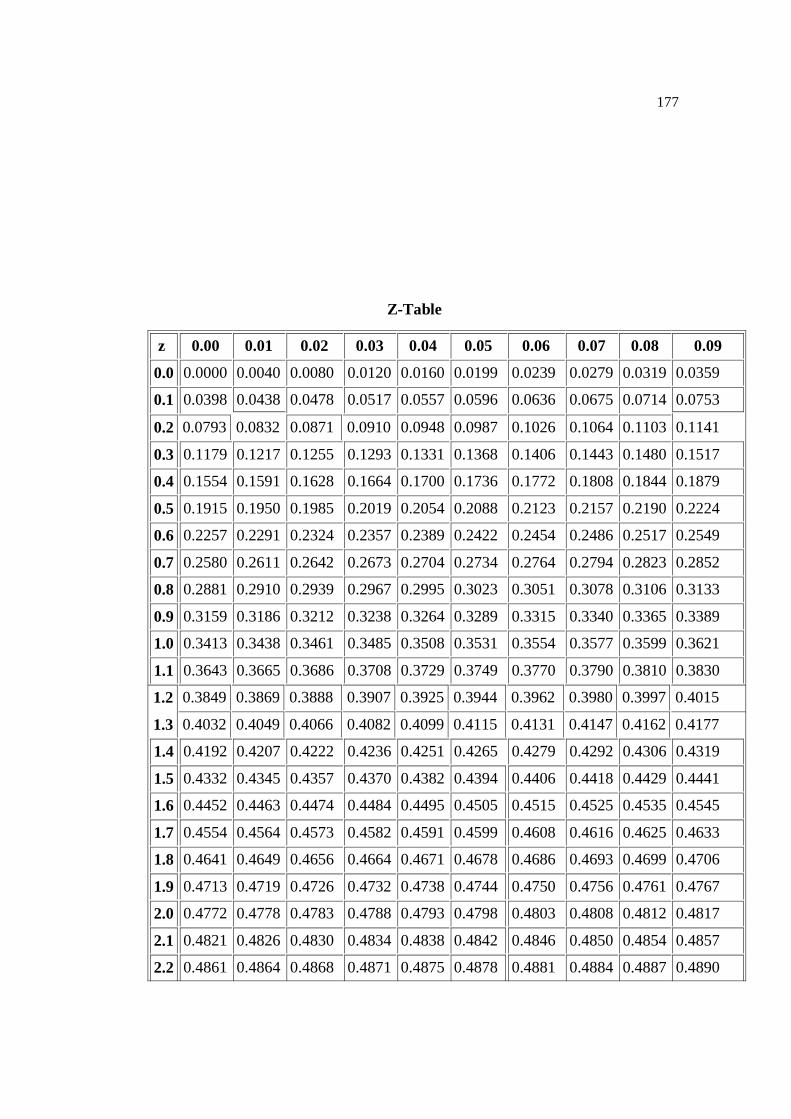
177
Z-Table
z 0.00 0.01 0.02 0.03 0.04 0.05 0.06 0.07 0.08 0.09
0.0 0.0000 0.0040 0.0080 0.0120 0.0160 0.0199 0.0239 0.0279 0.0319 0.0359
0.1 0.0398 0.0438 0.0478 0.0517 0.0557 0.0596 0.0636 0.0675 0.0714 0.0753
0.2 0.0793 0.0832 0.0871 0.0910 0.0948 0.0987 0.1026 0.1064 0.1103 0.1141
0.3 0.1179 0.1217 0.1255 0.1293 0.1331 0.1368 0.1406 0.1443 0.1480 0.1517
0.4 0.1554 0.1591 0.1628 0.1664 0.1700 0.1736 0.1772 0.1808 0.1844 0.1879
0.5 0.1915 0.1950 0.1985 0.2019 0.2054 0.2088 0.2123 0.2157 0.2190 0.2224
0.6 0.2257 0.2291 0.2324 0.2357 0.2389 0.2422 0.2454 0.2486 0.2517 0.2549
0.7 0.2580 0.2611 0.2642 0.2673 0.2704 0.2734 0.2764 0.2794 0.2823 0.2852
0.8 0.2881 0.2910 0.2939 0.2967 0.2995 0.3023 0.3051 0.3078 0.3106 0.3133
0.9 0.3159 0.3186 0.3212 0.3238 0.3264 0.3289 0.3315 0.3340 0.3365 0.3389
1.0 0.3413 0.3438 0.3461 0.3485 0.3508 0.3531 0.3554 0.3577 0.3599 0.3621
1.1 0.3643 0.3665 0.3686 0.3708 0.3729 0.3749 0.3770 0.3790 0.3810 0.3830
1.2 0.3849 0.3869 0.3888 0.3907 0.3925 0.3944 0.3962 0.3980 0.3997 0.4015
1.3 0.4032 0.4049 0.4066 0.4082 0.4099 0.4115 0.4131 0.4147 0.4162 0.4177
1.4 0.4192 0.4207 0.4222 0.4236 0.4251 0.4265 0.4279 0.4292 0.4306 0.4319
1.5 0.4332 0.4345 0.4357 0.4370 0.4382 0.4394 0.4406 0.4418 0.4429 0.4441
1.6 0.4452 0.4463 0.4474 0.4484 0.4495 0.4505 0.4515 0.4525 0.4535 0.4545
1.7 0.4554 0.4564 0.4573 0.4582 0.4591 0.4599 0.4608 0.4616 0.4625 0.4633
1.8 0.4641 0.4649 0.4656 0.4664 0.4671 0.4678 0.4686 0.4693 0.4699 0.4706
1.9 0.4713 0.4719 0.4726 0.4732 0.4738 0.4744 0.4750 0.4756 0.4761 0.4767
2.0 0.4772 0.4778 0.4783 0.4788 0.4793 0.4798 0.4803 0.4808 0.4812 0.4817
2.1 0.4821 0.4826 0.4830 0.4834 0.4838 0.4842 0.4846 0.4850 0.4854 0.4857
2.2 0.4861 0.4864 0.4868 0.4871 0.4875 0.4878 0.4881 0.4884 0.4887 0.4890
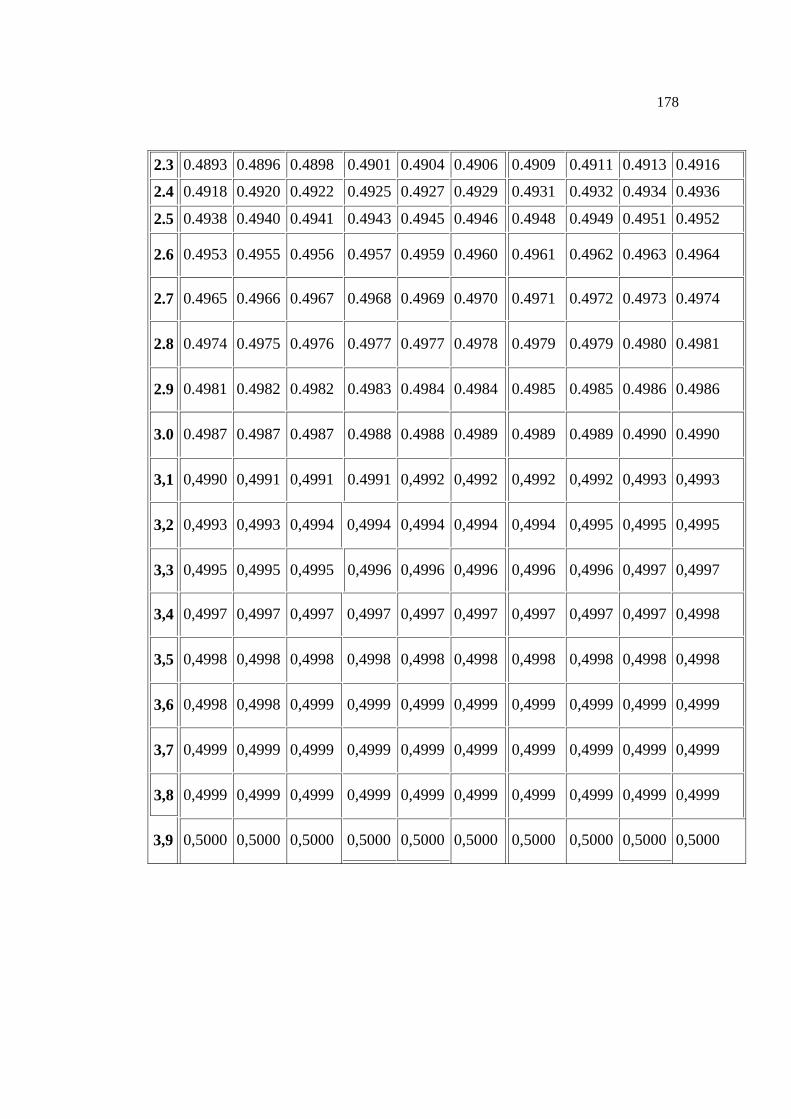
178
2.3 0.4893 0.4896 0.4898 0.4901 0.4904 0.4906 0.4909 0.4911 0.4913 0.4916
2.4 0.4918 0.4920 0.4922 0.4925 0.4927 0.4929 0.4931 0.4932 0.4934 0.4936
2.5 0.4938 0.4940 0.4941 0.4943 0.4945 0.4946 0.4948 0.4949 0.4951 0.4952
2.6 0.4953 0.4955 0.4956 0.4957 0.4959 0.4960 0.4961 0.4962 0.4963 0.4964
2.7 0.4965 0.4966 0.4967 0.4968 0.4969 0.4970 0.4971 0.4972 0.4973 0.4974
2.8 0.4974 0.4975 0.4976 0.4977 0.4977 0.4978 0.4979 0.4979 0.4980 0.4981
2.9 0.4981 0.4982 0.4982 0.4983 0.4984 0.4984 0.4985 0.4985 0.4986 0.4986
3.0 0.4987 0.4987 0.4987 0.4988 0.4988 0.4989 0.4989 0.4989 0.4990 0.4990
3,1 0,4990 0,4991 0,4991 0.4991 0,4992 0,4992 0,4992 0,4992 0,4993 0,4993
3,2 0,4993 0,4993 0,4994 0,4994 0,4994 0,4994 0,4994 0,4995 0,4995 0,4995
3,3 0,4995 0,4995 0,4995 0,4996 0,4996 0,4996 0,4996 0,4996 0,4997 0,4997
3,4 0,4997 0,4997 0,4997 0,4997 0,4997 0,4997 0,4997 0,4997 0,4997 0,4998
3,5 0,4998 0,4998 0,4998 0,4998 0,4998 0,4998 0,4998 0,4998 0,4998 0,4998
3,6 0,4998 0,4998 0,4999 0,4999 0,4999 0,4999 0,4999 0,4999 0,4999 0,4999
3,7 0,4999 0,4999 0,4999 0,4999 0,4999 0,4999 0,4999 0,4999 0,4999 0,4999
3,8 0,4999 0,4999 0,4999 0,4999 0,4999 0,4999 0,4999 0,4999 0,4999 0,4999
3,9 0,5000 0,5000 0,5000 0,5000 0,5000 0,5000 0,5000 0,5000 0,5000 0,5000
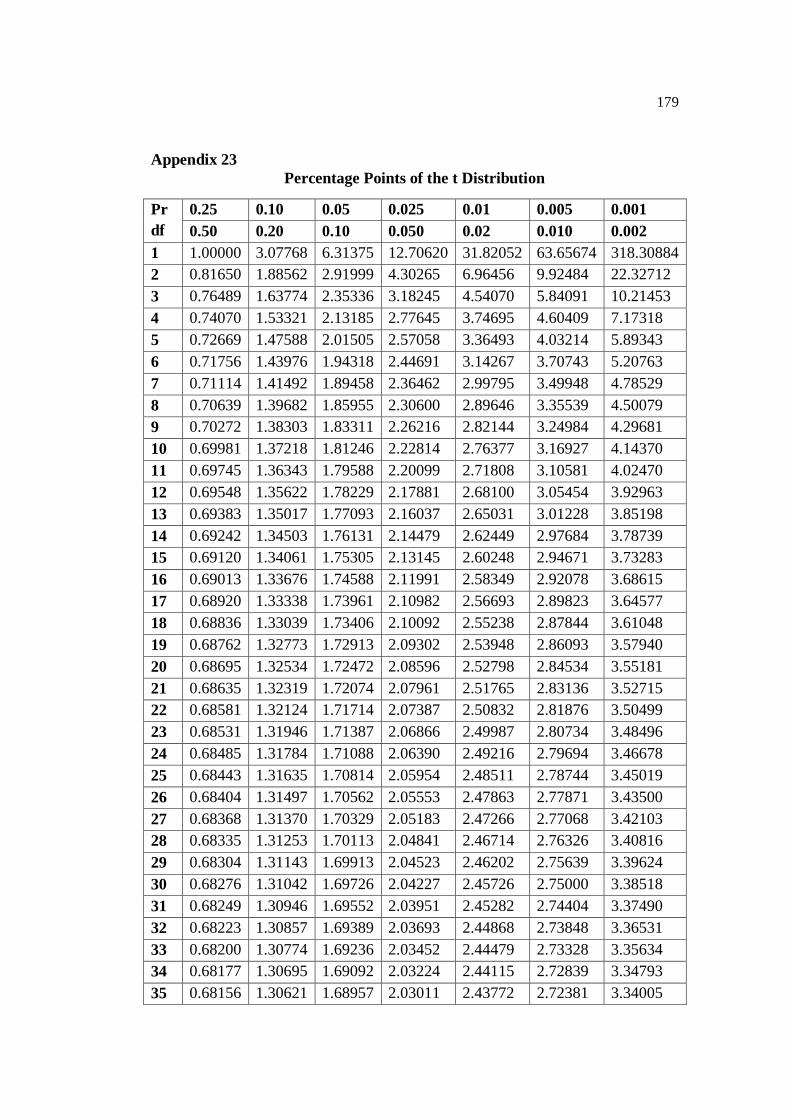
179
Appendix 23
Percentage Points of the t Distribution
Pr
df
0.25 0.10 0.05 0.025 0.01 0.005 0.001
0.50 0.20 0.10 0.050 0.02 0.010 0.002
1 1.00000 3.07768 6.31375 12.70620 31.82052 63.65674 318.30884
2 0.81650 1.88562 2.91999 4.30265 6.96456 9.92484 22.32712
3 0.76489 1.63774 2.35336 3.18245 4.54070 5.84091 10.21453
4 0.74070 1.53321 2.13185 2.77645 3.74695 4.60409 7.17318
5 0.72669 1.47588 2.01505 2.57058 3.36493 4.03214 5.89343
6 0.71756 1.43976 1.94318 2.44691 3.14267 3.70743 5.20763
7 0.71114 1.41492 1.89458 2.36462 2.99795 3.49948 4.78529
8 0.70639 1.39682 1.85955 2.30600 2.89646 3.35539 4.50079
9 0.70272 1.38303 1.83311 2.26216 2.82144 3.24984 4.29681
10 0.69981 1.37218 1.81246 2.22814 2.76377 3.16927 4.14370
11 0.69745 1.36343 1.79588 2.20099 2.71808 3.10581 4.02470
12 0.69548 1.35622 1.78229 2.17881 2.68100 3.05454 3.92963
13 0.69383 1.35017 1.77093 2.16037 2.65031 3.01228 3.85198
14 0.69242 1.34503 1.76131 2.14479 2.62449 2.97684 3.78739
15 0.69120 1.34061 1.75305 2.13145 2.60248 2.94671 3.73283
16 0.69013 1.33676 1.74588 2.11991 2.58349 2.92078 3.68615
17 0.68920 1.33338 1.73961 2.10982 2.56693 2.89823 3.64577
18 0.68836 1.33039 1.73406 2.10092 2.55238 2.87844 3.61048
19 0.68762 1.32773 1.72913 2.09302 2.53948 2.86093 3.57940
20 0.68695 1.32534 1.72472 2.08596 2.52798 2.84534 3.55181
21 0.68635 1.32319 1.72074 2.07961 2.51765 2.83136 3.52715
22 0.68581 1.32124 1.71714 2.07387 2.50832 2.81876 3.50499
23 0.68531 1.31946 1.71387 2.06866 2.49987 2.80734 3.48496
24 0.68485 1.31784 1.71088 2.06390 2.49216 2.79694 3.46678
25 0.68443 1.31635 1.70814 2.05954 2.48511 2.78744 3.45019
26 0.68404 1.31497 1.70562 2.05553 2.47863 2.77871 3.43500
27 0.68368 1.31370 1.70329 2.05183 2.47266 2.77068 3.42103
28 0.68335 1.31253 1.70113 2.04841 2.46714 2.76326 3.40816
29 0.68304 1.31143 1.69913 2.04523 2.46202 2.75639 3.39624
30 0.68276 1.31042 1.69726 2.04227 2.45726 2.75000 3.38518
31 0.68249 1.30946 1.69552 2.03951 2.45282 2.74404 3.37490
32 0.68223 1.30857 1.69389 2.03693 2.44868 2.73848 3.36531
33 0.68200 1.30774 1.69236 2.03452 2.44479 2.73328 3.35634
34 0.68177 1.30695 1.69092 2.03224 2.44115 2.72839 3.34793
35 0.68156 1.30621 1.68957 2.03011 2.43772 2.72381 3.34005
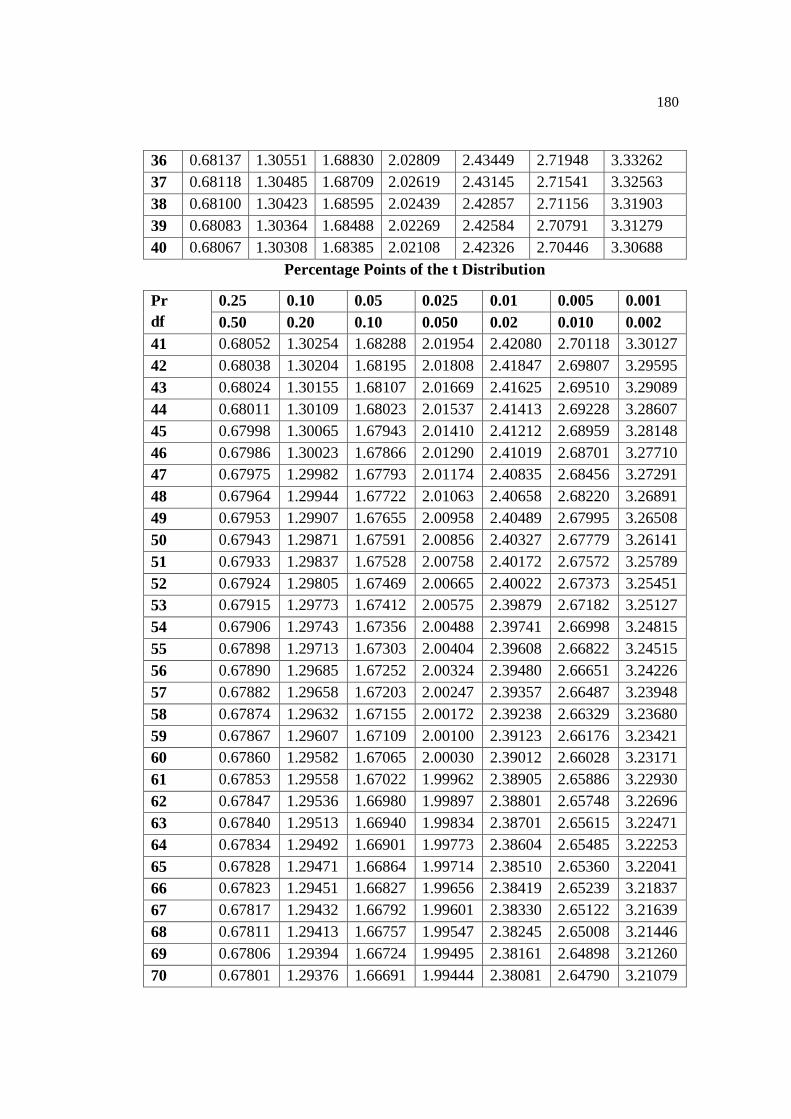
180
36 0.68137 1.30551 1.68830 2.02809 2.43449 2.71948 3.33262
37 0.68118 1.30485 1.68709 2.02619 2.43145 2.71541 3.32563
38 0.68100 1.30423 1.68595 2.02439 2.42857 2.71156 3.31903
39 0.68083 1.30364 1.68488 2.02269 2.42584 2.70791 3.31279
40 0.68067 1.30308 1.68385 2.02108 2.42326 2.70446 3.30688
Percentage Points of the t Distribution
Pr
df
0.25 0.10 0.05 0.025 0.01 0.005 0.001
0.50 0.20 0.10 0.050 0.02 0.010 0.002
41 0.68052 1.30254 1.68288 2.01954 2.42080 2.70118 3.30127
42 0.68038 1.30204 1.68195 2.01808 2.41847 2.69807 3.29595
43 0.68024 1.30155 1.68107 2.01669 2.41625 2.69510 3.29089
44 0.68011 1.30109 1.68023 2.01537 2.41413 2.69228 3.28607
45 0.67998 1.30065 1.67943 2.01410 2.41212 2.68959 3.28148
46 0.67986 1.30023 1.67866 2.01290 2.41019 2.68701 3.27710
47 0.67975 1.29982 1.67793 2.01174 2.40835 2.68456 3.27291
48 0.67964 1.29944 1.67722 2.01063 2.40658 2.68220 3.26891
49 0.67953 1.29907 1.67655 2.00958 2.40489 2.67995 3.26508
50 0.67943 1.29871 1.67591 2.00856 2.40327 2.67779 3.26141
51 0.67933 1.29837 1.67528 2.00758 2.40172 2.67572 3.25789
52 0.67924 1.29805 1.67469 2.00665 2.40022 2.67373 3.25451
53 0.67915 1.29773 1.67412 2.00575 2.39879 2.67182 3.25127
54 0.67906 1.29743 1.67356 2.00488 2.39741 2.66998 3.24815
55 0.67898 1.29713 1.67303 2.00404 2.39608 2.66822 3.24515
56 0.67890 1.29685 1.67252 2.00324 2.39480 2.66651 3.24226
57 0.67882 1.29658 1.67203 2.00247 2.39357 2.66487 3.23948
58 0.67874 1.29632 1.67155 2.00172 2.39238 2.66329 3.23680
59 0.67867 1.29607 1.67109 2.00100 2.39123 2.66176 3.23421
60 0.67860 1.29582 1.67065 2.00030 2.39012 2.66028 3.23171
61 0.67853 1.29558 1.67022 1.99962 2.38905 2.65886 3.22930
62 0.67847 1.29536 1.66980 1.99897 2.38801 2.65748 3.22696
63 0.67840 1.29513 1.66940 1.99834 2.38701 2.65615 3.22471
64 0.67834 1.29492 1.66901 1.99773 2.38604 2.65485 3.22253
65 0.67828 1.29471 1.66864 1.99714 2.38510 2.65360 3.22041
66 0.67823 1.29451 1.66827 1.99656 2.38419 2.65239 3.21837
67 0.67817 1.29432 1.66792 1.99601 2.38330 2.65122 3.21639
68 0.67811 1.29413 1.66757 1.99547 2.38245 2.65008 3.21446
69 0.67806 1.29394 1.66724 1.99495 2.38161 2.64898 3.21260
70 0.67801 1.29376 1.66691 1.99444 2.38081 2.64790 3.21079
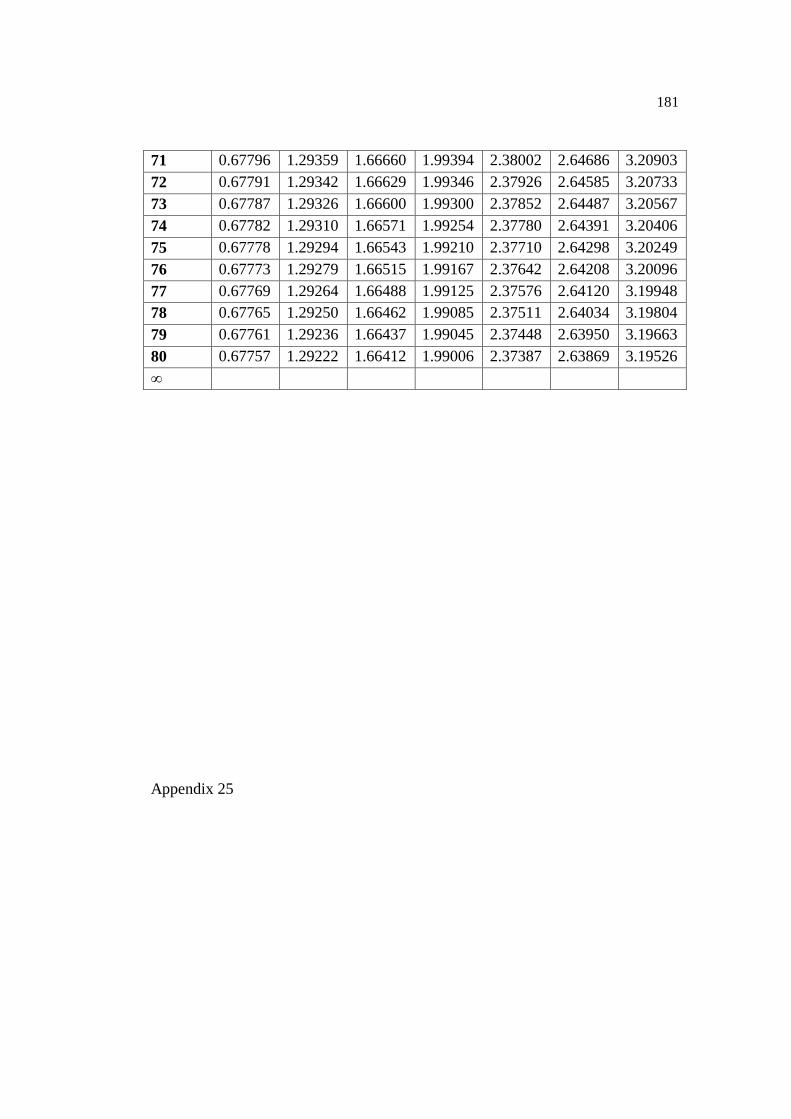
181
71 0.67796 1.29359 1.66660 1.99394 2.38002 2.64686 3.20903
72 0.67791 1.29342 1.66629 1.99346 2.37926 2.64585 3.20733
73 0.67787 1.29326 1.66600 1.99300 2.37852 2.64487 3.20567
74 0.67782 1.29310 1.66571 1.99254 2.37780 2.64391 3.20406
75 0.67778 1.29294 1.66543 1.99210 2.37710 2.64298 3.20249
76 0.67773 1.29279 1.66515 1.99167 2.37642 2.64208 3.20096
77 0.67769 1.29264 1.66488 1.99125 2.37576 2.64120 3.19948
78 0.67765 1.29250 1.66462 1.99085 2.37511 2.64034 3.19804
79 0.67761 1.29236 1.66437 1.99045 2.37448 2.63950 3.19663
80 0.67757 1.29222 1.66412 1.99006 2.37387 2.63869 3.19526
∞
Appendix 25
182
183
Related Documents