Welcome message from author
This document is posted to help you gain knowledge. Please leave a comment to let me know what you think about it! Share it to your friends and learn new things together.
Transcript

TABLE OF CONTENTS
INTRODUCTION ............................................................................................................................................................. 1 DATA COLLECTION..................................................................................................................................................... 1 EXISTING CONDITIONS.............................................................................................................................................. 4
Area 1 (Commercial/Residential Border) ................................................................................................. 4 Area 2 (Glashaus Area)............................................................................................................................. 6 Residential Parking ................................................................................................................................... 8 Off-Street Parking................................................................................................................................... 10 Facility Manager Interviews ................................................................................................................... 11 Intercept Survey ...................................................................................................................................... 11 Phase 2 - ExpandedParking Study Area ................................................................................................. 12 Phase 2 Expanded Area Findings............................................................................................................ 19 Summary of Existing Conditions............................................................................................................ 20
PARKING MANAGEMENT PLAN ......................................................................................................................... 22
Plan Goals ............................................................................................................................................... 22 Recommendations................................................................................................................................... 22 Plan Format............................................................................................................................................. 23
PARKING MANAGEMENT PLAN RECOMMENDATIONS.......................................................................... 28
Variable On-Street Pricing...................................................................................................................... 28 Short Term Parking Area ........................................................................................................................ 29 Long Term Parking Area ........................................................................................................................ 29 Residential Parking Permit Program....................................................................................................... 29 Hollis Street Bus Corridor....................................................................................................................... 30 North Hollis Industrial Area ................................................................................................................... 30
PARKING MANAGEMENT PLAN PHASING.................................................................................................... 31
1. Implement Pricing – Short Term Areas ............................................................................................. 31 2. Monitoring & Adjustment.................................................................................................................. 31 3. Implement Pricing – Long Term Areas ............................................................................................. 31 4. Monitor Residential Spillover............................................................................................................ 32
IMPLEMENTATION STEPS ...................................................................................................................................... 32
Parking Pricing Program......................................................................................................................... 32 Residential Permit Parking Program....................................................................................................... 33 Parking Monitoring and Adjustment....................................................................................................... 34
PARKING MANAGEMENT PLAN COSTS AND REVENUES..................................................................... 35
Enforcement, Maintenance and Administration Costs............................................................................ 37 Third Party Costs .................................................................................................................................... 38 In-Pavement Sensors............................................................................................................................... 38
List of Tables Table 1. Commercial/Residential Border Area On-Street Occupancy...................................................................... 4 Table 2. Glashaus Area On-Street Occupancy .............................................................................................................. 6 Table 3. Residential Area Occupancy .............................................................................................................................. 8 Table 4. Midday Off-Street Occupancy ........................................................................................................................ 10 Table 5: Parking Supply and Base Utilization ............................................................................................................. 12
EMERYVILLE PARKING STUDY WILBUR SMITH ASSOCIATES
TOC - 1
TABLE OF CONTENTS
Table 6: License Plate Observations and Assumed User Types .............................................................................. 14 Table 7: Observed Hot Spot Occupancies................................................................................................................. 16 Table 8: User Types by Percentage of Unique Vehicle Observations .................................................................... 16 Table 9. User Profiles...................................................................................................................................................... 19 Table 10. Parking Management Solutions Matrix........................................................................................................ 25 Table 10. Parking Management Solutions Matrix Continued.................................................................................... 26 Table 10. Parking Management Solutions Glossary.................................................................................................... 27 Table 11. On-Street Variable Pricing Plan.................................................................................................................... 29 Table 12. City of Emeryville Parking Operating Budget- 69% Occupancy Assumption ..................................... 36 Table 13. Annualized Labor Costs for Recommended Parking Management Alternative................................... 37 Table 14. Third Party Fees ............................................................................................................................................. 38 Table 15. Sensors Installations & Service Cost– Short Term Parking ..................................................................... 38 List of Figures Figure 1 Study Area ............................................................................................................................................................ 3 Figure 2: Parking Occupancies Time Series Progression: Area 1 ............................................................................... 5 Figure 3: Parking Occupancies Time Series Progression: Area 2 ............................................................................... 7 Figure 4: Parking Occupancies Time Series Progression: Residential Area .............................................................. 9 Figure 5. Parking Occupancy – Study Addendum Area............................................................................................. 13 Figure 6. Parking Hotspots ............................................................................................................................................. 15 Figure 7. Parking Occupancy by Time Period ............................................................................................................. 17 Figure 8. Parking User Types.......................................................................................................................................... 18 Figure 9. Parking Management Plan Map..................................................................................................................... 24 List of Appendices Appendix A Facility Manager Survey Summary Appendix B Intercept Survey Summary Appendix C Parking Study Addendum Appendix D Detailed Cost and Revenue Analysis of Alternatives
EMERYVILLE PARKING STUDY WILBUR SMITH ASSOCIATES
TOC - 2
PARKING POLICY & MANAGEMENT IMPLEMENTATION PLAN
INTRODUCTION The city of Emeryville is small in area (1.2 square miles) and population (8,500), but is one of the most regionally connected cities in the Bay Area. Emeryville is situated at the eastern end of the San Francisco-Oakland Bay Bridge, contains the intersection of Interstate Highway 80 (I-80) with several regional and other interstate highways, and has extensive transportation access by Amtrak Rail, Alameda County (AC) Transit and heavy cargo facilities at the nearby port of Oakland. Emeryville has many large employers and several large shopping areas plus a daytime population that swells to over 20,000. The city’s daily population expansion produces a high volume of vehicles and high parking demand as exhibited by historically high parking occupancies in the North Hollis and Park Avenue areas and significant overflow into residential neighborhoods. In the spring of 2007, the city of Emeryville commissioned a parking study to address current parking problems in the North Hollis District and to develop a set of parking policies, in addition to an implementation management plan that addresses the following goals:
• Reduce solo driving and thus reduce parking demand • Increase parking efficiency and maneuverability • Coordinate and manage parking supply
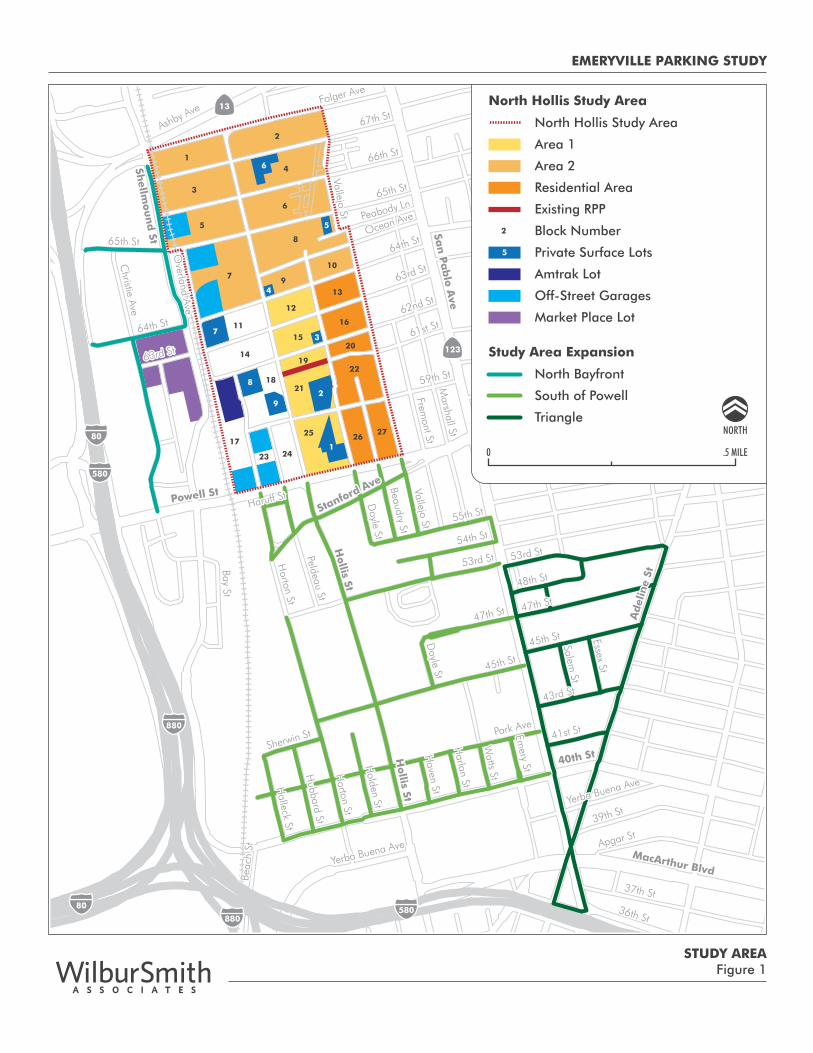
This report summarizes existing parking conditions and outlines the recommendations for parking management in the North Hollis Area and adjacent areas with the aim of improving the efficiency and accessibility of the city’s parking resources. The work was conducted in two distinct phases. Phase 1, initiated in 2007, covered the North Hollis Area and Phase 2, conducted in 2009, covered additional areas of the city south and west of the North Hollis Area as illustrated in Figure 1.
DATA COLLECTION On- and off-street parking utilization data was collected in the North Hollis Study Area in 2007. Phase 1 was conducted during the weeks of June 18th, June 25th and during the week of October 15, 2007. The second and final phase was conducted in April 2009. The intent of Phase 1 data collection was to confirm parking patterns in the commercial residential border area (Area 1) and to capture existing parking patterns in the North Hollis Commercial and Residential Study Areas and to observe the use of on-street and off-street employee parking (Area 2). The data collected describes the occupancy of parking spaces in Area 1, Area 2 and the residential area plus the duration of occupancy of various parking user types (by block face) and the turnover of parking spaces (i.e. the number of vehicles per day that use existing parking spaces).
EMERYVILLE PARKING STUDY WILBUR SMITH ASSOCIATES
Page 1
PARKING POLICY & MANAGEMENT IMPLEMENTATION PLAN
Parking data was collected in Area 2 consisting of license plate counts at 4:00 AM, 10:00 AM, and 3:00 PM, similar to data previously collected for the existing residential area to confirm residential commuter parking usage. Off-street parking data was collected throughout the North Hollis Study Area which included a survey of surface parking lots and parking garages. Additionally, parking facility managers were interviewed to obtain information on the existing parking practices of visitors/residents using off-street facilities, the level of performance, and key issues that parking facility owners/operators are concerned with to improve overall utilization. An intercept survey was conducted to provide an understanding of the North Hollis parking environment. The survey was administered in the commercial and residential areas of the neighborhood to gather information about the public’s attitude and perceptions regarding parking and potential policy solutions for the area. After the Phase 1 data collection effort was completed for the North Hollis Area, three additional subareas were identified for Phase 2 data collection to determine if they would be appropriate for addition to the overall parking management program. These areas included:
Powell Street-40th Street o This subarea encompassed the middle region of the City and is bounded by Powell Street (to
the north), 40th Street (to the south), San Pablo Avenue (to the east), and the railroad tracks (to the west). Commercial and office properties make up the majority of land uses within this subarea, which also includes major employers such as Chiron and Pixar.
Adeline Street-San Pablo Avenue-53rd Street (referred to as the “Triangle”)
o The “Triangle” is located in the southeast quadrant of the City. The subarea is bounded by 53rd Street (to the north), 36th Street (to the south), Adeline Street (to the east), and San Pablo Avenue (to the west). The primary land uses within the subarea include residential properties, and local businesses.
North Bayfront
o The North Bayfront subarea is located in the northwest quadrant of the City, and is bounded by La Coste Street (to the north and west), Powell Avenue (to the south), Christie Avenue and Shellmound Street (to the east). A diverse mixture of land uses are located within the subarea, including multi-family residential buildings, commercial, office, and the Emeryville Market Place retail center.
In total, 185 on-street spaces in Area 1,625 on-street parking spaces in Area 2 (Glashaus Area), 314 in the residential area and 1,012 spaces consisting nine off-street surface parking lots were surveyed in the North Hollis Study Area during Phase 1. An additional 2,253 parking spaces were surveyed in the second data collection phase. The North Hollis Study Area and supplemental subareas are illustrated in Figure 1.
EMERYVILLE PARKING STUDY WILBUR SMITH ASSOCIATES
Page 2
16
5
4
37
8
92
1
2
3
5
7
11
12
13
16
20
22
21
25 2627
14
15
19
18
17
23 24
8
9
10
6
4
Ad
elin
e St
40th St
65th St
65th St
San
Pa
blo
Ave
Powell St
36th St
Stanford Ave
Park Ave
66th St
67th St
Doyle St
Haruff St
63rd St
64th St
47th St
47th St
37th St
Vallejo St
Christie Ave
Ashby Ave
39th St
Apgar St
Folger Ave
53rd St53rd St
Shellm
oun
d St
Fremont St
Ocean Ave
Beaudry St
Bay St
Watts St
Harlan St
48th St
MacArthur Blvd
Peldeau St
Horton St
Hollis St
Holden St
Horton St
Halleck St
Emery StH
ubbard St
Beac
h St
Essex St
Marshall St
Salem St
Overland Ave
Yerba Buena Ave
Sherwin St
Doyle St
45th St
41st St
43rd St
61st St
59th St
62nd St
54th St
Vallejo St
Yerba Buena Ave
45th St
64th St
63rd St
55th St
Haven St
Hollis St
Ad
elin
e St
40th St
65th St
Peabody LnPeabody Ln
65th St
San
Pa
blo
Ave
Powell St
36th St
Stanford Ave
Park Ave
66th St
67th St
Doyle St
Haruff St
63rd St
64th St
47th St
47th St
37th St
Vallejo St
Christie Ave
Ashby Ave
39th St
Apgar St
Folger Ave
53rd St53rd St
Shellm
oun
d St
Fremont St
Ocean Ave
Beaudry St
Bay St
Watts St
Harlan St
48th St
MacArthur Blvd
Peldeau St
Horton St
Hollis St
Holden St
Horton St
Halleck St
Emery StH
ubbard St
Beac
h St
Essex St
Marshall St
Salem St
Overland Ave
Yerba Buena Ave
Sherwin St
Doyle St
45th St
41st St
43rd St
61st St
59th St
62nd St
54th St
Vallejo St
Yerba Buena Ave
45th St
64th St
63rd St
55th St
Haven St
Hollis St
580
580880
880
80
80
123
13
NORTH
.5 MILE0
North Bayfront
Study Area Expansion
South of Powell
Triangle
STUDY AREAFigure 1
EMERYVILLE PARKING STUDY
North Hollis Study Area
North Hollis Study Area
Area 1
Area 2
Residential Area
Existing RPP
Block Number
Private Surface Lots
Amtrak Lot
Off-Street Garages
Market Place Lot
2
5
PARKING POLICY & MANAGEMENT IMPLEMENTATION PLAN
EXISTING CONDITIONS
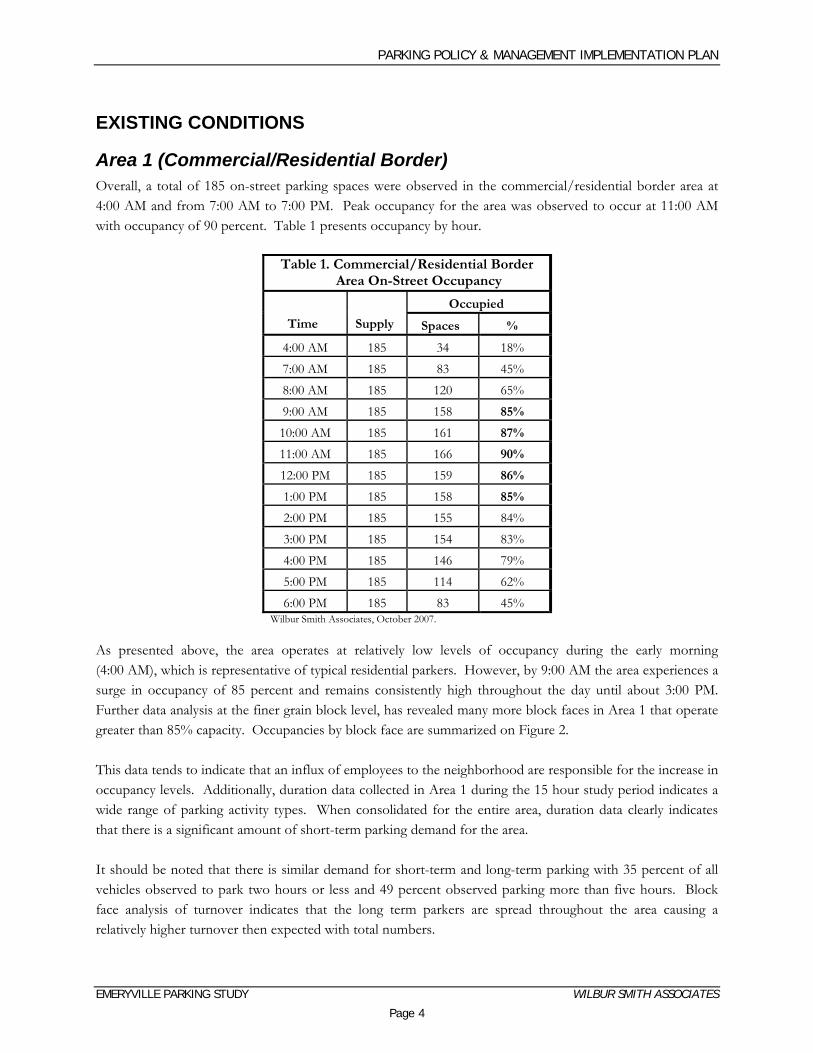
Area 1 (Commercial/Residential Border) Overall, a total of 185 on-street parking spaces were observed in the commercial/residential border area at 4:00 AM and from 7:00 AM to 7:00 PM. Peak occupancy for the area was observed to occur at 11:00 AM with occupancy of 90 percent. Table 1 presents occupancy by hour.
Table 1. Commercial/Residential Border Area On-Street Occupancy
Occupied
Time Supply Spaces %
4:00 AM 185 34 18% 7:00 AM 185 83 45% 8:00 AM 185 120 65% 9:00 AM 185 158 85%
10:00 AM 185 161 87%
11:00 AM 185 166 90%
12:00 PM 185 159 86%
1:00 PM 185 158 85%
2:00 PM 185 155 84% 3:00 PM 185 154 83% 4:00 PM 185 146 79% 5:00 PM 185 114 62% 6:00 PM 185 83 45%
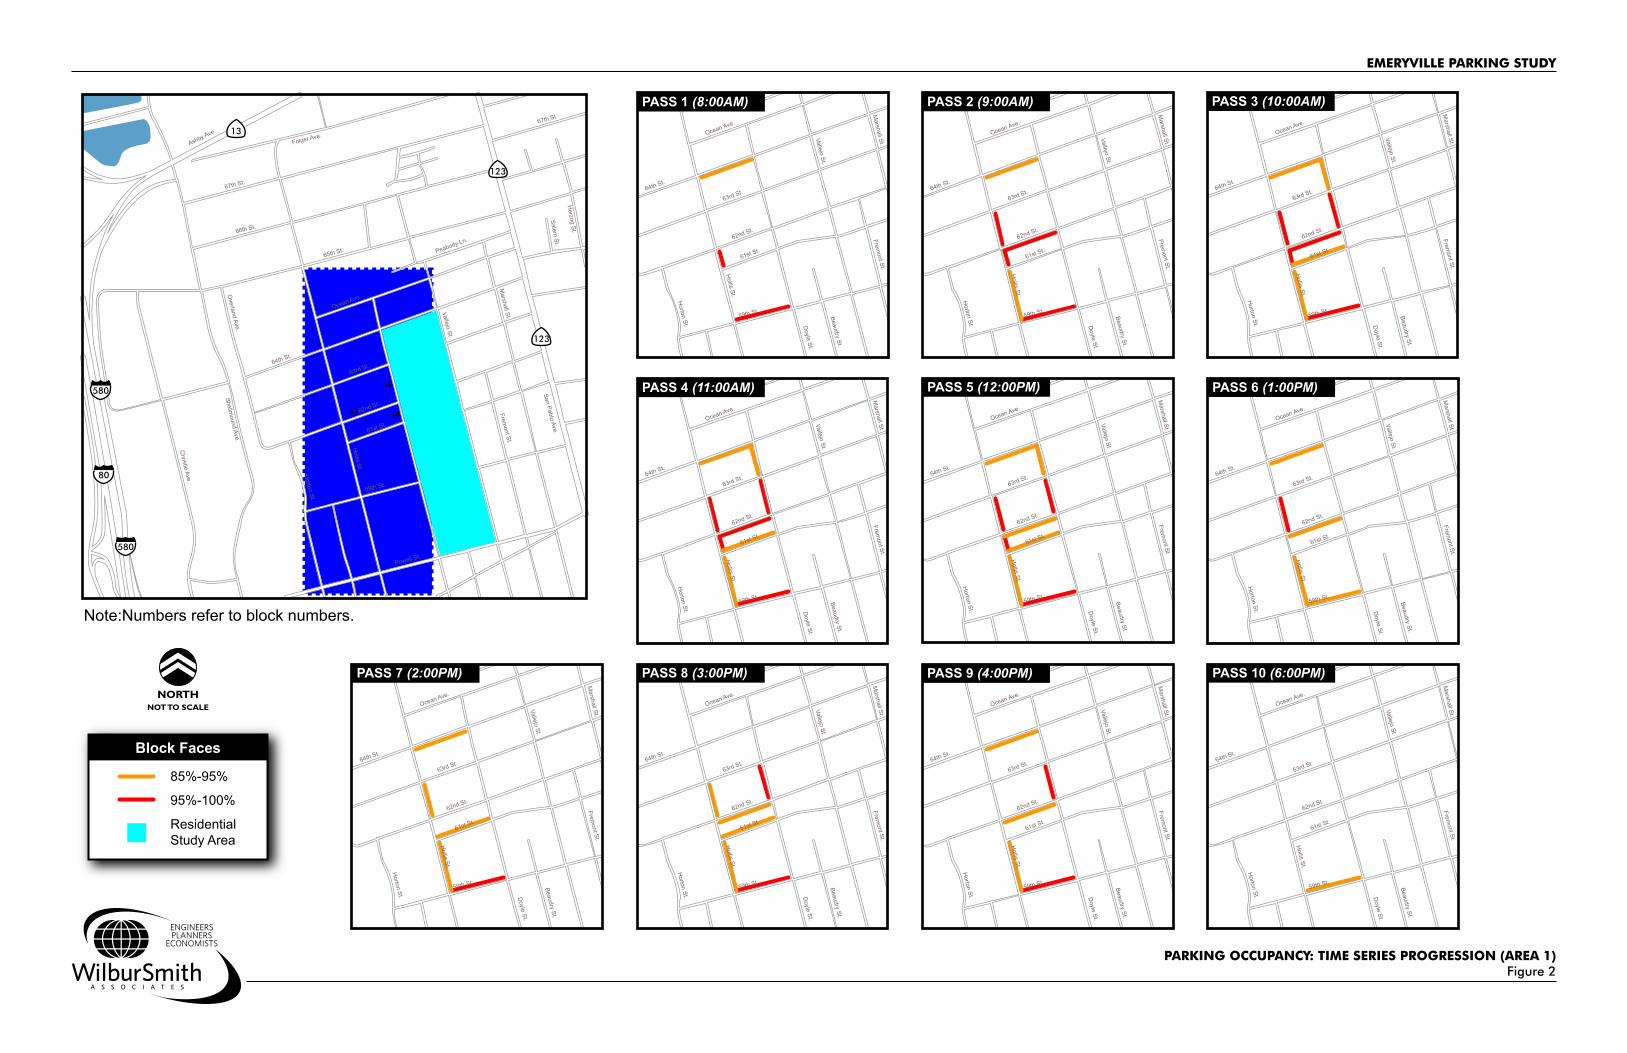
Wilbur Smith Associates, October 2007. As presented above, the area operates at relatively low levels of occupancy during the early morning (4:00 AM), which is representative of typical residential parkers. However, by 9:00 AM the area experiences a surge in occupancy of 85 percent and remains consistently high throughout the day until about 3:00 PM. Further data analysis at the finer grain block level, has revealed many more block faces in Area 1 that operate greater than 85% capacity. Occupancies by block face are summarized on Figure 2. This data tends to indicate that an influx of employees to the neighborhood are responsible for the increase in occupancy levels. Additionally, duration data collected in Area 1 during the 15 hour study period indicates a wide range of parking activity types. When consolidated for the entire area, duration data clearly indicates that there is a significant amount of short-term parking demand for the area. It should be noted that there is similar demand for short-term and long-term parking with 35 percent of all vehicles observed to park two hours or less and 49 percent observed parking more than five hours. Block face analysis of turnover indicates that the long term parkers are spread throughout the area causing a relatively higher turnover then expected with total numbers.
EMERYVILLE PARKING STUDY WILBUR SMITH ASSOCIATES
Page 4
34
3836
3739
42
46 4543
47
50
48
49
44
36
41
123
13
123
NORTHNOT TO SCALE
580
580
80
Folger Ave.Ashby Ave.
67th St.
66th St.
65th St.
67th St.
Salem St.
Marshall St.
Vallejo St.
Fremont St.
San Pablo Ave.
Beaudry St.
Doyle St.
Hollis St.
Horton St.
Christie Ave.
Shellmound Ave.
Overland Ave.
Herzog St.
64th St.
59th St.
Powell St.
62nd St.
63rd St.
Peabody Ln.
Ocean Ave.
61st St.
Note:Numbers refer to block numbers.
PARKING OCCUPANCY: TIME SERIES PROGRESSION (AREA 1)Figure 2
Block Faces
85%-95%
95%-100%
ResidentialStudy Area
8
Marshall St.
Vallejo St.
Fremont St.
Beaudry St.
Doyle St.
Horton St.
64th St.
59th St.
62nd St.
63rd St.
Ocean Ave.
61st St.
Hollis St.
PASS 8 (3:00PM) 8
Marshall St.
Vallejo St.
Fremont St.
Beaudry St.
Doyle St.
Horton St.
Overland Ave.
64th St.
59th St.
Powell St.
62nd St.
63rd St.
Ocean Ave.
61st St.
Hollis St.
PASS 9 (4:00PM) 8
Marshall St.
Vallejo St.
Fremont St.
Beaudry St.
Doyle St.
Horton St.
64th St.
59th St.
62nd St.
63rd St.
Ocean Ave.
61st St.
Hollis St.
PASS 10 (6:00PM)
8
Marshall St.
Vallejo St.
Fremont St.
Beaudry St.
Doyle St.
Horton St.
Overland Ave.
64th St.
59th St.
Powell St.
62nd St.
63rd St.
Ocean Ave.
61st St.
Hollis St.
PASS 3 (10:00AM)8
Marshall St.
Vallejo St.
Fremont St.
Beaudry St.
Doyle St.
Horton St.
Overland Ave.
64th St.
59th St.
Powell St.
62nd St.
63rd St.
Ocean Ave.
61st St.
PASS 2 (9:00AM)
Hollis St.
8
Marshall St.
Vallejo St.
Fremont St.
Beaudry St.
Doyle St.
Hollis St.
Horton St.
64th St.
59th St.
Powell St.
62nd St.
63rd St.
Ocean Ave.
61st St.
PASS 1 (8:00AM)
8
Marshall St.
Vallejo St.
Fremont St.
Beaudry St.
Doyle St.
Horton St.
64th St.
59th St.
62nd St.
63rd St.
Ocean Ave.
61st St.
Hollis St.
PASS 4 (11:00AM) 8
Marshall St.
Vallejo St.
Fremont St.
Beaudry St.
Doyle St.
Horton St.
Overland Ave.
64th St.
59th St.
62nd St.
63rd St.
Ocean Ave.
61st St.
Hollis St.
PASS 5 (12:00PM) 8
Marshall St.
Vallejo St.
Fremont St.
Beaudry St.
Doyle St.
Horton St.
Overland Ave.
64th St.
59th St.
62nd St.
63rd St.
Ocean Ave.
61st St.
Hollis St.
PASS 6 (1:00PM)
EMERYVILLE PARKING STUDY
8
Marshall St.
Vallejo St.
Fremont St.
Beaudry St.
Doyle St.
Horton St.
Overland Ave.
64th St.
59th St.
Powell St.
62nd St.
63rd St.
Ocean Ave.
61st St.
Hollis St.
PASS 7 (2:00PM)

PARKING POLICY & MANAGEMENT IMPLEMENTATION PLAN
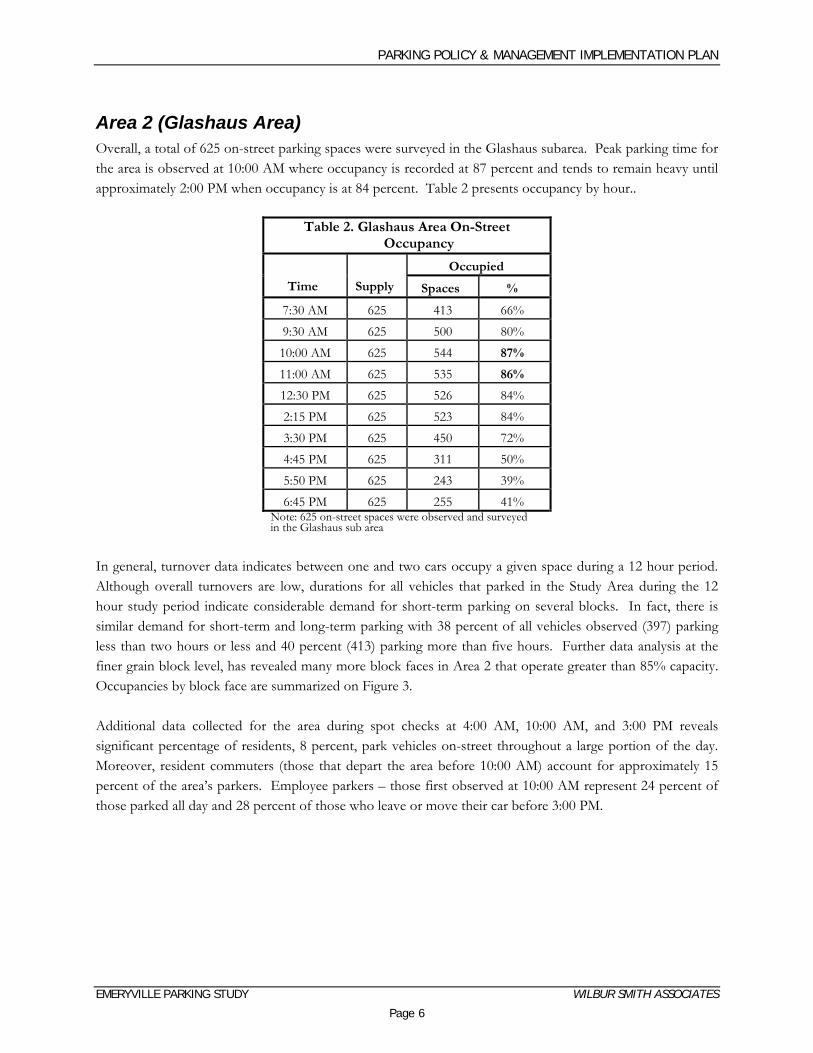
Area 2 (Glashaus Area) Overall, a total of 625 on-street parking spaces were surveyed in the Glashaus subarea. Peak parking time for the area is observed at 10:00 AM where occupancy is recorded at 87 percent and tends to remain heavy until approximately 2:00 PM when occupancy is at 84 percent. Table 2 presents occupancy by hour..
Table 2. Glashaus Area On-Street Occupancy
Occupied
Time Supply Spaces %
7:30 AM 625 413 66% 9:30 AM 625 500 80% 10:00 AM 625 544 87%
11:00 AM 625 535 86%
12:30 PM 625 526 84% 2:15 PM 625 523 84% 3:30 PM 625 450 72% 4:45 PM 625 311 50% 5:50 PM 625 243 39% 6:45 PM 625 255 41%
Note: 625 on-street spaces were observed and surveyed in the Glashaus sub area
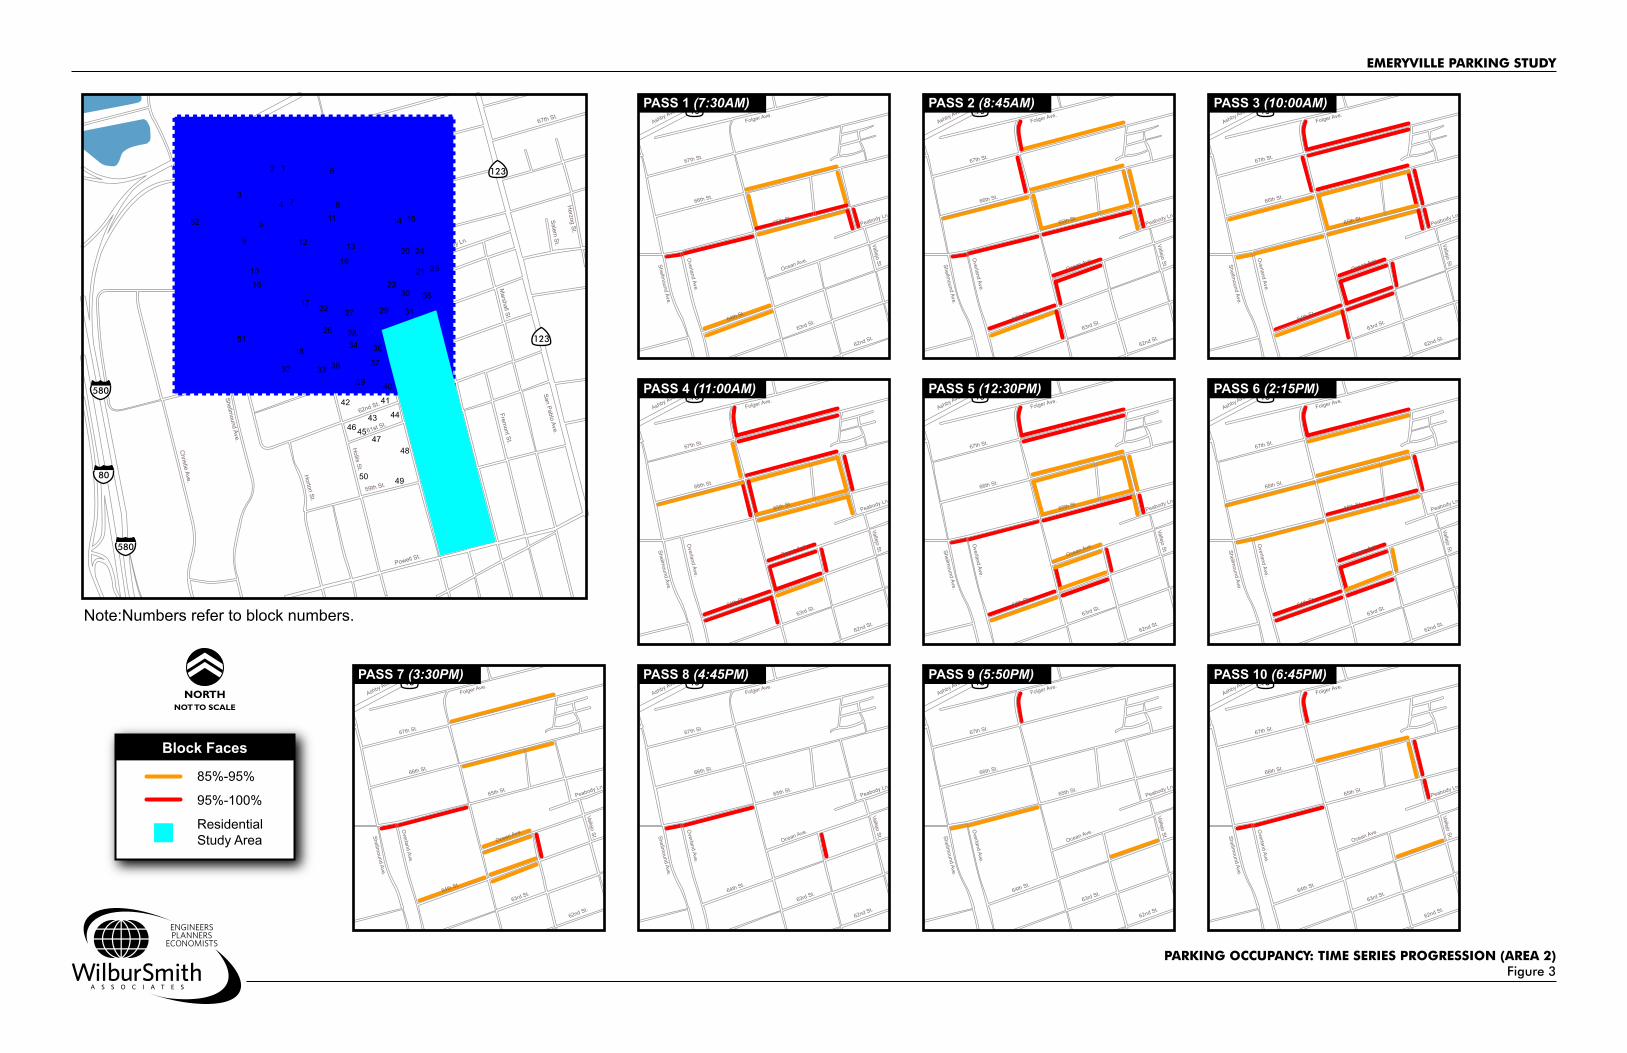
In general, turnover data indicates between one and two cars occupy a given space during a 12 hour period. Although overall turnovers are low, durations for all vehicles that parked in the Study Area during the 12 hour study period indicate considerable demand for short-term parking on several blocks. In fact, there is similar demand for short-term and long-term parking with 38 percent of all vehicles observed (397) parking less than two hours or less and 40 percent (413) parking more than five hours. Further data analysis at the finer grain block level, has revealed many more block faces in Area 2 that operate greater than 85% capacity. Occupancies by block face are summarized on Figure 3. Additional data collected for the area during spot checks at 4:00 AM, 10:00 AM, and 3:00 PM reveals significant percentage of residents, 8 percent, park vehicles on-street throughout a large portion of the day. Moreover, resident commuters (those that depart the area before 10:00 AM) account for approximately 15 percent of the area’s parkers. Employee parkers – those first observed at 10:00 AM represent 24 percent of those parked all day and 28 percent of those who leave or move their car before 3:00 PM.
EMERYVILLE PARKING STUDY WILBUR SMITH ASSOCIATES
Page 6

123
13
123
NORTHNOT TO SCALE
580
580
80
Folger Ave.Ashby Ave.
67th St.
66th St.
65th St.
67th St.
Salem St.
Marshall St.
Vallejo St.
Fremont St.
San Pablo Ave.
Beaudry St.
Doyle St.
Hollis St.
Horton St.
Christie Ave.
Shellmound Ave.
Overland Ave.
Herzog St.
64th St.
59th St.
Powell St.
62nd St.
63rd St.
Peabody Ln.
Ocean Ave.
61st St.
Note:Numbers refer to block numbers.
PARKING OCCUPANCY: TIME SERIES PROGRESSION (AREA 2)Figure 3
5
10
12
11 14 15
20 24
252123
22
19
13
16
51
17
18
32 33 38
34 36
37
42
39 40
41
4346
47
50 49
48
44
45
2826
27 29
30 35
31
9
4 7
6
8
12
3
52
Block Faces
85%-95%
95%-100%
ResidentialStudy Area
Folger Ave.Ashby Ave.
67th St.
66th St.
65th St.
Vallejo St.Shellmound Ave.
Overland Ave.
64th St.
62nd St.
63rd St.
Peabody Ln.
Ocean Ave.
13Folger Ave.
Ashby Ave.
67th St.
66th St.
65th St.
Vallejo St.Shellmound Ave.
Overland Ave.
64th St.
62nd St.
63rd St.
Peabody Ln.
Ocean Ave.
13Folger Ave.
Ashby Ave.
67th St.
66th St.
65th St.
Vallejo St.Shellmound Ave.
Overland Ave.
64th St.
62nd St.
63rd St.
Peabody Ln.
Ocean Ave.
13
13Folger Ave.
Ashby Ave.
67th St.
66th St.
65th St.
Vallejo St.Shellmound Ave.
Overland Ave.
64th St.
62nd St.
63rd St.
Peabody Ln.
Ocean Ave.
Folger Ave.Ashby Ave.
67th St.
66th St.
65th St.
Vallejo St.Shellmound Ave.
Overland Ave.
64th St.
62nd St.
63rd St.
Peabody Ln.
Ocean Ave.
13Folger Ave.
Ashby Ave.
67th St.
66th St.
65th St.
Vallejo St.Shellmound Ave.
Overland Ave.
64th St.
62nd St.
63rd St.
Peabody Ln.
Ocean Ave.
13
Folger Ave.Ashby Ave.
67th St.
66th St.
65th St.
Vallejo St.Shellmound Ave.
Overland Ave.
64th St.
62nd St.
63rd St.
Peabody Ln.
Ocean Ave.
13 13Folger Ave.
Ashby Ave.
67th St.
66th St.
65th St.
Vallejo St.Shellmound Ave.
Overland Ave.
64th St.
62nd St.
63rd St.
Peabody Ln.
Ocean Ave.
Folger Ave.Ashby Ave.
67th St.
66th St.
65th St.
Vallejo St.Shellmound Ave.
Overland Ave.
64th St.
62nd St.
63rd St.
Peabody Ln.
Ocean Ave.
13 13Folger Ave.
Ashby Ave.
67th St.
66th St.
65th St.
Vallejo St.Shellmound Ave.
Overland Ave.
64th St.
62nd St.
63rd St.
Peabody Ln.
Ocean Ave.
PASS 1 (7:30AM) PASS 2 (8:45AM) PASS 3 (10:00AM)
PASS 4 (11:00AM) PASS 5 (12:30PM) PASS 6 (2:15PM)
PASS 7 (3:30PM) PASS 8 (4:45PM) PASS 9 (5:50PM) PASS 10 (6:45PM)
EMERYVILLE PARKING STUDY

34
3837
39
42
46 4543
47
50
48
49
44
36
41
55
59
6369
6260
58
57
54
5653
31
30
29
61
65
66
67
70
687176
77
7572
73
35
74
NORTHNOT TO SCALE
Vallejo St.Beaudry St.
Doyle St.
Hollis St.
Horton St.
59th St.
Powell St.
62nd St.
63rd St.
Ocean Ave.
61st St.
EMERYVILLE PARKING STUDY
PARKING OCCUPANCY: TIME SERIES PROGRESSION (RESIDENTIAL)Figure 4
Block Faces
85%-95%
95%-100%
ResidentialStudy Area
8
Marshall St.
Vallejo St.
Fremont St.
Beaudry St.
Doyle St.
Horton St.
64th St.
59th St.
Powell St.
62nd St.
63rd St.
Ocean Ave.
61st St.
Hollis St.
PASS 3 (3:00PM)
8
Marshall St.
Vallejo St.
Fremont St.
Beaudry St.
Doyle St.
Horton St.
64th St.
59th St.
62nd St.
63rd St.
Ocean Ave.
61st St.
Hollis St.
PASS 2 (10:00AM)
8
Marshall St.
Vallejo St.
Fremont St.
Beaudry St.
Doyle St.
Hollis St.
Horton St.
64th St.
59th St.
Powell St.
62nd St.
63rd St.
Ocean Ave.
61st St.
PASS 1 (4:00AM)
PARKING POLICY & MANAGEMENT IMPLEMENTATION PLAN
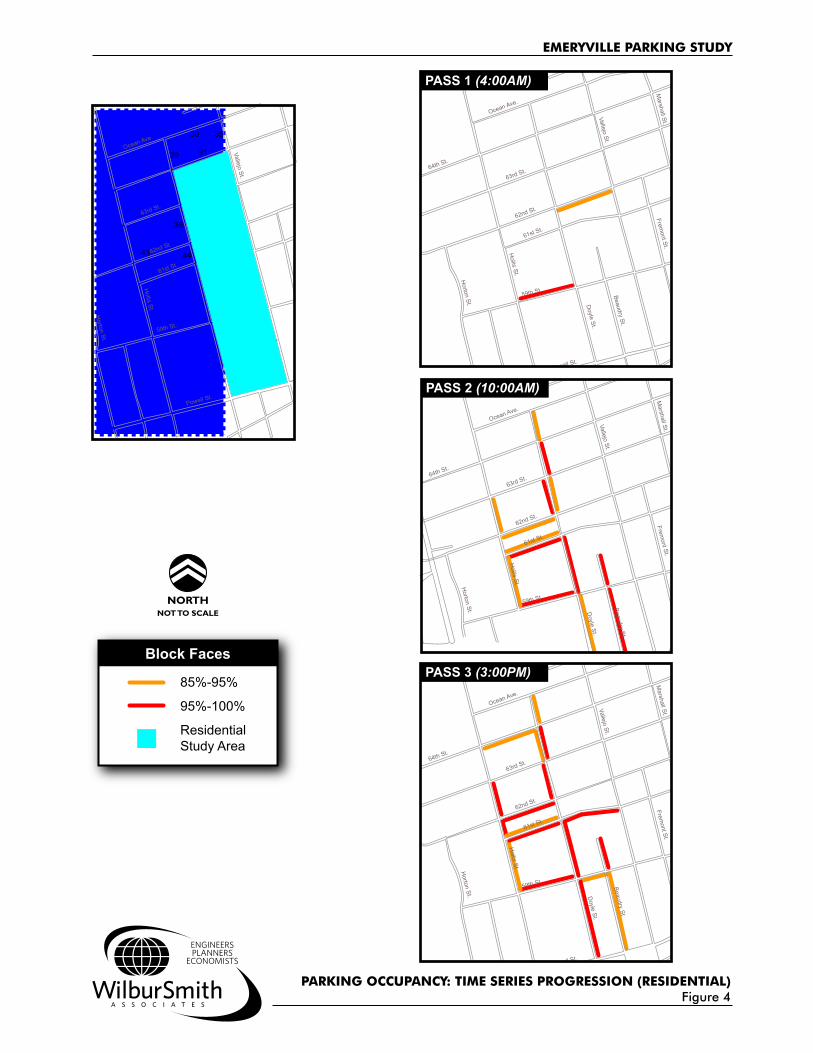
Of particular interest is the fact that 37 percent of resident vehicles were observed to depart during morning commute hours. During the same observation period, of the vehicles observed in the afternoon (3:00 PM), 30 percent were parked by residents all day and 34 percent of vehicles were parked by employees during work hours 10:00 AM to 3:00 PM. This information demonstrates that as residents depart the neighborhood, employees and visitors fill in available capacity on these streets.
Off-Street Parking Off-street parking conditions were quantitatively assessed for the North Hollis area. Three types of off street parking were observed including Amtrak long-term parking (with associated paid parking), private employee surface lots, and parking garages. Amtrak Parking Lot A 12 hour license plate survey was conducted of 215 parking spaces in the Amtrak parking lot on Thursday, June 28th, 2007. The following summarizes the observations:
• Amtrak lot occupancy ranged from 82 to 84 percent, peaking at 1:00 PM • Average duration for the lot was 6.8 hours during the 12 hour study period
Private Surface Parking Lots In total, there are nine off-street lots located in the Study Area (67th Street to Powell) that provide approximately 1,146 parking spaces (as compared with 625 on-street spaces surveyed in the Glashaus area and 314 on-street spaces surveyed in the residential Study Area). Table 4 summarizes midday off-street occupancy.
Table 4. Midday Off-Street Occupancy % Occupancy
10:00 AM 61% 11:00 AM 70% 12:00 PM 69% 1:00 PM 64% 2:00 PM 66%
The off-street parking utilization data presented in Table 4 indicates that off-street surface lots are not being utilized efficiently and have significant capacity to accommodate additional vehicles. A comparison of occupancies observed at 10:00 AM between study subareas in the North Hollis area point to a parking imbalance between on- and off-street supplies and a potential to explore shared parking solutions. Parking Garages Data collection for parking garages involved both commercial and residential facilities serving in the North Hollis area. A total of eight facilities were surveyed during presumed peak hour of occupancy, 4:00 AM for residential facilities and 11:00 AM or 2:00 PM for commercial serving facilities.
EMERYVILLE PARKING STUDY WILBUR SMITH ASSOCIATES
Page 10
PARKING POLICY & MANAGEMENT IMPLEMENTATION PLAN
In general, occupancies for commercial serving garages ranged between 29 and 65 percent, with one garage reporting occupancy of 96 percent. With respect to residential serving facilities, occupancy at 4:00 AM was recorded at 40 percent. Overall, the majority of facilities surveyed are shown to be able to accommodate more than double the observed occupancy.
Facility Manager Interviews To further supplement the data obtained during field surveys, facility managers were interviewed regarding operations of their parking garage. Managers were asked to provide information on parking requirements, parking provision, parking pricing, transportation benefits, and special agreements or anticipated changes to existing facilities. With respect to parking requirements, office and retail uses indicated their parking ratios between three and four spaces per 1,000 square feet while residential facilities reported one space per dwelling unit. When asked how parking was allocated to tenants, each facility had a unique formula but most facilities indicated parking was included in the price of rent. Other facilities “unbundle” or separate the price of parking from the rent and also allow tenants to negotiate the amount of parking they wish to use. A handful of facilities reported offering transportation benefits to the tenants of their facilities. Two facilities indicated they offered bicycle parking, a car-share vehicle, and carpool parking spaces at sites. With respect to anticipated changes, only Emeryville Marketplace reported moving forward with plans to redevelop their existing surface parking lot and construct a phased parking garage project. A detailed summary of the facility manager interviews and findings are provided in Appendix A.
Intercept Survey An intercept survey was conducted in North Hollis to gain perspective on what parking attitudes were prevalent. Key survey findings included the following:
• The majority, 85 percent, of respondents were able to find parking within five minutes of arrival time • 49 percent of those surveyed believe on-street parking is difficult to find • 74 percent of respondents were not willing to pay for convenient parking • Of the parking attributes asked, “cost” and “availability” were ranked “most important” with respect
to parking in North Hollis • 33 percent of respondents indicated they would be willing to pay between $0.50 and $1.00 per hour
for convenient on-street parking A detailed summary of the intercept survey results and findings are provided in Appendix B.
EMERYVILLE PARKING STUDY WILBUR SMITH ASSOCIATES
Page 11
PARKING POLICY & MANAGEMENT IMPLEMENTATION PLAN
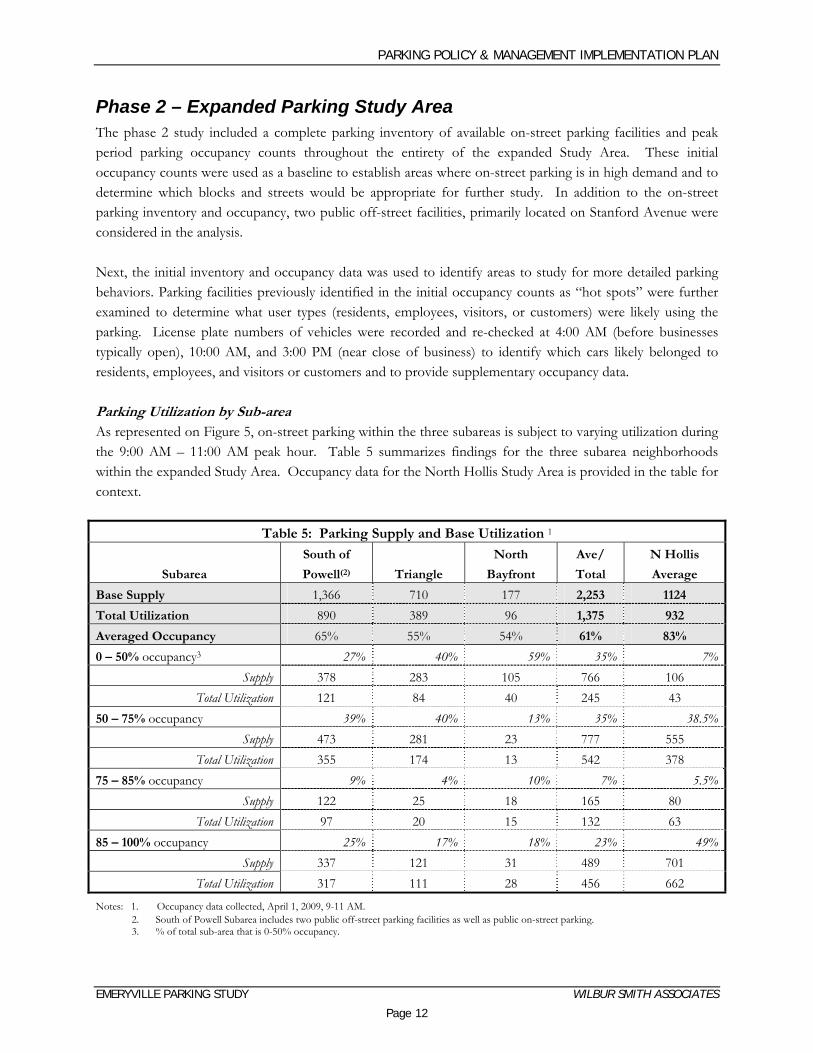
Phase 2 – Expanded Parking Study Area The phase 2 study included a complete parking inventory of available on-street parking facilities and peak period parking occupancy counts throughout the entirety of the expanded Study Area. These initial occupancy counts were used as a baseline to establish areas where on-street parking is in high demand and to determine which blocks and streets would be appropriate for further study. In addition to the on-street parking inventory and occupancy, two public off-street facilities, primarily located on Stanford Avenue were considered in the analysis. Next, the initial inventory and occupancy data was used to identify areas to study for more detailed parking behaviors. Parking facilities previously identified in the initial occupancy counts as “hot spots” were further examined to determine what user types (residents, employees, visitors, or customers) were likely using the parking. License plate numbers of vehicles were recorded and re-checked at 4:00 AM (before businesses typically open), 10:00 AM, and 3:00 PM (near close of business) to identify which cars likely belonged to residents, employees, and visitors or customers and to provide supplementary occupancy data. Parking Utilization by Sub-area As represented on Figure 5, on-street parking within the three subareas is subject to varying utilization during the 9:00 AM – 11:00 AM peak hour. Table 5 summarizes findings for the three subarea neighborhoods within the expanded Study Area. Occupancy data for the North Hollis Study Area is provided in the table for context.
Table 5: Parking Supply and Base Utilization 1
Subarea
South of
Powell(2) Triangle
North
Bayfront
Ave/
Total
N Hollis
Average
Base Supply 1,366 710 177 2,253 1124
Total Utilization 890 389 96 1,375 932
Averaged Occupancy 65% 55% 54% 61% 83%
0 – 50% occupancy3 27% 40% 59% 35% 7%Supply 378 283 105 766 106
Total Utilization 121 84 40 245 43 50 – 75% occupancy 39% 40% 13% 35% 38.5%
Supply 473 281 23 777 555 Total Utilization 355 174 13 542 378
75 – 85% occupancy 9% 4% 10% 7% 5.5%Supply 122 25 18 165 80
Total Utilization 97 20 15 132 63 85 – 100% occupancy 25% 17% 18% 23% 49%
Supply 337 121 31 489 701 Total Utilization 317 111 28 456 662
Notes: 1. Occupancy data collected, April 1, 2009, 9-11 AM. 2. South of Powell Subarea includes two public off-street parking facilities as well as public on-street parking. 3. % of total sub-area that is 0-50% occupancy.
EMERYVILLE PARKING STUDY WILBUR SMITH ASSOCIATES
Page 12
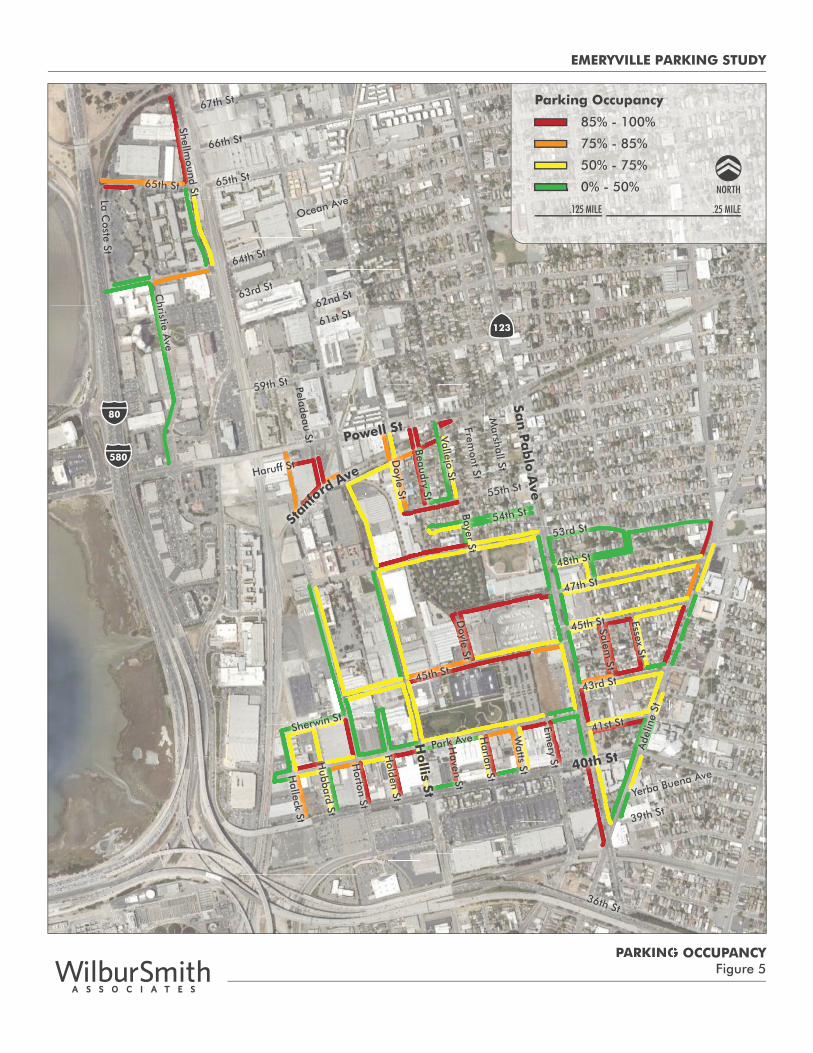
PARKING OCCUPANCYFigure 5
NORTH
.125 MILE .25 MILE
85% - 100%
Parking Occupancy
75% - 85%
50% - 75%
0% - 50%
PARKING
San
Pa
blo
Ave
Shellmound St
Christie A
ve
La Coste St
Marshall St
Vallejo StBoyer St
Doyle St
Halleck St
Hubbard St
Horton St
Holden St
Harlan St
Haven St
Watts St
Emery St
Hollis St
Fremont St
Beaudry St
Doyle St
67th St
66th St
65th St65th St
59th St Peladeau St
Haruff St
Powell St
53rd St
Park Ave41st St
36th St
43rd St
Yerba Buena Ave
39th St
40th St
Sherwin St
Ade
line
St
47th St
55th St
54th St
Salem St
Essex St
48th St
45th St
45th St
63rd St
62nd St
Ocean Ave
61st St
64th St
Stan
fo
rd Ave580
80
123
EMERYVILLE PARKING STUDY
PARKING POLICY & MANAGEMENT IMPLEMENTATION PLAN
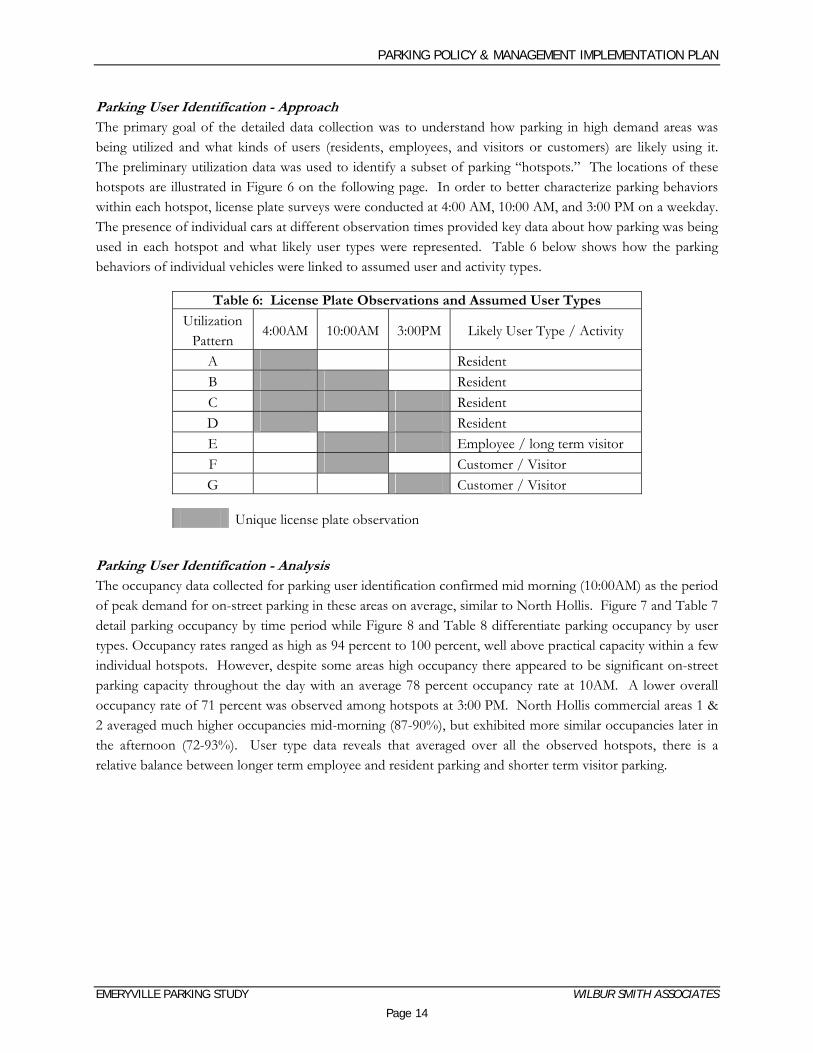
Parking User Identification - Approach The primary goal of the detailed data collection was to understand how parking in high demand areas was being utilized and what kinds of users (residents, employees, and visitors or customers) are likely using it. The preliminary utilization data was used to identify a subset of parking “hotspots.” The locations of these hotspots are illustrated in Figure 6 on the following page. In order to better characterize parking behaviors within each hotspot, license plate surveys were conducted at 4:00 AM, 10:00 AM, and 3:00 PM on a weekday. The presence of individual cars at different observation times provided key data about how parking was being used in each hotspot and what likely user types were represented. Table 6 below shows how the parking behaviors of individual vehicles were linked to assumed user and activity types.
Table 6: License Plate Observations and Assumed User Types
Utilization Pattern
4:00AM 10:00AM 3:00PM Likely User Type / Activity
A Resident B Resident C Resident D Resident E Employee / long term visitor F Customer / Visitor G Customer / Visitor
Unique license plate observation
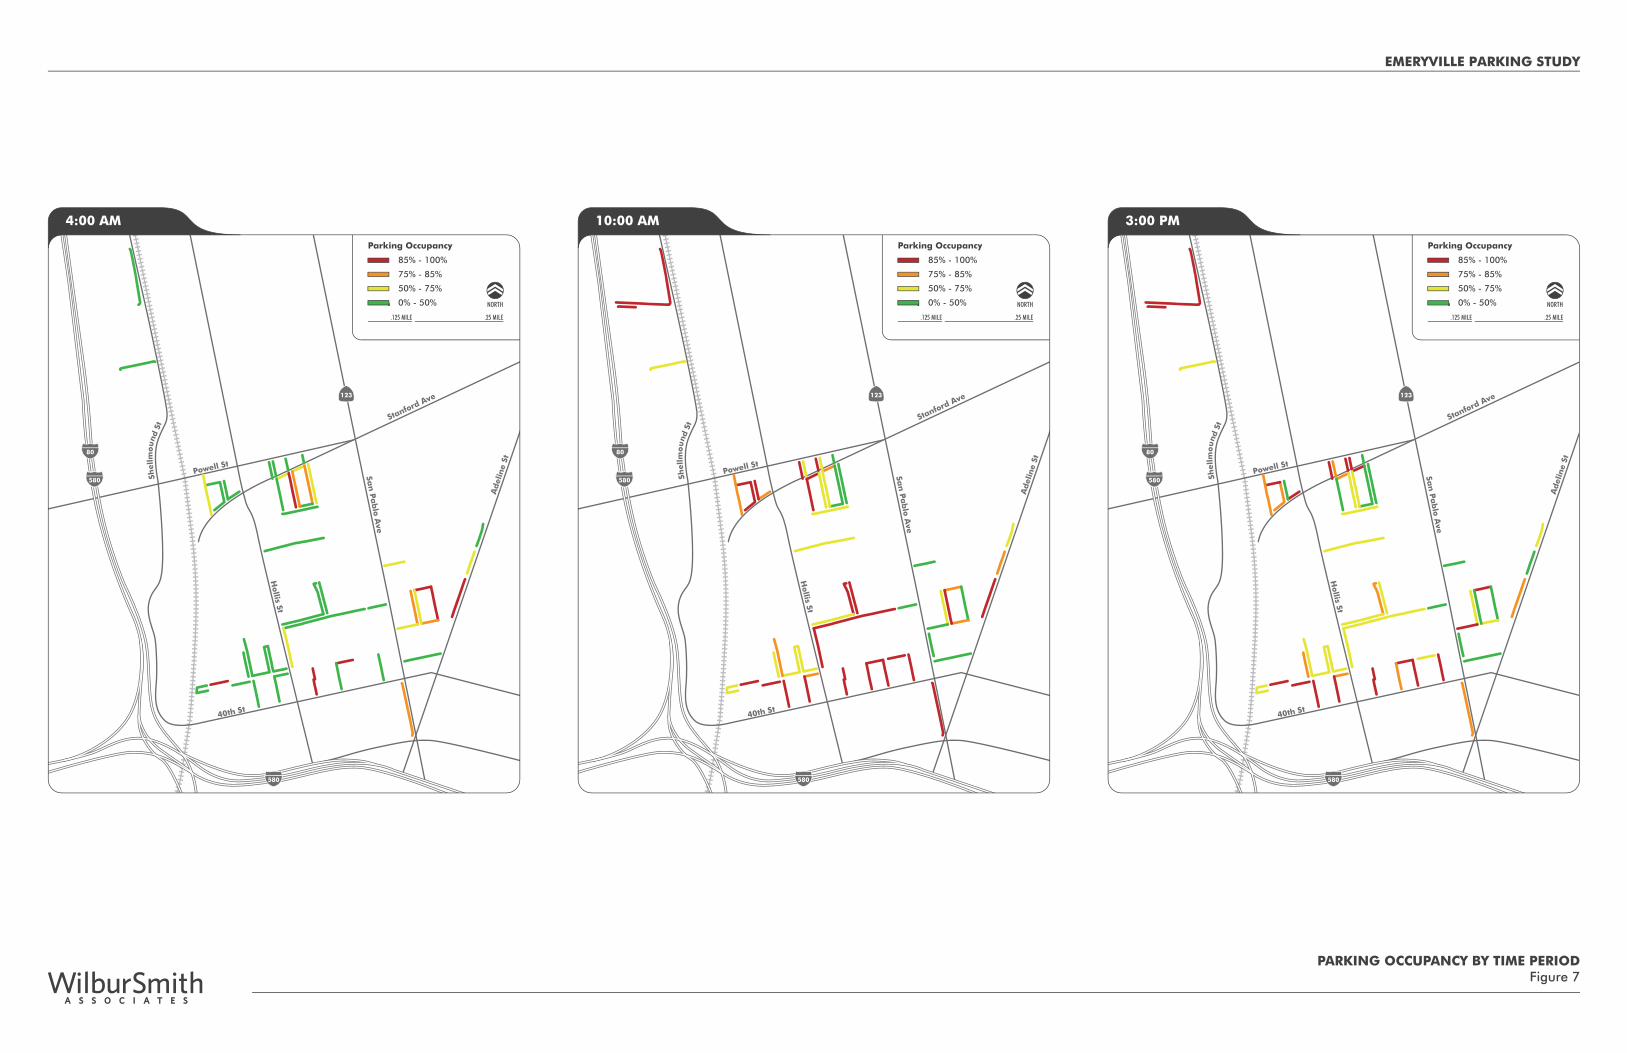
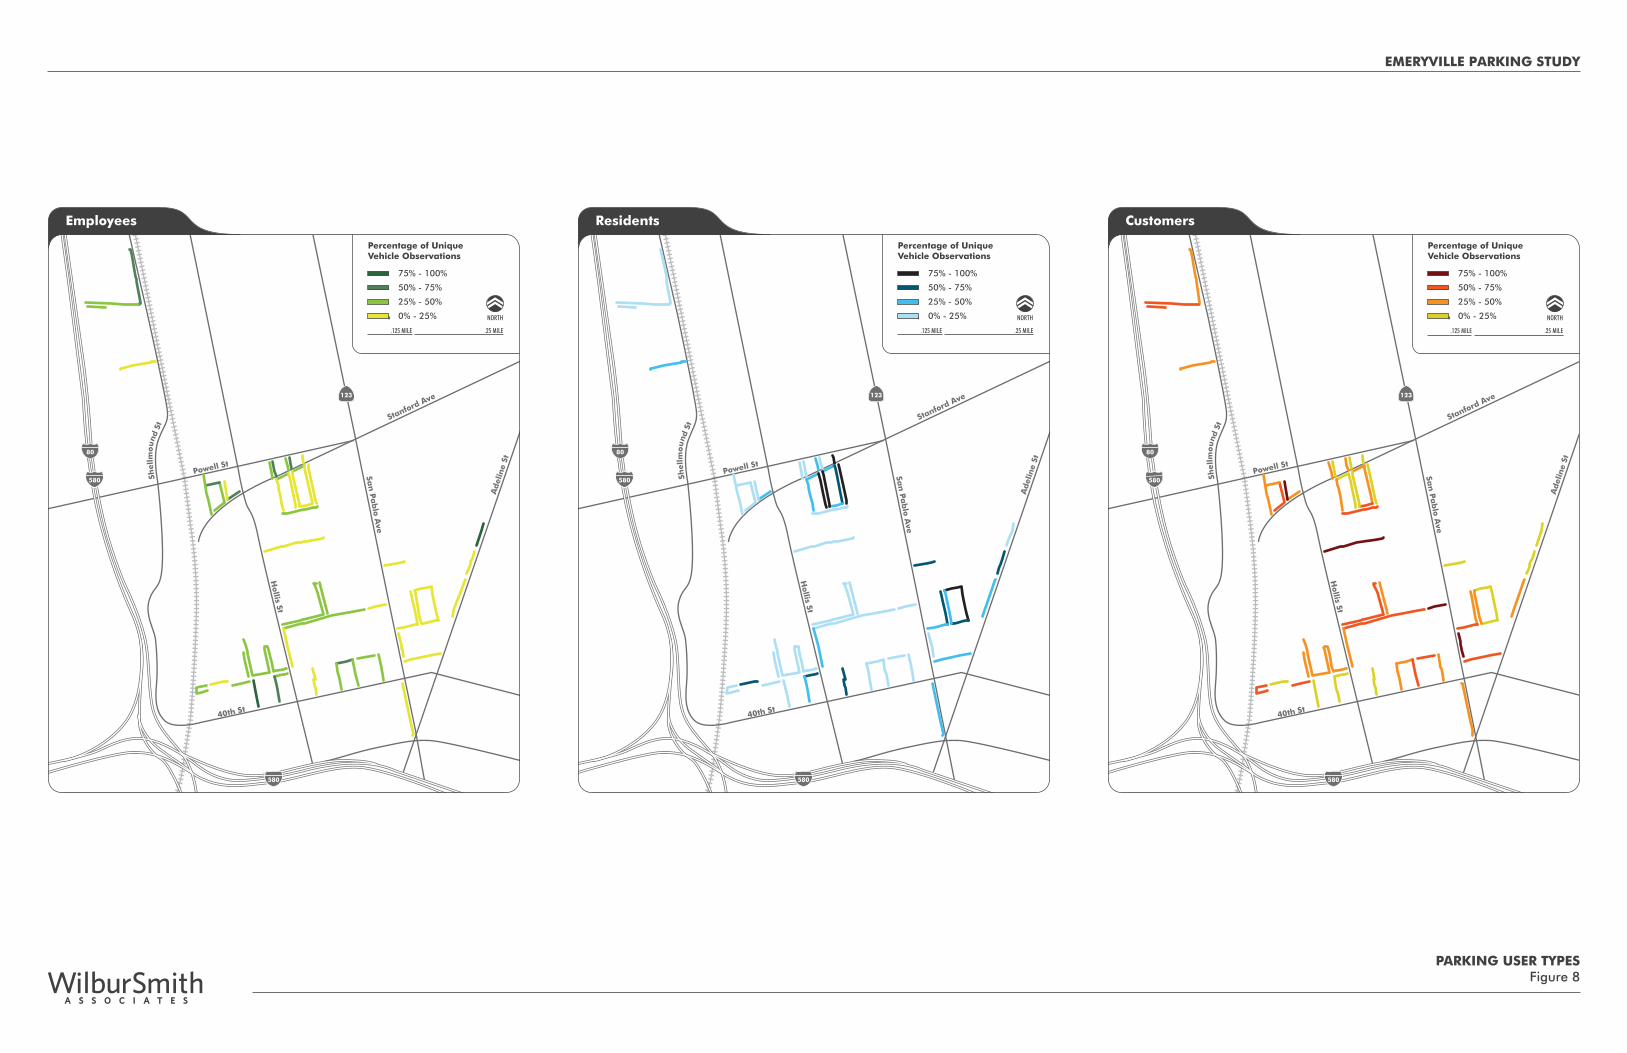
Parking User Identification - Analysis The occupancy data collected for parking user identification confirmed mid morning (10:00AM) as the period of peak demand for on-street parking in these areas on average, similar to North Hollis. Figure 7 and Table 7 detail parking occupancy by time period while Figure 8 and Table 8 differentiate parking occupancy by user types. Occupancy rates ranged as high as 94 percent to 100 percent, well above practical capacity within a few individual hotspots. However, despite some areas high occupancy there appeared to be significant on-street parking capacity throughout the day with an average 78 percent occupancy rate at 10AM. A lower overall occupancy rate of 71 percent was observed among hotspots at 3:00 PM. North Hollis commercial areas 1 & 2 averaged much higher occupancies mid-morning (87-90%), but exhibited more similar occupancies later in the afternoon (72-93%). User type data reveals that averaged over all the observed hotspots, there is a relative balance between longer term employee and resident parking and shorter term visitor parking.
EMERYVILLE PARKING STUDY WILBUR SMITH ASSOCIATES
Page 14
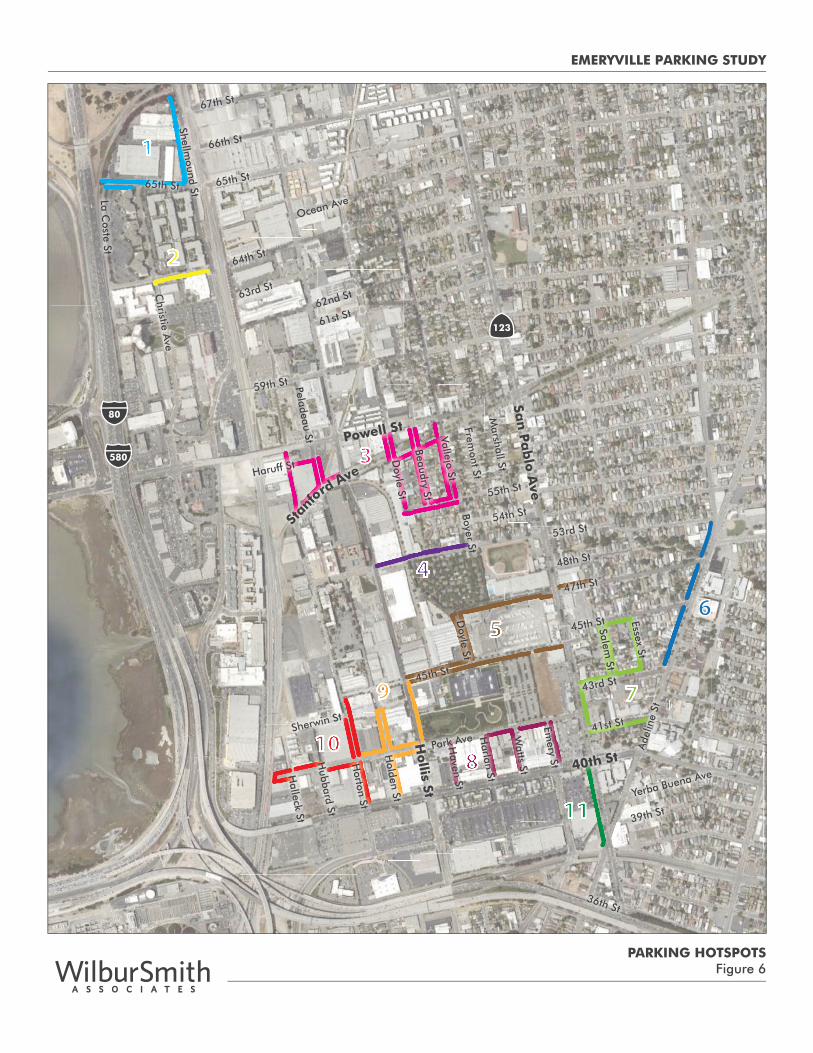
PARKING HOTSPOTSFigure 6
1
2
3
4
56
7
11
8
9
10
2
4
5
4
1111
88
PARKIN
11111
100
77
5
9999
44
333
San
Pa
blo
Ave
Shellmound St
Christie A
ve
La Coste St
Marshall St
Vallejo StBoyer St
Doyle St
Halleck St
Hubbard St
Horton St
Holden St
Harlan St
Haven St
Watts St
Emery St
Hollis St
Fremont St
Beaudry St
Doyle St
67th St
66th St
65th St65th St
59th St Peladeau St
Haruff St
Powell St
53rd St
Park Ave41st St
36th St
43rd St
Yerba Buena Ave
39th St
40th St
Sherwin St
Ade
line
St
47th St
55th St
54th St
Salem St
Essex St
48th St
45th St
45th St
63rd St
62nd St
Ocean Ave
61st St
64th St
Stan
fo
rd Ave580
80
123
EMERYVILLE PARKING STUDY
PARKING POLICY & MANAGEMENT IMPLEMENTATION PLAN
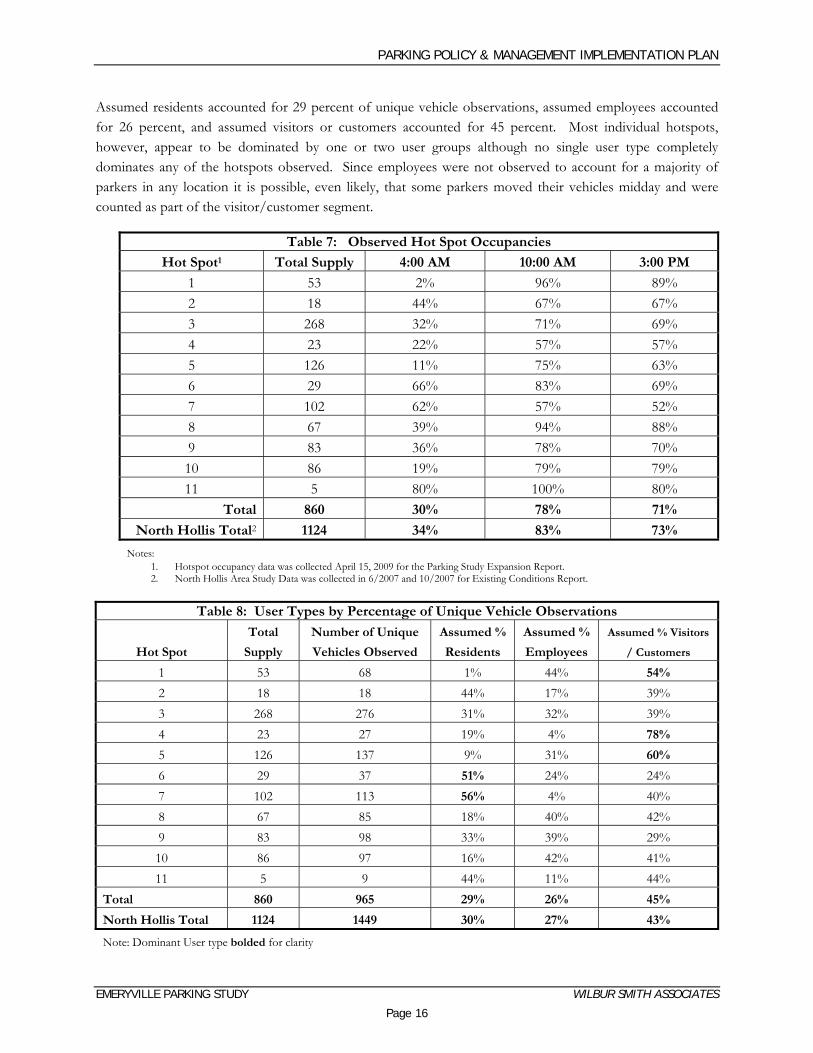
Assumed residents accounted for 29 percent of unique vehicle observations, assumed employees accounted for 26 percent, and assumed visitors or customers accounted for 45 percent. Most individual hotspots, however, appear to be dominated by one or two user groups although no single user type completely dominates any of the hotspots observed. Since employees were not observed to account for a majority of parkers in any location it is possible, even likely, that some parkers moved their vehicles midday and were counted as part of the visitor/customer segment.
Table 7: Observed Hot Spot Occupancies
Hot Spot1 Total Supply 4:00 AM 10:00 AM 3:00 PM
1 53 2% 96% 89% 2 18 44% 67% 67% 3 268 32% 71% 69% 4 23 22% 57% 57% 5 126 11% 75% 63% 6 29 66% 83% 69% 7 102 62% 57% 52% 8 67 39% 94% 88% 9 83 36% 78% 70% 10 86 19% 79% 79%
11 5 80% 100% 80% Total 860 30% 78% 71%
North Hollis Total2 1124 34% 83% 73%
Notes: 1. Hotspot occupancy data was collected April 15, 2009 for the Parking Study Expansion Report. 2. North Hollis Area Study Data was collected in 6/2007 and 10/2007 for Existing Conditions Report.
Table 8: User Types by Percentage of Unique Vehicle Observations
Hot Spot
Total
Supply
Number of Unique
Vehicles Observed
Assumed %
Residents
Assumed %
Employees
Assumed % Visitors
/ Customers
1 53 68 1% 44% 54%
2 18 18 44% 17% 39% 3 268 276 31% 32% 39% 4 23 27 19% 4% 78%
5 126 137 9% 31% 60%
6 29 37 51% 24% 24% 7 102 113 56% 4% 40% 8 67 85 18% 40% 42% 9 83 98 33% 39% 29% 10 86 97 16% 42% 41% 11 5 9 44% 11% 44%
Total 860 965 29% 26% 45%
North Hollis Total 1124 1449 30% 27% 43%
Note: Dominant User type bolded for clarity
EMERYVILLE PARKING STUDY WILBUR SMITH ASSOCIATES
Page 16
NORTH
.125 MILE .25 MILE
85% - 100%
Parking Occupancy
75% - 85%
50% - 75%
0% - 50%NORTH
.125 MILE .25 MILE
85% - 100%
Parking Occupancy
75% - 85%
50% - 75%
0% - 50%NORTH
.125 MILE .25 MILE
85% - 100%
Parking Occupancy
75% - 85%
50% - 75%
0% - 50%
4:00 AM 10:00 AM 3:00 PM
PARKING OCCUPANCY BY TIME PERIODFigure 7
San
Pa
blo
Ave
Stanford Ave
Hollis St
Powell St
40th St
580
Adel
ine
St
Shellm
ound
St
580
80
123
580
40th St
580
40th St
580
San
Pa
blo
Ave
Stanford Ave
Hollis St
Powell St
580
Adel
ine
St
Shellm
ound
St
580
80
123
San
Pa
blo
Ave
Stanford Ave
Hollis St
Powell St
580
Adel
ine
St
Shellm
ound
St
580
80
123
EMERYVILLE PARKING STUDY
NORTH
.125 MILE .25 MILE
Percentage of UniqueVehicle Observations
75% - 100%
50% - 75%
25% - 50%
0% - 25%NORTH
.125 MILE .25 MILE
Percentage of UniqueVehicle Observations
75% - 100%
50% - 75%
25% - 50%
0% - 25%NORTH
.125 MILE .25 MILE
75% - 100%
Percentage of UniqueVehicle Observations
50% - 75%
25% - 50%
0% - 25%
Employees Residents Customers
PARKING USER TYPESFigure 8
San
Pa
blo
Ave
Stanford Ave
Hollis St
Powell St
40th St
580
Adel
ine
St
Shellm
ound
St
580
80
123
580
40th St
580
40th St
580
San
Pa
blo
Ave
Stanford Ave
Hollis St
Powell St
580
Adel
ine
St
Shellm
ound
St
580
80
123
San
Pa
blo
Ave
Stanford Ave
Hollis St
Powell St
580
Adel
ine
St
Shellm
ound
St
580
80
123
EMERYVILLE PARKING STUDY
PARKING POLICY & MANAGEMENT IMPLEMENTATION PLAN
EMERYVILLE PARKING STUDY WILBUR SMITH ASSOCIATES
Page 19
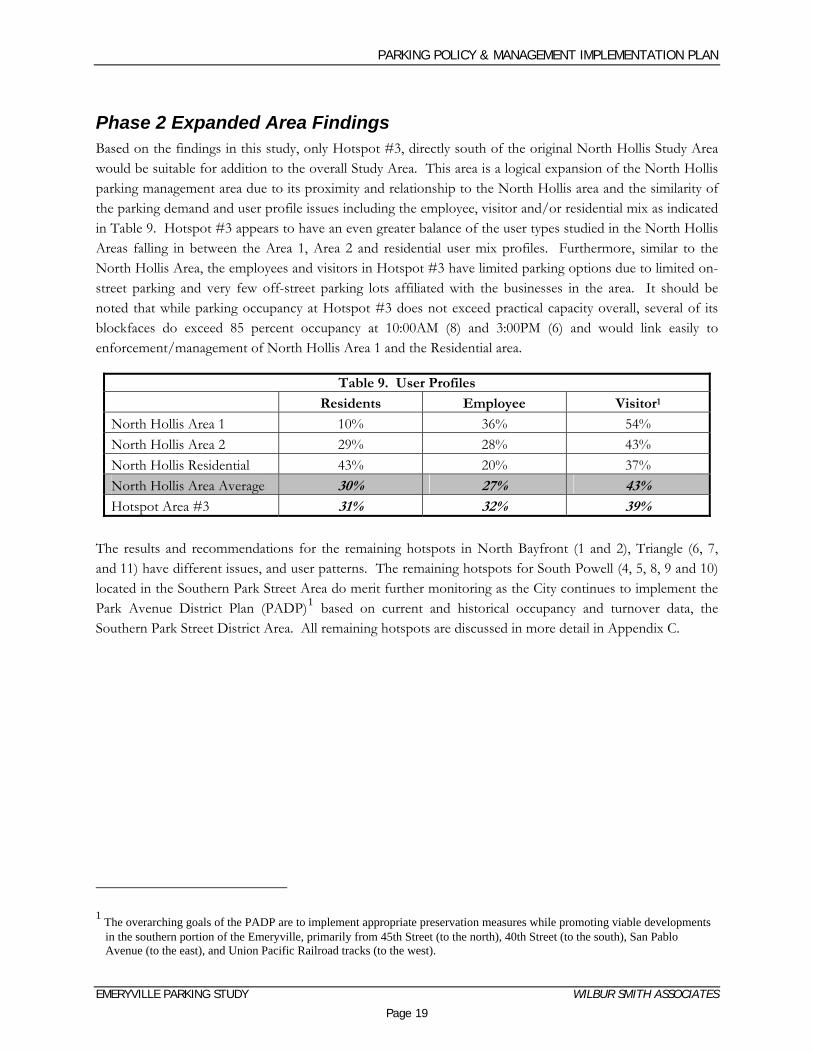
Phase 2 Expanded Area Findings Based on the findings in this study, only Hotspot #3, directly south of the original North Hollis Study Area would be suitable for addition to the overall Study Area. This area is a logical expansion of the North Hollis parking management area due to its proximity and relationship to the North Hollis area and the similarity of the parking demand and user profile issues including the employee, visitor and/or residential mix as indicated in Table 9. Hotspot #3 appears to have an even greater balance of the user types studied in the North Hollis Areas falling in between the Area 1, Area 2 and residential user mix profiles. Furthermore, similar to the North Hollis Area, the employees and visitors in Hotspot #3 have limited parking options due to limited on-street parking and very few off-street parking lots affiliated with the businesses in the area. It should be noted that while parking occupancy at Hotspot #3 does not exceed practical capacity overall, several of its blockfaces do exceed 85 percent occupancy at 10:00AM (8) and 3:00PM (6) and would link easily to enforcement/management of North Hollis Area 1 and the Residential area.
Table 9. User Profiles
Residents Employee Visitor1
North Hollis Area 1 10% 36% 54% North Hollis Area 2 29% 28% 43% North Hollis Residential 43% 20% 37% North Hollis Area Average 30% 27% 43% Hotspot Area #3 31% 32% 39%
The results and recommendations for the remaining hotspots in North Bayfront (1 and 2), Triangle (6, 7, and 11) have different issues, and user patterns. The remaining hotspots for South Powell (4, 5, 8, 9 and 10) located in the Southern Park Street Area do merit further monitoring as the City continues to implement the Park Avenue District Plan (PADP)1 based on current and historical occupancy and turnover data, the Southern Park Street District Area. All remaining hotspots are discussed in more detail in Appendix C. 1 The overarching goals of the PADP are to implement appropriate preservation measures while promoting viable developments
in the southern portion of the Emeryville, primarily from 45th Street (to the north), 40th Street (to the south), San Pablo Avenue (to the east), and Union Pacific Railroad tracks (to the west).
PARKING POLICY & MANAGEMENT IMPLEMENTATION PLAN
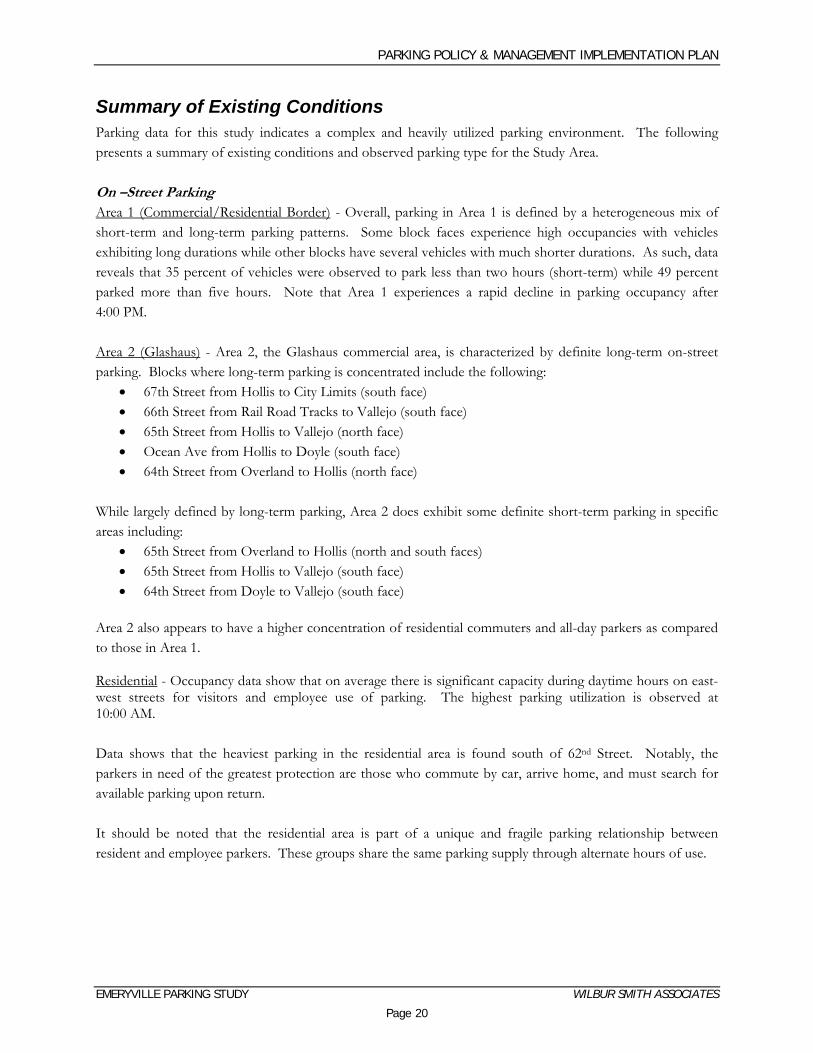
Summary of Existing Conditions Parking data for this study indicates a complex and heavily utilized parking environment. The following presents a summary of existing conditions and observed parking type for the Study Area. On –Street Parking Area 1 (Commercial/Residential Border) - Overall, parking in Area 1 is defined by a heterogeneous mix of short-term and long-term parking patterns. Some block faces experience high occupancies with vehicles exhibiting long durations while other blocks have several vehicles with much shorter durations. As such, data reveals that 35 percent of vehicles were observed to park less than two hours (short-term) while 49 percent parked more than five hours. Note that Area 1 experiences a rapid decline in parking occupancy after 4:00 PM. Area 2 (Glashaus) - Area 2, the Glashaus commercial area, is characterized by definite long-term on-street parking. Blocks where long-term parking is concentrated include the following:
• 67th Street from Hollis to City Limits (south face) • 66th Street from Rail Road Tracks to Vallejo (south face) • 65th Street from Hollis to Vallejo (north face) • Ocean Ave from Hollis to Doyle (south face) • 64th Street from Overland to Hollis (north face)
While largely defined by long-term parking, Area 2 does exhibit some definite short-term parking in specific areas including:
• 65th Street from Overland to Hollis (north and south faces) • 65th Street from Hollis to Vallejo (south face) • 64th Street from Doyle to Vallejo (south face)
Area 2 also appears to have a higher concentration of residential commuters and all-day parkers as compared to those in Area 1. Residential - Occupancy data show that on average there is significant capacity during daytime hours on east-west streets for visitors and employee use of parking. The highest parking utilization is observed at 10:00 AM. Data shows that the heaviest parking in the residential area is found south of 62nd Street. Notably, the parkers in need of the greatest protection are those who commute by car, arrive home, and must search for available parking upon return. It should be noted that the residential area is part of a unique and fragile parking relationship between resident and employee parkers. These groups share the same parking supply through alternate hours of use.
EMERYVILLE PARKING STUDY WILBUR SMITH ASSOCIATES
Page 20
PARKING POLICY & MANAGEMENT IMPLEMENTATION PLAN
Parking Demography in Area 1& Area 2 The rapid decline in occupancy in both areas 1 & 2 after approximately 4:00 PM suggests that the midday occupancy peak is largely attributable to employees parking on-street throughout the work day. The 4:00 AM occupancy data supports this conclusion by distinguishing the parking impact of employees from that of residents. Parking patterns also indicate significantly more residential commuters and all-day parkers in Area 2 than in Area 1. Perhaps that is due to residential units within Area 2 and the fact that there is sufficient on-street parking in the residential area adjacent to Area 1 that meets residents’ needs. Both areas show significant short-term and all-day employee parking use. Off-Street Parking
Surface Parking Lots - Off-street parking lots are significantly underutilized during midday hours with occupancies ranging between 61 to 70 percent. During the same time period on-street occupancy is recorded at 85 to 95 percent. This stark contrast points to the use imbalance of on- and off-street parking. Parking Garages - Overall, multi-purpose serving parking garages are observed to operate well below levels of practical capacity. Occupancies are recorded to range between 29 and 65 percent, with two garages (the Terraces and the Hollis Business Center being the exception at 86 and 96 percent respectively. Similar to surface parking lots, parking garages offer significant capacity to accommodate additional vehicles. Each facility has a unique arrangement to provide parking. Some facilities include parking in the price of rent while other “unbundle” or separate it from the price and are allowed to negotiate for the final parking supply allotment. Parking price also differs between facilities as some have a fixed monthly rent for assigned spaces and others allow additional spaces to be rented at an additional cost. Parking Study Expansion Area The parking study addendum was conducted to determine if a case could be made to expand the Study Area and parking management plan. Based upon the two phases of data collection it was determined that the original North Hollis Study Area should be expanded encompass a parking hotspot (Hotspot #3) immediately south of the original Study Area as shown in Figure 9 in the parking management plan discussion. This resulted in an addition of 268 spaces to the Study Area including two public off-street parking facilities.
EMERYVILLE PARKING STUDY WILBUR SMITH ASSOCIATES
Page 21
PARKING POLICY & MANAGEMENT IMPLEMENTATION PLAN
PARKING MANAGEMENT PLAN Recommendations for parking management are based on an anlysis of existing conditions in the Study Area.with the aim of improving the efficiency and accessibility of the city’s parking resources. Observations of actual parking use, such as vehicle occupancy and the amount of time that vehicles remain parked in different parts of the Study Area, form the basis for the management plan. Extensive in-person surveying of residents, employees, and visitors in the North Hollis area further clarified existing parking problems and potential solutions. In addition, community meetings and meetings with groups such as the Transportation Management Association (TMA) were held. The input received from these meetings helped in the formulation of the plan. Both parking duration data and survey responses indicate that many employees arrive early to find a parking space adjacent to their place of employment, and do not move their vehicle until the end of the work day. The low turnover and high numbers of these long-term parkers significantly reduce the available parking for drivers arriving in the late morning and midday. Short-term parkers such as individuals arriving for meetings at area businesses, students or assistants at schools, and patrons of restaurants, retail, and the area’s light industrial enterprises are forced to drive throughout the area searching for parking until a space is vacated. This lack of midday parking availability can discourage customers from visiting local businesses, increase traffic congestion, and increase travel unpredictability.
Plan Goals In addition to improving the efficiency of commercial area parking conditions, goals of the plan include:
• Protect access to on-street parking for local residents, especially in the residential areas east of Doyle Street, where spillover from the employment area may occur.
• Protect the viability of the industrial areas at the North Hollis Area’s perimeter which have very limited parking.
• Allow the possible implementation of a bus corridor along Hollis Street during commute hours to promote transit use in Emeryville and lower employee dependence on single occupancy vehicles.
Recommendations The study’s recommendations are based on the observed parking conditions, the interview survey findings, the input received from the public, the examination of existing land use types, and the current location of the on- and off-street parking supply. The results of this process are the following recommendations:
• Variable on-street pricing including o Short-term parking area o Long-term parking area
• Residential permit parking program
EMERYVILLE PARKING STUDY WILBUR SMITH ASSOCIATES
Page 22
PARKING POLICY & MANAGEMENT IMPLEMENTATION PLAN
• Hollis Bus Corridor parking restrictions • North Hollis Industrial Area parking
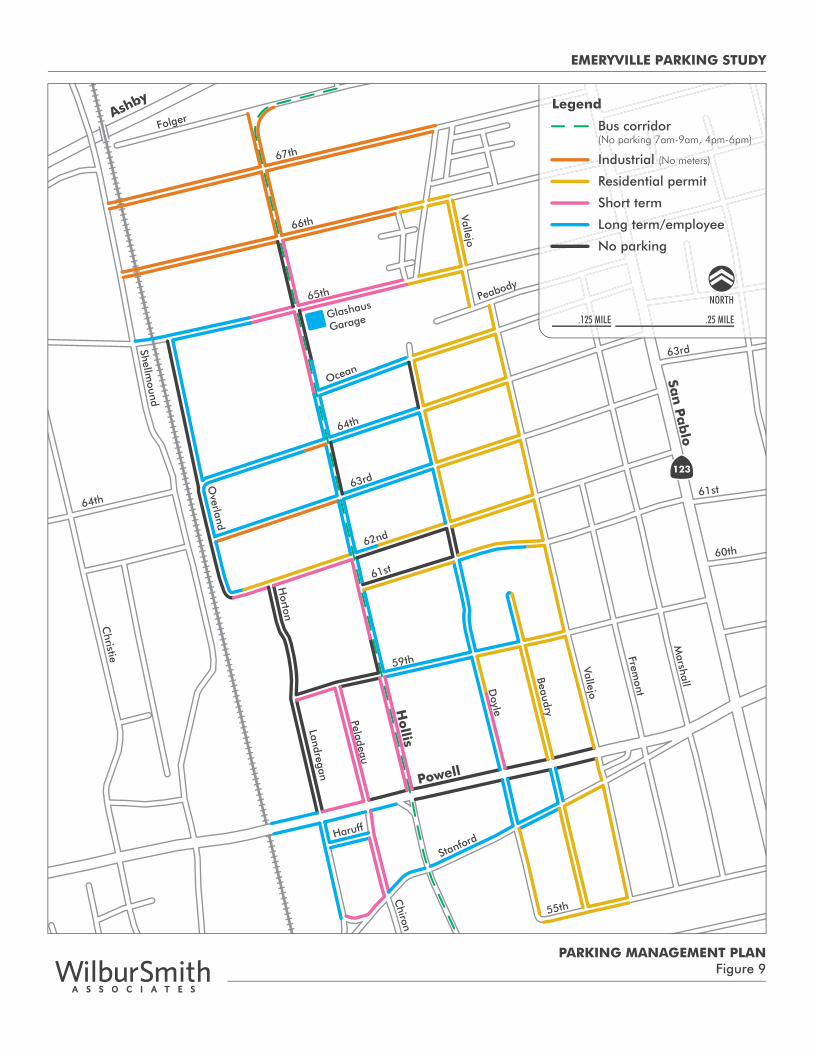
The program recommends a land use based, on-street parking pricing plan, involving variable pricing using multi-space meters in combination with parking permit programs for residents and employees. The map displayed in Figure 9 presents the Parking Management Plan which involves the creation of four curbside classifications designed to address the needs of residents, employees and both short term and long term visitors. A matrix of the parking policy solutions which were considered and an accompanying glossary are presented in Table 10. The evaluation presented in this matrix summarizes the considerations used to develop the recommendations.
Plan Format The parking management plan provides a detailed discussion of parking management recommendations and a section outlining the steps to implement the various elements of the parking management plan. The final section of the Plan presents a ten-year revenue estimate for the program. This includes a detailed staffing plan and itemization of estimated costs of operation, maintenance, and enforcement.
EMERYVILLE PARKING STUDY WILBUR SMITH ASSOCIATES
Page 23
NORTH
.125 MILE .25 MILE
Bus corridor(No parking 7am-9am, 4pm-6pm)
Legend
Industrial (No meters)
Residential permit
Short term
Long term/employee
No parking
Hollis
65th
Glashaus
Garage
66th
67th
Doyle
63rd
64th
Vallejo
59th
Powell
Shellmound
62nd
61st
San
Pab
lo
Stanford
Fremont
Ocean
Christie
55th
Beaudry
Folger
Peladeau
Peabody
Landregan
Marshall
Horton
Overland
Haruff
60th
Chiron
Vallejo
Ashby
63rd
61st64th
123
EMERYVILLE PARKING STUDY
PARKING MANAGEMENT PLANFigure 9
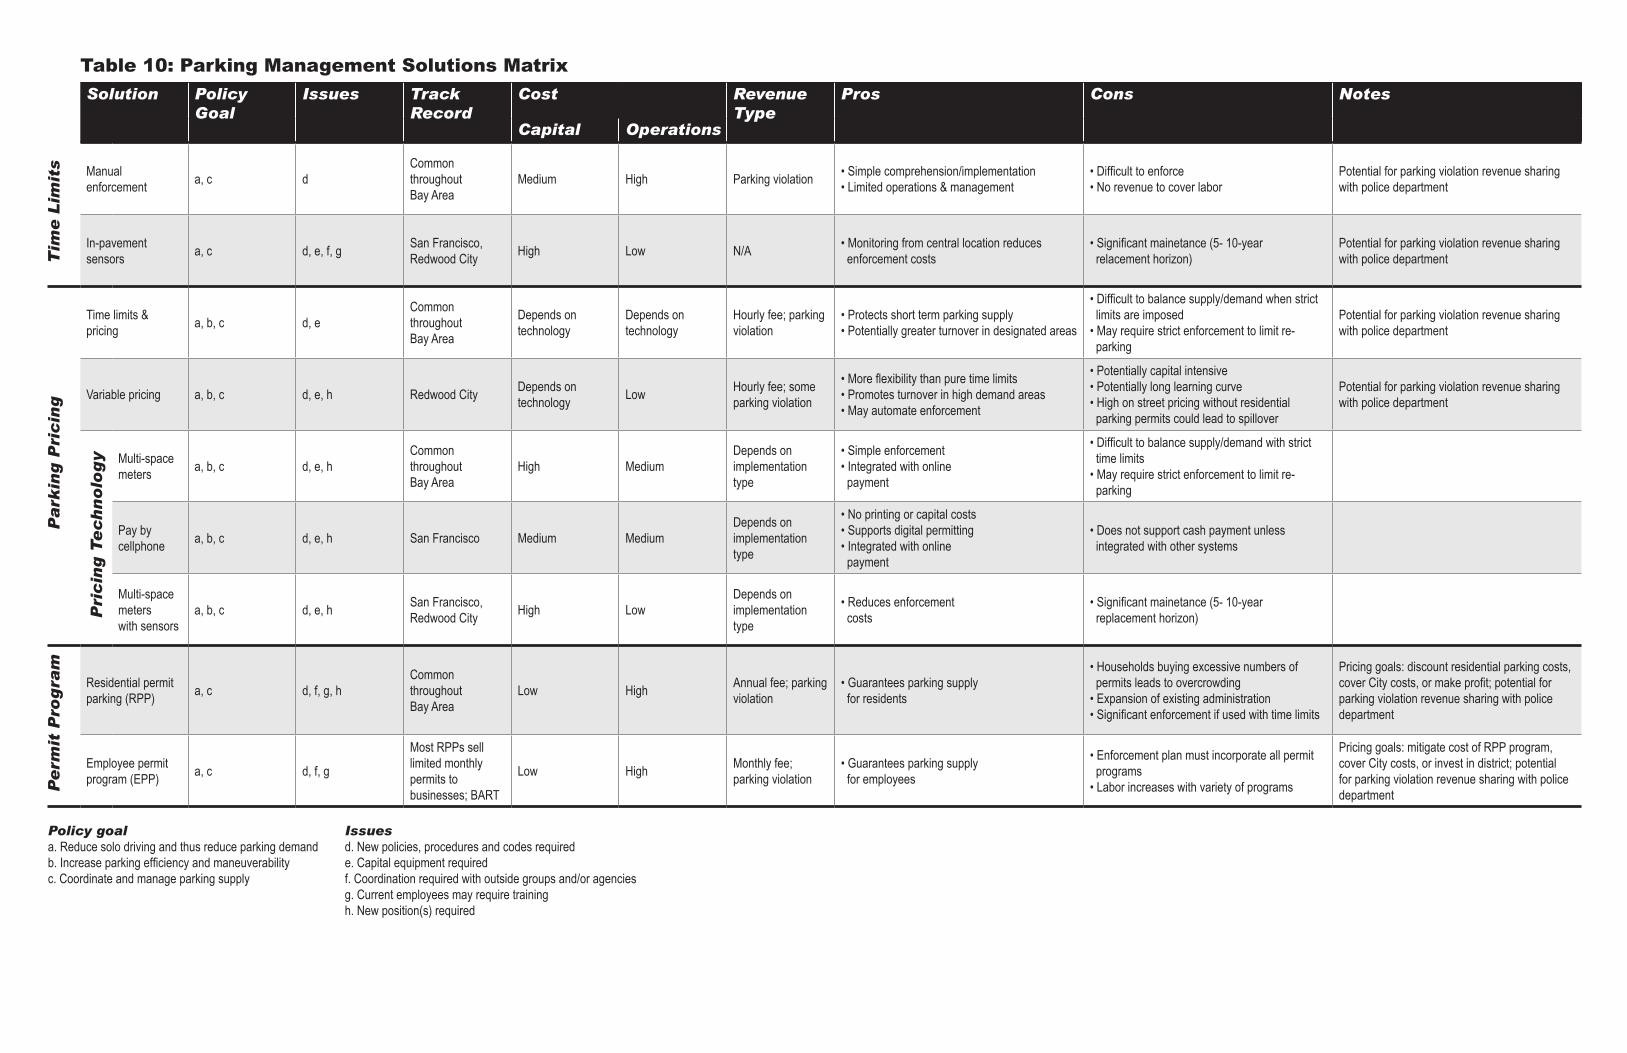
Table 10: Parking Management Solutions MatrixSolution Policy
GoalIssues Track
RecordCost Revenue
TypePros Cons Notes
Capital Operations
Tim
e L
imit
s Manual enforcement a, c d
Common throughoutBay Area
Medium High Parking violation • Simple comprehension/implementation • Limited operations & management
• Difficult to enforce• No revenue to cover labor
Potential for parking violation revenue sharing with police department
In-pavement sensors a, c d, e, f, g San Francisco,
Redwood City High Low N/A • Monitoring from central location reduces enforcement costs
• Significant mainetance (5- 10-year relacement horizon)
Potential for parking violation revenue sharing with police department
Pa
rkin
g P
ric
ing
Time limits & pricing a, b, c d, e
Common throughoutBay Area
Depends on technology
Depends on technology
Hourly fee; parking violation
• Protects short term parking supply • Potentially greater turnover in designated areas
• Difficult to balance supply/demand when strict limits are imposed• May require strict enforcement to limit re- parking
Potential for parking violation revenue sharing with police department
Variable pricing a, b, c d, e, h Redwood City Depends on technology Low Hourly fee; some
parking violation
• More flexibility than pure time limits • Promotes turnover in high demand areas• May automate enforcement
• Potentially capital intensive• Potentially long learning curve• High on street pricing without residential parking permits could lead to spillover
Potential for parking violation revenue sharing with police department
Pri
cin
g T
ech
no
log
y Multi-space meters a, b, c d, e, h
CommonthroughoutBay Area
High MediumDepends on implementation type
• Simple enforcement • Integrated with online payment
• Difficult to balance supply/demand with strict time limits• May require strict enforcement to limit re- parking
Pay by cellphone a, b, c d, e, h San Francisco Medium Medium
Depends on implementation type
• No printing or capital costs • Supports digital permitting • Integrated with online payment
• Does not support cash payment unless integrated with other systems
Multi-space meterswith sensors
a, b, c d, e, h San Francisco, Redwood City High Low
Depends on implementation type
• Reduces enforcement costs
• Significant mainetance (5- 10-year replacement horizon)
Pe
rmit
Pro
gra
m
Residential permit parking (RPP) a, c d, f, g, h
CommonthroughoutBay Area
Low High Annual fee; parking violation
• Guarantees parking supply for residents
• Households buying excessive numbers of permits leads to overcrowding• Expansion of existing administration• Significant enforcement if used with time limits
Pricing goals: discount residential parking costs, cover City costs, or make profit; potential for parking violation revenue sharing with police department
Employee permit program (EPP) a, c d, f, g
Most RPPs sell limited monthly permits to businesses; BART
Low High Monthly fee; parking violation
• Guarantees parking supply for employees
• Enforcement plan must incorporate all permit programs• Labor increases with variety of programs
Pricing goals: mitigate cost of RPP program, cover City costs, or invest in district; potential for parking violation revenue sharing with police department
Policy goala. Reduce solo driving and thus reduce parking demandb. Increase parking efficiency and maneuverabilityc. Coordinate and manage parking supply
Issuesd. New policies, procedures and codes requirede. Capital equipment requiredf. Coordination required with outside groups and/or agenciesg. Current employees may require trainingh. New position(s) required
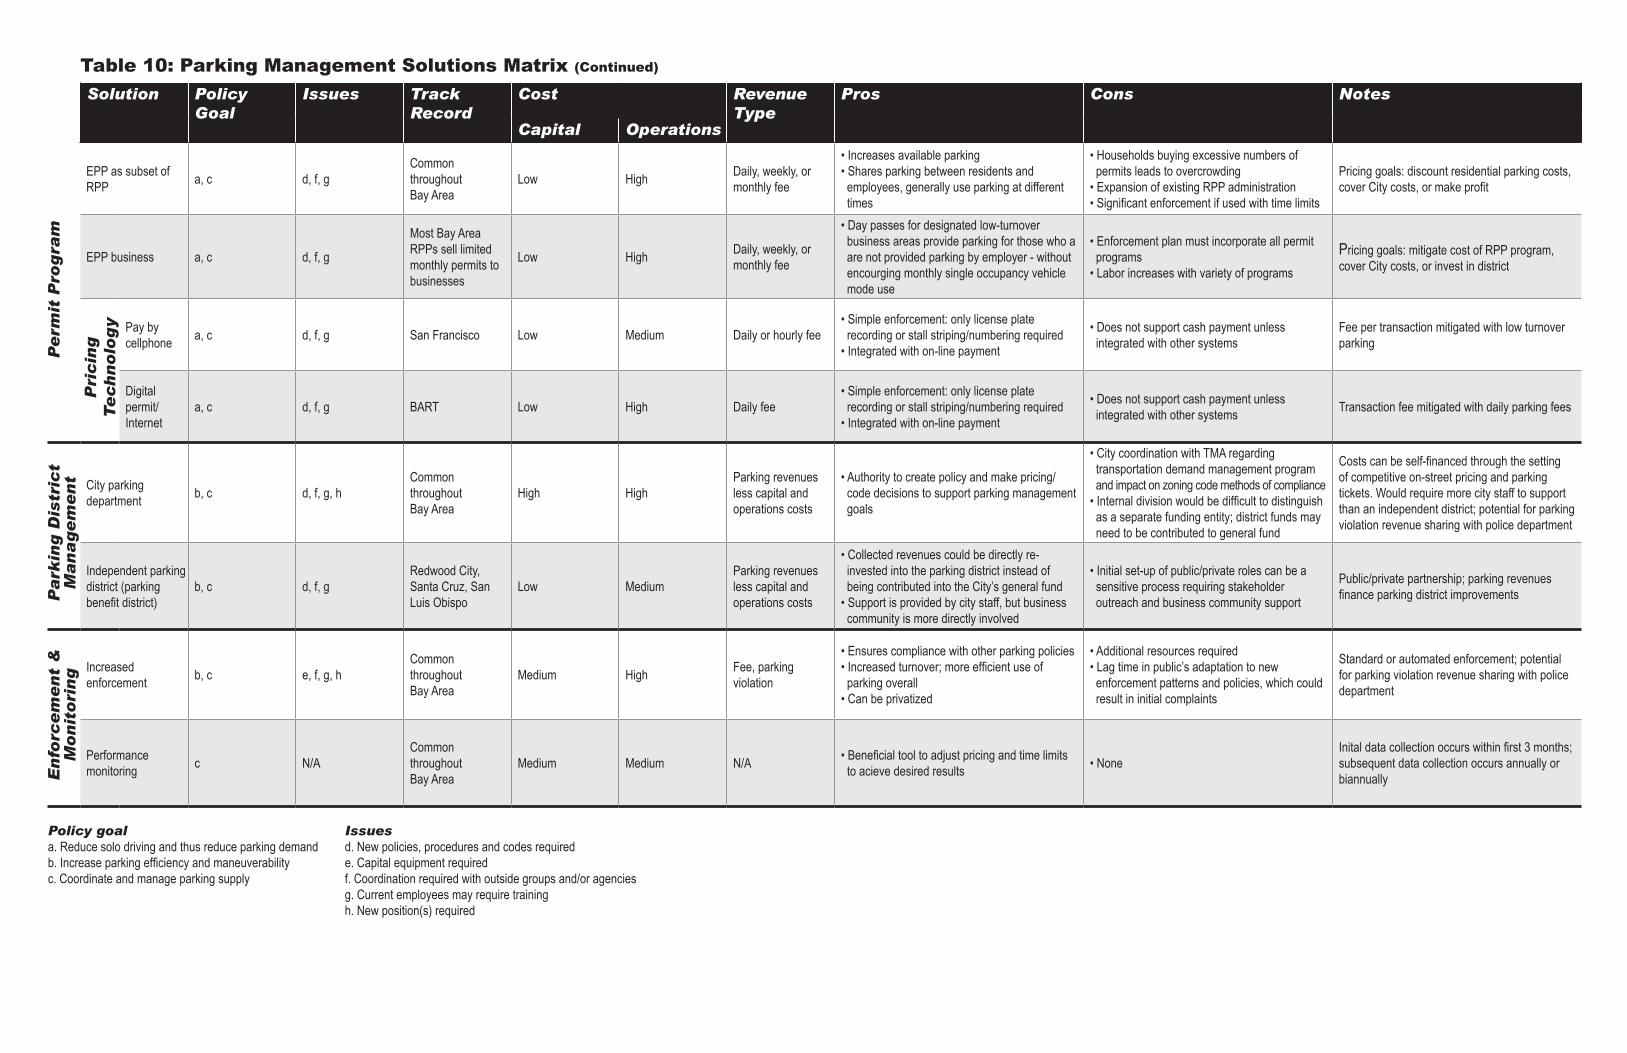
Table 10: Parking Management Solutions Matrix (Continued)
Solution Policy Goal
Issues TrackRecord
Cost RevenueType
Pros Cons Notes
Capital Operations
Pe
rmit
Pro
gra
m
EPP as subset of RPP a, c d, f, g
CommonthroughoutBay Area
Low High Daily, weekly, or monthly fee
• Increases available parking • Shares parking between residents and employees, generally use parking at different times
• Households buying excessive numbers of permits leads to overcrowding• Expansion of existing RPP administration• Significant enforcement if used with time limits
Pricing goals: discount residential parking costs, cover City costs, or make profit
EPP business a, c d, f, g
Most Bay Area RPPs sell limited monthly permits to businesses
Low High Daily, weekly, or monthly fee
• Day passes for designated low-turnover business areas provide parking for those who a are not provided parking by employer - without encourging monthly single occupancy vehicle mode use
• Enforcement plan must incorporate all permit programs• Labor increases with variety of programs
Pricing goals: mitigate cost of RPP program, cover City costs, or invest in district
Pri
cin
g
Te
ch
no
log
y Pay by cellphone a, c d, f, g San Francisco Low Medium Daily or hourly fee
• Simple enforcement: only license plate recording or stall striping/numbering required• Integrated with on-line payment
• Does not support cash payment unless integrated with other systems
Fee per transaction mitigated with low turnover parking
Digital permit/Internet
a, c d, f, g BART Low High Daily fee• Simple enforcement: only license plate recording or stall striping/numbering required• Integrated with on-line payment
• Does not support cash payment unless integrated with other systems Transaction fee mitigated with daily parking fees
Pa
rkin
g D
istr
ict
Ma
na
ge
me
nt City parking
department b, c d, f, g, hCommonthroughoutBay Area
High HighParking revenues less capital and operations costs
• Authority to create policy and make pricing/ code decisions to support parking management goals
• City coordination with TMA regarding transportation demand management program and impact on zoning code methods of compliance• Internal division would be difficult to distinguish as a separate funding entity; district funds may need to be contributed to general fund
Costs can be self-financed through the setting of competitive on-street pricing and parking tickets. Would require more city staff to support than an independent district; potential for parking violation revenue sharing with police department
Independent parking district (parking benefit district)
b, c d, f, gRedwood City, Santa Cruz, San Luis Obispo
Low MediumParking revenues less capital and operations costs
• Collected revenues could be directly re- invested into the parking district instead of being contributed into the City’s general fund• Support is provided by city staff, but business community is more directly involved
• Initial set-up of public/private roles can be a sensitive process requiring stakeholder outreach and business community support
Public/private partnership; parking revenues finance parking district improvements
En
forc
em
en
t &
M
on
ito
rin
g Increased enforcement b, c e, f, g, h
CommonthroughoutBay Area
Medium High Fee, parking violation
• Ensures compliance with other parking policies• Increased turnover; more efficient use of parking overall• Can be privatized
• Additional resources required• Lag time in public’s adaptation to new enforcement patterns and policies, which could result in initial complaints
Standard or automated enforcement; potential for parking violation revenue sharing with police department
Performance monitoring c N/A
CommonthroughoutBay Area
Medium Medium N/A • Beneficial tool to adjust pricing and time limits to acieve desired results • None
Inital data collection occurs within first 3 months; subsequent data collection occurs annually or biannually
Policy goala. Reduce solo driving and thus reduce parking demandb. Increase parking efficiency and maneuverabilityc. Coordinate and manage parking supply
Issuesd. New policies, procedures and codes requirede. Capital equipment requiredf. Coordination required with outside groups and/or agenciesg. Current employees may require trainingh. New position(s) required
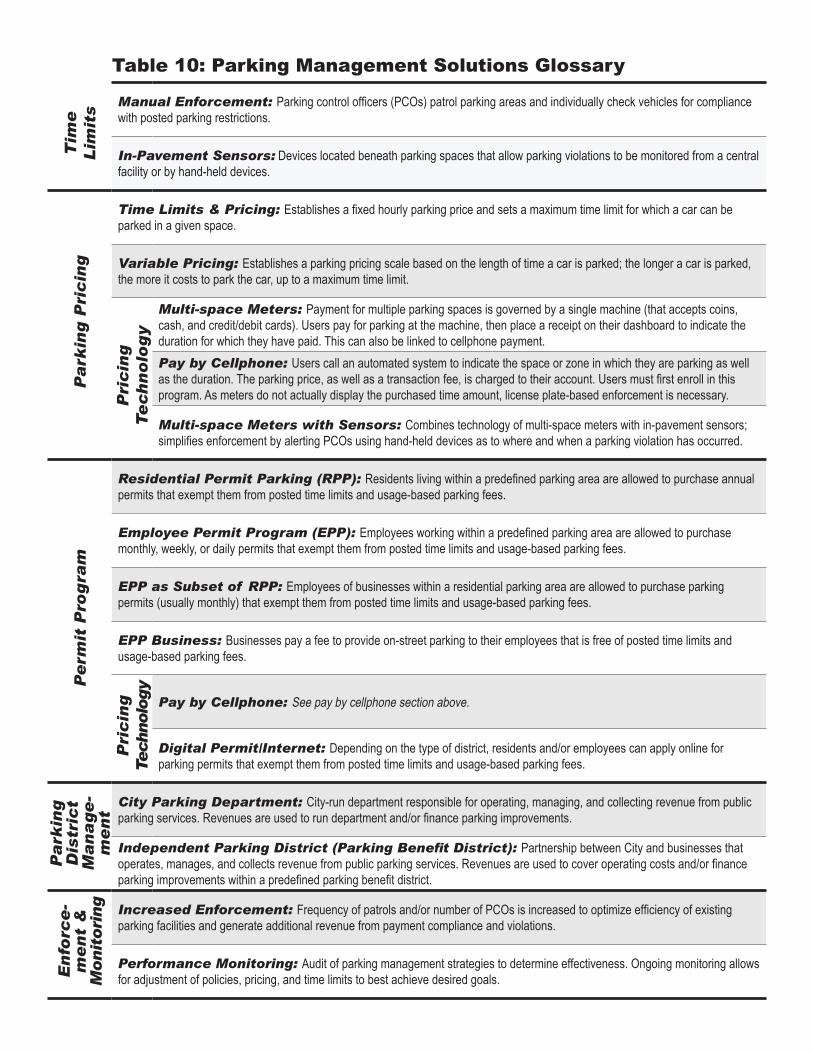
Table 10: Parking Management Solutions GlossaryT
ime
L
imit
sManual Enforcement: Parking control officers (PCOs) patrol parking areas and individually check vehicles for compliance with posted parking restrictions.
In-Pavement Sensors: Devices located beneath parking spaces that allow parking violations to be monitored from a central facility or by hand-held devices.
Pa
rkin
g P
ric
ing
Time Limits & Pricing: Establishes a fixed hourly parking price and sets a maximum time limit for which a car can be parked in a given space.
Variable Pricing: Establishes a parking pricing scale based on the length of time a car is parked; the longer a car is parked, the more it costs to park the car, up to a maximum time limit.
Pri
cin
g
Te
ch
no
log
y
Multi-space Meters: Payment for multiple parking spaces is governed by a single machine (that accepts coins, cash, and credit/debit cards). Users pay for parking at the machine, then place a receipt on their dashboard to indicate the duration for which they have paid. This can also be linked to cellphone payment.Pay by Cellphone: Users call an automated system to indicate the space or zone in which they are parking as well as the duration. The parking price, as well as a transaction fee, is charged to their account. Users must first enroll in this program. As meters do not actually display the purchased time amount, license plate-based enforcement is necessary.
Multi-space Meters with Sensors: Combines technology of multi-space meters with in-pavement sensors; simplifies enforcement by alerting PCOs using hand-held devices as to where and when a parking violation has occurred.
Pe
rmit
Pro
gra
m
Residential Permit Parking (RPP): Residents living within a predefined parking area are allowed to purchase annual permits that exempt them from posted time limits and usage-based parking fees.
Employee Permit Program (EPP): Employees working within a predefined parking area are allowed to purchase monthly, weekly, or daily permits that exempt them from posted time limits and usage-based parking fees.
EPP as Subset of RPP: Employees of businesses within a residential parking area are allowed to purchase parking permits (usually monthly) that exempt them from posted time limits and usage-based parking fees.
EPP Business: Businesses pay a fee to provide on-street parking to their employees that is free of posted time limits and usage-based parking fees.
Pri
cin
gTe
chnolo
gy
Pay by Cellphone: See pay by cellphone section above.
Digital Permit/Internet: Depending on the type of district, residents and/or employees can apply online for parking permits that exempt them from posted time limits and usage-based parking fees.
Pa
rkin
g
Dis
tric
t M
an
age
-m
en
t
City Parking Department: City-run department responsible for operating, managing, and collecting revenue from public parking services. Revenues are used to run department and/or finance parking improvements.
Independent Parking District (Parking Benefit District): Partnership between City and businesses that operates, manages, and collects revenue from public parking services. Revenues are used to cover operating costs and/or finance parking improvements within a predefined parking benefit district.
En
forc
e-
me
nt
&
Monit
ori
ng Increased Enforcement: Frequency of patrols and/or number of PCOs is increased to optimize efficiency of existing
parking facilities and generate additional revenue from payment compliance and violations.
Performance Monitoring: Audit of parking management strategies to determine effectiveness. Ongoing monitoring allows for adjustment of policies, pricing, and time limits to best achieve desired goals.
PARKING POLICY & MANAGEMENT IMPLEMENTATION PLAN
PARKING MANAGEMENT PLAN RECOMMENDATIONS This Plan recommends implementing variable pricing throughout the North Hollis Area to achieve the parking management objectives. Potential technology and price configurations are discussed in greater detail in the sections that follow. Recommendations for preserving residential parking access, as well as issues relating to industrial areas and a potential bus corridor are also covered.
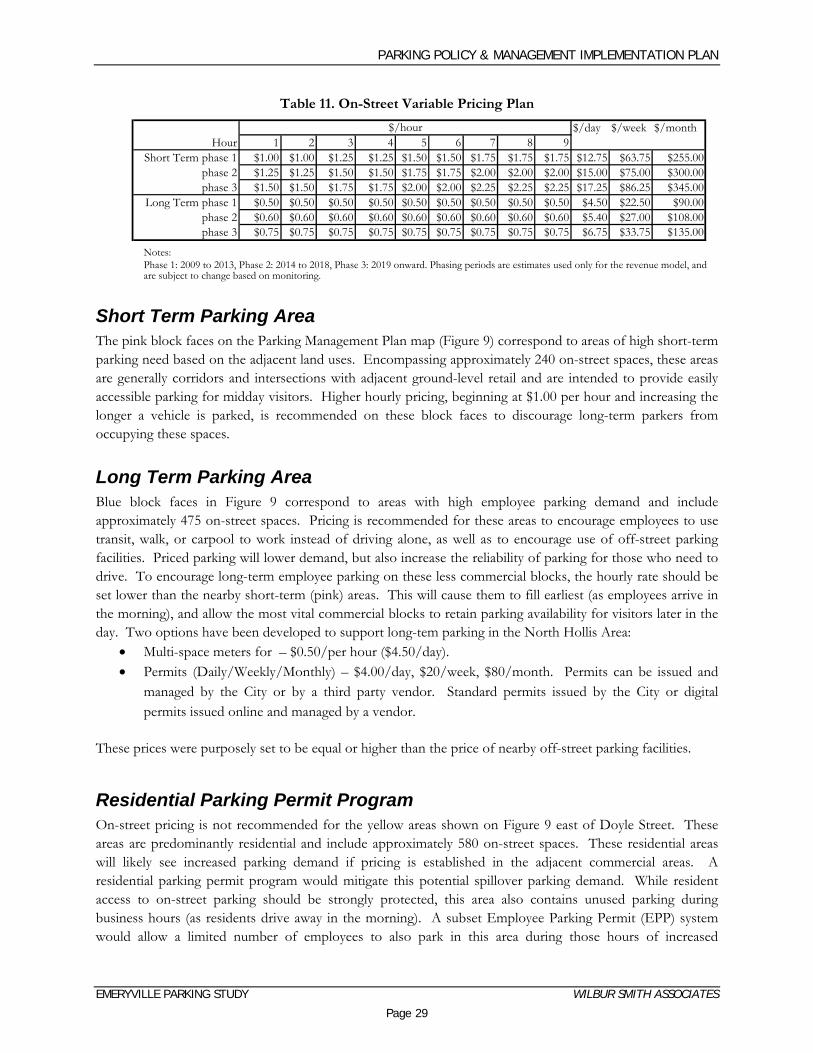
Variable On-Street Pricing Variable on-street pricing can increase vehicle turnover in parking spaces that are highly desirable, particularly those that are near retail and commercial destinations. To encourage short term parking and discourage drivers from leaving their vehicle in the same space all day, the hourly parking rate is increased the longer a vehicle is parked. This provides an economic incentive for long-term parkers to move to peripheral parking. Parkers are allowed to stay as long as they need, but it is assumed due the price gradient that they will minimize their stay, or find cheaper long term parking nearby. Time limits aim to achieve the same goals as variable pricing (higher turnover and more short term parking availability), but variable pricing provides more flexibility for users and is easier to enforce. Time limits impose an artificial maximum parking period which can frustrate short- and medium-term parkers and dissuade impulse shoppers and other visitors. By charging more (per hour) to stay beyond two hours, variable pricing gives parkers flexibility to stay longer, but also encourages them to use designated long-term parking spaces for longer stays. Enforcement officers are spared having to chalk tires and keep track of when vehicles come and go. Instead, enforcement is based simply on whether the parker has paid for sufficient time. Some technologies actually allow the user to extend the time for which they have paid using their cell-phone. This also reduces the role of high-priced violation penalties in parking revenue; by relying on pricing, parking costs are spread among all users in a more predictable manner. WSA recommends purchasing and installing multi-space meters, typically one per block face or one per eight on-street stalls. Table 11 outlines the proposed pricing plan for short-term and long-term on-street parking meters. Variable pricing is proposed in the short-term parking areas to encourage two-hour turnover, and discourage long-term use. The amount of the fee in the long-term areas was purposely set to be similar or more than the cost of parking in the nearby public Amtrak and Terraces off-street parking facilities, which cost $80 to $85 per month, or approximately $0.50/hour. Nearby non-public off-street parking spaces range in cost from $75 to $110 per month, though these costs are often paid for by area employers, and are therefore less indicative of public parking demand. A phasing schedule for a gradual increase in prices is proposed as the program matures.
EMERYVILLE PARKING STUDY WILBUR SMITH ASSOCIATES
Page 28
PARKING POLICY & MANAGEMENT IMPLEMENTATION PLAN
Table 11. On-Street Variable Pricing Plan $/day $/week $/month
Hour 1 2 3 4 5 6 7 8 9Short Term phase 1 $1.00 $1.00 $1.25 $1.25 $1.50 $1.50 $1.75 $1.75 $1.75 $12.75 $63.75 $255.00
phase 2 $1.25 $1.25 $1.50 $1.50 $1.75 $1.75 $2.00 $2.00 $2.00 $15.00 $75.00 $300.00phase 3 $1.50 $1.50 $1.75 $1.75 $2.00 $2.00 $2.25 $2.25 $2.25 $17.25 $86.25 $345.00
Long Term phase 1 $0.50 $0.50 $0.50 $0.50 $0.50 $0.50 $0.50 $0.50 $0.50 $4.50 $22.50 $90.00phase 2 $0.60 $0.60 $0.60 $0.60 $0.60 $0.60 $0.60 $0.60 $0.60 $5.40 $27.00 $108.00phase 3 $0.75 $0.75 $0.75 $0.75 $0.75 $0.75 $0.75 $0.75 $0.75 $6.75 $33.75 $135.00
$/hour
Notes: Phase 1: 2009 to 2013, Phase 2: 2014 to 2018, Phase 3: 2019 onward. Phasing periods are estimates used only for the revenue model, and are subject to change based on monitoring.
Short Term Parking Area The pink block faces on the Parking Management Plan map (Figure 9) correspond to areas of high short-term parking need based on the adjacent land uses. Encompassing approximately 240 on-street spaces, these areas are generally corridors and intersections with adjacent ground-level retail and are intended to provide easily accessible parking for midday visitors. Higher hourly pricing, beginning at $1.00 per hour and increasing the longer a vehicle is parked, is recommended on these block faces to discourage long-term parkers from occupying these spaces.
Long Term Parking Area Blue block faces in Figure 9 correspond to areas with high employee parking demand and include approximately 475 on-street spaces. Pricing is recommended for these areas to encourage employees to use transit, walk, or carpool to work instead of driving alone, as well as to encourage use of off-street parking facilities. Priced parking will lower demand, but also increase the reliability of parking for those who need to drive. To encourage long-term employee parking on these less commercial blocks, the hourly rate should be set lower than the nearby short-term (pink) areas. This will cause them to fill earliest (as employees arrive in the morning), and allow the most vital commercial blocks to retain parking availability for visitors later in the day. Two options have been developed to support long-tem parking in the North Hollis Area:
• Multi-space meters for – $0.50/per hour ($4.50/day). • Permits (Daily/Weekly/Monthly) – $4.00/day, $20/week, $80/month. Permits can be issued and
managed by the City or by a third party vendor. Standard permits issued by the City or digital permits issued online and managed by a vendor.
These prices were purposely set to be equal or higher than the price of nearby off-street parking facilities.
Residential Parking Permit Program On-street pricing is not recommended for the yellow areas shown on Figure 9 east of Doyle Street. These areas are predominantly residential and include approximately 580 on-street spaces. These residential areas will likely see increased parking demand if pricing is established in the adjacent commercial areas. A residential parking permit program would mitigate this potential spillover parking demand. While resident access to on-street parking should be strongly protected, this area also contains unused parking during business hours (as residents drive away in the morning). A subset Employee Parking Permit (EPP) system would allow a limited number of employees to also park in this area during those hours of increased
EMERYVILLE PARKING STUDY WILBUR SMITH ASSOCIATES
Page 29
PARKING POLICY & MANAGEMENT IMPLEMENTATION PLAN
EMERYVILLE PARKING STUDY WILBUR SMITH ASSOCIATES
Page 30
availability without infringing on the availability of parking for residents. Currently this area is relied upon heavily for long-term parking. Parking occupancy and duration data for the residential area indicated that 37 percent of residents leave the area before 10:00 AM, and 21 percent of residents leave before 3:00 PM, making space available for employees and visitors. Parking patterns indicate that most new parkers in this area arrive before 10:00 AM. WSA recommends that initially the City sell no more than 215 permits to employees, available for employees during business hours. While this represents a recommended maximum, the City may refine the distribution method through outreach to residents, and may wish to place a permit cap per household, or distribute residential and employee permits in different phases to better observe and balance the demand between residents and employees. Additionally, a two hour limit should be enforced in this area to allow visitors to park in the unused midday spaces. The City currently issues parking permits through the Finance department. Applicants are required to provide vehicle registration and proof of residency. An expanded residential and employee permit program can be managed under the same system, either through traditional placards/stickers or through digital permits and managed through a third party vendor, as discussed above. WSA recommends that the City maintain the current residential permit cost and sell employee permits at a rate similar to that charged at the nearby Amtrak parking lot, (which is set by a private operator, Wareham Properties) and other nearby private off-street parking. Parking usage in the area would be periodically monitored to assure that the residents would have sufficient parking available and that those employees with permits would be able to find a space. The number of permits sold to employees would then be adjusted as appropriate.
• Residential Permits - $20/year residential; • Employee Permits - $4.00/day, $20/week, $80/month. Permits can be issued and managed by the
City or by a third party vendor. Standard permits issued by the City or digital permits issued online and managed by a vendor.
Hollis Street Bus Corridor The City is considering restricting parking availability along Hollis Street during morning and evening commute times (7:00 to 9:00 AM and 4:00 to 6:00 PM), to allow for the provision of special bus-only lanes. This could provide faster, more reliable bus service which would promote increased transit use.2
North Hollis Industrial Area Those portions of the Study Area which are predominantly industrial are recommended to have no on-street parking pricing or time limit restrictions. The historic industrial buildings in these areas have limited or no off-street parking. There are irregular, discontinuous curbs and sidewalks due to the need to provide truck access to off-street loading facilities. These features make paid on-street parking systems impractical and counterproductive. Industrial areas should be monitored for any potential spillover from nearby paid parking areas, however. The map in Figure 9 also shows the existing block faces which are designated as “no-parking” zones.3 2 The City is currently studying the effect of alternative signal timings and bus signal preemption at intersections on Hollis Street to increase bus
throughput during commute hours. If results are favorable, time limit restrictions may not be required. 3 These street segments have no parking due to turn lanes, driveways, fire hydrants, narrow travel ways, parks, playgrounds, bike lanes and traffic
lane priority (Powell Street).
PARKING POLICY & MANAGEMENT IMPLEMENTATION PLAN
PARKING MANAGEMENT PLAN PHASING The order and extent to which parking management changes are implemented can significantly affect their success. Pricing, time limits, and permitting affect parking demand and can therefore cause significant changes to an area’s occupancy rates, revenue, enforcement needs, and monitoring approaches. Implementing each change gradually and in the appropriate order ensures that users have time to adapt to the new parking environment. Proper phasing also allows observation of the effects of each change, to determine whether each is successful and whether more investment is warranted. Empirically testing the effects of new technologies and policies will protect the City from making unnecessarily large capital outlays, and illuminate the most successful (and cost effective) management approaches. The following general phasing approach is recommended for the City of Emeryville’s Parking Management Plan:
1. Implement Pricing in Short Term Areas 2. Monitor & Adjust 3. Implement Pricing in Long Term Areas 4. Monitor Residential Spillover and Determine Need for RPP Program
1. Implement Pricing – Short Term Areas Implementing pricing on the short-term parking block faces (as shown in Figure 9) should be the first program phase. Installing payment technology only in limited areas initially has several benefits. First, it allows drivers time to acclimate to the shift from free parking to paid parking, giving them time to become familiar with the meter technology and hourly rates. Second, a limited initial introduction allows the City to gain experience with equipment installation, maintenance, and enforcement issues while facing minimal risk of serious widespread problems. The up front capital costs, and attendant risk, are also minimized by phasing in pricing payment technologies.
2. Monitoring & Adjustment After installing payment technologies in the short term parking areas, parking occupancy and driver behavior should be observed, and any user problems or suggestions should be recorded and evaluated. Driver and citizen opinions will very likely shift over time as familiarity with the new technology and policies increases, and as the advantages of greater parking availability and reliability become increasingly apparent.
3. Implement Pricing – Long Term Areas Based on user feedback and observations, payment technology should next be extended to the long term parking areas. Some adjustments to the specific technology configurations may need to be made at this point, based on the City’s experience with parking implementation in the short term parking areas. The first major round of monitoring should occur within three to six months of meter installation, to allow some time for users to acclimate to changes. Subsequent monitoring should follow at least once per year.
EMERYVILLE PARKING STUDY WILBUR SMITH ASSOCIATES
Page 31
PARKING POLICY & MANAGEMENT IMPLEMENTATION PLAN
EMERYVILLE PARKING STUDY WILBUR SMITH ASSOCIATES
Page 32
4. Monitor Residential Spillover Further monitoring of occupancy, violations, and meter revenue should follow this broader pricing implementation. Any increased occupancy in the adjacent residential areas is of particular importance to note, as this can indicate the degree to which drivers are willing to avoid priced parking. If residential area spillover increases to an untenable level, an expansion of the City’s residential parking permit (RPP) program is one potential mitigation. By phasing in each parking management change, the City will avoid unnecessary administrative and capital costs and benefit from early experience gained through limited pricing introductions. Implementing pricing in the short term areas first, for example, allows users to become familiar with the technology, and provides the City opportunities to make adjustments to technologies, policies, and enforcement. Focusing on a potential RPP expansion after, rather than before, pricing implementation can prevent unnecessary administrative burdens by determining whether spillover is significantly impacted by pricing. Monitoring and analysis of parking behavior both before and after every phase is extremely important, as this provides baseline measurements to empirically measure benefits and potential problems as they develop.
IMPLEMENTATION STEPS The following section describes specific, sequential actions that can lead to effective implementation of parking pricing, residential permit parking, and ongoing monitoring of parking conditions and policy effectiveness in Emeryville. These approaches should be implemented based on the overall phasing guidelines described in the previous section, and may be adjusted based on policy priorities or changes to the parking environment.
Parking Pricing Program As outlined in the Parking Management Plan Phasing section, the following steps provide a framework for the implementation of short-term area pricing, followed by monitoring, and finally broader pricing in long-term parking areas. Planning
1. Confirm the boundaries of pricing areas4 2. Approve pricing plan5 3. Select pricing technology
a. Short-term parking: multi-space meters, b. Long term parking:
i. Multi-space meters ii. Pay-by-cell phone iii. Employee permits
4 Refer to Figure 9, p. 24 5 Refer to Table 11, p. 29
PARKING POLICY & MANAGEMENT IMPLEMENTATION PLAN
EMERYVILLE PARKING STUDY WILBUR SMITH ASSOCIATES
Page 33
4. Identify funding for initial program start up including capital costs and costs of operation, maintenance and enforcement
5. Develop Administrative Framework to manage program a. Develop a staffing plan to define responsibilities, including the hiring and the training of
needed staff, 6 b. Develop legal framework; amend zoning ordinances as required
6. Public notice, education, and outreach (focus to business, overview to residents) Installation
7. Installation a. Confirm location of multi-space meters or pay-by-cell signage. Generally, only one multi-
space meter is required per block face or one for each eight spaces. b. Prepare and issue a request for proposals for multi-space parking meters in short-term
parking locations to qualified vendors. c. Choose preferred vendor and negotiate terms and conditions for short-term areas. d. Monitor occupancy, compliance, enforcement issues, and operational issues; adjust future
equipment orders and policies accordingly. e. Fully implement parking technology in long-term areas, based on previous results.
Monitoring
8. Monitor implementation of full area pricing (see detailed discussion of monitoring below). Further adjustments may be needed based on future demand, though sufficient time should be allowed for drivers to adapt to pricing before secondary changes.
Residential Permit Parking Program A residential permit parking (RPP) program can effectively control spillover parking from commercial areas on residential block faces. As discussed in the Parking Management Plan Phasing section, implementation of an RPP should be based on observations of excessive on-street parking from non-residential vehicles. Pricing should be implemented prior to implementation of an RPP, so that ongoing monitoring can be used to identify the source of any parking problems that emerge in residential areas. The City of Emeryville has enumerated RPP guidelines that are compatible with the following implementation steps:
1. Collect occupancy data by block face in residential area 2. Confirm early morning residential turnover (3:00 AM to 5:00 AM) to calculate available business
permits out of total residential parking supply. 3. Select block faces for permitting based on a minimum of 75% on-street occupancy 4. Conduct public outreach/education (focus on residents) 5. Conduct neighborhood petition by block face 6. Approve pricing plan as recommended
6 Refer to Table 13, p. 39
PARKING POLICY & MANAGEMENT IMPLEMENTATION PLAN
7. Select permitting technology a. Digital/internet b. Paper/placard
8. Create and sell Residential Parking Permits to residents of areas marked for protection 9. Create and sell limited Employee Parking Permits to employees in residential area – based on
residential turnover data. 10. Establish and enforce 2-hour time limits to eliminate free unlimited parking in residential area.
Parking Monitoring and Adjustment
Annual monitoring of parking occupancies will be required to measure the effects of the pricing program and allow for pricing adjustments to meet occupancy goals as necessary. An annual monitoring program beginning three months after program initiation should consist of occupancy counts in the early morning and at typical peak times throughout the district at on- and off-street locations, to measure residential use and the shift in occupancy due to new pricing programs. Time periods to monitor based on existing conditions include:
• Early Morning 4:00 AM-5:00 AM • Midweek-Midday 11:00 AM-1:00 PM • Midweek-Evening 4:00 PM-7:00 PM
Where and when the on-street occupancy is higher than 85 percent (practical capacity) during peak times, the City should consider the following steps:
• Increase meter prices incrementally. WSA recommends increments of $0.25/hour. • Re-evaluate residential parking programs as necessary.
If the on-street occupancy at meters has decreased significantly and created spillover occupancy onto nearby neighborhood streets, the City should consider the following steps:
• Decrease meter prices incrementally in areas of concern. • Re-evaluate residential parking programs as necessary.
EMERYVILLE PARKING STUDY WILBUR SMITH ASSOCIATES
Page 34
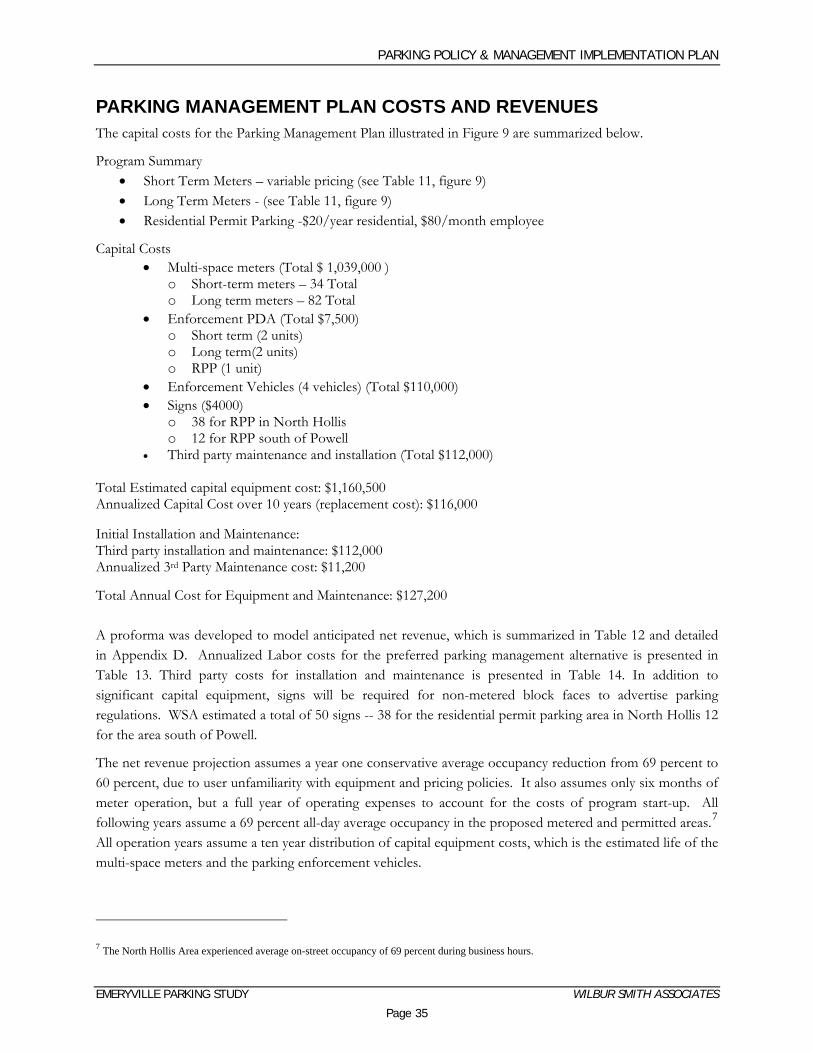
PARKING POLICY & MANAGEMENT IMPLEMENTATION PLAN
EMERYVILLE PARKING STUDY WILBUR SMITH ASSOCIATES
Page 35
PARKING MANAGEMENT PLAN COSTS AND REVENUES The capital costs for the Parking Management Plan illustrated in Figure 9 are summarized below.
Program Summary • Short Term Meters – variable pricing (see Table 11, figure 9) • Long Term Meters - (see Table 11, figure 9) • Residential Permit Parking -$20/year residential, $80/month employee
Capital Costs • Multi-space meters (Total $ 1,039,000 )
o Short-term meters – 34 Total o Long term meters – 82 Total
• Enforcement PDA (Total $7,500) o Short term (2 units) o Long term(2 units) o RPP (1 unit)
• Enforcement Vehicles (4 vehicles) (Total $110,000) • Signs ($4000)
o 38 for RPP in North Hollis o 12 for RPP south of Powell
• Third party maintenance and installation (Total $112,000) Total Estimated capital equipment cost: $1,160,500 Annualized Capital Cost over 10 years (replacement cost): $116,000 Initial Installation and Maintenance: Third party installation and maintenance: $112,000 Annualized 3rd Party Maintenance cost: $11,200 Total Annual Cost for Equipment and Maintenance: $127,200
A proforma was developed to model anticipated net revenue, which is summarized in Table 12 and detailed in Appendix D. Annualized Labor costs for the preferred parking management alternative is presented in Table 13. Third party costs for installation and maintenance is presented in Table 14. In addition to significant capital equipment, signs will be required for non-metered block faces to advertise parking regulations. WSA estimated a total of 50 signs -- 38 for the residential permit parking area in North Hollis 12 for the area south of Powell.
The net revenue projection assumes a year one conservative average occupancy reduction from 69 percent to 60 percent, due to user unfamiliarity with equipment and pricing policies. It also assumes only six months of meter operation, but a full year of operating expenses to account for the costs of program start-up. All following years assume a 69 percent all-day average occupancy in the proposed metered and permitted areas.7 All operation years assume a ten year distribution of capital equipment costs, which is the estimated life of the multi-space meters and the parking enforcement vehicles.
7 The North Hollis Area experienced average on-street occupancy of 69 percent during business hours.
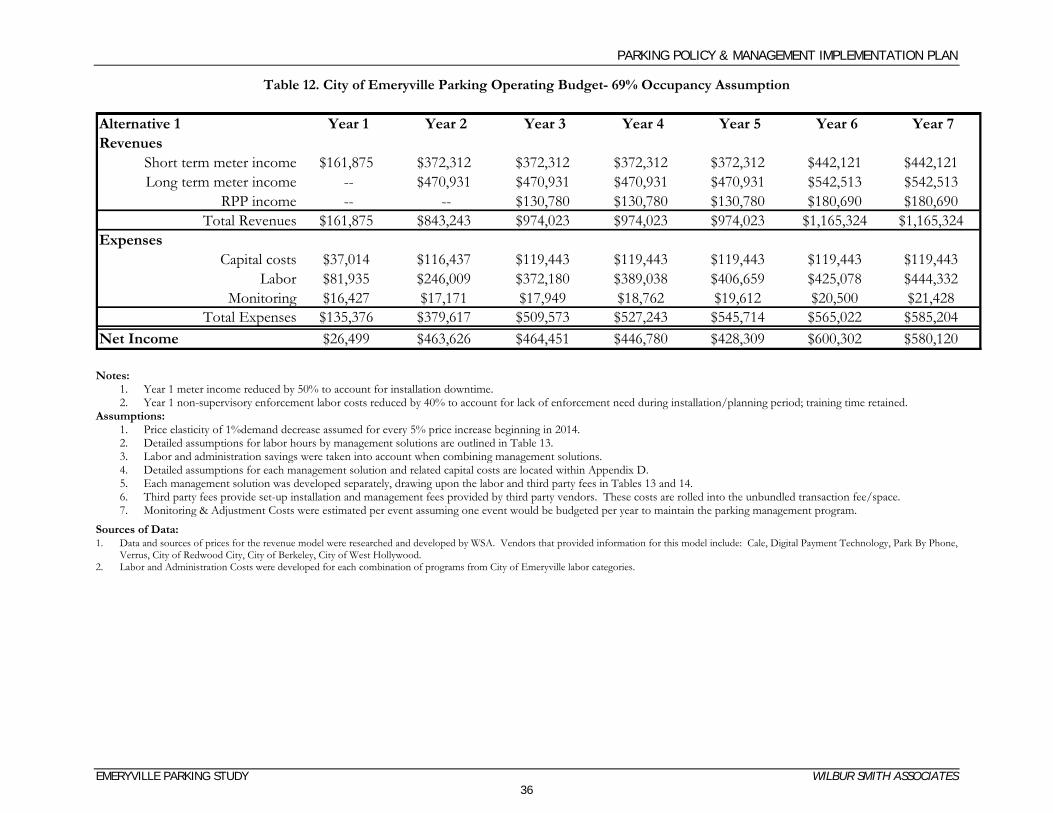
Alternative 1 Year 1 Year 2 Year 3 Year 4 Year 5 Year 6 Year 7Revenues
Short term meter income $161,875 $372,312 $372,312 $372,312 $372,312 $442,121 $442,121Long term meter income -- $470,931 $470,931 $470,931 $470,931 $542,513 $542,513
RPP income -- -- $130,780 $130,780 $130,780 $180,690 $180,690Total Revenues $161,875 $843,243 $974,023 $974,023 $974,023 $1,165,324 $1,165,324
ExpensesCapital costs $37,014 $116,437 $119,443 $119,443 $119,443 $119,443 $119,443
Labor $81,935 $246,009 $372,180 $389,038 $406,659 $425,078 $444,332Monitoring $16,427 $17,171 $17,949 $18,762 $19,612 $20,500 $21,428
Total Expenses $135,376 $379,617 $509,573 $527,243 $545,714 $565,022 $585,204Net Income $26,499 $463,626 $464,451 $446,780 $428,309 $600,302 $580,120
PARKING POLICY & MANAGEMENT IMPLEMENTATION PLAN
EMERYVILLE PARKING STUDY WILBUR SMITH ASSOCIATES 36
Table 12. City of Emeryville Parking Operating Budget- 69% Occupancy Assumption
Notes:
1. Year 1 meter income reduced by 50% to account for installation downtime. 2. Year 1 non-supervisory enforcement labor costs reduced by 40% to account for lack of enforcement need during installation/planning period; training time retained.
Assumptions: 1. Price elasticity of 1%demand decrease assumed for every 5% price increase beginning in 2014. 2. Detailed assumptions for labor hours by management solutions are outlined in Table 13. 3. Labor and administration savings were taken into account when combining management solutions. 4. Detailed assumptions for each management solution and related capital costs are located within Appendix D. 5. Each management solution was developed separately, drawing upon the labor and third party fees in Tables 13 and 14. 6. Third party fees provide set-up installation and management fees provided by third party vendors. These costs are rolled into the unbundled transaction fee/space. 7. Monitoring & Adjustment Costs were estimated per event assuming one event would be budgeted per year to maintain the parking management program.
Sources of Data: 1. Data and sources of prices for the revenue model were researched and developed by WSA. Vendors that provided information for this model include: Cale, Digital Payment Technology, Park By Phone,
Verrus, City of Redwood City, City of Berkeley, City of West Hollywood. 2. Labor and Administration Costs were developed for each combination of programs from City of Emeryville labor categories.
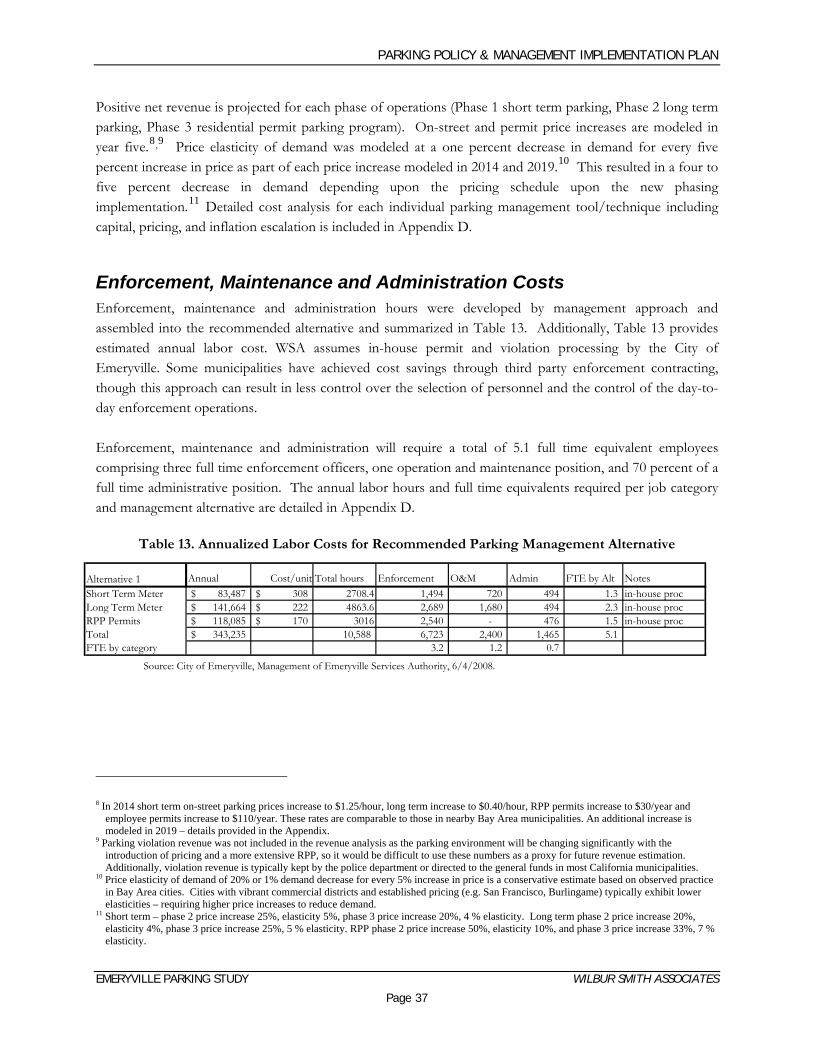
PARKING POLICY & MANAGEMENT IMPLEMENTATION PLAN
EMERYVILLE PARKING STUDY WILBUR SMITH ASSOCIATES
Page 37
Alternative 1 Annual Cost/unit Total hours Enforcement O&M Admin FTE by Alt NotesShort Term Meter 83,487$ 308$ 2708.4 1,494 720 494 1.3 in-house procLong Term Meter 141,664$ 222$ 4863.6 2,689 1,680 494 2.3 in-house procRPP Permits 118,085$ 170$ 3016 2,540 - 476 1.5 in-house procTotal 343,235$ 10,588 6,723 2,400 1,465 5.1 FTE by category 3.2 1.2 0.7
Positive net revenue is projected for each phase of operations (Phase 1 short term parking, Phase 2 long term parking, Phase 3 residential permit parking program). On-street and permit price increases are modeled in year five.8 ,9 Price elasticity of demand was modeled at a one percent decrease in demand for every five percent increase in price as part of each price increase modeled in 2014 and 2019.10 This resulted in a four to five percent decrease in demand depending upon the pricing schedule upon the new phasing implementation.11 Detailed cost analysis for each individual parking management tool/technique including capital, pricing, and inflation escalation is included in Appendix D.
Enforcement, Maintenance and Administration Costs Enforcement, maintenance and administration hours were developed by management approach and assembled into the recommended alternative and summarized in Table 13. Additionally, Table 13 provides estimated annual labor cost. WSA assumes in-house permit and violation processing by the City of Emeryville. Some municipalities have achieved cost savings through third party enforcement contracting, though this approach can result in less control over the selection of personnel and the control of the day-to-day enforcement operations. Enforcement, maintenance and administration will require a total of 5.1 full time equivalent employees comprising three full time enforcement officers, one operation and maintenance position, and 70 percent of a full time administrative position. The annual labor hours and full time equivalents required per job category and management alternative are detailed in Appendix D.
Table 13. Annualized Labor Costs for Recommended Parking Management Alternative
Source: City of Emeryville, Management of Emeryville Services Authority, 6/4/2008.
8 In 2014 short term on-street parking prices increase to $1.25/hour, long term increase to $0.40/hour, RPP permits increase to $30/year and
employee permits increase to $110/year. These rates are comparable to those in nearby Bay Area municipalities. An additional increase is modeled in 2019 – details provided in the Appendix.
9 Parking violation revenue was not included in the revenue analysis as the parking environment will be changing significantly with the introduction of pricing and a more extensive RPP, so it would be difficult to use these numbers as a proxy for future revenue estimation. Additionally, violation revenue is typically kept by the police department or directed to the general funds in most California municipalities.
10 Price elasticity of demand of 20% or 1% demand decrease for every 5% increase in price is a conservative estimate based on observed practice in Bay Area cities. Cities with vibrant commercial districts and established pricing (e.g. San Francisco, Burlingame) typically exhibit lower elasticities – requiring higher price increases to reduce demand.
11 Short term – phase 2 price increase 25%, elasticity 5%, phase 3 price increase 20%, 4 % elasticity. Long term phase 2 price increase 20%, elasticity 4%, phase 3 price increase 25%, 5 % elasticity. RPP phase 2 price increase 50%, elasticity 10%, and phase 3 price increase 33%, 7 % elasticity.
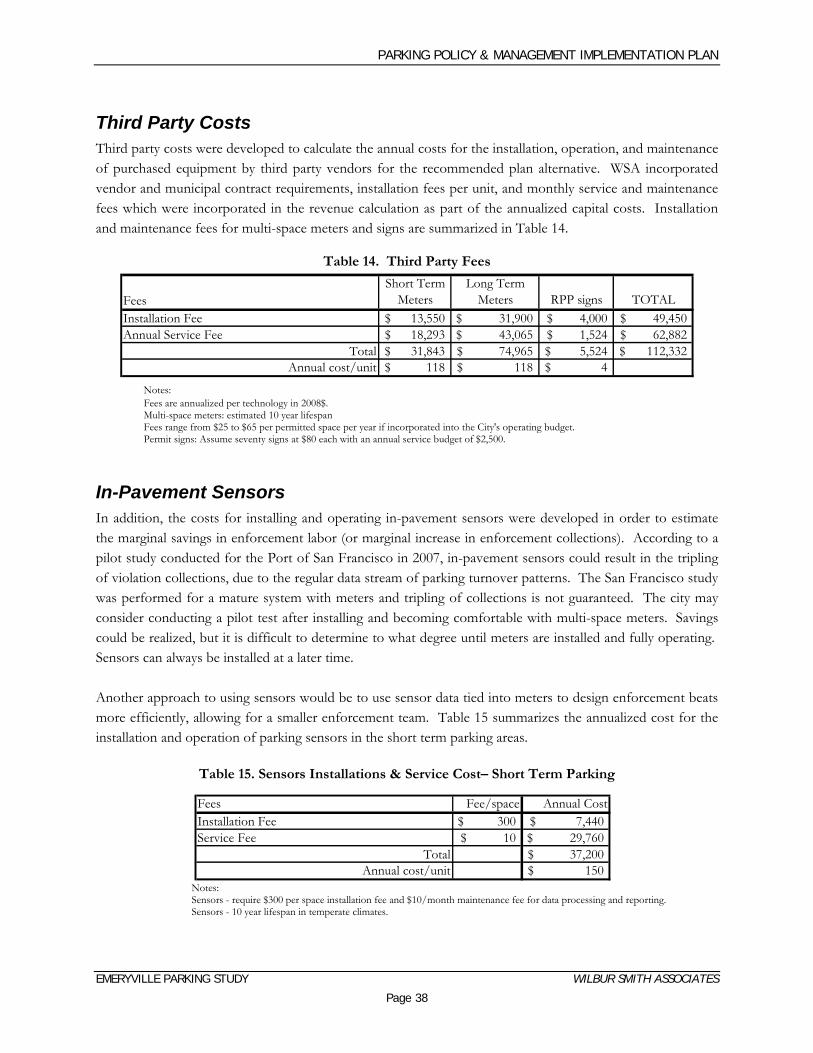
PARKING POLICY & MANAGEMENT IMPLEMENTATION PLAN
EMERYVILLE PARKING STUDY WILBUR SMITH ASSOCIATES
Page 38
Fees Fee/space Annual CostInstallation Fee 300$ 7,440$ Service Fee 10$ 29,760$
Total 37,200$ Annual cost/unit 150$
Third Party Costs Third party costs were developed to calculate the annual costs for the installation, operation, and maintenance of purchased equipment by third party vendors for the recommended plan alternative. WSA incorporated vendor and municipal contract requirements, installation fees per unit, and monthly service and maintenance fees which were incorporated in the revenue calculation as part of the annualized capital costs. Installation and maintenance fees for multi-space meters and signs are summarized in Table 14.
Table 14. Third Party Fees
FeesShort Term
MetersLong Term
Meters RPP signs TOTALInstallation Fee 13,550$ 31,900$ 4,000$ 49,450$ Annual Service Fee 18,293$ 43,065$ 1,524$ 62,882$
Total 31,843$ 74,965$ 5,524$ 112,332$ Annual cost/unit 118$ 118$ 4$
Notes: Fees are annualized per technology in 2008$. Multi-space meters: estimated 10 year lifespan Fees range from $25 to $65 per permitted space per year if incorporated into the City's operating budget. Permit signs: Assume seventy signs at $80 each with an annual service budget of $2,500.
In-Pavement Sensors In addition, the costs for installing and operating in-pavement sensors were developed in order to estimate the marginal savings in enforcement labor (or marginal increase in enforcement collections). According to a pilot study conducted for the Port of San Francisco in 2007, in-pavement sensors could result in the tripling of violation collections, due to the regular data stream of parking turnover patterns. The San Francisco study was performed for a mature system with meters and tripling of collections is not guaranteed. The city may consider conducting a pilot test after installing and becoming comfortable with multi-space meters. Savings could be realized, but it is difficult to determine to what degree until meters are installed and fully operating. Sensors can always be installed at a later time. Another approach to using sensors would be to use sensor data tied into meters to design enforcement beats more efficiently, allowing for a smaller enforcement team. Table 15 summarizes the annualized cost for the installation and operation of parking sensors in the short term parking areas.
Table 15. Sensors Installations & Service Cost– Short Term Parking
Notes: Sensors - require $300 per space installation fee and $10/month maintenance fee for data processing and reporting. Sensors - 10 year lifespan in temperate climates.
PARKING POLICY & MANAGEMENT IMPLEMENTATION PLAN
EMERYVILLE PARKING STUDY WILBUR SMITH ASSOCIATES
Page 39
The annualized cost of in-pavement sensors in the short term parking zone is estimated at one-half of one FTE for a police service technician (PST)12. The cost estimated for enforcing parking for the short-term parking zone is almost 1000 hours or ½ FTE. The total number of PST FTEs estimated for the entire management program is 2.5 FTE. If ½ FTE from the short-term parking zone were replaced by sensors, it is realistic to assume that the remaining 2 FTE could cover the redesigned enforcement beat. The sensor technology is relatively new and has not been proven in long-term service. If the city were to consider installing sensors, it should be phased in as a pilot study in one short-term parking area and data patterns observed for three to six months before enforcement patterns are significantly adjusted and investment in the sensor program expanded. It should be noted that regular enforcement and periodic adjustment of enforcement patterns, based on manual data collection, may also help to create efficiencies in parking enforcement.
12 The City of Emeryville currently employs civilian PSTs for parking enforcement at $75,000 including benefits.

Related Documents