NTIA Report 14-507 EMC Measurements for Spectrum Sharing Between LTE Signals and Radar Receivers Frank H. Sanders John E. Carroll Geoffrey A. Sanders Robert L. Sole Robert J. Achatz Lawrence S. Cohen U.S. DEPARTMENT OF COMMERCE • National Telecommunications and Information Administration report series

Welcome message from author
This document is posted to help you gain knowledge. Please leave a comment to let me know what you think about it! Share it to your friends and learn new things together.
Transcript
NTIA Report 14-507
EMC Measurements for Spectrum Sharing Between LTE Signals and
Radar Receivers
Frank H. Sanders John E. Carroll
Geoffrey A. Sanders Robert L. Sole
Robert J. Achatz Lawrence S. Cohen
U.S. DEPARTMENT OF COMMERCE • National Telecommunications and Information Administration
report series
NTIA Report 14-507
EMC Measurements for Spectrum Sharing Between LTE Signals and
Radar Receivers
Frank H. Sanders John E. Carroll
Geoffrey A. Sanders Robert L. Sole
Robert J. Achatz Lawrence S. Cohen
U.S. DEPARTMENT OF COMMERCE
July 2014


DISCLAIMER
Certain commercial equipment and materials are identified in this report to specify adequately the technical aspects of the reported results. In no case does such identification imply recommendation or endorsement by the National Telecommunications and Information Administration, nor does it imply that the material or equipment identified is the best available for this purpose.
iii

CONTENTS
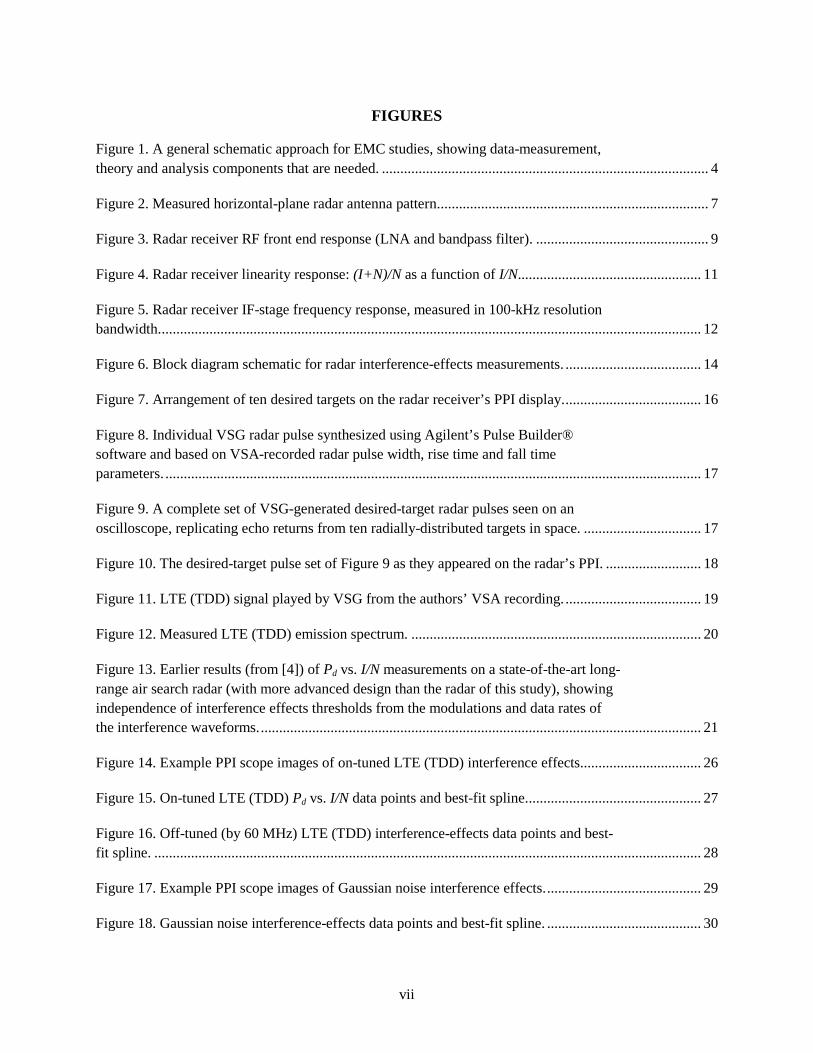
Figures ........................................................................................................................................................ vii
Tables ........................................................................................................................................................... ix
Acronyms/Abbreviations and Symbols ........................................................................................................ x
Executive Summary ................................................................................................................................... xiii
1. Introduction ............................................................................................................................................... 1 1.1 FCC 3.5 GHz NPRM and FNPRM .................................................................................................... 2 1.2 Technical Components for Spectrum-Sharing EMC Study ................................................................ 3 1.3 Goal and Outputs of EMC Study Described in this Report ................................................................ 4
2. Radar Description ..................................................................................................................................... 6 2.1 Overview of Radar ............................................................................................................................. 6 2.2 Radar Antenna Description ................................................................................................................ 7 2.3 Radar Transmitter Description ........................................................................................................... 7 2.4 Radar Receiver Description ................................................................................................................ 8
2.4.1 Radar Receiver RF Front End Frequency Response ................................................................ 8 2.4.2 Radar Receiver RF Front End Overload Measurement ............................................................ 9 2.4.3 Radar Receiver Noise Figure and Antenna-to-LNA Loss ........................................................ 9 2.4.4 Radar Receiver Linear Dynamic Range ................................................................................. 10 2.4.5 Radar Receiver IF Stage Frequency Response ....................................................................... 11
3. Interference Measurement Methodology ................................................................................................ 13 3.1 Interference-Effects Methodology Overview for these Measurements ............................................ 13
3.1.1 Radar Automatic Gain Control (AGC) Setting ...................................................................... 14 3.1.2 Radar Sensitivity Time Control (STC) Setting ....................................................................... 15 3.1.3 Radar Fast Time Constant (FTC) Setting ............................................................................... 15
3.2 Radar Desired-Target Generation ..................................................................................................... 15 3.3 LTE (TDD) Signal Description ........................................................................................................ 18
3.3.1 LTE Microcell Base Station Characteristics........................................................................... 19 3.3.2 LTE Microcell Modulations (TDD, FDD or Both) ................................................................ 21
3.4 Gaussian Noise Interference ............................................................................................................. 22 3.5 Timing and Synchronization of Targets, Interference and Radar Antenna Rotation ....................... 23 3.6 Target and Interference Calibration Methodology ........................................................................... 24
3.6.1 Calibration of Desired-Targets Power Level .......................................................................... 24 3.6.2 Calibration of LTE Interference Power Level ........................................................................ 24 3.6.3 Calibration of Gaussian Noise Interference Power Level ...................................................... 24
4. LTE and Gaussian Noise Interference Measurement Results ................................................................. 26 4.1 LTE (TDD) On-Tuned Interference Measurement Results .............................................................. 26 4.2 LTE (TDD) Off-Tuned Interference Measurem,ent Results ............................................................ 27
v
4.3 Gaussian Noise (Aggregate LTE and LTE (FDD) Proxy) Interference Measurement Results .................................................................................................................................................... 28 4.4 CW Interference Measurement Results ............................................................................................ 30 4.5 Note on Impromptu Single-Blind Test of Target-Counting Validity ............................................... 31 4.6 Summary of Interference-Effects Measurement Results .................................................................. 31
5. Summary and Conclusions ..................................................................................................................... 34 5.1 Summary of this Study’s Results...................................................................................................... 34 5.2 Conclusions ...................................................................................................................................... 34
6. Acknowledgments ................................................................................................................................... 35
7. References ............................................................................................................................................... 36
Appendix A LTE/OFDM Signal Statistics ................................................................................................. 37 A.1 Measurement System Description ................................................................................................... 37 A.2 WiMAX spectrum ........................................................................................................................... 38 A.3 Signal statistic measurements .......................................................................................................... 39
A.3.1 Analysis Details ..................................................................................................................... 40 A.3.2 2683.5 MHz ........................................................................................................................... 40 A.3.3 2550 MHz .............................................................................................................................. 44 A.3.4 2750 MHz .............................................................................................................................. 46 A.3.5 2850 MHz .............................................................................................................................. 48
A.4 Correlation statistics ........................................................................................................................ 50 A.5 Conclusion ....................................................................................................................................... 50
vi
FIGURES
Figure 1. A general schematic approach for EMC studies, showing data-measurement, theory and analysis components that are needed. ......................................................................................... 4
Figure 2. Measured horizontal-plane radar antenna pattern. ......................................................................... 7
Figure 3. Radar receiver RF front end response (LNA and bandpass filter). ............................................... 9
Figure 4. Radar receiver linearity response: (I+N)/N as a function of I/N.................................................. 11
Figure 5. Radar receiver IF-stage frequency response, measured in 100-kHz resolution bandwidth. ................................................................................................................................................... 12
Figure 6. Block diagram schematic for radar interference-effects measurements. ..................................... 14
Figure 7. Arrangement of ten desired targets on the radar receiver’s PPI display. ..................................... 16
Figure 8. Individual VSG radar pulse synthesized using Agilent’s Pulse Builder® software and based on VSA-recorded radar pulse width, rise time and fall time parameters. .................................................................................................................................................. 17
Figure 9. A complete set of VSG-generated desired-target radar pulses seen on an oscilloscope, replicating echo returns from ten radially-distributed targets in space. ................................ 17
Figure 10. The desired-target pulse set of Figure 9 as they appeared on the radar’s PPI. .......................... 18
Figure 11. LTE (TDD) signal played by VSG from the authors’ VSA recording. ..................................... 19
Figure 12. Measured LTE (TDD) emission spectrum. ............................................................................... 20
Figure 13. Earlier results (from [4]) of Pd vs. I/N measurements on a state-of-the-art long-range air search radar (with more advanced design than the radar of this study), showing independence of interference effects thresholds from the modulations and data rates of the interference waveforms. ........................................................................................................................ 21
Figure 14. Example PPI scope images of on-tuned LTE (TDD) interference effects................................. 26
Figure 15. On-tuned LTE (TDD) Pd vs. I/N data points and best-fit spline. ............................................... 27
Figure 16. Off-tuned (by 60 MHz) LTE (TDD) interference-effects data points and best-fit spline. ..................................................................................................................................................... 28
Figure 17. Example PPI scope images of Gaussian noise interference effects. .......................................... 29
Figure 18. Gaussian noise interference-effects data points and best-fit spline. .......................................... 30
vii
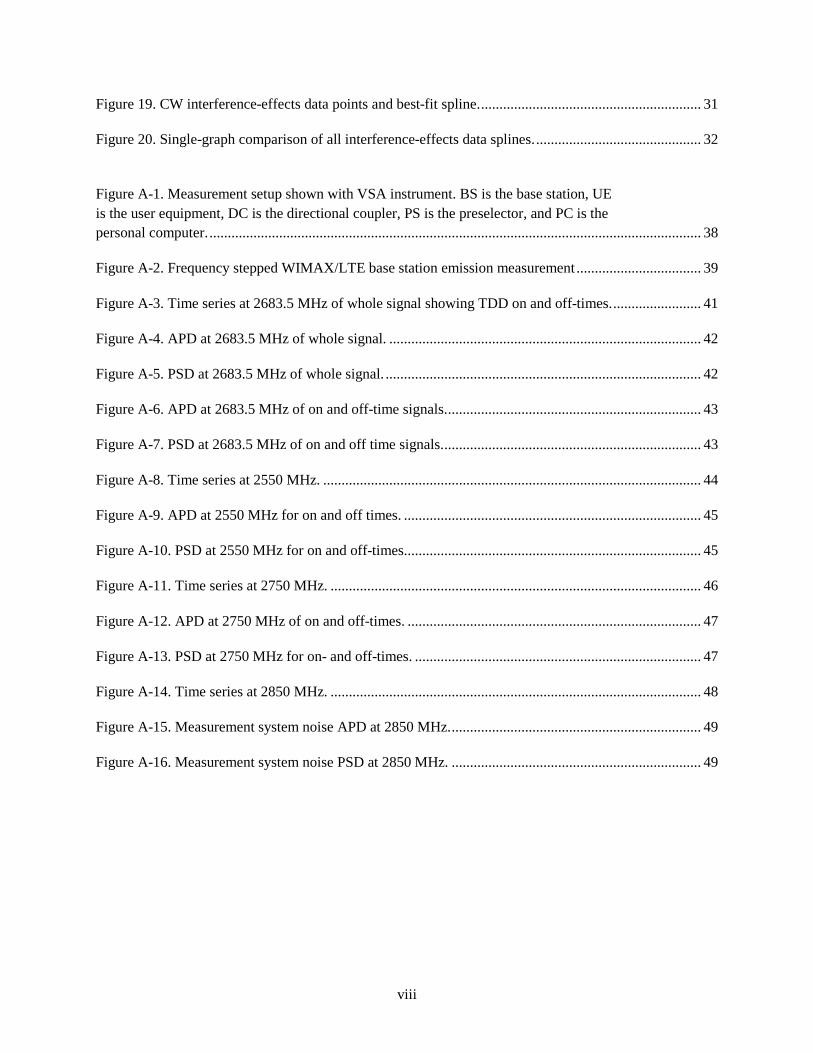
Figure 19. CW interference-effects data points and best-fit spline. ............................................................ 31
Figure 20. Single-graph comparison of all interference-effects data splines. ............................................. 32
Figure A-1. Measurement setup shown with VSA instrument. BS is the base station, UE is the user equipment, DC is the directional coupler, PS is the preselector, and PC is the personal computer. ...................................................................................................................................... 38
Figure A-2. Frequency stepped WIMAX/LTE base station emission measurement .................................. 39
Figure A-3. Time series at 2683.5 MHz of whole signal showing TDD on and off-times. ........................ 41
Figure A-4. APD at 2683.5 MHz of whole signal. ..................................................................................... 42
Figure A-5. PSD at 2683.5 MHz of whole signal. ...................................................................................... 42
Figure A-6. APD at 2683.5 MHz of on and off-time signals. ..................................................................... 43
Figure A-7. PSD at 2683.5 MHz of on and off time signals. ...................................................................... 43
Figure A-8. Time series at 2550 MHz. ....................................................................................................... 44
Figure A-9. APD at 2550 MHz for on and off times. ................................................................................. 45
Figure A-10. PSD at 2550 MHz for on and off-times................................................................................. 45
Figure A-11. Time series at 2750 MHz. ..................................................................................................... 46
Figure A-12. APD at 2750 MHz of on and off-times. ................................................................................ 47
Figure A-13. PSD at 2750 MHz for on- and off-times. .............................................................................. 47
Figure A-14. Time series at 2850 MHz. ..................................................................................................... 48
Figure A-15. Measurement system noise APD at 2850 MHz. .................................................................... 49
Figure A-16. Measurement system noise PSD at 2850 MHz. .................................................................... 49
viii
TABLES
Table 1. Provisional characteristics of 3.5 GHz microcell base station transmitters. ................................. 20
Table A-1. WiMAX/LTE spectrum measurement parameters. .................................................................. 40
Table A-2. Summary of measured resemblance between Gaussian noise and WGN. ................................ 50
ix
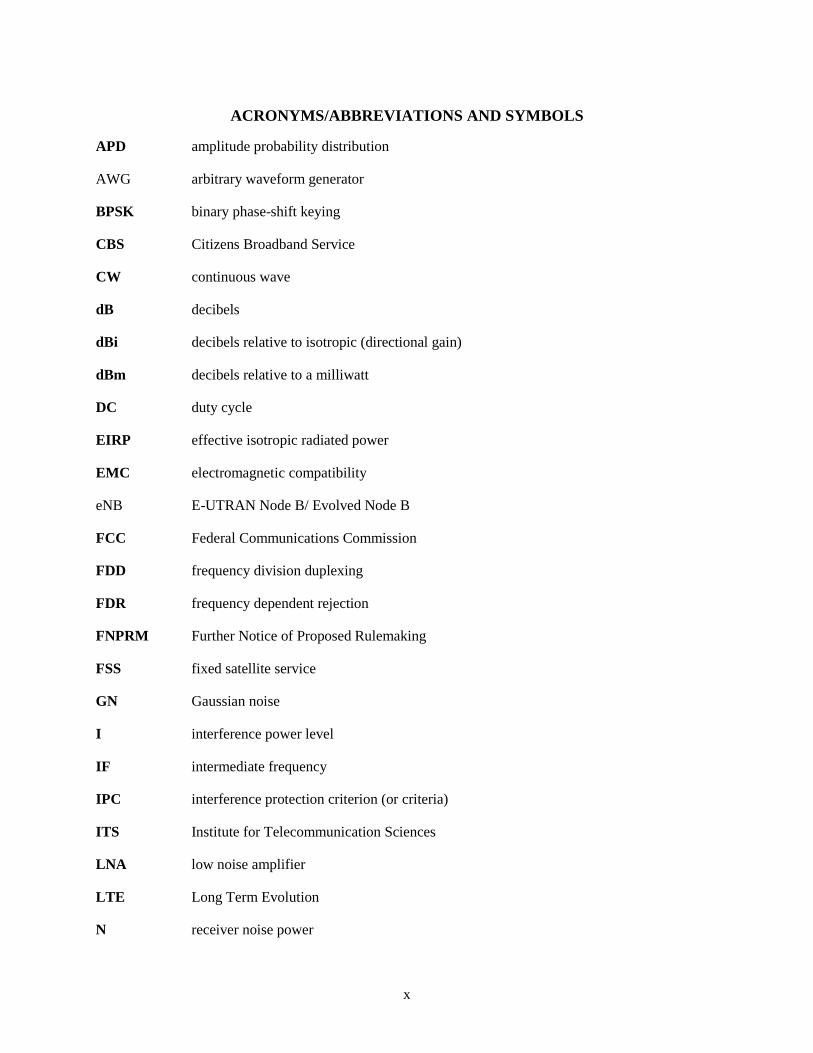
ACRONYMS/ABBREVIATIONS AND SYMBOLS
APD amplitude probability distribution
AWG arbitrary waveform generator
BPSK binary phase-shift keying
CBS Citizens Broadband Service
CW continuous wave
dB decibels
dBi decibels relative to isotropic (directional gain)
dBm decibels relative to a milliwatt
DC duty cycle
EIRP effective isotropic radiated power
EMC electromagnetic compatibility
eNB E-UTRAN Node B/ Evolved Node B
FCC Federal Communications Commission
FDD frequency division duplexing
FDR frequency dependent rejection
FNPRM Further Notice of Proposed Rulemaking
FSS fixed satellite service
GN Gaussian noise
I interference power level
IF intermediate frequency
IPC interference protection criterion (or criteria)
ITS Institute for Telecommunication Sciences
LNA low noise amplifier
LTE Long Term Evolution
N receiver noise power
x
NPRM Notice of Proposed Rulemaking
NTIA National Telecommunications and Information Administration
OFDM orthogonal frequency division multiplexing
OOB out-of-band
OSM Office of Spectrum Management
P0N simple pulsed modulation
PPI plan position indicator
PRR pulse repetition rate
PSD power spectral density
QPSK quadrature phase-shift keying
RMS root mean square
RF radio frequency
SAS spectrum access system
TDD time division duplexing
UE user equipment
UWB ultrawideband
VSA vector signal analyzer
VSG vector signal generator
WGN white Gaussian noise
xi

EXECUTIVE SUMMARY
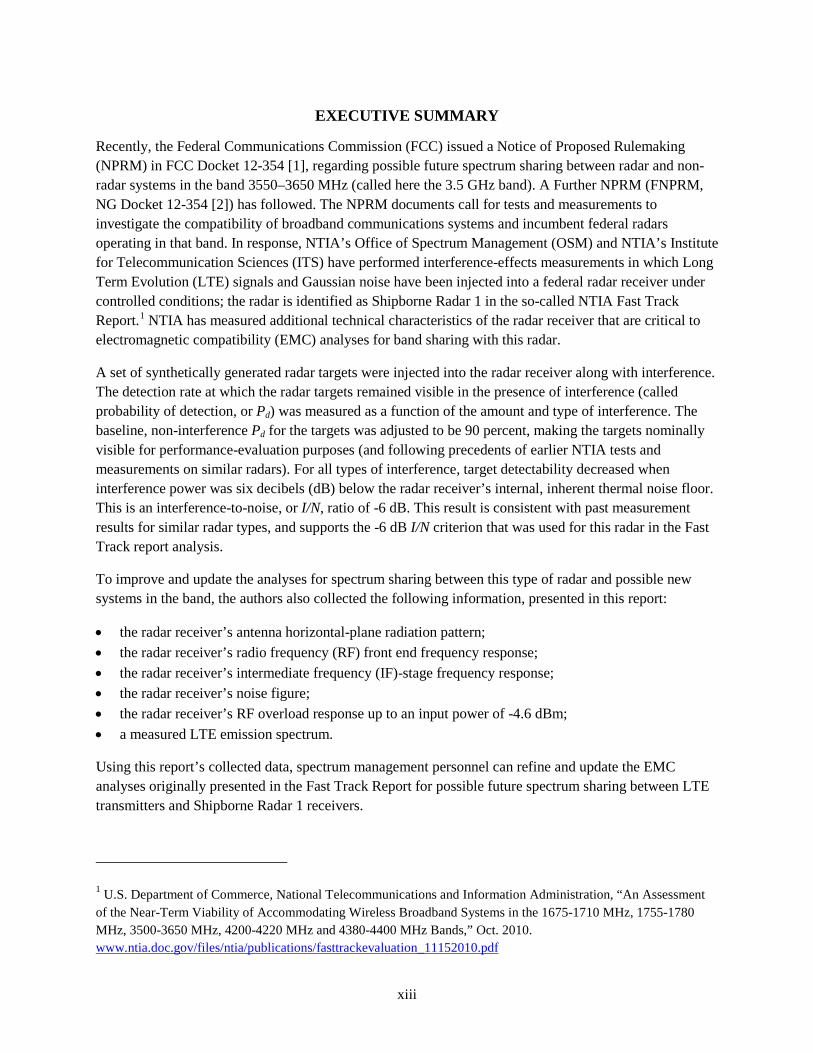
Recently, the Federal Communications Commission (FCC) issued a Notice of Proposed Rulemaking (NPRM) in FCC Docket 12-354 [1], regarding possible future spectrum sharing between radar and non-radar systems in the band 3550–3650 MHz (called here the 3.5 GHz band). A Further NPRM (FNPRM, NG Docket 12-354 [2]) has followed. The NPRM documents call for tests and measurements to investigate the compatibility of broadband communications systems and incumbent federal radars operating in that band. In response, NTIA’s Office of Spectrum Management (OSM) and NTIA’s Institute for Telecommunication Sciences (ITS) have performed interference-effects measurements in which Long Term Evolution (LTE) signals and Gaussian noise have been injected into a federal radar receiver under controlled conditions; the radar is identified as Shipborne Radar 1 in the so-called NTIA Fast Track Report.1 NTIA has measured additional technical characteristics of the radar receiver that are critical to electromagnetic compatibility (EMC) analyses for band sharing with this radar.
A set of synthetically generated radar targets were injected into the radar receiver along with interference. The detection rate at which the radar targets remained visible in the presence of interference (called probability of detection, or Pd) was measured as a function of the amount and type of interference. The baseline, non-interference Pd for the targets was adjusted to be 90 percent, making the targets nominally visible for performance-evaluation purposes (and following precedents of earlier NTIA tests and measurements on similar radars). For all types of interference, target detectability decreased when interference power was six decibels (dB) below the radar receiver’s internal, inherent thermal noise floor. This is an interference-to-noise, or I/N, ratio of -6 dB. This result is consistent with past measurement results for similar radar types, and supports the -6 dB I/N criterion that was used for this radar in the Fast Track report analysis.
To improve and update the analyses for spectrum sharing between this type of radar and possible new systems in the band, the authors also collected the following information, presented in this report:
• the radar receiver’s antenna horizontal-plane radiation pattern; • the radar receiver’s radio frequency (RF) front end frequency response; • the radar receiver’s intermediate frequency (IF)-stage frequency response; • the radar receiver’s noise figure; • the radar receiver’s RF overload response up to an input power of -4.6 dBm; • a measured LTE emission spectrum.
Using this report’s collected data, spectrum management personnel can refine and update the EMC analyses originally presented in the Fast Track Report for possible future spectrum sharing between LTE transmitters and Shipborne Radar 1 receivers.
1 U.S. Department of Commerce, National Telecommunications and Information Administration, “An Assessment of the Near-Term Viability of Accommodating Wireless Broadband Systems in the 1675-1710 MHz, 1755-1780 MHz, 3500-3650 MHz, 4200-4220 MHz and 4380-4400 MHz Bands,” Oct. 2010. www.ntia.doc.gov/files/ntia/publications/fasttrackevaluation_11152010.pdf
xiii
EMC MEASUREMENTS FOR SPECTRUM SHARING BETWEEN LTE SIGNALS AND RADAR RECEIVERS
Frank H. Sanders, John E. Carroll, Geoffrey A. Sanders,2 Robert L. Sole,3 Robert J. Achatz,2 Lawrence S. Cohen4
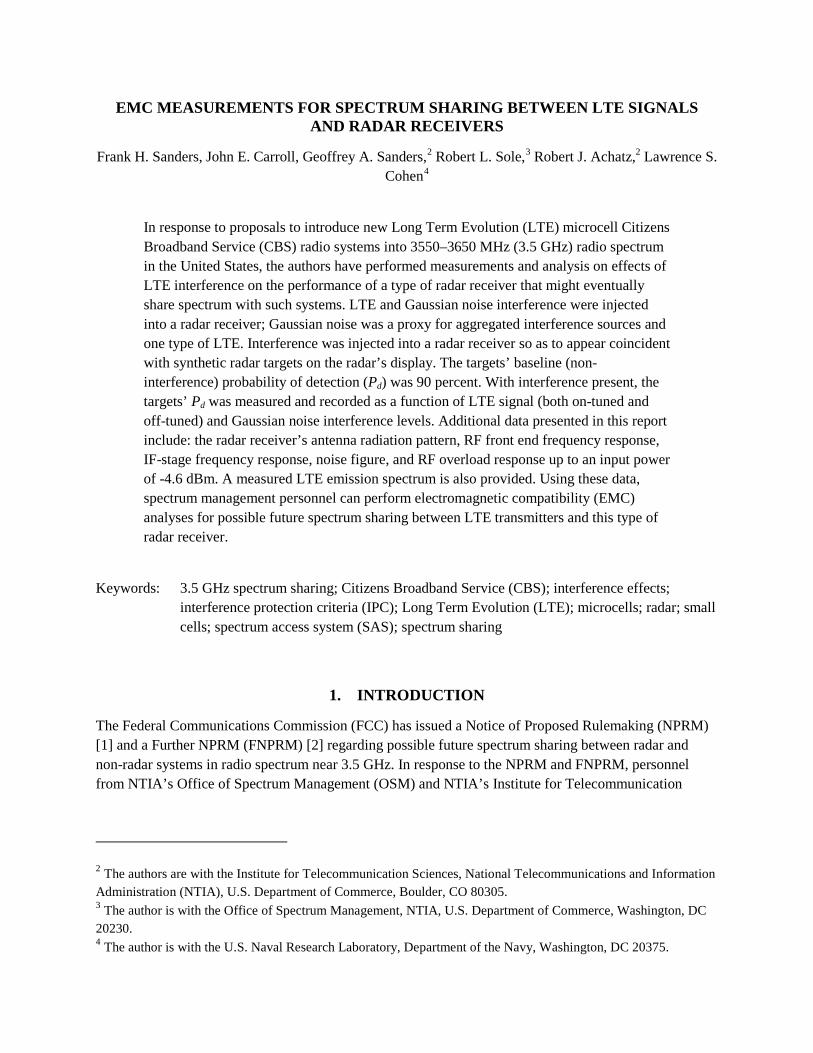
In response to proposals to introduce new Long Term Evolution (LTE) microcell Citizens Broadband Service (CBS) radio systems into 3550–3650 MHz (3.5 GHz) radio spectrum in the United States, the authors have performed measurements and analysis on effects of LTE interference on the performance of a type of radar receiver that might eventually share spectrum with such systems. LTE and Gaussian noise interference were injected into a radar receiver; Gaussian noise was a proxy for aggregated interference sources and one type of LTE. Interference was injected into a radar receiver so as to appear coincident with synthetic radar targets on the radar’s display. The targets’ baseline (non-interference) probability of detection (Pd) was 90 percent. With interference present, the targets’ Pd was measured and recorded as a function of LTE signal (both on-tuned and off-tuned) and Gaussian noise interference levels. Additional data presented in this report include: the radar receiver’s antenna radiation pattern, RF front end frequency response, IF-stage frequency response, noise figure, and RF overload response up to an input power of -4.6 dBm. A measured LTE emission spectrum is also provided. Using these data, spectrum management personnel can perform electromagnetic compatibility (EMC) analyses for possible future spectrum sharing between LTE transmitters and this type of radar receiver.
Keywords: 3.5 GHz spectrum sharing; Citizens Broadband Service (CBS); interference effects; interference protection criteria (IPC); Long Term Evolution (LTE); microcells; radar; small cells; spectrum access system (SAS); spectrum sharing
1. INTRODUCTION
The Federal Communications Commission (FCC) has issued a Notice of Proposed Rulemaking (NPRM) [1] and a Further NPRM (FNPRM) [2] regarding possible future spectrum sharing between radar and non-radar systems in radio spectrum near 3.5 GHz. In response to the NPRM and FNPRM, personnel from NTIA’s Office of Spectrum Management (OSM) and NTIA’s Institute for Telecommunication
2 The authors are with the Institute for Telecommunication Sciences, National Telecommunications and Information Administration (NTIA), U.S. Department of Commerce, Boulder, CO 80305. 3 The author is with the Office of Spectrum Management, NTIA, U.S. Department of Commerce, Washington, DC 20230. 4 The author is with the U.S. Naval Research Laboratory, Department of the Navy, Washington, DC 20375.
Sciences (ITS) have performed interference-effects measurements in which they have hardline-injected5 pre-recorded 4G Long Term Evolution (LTE) Time Division Duplexing (TDD) signals into a type of radar receiver (Shipborne Radar 1 in [3]) that may need to share the spectrum band identified in the NPRM and FNPRM. As a proxy for Frequency Division Duplexing (FDD) LTE and aggregate LTE interference signals, the authors injected Gaussian noise into the radar receiver during separate measurements runs. The Gaussian noise results also provided a reality check on the authors’ results, as the effects of such noise on the radar receiver can be checked analytically. Off-tuned LTE interference was also injected into the radar receiver (on the radar’s tuned center frequency) from an LTE emission recorded 60 MHz from LTE center frequency.6
Synthesized radar targets7 were hardline-injected into the radar receiver simultaneously with, and on the same azimuths as, the interference power. This intersection in time and geometry between desired targets and interference satisfied the condition of radar targets being on the same azimuth as one or more LTE transmitter(s). In a baseline (non-interference) condition the synthetic targets’ power level was adjusted to make them visible with a probability of being detected, Pd, of 90 percent. Interference was then injected into the receiver. As the interference power level, I, was increased, Pd was recorded as a function of the ratio of I to the radar’s inherent internal noise level, N. The procedure and methodology of measuring Pd as a function of I/N were identical to the measurement process described in [4].
This report describes the measurement procedures, methodologies and results of interference injection at varying power levels into the radar receiver. The results are presented as graphs showing Pd as a function of I/N. For all types of injected interference, the radar receiver’s target-detection performance began to decrease at an I/N threshold of about -6 dB. This result is consistent with previous results from other radar types [4].
Additional supporting data that are important in band-sharing analyses are presented for this radar in this report, as described further below. The authors do not claim to identify interference protection criteria (IPC) or other band-sharing electromagnetic compatibility (EMC) criteria for this radar type. Other technical personnel, including entities that operate this type of radar, may use the data presented in this report, along with any other relevant operational factors, to determine band-sharing criteria for this radar.
1.1 FCC 3.5 GHz NPRM and FNPRM
The FCC NPRM and FNPRM are focused on developing new, innovative spectrum uses and sharing among new, small cell (microcell) LTE-based communications systems and networks in the spectrum between 3550 and 3650 MHz. An NTIA Report [3] identified this band for potential shared federal and non-federal use. This new use is to be called the Citizens Broadband Service (CBS). The basic technical
5 In the authors’ experience, hardline-coupled interference measurements on receivers are faster, more efficient and produce smaller error margins than radiatively-coupled interference measurements. 6 The recording was of an 18–MHz wide portion of the LTE out-of-band emission; 60 MHz of off-tuning was used in order to ensure that the interference power was far from the LTE on-channel emissions 7 In this report, and in radar engineering in general, the term “target” has no military connotation. It refers instead to any object that the radar is supposed to detect.
2
idea behind microcells is to obtain relatively short frequency re-use distances from cell to cell by making the cells relatively small; microcells are supposed to provide relatively high spectrum-use efficiency as compared to larger conventional cells. The overall structure of the CBS has been proposed [1] as a multi-tiered shared access model.
Because incumbent systems already exist in this frequency range and are expected to continue to operate in this band after the introduction of new microcell systems, the microcell systems will need to share this spectrum with incumbents. Incumbent uses in the band include federal radars and non-federal Fixed Satellite Service (FSS) earth stations for receive-only space-to-earth operations and feeder links [1].
1.2 Technical Components for Spectrum-Sharing EMC Study
As proposed in [1] and [2], use of the CBS band is to be managed via an entity called the spectrum access system (SAS). The SAS is envisioned as incorporating a dynamic database and possibly other interference mitigation techniques to de-conflict uses among new users and between new users and incumbent users. Such a management system may need to incorporate, at some level, a set of rules for separations in frequency and distance that are needed to mitigate interference among users.
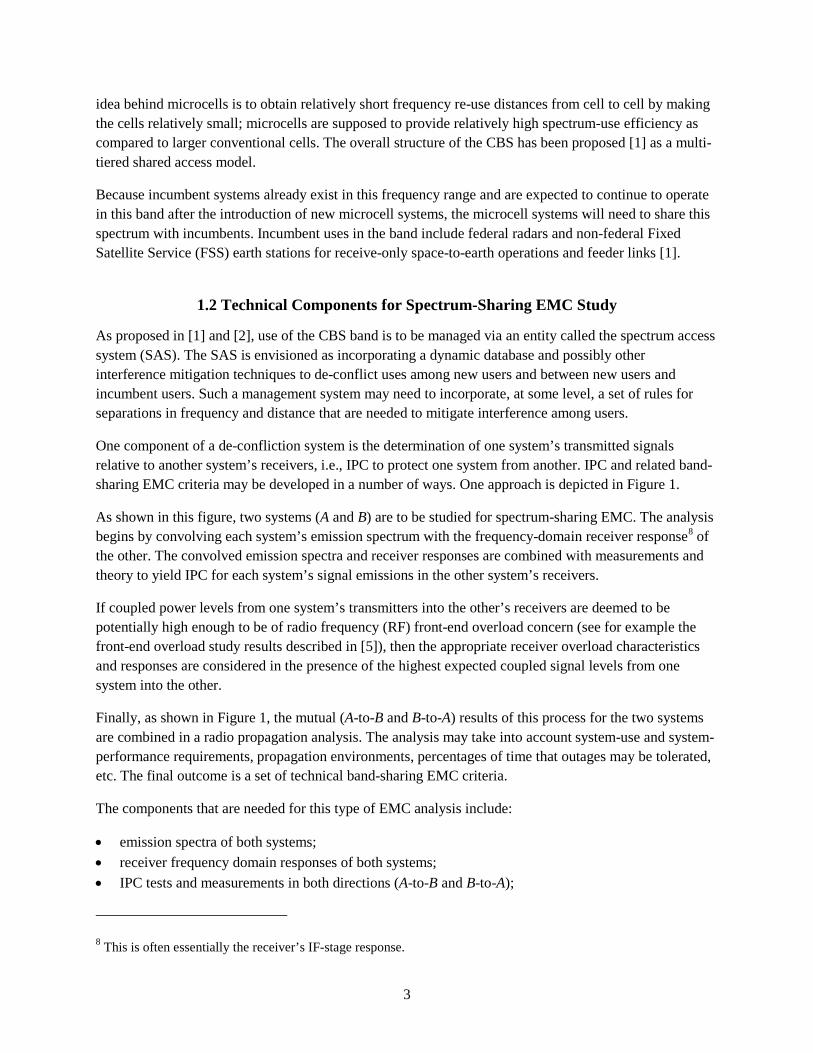
One component of a de-confliction system is the determination of one system’s transmitted signals relative to another system’s receivers, i.e., IPC to protect one system from another. IPC and related band-sharing EMC criteria may be developed in a number of ways. One approach is depicted in Figure 1.
As shown in this figure, two systems (A and B) are to be studied for spectrum-sharing EMC. The analysis begins by convolving each system’s emission spectrum with the frequency-domain receiver response8 of the other. The convolved emission spectra and receiver responses are combined with measurements and theory to yield IPC for each system’s signal emissions in the other system’s receivers.
If coupled power levels from one system’s transmitters into the other’s receivers are deemed to be potentially high enough to be of radio frequency (RF) front-end overload concern (see for example the front-end overload study results described in [5]), then the appropriate receiver overload characteristics and responses are considered in the presence of the highest expected coupled signal levels from one system into the other.
Finally, as shown in Figure 1, the mutual (A-to-B and B-to-A) results of this process for the two systems are combined in a radio propagation analysis. The analysis may take into account system-use and system-performance requirements, propagation environments, percentages of time that outages may be tolerated, etc. The final outcome is a set of technical band-sharing EMC criteria.
The components that are needed for this type of EMC analysis include:
• emission spectra of both systems; • receiver frequency domain responses of both systems; • IPC tests and measurements in both directions (A-to-B and B-to-A);
8 This is often essentially the receiver’s IF-stage response.
3
• RF overload tests and measurements (if necessary) for one or both receivers; • propagation analysis.
Figure 1. A general schematic approach for EMC studies, showing data-measurement, theory and analysis components that are needed.
1.3 Goal and Outputs of EMC Study Described in this Report
In this report, the authors show the results of EMC measurements for future 3550–3650 MHz spectrum sharing between proposed future microcell signals and existing radar receivers. The collected data that are presented in this report include:
• the radar receiver’s antenna horizontal-plane radiation pattern; • the radar receiver’s radio frequency (RF) front end frequency response; • the radar receiver’s intermediate frequency (IF)-stage frequency response; • the radar receiver’s noise figure; • the radar receiver’s RF overload response up to an input power of -4.6 dBm; • the radar receiver’s target-performance results for LTE and Gaussian noise interference effects;
4
• measured LTE emission spectra.
For the LTE-to-radar receiver interference-effects measurements, results are presented for LTE signals and Gaussian noise that were injected into a radar receiver against a set of injected radar targets with a baseline (non-interference) Pd of 90 percent.
5
2. RADAR DESCRIPTION
2.1 Overview of Radar
The radar type examined in this study9 searches for targets with a radiated beam of transmitted power that is directed into (and scanned through) space as a succession of high-powered RF pulses. The pulse modulation is that of a simple carrier wave, designated P0N. Immediately after the transmitter fires each pulse out of the radar antenna, the radar RF front end switches the antenna to the radar’s receiver, which listens for echo power returning from objects in space. The listening interval continues until it is time to fire the next transmitted pulse, and this process continues for as long as the radar operates. The radar’s maximum range for target detection is determined by the longest distance that the transmitted pulses and their corresponding echoes can travel through space and return to the radar antenna within each pulse-pair transmission interval.
While the RF pulses are fired and the corresponding pulse echoes are returned, the radar antenna continuously mechanically rotates 360 degrees around the local horizon. The antenna has a high-gain radiation pattern that is narrow in azimuth and relatively broad in elevation; during the 3 dB beam-scanning interval across any point in space, the radar transmits 20 RF pulses and listens for echoes during 20 corresponding inter-pulse intervals.
Individual pulse echoes are often received at power levels that are lower than the radar receiver’s internal thermal noise10 level. Radar receivers integrate successive pulse echo intervals (about 20 at a time for the radar in this study) to detect targets that are viewable on 360° plan position indicator (PPI) screen displays. Because individual target echoes are normally lower in power than radar receiver thermal noise, a 1 dB increase in a radar receiver’s thermal noise level (after target-echo integration) can cause measurable detection-performance degradation of even relatively strong target echoes. Interference power that is at one-fourth (6 dB lower power than) the radar receiver thermal noise causes such an increase.11
As documented in [4], many radar receivers begin to lose detection performance for 90 percent Pd baseline (non-interference condition) targets when high duty cycle interference (as from communication signals) exceeds an I/N level of -6 dB. The authors have observed this behavior both in older radar receiver models and in newer, state-of-the art radar receivers.12
9 Shipborne Radar 1 in [3]. 10 Defined as (kTB) ·(nf), where k = Boltzmann’s constant (1.38·10-23 J/K-Hz), T = ambient temperature, B = receiver bandwidth, and nf = noise factor. At room temperature, 10log(kTB) = -174 dBm/Hz. Typical radar receiver noise factors are near 2, or 3 dB in decibel terms. 11 10log(1) = 0 dB = normalized receiver noise level; 10log(1/4) = -6 dB; and 10log(1+1/4) ≈ 1 dB. 12 Meteorological radars may have even lower I/N performance-degradation levels, between -8 and -12 dB, as described in [4] and [6].
6
2.2 Radar Antenna Description
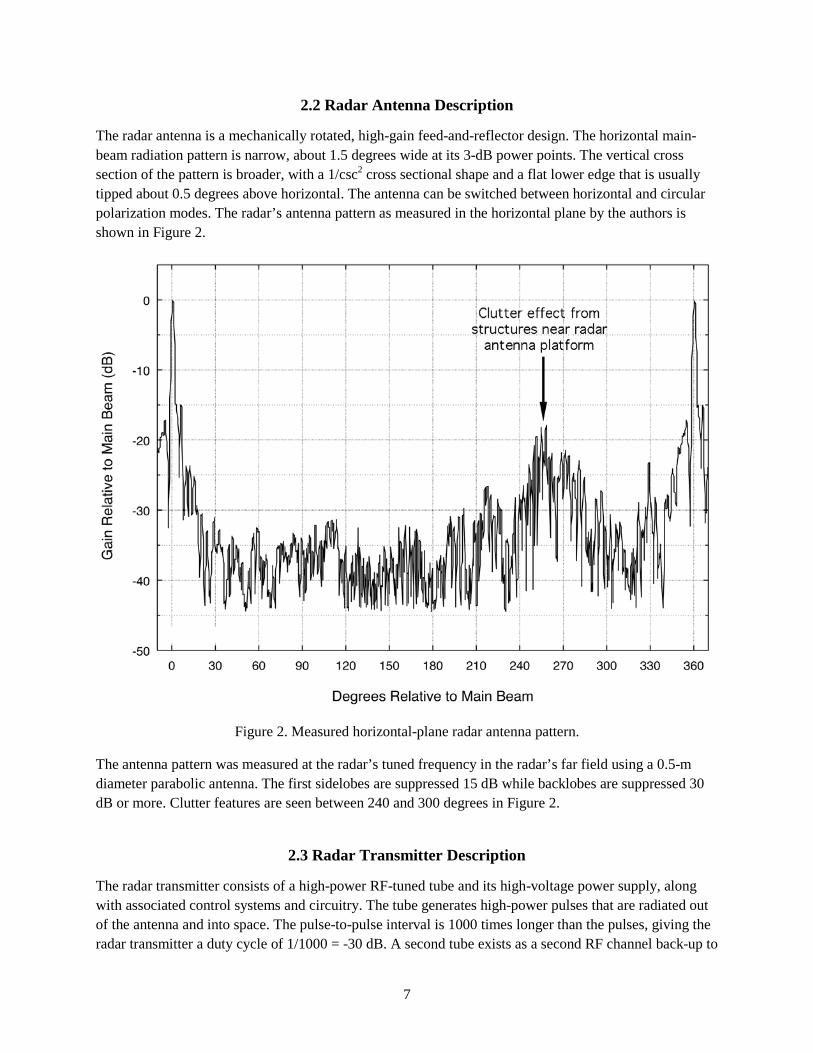
The radar antenna is a mechanically rotated, high-gain feed-and-reflector design. The horizontal main-beam radiation pattern is narrow, about 1.5 degrees wide at its 3-dB power points. The vertical cross section of the pattern is broader, with a 1/csc2 cross sectional shape and a flat lower edge that is usually tipped about 0.5 degrees above horizontal. The antenna can be switched between horizontal and circular polarization modes. The radar’s antenna pattern as measured in the horizontal plane by the authors is shown in Figure 2.
Figure 2. Measured horizontal-plane radar antenna pattern.
The antenna pattern was measured at the radar’s tuned frequency in the radar’s far field using a 0.5-m diameter parabolic antenna. The first sidelobes are suppressed 15 dB while backlobes are suppressed 30 dB or more. Clutter features are seen between 240 and 300 degrees in Figure 2.
2.3 Radar Transmitter Description
The radar transmitter consists of a high-power RF-tuned tube and its high-voltage power supply, along with associated control systems and circuitry. The tube generates high-power pulses that are radiated out of the antenna and into space. The pulse-to-pulse interval is 1000 times longer than the pulses, giving the radar transmitter a duty cycle of 1/1000 = -30 dB. A second tube exists as a second RF channel back-up to
7
the first. The radar transmitter operates on one frequency and is not re-tunable on-the-fly; the radar cannot avoid or mitigate interference from other systems by switching from one operational frequency to another. Out-of-band radar emissions are reduced by a 3700 MHz low-pass waveguide filter located between the transmitter output and the antenna.
2.4 Radar Receiver Description
The radar’s superheterodyne receiver consists of (in target-echo signal-processing order after the radar’s transmitter-receiver waveguide switch): a low-noise amplifier (LNA); an RF front-end bandpass filter (dedicated to the receiver and separate from the 3700 MHz low-pass waveguide filter that is shared with the transmitter); mixer-downconverter; IF filtering; target integration and detection circuitry; and finally an output to PPI scopes.
The radar’s signal-processing bandwidth is governed by the frequency response of the IF stage and its noise figure is determined by the noise figure of the front-end LNA, both of which are described in further detail below.
2.4.1 Radar Receiver RF Front End Frequency Response
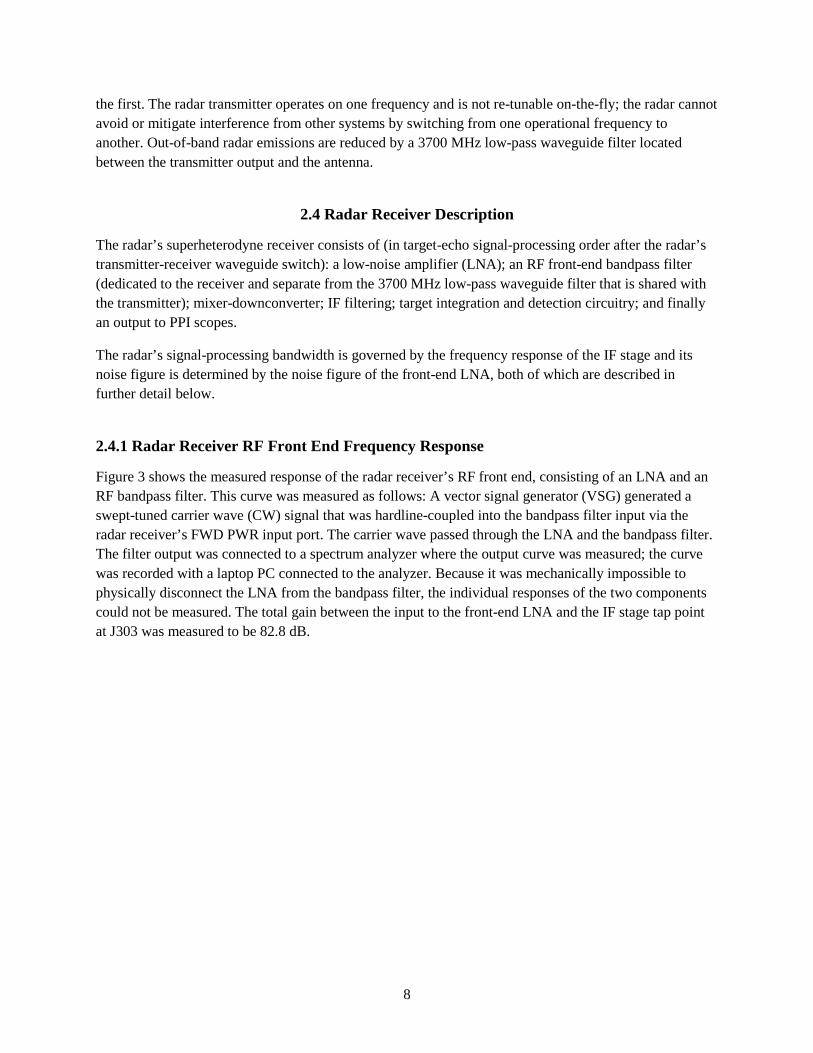
Figure 3 shows the measured response of the radar receiver’s RF front end, consisting of an LNA and an RF bandpass filter. This curve was measured as follows: A vector signal generator (VSG) generated a swept-tuned carrier wave (CW) signal that was hardline-coupled into the bandpass filter input via the radar receiver’s FWD PWR input port. The carrier wave passed through the LNA and the bandpass filter. The filter output was connected to a spectrum analyzer where the output curve was measured; the curve was recorded with a laptop PC connected to the analyzer. Because it was mechanically impossible to physically disconnect the LNA from the bandpass filter, the individual responses of the two components could not be measured. The total gain between the input to the front-end LNA and the IF stage tap point at J303 was measured to be 82.8 dB.
8
Figure 3. Radar receiver RF front end response (LNA and bandpass filter).
2.4.2 Radar Receiver RF Front End Overload Measurement
The radar receiver has a noise diode calibration input port13 at which the authors used their VSG to inject a high-power carrier wave to examine the RF front-end (LNA) overload power point. This noise diode input point couples power into the radar receiver via a -24.6 dB coupling (power loss) factor. Injecting CW power at the VSG’s maximum output power of +20 dBm at this point, for a calculated CW input power to the LNA of (+20 dBm – 24.6 dB) = -4.6 dBm, the LNA output remained linear as a function of input power. The radar receiver LNA’s 1 dB input power compression point is therefore greater than -4.6 dBm.
2.4.3 Radar Receiver Noise Figure and Antenna-to-LNA Loss
The radar receiver’s noise figure was measured by observing the power level in the receiver’s IF stage while injecting CW power into the radar’s RF front end at the noise diode calibration input point (ahead of the LNA input). VSG output power into the radar front end was adjusted until the root mean square
13 Labeled “RCVR NF”.
9
(RMS) power level within the IF stage (monitored by a spectrum analyzer at IF output tap point14) was seen to increase by 3 dB. At this point, the input power to the IF was equal to the IF’s internal thermal noise. The VSG output power that produced a 3 dB increase in the IF stage power was -82 dBm. With a coupler loss factor of -24.6 dBm and 5 dB of measured RF line loss between the VSG and the radar, the 3 dB delta-power input to the IF was (-82 dBm – 24.6 dB – 5 dB) = -111.6 dBm.
The radar’s IF stage bandwidth (essentially the same as its signal-processing bandwidth) is 1 MHz. Thermal kTB power in this bandwidth at room temperature (see footnote 10) is -114 dBm. The receiver noise figure was thus measured to be (-111.6 – (-114 dBm)) = 2.4 dB.
The loss between the antenna and the RF front end LNA input could not be measured directly but considering that the antenna is connected to the LNA input entirely by low-loss waveguide this loss is estimated to be 2 dB.
2.4.4 Radar Receiver Linear Dynamic Range
Using the same measurement setup as described above for measuring the receiver’s noise figure, the power level at the IF output was measured as a function of input power from the VSG at the radar’s RF front end. Data points were collected at 0.5-dB intervals at I/N levels (where I is the CW input power from the VSG) ranging from -16 dB to +15 dB. The results of this measurement are shown in Figure 4.
14 Labeled J303.
10
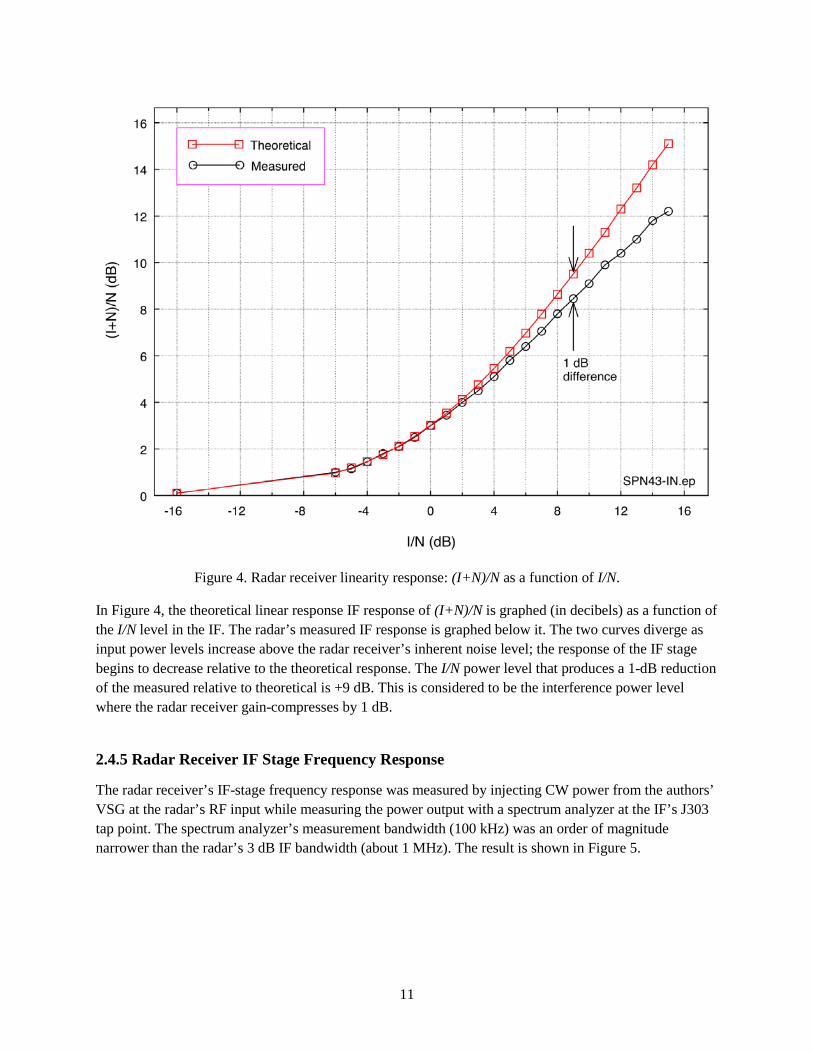
Figure 4. Radar receiver linearity response: (I+N)/N as a function of I/N.
In Figure 4, the theoretical linear response IF response of (I+N)/N is graphed (in decibels) as a function of the I/N level in the IF. The radar’s measured IF response is graphed below it. The two curves diverge as input power levels increase above the radar receiver’s inherent noise level; the response of the IF stage begins to decrease relative to the theoretical response. The I/N power level that produces a 1-dB reduction of the measured relative to theoretical is +9 dB. This is considered to be the interference power level where the radar receiver gain-compresses by 1 dB.
2.4.5 Radar Receiver IF Stage Frequency Response
The radar receiver’s IF-stage frequency response was measured by injecting CW power from the authors’ VSG at the radar’s RF input while measuring the power output with a spectrum analyzer at the IF’s J303 tap point. The spectrum analyzer’s measurement bandwidth (100 kHz) was an order of magnitude narrower than the radar’s 3 dB IF bandwidth (about 1 MHz). The result is shown in Figure 5.
11
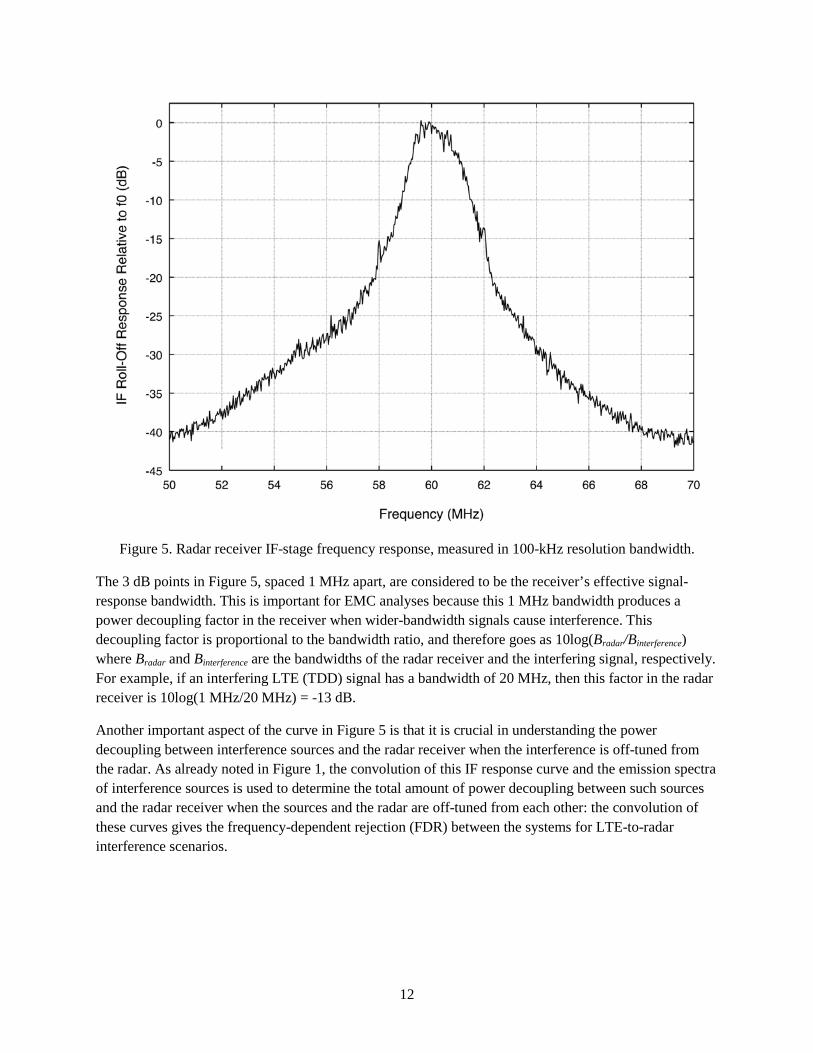
Figure 5. Radar receiver IF-stage frequency response, measured in 100-kHz resolution bandwidth.
The 3 dB points in Figure 5, spaced 1 MHz apart, are considered to be the receiver’s effective signal-response bandwidth. This is important for EMC analyses because this 1 MHz bandwidth produces a power decoupling factor in the receiver when wider-bandwidth signals cause interference. This decoupling factor is proportional to the bandwidth ratio, and therefore goes as 10log(Bradar/Binterference) where Bradar and Binterference are the bandwidths of the radar receiver and the interfering signal, respectively. For example, if an interfering LTE (TDD) signal has a bandwidth of 20 MHz, then this factor in the radar receiver is 10log(1 MHz/20 MHz) = -13 dB.
Another important aspect of the curve in Figure 5 is that it is crucial in understanding the power decoupling between interference sources and the radar receiver when the interference is off-tuned from the radar. As already noted in Figure 1, the convolution of this IF response curve and the emission spectra of interference sources is used to determine the total amount of power decoupling between such sources and the radar receiver when the sources and the radar are off-tuned from each other: the convolution of these curves gives the frequency-dependent rejection (FDR) between the systems for LTE-to-radar interference scenarios.
12
3. INTERFERENCE MEASUREMENT METHODOLOGY
As noted above, the interference-effects measurement methodology for this study followed the approach and procedures described in [4], a process that has undergone considerable review over the past decade and that has been used as the basis for development of IPC thresholds in a number of national and international radar-band sharing studies.
The basic concept is that a radar receiver’s target-detection performance15 is measured when RF interference is injected into the receiver on the same azimuths as desired targets. The targets and the interference are both injected into the receiver at identical RF frequencies via hardlines and combiners, so as to remove propagation variations and effects from the measurements. Targets are injected with enough power to be detectable with a Pd of 90 percent in the absence of interference. Interference is injected one modulation at a time, at varying power levels. At each power level for each interference waveform modulation, the target detections are counted as a ratio of detection counts divided by a statistically significant number that are injected. The Pd rate is then graphed as a function of interference modulation type and I/N power ratio.
The purpose of these measurements is to provide raw data for development of IPC thresholds in radar receivers in terms of I/N. Since I/N levels are referenced entirely inside the receiver circuitry, sharing criteria on which they are based need to be further developed into frequency-distance deltas. This may be accomplished through data that include radar receiver noise figure, radar antenna gain, radar IF responses, emission spectra of interference sources, and the application of appropriate propagation models and analysis, as described above.16
3.1 Interference-Effects Methodology Overview for these Measurements
Figure 6 is a block-diagram schematic showing the overall hardware configuration for interference-effects measurements on this radar. The radar transmitter was set up to operate normally, except that both transmitter magnetrons were turned off and thus no power was radiated into space and no external target echoes were received by the antenna. Desired targets and interference were injected at the RCVR NF directional coupler port. This coupler, connected to a waveguide switch, was in turn connected to a circulator. The circulator fed the targets and interference into the radar receiver. Within the receiver, the targets and interference passed successively through a transmitter-receiver (T/R) limiter,17 LNA, bandpass filter, and two mixing downconversion stages. At the output of the second mixer, where the IF power was still linear, a spectrum analyzer was connected at the IF output tap point; this was where interference I/N levels were monitored.
15 Or, for meteorological radars, the echo processing that produces reflectivity, Doppler, and spectrum width data products. 16 Overload testing of radar receivers is generally pointless since the target-loss and even PPI strobing thresholds are normally well below any RF front-end overload points. 17 The limiter functions as a diode in the presence of strong interference, cutting off energy to the rest of the receiver in the presence of very high-power interference. Because limiters interrupt receiver operations when they activate, they are EMC (damage) protection devices rather than interference-mitigation devices.
13
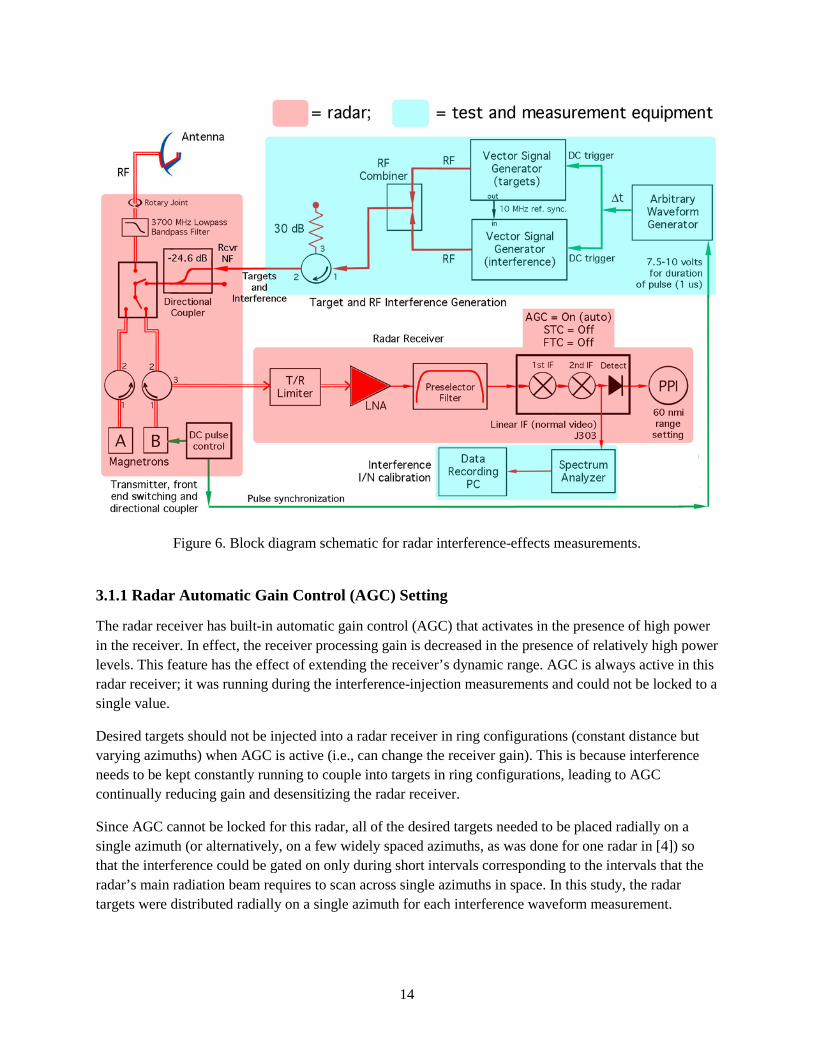
Figure 6. Block diagram schematic for radar interference-effects measurements.
3.1.1 Radar Automatic Gain Control (AGC) Setting
The radar receiver has built-in automatic gain control (AGC) that activates in the presence of high power in the receiver. In effect, the receiver processing gain is decreased in the presence of relatively high power levels. This feature has the effect of extending the receiver’s dynamic range. AGC is always active in this radar receiver; it was running during the interference-injection measurements and could not be locked to a single value.
Desired targets should not be injected into a radar receiver in ring configurations (constant distance but varying azimuths) when AGC is active (i.e., can change the receiver gain). This is because interference needs to be kept constantly running to couple into targets in ring configurations, leading to AGC continually reducing gain and desensitizing the radar receiver.
Since AGC cannot be locked for this radar, all of the desired targets needed to be placed radially on a single azimuth (or alternatively, on a few widely spaced azimuths, as was done for one radar in [4]) so that the interference could be gated on only during short intervals corresponding to the intervals that the radar’s main radiation beam requires to scan across single azimuths in space. In this study, the radar targets were distributed radially on a single azimuth for each interference waveform measurement.
14
3.1.2 Radar Sensitivity Time Control (STC) Setting
Sensitivity time control (STC) is a time-dependent, fast-switched, variable RF attenuation feature that invokes attenuation at the receiver’s RF front end during the initial portion of each echo-listening interval. STC operates automatically after each pulse transmission; it is not activated by any aspect of the radar’s ambient environment. By desensitizing the receiver to any unwanted high-power echoes from nearby objects, STC minimizes the amount of bright but useless echo-return power (called clutter) on the PPI display in the zone immediately around the radar. STC improves the aesthetic quality of the PPI display by reducing distracting clutter, but this feature does not make desired targets more visible; it is not an interference-mitigation feature.
In this study’s measurements, which were all hardline-coupled with no transmitted power and therefore no returning echo power, no clutter was present at any time on the radar’s PPI display. Thus there was no reason to use STC during the measurements. (This is yet another reason to perform interference-effects measurements on radars using hardline connections in lieu of radiation.) The desirability of placing the targets across a wide range of distances that included STC-affected ranges (for the widest possible target-to-target separations and consequently improved accuracy of target counting) was another reason to turn STC off.
3.1.3 Radar Fast Time Constant (FTC) Setting
Fast time constant (FTC) enhances the visibility of target echoes in the presence of clutter, but only if the echoes are already stronger than the clutter18. In other words, FTC only makes very strong target echoes somewhat more visible out of clutter saturation on a PPI than they otherwise would be. FTC is therefore not an interference-mitigation technique. Since the hardline nature of the measurements obviated the need to work through clutter on the PPI, and because FTC is not an interference-mitigation feature, FTC was turned off during the interference measurements.
3.2 Radar Desired-Target Generation
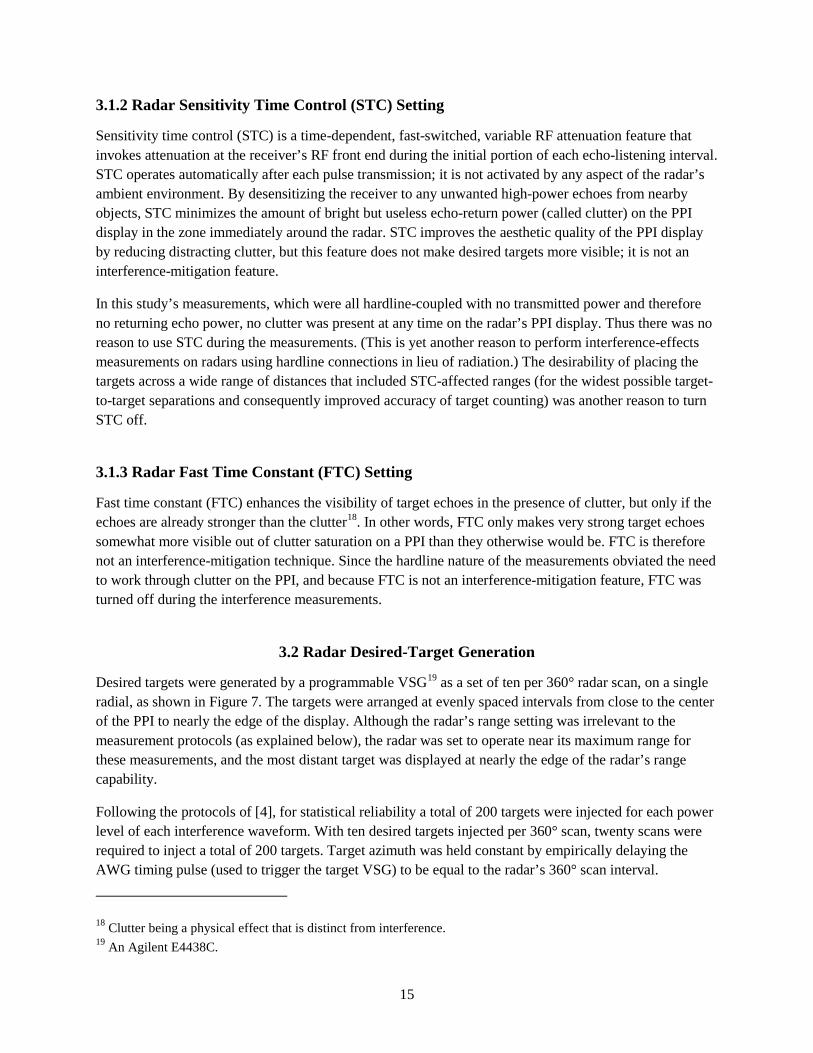
Desired targets were generated by a programmable VSG19 as a set of ten per 360° radar scan, on a single radial, as shown in Figure 7. The targets were arranged at evenly spaced intervals from close to the center of the PPI to nearly the edge of the display. Although the radar’s range setting was irrelevant to the measurement protocols (as explained below), the radar was set to operate near its maximum range for these measurements, and the most distant target was displayed at nearly the edge of the radar’s range capability.
Following the protocols of [4], for statistical reliability a total of 200 targets were injected for each power level of each interference waveform. With ten desired targets injected per 360° scan, twenty scans were required to inject a total of 200 targets. Target azimuth was held constant by empirically delaying the AWG timing pulse (used to trigger the target VSG) to be equal to the radar’s 360° scan interval.
18 Clutter being a physical effect that is distinct from interference. 19 An Agilent E4438C.
15
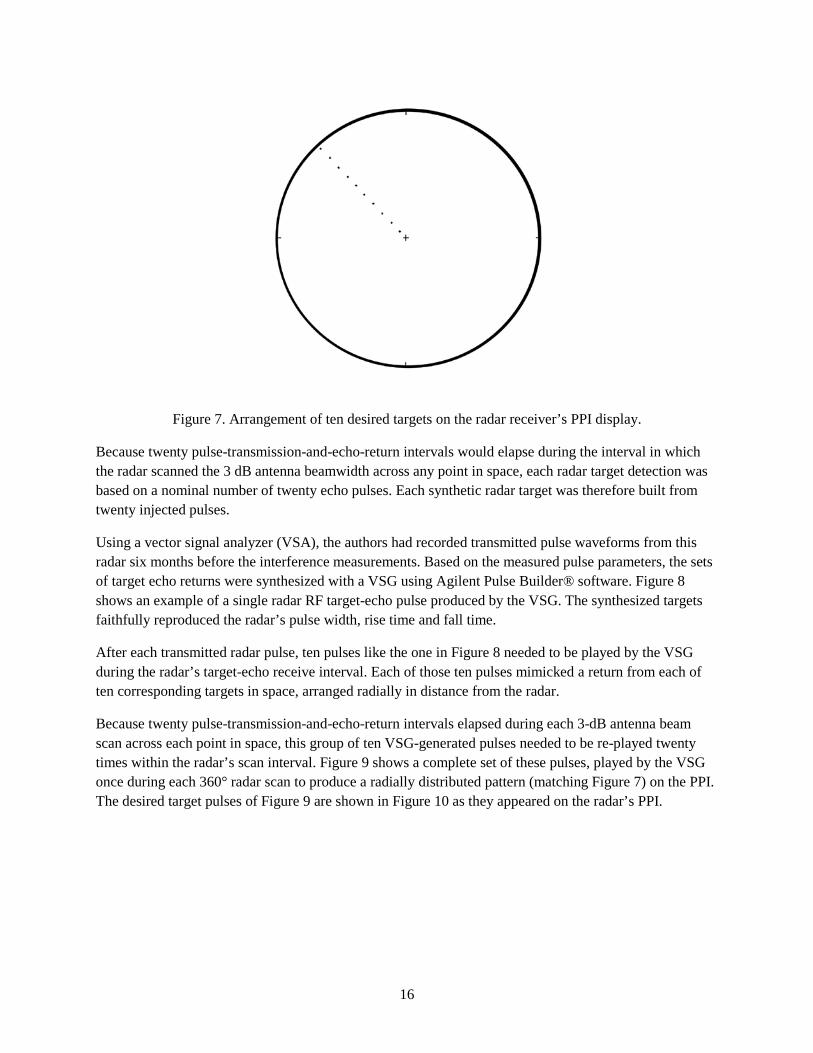
Figure 7. Arrangement of ten desired targets on the radar receiver’s PPI display.
Because twenty pulse-transmission-and-echo-return intervals would elapse during the interval in which the radar scanned the 3 dB antenna beamwidth across any point in space, each radar target detection was based on a nominal number of twenty echo pulses. Each synthetic radar target was therefore built from twenty injected pulses.
Using a vector signal analyzer (VSA), the authors had recorded transmitted pulse waveforms from this radar six months before the interference measurements. Based on the measured pulse parameters, the sets of target echo returns were synthesized with a VSG using Agilent Pulse Builder® software. Figure 8 shows an example of a single radar RF target-echo pulse produced by the VSG. The synthesized targets faithfully reproduced the radar’s pulse width, rise time and fall time.
After each transmitted radar pulse, ten pulses like the one in Figure 8 needed to be played by the VSG during the radar’s target-echo receive interval. Each of those ten pulses mimicked a return from each of ten corresponding targets in space, arranged radially in distance from the radar.
Because twenty pulse-transmission-and-echo-return intervals elapsed during each 3-dB antenna beam scan across each point in space, this group of ten VSG-generated pulses needed to be re-played twenty times within the radar’s scan interval. Figure 9 shows a complete set of these pulses, played by the VSG once during each 360° radar scan to produce a radially distributed pattern (matching Figure 7) on the PPI. The desired target pulses of Figure 9 are shown in Figure 10 as they appeared on the radar’s PPI.
16
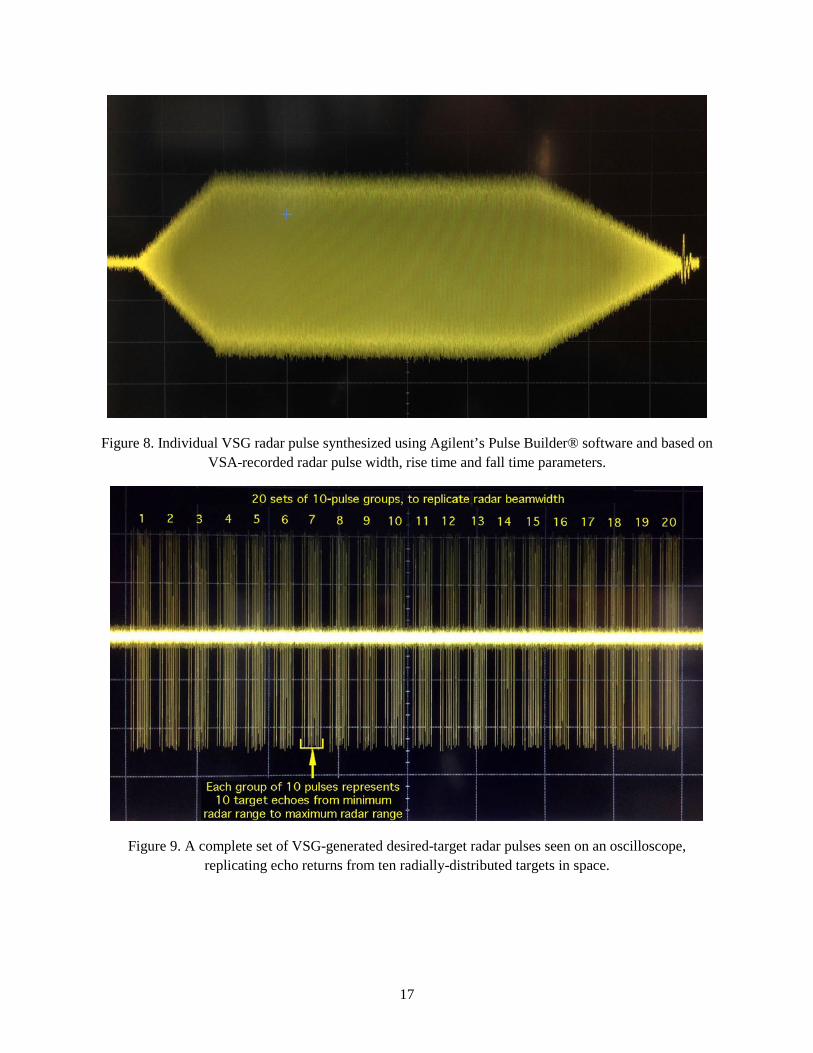
Figure 8. Individual VSG radar pulse synthesized using Agilent’s Pulse Builder® software and based on VSA-recorded radar pulse width, rise time and fall time parameters.
Figure 9. A complete set of VSG-generated desired-target radar pulses seen on an oscilloscope, replicating echo returns from ten radially-distributed targets in space.
17
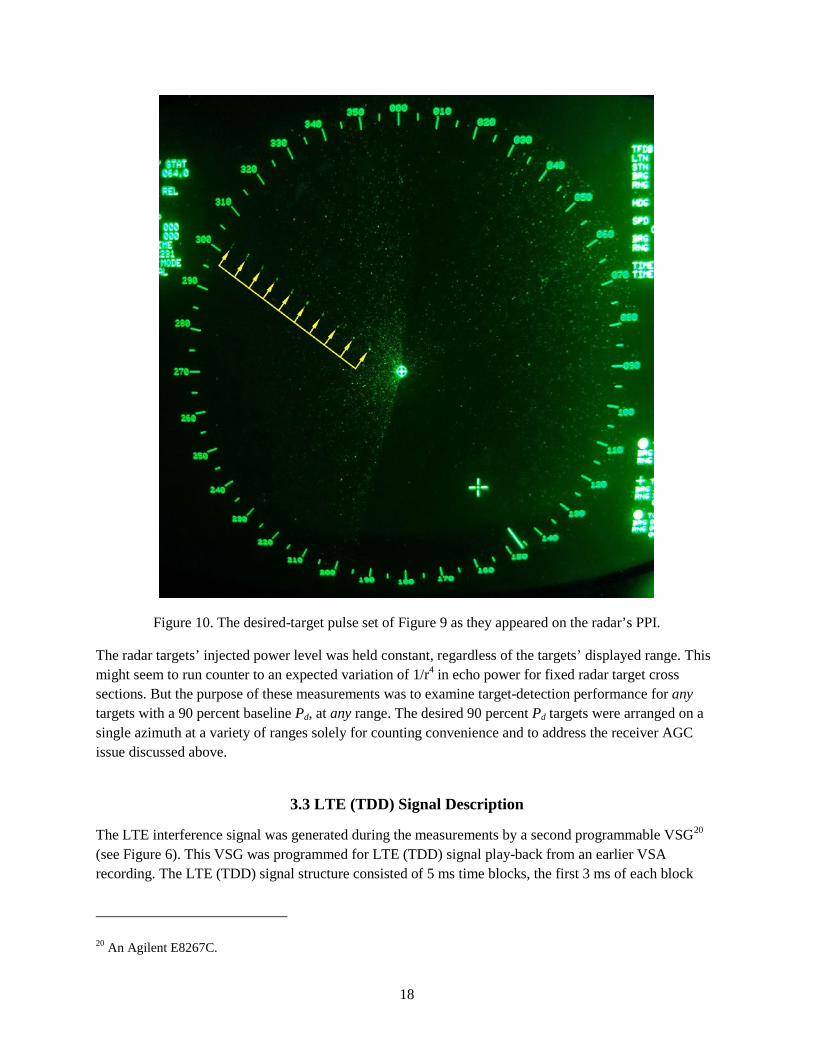
Figure 10. The desired-target pulse set of Figure 9 as they appeared on the radar’s PPI.
The radar targets’ injected power level was held constant, regardless of the targets’ displayed range. This might seem to run counter to an expected variation of 1/r4 in echo power for fixed radar target cross sections. But the purpose of these measurements was to examine target-detection performance for any targets with a 90 percent baseline Pd, at any range. The desired 90 percent Pd targets were arranged on a single azimuth at a variety of ranges solely for counting convenience and to address the receiver AGC issue discussed above.
3.3 LTE (TDD) Signal Description
The LTE interference signal was generated during the measurements by a second programmable VSG20 (see Figure 6). This VSG was programmed for LTE (TDD) signal play-back from an earlier VSA recording. The LTE (TDD) signal structure consisted of 5 ms time blocks, the first 3 ms of each block
20 An Agilent E8267C.
18
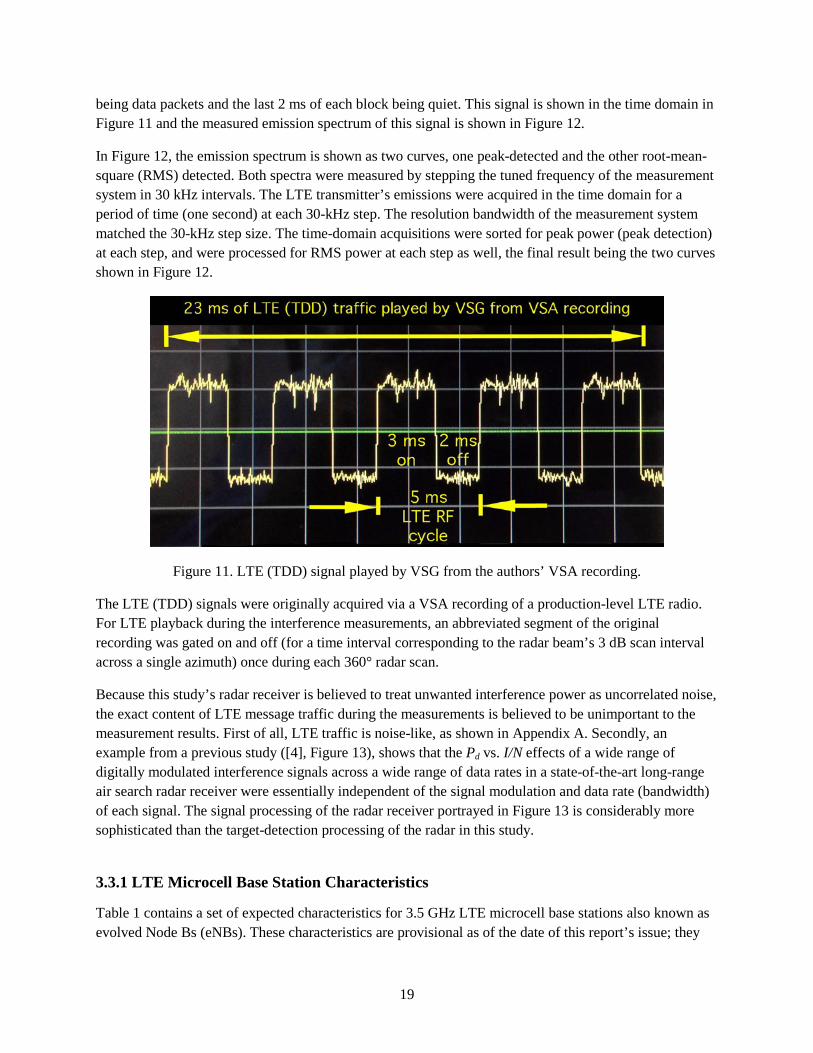
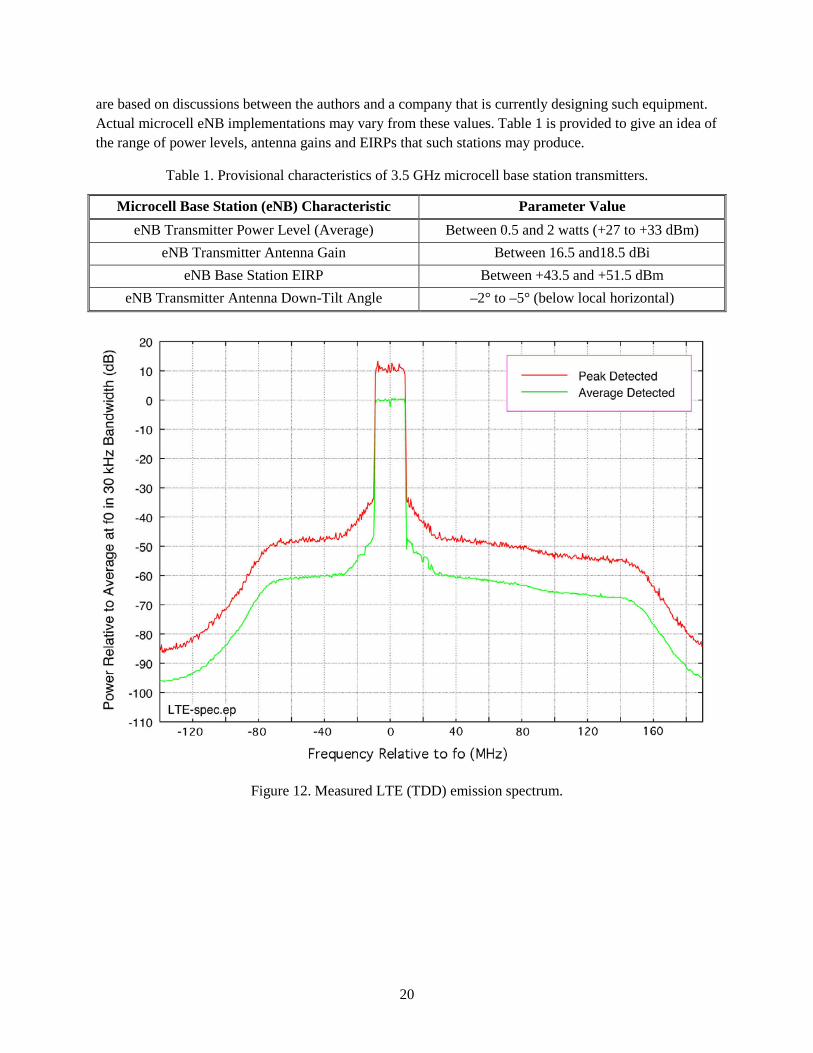
being data packets and the last 2 ms of each block being quiet. This signal is shown in the time domain in Figure 11 and the measured emission spectrum of this signal is shown in Figure 12.
In Figure 12, the emission spectrum is shown as two curves, one peak-detected and the other root-mean-square (RMS) detected. Both spectra were measured by stepping the tuned frequency of the measurement system in 30 kHz intervals. The LTE transmitter’s emissions were acquired in the time domain for a period of time (one second) at each 30-kHz step. The resolution bandwidth of the measurement system matched the 30-kHz step size. The time-domain acquisitions were sorted for peak power (peak detection) at each step, and were processed for RMS power at each step as well, the final result being the two curves shown in Figure 12.
Figure 11. LTE (TDD) signal played by VSG from the authors’ VSA recording.
The LTE (TDD) signals were originally acquired via a VSA recording of a production-level LTE radio. For LTE playback during the interference measurements, an abbreviated segment of the original recording was gated on and off (for a time interval corresponding to the radar beam’s 3 dB scan interval across a single azimuth) once during each 360° radar scan.
Because this study’s radar receiver is believed to treat unwanted interference power as uncorrelated noise, the exact content of LTE message traffic during the measurements is believed to be unimportant to the measurement results. First of all, LTE traffic is noise-like, as shown in Appendix A. Secondly, an example from a previous study ([4], Figure 13), shows that the Pd vs. I/N effects of a wide range of digitally modulated interference signals across a wide range of data rates in a state-of-the-art long-range air search radar receiver were essentially independent of the signal modulation and data rate (bandwidth) of each signal. The signal processing of the radar receiver portrayed in Figure 13 is considerably more sophisticated than the target-detection processing of the radar in this study.
3.3.1 LTE Microcell Base Station Characteristics
Table 1 contains a set of expected characteristics for 3.5 GHz LTE microcell base stations also known as evolved Node Bs (eNBs). These characteristics are provisional as of the date of this report’s issue; they
19
are based on discussions between the authors and a company that is currently designing such equipment. Actual microcell eNB implementations may vary from these values. Table 1 is provided to give an idea of the range of power levels, antenna gains and EIRPs that such stations may produce.
Table 1. Provisional characteristics of 3.5 GHz microcell base station transmitters.
Microcell Base Station (eNB) Characteristic Parameter Value eNB Transmitter Power Level (Average) Between 0.5 and 2 watts (+27 to +33 dBm)
eNB Transmitter Antenna Gain Between 16.5 and18.5 dBi eNB Base Station EIRP Between +43.5 and +51.5 dBm
eNB Transmitter Antenna Down-Tilt Angle –2° to –5° (below local horizontal)
Figure 12. Measured LTE (TDD) emission spectrum.
20
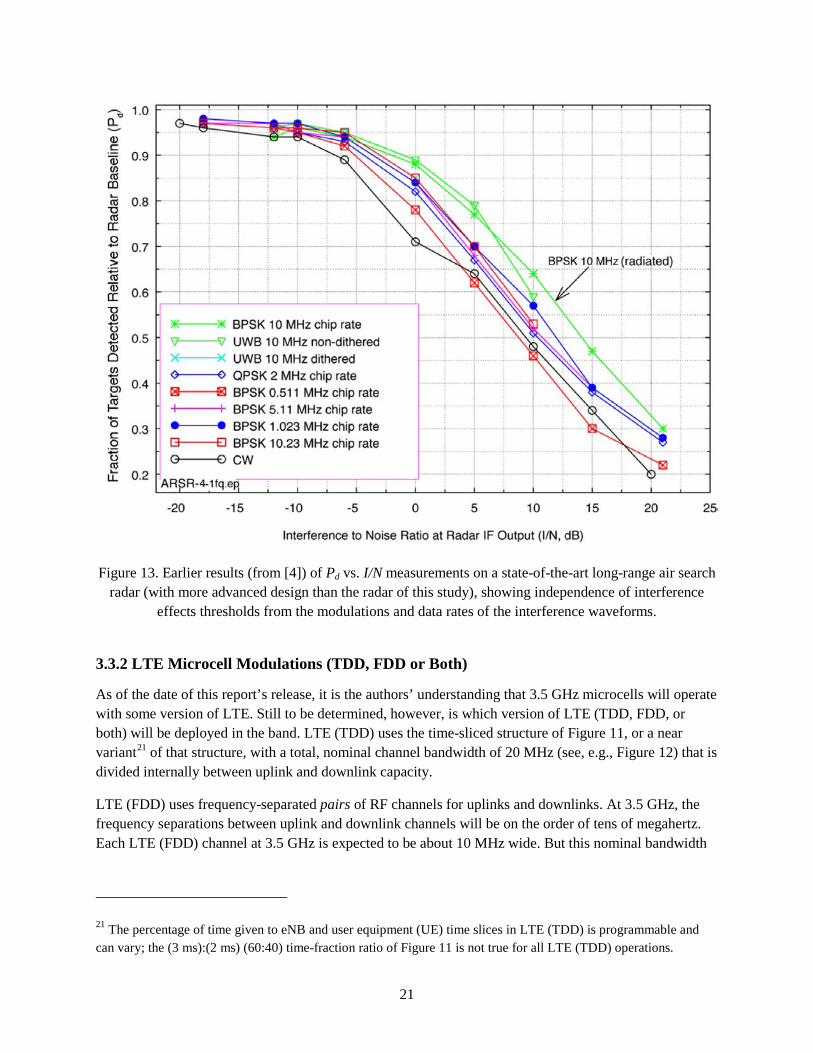
Figure 13. Earlier results (from [4]) of Pd vs. I/N measurements on a state-of-the-art long-range air search radar (with more advanced design than the radar of this study), showing independence of interference
effects thresholds from the modulations and data rates of the interference waveforms.
3.3.2 LTE Microcell Modulations (TDD, FDD or Both)
As of the date of this report’s release, it is the authors’ understanding that 3.5 GHz microcells will operate with some version of LTE. Still to be determined, however, is which version of LTE (TDD, FDD, or both) will be deployed in the band. LTE (TDD) uses the time-sliced structure of Figure 11, or a near variant21 of that structure, with a total, nominal channel bandwidth of 20 MHz (see, e.g., Figure 12) that is divided internally between uplink and downlink capacity.
LTE (FDD) uses frequency-separated pairs of RF channels for uplinks and downlinks. At 3.5 GHz, the frequency separations between uplink and downlink channels will be on the order of tens of megahertz. Each LTE (FDD) channel at 3.5 GHz is expected to be about 10 MHz wide. But this nominal bandwidth
21 The percentage of time given to eNB and user equipment (UE) time slices in LTE (TDD) is programmable and can vary; the (3 ms):(2 ms) (60:40) time-fraction ratio of Figure 11 is not true for all LTE (TDD) operations.
21
will vary somewhat, especially for uplinks that may use slightly narrower bandwidths depending on operating conditions, sometimes for example on the order of 7 MHz.22
At the time that the radar receiver was tested, the authors had not had an opportunity to record an LTE (FDD) signal.23 Given, however, that LTE (FDD) signals do not time-slice like LTE (TDD), but instead operate continuously in time on each channel, and given that, as observed in [4] for a number of other radars (and as shown for example in Figure 13) that there is good evidence that even sophisticated radar receivers treat interference power as uncorrelated noise, the authors used Gaussian noise (described below) as a proxy for LTE (FDD) in this interference study. The exactly noise-like statistical characteristic of LTE (both TDD and FDD) is described in detail in Appendix A; these data support the use of Gaussian noise as a proxy for LTE (FDD) interference in this study.
Concerning off-tuned characteristics of the two types of LTE signals in the time domain, the authors have observed that off-tuned energy is noise-like for both modulations (see Appendix A). Therefore for the radar receiver measurements a recording of off-tuned LTE (TDD) interference power that was played back during off-tuned interference measurements was valid for off-tuned interference effects for both types of LTE modulation. LTE off-tuned measurements in this study were performed using a 60 MHz off-tuned VSA recording24 of an LTE (TDD) signal. Using a VSG, that recording was played back into the radar receiver on the radar’s tuned center frequency.
Both LTE signal modulations use bandwidths that substantially exceed the radar receiver’s 1 MHz bandwidth (see Figure 5). Therefore, when calculating the fraction of interference power from an LTE signal in this type of radar receiver, a factor of 10log(Bradar/Binterference) = 10log(1 MHz)/(Binterference) bandwidth-offset correction needs to be applied, where Binterference is the total bandwidth of the interfering signal. For a 20 MHz-wide LTE (TDD) signal, for example, this power-offset factor would be -13 dB. As described in the section on calibration (below), the reported interference levels in the radar receiver in this report are the actual power levels measured in the radar receiver’s 1 MHz bandwidth. Conversely, the total LTE power levels that were injected into the radar receiver were higher than the levels monitored in the radar IF stage by the inverse of the bandwidth-offset factor.
3.4 Gaussian Noise Interference
As described above, Gaussian noise was injected into the radar receiver for two purposes. One purpose was to replicate aggregate LTE interference effects, the assumption being that a collection of LTE signals, themselves having individually noise-like statistics (see Appendix A), will have noise-like statistics in their aggregate. The other purpose was to serve as a proxy for LTE (FDD) signals in lieu of having an available recording of an LTE (FDD) signal, the case again being that: the LTE (FDD) signal is statistically noise-like in its characteristics (see Appendix A); that (unlike LTE (TDD)) it is not gated on and off in time; and that previous measurements of interference effects on even more sophisticated radar
22 Based on unpublished results from recent radar-to-LTE interference-effects measurements by the authors. 23 The authors recorded an LTE (FDD) signal subsequently to this study’s radar receiver measurements. 24 18 MHz wide.
22
receivers has shown [3] that radar receivers process interference as uncorrelated noise across a wide range of interference waveform modulation types.
For this study, Gaussian noise was generated by software written by an ITS engineer25 in MATLAB® code that was loaded into the authors’ interference VSG. Just as the LTE interference bursts were, the Gaussian noise was gated on and off simultaneously with the occurrence of the targets on the PPI, for an interval that corresponded to the time required for the radar beam’s 3 dB points to scan across any fixed point in space.
3.5 Timing and Synchronization of Targets, Interference and Radar Antenna Rotation
The injected desired-target pulse sequences (Figure 9) had to be synchronized in time with the radar transmitter’s pulse transmissions so as to be displayed at the proper (and fixed) ranges from the center of the PPI. The desired targets and injected interference had to be synchronized with each other so as to coincide on a single azimuth on the PPI. And it was desirable that the targets and interference should be synchronized with the radar antenna’s rotation so as to prevent precession or recession (“walking”) of their azimuth around the PPI during each interference measurement run.
The radar transmitter did not provide a north-mark pulse correlated with true north (or any other) antenna azimuth, but the radar transmitter did provide a direct-current (DC) pulse that began at the same time as each transmitted pulse, and which lasted just as long as each transmitted pulse (see Figure 6). Further, the radar antenna rotation scan rate was found to be very stable. To trigger the target-pulse sequence of Figure 9, the transmitter’s DC pulses were run through a purpose-built voltage converter that in turn produced a TTL–voltage trigger pulse for an arbitrary waveform generator (AWG) (see Figure 6) that finally triggered the emissions of both VSGs. The AWG was configured to ignore subsequent radar DC pulses for the remainder of each 360° radar scan interval.
The desired targets were manually located on the PPI when the rotating PPI scan line was observed by eye to be at some convenient azimuth, say the ten o’clock position. After manually arming the AWG at the moment that the PPI scan line was at this convenient azimuth, both VSGs automatically fired their respective emissions at the moment that the next DC pulse from the transmitter (via the DC voltage converter and the AWG) occurred. The AWG was programmed to remain dormant for a period of time that was manually adjusted by trial-and-error to be exactly equal to the radar antenna’s 360° scan interval. At the end of that dormancy interval, the AWG would automatically re-arm itself and fire on the next available DC radar pulse (effectively the next transmitted pulse from the radar). With careful adjustment of the dormancy interval to match the radar’s scan interval, the targets remained fixed on the same PPI azimuth for many minutes on end, which was enough time for complete measurement of the effects of each type of interference waveform. The 10 MHz reference output on the desired-target VSG was connected to a 10 MHz reference input on the interference VSG (see Figure 6) to ensure that the two VSGs used the same time reference. The interference and target waveforms were created such that the interference began 1-2 ms before the targets and ended 1-2 ms after the targets.
25 R. Achatz.
23
3.6 Target and Interference Calibration Methodology
Desired-target power levels had to be adjusted to ensure that the baseline condition of no interference the targets would be detectable and countable at a rate of 90 percent. The target power level was adjusted empirically to achieve that condition. Interference power levels needed to be adjusted relative to the internal, inherent noise level of the radar receiver in the receiver’s nominal target-detection bandwidth of 1 MHz (Figure 5). The following sub-sections describe these power calibration procedures in detail.
3.6.1 Calibration of Desired-Targets Power Level
In conformance with procedures described in [4], the targets’ baseline Pd needed to be set as close as possible to 90 percent. To do this, the authors initially set the power out of the desired-target VSG to a level that allowed them to be seen (using the spectrum analyzer) close to the radar noise at the (linear) receiver IF output, J303 (shown in Figure 6). Targets were counted manually for 20 radar scans (equaling 200 targets injected) and the percentage of targets that were actually observed was computed. Target power was adjusted upward or downward to arrive at the closest possible percentage to 90 percent across (180 counted out of 200 injected), subject to the minimum power step size available on the VSG output.
We note that, with the target power adjusted to the 90 percent Pd level, the peak-detected target power at IF tap point J303 was observed to run between 1.5 and 2 dB higher than the radar receiver’s peak-detected noise power. The difference between RMS target power and RMS radar receiver noise power was about 0.1 dB.
3.6.2 Calibration of LTE Interference Power Level
The spectrum analyzer at radar IF tap point J303 (which was set to a linear IF output via a mechanical control switch; log video is unacceptable for this task) was adjusted to observe the radar’s internal RMS noise power in a 1 MHz resolution bandwidth (matching as closely as possible the receiver’s bandwidth (Figure 5)). Freezing this level on the analyzer’s data trace display, the interference VSG (connected at the radar receiver’s RF input, Figure 6) was turned on in its LTE (TDD) mode with the LTE signal center-tuned to the radar’s tuned frequency. (The injected LTE (TDD) interference had a bandwidth of 20 MHz, as shown in Figure 12.) The LTE power level was adjusted until the injected RMS-detected LTE interference power was observed 3 dB above the radar’s internal noise (= 0 dB I/N). A table was then constructed from this power level, correlating actual VSG front-panel output power with I/N levels. Note that peak-detected LTE power would exceed RMS-detected LTE power by 10 dB.
3.6.3 Calibration of Gaussian Noise Interference Power Level
The spectrum analyzer was connected to the radar receiver’s linear IF tap point J303 (Figure 6). The analyzer was adjusted to observe the radar receiver’s RMS internal noise power in 1 MHz resolution bandwidth (matching its IF bandwidth, Figure 5). Freezing this level on the analyzer’s data trace display, the interference VSG (connected at the radar receiver’s RF input, Figure 6) was turned on in its Gaussian-noise generation mode. (The injected Gaussian noise had a bandwidth of 10 MHz, substantially exceeding the radar receiver bandwidth.) The VSG’s output noise power level was adjusted until the injected RMS-
24
detected Gaussian noise power was observed 3 dB above the radar’s internal noise (= 0 dB I/N). A table was then constructed from this power level, correlating actual VSG front-panel output noise power with I/N levels. Note that peak-detected Gaussian noise power exceeds RMS-detected Gaussian noise power by approximately10 dB.
25
4. LTE AND GAUSSIAN NOISE INTERFERENCE MEASUREMENT RESULTS
In this section we present the measured Pd vs I/N performance of the radar receiver in the presence of the following interference: proxy LTE (FDD) on-tuned, LTE (TDD) off-tuned by 60 MHz and Gaussian noise (for aggregate LTE and LTE (FDD) proxy). We also include a result for on-tuned CW interference, although CW signals are not expected to use spectrum at 3.5 GHz.
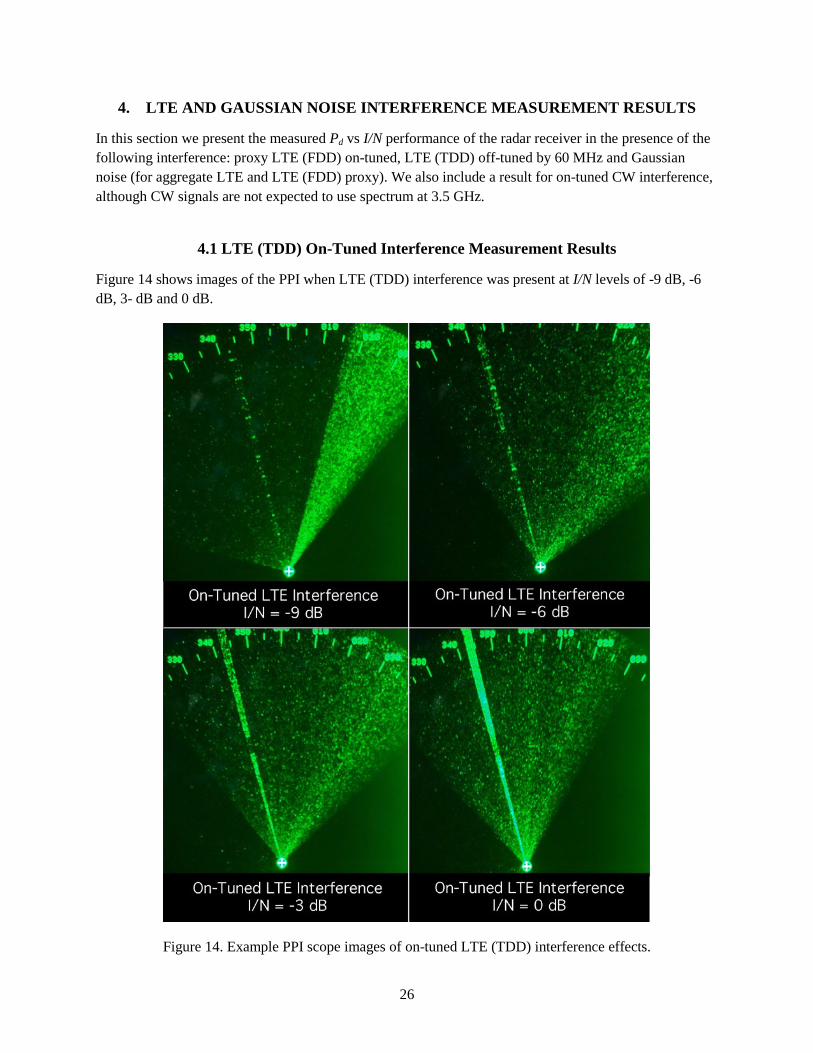
4.1 LTE (TDD) On-Tuned Interference Measurement Results
Figure 14 shows images of the PPI when LTE (TDD) interference was present at I/N levels of -9 dB, -6 dB, 3- dB and 0 dB.
Figure 14. Example PPI scope images of on-tuned LTE (TDD) interference effects.
26
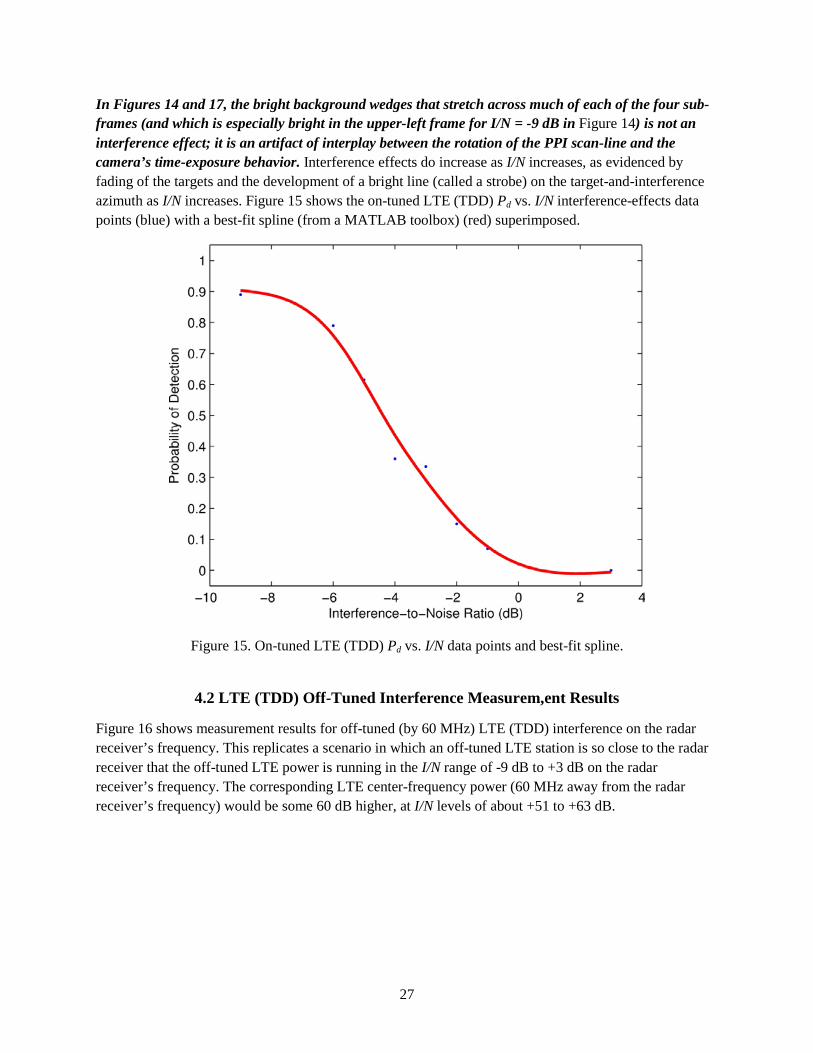
In Figures 14 and 17, the bright background wedges that stretch across much of each of the four sub-frames (and which is especially bright in the upper-left frame for I/N = -9 dB in Figure 14) is not an interference effect; it is an artifact of interplay between the rotation of the PPI scan-line and the camera’s time-exposure behavior. Interference effects do increase as I/N increases, as evidenced by fading of the targets and the development of a bright line (called a strobe) on the target-and-interference azimuth as I/N increases. Figure 15 shows the on-tuned LTE (TDD) Pd vs. I/N interference-effects data points (blue) with a best-fit spline (from a MATLAB toolbox) (red) superimposed.
Figure 15. On-tuned LTE (TDD) Pd vs. I/N data points and best-fit spline.
4.2 LTE (TDD) Off-Tuned Interference Measurem,ent Results
Figure 16 shows measurement results for off-tuned (by 60 MHz) LTE (TDD) interference on the radar receiver’s frequency. This replicates a scenario in which an off-tuned LTE station is so close to the radar receiver that the off-tuned LTE power is running in the I/N range of -9 dB to +3 dB on the radar receiver’s frequency. The corresponding LTE center-frequency power (60 MHz away from the radar receiver’s frequency) would be some 60 dB higher, at I/N levels of about +51 to +63 dB.
27
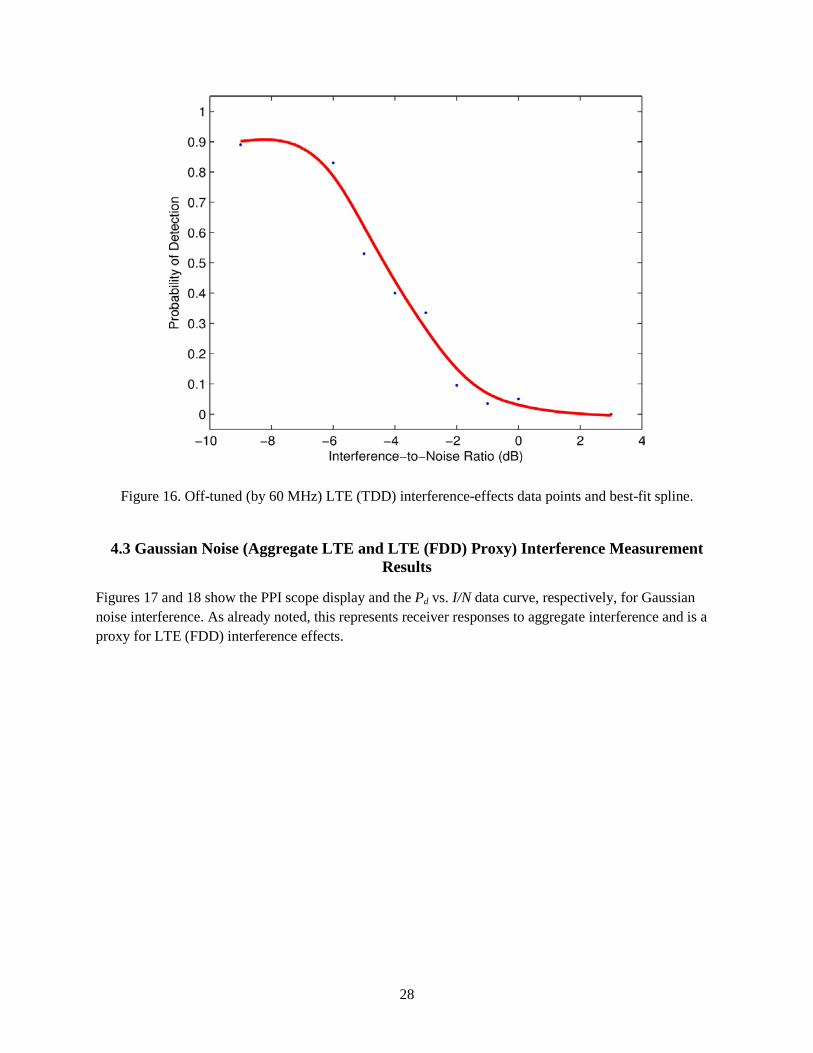
Figure 16. Off-tuned (by 60 MHz) LTE (TDD) interference-effects data points and best-fit spline.
4.3 Gaussian Noise (Aggregate LTE and LTE (FDD) Proxy) Interference Measurement Results
Figures 17 and 18 show the PPI scope display and the Pd vs. I/N data curve, respectively, for Gaussian noise interference. As already noted, this represents receiver responses to aggregate interference and is a proxy for LTE (FDD) interference effects.
28
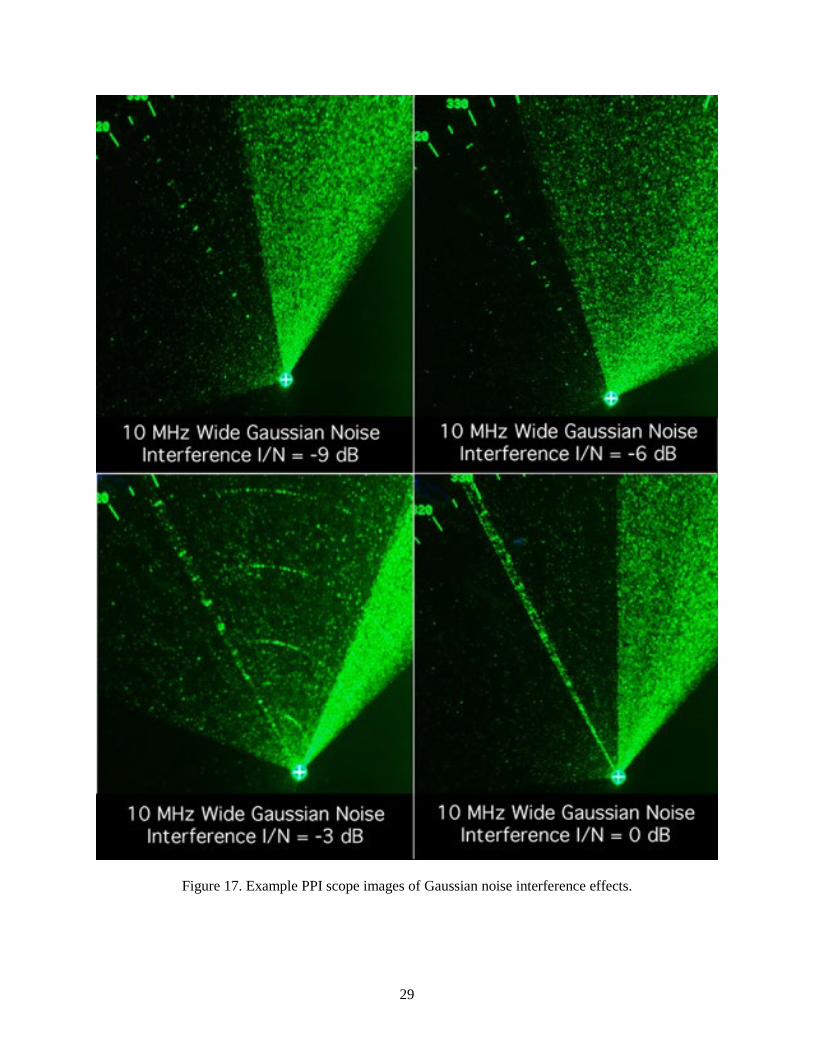
Figure 17. Example PPI scope images of Gaussian noise interference effects.
29
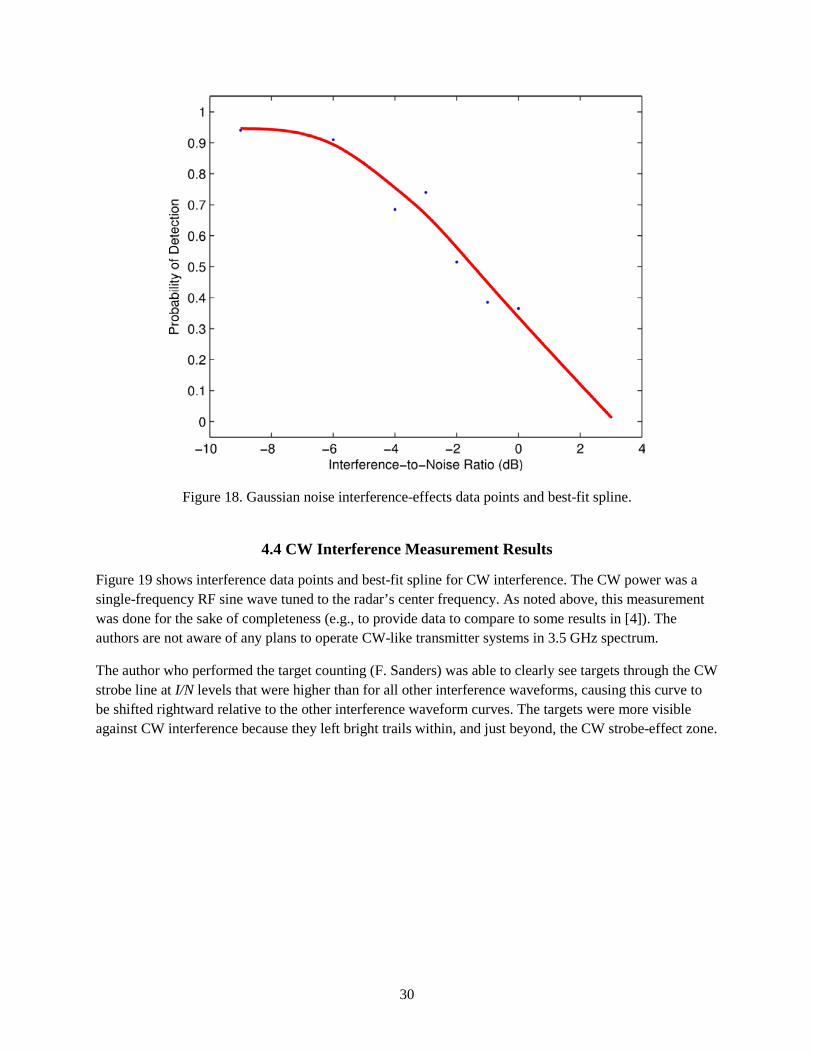
Figure 18. Gaussian noise interference-effects data points and best-fit spline.
4.4 CW Interference Measurement Results
Figure 19 shows interference data points and best-fit spline for CW interference. The CW power was a single-frequency RF sine wave tuned to the radar’s center frequency. As noted above, this measurement was done for the sake of completeness (e.g., to provide data to compare to some results in [4]). The authors are not aware of any plans to operate CW-like transmitter systems in 3.5 GHz spectrum.
The author who performed the target counting (F. Sanders) was able to clearly see targets through the CW strobe line at I/N levels that were higher than for all other interference waveforms, causing this curve to be shifted rightward relative to the other interference waveform curves. The targets were more visible against CW interference because they left bright trails within, and just beyond, the CW strobe-effect zone.
30
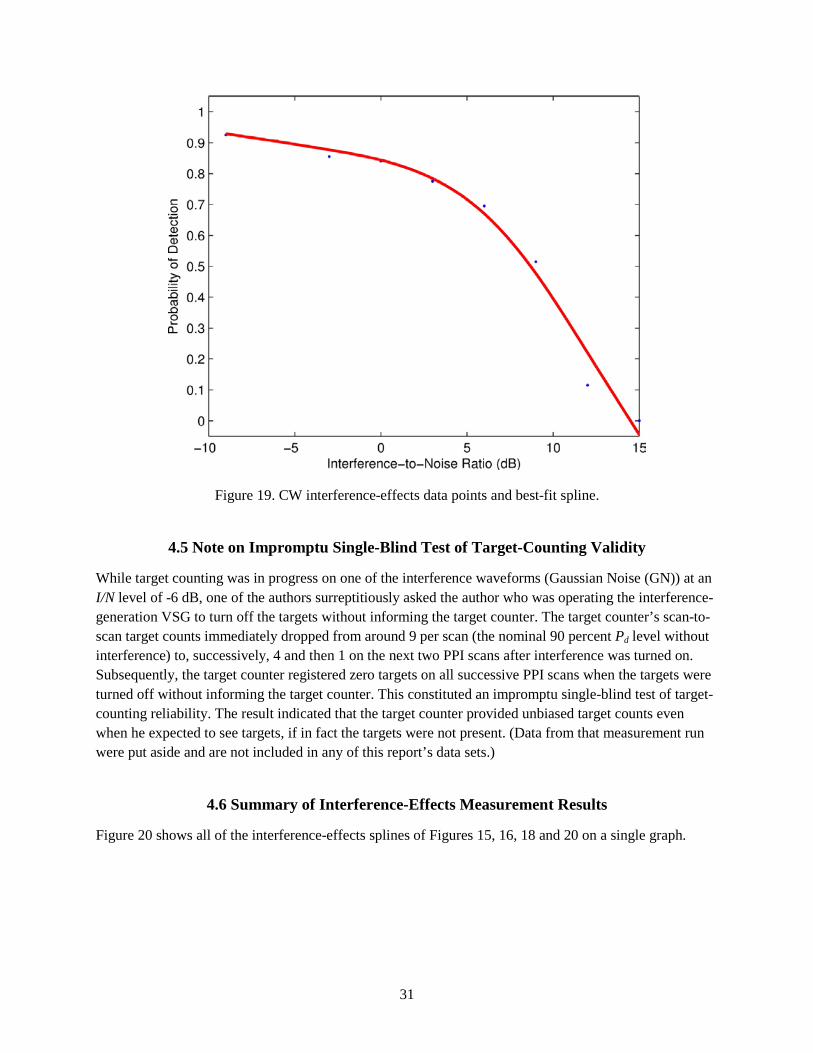
Figure 19. CW interference-effects data points and best-fit spline.
4.5 Note on Impromptu Single-Blind Test of Target-Counting Validity
While target counting was in progress on one of the interference waveforms (Gaussian Noise (GN)) at an I/N level of -6 dB, one of the authors surreptitiously asked the author who was operating the interference-generation VSG to turn off the targets without informing the target counter. The target counter’s scan-to-scan target counts immediately dropped from around 9 per scan (the nominal 90 percent Pd level without interference) to, successively, 4 and then 1 on the next two PPI scans after interference was turned on. Subsequently, the target counter registered zero targets on all successive PPI scans when the targets were turned off without informing the target counter. This constituted an impromptu single-blind test of target-counting reliability. The result indicated that the target counter provided unbiased target counts even when he expected to see targets, if in fact the targets were not present. (Data from that measurement run were put aside and are not included in any of this report’s data sets.)
4.6 Summary of Interference-Effects Measurement Results
Figure 20 shows all of the interference-effects splines of Figures 15, 16, 18 and 20 on a single graph.
31
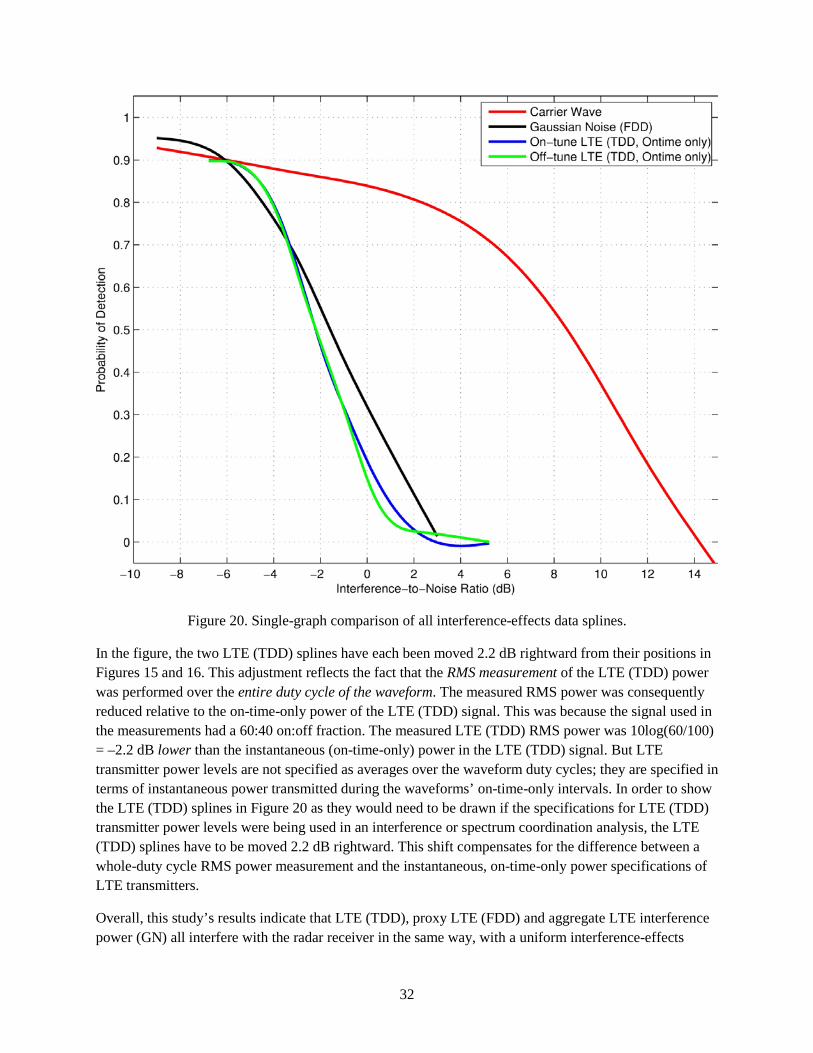
Figure 20. Single-graph comparison of all interference-effects data splines.
In the figure, the two LTE (TDD) splines have each been moved 2.2 dB rightward from their positions in Figures 15 and 16. This adjustment reflects the fact that the RMS measurement of the LTE (TDD) power was performed over the entire duty cycle of the waveform. The measured RMS power was consequently reduced relative to the on-time-only power of the LTE (TDD) signal. This was because the signal used in the measurements had a 60:40 on:off fraction. The measured LTE (TDD) RMS power was 10log(60/100) = –2.2 dB lower than the instantaneous (on-time-only) power in the LTE (TDD) signal. But LTE transmitter power levels are not specified as averages over the waveform duty cycles; they are specified in terms of instantaneous power transmitted during the waveforms’ on-time-only intervals. In order to show the LTE (TDD) splines in Figure 20 as they would need to be drawn if the specifications for LTE (TDD) transmitter power levels were being used in an interference or spectrum coordination analysis, the LTE (TDD) splines have to be moved 2.2 dB rightward. This shift compensates for the difference between a whole-duty cycle RMS power measurement and the instantaneous, on-time-only power specifications of LTE transmitters.
Overall, this study’s results indicate that LTE (TDD), proxy LTE (FDD) and aggregate LTE interference power (GN) all interfere with the radar receiver in the same way, with a uniform interference-effects
32
(lost-targets) threshold of about I/N = -6 dB. This result is consistent with the authors’ understanding of the effects of uncorrelated noise in the radar receiver and with the results of previous, similar studies (e.g.,[4]).
The radar receiver’s Pd vs. I/N curves for LTE signals and Gaussian noise are steeply sloped. They are more steeply sloped than, for example, the curves in Figure 13. The only common interference waveform between Figures 13 and 20 is CW, and although the CW curve for this study’s radar does drops more slowly than for LTE signals and GN, it still drops faster than for the radar of Figure 13. We conclude that, overall, the radar in this study seemed to exhibit more steeply dropping Pd vs. I/N curves than some other radars (e.g., Figure 13).
33
5. SUMMARY AND CONCLUSIONS
5.1 Summary of this Study’s Results
In this report, the authors have presented the results of EMC measurements for future 3550–3650 MHz spectrum sharing between proposed future microcell signals and existing radar receivers. The collected data presented in this report include:
• the radar receiver’s horizontal-plane antenna radiation pattern; • the radar receiver’s RF front end frequency response; • the radar receiver’s IF-stage frequency response; • the radar receiver’s noise figure; • the radar receiver’s RF overload response up to an input power of -4.6 dBm; • a measured LTE emission spectrum; • interference-effects results for LTE signal, CW and Gaussian noise interference effects.
5.2 Conclusions
Interference waveforms of LTE (TDD), LTE (FDD) (from a Gaussian noise proxy) and simulated aggregate LTE interference power (GN) all interfere with the radar receiver in the same way, with a uniform interference-effects (lost-targets) threshold of about I/N = -6 dB within the radar receiver. This result is consistent with the authors’ understanding of the effects of uncorrelated interference power in the radar receiver, and with the results of previous interference-effects studies on other types of radar receivers.
The authors do not identify IPC or other band-sharing EMC criteria for the type of radar receiver that has been studied; that needs to be done in a separate analysis. But the measurement results presented in this report may be used to guide the development of band-sharing EMC criteria for LTE interference into this type of radar receiver. Overall, the collected data presented in this report may be applied in future, multi-agency band-sharing EMC studies to determine technical conditions for band sharing.
34
6. ACKNOWLEDGMENTS
The authors thank the staff at the radar field station where this work was performed for engineering access and technical support. We could not have done it without you, and your gracious assistance and substantial patience with us while we interrupted your regular operations is greatly appreciated.
35
7. REFERENCES
[1] Federal Communications Commission, “Proposal to Create a Citizen’s Broadband Service in the 3550-3650 MHz Band,” FCC Docket No. 12-354, 12 Dec. 2012. http://www.fcc.gov/document/enabling-innovative-small-cell-use-35-ghz-band-nprm-order
[2] Federal Communications Commission, “Amendment to the Commission’s Rules with Regard to Commercial Operations in the Band 3550-3650 MHz,” FCC Gaussian noise Docket No. 12-354, 23 Apr. 2014. http://apps.fcc.gov/ecfs/document/view?id=7521099242
[3] U.S. Dept. of Commerce, National Telecommunications and Information Administration, “An Assessment of the Near-Term Viability of Accommodating Wireless Broadband Systems in the 1675-1710 MHz, 1755-1780 MHz, 3500-3650 MHz, 4200-4220 MHz and 4380-4400 MHz Bands (President's Spectrum Plan Report),” Oct. 2010. http://www.ntia.doc.gov/files/ntia/publications/fasttrackevaluation_11152010.pdf
[4] Sanders, F. H., R. L. Sole, B. L. Bedford, D. Franc and T. Pawlowitz, “Effects of RF Interference on Radar Receivers”, U.S. Dept. of Commerce, NTIA Technical Report TR-06-444, Feb. 2006. http://www.its.bldrdoc.gov/publications/2481.aspx
[5] Sanders, F. H., R. L. Hinkle and B. J. Ramsey, “Analysis of Electromagnetic Compatibility Between Radar Stations and 4 GHz Earth Stations,” U.S. Dept. of Commerce, NTIA Technical Report TR-94-313, Jul. 1994. http://www.its.bldrdoc.gov/publications/2340.aspx
[6] Carroll, J. E., G. A. Sanders, F. H. Sanders and R. L. Sole, “Case Study: Investigation of Interference into 5 GHz Weather Radars from Unlicensed National Information Infrastructure Devices, Part 3,” U.S. Dept. of Commerce, NTIA Technical Report TR-12-486, Jun. 2012. http://www.its.bldrdoc.gov/publications/2677.aspx
36
APPENDIX A LTE/OFDM SIGNAL STATISTICS
In interference analysis, it is often convenient to replace the actual signal with one that is more analytically tractable. In this case an orthogonal frequency division multiplexed (OFDM) signal transmitted from a Broadband Radio Service (BRS) base station is compared to GN. This appendix shows measurements and statistical analysis that support this replacement. The BRS base station signal conformed to the WiMAX OFDM time division duplexed (TDD) standard. As LTE and WiMAX are both OFDM at the operational level, the results presented here are equally applicable to LTE signals. Since on- and off-times for the signal were separable, results for on-times are assumed to apply to FDD implementations of WiMAX and LTE as well.
The signal was transmitted at a 2683.5 MHz center frequency and had an approximate 9.3 MHz equivalent noise bandwidth. The TDD on-time and period were 3 and 5 ms long, respectively, with a resultant 3/5 = 60% duty cycle. A single LTE/WiMAX OFDM symbol with guard time is approximately 103 µs long. In one 3 ms on-time there are approximately 29 OFDM symbols.
A.1 Measurement System Description
The measurement system consisted of a custom preselector unit26, instrument, and computer. The custom preselector unit had a variable attenuator, preselector filter, and low noise amplifier (LNA). The preselector filter had a 30 MHz bandwidth and approximately 8 dB loss at 3 GHz. The LNA had 25 dB gain and approximately 4.5 dB noise figure at 3 GHz.
The instrument is either a spectrum analyzer (SA) or vector signal analyzer (VSA). The WIMAX/LTE spectrum was measured with a SA. The signal’s time series, used to analyze the signal statistics of smaller portions of the WiMAX/LTE spectrum, was measured with a VSA. In either case the noise figure was approximately 21 dB at 3 GHz.
A block diagram of the measurement system is shown in Figure A-1. Hardline connections were used to avoid radiated measurement problems such as low signal powers, multipath, and interference. An attenuator in the cable connecting the base station to the user equipment replicated radio wave propagation path loss. The measurement system was connected to the cable by a directional coupler.
For the purposes of this appendix, the SA powers are reported as the power at the input to the preselector and the VSA powers are reported as the power at the input to the VSA.
26 Third generation Radio Spectrum Measurement System (RSMS) preselector unit.
37
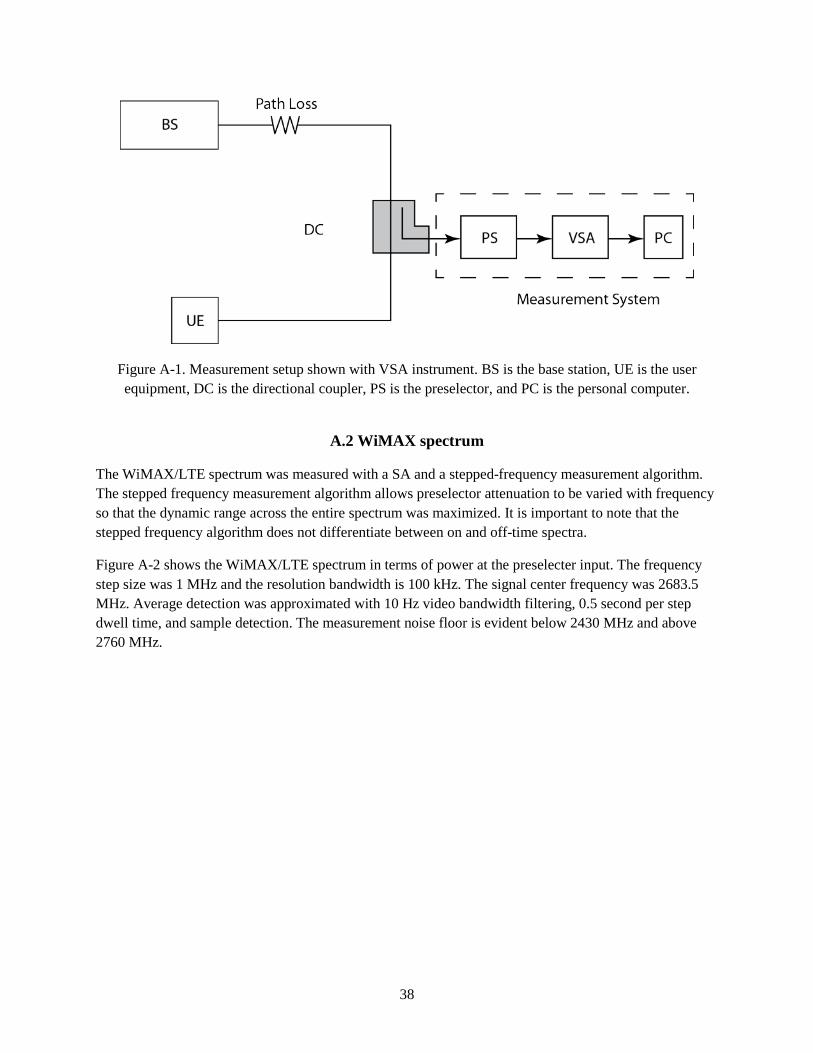
Figure A-1. Measurement setup shown with VSA instrument. BS is the base station, UE is the user equipment, DC is the directional coupler, PS is the preselector, and PC is the personal computer.
A.2 WiMAX spectrum
The WiMAX/LTE spectrum was measured with a SA and a stepped-frequency measurement algorithm. The stepped frequency measurement algorithm allows preselector attenuation to be varied with frequency so that the dynamic range across the entire spectrum was maximized. It is important to note that the stepped frequency algorithm does not differentiate between on and off-time spectra.
Figure A-2 shows the WiMAX/LTE spectrum in terms of power at the preselecter input. The frequency step size was 1 MHz and the resolution bandwidth is 100 kHz. The signal center frequency was 2683.5 MHz. Average detection was approximated with 10 Hz video bandwidth filtering, 0.5 second per step dwell time, and sample detection. The measurement noise floor is evident below 2430 MHz and above 2760 MHz.
38
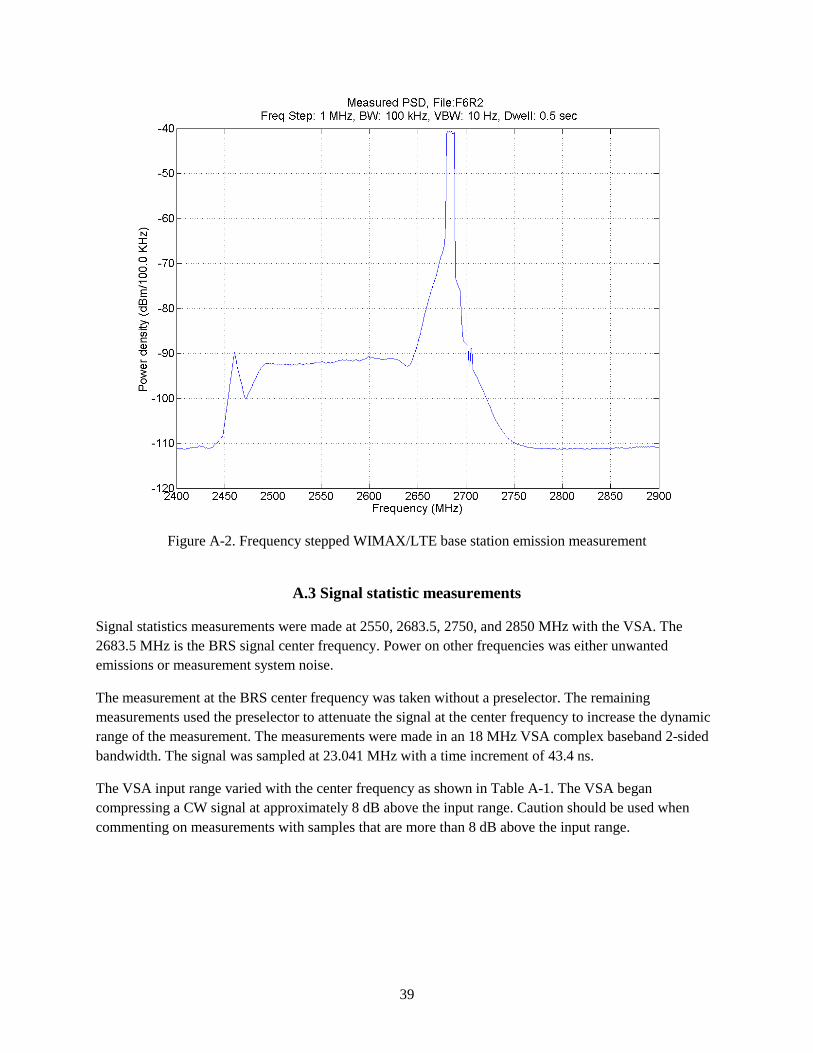
Figure A-2. Frequency stepped WIMAX/LTE base station emission measurement
A.3 Signal statistic measurements
Signal statistics measurements were made at 2550, 2683.5, 2750, and 2850 MHz with the VSA. The 2683.5 MHz is the BRS signal center frequency. Power on other frequencies was either unwanted emissions or measurement system noise.
The measurement at the BRS center frequency was taken without a preselector. The remaining measurements used the preselector to attenuate the signal at the center frequency to increase the dynamic range of the measurement. The measurements were made in an 18 MHz VSA complex baseband 2-sided bandwidth. The signal was sampled at 23.041 MHz with a time increment of 43.4 ns.
The VSA input range varied with the center frequency as shown in Table A-1. The VSA began compressing a CW signal at approximately 8 dB above the input range. Caution should be used when commenting on measurements with samples that are more than 8 dB above the input range.
39
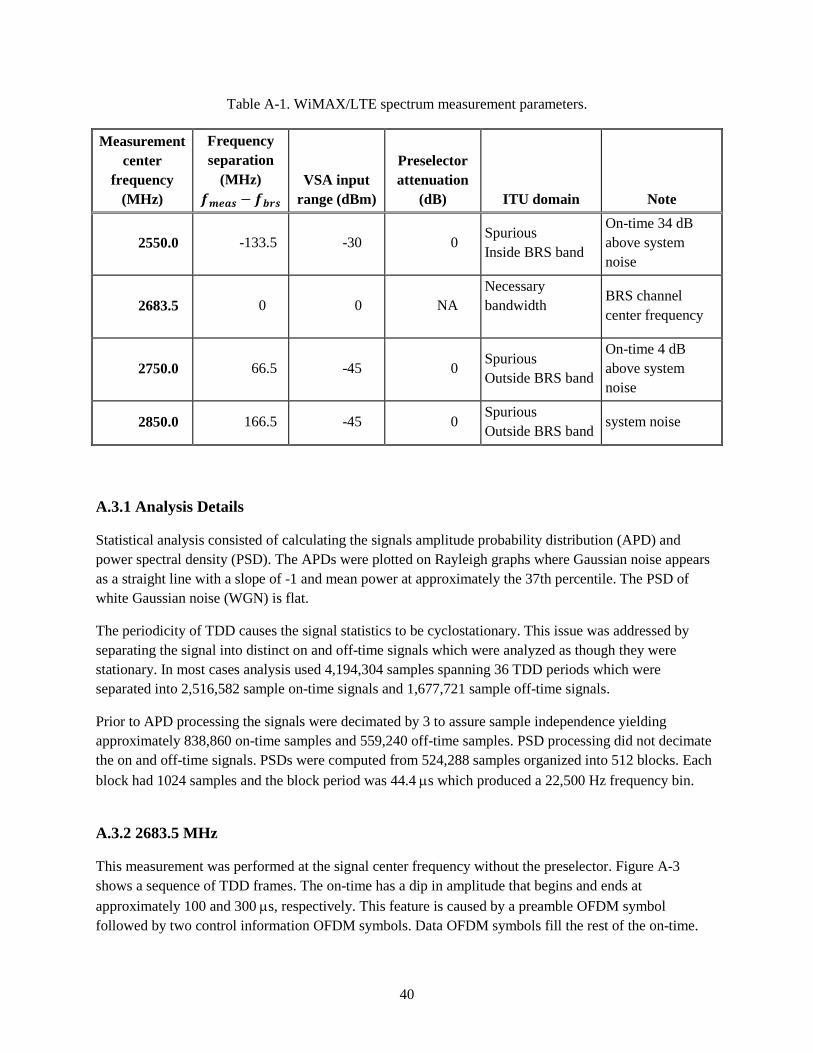
Table A-1. WiMAX/LTE spectrum measurement parameters.
Measurement center
frequency (MHz)
Frequency separation
(MHz) 𝒇𝒎𝒆𝒂𝒔 − 𝒇𝒃𝒓𝒔
VSA input range (dBm)
Preselector attenuation
(dB) ITU domain Note
2550.0 -133.5 -30 0 Spurious Inside BRS band
On-time 34 dB above system noise
2683.5 0 0 NA Necessary bandwidth
BRS channel center frequency
2750.0 66.5 -45 0 Spurious Outside BRS band
On-time 4 dB above system noise
2850.0 166.5 -45 0 Spurious Outside BRS band system noise
A.3.1 Analysis Details
Statistical analysis consisted of calculating the signals amplitude probability distribution (APD) and power spectral density (PSD). The APDs were plotted on Rayleigh graphs where Gaussian noise appears as a straight line with a slope of -1 and mean power at approximately the 37th percentile. The PSD of white Gaussian noise (WGN) is flat.
The periodicity of TDD causes the signal statistics to be cyclostationary. This issue was addressed by separating the signal into distinct on and off-time signals which were analyzed as though they were stationary. In most cases analysis used 4,194,304 samples spanning 36 TDD periods which were separated into 2,516,582 sample on-time signals and 1,677,721 sample off-time signals.
Prior to APD processing the signals were decimated by 3 to assure sample independence yielding approximately 838,860 on-time samples and 559,240 off-time samples. PSD processing did not decimate the on and off-time signals. PSDs were computed from 524,288 samples organized into 512 blocks. Each block had 1024 samples and the block period was 44.4 µs which produced a 22,500 Hz frequency bin.
A.3.2 2683.5 MHz
This measurement was performed at the signal center frequency without the preselector. Figure A-3 shows a sequence of TDD frames. The on-time has a dip in amplitude that begins and ends at approximately 100 and 300 µs, respectively. This feature is caused by a preamble OFDM symbol followed by two control information OFDM symbols. Data OFDM symbols fill the rest of the on-time.
40
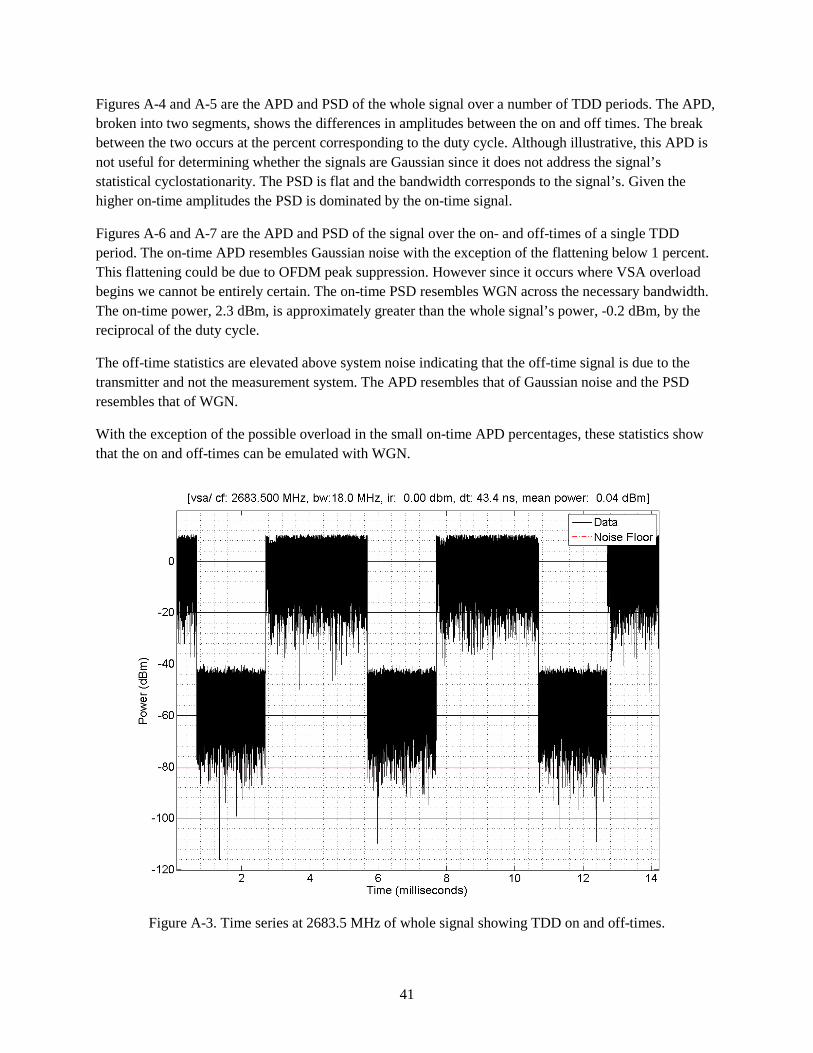
Figures A-4 and A-5 are the APD and PSD of the whole signal over a number of TDD periods. The APD, broken into two segments, shows the differences in amplitudes between the on and off times. The break between the two occurs at the percent corresponding to the duty cycle. Although illustrative, this APD is not useful for determining whether the signals are Gaussian since it does not address the signal’s statistical cyclostationarity. The PSD is flat and the bandwidth corresponds to the signal’s. Given the higher on-time amplitudes the PSD is dominated by the on-time signal.
Figures A-6 and A-7 are the APD and PSD of the signal over the on- and off-times of a single TDD period. The on-time APD resembles Gaussian noise with the exception of the flattening below 1 percent. This flattening could be due to OFDM peak suppression. However since it occurs where VSA overload begins we cannot be entirely certain. The on-time PSD resembles WGN across the necessary bandwidth. The on-time power, 2.3 dBm, is approximately greater than the whole signal’s power, -0.2 dBm, by the reciprocal of the duty cycle.
The off-time statistics are elevated above system noise indicating that the off-time signal is due to the transmitter and not the measurement system. The APD resembles that of Gaussian noise and the PSD resembles that of WGN.
With the exception of the possible overload in the small on-time APD percentages, these statistics show that the on and off-times can be emulated with WGN.
Figure A-3. Time series at 2683.5 MHz of whole signal showing TDD on and off-times.
41
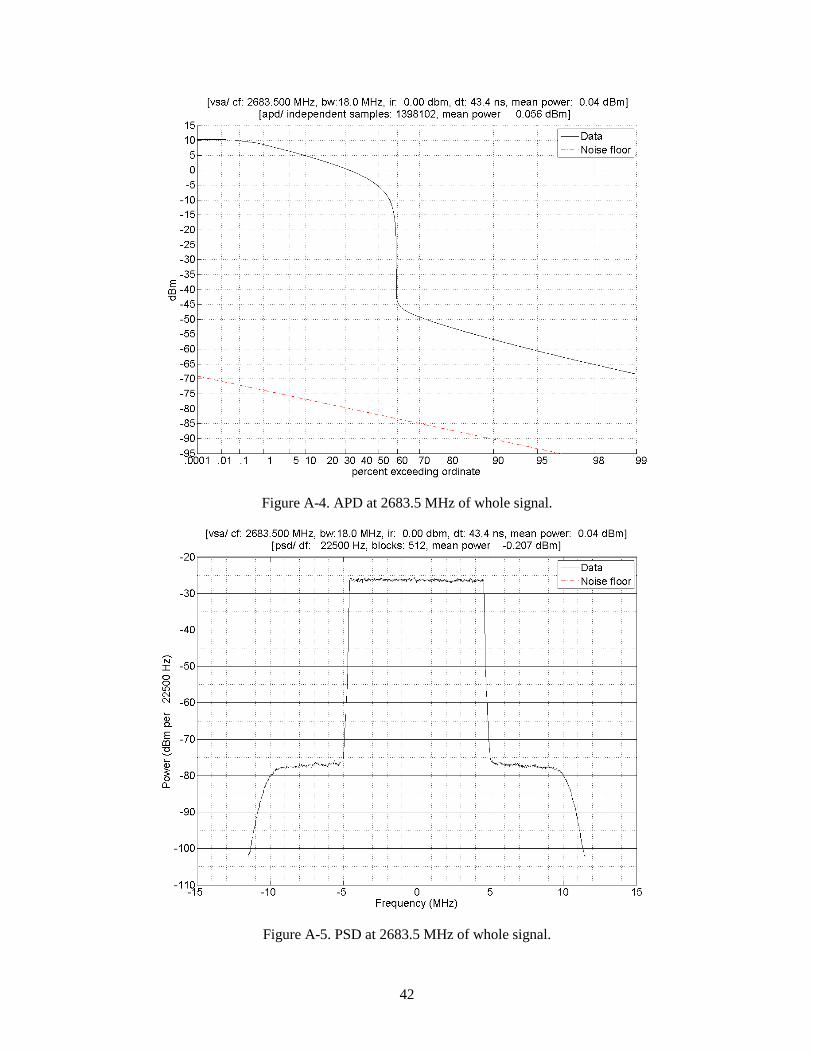
Figure A-4. APD at 2683.5 MHz of whole signal.
Figure A-5. PSD at 2683.5 MHz of whole signal.
42
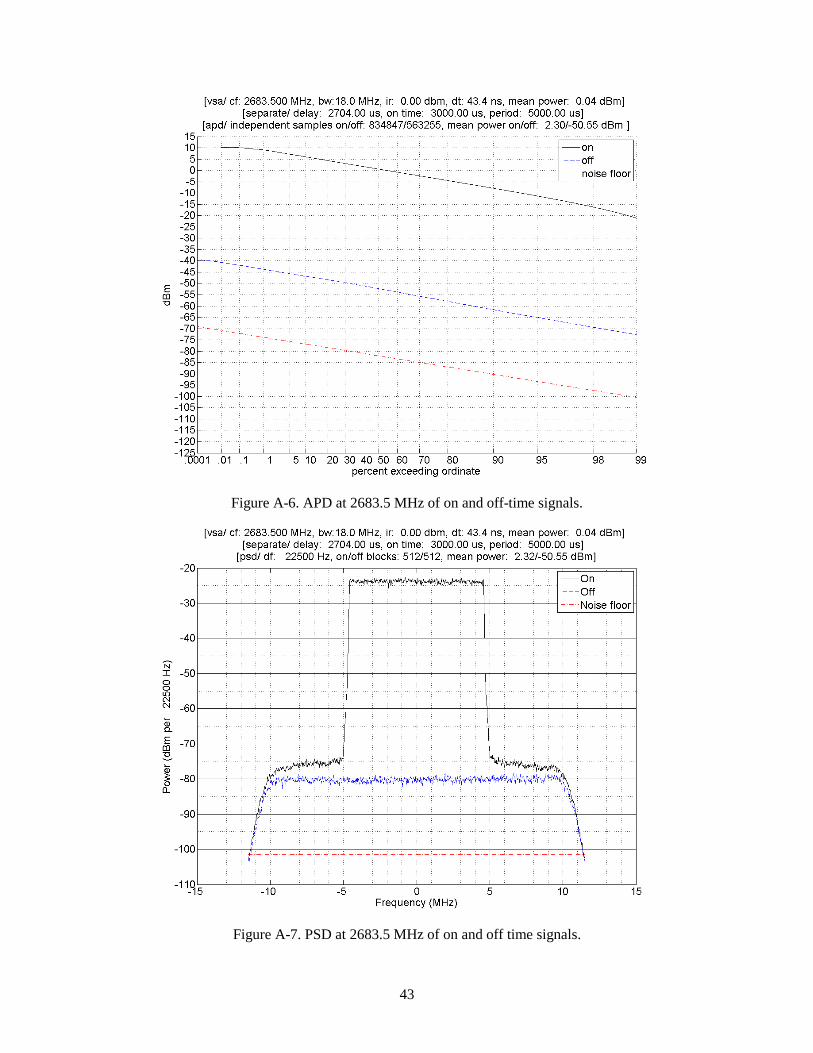
Figure A-6. APD at 2683.5 MHz of on and off-time signals.
Figure A-7. PSD at 2683.5 MHz of on and off time signals.
43
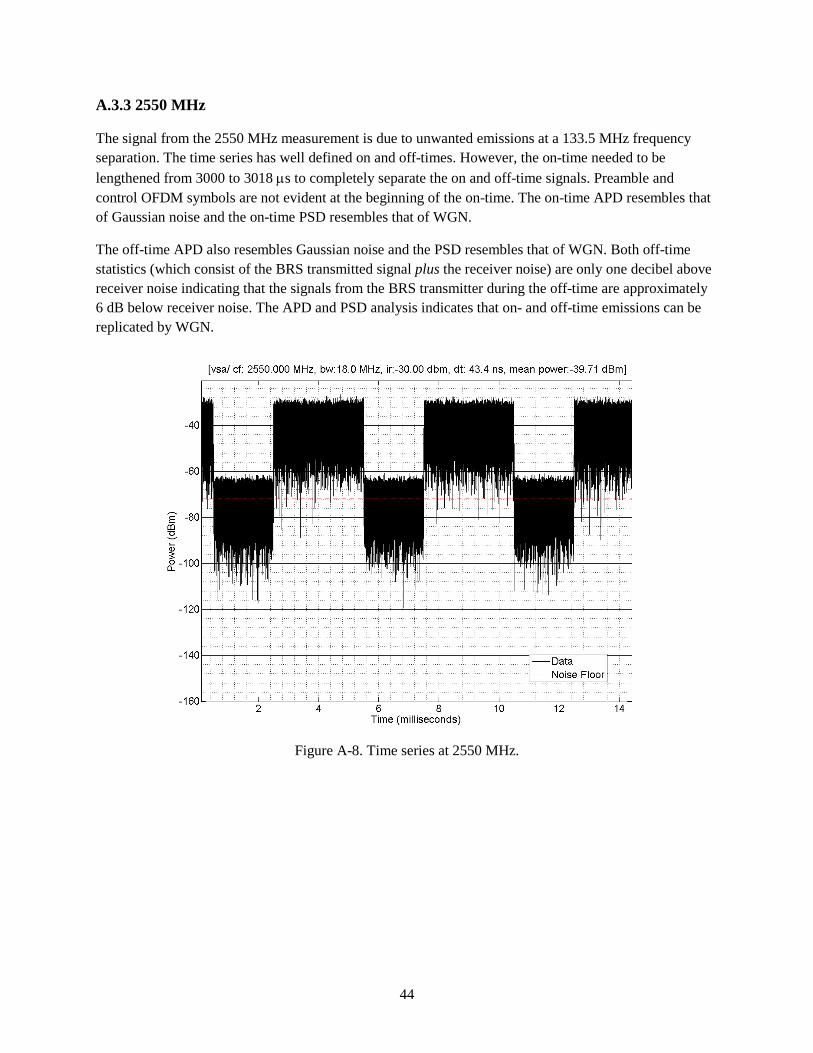
A.3.3 2550 MHz
The signal from the 2550 MHz measurement is due to unwanted emissions at a 133.5 MHz frequency separation. The time series has well defined on and off-times. However, the on-time needed to be lengthened from 3000 to 3018 µs to completely separate the on and off-time signals. Preamble and control OFDM symbols are not evident at the beginning of the on-time. The on-time APD resembles that of Gaussian noise and the on-time PSD resembles that of WGN.
The off-time APD also resembles Gaussian noise and the PSD resembles that of WGN. Both off-time statistics (which consist of the BRS transmitted signal plus the receiver noise) are only one decibel above receiver noise indicating that the signals from the BRS transmitter during the off-time are approximately 6 dB below receiver noise. The APD and PSD analysis indicates that on- and off-time emissions can be replicated by WGN.
Figure A-8. Time series at 2550 MHz.
44
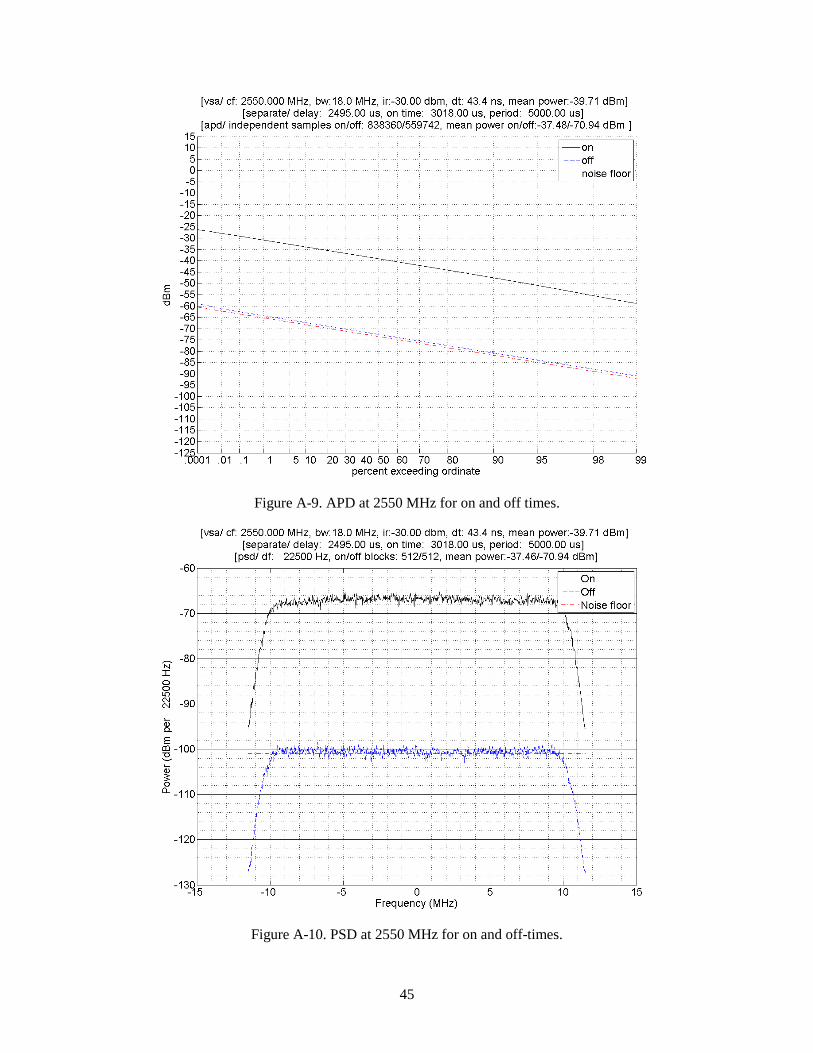
Figure A-9. APD at 2550 MHz for on and off times.
Figure A-10. PSD at 2550 MHz for on and off-times.
45
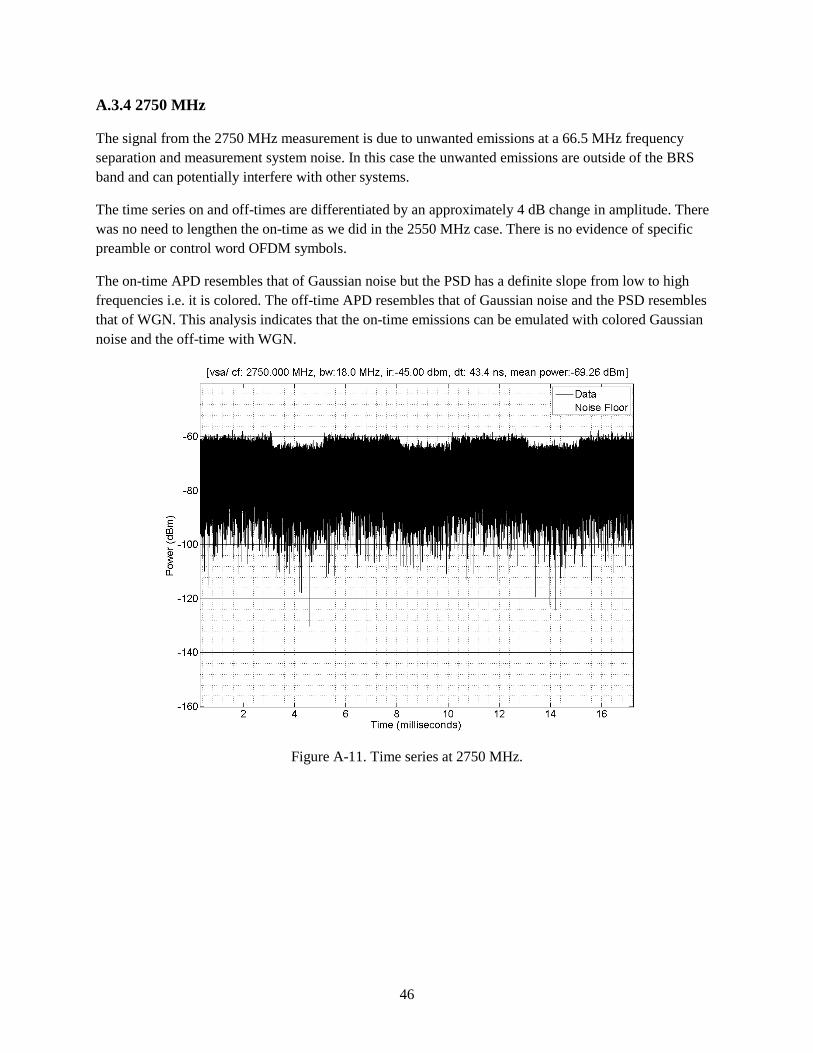
A.3.4 2750 MHz
The signal from the 2750 MHz measurement is due to unwanted emissions at a 66.5 MHz frequency separation and measurement system noise. In this case the unwanted emissions are outside of the BRS band and can potentially interfere with other systems.
The time series on and off-times are differentiated by an approximately 4 dB change in amplitude. There was no need to lengthen the on-time as we did in the 2550 MHz case. There is no evidence of specific preamble or control word OFDM symbols.
The on-time APD resembles that of Gaussian noise but the PSD has a definite slope from low to high frequencies i.e. it is colored. The off-time APD resembles that of Gaussian noise and the PSD resembles that of WGN. This analysis indicates that the on-time emissions can be emulated with colored Gaussian noise and the off-time with WGN.
Figure A-11. Time series at 2750 MHz.
46
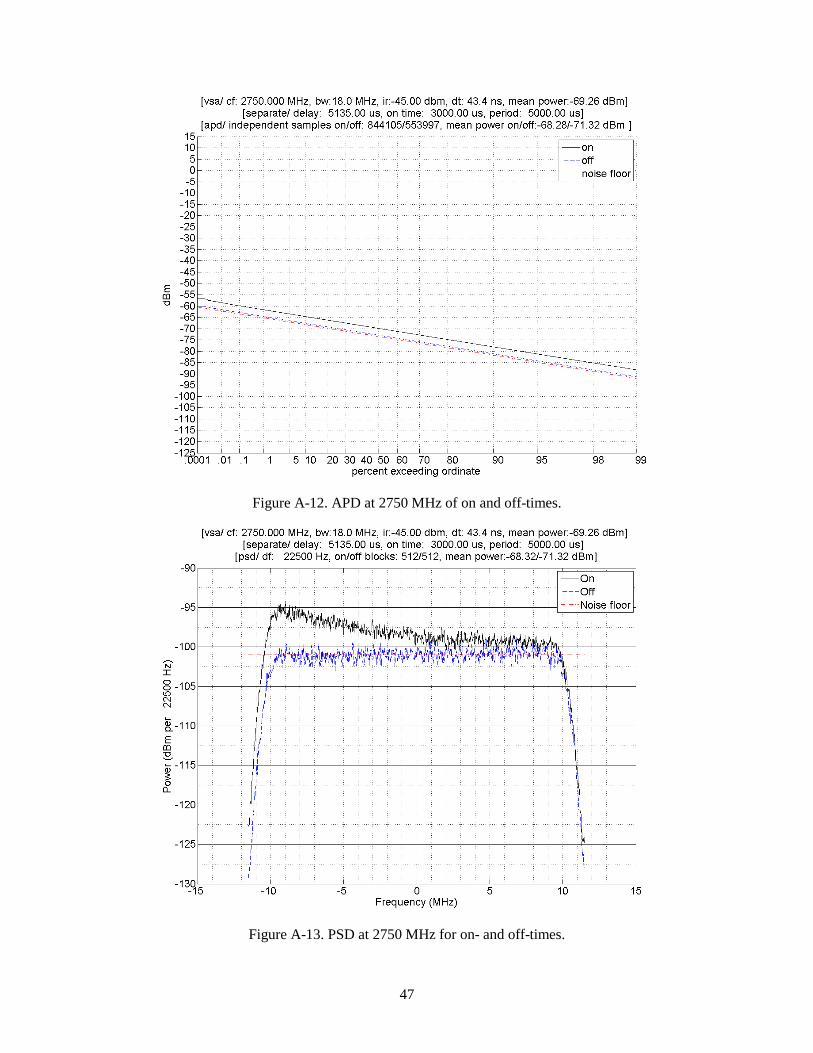
Figure A-12. APD at 2750 MHz of on and off-times.
Figure A-13. PSD at 2750 MHz for on- and off-times.
47
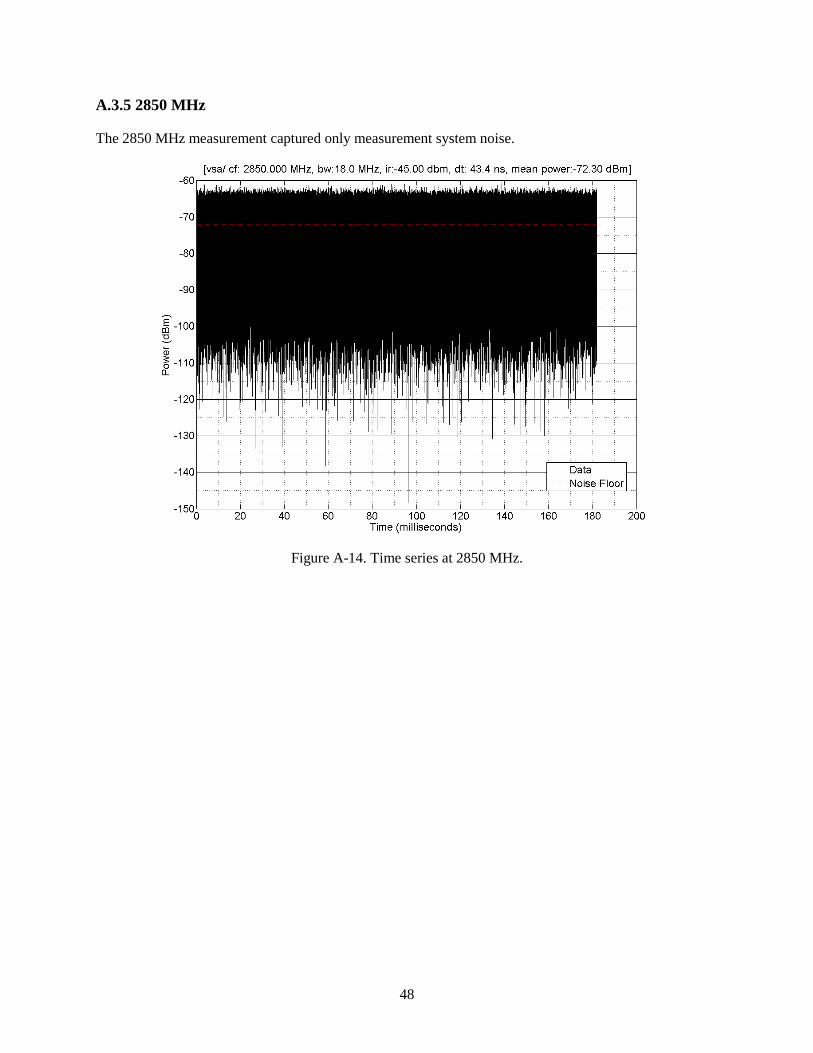
A.3.5 2850 MHz
The 2850 MHz measurement captured only measurement system noise.
Figure A-14. Time series at 2850 MHz.
48
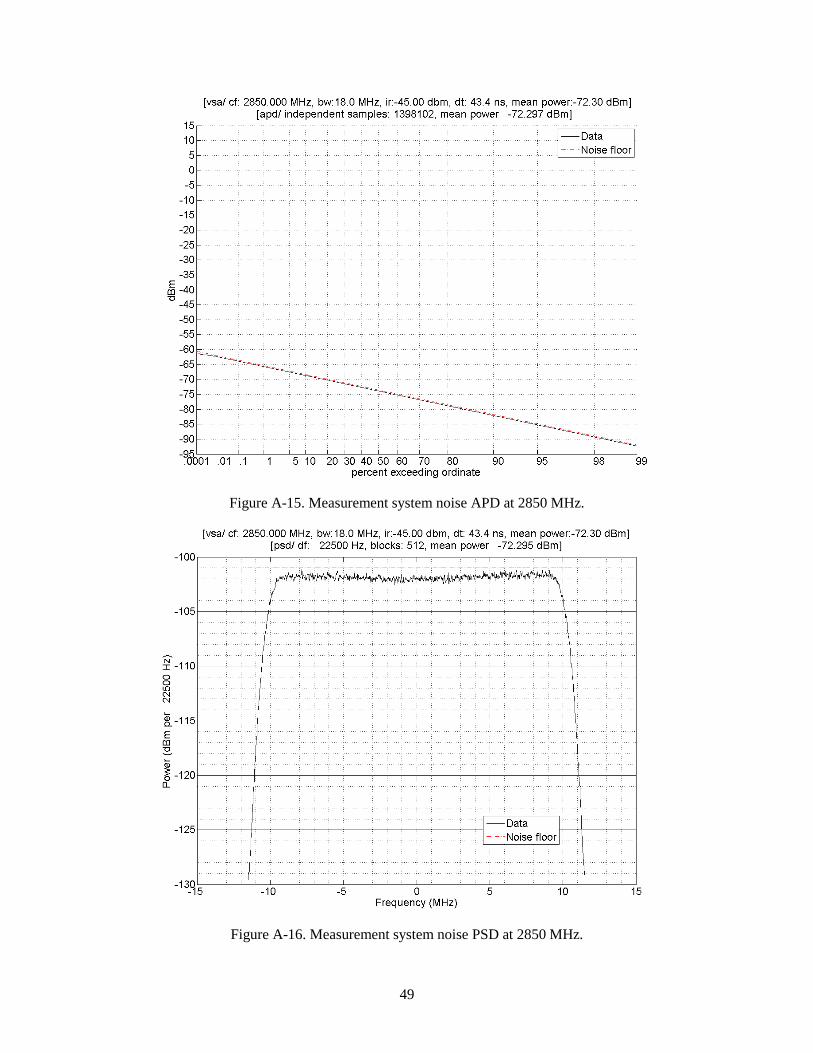
Figure A-15. Measurement system noise APD at 2850 MHz.
Figure A-16. Measurement system noise PSD at 2850 MHz.
49
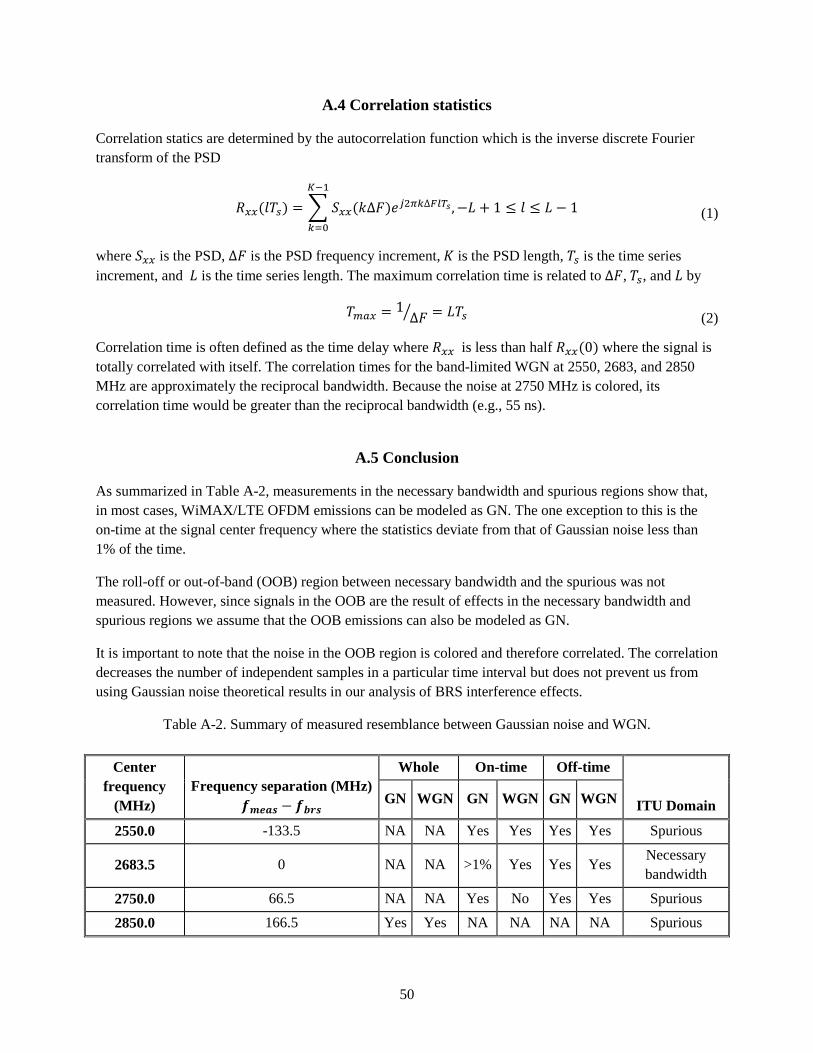
A.4 Correlation statistics
Correlation statics are determined by the autocorrelation function which is the inverse discrete Fourier transform of the PSD
𝑅𝑥𝑥(𝑙𝑇𝑠) = �𝑆𝑥𝑥(𝑘∆𝐹𝐾−1
𝑘=0
)𝑒𝑗2𝜋𝑘∆𝐹𝑙𝑇𝑠 ,−𝐿 + 1 ≤ 𝑙 ≤ 𝐿 − 1 (1)
where 𝑆𝑥𝑥 is the PSD, ∆𝐹 is the PSD frequency increment, 𝐾 is the PSD length, 𝑇𝑠 is the time series increment, and 𝐿 is the time series length. The maximum correlation time is related to ∆𝐹, 𝑇𝑠, and 𝐿 by
𝑇𝑚𝑎𝑥 = 1∆𝐹� = 𝐿𝑇𝑠 (2)
Correlation time is often defined as the time delay where 𝑅𝑥𝑥 is less than half 𝑅𝑥𝑥(0) where the signal is totally correlated with itself. The correlation times for the band-limited WGN at 2550, 2683, and 2850 MHz are approximately the reciprocal bandwidth. Because the noise at 2750 MHz is colored, its correlation time would be greater than the reciprocal bandwidth (e.g., 55 ns).
A.5 Conclusion
As summarized in Table A-2, measurements in the necessary bandwidth and spurious regions show that, in most cases, WiMAX/LTE OFDM emissions can be modeled as GN. The one exception to this is the on-time at the signal center frequency where the statistics deviate from that of Gaussian noise less than 1% of the time.
The roll-off or out-of-band (OOB) region between necessary bandwidth and the spurious was not measured. However, since signals in the OOB are the result of effects in the necessary bandwidth and spurious regions we assume that the OOB emissions can also be modeled as GN.
It is important to note that the noise in the OOB region is colored and therefore correlated. The correlation decreases the number of independent samples in a particular time interval but does not prevent us from using Gaussian noise theoretical results in our analysis of BRS interference effects.
Table A-2. Summary of measured resemblance between Gaussian noise and WGN.
Center frequency
(MHz) Frequency separation (MHz)
𝒇𝒎𝒆𝒂𝒔 − 𝒇𝒃𝒓𝒔
Whole On-time Off-time
ITU Domain GN WGN GN WGN GN WGN
2550.0 -133.5 NA NA Yes Yes Yes Yes Spurious
2683.5 0 NA NA >1% Yes Yes Yes Necessary bandwidth
2750.0 66.5 NA NA Yes No Yes Yes Spurious
2850.0 166.5 Yes Yes NA NA NA NA Spurious
50
NTIA FORM 29 U.S. DEPARTMENT OF COMMERCE (4-80) NATIONAL TELECOMMUNICATIONS AND INFORMATION ADMINISTRATION
BIBLIOGRAPHIC DATA SHEET
1. PUBLICATION NO. TR-14-507
2. Government Accession No.
3. Recipient’s Accession No.
4. TITLE AND SUBTITLE EMC Measurements for Spectrum Sharing Between LTE Signals and Radar Receivers
5. Publication Date July 2014 6. Performing Organization Code ITS.T
7. AUTHOR(S) F. H. Sanders, J. E. Carroll, G. A. Sanders, R. L. Sole, R. J. Achatz and L. S. Cohen
9. Project/Task/Work Unit No. 6469000-200 8. PERFORMING ORGANIZATION NAME AND ADDRESS
Institute for Telecommunication Sciences National Telecommunications & Information Administration U.S. Department of Commerce 325 Broadway Boulder, CO 80305
10. Contract/Grant Number.
11. Sponsoring Organization Name and Address National Telecommunications & Information Administration Herbert C. Hoover Building 14th & Constitution Ave., NW Washington, DC 20230
12. Type of Report and Period Covered
14. SUPPLEMENTARY NOTES 15. ABSTRACT (A 200-word or less factual summary of most significant information. If document includes a significant bibliography or literature survey, mention it here.) In response to proposals to introduce new Long Term Evolution (LTE) microcell Citizens Broadband Service (CBS) radio systems into 3550–3650 MHz (3.5 GHz) radio spectrum in the United States, the authors have performed measurements and analysis on effects of LTE interference on the performance of a type of radar receiver that might eventually share spectrum with such systems. LTE and Gaussian noise (GN) interference were injected into a radar receiver; Gaussian noise was a proxy for aggregated interference sources and one type of LTE. Interference was injected into a radar receiver so as to appear coincident with synthetic radar targets on the radar’s display. The targets’ baseline (non-interference) probability of detection (Pd) was 90 percent. With interference present, the targets’ Pd was measured and recorded as a function of LTE signal (both on-tuned and off-tuned) and Gaussian noise interference levels. Additional data presented in this report include: the radar receiver’s antenna radiation pattern, RF front end frequency response, IF-stage frequency response, noise figure, and RF overload response up to an input power of -4.6 dBm. A measured LTE emission spectrum is also provided. Using these data, spectrum management personnel can perform electromagnetic compatibility (EMC) analyses for possible future spectrum sharing between LTE transmitters and this type of radar receiver.
16. Key Words (Alphabetical order, separated by semicolons) 3.5 GHz spectrum sharing; Citizens Broadband Service (CBS); interference effects; interference protection criteria (IPC); Long Term Evolution (LTE); microcells; radar; small cells; spectrum access system (SAS); spectrum sharing 17. AVAILABILITY STATEMENT UNLIMITED. FOR OFFICIAL DISTRIBUTION.
18. Security Class. (This report)
Unclassified
20. Number of pages 71
19. Security Class. (This page)
Unclassified
21. Price:
NTIA FORMAL PUBLICATION SERIES NTIA MONOGRAPH (MG)
A scholarly, professionally oriented publication dealing with state-of-the-art research or an authoritative treatment of a broad area. Expected to have long-lasting value.
NTIA SPECIAL PUBLICATION (SP)
Conference proceedings, bibliographies, selected speeches, course and instructional materials, directories, and major studies mandated by Congress.
NTIA REPORT (TR)
Important contributions to existing knowledge of less breadth than a monograph, such as results of completed projects and major activities. Subsets of this series include:
JOINT NTIA/OTHER-AGENCY REPORT (JR)
This report receives both local NTIA and other agency review. Both agencies’ logos and report series numbering appear on the cover.
NTIA SOFTWARE & DATA PRODUCTS (SD)
Software such as programs, test data, and sound/video files. This series can be used to transfer technology to U.S. industry.
NTIA HANDBOOK (HB)
Information pertaining to technical procedures, reference and data guides, and formal user's manuals that are expected to be pertinent for a long time.
NTIA TECHNICAL MEMORANDUM (TM)
Technical information typically of less breadth than an NTIA Report. The series includes data, preliminary project results, and information for a specific, limited audience.
For information about NTIA publications, contact the NTIA/ITS Technical Publications Office at 325 Broadway, Boulder, CO, 80305 Tel. (303) 497-3572 or e-mail [email protected].
Related Documents