Embedded Energy Plan Final Report Prepared for: Irvine Ranch Water District Submitted by: Navigant Consulting, Inc. 1 Market Street Spear Street Tower, Suite 1200 San Francisco, CA 94105 415.399.2180 navigant.com In Collaboration with: HDR Engineering Inc. 3230 El Camino Real, Suite 200 Irvine, CA 92602 714.730.2388 hdrinc.com Navigant Reference No.: 171637 December, 2015

Welcome message from author
This document is posted to help you gain knowledge. Please leave a comment to let me know what you think about it! Share it to your friends and learn new things together.
Transcript

Embedded Energy Plan Final Report Prepared for: Irvine Ranch Water District
Submitted by: Navigant Consulting, Inc. 1 Market Street Spear Street Tower, Suite 1200 San Francisco, CA 94105 415.399.2180 navigant.com In Collaboration with:
HDR Engineering Inc. 3230 El Camino Real, Suite 200 Irvine, CA 92602 714.730.2388 hdrinc.com Navigant Reference No.: 171637 December, 2015

Page ii
Table of Contents
Executive Summary ................................................................................................................. vi
Overview ........................................................................................................................................................ vi Key Concepts and Terms ............................................................................................................................. vi Summary of Historic Data Analysis .......................................................................................................... vii
Historic Embedded Energy ............................................................................................................ viii Historic Water Use .............................................................................................................................. x Historic Conservation Programs ...................................................................................................... xi
Summary of Analysis and Tools to Inform Future Planning ................................................................ xiii Future Embedded Energy Forecasts .............................................................................................. xiii Spatial Embedded Energy Estimates .............................................................................................. xv Embedded Energy Management Tool........................................................................................... xvi Pumping Surcharge Analysis ........................................................................................................ xvii Recommendations for New/Improved Data Collection ........................................................... xviii
1. Introduction ............................................................................................................................ 1
1.1 Overview of Study ................................................................................................................................... 1 1.2 Key Concepts ............................................................................................................................................ 1 1.3 Scope of Analysis ..................................................................................................................................... 2 1.4 Overview of Data Collection .................................................................................................................. 3 1.5 Organization of this Report .................................................................................................................... 3
2. Historic Embedded Energy Estimates ................................................................................ 4
2.1 Historic Electric and Natural Gas Use by System ............................................................................... 4 2.2 IRWD’s Top Energy Consuming Facilities ........................................................................................... 8 2.3 Energy Intensity of IRWD-Operated Systems ..................................................................................... 9 2.4 Energy Intensity of Individual IRWD Facilities................................................................................. 10
3. Historic Water Use Analysis .............................................................................................. 14
3.1 Overall Water Usage Analysis ............................................................................................................. 14 3.2 Recommended Adjustment Coefficient Ratios .................................................................................. 16
4. Water Conservation Program Energy and GHG Savings ............................................ 18
4.1 Water Savings Analysis......................................................................................................................... 18 4.2 Embedded Energy Savings ................................................................................................................... 20 4.3 Conservation Impacts on Historical Water Usage ............................................................................ 21 4.4 GHG Emissions Reduction Analysis ................................................................................................... 22
5. Future Embedded Energy Estimates ................................................................................ 24
6. GIS Processing and Spatial Embedded Energy Estimates ........................................... 28

Page iii
6.1 Summary Energy Intensity Maps ........................................................................................................ 28 6.2 Regional Summary ................................................................................................................................ 36
7. Embedded Energy Management Tool ............................................................................. 38
7.1 Data Viewing .......................................................................................................................................... 38 7.2 Conservation Analysis .......................................................................................................................... 39 7.3 Surcharge Analysis ................................................................................................................................ 40
8. Pumping Surcharge Estimate ............................................................................................ 42
8.1 Historic Context of Pumping Surcharge Estimate ............................................................................ 42 8.2 Summary of Results ............................................................................................................................... 43
9. Updating the Embedded Energy Plan .............................................................................. 48
9.1 New and Improved Data Collection ................................................................................................... 48 9.1.1 Overall Data Management ...................................................................................................... 49 9.1.2 Water Flow through Facilities ................................................................................................ 51 9.1.3 Energy Consumption Data ..................................................................................................... 53 9.1.4 Historic Water Use Billing Data ............................................................................................. 54 9.1.5 Demand Forecast Tool ............................................................................................................. 55
9.2 Estimated Budget to Update Study ..................................................................................................... 55
List of Technical Reports ........................................................................................................ 57

Page iv
Figures Figure ES- 1: Water Systems .................................................................................................................................. vii Figure ES- 2: TOTAL IRWD Historic Embedded Energy (2005-2013) ...........................................................viii Figure ES- 3: IRWD ONLY Energy Intensity of Water Systems (2013) ............................................................ ix Figure ES- 4: TOTAL IRWD Energy Intensity (2013) .......................................................................................... x Figure ES- 5: Total Potable Water Usage 2005-2013 (AF) .................................................................................... x Figure ES- 6: Total Non-Potable Water Usage 2005-2013 (AF) .......................................................................... xi Figure ES- 7: Customer First-Year Annual Water Savings (2005-2013)........................................................... xii Figure ES- 8: IRWD ONLY and NON-IRWD Embedded Energy and GHG Savings from Conservation Programs (2013) ..................................................................................................................................................... xiii Figure ES- 9: TOTAL IRWD Energy Use - Baseline Forecast (2014-2035) ...................................................... xiv Figure ES- 10: TOTAL IRWD Energy Use - Future Scenarios (2014-2035) ..................................................... xv Figure ES- 11: TOTAL IRWD Energy Intensity by Region (2013) ................................................................... xvi Figure ES- 12: Conservation Analysis in the Tool ............................................................................................ xvii Figure ES- 13: Alternative Surcharge Zones ................................................................................................... xviii Figure 1: Water Systems .......................................................................................................................................... 2 Figure 2: Total Electricity Use by System .............................................................................................................. 5 Figure 3: Distribution of 2013 Total Electricity Consumption with Non-IRWD Systems Broken Out ......... 6 Figure 4: Total IRWD Natural Gas Consumption by System ............................................................................. 7 Figure 5: 2013 Energy Intensity of IRWD Systems............................................................................................... 9 Figure 6: Total Energy Intensity of IRWD Water (2013).................................................................................... 10 Figure 7: IRWD Facility Energy Intensity and Energy Use Range (2013) ....................................................... 12 Figure 8: Total Potable Water Usage 2005-2013 (AF) ......................................................................................... 14 Figure 9: Total Non-Potable Water Usage 2005-2013 (AF)................................................................................ 15 Figure 10: Hydrological Year Comparison of Water Usage per Account - All Accounts (AF) .................... 15 Figure 11: Water Use Demand Forecast Scenarios (Average, Wet, and Dry Conditions) ............................ 17 Figure 15: Customer First-Year Annual Water Savings .................................................................................... 18 Figure 16: 2013 Cumulative Water Savings ........................................................................................................ 19 Figure 17: 2013 Cumulative Savings by Water Type ......................................................................................... 20 Figure 18: Total IRWD Embedded Energy Savings by Water Type ................................................................ 21 Figure 19: IRWD Historical GPCD & AF/Acre Trends with and without Conservation Programs ........... 22 Figure 20: IRWD GHG Emissions Savings by Water Type ............................................................................... 23 Figure 12: Total IRWD Energy Use - Baseline Forecast ..................................................................................... 24 Figure 13: Total Energy Use - Conservation Scenarios ...................................................................................... 25 Figure 14: Total IRWD Energy Use - Hydrology Scenario................................................................................ 27 Figure 21: IRWD Only Potable Energy Intensity by Region ............................................................................. 30 Figure 22: IRWD Total Potable Energy Intensity by Region (IRWD Only + Non-IRWD Energy) .............. 31 Figure 23: IRWD Only Non-Potable Energy Intensity by Region .................................................................... 32 Figure 24: IRWD Total Non-Potable Energy Intensity by Region (IRWD Only + Non-IRWD Energy) ..... 33 Figure 25: IRWD Only Combined Energy Intensity by Region (Potable, Non-Potable, and Sewer Systems) ................................................................................................................................................................................... 34 Figure 26: IRWD Total Combined Energy Intensity by Region (Potable, Non-Potable, and Sewer Systems) ................................................................................................................................................................................... 35 Figure 27: EI Data Mapping in the Tool .............................................................................................................. 39

Page v
Figure 28: Conservation Analysis in the Tool ..................................................................................................... 40 Figure 29: Surcharge Analysis in the Tool - Viewing Cost Intensity Data ...................................................... 41 Figure 30: Alternative Surcharge Zones .............................................................................................................. 47 Tables Table ES- 1: Water Usage by Water Year Type .................................................................................................... xi Table ES- 2: Summary of Recommendations ..................................................................................................... xix Table 1: 2013 Electricity Use and Energy Intensity of Top IRWD Facilities ..................................................... 8 Table 2: Water Usage Adjustment Ratios by Water Type ................................................................................. 16 Table 5: Embedded Energy Savings by Water Type .......................................................................................... 21 Table 6: GHG Emissions Reduction ..................................................................................................................... 23 Table 3: Conservation Scenarios Summary ......................................................................................................... 26 Table 4: Hydrology Scenario Summary ............................................................................................................... 27 Table 7: Most Energy Intensive GPZs for Potable Water .................................................................................. 36 Table 8: Most Energy Intensive RWZs for Non-Potable Water ........................................................................ 37 Table 9: Summary of Potable Water Surcharge Analysis Given Existing Surcharge Zones ........................ 44 Table 10: Summary of Potable Water Surcharge Analysis Using New Surcharge Zones ............................ 45 Table 11: Summary of Non-Potable Water Surcharge Analysis Given Existing Surcharge Zones ............. 46 Table 12: Summary of Non-Potable Water Surcharge Analysis Using New Surcharge Zones ................... 46 Table 13: Summary of Recommendations ........................................................................................................... 48 Table 14: MWRP Submeter Matching .................................................................................................................. 52 Table 15: LAWRP Submeter Matching ................................................................................................................ 52 Table 16: Co-located Pumps .................................................................................................................................. 54

Page vi
Executive Summary
Overview IRWD’s Embedded Energy Plan was commissioned to examine energy use associated with collection, use, reuse, and disposal of water and biosolids in IRWD’s service area. The Embedded Energy Plan provides the following benefits to IRWD:
• Demonstrate embedded energy reductions over time • Quantify the avoided cost of energy in water conservation programs • Identify the most cost-effective geographic areas for water conservation programs • Provide information required to develop a pumping surcharge recommendation • Position IRWD for the possibility of obtaining energy utility funding for water conservation
programs • Enhance IRWD's role as an industry leader in water conservation and energy savings
IRWD selected a team of Navigant Consulting, Inc. (Navigant) and HDR Engineering Inc. (HDR) to develop the plan. The team collected and analyzed historic energy and water data over the time period 2005 – 2013. Historic data analysis provided information that was then leveraged to develop planning tools and analyses. This report describes the results of historic data analysis and the tools and future forecasts. These analyses include:
• Historic Embedded Energy Estimates – Analysis of total energy use and historic embedded energy on an annual basis from 2005 - 2013.
• Water Use Analysis – Analysis of historic water use and trends • Water Conservation Program Energy Savings – Estimates of embedded energy savings and
greenhouse gas savings resulting from past water conservation efforts. • Future Embedded Energy Estimates – Forecasts of future embedded energy on an annual basis
for a 22-year (2014 – 2035) planning horizon. • Spatial Embedded Energy Estimates – Regional energy analysis within IRWD service area to
identify areas of high and low energy use. • Embedded Energy Management Tool – Delivery of an Embedded Energy Management Tool to
enable IRWD staff to examine spatial energy and water data, conduct pumping surcharge analysis and conduct water conservation program energy savings analysis.
• Pumping Surcharge Estimate – Analysis to inform IRWD’s update of pumping surcharges.
Key Concepts and Terms “Energy Intensity” and “Embedded Energy” are two key concepts used throughout this study.
• Energy Intensity (EI) is the average amount of energy needed to transport or treat water or sewer flows on a per unit basis (kWh/AF). Each facility (pump station or treatment plant) has its own EI. EIs of multiple facilities within a system can be aggregated to represent the EI of a larger system. The EI of water delivered to a region is dependent on the EI of the collection of facilities used to serve that region.
• Embedded Energy is amount of energy used to provide water to end users and the amount of energy used to collect, transport, and treat sewer flows. It captures the entire energy picture both upstream and downstream of an end use customer. Embedded energy is especially useful in
Page vii
quantifying energy savings as a result of water savings (water savings x EI = embedded energy savings)
This Embedded Energy Plan considers energy use by IRWD-owned facilities as well as the energy use of systems upstream and downstream of IRWD that are essential to providing water services to IRWD customers. This report uses the following nomenclature when referring to energy use and energy intensity:
• IRWD ONLY: Only considers facilities owned by IRWD • NON-IRWD: Considers Metropolitan Water District of Southern California (MWD), State Water
Project, and Colorado River Aqueduct facilities used to import and treat water that is purchased by IRWD. Also considers facilities used by Orange County Sanitation District and Santa Margarita Water District to collect and treat sewer water from IRWD service area1
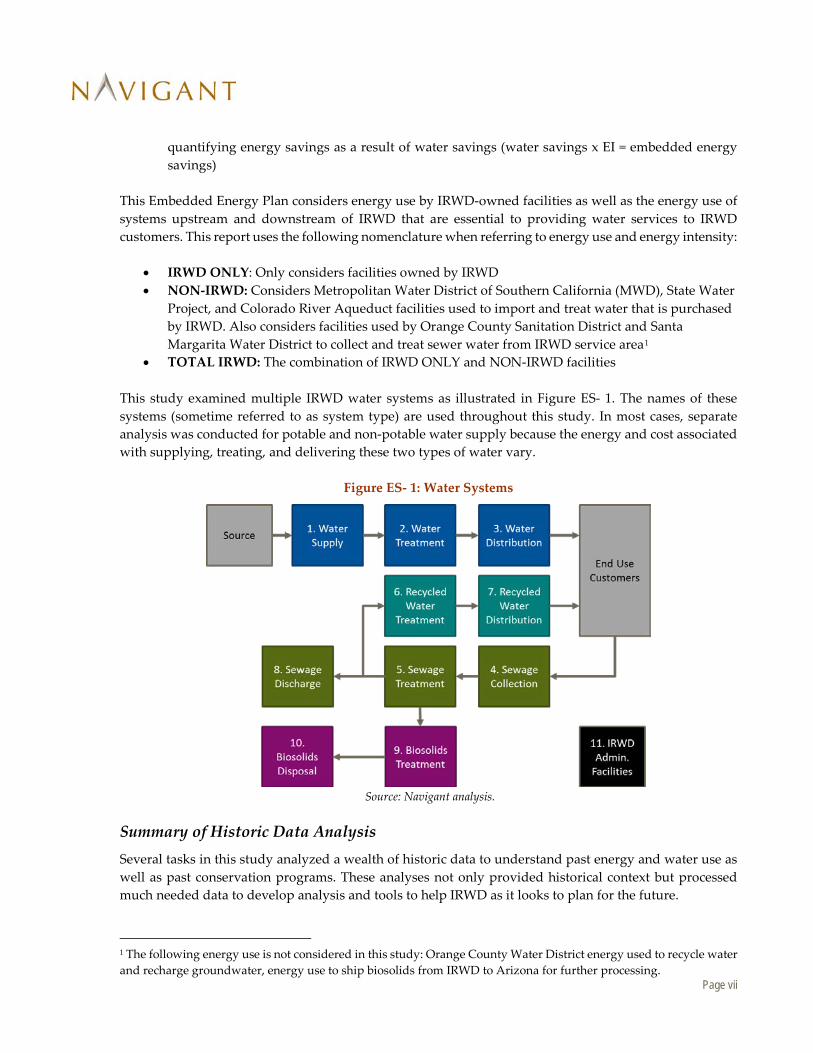
• TOTAL IRWD: The combination of IRWD ONLY and NON-IRWD facilities This study examined multiple IRWD water systems as illustrated in Figure ES- 1. The names of these systems (sometime referred to as system type) are used throughout this study. In most cases, separate analysis was conducted for potable and non-potable water supply because the energy and cost associated with supplying, treating, and delivering these two types of water vary.
Figure ES- 1: Water Systems
Source: Navigant analysis.
Summary of Historic Data Analysis Several tasks in this study analyzed a wealth of historic data to understand past energy and water use as well as past conservation programs. These analyses not only provided historical context but processed much needed data to develop analysis and tools to help IRWD as it looks to plan for the future.
1 The following energy use is not considered in this study: Orange County Water District energy used to recycle water and recharge groundwater, energy use to ship biosolids from IRWD to Arizona for further processing.

Page viii
Historic Embedded Energy
The vast majority of historic energy use by IRWD is in the form of electricity, but a very limited amount of natural gas is used. Figure ES- 2 shows historic electricity consumption by system. Each system’s energy use is layered on top of the others to show the total electricity use. The historic energy footprint of IRWD’s water was dominated by imported potable water. Energy used for non-potable imports had an unusual peak in 2007 when a biological opinion was released that was expected to impact the State Water Project’s operation of the Delta and the future of the Interim Agricultural Water Program was being evaluated. Declines in IRWD Only energy use from 2009 through 2011 may be due to the continued economic slowdown coupled with a very wet year in 2010. Meanwhile increases from 2011 through 2013 may be due to a combination of increasing demand (resulting from the economic recovery), dry conditions, and decreased reliance on imported water supplies.
Figure ES- 2: TOTAL IRWD Historic Embedded Energy (2005-2013)
Source: Navigant analysis.
Figure ES- 3 illustrates the energy intensity of each IRWD-owned system in 2013. Potable water supply, sewage (wastewater) treatment, and non-potable water distribution have the highest energy intensities. Conversely, sewage (wastewater) collection, non-potable (recycled) water treatment, and biosolids handling are amongst the least energy intensive systems. These values will be useful if IRWD were to partner with an energy utility to develop joint customer-facing water-energy programs for IRWD’s entire

Page ix
service area. In addition, IRWD and the energy utilities can use the information presented in Figure ES- 3 below to conduct analysis in the CPUC’s newly released Water-Energy Calculator.2
Figure ES- 3: IRWD ONLY Energy Intensity of Water Systems (2013)
Source: Navigant analysis.
Figure ES- 4 illustrates a complete view of IRWD’s water-energy footprint showing both IRWD ONLY and NON-IRWD energy intensities (the two are additive). These values are useful for calculating the total energy savings that result from water conservation activities and comparing to other water agencies.
2 Additional details available at: http://www.cpuc.ca.gov/PUC/energy/Energy+Efficiency/Water-Energy+Nexus+Programs.htm

Page x
Figure ES- 4: TOTAL IRWD Energy Intensity (2013)
Source: Navigant analysis.
Historic Water Use
Figure ES- 5 and Figure ES- 6 show the total potable and non-potable water usage by customer type for 2005-2013. The Residential customers account for almost half of potable water usage with Commercial, Industrial, Landscape/Irrigation, and Multifamily representing the majority of the remaining usage. Non-potable water is almost exclusively used by Landscape/Irrigation and Agriculture accounts. For both water types (potable and non-potable), there is a dip in overall water usage in 2010, which was a wet year, and two spikes in 2007 and 2013, which were both dry years.
Figure ES- 5: Total Potable Water Usage 2005-2013 (AF)
Source: Navigant analysis.
-
10,000
20,000
30,000
40,000
50,000
60,000
70,000
2005 2006 2007 2008 2009 2010 2011 2012 2013
Acr
e Fe
et
Residential Commerical Industrial
Public Construction/ Temporary Landscape/ Irrigation
Agriculture Multifamily Fireline

Page xi
Figure ES- 6: Total Non-Potable Water Usage 2005-2013 (AF)
Source: Navigant analysis.
Navigant compared water use in different hydrologic year types to determine the impact of hydrology on demand; results are summarized in Table ES- 1. Non-potable water usage is the most significantly affected by hydrological conditions (1.33 times the average year demand in a dry year). Potable water usage is impacted much less by hydrological conditions, but still increases in dry years (1.06 times the average year demand in a dry year).
Table ES- 1: Water Usage by Water Year Type
Water Type
Average Usage per Customer (AF/Customer/Yr) Wet To
Average Ratio
Dry To Average
Ratio Wet (2010)
Average (2011)
Dry (2013)
Potable 0.54 0.54 0.58 0.99 1.06
Non-Potable 4.58 4.79 6.38 0.96 1.33
Sewer Flow 0.30 0.31 0.32 0.99 1.04
Source: Navigant analysis.
Historic Conservation Programs
IRWD has a long history of innovative and aggressive water conservation activities. Since 1988 with the adoption of a demand-based tiered rate structure as well as aggressive conservation activities, there has been a 25% reduction in residential water use and a 50% reduction in landscape water use. This report analyzed in detail rebated conservation measures from 2005 through 2013, the historic period that includes the adoption of a formal conservation plan in 2005. Water conservation measures are commonly estimated to save water multiple years (depending on the technology) following their installation date. Figure ES- 7 shows the first-year annual water savings resulting from IRWD water conservation programs. Water savings increased from 2005 to 2008, at which
-
5,000
10,000
15,000
20,000
25,000
30,000
35,000
2005 2006 2007 2008 2009 2010 2011 2012 2013
Acr
e Fe
et
Residential Public Landscape/ Irrigation
Agriculture Multifamily Commerical
Fireline Industrial Construction/ Temporary

Page xii
point savings consistently decreased until 2011. Savings increased yet again in 2012 and 2013. Several measures exhibit noteworthy trends throughout this period. Rotary Stream Nozzles and High Efficiency Toilets had high savings from 2007-2009 but sharply declined in years 2010-2013. Weather Based Irrigation Controllers generally showed a growing trend in savings from 2006-2013. Stealth Direct Install measures lead to the most water savings in 2013. Zero/Ultra Low Water Urinals performed consistently from 2007-2012, with the highest amount of first-year savings made in 2010.
Figure ES- 7: Customer First-Year Annual Water Savings (2005-2013)
Source: Navigant analysis.
The resulting IRWD ONLY and NON-IRWD embedded energy and GHG savings from IRWD’s 2005-2013 conservation programs are summarized in Figure ES- 8. The TOTAL IRWD embedded energy savings in 2013 as a result of efficiency programs operating from 2005 to 2013 amount to 3,863 MWh, of which 2,610 MWh is IRWD ONLY energy savings. IRWD ONLY energy savings result in reducing IRWD’s annual energy bill by roughly $313,000.3 The amount of TOTAL IRWD GHG emissions saved due to IRWD water conservation programs from 2005-2013 is 2,176 tonnes of CO2. The emissions saved from avoided NON-IRWD uses are significantly more than are saved from the avoided IRWD ONLY uses.
3 IRWD’s current average cost of electricity is approximately $0.12/kWh.

Page xiii
Figure ES- 8: IRWD ONLY and NON-IRWD Embedded Energy and GHG Savings from Conservation Programs (2013)
Source: Navigant analysis.
Summary of Analysis and Tools to Inform Future Planning These tasks leveraged historic data to develop analysis and tools to help IRWD as it looks to plan for the future.
Future Embedded Energy Forecasts
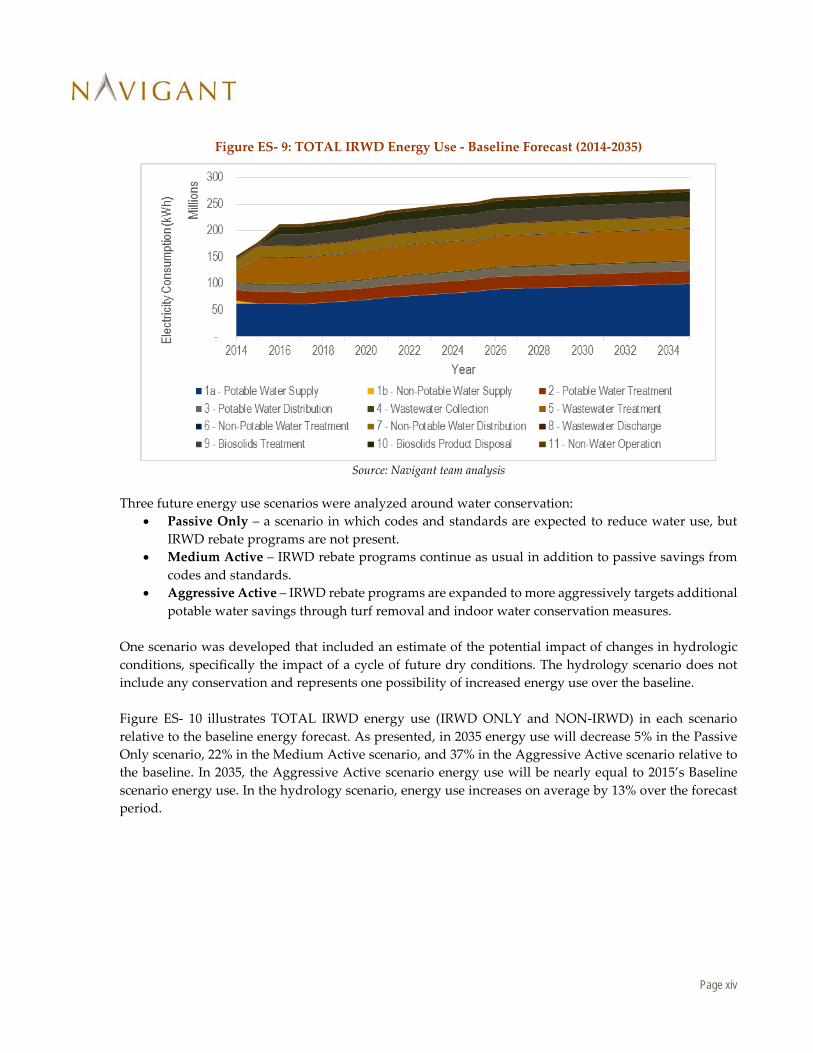
Navigant forecasted a future baseline of TOTAL IRWD embedded energy use on an annual basis for a 22-year planning horizon from 2014 to 2035. It considers both IRWD ONLY and NON-IRWD energy use required to meet future demands associated with existing facilities and planned new IRWD facilities. Groundwater pumping from the Orange County Ground Water Basin is limited using the data contained in IRWD’s 2013 Ground Water Workplan. Superimposed on the future baseline were various scenarios of conservation and hydrology. Figure ES- 9 shows a baseline forecast of TOTAL IRWD energy use for providing water and sewer services to IRWD customers. This graph includes energy use by IRWD ONLY facilities plus NON-IRWD energy use that occurs upstream of IRWD to import water and downstream of IRWD to treat exported sewage and biosolids. Energy use generally increases as water use increases over time. The large jumps in energy use that occur in 2015 and 2016 are due to the projected energy use of Michaelson Water Reclamation Plant’s (MWRP) phase 2 expansion and biosolids treatment processes; respectively.
Page xiv
Figure ES- 9: TOTAL IRWD Energy Use - Baseline Forecast (2014-2035)
Source: Navigant team analysis
Three future energy use scenarios were analyzed around water conservation: • Passive Only – a scenario in which codes and standards are expected to reduce water use, but
IRWD rebate programs are not present. • Medium Active – IRWD rebate programs continue as usual in addition to passive savings from
codes and standards. • Aggressive Active – IRWD rebate programs are expanded to more aggressively targets additional
potable water savings through turf removal and indoor water conservation measures. One scenario was developed that included an estimate of the potential impact of changes in hydrologic conditions, specifically the impact of a cycle of future dry conditions. The hydrology scenario does not include any conservation and represents one possibility of increased energy use over the baseline. Figure ES- 10 illustrates TOTAL IRWD energy use (IRWD ONLY and NON-IRWD) in each scenario relative to the baseline energy forecast. As presented, in 2035 energy use will decrease 5% in the Passive Only scenario, 22% in the Medium Active scenario, and 37% in the Aggressive Active scenario relative to the baseline. In 2035, the Aggressive Active scenario energy use will be nearly equal to 2015’s Baseline scenario energy use. In the hydrology scenario, energy use increases on average by 13% over the forecast period.

Page xv
Figure ES- 10: TOTAL IRWD Energy Use - Future Scenarios (2014-2035)
Source: Navigant analysis.
Spatial Embedded Energy Estimates
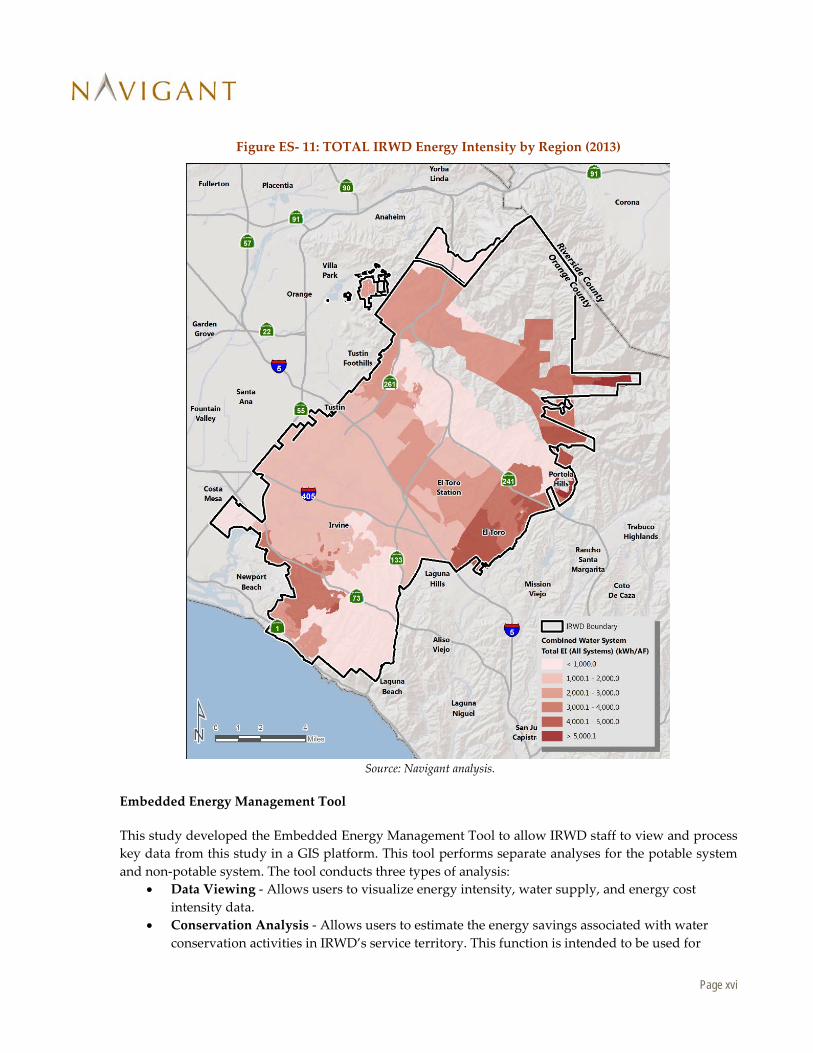
Navigant developed summary maps of energy intensity by region. Like a “temperature map” typically used in communicating weather forecasts, the information is presented over a range of six colors that represent the intensity of the value presented. Thus the maps can be used to identify the high energy or cost intensity areas geographically. Figure ES- 11 illustrates the TOTAL IRWD EI of all water services (potable, non-potable, and sewer). The EI data is plotted using potable geopressure zones for visualization. Figure ES- 11 shows high energy intensity in the Santiago Hills, Portola Hills, and Newport Coast areas. Santiago Hills and Portola Hills only receive potable water that is pumped to high elevations. The Newport Coast area received imported potable water with a high energy intensity while non-potable water supplied to the region must be pumped to high elevations. The Central Irvine area has a relatively low energy intensity due to the use of local water supplies as well as the relatively flat geography. Note this map is just one of many that this study has produced. The Embedded Energy Management Tool (described below) provides IRWD the ability to produce similar maps showing energy cost and water use and the ability to isolate systems and plot their data individually.
Page xvi
Figure ES- 11: TOTAL IRWD Energy Intensity by Region (2013)
Source: Navigant analysis.
Embedded Energy Management Tool
This study developed the Embedded Energy Management Tool to allow IRWD staff to view and process key data from this study in a GIS platform. This tool performs separate analyses for the potable system and non-potable system. The tool conducts three types of analysis:
• Data Viewing - Allows users to visualize energy intensity, water supply, and energy cost intensity data.
• Conservation Analysis - Allows users to estimate the energy savings associated with water conservation activities in IRWD’s service territory. This function is intended to be used for

Page xvii
water conservation planning purposes. Users can target certain geographic areas or perform analysis for the entire service area.
• Surcharge Analysis - Allows users to estimate the pumping surcharge for selected regions in IRWD’s service area. Analysis can be conducted separately for the potable and non-potable systems.
Figure ES- 12 illustrates the water conservation analysis function. The function displays a map of the energy intensity by region and allows users to select a subset of regions and estimate the energy savings from installed conservation measures in that region.
Figure ES- 12: Conservation Analysis in the Tool
Pumping Surcharge Analysis4
This study assessed the variation in cost of pumping water to different regions throughout IRWD’s service area and developed a “pumping surcharge” by region. Consistent with IRWD’s historic pumping surcharges, this analysis did not include costs associated with water supply, water treatment, sewage collection, or any sewage treatment processes. Furthermore, this analysis only considers energy costs directly paid by IRWD; it does not consider energy costs that may be incurred by wholesale water agencies
4 Navigant’s analysis is based on a methodology agreed to by IRWD staff using available data from 2013. Navigant has presented the results of its analysis for the scenarios requested by IRWD staff. Determination as to what surcharge values to ultimately adopt is to be made by IRWD.

Page xviii
from which IRWD imports water. It excludes capital cost recovery and any non-energy operation and maintenance costs associated with delivering water. This analysis suggests “redrawing” IRWD’s existing surcharge zones to better reflect pumping energy costs. Figure ES- 13 illustrates one alternative set of surcharge zones for potable and non-potable water.5 This analysis shows one of many possible scenarios for regrouping surcharge zones. IRWD staff can modify these and explore further scenarios using the Embedded Energy Management Tool.
Figure ES- 13: Alternative Surcharge Zones
Source: Navigant analysis.
Recommendations for New/Improved Data Collection
During the development of IRWD’s Embedded Energy Plan Navigant identified several data collection and data management recommendations that are summarized in Table ES- 2. Implementing these recommendations would improve the quality of data, make future updates to this study as well as other types of energy analysis easier to implement, and improve the quality of IRWD’s energy analysis. The recommended priority was determined based on the potential to increase the quality of future embedded energy analysis and the establishment of data management best practices that could benefit other future efforts and studies that IRWD undertakes.
5 For additional details, see the technical report (Task 9). The figure here illustrate “Alternative P-2” and “Alternative NP-2”

Page xix
Two of the high priority recommendations that would significantly improve the reliability of estimating surcharges:
• Collect missing flow data for distribution facilities to better inform surcharge estimates. The area with the highest suggested surcharge is fed by pumps for which there is no flow data. Flow data was estimated in this study.
• Submeter electricity for co-located pump stations. Several pump stations share one SCE electric meter, the distribution of electricity between the two stations was estimated in this study.
Table ES- 2: Summary of Recommendations
Rank Recommendation* Priority 1 #8: Collect missing flow data for distribution facilities to better inform surcharge estimates.6 High 2 #1: Use Atlas ID to identify facilities across all IRWD information systems and data sets High 3 #2: Maintain a database that links Atlas IDs to SCE account numbers High 4 #12: Submeter electricity for co-located pump stations High 5 #3: Digitize field measurements of flow data on a regular basis High 6 #4: Maintain a common flow database Medium 7 #9: Improve sub metering of flow and energy at sewage treatment plants Medium 8 #7: Collect missing flow data for treatment facilities Medium 9 #11: Record and standardize units of measurement for flow data Medium 10 #13: Maintain a link between old customer account numbers and new customer account numbers Medium 11 #15: Consider scenario analysis in the next update to the demand forecast tool Medium 12 #10: Collect missing flow data for lift stations Low 13 #6: Update descriptions of facilities Low 14 #14: Update location data for new customers Low 15 #5: Develop a Hydraulic Schematic for IRWD’s sewage collection and treatment systems Low
6 Note: the four pumps serving the region with the highest energy and cost intensity (thus the highest recommended surcharge) had no flow data. Flow was estimated by Navigant.

Page 1
1. Introduction
1.1 Overview of Study Navigant Consulting, Inc. (Navigant), in conjunction with HDR Engineering Inc. (HDR), was selected to support the Irvine Ranch Water District’s (IRWD) need to develop an Embedded Energy Plan. The goal of the Embedded Energy Plan is to provide the following benefits to IRWD:
• Demonstrate embedded energy reductions over time • Quantify the avoided cost of energy in water conservation programs • Identify the most cost-effective geographic areas for water conservation programs • Provide information required to develop a pumping surcharge recommendation • Position IRWD for the possibility of obtaining energy utility funding for water conservation
programs • Enhance IRWD's role as an industry leader in water conservation and energy savings
The overall project consists of multiple distinct, yet interrelated tasks. These tasks are:
• Historic Embedded Energy Estimates (Task 2) – This analysis calculates total energy use and historic embedded energy on an annual basis from 2005 to 2013 for each of IRWD's major systems.
• Water Use Analysis (Task 5) – This analysis examines historic water use for each service area to develop coefficients that will allow future demand forecasts to be adjusted to account for wet, dry and average hydrologic conditions.
• Future Embedded Energy Estimates (Task 3) – This analysis develops a baseline for future embedded energy and total energy use on an annual basis for a 20-year planning horizon.
• Water Conservation Program Energy Savings (Task 8) – This analysis develops embedded energy estimates for the 2005–2013 time period based on past water conservation efforts.
• GIS Processing and Spatial Embedded Energy Estimates (Tasks 4 and 6) – This analysis provides estimate potable water demands, non-potable water demands, and sewage generation rates in each geographic region of IRWD service area. The analysis also develops estimates of embedded energy in each geographic region.
• Embedded Energy Management Tool (Task 7) – This analysis develops an Embedded Energy Management Tool to enable IRWD staff to examine spatial embedded energy data, conduct surcharge analysis and conduct water conservation program energy savings analysis.
• Pumping Surcharge Estimate (Task 9) – This analysis will help IRWD assess the variation in cost of pumping to provide water to different regions throughout its service territory and develop a pumping surcharge by region.
1.2 Key Concepts Several key concepts are used throughout this study.
• Energy Intensity (EI) is the average amount of energy needed to transport or treat water or sewer flows on a per unit basis (kWh/AF). ). Each facility (pump station or treatment plant) has its own EI. EIs of multiple facilities within a system can be aggregated to represent the EI of a larger system. The EI of water delivered to a region is dependent on the EI of the collection of facilities used to serve that region.

Page 2
• Energy Cost Intensity (CI) is defined as the average energy cost needed to transport or treat water or sewer flows on a per unit basis (dollars per hundred cubic feet [$/CCF]). CI values provide an estimate of the variable energy cost required to provide water service to a customer.
• Embedded Energy is amount of energy used to provide water to end users and the amount of energy used to collect, transport, and treat sewer flows. It captures the entire energy picture both upstream and downstream of an end use customer.
• Embedded Energy Savings refers to the reduction in the amount of embedded energy used as a result of water conservation and efficiency programs
Embedded Energy Savings = Water savings x EI
1.3 Scope of Analysis Throughout this study the Navigant team examined multiple IRWD water systems illustrated in Figure 1. The team primarily focused on energy consumption in IRWD-owned facilities (IRWD Only energy use); however, energy use “upstream” of IRWD to import water and “downstream” to export sewer flows were also included (Non-IRWD energy use).
Figure 1: Water Systems
Source: Navigant analysis.
In most cases, separate analyses were conducted for potable and non-potable water systems. The energy and cost associated with supplying, treating, and delivering these two types of water are different. The team collected and analyzed historic data from 2005 to 2013. Historic data was use to observe past trends. However, for most analyses, data from 2013 was used because it was deemed to be the best available data and most representative of the current water system. Future forecasts use 2013 data as well as additional adjustments and estimates.

Page 3
1.4 Overview of Data Collection Multiple datasets were collected from IRWD that informed this analysis. These include:
• Historic monthly electric use data (2005-2013) – SCE meter records for all IRWD facilities • Historic monthly natural gas use data (2005-2013) – SCG meter records for all IRWD facilities • Historic monthly water flow data (2005-2013) - flow data for each facility was provided in four
sets: water supply, water distribution, water reclamation plants, and lift stations • Historic monthly water billed (2005-2013) – monthly water billing records for all customers • Historic annual water conservation (2005-2013) – Conservation program records provided data
on the number of rebated measures installed and resulting water savings • Forecasted water demand (2012-2035) – IRWD’s demand forecasting tool (DFT) provided a
forecast of water consumption annual through 2035 • Planned future facility data – IRWD’s groundwater work plan provided estimates of water
production from future facilities, other IRWD engineering studies provided energy estimates for future facilities
• System schematics – IRWD distribution system schematics were essential to conducting spatial embedded energy estimates
1.5 Organization of this Report The remainder of this report contains a summary of the results of each technical task conducted in the Embedded Energy Plan Study. Attached to this report are the full technical reports for each task. The full technical reports include detailed discussions of methodology, data sources, and detailed findings. Technical reports provide more granularity in the presentation of results and more detailed results than this summary report. Readers interested in specific topics or results from this summary report should refer to the technical reports for further understanding.

Page 4
2. Historic Embedded Energy Estimates
In this task, energy use and historic embedded energy were documented on an annual basis for 2005 to 2013 for each of IRWD's major systems. The Navigant team developed embedded energy estimates for the systems previously numbered in Figure 1. This analysis further breaks down water supply into two subsystems: 1a – Potable Water Supply and 1b – Non-Potable Water Supply. As part of this task, the Navigant team estimated the total historic energy use and average energy intensity (EI) of each major system component.
2.1 Historic Electric and Natural Gas Use by System Navigant examined the total energy footprint of IRWD’s water system. Figure 2 shows the electricity consumption for each year in the study period broken out by system including energy use to import water and export sewer flows. Figure 2 is a “stacked area graph;” each “layer” in the graph represents the electricity consumption by a system. Changes in the “thickness” of each layer over time indicate the changing energy use of each system over time. Each system is layered on top of each other to show the total electricity use. Figure 2 shows:
• The energy footprint of IRWD’s water is dominated by imported potable water. • Energy used for non-potable imports had an unusual peak in 2007. This was required to make up
for LAWRP not providing recycled water to Zone B that year. • While Non-IRWD energy use has generally decreased from 2007 to 2013, IRWD Only energy use
(energy used by systems IRWD operates) over time has increased. This is associated with IRWD’s commitment to developing local groundwater supplies.
o The decline in IRWD Only energy use from 2009 through 2011 may be due to the continued economic slowdown coupled with a very wet year in 2010.
o The increases from 2011 through 2013 may be due to a combination of increasing demand (resulting from the economic recovery), dry conditions, and decreased reliance on imported water supplies.
• Recycled and non-potable water distribution and potable water supply are the two largest IRWD Only energy uses.

Page 5
Figure 2: Total Electricity Use by System
Source: Navigant analysis.

Page 6
Figure 3 provides a breakdown of IRWD’s water-energy footprint for 2013; it also clarifies the proportion of the Non-IRWD component. The dominance of energy associated with importing potable water is of special note considering only 26% of potable demand was met with imported water in 2013. This breakdown also shows that non-potable water distribution uses more energy than potable water distribution. IRWD delivers more potable water that non-potable water, but uses less electricity to do so. This indicates that non-potable water distribution is more energy intensive than potable water distribution. One possible explanation is that most non-potable water supply is generated at low elevations (from MWRP and LAWRP) which then has to be pumped to higher elevations where a significant portion of the demand is located. Conversely, potable water supply (from groundwater wells and imports) enter IRWD’s system at multiple pressure zones and the vast majority of potable water demand is in lower pressure zones.
Figure 3: Distribution of 2013 Total Electricity Consumption with Non-IRWD Systems Broken Out
Source: Navigant analysis.

Page 7
Figure 4 shows the natural gas consumption in IRWD’s system. Natural gas use exhibits high variability on the monthly scale (not shown) because most natural gas-fired pumps are used as backup and only run in an emergency or for testing rather than on a regular basis. In fact, the high natural gas use in 2005 within the sewage (wastewater) treatment system was to power emergency generators for the primary and secondary treatment processes. These generators were used extensively July – September of 2005. Natural gas use in non-water operations depends on how natural gas is used in facilities, and as it may be for heating, can also vary with changes in the weather.
Figure 4: Total IRWD Natural Gas Consumption by System
Source: Navigant analysis.
Page 8
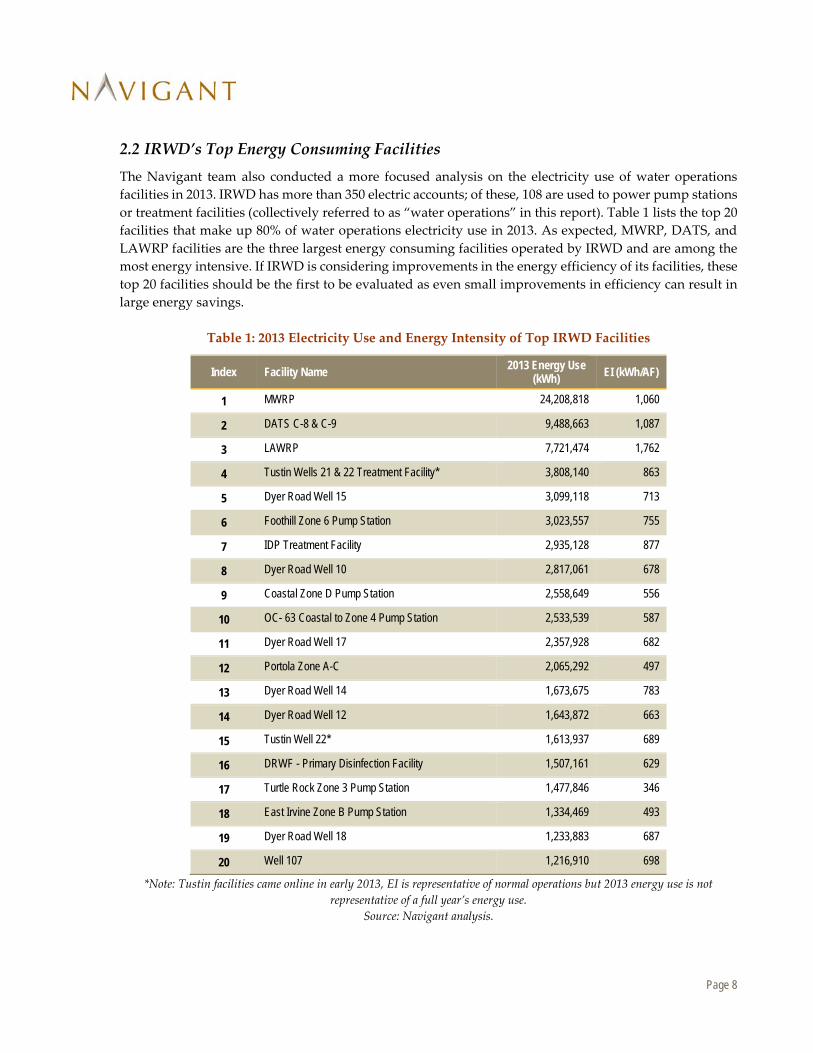
2.2 IRWD’s Top Energy Consuming Facilities The Navigant team also conducted a more focused analysis on the electricity use of water operations facilities in 2013. IRWD has more than 350 electric accounts; of these, 108 are used to power pump stations or treatment facilities (collectively referred to as “water operations” in this report). Table 1 lists the top 20 facilities that make up 80% of water operations electricity use in 2013. As expected, MWRP, DATS, and LAWRP facilities are the three largest energy consuming facilities operated by IRWD and are among the most energy intensive. If IRWD is considering improvements in the energy efficiency of its facilities, these top 20 facilities should be the first to be evaluated as even small improvements in efficiency can result in large energy savings.
Table 1: 2013 Electricity Use and Energy Intensity of Top IRWD Facilities
Index Facility Name 2013 Energy Use (kWh) EI (kWh/AF)
1 MWRP 24,208,818 1,060
2 DATS C-8 & C-9 9,488,663 1,087
3 LAWRP 7,721,474 1,762
4 Tustin Wells 21 & 22 Treatment Facility* 3,808,140 863
5 Dyer Road Well 15 3,099,118 713
6 Foothill Zone 6 Pump Station 3,023,557 755
7 IDP Treatment Facility 2,935,128 877
8 Dyer Road Well 10 2,817,061 678
9 Coastal Zone D Pump Station 2,558,649 556
10 OC- 63 Coastal to Zone 4 Pump Station 2,533,539 587
11 Dyer Road Well 17 2,357,928 682
12 Portola Zone A-C 2,065,292 497
13 Dyer Road Well 14 1,673,675 783
14 Dyer Road Well 12 1,643,872 663
15 Tustin Well 22* 1,613,937 689
16 DRWF - Primary Disinfection Facility 1,507,161 629
17 Turtle Rock Zone 3 Pump Station 1,477,846 346
18 East Irvine Zone B Pump Station 1,334,469 493
19 Dyer Road Well 18 1,233,883 687
20 Well 107 1,216,910 698
*Note: Tustin facilities came online in early 2013, EI is representative of normal operations but 2013 energy use is not representative of a full year’s energy use.
Source: Navigant analysis.

Page 9
2.3 Energy Intensity of IRWD-Operated Systems The Navigant team aggregated the energy and flow data to develop an overall energy intensity for each of IRWD’s systems. The results of this can be seen in Figure 5. The results represent the average system-wide EI and are based on IRWD Only energy use in 2013. Potable water supply, sewage (wastewater) treatment, and non-potable water distribution are amongst the most energy intensive systems. Conversely, sewage (wastewater) collection, non-potable (recycled) water treatment, and biosolids handling are amongst the least energy intensive systems. These values will be useful if IRWD were to partner with an energy utility to develop joint customer-facing water-energy programs. The energy utilities may need the information presented in Figure 5 below to conduct analysis in the CPUC’s newly released Water-Energy Calculator.7
Figure 5: 2013 Energy Intensity of IRWD Systems
Source: Navigant analysis.
Adding the Non-IRWD energy intensity from upstream (imported water) and downstream (exported sewer flows) systems presents the “bigger picture” of IRWD’s water-energy footprint. Figure 6 illustrates this complete view of IRWD’s water-energy footprint broken down by IRWD Only and Non-IRWD energy
7 Additional details available at: http://www.cpuc.ca.gov/PUC/energy/Energy+Efficiency/Water-Energy+Nexus+Programs.htm

Page 10
intensity. These values are useful for calculating the total energy savings that result from water conservation activities. Figure 6 should be interpreted as follows:
• An average of 1,663 kWh are used for every acre-foot of potable water delivered to an IRWD customer. Of that energy needed, 975 kWh are consumed by IRWD-owned facilities, while the remainder is consumed upstream of IRWD to import and treat that water.
• An average of 1,110 kWh are used for every acre-foot of non-potable water delivered to an IRWD customer. Of that energy needed, 881 kWh are consumed by IRWD-owned facilities, while the remainder is consumed upstream of IRWD to import untreated water.
• An average of 596 kWh are used to collect and treat every acre-foot of sewage from an IRWD customer. Of that energy needed, 523 kWh are consumed by IRWD-owned facilities, while the remainder are consumed downstream of IRWD to further treat sewage at OCSD or SMWD.
Figure 6: Total Energy Intensity of IRWD Water (2013)
Source: Navigant analysis
2.4 Energy Intensity of Individual IRWD Facilities Figure 7 illustrates 2013 energy intensity and total 2013 energy use for all IRWD facilities organized by system. Each bubble in Figure 7 represents a single facility or process (in the case of sewage treatment plant processes), the midpoint of the bubble represents its 2013 energy intensity (read along the vertical axis) while the size of the bubble represent the total energy use in 2013 (the larger the bubble, the larger the energy use). The bubbles are positioned horizontally across the nine labeled systems.

Page 11
Figure 7 illustrates the following for each system: 1. Water Supply: These facilities are large in number and tend to cluster in the range of
500-1,000 kWh/AF with a few facilities having lower EIs. 2. Potable Water Treatment: These are few in number and tend to be larger energy consumers with
higher EI values than the majority of other facilities. The largest energy consuming treatment plant (DATS) is also the most energy intensive facility in this system.
3. Potable Water Distribution: These pump stations are large in number and have a wide range of EI values. Almost all facilities in this system have an EI of less than 1,000 kWh/AF with many of these having EIs less than 500 kWh/AF.
4. Sewage (Wastewater) Collection: These lift stations are small energy users with a wide range of EI values. Most tend to cluster below 300 kWh/AF; those with low EIs account for the majority of collection energy use.
5. Sewage (Wastewater) Treatment: These represent the primary and secondary treatment processes at MWRP and LAWRP. They are large energy users and vary greatly in their energy intensities. This is due to the differing processes associated with treatment at each plant; MWRP treats water using activated sludge for the majority of the study period while LAWRP uses a pond system.
6. Non-Potable (Recycled) Water Treatment: This represents the EI for tertiary treatment processes at MWRP and LAWRP. Both plants have a similar EI for this process though MWRP uses more total energy because it processes more water than LAWRP.
7. Non-Potable (Recycled) Water Distribution: These pump stations are numerous and tend to have EI’s less than 1,000 kWh/AF. One recycled water distribution pump station in particular (at MWRP) accounts for a large portion of the total energy use of this system. This MWRP pump station has a capacity of 28,000 gallons per minute (by far the largest in the non-potable system) and delivers water into Zone A of the distribution system.
8. Sewage (Wastewater) Discharge: For MWRP and LAWRP, this is a low energy use and low energy intensive process. The Shallow Ground Unit discharge is included in this system and has a higher EI (close to 1,000 kWh/AF).
9. Biosolids Treatment: This process has a low energy intensity as the only IRWD facilities currently included are pumps at MWRP sending sewage and sludge to OCSD for biosolids handling.
10. Biosolids Product Disposal: This is not captured in our analysis. In 2013, IRWD’s sewage treatment plants did not have biosolids product disposal processes. Biosolids coming out of the treatment process were hauled away for further processing and disposal.

Page 12
Figure 7: IRWD Facility Energy Intensity and Energy Use Range (2013)
Source: Navigant analysis.

Page 13 Irvine Ranch Water District Embedded Energy Plan
The annual energy intensity of the 108 unique water operations facilities and processes throughout IRWD’s system form the backbone of data for the rest of the study. The facility energy intensity values feed into spatial embedded energy analysis, the Embedded Energy Management Tool, and pumping surcharge analysis. Higher level data on the energy intensity of systems feeds into the water conservation program analysis and our estimates of future energy use.

Page 14 Irvine Ranch Water District Embedded Energy Plan
3. Historic Water Use Analysis
In this task, the Navigant team analyzed historic water use for IRWD’s service area to develop coefficients that will allow future demand forecasts to be adjusted to account for wet, dry, and average hydrologic conditions. Analysis was conducted based on water use data for each customer, which was then summarized by customer type (e.g. residential, commercial, etc.) and geopressure zone (GPZ). Wet, dry, and average conditions were determined based on local rainfall data. Data was analyzed from 2005 to 2013.
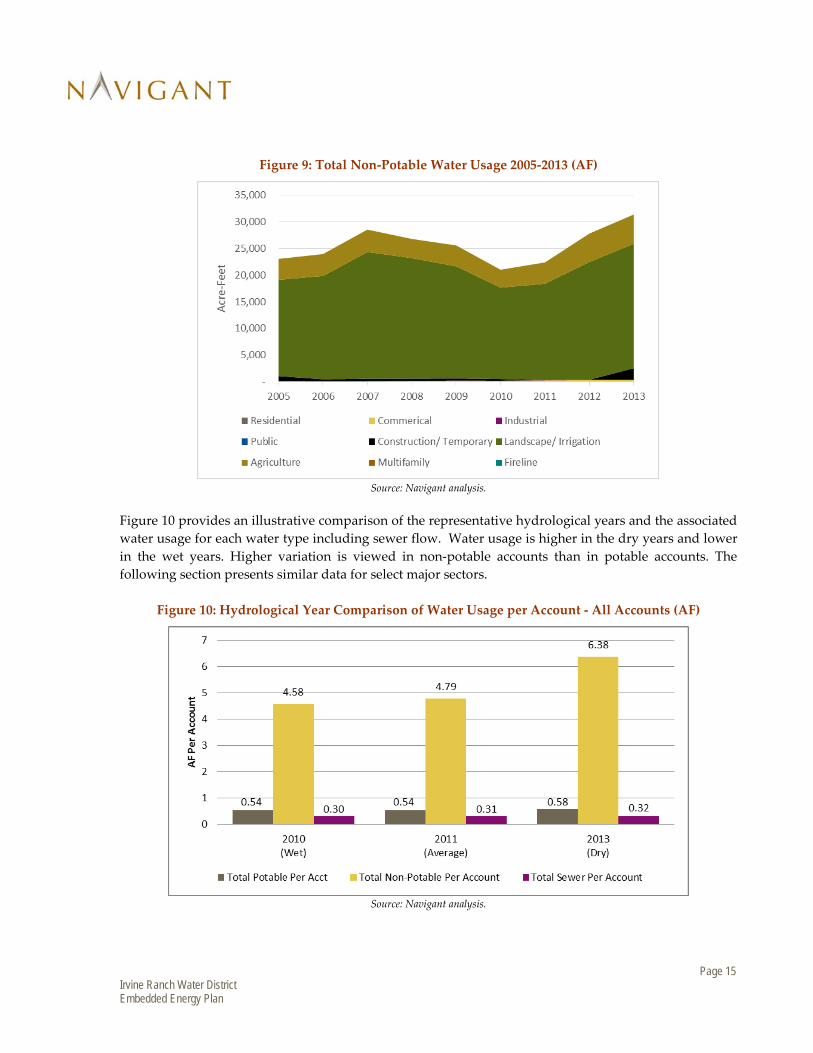
3.1 Overall Water Usage Analysis Figure 8 and Figure 9 below show the total water usage in AF for potable and non-potable water usage by sector for 2005-2013. The Residential use accounts for almost half of potable water usage with Commercial, Industrial, Landscape/Irrigation, and Multifamily representing the majority of the remaining usage. Non-potable water is almost exclusively used by Landscape/Irrigation and Agriculture accounts. For both water types (potable and non-potable), there is a dip in overall water usage in 2010, which is the representative wet year, and two spikes in 2007 and 2013, which were both dry years.
Figure 8: Total Potable Water Usage 2005-2013 (AF)
Source: Navigant analysis.
Page 15 Irvine Ranch Water District Embedded Energy Plan
Figure 9: Total Non-Potable Water Usage 2005-2013 (AF)
Source: Navigant analysis.
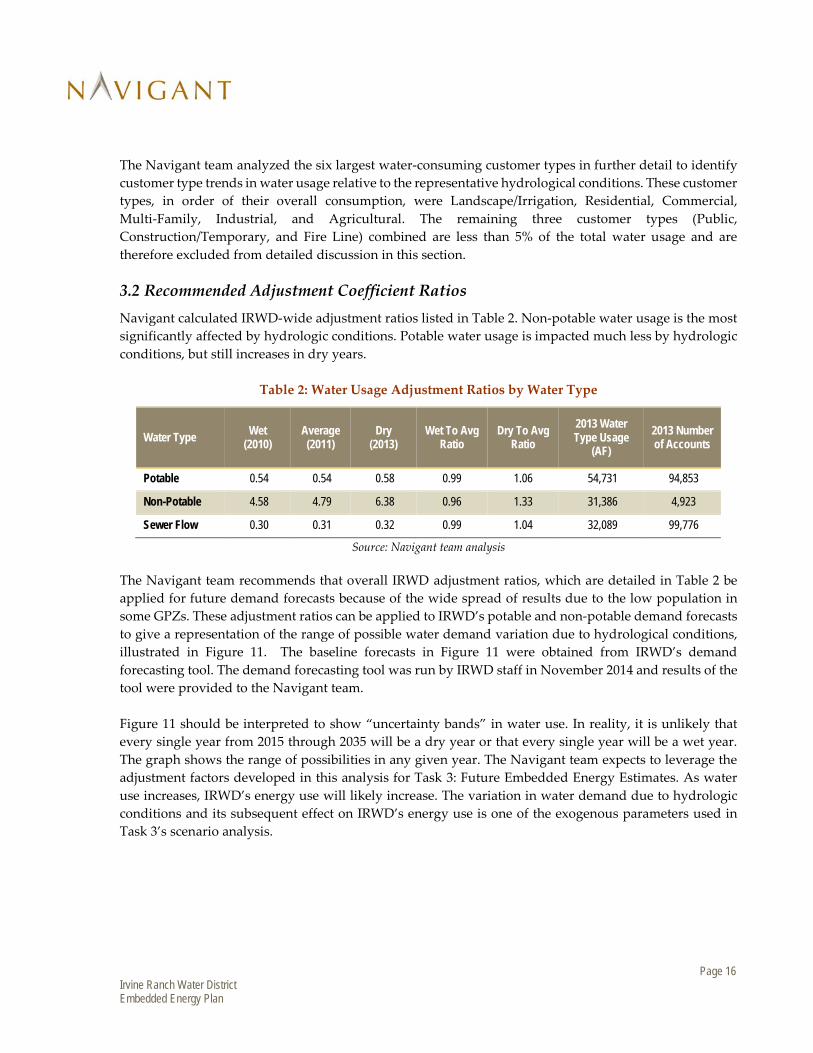
Figure 10 provides an illustrative comparison of the representative hydrological years and the associated water usage for each water type including sewer flow. Water usage is higher in the dry years and lower in the wet years. Higher variation is viewed in non-potable accounts than in potable accounts. The following section presents similar data for select major sectors.
Figure 10: Hydrological Year Comparison of Water Usage per Account - All Accounts (AF)
Source: Navigant analysis.
Page 16 Irvine Ranch Water District Embedded Energy Plan
The Navigant team analyzed the six largest water-consuming customer types in further detail to identify customer type trends in water usage relative to the representative hydrological conditions. These customer types, in order of their overall consumption, were Landscape/Irrigation, Residential, Commercial, Multi-Family, Industrial, and Agricultural. The remaining three customer types (Public, Construction/Temporary, and Fire Line) combined are less than 5% of the total water usage and are therefore excluded from detailed discussion in this section.
3.2 Recommended Adjustment Coefficient Ratios Navigant calculated IRWD-wide adjustment ratios listed in Table 2. Non-potable water usage is the most significantly affected by hydrologic conditions. Potable water usage is impacted much less by hydrologic conditions, but still increases in dry years.
Table 2: Water Usage Adjustment Ratios by Water Type
Water Type Wet (2010)
Average (2011)
Dry (2013)
Wet To Avg Ratio
Dry To Avg Ratio
2013 Water Type Usage
(AF) 2013 Number of Accounts
Potable 0.54 0.54 0.58 0.99 1.06 54,731 94,853
Non-Potable 4.58 4.79 6.38 0.96 1.33 31,386 4,923
Sewer Flow 0.30 0.31 0.32 0.99 1.04 32,089 99,776
Source: Navigant team analysis
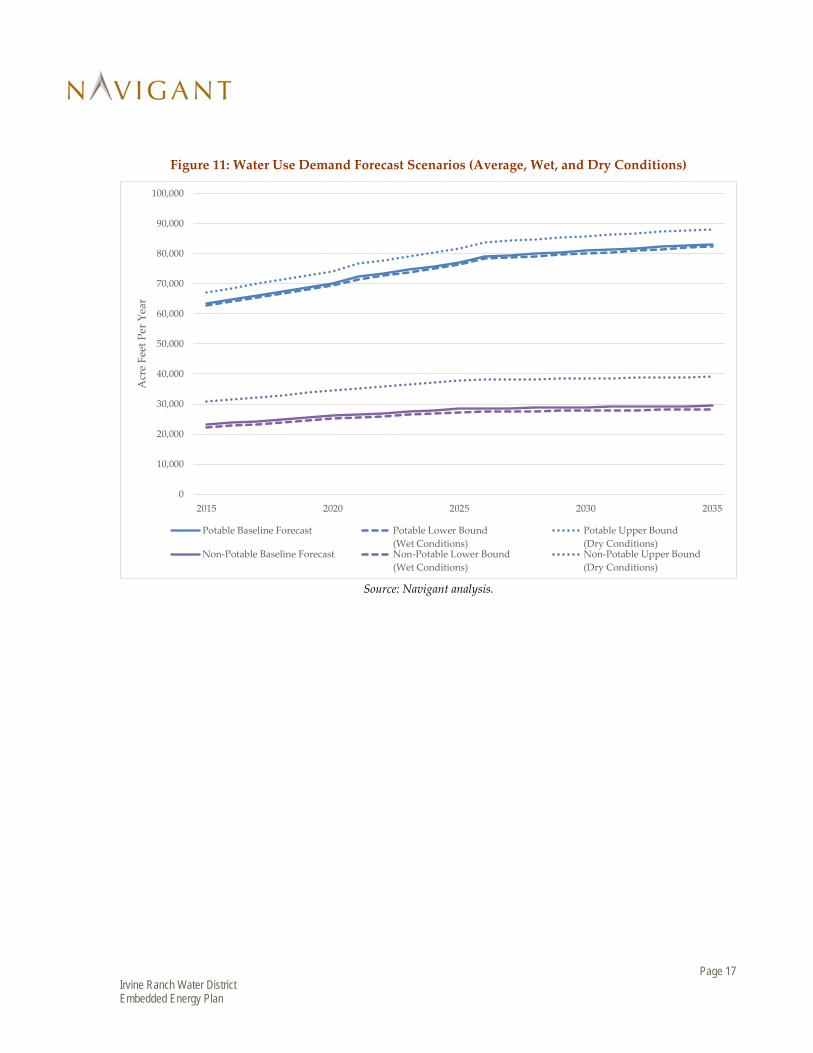
The Navigant team recommends that overall IRWD adjustment ratios, which are detailed in Table 2 be applied for future demand forecasts because of the wide spread of results due to the low population in some GPZs. These adjustment ratios can be applied to IRWD’s potable and non-potable demand forecasts to give a representation of the range of possible water demand variation due to hydrological conditions, illustrated in Figure 11. The baseline forecasts in Figure 11 were obtained from IRWD’s demand forecasting tool. The demand forecasting tool was run by IRWD staff in November 2014 and results of the tool were provided to the Navigant team. Figure 11 should be interpreted to show “uncertainty bands” in water use. In reality, it is unlikely that every single year from 2015 through 2035 will be a dry year or that every single year will be a wet year. The graph shows the range of possibilities in any given year. The Navigant team expects to leverage the adjustment factors developed in this analysis for Task 3: Future Embedded Energy Estimates. As water use increases, IRWD’s energy use will likely increase. The variation in water demand due to hydrologic conditions and its subsequent effect on IRWD’s energy use is one of the exogenous parameters used in Task 3’s scenario analysis.
Page 17 Irvine Ranch Water District Embedded Energy Plan
Figure 11: Water Use Demand Forecast Scenarios (Average, Wet, and Dry Conditions)
Source: Navigant analysis.
0
10,000
20,000
30,000
40,000
50,000
60,000
70,000
80,000
90,000
100,000
2015 2020 2025 2030 2035
Acr
e Fe
et P
er Y
ear
Potable Baseline Forecast Potable Lower Bound(Wet Conditions)
Potable Upper Bound(Dry Conditions)
Non-Potable Baseline Forecast Non-Potable Lower Bound(Wet Conditions)
Non-Potable Upper Bound(Dry Conditions)
Page 18 Irvine Ranch Water District Embedded Energy Plan
4. Water Conservation Program Energy and GHG Savings
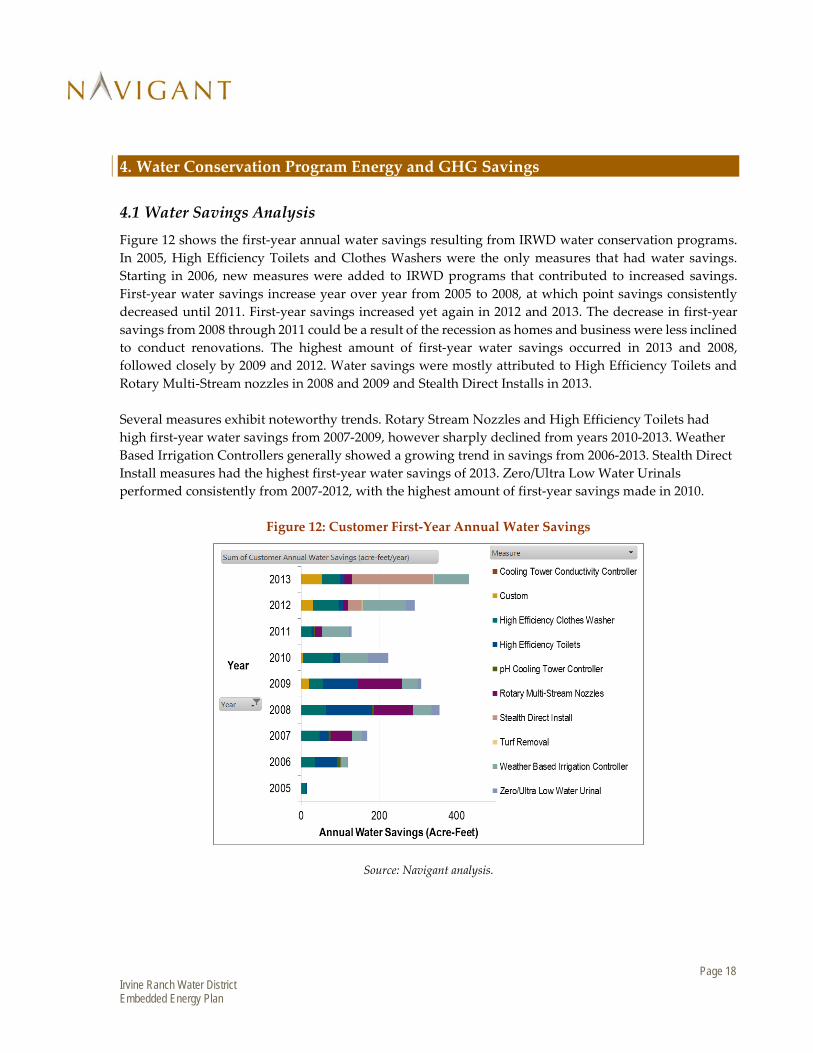
4.1 Water Savings Analysis Figure 12 shows the first-year annual water savings resulting from IRWD water conservation programs. In 2005, High Efficiency Toilets and Clothes Washers were the only measures that had water savings. Starting in 2006, new measures were added to IRWD programs that contributed to increased savings. First-year water savings increase year over year from 2005 to 2008, at which point savings consistently decreased until 2011. First-year savings increased yet again in 2012 and 2013. The decrease in first-year savings from 2008 through 2011 could be a result of the recession as homes and business were less inclined to conduct renovations. The highest amount of first-year water savings occurred in 2013 and 2008, followed closely by 2009 and 2012. Water savings were mostly attributed to High Efficiency Toilets and Rotary Multi-Stream nozzles in 2008 and 2009 and Stealth Direct Installs in 2013. Several measures exhibit noteworthy trends. Rotary Stream Nozzles and High Efficiency Toilets had high first-year water savings from 2007-2009, however sharply declined from years 2010-2013. Weather Based Irrigation Controllers generally showed a growing trend in savings from 2006-2013. Stealth Direct Install measures had the highest first-year water savings of 2013. Zero/Ultra Low Water Urinals performed consistently from 2007-2012, with the highest amount of first-year savings made in 2010.
Figure 12: Customer First-Year Annual Water Savings
Source: Navigant analysis.

Page 19 Irvine Ranch Water District Embedded Energy Plan
Figure 13 shows the 2013 cumulative water savings broken out by measure and installation year. This graph shows Weather Based Irrigation Controllers provided the most savings over the 2005-2013 period while Cooling Tower Conductivity Controllers provided the least. Turf removal and pH Cooling Tower Controls were also low savings sources. Overall, Weather Based Irrigation Controllers had the most water savings during this period followed by High Efficiency Clothes Washers. Custom measures accounted for over 100 AF of water savings, but were only installed starting in 2009. The Stealth Direct Install program has contributed significant savings to the IRWD water conservation program. In 2013, the Stealth Direct Install program produced more savings than the Zero/Ultra Low Water Urinal measure (over the 2005-2013 period), even though the Stealth Direct Install programs had only been running for two years.
Figure 13: 2013 Cumulative Water Savings
Source: Navigant analysis.
Each measure saves either indoor or outdoor water, and each customer receives either potable or non-potable water. These distinctions determine what components of embedded energy are saved. Figure 14 shows the 2013 cumulative savings broken out by these two parameters. Only zero/ultra low water urinals save indoor non-potable water; these installations would be at commercial sites that have dual plumbing (i.e. purple piping).

Page 20 Irvine Ranch Water District Embedded Energy Plan
Figure 14: 2013 Cumulative Savings by Water Type
Source: Navigant analysis.
IRWD’s 2013 cumulative water savings relative to total 2013 consumption was 2.3% (total across all of IRWD’s territory). This implies water efficiency programs alone account for a 2.3% decrease in water consumption. Other sources can also drive decreases in total water consumption (e.g., price, weather, and economic conditions) and are discussed further in section 4.3.
4.2 Embedded Energy Savings Navigant calculated the average embedded energy savings due to IRWD water conservation programs. Navigant considered the energy intensity of each of the 10 major systems in calculating the embedded energy savings as a result of water efficiency programs. Table 3 outlines the total water saved, energy intensity values used, and embedded energy saved for potable and non-potable water for both indoor and outdoor usage. There are separate energy intensities for both IRWD Only and Non-IRWD electricity usage. Table 3 and Figure 15 provide the total savings by each water type. IRWD Only embedded energy savings are all higher than Non-IRWD embedded electric savings. The total embedded energy savings in 2013 as a result of efficiency programs since 2005 amount to 3,863 MWh, of which 2,610 MWh is IRWD Only energy savings. IRWD’s energy savings results in reducing IRWD’s annual energy bill by roughly $261,000.8
8 IRWD’s average cost of electricity was approximately $0.10/kWh in 2013.

Page 21 Irvine Ranch Water District Embedded Energy Plan
Table 3: Embedded Energy Savings by Water Type
Measure Type Water Type
AF saved (Cumulative
2013 Savings)
Energy Intensity (kWh/AF) Embedded Energy Savings (kWh)
IRWD Only Non-IRWD IRWD Only Non-IRWD Total
Savings
Outdoor Potable 431 1,030 687 444,172 296,476 740,648 Non-Potable 497 881 230 437,937 114,141 552,078
Indoor Potable 1,104 1,553 760 1,713,776 838,621 2,552,396 Non-Potable 10.7 1,404 302 14,987 3,225 18,212
Total Savings 2,043 - - 2,610,870 1,252,463 3,863,334
Source: Navigant analysis.
Figure 15: Total IRWD Embedded Energy Savings by Water Type
Source: Navigant analysis.
4.3 Conservation Impacts on Historical Water Usage The previous sections show that the water conservation programs have a significant savings impact for IRWD. Navigant further analyzed these impacts by layering the water conservation program savings on historical usage to see the cumulative impact of these programs over time. Figure 16 shows usage trends for the Residential (in GPCD) and Landscape (AF/Acre/Year) account types since 1988. GPCD is an important metric that the State Water Resources Control Board is monitoring during the drought. The graph shows the historic reduction of usage from 1988 to 2014 utilizing the blue (Residential) and green (Landscape) solid lines. The dotted red line represents Residential usage estimates without the impact of 2005-2013 efficiency programs while the purple dotted line illustrates the same for Landscape account usage.
0 0.5 1 1.5 2 2.5 3
Non-Potable
Potable
Non-Potable
Potable
Embedded Energy Savings (kWh)
Millions
Indoo
rOu
tdoor
IRWD Non-IRWD

Page 22 Irvine Ranch Water District Embedded Energy Plan
Figure 16: IRWD Historical GPCD & AF/Acre Trends with and without Conservation Programs
Source: Navigant analysis.
By 2013, Residential water conservation programs since 2005 have resulted in a 2.6% reduction in water usage and Landscape programs have resulted in about a 2.2% reduction. The graph illustrates a more significant reduction in both GPCD and AF/Acre in years past leading to the conclusion that IRWD’s current water conservation programs are one of many impacts that drive changes in water use over time. Other impacts that are not captured in this analysis include naturally occurring (unrebated) adoption of efficiency measures, impacts of codes and standards, behavioral conservation (such as the impact of IRWD’s WaterSmart program), changes to rates, and rainfall conditions.
4.4 GHG Emissions Reduction Analysis Navigant additionally calculated the associated GHG emissions savings due to IRWD water conservation programs. For this analysis, all acre feet saved from water conservation programs in IRWD are considered to reduce water imports from MWD. Therefore, the EI utilized for the GHG analysis only includes the appropriate IRWD systems associated with imported water supply and subsequent treatment and delivery to IRWD customers. Table 4 provides the inputs and results for this analysis. Navigant utilized the formulae outlined in IRWDs GHG inventory9 to evaluate the GHG emissions reductions from embedded electricity savings in IRWD’s 9 IRWD. Greenhouse Gas Inventory 2012. January 2014
1.00
1.50
2.00
2.50
3.00
3.50
4.00
4.50
5.00
60
70
80
90
100
110
120
130
ACR
E-FE
ET P
ER A
CR
E PE
R Y
EAR
RES
IDEN
TIAL
GPC
D
CALENDAR YEARResidential GPCD w/o Conservation Residential GPCDAF per Acre per Year w/o Conservation AF/Acre/Yr
TIERED RATE STRUCTURE 1991
RESIDENTIAL ACCOUNTS 25%
REDUCTION
EL NIÑO 1997 VERY WET
2010
2007 RECORDLOW RAINFALL
4.12"
LANDSCAPEACCOUNTS 50%
REDUCTION
2011-2014RECORD
DROUGHT

Page 23 Irvine Ranch Water District Embedded Energy Plan
systems handling imported water and to calculate the additional GHG emissions reductions from avoided water imports from MWD. The total GHG emissions saved due to IRWD water conservation programs from 2005-2013 is 2,176 tonnes of CO2. Table 4 and Figure 17 provide a summary of the total GHG emissions savings by water type conserved. The emissions saved from avoided MWD Imports are significantly more than the emissions saved due to IRWD’s reduced electricity consumption associated with imported water. The GHG savings from avoided MWD imports total 1,784 tonnes of CO2 - more than four times the GHG savings associated with IRWD embedded electricity savings (391 tonnes of CO2). Overall, there is also a much more significant reduction of GHG emissions associated with potable water usage rather than non-potable.
Table 4: GHG Emissions Reduction
Measure Type Water Type AF saved
GHG Embedded Energy Savings
GHG Emissions Reduction (Tonnes of CO2)
EI (kWh/AF) Savings (kWh)
IRWD Electricity
MWD Imports
Total GHG Reduction
Outdoor Potable 431 287 123,813 35.4 377 412 Non-Potable 497 677 336,576 96.3 434 531
Indoor Potable 1,104 810 894,076 256 964 1,220 Non-Potable 10.7 1,200 12,810 3.7 9.3 13
Total Savings 2,043 - 1,367,275 391 1,784 2,176
Source: Navigant analysis.
Figure 17: IRWD GHG Emissions Savings by Water Type
Source: Navigant analysis.
0 200 400 600 800 1,000 1,200 1,400
Non-Potable
Potable
Non-Potable
Potable
Tonnes of CO2
Indoo
rOu
tdoor
IRWD MWD Imports

Page 24 Irvine Ranch Water District Embedded Energy Plan
5. Future Embedded Energy Estimates
This section describes our estimates of future embedded energy use (Task 3) and a scenario analysis of how that energy use may change with various levels of future water conservation and hydrologic conditions. Future embedded energy use was estimated on an annual basis from 2014 to 2035. To be consistent with potential funding sources from the energy sector and IRWD’s greenhouse gas estimates, the analysis considers three types of energy use; IRWD Only, Non-IRWD, and IRWD Total. IRWD Only is the energy consumed by IRWD facilities. Non-IRWD is the energy use associated with importing water from MWD and exporting sewer flows and biosolids for treatment. IRWD Total is the sum of IRWD Only and Non-IRWD energy use. Figure 18 shows a forecast of IRWD Total energy use for providing water and sewer services to IRWD customers. This graph includes energy use by IRWD facilities plus Non-IRWD energy use upstream of IRWD to import water and downstream of IRWD to treat exported sewer flows and biosolids. Energy use generally increases as water use increases over time. The large jump in energy use beginning in 2015 is primarily due to the Michelson Water Reclamation Plant’s (MWRP) capacity expansion and the construction of a new biosolids treatment processes. Historically, the biosolids produced by MWRP were pumped to the Orange County Sanitation District for treatment while biosolids produced at the Los Alisos Water Reclamation Plant (LAWRP) were shipped via truck to Arizona. The new MWRP biosolids treatment facility will process biosolids from both MWRP and LAWRP into fertilizer that can be sold locally. IRWD also plans to install micro turbines on MWRP to use biogas for energy generation to offset some of the energy use by the treatment process. Our analysis includes the net energy consumption of the treatment processes (accounting for energy generation).
Figure 18: Total IRWD Energy Use - Baseline Forecast
Source: Navigant analysis.
Page 25 Irvine Ranch Water District Embedded Energy Plan
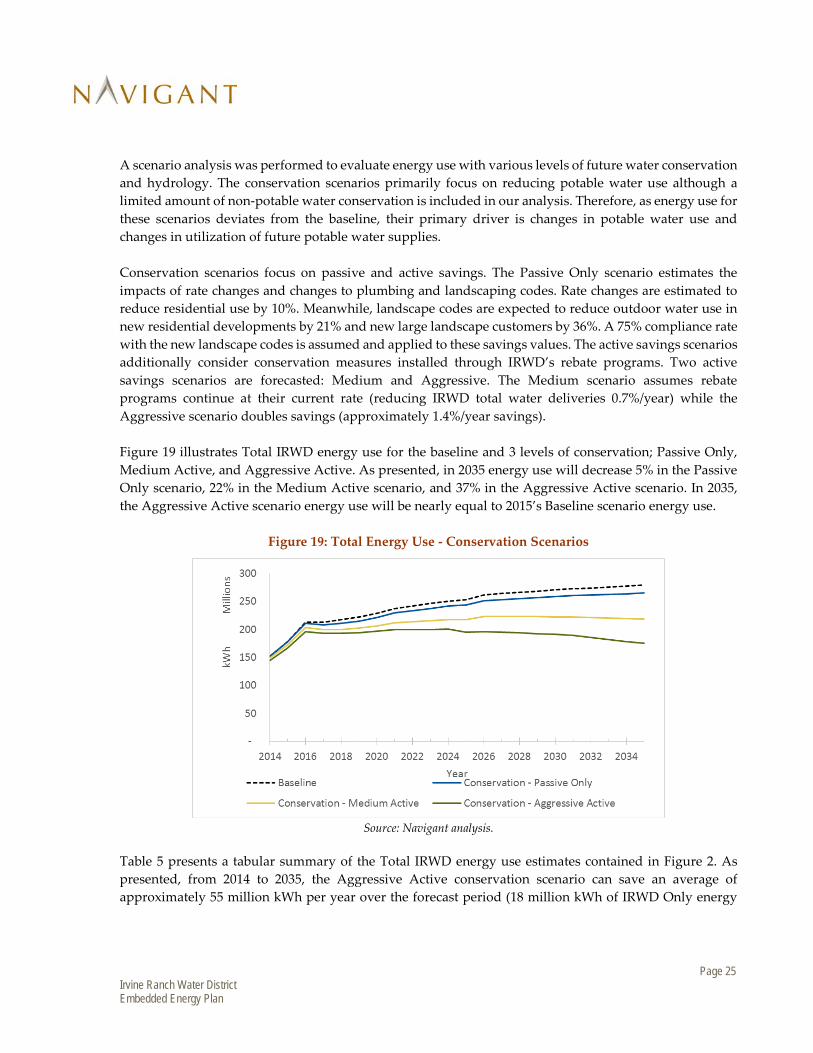
A scenario analysis was performed to evaluate energy use with various levels of future water conservation and hydrology. The conservation scenarios primarily focus on reducing potable water use although a limited amount of non-potable water conservation is included in our analysis. Therefore, as energy use for these scenarios deviates from the baseline, their primary driver is changes in potable water use and changes in utilization of future potable water supplies. Conservation scenarios focus on passive and active savings. The Passive Only scenario estimates the impacts of rate changes and changes to plumbing and landscaping codes. Rate changes are estimated to reduce residential use by 10%. Meanwhile, landscape codes are expected to reduce outdoor water use in new residential developments by 21% and new large landscape customers by 36%. A 75% compliance rate with the new landscape codes is assumed and applied to these savings values. The active savings scenarios additionally consider conservation measures installed through IRWD’s rebate programs. Two active savings scenarios are forecasted: Medium and Aggressive. The Medium scenario assumes rebate programs continue at their current rate (reducing IRWD total water deliveries 0.7%/year) while the Aggressive scenario doubles savings (approximately 1.4%/year savings). Figure 19 illustrates Total IRWD energy use for the baseline and 3 levels of conservation; Passive Only, Medium Active, and Aggressive Active. As presented, in 2035 energy use will decrease 5% in the Passive Only scenario, 22% in the Medium Active scenario, and 37% in the Aggressive Active scenario. In 2035, the Aggressive Active scenario energy use will be nearly equal to 2015’s Baseline scenario energy use.
Figure 19: Total Energy Use - Conservation Scenarios
Source: Navigant analysis.
Table 5 presents a tabular summary of the Total IRWD energy use estimates contained in Figure 2. As presented, from 2014 to 2035, the Aggressive Active conservation scenario can save an average of approximately 55 million kWh per year over the forecast period (18 million kWh of IRWD Only energy

Page 26 Irvine Ranch Water District Embedded Energy Plan
use). This could amount to approximately $2M in annual SCE energy bill savings over this time period.10 Table 5 provides additional energy use results for each scenario.
Table 5: Conservation Scenarios Summary
Scenario 2014 - 2035
Energy Consumption
(GWh)
Average Annual Energy
Consumption (kWh)
Difference Relative to Baseline
(Annual kWh) Total Energy
Baseline 5,365 243,848,104
Conservation - Passive Only 5,173 235,138,763 -8,709,341
Conservation - Medium Active 4,626 210,280,182 -33,567,922
Conservation - Aggressive Active 4,161 189,136,152 -54,711,952
IRWD ONLY Energy Baseline 4,100 186,373,732
Conservation - Passive Only 4,050 184,086,175 -2,287,557
Conservation - Medium Active 3,940 179,112,669 -7,261,063
Conservation - Aggressive Active 3,705 168,388,611 -17,985,121
NON-IRWD Energy Baseline 1,264 57,474,372
Conservation - Passive Only 1,123 51,052,588 -6,421,783
Conservation - Medium Active 686 31,167,513 -26,306,858
Conservation - Aggressive Active 456 20,747,541 -36,726,831 Source: Navigant analysis.
Figure 20 illustrates Total IRWD energy use in the hydrology scenario. Energy use increases in the dry years as potable and non-potable water demand increases. The hydrology scenario was designed to show the possibility of increased water demand based on a cycle of dry years coupled with no additional conservation. Therefore, it represents one possible scenario of increased energy use in contrast to the previously presented conservation scenarios. Table 6 provides a summary of total energy use over the forecast period.
10 IRWD’s average cost of electricity was approximately $0.12/kWh in 2013.
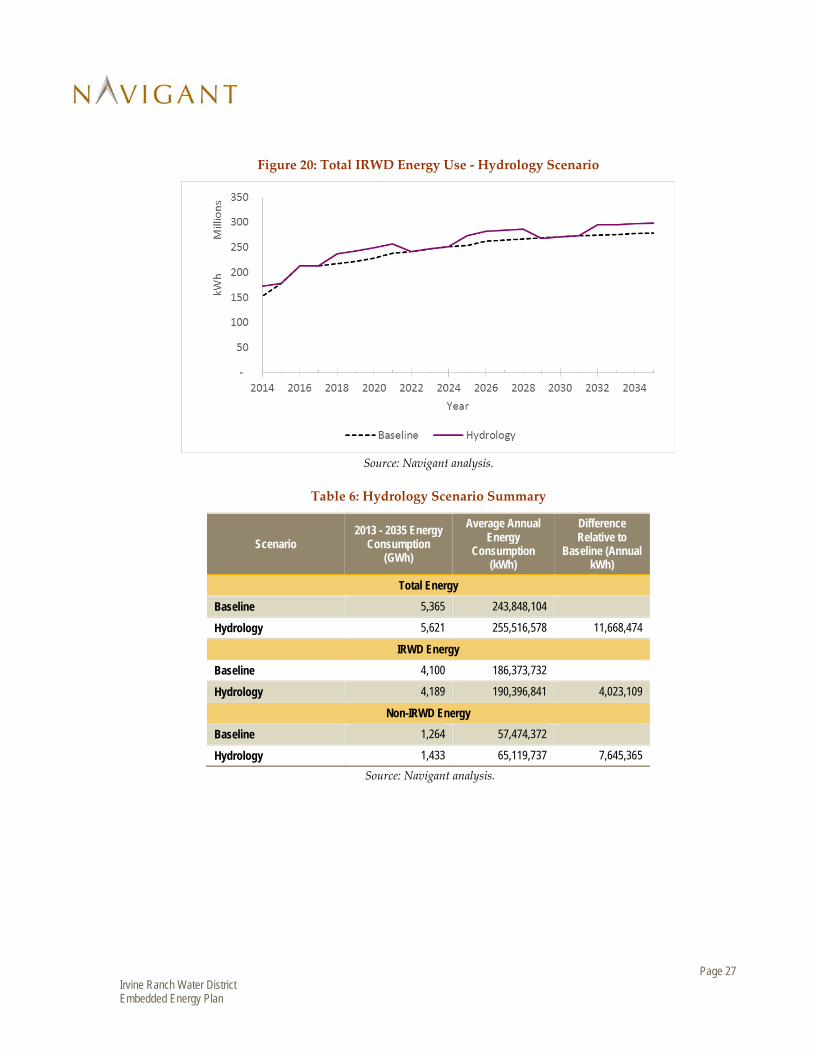
Page 27 Irvine Ranch Water District Embedded Energy Plan
Figure 20: Total IRWD Energy Use - Hydrology Scenario
Source: Navigant analysis.
Table 6: Hydrology Scenario Summary
Scenario 2013 - 2035 Energy
Consumption (GWh)
Average Annual Energy
Consumption (kWh)
Difference Relative to
Baseline (Annual kWh)
Total Energy
Baseline 5,365 243,848,104
Hydrology 5,621 255,516,578 11,668,474
IRWD Energy
Baseline 4,100 186,373,732
Hydrology 4,189 190,396,841 4,023,109
Non-IRWD Energy
Baseline 1,264 57,474,372
Hydrology 1,433 65,119,737 7,645,365 Source: Navigant analysis.

Page 28 Irvine Ranch Water District Embedded Energy Plan
6. GIS Processing and Spatial Embedded Energy Estimates
Navigant developed summary maps of energy intensity by region. Like a “temperature map” typically used in communicating weather forecasts, the information is presented over a range of six colors that represent the intensity of the value presented. Thus the maps can be used to identify the high energy or cost intensity areas geographically.
6.1 Summary Energy Intensity Maps Several summary maps are presented in the figures on the following pages. Note the colors in each map are similar, however the scale in the legend for each map is different.
• Figure 21 illustrates the EI of potable water systems plus associated sewage collection and treatment. The EI only represents the energy purchased by IRWD from SCE. It includes the following systems: potable supply, potable treatment, potable distribution, sewage collection, sewage treatment, sewage discharge, biosolids treatment, and biosolids product disposal.
• Figure 22 is similar to Figure 21 with the addition of energy intensity from non-IRWD systems (energy use associated with importing water from MWD and exporting sewer flows and biosolids for treatment).
• Figure 23 illustrates the EI of non-potable water systems plus associated sewage collection and treatment. The EI only represents the energy purchased by IRWD from SCE. It includes the following systems: non-potable supply, recycled water treatment, non-potable distribution, sewage collection, sewage treatment, sewage discharge, biosolids treatment, and biosolids product disposal.
• Figure 24 is similar to Figure 23 with the addition of energy intensity from Non-IRWD systems (energy use associated with importing water from MWD and exporting sewer flows and biosolids for treatment).
• Figure 25 illustrates the combined EI of all water services in a region (potable, non-potable and sewage). The EI only represents the energy purchased by IRWD from SCE. The EI data is plotted using potable GPZs for visualization. Note, however, that several of these regions only receive potable service and no non-potable service.
• Figure 26 is similar to Figure 25 with the addition of energy intensity from Non-IRWD systems (energy use associated with importing water from MWD and exporting sewer flows and biosolids for treatment).
Comparing the two potable maps (Figure 21 and Figure 22) shows consistently high energy intensity in the Santiago Hills and Portola Hills areas as these are areas with high elevation that require significant distribution pumping. The Newport Coast area has relatively low EI when considering IRWD Only energy use - lower than Central Irvine. However, when adding Non-IRWD energy use Newport Coast’s EI increases. This is because Newport Coast is heavily dependent on highly energy intensive imported water while Central Irvine almost exclusively uses local groundwater. Additional regional observations can be found in Section 6.2.

Page 29 Irvine Ranch Water District Embedded Energy Plan
Comparing the two non-potable maps (Figure 23 and Figure 24) shows consistently high energy intensity in the Newport Coast area as it has relatively high elevation and requires significant distribution pumping. The Tustin Ranch and Northwood areas have relatively low EI when considering IRWD Only energy use as there is little distribution energy needed. However, when adding Non-IRWD energy use Tustin Ranch and Northwood, EI increases. This is because these regions are heavily dependent on highly energy intensive imported water while the rest of the non-potable zones primarily use IRWD-produced recycled water. Additional regional observations can be found in Section 6.2. Comparing the combined EI maps (Figure 25 and Figure 26) shows consistently high energy intensity in the Santiago Hills and Portola Hills areas. These areas only receive potable water that (as mentioned earlier) is pumped to high elevations. The Newport Coast area has relatively consistent combined IRWD EI compared to Central Irvine (Figure 25). IRWD Only energy use to serve potable water to the Newport Coast area is relatively low (Figure 21) as most potable supply is imported while suppling non-potable water to the region is relatively high (Figure 23) as it must be pumped to high elevations. However, when adding Non-IRWD energy use Newport Coast’s EI increases (Figure 26). Note that these maps are just a subset of what the tool can produce. The tool allows users to isolate specific systems or groups of systems and map their results allowing users to produce a large number of unique maps.
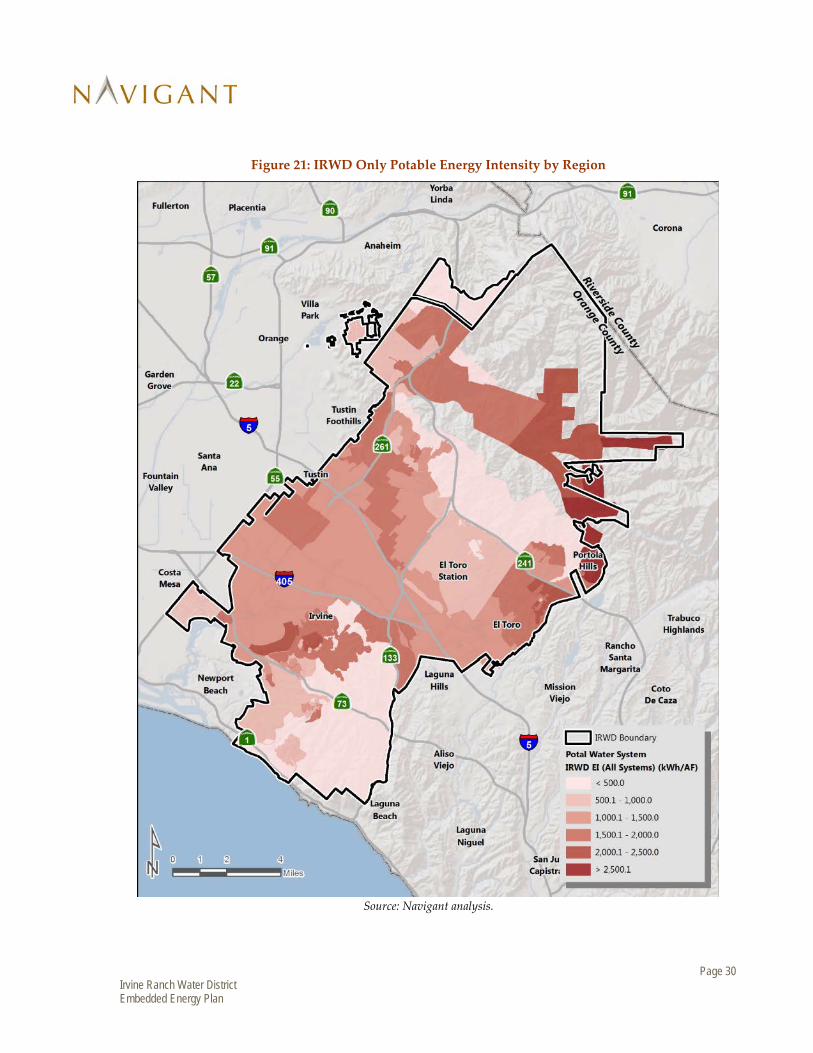
Page 30 Irvine Ranch Water District Embedded Energy Plan
Figure 21: IRWD Only Potable Energy Intensity by Region
Source: Navigant analysis.

Page 31 Irvine Ranch Water District Embedded Energy Plan
Figure 22: IRWD Total Potable Energy Intensity by Region (IRWD Only + Non-IRWD Energy)
Source: Navigant analysis.

Page 32 Irvine Ranch Water District Embedded Energy Plan
Figure 23: IRWD Only Non-Potable Energy Intensity by Region
Source: Navigant analysis.

Page 33 Irvine Ranch Water District Embedded Energy Plan
Figure 24: IRWD Total Non-Potable Energy Intensity by Region (IRWD Only + Non-IRWD Energy)
Source: Navigant analysis.

Page 34 Irvine Ranch Water District Embedded Energy Plan
Figure 25: IRWD Only Combined Energy Intensity by Region (Potable, Non-Potable, and Sewer Systems)
Source: Navigant analysis.
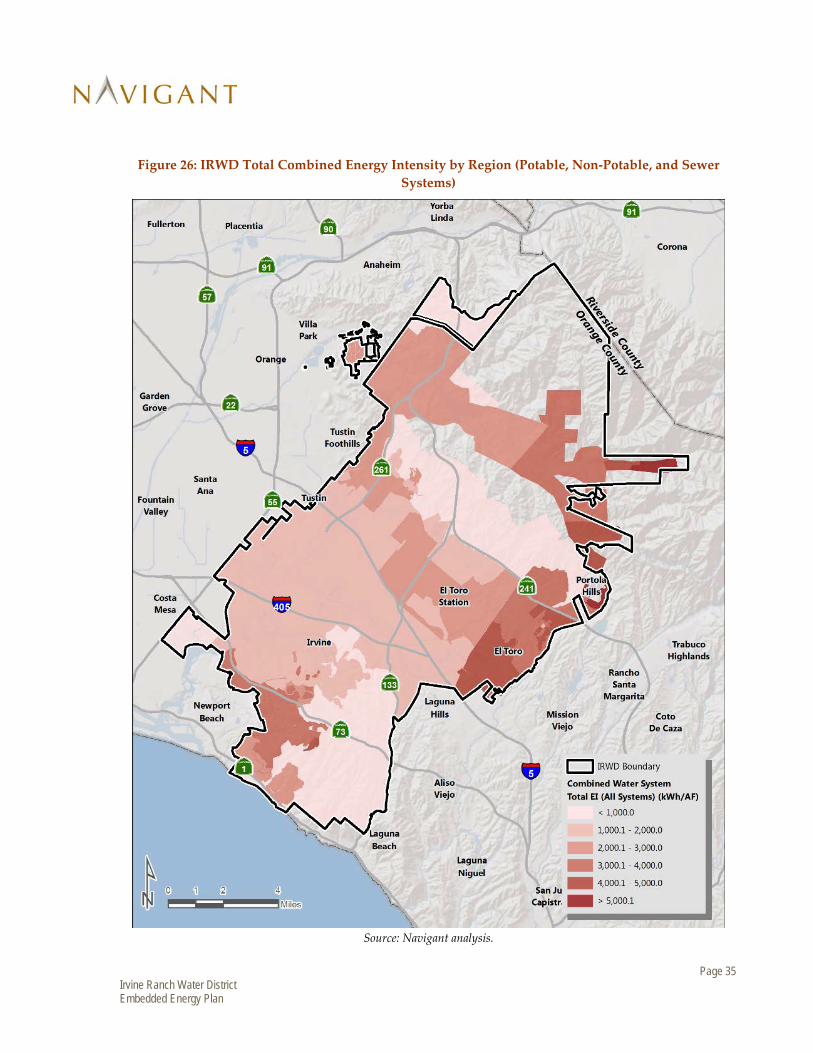
Page 35 Irvine Ranch Water District Embedded Energy Plan
Figure 26: IRWD Total Combined Energy Intensity by Region (Potable, Non-Potable, and Sewer Systems)
Source: Navigant analysis.

Page 36 Irvine Ranch Water District Embedded Energy Plan
6.2 Regional Summary Table 7 and Table 8 list the most energy intensive zones for potable and non-potable water, including sewage systems. The breakdown of IRWD Only versus Non-IRWD energy intensity serves to demonstrate that high energy intensities can be due to a number of factors, one of which is how much water serving a region is imported, and thereby how much of the energy footprint is not from IRWD facilities. Table 7 shows the following regions have high energy intensity of delivering potable water:
• Portola Hills Zones 8 and 9 • Santiago Canyon Zones 10 and 11 • Lake Forest/Foothill Ranch Zone 6 • Newport Coast Zones 4, 6, and 7
These regions are all locations above 700 feet in elevation. Water must be pumped through multiple distribution pump stations to reach these high elevations. Additionally some of these regions draw a portion of their water from imports thus adding Non-IRWD EI and increasing the Total EI.
Table 7:. Most Energy Intensive GPZs for Potable Water
Index GPZ IRWD Only EI (kWh/AF)
Non-IRWD EI (kWh/AF)
Total EI (kWh/AF)
1 POR_08_0_R01 3,179 2,527 5,706
2 POR_09_0_000 3,179 2,527 5,706
3 POR_09_0_R01 3,179 2,527 5,706
4 SNC_11_0_000 4,451 1,149 5,600
5 POR_08_0_000 2,941 2,527 5,468
6 NPC_06_0_R01 1,894 3,014 4,908
7 LKF_06_0_000 2,413 2,183 4,595
8 SNC_10_A_000 3,285 1,149 4,434
9 NPC_07_0_000 1,383 3,014 4,397
10 NPC_04_0_R01 1,521 2,617 4,138
Source: Navigant analysis.

Page 37 Irvine Ranch Water District Embedded Energy Plan
Table 8 shows the following regions have high energy intensity of delivering non-potable water: • Tustin Ranch Zone B and C – These regions are primarily supplied by energy intensive imported
water • Newport Coast Zone E, F, G and H – These regions required significant distribution system
pumping up to elevations greater than 1,000 feet • Northwood Zone B – This region is primarily supplied by energy intensive imported water • Lake Forest Zone B and C – Water must be pumped above 800 feet in elevation in this region. • Crystal Cove Zone C – This region receives water from higher elevation zones.
Table 8: Most Energy Intensive RWZs for Non-Potable Water
Index RWZ IRWD Only EI (kWh/AF)
Non-IRWD EI (kWh/AF)
Total EI (kWh/AF)
1 Zone C TRN 642 2,473 3,115
2 Zone B TRN 881 2,110 2,991
3 Zone H NPC 2,580 397 2,977
4 Zone G NPC 2,465 397 2,862
5 Zone B NWD 684 2,110 2,794
6 Zone C LKF 2,544 0 2,544
7 Zone F NPC 2,122 397 2,519
8 Zone E NPC 2,111 397 2,508
9 Zone C CRY 2,003 397 2,400
10 Zone B LKF 2,395 0 2,395
Source: Navigant analysis.

Page 38 Irvine Ranch Water District Embedded Energy Plan
7. Embedded Energy Management Tool
The Embedded Energy Management Tool allows users to view and process key data from this study in a GIS platform. This tool performs separate analyses either at the GPZ level for the potable system or at the RWZ for the non-potable system. The tool conducts three types of analysis:
• Data Viewing • Conservation Analysis • Surcharge Analysis
The functionality required for this tool called for a customized GIS tool. The team used ArcObject with C# to accomplish the functionality required. Detailed documentation of the Tool’s functions as well as a simple step-by-step guide to opening the Tool and running the various analyses with the Tool can be found in the detailed technical report (Task 7).
7.1 Data Viewing The Data Viewing option allows users to visualize energy intensity, water supply, and cost intensity data. Like a “temperature map” typically used in communicating weather forecasts, the information is presented over a range of colors that represent the intensity of the value presented. Thus the user could identify the high energy or cost intensity areas geographically. This option simply displays data that the tool uses. It does not run any calculations. The following types of data can be viewed with this function:
• Energy Intensity Map o Users select to view, potable, non-potable or total energy intensity. o Users select the system types to include in the data visualization.
• Water Use Map o Users select to view potable or non-potable water use data o Users select to view all or a subset of customer types (i.e. Residential, Landscape,
Commercial) • Cost Intensity (CI) Map
o Users select to view potable or non-potable CI data o Users select the system types to include in the data visualization.
Figure 27 illustrates the EI data mapping function in the tool. Users can select which water system (potable, non-potable or total) to map from a drop-down menu, which system components to include (using check boxes), and IRWD Only versus Non-IRWD energy use. Figure 27 shows potable EI for all systems showing IRWD Only energy use.
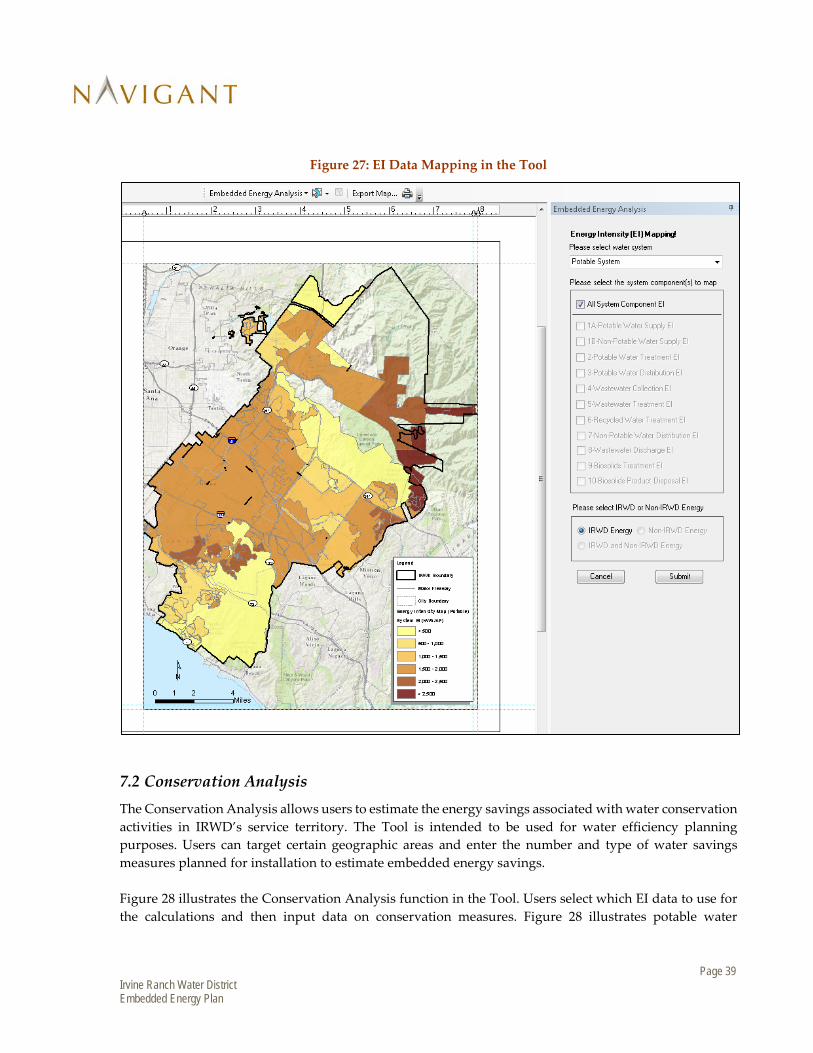
Page 39 Irvine Ranch Water District Embedded Energy Plan
Figure 27: EI Data Mapping in the Tool
7.2 Conservation Analysis The Conservation Analysis allows users to estimate the energy savings associated with water conservation activities in IRWD’s service territory. The Tool is intended to be used for water efficiency planning purposes. Users can target certain geographic areas and enter the number and type of water savings measures planned for installation to estimate embedded energy savings. Figure 28 illustrates the Conservation Analysis function in the Tool. Users select which EI data to use for the calculations and then input data on conservation measures. Figure 28 illustrates potable water

Page 40 Irvine Ranch Water District Embedded Energy Plan
Conservation Analysis for a selected region (a group of three GPZs in Santiago Canyon) that install a handful of water conservation measures.
Figure 28: Conservation Analysis in the Tool
7.3 Surcharge Analysis The Surcharge Analysis option allows users to estimate the pumping surcharge for selected regions in IRWD’s service area. Analysis can be conducted separately for the potable and non-potable systems. See Section 8 of this report for additional context on pumping surcharge.
• Key user inputs: o Select to conduct potable or non-potable analysis o Select which potable or non-potable zones are included in which surcharge zone o Specify a base value below which no pumping surcharge will be calculated.
• Output o Indicates selected surcharge zones

Page 41 Irvine Ranch Water District Embedded Energy Plan
o Indicates the average CI, base value, pumping surcharge, and estimated revenue for each surcharge zone
o Users can save the surcharge groupings. Saved data can be loaded to the tool when is re-opened in the future to recreate the past analysis
Figure 29 illustrates the Surcharge Analysis function in the Tool. Users can select to analyze potable or non-potable systems. The default is to show recommended surcharge zones, though users can alter zones. Figure 29 shows a map of potable CI data along with a table of the calculated potable surcharge by zone.
Figure 29: Surcharge Analysis in the Tool - Viewing Cost Intensity Data

Page 42 Irvine Ranch Water District Embedded Energy Plan
8. Pumping Surcharge Estimate11
The cost of distributing potable water and non-potable water (including recycled water) varies throughout IRWD’s service area based on location. In this analysis, the team assessed the variation in cost of pumping water to different regions throughout IRWD’s service area and developed a “pumping surcharge” by region. Consistent with IRWD’s historic pumping surcharge costs, this analysis did not include costs associated with water supply, water treatment, sewage collection, or any sewage treatment processes. Furthermore, this analysis only considers energy costs directly paid by IRWD; it does not consider energy costs that may be incurred by wholesale water agencies from which IRWD imports water. It excludes capital cost recovery and any non-energy operation and maintenance costs associated with delivering water.
8.1 Historic Context of Pumping Surcharge Estimate IRWD already applies a pumping surcharge to customers’ bills primarily based on elevation:
“A surcharge will be added to the commodity rate of those users who reside at higher elevations and cause the District to incur additional pumping costs to supply their water. The surcharge is based upon prevailing energy costs and currently varies from $0.16 to $0.42 per ccf depending upon the elevation of the area served.”12
IRWD has been using a pumping surcharge as part of its retail water rates for more than 20 years. The current surcharge values were determined approximately three years ago (in the 2011-2012 time frame). The current surcharges were calculated by IRWD staff using energy billing data. IRWD staff grouped IRWD’s area into nine distinct potable surcharge zones and four non-potable surcharge zones. Each customer within each zone has the same pumping surcharge applied to their bill as every other customer within the same zone. There are customers in IRWD’s service area that do not have any surcharge applied to their bills. These customers are considered to be part of the “base” zone. Distributing water to this base zone includes pumping costs that are included as part of IRWD’s standard billing rates. Surcharges for all other zones are calculated as follows:
11 This analysis (the “result”) was prepared for IRWD on terms specifically limiting the liability of Navigant Consulting, Inc. (“Navigant”). Navigant’s conclusions are the result of the exercise of Navigant’s reasonable professional judgment, based in part upon materials provided by IRWD and others. Navigant’s analysis is based on a methodology agreed to by IRWD staff using available data from 2013. Navigant has presented the results of its analysis for the scenarios requested by IRWD staff. Determination as to what surcharge values to ultimately adopt is to be made by IRWD. 12 Source: http://www.irwd.com/services/residential-water-rates

Page 43 Irvine Ranch Water District Embedded Energy Plan
Equation 1 Surchargei = P_Costi – P_CostBase
Where: Surchargei = Pumping surcharge for Zone i ($/AF or $/CCF) P_Costi = Cost to pump water to Zone i ($/AF or $/CCF) P_CostBase = Cost to pump water to the Base Zone ($/AF or $/CCF)
Equation 1, shown above, uses a single base cost to estimate pumping surcharge throughout IRWD. This approach is different than IRWD’s existing methodology that used different base zones for different parts of the District. IRWD’s existing pumping surcharges were then calculated as the additional pumping cost above one of the base zones without estimating the pumping cost for any of the base zones.
• Three different base zones are used in IRWD’s current potable water use surcharge values: o East Irvine Zone 4 o Turtle Rock Zone 3 o Imports from turnout DOC063
• One base zone is used in IRWD’s current non-potable analysis: Zone B South
8.2 Summary of Results IRWD currently has nine different potable surcharge zones; two zones have the same surcharge value, thus there are eight unique surcharge values. In this analysis, the Navigant team recalculated the potable pumping surcharge for two alternatives. Alternative P-1 uses the existing eight unique surcharge zones with Equation 1 while Alternative P-2 uses three, new potable surcharge zones with Equation 1. A comparison of the current potable pumping surcharge rates along with those estimated under Alternatives P-1 and P-2 can be found in Table 9 and Table 10. As presented, the estimated revenue for Alternatives P-1 and P-2 are less than the current pumping surcharge estimates. IRWD currently has four different non-potable surcharge zones; two zones have the same surcharge value thus there are three unique surcharge values. In this analysis, the Navigant team recalculated the non-potable surcharge for two alternatives. Alternative NP-1 uses the existing three unique surcharge zones with Equation 1 while Alternative NP-2 uses three new non-potable surcharge zones with Equation 1. A comparison of the current non-potable pumping surcharge rates with those estimated under Alternatives NP-1 and NP-2 can be found in Table 11 and Table 12. Figure 30 illustrates Alternative P-2 and NP-2 for potable and non-potable water, respectively.13 This analysis shows one of many possible scenarios for regrouping surcharge zones. IRWD staff can modify these and explore further scenarios using the Embedded Energy Management Tool.
13 For additional details, see the technical report (Task 9).

Page 44 Irvine Ranch Water District Embedded Energy Plan
Table 9: Summary of Potable Water Surcharge Analysis Given Existing Surcharge Zones
Current Zones Current Surcharge P-1: New Surcharge
Surcharge Zone Number of Pressure Zones
Number of Customers (2013)*
Total demand (AF/yr) Surcharge ($/CCF) Estimated Revenue
Collected Surcharge ($/CCF) Estimated Revenue Collected
Base Zone 67 80,969 46,883 $0.00 $0 $0.00 $0
1 13 3,394 1,710 $0.16 $119,000 $0.13 $94,000
2 13 2,355 1,496 $0.17 $111,000 $0.04 $29,000
3 5 2,310 2,193 $0.18** $172,000 $0.17 $167,000
4 2 2,038 872 $0.25 $95,000 $0.28 $107,000
5 2 458 192 $0.28 $23,000 $0.41 $34,000
6 4 817 354 $0.29 $45,000 $0.16 $24,000
7 2 942 509 $0.32 $71,000 $0.47 $104,000
8 1 245 149 $0.42 $27,000 $0.26 $17,000
Total 109 93,528 54,358 $663,000 $576,000 *Number of Customers is based on those that are able to be mapped to a zone. A small subset of customers could not be mapped to a zone and are excluded from this analysis.
**Two zones have the same surcharge in IRWD’s existing system. In this table, we combine them for simplicity. Source: Navigant analysis.
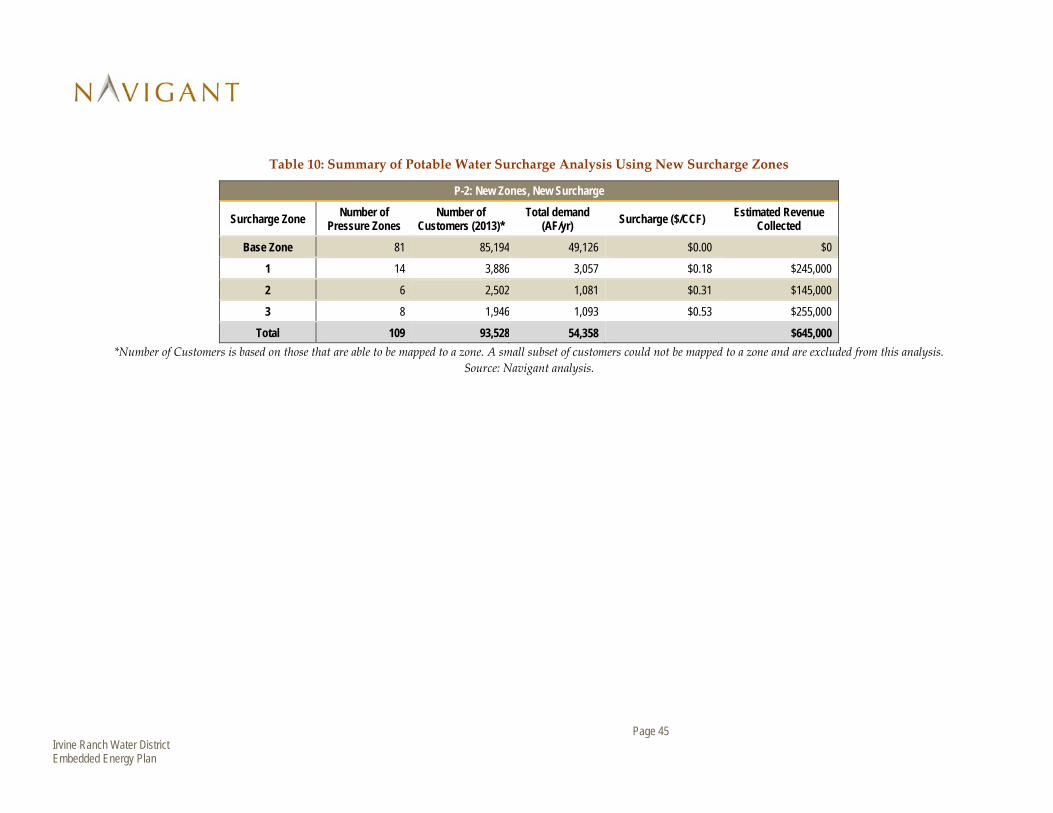
Page 45 Irvine Ranch Water District Embedded Energy Plan
Table 10: Summary of Potable Water Surcharge Analysis Using New Surcharge Zones
P-2: New Zones, New Surcharge
Surcharge Zone Number of Pressure Zones
Number of Customers (2013)*
Total demand (AF/yr) Surcharge ($/CCF) Estimated Revenue
Collected
Base Zone 81 85,194 49,126 $0.00 $0
1 14 3,886 3,057 $0.18 $245,000
2 6 2,502 1,081 $0.31 $145,000
3 8 1,946 1,093 $0.53 $255,000
Total 109 93,528 54,358 $645,000 *Number of Customers is based on those that are able to be mapped to a zone. A small subset of customers could not be mapped to a zone and are excluded from this analysis.
Source: Navigant analysis.

Page 46 Irvine Ranch Water District Embedded Energy Plan
Table 11: Summary of Non-Potable Water Surcharge Analysis Given Existing Surcharge Zones
Current Zones Current Surcharge P-1: New Surcharge
Surcharge Zone Number of Pressure Zones
Number of Customers (2013)*
Total demand (AF/yr) Surcharge ($/CCF) Estimated Revenue
Collected Surcharge ($/CCF) Estimated Revenue Collected
Base Zone 25 4,130 28,069 $0.00 $0 $0.00 $0
1 6 399 1,302 $0.16** $91,000 $0.17 $97,000
2 1 78 269 $0.29 $34,000 $0.27 $32,000
3 1 6 52 $0.42 $9,000 $0.38 $8,000
Total 33 4,613 29,692 $134,000 $137,000 *Number of Customers is based on those that are able to be mapped to a zone. A small subset of customers could not be mapped to a zone and are excluded from this analysis.
*Two zones have the same surcharge in IRWD’s existing system. In this table, we combine them for simplicity. Source: Navigant analysis.
Table 12: Summary of Non-Potable Water Surcharge Analysis Using New Surcharge Zones
NP-2: New Zones, New Surcharge
Surcharge Zone Number of Pressure Zones
Number of Customers (2013)*
Total demand (AF/yr) Surcharge ($/CCF) Estimated Revenue
Collected
Base Zone 14 3,461 23,686 $0.00 $0
1 8 543 2,169 $0.19 $178,000
2 10 603 3,786 $0.31 $512,000
3 1 6 52 $0.42 $9,000
Total 33 4,613 29,692 $699,000 *Number of Customers is based on those that are able to be mapped to a zone. A small subset of customers could not be mapped to a zone and are excluded from this analysis.
Source: Navigant analysis.

Page 47 Irvine Ranch Water District Embedded Energy Plan
Figure 30: Alternative Surcharge Zones
Source: Navigant analysis.

Page 48 Irvine Ranch Water District Embedded Energy Plan
9. Updating the Embedded Energy Plan
9.1 New and Improved Data Collection During the development of IRWD’s Embedded Energy Plan, Navigant identified several data collection and data management recommendations that are summarized in Table 13. Implementing these recommendations would improve the quality of data, make future updates to this study as well as other types of energy analysis easier to implement, and improve the quality of IRWD’s energy analysis. The recommended priority was determined based on the potential to increase the quality of future embedded energy analysis and the establishment of data management best practices that could benefit other future efforts and studies that IRWD undertakes. Recommendations were then force ranked.
Table 13: Summary of Recommendations
Rank Recommendation* Priority 1 #8: Collect missing flow data for distribution facilities to better inform surcharge estimates14 High 2 #1: Use Atlas ID to identify facilities across all IRWD information systems and data sets High 3 #2: Maintain a database that links Atlas IDs to SCE account numbers High 4 #12: Submeter electricity for co-located pump stations High 5 #3: Digitize field measurements of flow data on a regular basis High 6 #4: Maintain a common flow database Medium 7 #9: Improve sub metering of flow and energy at sewage treatment plants Medium 8 #7: Collect missing flow data for treatment facilities Medium 9 #11: Record and standardize units of measurement for flow data Medium 10 #13: Maintain a link between old customer account numbers and new customer account numbers Medium 11 #15: Consider scenario analysis in the next update to the demand forecast tool Medium 12 #10: Collect missing flow data for lift stations Low 13 #6: Update descriptions of facilities Low 14 #14: Update location data for new customers Low 15 #5: Develop a Hydraulic Schematic for IRWD’s sewage collection and treatment systems Low
*Recommendation numbers (i.e. #1, #2, etc.) are used throughout this section to link this table to more detailed discussion of each recommendation.
Much of the embedded energy plan relies on historic data obtained from IRWD staff. These data fall into several categories that are discussed in this section:
• Overall data management • Water flow through facilities • Energy consumption data
14 Note: the four pumps serving the region with the highest energy and cost intensity (thus the highest recommended surcharge) had no flow data. Flow was estimated by Navigant.

Page 49 Irvine Ranch Water District Embedded Energy Plan
• Historic water use billing data • Demand forecast tool
9.1.1 Overall Data Management
A facility account mapping serves as a master list of all facilities including their address, description, associated energy account numbers, associated flow data identifiers, and system. IRWD staff searched internally for a comprehensive list that provided all of this information in one location. A list was produced that provided all electric meter numbers, addresses, and a partial list of facility descriptions. A key missing piece was the link to flow data. IRWD staff had to manually match energy data to flow datasets using the addresses listed on SCE account numbers and IRWD flow datasets. This manual process was reviewed by Navigant and IRWD staff to ensure matching was consistent and logical. Through this process, several issues arose that the team corrected. A final QC process by the Navigant team was required to cross-reference the addresses with a GIS map of IRWD facilities. This overall process was time and labor intensive and led to some delays in the project schedule. Lessons learned can improve the process in the future. Recommendation 1: Use Atlas ID to identify facilities across all IRWD information systems and data sets Database best practice prescribes having a single unique identifier for each facility (or process within a facility). While Navigant used the SCE electric account number, this system is neither perfect nor complete. IRWD already has the Atlas ID system, which further identifies the system that each facility is a part of. This unique identifier is already used in IRWD’s GIS system and hydraulic models to identify and locate each facility. Flow data provided to Navigant did not use Atlas ID but rather a physical address and a facility description which required manual matching. Using the Atlas ID to manage flow data would link data automatically to the correct facility. Furthermore, linking flow data to Atlas IDs could enable use of flow data in IRWD hydraulic models. Recommendation 2: Maintain a database that links Atlas IDs to SCE account numbers Navigant started the process of linking Atlas IDs to SCE account numbers while conducting the Historical Embedded Energy Analysis. This linking was done to fill gaps where necessary; however, the list should be updated and completed when possible. This would allow future analysis to easily link a facility’s energy use to all other identifying information that IRWD maintains for each facility. It was determined that there were a few facilities that received new SCE electric meters over time. Because SCE Electric meter data was linked to facility addresses and an incomplete set of facility names, the new and old electric meters were not readily recognized as being linked to the same facility. Linking the electric meter number to an Atlas ID would furthermore allow full histories to be developed for facilities that may have undergone renovations.

Page 50 Irvine Ranch Water District Embedded Energy Plan
Recommendation 3: Digitize field measurements of flow data on a regular basis Based on discussions with IRWD staff, the water distribution data had significant gaps within the study period because the computer server that stored this data crashed. Hard copy records replaced missing electronic data where possible; however, hard copy records did not cover the entire study period (hard copy records covered 2012 and 2013). These hard copy records were developed through monthly field monitoring of pump stations. Digitizing these hard copy data took considerable time and effort. Regularly digitizing these field records would save time and effort in future study updates. Furthermore, digitized field data can be used to cross reference against automatically collected SCADA data to ensure accuracy of the SCADA system. Recommendation 4: Maintain a common flow database Navigant received flow data in four data sets: water supply, water distribution, sewage treatment plants (one set for each plant), and lift stations. Placing and maintaining these four flow data sets in one location would allow better QC methods and more easily allow identification of data gaps. Recommendation 5: Develop a hydraulic schematic for IRWD’s sewage collection and treatment systems Navigant heavily relied on IRWD’s hydraulic schematics of its potable and non-potable water systems in the spatial embedded energy estimates task. These schematics were developed by AKM Consulting Engineers in 2014. A similar schematic does not exist for IRWD’s sewage system. Analysis relied on IRWD’s current sewer collection system hydraulic model (InfoSewer, by Innovyze). The sewer model sufficed for the analysis; however, standardized schematics across all of IRWD’s system would be helpful in communications and overall understanding of IRWD’s system. Recommendation 6: Update descriptions of facilities Creating a standardized naming convention for descriptions of facility could also alleviate confusion.. Examples where this would alleviate confusion:
• Confusion can arise facilities from other providers are incorporated into IRWD’s system. For example, LAWRP’s distribution zone numbers were offset from IRWD’s system, so when Lake Forest pump stations were incorporated into IRWD’s system, IRWD had to identify the LAWRP zones in the name as well as the IRWD zones that water was being pumped from and to.
• The term “Irvine Desalter Project” (IDP) refers both to a treatment facility and to a series of groundwater wells that feed this facility.
• Harvard Avenue Trunk Sewer (HATS) is both a trunk line that is fed sewage from a distinct region and a facility that is used to divert (pump) sewage to IRWD’s Michelson Water Reclamation Plant.
This recommendation is being listed as low priority because if IRWD is able to link all facilities to an Atlas ID, facility descriptions will not need to be relied upon.

Page 51 Irvine Ranch Water District Embedded Energy Plan
9.1.2 Water Flow through Facilities
Monthly water flow data for each facility was provided to the Navigant team in four data sets: water supply, water distribution, sewage treatment plants (one set for each plant), and lift stations. Each of these data sources had varying levels of data quality and availability. Recommendation 7: Collect missing flow data for treatment facilities Water supply flow data was complete for the entire study period and was relatively well documented. Flow through water treatment plants was not always documented. One particular case was the Treatment Facility for Wells 21 and 22. Flow for the individual wells was available but outflow from the treatment plant had to be estimated. Recommendation 8: Collect missing flow data for distribution facilities to better inform surcharge estimates Water distribution flow data included potable and non-potable distribution pumps. Flow data was approximately 40% complete for the study period and was completely missing for the years 2010-2011. Several pumps had no flow data available. Additionally, several existing pump stations were not listed in IRWD’s flow data set. The following pump stations were missing flow data.
• Coastal Zone 4 Pump Station • Crystal Cove Zone 2-4 Pump Station • Culver and Bonita Zone 1-3 Pump Station • Fleming Pump Station • Read Pump Station • Sand Canyon Zone A Facilities • Shaw Pump Station • Williams Canyon Pump Station
The last four facilities listed above (Read, Sand Canyon, Shaw, and Williams Canyon) serve high elevation regions in Santiago Canyon. Energy intensities and cost intensities for these four pump stations were estimated by Navigant using differences in head pressure in the zones being pumped from and to. These estimates strongly influence the pumping surcharge calculated for the Santiago Canyon area (a region in which the highest potable surcharge was estimated). More accurate data for these pumps would better support the high surcharges calculated for customers in these regions. If there are meters on these facilities, data collection schedules should be implemented immediately. If meters do not yet exist for these facilities, flow meters should be installed and data collection should begin. Recommendation 9: Improve submetering of flow and energy at sewage treatment plants Sewage treatment plant flow data was submetered for each major process much like electricity was submetered for LAWRP and MWRP. Over 90% of this data during the study period was available. Flow data was not always lined up to the exact process that this study was isolating, thus the Navigant team (with guidance and input from IRWD staff) adjusted flow data sets to match the necessary processes. In

Page 52 Irvine Ranch Water District Embedded Energy Plan
several cases one electric submeter represented the energy use for multiple processes and flows. This required proportioning the electric submetered data further to individual processes. Table 14 and Table 15 illustrate how submetered electric data matches to submetered flow data for MWRP and LAWRP (the process names are listed as provided by IRWD). They do not necessarily represent the values used to calculate EI, but the actual processes being metered. Two specific recommendations that could improve future embedded energy analysis:
• Electrically submeter the pumps that feed sewage to OCSD. At present, there are two pumps that are included within the primary and secondary treatment processes. As IRWD treats more of its own sewer flows and sends less sewage to OCSD, the energy use of these pumps could change.
• Zone A is fed by two sources of water: LAWRP and water from Zone B. Submetering the outflow from LAWRP into Zone A would be helpful in future analyses.
Table 14: MWRP Submeter Matching
Set Submetered Electric Process Names Flow Process Names 1 (Primary*0.43) + (Secondary*0.87) MWRP Inflow
2 Tertiary - UV
MWRP to Tertiary Treatment U.V.
3 Recl. Pump MWRP Recycled Water
4 Primary*0.57 MWRP Sewage Discharge (to OCSD)
5 Secondary*0.13 MWRP MPS-3 Sludge Flows treated at OCSD
6 Admin
N/A Marsh
Source: IRWD staff.
Table 15: LAWRP Submeter Matching
Set Submetered Electric Process Names Flow Process Names
1 LAWRP ZONE 'A' RECYCLE EFF. LAWRP ZONE 'A' RECYCLE EFF.*
2 LAWRP ZONE 'B' RECYCLE EFF. LAWRP ZONE 'B' RECYCLE EFF.
3 SOCWA Comb. Pumping
LAWRP SECONDARY EFF. TO ACOO
SGU to ACOO Eff. Q PTP to ACOO Eff. Q
4 Tertiary Treatment - 5 Solids Handling - 6 Secondary Treatment Plant Inf. Q 7 Pond-5 Effluent Pumping -
*Note: This flow data contained non-potable flow not generated at LAWRP Source: IRWD staff.

Page 53 Irvine Ranch Water District Embedded Energy Plan
Diagramming flows through sewage treatment processes in each plant would be useful in future embedded energy analyses. Sewer flows diverted to OCSD are a major cost driver to IRWD. Mapping when and where OCSD diversion occurs, how much flow at what level of treatment is being diverted, and what processes that sewage has gone through are especially important for future updates. Because IRWD has the potential to reduce flows to OCSD in the future, better information on the location and quality of these diversions is important. Recommendation 10: Collect missing flow data for lift stations Lift station flow data included sewer lift stations as well as sewer diversions such as the Harvard Avenue Trunk Sewer (HATS) pump. Lift station data was approximately 48% complete for the study period.
• No flow data was available for any lift station from 2005-2006 • Flow data was completely missing for four lift stations:
o Newport Coast Lift Station o Buck Gully Lift Station o Monticito/Via Burrone Lift Station o San Joaquin Lift Station
Lift stations are relatively low energy use facilities. Nevertheless, they should be considered as part of a data collection program. Recommendation 11: Record and standardize units of measurement for flow data Units for flow data provided were often inconsistent among facilities, even within the same system (e.g., potable water distribution pumps, non-potable distribution pumps, etc.). Water flow unit errors can misrepresent flow by orders of magnitude, which impacts energy intensity. Our recommendation is to standardize data collection process and the units that data is collected in. If flow meters at different facilities read in different units, data collection standardization processes should provide a units conversion step in the (digital) data entry process.
9.1.3 Energy Consumption Data
Except for a few unique cases, SCE energy meter data available to the team was almost 100% complete. This study collected SCE energy data from 2005 through 2013. This period of time does not need to be recollected in the future. Data stating in January 2014 will suffice. SCE account numbers can be used to link newly collected data to previously collected data. IRWD’s SCE account manager should be able to provide IRWD this data electronically for all IRWD-owned facilities. Natural gas data was available for the entire study period. Updated natural gas consumption data can be obtained from IRWD’s SCG account manager in electronic format.

Page 54 Irvine Ranch Water District Embedded Energy Plan
Recommendation 12: Submeter electricity for co-located pump stations Several pairs of pump stations are co-located (listed in Table 16), and thereby metered by a single SCE electric meter. South County 1-3 PS is one of the largest pump stations IRWD’s potable distribution system. The other two co-located pairs in Table 16 are both pairs of a potable and non-potable pump. Each facility in each co-located pair is likely to have a different set of operating parameters, efficiency, and head. All of these factors combined make it impossible to accurately allocate electric use between the two co-located facilities. Navigant estimates were made for the purposes of this study. Navigant recommends installing submeters so that data can be collected for each pump station separately.
Table 16: Co-located Pumps
Index Co-Located Pair Atlas ID SCE Electric Service
Account # Facility Description
1 1 DPS006 1116202 East Irvine Zone 3 Pump Station 2 1 DPS051 1116202 South County 1-3 PS 3 2 DPS013 12350158 Coastal Zone 7 Pump Station 4 2 RPS012 12350158 Coastal Zone H Pump Station 5 3 DPS033 29138686 PA6 Portola Springs Zone 4-6 PS 6 3 RPS019 29138686 PA6 Portola Springs Zone C-D PS
Source: Navigant analysis.
9.1.4 Historic Water Use Billing Data
Historic water billing data was used to analyze trends in customer water use over time. In the process, Navigant mapped customers to their location based to assist in spatial analysis. Recommendation 13: Maintain a link between old customer account numbers and new customer account numbers It is our understanding that IRWD has updated its customer account tracking system (to the point of even changing account numbers). Navigant’s past analysis uses the account number system as of 2013. If updates have been made, Navigant recommends the link between new and old account numbers are maintained within some database at IRWD. Historic participation in IRWD conservation programs were recorded using account numbers. Without a link from new to old account numbers the history of which customers installed which devices could be muddied. Recommendation 14: Update location data for new customers IRWD’s GIS database links customer accounts to their physical location. The location of each customer can be cross referenced with a map of the service areas geographic pressure zone (GPZs) and thus each customer account can be assigned to a GPZ. This database had more than 92% of customer mapped to a GPZ. Additional analysis by the Navigant team using billing address was able to increase the percent of customers mapped to 97%. Approximately 1,500 customer account numbers (out of more than 99,000 total

Page 55 Irvine Ranch Water District Embedded Energy Plan
accounts) are still not mapped to a GPZ. These unmapped accounts include 1,325 potable accounts and 190 non-potable accounts. It is our understanding that newer customer connections are those most likely to be unmapped. These customers are small in total number and represents an acceptable (and very low occurrence) of missing data. The small number unmapped accounts will have little impact on the study’s results. While having a “fully mapped” customer base for this study would be ideal, Navigant recommends these are updated when co-benefits (beyond just this study) can be found for investing IRWD’s staff time and effort.
9.1.5 Demand Forecast Tool
Parts of the embedded energy plan relied heavily on IRWD’s demand forecast tool (DFT). The DFT forecasts potable water use, non-potable water use, and sewer flows from each parcel in IRWD territory annual through 2035. Recommendation 15: Consider scenario analysis in the next update to the demand forecast tool The DFT results as provided to Navigant in November 2014 contained a single forecast for water use with no assumptions about varying hydrology. Navigant used this forecast as a business as usual scenario. In the development of the Future Embedded Energy Analysis, the Navigant team needed to develop additional demand scenarios to help understand the range of possible water demand futures. Possible variables that can affect future water demand forecasts include:
• Hydrologic conditions • Conservation and efficiency programs and messaging • New codes and standards • Retail water prices
Developing the range and impact of these variables for the purpose of this study took considerable IRWD staff effort. We recommend IRWD incorporate the impacts of these variables into the DFT during its next scheduled update. Enabling scenario analysis in the DFT would help standardize key water demand drivers across all of IRWD’s forecasting related studies. This could significantly reduce (but not completely eliminate) the need for additional custom scenario analysis for individual forecasting related studies.
9.2 Estimated Budget to Update Study A joint team of Navigant Consulting and HDR Engineering is highly capable and well positioned to update this study in the future as IRWD see fit. A detailed scope for updating the study can be found in the detailed technical report (Task 10). Conducting a “data refresh” update to the study is possible at a fraction of the cost of the original study. Much of the time invested in the first study was to develop and vet methodology with IRWD staff, develop data management strategies, link energy data to water data, and build the analysis infrastructure (spreadsheets and GIS tools) to conduct the necessary analysis. However, a significant portion of staff time was also spent processing and conducting quality control on the received data.

Page 56 Irvine Ranch Water District Embedded Energy Plan
We estimate the budget to conduct the above described scope in a single update study falls in the range of $80,000 to $160,000 based on Navigant and HDR 2015 billing rates. The exact budget depends on multiple factors described in the list below. Navigant and HDR can provide regular updates to the study if needed. IRWD staff should consider aligning an update schedule for the embedded energy plan with other IRWD efforts that are updated regularly (i.e. rate case, capital improvement plan, urban water management plan). Should annual updates to the study be planned, the first update is expected to take more effort than subsequent annual updates (discussed further below).
• The period of new data collection - The level of effort increases as more data is scoped into the update study. For example, adding just one year of new data requires less effort than adding multiple years of new data. Should annual updates be planned, it is expected the first update to the study will required addressing at least two years’ worth of new data (2014 and 2015) while subsequent updates will only need to handle one year of new data at a time. Thus the first update will require more effort than subsequent annual updates.
• The expected quality of new data - The level of effort decreases if IRWD staff implement recommendations outlined earlier in this document. Implementing higher priority recommendations would have a bigger impact on the quality of results and level of effort required for an update compared to lower priority recommendations.
• The scope of the update: o It’s possible that updates of the surcharge analysis are not needed every single year (if
annual updates to the study as a whole are being considered). Surcharge updates should be aligned with updates to IRWD rates.
o Level of effort will increase if new facilities or annexed regions are to be considered in future updates. These additions require minor re-programming of analysis files and possible major re-programming of the embedded energy tool (in the case of annexed regions).
• The start date for the update - the above estimated budget range is based on Navigant and HDR’s 2015 billing rates. If the update is to take place in some future year budget will be adjust to reflect appropriate rates.
• The timeline allotted for the update - Additional details on the timeline for an update project are needed to accurately estimate a budget.

Page 57 Irvine Ranch Water District Embedded Energy Plan
List of Technical Reports
The following technical reports are provided along with this summary report:
• Embedded Energy Plan - Task 2: Historic Embedded Energy Analysis • Embedded Energy Plan - Task 5: Water Use Analysis • Embedded Energy Plan - Task 8: Water Conservation Program Energy Savings and GHG
Emissions Savings • Embedded Energy Plan - Task 3: Future Embedded Energy Estimates • Embedded Energy Plan - Task 4 and 6: GIS Processing and Spatial Embedded Energy Estimates • Embedded Energy Plan - Task 7: Embedded Energy Management Tool • Embedded Energy Plan - Task 9: Pumping Surcharge Estimate • Embedded Energy Plan - Task 10: Updating the Plan
Related Documents