ASIAN DEVELOPMENT BANK ELECTRICITY CONSUMPTION, OUTPUT, AND TRADE IN BHUTAN Hooi Hooi Lean and Russell Smyth ADB SOUTH ASIA WORKING PAPER SERIES NO. 34 December 2014

Welcome message from author
This document is posted to help you gain knowledge. Please leave a comment to let me know what you think about it! Share it to your friends and learn new things together.
Transcript
ASIAN DEVELOPMENT BANK
ELECTRICITY CONSUMPTION, OUTPUT, AND TRADE IN BHUTANHooi Hooi Lean and Russell Smyth
ADB SOUTH ASIA WORKING PAPER SERIES
NO. 34
December 2014
��
ADB South Asia Working Paper Series ���������
Electricity Consumption, Output, and Trade in Bhutan � � �� � �Hooi Hooi Lean and Russell Smyth*
No. 34 �
Dr. Hooi Hooi Lean is an associate professor at the School of Social Sciences (Economics Program), Universiti Sains Malaysia.
Dr. Russell Smyth is Professor and Deputy Head of the Department of Economics, Monash University, Australia.
* We thank Sarah Carrington and anonymous reviewers for helpful suggestions on earlier versions of this paper.
����� �
ASIAN DEVELOPMENT BANK
Asian Development Bank 6 ADB Avenue, Mandaluyong City 1550 Metro Manila, Philippines www.adb.org
The views expressed in this publication are those of the author and do not necessarily reflect the views and policies of the Asian Development Bank (ADB) or its Board of Governors or the governments they represent.
ADB does not guarantee the accuracy of the data included in this publication and accepts no responsibility for any consequence of their use.
By making any designation of or reference to a particular territory or geographic area, or by using the term “country” in this document, ADB does not intend to make any judgments as to the legal or other status of any territory or area.
ADB encourages printing or copying information exclusively for personal and noncommercial use with proper acknowledgment of ADB. Users are restricted from reselling, redistributing, or creating derivative works for commercial purposes without the express, written consent of ADB.
Unless otherwise noted, “$” refers to US dollars.

CONTENTS
TABLES AND FIGURES ............................................................................................................................................... iv
ABSTRACT ........................................................................................................................................................................ v
1. INTRODUCTION .................................................................................................................................................. 1
2. BHUTAN CONTEXT ........................................................................................................................................... 1
3. EXISTING LITERATURE ................................................................................................................................... 2
4. DATA, MODELING STRATEGY, AND HYPOTHESES ........................................................................ 3
4.1 Production function ................................................................................................................................ 3
4.2 Data ............................................................................................................................................................... 3
4.3 Econometric modeling strategy .......................................................................................................... 7
4.4 Hypotheses relating to Granger causality ....................................................................................... 8
5. RESULTS ................................................................................................................................................................... 9
6. CONCLUSIONS .................................................................................................................................................. 12
REFERENCES .................................................................................................................................................................. 15
�� �
TABLES AND FIGURES
TABLES
1 Descriptive Statistics (ln) .................................................................................................................................... 4
2 Augmented Dickey–Fuller Unit Root Test ................................................................................................... 9
3 Johansen-Juselius Cointegration Test (for Equation 1) ........................................................................ 10
4 Normalized Long-Run Estimation (for Equation 2) ................................................................................ 10
5 VECM Short-Run Estimation Results (for Equation 3) ........................................................................... 11
6 Granger Causality Test (�2 Statistics) ......................................................................................................... 12
FIGURES
1a GDP at constant (2000) prices (ln) ................................................................................................................ 4
1b Gross fixed capital formation, constant (ln) ................................................................................................ 5
1c Labor force (in thousands) (ln) ........................................................................................................................ 5
1d GVA electricity and water, constant (ln) ...................................................................................................... 6
1e Trade, constant (ln) .............................................................................................................................................. 6
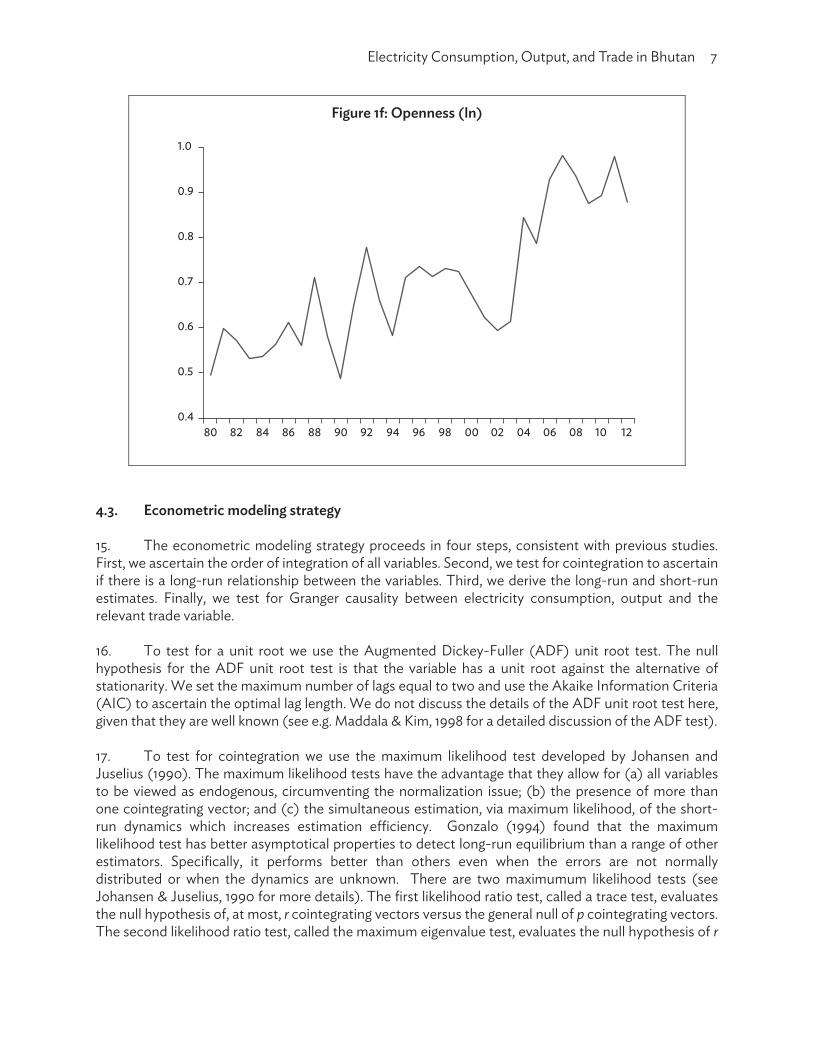
1f Openness (ln) ......................................................................................................................................................... 7
� �
ABSTRACT This paper examines the relationship between electricity consumption, international trade, and economic growth in Bhutan within an augmented production function framework. The main findings are that in the long run a 1% increase in electricity consumption generates 0.03%–0.05% increase in output. A 1% increase in total trade results in 0.5% increase in output. A 1% increase in trade openness results in 1% increase in output. We also find unidirectional Granger causality running from electricity consumption to economic growth. The implications of our findings are that Bhutan is energy-dependent and that it can promote economic growth through further investment in hydropower.
��

�1. INTRODUCTION 1. Hydropower is an important source of economic growth in Bhutan. As one scholar put it: “The development of a hydropower industry has been recognized as the primary driving force for the economic development for the country” (Dorji, 2007, p. 6). Almost all of Bhutan’s electricity is supplied by hydropower schemes and electricity from hydropower represents 12% of Gross Domestic Product (GDP) (Uddin et al, 2007). Bhutan is also heavily reliant on trade with India. India is Bhutan’s largest trading partner, accounting for 95% of Bhutan’s exports and 74% of its imports (Shneiderman & Turin, 2012). Bhutan has three hydropower plants in operation, and a fourth under construction, which are largely financed by India (Srinivasan, 2013). About 75% of electricity generated in Bhutan is exported to India in accordance with an export tariff bilaterally agreed between the countries (Singh, 2013) and electricity exports constitute 45% of Bhutan’s exports to India (Bisht, 2012). Revenue from the sale of electricity to India provides about 40% of national revenue in Bhutan (Singh, 2013). According to Bhutan’s Tenth Five Year Plan, the hydropower sector is expected to contribute 50% of GDP and 75% of fiscal revenue by 2020 (Bist, 2012). 2. Beginning with Narayan and Smyth (2009) there is a growing literature that examines the relationship between energy consumption, international trade and economic growth within an augmented production function framework (see e.g. Lean & Smyth, 2010a, 2010b; Sadorsky 2011, 2012; Shahbaz et al, 2013a). The purpose of this paper is to extend this literature to consider the specific case of Bhutan. We examine the relationship between electricity consumption in Bhutan, international trade between Bhutan and all other countries and economic growth in Bhutan. 3. We extend the existing literature on the relationship between energy consumption, international trade and economic growth in two directions. First, to this point, there are no studies that examine the nexus between energy consumption, international trade and economic growth in which the source of the energy consumption is a renewable energy supply. Existing studies have examined the relationship between renewable energy and economic growth in an augmented production function framework (see e.g. Apergis & Payne 2010a, 2010b, 2011, 2012; Payne & Taylor, 2010; Wolde-Rufael & Menyah, 2010). We extend these studies to include international trade in the augmented production function. 4. Second, in existing studies of the relationship between energy generated from hydropower (or other renewable energy sources), renewable energy typically represents only a very small fraction of the country’s total energy supply. Bhutan is an interesting extension to the literature on the relationship between electricity generated by hydropower and economic growth because it is one of the few countries in the world in which hydropower is the main source of electricity. 2. BHUTAN CONTEXT 5. Bhutan’s modernization commenced in the early 1960s with the establishment of basic infrastructure, such as power, roads and telecommunications (Dhakal et al, 2009; Uddin et al, 2007). In the period since, Bhutan has forged a middle path to development (Walcott, 2011), in which the focus has been on maximizing Gross National Happiness (GNH), rather than GDP (Brooks, 2013; Burns, 2011; Walcott 2011; Zurick 2006). The four pillars of GNH are sustainable and equitable social development, environmental conservation, promotion of culture and good governance. While Bhutan remains one of the least developed countries in the world, with almost a third of its
2 ADB South Asia Working Paper Series No. 34
population living below the poverty line, its middle path to development has generated robust economic growth (Dhakal et al, 2009; Uddin et al, 2007). Since the 1960s a wage-based exchange economy has developed from a nonmonetized traditional economy based almost solely on agriculture (Uddin et al, 2007). Over the last quarter century, agriculture as a percentage of GDP has decreased from 33.8% in 1991 to 15.9% in 2011 (World Bank, 2013). However, agriculture still accounts for 62% of employment (World Bank, 2013). 6. Bhutan has no significant reserves of fossil energy resources (oil, natural gas or petroleum), except for limited coal reserves in the southwest (Uddin et al, 2007). Bhutan’s energy mix consists primarily of fuel wood and hydropower. Overall, 99.5% of electricity is generated from hydropower with the remaining share generated from diesel power generating plants (Bist, 2012). Bhutan’s recent robust economic growth is attributable to the development of its hydropower sector, with hydropower projects, such as Chukha (336 MW), Krichu (60 MW) and Tala (1020 MW) implemented with financial and technical assistance from India. Bhutan has four major river systems (the Ammochu, the Wangchu, the Sankosh and the Mansa), which means it is well endowed to harness hydropower from run-of-the-river plants (Uddin et al, 2007). However, despite the importance of the contribution of electricity from hydropower to economic development in Bhutan, it is estimated that Bhutan currently only taps 5% of its hydropower potential (Singha, 2011). 7. The electricity generated from Chukha, Krichu and Tala is exported to India, after meeting the internal demand of Bhutan. Eighty per cent of Bhutan’s trade is with India and, as discussed in the introduction, exports of electricity to the Indian grid constitute just under one half of Bhutan exports to India. Electricity from hydropower represents not only an important traded good between Bhutan and India, but figures as a key feature in the Bhutan-India bilateral relationship (Bisht, 2012). 3. EXISTING LITERATURE 8. Voluminous literatures exist on the relationship between energy consumption and economic growth and between economic growth and trade (see Ahmad, 2001; Giles & Williams, 2000; Ozturk, 2010; Payne, 2010). Studies that examine the relationship between energy consumption, trade and economic growth using a single augmented production function model are relatively recent (see e.g. Lean & Smyth, 2010a, 2010b; Narayan & Smyth, 2009; Sadorsky 2011, 2012; Shahbaz et al, 2013a). Overall, the findings from these studies provide mixed support for the export-led and handmaiden hypotheses and competing hypotheses concerning the relationships between energy consumption and economic growth and between energy consumption and trade. 9. Several studies exist for South Asian countries that examine the relationship between economic growth and international trade (see e.g. Bahamani-Oskooee & Alse, 1993; Chandra, 2002, 2003; Dhawan & Biswal, 1999; Dodaro, 1993; Jimenz & Razmi, 2013; Jung & Marshall, 1985; Love & Chandra, 2004a, 2004b; 2005). The evidence from these studies on the export-led and handmaiden hypotheses, however, is mixed. Moreover, none of these studies consider the specific case of Bhutan. 10. Similarly, there are a number of studies for South Asian countries that examine the relationship between energy consumption and economic growth (Akhmat & Zaman, 2013; Mudakkar et al, 2013; Pradhan, 2010; Shahbaz et al, 2012; Singha, 2011; Wolde-Rufael, 2010; Zaman et al, 2011). Some of these studies have examined the relationship between renewable or alternative energy consumption and economic growth (Akhmat & Zaman, 2013; Shahbaz et al, 2012; Wolde-Rufael, 2010). A subset of these
Electricity Consumption, Output, and Trade in Bhutan 3
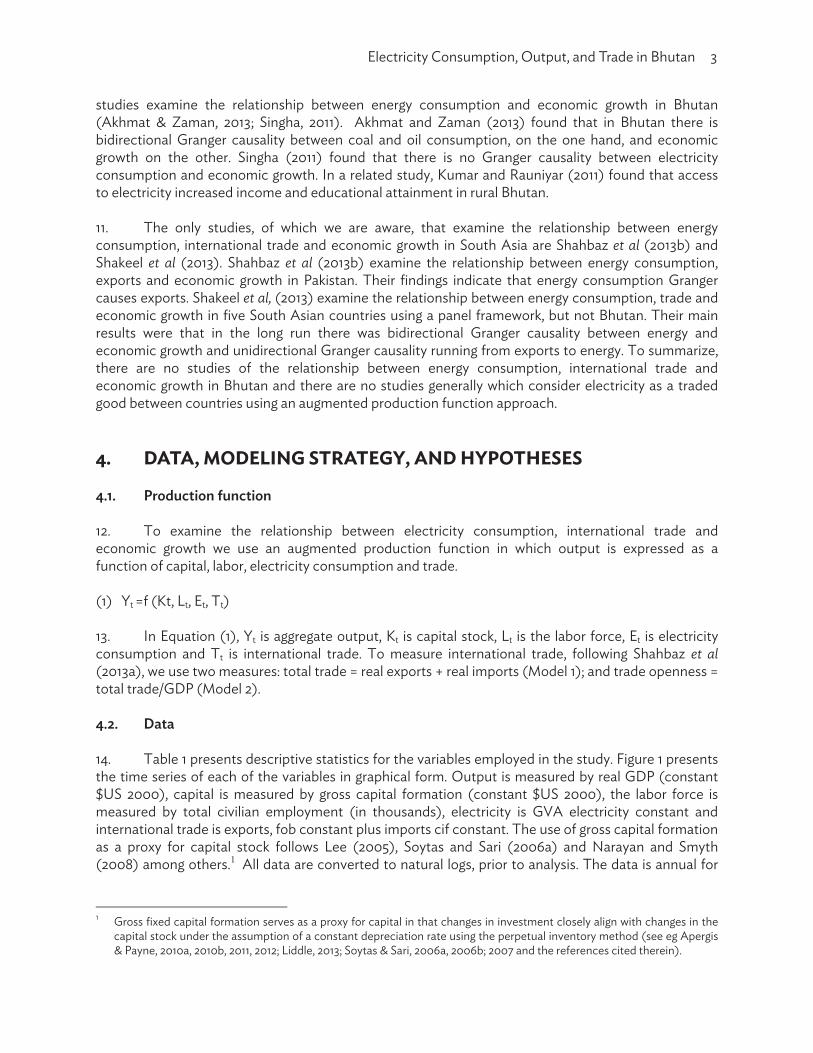
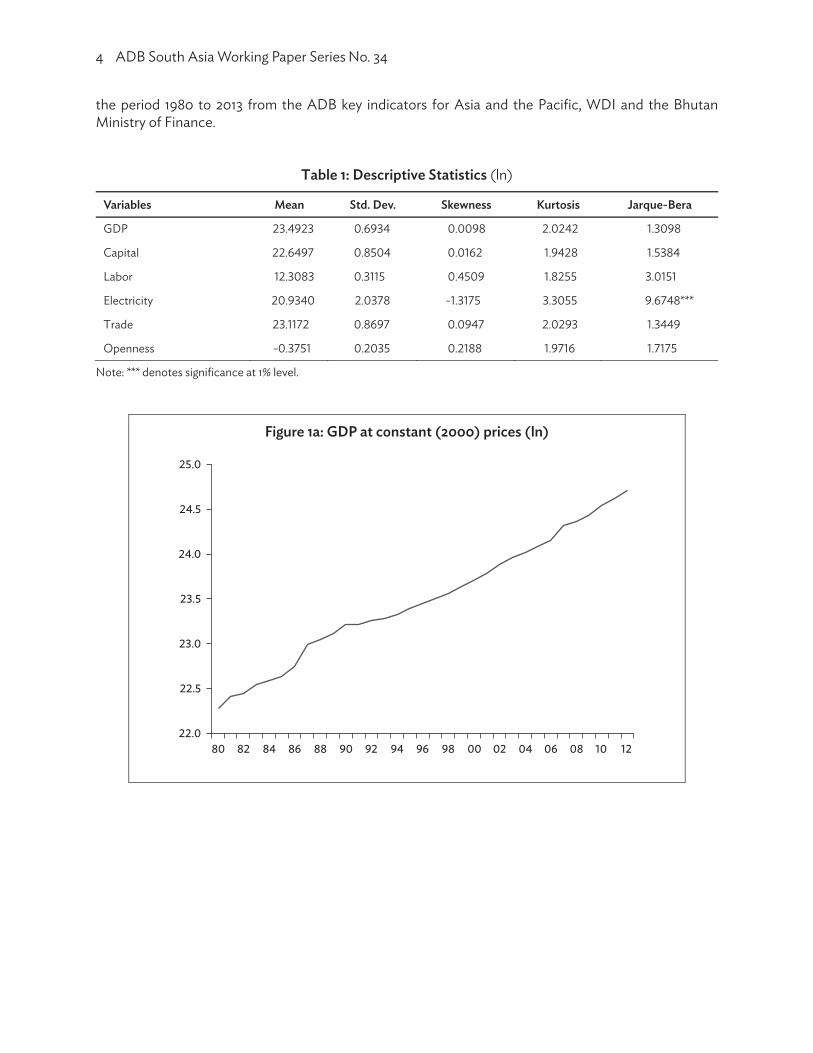
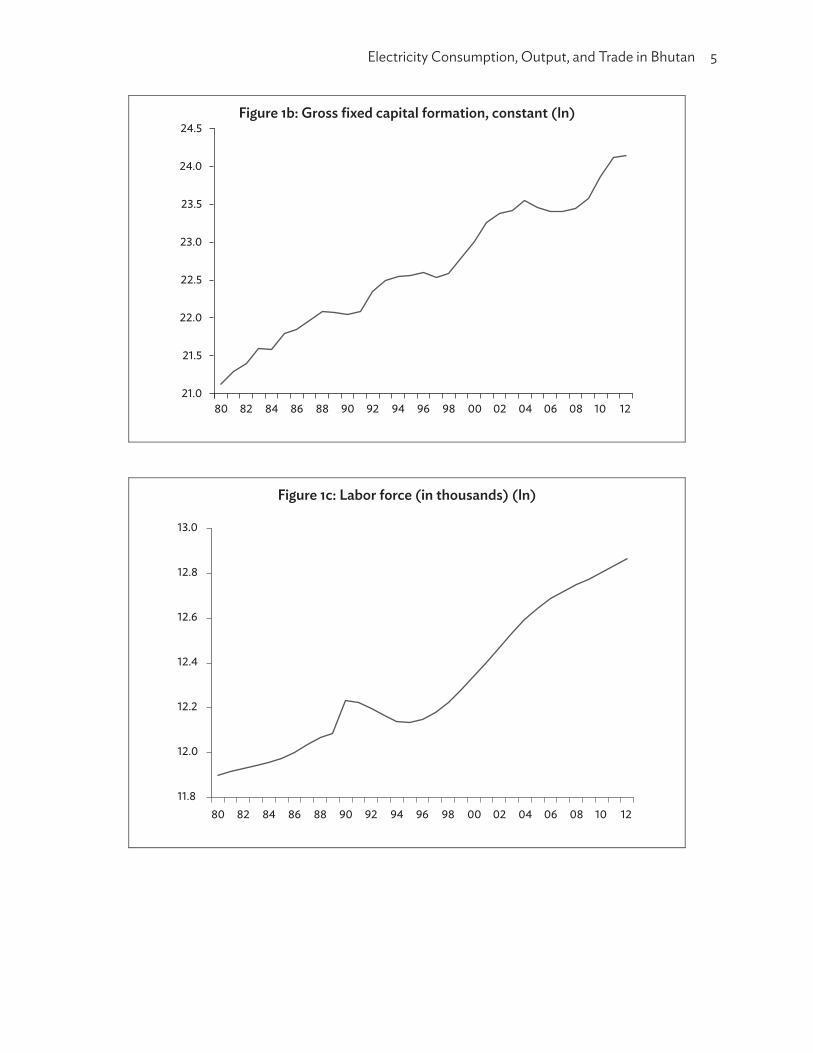
studies examine the relationship between energy consumption and economic growth in Bhutan (Akhmat & Zaman, 2013; Singha, 2011). Akhmat and Zaman (2013) found that in Bhutan there is bidirectional Granger causality between coal and oil consumption, on the one hand, and economic growth on the other. Singha (2011) found that there is no Granger causality between electricity consumption and economic growth. In a related study, Kumar and Rauniyar (2011) found that access to electricity increased income and educational attainment in rural Bhutan. 11. The only studies, of which we are aware, that examine the relationship between energy consumption, international trade and economic growth in South Asia are Shahbaz et al (2013b) and Shakeel et al (2013). Shahbaz et al (2013b) examine the relationship between energy consumption, exports and economic growth in Pakistan. Their findings indicate that energy consumption Granger causes exports. Shakeel et al, (2013) examine the relationship between energy consumption, trade and economic growth in five South Asian countries using a panel framework, but not Bhutan. Their main results were that in the long run there was bidirectional Granger causality between energy and economic growth and unidirectional Granger causality running from exports to energy. To summarize, there are no studies of the relationship between energy consumption, international trade and economic growth in Bhutan and there are no studies generally which consider electricity as a traded good between countries using an augmented production function approach. 4. DATA, MODELING STRATEGY, AND HYPOTHESES 4.1. Production function 12. To examine the relationship between electricity consumption, international trade and economic growth we use an augmented production function in which output is expressed as a function of capital, labor, electricity consumption and trade. (1) Yt =f (Kt, Lt, Et, Tt) 13. In Equation (1), Yt is aggregate output, Kt is capital stock, Lt is the labor force, Et is electricity consumption and Tt is international trade. To measure international trade, following Shahbaz et al (2013a), we use two measures: total trade = real exports + real imports (Model 1); and trade openness = total trade/GDP (Model 2). 4.2. Data 14. Table 1 presents descriptive statistics for the variables employed in the study. Figure 1 presents the time series of each of the variables in graphical form. Output is measured by real GDP (constant $US 2000), capital is measured by gross capital formation (constant $US 2000), the labor force is measured by total civilian employment (in thousands), electricity is GVA electricity constant and international trade is exports, fob constant plus imports cif constant. The use of gross capital formation as a proxy for capital stock follows Lee (2005), Soytas and Sari (2006a) and Narayan and Smyth (2008) among others.� All data are converted to natural logs, prior to analysis. The data is annual for ��������������������������������������������������������1 Gross fixed capital formation serves as a proxy for capital in that changes in investment closely align with changes in the
capital stock under the assumption of a constant depreciation rate using the perpetual inventory method (see eg Apergis & Payne, 2010a, 2010b, 2011, 2012; Liddle, 2013; Soytas & Sari, 2006a, 2006b; 2007 and the references cited therein).
4 ADB South Asia Working Paper Series No. 34
the period 1980 to 2013 from the ADB key indicators for Asia and the Pacific, WDI and the Bhutan Ministry of Finance.
Table 1: Descriptive Statistics (ln)
Variables Mean Std. Dev. Skewness Kurtosis Jarque-Bera
GDP 23.4923 0.6934 0.0098 2.0242 1.3098
Capital 22.6497 0.8504 0.0162 1.9428 1.5384
Labor 12.3083 0.3115 0.4509 1.8255 3.0151
Electricity 20.9340 2.0378 -1.3175 3.3055 9.6748***
Trade 23.1172 0.8697 0.0947 2.0293 1.3449
Openness -0.3751 0.2035 0.2188 1.9716 1.7175
Note: *** denotes significance at 1% level.
Figure 1a: GDP at constant (2000) prices (ln)
�
22.0
22.5
23.0
23.5
24.0
24.5
25.0
80 82 84 86 88 90 92 94 96 98 00 02 04 06 08 10 12
Electricity Consumption, Output, and Trade in Bhutan 5
Figure 1b: Gross fixed capital formation, constant (ln)
Figure 1c: Labor force (in thousands) (ln)
�
21.0
21.5
22.0
22.5
23.0
23.5
24.0
24.5
80 82 84 86 88 90 92 94 96 98 00 02 04 06 08 10 12
11.8
12.0
12.2
12.4
12.6
12.8
13.0
80 82 84 86 88 90 92 94 96 98 00 02 04 06 08 10 12
6 ADB South Asia Working Paper Series No. 34
Figure 1d: GVA electricity and water, constant (ln)
Figure 1e: Trade, constant (ln)
�
16
17
18
19
20
21
22
23
24
80 82 84 86 88 90 92 94 96 98 00 02 04 06 08 10 12
21.5
22.0
22.5
23.0
23.5
24.0
24.5
25.0
80 82 84 86 88 90 92 94 96 98 00 02 04 06 08 10 12
Electricity Consumption, Output, and Trade in Bhutan 7
Figure 1f: Openness (ln)
4.3. Econometric modeling strategy 15. The econometric modeling strategy proceeds in four steps, consistent with previous studies. First, we ascertain the order of integration of all variables. Second, we test for cointegration to ascertain if there is a long-run relationship between the variables. Third, we derive the long-run and short-run estimates. Finally, we test for Granger causality between electricity consumption, output and the relevant trade variable. 16. To test for a unit root we use the Augmented Dickey-Fuller (ADF) unit root test. The null hypothesis for the ADF unit root test is that the variable has a unit root against the alternative of stationarity. We set the maximum number of lags equal to two and use the Akaike Information Criteria (AIC) to ascertain the optimal lag length. We do not discuss the details of the ADF unit root test here, given that they are well known (see e.g. Maddala & Kim, 1998 for a detailed discussion of the ADF test). 17. To test for cointegration we use the maximum likelihood test developed by Johansen and Juselius (1990). The maximum likelihood tests have the advantage that they allow for (a) all variables to be viewed as endogenous, circumventing the normalization issue; (b) the presence of more than one cointegrating vector; and (c) the simultaneous estimation, via maximum likelihood, of the short-run dynamics which increases estimation efficiency. Gonzalo (1994) found that the maximum likelihood test has better asymptotical properties to detect long-run equilibrium than a range of other estimators. Specifically, it performs better than others even when the errors are not normally distributed or when the dynamics are unknown. There are two maximumum likelihood tests (see Johansen & Juselius, 1990 for more details). The first likelihood ratio test, called a trace test, evaluates the null hypothesis of, at most, r cointegrating vectors versus the general null of p cointegrating vectors. The second likelihood ratio test, called the maximum eigenvalue test, evaluates the null hypothesis of r
0.4
0.5
0.6
0.7
0.8
0.9
1.0
80 82 84 86 88 90 92 94 96 98 00 02 04 06 08 10 12
8 ADB South Asia Working Paper Series No. 34
cointegrating vectors against the alternative of (r +1) cointegrating vectors. We use the AIC to determine lag length. Because we have annual data, for Equation 1 we set the maximum number of lags equal to two (see Johansen & Juselius, 1990). Because the number of time series observations is short, in Equation 2 we use one lag. 18. If the likelihood ratio test establishes the existence of a long-run relationship between the variables we can estimate the long run parameters. The long-run multivariate models corresponding to Equation (1) is as follows: (2) Yt = � + �1 Kt + �2 Lt + �3 Et + �4 Tt + ut
19. If cointegration exists between the variables, this forms the basis for the specification of the vector error correction model (VECM). We are interested in the VECM for the augmented production function, in which GDP is the dependent variable. If there is a long run relationship between the series, shocks will result in disequilibrium in the short-run before the series return to their long-run equilibrium. This is captured in the error-correction term (ECT), calculated from the long run cointegrating vector. The short run model corresponding to Equation (1) is as follows:
(3) � � � � � �
� � � � �
m m m m m
t i t i i t i i t i i t i i t i t ti i i i i
Y Y K L E T EC T� � � � � � � �� � � � � �� � � � �
� � � � � �
20. To test for Granger causality we use the modified version of Granger causality, proposed by Toda and Yamamoto (1995) and Dolado and Lutkepohl (1996) (hereafter, the TYDL approach). The TYDL approach uses a modified Wald test for restrictions on the parameters of the VAR(k) model. The test has an asymptotic chi-square distribution with k degrees of freedom in the limit when VAR[k + dmax] is estimated, where dmax is the maximal order of integration for the series in the system. Following Dolado and Lutkepohl (1996), we use dmax = 1 as it performs better than other orders of dmax. The optimal lag length, k, is selecting using the SBC. 4.4. Hypotheses relating to Granger causality 21. There are three competing hypotheses concerning the relationship between electricity consumption, international trade and GDP. The first set of hypotheses concerns the relationship between electricity consumption and GDP. The competing hypotheses are that there is unidirectional Granger causality running from electricity consumption to GDP; unidirectional Granger causality running from GDP to electricity consumption; bidirectional Granger causality between these variables or no Granger causality in either direction (Mehrara, 2007). If there is unidirectional Granger causality running from GDP to electricity consumption or no Granger causality in either direction, reducing electricity consumption will have little or no adverse effect on aggregate output. On the other hand, if unidirectional Granger causality runs from electricity consumption to GDP, reducing electricity consumption in the market could lead to a fall in income, while increases in electricity consumption contribute to aggregate output. If there is bidirectional Granger causality between the variables, this is suggestive of an energy-dependent economy in which there are feedback effects between electricity consumption and aggregate output. 22. The second set of competing hypotheses concerns the causal relationship between exports/trade and GDP. The export-led hypothesis states that Granger causality runs from exports to GDP. There are several possible reasons why Granger causality might run from exports to GDP
Electricity Consumption, Output, and Trade in Bhutan 9
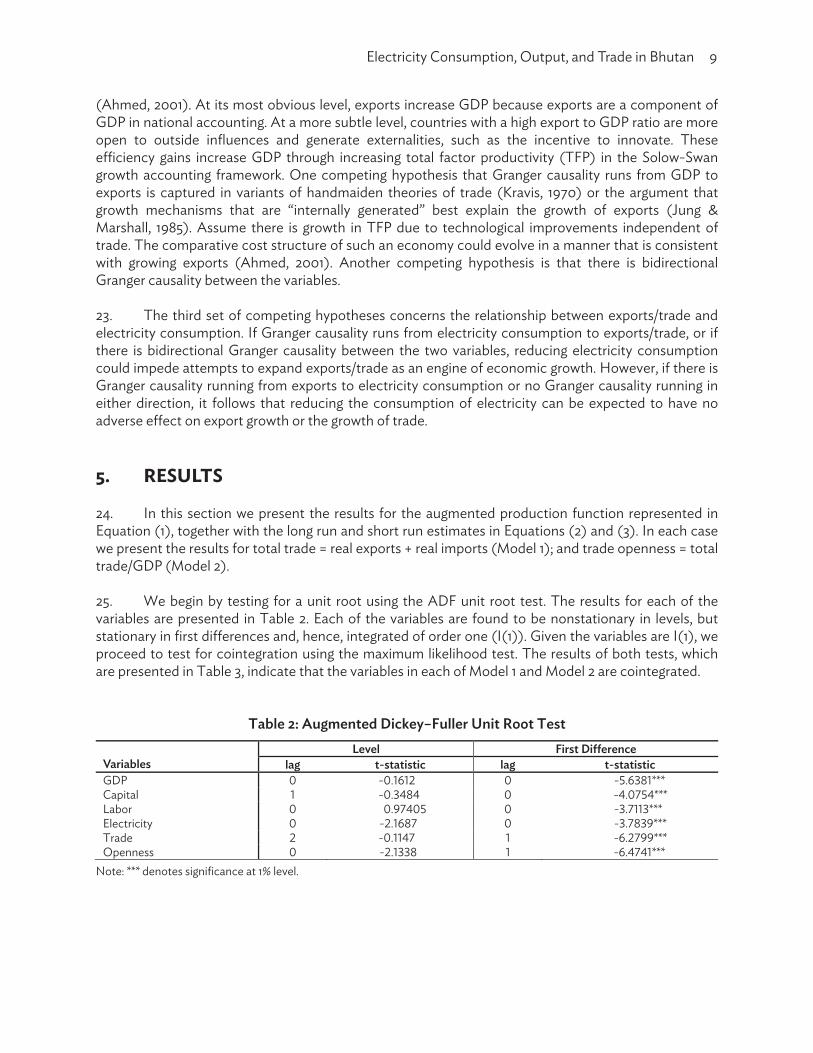
(Ahmed, 2001). At its most obvious level, exports increase GDP because exports are a component of GDP in national accounting. At a more subtle level, countries with a high export to GDP ratio are more open to outside influences and generate externalities, such as the incentive to innovate. These efficiency gains increase GDP through increasing total factor productivity (TFP) in the Solow-Swan growth accounting framework. One competing hypothesis that Granger causality runs from GDP to exports is captured in variants of handmaiden theories of trade (Kravis, 1970) or the argument that growth mechanisms that are “internally generated” best explain the growth of exports (Jung & Marshall, 1985). Assume there is growth in TFP due to technological improvements independent of trade. The comparative cost structure of such an economy could evolve in a manner that is consistent with growing exports (Ahmed, 2001). Another competing hypothesis is that there is bidirectional Granger causality between the variables. 23. The third set of competing hypotheses concerns the relationship between exports/trade and electricity consumption. If Granger causality runs from electricity consumption to exports/trade, or if there is bidirectional Granger causality between the two variables, reducing electricity consumption could impede attempts to expand exports/trade as an engine of economic growth. However, if there is Granger causality running from exports to electricity consumption or no Granger causality running in either direction, it follows that reducing the consumption of electricity can be expected to have no adverse effect on export growth or the growth of trade. 5. RESULTS 24. In this section we present the results for the augmented production function represented in Equation (1), together with the long run and short run estimates in Equations (2) and (3). In each case we present the results for total trade = real exports + real imports (Model 1); and trade openness = total trade/GDP (Model 2). 25. We begin by testing for a unit root using the ADF unit root test. The results for each of the variables are presented in Table 2. Each of the variables are found to be nonstationary in levels, but stationary in first differences and, hence, integrated of order one (I(1)). Given the variables are I(1), we proceed to test for cointegration using the maximum likelihood test. The results of both tests, which are presented in Table 3, indicate that the variables in each of Model 1 and Model 2 are cointegrated.
Table 2: Augmented Dickey–Fuller Unit Root Test Variables
Level First Difference lag t-statistic lag t-statistic
GDP 0 -0.1612 0 -5.6381***Capital 1 -0.3484 0 -4.0754***Labor 0 0.97405 0 -3.7113***Electricity 0 -2.1687 0 -3.7839***Trade 2 -0.1147 1 -6.2799***Openness 0 -2.1338 1 -6.4741***
Note: *** denotes significance at 1% level. �
10 ADB South Asia Working Paper Series No. 34
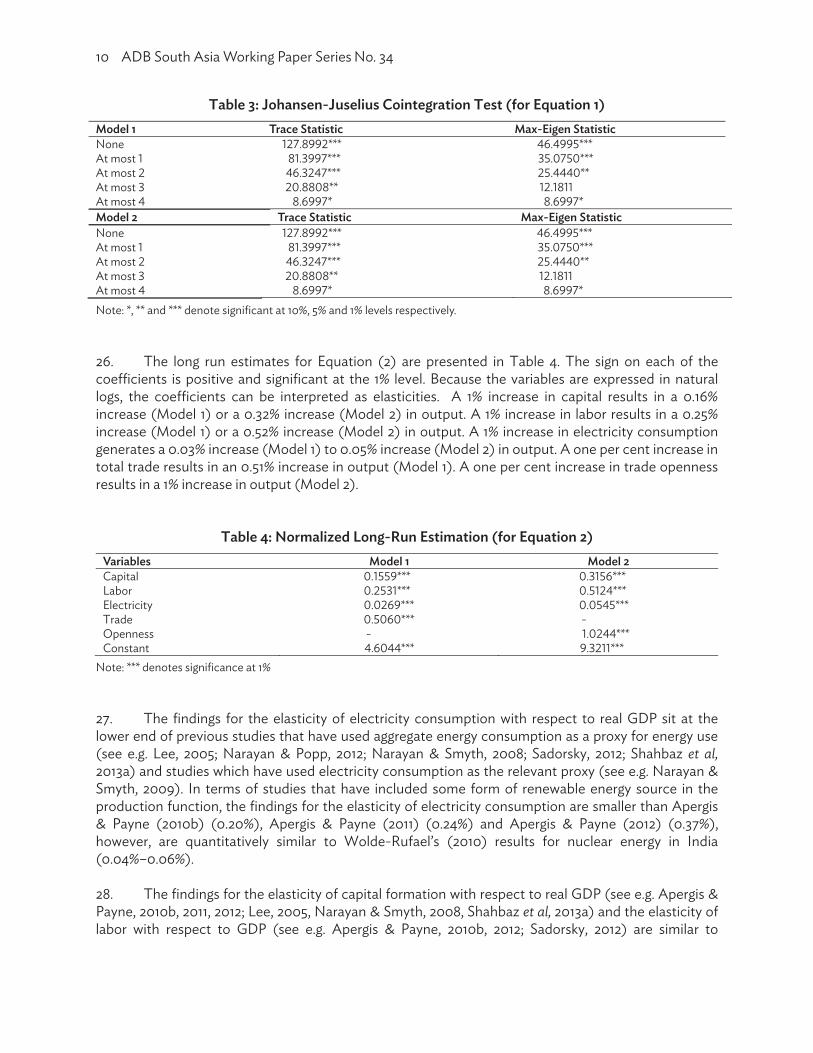
Table 3: Johansen-Juselius Cointegration Test (for Equation 1) Model 1 Trace Statistic Max-Eigen Statistic None 127.8992*** 46.4995*** At most 1 81.3997*** 35.0750*** At most 2 46.3247*** 25.4440** At most 3 20.8808** 12.1811 At most 4 8.6997* 8.6997* Model 2 Trace Statistic Max-Eigen Statistic None 127.8992*** 46.4995*** At most 1 81.3997*** 35.0750*** At most 2 46.3247*** 25.4440** At most 3 20.8808** 12.1811 At most 4 8.6997* 8.6997* Note: *, ** and *** denote significant at 10%, 5% and 1% levels respectively. 26. The long run estimates for Equation (2) are presented in Table 4. The sign on each of the coefficients is positive and significant at the 1% level. Because the variables are expressed in natural logs, the coefficients can be interpreted as elasticities. A 1% increase in capital results in a 0.16% increase (Model 1) or a 0.32% increase (Model 2) in output. A 1% increase in labor results in a 0.25% increase (Model 1) or a 0.52% increase (Model 2) in output. A 1% increase in electricity consumption generates a 0.03% increase (Model 1) to 0.05% increase (Model 2) in output. A one per cent increase in total trade results in an 0.51% increase in output (Model 1). A one per cent increase in trade openness results in a 1% increase in output (Model 2).
Table 4: Normalized Long-Run Estimation (for Equation 2) Variables Model 1 Model 2 Capital 0.1559*** 0.3156*** Labor 0.2531*** 0.5124*** Electricity 0.0269*** 0.0545*** Trade 0.5060*** - Openness - 1.0244*** Constant 4.6044*** 9.3211***
Note: *** denotes significance at 1% 27. The findings for the elasticity of electricity consumption with respect to real GDP sit at the lower end of previous studies that have used aggregate energy consumption as a proxy for energy use (see e.g. Lee, 2005; Narayan & Popp, 2012; Narayan & Smyth, 2008; Sadorsky, 2012; Shahbaz et al, 2013a) and studies which have used electricity consumption as the relevant proxy (see e.g. Narayan & Smyth, 2009). In terms of studies that have included some form of renewable energy source in the production function, the findings for the elasticity of electricity consumption are smaller than Apergis & Payne (2010b) (0.20%), Apergis & Payne (2011) (0.24%) and Apergis & Payne (2012) (0.37%), however, are quantitatively similar to Wolde-Rufael’s (2010) results for nuclear energy in India (0.04%–0.06%). 28. The findings for the elasticity of capital formation with respect to real GDP (see e.g. Apergis & Payne, 2010b, 2011, 2012; Lee, 2005, Narayan & Smyth, 2008, Shahbaz et al, 2013a) and the elasticity of labor with respect to GDP (see e.g. Apergis & Payne, 2010b, 2012; Sadorsky, 2012) are similar to
Electricity Consumption, Output, and Trade in Bhutan 11
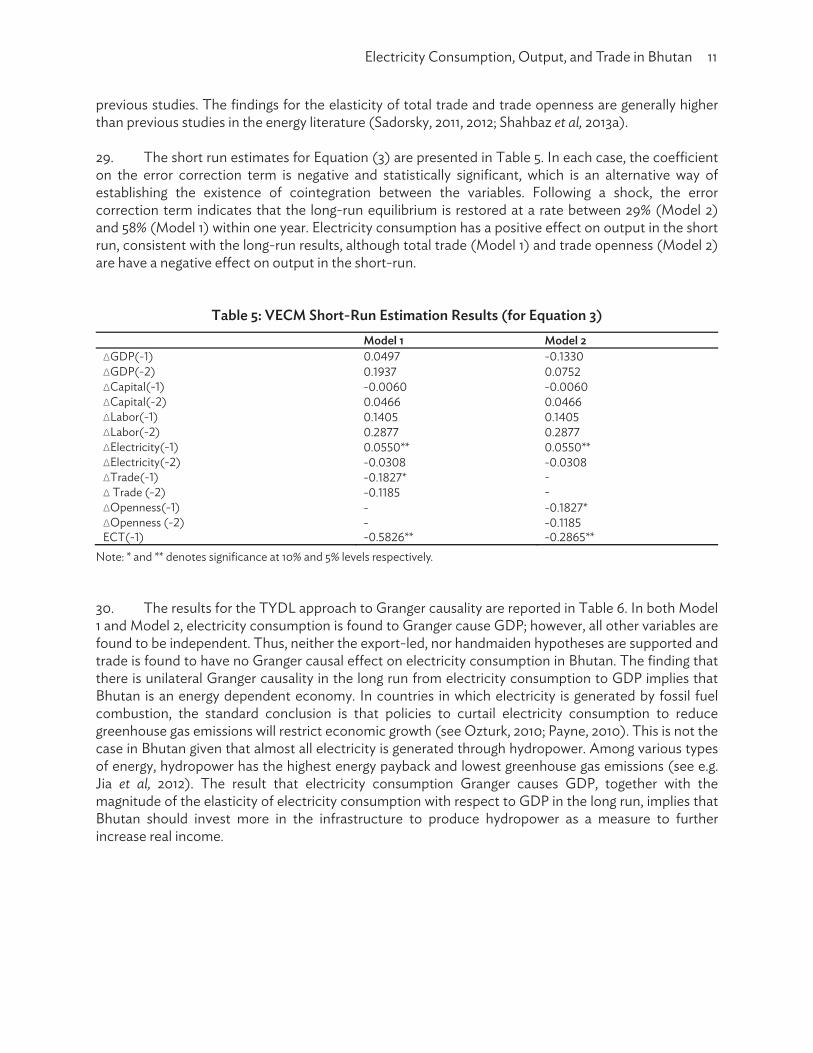
previous studies. The findings for the elasticity of total trade and trade openness are generally higher than previous studies in the energy literature (Sadorsky, 2011, 2012; Shahbaz et al, 2013a). 29. The short run estimates for Equation (3) are presented in Table 5. In each case, the coefficient on the error correction term is negative and statistically significant, which is an alternative way of establishing the existence of cointegration between the variables. Following a shock, the error correction term indicates that the long-run equilibrium is restored at a rate between 29% (Model 2) and 58% (Model 1) within one year. Electricity consumption has a positive effect on output in the short run, consistent with the long-run results, although total trade (Model 1) and trade openness (Model 2) are have a negative effect on output in the short-run.�
Table 5: VECM Short-Run Estimation Results (for Equation 3) Model 1 Model 2 �GDP(-1) 0.0497 -0.1330 �GDP(-2) 0.1937 0.0752 �Capital(-1) -0.0060 -0.0060 �Capital(-2) 0.0466 0.0466 �Labor(-1) 0.1405 0.1405 �Labor(-2) 0.2877 0.2877 �Electricity(-1) 0.0550** 0.0550** �Electricity(-2) -0.0308 -0.0308 �Trade(-1) -0.1827* -� Trade (-2) -0.1185 -�Openness(-1) - -0.1827* �Openness (-2) - -0.1185 ECT(-1) -0.5826** -0.2865**
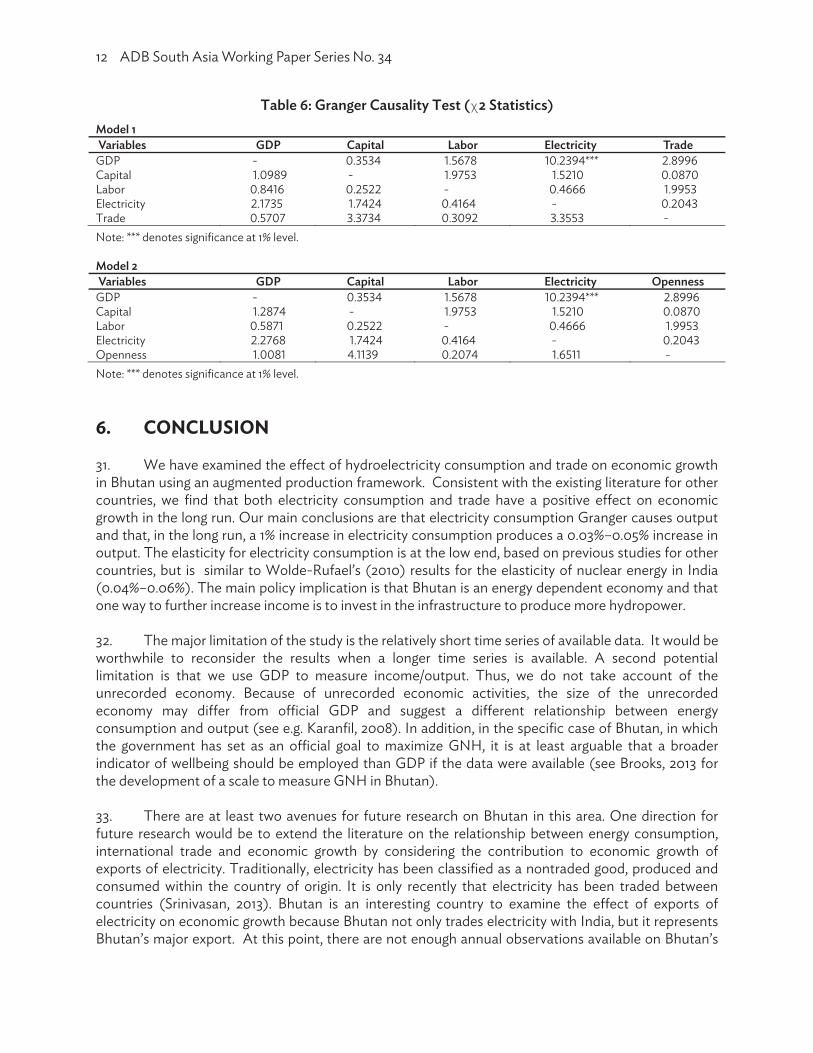
Note: * and ** denotes significance at 10% and 5% levels respectively. 30. The results for the TYDL approach to Granger causality are reported in Table 6. In both Model 1 and Model 2, electricity consumption is found to Granger cause GDP; however, all other variables are found to be independent. Thus, neither the export-led, nor handmaiden hypotheses are supported and trade is found to have no Granger causal effect on electricity consumption in Bhutan. The finding that there is unilateral Granger causality in the long run from electricity consumption to GDP implies that Bhutan is an energy dependent economy. In countries in which electricity is generated by fossil fuel combustion, the standard conclusion is that policies to curtail electricity consumption to reduce greenhouse gas emissions will restrict economic growth (see Ozturk, 2010; Payne, 2010). This is not the case in Bhutan given that almost all electricity is generated through hydropower. Among various types of energy, hydropower has the highest energy payback and lowest greenhouse gas emissions (see e.g. Jia et al, 2012). The result that electricity consumption Granger causes GDP, together with the magnitude of the elasticity of electricity consumption with respect to GDP in the long run, implies that Bhutan should invest more in the infrastructure to produce hydropower as a measure to further increase real income. �
12 ADB South Asia Working Paper Series No. 34
Table 6: Granger Causality Test (�2 Statistics) Model 1 Variables GDP Capital Labor Electricity TradeGDP - 0.3534 1.5678 10.2394*** 2.8996Capital 1.0989 - 1.9753 1.5210 0.0870Labor 0.8416 0.2522 - 0.4666 1.9953Electricity 2.1735 1.7424 0.4164 - 0.2043Trade 0.5707 3.3734 0.3092 3.3553 -Note: *** denotes significance at 1% level. Model 2 Variables GDP Capital Labor Electricity OpennessGDP - 0.3534 1.5678 10.2394*** 2.8996Capital 1.2874 - 1.9753 1.5210 0.0870Labor 0.5871 0.2522 - 0.4666 1.9953Electricity 2.2768 1.7424 0.4164 - 0.2043Openness 1.0081 4.1139 0.2074 1.6511 -Note: *** denotes significance at 1% level. 6. CONCLUSION 31. We have examined the effect of hydroelectricity consumption and trade on economic growth in Bhutan using an augmented production framework. Consistent with the existing literature for other countries, we find that both electricity consumption and trade have a positive effect on economic growth in the long run. Our main conclusions are that electricity consumption Granger causes output and that, in the long run, a 1% increase in electricity consumption produces a 0.03%–0.05% increase in output. The elasticity for electricity consumption is at the low end, based on previous studies for other countries, but is similar to Wolde-Rufael’s (2010) results for the elasticity of nuclear energy in India (0.04%–0.06%). The main policy implication is that Bhutan is an energy dependent economy and that one way to further increase income is to invest in the infrastructure to produce more hydropower. 32. The major limitation of the study is the relatively short time series of available data. It would be worthwhile to reconsider the results when a longer time series is available. A second potential limitation is that we use GDP to measure income/output. Thus, we do not take account of the unrecorded economy. Because of unrecorded economic activities, the size of the unrecorded economy may differ from official GDP and suggest a different relationship between energy consumption and output (see e.g. Karanfil, 2008). In addition, in the specific case of Bhutan, in which the government has set as an official goal to maximize GNH, it is at least arguable that a broader indicator of wellbeing should be employed than GDP if the data were available (see Brooks, 2013 for the development of a scale to measure GNH in Bhutan). 33. There are at least two avenues for future research on Bhutan in this area. One direction for future research would be to extend the literature on the relationship between energy consumption, international trade and economic growth by considering the contribution to economic growth of exports of electricity. Traditionally, electricity has been classified as a nontraded good, produced and consumed within the country of origin. It is only recently that electricity has been traded between countries (Srinivasan, 2013). Bhutan is an interesting country to examine the effect of exports of electricity on economic growth because Bhutan not only trades electricity with India, but it represents Bhutan’s major export. At this point, there are not enough annual observations available on Bhutan’s
Electricity Consumption, Output, and Trade in Bhutan 13
electricity exports to India to perform, a meaningful analysis, but this issue should be revisited in a few years time when more time series observations become available. 34. A second direction for future research would be to add one or more other variables, in addition to energy and trade, in the augmented production function. The obvious additional variable to include would be tourism. Bhutan has placed a lot of emphasis on developing a “high value low volume” sustainable tourism industry. Tourism and hydropower are the two main industries supporting Bhutan’s economy (Singha, 2013). Using an augmented production function which includes energy consumption and tourism on the right hand side is a recent development in the literature (see Tang & Abosedra, 2014). Studying this combination of variables in the Bhutanese case, given both industries figure so prominently in the Bhutanese economy, would be a useful extension of the literature on the energy–output nexus. ��

�REFERENCES* Ahmad, J. (2001). Causality between exports and economic growth: What do the econometric studies
tell us? Pacific Economic Review 6: 147-167. Akhmat, G., Zaman, K. (2013). Nuclear energy consumption, commercial energy consumption and
economic growth in South Asia: Bootstrap panel causality test. Renewable and Sustainable Energy Reviews 25: 552-559.
Apergis, N., Payne, J.E. (2010a). Renewable energy consumption and growth in Eurasia. Energy
Economics 32: 1392-1397. Apergis, N., Payne, J.E. (2010b). Renewable energy consumption and economic growth: Evidence from
a panel of OECD countries. Energy Policy 38: 656-660. Apergis, N., Payne, J.E. (2011). The renewable energy consumption-growth nexus in Central America.
Applied Energy 88: 343-347. Apergis, N., Payne, J.E. (2012). Renewable and non-renewable energy consumption-growth nexus:
Evidence from a panel error correction model. Energy Economics 34: 733-738. Bahmani-Oskooee, M., Alse, J. (1993). Export growth and economic growth: An application of
cointegration and error-correction modelling. Journal of developing Areas 27: 535-542. Bist, M. (2012). Bhutan-India power cooperation: Benefits beyond bilateralism. Strategic Analysis 36:
787-803. Brooks, J. (2013). Avoiding the Limits to Growth: Gross National Happiness in Bhutan as a model for
sustainable development. Sustainability 5: 3640-3664. Burns, G.W. (2011). Gross National Happiness: A Gift from Bhutan to the world. In R. Biswas-Diener
(Ed.) Positive Psychology as Social Change. Berlin: Springer Science + Business Media, pp. 73-87.
Chandra, R. (2002). Export growth and economic growth: An investigation of causality in India. Indian
Economic Journal 49: 64-73. Chandra, R. (2003). Reinvestigating export-led growth in India using a multivariate cointegration
framework. Journal of Developing Areas 37: 73-86. Dhakal, D., Pradhan, G., Upadhyaya, K.P. (2009). Nepal and Bhutan: Economic growth in two Shangri-
las. International Journal of Social Economics 36: 124-137. Dhawan, U., Biswal, B. (1999). Re-examining the export-led growth hypothesis: A multivariate
cointegration analysis for India. Applied Economics 31: 525-530. ��������������������������������������������������������* ADB recognizes “China” as the People’s Republic of China.
16 References
Dodaro, S. (1993). Exports and growth: A reconsideration of causality. Journal of Developing Areas 27: 227-244.
Dolado, JJ., Lutkepohl, H. (1996). Making Wald tests work for the cointegrated VAR system.
Econometric Reviews 15: 369-386. Dorji, P.K. (2007). The sustainable management of micro hydropower systems for rural electrification:
The case of Bhutan. MSc (Environmental Science) thesis, Humboldt State University, California, USA.
Giles, J.A., Williams, C.L. (2000). Export-led growth: A survey of the literature and some non-causality
results, Part 1. Journal of International Trade and Economic Development 9: 261-337. Gonzalo, J. (1994). Five alternative methods of estimating long-run equilibrium relationships. Journal
of Econometrics 60(1-2): 203-233. Jia, J., Punys, P., Ma, J. (2012). Hydropower. In W.Y. Chen, J. Seiner, T, Suzuki and M. Lackner (Eds.)
Handbook of Climate Change Mitigation. Berlin: Springer Science + Business Media, pp. 1357-1401.
Jimenez, G.H. (2013). Can Asia sustain an export-led growth strategy in the aftermath of the global
crisis? Exploring a neglected aspect. Journal of Asian Economics 29: 45-61. Johansen, S., Juselius, K. (1990). Maximum likelihood estimation and inference on cointegration, with
applications to the demand for money. Oxford Bulletin of Economics and Statistics 52: 169-210 Jung, S.W., Marshall, P.J. (1985). Exports, growth and causality in developing countries. Journal of
Development economics 18: 1-12. Karanfil, F. (2008). Energy consumption and economic growth revisited: Does the size of the
unrecorded economy matter? Energy Policy 36, 3029-3035. Kumar, S., Rauniyar, G. (2011). Is electrification welfare improving? Non-experimental evidence from
rural Bhutan. MPRA Working Paper No. 31482. Kravis, I.B. (1970). Trade as a handmaiden of growth: Similarities between the nineteenth and
twentieth centuries. Economic Journal 80: 850-872. Lean, HH., Smyth, R. (2010a). Multivariate Granger causality between electricity generation, exports,
prices and GDP in Malaysia. Energy 35: 3640-3648. Lean, HH., Smyth, R (2010b). On the dynamics of aggregate output, electricity consumption and
exports in Malaysia: evidence from multivariate Granger causality tests. Applied Energy 87: 1963-1971.
Lee, C.C. (2005). Energy consumption and GDP in developing countries: a cointegrated panel analysis.
Energy Economics 27: 415-427.
References 17
Liddle, B. (2013). The importance of energy quality in energy intensive manufacturing: Evidence from panel cointegration and panel FMOLS. Energy Economics 34: 1810-1825.
Love, J., Chandra, R. (2004a). Testing export-led growth in India, Pakistan and Sri Lanka using a
multivariate framework. Manchester School 72: 483-496. Love, J., Chandra, R. (2004b). Testing export-led growth in Bangladesh in a multivariate VAR
framework. Journal of Asian Economics 15: 1155-1168. Love, J., Chandra, R. (2005). Testing export-led growth in South Asia. Journal of Economic Studies 32:
132-145. Mehrara, M. 2007. Energy consumption and economic growth: The case of oil exporting countries.
Energy Policy 35: 2939-2945. Mudakkar, S.R., Zaman, K., Shakir, H., Arif, M., Naseen, I and Naz, L. (2013). Determinants of energy
consumption function in SAARC countries: Balancing the odds. Renewable and Sustainable Energy Reviews 28: 566-574.
Narayan, P.K. and Popp, S. (2012). The energy consumption-real GDP nexus revisited: empirical
evidence from 93 countries. Economic Modeling 29: 303-308. Narayan, P.K. and Smyth, R. (2008). Energy consumption and real GDP in G7 countries: new evidence
from panel cointegration with structural breaks. Energy Economics 30: 2331-2341. Narayan, P.K. and Smyth, R. (2009). Multivariate granger causality between electricity consumption,
exports and GDP: Evidence from a panel of Middle Eastern countries. Energy Policy 39: 229-236.
Ozturk, I. (2010). A literature survey on the energy-growth nexus. Energy Policy 38: 340-349. Payne, J.E. (2010). A survey of the electricity consumption-growth literature. Applied Energy 87: 723-
731. Payne, J.E. and Taylor, J.P. (2010). Nuclear energy consumption and economic growth in the US: An
empirical note. Energy Sources, Part B: Economics, Planning and Policy 5: 301-307. Pradhan, R.P. (2010). Energy consumption-growth nexus in SSARC countries using cointegration and
error-correction model. Modern Applied Science 4: 74-90. Sadorsky, P. (2011). Trade and energy consumption in the Middle East. Energy Economics 33: 739-749. Sadorsky, P. (2012). Energy consumption, output and trade in South America. Energy Economics 34:
475-488. Shneiderman, S., Turin, M. (2012). Nepal and Bhutan in 2011: Cautious optimism. Asian Survey 52: 138-
146.
18 References
Shahbaz, M., Khan, S., Tahir, M.I. (2013a). The dynamic links between energy consumption, economic growth, financial development and trade in China: Fresh evidence from multivariate framework analysis. Energy Economics 40: 8-21.
Shahbaz, M., Lean, H. H., Farooq, A. (2013b). Natural gas consumption and economic growth in
Pakistan. Renewable & Sustainable Energy Reviews 18: 87-94. Shahbaz, M., Zeshan, M., Afza, T. (2012). Is energy consumption effective to spur economic growth in
Pakistan? New evidence from bounds test to level relationships and Granger causality tests. Economic Modelling 29: 2310-2319.
Shakeel, M., Iqbal, M.M., Majeed, M.T. (2013). Energy consumption, trade and GDP: A case study of
South Asian countries. Working Paper, School of Economics, Quaid-i-Azam University, Islamabad, Pakistan.
Singh, B.K. (2013). South Asia energy security: Challenges and opportunities. Energy Policy 63: 458-468. Singha, K. (2011). Power sector and economic development in the Himilayan kingdom of Bhutan: An
observation. Asia Pacific Journal of Social Science 2: 29-43. Singha, K. (2013). Tourism, environment and economic growth in the Himalayan kingdom of Bhutan. In
S. Nautiyal et al (Ed.) Knowledge Systems of Societies for Adaptation and Mitigation of Impacts of Climate Change, Springer-Verlag Berlin Heidelberg, pp. 651-667.
Soytas, U. and Sari, R, (2006a). Energy consumption and income in G7 countries. Journal of Policy
Modeling 28: 739-750. Soytas, U. and Sari, R. (2006b). Can China contribute more to the fight against global warming? Journal
of Policy Modeling 28: 837-846. Soytas, U. and Sari, R. (2007). The relationship between energy and production: evidence from Turkish
manufacturing industry. Energy Economics 29: 1151-1165. Srinivasan, S. (2013). Electricity as a traded good. Energy Policy 62: 1048-1052. Tang, CF., Abosedra, S. (2014). The impacts of tourism, energy consumption and political instability on
economic growth in the MENA countries. Energy Policy 68, 458-464. Toda, H.Y., Yamamoto, T. (1995). Statistical inference in vector autoregressions wiyj possibly
integrated process. Journal of Econometrics 66: 225-250. Uddin, S.N., Taplin, R., Yu, X. (2007). Energy, environment and development in Bhutan. Renewable
and Sustainable Energy Reviews 11: 2083-2103. Walcott, S.M. (2011). One of a kind: Bhutan and the modernity challenge. National identities. National
Identities 13: 253-265. Wolde-Rufael, Y. (2010). Bounds test approach to cointegration and causality between nuclear energy
and economic growth in India. Energy Policy 38: 52-58.
References 19
Wolde-Rufael, Y., Menyah, K. (2010). Nuclear energy consumption and economic growth in nine
developed countries. Energy Economics 32: 550-556. World Bank (2013). World Development Indicators, Washington DC: World Bank. Zaman, K., Khan, MM., Saleem, Z. (2011). Bivariate cointegration between energy consumption and
development factors: A case study of Pakistan. International Journal of Green Energy 8: 820-833.
Zurick, D. (2006). Gross National Happiness and environmental status in Bhutan. Geographical
Review 96: 657-681.
ASIAN DEVELOPMENT BANK6 ADB Avenue, Mandaluyong City1550 Metro Manila, Philippineswww.adb.org
Electricity Consumption, Output, and Trade in Bhutan
This paper examines the relationship between electricity consumption, international trade, and economic growth in Bhutan within an augmented production function framework. The main findings are that in the long run, (i) a 1% increase in electricity consumption generates 0.03%–0.05% increase in output, (ii) a 1% increase in total trade results in 0.5% increase in output, and (iii) a 1% increase in trade openness results in 1% increase in output. A unidirectional Granger causality running from electricity consumption to economic growth was found. The implications of the findings are that Bhutan is energy-dependent and it can promote economic growth through further investment in hydropower.
About the Asian Development Bank
ADB’s vision is an Asia and Pacific region free of poverty. Its mission is to help its developing member countries reduce poverty and improve the quality of life of their people. Despite the region’s many successes, it remains home to approximately two-thirds of the world’s poor: 1.6 billion people who live on less than $2 a day, with 733 million struggling on less than $1.25 a day. ADB is committed to reducing poverty through inclusive economic growth, environmentally sustainable growth, and regional integration.
Based in Manila, ADB is owned by 67 members, including 48 from the region. Its main instruments for helping its developing member countries are policy dialogue, loans, equity investments, guarantees, grants, and technical assistance.
Related Documents