Natural mating in Nile tilapia (Oreochromis niloticus L.) Implications for reproductive success, inbreeding and cannibalism Yonas Fessehaye

Welcome message from author
This document is posted to help you gain knowledge. Please leave a comment to let me know what you think about it! Share it to your friends and learn new things together.
Transcript
Natural mating in Nile tilapia (Oreochromis niloticus L.)
Implications for reproductive success, inbreeding and
cannibalism
Yonas Fessehaye
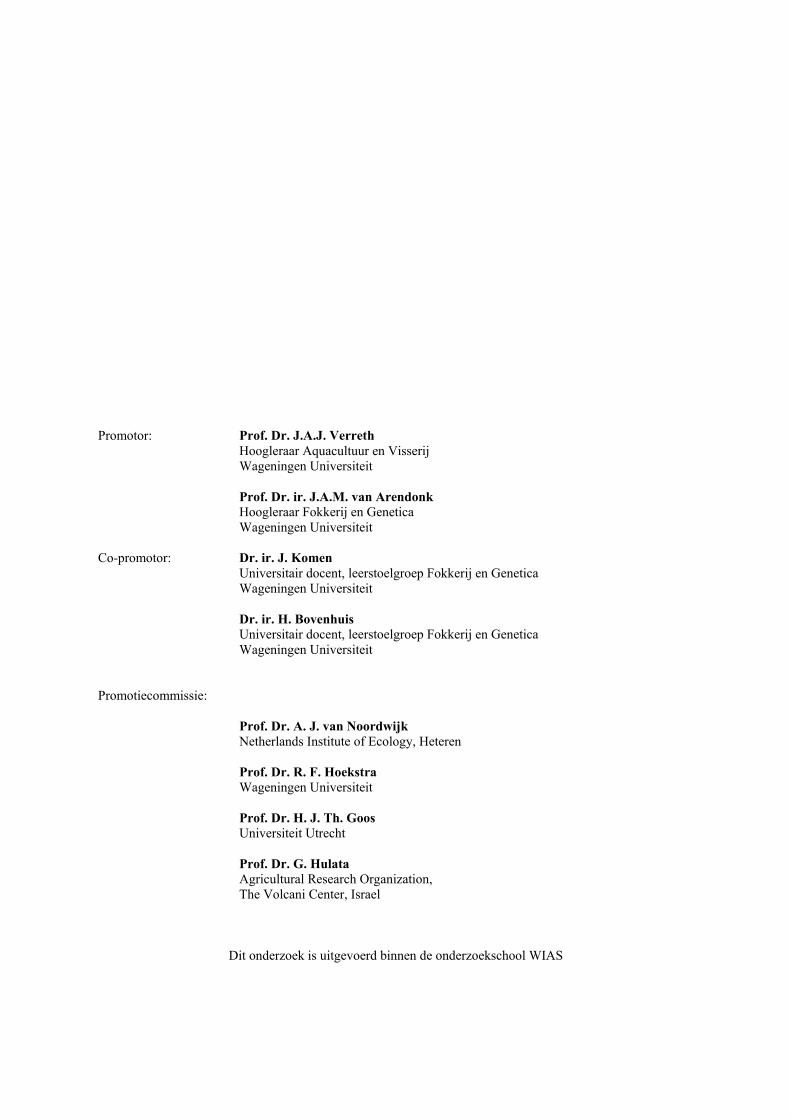
Promotor: Prof. Dr. J.A.J. Verreth Hoogleraar Aquacultuur en Visserij Wageningen Universiteit Prof. Dr. ir. J.A.M. van Arendonk
Hoogleraar Fokkerij en Genetica Wageningen Universiteit Co-promotor: Dr. ir. J. Komen Universitair docent, leerstoelgroep Fokkerij en Genetica Wageningen Universiteit Dr. ir. H. Bovenhuis
Universitair docent, leerstoelgroep Fokkerij en Genetica Wageningen Universiteit Promotiecommissie: Prof. Dr. A. J. van Noordwijk
Netherlands Institute of Ecology, Heteren Prof. Dr. R. F. Hoekstra
Wageningen Universiteit Prof. Dr. H. J. Th. Goos
Universiteit Utrecht Prof. Dr. G. Hulata
Agricultural Research Organization, The Volcani Center, Israel
Dit onderzoek is uitgevoerd binnen de onderzoekschool WIAS
Natural mating in Nile tilapia (Oreochromis niloticus L.)
Implications for reproductive success, inbreeding and
cannibalism
Yonas Fessehaye
Proefschrift
Ter verkrijging van de graad van doctor
Op gezag van rector magnificus
Van Wageningen Universiteit,
Prof. Dr. M.J. Kropff,
In het openbaar te verdedigen
Op maandag 11 december 2006
Des namiddags te half twee in de Aula.
Fessehaye, Y.
Natural mating in Nile tilapia (Oreochromis niloticus L.)
Implications for reproductive success, inbreeding and cannibalism
PhD thesis, Wageningen University, 2006
With summary in English and Dutch
ISBN: 90-8504-540-1

To my parents:
Fessehaye and Ghidey Ghebreyesus

Contents
Chapter 1 General Introduction 9
Chapter 2 Mating systems and male reproductive success in Nile tilapia
(Oreochromis niloticus) in breeding hapas: A microsatellite
analysis 21
Chapter 3 Effects of inbreeding on survival, body weight and fluctuating
asymmetry (FA) in Nile tilapia, Oreochromis niloticus 43
Chapter 4 Effects of inbreeding and sex ratio on reproductive success in
mass-spawning of Nile tilapia, Oreochromis niloticus 63
Chapter 5 Prediction of cannibalism in juvenile Oreochromis niloticus based
on predator to prey weight ratio; and effects of age and stocking
density 87
Chapter 6 General Discussion 107
Summary (English) 131
Samenvatting (Dutch) 137
Acknowledgements 143
List of Publications 145
Training and Supervision Plan 147
Curriculum vitae 148


Chapter 1
General Introduction

General Introduction
11
1. Tilapia in aquaculture
Tilapia is the third most cultured fish, after carps and salmonids. In the last decade, the
production of farmed tilapia has shown a tremendous increase jumping from 383,654 metric
tons in 1990 to 1,505,804 metric tons in 2002. The value of farmed tilapia has also witnessed
a great increase during the past two decades, going from US$154 million in 1984 to
US$1800.7 million in 2002 (El-Sayed, 2006). About 16 tilapiine species have been used for
aquaculture production out of which ten species are commercially farmed (FAO, 2004).
Since 1984, global tilapia production is dominated by three species: the Nile tilapia
Oreochromis niloticus (L.), the Mozambique tilapia Oreochromis mossambicus (Peters) and
the blue tilapia Oreochromis aureus (Steindachner) (Rana, 1997). Today Nile tilapia, by far,
is the most important farmed tilapia species, representing more than 80% of total tilapia
production.
2. Selective breeding in Nile tilapia
Both small-scale and commercial production of tilapia is rapidly expanding in many
countries. While remarkable progress has been made in improving the productivity of crops
and livestock in the last three to four decades through breeding and selection, it is only in the
last few decades that efforts have been made to harness the benefits of genetic improvement
in fish. In Nile tilapia, different selection strategies such as mass selection (Tave and
Smitherman, 1980; Hulata et al., 1986; Teichert-Coddington and Smitherman, 1988), within
family selection (Bolivar and Newkirk, 2002) and combined within- and between family
selection (e.g. ‘Genetic Improvement of Farmed Tilapias’ (GIFT) project: Eknath et al.,
1993) have been used to improve growth. In the GIFT breeding programme, selective
breeding in five consecutive generations resulted in a cumulative genetic improvement of
85% compared to the base population (Dey and Gupta, 2000). Most other breeding
programmes were merely used to generate few generations of selection response and to
estimate genetic parameters. As a result only few recommendations have been made with
respect to the most efficient selection strategy for Nile tilapia. Gall and Bakar (2002) argued
that BLUP (Best Linear Unbiased Prediction) selection is the most efficient method for
selection in tilapia. However, Sonesson et al. (2005) showed that BLUP selection might
result in unacceptably high rates of inbreeding and recommended mass selection as a more
desirable strategy for fish breeding programmes.
Chapter 1
12
Mass selection is the simplest form of selection within a population involving rearing large
groups of animals simultaneously and then selecting the best, based on their phenotypic
values (Falconer and Mackay, 1996). In fish, mass selection is often combined with mass
spawning, where broodstock are mated ‘en masse’ in spawning enclosures. It has been a
common strategy in fish breeding because of its simplicity and because it does not require
individual identification or maintenance of pedigree records. In principle, mass selection can
produce rapid improvement if the heritability of the traits under selection is high. However,
earlier work on mass selection in tilapia showed no or marginal response to genetic
improvement (Hulata et al., 1986; Huang and Liao, 1990). This disappointing response to
mass selection in Nile tilapia has been attributed to the availability of low genetic variation
in the base population and accumulation of inbreeding, non-heritable phenotypic variances
(e.g. cannibalism) and wrong or inappropriate management practices. Due to high fecundity
in many fish species, large numbers of offspring are produced in each generation while only
few animals are actually selected for the production of a new generation, i.e. a very small
number of individuals can make a large contribution to the genetic make-up of successive
generations. This will lead to the fast accumulation of inbreeding and loss of additive genetic
variance counteracting further genetic improvement (Gjerde and Rye, 1998). Moreover in
mass spawning the contribution of parents is not known and genetic contributions might be
dominated by few parents; exacerbating the accumulation of inbreeding. Inbreeding becomes
more serious in small facilities with limited capabilities to maintain parent broodstock in
large numbers.
In practicing mass selection, animals which display a better than average phenotype for a
certain trait, are selected to produce future generations. However, mass-spawned fry consist
of groups of individuals of different ages. Such mixed populations are not suitable for
selection for growth. The non-synchronous spawning in tilapia makes mass selection more
difficult since the larger individuals are likely to be progenies of earlier spawns, rather than
faster growers (Hulata et al., 1986). Fish breeders might also inadvertently select for
cannibalistic fish as those fish display desirable traits such as fast growth rate and robustness
(Li and Mathias, 1982). Variation in size due to non-heritable effects such as asynchronous
spawning and size dependent cannibalism will, therefore, increase the phenotypic variance,
mask the genetic components of growth and can often lead to marginal or no response
(Doyle and Talbot, 1986; Ruzzante, 1993; Lutz, 2004).
General Introduction
13
Small-scale farmers and hatcheries in developing countries are even more constrained by
access to knowledge of genetic management and commit many mistakes which have been
often blamed for the failure of mass selection schemes. A typical practice at harvest among
small-scale farmers in Africa is to sell or eat all fish of certain size, leaving smaller stunted
individuals to be either sold as fingerlings to other farmers or continue growing them in their
own ponds. This inadvertent selection of smaller adults is tantamount to selection for slow
growth and early sexual maturation (Brummett et al., 2004). Considering the heritability for
body weight (0.38-60) and female GSI (Gonado-Somatic Index) (0.25) reported in Charo et
al. (2006), such an unintentional negative selection will not only result in no genetic progress
but may also lead to deterioration of stocks in the long run. Anecdotal and empirical
evidence exists for substantial (up to 40%) declines in growth among Oreochromis
populations domesticated in both large and small-scale fish farms in Africa (Brummett and
Ponzoni, 2004).
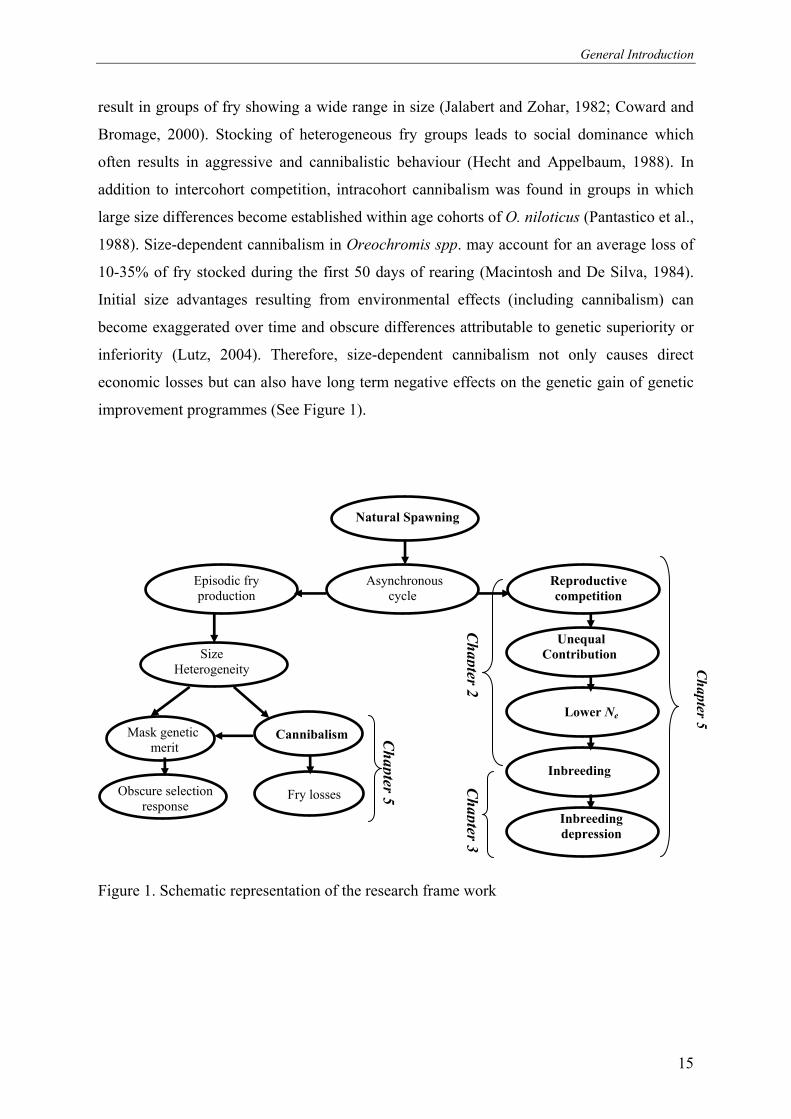
Overall, simple and unstructured mass selection schemes based on mass-spawning are often
practiced but have often resulted in no or marginal genetic progress. In order to refine the
design and improve the efficiency of mass selection based on natural mating, it is crucial to
have a better understanding on: reproduction under mass spawning conditions; the actual
contribution of broodstock to the next generation; measures to constrain inbreeding and
increase effective population size, synchronization of spawning and management of size
heterogeneity to minimize size dependent cannibalism (See Figure 1).
3. Natural reproductive behaviour of O. niloticus
The mating system of the African cichlid fish Oreochromis spp. resembles that of other
lekking animals; males defend mating territories where the spawning pits they dig are sites
for mating and oviposition (Baerends and Baerends-van Roon, 1950; Fryer and Iles, 1972).
The female lays her eggs in the spawning pit after which they are fertilized by the male.
Under natural conditions, females may encounter solitary or aggregated males and
experience varying degrees of male interference and competition during courtship and
spawning (Nelson, 1995). After fertilization of the eggs, the female picks up the eggs in her
buccal cavity. Thereafter, the female leaves the spawning pit and rears her clutch until the
fry are free-swimming. The male continues to defend the pit and attract other females for
mating (Fryer and Iles, 1972; Rana, 1988).

Chapter 1
14
4. Commercial fry production in O. niloticus
In intensive hatcheries, fry production of O. niloticus is typically achieved by stocking of
males and females in tanks or in hapas suspended in fertilized ponds, harvesting seed from
the mouths of females and incubating them artificially in tank-based hatcheries (Little et al.,
1995). Sexually mature tilapias generally undergo successive reproductive cycles at intervals
of 3–6 weeks. Theoretically, this could lead to almost continuous production of fry,
assuming that seasonal environmental variation is minimal. However, the reproduction in O.
niloticus is characterized by an asynchronous ovarian cycle (Rana, 1990). This has two
implications. First, asynchronous spawning of females will result in competition by males
for access to these spawning females (Grant et al., 1995). Secondly, it leads to episodic fry
production (Jalabert and Zohar, 1982) which in turn might cause size-dependent competition
and cannibalism (Figure 1).
4.1. Reproductive competition
When females spawn asynchronously, individual males with high competitive ability can
potentially acquire access to a disproportionately large share of the total number of females
that spawn in a given period of time (Grant et al., 1995). Mating systems can strongly
influence effective population size (Ne), by affecting the likelihood that an individual will
reproduce (Nunney, 1991), by influencing the variance in individual reproductive success
within one or both sexes (Nunney, 1993) and by affecting the number of mates per
individual (Sugg and Chesser, 1994). Higher fecundity and higher reproductive success of a
few parents may result in a quite high variance in progeny number and consequently small
within-generation Ne and low Ne/N ratio (Waples, 1998). When Ne is low, there is
considerable risk that the amount of genetic variation in the population will be reduced by
genetic drift (Hedrick, 2005). There is a direct relationship between Ne and inbreeding, such
that Ne is equal to 1/(2∆F), where ∆F is the per-generation rate of inbreeding (Falconer and
Mackay, 1996). To ensure the long-term success of breeding programmes, the maintenance
of genetic variation is very important (Hedrick et al., 1986). Reduced genetic variability as a
result of genetic drift limits the opportunity for future genetic improvement.
4.2. Size heterogeneity and cannibalism
Asynchronous reproductive cycles in O. niloticus also lead to episodic fry production. In
practice, hatcheries combine fry of different families hatched at different times. This will
General Introduction
15
result in groups of fry showing a wide range in size (Jalabert and Zohar, 1982; Coward and
Bromage, 2000). Stocking of heterogeneous fry groups leads to social dominance which
often results in aggressive and cannibalistic behaviour (Hecht and Appelbaum, 1988). In
addition to intercohort competition, intracohort cannibalism was found in groups in which
large size differences become established within age cohorts of O. niloticus (Pantastico et al.,
1988). Size-dependent cannibalism in Oreochromis spp. may account for an average loss of
10-35% of fry stocked during the first 50 days of rearing (Macintosh and De Silva, 1984).
Initial size advantages resulting from environmental effects (including cannibalism) can
become exaggerated over time and obscure differences attributable to genetic superiority or
inferiority (Lutz, 2004). Therefore, size-dependent cannibalism not only causes direct
economic losses but can also have long term negative effects on the genetic gain of genetic
improvement programmes (See Figure 1).
Figure 1. Schematic representation of the research frame work
Lower Ne
Size Heterogeneity
Cannibalism
Fry losses
Inbreeding
depression
Asynchronous cycle
Natural Spawning
Mask genetic merit
Obscure selection response
Episodic fry production
Reproductive
competition
Chapter 5
Chapter 3
Chapter 2
Unequal
Contribution
Inbreeding
Chapter 5
Chapter 1
16
5. Aim and outline this thesis
The aim of this thesis was to gain thorough knowledge and understanding of the natural
mating systems in O. niloticus and its consequences for genetic improvement programmes.
The outline of this thesis and the relationship between the different chapters are presented in
Figure 1. In Chapter 2, microsatellite markers are used to determine parentage and to
investigate the mating system of mass-spawning O. niloticus under semi-natural conditions
in breeding hapas. Two groups of 37 tilapias were stocked at female to male sex ratio of 2.
Reproductive success of both males and females was determined and the per-generation rate
of inbreeding and effective population size was estimated. As we found substantial estimates
of the rate of inbreeding, in Chapter 3 we investigated the effects of different levels of
inbreeding on survival and on body weight at both early and later life stages. In addition the
effect of inbreeding on fluctuating asymmetry at later stage in life was also investigated. In
Chapter 4 microsatellite markers were used to investigate the effects of different levels of
inbreeding on the individual reproductive success in O. niloticus. Fish were stocked at a
female to male sex ratio of 1 and 3 to compare reproductive success of males under different
competitive conditions. The estimates of inbreeding depression in reproductive success for
both males and females are given.
In Chapter 5, factors influencing size-dependent cannibalism in Nile tilapia, Oreochromis
niloticus are investigated in controlled conditions. The aim of this chapter is to derive simple
rules for management of heterogeneous fry groups by which cannibalism can be minimized
Finally in Chapter 6, the results of this thesis are discussed in view of their implications to
aquaculture breeding schemes and natural populations.
General Introduction
17
References
Baerends, G. P., and Baerends-van Roon, J. M., 1950. An introduction to the study of the
ethology of cichlid fishes. Behavior Suppl. 1, 1-242.
Bolivar, R.B., and Newkirk, G.F., 2002. Response to within family selection for body weight
in Nile tilapia (Oreochromis niloticus) using a single-trait animal model.
Aquaculture 204, 371-381.
Brummett, R.E, Angoni, D.E., Pouomogne, V., 2004. On-farm and on-station comparison of
wild and domesticated Cameroonian populations of Oreochromis niloticus.
Aquaculture 242, 157-164
Brummett, R.E., and Ponzoni, R., 2004. Genetic quality of domesticated African tilapia
populations. Journal of Fish Biology 65 (Supplement A), 314-325
Charo-Karisa, H., Komen, H., Rezk, M.A., Ponzoni, P.W., van Arendonk, J.A.M and
Bovenhuis, H., 2006. Heritability estimates and response to selection for growth of
Nile tilapia (Oreochromis niloticus) in low-input earthen ponds. Aquaculture (in
press).
Coward, K., and Bromage, N.R., 2000. Reproductive physiology of female tilapia
broodstock. Reviews in Fish Biology and Fisheries 10, 1–25.
Doyle, R.W., and Talbot, A.J., 1986. Effective population size and selection in variable
aquaculture stocks. Aquaculture 57, 27-35.
Dye, M. M., and Gupta, M.V., 2000. Socioeconomics of disseminating genetically improved
Nile tilapia in Asia: an introduction. Aquaculture Economics and Management 4, 5-
11.
Eknath, A.E., Tayamen, M.M., Palada-de Vera, M.S., Danting, J.C., Reyes, R.A., Dionisio,
E.E., Capili, J.B., Bolivar, H.L., Abella, T.A., Circa, A.V., Bentsen, H.B., Gjerde,
B., Gjedrem, T., Pullin, R.S.V., 1993. Genetic improvement of farmed tilapias:
growth performance of eight strains of Oreochromis niloticus tested in different
farm environments. Aquaculture 111, 171-188.
El-Sayed, A.M., 2006. Tilapia culture. CABI publishing, Oxford, UK.
Falconer, D.S., and Mackay, T.F.C., 1996. Introduction to quantitative genetics, 4th edition.
Prentice Hall, Harlow.
FAO (Food and Agriculture Organization of the United Nations), 2004. Fishstat Plus. FAO,
Rome.
Chapter 1
18
Fryer, G., and Iles, T. D., 1972. The Cichlid Fishes of the Great Lakes of Africa: Their
Biology and Evolution. Edinburgh: Oliver & Boyd.
Gall, G.A.E., and Bakar, Y., 2002. Application of mixed-model techniques to fish breed
improvement: analysis of breeding-value selection to increase 98-day body weight
in tilapia. Aquaculture 212, 93-113.
Gjerde B., and Rye, M., 1998. Design of breeding programmes in aquaculture species:
Possibilities and constraints. In: Bartley, D.M., Basurco B. (ed.). Genetics and
breeding of Mediterranean aquaculture species. Zaragoza : CIHEAM-IAMZ, 1998.
p. 181-192, Seminar of the CIHEAM Network on Technology of Aquaculture in
the Mediterranean (TECAM), 1997/04/28-29, Zaragoza (Spain).
Grant, J.W.A., Bryant, M.J., and Soos, C.E., 1995. Operational sex ratio, mediated by
synchrony of female arrival, alters the variance of male mating success in Japanese
medaka. Animal Behavior 49, 367-375.
Hecht, T. and Appelbaum, S., 1988. Observation on intraspecific aggression and coeval
sibling cannibalism by larva and juvenile Clarias gariepinus (Clariidae: Pisces)
under controlled conditions. Journal of Zoology. 214, 21-44.
Hedrick, P., 2005. Large variance in reproductive success and the Ne/N ratio. Evolution 59,
1596-1599.
Hedrick, P.W., Brussard, P.F., Allendorf, F.W., Beardmore, J.A., Orzack, S., 1986. Protein
variation, fitness and captive propagation. Zoo Biology 5, 91-99.
Huang, C.M., and Liao, I.C., 1990. Response to mass selection for growth rate in
Oreochromis niloticus. Aquaculture 85, 199-205.
Hulata, G., Wohlfarth, G.W., Halevy, A., 1986. Mass selection for growth rate in the Nile
tilapia (Oreochromis niloticus). Aquaculture 57, 177-184.
Jalabert, B., and Zohar, Y., 1982. Reproductive physiology in cichlid fishes, with particular
reference to Tilapia and Sarotherodon. In: Pullin, R.S.V. and Lowe-McConnell,
R.H. (eds), The Biology and Culture of Tilapias (ICLARM conference proceedings
7). International Center for Living Aquatic Resources Management, Manila,
Philippines, pp. 129–140.
Li, S.K. and Mathias, J.A., 1982. Cause of high mortality among cultured larval walleyes.
Transactions of the American Fisheries Society 111, 710-721.
Little, D.C., Lin, C.K., Turner, W.A. 1995. Commercial scale tilapia fry production in
Thailand. World Aquaculture 26(4), 20–24.
General Introduction
19
Lutz, C.G., 2004. Stock considerations for small producers. Aquaculture Magazine 30, 61-
62.
Macintosh, D.J., and De Silva, S.S. 1984. The influence of stocking density and food ration
on fry survival and growth in Oreochromis mossambicus and O. niloticus female x
O. aureus male hybrids reared in a closed circulated system. Aquaculture 41, 345-
358.
Nelson, C. M., 1995. Male size, spawning pit size and female mate choice in a lekking
cichlid fish. Animal Behaviour 50, 1587-1599.
Nunney, L., 1991. The influence of age structure and fecundity on effective population size.
Proc. R. Soc. London Ser. B 246, 71-76.
Nunney, L., 1993. The influence of mating structure and over-lapping generations on
effective population size. Evolution 47, 1329-1341
Pantastico, J.B., Dangilan, M.M.A., and Egula, R.V., 1988. Cannibalism among different
sizes of tilapia (Oreochromis niloticus) fry/fingerlings and the effect of natural
food, p. 465-468. In: Pullin, R.S.V., T. Bhukaswan, K. Tonguthai and J.L.
MacLean (eds.). Proceedings of The second International Symposium on Tilapia in
Aquaculture. ICLARM conference.
Rana, K.J., 1988. Reproductive biology and the hatchery rearing of tilapia eggs and fry. In:
Muir, J.F. and Roberts, R.J. (eds), Recent Advances in Aquaculture, vol. 3. Crook
Helm, London & Sydney, pp. 343–406.
Rana, K.J., 1990. Influence of incubation temperature on Oreochromis niloticus (L.) eggs
and fry II. Survival, growth and feeding of fry developing solely on their yolk
reserves. Aquaculture 87, 183–195.
Rana, K.J., 1997. Status of global production and production trends. FAO Fish. Circ. No.
886. FAO, Rome.
Ruzzante, D.E., 1993. Domestication effects on aggressive and schooling behaviour in fish.
Aquaculture 120, 1-24.
Sonesson, A.K., Gjerde, B., Meuwissen, T.H.E., 2005. Truncation selection for BLUP-EBV
and phenotypic values in fish breeding schemes. Aquaculture 243, 61-68.
Sugg, D.W., and Chesser, R.K., 1994. Effective population sizes with multiple paternity.
Genetics 137, 1147-1155.
Tave, D. and Smitherman, R.O., 1980. Predicted response to selection for early growth in
Tilapia nilotica. Transactions of the American Fisheries Society 109, 439-445.

Chapter 1
20
Teichert-Coddington, and D.R., Smitherman, R.O., 1988. Lack of response by Tilapia
nilotica to mass selection for rapid early growth. Transactions of the American
Fisheries Society 117, 297-300.
Waples, R.S., 1998. Separating the wheat from the chaff: patterns of genetic differentiation
in high gene flow species. Journal of Heredity 89, 438-450.
Chapter 2
Mating systems and male reproductive success in Nile tilapia
(Oreochromis niloticus) in breeding hapas: a microsatellite analysis
Yonas Fessehayea,b,c, Zizy El-Bialya, Mahmoud A. Rezkc, Richard Crooijmansa, Henk
Bovenhuisa and Hans Komena
a Animal Breeding and Genetics Group, Wageningen University, The Netherlands
b Aquaculture and Fisheries group, Wageningen University, The Netherlands
c The WorldFish Center, Regional office for Africa and W. Asia, Abbassa, Abou Hamad, Sharkia, Egypt
Aquaculture 256 (2006), 148-158

Mating Systems
23
Abstract
Fry production in Nile tilapia, Oreochromis niloticus is typically achieved by mass-spawning
of males and females stocked in large hapas suspended in ponds. In such spawning
aggregations, territorial behaviour and reproductive competition among males may lead to a
large variance in reproductive success among individual males. We analyzed parentage and
quantified male reproductive success of O. niloticus under commercial hatchery conditions in
two breeding hapas each stocked with 12 males and 25 females. Eleven microsatellite markers
were used to estimate the reproductive success of individual males and females. In total, 760
offspring from 76 spawnings were included in the paternity analysis. Mating patterns in Nile
tilapia ranged from single pair to promiscuous mating. Multiple paternity was detected in 70%
of the broods, with up to 4 males fertilizing a single clutch. Multiple maternity was also
detected in over 30% of the clutches analyzed. There was a very high variance in male
reproductive success, with one third of males siring more than 70% of the offspring. Male
condition factor had a significant effect on reproductive success with larger males siring a
large proportion of offspring. The high reproductive variance resulted in a Ne of around 16 for
hapas A and B, and a low Ne/N ratio, 0.43 and 0.45 for hapas A and B respectively. The rate
of inbreeding, ∆F, for each hapa, was estimated to be around 3.0% per generation, which is
about twice the inbreeding expected in an idealized population of the same census size. When
designing fish breeding programmes based on mass-spawning, the higher inbreeding and
lower effective population size should be taken into consideration.
Chapter 2
24
1. Introduction
Male reproductive behaviour may be extremely diverse, both within species and between
species. Among vertebrate classes, fish exhibit by far the greatest variability in competitive
and cooperative behaviours in male reproduction (Taborsky, 2001). Reproductive competition
may lead to a large variance in reproductive success among individual males thereby
contributing to a low effective population size (Bekkevold et al., 2002). The genetic
consequence of unbalanced contributions of parents is of concern for selective breeding
schemes which use mass spawning (Boudry et al., 2002). In those schemes inbreeding is
likely to occur, leading to decreased in performance (Kincaid, 1976). Furthermore, reduced
genetic variability limits the possibility of future genetic improvement by selective breeding.
Tilapias are among the most important freshwater species with the greatest production
expansion in aquaculture in recent years (Fitzsimmons and Gonzalez, 2005). In intensive
hatcheries, fry production in O. niloticus is typically achieved by stocking of males and
females in large hapas suspended in fertilized ponds, harvesting seed from the mouths of
females and incubating them artificially in tank-based hatcheries (Little et al., 1995). O.
niloticus is a lek-spawning fish: each male builds and defends a territory within a defined
spawning area (a ‘lek’) where oviposition of eggs by females takes place (Rana, 1988). A
characteristic feature of leks is high variance in reproductive success among males within an
aggregation, with more attractive and dominant males gaining a disproportionate share of
matings (Hoglund and Alatalo, 1995: quoted in Bekkevold et al., 2002). Considerable effort
has been devoted to understand why success is distributed so unevenly among males,
including the roles of male-male competition and female choice (Beehler and Foster, 1988;
Reynolds and Gross, 1990; Stillman et al., 1993).
Whereas behavioural observations indicate that the mating system of the African cichlid fish
O. mossambicus resembles that of other lekking animals (Nelson, 1995), no genetic study of
the mating system of Oreochromis species has been carried out. Furthermore, no direct
quantification of reproductive success and parental contribution to the next generation has
been previously investigated in Nile tilapia. In this study, we used eleven highly polymorphic
microsatellite markers to analyze parentage of offspring from several spawnings to genetically
characterize the mating systems in O. niloticus and to quantify individual males’ reproductive
success in breeding hapas. We determine the variance in individual reproductive success and
discuss the possible factors contributing to this large variance. Finally, the consequence of
Mating Systems
25
mating systems and parental contribution on effective population size is discussed in relation
to breeding programmes which employ mass spawning for fry production.
2. Materials and Methods
Fish
The spawning experiments were carried out at the experimental station of The WorldFish
Center, Abbassa, Egypt. Grandparents of the experimental fish were produced in the spring of
2000 from all possible diallele crosses between four Egyptian strains of O. niloticus (Rezk et
al., 2002). Parental fish, which consisted of 24 males and 50 females (Females: average =
73.09g, CV =17.5%; males: average = 73.78 g, CV = 19%), were randomly selected from this
population maintained at the research station. Females and males were separately conditioned
for two weeks prior to stocking in the breeding hapas by feeding them twice daily at a feeding
rate of 3% body weight per day with 3mm floating pellets (40% crude protein, Alexandria Oil
and Soap Company, Kafr El-Sheikh, Egypt).
Experimental set up
The spawning experiments were carried out in the breeding season of 2003. Prior to the
experiment, all fish were anesthetized with tricaine methanesulfonate (MS-222) and tagged
with Floy® tags between the dorsal fin and lateral line. All parental fish were measured for
total body weight (W, nearest 0.1 g); total length (TL), standard length (SL), head length
(HL), head width (HW) and body depth (BD). TL and SL were measured as the distance from
the tip of the snout to the end of the caudal fin and hypural bone respectively; HL was
measured from the tip of the snout to the end of the opercle; HW is the maximum head width
near the opercle and BD is the maximum body depth measured dorso-ventrally just anterior to
the dorsal fin. About 0.5 ml of blood was collected from all parental fish by caudal puncture
using a hypodermic needle rinsed with Na2EDTA. Two 8 x 2 x 1 m3 (length x width x depth)
hapa enclosures were installed in two concrete- walled ponds with mud bottom (dimension:
50 x 5 x 1m3; the floor of the hapas was sitting on the pond bottom). Broodstock were divided
into two random groups of 25 females and 12 males and were stocked in either one of two
hapas. Two days after stocking, one male died in hapa A and was replaced by another one.
Broodstock were allowed to spawn naturally for a period of ten days after which checking for
eggs in the mouth of breeders commenced. Collection of eggs was carried out on a weekly
basis for a duration of three weeks after which males and females were separated for a re-
Chapter 2
26
conditioning period of two weeks by feeding them with high protein diet (40% crude protein).
After the reconditioning period, breeders were re-stocked into their original hapas and were
allowed to spawn again for a period of about ten days after which 3 more weekly collections
of eggs were made.
Egg collection and incubation
All females were checked during each egg collection. Females carrying eggs in the buccal
cavity were identified with the tag number and eggs were collected from the mouth of each
incubating female into a plastic bowl. The unhatched eggs were then rinsed and counted
before transferring them to the artificial incubators.
Fertilized eggs were incubated in 20-l aquaria with continuous aeration to keep the eggs in
constant motion and to ensure sufficient oxygen supply needed for hatching of eggs. To
control fungal infection, the water was treated with 30 ppm formalin for the first day and with
20 ppm formalin for the subsequent days. Formalin treatments were stopped when the
embryos reached the eyed stage. In addition, eggs were inspected daily and unfertilized or
dead eggs were removed as the presence of spoiled eggs may cause infection and loss of the
whole spawn. Fry were reared in the incubation system till the yolk sac stage. Hatching
percentages and fry survival was recorded for all families. Finally, ten yolk sac fry per spawn
were randomly sampled for DNA extraction and genetic analysis.
DNA extraction and microsatellite analysis
Genomic DNA was extracted from blood of parental fish and whole yolk sac larvae. DNA
was isolated from blood of parental fish using the PUREGENE kit (Gentra Systems,
Minneapolis, MN, USA) following the manufacturers instructions for non-mammalian blood.
Yolk sac fry were overdosed with MS-222 (tricaine methanesulfonate). The yolk sac was then
removed using a scalpel and embryos were placed in sterile 1.5 ml microcentrifuge tubes.
Extraction of DNA from whole larvae was also carried out using the same kit and protocol as
for non-mammalian blood. The amount of re-hydrated DNA solution was adjusted to yield
final DNA concentrations of 5–10 µg/ml. Eighteen microsatellite markers from the database
at the National Center for Biotechnology Information (http://www.ncbi.nlm.nih.gov) were
screened. Based on their level of heterozygosity and genotyping reliability, the best eleven
microsatellite markers (UNH160, UNH169, UNH190, UNH203, UNH212, UNH222,
UNH123, UNH178, UNH208, UNH214, UNH231) were selected for genotyping all parental
Mating Systems
27
fish and offspring. PCR cycling conditions were as follows: 5 min at 95 °C, 35 cycles of 30 s
at annealing temperature (45–60 °C), and 30s at 72 °C, followed by a final elongation step of
4 min at 72 °C. Amplified products were combined in multiplex groups of five to six markers,
and electrophoresed on 6% polyacrylamide gel on the ABI prism 373 DNA sequencer
(Applied Biosystems, CA, USA). Fragment sizes were calculated relative to the TAMRA 350
size standard. Genotype results were analyzed using GENESCAN version 3.1 and
GENOTYPER version 2.5 (Perkin-Elmer, Boston, MA, USA).
Statistical analysis
Parentage analysis: Allocation of offspring to their putative parental pairs was performed
using PAPA vers. 2.0. (Package for analysis of parental allocation). PAPA is a computer
programme that performs parental allocation by calculating the likelihood of each potential
parental pair. Given an offspring genotype, the likelihood of parental pair of genotypes is
defined as the probability of this pair breeding the offspring genotype among all its possible
descents (Duchesne et al., 2002). The probability of erroneous scoring of allelic size (such as
allele designation, stutter-related scoring, or upper allele dropout errors) in an individual
genotype must be considered when conducting maximum-likelihood parentage analysis
(Sancristobal and Chevalet, 1997). In our parentage analysis we assumed an error rate of 0.02
and a uniform distribution of the errors. To test the parental assignment and to estimate the
efficiency of the loci used in parental allocation, a random sample of 10,000 simulated
offspring were generated from all parental male and female genotypes. These simulations
were conducted by adding loci from the most polymorphic to the least polymorphic one.
Condition factor of males: Condition factor (K) was calculated as K = W (g)/SL2.93, whereby
the exponent in the formula is the slope of the regression of Log10W on Log10SL (Bolger and
Connolly, 1989).
Male reproductive success: Male reproductive success was calculated for each male as the
proportion of offspring sired by a male in a single spawning. All correctly allocated offspring
were included in this analysis. Genetically effective paternity frequency was calculated for
each spawning following Bekkevold et al. (2002). The same formula was also used to
compute the genetically effective maternity frequency.
Chapter 2
28
∑=
= n
i
ip
PF
1
2
1
Where PF is genetically effective paternity frequency
pi is the proportion of offspring sired by the ith male in a given clutch
n is number of males involved in fertilizing a clutch
For each spawning, the reproductive success of each male in a hapa was considered to be in
the range of 0 to 1; whereby 0 is the case in which a male had sired none of the offspring and
1 in which a male had sired all the offspring in that spawning. The effects of hapa, condition
factor of males, date of sampling on the reproductive success of males was then investigated
using generalized, linear model procedure (GENMOD) of SAS (1989). A generalized linear
model with binomial errors and logit link function was used as male reproductive success was
calculated as the proportion of offspring sired by a male within a single spawning. A basic
model was fitted with an effect of hapa (I = 1, 2), and sampling date (j = 1 till 6). In order to
test the relative importance of the explanatory variables, the basic model was run by adding
one additional variable at a time and in each successive run another variable was replaced
(condition factor, weight and morphometric measurements such as TL, BD and HL).
Calculation of effective population size (Ne) and rate of inbreeding (∆F): The effective
population size for each hapa was calculated after Wright (1938) as:
)(4 efemefeme NNNNN +=
Where Nem and Nef are the effective number of males and females, respectively. Nem and Nef
were calculated following Lande and Barrowclough (1987):
]1)/([
)1(2
−+
−=
mkmm
mmem
kk
kNN
σ
Where Nm is the actual number of males; mk is the average number of offspring sired by an
individual male and σkm2is the variance of km. The same formula was used to compute the
effective number of females.
Mating Systems
29
The rate of inbreeding, ∆F was calculated after Brown et al. (2005) using the following
formula
222)(
4
1)(
4
1
2
1fm
Parents
i cccF −−=∆ ∑
Where ci is the fractional contribution of each parent, mc is the average fractional contribution
of males, 1/ (2Cm), and fc is the average fractional contribution of females, 1/ (2Cf)
3. Results
Female spawning
The total number of spawns collected over the experimental period was 47 and 29 for hapa A
and hapa B respectively. About 92% of all females stocked in both hapas spawned and about
44% had more than one spawning. The average (± SD) female fecundity and hatching
percentage over all the spawnings and both hapas combined was 523 (± 184) and 74 (± 16)
respectively.
Parentage analysis
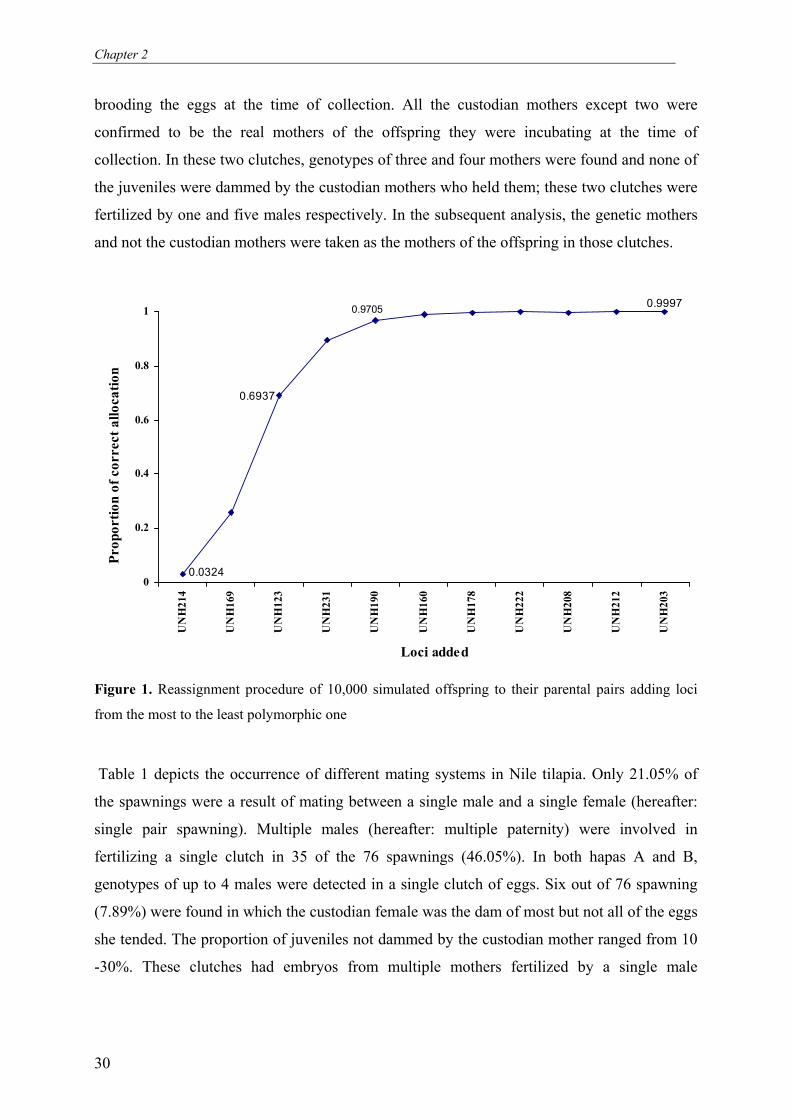
Parental allocation was highly reliable and efficient as demonstrated by the results of the
reassignment simulations. About 97.0% of the simulated offspring could be assigned to their
correct parental pairs based on information from only five loci. With all the eleven loci,
almost 100% of correct allocation could be attained (Figure 1). Parental assignment was then
performed on a total of 760 real offspring collected from 76 spawnings (Hapa A = 47; Hapa B
= 29). Over all, 97.7% and 99.7% of all offspring were unambiguously allocated to their
putative parental pairs based on information from five and eleven loci respectively. In hapa A,
467 out of the 470 (99.4%) offspring were unambiguously allocated to their putative parents.
Three offspring could not be allocated to a single pair of parents because the samples of these
offspring amplified for only three of the eleven markers. These three offspring were not
considered in the subsequent analysis. In hapa B, all 290 offspring were unambiguously
allocated to their putative parental pairs. To confirm if the custodian mothers are the real
mothers of the offspring, the mothers allocated to offspring using PAPA 2.0 (genetically
deduced) were cross-checked with the tag numbers of custodian mothers which were mouth-
Chapter 2
30
brooding the eggs at the time of collection. All the custodian mothers except two were
confirmed to be the real mothers of the offspring they were incubating at the time of
collection. In these two clutches, genotypes of three and four mothers were found and none of
the juveniles were dammed by the custodian mothers who held them; these two clutches were
fertilized by one and five males respectively. In the subsequent analysis, the genetic mothers
and not the custodian mothers were taken as the mothers of the offspring in those clutches.
0
0.2
0.4
0.6
0.8
1
UN
H214
UN
H169
UN
H123
UN
H231
UN
H190
UN
H160
UN
H178
UN
H222
UN
H208
UN
H212
UN
H203
Loci added
Proportion o
f correct allocation
0.97050.9997
0.0324
0.6937
Figure 1. Reassignment procedure of 10,000 simulated offspring to their parental pairs adding loci
from the most to the least polymorphic one
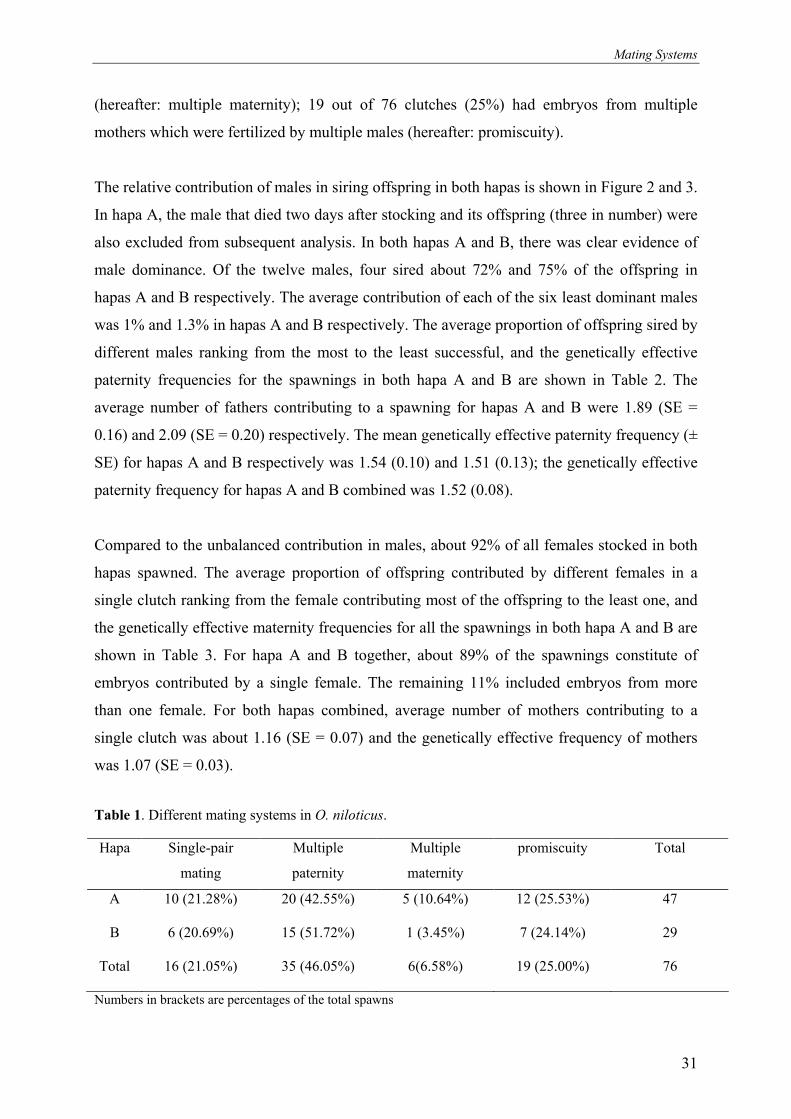
Table 1 depicts the occurrence of different mating systems in Nile tilapia. Only 21.05% of
the spawnings were a result of mating between a single male and a single female (hereafter:
single pair spawning). Multiple males (hereafter: multiple paternity) were involved in
fertilizing a single clutch in 35 of the 76 spawnings (46.05%). In both hapas A and B,
genotypes of up to 4 males were detected in a single clutch of eggs. Six out of 76 spawning
(7.89%) were found in which the custodian female was the dam of most but not all of the eggs
she tended. The proportion of juveniles not dammed by the custodian mother ranged from 10
-30%. These clutches had embryos from multiple mothers fertilized by a single male
Mating Systems
31
(hereafter: multiple maternity); 19 out of 76 clutches (25%) had embryos from multiple
mothers which were fertilized by multiple males (hereafter: promiscuity).
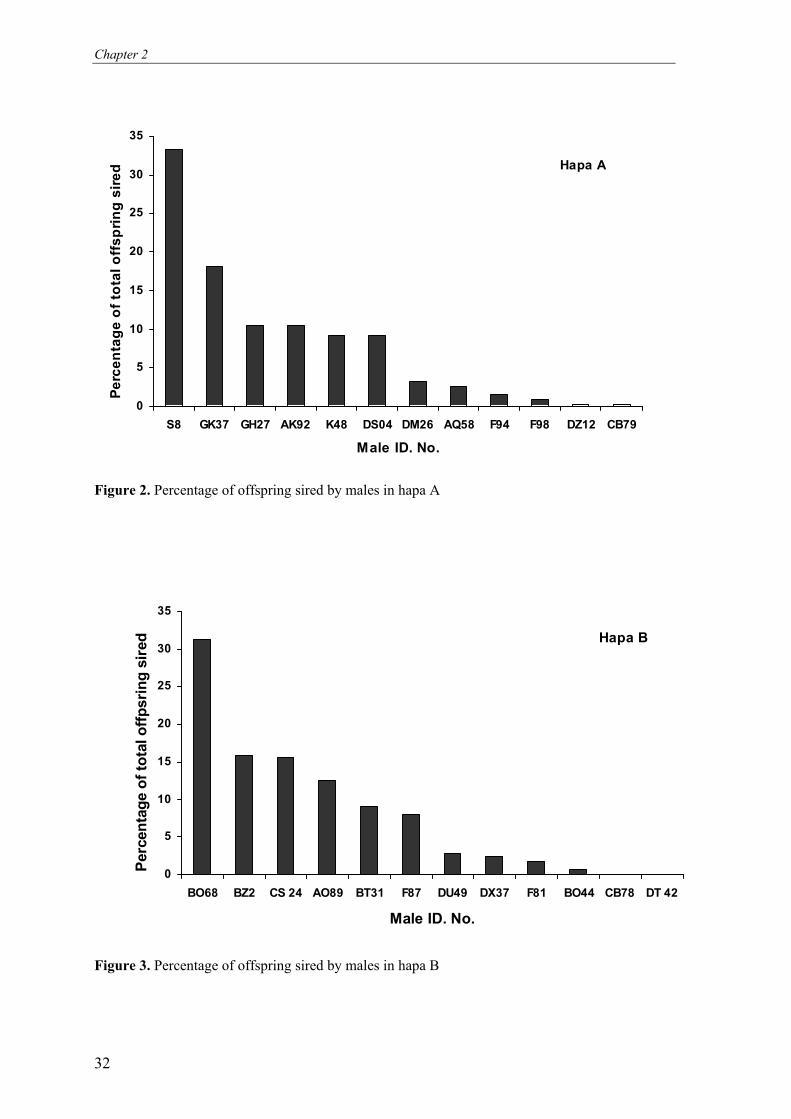
The relative contribution of males in siring offspring in both hapas is shown in Figure 2 and 3.
In hapa A, the male that died two days after stocking and its offspring (three in number) were
also excluded from subsequent analysis. In both hapas A and B, there was clear evidence of
male dominance. Of the twelve males, four sired about 72% and 75% of the offspring in
hapas A and B respectively. The average contribution of each of the six least dominant males
was 1% and 1.3% in hapas A and B respectively. The average proportion of offspring sired by
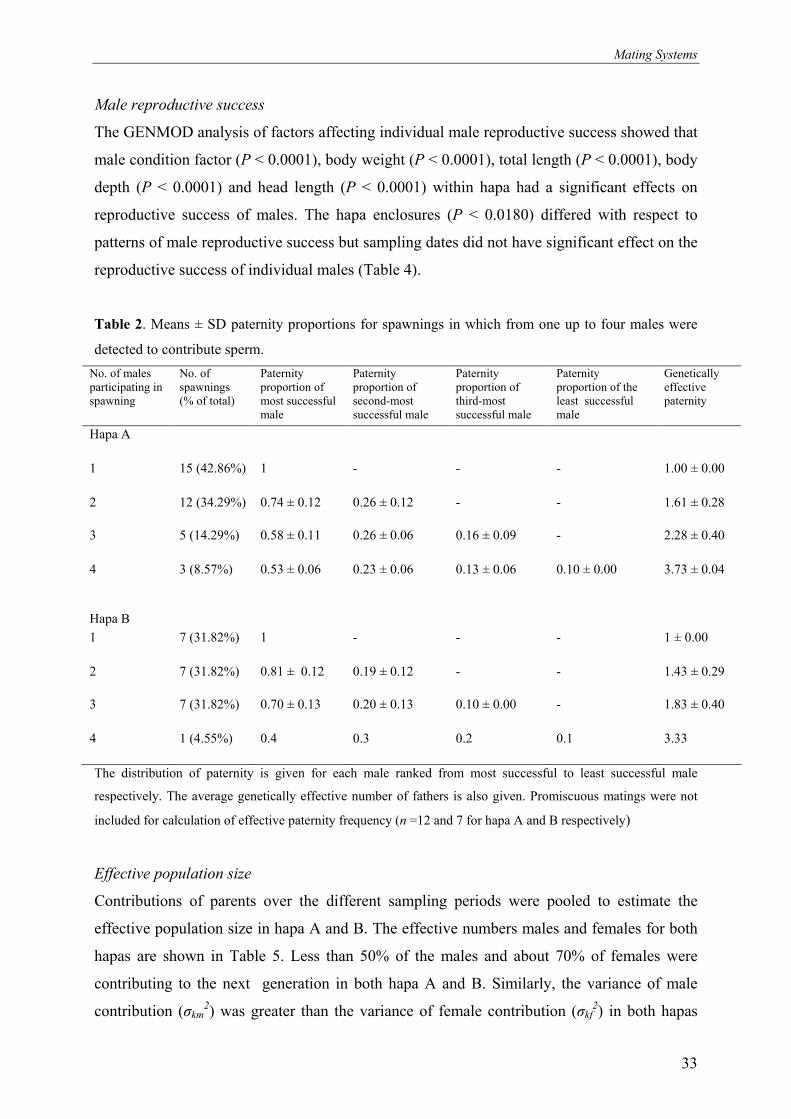
different males ranking from the most to the least successful, and the genetically effective
paternity frequencies for the spawnings in both hapa A and B are shown in Table 2. The
average number of fathers contributing to a spawning for hapas A and B were 1.89 (SE =
0.16) and 2.09 (SE = 0.20) respectively. The mean genetically effective paternity frequency (±
SE) for hapas A and B respectively was 1.54 (0.10) and 1.51 (0.13); the genetically effective
paternity frequency for hapas A and B combined was 1.52 (0.08).
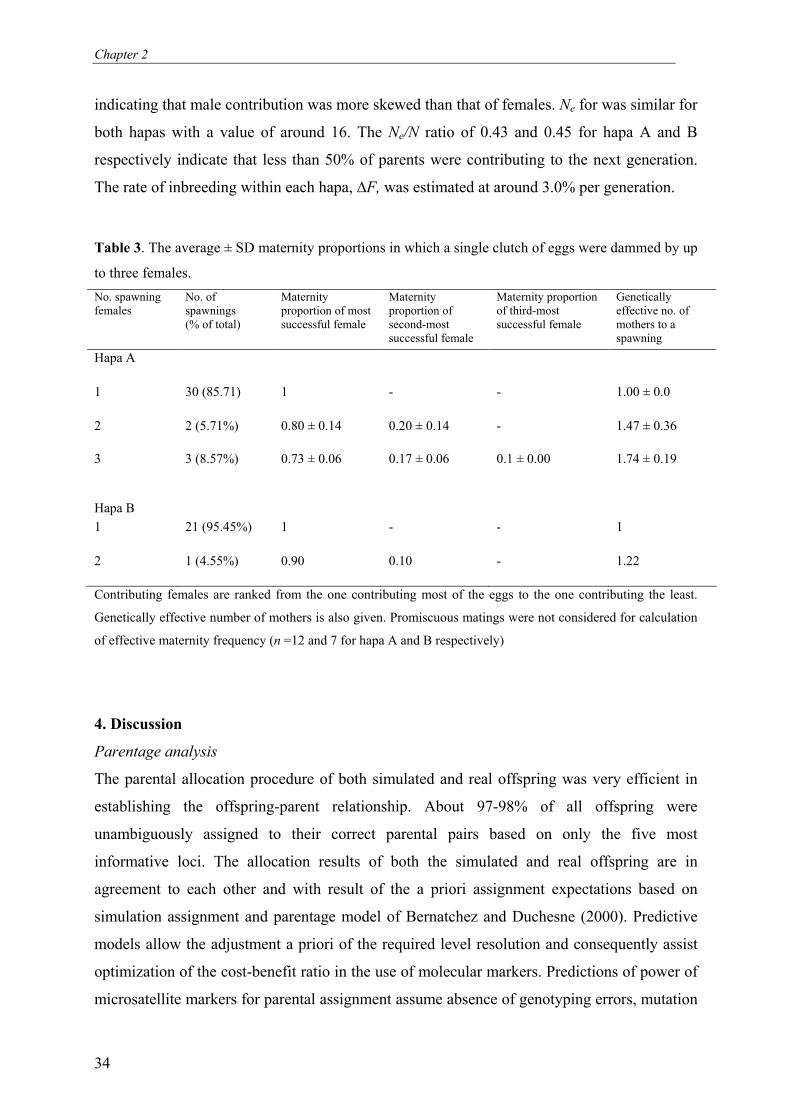
Compared to the unbalanced contribution in males, about 92% of all females stocked in both
hapas spawned. The average proportion of offspring contributed by different females in a
single clutch ranking from the female contributing most of the offspring to the least one, and
the genetically effective maternity frequencies for all the spawnings in both hapa A and B are
shown in Table 3. For hapa A and B together, about 89% of the spawnings constitute of
embryos contributed by a single female. The remaining 11% included embryos from more
than one female. For both hapas combined, average number of mothers contributing to a
single clutch was about 1.16 (SE = 0.07) and the genetically effective frequency of mothers
was 1.07 (SE = 0.03).
Table 1. Different mating systems in O. niloticus.
Hapa Single-pair
mating
Multiple
paternity
Multiple
maternity
promiscuity Total
A 10 (21.28%) 20 (42.55%) 5 (10.64%) 12 (25.53%) 47
B 6 (20.69%) 15 (51.72%) 1 (3.45%) 7 (24.14%) 29
Total 16 (21.05%) 35 (46.05%) 6(6.58%) 19 (25.00%) 76
Numbers in brackets are percentages of the total spawns
Chapter 2
32
0
5
10
15
20
25
30
35
S8 GK37 GH27 AK92 K48 DS04 DM26 AQ58 F94 F98 DZ12 CB79
Male ID. No.
Perc
enta
ge o
f to
tal offspring s
ired Hapa A
Figure 2. Percentage of offspring sired by males in hapa A
0
5
10
15
20
25
30
35
BO68 BZ2 CS 24 AO89 BT31 F87 DU49 DX37 F81 BO44 CB78 DT 42
Male ID. No.
Perc
enta
ge o
f to
tal offpsring s
ired Hapa B
Figure 3. Percentage of offspring sired by males in hapa B
Mating Systems
33
Male reproductive success
The GENMOD analysis of factors affecting individual male reproductive success showed that
male condition factor (P < 0.0001), body weight (P < 0.0001), total length (P < 0.0001), body
depth (P < 0.0001) and head length (P < 0.0001) within hapa had a significant effects on
reproductive success of males. The hapa enclosures (P < 0.0180) differed with respect to
patterns of male reproductive success but sampling dates did not have significant effect on the
reproductive success of individual males (Table 4).
Table 2. Means ± SD paternity proportions for spawnings in which from one up to four males were
detected to contribute sperm.
No. of males participating in spawning
No. of spawnings (% of total)
Paternity proportion of most successful male
Paternity proportion of second-most successful male
Paternity proportion of third-most successful male
Paternity proportion of the least successful male
Genetically effective paternity
Hapa A
1 15 (42.86%) 1 - - - 1.00 ± 0.00
2 12 (34.29%) 0.74 ± 0.12 0.26 ± 0.12 - - 1.61 ± 0.28
3 5 (14.29%) 0.58 ± 0.11 0.26 ± 0.06 0.16 ± 0.09 - 2.28 ± 0.40
4 3 (8.57%) 0.53 ± 0.06 0.23 ± 0.06 0.13 ± 0.06 0.10 ± 0.00 3.73 ± 0.04
Hapa B
1 7 (31.82%) 1 - - - 1 ± 0.00
2 7 (31.82%) 0.81 ± 0.12 0.19 ± 0.12 - - 1.43 ± 0.29
3 7 (31.82%) 0.70 ± 0.13 0.20 ± 0.13 0.10 ± 0.00 - 1.83 ± 0.40
4 1 (4.55%) 0.4 0.3 0.2 0.1 3.33
The distribution of paternity is given for each male ranked from most successful to least successful male
respectively. The average genetically effective number of fathers is also given. Promiscuous matings were not
included for calculation of effective paternity frequency (n =12 and 7 for hapa A and B respectively)
Effective population size
Contributions of parents over the different sampling periods were pooled to estimate the
effective population size in hapa A and B. The effective numbers males and females for both
hapas are shown in Table 5. Less than 50% of the males and about 70% of females were
contributing to the next generation in both hapa A and B. Similarly, the variance of male
contribution (σkm2) was greater than the variance of female contribution (σkf
2) in both hapas
Chapter 2
34
indicating that male contribution was more skewed than that of females. Ne for was similar for
both hapas with a value of around 16. The Ne/N ratio of 0.43 and 0.45 for hapa A and B
respectively indicate that less than 50% of parents were contributing to the next generation.
The rate of inbreeding within each hapa, ∆F, was estimated at around 3.0% per generation.
Table 3. The average ± SD maternity proportions in which a single clutch of eggs were dammed by up
to three females.
No. spawning females
No. of spawnings (% of total)
Maternity proportion of most successful female
Maternity proportion of second-most successful female
Maternity proportion of third-most successful female
Genetically effective no. of mothers to a spawning
Hapa A
1
30 (85.71) 1 - - 1.00 ± 0.0
2
2 (5.71%) 0.80 ± 0.14 0.20 ± 0.14 - 1.47 ± 0.36
3
3 (8.57%) 0.73 ± 0.06 0.17 ± 0.06 0.1 ± 0.00 1.74 ± 0.19
Hapa B
1
21 (95.45%) 1 - - 1
2
1 (4.55%) 0.90 0.10 - 1.22
Contributing females are ranked from the one contributing most of the eggs to the one contributing the least.
Genetically effective number of mothers is also given. Promiscuous matings were not considered for calculation
of effective maternity frequency (n =12 and 7 for hapa A and B respectively)
4. Discussion
Parentage analysis
The parental allocation procedure of both simulated and real offspring was very efficient in
establishing the offspring-parent relationship. About 97-98% of all offspring were
unambiguously assigned to their correct parental pairs based on only the five most
informative loci. The allocation results of both the simulated and real offspring are in
agreement to each other and with result of the a priori assignment expectations based on
simulation assignment and parentage model of Bernatchez and Duchesne (2000). Predictive
models allow the adjustment a priori of the required level resolution and consequently assist
optimization of the cost-benefit ratio in the use of molecular markers. Predictions of power of
microsatellite markers for parental assignment assume absence of genotyping errors, mutation
Mating Systems
35
or non-amplifying or ‘null’ alleles (Villanueva et al., 2002). Violation of such assumptions
can lead to a lower allocation efficiency and frequent mismatches of offspring to their true
parents. Our allocation results show that a satisfactory level of parental assignment could be
attained with only five loci, however, the use of 6-8 microsatellites would ensure higher
allocation efficiency and would overcome the assignment failures arising from genotyping
errors and null alleles.
Table 4. General linear model analysis (type III) on the effect of hapa, sampling date, male condition
factor, male weight, TL, BD and HL on male reproductive success.
Effects
df χ2 P -value
Hapa
1 5.60 < 0.0180
Sampling date
5 0.28 0.9980
Condition factor*
1 403.36 < 0.0001
Weight*
1 296.82 < 0.0001
Total length*
1 200.41 < 0.0001
Body depth*
1 386.11 < 0.0001
Head length*
1 261.56 < 0.0001
The basic model (hapa, sampling period) was run by adding another explanatory variable (indicated by *) at a
time and replacing it with another in the subsequent analysis.
Mating systems
Fish have some of the most complex mating systems known in the animal kingdom (Neff,
2001). Our results show a diversity of reproductive pattern ranging from single pair to
promiscuous matings. Multiple paternity in mouth brooding tilapias (at that time termed as
Sarotherodon) has been documented as early as 1981 using allozymes (Hulata et al., 1981).
Recently, microsatellite-based paternity analyses in several cichlid species have documented
multiple paternity of broods, with up to six males fertilizing a single clutch (Parker and
Kornfield., 1996; Kellogg et al., 1995). Similarly, the parentage analysis in our study has
shown that up to four males fertilized a single clutch of eggs. While males are expected to be
promiscuous because male reproductive success is directly related to the number of females
inseminated, the adaptive significance of females copulating with multiple males is less clear

Chapter 2
36
(Parker, 1992). Female multiple mating may be male driven, but females often directly seek
for copulations from a number of males, and it is becoming increasingly clear that many
females in a wide range of taxa are genetically polyandrous (Gowaty, 1994). Females also
gain any of several fitness advantages by mating with multiple males. Such benefits include
fertilization insurance against male sterility, access to more or better quality territories,
success in ‘prospecting’ better genes for her progeny, production of broods with more diverse
and potentially adaptive genotypic arrays, and avoidance of inbreeding depression if some of
her matings might be with close kin (Avise et al., 2002). However, multiple mating of females
could also simply be a matter of re-spawning. When a female fails to spawn all of her eggs
during a single mating bout, she may spawn again in a different nest and with a different male
leading to the siring of her eggs by multiple males (DeWoody and Avise, 2001). Our study
documented five clutches in which the custodian mother dammed most but not all of the
offspring she tended. In those clutches, the proportion of offspring not dammed by the
custodian mother was between 10 to 30%. In addition, two custodian females carrying the
eggs dammed none of their apparent offspring. These maternal exclusions were based on
eleven highly polymorphic loci and the possibility of wrong parental assignment could be
ruled out. Intraspecific brood mixing, shuffling of conspecific broods, is a cryptic
phenomenon in mouth-brooders documented by microsatellite markers. In four of the six
orally brooded cohorts of fry examined in a Lake Malawi cichlid (Protomelas spilopterus),
the proportions of juveniles not dammed by the female who held them ranged from 6% to
65% (Kellogg et al., 1998). The origin of brood mixing has traditionally been explained in
several ways: (1) parents carry the offspring in their mouths and put some under the care of
foster parents termed as ‘farming-out’ (McKaye et al., 1992); (2) foster parents kidnap the
young (McKaye and McKaye, 1977); (3) aggressive behaviour between parents of two
adjacent broods results in the winner’s acquisition of the loser’s brood (Lewis, 1980) and (4)
young of guarded broods close to each other simply mix (McKaye, 1977); and (5) deserted or
stray young intrude into unrelated broods (Ribbink et al., 1980). DeWoody and Avise (2001)
suggested that genotypic incompatibility between an embryo and its guardian may also result
from ‘egg thievery’. Several of the possible explanations for the origin and significance of
brood mixing remain highly speculative and the true origin of brood mixing remains unclear
because of the difficulty of observing the process of mixing (Kellogg et al., 1998). High fish
density, space limitation and inability of fish to construct nests in artificial hapa environment
might have led to egg mixing and shuffling of broods.

Mating Systems
37
Table 5. Number of broodstock (N), averaged offspring count of male (km) and female (kf) parents,
variance of male and female contributions (σkm2, σkf
2 respectively), effective numbers of males and
females (Nem, Nef respectively), effective population size (Ne), coefficient of inbreeding (∆F)and the
ratio of Ne/N for hapa A and B.
Hapa
N km kf σkm2 σk f
2 Nem Nef Ne ∆F Ne/N
A
37 38.3 19.33 2094.06 148.84 4.99 17.78 15.60 0.0309 0.43
B
37 24 12 724.72 85.83 5.39 15.8 16.08 0.0301 0.45
Male reproductive success
Parentage analysis in this experiment revealed that there is a large variance in the
reproductive success of males and that one third of males sired more than 70% offspring in
both hapas. This is a striking feature of many animal species in which few males obtain most
of the matings, while the rest have little or no success. Male reproductive competition for
fertilization has been documented in a rapidly increasing number of genetic paternity studies
of a wide range of fish species (DeWoody and Avise, 2001). Variation in male success is
most pronounced in leks, in which 10-20% of males often obtain 70-80% of the matings
(Wiley, 1991). Reproductive success in lekking species is dependent on male-male interaction
and female mate choice (Johnstone and Earn, 1999). Some authors suggest that differences
between male’s mating success at a lek are largely the result of female preferences
(Andersson, 1992); others suggest that male –male competition is more important in
determining male mating success (LeCroy, 1981; Beehler and Foster, 1988). Male-male
competition could not be observed directly in our study. Even so, previous observations of
tilapia reproductive behaviour (Nelson, 1995) together with our study showing a correlation
between male condition factor/weight and reproductive success, leads to the hypothesis that
males experience reproductive competition. Male condition factor and weight had a
significant effect on reproductive success with males of higher condition factor/weight siring
a large proportion of offspring. Rakitin et al. (1999) reported that the most successful cod
male had a greater condition factor (K) and also higher spermatocrit than the least successful
male, suggesting that sire condition factor is potentially a critical factor determining sperm
fertilization potency. It is, however, difficult to disentangle the relative effects of female
mating preference from male –male competition on the reproductive success of males. Several
studies have evaluated female mate choice among Old and New World cichlids and identified
Chapter 2
38
male characters such as bower size, egg-spot numbers and male body size that lead to non-
random mate selections (Noonan, 1983; McKaye et al., 1990). Female O. mossambicus made
choices based on two criteria under different circumstances: a spawning site characteristic,
spawning pit size and a morphological feature of males, body length (Nelson, 1995). The
assumption that bigger males have advantages in male-male competition or in female mate
choice has been challenged. Bekkevold et al. (2002) argues that larger males might have been
able to sire more offspring simply by having larger ejaculates, which swamps those of smaller
males, rather than because they acquire more matings with females. The relative importance
of male-male competition and female choice to the skewed mating success in tilapia is not
clearly understood and merits further investigation.
Effective population size
Effective populations size (Ne) depends strongly on mating systems. The mating system is a
primary determinant of variation in male mating success. Under extreme polygyny (with very
few males obtaining almost all of the matings), high variance in reproductive success results
in a low effective population size. When obvious inequalities in reproductive success occur,
Ne is always much smaller than in comparable monogamous populations (Nunney, 1993).
Low Ne/ N ratios could be the result of high variance in reproductive success, which decreases
the genetically effective size of a population without affecting census population. This factor
is especially important in highly fecund species in which most of the mortality occurs during
the egg and larval stages (Hedgecock, 1994). Boudry et al. (2002) also demonstrated that the
effective population size is strongly reduced in oysters, because of unbalanced parental
contribution, even when gametic contributions are balanced. Our results are in agreement with
these findings. Large variances in male contribution (σkm2) together with the small number of
contributing males were the factors that led to the reduced magnitude of Ne. In addition, the
skewed reproductive success and lower Ne resulted in an inbreeding rate of around 3% per
generation which is twice as much as the inbreeding expected in an idealized population. In
the absence of selection and under random mating, the expected level of inbreeding per
generation is 1.56%: ∆F = 1/8Nm + 1/8Nf (Falconer, 1986). The mass spawning breeding
schemes in both hapas had ∆F values three times the inbreeding constraint of 1% per
generation generally given for breeding programmes (Bijma, 2000). Small scale, mass-
spawning based genetic improvement programmes commonly produce lager number of
offspring from a limited number of parents and often produce their own broodstock
replacements. This together with the high observed variation in reproductive success and
Mating Systems
39
dominance of few males will have serious genetic consequences and might affect the fitness
of the population in subsequent generations.
In conclusion, this study represents the first step in understanding the mating patterns in O.
niloticus to quantify variance in reproductive success and estimate Ne. Further research should
be carried out to evaluate the influence of different factors affecting mating strategies (such as
sex ratio, stocking density etc) and hence optimize Ne.
Acknowledgements
This study is part of the first author's PhD study, funded by NUFFIC (The Netherlands
organization for international cooperation in higher education), INREF-Pond, Wageningen
University (http://www.inref-pond.org) and the WorldFish Center. We acknowledge the staff of
The WorldFish Centre, Abbassa, Egypt for providing the necessary help and facilities during the
experiments.
References
Andersson, S., 1992. Female preference for long tails in lekking Jackson’s widow birds:
experimental evidence. Animal Behaviour 43, 379-388.
Avise, J.C., Jones, A.G., Walker, D., Dewoody, J.A., and collaborators, 2002. Genetic mating
systems and reproductive natural histories of fishes: Lessons for ecology and evolution.
Ann. Rev. Genet. 36, 19-45.
Beehler, B.M., Foster, M.S., 1988. Hotshots, hotspots, and female preference in the
organization of lek mating systems. American Naturalist 131, 203-219.
Bekkevold, D., Hansen, M.W., Loeschcke, V., 2002. Male reproductive competition in
spawning aggregations of cod (Gadus morhua L.). Molecular Ecology 11, 91-102.
Bernatchez, L., Duchesne, P., 2000. Individual-based genotype analysis in studies of
parentage and population assignment: how many loci, how many alleles? Can. J. Fish.
Aquat. Sci. 57, 1-12.
Bijma, P., 2000. Long term Genetic Contributions. Prediction of Rates of Inbreeding and
Genetic Gain in Selected Populations. PhD thesis, Animal Breeding and Genetics
Group, Wageningen University, The Netherlands. pp. 205-206.
Bolger, T. and Connolly, P.L., 1989. The selection of suitable indices for the measurements
and analysis of fish condition. Journal Fish Biology 34, 171-182.
Chapter 2
40
Boudry, P., Collet, B., Cornette, F., Hervouet, V, Bonhomme, F., 2002. High variance in
reproductive success of the Pacific oyster (Crassostrea gigas, Thunberg) revealed by
microsatellite-based parentage analysis of multifactorial crosses. Aquaculture 204, 283-
296.
Brown, R.C., Woolliams, J.A., McAndrew, B.J., 2005. Factors influencing effective
population size in commercial populations of gilthead seabream, Sparus aurata.
Aquaculture 247, 219-225.
DeWoody, J.A, and Avise JC., 2001. Genetic perspectives on the natural history of fish
mating systems. Journal of Heredity 92, 167-172.
Duchesne, P., Godbout, M, Bernatchez, L., 2002. PAPA (package for the analysis of parental
allocation): a computer program for simulated and real parental allocation. Molecular
Ecology Notes 2, 191-193.
Falconer, D.S., 1986. Introduction to Quantitative Genetics, 2nd edition. Longman, England.
Fitzsimmons K., Gonzalez P., 2005. Over view of global trade and markets for tilapia-2005.
World Aquaculture 2005 book of abstracts, Bali, Indonesia.
Gowaty, P.A. 1994. Architects of sperm competition. Trends in Ecology and Evolution 9,
160-162.
Hedgecock, D., 1994. Does variance in reproductive success limit effective population sizes
of marine organisms? In: Beaumont, A.R. (Ed). Genetics and Evolution of aquatic
organisms. Chapman and Hall, London, pp 122-134.
Hoglund, J., Alatalo, R.V., 1995. Leks. Princeton University Press, Princeton, NJ.
Hulata G., Rothband, S., Avtalion, R., 1981. Evidence for multiple paternity in Sarotherodon
broods. Aquaculture 25, 281-283.
Johnstone, R.A., Earn, D.J.D., 1999. Imperfect female choice and male mating skew on leks
of different sizes. Behavioral Ecology and Socio-biology 45, 277-281.
Kellogg, K.A., Markert, J.A., Stauffer, J.R., Kocher, T.D., 1995. Microsatellite variation
demonstrates multiple paternity in lekking cichlid fishes from Lake Malawi, Africa.
Proc. R. Soc. London Ser. B 260, 79-84.
Kellogg, K.A., Markert, J.A. Stauffer, J.R., Kocher, T.D., 1998. Intraspecific brood mixing
and reduced polyandry in a maternal mouth-brooding cichlid. Behavioral Ecology 9,
309-312.
Kincaid, H.L., 1976. Inbreeding in rainbow trout (Salmo gairdneri). J. Fish. Res. Board Can.
33, 2420-2426.
Mating Systems
41
Lande, R. and Barrowclough, G.F., 1987. Effective population size, genetic variation, and
their use in population management. In: Soule, M.E. (Ed.) Viable populations for
conservation. Cambridge University Press, Cambridge, UK, pp. 87-123.
LeCroy, M., 1981. The genus Paradisaea: display and evolution. Am. Mus. Novit. 2714, 1-52
Lewis, D.S.C., 1980. Mixed species broods in Lake Malawi cichlids: an alternative to the
cuckoo theory. Copeia 4, 874-875.
Little, D.C., Lin, C.K., Turner, W.A. 1995. Commercial scale tilapia fry production in
Thailand. World Aquaculture 26(4), 20–24.
McKaye, K.R., 1997. Defense of a predator’s young by a herbivorous fish: an unusual
strategy. American Naturalist 111, 301-315.
McKaye, K.R., Louda, S.M., Stauffer, J.M., 1990. Bower size and male reproductive success
in a cichlid fish lek. Animal Behaviour 31, 206-210.
McKaye, K.R., and McKaye, N.M., 1977. Communal care and kidnapping of young by
parental cichlids. Evolution 31, 674-681.
McKaye, K.R., Mughogho, D.E., Lovullo, T.J., 1992. Formation of the selfish school.
Environmental Biology of Fishes 35, 213-218.
Neff, B.D., 2001., Genetic paternity analysis and breeding success in bluegill sunfish
(Lepomis macrochirus). Journal of Heredity 92, 111-119.
Nelson, C. M., 1995. Male size, spawning pit size and female mate choice in a lekking cichlid
fish. Animal Behaviour 50, 1587-1599.
Noonan, K.C., 1983. Female mate choice in the cichlid fish Cichlasoma nigrofasciatum.
Animal Behaviour 31, 1005-1010.
Nunney, L., 1993. The influence of mating systems and overlapping generations on effective
population size. Evolution 47, 1329-1341.
Parker, G.A., 1992. Snakes and female sexuality. Nature, 355:395-396.
Parker, A., Kornfield I., 1996. Polygynandry in Pseudotropheus zebra, a cichlid fish from
Lake Malawi. Environmental Biology Fishes 47, 345-52.
Rakitin, A, Ferguson, M.M. and Trippel, E.A., 1999. Sperm competition and fertilization
success in Atlantic cod (Gadus morhua): effect of sire size and condition factor on
gamete quality. Can. J. Fish. Aquat. Sci. 56, 2315-2323.
Rana, K.J., 1988. Reproductive biology and the hatchery rearing of tilapia eggs and fry. In:
Muir, J.F. and Roberts, R.J. (eds), Recent Advances in Aquaculture, vol. 3. Crook Helm,
London & Sydney, pp. 343–406.
Chapter 2
42
Reynolds, J.D., M.R. Gross., 1990. Costs and benefits of female mate choice: is there a lek
paradox? American Naturalist 136, 230-243.
Rezk, M.A., Kamel, E.A., Ramadan, A.A., Dunham, R.A., 2002. Comparative growth of
Egyptian tilapias in response to declining water temperature. Aquaculture 207, 239–247.
Ribbink A. J., Marsh, A. C., Sharp, B.J., 1980. Parental behaviour and mixed broods among
cichlid fish of Lake Malawi. South African Journal Zoology 15, 1-6.
Sancristobal, M and Chevalet, C., 1997. Error tolerant parent identification from a finite set of
individuals. Genetical Research. 70, 53-62.
SAS Institute, 1989. User’s Guide: Statistics, Release 6.12 Edition. SAS Institute, Cary, NC.
Stillman, R.A., Clutton-Brock, T.T., Sutherland, W.J., 1993. Blackholes, mate retention, and
the evolution of ungulate leks. Behavioral Ecology 4, 1-6.
Taborsky, M., 2001. The evolution of bourgeois, parasitic, and cooperative reproductive
behaviors in fishes. Journal of Heredity 92, 100-110.
Villanueva, B., Verspoor, E., and Visscher, P.M., 2002. Parental assignment in fish using
microsatllite genetic markers with finite number of parents and offspring. Animal
Genetics 33, 33-41.
Wiley, R.H., 1991. Lekking in birds and mammals: behavioral and evolutionary issues.
Advances in the study of behavior 20, 201-291
Wright, S., 1938. Size of population and breeding structure in relation to evolution. Science
87, 430-431.
Chapter 3
Effects of inbreeding on survival, body weight and fluctuating
asymmetry (FA) in Nile tilapia, Oreochromis niloticus
Yonas Fessehayea, b, c, Hans Komena,, Mahmoud A. Rezkc, Johan A.M. van Arendonka, Henk Bovenhuisa
a Animal Breeding and Genetics Group, Wageningen University, P.O. Box 338, 6700 AH, Wageningen,
The Netherlands
b Aquaculture and Fisheries group, Wageningen University, P.O. Box 338, 6700 AH, Wageningen,
The Netherlands
c The WorldFish Center, Regional office for Africa and W. Asia, Abbassa, Abou Hamad, Sharkia, Egypt
Aquaculture (accepted)

Effects of inbreeding on survival and body weight
45
Abstract
The present study investigated the effects of different levels of inbreeding on survival,
growth, body weight and fluctuating asymmetry (FA) in O. niloticus. We mated 20 sires and
35 dams in a full-sib/half-sib mating design to produce 35 full-sib families with expected
level of inbreeding (F %) of 0.0, 6.3, 9.4, 12.5 and 25. Fry were produced and reared in hapas
suspended in fertilized ponds until time of tagging. In total 1832 fish were tagged with floy®
tags and stocked in two fertilized earthen ponds. During the experiment fish were not fed but
relied entirely on natural food available in the ponds. Fish were harvested after a period of 8
months, which included 3 months of over-wintering. Results show that level of inbreeding
significantly affected early fry survival and body weight at stocking. Level of inbreeding did
not affect survival and body weight at harvest. Pond, weight at stocking, sire and dam had
significant effects on body weight and pond survival at harvest. FA was not significantly
affected by the level of inbreeding or sire. However, FA was significantly affected by dam
(which constitutes the combined effects of hapa rearing, age of fish and maternal (genetic)
effects), and pond. This supports the idea that FA is more influenced by environmental than
by genetic factors. The observed difference in effects of inbreeding on early and later life
stages can be explained by strong natural selection on fitness during over-wintering.
Chapter 3
46
1. Introduction
Harmful effects of inbreeding have been noticed in numerous animal and plant species for
many centuries. The magnitude and specific effects of inbreeding, however, are highly
variable because they depend on the genetic constitution of the species/populations under
study, and on interaction of genotypes with environment (Hedrick and Kalinowski, 2000).
Inbreeding depression studies in fish are limited to a few experiments, mostly on rainbow
trout (Aulstad and Kittelsen, 1971; Kincaid, 1976a,b; Gjerde et al., 1983; Su et al., 1996;
Pante et al., 2001). The estimates of these studies in fish came from analyses with different
models, conducted at different time periods and on populations with dissimilar levels of
average inbreeding. In general, they show the detrimental effects of inbreeding such as
reduced growth, viability, survival and increased number of abnormalities.
Inbreeding depression is more often observed in life-history traits than in morphological traits
(DeRose and Roff, 1999). However, several studies have also found evidence of inbreeding
depression on developmental stability of morphological traits (Leary et al., 1983; Alibert et
al., 1994). Inbreeding may affect developmental stability of morphological traits because the
lack of enzymatic diversity in homozygotes reduces the efficiency of normal developmental
homeostasis processes (Lerner, 1954: Quoted in Radwan and Drewniak, 2001), this being
reflected by an increase in fluctuating asymmetry (FA: Palmer and Strobeck, 1986). FA refers
to a pattern of bilateral variation in a sample of individuals, where the mean of right minus
left values of a trait is zero and the variation is normally distributed about that mean (Palmer,
1994).
In a previous paper (Fessehaye et al., 2006) we reported on the mating patterns of Nile tilapia
under semi-natural mating conditions. Natural reproduction in O. niloticus is characterised by
a high reproductive capacity of females, skewed reproductive success of males and very high
variance in reproductive success. These factors are likely to increase the level of inbreeding in
small populations; we estimated that natural mating could lead to an inbreeding level twice as
high as what is expected in an idealized random mating population of the same census size.
Although inbreeding has been shown to depress fitness in many species, there is little
knowledge on how inbreeding is manifested in fish at different stages of life and to our
knowledge no study has so far been conducted to examine the effect of inbreeding on life-
history and morphological traits in Nile tilapia. In the present study, we conducted single pair
Effects of inbreeding on survival and body weight
47
matings between pedigreed fish to produce progeny groups of fish with different levels of
inbreeding in order to investigate the consequences of inbreeding on body weight, growth,
survival and fluctuating asymmetry in O. niloticus
2. Materials and methods
2.1. Study population
All experimental procedures were conducted at The WorldFish Regional Center experimental
station at Abbassa, Egypt. The base population at the station was produced in the spring of
2000 from all possible diallele crosses between four local Egyptian strains (Rezk et al., 2002).
Individuals in the base population (G0) were unrelated. Under the selection programmes
described in Charo-Karisa (2006), G1 and G2 populations were produced in 2002 and 2003
respectively. Pedigreed and non-inbred fish from the second generation (G2) of this selection
programmes were used to produce offspring with five levels of inbreeding (F, %: 0, 6.3, 9.4,
12.5, and 25). Pedigree information was used to determine the level of inbreeding relative to
the known founders of the population (G0) which were assumed to be unrelated. We followed
Wright’s (1922) approach of path counting to calculate the additive genetic relationship
between parents. Inbreeding was calculated as half the additive genetic relationship of the
parents.
To disentangle the additive genetic effects and the effects of inbreeding, the experimental fish
were produced in a full-sib/half-sib mating design in which each sire was mated to two dams
and each dam mated to only one sire to produce half-sib families with different levels of
inbreeding. E.g. a sire was mated to one dam giving progeny with expected inbreeding level
of F = 25% and mated to another dam to produce progeny with F = 0%. In total 35 full-sib
families were produced from 20 sires and 35 dams. These include 15 sires which were mated
with two dams and five sires which were mated to one dam each.
Fry were produced over a period of five weeks (August 18 till September 22, 2004). At swim-
up, each family was reduced to 100 fry per hapa (hereafter ‘thinning’) and separately reared in
a 2 × 3 m hapa until the last family reached tagging size (mean of 2 g). Hapas were set in one
1000 m2 earthen pond that received a daily application of chicken manure at the rate of 50
kg/ha/day. No supplemental feeds were given throughout the growth period.
Chapter 3
48
At an average age of 8 weeks post hatching, a maximum of 60 fish/family were tagged with
Floy® tags between the dorsal fin and lateral line. After tagging, fish were returned to hapas
and allowed to recover from tagging stress for 4 days. The 60 progenies from each family
were then divided into two random groups of 30 fry and each group was stocked in one of two
1000 m2 grow-out ponds. In total 947 and 944 fish were stocked; 53 and 56 untagged fish
were added to the first and second pond respectively to adjust the stocking density to 1 fish
per m2. Ponds were fertilized with 50 kg/ha/day of chicken manure on a daily basis. Fish were
harvested after a period of about 8 months, which included an over wintering period of 3
months.
2.2. Data
Measurements in hapas (Hapa rearing)
At swim-up, the total number of hatched fry and the number of fry with deformities per dam
were counted. Fry were again counted at the time of tagging and hapa survival (hereafter
‘early fry survival’) was calculated as 100)( 0 xNN t , where Nt is the number of fry at tagging
and N0 is the number of fry at thinning. At the time of stocking, fish were individually
weighed.
Measurements in Ponds (Pond rearing)
Eight months after stocking, fish were harvested and the following measurements were taken:
body weight, standard length, total length, sex, gonad weight and maturity stage of gonads.
Total number of fish was counted to calculate survival of fish between stocking and
harvesting (hereafter ‘pond survival’). Pond survival for each individual fish was recorded on
binary scale (1 = survived, 0 = died). Maturity indices were recorded after visual examination
of the gonad and evaluating the stage of development based on size, shape, texture and colour
of the gonads as described in Owiti and Dadzie (1989). Maturity stages of 3, 4 and 5 were
categorized as mature and scored as 1; maturity stages of 1 and 2 were categorized as
immature and scored as 0.
Specific growth rate (SGR, % day-1) was calculated as: tBWBWx if )lnln(100 − , where BWi,
BWf are individual body weight at stocking and harvest respectively and t is the number of
days between stocking and harvesting.
Effects of inbreeding on survival and body weight
49
Gonado-somatic index (GSI): was calculated as ( )BWtGonadweighx100 where BW is the
body weight of fish.
Fluctuating asymmetry (FA)
A population of 319 fish (Average weight = 156.77, CV = 30.8%) across different levels of
inbreeding (see Table 7) were selected for the measurement of fluctuating asymmetry.
Pectoral fin, pelvic fin and first gill branchial arches were dissected from both sides of the
fish, cleaned and examined using a dissecting microscope. Four meristic traits (number of
pectoral fin rays, number of pelvic fin rays, number of gill rakers on the upper first branchial
arch and number of gill rakers on the lower first branchial arch) and one metric trait (head
length) were measured on both the left and right side of all fish. Gill rakers were divided into
upper and lower gill rakers because these have been show to vary independently (Leary et al.
1983). All measurements were taken by one observer to ensure consistent measurements on
all fish.
2.3. Data Analysis
Hapa rearing
To analyze the factors affecting early life traits, two models were used. Model 1 was used for
those traits with only one record per dam. Model 2 was used for traits with several records per
dam
Total number of hatched fry, hapa survival, and fry deformity
The effects of dam weight and inbreeding level of offspring on total number of hatched fry,
hapa survival and fry deformity were evaluated using the following model:
Yi= µ + β1*ln(Wi) + β2Fi + εi………………………………….………………...……(Model 1)
Where Yi is the trait measurement on offspring of ith dam; µ is the overall mean; ln(Wi) is the
co-variable of the natural logarithm of body weight of ith dam; β1 is the regression coefficient
of Yi on ln(Wi); Fi is the inbreeding level of the offspring produced by ith dam; β2 is the
regression coefficient of Yi on Fi; and εi is the residual error term.
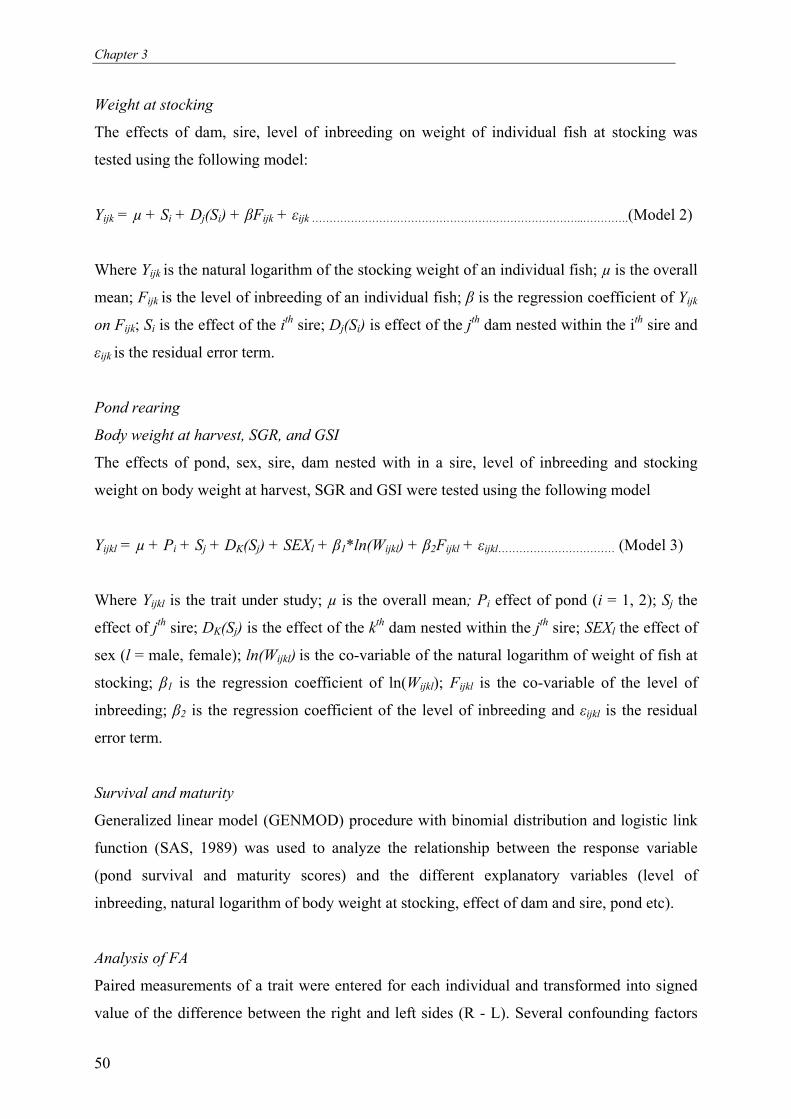
Chapter 3
50
Weight at stocking
The effects of dam, sire, level of inbreeding on weight of individual fish at stocking was
tested using the following model:
Yijk = µ + Si + Dj(Si) + βFijk + εijk …………………………………………………………………..………….(Model 2)
Where Yijk is the natural logarithm of the stocking weight of an individual fish; µ is the overall
mean; Fijk is the level of inbreeding of an individual fish; β is the regression coefficient of Yijk
on Fijk; Si is the effect of the ith sire; Dj(Si) is effect of the j
th dam nested within the ith sire and
εijk is the residual error term.
Pond rearing
Body weight at harvest, SGR, and GSI
The effects of pond, sex, sire, dam nested with in a sire, level of inbreeding and stocking
weight on body weight at harvest, SGR and GSI were tested using the following model
Yijkl = µ + Pi + Sj + DK(Sj) + SEXl + β1*ln(Wijkl) + β2Fijkl + εijkl…………………………… (Model 3)
Where Yijkl is the trait under study; µ is the overall mean; Pi effect of pond (i = 1, 2); Sj the
effect of jth sire; DK(Sj) is the effect of the kth dam nested within the jth sire; SEXl the effect of
sex (l = male, female); ln(Wijkl) is the co-variable of the natural logarithm of weight of fish at
stocking; β1 is the regression coefficient of ln(Wijkl); Fijkl is the co-variable of the level of
inbreeding; β2 is the regression coefficient of the level of inbreeding and εijkl is the residual
error term.
Survival and maturity
Generalized linear model (GENMOD) procedure with binomial distribution and logistic link
function (SAS, 1989) was used to analyze the relationship between the response variable
(pond survival and maturity scores) and the different explanatory variables (level of
inbreeding, natural logarithm of body weight at stocking, effect of dam and sire, pond etc).
Analysis of FA
Paired measurements of a trait were entered for each individual and transformed into signed
value of the difference between the right and left sides (R - L). Several confounding factors
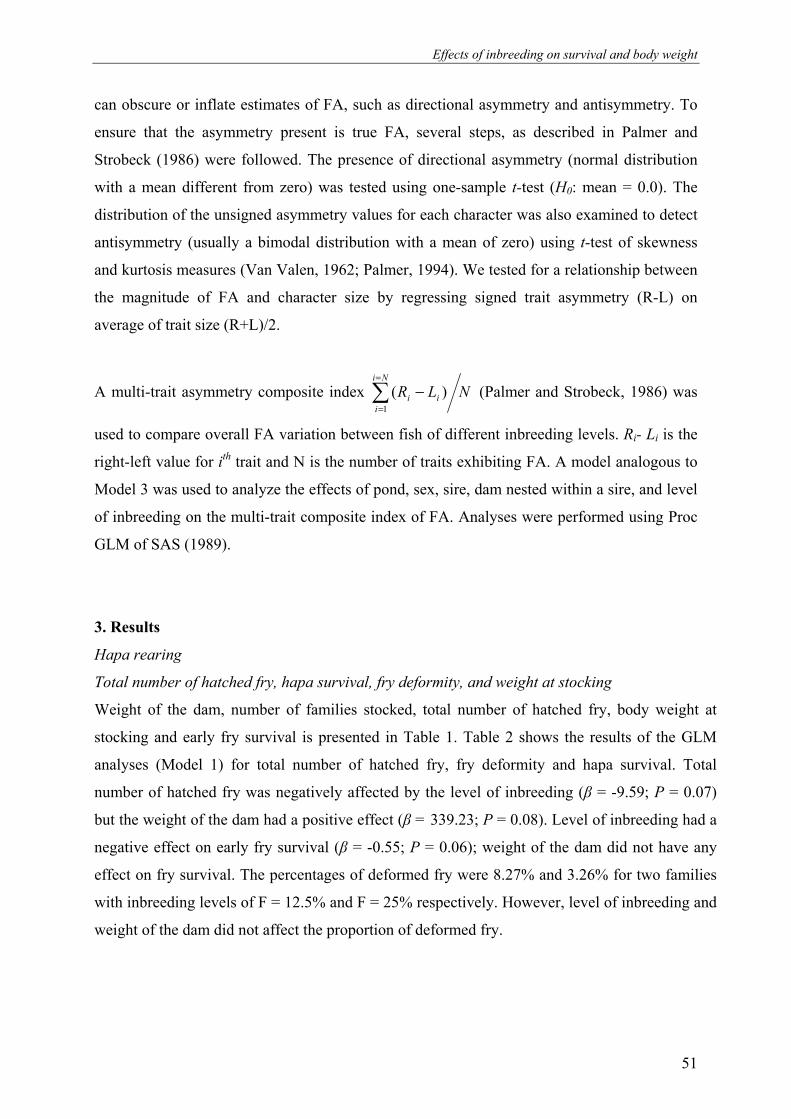
Effects of inbreeding on survival and body weight
51
can obscure or inflate estimates of FA, such as directional asymmetry and antisymmetry. To
ensure that the asymmetry present is true FA, several steps, as described in Palmer and
Strobeck (1986) were followed. The presence of directional asymmetry (normal distribution
with a mean different from zero) was tested using one-sample t-test (H0: mean = 0.0). The
distribution of the unsigned asymmetry values for each character was also examined to detect
antisymmetry (usually a bimodal distribution with a mean of zero) using t-test of skewness
and kurtosis measures (Van Valen, 1962; Palmer, 1994). We tested for a relationship between
the magnitude of FA and character size by regressing signed trait asymmetry (R-L) on
average of trait size (R+L)/2.
A multi-trait asymmetry composite index NLRNi
i
ii∑=
=
−1
)( (Palmer and Strobeck, 1986) was
used to compare overall FA variation between fish of different inbreeding levels. Ri- Li is the
right-left value for ith trait and N is the number of traits exhibiting FA. A model analogous to
Model 3 was used to analyze the effects of pond, sex, sire, dam nested within a sire, and level
of inbreeding on the multi-trait composite index of FA. Analyses were performed using Proc
GLM of SAS (1989).
3. Results
Hapa rearing
Total number of hatched fry, hapa survival, fry deformity, and weight at stocking
Weight of the dam, number of families stocked, total number of hatched fry, body weight at
stocking and early fry survival is presented in Table 1. Table 2 shows the results of the GLM
analyses (Model 1) for total number of hatched fry, fry deformity and hapa survival. Total
number of hatched fry was negatively affected by the level of inbreeding (β = -9.59; P = 0.07)
but the weight of the dam had a positive effect (β = 339.23; P = 0.08). Level of inbreeding had a
negative effect on early fry survival (β = -0.55; P = 0.06); weight of the dam did not have any
effect on fry survival. The percentages of deformed fry were 8.27% and 3.26% for two families
with inbreeding levels of F = 12.5% and F = 25% respectively. However, level of inbreeding and
weight of the dam did not affect the proportion of deformed fry.
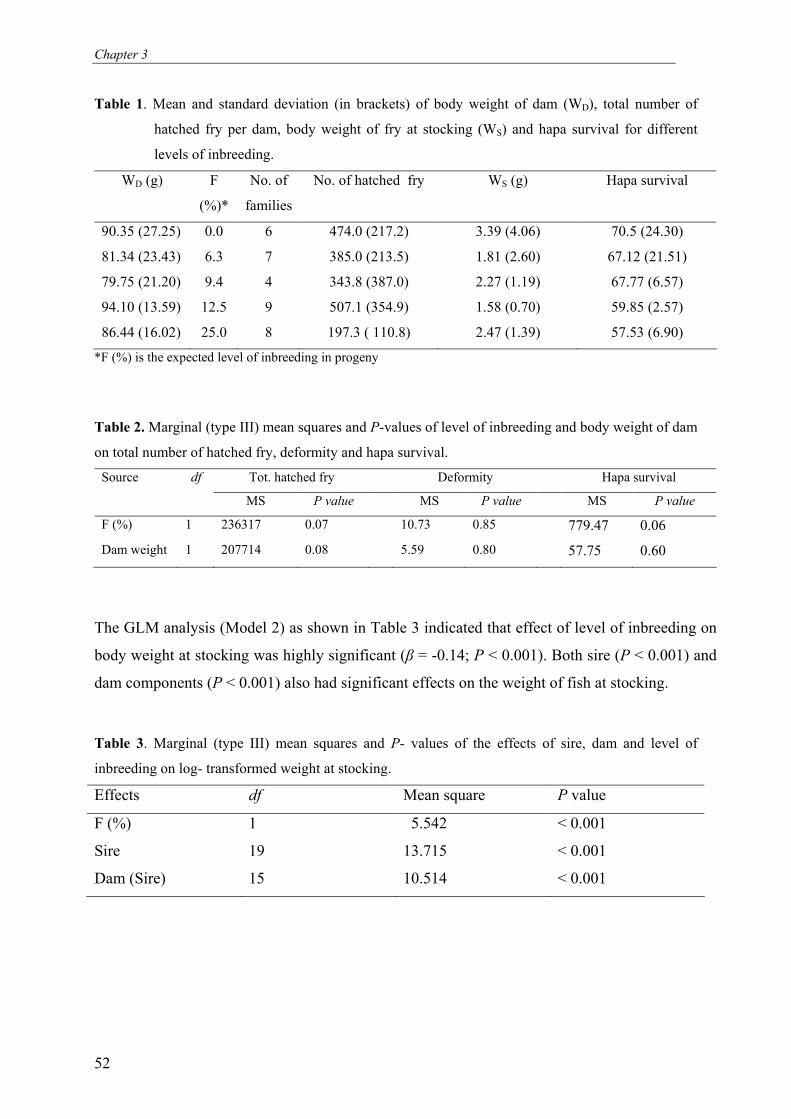
Chapter 3
52
Table 1. Mean and standard deviation (in brackets) of body weight of dam (WD), total number of
hatched fry per dam, body weight of fry at stocking (WS) and hapa survival for different
levels of inbreeding.
WD (g)
F
(%)*
No. of
families
No. of hatched fry WS (g) Hapa survival
90.35 (27.25) 0.0 6 474.0 (217.2) 3.39 (4.06) 70.5 (24.30)
81.34 (23.43) 6.3 7 385.0 (213.5) 1.81 (2.60) 67.12 (21.51)
79.75 (21.20) 9.4 4 343.8 (387.0) 2.27 (1.19) 67.77 (6.57)
94.10 (13.59) 12.5 9 507.1 (354.9) 1.58 (0.70) 59.85 (2.57)
86.44 (16.02) 25.0 8 197.3 ( 110.8) 2.47 (1.39) 57.53 (6.90)
*F (%) is the expected level of inbreeding in progeny
Table 2. Marginal (type III) mean squares and P-values of level of inbreeding and body weight of dam
on total number of hatched fry, deformity and hapa survival.
Tot. hatched fry Deformity Hapa survival Source df
MS P value MS P value MS P value
F (%) 1 236317 0.07 10.73 0.85 779.47 0.06
Dam weight 1 207714 0.08 5.59 0.80 57.75 0.60
The GLM analysis (Model 2) as shown in Table 3 indicated that effect of level of inbreeding on
body weight at stocking was highly significant (β = -0.14; P < 0.001). Both sire (P < 0.001) and
dam components (P < 0.001) also had significant effects on the weight of fish at stocking.
Table 3. Marginal (type III) mean squares and P- values of the effects of sire, dam and level of
inbreeding on log- transformed weight at stocking.
Effects df Mean square P value
F (%) 1 5.542 < 0.001
Sire 19 13.715 < 0.001
Dam (Sire) 15 10.514 < 0.001
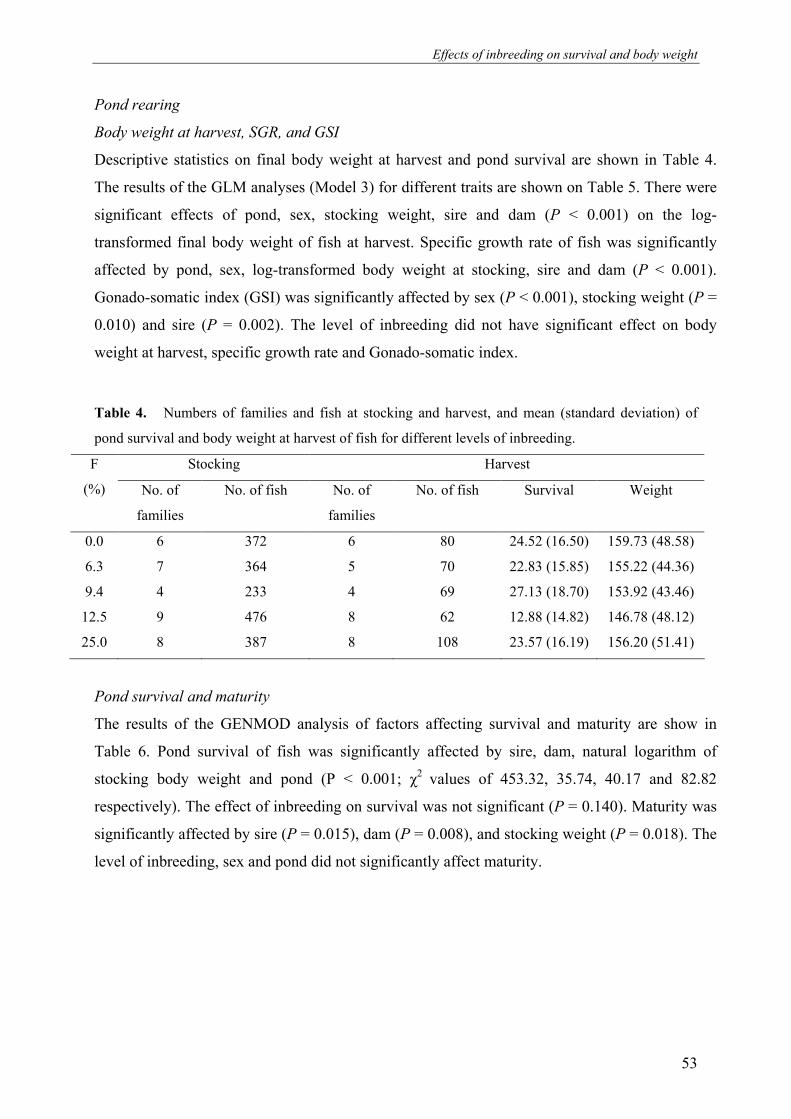
Effects of inbreeding on survival and body weight
53
Pond rearing
Body weight at harvest, SGR, and GSI
Descriptive statistics on final body weight at harvest and pond survival are shown in Table 4.
The results of the GLM analyses (Model 3) for different traits are shown on Table 5. There were
significant effects of pond, sex, stocking weight, sire and dam (P < 0.001) on the log-
transformed final body weight of fish at harvest. Specific growth rate of fish was significantly
affected by pond, sex, log-transformed body weight at stocking, sire and dam (P < 0.001).
Gonado-somatic index (GSI) was significantly affected by sex (P < 0.001), stocking weight (P =
0.010) and sire (P = 0.002). The level of inbreeding did not have significant effect on body
weight at harvest, specific growth rate and Gonado-somatic index.
Table 4. Numbers of families and fish at stocking and harvest, and mean (standard deviation) of
pond survival and body weight at harvest of fish for different levels of inbreeding.
Stocking Harvest F
(%) No. of
families
No. of fish No. of
families
No. of fish Survival Weight
0.0 6 372 6 80 24.52 (16.50) 159.73 (48.58)
6.3 7 364 5 70 22.83 (15.85) 155.22 (44.36)
9.4 4 233 4 69 27.13 (18.70) 153.92 (43.46)
12.5 9 476 8 62 12.88 (14.82) 146.78 (48.12)
25.0 8 387 8 108 23.57 (16.19) 156.20 (51.41)
Pond survival and maturity
The results of the GENMOD analysis of factors affecting survival and maturity are show in
Table 6. Pond survival of fish was significantly affected by sire, dam, natural logarithm of
stocking body weight and pond (P < 0.001; χ2 values of 453.32, 35.74, 40.17 and 82.82
respectively). The effect of inbreeding on survival was not significant (P = 0.140). Maturity was
significantly affected by sire (P = 0.015), dam (P = 0.008), and stocking weight (P = 0.018). The
level of inbreeding, sex and pond did not significantly affect maturity.
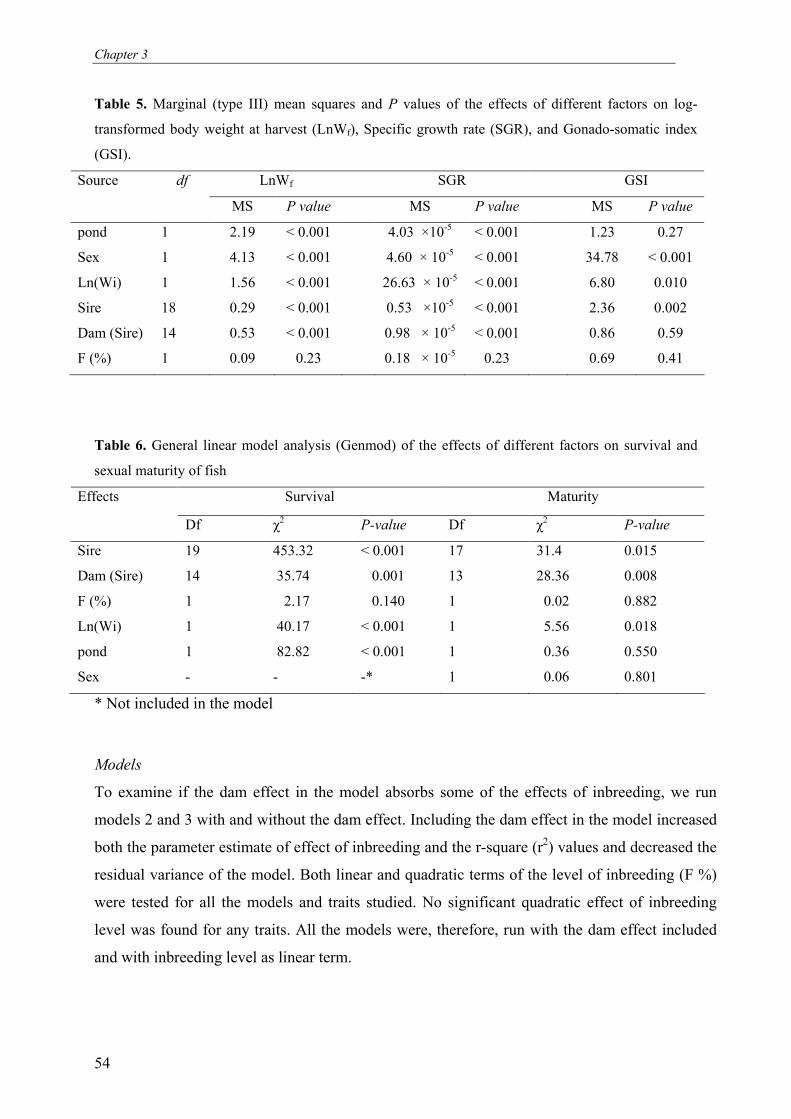
Chapter 3
54
Table 5. Marginal (type III) mean squares and P values of the effects of different factors on log-
transformed body weight at harvest (LnWf), Specific growth rate (SGR), and Gonado-somatic index
(GSI).
LnWf SGR GSI Source df
MS P value MS P value MS P value
pond 1 2.19 < 0.001 4.03 ×10⁻⁵ < 0.001 1.23 0.27
Sex 1 4.13 < 0.001 4.60 × 10⁻⁵ < 0.001 34.78 < 0.001
Ln(Wi) 1 1.56 < 0.001 26.63 × 10⁻⁵ < 0.001 6.80 0.010
Sire 18 0.29 < 0.001 0.53 ×10⁻⁵ < 0.001 2.36 0.002
Dam (Sire) 14 0.53 < 0.001 0.98 × 10⁻⁵ < 0.001 0.86 0.59
F (%) 1 0.09 0.23 0.18 × 10⁻⁵ 0.23 0.69 0.41
Table 6. General linear model analysis (Genmod) of the effects of different factors on survival and
sexual maturity of fish
Survival Maturity Effects
Df χ2 P-value Df χ2 P-value
Sire 19 453.32 < 0.001 17 31.4 0.015
Dam (Sire) 14 35.74 0.001 13 28.36 0.008
F (%) 1 2.17 0.140 1 0.02 0.882
Ln(Wi) 1 40.17 < 0.001 1 5.56 0.018
pond 1 82.82 < 0.001 1 0.36 0.550
Sex - - -* 1 0.06 0.801
* Not included in the model
Models
To examine if the dam effect in the model absorbs some of the effects of inbreeding, we run
models 2 and 3 with and without the dam effect. Including the dam effect in the model increased
both the parameter estimate of effect of inbreeding and the r-square (r2) values and decreased the
residual variance of the model. Both linear and quadratic terms of the level of inbreeding (F %)
were tested for all the models and traits studied. No significant quadratic effect of inbreeding
level was found for any traits. All the models were, therefore, run with the dam effect included
and with inbreeding level as linear term.
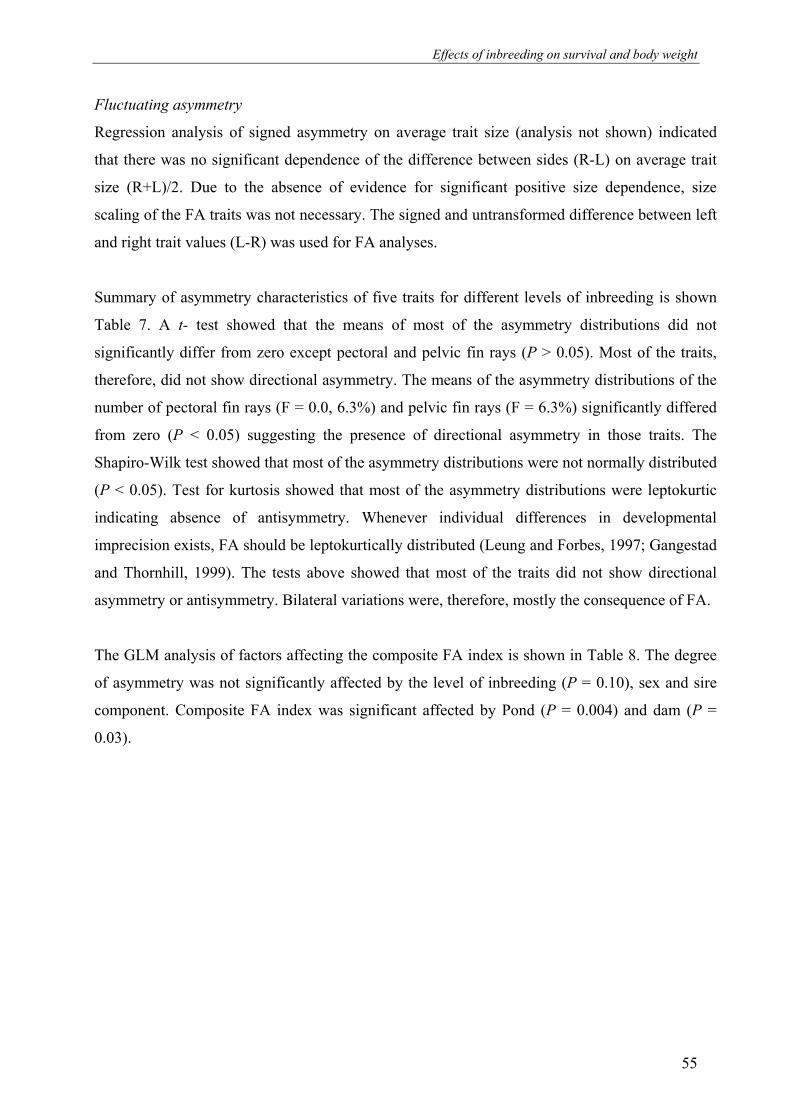
Effects of inbreeding on survival and body weight
55
Fluctuating asymmetry
Regression analysis of signed asymmetry on average trait size (analysis not shown) indicated
that there was no significant dependence of the difference between sides (R-L) on average trait
size (R+L)/2. Due to the absence of evidence for significant positive size dependence, size
scaling of the FA traits was not necessary. The signed and untransformed difference between left
and right trait values (L-R) was used for FA analyses.
Summary of asymmetry characteristics of five traits for different levels of inbreeding is shown
Table 7. A t- test showed that the means of most of the asymmetry distributions did not
significantly differ from zero except pectoral and pelvic fin rays (P > 0.05). Most of the traits,
therefore, did not show directional asymmetry. The means of the asymmetry distributions of the
number of pectoral fin rays (F = 0.0, 6.3%) and pelvic fin rays (F = 6.3%) significantly differed
from zero (P < 0.05) suggesting the presence of directional asymmetry in those traits. The
Shapiro-Wilk test showed that most of the asymmetry distributions were not normally distributed
(P < 0.05). Test for kurtosis showed that most of the asymmetry distributions were leptokurtic
indicating absence of antisymmetry. Whenever individual differences in developmental
imprecision exists, FA should be leptokurtically distributed (Leung and Forbes, 1997; Gangestad
and Thornhill, 1999). The tests above showed that most of the traits did not show directional
asymmetry or antisymmetry. Bilateral variations were, therefore, mostly the consequence of FA.
The GLM analysis of factors affecting the composite FA index is shown in Table 8. The degree
of asymmetry was not significantly affected by the level of inbreeding (P = 0.10), sex and sire
component. Composite FA index was significant affected by Pond (P = 0.004) and dam (P =
0.03).
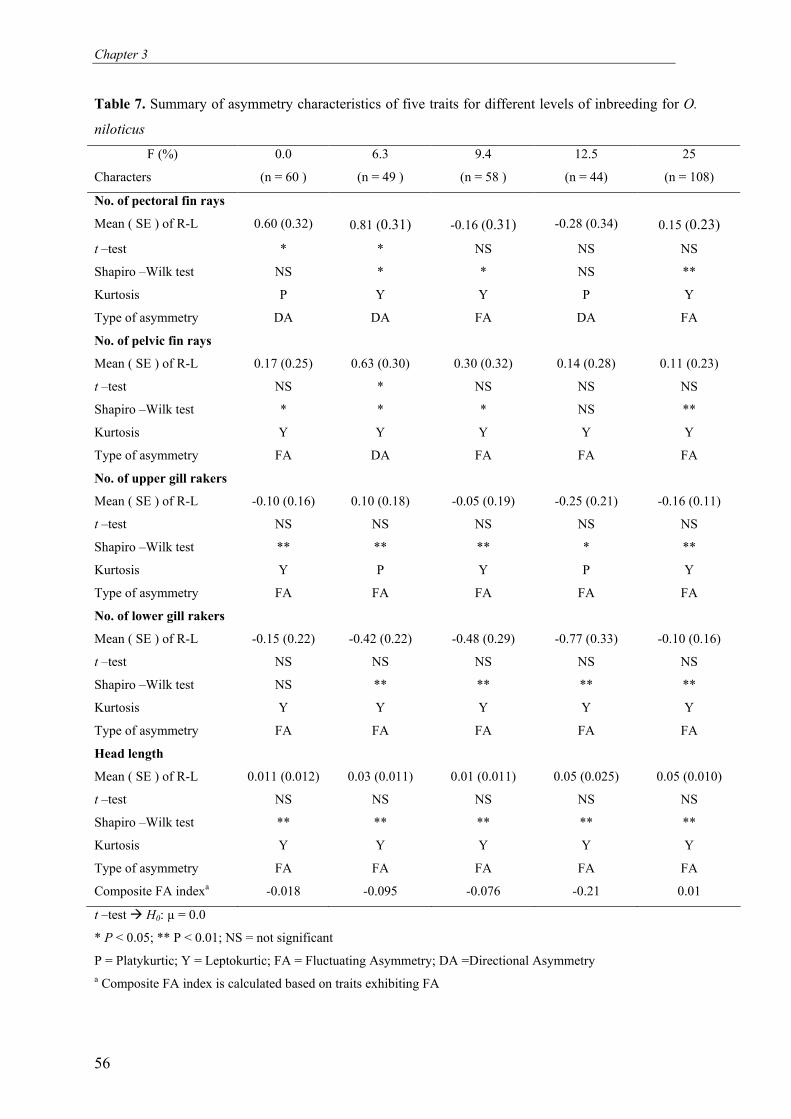
Chapter 3
56
Table 7. Summary of asymmetry characteristics of five traits for different levels of inbreeding for O.
niloticus
F (%)
Characters
0.0
(n = 60 )
6.3
(n = 49 )
9.4
(n = 58 )
12.5
(n = 44)
25
(n = 108)
No. of pectoral fin rays
Mean ( SE ) of R-L 0.60 (0.32) 0.81 (0.31) -0.16 (0.31) -0.28 (0.34) 0.15 (0.23)
t –test * * NS NS NS
Shapiro –Wilk test NS * * NS **
Kurtosis P Y Y P Y
Type of asymmetry DA DA FA DA FA
No. of pelvic fin rays
Mean ( SE ) of R-L 0.17 (0.25) 0.63 (0.30) 0.30 (0.32) 0.14 (0.28) 0.11 (0.23)
t –test NS * NS NS NS
Shapiro –Wilk test * * * NS **
Kurtosis Y Y Y Y Y
Type of asymmetry FA DA FA FA FA
No. of upper gill rakers
Mean ( SE ) of R-L -0.10 (0.16) 0.10 (0.18) -0.05 (0.19) -0.25 (0.21) -0.16 (0.11)
t –test NS NS NS NS NS
Shapiro –Wilk test ** ** ** * **
Kurtosis Y P Y P Y
Type of asymmetry FA FA FA FA FA
No. of lower gill rakers
Mean ( SE ) of R-L -0.15 (0.22) -0.42 (0.22) -0.48 (0.29) -0.77 (0.33) -0.10 (0.16)
t –test NS NS NS NS NS
Shapiro –Wilk test NS ** ** ** **
Kurtosis Y Y Y Y Y
Type of asymmetry FA FA FA FA FA
Head length
Mean ( SE ) of R-L 0.011 (0.012) 0.03 (0.011) 0.01 (0.011) 0.05 (0.025) 0.05 (0.010)
t –test NS NS NS NS NS
Shapiro –Wilk test ** ** ** ** **
Kurtosis Y Y Y Y Y
Type of asymmetry FA FA FA FA FA
Composite FA indexa -0.018 -0.095 -0.076 -0.21 0.01
t –test � H0: µ = 0.0
* P < 0.05; ** P < 0.01; NS = not significant
P = Platykurtic; Y = Leptokurtic; FA = Fluctuating Asymmetry; DA =Directional Asymmetry
a Composite FA index is calculated based on traits exhibiting FA
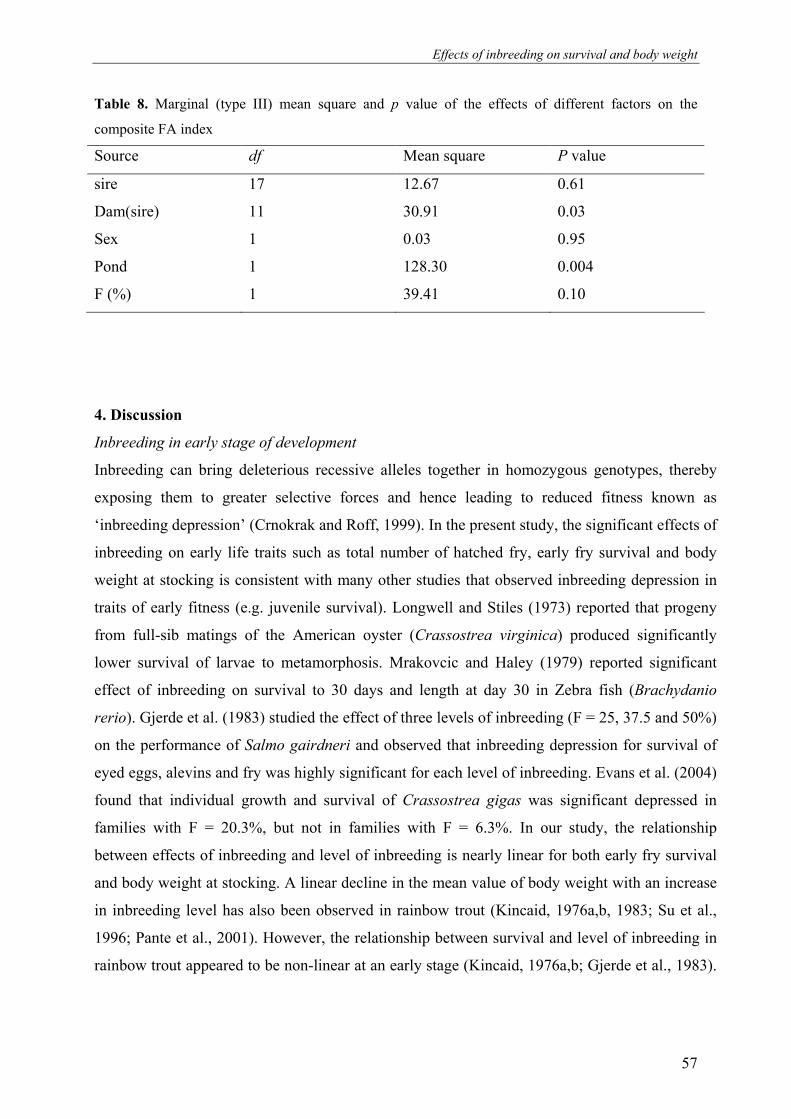
Effects of inbreeding on survival and body weight
57
Table 8. Marginal (type III) mean square and p value of the effects of different factors on the
composite FA index
Source df Mean square P value
sire 17 12.67 0.61
Dam(sire) 11 30.91 0.03
Sex 1 0.03 0.95
Pond 1 128.30 0.004
F (%) 1 39.41 0.10
4. Discussion
Inbreeding in early stage of development
Inbreeding can bring deleterious recessive alleles together in homozygous genotypes, thereby
exposing them to greater selective forces and hence leading to reduced fitness known as
‘inbreeding depression’ (Crnokrak and Roff, 1999). In the present study, the significant effects of
inbreeding on early life traits such as total number of hatched fry, early fry survival and body
weight at stocking is consistent with many other studies that observed inbreeding depression in
traits of early fitness (e.g. juvenile survival). Longwell and Stiles (1973) reported that progeny
from full-sib matings of the American oyster (Crassostrea virginica) produced significantly
lower survival of larvae to metamorphosis. Mrakovcic and Haley (1979) reported significant
effect of inbreeding on survival to 30 days and length at day 30 in Zebra fish (Brachydanio
rerio). Gjerde et al. (1983) studied the effect of three levels of inbreeding (F = 25, 37.5 and 50%)
on the performance of Salmo gairdneri and observed that inbreeding depression for survival of
eyed eggs, alevins and fry was highly significant for each level of inbreeding. Evans et al. (2004)
found that individual growth and survival of Crassostrea gigas was significant depressed in
families with F = 20.3%, but not in families with F = 6.3%. In our study, the relationship
between effects of inbreeding and level of inbreeding is nearly linear for both early fry survival
and body weight at stocking. A linear decline in the mean value of body weight with an increase
in inbreeding level has also been observed in rainbow trout (Kincaid, 1976a,b, 1983; Su et al.,
1996; Pante et al., 2001). However, the relationship between survival and level of inbreeding in
rainbow trout appeared to be non-linear at an early stage (Kincaid, 1976a,b; Gjerde et al., 1983).
Chapter 3
58
Wang et al. (2002) attributed this poor fit to either incomplete survival data or use of
inappropriate model to analyze the data.
Inbreeding in later stages of development
Inbreeding did not have significant effects on body weight and survival at later stages of life.
This is in agreement with results from Aulstad et al. (1972) who reported non-significant effect
of inbreeding depression (F = 25%) for growth of rainbow trout fry at 331 days. Gjerde et al.
(1983) also reported significant effect of inbreeding on survival of rainbow trout fingerlings,
while fry weight at 160 days after first feeding was not significantly affected by any of the
inbreeding levels studied (F = 25, 37.5 and 50%). With inbreeding, recessive alleles conferring
inbreeding depression are exposed to natural selection, and therefore may be purged. As a result,
inbreeding depression is expected to be reduced over time in groups of older individuals (Lande
and Schemske, 1985): when inbreeding is high, lethals and sublethals expressed early in
development leave relatively more heterozygous individuals and thus give lower estimates of
inbreeding depression at later stages. Organisms with high fecundity most easily absorb (and
hide) such inbreeding depression in later stages of life (Savolainen and Hedrick, 1995).
However, Kincaid (1983) and Su et al. (1996) reported that the effect of inbreeding increased
with age on traits such as body weight. This trend of increasing depression in body weight with
fish age might be associated with the cubic nature of the growth curve magnifying the reduced
growth rate of the inbred fish (Kincaid, 1983). However, even when inbreeding depression in
body weight at the various age stages was calculated in % of the mean in an attempt to eliminate
the effect of scale, the overall trend was still there (Su et al., 1996). It is possible that the lower
survival at later stages of development in our experiment might be responsible for this difference
in observations between trout and tilapia. Over-wintering survival in our experiment was very
low for all levels of inbreeding (≈ 20%) and survival at harvest was significantly affected by
body weight of fish at stocking (Table 6). Charo-Karisa et al. (2005) showed that smaller fish in
O. niloticus are more susceptible to low temperature stress. Lower temperature during over-
wintering, therefore, might have killed smaller individuals across all inbreeding levels. Another
important difference between our study and that of Kincaid et al. (1983) is that in our study, fish
were reared under semi-natural conditions, i.e. without any additional feeding. The apparent lack
of inbreeding depression in later stages of life could, therefore, be due to the combined severe
selective forces of low food availability and low temperature during over-wintering period,
which might have diminished the differences in survival among the different levels of inbreeding
and hence might have masked the effect of inbreeding.
Effects of inbreeding on survival and body weight
59
Fluctuating asymmetry
Developmental stability is thought to depend upon heterozygosity. Heterozygotes are able to
synthesise a wider range of biochemical products and thus to adjust development to a broader
range of environmental variables (Lerner, 1954). There is increasing evidence that environmental
stress may increase FA (Parsons, 1990) but there are only few studies that clearly demonstrate
the influence of genetic stress on developmental stability (Batter-ham et al., 1996; Brakefield and
Breuker, 1996). Our results show that fluctuating asymmetry, as estimated by the composite FA
index, was not significantly affected by the level of inbreeding. This is in agreement with
Bongers et al. (1997) who compared three F-isogenic and one partly outbred strains of carp, and
concluded that the level of inbreeding does not seem to affect the true environmental variation
and developmental stability. The present study also shows that no effect of sire was found while
the dam and pond effects were highly significant. The dam effect, in our experiment, constitutes
the effect of hapa rearing, maternal (genetic) effects and the age of fish. These results suggest
that the contribution of genetic factors to variation in FA is limited. Genetic variation for FA is
often assumed to be maintained by heterosis, on the basis that heterozygotes for enzyme–coding
loci will be better able to withstand stress imposed by variable environments (Lerner, 1954:
Quoted in Radwan and Drewniak, 2001). However, in recent years, the presumed link between
allozyme/protein heterozygosity and FA has been increasingly questioned (Clarke 1993). A
meta-analysis by VØllestad et al. (1999) showed that heterozygosity explained only a very small
(1%) amount of variation in FA, and most investigators now appear to agree that there is very
little additive genetic variation for FA in most characters. Our results support this conclusion.
Concluding remarks
The results of this study emphasize that inbreeding can have significant effects on early life traits
such as fry survival and body weight, but not on later stages of development. The underlying
reason for this could be that the set of detrimental alleles primarily responsible for lowered
fitness due to inbreeding is effectively purged by (natural) selection. However, reduced
differences between inbred and outbred individuals within small populations should not be used
to infer that purging has been effective in eliminating all the negative effects of inbreeding as
inbred individuals that survive to adulthood may still suffer reduced fitness via poor performance
in mating competition and reduced fecundity.
Chapter 3
60
Acknowledgements
This study is part of the first author's PhD study, funded by NUFFIC (The Netherlands
organization for international cooperation in higher education), INREF-Pond, Wageningen
University (http://www.inref-pond.org) and the WorldFish Center. We acknowledge the staff of
The WorldFish Centre, Abbassa, Egypt for providing the necessary help and facilities during the
experiments.
References
Alibert, P., Renaud, S., Dod, B., Bonhomme, F., Auffray, J.C., 1994. Fluctuating asymmetry
in the Mus musculus hybrid zone: heterotic effect in disrupted co-adapted genomes.
Proc. R. Soc. Lond. B 258, 53–59.
Aulstad, D., and Kittelsen, A., 1971. Abnormal body curvature of rainbow trout (Salmo
gairdneri) inbred fry. J. Fish. Res. Board Can. 28, 1918-1920.
Aulstad, D., Gjedrem, T., Skejervold, H., 1972. Genetic and environmental sources of
variation in length and weight of rainbow trout (Salmo gairdneri). J. Fish. Res.
Board Can. 29, 237-241.
Batterham, P., Davies, A.G., Game, A.Y. McKenzie, J.A., 1996. Asymmetry - where
evolutionary and developmental genetics meet. Bioessays 18, 841-845.
Bongers, A.B.J., Ben-Ayed, M.Z., Doulabi, B.Z., Komen, J., Richter, C.J.J., 1997. Origin of
variation in isogenic, gynogenetic, and androgenetic strains of common carp,
Cyprinus carpio. The Journal of Experimental Zoology 277, 72-79.
Brakefield, P.M., and Breuker, C.J., 1996. The genetical basis of Fluctuating asymmetry for
developmentally integrated traits in a butterfly eyespot pattern. Proc. R. Soc. Lond.
B 263, 1557-1563.
Charo-Karisa, H., 2006. Selection for growth of Nile tilapia (Oreochromis niloticus L) in low-
input environments. PhD thesis, Wageningen University, The Netherlands.
Charo-Karisa, H., Rezk, M.A., Bovenhuis, H., Komen, H., 2005. Heritability of cold tolerance
in Nile tilapia, Oreochromis niloticus, juveniles. Aquaculture 249, 115–123.
Clarke, G.M., 1993. The genetic basis of developmental stability: I. Relationships between
stability, heterozygosity and genomic co-adaptation. Genetica 89, 15–23.
Crnokrak, P., and Roff, D. A., 1999. Inbreeding depression in the wild. Heredity 83, 260–270.
DeRose, M.A., and Roff, D.A., 1999. A comparison of inbreeding depression in life-history
and morphological traits in animals. Evolution 53, 1288-1292.

Effects of inbreeding on survival and body weight
61
Evans, F., Matson, S., Brake, J., Langdon, C., 2004. The effect of inbreeding on performance
traits of adult Pacific oyster (Crassostrea gigas). Aquaculture 230, 89-98.
Fessehaye, Y., El-bialy, Z., Rezk, M.A., Crooijmans, R., Bovenhuis, H., Komen, H., 2006.
Mating systems and male reproductive success in Nile tilapia (Oreochromis
niloticus) in breeding hapas: A microsatellite analysis. Aquaculture 256, 148-158
Gangestad, S.W., and Thornhill, R., 1999. Individual differences in developmental precision
and fluctuating asymmetry: a model and its implications. J. Evol. Biol. 12, 402-416.
Gjerde, B., Gunnes, K., Gjedrem, T., 1983. Effects of inbreeding on survival and growth in
rainbow trout. Aquaculture 34, 327-332
Hedrick, P.W., and kalinowski, S.T., 2000. Inbreeding depression in conservation biology.
Annu. Rev. Ecol. Syst. 31, 139-162.
Kincaid, H.L., 1976a. Effects of inbreeding in on rainbow trout populations. Transactions of
the American Fisheries Society 105, 273-280
Kincaid, H.L., 1976b. Inbreeding in rainbow trout (Salmo gairdneri). J. Fish. Res. Board Can.
33, 2420-2426.
Kincaid, H.L., 1983. Inbreeding in fish populations used for aquaculture. Aquaculture 33,
215-227.
Lande, R., and Schemske, D. W., 1985. The evolution of self-fertilization and inbreeding
depression in plants. I. Genetic models. Evolution 39, 24–40.
Leary, R.F., Allendorf, F.W., Knudsen, K.L., 1983. Developmental stability and enzyme
heterozygosity in rainbow trout. Nature 301, 71-72.
Lerner, I.M, 1954. Genetic homeostasis. Wiley and Sons, New York. 134pp.
Leung, B., and Forbes, M.R., 1997. Modelling fluctuating asymmetry in relation to stress and
fitness. Oikos 78, 397-405.
Longwell, A.C. and Stiles, S., 1973. Gamete cross incompatibility and inbreeding in the
commercial American oyster, Crassostrea virginica Gmelin. Cytologia, 38, 521-
533.
Mrakovcic, M. and Haley, L.E., 1979. Inbreeding depression in the zebra fish Brachydanio
rerio (Hamilton Buchana). Journal of Fish Biology 15, 323-327.
Owiti, D.O., and Dadzie S., 1989. Maturity, fecundity and the effect of rainfall on the
spawning rhythm of a siluroid catfish, Clarias mossambicus (Peters). Aquaculture
and Fisheries Management 20, 355-368.
Chapter 3
62
Palmer, A.R., 1994. Fluctuating asymmetry analyses: a primer. In: Developmental Instability:
its Origins and Evolutionary Implications (T. A. Markow, ed.), pp. 335-364. Kluwer
Academic Publishers, The Netherlands.
Palmer, A.R., and Strobeck, C., 1986. Fluctuating asymmetry: measurement, analysis,
patterns. Ann. Rev. Ecol. Syst. 17, 223-236.
Pante, M.J.R., Gjerde, B., McMillan, I., 2001a. Effect of inbreeding on body weight at harvest
in rainbow trout, Onchorhynchus mykiss. Aquaculture 192, 201-211.
Parsons, P.A., 1990. Fluctuating asymmetry: an epigenetic measure of stress. Biol. Rev.
Camb. Philo Soc. 65, 131-145.
Radwan, J. and Drewniak, M., 2001. Inbreeding depression for size but not for symmetry.
Evolution 55, 498-511.
Rezk, M.A., Kamel, E.A., Ramadan, A.A., Dunham, R.A., 2002. Comparative growth of
Egyptian tilapias in response to declining water temperature. Aquaculture 207, 239–
247.
SAS Institute, 1989. User's Guide: Statistics, Release 6.12 Edition. SAS Institute, Cary, NC.
Savolainen, O., and Hedrick, P.W., 1995. Heterozygosity and fitness: no association in Scots
pine. Genetics 140, 755–766.
Su., G.S., Liljedahl, L.E., Gall, G.A.E., 1996. Effects of inbreeding on growth and
reproductive traits in rainbow trout (Onchorhynchus mykiss). Aquaculture 142, 139-
148.
Van Valen, L., 1962. A study of fluctuating asymmetry. Evolution 16, 125-142.
VØllestad, L.A., Hindar, K, MØller, A.P., 1999. A meta-analysis of fluctuating asymmetry in
relation to heterozygosity. Heredity 83, 206-218.
Wang, S., Hard, J.J., Utter, F., 2002. Salmonid inbreeding: a review. Reviews in Fish Biology
and Fisheries 11, 301-319.
Wright, S., 1922. Coefficients of inbreeding and relationship. American Naturalist 56, 330-
338.
Chapter 4
Effects of inbreeding and sex ratio on reproductive success in
mass-spawning of Nile tilapia, Oreochromis niloticus
Yonas Fessehayea,b,c, Henk Bovenhuisa , Mahmoud A. Rezkc, Richard Crooijmansa, Johan
A.M. van Arendonka, Hans Komena
a Animal Breeding and Genetics Group, Wageningen University, P.O. Box 338, 6700 AH, Wageningen,
The Netherlands
b Aquaculture and Fisheries group, Wageningen University, P.O. Box 338, 6700 AH, Wageningen,
The Netherlands
c The WorldFish Center, Regional office for Africa and W. Asia, Abbassa, Abou Hamad, Sharkia, Egypt
Molecular Ecology (in preparation)

Effects of inbreeding and sex ratio on reproductive success
65
Abstract
This study investigated the effects of inbreeding on the mating system and reproductive
success in Nile tilapia, O. niloticus under semi-natural conditions in breeding hapas. Two
hapas were stocked with 36 fish at a female to male sex ratios of either 1 (hapa A) or 3 (hapa
B). Fish used for this experiment were randomly taken from nine families (four fish per
family) with different levels of inbreeding (0, 6.3, 9.4 and 25%). Fry were collected from the
mouth of incubating females on a weekly basis and parentage assignment was done on 1120
offspring from 56 spawnings using seven polymorphic microsatellite markers. Results show
that female reproductive output (fecundity), expressed as the total number of eggs per
spawning, was significantly affected by body weight and level of inbreeding. Per 10%
increase of the level of inbreeding, egg number declined by 11% of the mean. Male
reproductive success, calculated as the proportion of offspring sired per spawning, was
affected by the level of inbreeding, condition factor, gonad weight of males and sex ratio. Per
10% increase in the level of inbreeding, male reproductive success declined by 40%. The
decline in reproductive success was higher in sex ratio 1 compared to sex ratio 3 indicating
that the effects of inbreeding were magnified under higher male-male competition. Degree of
relatedness between mating pairs (Kinship coefficient) did not have any effect on
reproductive success of males. Overall, our findings show that inbred individuals have lower
reproductive success and uncover a natural selective pressure that favors outbred males and
that counterbalances accumulation of inbreeding
Chapter 4
66
1. Introduction
Reproductive success in many animals has been shown to be influenced by, among other
things, the level of inbreeding, sex ratio and genetic compatibility of potential mates.
Inbreeding has been observed to cause differential mate acquisition and reproductive success
in many vertebrate species (e.g. Meagher et al., 2000; Slate et al., 2000; Charpentier et al.,
2005). Inbred adults may be at a disadvantage in direct intrasexual competition over mates
because they are less vigorous than their outbred counterparts (Ryan et al., 2002); For
example, inbreeding was demonstrated to reduce competitive male mating ability in
Drosophila melanogaster (Miller et al., 1993) and to decrease display rate in guppies which is
a primary determinant of reproductive success (Farr, 1983).
There is a growing body of evidence that genetic compatibility may drive mate choice and
hence affect reproductive success (Tregenza and Wedell, 2000). The recognition and
avoidance of kin as potential mate could affect mate acquisition and reproductive success in
systems where individuals actively avoid inbreeding by mating with least-related mates
available (Ryan et al., 2002). In many species, genetic similarity to females was found to
affect male reproductive success: males genetically most different from females sired more
offspring in multiply sired litters, despite having no mating advantage (Olsson et al., 1996).
Among insects, Wilson et al. (1997) found that female genotype strongly influences the
outcome of sperm competition in Callosobruchus maculatus with male success apparently
determined by genetic compatibility with the female.
Reproductive success can also be influenced by a variety of ecological and demographic
variables such as sex ratio (Emlen and Oring, 1977) and population density (Maher and Lott,
2000). Both sex ratio and density may influence the encounter rates between males and
females and the extent to which mates can be monopolized (Emlen and Oring, 1977).
Classical sexual selection theory predicts that the operational sex ratio (the ratio of sexually
active males to fertilisable females) seem to trigger changes in competition intensity (Emlen
and Oring, 1977; Reynolds, 1996), male mating tactics (Krupa and Sih, 1993) and
reproductive success (Andersson, 1994; Reynolds, 1996).
In Oreochromis niloticus, territorial males provide no parental care and their mating system
resembles that of lekking animals. In a lek mating system, males defend clustered territories
and females visit males solely for courtship and mating (Bradbury and Gibson, 1983). In mass
Effects of inbreeding and sex ratio on reproductive success
67
spawning in Nile tilapia, aggregation of reproductive individuals could provide us with
interesting models to study the factors influencing mating systems and reproductive success
under semi-natural conditions. In a previous paper (Fessehaye et al., 2006), we reported on
the mating patterns of Nile tilapia under semi-natural mating conditions at a female to male
sex ratio of 2. In the present study, we investigated the effects of inbreeding on the
reproductive success in Nile tilapia. Fish were stocked at sex ratios of 1 and 3 to evaluate the
effect of number of potential mates on reproductive strategies and mating systems. To test if
the degree of relatedness between potential mates in a hapa influences the reproductive
success, fish with different level of relatedness (kinship coefficient) were stocked.
2. Materials and Methods
Fish
The spawning experiments were carried out at the experimental station of The WorldFish
Center, Abbassa, Egypt. Parental fish for this experiment were produced in 2004 (See
Fessehaye et al., 2006 for details) from pedigreed and unrelated fish of the second generation
of a breeding programme (described in Charo-karisa et al., 2006). A total of 72 fish (27 males
and 45 females) from nine full-sib families (8 fish/family) were used. Based on pedigree, fish
had inbreeding levels (F, %) ranging from 0- 25% (i.e. F= 0, 6.3, 9.4 and 25%; See Table 1).
Females and males were separately conditioned for two weeks prior to stocking in the
breeding hapas. During this period, fish were fed with 3mm floating pellets (40% crude
protein, Alexandria Oil and Soap Company, Kafr El-Sheikh, Egypt) twice daily at of 3% body
weight per day.
Experimental set up
The spawning experiments were carried out during the breeding season of 2005. Prior to
stocking, all parental fish were measured for total body weight (W, nearest 0.1 g); total length
(TL), and standard length (SL). TL and SL were measured as the distance from the tip of the
snout to the end of the caudal fin and hypural bone respectively. For DNA analysis, 0.5 ml of
blood was collected from all parental fish by caudal puncture using a hypodermic needle
rinsed with Na2EDTA. Two 8 x 2 x 1 m3 (length x width x depth) hapa enclosures were
installed in a concrete- walled pond with mud bottom (dimension: 50 x 5 x 1 m3; the floor of
the hapas was sitting on the pond bottom). Broodstock were divided into two groups
consisting of 36 fish in such a way that the nine families were represented equally in both

Chapter 4
68
hapas. Hapa A was stocked with 18 females and 18 males (2 females and 2 males per family)
at a female to male sex ratio of 1:1 (Sex ratio 1). Hapa B was stocked with 27 females and 9
males (3 females and 1 male per family) at female: male sex ratio of 3:1 (Sex ratio 3). Each
family was represented by four full-sib fish in each hapa. Two days after stocking, one male
and one female died in hapa A and B respectively and were replaced with another fish from
the same family; fish which died at a later stage of experiment were not replaced (n = 4).
Broodstock were allowed to spawn naturally for a period of ten days after which collection of
eggs commenced.
Egg collection and incubation
Collection of eggs was carried out on a weekly basis for a duration of eight weeks. All
females were checked during each collection period. Females carrying eggs in the buccal
cavity were identified with the tag number and eggs were collected from the mouth of each
incubating female by rinsing them into a plastic bowl. The fertilized eggs were counted and
were incubated in 20-l aquaria with continuous aeration to keep the eggs in constant motion
and to ensure sufficient oxygen supply needed for hatching of eggs. To control fungal
infection, the water was treated with 30 ppm formalin for the first day and with 20 ppm
formalin for the subsequent days. Formalin treatments were stopped when the embryos
reached the eyed stage. Eggs were inspected daily and unfertilized or dead eggs were removed
as the presence of spoiled eggs may cause infection and loss of the whole spawn. Embryos
were reared in the incubation system till the yolk sac stage. Twenty yolk sac fry per spawn
were randomly sampled for DNA extraction and genetic analysis.
DNA extraction and microsatellite analysis
Genomic DNA was extracted from blood of parental fish and from whole yolk sac larvae.
DNA was isolated from blood of parental fish using the PUREGENE kit (Gentra Systems,
Minneapolis, MN, USA) following the manufacturers instructions for non-mammalian blood.
Yolk sac fry were overdosed with MS-222 (tricaine methanesulfonate). The yolk sac was then
removed using a scalpel and embryos were placed in sterile 1.5 ml microcentrifuge tubes. The
tissue was squashed and homogenized using micro a pestle and extraction of DNA from
whole larvae was carried out using the same kit and protocol as for non-mammalian blood.
The amount of re-hydrated DNA solution was adjusted to yield final DNA concentrations of
5-10 µg/ml.
Effects of inbreeding and sex ratio on reproductive success
69
Based on the parentage analysis in Fessehaye et al. (2006) and simulation results, seven
polymorphic and informative markers (UNH169, UNH190, UNH123, UNH178, UNH208,
UNH214, UNH231) were selected for genotyping all parental fish and offspring. PCR cycling
conditions were as follows: 5 min at 95 °C, 35 cycles of 30 s at annealing temperature (45–60
°C), and 30s at 72 °C, followed by a final elongation step of 4 min at 72 °C. Amplified
products of all markers were multiplexed in one set, and electrophoresed through a system of
capillaries on ABI 3730 DNA analyzer (Applied Biosystems, CA, USA). Fragment sizes were
calculated relative to the LIZ 500 size standard. Genotype results were analyzed using
GeneMapper Version 4.0 (Perkin-Elmer, Boston, MA, USA).
Calculations and statistical analysis
Parameters calculated
Condition factor: Fulton’s condition factor (K) was calculated as 3SLBWk = , where BW is
body weight (g) and SL is standard body length (cm).
Spawn fecundity (number of eggs/spawning) of females was equal to the total number of eggs
counted per spawning.
Gonado-somatic index (GSI): At the end of the experiment, all parental fish were sacrificed
and gonads weighed. GSI was calculated as )(100 BWtGonadweighxGSI = where BW is the
live body weight of fish
Kinship coefficient (Φ): The kinship coefficient is half the additive genetic relationship of two
individuals. The additive genetic relationship between two individuals was calculated as
)1(2
1)(
1
, i
pinin
i
yx Fwa +
=
+
=
∑
Where yxa , is the additive genetic relationship between x and y; the Σ indicates the summation
over all n paths connecting x and y; the subscript i indicates one specific path with (ni + pi)
generations separating x and y via common ancestor Wi; Fwi is the inbreeding coefficient of
common ancestor Wi; n is the number of generations between x and Wi; p is the number of
generations between y and Wi. Relationships during two generations were used to calculate
Chapter 4
70
the kinship coefficient relative to the known founders of the population (G0) which were
assumed to be unrelated and with F = 0. We followed Wright’s (1922) approach of path
counting to calculate the additive genetic relationship and F.
Genetically effective paternity frequency (PF) was calculated for each spawning following
Bekkevold et al. (2002)
∑=
=n
i
ipPF1
21 ,
Where pi is the proportion of offspring sired by the ith male, n number of males involved in
fertilizing a spawn.
Parentage analysis
Allocation of offspring to their putative parental pairs was performed using the program
PAPA ver. 2.0 (Package for Analysis of Parental Allocation) with a uniform distribution error
rate of 0.02 (Duchesne et al., 2002). To test the reliability of parental assignment, 10,000
offspring (100 iterations and 100 offspring/iteration) were simulated based on the observed
genotypes of all parents. Simulated offspring were re-allocated to their putative parents. The
simulation was used to test the efficiency and reliability of the loci used in parentage
assignments.
Reproductive success of females and males
The effect of inbreeding and body weight on spawn fecundity and gonad weight of females
was analyzed using model 1. The same model was used to analyze effects of inbreeding and
body weight on gonad weight of males:
Yi = µ + β1Fi + β2ln(wti) + εi….…………………..…………………..…………… (Model 1)
Where Yi is the trait under study; µ is the overall mean; F is the co-variable of level of
inbreeding of individual fish; β1 is the regression coefficient of F on Yi; ln(wti) is the co-
variable of natural logarithm of the body weight of fish; β2 is the regression coefficient of
ln(wti) on Yi and εi is the residual error term.

Effects of inbreeding and sex ratio on reproductive success
71
Male reproductive success was calculated for each male as the proportion of offspring sired
by that male in a spawning. The effects of sex ratio, inbreeding coefficient, condition factor of
males, GSI of males, and kinship coefficient of mating pairs (male-female relatedness) on
reproductive success of males were investigated by generalized linear model (GENMOD). A
logistic regression with a binomial error distribution and logit-link function was used as male
reproductive success was calculated as the proportion of offspring sired within a single
spawning. Since level of inbreeding of males might be related to their condition factor and
GSI, these factors were alternatively added to the basic model which includes effects of sex
ratio and kinship coefficient. The model fitted was
E (RS) = µ + Sexratioi + β1Φj + εij …….……………...…………………..….......… (Model 2)
Where RS is reproductive success of males; µ is the overall mean; Sexratio is the female to
male sex ratio (1, 3); Φj is the co-variable of the kinship coefficient of the mating pairs; β1 is
the regression coefficient of the kinship coefficient. The variables alternatively added to the
basic model: Fk is co-variable of the inbreeding level of the kth male; β2 is the regression
coefficient of F; Kl is the co-variable of condition factor of the lth males; β3 is the regression
coefficient of the condition factor of males (K); GSI is the co-variable of the gonado-somatic
index of males; β4 is the regression coefficient of GSI and εij is the residual error term.
3. Results
Spawning, fecundity and gonad weight
Descriptive statistics on body weight, GSI (for both males and females) and total number of
spawnings and spawn fecundity (females) for fish of different levels of inbreeding and for the
two sex ratios are given in Table 1. The total number of spawns collected over the
experimental period was 23 and 41 for sex ratios of 1 and 3 respectively. In the hapa with sex
ratio of 1, 67% of the females spawned and about 39% of the females had repeated spawning.
For sex ratio of 3, 78% of females spawned and 54% of the females spawned more than once.
One spawn (sex ratio 1) and five spawns (sex ratio 3) did not show any sign of development
and quickly succumbed to fungus, indicating that they probably had not been fertilized. Two
batches of eggs in the sex ratio 3 hatched but did not develop into yolk sac fry. The overall
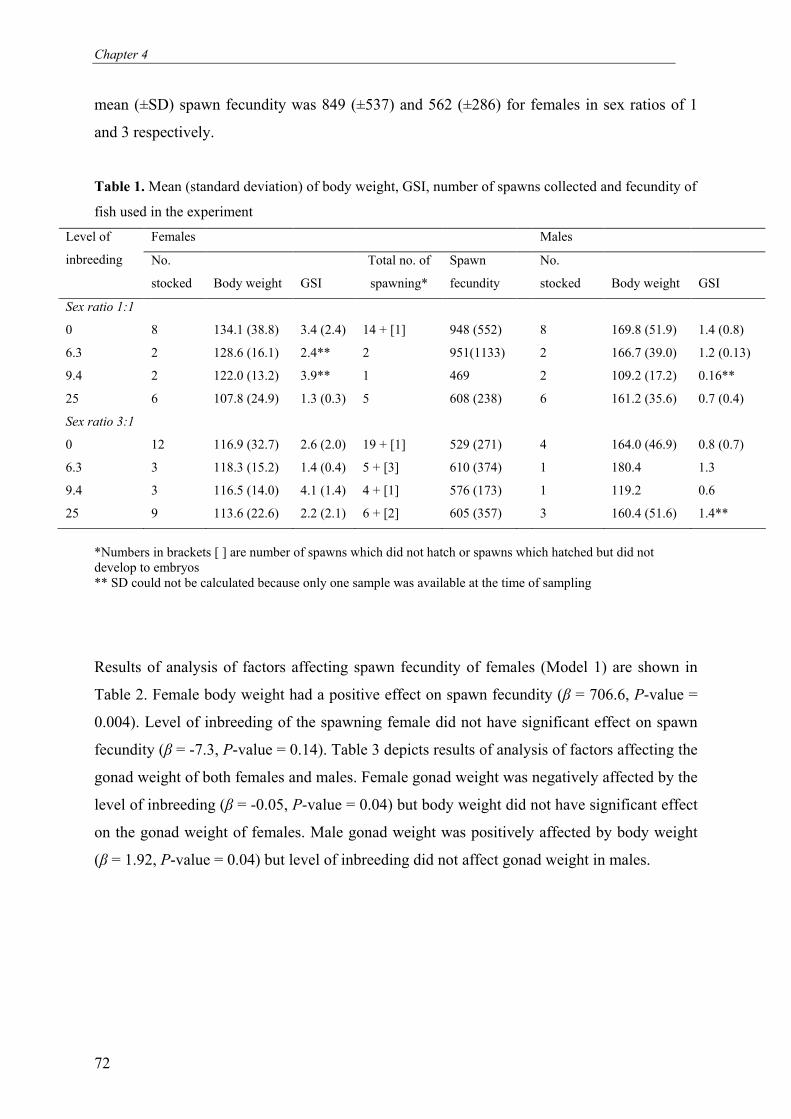
Chapter 4
72
mean (±SD) spawn fecundity was 849 (±537) and 562 (±286) for females in sex ratios of 1
and 3 respectively.
Table 1. Mean (standard deviation) of body weight, GSI, number of spawns collected and fecundity of
fish used in the experiment
Females Males Level of
inbreeding No.
stocked
Body weight
GSI
Total no. of
spawning*
Spawn
fecundity
No.
stocked
Body weight
GSI
Sex ratio 1:1
0 8 134.1 (38.8) 3.4 (2.4) 14 + [1] 948 (552) 8 169.8 (51.9) 1.4 (0.8)
6.3 2 128.6 (16.1) 2.4** 2 951(1133) 2 166.7 (39.0) 1.2 (0.13)
9.4 2 122.0 (13.2) 3.9** 1 469 2 109.2 (17.2) 0.16**
25 6 107.8 (24.9) 1.3 (0.3) 5 608 (238) 6 161.2 (35.6) 0.7 (0.4)
Sex ratio 3:1
0 12 116.9 (32.7) 2.6 (2.0) 19 + [1] 529 (271) 4 164.0 (46.9) 0.8 (0.7)
6.3 3 118.3 (15.2) 1.4 (0.4) 5 + [3] 610 (374) 1 180.4 1.3
9.4 3 116.5 (14.0) 4.1 (1.4) 4 + [1] 576 (173) 1 119.2 0.6
25 9 113.6 (22.6) 2.2 (2.1) 6 + [2] 605 (357) 3 160.4 (51.6) 1.4**
*Numbers in brackets [ ] are number of spawns which did not hatch or spawns which hatched but did not develop to embryos ** SD could not be calculated because only one sample was available at the time of sampling
Results of analysis of factors affecting spawn fecundity of females (Model 1) are shown in
Table 2. Female body weight had a positive effect on spawn fecundity (β = 706.6, P-value =
0.004). Level of inbreeding of the spawning female did not have significant effect on spawn
fecundity (β = -7.3, P-value = 0.14). Table 3 depicts results of analysis of factors affecting the
gonad weight of both females and males. Female gonad weight was negatively affected by the
level of inbreeding (β = -0.05, P-value = 0.04) but body weight did not have significant effect
on the gonad weight of females. Male gonad weight was positively affected by body weight
(β = 1.92, P-value = 0.04) but level of inbreeding did not affect gonad weight in males.
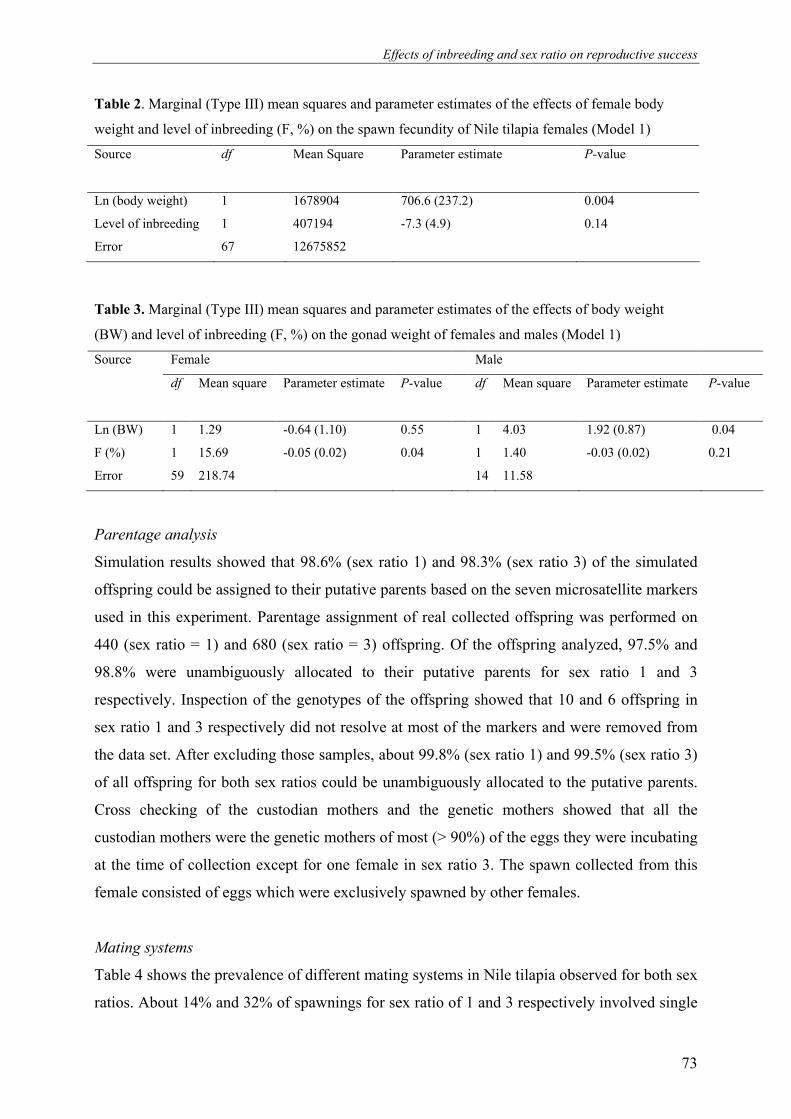
Effects of inbreeding and sex ratio on reproductive success
73
Table 2. Marginal (Type III) mean squares and parameter estimates of the effects of female body
weight and level of inbreeding (F, %) on the spawn fecundity of Nile tilapia females (Model 1)
Source df Mean Square Parameter estimate P-value
Ln (body weight) 1 1678904 706.6 (237.2) 0.004
Level of inbreeding 1 407194 -7.3 (4.9) 0.14
Error 67 12675852
Table 3. Marginal (Type III) mean squares and parameter estimates of the effects of body weight
(BW) and level of inbreeding (F, %) on the gonad weight of females and males (Model 1)
Female Male Source
df
Mean square Parameter estimate
P-value df Mean square Parameter estimate P-value
Ln (BW) 1 1.29 -0.64 (1.10) 0.55 1 4.03 1.92 (0.87) 0.04
F (%) 1 15.69 -0.05 (0.02) 0.04 1 1.40 -0.03 (0.02) 0.21
Error 59 218.74 14 11.58
Parentage analysis
Simulation results showed that 98.6% (sex ratio 1) and 98.3% (sex ratio 3) of the simulated
offspring could be assigned to their putative parents based on the seven microsatellite markers
used in this experiment. Parentage assignment of real collected offspring was performed on
440 (sex ratio = 1) and 680 (sex ratio = 3) offspring. Of the offspring analyzed, 97.5% and
98.8% were unambiguously allocated to their putative parents for sex ratio 1 and 3
respectively. Inspection of the genotypes of the offspring showed that 10 and 6 offspring in
sex ratio 1 and 3 respectively did not resolve at most of the markers and were removed from
the data set. After excluding those samples, about 99.8% (sex ratio 1) and 99.5% (sex ratio 3)
of all offspring for both sex ratios could be unambiguously allocated to the putative parents.
Cross checking of the custodian mothers and the genetic mothers showed that all the
custodian mothers were the genetic mothers of most (> 90%) of the eggs they were incubating
at the time of collection except for one female in sex ratio 3. The spawn collected from this
female consisted of eggs which were exclusively spawned by other females.
Mating systems
Table 4 shows the prevalence of different mating systems in Nile tilapia observed for both sex
ratios. About 14% and 32% of spawnings for sex ratio of 1 and 3 respectively involved single

Chapter 4
74
pair mating in which the eggs of one female were entirely fertilized by one male. Multiple
paternity was observed in about 64% and 32% of the spawning in sex ratios of 1 and 3
respectively. In those spawnings, genotypes of up to five and three males were detected in a
single spawn for sex ratios 1 and 3 respectively. Multiple maternity was detected in 2
spawnings (5.9%) in sex ratio of 3. No multiple maternity was observed in sex ratio of 1.
About 23% (sex ratio 1) and 29% (sex ratio 3) of the spawnings had embryos from multiple
mothers fertilized by multiple males (promiscuous matings).
Table 4. Effect of sex ratio on the mating patterns of Nile tilapia. Numbers in parentheses are
percentage of the total spawns
Sex ratio Single pair
mating
Multiple
paternity
Multiple
maternity
Promiscuous
matings
Total no. of
spawnings
1:1 3 (13.6%) 14 (63.6%) 0 (0%) 5 (22.7%) 22
3:1 11 (32.4%) 11 (32.4%) 2 (5.9%) 10 (29.4%) 34
Male reproductive success
One third of the males sired about 89% and 93% of the analyzed offspring in sex ratio 1 and 3
respectively. Three males in sex ratio 1 and one male in sex ratio 3 did not sire any of the
offspring analyzed. One male in sex ratio 1 died one day after stocking of fish and was
excluded from the analysis. Promiscuous spawnings were regarded as reproductive artifacts
and were not considered in further calculations and analysis. Excluding the promiscuous
matings, the average number of fathers contributing to a spawning was 2.14 (SE = 0.41) and
1.18 (SE = 0.08) for sex ratios 1 and 3 respectively. The average proportions of offspring
sired and the genetically effective paternity frequencies in spawnings with various numbers of
males siring offspring are shown in Table 5. The mean genetically effective paternity
frequencies for sex ratios 1 and 3 were 1.68 (SE = 0.24) and 1.20 (SE = 0.06) respectively.
The ranking of males’ paternity proportion given in Table 5 was further broken down into the
relative contribution of the males with different categories of levels of inbreeding (Table 6).
Males with lower inbreeding levels (0% and 6.3%) dominated the majority of the paternal
proportions in each successive rank (from the most successful to the third most successful
ranks).
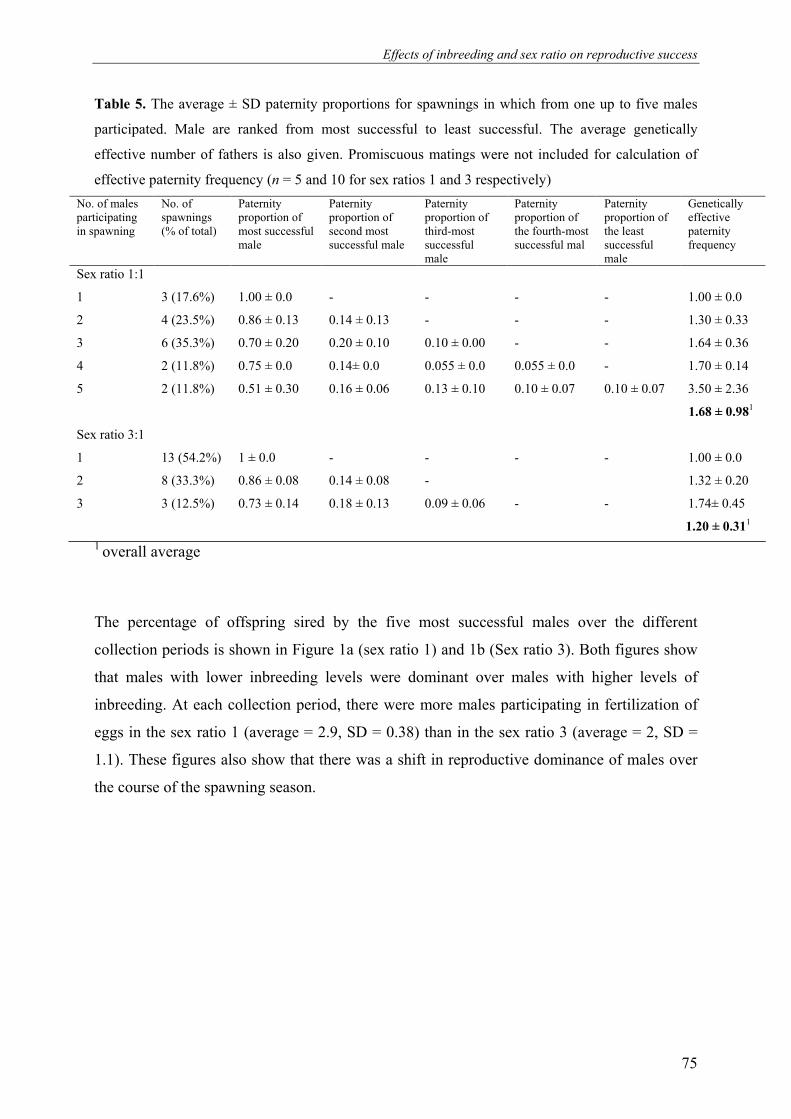
Effects of inbreeding and sex ratio on reproductive success
75
Table 5. The average ± SD paternity proportions for spawnings in which from one up to five males
participated. Male are ranked from most successful to least successful. The average genetically
effective number of fathers is also given. Promiscuous matings were not included for calculation of
effective paternity frequency (n = 5 and 10 for sex ratios 1 and 3 respectively)
No. of males participating in spawning
No. of spawnings (% of total)
Paternity proportion of most successful male
Paternity proportion of second most successful male
Paternity proportion of third-most successful male
Paternity proportion of the fourth-most successful mal
Paternity proportion of the least successful male
Genetically effective paternity frequency
Sex ratio 1:1
1 3 (17.6%) 1.00 ± 0.0 - - - - 1.00 ± 0.0
2 4 (23.5%) 0.86 ± 0.13 0.14 ± 0.13 - - - 1.30 ± 0.33
3 6 (35.3%) 0.70 ± 0.20 0.20 ± 0.10 0.10 ± 0.00 - - 1.64 ± 0.36
4 2 (11.8%) 0.75 ± 0.0 0.14± 0.0 0.055 ± 0.0 0.055 ± 0.0 - 1.70 ± 0.14
5 2 (11.8%) 0.51 ± 0.30 0.16 ± 0.06 0.13 ± 0.10 0.10 ± 0.07 0.10 ± 0.07 3.50 ± 2.36
1.68 ± 0.981
Sex ratio 3:1
1 13 (54.2%) 1 ± 0.0 - - - - 1.00 ± 0.0
2 8 (33.3%) 0.86 ± 0.08 0.14 ± 0.08 - 1.32 ± 0.20
3 3 (12.5%) 0.73 ± 0.14 0.18 ± 0.13 0.09 ± 0.06 - - 1.74± 0.45
1.20 ± 0.311
1 overall average
The percentage of offspring sired by the five most successful males over the different
collection periods is shown in Figure 1a (sex ratio 1) and 1b (Sex ratio 3). Both figures show
that males with lower inbreeding levels were dominant over males with higher levels of
inbreeding. At each collection period, there were more males participating in fertilization of
eggs in the sex ratio 1 (average = 2.9, SD = 0.38) than in the sex ratio 3 (average = 2, SD =
1.1). These figures also show that there was a shift in reproductive dominance of males over
the course of the spawning season.
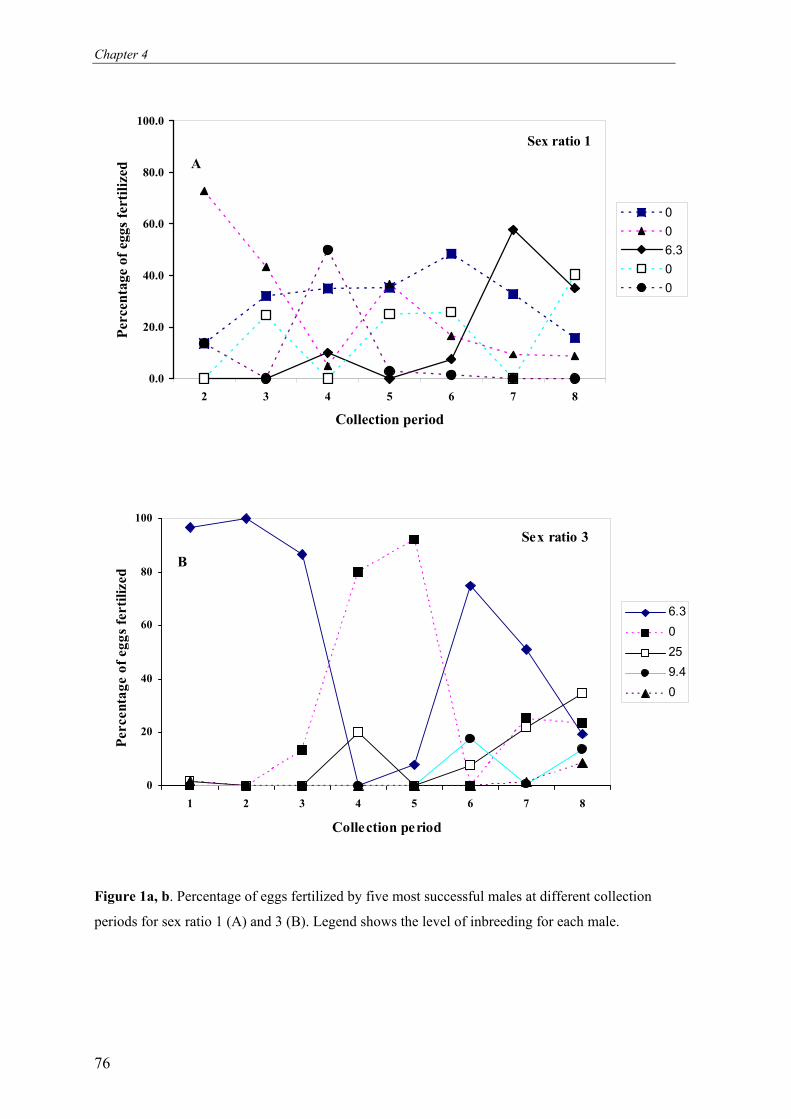
Chapter 4
76
0.0
20.0
40.0
60.0
80.0
100.0
2 3 4 5 6 7 8
Collection period
Perc
enta
ge
of eg
gs fe
rtiliz
ed
0
0
6.3
0
0
Sex ratio 1
A
0
20
40
60
80
100
1 2 3 4 5 6 7 8
Collection period
Percenta
ge o
f eggs fe
rtilized
6.3
0
25
9.4
0
Sex ratio 3
B
Figure 1a, b. Percentage of eggs fertilized by five most successful males at different collection
periods for sex ratio 1 (A) and 3 (B). Legend shows the level of inbreeding for each male.
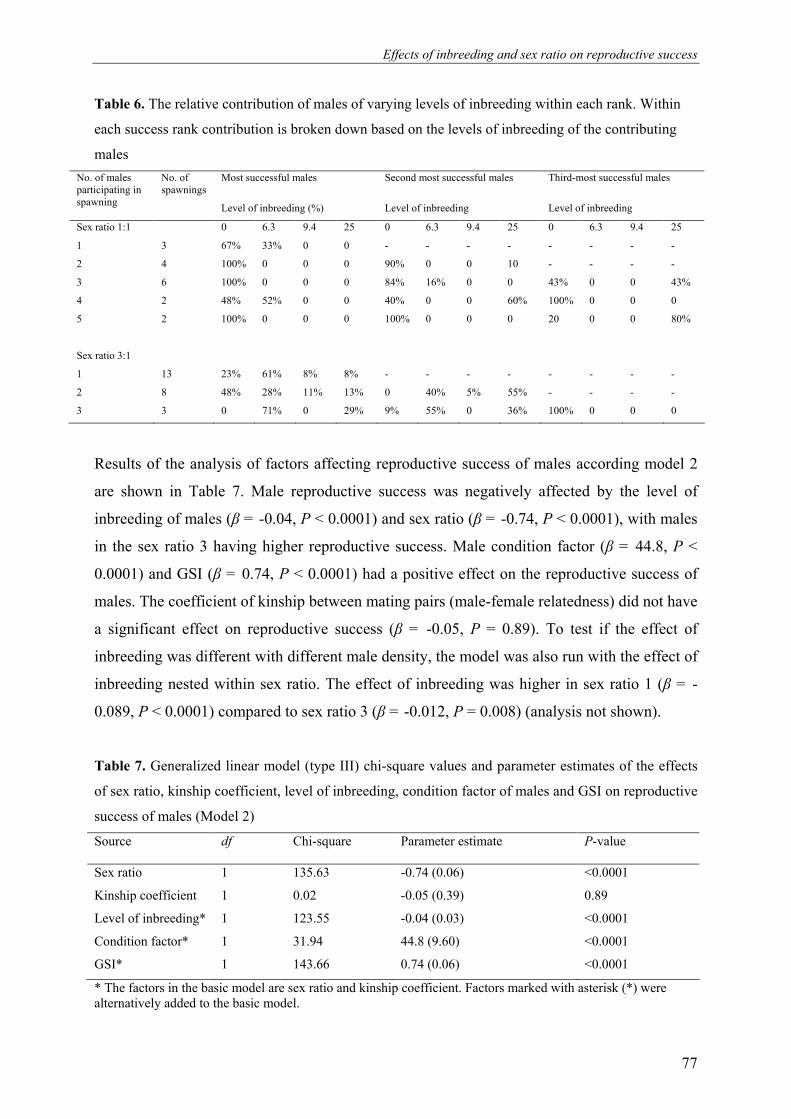
Effects of inbreeding and sex ratio on reproductive success
77
Table 6. The relative contribution of males of varying levels of inbreeding within each rank. Within
each success rank contribution is broken down based on the levels of inbreeding of the contributing
males
No. of males participating in spawning
No. of spawnings
Most successful males
Level of inbreeding (%)
Second most successful males
Level of inbreeding
Third-most successful males
Level of inbreeding
Sex ratio 1:1 0 6.3 9.4 25 0 6.3 9.4 25 0 6.3 9.4 25
1 3 67% 33% 0 0 - - - - - - - -
2 4 100% 0 0 0 90% 0 0 10 - - - -
3 6 100% 0 0 0 84% 16% 0 0 43% 0 0 43%
4 2 48% 52% 0 0 40% 0 0 60% 100% 0 0 0
5 2 100% 0 0 0 100% 0 0 0 20 0 0 80%
Sex ratio 3:1
1 13 23% 61% 8% 8% - - - - - - - -
2 8 48% 28% 11% 13% 0 40% 5% 55% - - - -
3 3 0 71% 0 29% 9% 55% 0 36% 100% 0 0 0
Results of the analysis of factors affecting reproductive success of males according model 2
are shown in Table 7. Male reproductive success was negatively affected by the level of
inbreeding of males (β = -0.04, P < 0.0001) and sex ratio (β = -0.74, P < 0.0001), with males
in the sex ratio 3 having higher reproductive success. Male condition factor (β = 44.8, P <
0.0001) and GSI (β = 0.74, P < 0.0001) had a positive effect on the reproductive success of
males. The coefficient of kinship between mating pairs (male-female relatedness) did not have
a significant effect on reproductive success (β = -0.05, P = 0.89). To test if the effect of
inbreeding was different with different male density, the model was also run with the effect of
inbreeding nested within sex ratio. The effect of inbreeding was higher in sex ratio 1 (β = -
0.089, P < 0.0001) compared to sex ratio 3 (β = -0.012, P = 0.008) (analysis not shown).
Table 7. Generalized linear model (type III) chi-square values and parameter estimates of the effects
of sex ratio, kinship coefficient, level of inbreeding, condition factor of males and GSI on reproductive
success of males (Model 2)
Source df Chi-square Parameter estimate
P-value
Sex ratio 1 135.63 -0.74 (0.06) <0.0001
Kinship coefficient 1 0.02 -0.05 (0.39) 0.89
Level of inbreeding* 1 123.55 -0.04 (0.03) <0.0001
Condition factor* 1 31.94 44.8 (9.60) <0.0001
GSI* 1 143.66 0.74 (0.06) <0.0001
* The factors in the basic model are sex ratio and kinship coefficient. Factors marked with asterisk (*) were alternatively added to the basic model.
Chapter 4
78
4. Discussion
Mating systems
The mating systems observed in both sex ratios are diverse ranging from single pair mating to
promiscuous mating. The frequency of single pair mating in sex ratio 3 (32%) is more than
twice what is observed in sex ratio 1 (14%). Conversely, the frequency of multiple paternity
in sex ratio 1 (64%) was twice that of the sex ratio of 3 (32%). The prevalence of monogamy
is likely due to a combination of factors that reduce either the environmental potential for
polygyny or the ability of males to exploit any existing polygyny potential (Emlen and Oring,
1977). Prevalence of single pair and multiple pair mating in spawning with sex ratio of 2 as
reported in Fessehaye et al. (2006) was 21% and 46% respectively. These values are mid way
in between the values of the sex ratios in the present study and thus reinforce our conclusion
that differences due to sex ratio are causing differences in mating system in Nile tilapia. Over
all, our result is in agreement with previous findings that adult sex ratio is a key factor
affecting sexual competition (Kvarnemo et al., 1995) and mating system (Emlen and Oring,
1977).
Parental inbreeding and reproductive success
In the present study, a decline in egg number of 11% of the mean was observed per 10%
increase of the level of inbreeding. Su et al. (1996) showed that the number of eggs in
Oncorhynchus mykiss was significantly reduced by inbreeding (6% per 10% increase in
inbreeding). The higher magnitude of inbreeding depression could be the result of fast
accumulation of inbreeding by full-sib mating in our experiment as opposed to accumulation
of inbreeding over five generations in Su et al. (1996). At a slow rate of inbreeding, there are
more generations during which selection can counteract effects of inbreeding by eliminating a
larger proportion of the genetic load (Ehiobu et al., 1989; Day et al., 2003; Reed et al., 2003).
Level of inbreeding had a significant effect on the reproductive success of Nile tilapia males.
Per 10% increase in the level of inbreeding, the reproductive success of males decreased by
40% (Table 7). Visual inspection of multiply sired spawns also showed that relatively
outbred males were responsible for fertilizing the majority of eggs while more inbred males
had marginal contribution in 85% of the spawns. Although inbreeding has been shown to
depress fitness traits in early stages of many species; there is little knowledge about the effects
of inbreeding on reproductive success in fish in general and tilapia in particular. In a recent
study of house mice (Mus domesticus), reproductive success of males was reduced by 81%
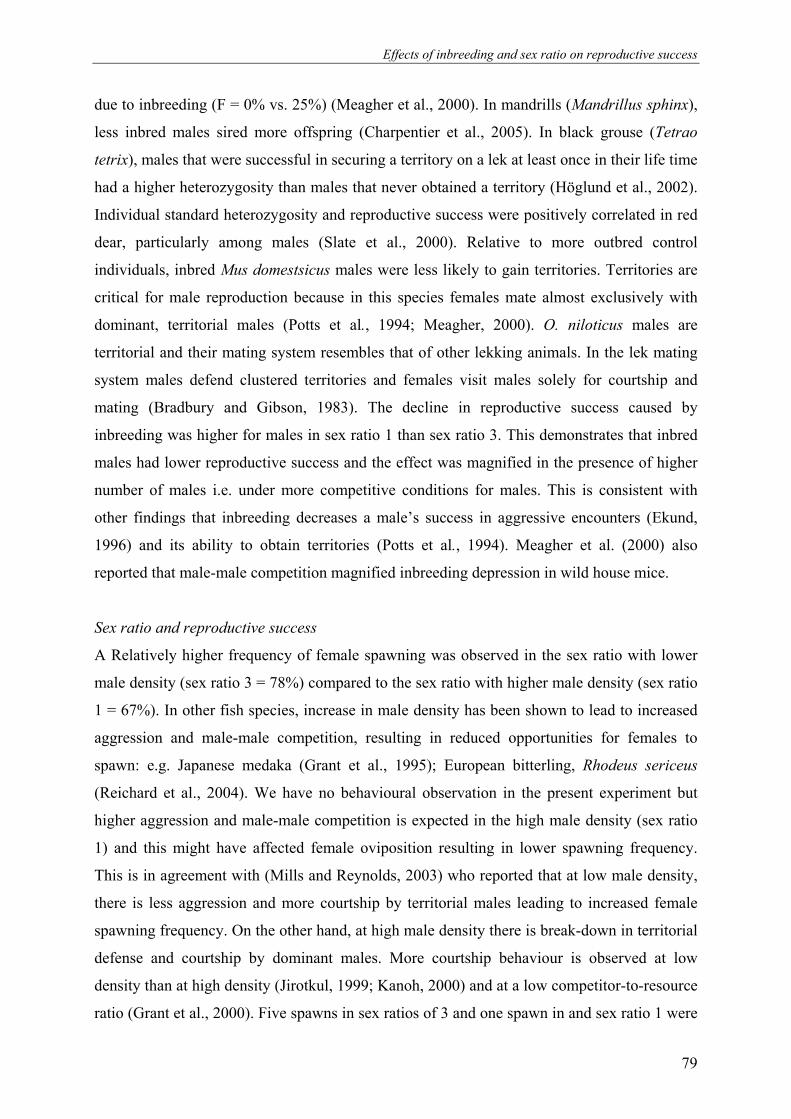
Effects of inbreeding and sex ratio on reproductive success
79
due to inbreeding (F = 0% vs. 25%) (Meagher et al., 2000). In mandrills (Mandrillus sphinx),
less inbred males sired more offspring (Charpentier et al., 2005). In black grouse (Tetrao
tetrix), males that were successful in securing a territory on a lek at least once in their life time
had a higher heterozygosity than males that never obtained a territory (Höglund et al., 2002).
Individual standard heterozygosity and reproductive success were positively correlated in red
dear, particularly among males (Slate et al., 2000). Relative to more outbred control
individuals, inbred Mus domestsicus males were less likely to gain territories. Territories are
critical for male reproduction because in this species females mate almost exclusively with
dominant, territorial males (Potts et al., 1994; Meagher, 2000). O. niloticus males are
territorial and their mating system resembles that of other lekking animals. In the lek mating
system males defend clustered territories and females visit males solely for courtship and
mating (Bradbury and Gibson, 1983). The decline in reproductive success caused by
inbreeding was higher for males in sex ratio 1 than sex ratio 3. This demonstrates that inbred
males had lower reproductive success and the effect was magnified in the presence of higher
number of males i.e. under more competitive conditions for males. This is consistent with
other findings that inbreeding decreases a male’s success in aggressive encounters (Ekund,
1996) and its ability to obtain territories (Potts et al., 1994). Meagher et al. (2000) also
reported that male-male competition magnified inbreeding depression in wild house mice.
Sex ratio and reproductive success
A Relatively higher frequency of female spawning was observed in the sex ratio with lower
male density (sex ratio 3 = 78%) compared to the sex ratio with higher male density (sex ratio
1 = 67%). In other fish species, increase in male density has been shown to lead to increased
aggression and male-male competition, resulting in reduced opportunities for females to
spawn: e.g. Japanese medaka (Grant et al., 1995); European bitterling, Rhodeus sericeus
(Reichard et al., 2004). We have no behavioural observation in the present experiment but
higher aggression and male-male competition is expected in the high male density (sex ratio
1) and this might have affected female oviposition resulting in lower spawning frequency.
This is in agreement with (Mills and Reynolds, 2003) who reported that at low male density,
there is less aggression and more courtship by territorial males leading to increased female
spawning frequency. On the other hand, at high male density there is break-down in territorial
defense and courtship by dominant males. More courtship behaviour is observed at low
density than at high density (Jirotkul, 1999; Kanoh, 2000) and at a low competitor-to-resource
ratio (Grant et al., 2000). Five spawns in sex ratios of 3 and one spawn in and sex ratio 1 were
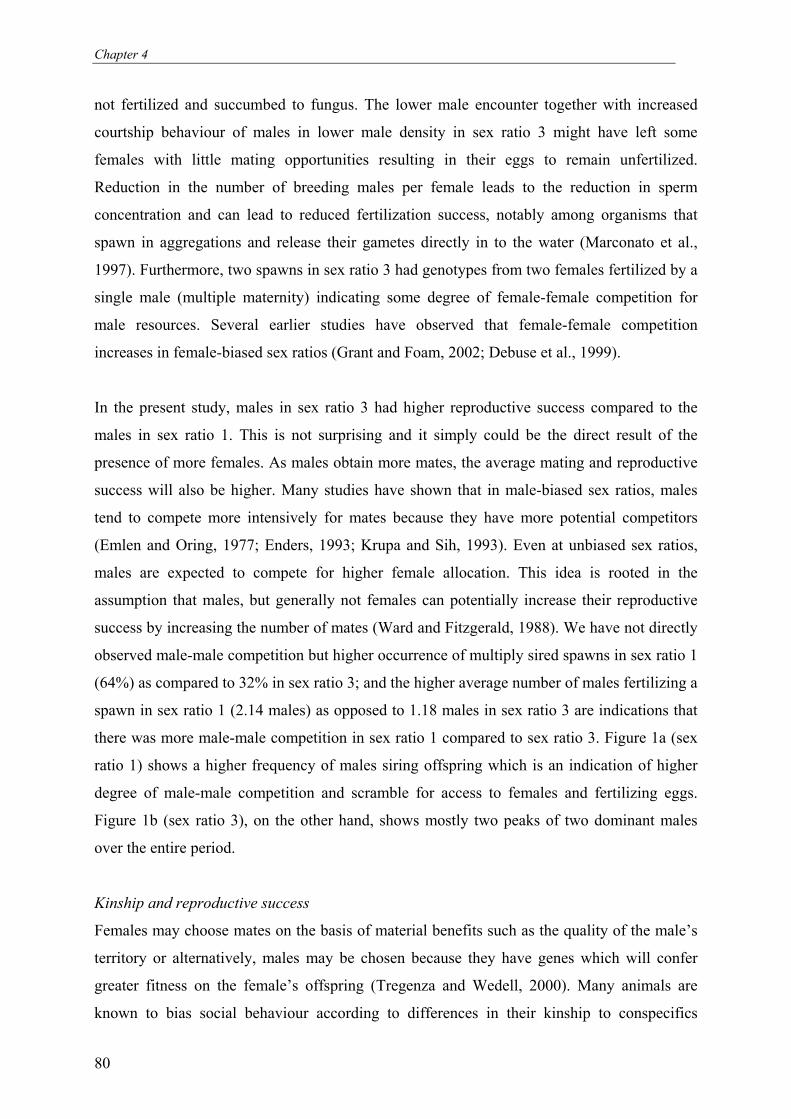
Chapter 4
80
not fertilized and succumbed to fungus. The lower male encounter together with increased
courtship behaviour of males in lower male density in sex ratio 3 might have left some
females with little mating opportunities resulting in their eggs to remain unfertilized.
Reduction in the number of breeding males per female leads to the reduction in sperm
concentration and can lead to reduced fertilization success, notably among organisms that
spawn in aggregations and release their gametes directly in to the water (Marconato et al.,
1997). Furthermore, two spawns in sex ratio 3 had genotypes from two females fertilized by a
single male (multiple maternity) indicating some degree of female-female competition for
male resources. Several earlier studies have observed that female-female competition
increases in female-biased sex ratios (Grant and Foam, 2002; Debuse et al., 1999).
In the present study, males in sex ratio 3 had higher reproductive success compared to the
males in sex ratio 1. This is not surprising and it simply could be the direct result of the
presence of more females. As males obtain more mates, the average mating and reproductive
success will also be higher. Many studies have shown that in male-biased sex ratios, males
tend to compete more intensively for mates because they have more potential competitors
(Emlen and Oring, 1977; Enders, 1993; Krupa and Sih, 1993). Even at unbiased sex ratios,
males are expected to compete for higher female allocation. This idea is rooted in the
assumption that males, but generally not females can potentially increase their reproductive
success by increasing the number of mates (Ward and Fitzgerald, 1988). We have not directly
observed male-male competition but higher occurrence of multiply sired spawns in sex ratio 1
(64%) as compared to 32% in sex ratio 3; and the higher average number of males fertilizing a
spawn in sex ratio 1 (2.14 males) as opposed to 1.18 males in sex ratio 3 are indications that
there was more male-male competition in sex ratio 1 compared to sex ratio 3. Figure 1a (sex
ratio 1) shows a higher frequency of males siring offspring which is an indication of higher
degree of male-male competition and scramble for access to females and fertilizing eggs.
Figure 1b (sex ratio 3), on the other hand, shows mostly two peaks of two dominant males
over the entire period.
Kinship and reproductive success
Females may choose mates on the basis of material benefits such as the quality of the male’s
territory or alternatively, males may be chosen because they have genes which will confer
greater fitness on the female’s offspring (Tregenza and Wedell, 2000). Many animals are
known to bias social behaviour according to differences in their kinship to conspecifics

Effects of inbreeding and sex ratio on reproductive success
81
(Fletcher and Michener, 1987). Although the abilities of animals to detect smaller differences
in their kinship to potential mates have been largely untested, numerous species have been
observed to avoid mating with their first order (parents, full sibs) or second order (half-sibs)
relatives (Barnard and Fitzsimons, 1988). In the present study, the degree of relatedness, as
measured by the kinship coefficient, did not have any significant role in the reproductive
success of males. There is increasing evidence that social factors are also important in
influencing mate choice decisions (Westneat et al., 2000). For the evolution of inbreeding
avoidance behaviour, the costs of inbreeding must exceed the costs of avoiding inbreeding
(Koenig et al., 1998). In addition, as many fish are broadcast spawners releasing their gametes
in water, fertilization and reproductive success could be affected by physical characteristics
and presence of other competitive males in the surrounding. These factors can all confound
the relationship between kinship and reproductive success. A better understanding of this
relationship will undoubtedly broaden our understanding of mating systems and accumulation
of inbreeding in this species and merits further investigation.
Concluding remarks
The results of this experiment showed enhanced reproductive success of relatively outbred
individuals compared to inbred individuals. For males, the decline in reproductive success
was higher in sex ratio 1 compared to sex ratio 3 indicating that the effect of inbreeding was
magnified under higher male-male competition. This is consistent with many pervious studies
that observed that aggressive encounters and higher male-male competition magnified the
magnitude of inbreeding depression in reproductive success (Potts et al., 1994; Ekund, 1996;
Meagher et al., 2000). To our knowledge this study is the first attempt to determine the effect
of inbreeding on reproductive success in semi-natural conditions. The result uncovers a
selective pressure that favors outbred males and that counterbalances the increase of
inbreeding in a population.
Acknowledgements
This study is part of the first author's PhD study, funded by NUFFIC (The Netherlands
organization for international cooperation in higher education), INREF-Pond, Wageningen
University (http://www.inref-pond.org) and the WorldFish Center. We acknowledge the staff of
The WorldFish Centre, Abbassa, Egypt for providing the necessary help and facilities during the
experiments.
Chapter 4
82
References
Andersson, M., 1994. Sexual selection. Princeton, New Jersey: Princeton University Press
Barnard, C. J., and Fitzsimmons, J., 1989. Kin recognition and mate choice in mice: fitness
consequences of mating with kin. Animal Behaviour 38, 35--40.
Bekkevold, D., Hansen, M.W., Loeschcke, V., 2002. Male reproductive competition in
spawning aggregations of cod (Gadus morhua L.). Molecular Ecology 11, 91-102.
Bradbury, J.W. and Gibson, R.M., 1983. Mate choice. Cambridge University Press,
Cambridge,
Charo-Karisa, H., Komen, H., Rezk, M.A., Ponzoni, R.W., van Arendonk, J.A.M, Bovenhuis,
H., 2006. Heritability estimates and response to selection for growth of Nile tilapia
(Oreochromis niloticus) in low-input earthen ponds. Aquaculture (2006).
Charpentier, M., Setchell, J.M., Prugnolle, F., Knapp, L.A., Wickings, E.J., Peignot, P.,
Hossaert-Mckey, M., 2005. Genetic diversity and reproductive success in mandrills
(Mandrillus sphinx). Proc. Nat. Acad. Sci. 102, 16723-16728.
Day, S.B., Bryant, E.H., and Meffert, L.M., 2003. The influence of variable rates of
inbreeding on fitness, environmental responsiveness, and evolutionary potential.
Evolution 57, 134-1324.
Debuse, V.J., Addison, J.T, Reynolds, J.D., 1999. The effects of sex ratio on sexual
competition in the European lobster. Animal Behaviour 58, 973-981.
Duchesne, P., Godbout, M, Bernatchez, L., 2002. PAPA (package for the analysis of parental
allocation): a computer program for simulated and real parental allocation. Molecular
Ecology Notes 2, 191-193.
Ehiobu, N.G., Goddard, M.E. and Taylor, J.F., 1989. Effect of rate of inbreeding on
inbreeding depression in Drosophila melanogaster. Theoretical and Applied Genetics
77, 123-127.
Ekund, A., 1996. The effects of inbreeding on aggression in wild male house mice (mus
domesticus). Behavior 133, 883-901.
Emlen, S.T., and Oring, L.W., 1977. Ecology, sexual selection, and the evolution of mating
systems. Science, 197, 215-223.
Enders, M.M., 1993. The effect of male size and operational sex ratio on male mating success
in the common spider mite, Tetranychus urticae Koch (Acari: Tetranychidae).
American Naturalist 46, 835-846.
Farr, J.A., 1983. The inheritance of qualitative fitness traits in guppies, Poecilia reticulata.
Evolution 37, 1193-1209.
Effects of inbreeding and sex ratio on reproductive success
83
Fessehaye, Y., El-bialy, Z., Rezk, M.A., Crooijmans, R., Bovenhuis, H., Komen, H., 2006.
Mating systems and male reproductive success in Nile tilapia (Oreochromis
niloticus) in breeding hapas: A microsatellite analysis. Aquaculture 256, 148-158.
Fletcher, D. J. C., and Michener, C. D. (Eds.), 1987. Kin Recognition in Animals. Wiley, New
York.
Grant, J.W.A., and Foam, P.E., 2002. Effect of operational sex ratio on female-female versus
male-male competitive aggression. Can. J. Zool. 80, 2242-2246.
Grant, J.W.A., Bryant, M.J., and Soos, C.E., 1995. Operational sex ratio, mediated by
synchrony of female arrival, alters the variance of male mating success in Japanese
medaka. Animal Behavior 49, 367-375.
Grant, J.W.A., Gaboury, C.L., and Levitt, H.L., 2000. Competitor-to-resource ratio, a general
formulation of operational sex ratio, as a predictor of competitive aggression in
Japanese medaka (Pisces: Oryziidae). Behavioral Ecology 11, 670-675.
Höglund, J., Piertney, S.B., Alatalo, R.V., Lindell, J., Lundberg, A, Rintamäki, P.T., 2002.
Inbreeding depression and male fitness in black grouse. Proc. R. Soc. Lond. B. 269,
711-715.
Jirotkul, M., 1999. Operational sex ratio influences female preference and male-male
competition in guppies. Animal Behaviour 58, 287-294.
Kanoh, Y., 2000. Reproductive success associated with territoriality, sneaking, and grouping
in male rose bitterlings, Rhodeus ocellatus (Pisces: Cyprinidae). Environmental
Biology Fishes 57, 143-154.
Koenig, W.D., Haydock, J., Stanback, M.T., 1998. Reproductive roles in the cooperatively
breeding acorn woodpecker: incest avoidance versus reproductive competition.
American Naturalist 151, 243-255.
Krupa, J.J., and Sih, A., 1993. Experimental studies on water strider mating dynamics: spatial
variation in density and sex ratio. Behavioral Ecology and Sociobiology 33, 107-
102.
Kvarnemo, C., Forsgren, E., and Magnhangen, C., 1995. Effects of sex ratio on intra- and
intersexual behaviour in sand gobies. Animal Behaviour 50, 1455-1461.
Maher, C.R., and Lott, D.F., 2000. A review of ecological determinants of territoriality within
vertebrate species. American Midland Naturalist 143, 1-29
Marconato, A., Shapiro, D.Y., Petersen, C.W., Warner, R.R., Yokishawa, T., 1997.
Methodological analysis of fertilization rate in the bluehead wrasse Thalassoma
bifasciatum. Mar. Ecol. Prog. Ser 161, 61-70.
Chapter 4
84
Meagher, S., Penn, D. J., and Potts, W. K., 2000 Male- male competition magnifies
inbreeding depression in wild house mice. Proc. Natl. Acad. Sci. USA 97, 3324-
3329.
Miller, P.S., Glasner, J., and Hedrick, P.W., 1993. Inbreeding depression and male male-
mating behaviour in Drosophila melanogaster. Genetica 88, 29-36.
Mills, S.C., and Reynolds, J.D., 2003. Operational sex ratio and alternative reproductive
behaviours in the European bitterling, Rhodeus sericeus. Behavioral Ecology and
Sociobiology 54, 98-104.
Olsson, M., Shine, R., Gullberg, A., Madsen, T., Tegelstrom, H., 1996. Sperm selection by
females. Nature 383, 585.
Potts, W.K., Manning, C.J., Wakeland, E.K., 1994. The role of infectious disease, inbreeding
and mating preferences in maintaining MHC genetic diversity: an experimental test.
Phil. Trans. R. Soc. Lond. B 346, 369-378.
Reed, D.H., Lowe, E.H., Briscoe, D.A. and Frankham, R. 2003. Inbreeding and extinction:
effects of rate of inbreeding. Conservation Genetics 4, 405-410.
Reichard, M., Jurajda, P., Smith, C., 2004. Male-male interference competition decreases
spawning rate in the European bitterling (Rhodeus sericeus). Behavioral Ecology
and Sociobiology 56, 34-41.
Reynolds, J., 1996. Animal breeding systems. Trends in Ecology and Evolution 11, 68-72.
Ryan, K.K., Lacy, R.C., Margulis, S.W., 2002. Impacts of inbreeding on components of
reproductive success. In: Holt, W.V., Pickard, A.R., Rodger, J.C., Wildt, D.E. (eds),
2003. Reproductive Sciences and Integrated Conservation. Cambridge University
press, England.
Slate, J., Kruuk, L.E.B., Marshall, T.C., Pemberton, J.M., and Clutton-Brock, T.H., 2000.
Inbreeding depression influences lifetime breeding success in a wild population of
red deer (Cervus elaphus). Proc. R. Soc. Lond. B 267, 1657-1662.
Su., G.S., Liljedahl, L.E., Gall, G.A.E., 1996. Effects of inbreeding on growth and
reproductive traits in rainbow trout (Onchorhynchus mykiss). Aquaculture 142, 139-
148.
Tregenza, T., and Wedell, N., 2000. Genetic compatibility, mate choice and patterns of
parentage: Invited Review. Molecular Ecology 9, 1013-1027.
Ward, G., and Fitzgerlad, G.J., 1988. Effects of sex ratio on male behaviour and reproductive
success in a field population of three-spine sticklebacks (Gasterosteus aculeatus)
(Pisces: Gasterosteidae). J. Zool. Lond. 215, 597-610.

Effects of inbreeding and sex ratio on reproductive success
85
Westneat, D. F., Walters, A., McCarthy, T. M., Hatch, M. I., and Hein, W. K., 2000.
Alternative mechanisms of non independent mate choice. Animal Behaviour 59,
467–476.
Wilson, N., Tubman, S. C., Eady, P. E. and Robertson, G. W. 1997. Female genotype affects
male success in sperm competition. - Proc. R. Soc. London Ser. B 264, 1491-1495.
Wright, S., 1922. Coefficients of inbreeding and relationship. American Naturalist 56, 330-
338

Chapter 5
Prediction of Cannibalism in juvenile Oreochromis niloticus based on
predator to prey weight ratio; and effects of age and stocking density
Yonas Fessehayeab, Anamul Kabirb, Henk Bovenhuisa and Hans Komena
a Animal Breeding and Genetics Group, Wageningen University, P.O. Box 338, 6700 AH, Wageningen,
The Netherlands
b Aquaculture and Fisheries group, Wageningen University, P.O. Box 338, 6700 AH, Wageningen,
The Netherlands
Aquaculture 255 (2006), 314-322

Size-dependent cannibalism
89
Abstract
Factors influencing size-dependent cannibalism in Nile tilapia, Oreochromis niloticus were
investigated in controlled conditions. First, individual-based trials were conducted to develop
a linear regression model to predict the occurrence of cannibalism based on body
measurements. Oral gape (G, mm), body depth (D, mm) and weight (W, g) of 140 fish were
measured and we estimated maximum prey weight (Wprey) for a given predator weight
(Wpredator): Log10Wprey = 1.03Log10Wpredator – 1.13. This model was verified by conducting 76
single pair trials. The revised model based on observed cannibalism is: Log10Wprey =
Log10Wpredator – 1.17. Several experiments involving a group of prey and predators were
conducted to elucidate the relative importance of factors that influence cannibalism.
Cannibalism was significantly affected by stocking density, age of fish and predator: prey
weight ratio. Logit models of mortality data of both the individual-based and observations
based on a group of predators and prey estimated R50 (the predator: prey weight ratio at which
an encounter of a predator and prey resulted in a predation success of 50%) to be 14.6 and
14.8 respectively. The results of these experiments can be used to reduce fry losses due to
cannibalism.
Chapter 5
90
1. Introduction
Cannibalism is the act of killing and consuming the whole or major part, of an individual
belonging to the same species. Cannibalism can occur between unrelated animals, between
siblings and can be exerted by parents on their offspring or vice versa (Baras and Jobling,
2002). It is a frequent phenomenon in fish especially in culture environments where fish are
unable to escape predation via habitat segregation or mitigation.
A number of factors potentially influence the extent and rate of cannibalism in fish. These
factors generally fall into two major categories, i.e. size-related and behavioural factors.
Within the size-related category the principal cause of cannibalism is size variation within a
cohort caused by genotypic differences which dictate differences in egg size (and hence larval
size) and individual growth rates (DeAngelis et al., 1979). Factors which have been found to
affect the behaviour of larvae and thus cannibalism are food availability, population density,
refuge, water clarity, light intensity, feeding frequency and frequency at which alternative
prey is presented (DeAngelis et al., 1979; Fox, 1975; Hecht and Appelbaum, 1988; Katavic et
al., 1989).
Predator to prey size ratios vary substantially between different species and life stages;
predominantly because cannibalism is governed by gape size limitations and allometric
growth of mouth parts (Baras and Jobling, 2002; Lundvall et al., 1998; Qin and Fast, 1996).
The size range of prey that a predator potentially can feed on is constrained by the predator’s
ability to capture and handle prey (Christensen, 1996). The lower prey size limit can be set by
difficulties in retaining the prey (Persson, 1987) and by the predator’s ability to detect the
prey (Breck and Gitter, 1983). The upper limit is set by physical constraints of the predator,
such as the size of the feeding apparatus (e.g. oral gape) (Hart and Hamrin, 1988; Hambright,
1991) and swimming capacity (Christensen, 1996). In Nile tilapia, low fecundity and the
asynchronous reproductive cycles lead to episodic fry production (Jalabert and Zohar, 1982;
Coward and Bromage, 2000) which will give rise to different hatching times and hence a wide
size range. This size variation together with the aggressive nature of O. niloticus (Melard and
Philippart, 1980) implies a potential for size-dependent cannibalism. Pantastico et al. (1988)
reported that intracohort cannibalism was found in O. niloticus groups in which large size
differences become established within age cohorts. This presents a problem in aquaculture.
Macintosh and De Silva (1984) indicated that size-dependent cannibalism may account for an
average loss of 10-35% of fry stock during the first 50 days of rearing. However, no
Size-dependent cannibalism
91
information is available regarding the critical threshold in size difference above which
cannibalism is likely to occur.
In this study, we present a simple regression model that predicts maximum prey weight for a
certain weight of a predator based on body morphometric measurements; the model was
evaluated with paired fish trials. Since these paired fish trials do not reflect the conditions in
culture environment, we conducted several experiments to elucidate if the results of the model
are still valid in situations where several predators and prey are involved. We focused on how
varying sizes of fish (both predator and prey), different stocking densities, age of fish and tank
volume affect predator-prey interactions and consequently the rate of cannibalism. Such
information may help to understand cannibalism and will have practical application in
mitigation of cannibalism in aquaculture.
2. Materials and Methods
2.1. General procedures
In all experiments, cannibalism trials were conducted by combining larger sized fish
(hereafter predator) with smaller fish (hereafter prey) in the same aquarium. In the single pair
trials, only one predator and one prey were involved. In the cannibalism trials involving a
group of predators and prey, weight range within predator and prey groups in each trial were
kept to a minimum by sampling near identical weights of both predators and prey (CV <
6.3%). All trials lasted for 24 hours. Fish were fed a commercial pellet (Feed type Nutra
ABOOO, Feed size 0.4-0.7) at a daily ration 20g/kg0.8 supplied by hand 4 to 5 times during
the experimental period. Observation on agonistic and cannibalistic behaviour of both
predators and prey was carried out immediately after combining predator(s) and prey(s) and
during the first 10 minutes of the first four hours of the experiment. In each trial, prey
percentage mortality was estimated as a fraction of the number of prey that had been
cannibalized after 24 hours relative to the total number of prey stocked initially.
2.2. Experimental set up and data analysis
2.2.1. Cannibalism involving single predator and prey (Single pair trials)
2.2.1.1. Predator-prey morphometric model development
A predictive model for maximum prey size was developed based on measurements from 140
O. niloticus fry ranging from 14 to 100 mm total body length. All individuals were measured
Chapter 5
92
for total body weight (W, nearest 0.1 g), total body length (L), oral gape (G) and body depth
(D) (nearest mm). L was measured as the distance from the tip of the snout to the end of the
caudal fin; G (oral gape) as the maximum dorso-ventral dimension of the mouth which was
measured by opening the mouth to its maximum vertical open-mouth position and D as the
maximum body depth measured dorso-ventrally just anterior to the dorsal fin. It was assumed
that a predator could swallow a prey with a body depth smaller than or equal to its maximum
oral gape. Linear relations were developed between log-transformed values of Gpredator vs.
Wpredator and Dprey vs. Wprey. The two equations were combined to create a theoretical equation
relating Wprey and Wpredator. The resulting equation was used to predict the maximum prey
weight (Wprey) for a given size of a predator (Wpredator).
2.2.1.2. Verification of the morphometric model with paired fish
In order to verify the predictions given by the equation for maximum prey weight (Wprey), 76
single pair trials involving 23 sizes of predator (size range: 0.53 – 15.08 g) and 76 sizes of
prey (size range: 0.03 – 1.20 g) were carried out in 20L aquaria at a temperature of 26-28° C
and photoperiod of 12D: 12L. In each trial, a prey of known length and weight was paired
with a predator of known length and weight. The fish were checked at regular intervals. If a
prey had been eaten, its size was considered to be within the limits of predation for that
particular sized predator and the predator was then given a somewhat larger individual prey. If
the prey had not been eaten within the next two days, the prey was considered too large for
that particular predator. In case of predation, an interval of 24 hours was maintained between
consecutive trials to provide enough time for the predator to digest the consumed prey and to
make sure that the predator was not satiated because of the preceding prey. The maximum
prey size for a given predator weight was assumed to be between the largest consumed prey
and the prey that was too large for that predator. The maximum prey weight was then
calculated as the average between these two values. Mortality was scored on a binary scale
(1= killed, 0= not killed). Generalized Linear Model (GENMOD) procedure incorporating a
binomial model distribution with logit-link function (SAS, 1989) was used to analyze the
relationship between mortality scores (response variable) and the predator: prey weight ratio
(explanatory variable). This procedure models a linear relationship between the probability of
mortality of a prey (in logit scale) and the predator to prey weight ratio. The fitted values of
the logit model were transformed back into proportions to show the fitted curves in their
sigmoidal form. The predator: prey weight ratio that resulted in probability of 50% mortality
(hereafter R50) of a prey was estimated. The model fitted was
Size-dependent cannibalism
93
Yi = β0 + β1 LogXi + ε i ……………………………………………………………… (Model 1)
Where, Yi = the logit of probability of a prey being killed, β0 = the intercept; β1 = the
regression coefficient of Yi on LogXi; Xi = is the predator to prey weight and εi = the residual
error term.
2.2.2. Cannibalism involving group of predators and prey
In order to assess the validity of the results of our regression model for practical fish culture
conditions, several experimental trials involving groups of predators and prey were
conducted. In these trials we investigated the effect of different predator to prey weight ratio,
stocking density, age of fish and tank volume on the rate of cannibalism.
2.2.2.1. Effect of predator to prey weight ratio on cannibalism
Predator: prey ratio could be used to predict the success or failure of a predator in individual-
based predation models. To assess if this ratio also holds true in culture conditions in which
several predators and prey are involved, a total of 63 trials involving different sizes of
predators and prey were conducted. In each trial fifteen predators and fifteen preys were
stocked in 30L glass aquaria. Various combinations of predator and prey weights were used to
generate categories of predator: prey ratios ranging from 3 to 45. The average weights of
predators and prey ranged from 0.7 to 24 g and 0.09 to 0.77 g respectively. Predator and prey
originated from unrelated families or in some cases they were half sibs. GLM procedure was
used to test the effect of predator: prey weight ratio and family relationship on the rate of
cannibalism. The model fitted was
Yij = µ + Fi + βLogXj + εi………………………………………………………… (Model 2)
Where Yij = proportion of prey killed; µ = overall mean; Fi = family relationship between
predator and prey (i = half sibs, unrelated), Xj = a co-variable of the predator to prey weight
ratio; β = regression coefficient of Yij on LogXj and ε ij= the residual error term.
Furthermore, Generalized Linear Model (GENMOD) procedure with logit-link function
(SAS, 1989) was used to analyze the relationship between mortality rates and the log-
transformed predator: prey weight ratio. The same procedure was followed as in Model 1 for
Chapter 5
94
fitting a logistic regression and R50 was also estimated. The following model was eventually
fitted:
Yi = β0 + β1LogXi + ε i………………………………………………………………..(Model 3)
Where Yi = the logit of probability of a prey being killed; β0 = the intercept; Xi = predator to
prey weight ratio; β1 = the regression coefficient Yi on LogXi; and εi = the residual error term.
2.2.2.2. Effect of age and density on cannibalism
These trials were designed to investigate the effect of age on the rate of cannibalism in larvae
over the course of their early life stages. Two batches of older fish (predators) and one batch
of younger fish (prey) with age difference of two weeks were produced for this experiment.
When the prey were 7 days and the predator 14 days post hatching, the first set of cannibalism
trials were conducted (Predator: average weight = 0.79 g, SD = 0.073; prey: average weight =
0.058 g, SD = 0.0098). Different fish from the same group of predators and prey were used to
conduct three set of trials on three consecutive weeks. The average weight ± SD of the
predators and prey for the trials were as follows: trial II predator (1.69 ± 0.08) and prey (0.14
± 0.02); trial III predator (3.98 ± 0.22) and prey (0.36 ± 0.03) and trial IV predator (3.06 ±
0.1) and prey (0.4 ± 0.11). In total 24 trials were conducted in which fish were stocked at
three different densities of 0.33, 1 and 2 fish/L in 30L aquaria. GLM procedure of SAS
(1989) was used to test the effect of age, density and predator to prey weight ratio on the rate
of cannibalism by using the following model:
Yijk = µ + Ai + Dj + βLogXk + ε ijk………………………………………………..... (Model 4)
Where Yijk = Proportion of prey killed; µ = overall mean; Ai = age group of predator and prey;
Dj = density of fish (j = 0.33, 1, 2 fish/L); Xk = a co-variable of the predator to prey weight
ratio; β = regression coefficient of Yijk on LogXk; and εijk = the residual error term. Scheffe’s
multiple-range test was also used for multiple comparisons of means.
2.2.2.3. Effect of stocking density and tank volume on the rate of cannibalism
The effect of stocking density and tank volume on the rate of cannibalism was evaluated in
aquaria with different volumes (20, 30, 100 and 300L) and stocking densities of 0.33, 1 and 2
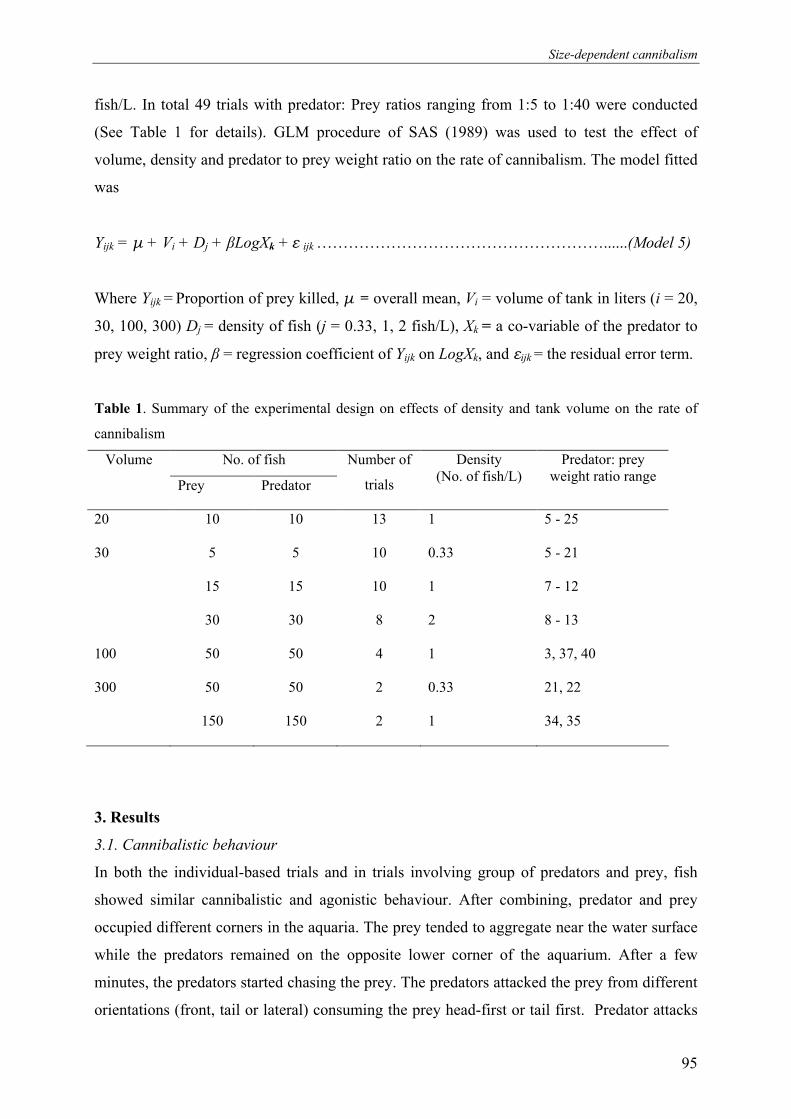
Size-dependent cannibalism
95
fish/L. In total 49 trials with predator: Prey ratios ranging from 1:5 to 1:40 were conducted
(See Table 1 for details). GLM procedure of SAS (1989) was used to test the effect of
volume, density and predator to prey weight ratio on the rate of cannibalism. The model fitted
was
Yijk = µ + Vi + Dj + βLogXk + ε ijk ………………………………………………......(Model 5)
Where Yijk = Proportion of prey killed, µ = overall mean, Vi = volume of tank in liters (i = 20,
30, 100, 300) Dj = density of fish (j = 0.33, 1, 2 fish/L), Xk = a co-variable of the predator to
prey weight ratio, β = regression coefficient of Yijk on LogXk, and εijk = the residual error term.
Table 1. Summary of the experimental design on effects of density and tank volume on the rate of
cannibalism
No. of fish Volume
Prey Predator
Number of
trials
Density (No. of fish/L)
Predator: prey weight ratio range
20 10 10 13
1 5 - 25
30
5 5 10 0.33 5 - 21
15
15 10 1 7 - 12
30
30 8 2 8 - 13
100 50 50 4
1
3, 37, 40
300 50 50 2 0.33 21, 22
150 150 2 1 34, 35
3. Results
3.1. Cannibalistic behaviour
In both the individual-based trials and in trials involving group of predators and prey, fish
showed similar cannibalistic and agonistic behaviour. After combining, predator and prey
occupied different corners in the aquaria. The prey tended to aggregate near the water surface
while the predators remained on the opposite lower corner of the aquarium. After a few
minutes, the predators started chasing the prey. The predators attacked the prey from different
orientations (front, tail or lateral) consuming the prey head-first or tail first. Predator attacks
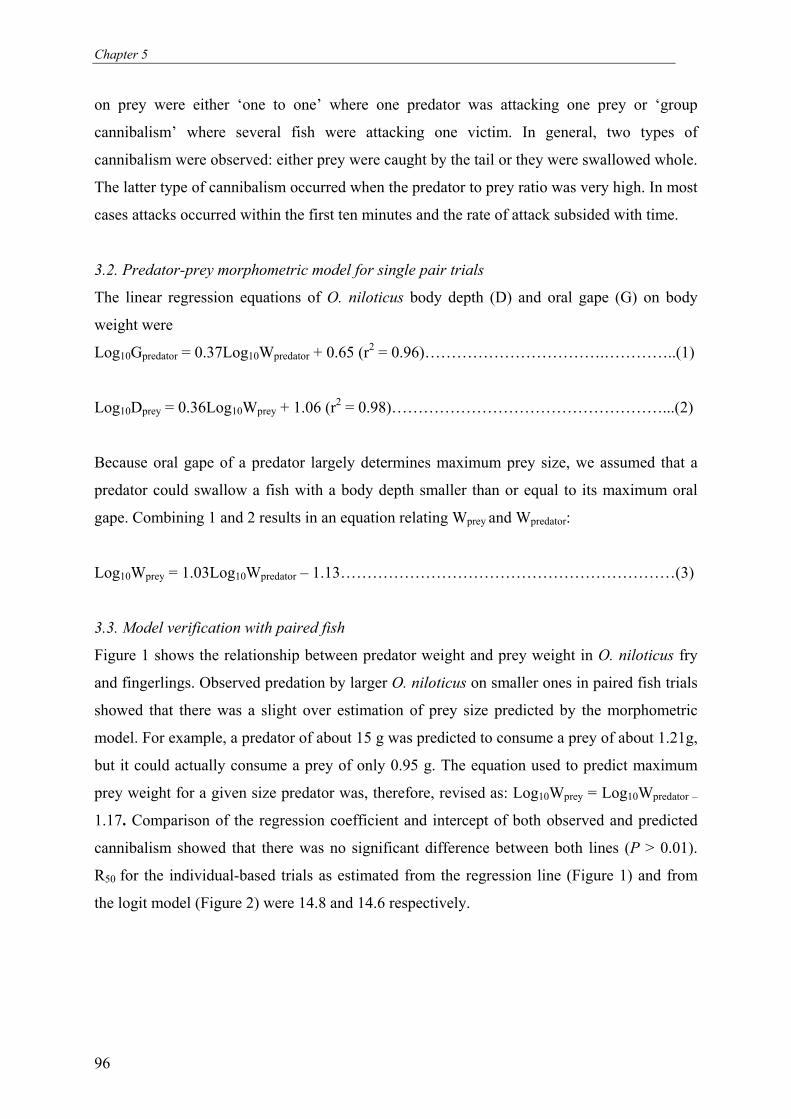
Chapter 5
96
on prey were either ‘one to one’ where one predator was attacking one prey or ‘group
cannibalism’ where several fish were attacking one victim. In general, two types of
cannibalism were observed: either prey were caught by the tail or they were swallowed whole.
The latter type of cannibalism occurred when the predator to prey ratio was very high. In most
cases attacks occurred within the first ten minutes and the rate of attack subsided with time.
3.2. Predator-prey morphometric model for single pair trials
The linear regression equations of O. niloticus body depth (D) and oral gape (G) on body
weight were
Log10Gpredator = 0.37Log10Wpredator + 0.65 (r2 = 0.96)…………………………….…………..(1)
Log10Dprey = 0.36Log10Wprey + 1.06 (r2 = 0.98)……………………………………………...(2)
Because oral gape of a predator largely determines maximum prey size, we assumed that a
predator could swallow a fish with a body depth smaller than or equal to its maximum oral
gape. Combining 1 and 2 results in an equation relating Wprey and Wpredator:
Log10Wprey = 1.03Log10Wpredator – 1.13………………………………………………………(3)
3.3. Model verification with paired fish
Figure 1 shows the relationship between predator weight and prey weight in O. niloticus fry
and fingerlings. Observed predation by larger O. niloticus on smaller ones in paired fish trials
showed that there was a slight over estimation of prey size predicted by the morphometric
model. For example, a predator of about 15 g was predicted to consume a prey of about 1.21g,
but it could actually consume a prey of only 0.95 g. The equation used to predict maximum
prey weight for a given size predator was, therefore, revised as: Log10Wprey = Log10Wpredator –
1.17. Comparison of the regression coefficient and intercept of both observed and predicted
cannibalism showed that there was no significant difference between both lines (P > 0.01).
R50 for the individual-based trials as estimated from the regression line (Figure 1) and from
the logit model (Figure 2) were 14.8 and 14.6 respectively.
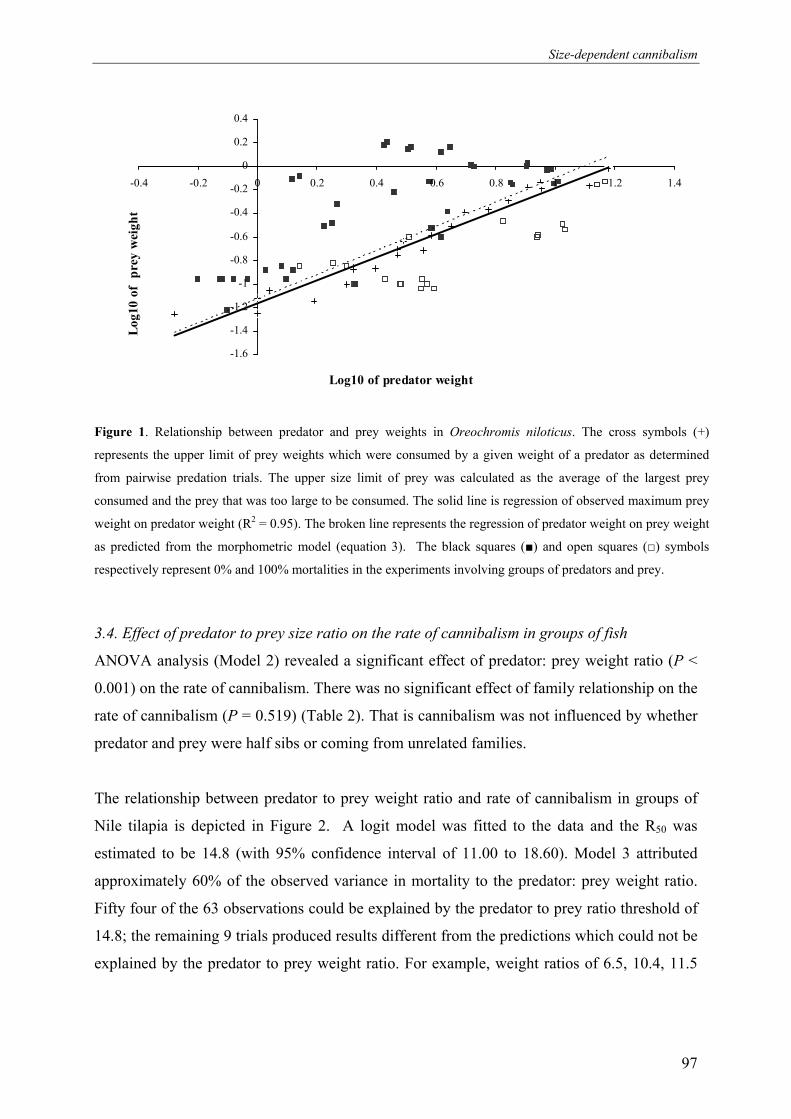
Size-dependent cannibalism
97
-1.6
-1.4
-1.2
-1
-0.8
-0.6
-0.4
-0.2
0
0.2
0.4
-0.4 -0.2 0 0.2 0.4 0.6 0.8 1 1.2 1.4
Log10 of predator weight
Log10 o
f p
rey w
eight
Figure 1. Relationship between predator and prey weights in Oreochromis niloticus. The cross symbols (+)
represents the upper limit of prey weights which were consumed by a given weight of a predator as determined
from pairwise predation trials. The upper size limit of prey was calculated as the average of the largest prey
consumed and the prey that was too large to be consumed. The solid line is regression of observed maximum prey
weight on predator weight (R2 = 0.95). The broken line represents the regression of predator weight on prey weight
as predicted from the morphometric model (equation 3). The black squares (■) and open squares (□) symbols
respectively represent 0% and 100% mortalities in the experiments involving groups of predators and prey.
3.4. Effect of predator to prey size ratio on the rate of cannibalism in groups of fish
ANOVA analysis (Model 2) revealed a significant effect of predator: prey weight ratio (P <
0.001) on the rate of cannibalism. There was no significant effect of family relationship on the
rate of cannibalism (P = 0.519) (Table 2). That is cannibalism was not influenced by whether
predator and prey were half sibs or coming from unrelated families.
The relationship between predator to prey weight ratio and rate of cannibalism in groups of
Nile tilapia is depicted in Figure 2. A logit model was fitted to the data and the R50 was
estimated to be 14.8 (with 95% confidence interval of 11.00 to 18.60). Model 3 attributed
approximately 60% of the observed variance in mortality to the predator: prey weight ratio.
Fifty four of the 63 observations could be explained by the predator to prey ratio threshold of
14.8; the remaining 9 trials produced results different from the predictions which could not be
explained by the predator to prey weight ratio. For example, weight ratios of 6.5, 10.4, 11.5
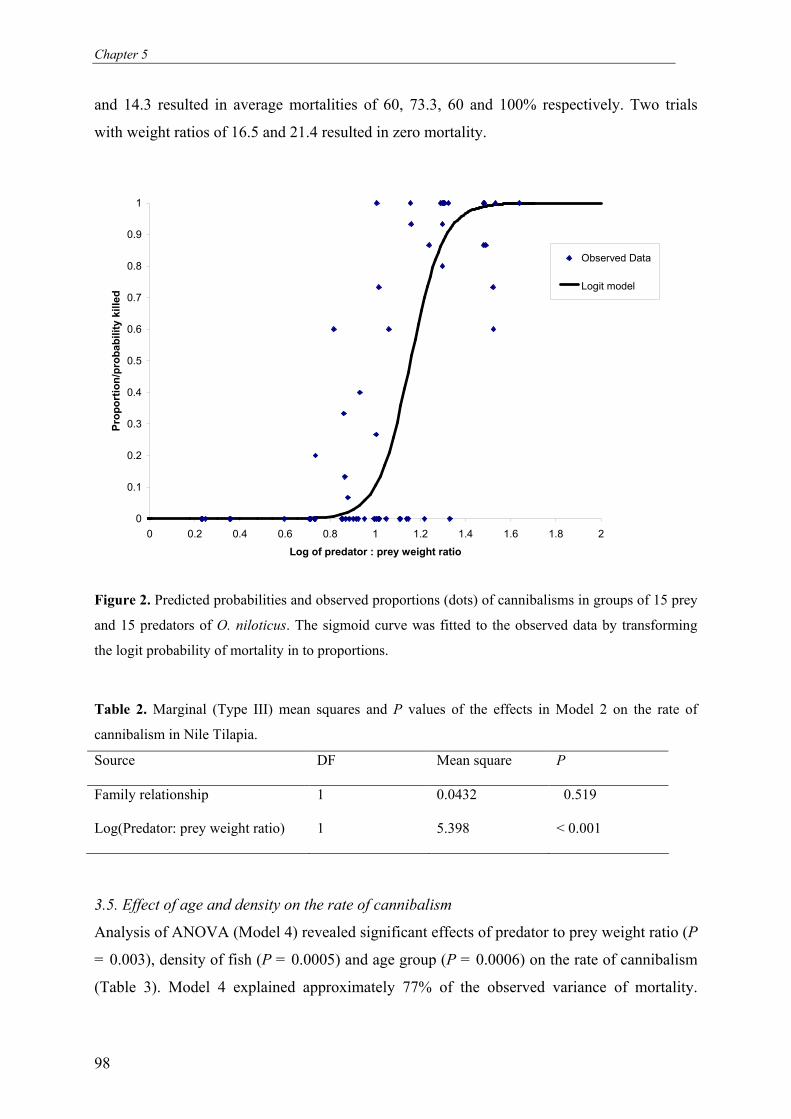
Chapter 5
98
and 14.3 resulted in average mortalities of 60, 73.3, 60 and 100% respectively. Two trials
with weight ratios of 16.5 and 21.4 resulted in zero mortality.
0
0.1
0.2
0.3
0.4
0.5
0.6
0.7
0.8
0.9
1
0 0.2 0.4 0.6 0.8 1 1.2 1.4 1.6 1.8 2
Log of predator : prey weight ratio
Pro
portio
n/p
robability k
ille
d
Observed Data
Logit model
Figure 2. Predicted probabilities and observed proportions (dots) of cannibalisms in groups of 15 prey
and 15 predators of O. niloticus. The sigmoid curve was fitted to the observed data by transforming
the logit probability of mortality in to proportions.
Table 2. Marginal (Type III) mean squares and P values of the effects in Model 2 on the rate of
cannibalism in Nile Tilapia.
Source
DF Mean square P
Family relationship
1 0.0432 0.519
Log(Predator: prey weight ratio)
1 5.398 < 0.001
3.5. Effect of age and density on the rate of cannibalism
Analysis of ANOVA (Model 4) revealed significant effects of predator to prey weight ratio (P
= 0.003), density of fish (P = 0.0005) and age group (P = 0.0006) on the rate of cannibalism
(Table 3). Model 4 explained approximately 77% of the observed variance of mortality.
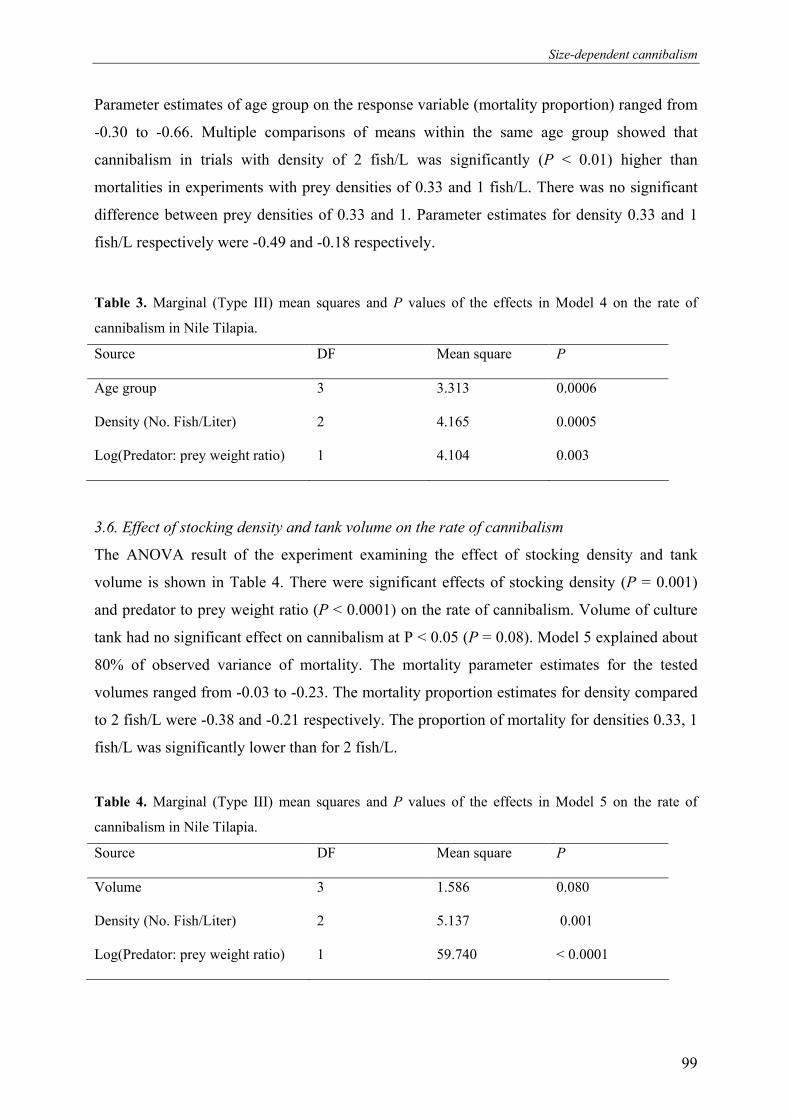
Size-dependent cannibalism
99
Parameter estimates of age group on the response variable (mortality proportion) ranged from
-0.30 to -0.66. Multiple comparisons of means within the same age group showed that
cannibalism in trials with density of 2 fish/L was significantly (P < 0.01) higher than
mortalities in experiments with prey densities of 0.33 and 1 fish/L. There was no significant
difference between prey densities of 0.33 and 1. Parameter estimates for density 0.33 and 1
fish/L respectively were -0.49 and -0.18 respectively.
Table 3. Marginal (Type III) mean squares and P values of the effects in Model 4 on the rate of
cannibalism in Nile Tilapia.
Source
DF Mean square P
Age group
3 3.313 0.0006
Density (No. Fish/Liter)
2 4.165 0.0005
Log(Predator: prey weight ratio)
1 4.104 0.003
3.6. Effect of stocking density and tank volume on the rate of cannibalism
The ANOVA result of the experiment examining the effect of stocking density and tank
volume is shown in Table 4. There were significant effects of stocking density (P = 0.001)
and predator to prey weight ratio (P < 0.0001) on the rate of cannibalism. Volume of culture
tank had no significant effect on cannibalism at P < 0.05 (P = 0.08). Model 5 explained about
80% of observed variance of mortality. The mortality parameter estimates for the tested
volumes ranged from -0.03 to -0.23. The mortality proportion estimates for density compared
to 2 fish/L were -0.38 and -0.21 respectively. The proportion of mortality for densities 0.33, 1
fish/L was significantly lower than for 2 fish/L.
Table 4. Marginal (Type III) mean squares and P values of the effects in Model 5 on the rate of
cannibalism in Nile Tilapia.
Source
DF Mean square P
Volume
3 1.586 0.080
Density (No. Fish/Liter)
2 5.137 0.001
Log(Predator: prey weight ratio)
1 59.740 < 0.0001
Chapter 5
100
4. Discussion
With most predator-prey relationships, morphological characteristics of predator feeding
apparatus are important constraints determining maximum prey size (Dabrowski and Bardega,
1984). Piscivorous fish are gape-limited predators. Because prey are generally swallowed
head- or tail first, their body depth (measured dorso-ventrally) relative to the size of a
piscivore's mouth determines whether they can be ingested (Hambright, 1991). Thus, in any
particular habitat prey with body depths greater than the largest piscivore gape are
invulnerable to ingestion. The results from this experiment are in agreement with the general
fact that there is high correlation between dimensions of body parts. Size of prey consumed
by predators could be predicted from that predator’s oral gape. Morphometric prediction of
cannibalism is species-specific because different species have different mouth morphology.
However, the model approach can prove useful for predicting cannibalism for larvae of
known size distribution.
Body size is known to play a crucial role in predator-prey interactions. Size relationship
between predator and prey is perhaps the single most important component in capture success
(Lundvall et al., 1998). Predator: prey size ratio is an important variable affecting cannibalism
(Qin and Fast, 1996) and it is generally assumed that cannibals can capture only victims that
are smaller than some critical body size owing to morphological limitations of the predator
and escape response of the prey (Christensen, 1996). The upper limit to victim size is often
assumed to be a fixed ratio of cannibal size (DeAngelis et al., 1979) but the precise
relationship between cannibal size and victim size is rarely known. In this study, predator to
prey ratio has been pointed out as the most important factor affecting rate of cannibalism in O.
niloticus. In the individual-based trials, an encounter of prey and predator with a weight
difference of 14.6 resulted in a 50% probability of the prey being killed by the predator (R50 =
14.6). Individual-based modeling approaches have often assumed threshold values of prey
size/predator size ratios to determine capture of juvenile fishes given an encounter with a
piscivore, with prey size/predator size ratios below threshold values resulting in 100% capture
efficiency and those above always resulting in failed capture attempts (Madenjian et al, 1991).
For the cannibalism observations involving several fish, a critical predator to prey weight
ratio of 14.8 was calculated as a critical ratio at which 50% of predation attempts by the
predator resulted in successful predation of the prey. Although predator-prey interactions
involving several fish are often complex, the results of the individual-based approach and the
Size-dependent cannibalism
101
trials that involved multiple prey and predators had nearly identical R50 (14.6 and 14.8).
Previous work has demonstrated the potential effectiveness of size-dependent information
obtained from laboratory predation experiments in predicting the outcome of population-level
interactions (Rice et al., 1993). However, the use of discrete values of relative fish size
(predator to prey size ratio) to determine capture success should be carefully handled as it
ignores the dynamic nature of size-dependent predation process. This is particularly
important, given that the output (cannibalism) could be extremely sensitive to the variation in
this parameter (predator: prey ratio) (Scharf et al., 1998). The difference in predator attributes
such as swimming speed and search pattern may result in differential encounter rates with
larval prey fish, leading to considerable effect on capture success and prey survival (Cowan et
al., 1996).
In fishes, early ontogenic changes in both size and morphology have major implications for
predator avoidance capacity (Fuiman and Magurran, 1994). Fish larvae possess several
sensory systems that are presumed to be important in predator detection and avoidance
(Blaxter, 1986). An increase in absolute body size also acts on predator-prey interactions, as
larger locomotor muscles provide more power to escape predators, and size also limits the
numbers of potential gape-limited predators. Together with the morphological and
developmental consequences of growth, the behavioural repertoire of a fry also increases
through learning (Lundvall et al., 1998). Prey larvae have improved ability to avoid predation
as they grow bigger and swim faster (Li and Mathias, 1982). Our results are in agreement
with the fact that prey fish become less vulnerable as they grow older. Prey fish have either
developed a mechanism of predation escape as they grow older or the increase in body size of
prey has led to the decrease in the predator to prey ratio and hence resulted in lesser
cannibalism. However, at higher predator to prey weight ratio cannibalism was still
considerably high despite the age of the fish.
In all species in which cannibalism has been investigated a positive density dependent
correlation appears to exist (Hecht and Pienaar, 1993). In many cases in which cannibalism
appears to be affected by fish density, a confounding factor is food availability. The influence
of stocking density on cannibalism at larval stages had already been evidenced in a number of
studies (Li and Mathias, 1982; Giles et al., 1986; Hecht and Appelbaum, 1988; Smith and
Reay, 1991). Macintosh and De Silva (1984) reported that under conditions of moderate
crowding and low food input cannibalism may become a significant cause of mortality in
Chapter 5
102
tilapia fry. Our results also demonstrated that prey vulnerability was increasing with
increasing density of fish and the effect of density was significant on the rate of cannibalism.
Higher density of either cannibal or prey promotes cannibalism through increased encounter
rate between predators and prey (Smith and Reay, 1991). In addition to capture success,
differences in encounter rate can also determine the outcome of predator-prey interactions.
Differential abundance or availability of prey can lead to higher encounter rates and increased
predation (Juanes, 2002).
In various taxonomic groups, socially organized animals frequently show recognition of close
relatives. A degree of kin recognition may operate in at least some fish species, with the result
that cannibalism of close relatives is avoided or suppressed (Smith and Reay, 1991).
However, no significant difference was noticed in cannibalism between related (half sib)
predators and prey and those coming from unrelated families. This was in agreement with
findings of McKaye and Barlow (1976) which demonstrated that kin recognition minimizes
filial cannibalism in Cichlids. Although we can not strictly conclude that tilapia larvae were
unable to discriminate between half-sibs and non-related fish; we can cautiously state that
related predators and prey (halfsib) are probably not less cannibalistic when compared to
unrelated predators and prey. Further investigation should be carried out to elucidate the
effect of family relationship on the rate of cannibalism in Nile tilapia.
In both the individual-based trials and trials that involved groups of predator and prey, the
highest intensity of agonistic behaviour and cannibalism occurred in the first hour of the
experiment. Although agonistic behaviour became less intense, it did not disappear during
subsequent hours. It is not clear whether decreasing trend of cannibalism over the
experimental period is due to familiarization, establishment of hierarchical stability or
satiation of the predators. Our previous results (unpublished data) indicate that familiarization
of predators and prey did not have any mitigating effect on confrontation and cannibalism.
These results do not support the findings of Giaquinto and Volpato (1997) which showed that
in juvenile Nile tilapia chemical communication decreases aggression among conspecifics by
modulating conspecific recognition, thereby increasing hierarchical stability and decreasing
confrontation.
This study showed that cannibalism among larvae might be triggered by many husbandry-
related factors but that size variation has an overriding effect on the rate of cannibalism. In
Size-dependent cannibalism
103
other words, cannibalism can not be avoided if substantial size heterogeneity exists among
fish. DeAngelis et al. (1979) showed that initial size variation was more important than
alternative food availability in controlling cannibalism. An optimal fry loss reducing strategy
would be to maintain fry at conditions which discourage size heterogeneity in combination
with size grading. The predator to prey weight ratio of 14.6 can be considered as critical
threshold for screening size heterogeneity and predicting the level of fry losses due to
cannibalism.
Acknowledgements
This study is part of the first author's PhD study, funded by NUFFIC (The Netherlands
organization for international cooperation in higher education) and INREF-Pond of Wageningen
University (http://www.inref-pond.org). We would like to acknowledge Menno ter Veld, Sietze
Leenstra for their technical assistance.
References
Baras, E. and Jobling, M., 2002. Dynamics of intracohort cannibalism in cultured fish.
Aquaculture Research 33, 461-479.
Blaxter, J.H.S., 1986. Development of sense organs and behavior of teleost larvae with special
reference to feeding and predatory avoidance. Transactions of the American Fisheries
Society 115, 98-114.
Breck, J.E. and Gitter, M.J., 1983. Effects of fish size on reactive distance of bluegill
(Lepomis macrochirus) sunfish. Can. J. Fish. Aquat. Sci. 40, 162-167 In: Lundvall, D.,
Svanback, R., Persson, L. and Bystrom, P. 1998. Size-dependent predation in piscivores:
interactions between predator foraging and prey avoidance abilities. Can. J. Fish. Aquat.
Sci. 56, 1285-1292.
Christensen, B., 1996. Predator foraging capabilities and prey anti-predator behaviors: Prey
versus post capture constraints on size-dependent predator-prey interactions. Oikos 76,
368-380.
Cowan, J.H. Houde, E.D., and Rose, K.A., 1996. Size-dependent vulnerability of marine fish
larvae to predation: and individual based numerical experiments. ICES J. Mar. Sci. 53,
23-37 In: Scharf, F.S., Buckel, J.A., Juanes, F., and Conover, D.O. 1998. Predation by
juvenile piscivourous bluefish (Pomatumus saltatrix): the influence of prey to predator
Chapter 5
104
prey size ratio and prey type on predator capture success and prey profitability. Can. J.
Fish. Aquat. Sci. 55, 1695-1703.
Coward, K., and Bromage, N. R., 2000. Reproductive physiology of female tilapia
broodstock. Reviews in Fish Biology and Fisheries. 10, 1-25.
Dabrowski, K.R. and Bardega, R., 1984. Mouth size and predicted food-size preferences of
larvae of three cyprinid fish species. Aquaculture 40, 41-46.
DeAngelis, D.L., Cox, D.K., and Coutant, C.C., 1979. Cannibalism and size dispersal in
young-of-the-year Largemouth Bass: Experiment and Model. Ecological Modelling 8,
133 -148.
Fuiman, L.A., and Magurran, A.E., 1994. Development of predator defences in fishes. Rev.
Fish Biol. Fish. 4, 145-183. In Lundvall, D., Svanback, R., Persson, L. and Bystrom, P.
1998. Size-dependent predation in piscivores: interactions between predator foraging
and prey avoidance abilities. Can. J. Fish. Aquat. Sci. 56, 1285-1292.
Fox, L. R., 1975. Cannibalism in natural population. Ann. Rev. Ecol. Syst. 6, 87-107. In:
Hecht, T and Anthony G. Pienaar. (1993). A review of cannibalism and its implications
in fish larviculture. Journal of the world Aquaculture society 24 (2), 246-261.
Giaquinto, P.C., and Volpato, G.L., 1997. Chemical communication, aggression and
conspecific recognition in the fish Nile Tilapia. Physiology and Behavior 62, 1333-
1338.
Giles, N., Wright R.M. and Nord M.E., 1986. Cannibalism in pike fry, Esox lucius L. some
experiments with fry densities. Journal of Fish Biology. 29, 107-113.
Hambright, K.D., 1991. Experimental analysis of prey selection by largemouth bass: role of
predator mouth width and prey body depth. Transactions of the American Fisheries
Society 120, 500-508.
Hart, P. and Hamrin, S.F. 1988. Pike as a selective predator. Effects of prey size, availability,
cover and pike jaw dimensions. Oikos, 51: 220-226 In: Lundvall, D., Svanback, R.,
Persson, L. and Bystrom, P. 1998. Size-dependent predation in piscivores: interactions
between predator foraging and prey avoidance abilities. Can. J. Fish. Aquat. Sci. 56,
1285-1292.
Hecht, T., and Appelbaum, S., 1988. Observations on intraspecific aggression and coeval
sibling cannibalism by larval and juvenile Clarias gariepinus (Clariidae: Pisces) under
controlled conditions. J. Zool., Lond. 214, 21- 44.
Hecht, T., and Pienaar, A., 1993. A review of cannibalism and its implications in Fish
larviculture. Journal of World Aquaculture Society 24, 246-261.
Size-dependent cannibalism
105
Jalabert, B. and Zohar, Y. (1982). Reproductive physiology in cichlid fishes, with particular
reference to Tilapia and Sarotherodon. In: Pullin, R.S.V. and Lowe-McConnell, R.H.
(eds), The Biology and Culture of Tilapias (ICLARM conference proceedings 7).
International Center for Living Aquatic Resources Management, Manila, Philippines,
129–140.
Juanes F. 2002. The allometry of cannibalism in piscivorous fishes. Can. J. Fish. Aquat. Sci.
60, 594-602.
Katavic, I., Jug-Dujakovic, J., and Glamuzina, B., 1989. Cannibalism as a factor affecting the
survival of intensively cultured Sea Bass (Dicentrarchus labrax) fingerlings.
Aquaculture 77, 135-143.
Li, S.K. and Mathias, J.A. (1982). Cause of high mortality among cultured larval walleyes.
Transactions of the American Fisheries Society. 111, 710-721.
Lundvall, D., Svanback, R., Persson, L. and Bystrom, P. 1998. Size-dependent predation in
piscivores: interactions between predator foraging and prey avoidance abilities. Can. J.
Fish. Aquat. Sci. 56, 1285-1292.
Macintosh, D.J., and De Silva, S.S., 1984. The influence of stocking density and food ration
on fry survival and growth in Oreochromis mossambicus and O. niloticus female x O.
aureus male hybrids reared in a closed circulated system. Aquaculture 41, 345-358.
Madenjian, C.P., Johnson, B.M., and Carpenter, S.R., 1991. Stocking strategies for fingerling
walleyes: an individual-based model approach. Ecol. Appl. 1: 280-288. In: Scharf, F.S.,
Buckel, J.A., Juanes, F., and Conover, D.O. 1998. Predation by juvenile piscivourous
bluefish (Pomatumus saltatrix): the influence of prey to predator prey size ratio and prey
type on predator capture success and prey profitability. Can. J. Fish. Aquat. Sci. 55,
1695-1703.
Mckaye, K.R., and Barlow, G.W., 1976. Chemical recognition of young by the Midas cichlid,
Cichlasoma citrinellum. Copeia 276-282. In Baras, E. and d’Almeida, A. F. 2001. Size
heterogeneity prevails over kinship in shaping cannibalism among larvae of sharptooth
catfish Clarias gariepinus. Aquatic Living Resources. 14, 251-256.
Melard, C. and Philippart, J.C., 1980. Pisciculture intensive de Saretherodon niloticus dans
les effluents thermiques d’une centrale munlceaire en Belgique. Paper presented at the
FAO/EIFAC Symposium on New Development in the Utilization of Heated Effluents
and of Recirculation Systems for Intensive Aquaculture, 28-30 May 1980. Stavanger,
Norway, EIFAC/80/Symp/Doc. E/11.20P.
Chapter 5
106
Pantastico, J.B., Dangilan, M.M.A., and Egula, R.V., 1988. Cannibalism among different
sizes of tilapia (Oreochromis niloticus) fry/fingerlings and the effect of natural food, p.
465-468. In R.S.V. Pullin, T. Bhukaswan, K. Tonguthai and J.L. Maclean (eds.) The
second International Symposium on Tilapia in Aquaculture. ICLARM conference.
Proceedings 15, 623 p. Department of Fisheries, Bangkok, Thailand, and International
Center for Living Aquatic Resources Management, Manila, Philippines.
Persson, L., 1987. The effects of resource availability and distribution on size class
interactions in perch, Perca fluviatilis. Oikos, 48, 148-160.
Qin, J., and Fast, A.W., 1996. Size and feed dependent cannibalism with juvenile snakehead
Channa striatus. Aquaculture 144, 313-320.
Rice, J.A., Crowder, L.B., and Rose, K.A., 1993. Interactions between size-structured
predator and prey populations: experimental test and model comparison. Transactions of
the American Fisheries Society 122, 481-491.
SAS Institute, 1989. User’s guide: Statistics, Release 6.12 Edition, SAS Institute, Cary, NC.
Scharf, F.S., Buckel, J.A., Juanes, F., and Conover, D.O., 1998. Predation by juvenile
piscivourous bluefish (Pomatumus saltatrix): the influence of prey to predator prey size
ratio and prey type on predator capture success and prey profitability. Can. J. Fish.
Aquat. Sci. 55, 1695-1703.
Smith, C, and Reay, P., 1991. Cannibalism in teleost fish. Reviews in Fish Biology and
Fisheries 1, 41-64.

Chapter 6
General discussion


General Discussion
109
Introduction
Mating systems in fish have received little attention despite the significant impact they can
have on population dynamics and conservation biology (Rowe and Hutchings, 2003) of both
captive and wild populations. Broodstock management programmes aiming at either genetic
improvement (for commercial aquaculture) or genetic homeostasis (for restocking and/or
maintenance of an endangered species) have a breeding plan comprised of selection of parents
(broodstock) for the next generation and systems for mating the selected parents (Turner and
Young, 1969). Breeding schemes employing mass spawning have two constraints: 1) Mate
selection and mating of the animals is not controlled and hence a small number of breeding
individuals may account for a large proportion of the subsequent generation; and 2) high
fecundity in most fish allows the use of small number of parents and high selection intensities.
These two factors are generally recognized as the main sources of inbreeding in hatchery-
produced fish populations (Bentsen and Gjerde, 1994; Gjerde et al., 1996; Gjedrem, 1998).
High rates of inbreeding can affect survival, reproduction, growth, the expression of genetic
defects and the level of genetic variability (Kincaid, 1983).
In Oreochromis niloticus, fry production is typically achieved by mass-spawning of males
and females stocked in large hapas, earthen ponds or tanks. Reproductive competition is
expected in a mass spawning system due to asynchronous spawning of females and the
aggressive nature of males. However, the effect of such reproductive competition on parental
contribution and other population parameters has not been studied previously. One of the
objectives of this thesis was to increase our understanding of the natural mating system in O.
niloticus, which is a primary determinant of reproductive success. In chapters 2 to 4,
reproductive variance and other population parameters (individual variation in reproductive
success, effective population size and the rate of inbreeding per generation) were quantified
and the effects of inbreeding on morphological and fitness traits were investigated. In chapter
5, the consequences of episodic fry production on size heterogeneity and cannibalism were
explored. In the present chapter, the results described in previous chapters will be discussed
and implications of the results will be explored in view of refining breeding schemes based on
mass spawning.
Mating systems
A wide range of genetic mating systems have been documented in nature and are believed to
influence many important genetic and evolutionary attributes: genetic diversity (Jarne and
Chapter 6
110
Städler, 1995); inbreeding, hybridization (Stephens and Sutherland, 2000) and intensity of
sexual selection (Neff, 2001). A thorough understanding of mating systems is, therefore,
important for many aspects of management of both domesticated and natural populations.
The evolution of mating systems in cichlid fishes has proceeded from monogamy with
biparental care to polygamy with maternal or paternal care (Barlow, 1964; Gittleman, 1981).
Polygamous mouth brooding cichlids have been studied closely in nature. Males are usually
larger and more colorful than females. Polygynandry prevails in that males mate with several
females, and females may deposit their eggs among more than one male when males are close
together (Barlow, 1991). Males provide no resource and the rewards of promiscuity for males
are undisputed because their reproductive success is directly related to the number of
females/eggs inseminated. Females, on the other hand, have high parental investment and are
expected to be choosy. The adaptive significance of females mating with multiple males is,
therefore, less clear (Parker, 1992). Several hypotheses have been formulated claiming that
promiscuous females secure substantial advantages. Benefits may be direct, such as fertility
insurance (Birkhead and Fletcher, 1995) or genetic benefits such as compensation for low
quality males (Kempenaers et al., 1992), avoidance of genetic incompatibility (Zeh and Zeh,
1996) and increased heterozygosity (Brown, 1997). It has also been proposed that female
promiscuity reduces fitness costs of inbreeding by increasing the probability of producing
outbred offspring (Stockley et al., 1993). In chapter 2 and 4 of this thesis, it was shown that
O. niloticus utilize several different mating systems ranging from single pair mating
(monogamous) to polygamous matings. Results in chapter 4 also revealed that sex ratio and
number of competitors influenced the prevalence of the different mating systems in tilapia.
The promiscuity of males and the stronger male-male competition in the presence of higher
density of males is consistent with many other findings and it was not surprising as it is a
mechanism to increase their reproductive success. A question that arises from our data in this
thesis is why females mate with multiple males? It has been hypothesized that females may
mate indiscriminately to bet-hedge against male infertility and to enhance genetic quality of
offspring. In this thesis, we are not able to discern the advantages of multiple mating for
females. For example in Chapter 2, there was no significant difference in hatching
percentages between multiply sired spawnings (76.9 ± 13.4) and spawnings sired by a single
male (75.5 ± 13.0) (results not presented) suggesting that females did not have fertilization
advantages by mating with multiple males. Given the fact that only few females spawned at a
time while practically all males were sexually active, we would think that females should be
General Discussion
111
choosy. However, with the crowded environment and intense competition between males in
the breeding hapas, we doubt if females might be able to exercise choosiness and we
cautiously say that multiple matings were probably more male-driven.
Reproductive success and effective population size
In an idealized population mating is random i.e. reproductively active individuals have equal
opportunity to mate and contribute equally to the gene pool. However, theory predicts that
differences between the sexes in potential reproductive rate and a sex ratio biased strongly
towards males should result in intense male competition, polygynous mating and high
variance in male reproductive success (Kvarnemo and Ahnesjo, 1996). The mass spawning
experiments (chapter 2 and 4), have either female-biased sex ratio (sex ratio 2 and 3: more
females than males) or unbiased (sex ratio 1: equal number of females and males). However,
the operational sex ratio (the ratio of sexually active males to fertilisable females) in all the
sex ratios was biased towards males as only few females spawn at a time while most males
are sexually active. Such male-biased sex ratios caused an intense competition between males
with stronger male-male competition in the sex ratio 1 compared to sex ratio 3 (Chapter 4:
Figures 1 and 2) as more males are present in sex ratio1. Moreover, better conditioned/less
inbred males acquire a higher proportion of offspring. This could be either due to their direct
advantage in male-male competition leading to higher access to females or indirectly due to
higher sperm volume and quality which in turn confer an advantage in sperm competition and
hence acquisition of fertilizations. Overall, the reproductive success of males was highly
skewed with around one third of the males contributing 70-93% of the offspring analyzed. In
comparison female contribution was much more balanced with most females (70-92%)
spawning at least once during the spawning period. As shown in Table 1, male reproductive
variance (σkm2) was by far greater than female reproductive variance (σkf
2) indicating that male
contribution was more skewed than that of females. There was a high discrepancy between
the census population size (N) and the effective population size, Ne (Table 1). The factors
causing a reduced magnitude of Ne were the high variances in male contribution (σkm2)
together with the small number of contributing males. Matocq (2004) reported that a decrease
in Ne can be caused by a number of behavioural and demographic factors operating within
populations. Specifically, strong skew in male reproductive success, as would be expected in
polygynous mating systems, could cause a substantial decrease in Ne relative to the census
population size. A Ne/N ratio of 0.30 - 0.44 in this study indicates that less than 50% of the
parents are contributing to the next generation and this suggests that the population is

Chapter 6
112
experiencing higher rates of genetic drift, being highest in the population with a female to
male sex ratio of 3 (Table 1). This low Ne equated to a rate of inbreeding of 3.0 - 4.4% per
generation, which is 2 -2.5 times the rate of inbreeding expected in an idealized population
(∆F = 1/8Nm + 1/8Nf : Falconer, 1989).
Table 1. Census number, reproductive variance, effective population size and rate of inbreeding for
the spawnings conducted in 2003 and 2005.
Total Ne ∆F Year N1 Sex ratio
(F to M)
σ2km σ2kf Nem Nef
Predicted2 Idealized3 predicted4 idealized5
Ne/N
2003 37 2:1 2094 149 5.0 17.8 15.6 32 0.0309 0.0156 0.43
2003 37 2:1 725 86 5.4 15.8 16.1 32 0.0301 0.0156 0.45
2005 36 3:1 10165 380 3.2 17.1 10.8 27 0.0437 0.0185 0.30
2005 36 1:1 1309 460 5.5 10.2 14.3 36 0.0341 0.0139 0.40
Nem and Nef are effective number of males and females respectively; σ2km and σ
2kf are reproductive variances for
males and females respectively
1Census size is the total number of males and females 2, 3 Calculated using the formula )(4 efemefeme NNNNN += . For predicted total Ne, Nem and Nef are used;
for idealized total Ne, the census number of males and females was used
4, 5 ∆F was calculated using 222)(
4
1)(
4
1
2
1fm
Parents
i cccF −−=∆ ∑ , for predicted ∆F contribution of
parents was obtained from parentage analysis; for idealized ∆F equal contribution of parents was assumed (for
details of this formula see Chapter 2)
Harmful effects of inbreeding have been noticed in numerous animal and plant species.
Results in chapter 3 and 4 of this thesis show that inbreeding significantly reduces the
phenotypic performance of a number of traits important in tilapia aquaculture (See Table 2).
Taking the ∆F estimate of sex ratio 3, the decline in phenotypic performance of different traits
can be extrapolated for breeding schemes that employ natural mating at that sex ratio. An
inbreeding rate of 4.4% per generation can cause a decline in fry survival of 2.4% (or ≈ 4% of
mean survival); a decline of the number of hatched fry by 42 (11% of the mean); and a
reduction in fecundity by 33 eggs per female (5% of the mean). Such levels of inbreeding can
also lead to depression of male reproductive success by up to 18%, the depression being much
higher under more intense male-male competition (sex ratio 1, for example). The results of
this thesis have generally shown that inbreeding affects not only traits at early stages but also
inbred animals that survive to adulthood may still suffer reduced fitness via poor performance
in mating competition and reduced fecundity. Lower reproductive success of inbred adults
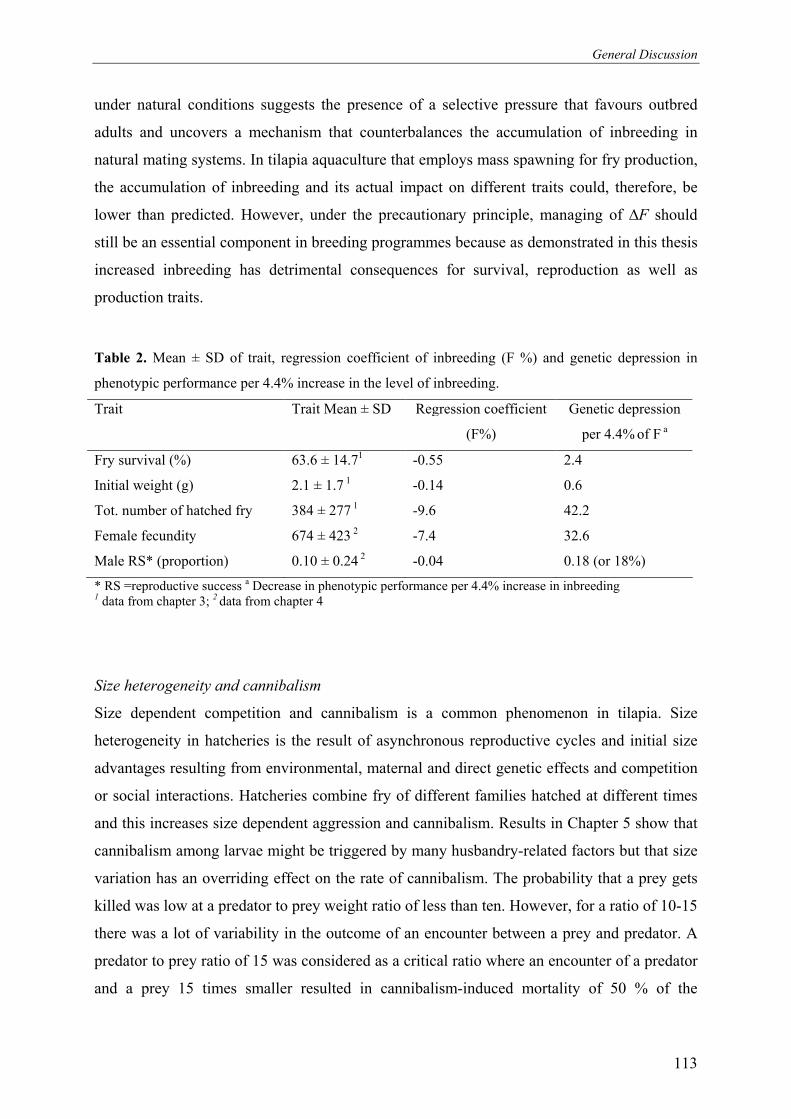
General Discussion
113
under natural conditions suggests the presence of a selective pressure that favours outbred
adults and uncovers a mechanism that counterbalances the accumulation of inbreeding in
natural mating systems. In tilapia aquaculture that employs mass spawning for fry production,
the accumulation of inbreeding and its actual impact on different traits could, therefore, be
lower than predicted. However, under the precautionary principle, managing of ∆F should
still be an essential component in breeding programmes because as demonstrated in this thesis
increased inbreeding has detrimental consequences for survival, reproduction as well as
production traits.
Table 2. Mean ± SD of trait, regression coefficient of inbreeding (F %) and genetic depression in
phenotypic performance per 4.4% increase in the level of inbreeding.
Trait Trait Mean ± SD Regression coefficient
(F%)
Genetic depression
per 4.4% of F a
Fry survival (%) 63.6 ± 14.71 -0.55 2.4
Initial weight (g) 2.1 ± 1.7 1 -0.14 0.6
Tot. number of hatched fry 384 ± 277 1 -9.6 42.2
Female fecundity 674 ± 423 2 -7.4 32.6
Male RS* (proportion) 0.10 ± 0.24 2 -0.04 0.18 (or 18%)
* RS =reproductive success a Decrease in phenotypic performance per 4.4% increase in inbreeding 1 data from chapter 3; 2 data from chapter 4
Size heterogeneity and cannibalism
Size dependent competition and cannibalism is a common phenomenon in tilapia. Size
heterogeneity in hatcheries is the result of asynchronous reproductive cycles and initial size
advantages resulting from environmental, maternal and direct genetic effects and competition
or social interactions. Hatcheries combine fry of different families hatched at different times
and this increases size dependent aggression and cannibalism. Results in Chapter 5 show that
cannibalism among larvae might be triggered by many husbandry-related factors but that size
variation has an overriding effect on the rate of cannibalism. The probability that a prey gets
killed was low at a predator to prey weight ratio of less than ten. However, for a ratio of 10-15
there was a lot of variability in the outcome of an encounter between a prey and predator. A
predator to prey ratio of 15 was considered as a critical ratio where an encounter of a predator
and a prey 15 times smaller resulted in cannibalism-induced mortality of 50 % of the
Chapter 6
114
encounters. This has a practical implication as weight ratio of 15 is common in culture
facilities with mixed and ungraded fish. Yousif (2002) conducted different experiments to
evaluate the effects of density, water flow and feeding frequency on size heterogeneity and
reported a coefficient of variation of up to 80% for weight and a biggest to smallest fish
weight ratio of up to 16 times. Size heterogeneity has two major implications for fry rearing
hatcheries. First it results in direct economic losses caused by cannibalism and fry losses.
According to Macintosh and De Silva (1984) it could cause a fry loss of up to 35% in the first
50 days of rearing. Secondly, cannibalistic fish exhibit increased robustness and vigour, a
reduction in developmental time, increased somatic growth rates, enhanced gonadal
development (Li and Mathias, 1982; Meffe and Crump, 1987). Under such circumstances,
fish breeders practising mass selection might inadvertently select for cannibalism as large
size, faster growth rate and robustness are those phenotypic traits which a breeder desires in
the selected broodstock. Many earlier mass selection schemes for growth in tilapias have
shown lack of positive response to selection (Hulata et al., 1986; Teichert-Coddington and
Smitherman, 1988; Huang and Liao, 1990). This lack of positive response has been attributed
to depletion of genetic variation (Hulata et al., 1986); and to non-heritable maternal effects
and size-dependent competition and cannibalism (Moav and Wohlfarth, 1984; Doyle and
Talbot, 1986; Ruzzante, 1993). Effects of initial size advantages are more crucial when
selection is practiced early at the fry stage resulting in selection of cannibalistic fry for grow-
out. Initial size advantages might also persist and affect the weight at harvest. In O. niloticus,
initial weight has been reported to significantly affect the survival and harvest weight (Charo-
Karisa, 2006). Mass selection under such size heterogeneity might lead to selection of initial
weight advantages which originate from cannibalism or rather than genetic merit. To
minimize such non-genetic variations, a selection technique based on collimation (early size
grading and culling of large fry) was proposed by Doyle and Talbot (1986). The effect of
collimation is to increase the ratio of genotypic to phenotypic variance (i.e. heritability) and
therefore increase the predicted response to directional selection. One generation of size-
specific mass selection in combination with collimation procedure resulted in a significant
response to selection of 8% for standard length and 29% for weight relative to the control
(Basiao et al., 2005). Our results on the critical size ratio for cannibalism (Chapter 5) can be
practically used for grading fry at early stages, thereby reducing direct fry losses due to
cannibalism and improving the efficiency of mass selection schemes in tilapia by reducing the
non-genetic variance.
General Discussion
115
Implications of natural mating systems for genetic diversity
Mating systems influence the genetic diversity within populations. Therefore, the genetic
consequences of mating systems should be considered in the development of captive breeding
plans and conservation of natural populations.
Implications for aquaculture stocks
Aquaculture is currently the fastest growing sector of food production in the world and by
2002 its contribution to the total fish and shellfish consumption was approximately 30% by
weight (FAO, 2004). The majority of global aquaculture production (90%) is currently in
developing countries (Hishamunda and Ridler, 2002). In 1993, less than 1% of the
aquaculture production worldwide originated from genetically improved breed farm breeds
(Gjedrem, 1997). Most aquaculture stocks currently used in developing countries are
genetically similar to wild, undomesticated stocks. Anecdotal and empirical evidence even
exists for substantial (up to 40%) declines in growth among Oreochromis captive populations
in both large and small-scale fish farms in Africa (Brummett and Ponzoni, 2004; Brummett et
al., 2004). Eknath (1991) reported the genetic deterioration taking place in hatcheries in India
due to poor broodstock management. The experience of selective breeding in tilapias has been
reviewed by Penman and McAndrew (2000) who concluded that the low heritability for
growth observed in many trials were an outcome of the low genetic variation typical of the
cultured stocks used. Although inappropriate husbandry practices might have also contributed
to the overall decline in growth performance, most of the blame has been put on the genetic
deterioration of stocks. Monitoring of genetic changes in populations undergoing selection
have been done using microsatellite markers and results have revealed reduction in some
genetic variability indices (number of alleles, He) and an increase in the degree of inbreeding
by 107.9% after four generations of mass selection for growth in Nile tilapia (Romana-Eguia
et al., 2005). Genetic diversity is the basis of the potential of species to respond to
environmental changes and determines a species ability to adaptively cope with natural
selection. It is also crucial in breeding programmes because it is critical for both the short
term and long term limits of response (Falconer, 1989). To ensure the highest probability of
success for breeding programmes, priority must be given to the maintenance of genetic
diversity. In mass spawning, this can be achieved by different manipulations such increasing
the effective population size or by maintaining separate lines of breeding stock and
occasionally exchanging breeders between these separate lines.

Chapter 6
116
Increasing effective population size (Ne)
Effective population size defines the effective number of individuals contributing to the next
generation and helps to predict fixation probability of favorable and deleterious alleles (Crow
and Kimura, 1970). Therefore, it determines the effect of both inbreeding depression and
genetic drift (Falconer, 1989; Caballero, 1994; Nomura, 2002). Genetic drift influences the
level of genetic variation. In both spawning experiments of 2003 and 2005, the effective
population size was approximately half of what is expected in an idealized population under
random mating (Ne/N < 0.5) (Table 1) suggesting the potential for rapid losses of gene
diversity. These low Ne equated to an inbreeding rate of 3.0 - 4.4% which is up to four times
the level of inbreeding acceptable for breeding programmes (1%: Bijma, 2000). This confirms
the need to increase the Ne in the population, in order to avoid the risks of inbreeding in
selection programmes that depend on mass spawning for fry production. Several methods can
be employed to increase the effective population size. For a fixed number of parents, the most
effective way to increase the Ne would be to reduce the variance in reproductive success by
equalizing the contribution of males and females to the next generation. In practice, this might
be difficult in mass spawning conditions where there is no control on mate selection, mating
of the animals and when there is no marker information to reconstruct pedigree. Results in
Chapter 2 and 4 showed that variation in individual parental contribution was high, the male
reproductive variance being higher than that of females by several magnitudes. This variation
had a large influence on effective population size. Therefore, any strategy to reduce
reproductive variance can be considered as a feasible option to increase the effective
population size in mass spawning. In O. niloticus females spawn asynchronously which leads
to a higher male-male competition and lower Ne. Synchronization of females, therefore, might
lead to less male-male competition and this reduced competition might increase the
participation of more males in fertilizing eggs. Synchronization of the ovarian cycle in O.
niloticus females is difficult but the problem can be alleviated through some manipulations.
Little et al. (1993) suggested that conditioning of tilapia females at high density prior to their
stocking in spawning tanks improves spawning synchrony and intensity. Spawning data of
females in our study also showed that some females spawned up to four times, while some
females fail to contribute during the spawning period. This together with the wide range of
fecundity among females can lead to unequal contribution and hence might cause a reduction
in effective population sizes. This can be prevented by removing brooding females from
breeding tanks and taking equal number of fry from each brooding female. This intervention
strategy might result in less number of fry being produced but it is feasible as the primary
General Discussion
117
objective for a breeding nucleus is capturing more genetic variation than producing a larger
number of fry.
Another routinely used diversity conserving practice is to increase the effective population
size by spawning as many fish as possible. This option entails more economic costs because
of larger space requirements, logistics, acquiring and maintenance of broodstock, but it pays
off in terms of capturing higher level of genetic diversity which will in turn result in higher
genetic progress. Gjerde and Rye (1998) reported that the high fecundity and higher
broodstock number make it possible to have a broad long term breeding objective in the
nucleus, while at the same time applying selection for a single or a few traits when producing
grow out animals and thus reducing the conflict between short term and long term breeding
objectives as seen in breeding programmes for livestock species.
With the total number of individuals fixed, sex ratio is the factor having the greatest potential
in affecting the effective population size and over which we have most control. Theoretically,
Ne is maximum when the number of males and females is equal
( ))(4 efemefeme NNNNN += . In the present study, mass spawnings were conducted with
three different sex ratios and the predicted level of inbreeding in each sex ratio is shown in
Table 1. The sex ratio 1 was expected to result in a lower level of inbreeding but as shown in
Table 1 the inbreeding associated with it is even higher than in the sex ratio 2, probably due to
the high male density and higher male-male competition in sex ratio 1 leading to relatively
lower male participation and higher reproductive variance. Considering both seed production
and associated level of inbreeding, sex ratio 2 seems to be a more viable option for a breeding
scheme based on mass spawning.
Apart from the traditional manipulations of increasing effective population size mentioned
above, genetic markers could be utilized in increasing Ne of small populations. Several
approaches such as frequency dependent selection and selection for heterozygosity at marker
loci have been proposed as strategy to increasing Ne (Wang, 2001). The efficiency of these
methods, however, has been rather low because of the limited marker information and their
chromosomal distributions in many species (Wang, 2001). In Oreochromis spp., a second-
generation genetic linkage map has been constructed and this will enable mapping and
selective breeding of quantitative traits (Lee et al., 2005).
Chapter 6
118
Marker information could also be used in parentage analysis; and knowledge on parentage
could be employed in implementation of a two stage selection scheme that combines walk-
back and optimum contribution selection proposed by Sonesson (2005) which makes it
possible to achieve high genetic gains at a constrained rate of inbreeding. The first step
involves selection of a batch of phenotypically superior fish and in the second stage, optimum
contribution selection is used. By implementing such a scheme, the unbalanced contribution
and higher rates of inbreeding in tilapia mass selection schemes can be prevented and thus
results in higher genetic gains. The results show that genotyping of two batches of 50 fish
were often necessary and could capture 76-92% of the overall genetic level achieved by
typing all fish. The added advantage of such a scheme is, therefore, that the genotyping costs
are low and that there is no common environmental effect as fish are communally reared in
one big holding facility (Sonesson, 2005).
Population subdivision and exchange of breeders
In addition to strategies designed to increase effective population size, gene diversity could be
maintained by subdividing a captive population into subpopulations (Kimura and Crow,
1963). Each subpopulation will lose genetic variation (i.e. heterozygosity and alleles) at a rate
proportional to the effective size of that subpopulation but different subpopulations may be
fixed for different alleles. Crossing of groups and transfer of animals between such groups
mitigates genetic drift and will result in maintenance of more genetic diversity in the total
captive population (Hedrick and Gilpin, 1997). Pooling of a group of isolated sub-populations
has been shown to maintain more genetic diversity and higher reproductive fitness than a
single large population of the same total size (Margan et al., 1998). Creation of sublines and
selecting within each subline has also been successfully implemented in dairy cattle breeding
programmes. Terawaki et al. (1998) simulated genetic selection in a closed nucleus herd
subdivided into two lines and with varying degree of crossing between the two lines. After ten
generations of selection, the scheme that crossed the two sublines every generation resulted in
the lowest level of inbreeding, albeit with a slight decrease in genetic gain. Such schemes
could also be adopted in the selective breeding of tilapia.
Given the information on the number of parents leaving offspring to the next generation, the
strategy ‘selection within cohorts and exchange of breeders’ as suggested by Eknath (1991)
for Indian carp and implemented by McPhee et al. (2004) for weight selection in redclaw
crayfish (Cherax quadricarinatus) could also be implemented by tilapia breeding
General Discussion
119
programmes. When the number of parents contributing to the next generation is known, the
rate of inbreeding per generation can be calculated using the formula of Falconer and Mackay
(1996)
mfF
81
81 +=∆
Where ∆F is the average rate of inbreeding per generation; f and m are the number of females
and males leaving progeny to the next generation.
Taking the mass spawning conducted in 2003 as an example, the effective number of males
and females contributing to the next generation were as follows: Hapa A (Nem = 5, Nef = 18)
and hapa B (Nem = 5, Nef = 16) (Table 1). These two experimental breeding hapas can be
considered as model broodstock units, and the level of inbreeding per generation for different
number of breeding units can be calculated (Figure 1). For example, assuming a similar
number of contributing males and females as in the experimental breeding units, three units of
breeders will result in a level of inbreeding of 1.06% per generation which is very close to the
acceptable level of inbreeding for most breeding programmes. For small scale farmer-based
breeding programme, three breeding units as our experimental spawning stock would have a
census population size of 111 adults (= 37*3; 25 females and 12 males per cohort) and Ne of
56 (= 111*0.5) spawning adults should be sufficient to meet the constrained inbreeding of
1%. In conservation management, on the other hand, there is a generally accepted view that a
minimum effective population size of 50 spawning individuals is required to capture genetic
diversity that will sustain the short-term fitness of a population (Allendorf and Ryman, 2002).
Using a Ne/N ≈ 0.5 from our study, this translates into a census population size of 100.
Therefore, from both the rate of inbreeding per generation and the conservation rule of thumb,
three breeding units of broodstock can be recommended as a founder population for a small-
scale breeding scheme run by an individual farmer. Nucleus breeding schemes offer the
potential for higher genetic progress than would be achieved by traditional within-farm
selection (Smith, 1988). The rate of genetic progress depends, among other things, on the size
of the nucleus, selection intensity and the effectiveness of selection within the nucleus
(Weigel, 2001). The experimental breeding units can be considered as building blocks and the
reproductive parameters might be extrapolated to design bigger schemes. In general for faster
rates of genetic progress in a nucleus, higher population size and higher selection intensities
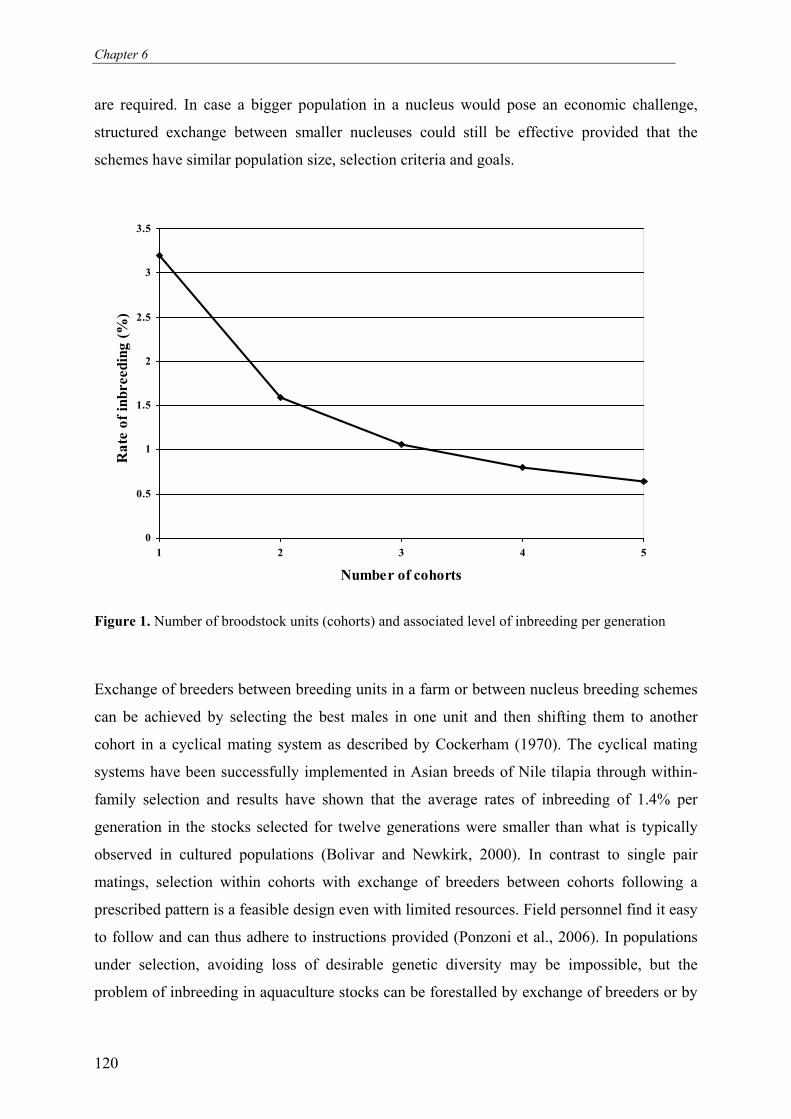
Chapter 6
120
are required. In case a bigger population in a nucleus would pose an economic challenge,
structured exchange between smaller nucleuses could still be effective provided that the
schemes have similar population size, selection criteria and goals.
0
0.5
1
1.5
2
2.5
3
3.5
1 2 3 4 5
Number of cohorts
Rate
of in
breedin
g (%
)
Figure 1. Number of broodstock units (cohorts) and associated level of inbreeding per generation
Exchange of breeders between breeding units in a farm or between nucleus breeding schemes
can be achieved by selecting the best males in one unit and then shifting them to another
cohort in a cyclical mating system as described by Cockerham (1970). The cyclical mating
systems have been successfully implemented in Asian breeds of Nile tilapia through within-
family selection and results have shown that the average rates of inbreeding of 1.4% per
generation in the stocks selected for twelve generations were smaller than what is typically
observed in cultured populations (Bolivar and Newkirk, 2000). In contrast to single pair
matings, selection within cohorts with exchange of breeders between cohorts following a
prescribed pattern is a feasible design even with limited resources. Field personnel find it easy
to follow and can thus adhere to instructions provided (Ponzoni et al., 2006). In populations
under selection, avoiding loss of desirable genetic diversity may be impossible, but the
problem of inbreeding in aquaculture stocks can be forestalled by exchange of breeders or by
General Discussion
121
keeping high effective populations sizes. It should be emphasized that subdividing the
population or exchange of breeders does nothing to reduce the level of inbreeding in the base
population, but it serves only to reduce the rate at which further inbreeding is accumulated.
Therefore, it is essential that a relatively high level of genetic diversity should be present in
the starting broodstock.
Implications for natural/semi-natural populations
The amount of genetic diversity in natural populations is the basis of adaptability to
environmental changes and evolutionary potential of species. The ability of natural
populations to maintain genetic variation depends not only on the number of individuals
constituting a population, but also on the mating systems of the species. Quantitative
estimates of mating system parameters in fish populations are, therefore, necessary to explain
the genetic structure of these populations and to predict adaptability and evolutionary
processes.
Multiple paternity, effective population size and inbreeding
Numerous studies have shown that multiple paternity within a single reproductive bout (e.g.,
clutch, litter, nest) is widespread among species with external fertilization and parental care
(Avise et al., 2002 and references therein). Microsatellite-based paternity analyses in several
cichlids have documented multiple paternity of broods, with up to six males fertilizing a
single clutch (Kellogg et al., 1995; Parker and Kornfield, 1996). In our study, the prevalence
of multiple paternity was high: 64% (sex ratio 1), 43% and 51% (sex ratio 2), 32% (sex ratio
3) of spawnings were multiply sired. Up to five males were involved in fertilizing eggs in a
single spawn (Chapter 2 and Chapter 4). Multiple paternity, compared to single paternity, can
influence effective population size (Sugg and Chesser, 1994) and the reproductive efficiency
of individuals (Levitan and Sewell, 1998). This mating system has been advocated as a
strategy to reduce inbreeding (Stockley et al., 1993) and maintain genetic diversity in small
natural populations. Broadly, multiple paternity has been claimed to provide genetic benefits
by improving the chance that females will acquire ‘‘good’’ genes or enhancing the genetic
diversity of their progeny (Yasui, 1998). Moran and Garcia-varquez (1998) observed that
multiple paternity was a way to increase the effective population size and consequently to
maintain genetic variability of the relict Atlantic salmon population in river Mandeo (La
Coruña, Spain) which otherwise would have suffered higher levels of inbreeding due to very
low number of adults and might have faced extinction. In their study, complete male
Chapter 6
122
dominance was not observed and no more than 28% of the total progeny was fertilized by a
single male. In contrast to Moran and Garcia-varquez (1998), the relative contributions of
males in most of the multiply-sired spawns in our study were characterized by one single
dominant male siring most of the offspring and other males with only minor contributions.
This very high variance in reproductive success and involvement of only few males in most of
the spawns resulted in reduction of effective population size and increased rate of inbreeding
compared to an idealized population under random mating. Furthermore, there were no
significant differences in the hatching rates of both the single pair spawnings and mutiply-
sired spawns suggesting that direct benefits of multiple paternity could not be discerned from
our data. Overall, our data did not reveal any of the claimed benefits of multiple paternity.
The high reproductive skew, dominance of few males and the associated level of inbreeding
might have masked the potential advantages of multiple paternity.
The Ne/N in our study ranged from 0.3 to 0.44 indicating that less than 50% of the parents
were contributing to the gene pool of the next generation. In natural populations, low Ne/N
ratios (e.g. Ne/N ≈ 0.10; Frankham 1995a) are common and have been attributed to the
exposure of natural populations to natural stressors such as weather extremes, high population
densities, parasites and diseases (Young 1994; Pray et al., 1996). These natural factors
promote population size fluctuations and large variation in family sizes that will eventually
reduce Ne/N (Frankham, 1995a). Whether inbreeding affects the demography and persistence
of natural populations has been questioned. There are evidences that inbreeding depression
can occur and can decrease the fitness of wild populations (e.g. Spielman et al., 2004; Reed,
2005). However, some other studies of natural populations have yielded no evidence of
inbreeding depression, despite small population size or genetic homogeneity (Visscher et al.,
2001; Kalinowski et al., 1999). The finding in this thesis (Chapter 4) showed that inbreeding
decreased the reproductive fitness of both males and females: inbred adults had lower
reproductive success compared to outbred individuals and that inbreeding depression on male
reproductive success was magnified under higher male density. The higher reproductive
success of males could be due to the advantage of outbred/better conditioned males in male-
male competition or it could also be active mate choice by females since body size and
condition fish are some of the cues used by females during mate choice (Houde, 1997).
However, given our experimental setup, it is not possible to disentangle effects of male-male
competition and active mate choice by females. But clearly the results reveal the presence of a
natural selective force that favours outbred adults and uncovers a mechanism that
General Discussion
123
counterbalances the accumulation of inbreeding to some extent in populations under natural
mating systems.
A number of other strategies for reducing inbreeding accumulation such as avoidance of
mating with close kin (Brown and Eklund, 1994) and natal dispersal (Pusey, 1987) have been
documented in many natural populations. Results in Chapter 4 did not reveal any effect of
relatedness (as measured by the kinship coefficient) on the reproductive success of males
suggesting there was no kin recognition and avoidance. Our experimental breeding hapas
allow natural mating but the crowded and artificial conditions might not be an appropriate
milieu for studying natural mechanisms of inbreeding avoidance which could be greatly
influenced by the nature of the environment. For example, Sarotherodon melanotheron
samples originating from lagoon areas tended to show significant heterozygosity deficiencies
as compared with Hardy-Weinberg equilibrium expectations, whereas this was not the case
for riverine samples. This is because in lagoon type of environment where the water
hydrodynamicity is much lower than within rivers, allowing mating within small group of kin
as compared to rivers where there is higher chance for dispersal (Pouyaud et al., 1999). In
Lake Malawi cichlids, male-biased within-population dispersal has been noticed explaining
the absence of inbreeding despite the very no /or low dispersal between population occupying
adjacent areas (Knight et al., 1999). In populations of Oreochromis niloticus, these
mechanisms of inbreeding avoidance might be at work and it is worthwhile investigating
them in a natural system or in an experimental set up more close to natural environment.
Conclusions
Mass selection breeding schemes which depend on mass spawning for fry production can
present a straightforward and economically viable option for low-cost genetic improvement
programmes. However, many mass selection schemes in fish have not lead to satisfactory
results because high selection intensities often lead to excessive inbreeding over time and
resulted in no or marginal genetic gain. The results of this thesis have established the effective
number of parents contributing to the next generation and the associated level of inbreeding
per generation in experimental mass spawning broodstock units (breeding units). Several
traditional strategies as well as marker-assisted manipulations have been discussed as a
possibility of increasing the effective population sizes or forestalling the rate at which genetic
diversity is lost. In addition, a critical size ratio for cannibalism has been established to
develop a collimation procedure which will reduce the phenotypic variance in growth that can
Chapter 6
124
be caused by size-dependent competition and cannibalism among fish. The information
presented in this thesis is thus a combination of strategies to increase genetic diversity, reduce
level of inbreeding and minimize the non-genetic phenotypic variance. Such information can
be used to develop practical scenarios for mass selection breeding schemes that maximise
selection response while at the same time managing inbreeding. Considering the breeding
units as basic building blocks, mass selection breeding programmes based on mass spawning
can be implemented. The number of breeding units can be extrapolated depending on the size
of the nucleus and the intensity of selection.
In conclusion, the results in this thesis have laid the ground work for a mass selection scheme
that takes into consideration the genetic contribution of parents under mass spawning mating
conditions and management of ∆F. Such schemes require minimum infrastructural
investments and can be adopted as a model for low-cost and effective selective breeding
schemes that will result in desired response without compromising the long term fitness of
culture populations due to inbreeding.
References
Allendorf, F.W., and Ryman, N., 2002. The role of genetics in population viability analysis.
In McCullough and Beissinger, S.R. (Eds.). Population viability analysis. University of
Chicago press, Chicago.
Avise, J.C., Jones, A.G., Walker, D., Dewoody, J.A., and collaborators, 2002. Genetic mating
systems and reproductive natural histories of fishes: Lessons for ecology and evolution.
Ann. Rev. Genet. 36, 19-45.
Barlow, G.W., 1964. Ethology of the Asian teleost Badis badis. V. Dynamics of fanning and
other parental activities, with comments on the behaviour of the larvae and post larvae.
Z. Tierpsychol. 21, 99-123 In: Keenleyside, M.H.A. (Ed.), 1991. Cichlid Fishes
Behaviour, ecology and evolution. Chapman and Hall, London.
Barlow, G.W., 1991. Mating Systems among Cichlid Fishes. Pp. 173-190 In: Keenleyside,
M.H.A.(Ed.), 1991. Cichlid Fishes Behaviour, ecology and evolution. Chapman and
Hall, London.
General Discussion
125
Basio, Z.U., Arago, A.L., and Doyle, R.W., 2005. A farmer-oriented Nile tilapia,
Oreochromis niloticus L., breed improvement in the Philippines. Aquaculture Research
36, 113-119.
Bentsen, H.B., Gjerde, B., 1994. Design of fish breeding programs. Proceedings of the 5th
World Congress Genet. Appl. Livest. Prod. 19, pp. 353 -359.
Bijma, P., 2000. Long term genetic contribution. Prediction of rates of inbreeding and genetic
gain in selected populations. PhD thesis, Animal Breeding and Genetics Group,
Wageningen University, The Netherlands.
Birkhead, T.R., and Fletcher, F. 1995. Male phenotype and ejaculate quality in the Zebra
finch Taeniopygia guttata. Proc. R. Soc. Lond. B 262, 329-334.
Bolivar, R.B., and Newkirk, G.F., 2000. Response to selection for body weight of Nile tilapia
(Oreochromis niloticus) in different culture environments. In: Fitzsimmons, K. and
Carvalho, J.F (eds). Tilapia Aquaculture in the 21st century. Proceedings from the fifth
International Symposium on Tilapia in Aquaculture, Vol. 1, Rio de Janeiro, Brazil
pp.12-23.
Brown, J.L., 1997. A theory of mate choice based on heterozygosity. Behavioral Ecology 8,
60-65.
Brown, J.L., Eklund, A., 1994. Kin recognition and the major histocompatibility complex: an
integrative review. American Naturalist 143, 432-461.
Brummett, R.E, Angoni, D.E., Pouomogne, V., 2004. On-farm and on-station comparison of
wild and domesticated Cameroonian populations of Oreochromis niloticus. Aquaculture
242, 157-164.
Brummett, R.E, Angoni, D.E., Pouomogne, V., 2004. On-farm and on-station comparison of
wild and domesticated Cameroonian populations of Oreochromis niloticus. Aquaculture
242, 157-164
Brummett, R.E., and Ponzoni, R., 2004. Genetic quality of domesticated African tilapia
populations. Journal of Fish Biology 65 (Supplement A), 314-325.
Caballero, A., 1994. Developments in the prediction of effective population size. Heredity 73,
657-679.
Charo-Karisa, H., 2006. Selection for growth of Nile tilapia (Oreochromis niloticus L.) in
low-input environments. PhD thesis. Wageningen University. 169 p.
Cockerham, C.C., 1970. Avoidance and rate of inbreeding. In: Kojima, K (Ed.) Mathematical
topics in population genetics. Springer Verlag, Berlin. P. 104-127.
Chapter 6
126
Crow, J.F., and Kimura, M., 1970. An introduction to Population Genetics Theory. Harper
and Row, New York, 591 pp.
Doyle, R.W., and Talbot, A.J., 1986. Effective population size and selection in variable
aquaculture stocks. Aquaculture 57, 27-35.
Eknath, A.E., 1991. Simple broodstock management to control indirect selection and
inbreeding. Indian carp example. NAGA, The ICLARM quarterly 738, 13-14.
Falconer, D.S., 1989. Introduction to Quantitative Genetics. Third edition. Longman,
England.
Falconer, D.S., Mackay, T.F.C., 1996. Introduction to Quantitative Genetics, 4th edition
Longman, Essex, England.
FAO, 2004. The State Of the World Fisheries and Aquaculture (SOFIA). FAO Corporate
Document Repository. http://www.Fao.org
Frankham, R., 1995a. Effective population-size adult-population size ratios in wildlife: a
review. Genetical Research 66, 95–107.
Gittleman, J.L., 1981. The phylogeny of parental care in fishes. Animal Behaviour 29, 936-
941.
Gjedrem, T. 1997. Selective breeding to improve aquaculture production. World Aquaculture.
22, 33-45.
Gjedrem, T., 1998. Developments in fish breeding and genetics. Acta Agricultura
Scandinavica A 28 (Suppl.), 19-26.
Gjerde B., and Rye, M., 1998. Design of breeding programmes in aquaculture species:
Possibilities and constraints. In: Bartley, D.M., Basurco B. (ed.). Genetics and breeding
of Mediterranean aquaculture species. Zaragoza: CIHEAM-IAMZ, 1998. p. 181-192,
Seminar of the CIHEAM Network on Technology of Aquaculture in the Mediterranean
(TECAM), 1997/04/28-29, Zaragoza (Spain)
Gjerde, B., Gjoen, H.M., Villanueva, B., 1996. Optimum designs for fish breeding
programmes with constrained inbreeding: mass selection for a normally distributed trait.
Livestock Production Science 47, 59-72.
Hedrick, P.W., and Gilpin, M., 1997. Metapopulations genetics: effective population size. In:
Hanski, I., Gilpin, M., (ed.) Metapopulation dynamics: ecology, genetics, and evolution.
New York, Academic press, p 165-181.
Hishamunda, N., and Ridler, N.B., 2002. Macro policies to promote sustainable commercial
aquaculture. Aquaculture International 10, 491-505.
Houde, A.E., 1997. Sex, color, and mate choice in Guppies. Princeton Univ. Press, Princeton.
General Discussion
127
Huang, C.M., and Liao, I.C., 1990. Response to mass selection for growth rate in
Oreochromis niloticus. Aquaculture 85, 199-205
Hulata, G., Wohlfarth, G.W., Halevy, A., 1986. Mass selection for growth rate in the Nile
tilapia (Oreochromis niloticus). Aquaculture 57, 177-184.
Jarne, P., and. Städler, T., 1995 Population genetic structure and mating system evolution in
freshwater pulmonates. Experientia 51, 482–497.
Kalinowski, S.T., Hedrick, P.W., Miller, P.S., 1999. No inbreeding depression observed in
Mexican and red wolf captive breeding programs. Conservation Biology. 13, 1371-
1377.
Kellogg, K.A., Markert, J.A., Stauffer, J.R., Kocher, T.D., 1995. Microsatellite variation
demonstrates multiple paternity in lekking cichlid fishes from Lake Malawi, Africa.
Proc. R. Soc. Lond. B 260, 79-84.
Kempenaers, B., Verheyen, G.R., Van den Broeck, M., Burke, T., Van Broekhoven, C.,
Dhont, A.A., 1992. Extra-pair paternity results from female preference for high quality
males in the blue tit. Nature 357, 494-496.
Kimura, M., and Crow, J.F., 1963. On the maximum avoidance of inbreeding. Genetical
Research 4, 399-415.
Kincaid, H.L., 1983. Inbreeding in fish populations used for aquaculture. Aquaculture 33,
215-227.
Knight, M.E., Van Oppen, M.J.H., Smith, H.L., Rico, C., Hewitt, G.M., Turner, G.F., 1999.
Evidence for male-biased dispersal in Lake Malawi cichlids from microsatellites.
Molecular Ecology 8, 1521-1527.
Kvarnemo, C. and Ahnesjo, I., 1996. The dynamics of operational sex ratios and competition
for mates. Trends in Ecology and Evolution 11, 404–408.
Levitan, D. R., and Sewell, M. A., 1998. Fertilization success in free-spawning marine
invertebrates: review of the evidence and fisheries implications. Canadian Special
Publication of Fisheries and Aquatic Sciences 125, 159-164.
Lee, B.Y., Lee, W.J., Streelman, J.T., Carleton, K.L., Howe, A.E., Hulata, G., Slettan, A.,
Stern, J.E., Terai, Y., Kocher, T.D. A second-generation genetic linkage map of Tilapia
(Oreochromis Spp.) Genetics 170, 237-244.
Li, S.K. and Mathias, J.A., 1982. Cause of high mortality among cultured larval walleyes.
Transactions of the American Fisheries Society 111, 710-721.
Chapter 6
128
Little, D.C., Macintosh, D.J. and Edwards, P. (1993) Improving spawning synchrony in the
Nile tilapia, Oreochromis niloticus (L.). Aquaculture Fisheries Management 24, 399–
405.
Macintosh, D.J., and De Silva, S.S. 1984. The influence of stocking density and food ration
on fry survival and growth in Oreochromis mossambicus and O. niloticus female x O.
aureus male hybrids reared in a closed circulated system. Aquaculture 41, 345-358.
Margan, S.H., Nurthen, R.K., Montgomery, M.E., Woodworth, L.M., Lowe, E.H., Briscoe,
D.A., Frankham, R., 1998. Single large or several small? Population fragmentation in
the captive management of endangered species. Zoo Biology 17, 467-480.
Matocq, M.D., 2004. Reproductive success and effective population size in woodrats
(Neotoma macrotis). Molecular Ecology 13, 1635-1642.
McPhee, C.P., Jones, C.M., Shanks, S.A., 2004. Selection for increased weight at 9 months in
redclaw crayfish (Cherax quadricarinatus). Aquaculture 237, 131-140.
Meffe, G.K., and Crump, M.L., 1987. Possible growth and reproductive benefits of
cannibalism in the mosquitofish. American Naturalist 129, 203-212.
Moav, R., and Wohlfarth, G.W., 1984. Magnification through competition of genetic
differences in yield capacity in carp. Heredity 33, 181-202.
Moran, P., and Garcia-Vazquez, E., 1998. Multiple paternity in Atlantic salmon: a way to
maintain genetic variability in relicted populations. Journal of Heredity 89,551–553.
Neff, B.D., 2001. Alternative reproductive tactics and sexual selection. Trends in Ecology and
Evolution 16, 669.
Nomura, T., 2002. Effective size of populations with heritable variation in fitness. Heredity
89, 413-416.
Parker, G.A., 1992. Snakes and female sexuality. Nature 355, 395-396.
Parker, G.A., Kornfield I., 1996. Polygynandry in Pseudotropheus zebra, a cichlid fish from
Lake Malawi. Environmental Biology Fishes 47, 345-52.
Penman, D.J., and McAndrew, B.J., 2000. Genetics for the management and improvement of
cultured tilapias. Pp 227-266. In: Beveridge, M.C.M and McAndrew, B.J., (eds).
Tilapias: Biology and Exploitation. Fisheries Series 25 Kluwer, Dordrecht, The
Netherlands.
Ponzoni, R.W., Nguyen, N.H., Khaw, H.L., 2006. Importance and implementation of simple
and advanced selective breeding programs for aquaculture species in developing
countries. Paper presented at the 8th World Congress Genet. Appl. Livest. Prod. August
13-18, 2006, Brazil.
General Discussion
129
Pouyaud, L., Desmarais, E., Chenuil, A., Agnese, J.F., and Bonhomme, F., 1999. Kin
cohesiveness and possible inbreeding in the mouthbrooding tilapia Sarotherodon
melanotheron (Pisces Cichlidae). Molecular Ecology 8, 803-812.
Pray, L. A., Goodnight, C. J., Stevens, L., Schwartz, J. M., and Yan, G. Y., 1996. The effect
of population size on effective population size: an empirical study in the red flour beetle
Tribolium castaneum. Genetical Research 68, 151–155.
Pusey, A.E., 1987. Sex-biased dispersal and inbreeding avoidance in birds and mammals.
Trends in Ecology and Evolution 2, 295-299.
Reed, D. H. 2005. Relationship between population size and fitness. Conservation Biology
19, 560–568.
Romana-Eguia, M.R.R., Ikeda, M., Basiao, Z.U., Taniguchi, N., 2005. Genetic changes
during mass selection for growth in Nile tilapia, Oreochromis niloticus (L), assessed by
microsatellites. Aquaculture Research 36, 69-78.
Rowe, S., and Hutchings, J.A., 2003. Mating systems and the conservation of commercially
exploited marine fish. Trends in Ecology and Evolution 18, 567-572.
Ruzzante, D.E., 1993. Domestication effects on aggressive and schooling behaviour in fish.
Aquaculture 120, 1-24.
Smith, C., 1988. Genetic improvement of livestock in developing countries using nucleus
breeding units. World Animal review 65, 2-10.
Sonesson, A.K., 2005. A combination of walk-back and optimum contribution selection in
fish: a simulation study. Genet. Sel. Evol. 37, 587-599.
Spielman, D., Brook, B. W., and Frankham, R. 2004. Most species are not driven to
extinction before genetic factors impact them. Proc. Natl. Acad. Sci. 101, 15261–15264.
Stephens, P.A., and Sutherland, W.J., 2000. Vertebrate mating systems, Allee effects and
conservation. In: Apollonio, M, Festa-Bianchet, M., and Mainardi, D., 2000. Vertebrate
mating systems. London, World Scientific Publishing.
Stockley, P., Searle, J.B., MacDonald, D.W., and Jones, C.S., 1993. Female multiple mating
behaviour in the common shrew as a strategy to reduce inbreeding. Proc R Soc Lond B.
254, 173-179.
Sugg, D.W., and Chesser, R.K., 1994. Effective population sizes with multiple paternity.
Genetics 137, 1147–1155.
Teichert-Coddington, D.R., Smitherman, R.O., 1988. Lack of response by Tilapia nilotica to
mass selection for rapid early growth. Transactions of the American Fisheries Society
117, 297-300.
Chapter 6
130
Terawaki, Y., Suzuki, M., and Fukuri, Y., 1998. Genetic response and inbreeding in a sub-
population mating system for diary cattle. Proc. Sixth World Congr. Genet. Appl.
Livest. Prod. 25, 471-474.
Turner, H.N., and Young, S.S.Y., 1969. Quantitative Genetics in Sheep breeding. Cornell
University Press, Ithaca, NY, 332 pp.
Visscher, P.M., Smith, D., Hall, S.J.G., and Williams, J.L., 2001. A viable herd of genetically
uniform cattle. Nature 409, 303.
Wang, J., 2001. Optimal marker-assisted selection to increase the effective size of small
populations. Genetics 157, 867-874.
Weigel, K.A., 2001. Controlling inbreeding in modern breeding programs. Journal of Dairy
Science 84 (E. Suppl.), 177-184.
Yasui, Y., 1997. A ‘‘good-sperm’’ model can explain the evolution of costly multiple mating
by females. American Naturalist 149, 573–584.
Young, T. P., 1994. Natural die-offs of large mammals: implications for conservation.
Conservation Biology 8, 410–418.
Yousif, O.M., 2002. The effects of stocking density, water exchange rate, feeding frequency
and grading on size hierarchy development in juvenile Nile tilapia, Oreochromis
niloticus L. Emirates Journal of Agricultural sciences. 14, 45-53.
Zeh, J.A., and Zeh, D.W., 1997. The evolution of polyandry. II. Post-copulatory defence
against genetic incompatibility. Proc. R. Soc. Lond B. 264, 69-75.

Summary

Summary
133
Summary
Nile tilapia (Oreochromis niloticus L.) is one of the most important species among the
commercially farmed tilapias. Both small-scale and commercial production of tilapia is
rapidly expanding in many countries of the world because tilapias meet many of the desirable
characteristics for an ideal species for aquaculture: fast growth, high acceptability to
consumers and tolerance of a wide range of culture conditions. Fry production in Nile tilapia,
Oreochromis niloticus is typically achieved by mass-spawning of males and females stocked
in large hapas, earthen ponds or tanks. Territorial behaviour and reproductive competition in
such spawning setup together with the asynchronous spawning nature in tilapia could have
serious implications for breeding plans that employ mass spawning for seed production. The
aims of this thesis were to gain thorough understanding into the natural mating systems in O.
niloticus; the genetic consequences of the mating system (reproductive success, effective
population size and inbreeding); as well as non-genetic variations (size heterogeneity and
cannibalism) among fish as a result of asynchronous reproduction.
In order to establish captive breeding programmes that maximize genetic gain without
compromising the long-term genetic diversity of stocks, understanding of the natural mating
systems is a crucial step. In Chapter 2, we analyzed parentage and quantified male
reproductive success of O. niloticus under commercial hatchery conditions in two breeding
hapas each stocked with 12 males and 25 females by sampling offspring from individual
mass-spawning events. Eleven highly polymorphic microsatellite markers were used to
genetically characterize the mating systems in O. niloticus and quantify the reproductive
success of individual males and females. In total, 760 offspring from 76 spawnings were
included in the paternity analysis. Mating system in Nile tilapia ranged from single pair to
promiscuous mating. Multiple paternity was detected in 46% of the broods, with up to 4
males fertilizing a single clutch. Multiple maternity was also detected in over 8% of the
clutches analyzed. There was a very high variance in male reproductive success, with one
third of males siring more than 70% of the offspring. Male condition factor had a significant
effect on reproductive success with better conditioned males siring a large proportion of
offspring. The high reproductive variance resulted in a Ne of around 16 for hapas A and B,
and a low Ne/N ratio, 0.43 and 0.45 for hapas A and B respectively. The rate of inbreeding,
∆F, for each hapa, was estimated to be around 3.0% per generation, which is about twice the
inbreeding expected in an idealized population of the same census size. When designing of
Summary
134
fish breeding programmes based on mass-spawning, the higher inbreeding and lower effective
population size should be taken into consideration.
In mating systems with skewed reproductive success, the effective population size (Ne) of a
population becomes smaller. As a result, small populations experience an increased degree of
inbreeding (∆F). Inbreeding depression in fish affects fitness related traits such as survival,
growth, reproductive traits and other morphological traits. The effect of genetic depression on
different traits in O. niloticus was investigated in Chapter 3. Experimental fish were
produced in a full-sib/half-sib mating design in which each sire was mated to two dams and
each dam mated to only one sire. We mated 20 sires and 35 dams to produce 35 full-sib
families with expected inbreeding coefficients (F) of 0.0, 6.3, 9.4, 12.5 and 25%. The fry were
produced and reared in hapas suspended in fertilized ponds until time of tagging. In total 1832
fish were stocked in two fertilized earthen ponds for a period of 8 months (including 3 months
of over-wintering). At the end of the experiment 389 fish were harvested. Results show that
level of inbreeding significantly affected early fry survival and body weight at stocking. Level
of inbreeding did not have significant effect on both the pond survival and weight at harvest.
Effects of pond, weight at stocking, sire and dam component significantly affected body
weight at harvest and pond survival. Fluctuating asymmetry was significantly affected by the
dam component and pond but not by the level of inbreeding. This suggests that FA was more
influenced by environmental factors than by genetic factors. The results of this study
emphasizes that inbreeding had a significant effect on survival and growth on early but not on
later stage of development. The observed difference in effects of inbreeding on early and later
life stages can be explained by strong natural selection on fitness during over-wintering.
Inbred individuals that survive the selective pressure to adulthood might still suffer reduced
adult survival and reproductive success. Chapter 4 investigated the effects of inbreeding on
reproductive success in Nile tilapia, O. niloticus under semi-natural conditions in breeding
hapas. A total of 72 fish (27 males and 45 females) from nine full-sib families (8 fish/family)
were divided into two and stocked in two hapas at a sex ratio of 1 and 3. Fish had inbreeding
coefficient of F = 0.0, 6.3, 9.4 and 25%. Fry were collected from the mouth of incubating
females on a weekly basis and parentage assignment was done on 1120 offspring from 56
spawnings using seven polymorphic microsatellite markers. Female reproductive output
(fecundity), expressed as the total number of eggs per spawning, was significantly affected by
the level of inbreeding and body weight. Per 10% increase of the level of inbreeding, egg
Summary
135
number declined by 11% of the mean. Male reproductive success, calculated as the proportion
of offspring sired per spawning, was affected by the level of inbreeding, condition factor, sex
ratio and gonad weight of males. Per 10% increase in the level of inbreeding, male
reproductive success declined by 40%. The decline in reproductive success was higher in sex
ratio 1 compared to sex ratio 3 indicating that the inbreeding depression was magnified under
higher male-male competition. Degree of relatedness between mating pairs (Kinship
coefficient), however, did not have any effect on reproductive success of males. Overall, our
findings show that inbred individuals have lower reproductive success and uncover a natural
selective pressure that favors outbred males and that counterbalances accumulation of
inbreeding.
Asynchronous nature of reproductive cycles of individual broodstock in O. niloticus leads to
episodic fry production. This presents a problem to aquaculture in two ways: 1) massive fry
losses due to size-dependent cannibalism; 2) mixed age/size populations and associated
cannibalism can mask the genetic merit of individuals. Fish breeders practising mass selection
might inadvertently select for cannibalism as large size, faster growth rate and robustness are
those phenotypic traits which a breeder desires in the selected broodstock. Selection under
such circumstances can mask genetic merit and obscure selection response in mass selection
programmes. In order to develop a protocol for size grading and minimize such effects,
factors influencing size-dependent cannibalism in Nile tilapia, Oreochromis niloticus, were
investigated in controlled conditions (Chapter 5). First, individual-based trials were
conducted to develop a linear regression model to predict the occurrence of cannibalism based
on body measurements. Oral gape (G, mm), body depth (D, mm) and weight (W, g) of 140
fish were measured and we estimated maximum prey weight (Wprey) for a given predator
weight (Wpredator): Log10Wprey = 1.03Log10Wpredator−1.13. This model was verified by
conducting 76 single pair trials. The revised model based on observed cannibalism is:
Log10Wprey = Log10Wpredator−1.17. Several experiments involving a group of prey and
predators were conducted to elucidate the relative importance of factors that influence
cannibalism. Cannibalism was significantly affected by stocking density, age of fish and
predator/prey weight ratio. Logit models of mortality data of both the individual-based and
observations based on a group of predators and prey estimated R50 (the predator/prey weight
ratio at which an encounter of a predator and prey resulted in a predation success of 50%) to
be 14.6 and 14.8, respectively. The results obtained in this experiment can be used to derive
Summary
136
simple management of heterogeneous fry groups (e.g. grading of fish). Grading will have
implications for reducing fry losses, minimizing the non-genetic variations caused by size
dependent cannibalism among fish and can improve the efficiency of mass selection.
The results described in this thesis are discussed in Chapter 6. This study demonstrated that a
thorough understanding of mating systems and reproduction parameters are crucial for
outlining strategies that ensure the maintenance of genetic diversity in breeding schemes
employing mass spawning for fry production. With the knowledge of mating systems and the
number of parents contributing to the next generation, mass selection based on mass spawning
can be used as a model for low cost breeding schemes that ensure a desired level of genetic
gain without compromising the genetic diversity of the stocks due to inbreeding. In addition,
knowledge on mating systems and other population parameters can be used in the
management of supportive breeding programmes for restoration of endangered wild fish
populations.

Samenvatting

Samenvatting
139
Samenvatting
Nijl tilapia (Oreochromis niloticus L.) is de belangrijkste soort onder de commercieel
gekweekte tilapias. Wereldwijd nemen zowel de grootschalige als kleinschalige teelt zeer snel
toe, vooral vanwege de ideale eigenschappen van Nijl tilapia als aquacultuur soort, zoals
snelle groei, hoge waardering door consumenten, en tolerantie tegen een grote
verscheidenheid aan kweekomstandigheden.
Productie van Nijl tilapia broed vindt plaats door ouderdieren bij elkaar in aarden vijvers,
tanks of hapas te plaatsen. De voortplanting is geheel natuurlijk en normaal kunnen binnen 20
dagen na het bij elkaar plaatsen van de ouders de vislarven geoogst worden. Territoriaal
gedrag en competitie van mannetjes om vrouwtjes, en niet synchrone voortplanting van
vrouwtjes kunnen echter grote consequenties hebben voor fokprogramma’s waarin deze
manier van voortplanten wordt gebruikt. Het doel van het in dit proefschrift beschreven
onderzoek was om een goed begrip te krijgen van het natuurlijke voortplantingssysteem van
O. niloticus. Hierbij lag de nadruk op de genetische consequenties van het
voortplantingssysteem, zoals reproductief succes, effectieve populatie grootte en inteelt.
Daarnaast is ook gekeken naar de gevolgen van a-synchroon voortplanten voor heterogeniteit
in grootte en kannibalisme.
Een goed begrip van het natuurlijke voortplantingssysteem is van cruciaal belang voor het
ontwerpen van fokprogramma’s waarbij genetische vooruitgang gemaximaliseerd wordt
zonder dat de genetische diversiteit op de lange termijn in gevaar komt. Vrouwelijke Nijl
tilapia incuberen de bevruchte eieren in de bek tot de larven uitkomen. In hoofdstuk 2
worden afstamming en mannelijk reproductief succes onder commerciële omstandigheden
gekwantificeerd door larven uit de bek van vrouwtjes te verzamelen uit 2 hapas die elk 12
mannetjes en 25 vrouwtjes bevatten. Elf polymorfe microsatelliet merkers werden gebruikt
om de afstamming van elk van de larven te bepalen. In totaal werden 760 nakomelingen uit 76
paringen gebruikt in de afstamminganalyse. Voortplantingspatronen varieerden van
monogame paringen tot promiscue paringen. Paternale polygamie trad op in 46% van de
verzamelde groepjes eieren, waarbij soms tot 4 vaders betrokken waren bij het bevruchten van
de eieren van een enkel vrouwtje. Maternale polygamie trad op in meer dan 8% van de
verzamelde ei groepjes. Er was een grote variatie in mannelijk reproductief succes, waarbij
een derde van alle mannetjes de vader waren van meer dan 70% van de nakomelingen.
Mannelijke conditie factor had een significant effect op reproductief succes waarbij mannetjes
Samenvatting
140
met een hogere conditiefactor meer nakomelingen hadden. De effectieve populatiegrootte Ne
was ongeveer 16 voor beide hapas, met een lage Ne/N ratio van 0.43 en 0.45 voor
respectievelijk hapa A en B. De toename van inteelt, ∆F, voor elke hapa werd geschat op
ongeveer 3% per generatie, wat twee keer de toename van inteelt is van een ideale populatie
met vergelijkbare omvang. Bij het ontwerp van vis fokprogramma’s gebaseerd op natuurlijke
voortplanting, dient rekening gehouden te worden met de hogere inteelt en kleinere effectieve
populatiegrootte.
Wanneer het individuele voortplantingssucces scheef verdeeld is wordt de effectieve
populatiegrootte Ne kleiner. Dit betekent dat kleinere populaties een verhoogde toename van
inteelt ondergaan. Inteelt depressie in vissen uit zich in fitness gerelateerde kenmerken zoals
overleving, groei, reproductie en in morfologische kenmerken. In hoofdstuk 3 werd gekeken
naar het effect van inteelt op diverse kenmerken in O. niloticus. Experimentele vissen werden
geproduceerd door elk mannetje met 2 vrouwtjes te paren, en elk vrouwtje maar met een
mannetje. In totaal werden 20 mannetjes en 35 vrouwtjes gepaard om 35 full-sib families te
produceren met inteelt coëfficiënten (F) van respectievelijk 0, 6,3, 9,4, 12,5 en 25%. De
larven werden geproduceerd en opgekweekt in hapas in bemeste vijvers tot dat ze gemerkt
konden worden. In totaal werden 1832 vissen gemerkt en opgekweekt in bemeste vijvers
gedurende een periode van 8 maanden (waarvan 3 gedurende de winter). Aan het einde van
het experiment werden 389 vissen geoogst. Het niveau van inteelt had een significant effect
op vroege larvale overleving en lichaamsgewicht op het moment van merken. Inteelt had geen
effect op vijveroverleving en gewicht na 8 maanden. Er waren significante effecten van
vijver, gewicht bij merken, en vader en moeder componenten op lichaamsgewicht na 8
maanden en overleving. Fluctuerende asymmetrie (FA) werd beïnvloed door de moeder en de
vijver waarin de vissen opgroeiden, maar niet door inteelt. Dit suggereert dat FA meer door
milieu componenten dan door genetische factoren beïnvloed wordt. De resultaten van deze
studie benadrukken dat inteelt een significant effect op overleving en groei op vroege leeftijd
van tilapia heeft. Het verschil in effect op vroege en late leeftijd kan worden verklaard door
een sterke natuurlijke selectie op fitness gedurende de overwintering.
Ingeteelde dieren die toch overleven en volwassen worden kunnen nog steeds last hebben van
verminderd reproductief succes. In hoofdstuk 4 worden de effecten van inteelt op
reproductief succes onderzocht onder semi-natuurlijke condities in hapas. Een groep van 72
vissen (27 mannetjes en 45 vrouwtjes) uit 9 full-sib families (8 vissen per familie) werden
Samenvatting
141
verdeeld in 2 groepen en in hapas geplaatst in een sex ratio van 1:1 of 1:3. De
inteeltcoefficient F van de vissen was 0, 6,3, 9,4 of 25%. Broed werd wekelijks verzameld uit
de bek van de vrouwtjes. Afstamming werd bepaald van 1120 larven uit 56 paringen, met
behulp van 7 microsatelliet merkers. Vrouwelijke fecunditeit, uitgedrukt als het totale aantal
eieren per paring, werd significant beïnvloed door lichaamsgewicht en de mate van inteelt.
Met elke 10% toename in teelt neemt de fecunditeit met 11% af. Mannelijk reproductief
succes, berekend als proportioneel aandeel per paring, werd beïnvloed door inteelt,
conditiefactor, sex ratio en testis gewicht van mannetjes. Met elke 10% toename in inteelt
nam het reproductief succes van mannetjes af met 40%. De afname was groter bij een sex
ratio van 1:1 dan bij een sex ratio van 1:3. Dit impliceert dat de effecten van inteeltdepressie
vergroot werden bij intense competitie van mannetjes onderling. De mate van verwantschap
tussen potentiële ouders had geen invloed op het uiteindelijke reproductieve succes van
mannetjes. Dit betekend dat inteelt niet vermeden wordt via paarkeuze, maar dat inteelt op
populatieniveau wel sterk beperkt wordt door verminderd reproductief succes van ingeteelde
mannetjes.
Als voortplanting cycli van O. niloticus vrouwtjes niet synchroon verlopen leidt dit tot pieken
en dalen in de productie van nakomelingen. Voor de aquacultuur is dit een probleem, om twee
redenen: 1) initiële verschillen in grootte en leeftijd van larven kunnen vergroot worden door
kannibalisme, en 2) in qua leeftijd gemengde populaties is het moeilijk om de genetische
waarde van individuen op basis van eigen prestatie te schatten. Fokkers die selecteren op
eigen prestatie kunnen zo onbedoeld kannibalistische vissen selecteren aangezien grootte,
groeisnelheid en robuustheid fokdoelen zijn waarop bij voorkeur geselecteerd wordt. Om deze
onbedoelde effecten te minimaliseren is het nodig om te sorteren om zo de grootte verschillen
in de populatie te structureren. Met de uiteindelijke bedoeling een protocol voor sorteren te
ontwikkelen werd een experiment opgezet waarbij het optreden van kannibalisme onder
gecontroleerde condities werd bestudeerd (hoofdstuk 5). Eerst werd een lineair regressie
model ontwikkeld om het optreden van kannibalisme te voorspellen op basis van
lichaamsafmetingen van predators (kannibalen) en prooien. Bekgrootte (G, mm),
lichaamshoogte (D, mm) en gewicht (W, g) van 140 vissen werden gemeten. De maximum
prooi grootte (Wprooi) voor een gegeven predator gewicht (Ppredator) werd geschat als:
Log10Wprooi = 1.03Log10Wpredator−1.13. Dit model werd geverifieerd in 76 een-op-een
confrontaties. Het aangepaste model op basis van de geobserveerde kannibalisme is:
Log10Wprooi = Log10Wpredator−1.17. Vervolgens werden verschillende experimenten met
Samenvatting
142
groepen van prooien en predatoren uitgevoerd om de relatieve belangrijkheid van diverse
factoren die kannibalisme beïnvloeden te onderzoeken. Kannibalisme werd significant
beïnvloed door bezettingsdichtheid, leeftijd van de vis en de predator/prooi ratio. Logit
modellen van mortaliteit data van individuele- en groepsconfrontaties werden gebruikt om de
R50 (de predator/prooi gewicht ratio waarbij in 50% van de gevallen kannibalisme optreed) te
schatten. Deze was 14.6 voor individuele confrontaties en 14.8 voor groepskannibalisme.
De resultaten van dit experiment kunnen worden gebruikt om eenvoudige protocollen te
ontwerpen om kannibalisme in heterogene larvengroepen te verminderen, bijv. door te
sorteren. Sorteren zal kannibalisme verminderen, de niet-genetische variatie verminderen en
de efficiëntie van selectie op basis van eigen prestatie verbeteren.
De resultaten beschreven in dit proefschrift worden bediscussieerd in hoofdstuk 6. Deze
studie demonstreert dat een grondig begrip van paringsgedrag en reproductie parameters
cruciaal zijn voor het ontwikkelen van strategieën, die bij fokprogramma’s waarbij natuurlijke
voortplanting wordt gebruikt, het behoud van genetische diversiteit verzekeren. Met de kennis
van paringsgedrag en het aantal ouders dat bijdraagt aan de volgende generatie kan een
goedkoop massaselectie programma, gebaseerd op natuurlijke voortplanting, worden
ontworpen waarbij genetische vooruitgang gemaximaliseerd zonder dat er ongewenste inteelt
optreed. Tevens kunnen kennis over paringsgedrag en andere populatie parameters gebruikt
worden in het beheer van ondersteunende fokprogramma’s voor het herstel van bedreigde
vispopulaties.

Acknowledgements
143
Acknowledgements
This study would not have been possible without the support and encouragement of many
individuals. I am grateful to my promtors Prof. Johan van Arendonk and Prof. Johan Verreth
for their constructive criticism and support. My foremost gratitude goes to my supervisors Dr.
Hans Komen and Henk Bovenhuis for their guidance and enlightening discussions. Your
enthusiasm and prompt responses were extraordinary! A special thanks for that. I would also
like to thank Dr. Mahmoud Rezk for his practical help in the field and Dr. Richard
Crooijmans for his guidance in the molecular analysis.
I would like to thank all my colleagues and friends at both the Animal Breeding & Genetics
group and Aquaculture & Fisheries group. During my stay I was fortunate to share office with
many colleagues: Harrison, Marc, Bosso, Solomon, Brigitte, Robbert and Mikhail- thanks for
all the nice discussions. Special thanks are due to many friends and colleagues: Catarina,
Oliver, Iyob, Guenzuelo, Paula, Miriam, Samad, Pascal, Patricia, Mohamed Ali, An, Titu,
Jascha. I really enjoyed the ambiance of friendship, collegiality and many exotic dinners -
Thank you all!
Special thanks go to many organizations which provided financial supported for my PhD
project. I am indebted to NUFFIC, University of Asmara, Wageningen University and the
WorldFish Center for providing me funds and necessary facilities. Special thanks to Dr. Hans
Komen for his relentless effort to make this project financially viable. The staff of the
WorldFish Center, Egypt is acknowledged for facilitation of my work and making my stay in
Abbassa comfortable. Many thanks to Roel Bosma, your help as a project manager is highly
appreciated.
I am also grateful to students who contributed to this project: Anamul Kabir, Zizy El-Bialy
and Ugur Ozturk. Thank your for your help and I wish you all the best in your future
endeavors.
Life would have been difficult without friends in the Netherlands: Iyob, Sammy G, Sammy P,
Mike (Berari keyat), Danny, Abraham, Abeba, Tamrat, Hideat, Suleiman, Debby – Thanks
you all for the nice and momentous time we had together. I would also like to extend my
gratitude to my family in the Netherlands Ghenet, Aklilu, Abeba, Hideat and her family.

Acknowledgements
144
Special thanks to my friends from Iowa Elizabeth and Charles Sukup – thanks for your many
visits to Wageningen. My long time friends from Ghent deserve special appreciation:
Mariska, Katrien, Solomon, Lieve and Yonas –you were there for me whenever I needed your
help and thank you all.
My deepest gratitude goes to all my family in Eritrea. My mother and father, Fessehaye and
Ghidey thanks for your love, dedication and unwavering support at all times. I also appreciate
all the support and encouragement from all my sisters and brother. Special thanks are due to
Brkti and Taddesse
My dearest Tsega, words won’t be enough to express my gratitude for your love, unflagging
support, dedication and optimism. You were my rock and your thoughts propelled me during
difficult times. For this I will be eternally grateful. Thank you Tsegi - You are the best!!!!
List of Publications
145
List of Publications
Peer-Reviewed papers
Fessehaye, Y., El-bialy, Z., Rezk, M.A., Crooijmans, R., Bovenhuis, H., Komen, H., 2006.
Mating systems and male reproductive success in Nile tilapia (Oreochromis
niloticus) in breeding hapas: A microsatellite analysis. Aquaculture 256, 148-
158
Fessehaye, Y., kabir, A., Bovenhuis, H., Komen, H., 2006. Prediction of cannibalism in
Juvenile Nile Tilapia, Oreochromis niloticus based on predator to prey weight
ratio; and effects of age and stocking density. Aquaculture 255, 314-322.
.
Fessehaye, Y., Komen, H., Rezk, M.A., van Arendonk, J.A.M., Bovenhuis, H. Effects of
inbreeding on survival, body weight and fluctuating asymmetry (FA) in Nile
tilapia, Oreochromis niloticus. Aquaculture (Accepted).
Viveiros, A.T.M., Fessehaye, Y., Ter Veld, M., Schulz, R.W., Komen, J., 2002. Hand-
stripping of semen and semen quality after maturational hormone treatments, in
African catfish Clarias gariepinus. Aquaculture 213, 373-386
Fessehaye, Y., Bovenhuis, H., Rezk, M.A., Crooijmans, R., van Arendonk, J.A.M., Komen.
H., Effects of inbreeding and sex ratio on reproductive success in mass-
spawning of Nile tilapia, Oreochromis niloticus. (to be submitted to Molecular
Ecology)
Proceedings and Abstracts
Fessehaye, Y., Bovenhuis, H., Komen, H., 2006. Genetic quality of Oreochromis niloticus fry
produced from mass spawnings: Threats and opportunities for small scale
aquaculture and selective breeding. In: Fishponds in Farming Systems, 2006.
Zijpp A.J. van der, J.A.J. Verreth, M.E.F. van Mensvoort, R.H. Bosma, M.C.M.
Beveridge (Eds.). Proceedings of INREF-POND symposium, Can Tho, Vietnam.
List of publications
146
Fessehaye, Y., Komen, H., Rezk, M.A., Ponzoni, R.W., Bovenhuis, H., 2006. Effect of
inbreeding on the performance of Nile tilapia (Oreochromis niloticus). Book of
Abstracts, International symposium-Genetics in aquaculture IX, June 26-30,
2006 Montpellier, France.
Fessehaye, Y., Z. El-bialy, Rezk, M.A. Crooijmans, R., Bovenhuis, H., Komen, H., 2005.
Microsatellite-based parentage analysis and males’ reproductive success in Nile
tilapia, Oreochromis niloticus. Book of Abstracts, World Aquaculture Society
meeting in Bali, Indonesia.
Fessehaye, Y., Rezk, M.A., Bovenhuis, Henk and Komen, H. 2004. Size Dependent
Cannibalism in Juvenile Nile tilapia (Oreochromis niloticus). In: Bolivar, R.,
Mair, G., Fitzsimmons, K. (Eds.), New Dimensions in Farmed Tilapia.
Proceedings of the 6th International Symposium on Tilapia in Aquaculture (ISTA
6), Manila, pp.
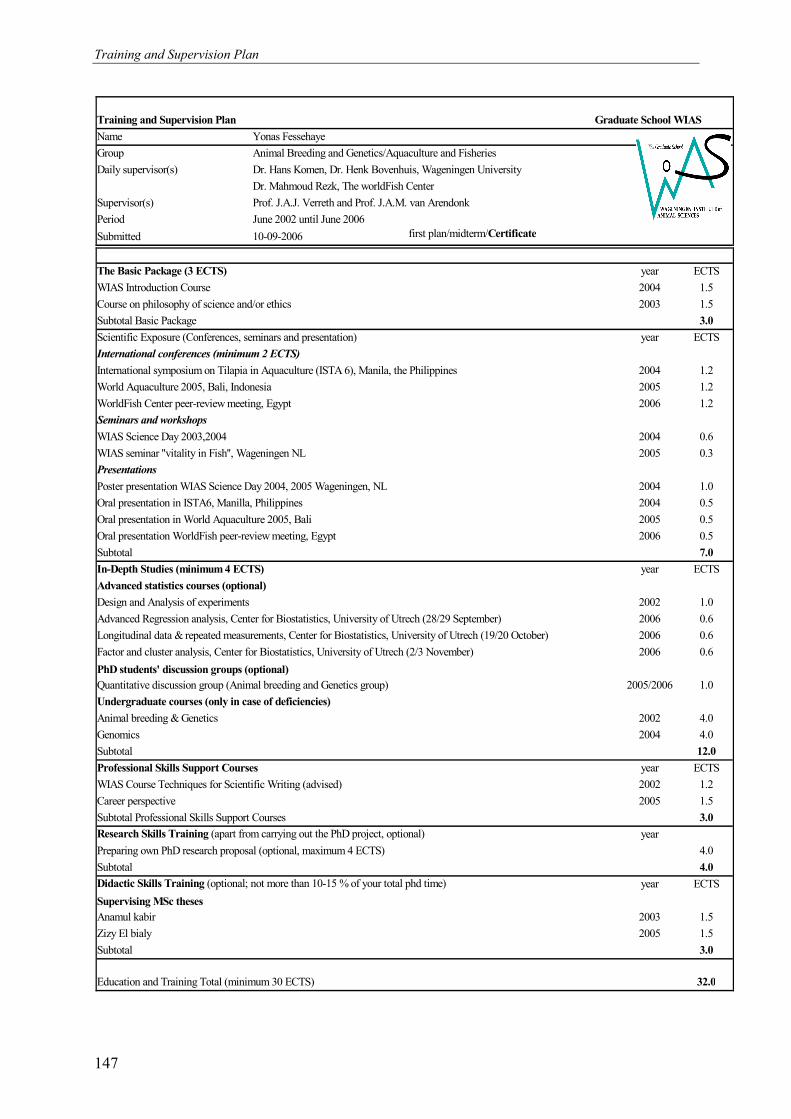
Training and Supervision Plan
147
Name
Group
Daily supervisor(s) Dr. Hans Komen, Dr. Henk Bovenhuis, Wageningen University
Dr. Mahmoud Rezk, The worldFish Center
Supervisor(s)
Period June 2002 until June 2006
Submitted 10-09-2006 first plan/midterm/Certificate
year ECTS
2004 1.5
2003 1.5
3.0
year ECTS
2004 1.2
2005 1.2
WorldFish Center peer-review meeting, Egypt 2006 1.2
2004 0.6
WIAS seminar ''vitality in Fish'', Wageningen NL 2005 0.3
2004 1.0
2004 0.5
2005 0.5
2006 0.5
7.0
year ECTS
2002 1.0
Advanced Regression analysis, Center for Biostatistics, University of Utrech (28/29 September) 2006 0.6
Longitudinal data & repeated measurements, Center for Biostatistics, University of Utrech (19/20 October) 2006 0.6
Factor and cluster analysis, Center for Biostatistics, University of Utrech (2/3 November) 2006 0.6
2005/2006 1.0
2002 4.0
2004 4.0
12.0
year ECTS
2002 1.2
2005 1.5
3.0
year
4.0
4.0
year ECTS
2003 1.5
2005 1.5
3.0
32.0
WIAS Course Techniques for Scientific Writing (advised)
Animal breeding & Genetics
Design and Analysis of experiments
Subtotal Professional Skills Support Courses
Undergraduate courses (only in case of deficiencies)
Quantitative discussion group (Animal breeding and Genetics group)
PhD students' discussion groups (optional)
Career perspective
Genomics
Subtotal
Professional Skills Support Courses
Advanced statistics courses (optional)
Oral presentation in ISTA6, Manilla, Philippines
Oral presentation WorldFish peer-review meeting, Egypt
Subtotal
In-Depth Studies (minimum 4 ECTS)
Oral presentation in World Aquaculture 2005, Bali
Education and Training Total (minimum 30 ECTS)
Supervising MSc theses
Anamul kabir
Zizy El bialy
Subtotal
Didactic Skills Training (optional; not more than 10-15 % of your total phd time)
Research Skills Training (apart from carrying out the PhD project, optional)
Preparing own PhD research proposal (optional, maximum 4 ECTS)
Subtotal
Subtotal Basic Package
WIAS Science Day 2003,2004
Scientific Exposure (Conferences, seminars and presentation)
International conferences (minimum 2 ECTS)
International symposium on Tilapia in Aquaculture (ISTA 6), Manila, the Philippines
World Aquaculture 2005, Bali, Indonesia
Training and Supervision Plan Graduate School WIAS
Yonas Fessehaye
Animal Breeding and Genetics/Aquaculture and Fisheries
Prof. J.A.J. Verreth and Prof. J.A.M. van Arendonk
Course on philosophy of science and/or ethics
WIAS Introduction Course
The Basic Package (3 ECTS)
Seminars and workshops
Presentations
Poster presentation WIAS Science Day 2004, 2005 Wageningen, NL
Curriculum Vitae
148
About the Author
YONAS FESSEHAYE was born on November 28, 1972 in Asmara, Eritrea. In 1996, he
received a B.Sc degree in Marine Biology from University of Asmara, Eritrea. From
September 1996 till September 1998 he worked as a teaching assistant at the same
department. In 2000, he obtained an M.Sc degree in Aquaculture from University of Ghent in
Belgium (Laboratory of Aquaculture and Artemia Reference Center). From 2000-2002, he
taught several courses at the department of Marine Biology and Fisheries, University of
Asmara. In June 2002 he was awarded a scholarship to pursue his PhD research at
Wageningen University.
Email: [email protected]
NOTES
149
The research in this thesis was financed by the Netherlands organization for international
cooperation in higher education (NUFFIC) via the MHO-University of Asmara project,
INREF-POND of Wageningen University and the WorldFish Center.
Financial support for printing of this thesis was obtained from the Dr. Judith Zwartz
foundation, Wageningen, The Netherlands and the LEB funds of Wageningen University.
Printed by: Ponsen en Looijen BV, Wageningen, The Netherlands.
Cover design: Bereket G.


Related Documents