. 71 ISSN 0372-5480 Printed in Croatia VETERINARSKI ARHIV 89 (1), 71-86, 2019 Effect of feed restrictions on performance, blood variables and immunity of broiler chickens Mahmoud Davoodi-Omam 1 , Mohammad Dadashbeiki 2 , Mirco Corazzin 3 , and Alireza Seidavi 1 * 1 Department of Animal Science, Rasht Branch, Islamic Azad University, Iran 2 Department of Veterinary Science, Rasht Branch, Islamic Azad University, Iran 3 Department of Agricultural, Food, Environmental and Animal Sciences, University of Udine, Italy ________________________________________________________________________________________ DAvOODi-OMAM, M., M. DADAShbEiki, M. COrAzzin, A. SEiDAvi: Effect of feed restrictions on performance, blood variables and immunity of broiler chickens. vet. arhiv 89, 71-86, 2019. AbSTrACT Genetic selection has led to an increase in performance and lean tissue deposition in broiler chickens which have become increasingly susceptible to disease. To reduce this susceptibility, various feed restriction programs have been proposed, albeit with highly variable results. This study investigated the effects of the duration and intensity of quantitative feed restriction in the early rearing period on the performance, blood parameters and immunity of broiler chickens. Two hundred and seventy chicks were randomly assigned to a 4 × 2 factorial arrangement to examine the effects of 2 durations (7 and 14 d) and 4 levels of feed restriction (5, 10, 15, and 20%). One control (Con) group was included. Feed intake (FI) and weight gain (WG) were recorded, and the feed conversion ratio (FCR) calculated weekly. At slaughter (42 d of age), blood was collected, and the carcass composition and characteristics of the gastrointestinal tract were assessed. In comparison with the Con, feed restrictions improved FCR (P<0.01), increased relative weight (RW) of the breast (P<0.05), and abdominal fat (P<0.01), and reduced the RW, as well as the dimension of some gut segments. Feed restriction showed limited influence on blood variables, the humoral immune response to Influenza and Newcastle disease vaccinations, and on response to injection of sheep red blood cells. Feed restrictions up to 20% for 7 or 14 d are an appropriate strategy to improve the FCR and the RW of breast, with a limited effect on blood variables, and without significant effects on the immunity of broiler chickens. key words: breast; broiler chicken; feed restriction; gut; productive traits; immunity ________________________________________________________________________________________ *Corresponding author: Prof. Alireza Seidavi, PhD, Department of Animal Science, Rasht Branch, Islamic Azad University, 41857-43999, Iran, Phone: +98 91 1331 3073; Fax: +98 13 14422 4069; E-mail: [email protected] DOI: 10.24099/vet.arhiv.0130

Welcome message from author
This document is posted to help you gain knowledge. Please leave a comment to let me know what you think about it! Share it to your friends and learn new things together.
Transcript
.
71ISSN 0372-5480Printed in Croatia
VeterINarSkI arhIV 89 (1), 71-86, 2019
Effect of feed restrictions on performance, blood variables and immunity of broiler chickens
Mahmoud Davoodi-Omam1, Mohammad Dadashbeiki2, Mirco Corazzin3, and Alireza Seidavi1*
1Department of Animal Science, Rasht Branch, Islamic Azad University, Iran2Department of Veterinary Science, Rasht Branch, Islamic Azad University, Iran
3Department of Agricultural, Food, Environmental and Animal Sciences, University of Udine, Italy________________________________________________________________________________________DAvOODi-OMAM, M., M. DADAShbEiki, M. COrAzzin, A. SEiDAvi: Effect of feed restrictions on performance, blood variables and immunity of broiler chickens. vet. arhiv 89, 71-86, 2019.
AbSTrACTGenetic selection has led to an increase in performance and lean tissue deposition in broiler chickens
which have become increasingly susceptible to disease. To reduce this susceptibility, various feed restriction programs have been proposed, albeit with highly variable results. This study investigated the effects of the duration and intensity of quantitative feed restriction in the early rearing period on the performance, blood parameters and immunity of broiler chickens. Two hundred and seventy chicks were randomly assigned to a 4 × 2 factorial arrangement to examine the effects of 2 durations (7 and 14 d) and 4 levels of feed restriction (5, 10, 15, and 20%). One control (Con) group was included. Feed intake (FI) and weight gain (WG) were recorded, and the feed conversion ratio (FCR) calculated weekly. At slaughter (42 d of age), blood was collected, and the carcass composition and characteristics of the gastrointestinal tract were assessed. In comparison with the Con, feed restrictions improved FCR (P<0.01), increased relative weight (RW) of the breast (P<0.05), and abdominal fat (P<0.01), and reduced the RW, as well as the dimension of some gut segments. Feed restriction showed limited influence on blood variables, the humoral immune response to Influenza and Newcastle disease vaccinations, and on response to injection of sheep red blood cells. Feed restrictions up to 20% for 7 or 14 d are an appropriate strategy to improve the FCR and the RW of breast, with a limited effect on blood variables, and without significant effects on the immunity of broiler chickens.
key words: breast; broiler chicken; feed restriction; gut; productive traits; immunity ________________________________________________________________________________________
*Corresponding author:Prof. Alireza Seidavi, PhD, Department of Animal Science, Rasht Branch, Islamic Azad University, 41857-43999, Iran, Phone: +98 91 1331 3073; Fax: +98 13 14422 4069; E-mail: [email protected]
DOI: 10.24099/vet.arhiv.0130
72 Vet. arhiv 89 (1), 71-86, 2019
M. Davoodi-Oman et al.: Feed restrictions and broiler chickens
introductionOver the years, intensive genetic selection has resulted in improvement in the
productive performance of chickens. Indeed, ZUIDhOF et al. (2014), showed that, in fifty years, the average daily gain and the muscle pectoralis major of broiler chickens at 42 d of age increased by over 400% and 75% respectively. At the same time some health problems, such as skeletal disorders and cardiovascular disease, have increased in the same broiler lines (DAWkINS and LAyTON 2012; SAhRAEI, 2012).
To reduce these issues, various feed restriction techniques or programs have been proposed. Generally, they refer to qualitative or quantitative feed restriction, depending on whether the program involves a reduction in the daily feed supply or nutritional dilution of the diet of the animals (SAhREI, 2012). These techniques seek to exploit compensatory growth, that is, the physiological mechanism according to which the animal can compensate for low growth during a feed restriction period by faster than normal growth when it is submitted to a re-feeding period (BOhmAN, 1955).
From this point of view, it is reasonable to consider that the greater the progress of genetic selection, the greater the intensity of feed restriction will be in broiler chicken husbandry. however, severe feed restriction programs impact the welfare of broiler chickens. D’EATh et al. (2009) stated that severe feed restriction of 25 - 50% of ad libitum feed intake of broiler chickens can reduce the time spent eating, increase aggressive behavior and plasma corticosterone, a hormone indicator of physiological chronic stress, while also altering the heterophil/lymphocyte ratio. however, URDANETA RINCON and LEESON (2009) showed that a mild feed restriction of up to 15% of ad libitum feed intake can reduce mortality in broiler chickens. Similar results were also found with feed restrictions of 10% (LIPPENS et al. 2000) and 20% (LIPPENS et al. 2009) of ad libitum feed intake during the early rearing period. AFShARmANESh et al. (2016) reported that submitting broiler chickens to early feed restriction is the most appropriate technique to reduce the prevalence of metabolic disorders. however, the effect cannot be excluded of feed restriction on the response to vaccinations or diseases, or on the metabolism of broiler chickens (COOk, 1991; ONBAşILAR et al., 2009).
On the other hand, despite the fact that the effect of quantitative feed restriction on in vivo performance and on the carcass characteristics of broiler chickens has already been studied in the last years, the results are largely inconsistent (RAhImI et al., 2015), and an appropriate quantitative feed restriction program is yet to be defined (vAN DER kLEIN et al., 2017). The reasons may be due to the reciprocal interaction of many factors, such as the physical form of the feed, the intensity of feed restriction, and the duration of both the feed restriction and re-feeding period (ShABANI et al., 2015).
73Vet. arhiv 89 (1), 71-86, 2019
M. Davoodi-Oman et al.: Feed restrictions and broiler chickens
hence, the aim of this study was to investigate the effects of the duration and intensity of mild feed restriction in the early rearing period on growth performance, carcass traits, organ weight, blood parameters and the immune response of broiler chickens.
Materials and methods The experiment location was in Fuman, Guilan province, Iran. The Animal Ethics
Committee of the Islamic Azad University, Iran, approved the procedures, and particular care was taken to minimize the number of animals.
Animal, experimental design. Two hundred and seventy male broiler chicks (Ross 308; Aviagen, huntsville, AL) were randomly assigned to a 4 × 2 factorial arrangement of treatments to examine the effects of 2 durations of quantitative feed restriction (FRD), 7 d (from 8th to 14th d of age) and 14 d (from 8th to 21th d of age), and 4 levels of quantitative feed restriction (FRI): 5, 10, 15 and 20% less than the standard guide of Ross 308 (ROSS 2007). Each treatment group was replicated 3 times. One additional treatment, without any feed restrictions, was also included as the control group (Con). All broiler chickens were fed ad libitum before and after the completion of the restriction period. The broiler chickens’ nutritional requirements were provided on the basis of the Ross strain rearing catalogue (ROSS, 2007). The ingredients and nutrient composition of the diets used are presented in Table 1. The cages were equipped with drinkers that were washed twice daily and filled with fresh water with the aim of maintaining unlimited and continuous access to water for broiler chickens. The broiler chickens were kept in land cages (1.5 × 1.0 × 0.5 m). The animals were housed under temperature-controlled conditions using a tunnel ventilation system (32 to 22 °C in relation to the animals’ age) and water was sprayed on the floor to maintain relative humidity between 55 to 65%. Lighting in the building was 24 h the first day, and then kept to 23 h for the rest of the experimental period. A vaccination program against avian influenza virus (at 1 d of age), infectious bronchitis virus (at 1 d of age), Gumboro virus (at 19 d of age), and Newcastle disease (at 1, 5, 8 and 21 d of age) was implemented. In order to reduce the stress caused by vaccinations, a multi-electrolyte solution was used in the drinking water 24 hours before and after vaccination. The humoral immune response of the broiler chickens was also studied by 2 injections of sheep red blood cells (SRBC) at 11 and 28 d of age. For SRBC injection, initially 1 mL of PBS along with 10 mL SRBC was mixed completely, and 0.5 mL of the obtained solution was injected under the skin of the broiler chick breast. Broiler chickens were slaughtered at 42 d of age.

74 Vet. arhiv 89 (1), 71-86, 2019
M. Davoodi-Oman et al.: Feed restrictions and broiler chickens
Table 1. Ingredients and chemical composition of diets used during starter (1 to 14 d of age), grower (15 to 28 d of age), and finisher periods (29 to 42 d of age)
Starter Grower Finisher
Ingredients (g/kg as-fed)Corn 413 464 472Soybean meal 363 241 202Wheat 130 220 250Soybean oil 15 8.5 10maize gluten meal 20 0 0Na chloride 2.4 3 2.9Dicalcium phosphate 15 12.5 11.6Ca carbonate 10.8 10.7 11Na bicarbonate 2.2 0.9 1.1DL-met 2.7 1.4 1.5Lys@hCl 2.2 0.6 1.1Vitamin premix* 1 1 0.9mineral premix** 1 1 0.9 multi-enzyme 0.25 0.25 0.25Phytase 0.25 0.25 0.25Bentonite 0 5.4 5
Chemical composition (g/kg unless stated otherwise)metabolizable energy (mJ/kg) 11.8 11.9 12.2Crude protein 222 200 177Linoleic acid 17.2 15.5 16.0Crude fiber 39.9 37.1 34.4Lys 13.4 11.0 10.9met and Cys 9.48 8.22 7.50met 5.93 4.68 4.20Thr 8.55 7.52 6.60Trp 2.75 2.39 2.00Available P 4.85 4.54 4.20Ca 9.80 9.34 9.00Cl- 2.30 2.35 2.40Na 1.68 1.61 1.60
* - Calcium Pantothenate: 4 mg/g; Niacin: 15 mg/g; vitamin B6: 13 mg/g; Cu: 3 mg/g; Zn: 15 mg/g; mn: 20 mg/g; Fe: 10 mg/g; k: 0.3 mg/g; ** - vitamin A: 5000 IU/g; vitamin D3: 500 IU/g; vitamin E: 3 mg/g; vitamin k3: 1.5 mg/g; vitamin B2: 1 mg/g
75Vet. arhiv 89 (1), 71-86, 2019
M. Davoodi-Oman et al.: Feed restrictions and broiler chickens
Sample collection and measurements. Feed intake (FI) and body weights were recorded weekly by cage, and the weight gain (WG) and feed conversion ratio (FCR) were calculated. One animal per replication was randomly selected at 30 and 40 d, at 11 and 27 d, and at 25 and 42 d of age to study the immune response of the animal to Influenza, Newcastle vaccines and SRBC injections respectively. At the end of the study, at 42 d of age, one bird per replication, totaling three birds per treatment, were selected for blood collection, and for evaluation of carcass, organ, cuts and gastrointestinal segments. Particular care was taken to choose the most representative birds of the cage in terms of body weight. After slaughter, the weights of the carcass and gastrointestinal segments were determined. Relative weights (RW) were calculated as the ratio between the weight of the cut, organ or gastrointestinal segments and the weight of the carcass. Finally, the gut was excised and its parts, the duodenum, jejunum, ileum, cecum, rectum and colon, were separated, as reported by JAvAD et al. (2015), and measured.
Laboratory methods. Blood samples (1 mL/bird) were collected into EDTA tubes from the wing veins, centrifuged at 3000 g, for 10 min and stored at -20 ºC, until assayed. Glucose, cholesterol, triglycerides, high-density lipoprotein (hDL), very low-density lipoprotein (vLDL), low-density lipoprotein (LDL), uric acid, albumin, globulin, and total protein were analyzed, as described in POURNAZARI et al. (2017). The immune response of the animals to vaccines and to SRBC injections was assessed following the haemagglutination inhibition method (SEIDAvI et al., 2014).
Statistical analysis. The statistical analysis was carried out using SPSS Inc (1989-1997) vers. 7.5.21. Normality of data distribution was assessed by the Shapiro-Wilk test. Data about broiler chickens in vivo and at slaughter, performance and blood variables were analyzed with a 2 (duration of feed restriction, 7 and 14 d) × 4 (intensity of feed restriction, 5, 10, 15, 20%) model using ANOvA. The humoral immune response data were analyzed by the non-parametric Scheirer-Ray-hare test, as suggested by DyThAm (2003). Contrasts, or non-parametric contrasts when appropriate, were used to assess the differences between the control and the mean of the treatment groups. Differences at the P<0.05 level were considered statistically significant.
resultsThe effects of feed restrictions on the in vivo performance of broiler chickens are
reported in Table 2. In comparison with the Con, and despite the lack of effect on FI and WG, feed restrictions improved FCR at the end of the starter period (1 to 14 d of age; P<0.01), and during the finisher (29 to 42 d of age; P<0.05) and the entire experimental period (1 to 42 d of age; P<0.01). moreover, the Con had lower WG than the treated groups during the grower period (15 to 28 d of age; P<0.01). Within the feed restricted groups, the duration had a more pronounced effect than the intensity of feed restriction on in vivo performance. Indeed, the effect of FRI was limited to FI at the end of the

76 Vet. arhiv 89 (1), 71-86, 2019
M. Davoodi-Oman et al.: Feed restrictions and broiler chickens
starter period, where the 20% feed restricted groups showed lower values than the 5% feed restricted groups (P<0.05). Conversely, groups feed restricted for 14 d had lower FI and BW than those feed restricted for 7 d during the grower, finisher, and the entire period (P<0.05). Feed restriction for seven days tended to improve FCR during the entire experimental period compared to 14-d of feed restriction (P = 0.06). The FRI × FRD interaction never reached the level of significance (P>0.05).
Table 2. Effect of intensities (FRI) and durations (FRD) of quantitative feed restriction on the performance of Ross 308 broilers
Age(day) Con
Quantitative feed restriction
SEm
P-valueIntensity* (%) Duration (d)
5 10 15 20 7 14 FRI FRDFRI
×FRDCon vs. Treat**
FI(g/d)
1-14 39.1 38.7c 37.4bc 36.7ab 35.7a 37.0 37.2 0.16 <0.01 0.47 0.12 0.5615-28 103 109 111 113 107 113 107 0.76 0.13 <0.01 0.21 0.2429-42 196 193 191 194 192 196 188 1.18 0.71 <0.01 0.34 0.721-42 113 114 113 115 112 116 111 0.54 0.30 <0.01 0.29 0.92
WG(g/d)
1-14 22.1 25.5β 25.3αβ 24.2αβ 23.8α 25.0 24.3 0.21 0.03 0.12 0.75 0.3415-28 55.1 59.7 61.8 61.9 59.6 63.6 57.9 0.59 0.35 <0.01 0.21 <0.0129-42 87.0 91.7 92.4 92.7 90.3 93.8 89.7 0.97 0.83 0.04 0.64 0.151-42 54.8 59.0 59.8 59.6 57.9 60.8 57.3 0.35 0.25 <0.01 0.18 0.24
FCR
1-14 1.71 1.50 1.45 1.51 1.49 1.46 1.52 0.013 0.44 0.06 0.13 <0.0115-28 1.86 1.84 1.84 1.81 1.79 1.80 1.84 0.02 0.80 0.30 0.74 0.2329-42 2.26 2.12 2.08 2.10 2.13 2.11 2.11 0.02 0.85 0.91 0.85 0.031-42 1.95 1.82 1.79 1.81 1.81 1.79 1.82 0.01 0.59 0.06 0.25 <0.01
Con - control group; WG - weight gain; FI - feed intake; FCR - feed conversion ratio; SEm - standard error of the means; a,b,c P<0.05; α,β P<0.10; * - intensity of quantitative feed restriction expressed as percentage of standard guideline; ** - control diet vs. treatment diets interaction
As shown in Table 3, when compared with the Con, feed restrictions tended to increase carcass percentage (P = 0.08), increased the RW of the breast (P<0.05), and abdominal fat (P<0.01), and reduced the RW of the heart (P<0.05), wings (P<0.05), neck (P<0.05), spleen (P<0.05) and liver (P<0.01). Within the feed restricted groups, FRI did not affect body weight at slaughter, carcass percentage, or the RW of cuts and organs (P>0.05). The groups feed restricted for 14 d tended to have a reduction in the RW of the breast (P = 0.06), BW at slaughter (P<0.05), RW of the kidneys (P<0.05), abdominal fat (P<0.05), lungs (P<0.05), and liver (P<0.05), but increased RW of the gizzard (P<0.05), brain (P<0.01), head (P<0.05), and wings (P<0.05) in comparison to the groups feed restricted for 7 d. however, significant FRI × FRD interaction (P<0.05) was only found for RW of the kidneys, lungs and liver.

77Vet. arhiv 89 (1), 71-86, 2019
M. Davoodi-Oman et al.: Feed restrictions and broiler chickens
Table 3. Effect of intensities (FRI) and durations (FRD) of quantitative feed restriction on the body weight at slaughter, carcass percentage, and weight of cuts and organs relative to the carcass
weight (%) of Ross 308 broilers
Con
Quantitative feed restriction
SEm
P -valueIntensity* (%) Duration (d)
5 10 15 20 7 14 FRI FRDFRI
×FRDCon vs.
Trea**BW (g) 2529 2663 2627 2567 2568 2707 2505 28.6 0.58 <0.01 0.70 0.70CaP (%) 77.2 79.3 79.0 78.9 79.4 79.1 79.2 0.339 0.93 0.83 0.70 0.08Breast (%) 32.4 35.2 34.4 35.5 35.0 35.7 34.4 0.306 0.66 0.06 0.30 0.02Thighs (%) 26.6 30.1 31.1 29.3 30.1 29.9 30.5 0.265 0.19 0.26 0.68 0.32Gizzard (%) 1.80 1.78 1.55 1.82 1.73 1.50 1.95 0.086 0.70 0.02 0.79 0.81heart (%) 0.535 0.485 0.492 0.474 0.433 0.469 0.472 0.010 0.22 0.89 0.42 0.02Brain (%) 0.129 0.123 0.124 0.122 0.127 0.119 0.129 0.001 0.44 <0.01 0.06 0.24kidneys (%) 0.694 0.759 0.778 0.736 0.726 0.792 0.707 0.017 0.70 0.02 0.01 0.28Notarium (%) 1.80 1.89 1.73 1.81 1.82 1.80 1.83 0.043 0.61 0.74 0.49 0.92head (%) 2.57 2.52 2.65 2.60 2.57 2.51 2.66 0.034 0.56 0.03 0.12 0.87Wings (%) 4.32 3.90 3.92 3.78 4.07 3.78 4.05 0.062 0.44 0.04 0.16 0.05Abd fat (%) 1.63 2.32 2.53 2.06 2.34 2.49 2.14 0.070 0.17 0.02 0.18 <0.01Lungs (%) 0.618 0.532 0.586 0.572 0.629 0.629 0.531 0.018 0.33 0.02 0.01 0.53Testes (%) 0.019 0.024 0.026 0.028 0.023 0.023 0.028 0.002 0.75 0.18 0.69 0.12Neck (%) 2.82 2.56 2.39 2.62 2.55 2.51 2.55 0.041 0.29 0.64 0.21 0.04Thymus (%) 0.283 0.280 0.240 0.284 0.239 0.240 0.282 0.016 0.63 0.21 0.51 0.83Spleen (%) 0.136 0.099 0.134 0.101 0.119 0.110 0.117 0.005 0.12 0.56 0.79 0.03Bursa Fab (%) 0.107 0.140 0.174 0.157 0.138 0.151 0.153 0.008 0.40 0.91 0.20 0.10Liver (%) 2.97 2.35 2.44 2.18 2.17 2.44 2.13 0.052 0.23 0.01 0.02 <0.01Con - control group; BW - body weight at slaughter; CaP - carcass percentage; Abd fat - abdominal fat; Bursa Fab - Bursa of Fabricius; SEm - standard error of the means; a,b,c P<0.05; α,β P<0.10; * - intensity of quantitative feed restriction expressed as percentage of standard guideline; ** - control diet vs. treatment diets interaction
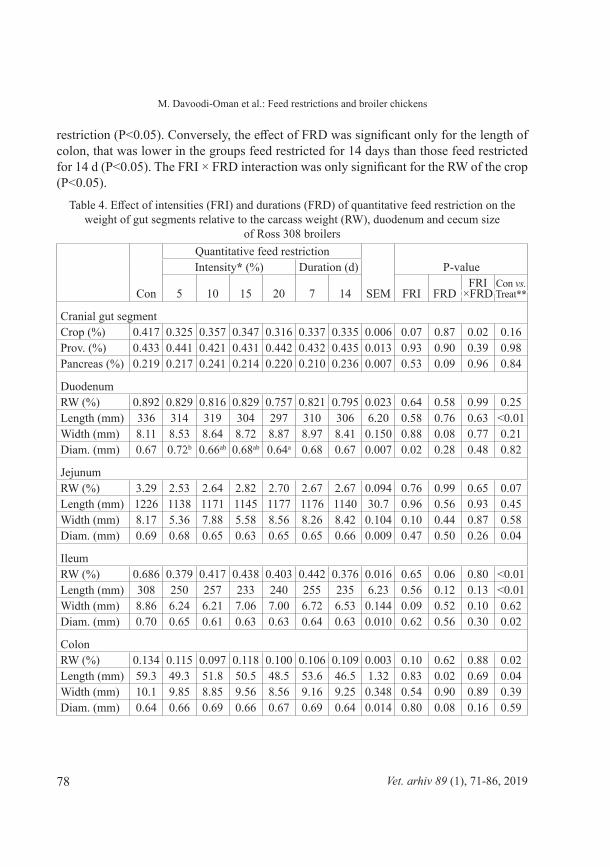
The effects of feed restrictions on the gut characteristics of broiler chickens are reported in Table 4. In comparison with the Con, feed restriction groups had reduced RW and the dimension of the gut of broiler chickens. In particular, a reduction in the RW of ileum (P<0.01), colon (P<0.05) and cecum (P<0.01), and of the length of the duodenum (P<0.01), ileum (P<0.01), colon (P<0.05), and cecum (P<0.05), as well as of the diameter of the jejunum (P = 0.04), and ileum (P<0.05), and of the width of cecum (P<0.05) were observed. moreover, also the RW of jejunum tended to be reduced by feed restriction (P = 0.07). The significant effect of FRI was limited to the diameter of the duodenum, which was lower in groups subjected to 20% feed restriction than in those subjected to 5% feed
78 Vet. arhiv 89 (1), 71-86, 2019
M. Davoodi-Oman et al.: Feed restrictions and broiler chickens
restriction (P<0.05). Conversely, the effect of FRD was significant only for the length of colon, that was lower in the groups feed restricted for 14 days than those feed restricted for 14 d (P<0.05). The FRI × FRD interaction was only significant for the RW of the crop (P<0.05).
Table 4. Effect of intensities (FRI) and durations (FRD) of quantitative feed restriction on the weight of gut segments relative to the carcass weight (RW), duodenum and cecum size
of Ross 308 broilers
Con
Quantitative feed restriction
SEm
P-valueIntensity* (%) Duration (d)
5 10 15 20 7 14 FRI FRDFRI
×FRDCon vs. Treat**
Cranial gut segmentCrop (%) 0.417 0.325 0.357 0.347 0.316 0.337 0.335 0.006 0.07 0.87 0.02 0.16Prov. (%) 0.433 0.441 0.421 0.431 0.442 0.432 0.435 0.013 0.93 0.90 0.39 0.98Pancreas (%) 0.219 0.217 0.241 0.214 0.220 0.210 0.236 0.007 0.53 0.09 0.96 0.84
DuodenumRW (%) 0.892 0.829 0.816 0.829 0.757 0.821 0.795 0.023 0.64 0.58 0.99 0.25Length (mm) 336 314 319 304 297 310 306 6.20 0.58 0.76 0.63 <0.01Width (mm) 8.11 8.53 8.64 8.72 8.87 8.97 8.41 0.150 0.88 0.08 0.77 0.21Diam. (mm) 0.67 0.72b 0.66ab 0.68ab 0.64a 0.68 0.67 0.007 0.02 0.28 0.48 0.82
JejunumRW (%) 3.29 2.53 2.64 2.82 2.70 2.67 2.67 0.094 0.76 0.99 0.65 0.07Length (mm) 1226 1138 1171 1145 1177 1176 1140 30.7 0.96 0.56 0.93 0.45Width (mm) 8.17 5.36 7.88 5.58 8.56 8.26 8.42 0.104 0.10 0.44 0.87 0.58Diam. (mm) 0.69 0.68 0.65 0.63 0.65 0.65 0.66 0.009 0.47 0.50 0.26 0.04
IleumRW (%) 0.686 0.379 0.417 0.438 0.403 0.442 0.376 0.016 0.65 0.06 0.80 <0.01Length (mm) 308 250 257 233 240 255 235 6.23 0.56 0.12 0.13 <0.01Width (mm) 8.86 6.24 6.21 7.06 7.00 6.72 6.53 0.144 0.09 0.52 0.10 0.62Diam. (mm) 0.70 0.65 0.61 0.63 0.63 0.64 0.63 0.010 0.62 0.56 0.30 0.02
ColonRW (%) 0.134 0.115 0.097 0.118 0.100 0.106 0.109 0.003 0.10 0.62 0.88 0.02Length (mm) 59.3 49.3 51.8 50.5 48.5 53.6 46.5 1.32 0.83 0.02 0.69 0.04Width (mm) 10.1 9.85 8.85 9.56 8.56 9.16 9.25 0.348 0.54 0.90 0.89 0.39Diam. (mm) 0.64 0.66 0.69 0.66 0.67 0.69 0.64 0.014 0.80 0.08 0.16 0.59

79Vet. arhiv 89 (1), 71-86, 2019
M. Davoodi-Oman et al.: Feed restrictions and broiler chickens
Con
Quantitative feed restriction
SEm
P-valueIntensity* (%) Duration (d)
5 10 15 20 7 14 FRI FRDFRI
×FRDCon vs. Treat**
CecumRW (%) 0.591 0.312 0.327 0.344 0.258 0.316 0.305 0.013 0.16 0.70 0.86 <0.01Length (mm)§ 198 164 175 178 170 177 167 3.89 0.61 0.18 0.66 0.04Width (mm)§ 11.0 9.56 8.78 9.72 7.30 9.40 8.28 0.313 0.06 0.09 0.86 0.04Diam. (mm)§ 0.67 0.67 0.64 0.71 0.67 0.66 0.69 0.009 0.13 0.07 0.79 0.82
RectumRW (%) 0.06 0.06 0.05 0.06 0.06 0.06 0.06 0.004 0.72 0.57 0.45 0.76Length (mm) 17.3 17.4 17.5 16.8 18.1 17.1 17.8 0.779 0.94 0.64 0.72 0.96Width (mm) 19.4 19.0 17.4 17.7 16.8 18.1 17.3 0.367 0.23 0.28 0.20 0.25Diam. (mm) 0.62 0.60 0.58 0.59 0.57 0.60 0.57 0.012 0.82 0.23 0.31 0.39
Con - control group; SEm - standard error of the means; Prov. - proventriculus; Diam. - diameter; * - intensity of quantitative feed restriction expressed as a percentage of the standard guideline; ** - control diet vs. treatment diets interaction; § left cecum
Feed restrictions did not influence the blood variables of broiler chickens (Table 5), with the only exception of albumin content, which was higher in the Con than in the treatment groups (P<0.05). Within the feed restricted groups, FRI did not affect the blood variables (P>0.05; Table 5). Conversely, FRD affected cholesterol and albumin levels, and the LDL/hDL ratio. In particular, groups feed restricted for 14 d had lower cholesterol levels (P<0.05), tended to have lower levels of albumin (P = 0.06) and a higher LDL/hDL ratio (P = 0.07) than those feed restricted for 7 d. however, a significant FRI × FRD interaction (P<0.05; Table 5) was only found for cholesterol level.
Feed restriction did not influence the humoral immune response to Influenza and Newcastle disease vaccinations or the response to injections of SRBC (P>0.05). In particular, antibody titres against influenza at 30 d (1.37 ± 0.19 log2 hI titer) and 40 d (3.63 ± 0.12 log2 hI titer) of age, and Newcastle disease vaccination at 11 (0.30 ± 0.09 log2 hI titer) and 27 d (3.93 ± 0.22 log2 hI titer) of age were not influenced by feed restriction. Antibody titer against SRBC at 25 d of age in terms of total immunoglobulin (0.93 ± 0.16 log2 hI titer), IgG (0 ± 0 log2 hI titer), and Igm (0.93 ± 0.16 log2 hI titer), and at 42 d of age in terms of total immunoglobulin (3.11 ± 0.28 log2 hI titer), IgG (0.67 ± 0.13 log2 hI titer), and Igm (2.44 ± 0.19 log2 hI titer) were similar between the groups (P>0.05).
Table 4. Effect of intensities (FRI) and durations (FRD) of quantitative feed restriction on the weight of gut segments relative to the carcass weight (RW), duodenum and cecum size
of Ross 308 broilers (continued)

80 Vet. arhiv 89 (1), 71-86, 2019
M. Davoodi-Oman et al.: Feed restrictions and broiler chickens
Table 5. Effect of intensities (FRI) and durations (FRD) of quantitative feed restriction on blood variables of Ross 308 broilers
Con
Quantitative feed restriction
P-valueIntensity* (%) Duration (d)
5 10 15 20 7 14 SEm FRI FRDFRI
×FRDCon vs. Treat**
Glucose (mg/dL) 217 247 237 245 251 243 247 4.79 0.76 0.67 0.50 0.11
Uric acid(mg/dL) 3.77 3.45 2.78 2.87 3.15 3.05 3.08 0.254 0.79 0.96 0.56 0.39
Cholesterol (mg/dL) 126 114 120 116 118 123 110 2.18 0.74 0.01 0.04 0.19
Triglycerides (mg/dL) 115 93.7 111.5 81.8 96.3 105.7 86.0 6.15 0.42 0.13 0.32 0.32
vLDL(mg/dL) 23.0 18.8 22.3 16.3 19.3 21.3 17.2 1.24 0.43 0.12 0.31 0.32
hDL (mg/dL) 79.7 66.7 76.0 76.2 67.2 73.4 69.6 1.97 0.19 0.35 0.63 0.21
LDL (mg/dL) 23.0 28.0 21.7 23.0 31.7 28.8 23.4 1.98 0.29 0.20 0.34 0.63
LDL/hDL 3.97 2.46 5.14 4.15 2.43 2.68 4.41 0.45 0.13 0.07 0.34 0.75Protein(g/dL) 4.00 3.47 3.73 3.65 3.37 3.65 3.46 0.064 0.21 0.16 0.67 0.39
Albumin(g/dL) 1.30 1.10 1.17 1.10 1.03 1.15 1.05 0.025 0.34 0.06 0.21 0.02
Globulin(g/dL) 2.70 2.37 2.57 2.55 2.33 2.50 2.41 0.045 0.18 0.32 0.46 0.50
Con - control group; WG - weight gain; FI - feed intake; FCR - feed conversion ratio; SEm - standard error of the means;* - intensity of quantitative feed restriction expressed as a percentage of the standard guideline; ** - control diet vs. treatment diets interaction
Discussion In comparison with the Con, FCR improved in the feed restricted groups, and it
tended to improve if the FRD was 7d rather than 14-d without any significant effect on FRI. These differences reflected those highlighted in the starter period, where the feed restriction technique seems more effective in improving the FCR of animals. Regarding the starter period, it should be pointed out that the animals were only feed-restricted during the last 7 d. From this point of view, our results are in substantial agreement with SANTOSO (2002), who showed that a 25% feed restriction of ad libitum feed intake for six days from 7 d to 13 d of age, was able to improve the FCR of broiler chickens at the

81Vet. arhiv 89 (1), 71-86, 2019
M. Davoodi-Oman et al.: Feed restrictions and broiler chickens
end of the period of feed restriction. The same author hypothesised that feed restriction reduced the energy requirement for maintenance by increasing the efficiency of energy utilization by broiler chickens. On the other hand, ShABANI et al. (2015) observed that feed restrictions of up to 20% of ad libitum feed intake and of up to 14 d after 8 d of age, were not able to influence the FCR of broiler chickens. FI and WG were similar between the feed restricted and Con groups, with the only exception of WG in the grower phase, which was higher in the feed restricted groups. As expected, the FRI was higher while the FI was lower in the starter period, explaining the tendency to a reduction in the broiler chicken’s BW in the same period. Differences in FI and WG between FRI levels in the other husbandry periods were not found. Conversely, the groups feed restricted for 14 d showed lower FI and WG than those feed restricted for 7 d in grower, finisher and the entire experimental periods. These results led to the lowest BW at slaughter observed in the groups feed restricted for 14 d. AFShARmANESh et al. (2016), considering a feed restriction of 50% of ad libitum feed intake from 6 d to 12 d of age, failed to find differences in the BW and FI of chickens feed-restricted or ad libitum-fed. Considering the entire period, these contemporary reductions of FI and WG did not allow for any improvement of FCR in respect to the groups feed restricted for 7 d. In general, in this study, no compensatory growth mechanism was observed, probably because of the low levels of feed restriction used. Indeed, vAN DER kLEIN et al. (2017) explained that compensatory growth is related to the level of feed restriction, and it may be less evident if mild feed restriction is used. JANG et al. (2009) highlighted that, after early feed restriction up to 30% of the voluntary feed intake, broiler chickens may completely recover their body weight with a re-alimentation period of 20-d. Also, LIPPENS et al. (2009), using a feed restriction of 20% of ad libitum feed intake from 4 to 7 d of age, did not find any clear compensatory growth in the animals.
In comparison with the Con, the feed restricted groups showed higher RW of the breast and abdominal fat. The literature reports highly controversial results (LIPPENS, 2000), probably because the effect of feed restriction is modulated by many factors, such as strain, feed restriction duration and intensity, and gender (TůmOvá and TEImURI, 2010). The FRI did not influence the abdominal fat and breast deposition, while broiler chickens subjected to FRD of 14 d had reduced abdominal fat and tended to have reduced breast percentage in comparison to those subjected to a FRD of 7 d. These results suggest that the accumulation of fat and muscle yield are related to the duration of the early mild feed restriction. Despite the fact that the animals were feed-restricted at an earlier age in comparison to the present study, LIPPENS (2000) also found that broiler chickens had significantly increased abdominal fat by 7% after 4 d of feed restriction of 20% of the ad libitum intake. Although it is not statistically significant, URDANETA RINCON and LEESON (2002) observed an increase in abdominal fat in broiler chickens of 42 d of age, which had been feed restricted from 5 to 10 d of age, suggesting that the feed
82 Vet. arhiv 89 (1), 71-86, 2019
M. Davoodi-Oman et al.: Feed restrictions and broiler chickens
restricted animals could be overeating, which cannot be excluded in the present study. RAhImI et al. (2015) hypothesised that the increase in fat accumulation after a mild feed restriction may be due to the alteration of the metabolism, the protein level of the diet, and the activity of enzymes involved in lipogenesis. In contrast, ShABANI et al. (2015) did not find any effect of feed restriction up to 25% of ad libitum feed intake on the RW of abdominal fat.
Considering the small intestine, the feed restricted groups showed a reduction in the diameter of the jejunum and ileum, and of the RW of the Ileum, and of the length of the Duodenum and Ileum in comparison with the Con. DUARTE et al. (2014) reported that, in the starter period, the gut grows more rapidly than the rest of the body. Therefore, feed restriction in this period can lead to an alteration of gut development. These authors also showed that a 30% restriction of ad libitum intake from 7 to 14 d of age reduced the weight of the small intestine, and this was recovered after three days of refeeding. Although the small intestine has a crucial role in the absorption of nutrients, in this trial the reduction and tendency to a reduction in the RW of the ileum and jejunum, respectively, were not reflected in the reduced RW of the breast and abdominal fat, as previously discussed. Since the RW of the pancreas was not affected by feed restriction, it may be hypothesised that the secretion of enzymes was not altered. moreover, it may be hypothesised that the activity of the intestinal peptidase and sucrose, and/or the expression of intestinal transporters were increased in the feed restricted groups as shown by many other authors (GILBERT et al., 2008; PINhEIRO et al., 2004; SUSBILLA et al., 2003). Considering the large intestine, the feed restricted groups showed a reduction in the RW and length of the cecum and colon, and of the width of the cecum. These results disagree with DUARTE et al. (2014) who observed that feed restriction were not able to modify the RW of the large intestine. however, the same authors argued that few studies are available about the influence of feed restriction on the development of the large intestine.
The feed restriction had a very limited effect on blood variables, indicating that the nutritional and metabolic status of broiler chickens was unaltered even in the treated groups, which is in agreement with the results regarding WG. Indeed, RAJmAN et al. (2006) explained that total plasma protein and uric acid are related to body condition and feed restriction, respectively. These results reinforce the hypothesis that the levels of feed restriction used were low and not able to markedly influence the animals’ metabolism. The results of our study are in agreement with the findings of ShABANI et al. (2015) who, considering a feed restriction of 14.5 and 25% of ad libitum feed intake, observed the very limited effect of feed restriction on the blood variables of broiler chicken.
Considering the immunity of broiler chickens, feed restriction reduced the RW of the secondary lymphoid organs, spleen and liver, but did not affect the RW of the primary lymphoid organs, thymus and bursa of Fabricius. Considering also the lack of influence
83Vet. arhiv 89 (1), 71-86, 2019
M. Davoodi-Oman et al.: Feed restrictions and broiler chickens
on the response to vaccination and to SRBC antigens, in this study the feed restriction did not alter the immune status of the animals or the efficacy of vaccinations. RAhImI et al. (2015) showed that a feed restriction of 15 and 30% of ad libitum feed intake had a low influence on the immunity of broiler chicken. Also FASSBINDER-ORTh and kARASOv (2006) did not find any effect of feed restriction up to 54% on the RW of the bursa of Fabricius and spleen.
In conclusion, this study showed that a quantitative feed restriction up to 20% for 7 and 14 d was an appropriate strategy to improve FCR and the RW of the breast, with a very limited effect on blood variables, or efficiency of vaccination, and without significant effects on the immune status of broiler chickens.
_______AcknowledgementsFinancial support by Rasht Branch, Islamic Azad University, grant number 17.16.4.8774 is gratefully acknowledged.
referencesAFShARmANESh, m., m. LOTFI, Z. mEhDIPOUR (2016): Effects of wet feeding and early
feed restriction on blood parameters and growth performance of broiler chickens. Anim. Nutr. 2, 168-172.
DOI: 10.1016/j.aninu.2016.04.002BOhmAN, v. R. (1955): Compensatory growth of beef cattle: the effect of hay maturity. J. Anim.
Sci. 14, 249-255. DOI: 10.2527/jas1955.141249xCOOk, m. E. (1991): Nutrition and immune response of the domestic fowl. Crit. Rev. in Poult.
Biol. 3, 167-189.DAWkINS, m. S., R. LAyTON (2012): Breeding for better welfare: genetic goals for broiler
chickens and their parents. Anim Welfare 21, 147-155. DOI: 10.7120/09627286.21.2.147D’EATh, R. B., B. J. TOLkAmP, I. kyRIAZAkIS, A. B. LAWRENCE (2009): Freedom from
hunger’ and preventing obesity: the animal welfare implications of reducing food quantity or quality. Anim. Behav. 77, 275-288.
DOI: 10.1016/j.anbehav.2008.10.028DUARTE, C. R. A., m. L. m. vICENTINI-PAULINO, D. F. PINhEIRO (2014): Digestive
enzymatic responses of chickens feed restricted and refed as affected by age. J. Poult. Sci. 51, 289-296.
DOI: 10.2141/jpsa.0130104DyThAm, C. (2003): Choosing and using statistics: A biologist’s guide. 2nd ed., Blackwell,
malden, USA.
84 Vet. arhiv 89 (1), 71-86, 2019
M. Davoodi-Oman et al.: Feed restrictions and broiler chickens
FASSBINDER-ORTh, C. A., W. h. kARASOv (2006): Effects of feed restriction and realimentation on digestive and immune function in the Leghorn Chick. Poultry Sci. 85, 1449-1456.
DOI: 10.1093/ps/85.8.1449GILBERT, E. R., E. A. WONG, k. E. WEBB JR. (2008): Peptide absorption and utilization:
Implications for animal nutrition and health. J. Anim. Sci. 86, 2135-2155. DOI: 10.2527/jas.2007-0826JANG, I. S., S. y. kANG, y. h. kO, y. S. mOON, S. h. SOhN (2009): Effect of qualitative and
quantitative feed restriction on growth performance and immune function in broiler chickens. Asian-Austral. J. Anim. 22, 388-395.
JAWAD, h. S., L. k. BIN IDRIS, m. Z. BIN BAkAR, A. BIN kASSIm (2015). Anatomical changes of Akar Putra chicken digestive system after partial ablation of uropygial gland. Am. J. Anim. vet. Sci. 10, 217-219.
DOI: 10.3844/ajavsp.2015.217.229LIPPENS, m., E. DELEZIE, L. mAERTENS, G. hUyGhEBAERT (2009): Influence of feed
texture and early quantitative feed restriction on performance, growth development and carcass composition of two broiler strains. Archiv. Geflügelkd. 73, 29-40.
LIPPENS, m., G. ROOm, G. DE GROOTE, E. DECUyPERE (2000): Early and temporary quantitative food restriction of broiler chickens. 1. Effects on performance characteristics, mortality and meat quality. Brit. Poultry Sci. 41, 343-354.
DOI: 10.1080/713654926ONBAşILAR, E. E., S. yALÇIN, E. TORLAk, P. ÖZDEmIR (2009): Effects of early feed
restriction on live performance, carcass characteristics, meat and liver composition, some blood parameters, heterophil-lymphocyte ratio, antibody production and tonic immobility duration. Trop. Anim. health Pro. 41, 1513-1519.
DOI: 10.1007/s11250-009-9341-8PINhEIRO, D. F., v. C. CRUZ, J. R. SARTORI, m. L. m. vICENTINI-PAULINO (2004): Effect
of early feed restriction and enzyme supplementation on digestive enzyme activities in broilers. Poultry Sci. 83, 1544-1550.
DOI: 10.1093/ps/83.9.1544POURNAZARI, m., A. A. A. QOTBI, A. SEIDAvI, m. CORAZZIN (2017): Prebiotics, probiotics
and thyme (Thymus vulgaris) for broilers: performance, carcass traits and blood variables. Rev. Colomb. Cienc. Pec. 30, 3-10.
DOI: 10.17533/udea.rccp.v30n1a01RAhImI, S., A. SEIDAvI, m. SAhRAEI, F. P. BLANCO, A. SChIAvONE, A. L. mARTÍNEZ
mARÍN (2015): Effects of feed restriction and diet nutrient density during re-alimentation on growth performance, carcass traits, organ weight, blood parameters and the immune response of broilers. Ital. J. Anim. Sci. 14, 4037.
DOI: 10.4081/ijas.2015.4037
85Vet. arhiv 89 (1), 71-86, 2019
M. Davoodi-Oman et al.: Feed restrictions and broiler chickens
RAJmAN, m., m. JURIáNI, D. LAmOŠOvá, m. máČAJOvá, m. SEDLAČkOvá, L. kOŠŤáL, D. JEŽOvá, P. vÝBOh (2006): The effects of feed restriction on plasma biochemistry in growing meat type chickens (Gallus gallus). Comp. Biochem. Phys. A. 145, 363-371.
DOI: 10.1016/j.cbpa.2006.07.004ROSS (2007): Ross 308 Broiler: Nutrition Specification, June 2007. Ross Breeders Limited,
Newbridge, Scotland.SAhRAEI, m. (2012): Feed restriction in broiler chickens production. Biotechn. Anim. husbandry
28, 333-352. DOI: 10.2298/BAh1202333SSANTOSO, U. (2002): Effects of early feed restriction on the occurrence of compensatory growth,
feed conversion efficiency, leg abnormality and mortality in unsexed broiler chickens reared in cages. Asian Austral J. Anim. 15, 1319-1325.
DOI: 10.5713/ajas.2002.1319SEIDAvI, A. R., L. ASADPOUR, m. DADAShBEIkI, R. PAyAN-CARREIRA (2014): Effects
of dietary fish oil and green tea powder supplementation on broiler chickens immunity. Acta Sci. vet. 42, 1-13.
ShABANI, S., A. SEIDAvI, L. ASADPOUR, m. CORAZZIN (2015): Effects of physical form of diet and intensity and duration of feed restriction on the growth performance, blood variables, microbial flora, immunity, and carcass and organ characteristics of broiler chickens. Livest. Sci. 180, 150-157.
DOI: 10.1016/j.livsci.2015.07.006SUSBILLA, J. P., I. TARvID, C. B. GOW, T. L. FRANkEL (2003): Quantitative feed restriction or
meal-feeding of broiler chicks alter functional development of enzymes for protein digestion. Brit. Poultry Sci. 44, 698-709.
DOI: 10.1080/00071660310001643679TůmOvá, E., A. TEImURI (2010): Fat deposition in broiler chicken: a review. Sci. Agr Bohemica
41, 121-128.URDANETA-RINCON, m., S. LEESON (2002): Quantitative and qualitative feed restriction on
growth characteristics of male broiler chickens. Poultry Sci. 81, 679-688. DOI: 10.1093/ps/81.5.679vAN DER kLEIN, S. A. S., F. A. SILvA, R. P. kWAkkEL, m. J. ZUIDhOF (2017): The effect of
quantitative feed restriction on allometric growth in broilers. Poultry Sci. 96, 118-126. DOI: 10.3382/ps/pew187ZUIDhOF, m. J., B. L. SChNEIDER, v. L. CARNEy, D. R. kORvER, F. E. ROBINSON (2014):
Growth, efficiency, and yield of commercial broilers from 1957, 1978, and 2005. Poultry Sci. 93, 2970-2982.
DOI: 10.3382/ps.2014-04291

86 Vet. arhiv 89 (1), 71-86, 2019
M. Davoodi-Oman et al.: Feed restrictions and broiler chickens
Received: 28 October 2017Accepted: 2 November 2018
_____________________________________________________________________________________DAvOODi-OMAM, M., M. DADAShbEiki, M. COrAzzin, A. SEiDAvi: Utjecaj ograničenog unosa hrane na proizvodna svojstva, krvne pokazatelje i imunost brojlera. vet. arhiv 89, 71-86, 2019.
SAŽETAkUzgojno-selekcijskim radom povećana su proizvodna svojstva i količina nemasnog tkiva u brojlera, ali
su oni istodobno postali osjetljiviji na bolesti. kako bi se ta osjetljivost smanjila, predloženi su različiti režimi prehrane, međutim s vrlo različitim rezultatima. Ovim je istraživanjem analiziran utjecaj trajanja i intenziteta ograničenog unosa hrane u početnom stadiju uzgoja na proizvodna svojstva, krvne pokazatelje i imunost brojlera. Ukupno 270 brojlera nasumično je podijeljeno u 4 × 2 faktorijalni dizajn kako bi se ispitali učinci dvaju razdoblja (7 i 14 dana) i četiri razine ograničenog unosa hrane (smanjenje za 5, 10, 15 i 20 %). Uključena je i jedna kontrolna skupina. Zabilježeni su unos hrane (FI) i prirast tjelesne mase (WG) te je stopa konverzije hrane (FCR) izračunata tjedno. Pri klanju (u dobi od 42 dana) prikupljena je krv te je određen sastav trupa i karakteristike probavnog sustava. U usporedbi s kontrolnom skupinom ograničenje unosa hrane poboljšalo je stopu konverzije hrane (P<0,01), povećalo je relativnu masu (RW) prsnog mišića (P<0,05) kao i abdominalnu masnoću (P<0,01) te je smanjilo relativnu masu i veličinu nekih crijevnih segmenata. Ograničen unos hrane pokazao je ograničen utjecaj na krvne pokazatelje i humoralni imunosni odgovor na cijepljenje protiv influence i newcastleske bolesti, kao i na injekcije ovčjih eritrocita. Ograničenje unosa hrane od 20 % tijekom 7 i 14 dana odgovarajuća je strategija za povećanje FCR-a i RW-a prsnog mišića, s ograničenim učinkom na krvne pokazatelje i bez znakovitog učinka na imunost brojlera.
ključne riječi: prsa; brojleri; ograničen unos hrane; crijeva; proizvodna svojstva; imunost ________________________________________________________________________________________
Related Documents


![Novel repellents for the blood-sucking insects …57 that feed on blood, such as mosquitoes, should protect themselves using insect repellents 58 [2]. Independent of its mechanism](https://static.cupdf.com/doc/110x72/5f48c363ca388855771cc9fb/novel-repellents-for-the-blood-sucking-insects-57-that-feed-on-blood-such-as-mosquitoes.jpg)