Review of the Economy 2007/08 Economic Advisory Council to the Prime Minister New Delhi January 2008

Welcome message from author
This document is posted to help you gain knowledge. Please leave a comment to let me know what you think about it! Share it to your friends and learn new things together.
Transcript
Review of the Economy2007/08
Economic Advisory Council to thePrime Minister
New Delhi
January 2008
Review of the Economy2007/08
Economic Advisory Council to the Prime MinisterNew Delhi
January 2008

ECONOMIC ADVISORY COUNCILTO THE PRIME MINISTER
Dr. C. Rangarajan Chairman
Dr. G.K. Chadha Member
Dr. Saumitra Chaudhuri Member
Dr. Satish C. Jha Member
Dr. M. Govinda Rao Member
Dr. Suresh Tendulkar Member
Dr. Alok Sheel Secretary
Economic Advisory Council to the Prime MinisterHall-E
Vigyan BhawanMaulana Azad Road
New Delhi
CONTENTS
I. OVERALL ECONOMIC GROWTH IN 2007/08 – A REVIEW 1-3• Developments in Q1 and Q2 of 2007/08 1
II. GLOBAL ECONOMIC DEVELOPMENTS IN 2007/08 AND OUTLOOK 4-7• Sub-prime Fall-out and Fear of Recessionary Conditions 4• Outlook for Emerging Economies 6• Inflation — Energy and Food 6
III. INDIA: THE GROWTH OUTLOOK 8-18• Growth Estimate for 2007-08 8• Investment and Savings 9• Farm Sector 12• Power Sector 14• Industrial Output 15• Service sector 18
IV. EXTERNAL PAYMENTS SITUATION 19-31• Oil and Gold Imports 19• Other Imports 20• Exports 22• Balance of Payments 24• Projections for the second half of 2007/08 27• Reserve accretion and exchange rate movement 28
V. PRICES, MONETARY, FINANCIAL AND FISCAL MANAGEMENT 32-35• Inflation – Wholesale and consumer price 32• Monetary and credit developments 33• Fiscal developments 34
VI. PROSPECTS FOR 2008/09 36-37
1
Economic Advisory Council to Prime Minister
REVIEW OF THE ECONOMY 2007-08
I – OVERALL ECONOMIC GROWTH IN 2007/08 – A REVIEW
1 With nine months of the fiscal year 2007/08 behind us, it is a good timeto review our Economic Outlook 2007-08 released in July 2007 in the light ofavailaibility of more upto date data and come to some clearer conclusions aboutthe economy’s performance this year and offer some inferences about the likelysituation in the coming fiscal year, that is, 2008/09.
Developments in Q1 and Q2 of 2007/08
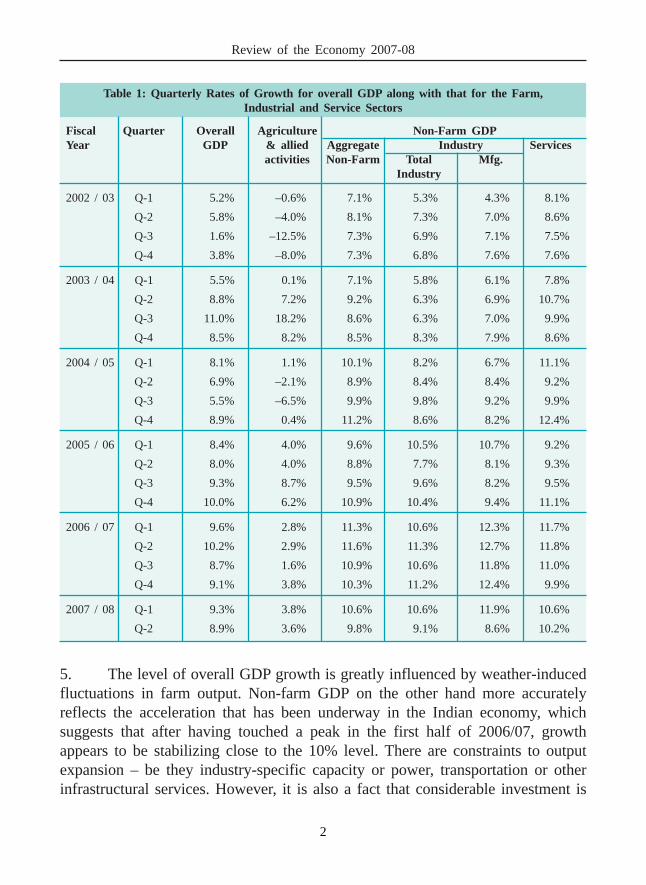
2. The economy grew by 9.3% in the first quarter (April to June) and by8.9% in the second quarter (July to September) of 2007/08. The average rate ofgrowth in the first half of the fiscal year was 9.1%, compared to 9.9% during thecomparable period of the previous fiscal year. For the record, the economy hadgrown at the rate of 9.6% and 10.2% in the first and second quarters of 2006/07.This may be seen to suggest that the process of economic acceleration that hascharacterised the economy over the past five years has lost some of its pace, afterhaving peaked in the first part of calendar 2006.
3. After having crossed 10% GDP growth in the second quarter of 2006/07,the economy appears to be stabilising at a rate above 8.5% and close to 9.0%. Thenon-farm sector after having accelerated from 7–8% in 2002/03 to 11.6% in thesecond quarter of 2006/07 appears likely to stabilise in the range between 10%and 10.5%. It may be noted that over the past 20 quarters (with steadilyaccelerating rates of expansion) the average rate of growth of GDP has been 8.0%and that of the non-farm sector 9.6%. Also, the growth rate in the farm sector hasshown a distinct improvement moving up to 3.5% in each of the previous threequarters from the average level of 2.4% for the past 20 quarters. We expect farmsector GDP to grow at around 3.5% in 2007-08. Combined with non-farm sectorgrowth of 10.0 to 10.5%, the overall rate of growth is expected to be around 8.9%.
4. Table-1 gives the overall rates of GDP growth for the past severalquarters, along with disaggregated growth rates for the farm, industry and servicessectors.
2
Review of the Economy 2007-08
Table 1: Quarterly Rates of Growth for overall GDP along with that for the Farm,Industrial and Service Sectors
Fiscal Quarter Overall Agriculture Non-Farm GDPYear GDP & allied Aggregate Industry Services
activities Non-Farm Total Mfg.Industry
2002 / 03 Q-1 5.2% –0.6% 7.1% 5.3% 4.3% 8.1%
Q-2 5.8% –4.0% 8.1% 7.3% 7.0% 8.6%
Q-3 1.6% –12.5% 7.3% 6.9% 7.1% 7.5%
Q-4 3.8% –8.0% 7.3% 6.8% 7.6% 7.6%
2003 / 04 Q-1 5.5% 0.1% 7.1% 5.8% 6.1% 7.8%
Q-2 8.8% 7.2% 9.2% 6.3% 6.9% 10.7%
Q-3 11.0% 18.2% 8.6% 6.3% 7.0% 9.9%
Q-4 8.5% 8.2% 8.5% 8.3% 7.9% 8.6%
2004 / 05 Q-1 8.1% 1.1% 10.1% 8.2% 6.7% 11.1%
Q-2 6.9% –2.1% 8.9% 8.4% 8.4% 9.2%
Q-3 5.5% –6.5% 9.9% 9.8% 9.2% 9.9%
Q-4 8.9% 0.4% 11.2% 8.6% 8.2% 12.4%
2005 / 06 Q-1 8.4% 4.0% 9.6% 10.5% 10.7% 9.2%
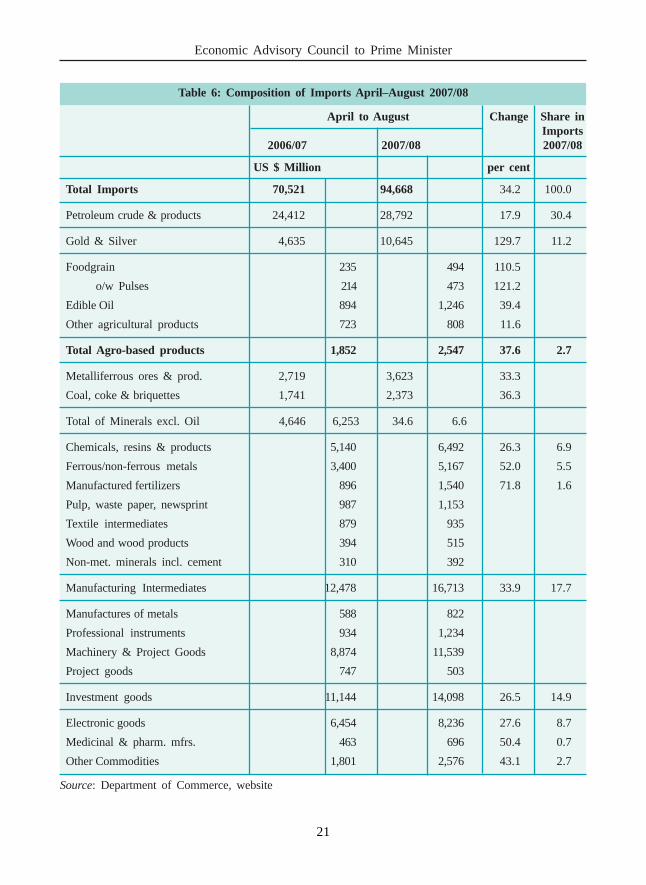
Q-2 8.0% 4.0% 8.8% 7.7% 8.1% 9.3%
Q-3 9.3% 8.7% 9.5% 9.6% 8.2% 9.5%
Q-4 10.0% 6.2% 10.9% 10.4% 9.4% 11.1%
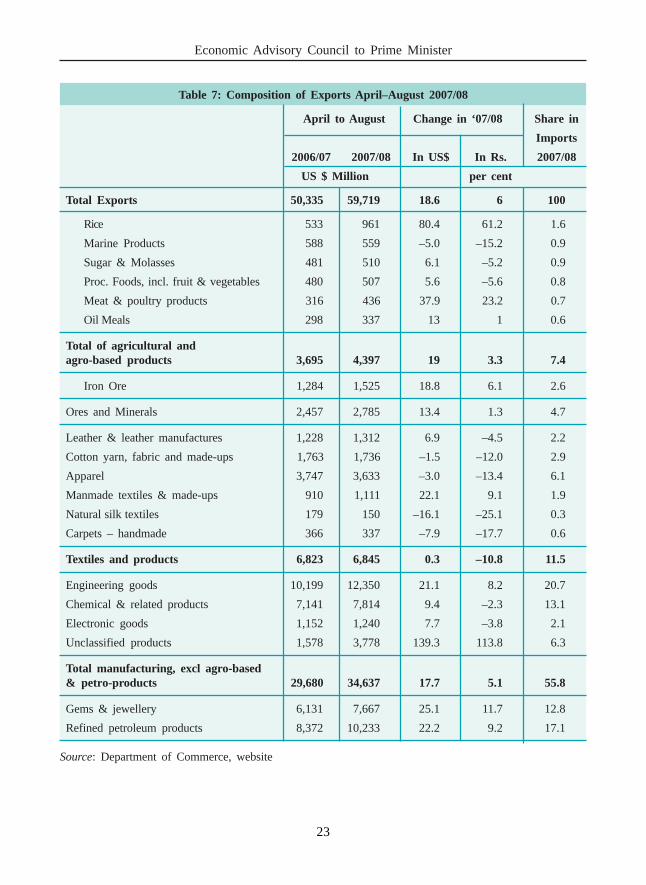
2006 / 07 Q-1 9.6% 2.8% 11.3% 10.6% 12.3% 11.7%
Q-2 10.2% 2.9% 11.6% 11.3% 12.7% 11.8%
Q-3 8.7% 1.6% 10.9% 10.6% 11.8% 11.0%
Q-4 9.1% 3.8% 10.3% 11.2% 12.4% 9.9%
2007 / 08 Q-1 9.3% 3.8% 10.6% 10.6% 11.9% 10.6%
Q-2 8.9% 3.6% 9.8% 9.1% 8.6% 10.2%
5. The level of overall GDP growth is greatly influenced by weather-inducedfluctuations in farm output. Non-farm GDP on the other hand more accuratelyreflects the acceleration that has been underway in the Indian economy, whichsuggests that after having touched a peak in the first half of 2006/07, growthappears to be stabilizing close to the 10% level. There are constraints to outputexpansion – be they industry-specific capacity or power, transportation or otherinfrastructural services. However, it is also a fact that considerable investment is

3
Economic Advisory Council to Prime Minister
underway to augment capacity in both the manufacturing and infrastructuresectors. Therefore, it may not be inappropriate to infer that a further round ofacceleration in industrial and related services sector output is probable furtherdown the road.
4
Review of the Economy 2007-08
II – GLOBAL ECONOMIC DEVELOPMENTS IN
2007/08 AND OUTLOOK
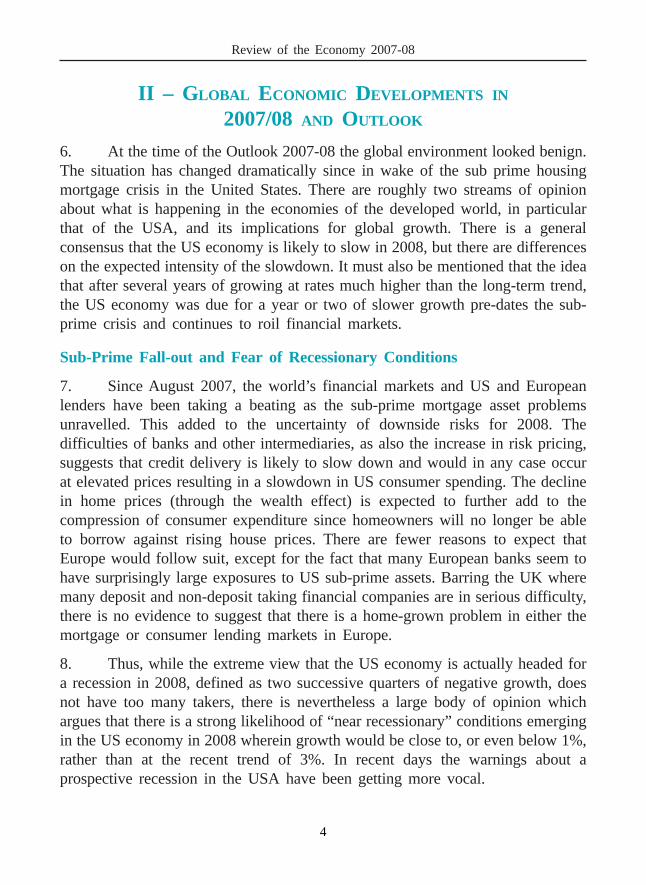
6. At the time of the Outlook 2007-08 the global environment looked benign.The situation has changed dramatically since in wake of the sub prime housingmortgage crisis in the United States. There are roughly two streams of opinionabout what is happening in the economies of the developed world, in particularthat of the USA, and its implications for global growth. There is a generalconsensus that the US economy is likely to slow in 2008, but there are differenceson the expected intensity of the slowdown. It must also be mentioned that the ideathat after several years of growing at rates much higher than the long-term trend,the US economy was due for a year or two of slower growth pre-dates the sub-prime crisis and continues to roil financial markets.
Sub-Prime Fall-out and Fear of Recessionary Conditions
7. Since August 2007, the world’s financial markets and US and Europeanlenders have been taking a beating as the sub-prime mortgage asset problemsunravelled. This added to the uncertainty of downside risks for 2008. Thedifficulties of banks and other intermediaries, as also the increase in risk pricing,suggests that credit delivery is likely to slow down and would in any case occurat elevated prices resulting in a slowdown in US consumer spending. The declinein home prices (through the wealth effect) is expected to further add to thecompression of consumer expenditure since homeowners will no longer be ableto borrow against rising house prices. There are fewer reasons to expect thatEurope would follow suit, except for the fact that many European banks seem tohave surprisingly large exposures to US sub-prime assets. Barring the UK wheremany deposit and non-deposit taking financial companies are in serious difficulty,there is no evidence to suggest that there is a home-grown problem in either themortgage or consumer lending markets in Europe.
8. Thus, while the extreme view that the US economy is actually headed fora recession in 2008, defined as two successive quarters of negative growth, doesnot have too many takers, there is nevertheless a large body of opinion whichargues that there is a strong likelihood of “near recessionary” conditions emergingin the US economy in 2008 wherein growth would be close to, or even below 1%,rather than at the recent trend of 3%. In recent days the warnings about aprospective recession in the USA have been getting more vocal.
5
Economic Advisory Council to Prime Minister
9. The alternate view is that while growth in the US may slip a bit, the slippagewould be small. This argument derives from the fact that the US economy has recordedstrong growth (2.8% year-on-year) even as late as the third quarter of 2007. Anecdotalreports on the Christmas shopping season do not suggest a slowdown in spendingeither. In fact, except for the home building sector, all other sectors seem to be doingrather well, with GDP growth excluding the problem-stricken housing sector stillgrowing at about 2.0% in the third quarter of 2007. Indeed, the US economy grewmore strongly in the third quarter of 2007, than it had in the first and the second. Thisconclusion is also supported by the employment figures. Unemployment in November2007 was reported to be 4.8% which is more or less unchanged from the beginningof the year and is low by historical standards. The data on non-farm employmentcreation has also continued to be healthy through 2007 including in October andNovember. However, in December 2007 the unemployment number rose to 5.0%and new non-farm job creation was at a low level.
10. The Euro-zone has been experiencing a revival of strong growth since thebeginning of 2006. In the third quarter of 2007 the region grew by 2.8%. Noneof the major economies of the region – Germany, France, Italy, Netherlands andSpain – showed signs of any weakness. Japan expanded at a brisk pace of 2.1%right up to the third quarter of 2007. However in December 2007 official sourceslowered the (quarter-on-quarter) growth estimate for the July-September quarterfrom 2.6% to 1.5% and then proceeded to significantly reduce growth projectionsfor the current fiscal year ending March 2008. Expected growth in the next fiscalyear has however been maintained at 2.0%.
11. In its World Economic Outlook of October 2007, the International MonetaryFund (IMF) has slightly reduced its earlier estimate of US economic growth for2007 to 1.9%, and drastically reduced its 2008 estimate to 1.9% from 2.8%earlier. Growth in the Euro area has been reduced by a smaller margin to 2.1%for 2008 while growth in Japan has been lowered to 1.7% in 2008. The IMFexpects a relatively small reduction in growth of world output in 2008 to 4.8%,slightly less than that likely to be achieved in 2007, as a result of the altered roleof developing economies in becoming “the major engine of global growth”
12. Taking on board the two opposing views, and considering that the IMFview may have been somewhat overtaken by adverse economic developments,including the big rise in oil prices that followed, on balance, we believe that thegreatest likelihood is of a situation that is akin to what the IMF had suggested inOctober, but with a bias towards greater economic weakness.
6
Review of the Economy 2007-08
Outlook for Emerging Economies
13. The slower growth in the developed world is likely to impact emergingeconomies by reducing demand for their exports in rich country markets, and thatin turn would affect the level of economic activity in the emerging world.However, the extent of the slowdown is likely to be mild. An additional possiblefactor in the expected ‘mild’ impact of the slowdown in the developed world isthe intra trade amongst the emerging markets. Further, there is a large domesticcomponent of demand in the major emerging economies which would offset theeffect of any possible contraction in export markets.
14. The IMF sees major downside risks in 2008 as emerging from “financialmarket strains (that) could continue and trigger a more pronounced globalslowdown. Thus, the immediate task for policymakers is to restore more normalfinancial market conditions and safeguard the continued expansion of activity.Additional risks … include potential inflation pressures, volatile oil markets, theimpact on emerging markets of strong capital inflows, and continued large globalimbalances.”
15. The strains on the financial market are self-evident, and the limited abilityof home-country regulators to resolve the problem is also palpable. Delinquenciesand home repossessions continue to rise in the US, and many leading Americanand European banks have announced large write-downs as well as unconventionalrecapitalisation from sovereign funds in Singapore, the Arab Emirates and China.
16. The big crunch in credit of all kinds that was so feared has not come topass, as is evident from expansion in monetary and banking data available for USand Western Europe, although the interbank market continues to be stressedUndoubtedly, the exceptional refinancing facilities (through the extended repowindow) offered by the European Central Bank, the US Federal Reserve, theBank of Japan and the Bank of England have helped in stabilising financialintermediaries by infusing their assets with the necessary liquidity. The risk of afinancial meltdown involving a freezing of markets for banking assets appearslargely to have passed, replaced by the individual woes of banks as they seek torepair the damage to their balance sheets through bouts of capital infusion.
Inflation – Energy & Food
17. In this global scenario, inflation poses the biggest challenge for 2008,together with managing the fallout of continued large capital flows into emerging
7
Economic Advisory Council to Prime Minister
economies. The demand for those commodities – crude oil, industrial rawmaterials, grain and other food – which have been stoking inflation numbersduring the past years is likely to persist; nonetheless it will, at best grow at a ratesmaller than in the past few years. In all these cases, the reason for price rise hasbeen driven by supply constraints and in the absence of a significant decline indemand it is unlikely that there will be any respite on the price front.
18. Crude oil prices are likely to stay firm. However, the main lesson of thepast months has been that the world can live with $80 to $90 per barrel. Cartelizedoil producers are thus likely to be emboldened to use production quotas, ifnecessary, to keep oil prices close to their present highs, and higher still, if marketconditions permit. The impact of crude oil at close to $100 per barrel throughmost of 2008 may have a dampening impact on economic activity, though itwould add to the complexity of managing a larger inflationary burden for the restof the world.
19. Over the past several years, adverse weather related factors and diversionof land to non-food use has caused world wheat output levels to fall since the late1990s. In fact, world wheat output fell more or less continuously after 1998/99 toits recent lowest level in 2003/04. In the meanwhile, consumption continued togrow steadily causing world wheat stocks to fall by 76 million tonnes, or 37%,during this period. Production recovered in the past three years (including 2007/08) but not sufficiently to catch up with consumption, leading to further erosionof stocks by an estimated 22 million tonnes or 17%. Not surprisingly, wheat priceshave soared. International wheat prices had begun to inch upwards in August/September 2005. In the two-year period between November 2005 and 2007 wheatprices have nearly doubled. The problem has been rendered more complex by therise of bio-fuels and diversion of both land and production to meet these demands– a development that has a longer-term bearing on grain prices. In December,wheat prices for March 2008 delivery in US markets rose by a further 10%.
20. Though more acreage is reportedly being brought under wheat in responseto higher prices, it is unlikely that the augmented output will soften wheat pricesby much in 2008/09 – though over the medium-term that is a distinct possibility.It is thus likely that we will continue to see high global wheat prices – and fora range of other agricultural commodities too – through 2008.
8
Review of the Economy 2007-08
III – India: The Growth Outlook
21. From the discussion in the previous section it would appear that someslowdown in the pace of expansion of the US economy is likely and this may leadto slower growth in developing economies as a result of lower rate of exportexpansion. This is however likely to be offset by continued growth in domesticmarkets and the relatively mild nature of the slowdown. The Indian economy ismuch less dependent on the external markets than the Chinese economy, forexample. Thus, while some export demand compression is likely to put anadditional burden on our exporters of goods and services, it is unlikely to be largeenough to significantly depress growth. However, the flip side to this is that thepressure on the prices of oil, food and other raw materials is likely to continue,making inflation management in 2008/09 quite challenging.
Growth Estimate for 2007/08
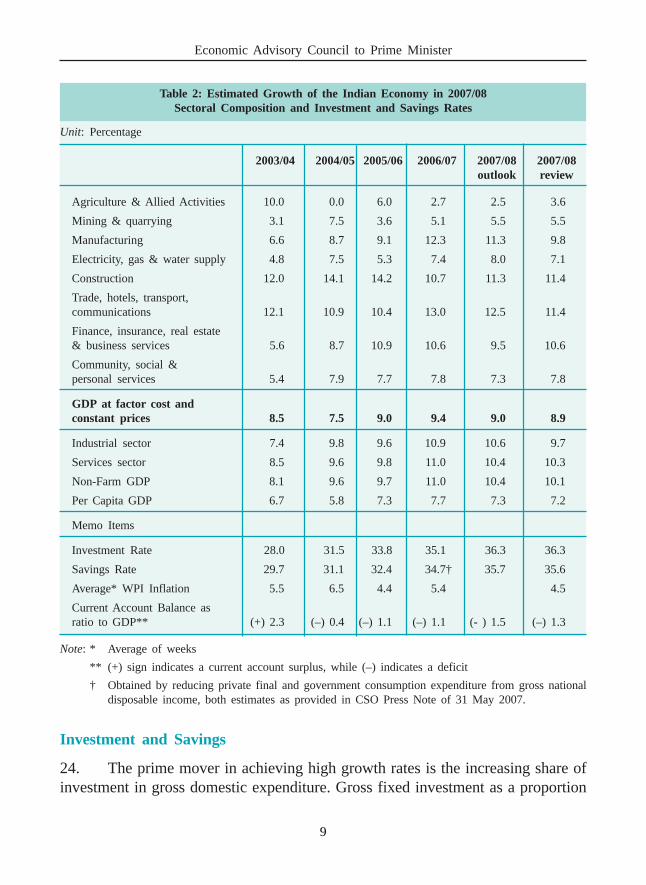
22. It is our assessment that the rate of growth of GDP in 2007/08 would be8.9%, marginally lower than our previous estimate in July 2007. The maindifference stems from lower than expected expansion in manufacturing output andlower growth in the output of energy utilities, which has been partially offset bybetter than expected expansion in the farm sector. The estimated rate of expansionby broad industry of origin for 2007/08 is given in Table 2.
23. The Outlook had stated that the primary downside risk to our economicperformance in 2007-08 derived from uncertainties on account of the southwestmonsoons. As things turned out, the monsoons were good and agricultural growthis better than what was anticipated in the Outlook. The current estimates are basedon a reasonably good rabi crop and an absence of serious weather anomalies.Industrial growth on the other hand, which was predicated on a benign externalenvironment, is likely to be slower than what was assumed in the Outlook. It isstill possible that output growth in manufacturing may show a stronger recoverythan what is assumed by us. However, on the whole we believe that in the finalanalysis the rate of overall expansion of the economy would be close to 8.9% forthe fiscal year ending March 2008, with per capita income rising by 7.2% in realterms – the third successive year of above 7% real increase in per capita GDP. Atmarket exchange rates the Indian economy would have a size of nearly US$ 1.2trillion which translates into per capita incomes of over US$ 1,000.
9
Economic Advisory Council to Prime Minister
Table 2: Estimated Growth of the Indian Economy in 2007/08Sectoral Composition and Investment and Savings Rates
Unit: Percentage
2003/04 2004/05 2005/06 2006/07 2007/08 2007/08outlook review
Agriculture & Allied Activities 10.0 0.0 6.0 2.7 2.5 3.6
Mining & quarrying 3.1 7.5 3.6 5.1 5.5 5.5
Manufacturing 6.6 8.7 9.1 12.3 11.3 9.8
Electricity, gas & water supply 4.8 7.5 5.3 7.4 8.0 7.1
Construction 12.0 14.1 14.2 10.7 11.3 11.4
Trade, hotels, transport,communications 12.1 10.9 10.4 13.0 12.5 11.4
Finance, insurance, real estate& business services 5.6 8.7 10.9 10.6 9.5 10.6
Community, social &personal services 5.4 7.9 7.7 7.8 7.3 7.8
GDP at factor cost andconstant prices 8.5 7.5 9.0 9.4 9.0 8.9
Industrial sector 7.4 9.8 9.6 10.9 10.6 9.7
Services sector 8.5 9.6 9.8 11.0 10.4 10.3
Non-Farm GDP 8.1 9.6 9.7 11.0 10.4 10.1
Per Capita GDP 6.7 5.8 7.3 7.7 7.3 7.2
Memo Items
Investment Rate 28.0 31.5 33.8 35.1 36.3 36.3
Savings Rate 29.7 31.1 32.4 34.7† 35.7 35.6
Average* WPI Inflation 5.5 6.5 4.4 5.4 4.5
Current Account Balance asratio to GDP** (+) 2.3 (–) 0.4 (–) 1.1 (–) 1.1 (- ) 1.5 (–) 1.3
Note: * Average of weeks
** (+) sign indicates a current account surplus, while (–) indicates a deficit
† Obtained by reducing private final and government consumption expenditure from gross nationaldisposable income, both estimates as provided in CSO Press Note of 31 May 2007.
Investment and Savings
24. The prime mover in achieving high growth rates is the increasing share ofinvestment in gross domestic expenditure. Gross fixed investment as a proportion
10
Review of the Economy 2007-08
of GDP has risen progressively from 24.8% in 2003/04 to 29.5% in 2006/07 bynearly equal increments in each year. We had estimated that in 2007/08 it wouldincrease further to 30.5%. Likewise, the aggregate gross investment rate hasincreased from 28.0% in 2003/04 to 35.1% in 2006/07, also in more or less equalincrements in each intervening year. We had estimated that in 2007/08 the grossinvestment rate would rise to 36.3%.
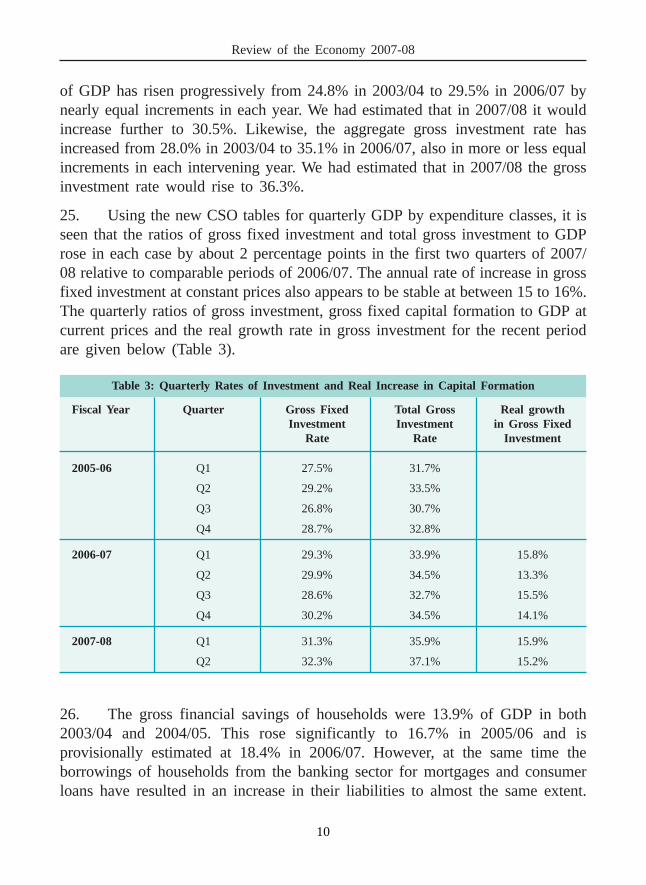
25. Using the new CSO tables for quarterly GDP by expenditure classes, it isseen that the ratios of gross fixed investment and total gross investment to GDProse in each case by about 2 percentage points in the first two quarters of 2007/08 relative to comparable periods of 2006/07. The annual rate of increase in grossfixed investment at constant prices also appears to be stable at between 15 to 16%.The quarterly ratios of gross investment, gross fixed capital formation to GDP atcurrent prices and the real growth rate in gross investment for the recent periodare given below (Table 3).
Table 3: Quarterly Rates of Investment and Real Increase in Capital Formation
Fiscal Year Quarter Gross Fixed Total Gross Real growthInvestment Investment in Gross Fixed
Rate Rate Investment
2005-06 Q1 27.5% 31.7%
Q2 29.2% 33.5%
Q3 26.8% 30.7%
Q4 28.7% 32.8%
2006-07 Q1 29.3% 33.9% 15.8%
Q2 29.9% 34.5% 13.3%
Q3 28.6% 32.7% 15.5%
Q4 30.2% 34.5% 14.1%
2007-08 Q1 31.3% 35.9% 15.9%
Q2 32.3% 37.1% 15.2%
26. The gross financial savings of households were 13.9% of GDP in both2003/04 and 2004/05. This rose significantly to 16.7% in 2005/06 and isprovisionally estimated at 18.4% in 2006/07. However, at the same time theborrowings of households from the banking sector for mortgages and consumerloans have resulted in an increase in their liabilities to almost the same extent.
11
Economic Advisory Council to Prime Minister
Hence, the net financial savings of households have barely risen from 11.3% in2003/04 to 11.6% of GDP in both 2005/06 and 2006/07. This means that theexpansion of investment has been financed mainly from other domestic sources– principally a rise in retained private corporate earnings from 4.7% in 2003/04to 8.1% in 2005/06. The estimates for 2006/07 are likely to be released shortly,but would probably be in the region of 9% of GDP.
27. Reduction in the negative savings of government administration (that is, theexcess of current consumption expenditure over the current revenues) has also beena significant contributor to financing investment. The magnitude of government dis-saving reached a low point in 2001/02 at 6.2% of GDP. Sustained efforts at both theCentre and the States towards prudent fiscal management have seen this ratio fall to3.6% in 2003/04 and to 2.5% in 2005/06. In 2006/07, it is estimated to be close to2.0% of GDP. In essence this has meant that government through better managementof its finances was able to release over 4 percentage points of GDP towards thefinancing of investment, which accounted for one-third of the increase of 12percentage points in the aggregate investment rate between 2001/02 and 2006/07.
28. In the aggregate, rising levels of investment have been financed fromdomestic sources – through a combination of higher retained corporate earningsand improved fiscal balances of government. There has been little absorption ofnet foreign savings which is, by definition, equivalent to the Current AccountDeficit (CAD). Till 2003/04, we had run a sizable current account surplus whichhas since 2004/05 turned into a deficit. The magnitude of the deficit has howeverremained close to or below 1% of GDP. Thus, the capital inflows which were inexcess of the CAD have in an accounting sense, become part of the foreigncurrency reserves of the central bank and “re-exported” overseas.
29. However, individual Indian companies have greatly benefited from foreigninvestment in their stocks and through overseas listing. As a result, Indian companiesthat have been in the forefront of the global growth process over the past decadehave had access to much greater equity investment and hence resources for risk-taking and growth than what the accounting equivalence between CAD and absorptionof net foreign savings may suggest. The interaction between global investors andIndian companies has directly benefited the latter, by improving their ability to tapinto global markets and internalise best practices. It has also enabled the acquisitionof businesses by Indian companies overseas, possibly the most important instrumentfor accessing world class technology and research & development, besides gaininga foothold in foreign markets and distribution networks.
12
Review of the Economy 2007-08
Farm Sector
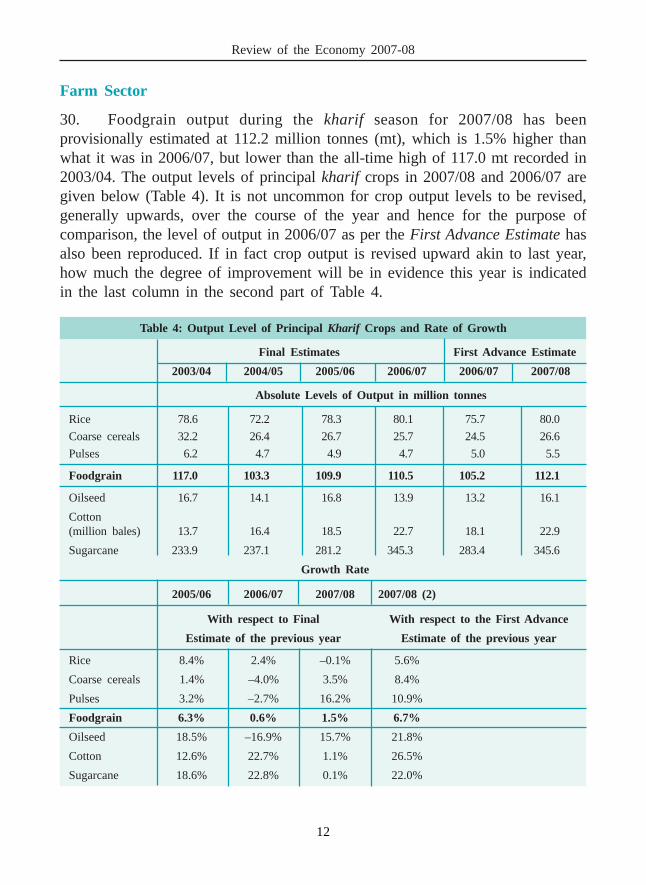
30. Foodgrain output during the kharif season for 2007/08 has beenprovisionally estimated at 112.2 million tonnes (mt), which is 1.5% higher thanwhat it was in 2006/07, but lower than the all-time high of 117.0 mt recorded in2003/04. The output levels of principal kharif crops in 2007/08 and 2006/07 aregiven below (Table 4). It is not uncommon for crop output levels to be revised,generally upwards, over the course of the year and hence for the purpose ofcomparison, the level of output in 2006/07 as per the First Advance Estimate hasalso been reproduced. If in fact crop output is revised upward akin to last year,how much the degree of improvement will be in evidence this year is indicatedin the last column in the second part of Table 4.
Table 4: Output Level of Principal Kharif Crops and Rate of Growth
Final Estimates First Advance Estimate
2003/04 2004/05 2005/06 2006/07 2006/07 2007/08
Absolute Levels of Output in million tonnes
Rice 78.6 72.2 78.3 80.1 75.7 80.0
Coarse cereals 32.2 26.4 26.7 25.7 24.5 26.6
Pulses 6.2 4.7 4.9 4.7 5.0 5.5
Foodgrain 117.0 103.3 109.9 110.5 105.2 112.1
Oilseed 16.7 14.1 16.8 13.9 13.2 16.1
Cotton(million bales) 13.7 16.4 18.5 22.7 18.1 22.9
Sugarcane 233.9 237.1 281.2 345.3 283.4 345.6
Growth Rate
2005/06 2006/07 2007/08 2007/08 (2)
With respect to Final With respect to the First Advance
Estimate of the previous year Estimate of the previous year
Rice 8.4% 2.4% –0.1% 5.6%
Coarse cereals 1.4% –4.0% 3.5% 8.4%
Pulses 3.2% –2.7% 16.2% 10.9%
Foodgrain 6.3% 0.6% 1.5% 6.7%
Oilseed 18.5% –16.9% 15.7% 21.8%
Cotton 12.6% 22.7% 1.1% 26.5%
Sugarcane 18.6% 22.8% 0.1% 22.0%
13
Economic Advisory Council to Prime Minister
31. There were reports in December 2007 that the progress of sowing for therabi season has been slow and that the acreage under wheat had fallen, despite thesubstantial increase in the Minimum Support Price (MSP) for wheat announcedmonths before the season commenced. It has been reported that the likely acreageunder wheat this year will be about 27.5 million hectares (m HA), which is 0.5m HA (1.8%) lower than what was sown last year. It appears that because ofadverse moisture conditions about 0.7 m HA less will come under wheat this yearin central India, which will be partly offset by an additional 0.2 m HA being sownwith wheat in Punjab, Haryana, Gujarat and Bihar. Overall it appears that totalwheat output in the 2007/08 rabi season will come close to the target of 75.5 mtwhich is 0.8% higher than the output last year. While estimates of production ofrabi food grains as a whole are not yet available, current indications are that thismight be slightly higher than last year’s level of 105.6 MT. This is subject tonormal weather conditions prevailing during the season.
32. The output of kharif oilseeds was significantly higher than in the previousyear primarily on account of a strong recovery in the production of groundnut,which increased by 58% from 3.3 mt to an estimated 5.2 mt in 2007. The outputof soybeans, which is the second largest kharif oilseed, is estimated to haveincreased by 2% to 9.0 mt this year. Overall, oilseed production in the kharifseason is estimated to have risen by nearly 16%. There are reports to suggest thatsowing of the largest rabi oilseed, namely mustard (and rapeseed), may have beensignificantly lower than last year, on account of relatively better economicprospects from growing wheat and trade estimates put the acreage under mustardthis year at up to a fifth lower than last year. However, this is not easy to reconcilewith the information that wheat acreage has fallen in central India, which is animportant growing area for mustard and rapeseed.
33. The output of raw cotton in 2007/08 as estimated by the Ministry ofAgriculture is 22.9 million bales (of 170 kg) indicating 1% increase over outputlevels last year. However, estimates of the Cotton Advisory Board, which areconsidered to be more accurate by trade and industry, had placed this year’soutput at nearly 31 million bales at the beginning of the season, an increase of 9%over last year. More recently, trade sources have reported that due to flood relatedand other losses, output may be lower than 30 million bales. The increase inoutput of cotton is attributed to a combination of expansion of BT cotton, acreageincrease of 8% and extension of irrigation facilities in the Gujarat region.Improvement of the domestic supply position will help stabilise prices and make
14
Review of the Economy 2007-08
available some raw cotton for export which is estimated to be 7 million bales thisyear.
34. 2006/07 saw an all-time record of 345 mt of sugarcane and 28.4 mt ofsugar production. This increased the stocks of sugar with mills to record levels,brought about a significant decline in domestic market prices of sugar and raisedcane payment dues in many regions of the country. Given the multi-year characterof sugarcane cultivation, corrections in acreage take at least a couple of years, ifnot more. It is generally expected that there may not be any decline in output -indeed there may be some increase - in 2007/08, given the amount of freshacreage planted in the previous season. Sugar output may consequently be around32 mt, i.e. 4% higher than last year. However, in part due to weather-relatedproblems in Maharashtra, and the late start of the crushing season in Uttar Pradeshdue to disputes over the recently notified State Advised Price (SAP), it is nowbelieved that output of mill sugar will be around 30 mt. The expectation is thatthere will be a sizeable decline in sugarcane acreage as well as sugar output in thenext crop year, i.e. 2008/09, since the current weak economics of the business islikely to persist for a while.
35. Production of fruits and vegetables has risen impressively by 5% to 25%,depending upon the item, and this seems to have become a trend over the pastseveral years. India, which is the largest producer of diary milk in the world,crossed 100 mt of output in 2006, and in the current year, the output is expectedto rise by 3%. The proportion of milk distributed by the organised sector is alsoexpected to increase. Egg production is expected to increase by 4 to 5% to 55billion eggs, while broiler meat production is believed to rise by 10% to 2.2 mtin 2007. Increasingly, horticulture and animal husbandry are gaining as a proportionof farm income thus more than making up for the relative stagnation of cerealproduction. Given the generally small size of our holdings and the availablelabour with farm families, this is a beneficial trend.
36. The overall prospects in 2007/08 support our assessment of 3.6% GDPgrowth in the farm sector in 2007/08.
Power Sector
37. Over the course of the Tenth Five Year Plan (2002–07) accretion to powercapacity had fallen well behind the targets set in the Plan, as indeed had been thecase in previous plan periods as well. However, since economic growth was alsolower, the delay in commissioning power capacity may have exacted a lesser cost
15
Economic Advisory Council to Prime Minister
on potential growth. With economic growth taking off in the Tenth Plan period,the constraints imposed by project delays in the power sector impose a moredirect and severe constraint on the ability of the economy to sustain high rates ofgrowth.
38. In 2007/08 the anticipated increase in power generation capacity was12,039 MW – much of which is a spill-over from delays in previous years. Tillthe end of December 2007, 6375 MW was actually completed. Optimisticestimates suggest that in the balance part of the year a further 4429 MW wouldbe commissioned, bringing the annual total to 10,804 MW, which would be about10% short of what was planned.
39. It may be remembered that over the past several years considerable directintervention and administrative pressure has been brought to bear on acceleratingpower capacity creation. Thus, there are two ways to look at what has happened in2007/08. One is to bemoan the extent of the shortfall and the other is to note thatthe annual increment of about 10,000 MW is more than double that achieved inprevious years. Another 10,000 MW of generation capacity is expected to be addedin 2008-09. The marked step up in addition to installed capacity was not enough tomake a significant dent on power supply deficits on account of increasing demand.At the all-India level, the power supply deficit for the period April–Nov. 2007/08was 7.9% (it was 8.4% during the same period last year); the deficit was highest inthe western and northern regions of the country at 13.2% and 8.0% respectively(corresponding to 12.7% and 11.4% in the same period last year).
Industrial Output
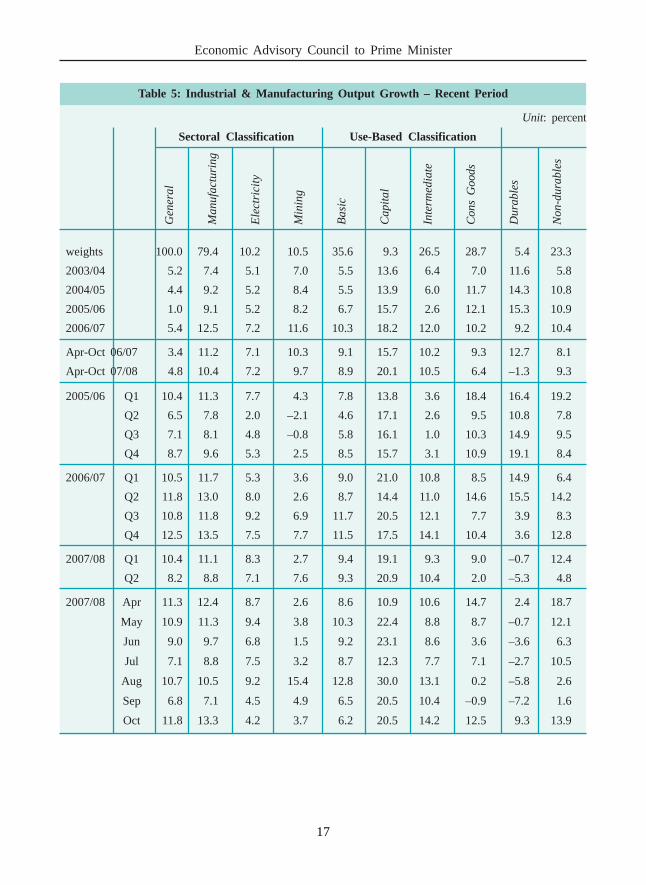
40. During the period April–Oct. 2007/08, the cumulative expansion ofindustrial output was 9.7%, lower than the 10.2% registered in the comparableperiod of the previous year. Manufacturing output expanded by 10.4% duringApril–Oct. 2007/08, which was also lower than the 11.2% recorded in thecomparable period last year. The rate of expansion of electricity generation stayedat the same level (7.1 to 7.2%) in the April-Oct. period of both the current fiscaland the previous year. Mining output in April–Oct. 2007/08 grew a little bit faster(4.8%) than it had (3.4%) in the comparable period of 2006/07. Thus, theprincipal reason for lower rates of industrial expansion is the slower rate ofgrowth in manufacturing output.
41. The lower rate of manufacturing output growth in 2007/08 has becomepronounced since June 2007. The main contributory factor is the drop in the rate
16
Review of the Economy 2007-08
of expansion in consumer durable output, unsupported by a matching offset fromexpansion in other product categories. The output of durable consumer goodsslipped from high double-digit numbers to low single digit ones in the thirdquarter (Oct–Dec) of 2006/07. This proceeded in an uninterrupted fashion tillMay 2007 when output began to decline even in absolute terms, albeit by a smallpercentage. Provisional estimates show a big bounce back to 9.3% growth inOctober 2007, but there is reason to see this as a one-off aberration caused by theunusually low level of output in October 2006. Non-durable consumer outputgrowth has also weakened, but not as sharply as that for durables. A considerablepart of the decline in the output of non-durable consumer goods derives fromlower export volumes of textiles.
42. The lower level of output growth in consumer durables can be attributedto tighter loan norms and interest rates that emerged as the joint product ofmonetary policy and banks’ own credit experience with several categories ofconsumer loans. As a result, borrowing possibly became harder to come by, andcertainly more costly. This may have blunted leveraged consumer demand andthis is seen reflected in lower output growth in consumer durables.
43. Output growth for capital goods continues to remain strong, while that ofbasic and intermediate goods has been somewhat erratic in the past months, buton average remain reasonably high. This may be seen in Table 5 which providesa break-up of industrial growth for recent years, recent quarters and for thepreceding months of the current fiscal year.
44. Cement production in the April-Nov period of 2007/08 has risen by 7.7%,reflecting an increase of nearly 8 mt. Capacity additions have been slower thanexpected but have totalled nearly 6.5 mt in the first eight months of 2007/08suggesting a level of capacity utilization that is slightly higher than in thecomparable period of last year.
45. Output of passenger cars increased by 15.0% in the period April–Nov2007/08 over the comparable period last year. This was close to the 17.6%expansion registered in output of cars in the same period last year relative to2005/06. In Light Commercial Vehicles, output growth in the April–Nov 2007/08period is 13.6%, a significant drop from the 30.6% growth last year. Output ofMedium & Heavy Commercial Vehicles has fallen in absolute terms with productionvolumes down by 2.9% compared to a growth of 32.4% in the same period lastyear. Likewise output of two-wheelers has declined by 6.2%, compared to a
17
Economic Advisory Council to Prime Minister
Gen
eral
Man
ufac
turi
ng
Ele
ctri
city
Min
ing
Bas
ic
Cap
ital
Inte
rmed
iate
Con
s G
oods
Dur
able
s
Non
-dur
able
s
Table 5: Industrial & Manufacturing Output Growth – Recent Period
Unit: percent
Sectoral Classification Use-Based Classification
weights 100.0 79.4 10.2 10.5 35.6 9.3 26.5 28.7 5.4 23.3
2003/04 5.2 7.4 5.1 7.0 5.5 13.6 6.4 7.0 11.6 5.8
2004/05 4.4 9.2 5.2 8.4 5.5 13.9 6.0 11.7 14.3 10.8
2005/06 1.0 9.1 5.2 8.2 6.7 15.7 2.6 12.1 15.3 10.9
2006/07 5.4 12.5 7.2 11.6 10.3 18.2 12.0 10.2 9.2 10.4
Apr-Oct 06/07 3.4 11.2 7.1 10.3 9.1 15.7 10.2 9.3 12.7 8.1
Apr-Oct 07/08 4.8 10.4 7.2 9.7 8.9 20.1 10.5 6.4 –1.3 9.3
2005/06 Q1 10.4 11.3 7.7 4.3 7.8 13.8 3.6 18.4 16.4 19.2
Q2 6.5 7.8 2.0 –2.1 4.6 17.1 2.6 9.5 10.8 7.8
Q3 7.1 8.1 4.8 –0.8 5.8 16.1 1.0 10.3 14.9 9.5
Q4 8.7 9.6 5.3 2.5 8.5 15.7 3.1 10.9 19.1 8.4
2006/07 Q1 10.5 11.7 5.3 3.6 9.0 21.0 10.8 8.5 14.9 6.4
Q2 11.8 13.0 8.0 2.6 8.7 14.4 11.0 14.6 15.5 14.2
Q3 10.8 11.8 9.2 6.9 11.7 20.5 12.1 7.7 3.9 8.3
Q4 12.5 13.5 7.5 7.7 11.5 17.5 14.1 10.4 3.6 12.8
2007/08 Q1 10.4 11.1 8.3 2.7 9.4 19.1 9.3 9.0 –0.7 12.4
Q2 8.2 8.8 7.1 7.6 9.3 20.9 10.4 2.0 –5.3 4.8
2007/08 Apr 11.3 12.4 8.7 2.6 8.6 10.9 10.6 14.7 2.4 18.7
May 10.9 11.3 9.4 3.8 10.3 22.4 8.8 8.7 –0.7 12.1
Jun 9.0 9.7 6.8 1.5 9.2 23.1 8.6 3.6 –3.6 6.3
Jul 7.1 8.8 7.5 3.2 8.7 12.3 7.7 7.1 –2.7 10.5
Aug 10.7 10.5 9.2 15.4 12.8 30.0 13.1 0.2 –5.8 2.6
Sep 6.8 7.1 4.5 4.9 6.5 20.5 10.4 –0.9 –7.2 1.6
Oct 11.8 13.3 4.2 3.7 6.2 20.5 14.2 12.5 9.3 13.9
18
Review of the Economy 2007-08
growth of 15.4% in the same period last year. The decline in the output levels ofM&HCV and two-wheelers has occurred despite a sharp pick-up in exports asmanufacturers have sought to compensate for declines in domestic sales.
46. On balance it would appear that manufacturing output growth for the fullyear 2007/08 would fall short of 10%, but will still be over 9%.
Service Sector
47. Revenue earning freight traffic of Indian Railways increased by 8.0% inApr-Oct 2007, that was lower than 9.9% recorded in the corresponding period lastyear. However, the slower expansion was mostly in the summer months of 2007and growth rates in the three months since August 2007 were close to or above10%, suggesting that the pace of expansion for the year as a whole is likely to beclose to last year’s level of about 9%. Cargo traffic at major ports rose by 13.0%during Apr-Oct 2007/08, almost double the rate in the corresponding period lastyear, and overall growth for the year is likely to be in excess of last year’s 9.5%.Domestic and international traffic at airports increased by 27%, somewhat lowerthan 36% last year and appears to be set to register a strong expansion in 2007/08, though it is lower than 31% registered last year.
48. GSM cellular connections increased by 67% in the period Apr-Oct 2007/08, a substantive increase over the already large base of 121 million subscribersin March 2007. The total of landline, GSM and WLL cellular connectionscontinued to grow by about 45% on year-on-year basis through the first sevenmonths of 2007/08, with the total subscriber base touching 256 million at the endof October 2007.
49. Financial sector activity has continued to expand, as evidenced by theaccretion to bank balance sheets, the premium collected by insurance companiesand the sharp increase in the corpus of funds under the management of mutualfunds.
19
Economic Advisory Council to Prime Minister
IV. EXTERNAL PAYMENTS SITUATION
50. For some years now, the external payments situation has been characterisedby a current account deficit (CAD) that is quite small considering what might wellhave been expected given the pace of growth and investment in the economy. Thatthe CAD is as low as around 1% of the GDP despite record levels of import ofcrude oil, capital goods, manufacturing intermediates and non-monetary gold, isa testimony to the structural strength of the country’s Balance of Payments (BoP).It appears that foreign investors have also reached a similar conclusion and it istheir confidence in the economy as a whole, and the BoP in particular, that haslaid the foundation of capital account surpluses that are far larger than what isneeded to finance the CAD.
51. In the first eight months of April–Nov. 2007/08, India’s merchandiseexports rose to $98.4 billion, an increase of 22.1% over the comparable period lastyear. Export growth during the same period last year was 26.0% (over 2005/06).Merchandise imports during April–Nov. 2007/08 increased to $151.0 billion, anincrease of 27.0% over that in the corresponding period last year, while importgrowth in the same period last year was 23.6%. The merchandise trade deficit inthe first eight months of 2007/08 aggregated $52.8 billion, 37% higher than whatit was during the corresponding period last year.
52. It appears that export expansion is driven more by productivity increasesthat have partially counteracted the adverse impact of an appreciating rupee andslowdown in developed countries while import growth is driven both by domesticeconomic growth as well as by the appreciation of the rupee.
Oil and Gold Imports
53. The value of oil imports rose by 10% to $43.3 billion in the first eightmonths of 2007/08, largely in line with increasing international prices of crude,which increased by 11% during the period April–Nov. 2007 over the correspondingperiod of the previous year. However, in the balance months of 2007/08, theimpact on the oil import bill is likely to be much greater. In 2006/07, world crudeprices were much lower during the period December - March, with the Nymexbenchmark spot price for sweet crude at $59 per barrel. In contrast, the benchmarkNymex sweet crude has stayed above $80 since September 2007, and over $90since late October. If world oil prices remain at these levels, the increase in theaverage price of imported crude is likely to increase by 50% or more in the
20
Review of the Economy 2007-08
remaining months of 2007/08. This will be reflected in fairly substantial increasesin the dollar value of oil imports in the period December to March 2007/08.
54. Gold imports totalled $6.7 billion in the first quarter of 2007/08, anincrease of 124% over the same period of last year. This is a big jump,notwithstanding the base effect of the sizeable decline in imports in the firstquarter of 2006/07. The value of gold imported in the first quarter of 2007/08 was69% more than in the record first quarter of 2005/06. Up to the end of August2007, for which detailed trade data is available, the value of gold imports in thecurrent fiscal year aggregated nearly $10 billion, a 116% increase over what wasimported in the corresponding period last year. Extrapolating from data on goldimported through major airports, it is estimated that up to the end of November2007, the total value of gold imports for the current fiscal year has recorded anincrease of about 30% in US dollar value.
Other Imports
55. The value of non-oil imports in April–Nov. 2007/08 rose by 35%. Whilethis was partly on account of the large increase in gold imports, the fact remainsthat the value of non-oil, non-gold imports in this period also rose by 36%,indicative of the strength of import demand generated by the rapid pace ofinvestment and economic expansion.
56. Information on the composition of imports and exports is available up toAugust 2007, that is, for the first five months of the current fiscal. While totalimports increased by 34% during this period, non-oil, non-gold, non-diamondimports rose by 33%. The import of investment goods – machinery and projectgoods – increased by 30% and comprised over 12% of the value of totalmerchandise imports. If the definition of investment goods is widened to includeferrous & non-ferrous metals, professional instruments, cement, and computersoftware in physical form, their share in imports rises to 20%, and the growth overthe corresponding period of last year to 35%.
57. If all items that are, or could be, considered as final consumption items(including food and all electronic imports) are aggregated, and unspecified itemsadded to this category, it is seen that this category of goods increased by 34%during April-August 2007, their share in total imports being a little over 14%. Theoverwhelming bulk of imports into the country thus continue to comprise crudeoil, gold, capital, raw materials and intermediate goods for the use of industry.
21
Economic Advisory Council to Prime Minister
Table 6: Composition of Imports April–August 2007/08
April to August Change Share inImports
2006/07 2007/08 2007/08
US $ Million per cent
Total Imports 70,521 94,668 34.2 100.0
Petroleum crude & products 24,412 28,792 17.9 30.4
Gold & Silver 4,635 10,645 129.7 11.2
Foodgrain 235 494 110.5
o/w Pulses 214 473 121.2
Edible Oil 894 1,246 39.4
Other agricultural products 723 808 11.6
Total Agro-based products 1,852 2,547 37.6 2.7
Metalliferrous ores & prod. 2,719 3,623 33.3
Coal, coke & briquettes 1,741 2,373 36.3
Total of Minerals excl. Oil 4,646 6,253 34.6 6.6
Chemicals, resins & products 5,140 6,492 26.3 6.9
Ferrous/non-ferrous metals 3,400 5,167 52.0 5.5
Manufactured fertilizers 896 1,540 71.8 1.6
Pulp, waste paper, newsprint 987 1,153
Textile intermediates 879 935
Wood and wood products 394 515
Non-met. minerals incl. cement 310 392
Manufacturing Intermediates 12,478 16,713 33.9 17.7
Manufactures of metals 588 822
Professional instruments 934 1,234
Machinery & Project Goods 8,874 11,539
Project goods 747 503
Investment goods 11,144 14,098 26.5 14.9
Electronic goods 6,454 8,236 27.6 8.7
Medicinal & pharm. mfrs. 463 696 50.4 0.7
Other Commodities 1,801 2,576 43.1 2.7
Source: Department of Commerce, website
22
Review of the Economy 2007-08
Exports
58. In the first five months of 2007/08, the value of exports rose by 19% inUS dollar terms and by 6% in Indian rupees. In the period up to November 2007,export growth more-or-less followed the same pattern of growth in US dollars at22% and 8% in Indian rupees. The rate of growth in the April-Aug period was thesame for non-petroleum products (18%) and non-POL, non-gems & jewellery(17%) in US dollar terms, and 5% and 4% respectively in Indian rupees.
59. The impact of the appreciation of the Indian rupee vis-à-vis the US dollarand other major currencies has been a major source of concern. Industry apprehendsa decline in India’s share in export markets as well as possible adverse consequenceson the competitiveness of Indian manufacturing, or at least in some sections of it.At Table 7 we have presented the commodity composition of exports during thefirst five months of 2007/08 in US dollars. The table indicates absolute declinesin cotton yarn, fabric & made-ups, apparel, natural silk textiles and handmadecarpets. The decline in the value of exports of such items when measured inIndian rupees is obviously larger.
61. It is interesting to note however that several items have bucked the trend,notably engineering goods and man-made textiles and made-ups, which registeredsmart gains in US dollar terms that translate into sizeable gains even whenmeasured in rupees, namely of 8% and 9% respectively. Gems & jewellery wasup by 12% in rupee terms and refined petroleum products by 9%. In the majorityof goods, especially those that formed an important component of the resurgenceof Indian exports after 1991, there has however been erosion in export value whenmeasured in Indian rupees. Thus, apparel was down by 13%, cotton yarn, fabric& made-ups by 12%, handmade carpets by 18%, and handicrafts by 50%. Therupee export value of leather products fell by 5% and chemicals by 2%. In thesebusinesses, therefore, there was a contraction of export business and to the extentthe domestic market could not accommodate diversion of output, a contraction ofbusiness in absolute terms as well.
63. While a complete analysis of the exact nature of the impact of rupeeappreciation on export volumes and unit realisation will have to await theavailability of more comprehensive data, some tentative points may be noted. Ina separate exercise, an investigation was made into the level of exports and theirunit values for the months of April–May and Sept–October for select exportproducts, including textile items, shipped from certain key ports. The finding was
23
Economic Advisory Council to Prime Minister
Table 7: Composition of Exports April–August 2007/08
April to August Change in ‘07/08 Share in
Imports
2006/07 2007/08 In US$ In Rs. 2007/08
US $ Million per cent
Total Exports 50,335 59,719 18.6 6 100
Rice 533 961 80.4 61.2 1.6
Marine Products 588 559 –5.0 –15.2 0.9
Sugar & Molasses 481 510 6.1 –5.2 0.9
Proc. Foods, incl. fruit & vegetables 480 507 5.6 –5.6 0.8
Meat & poultry products 316 436 37.9 23.2 0.7
Oil Meals 298 337 13 1 0.6
Total of agricultural andagro-based products 3,695 4,397 19 3.3 7.4
Iron Ore 1,284 1,525 18.8 6.1 2.6
Ores and Minerals 2,457 2,785 13.4 1.3 4.7
Leather & leather manufactures 1,228 1,312 6.9 –4.5 2.2
Cotton yarn, fabric and made-ups 1,763 1,736 –1.5 –12.0 2.9
Apparel 3,747 3,633 –3.0 –13.4 6.1
Manmade textiles & made-ups 910 1,111 22.1 9.1 1.9
Natural silk textiles 179 150 –16.1 –25.1 0.3
Carpets – handmade 366 337 –7.9 –17.7 0.6
Textiles and products 6,823 6,845 0.3 –10.8 11.5
Engineering goods 10,199 12,350 21.1 8.2 20.7
Chemical & related products 7,141 7,814 9.4 –2.3 13.1
Electronic goods 1,152 1,240 7.7 –3.8 2.1
Unclassified products 1,578 3,778 139.3 113.8 6.3
Total manufacturing, excl agro-based& petro-products 29,680 34,637 17.7 5.1 55.8
Gems & jewellery 6,131 7,667 25.1 11.7 12.8
Refined petroleum products 8,372 10,233 22.2 9.2 17.1
Source: Department of Commerce, website
24
Review of the Economy 2007-08
that in many cases there was a decline both in levels (rupees crore) and in unitvalue (Rs per unit) – which conforms to the broad story of difficulties on theexport front. However, it was also found that the unit value of exports had actuallyrisen (all in rupees) in almost as many cases as there were declines in levels. Ina few cases, both levels and unit export values had gone up in rupee terms.
64. The explanation underlying these findings seems to lie in a general erosionof export profitability, where more competitive units (which also have higher unitexport values) were able to maintain volumes, but the less competitive unitsexperienced significant declines in business volume. Without doubt, exportbusinesses are under considerable stress. There are reasons to believe that mostIndian businesses are able to adjust to small changes in relative prices, includingthe exchange rate of the rupee, through some productivity gains from year-to-year.However, if the magnitude of change in the exchange rate is much in excess ofthese incremental productivity gains, export businesses become vulnerable. Exportsapart, the change in relative world prices attendant on significant changes in theexchange rate equally impinge upon the competitiveness of domestic manufacturingin general and upon its relative profitability in particular.
Balance of Payments
Current Account
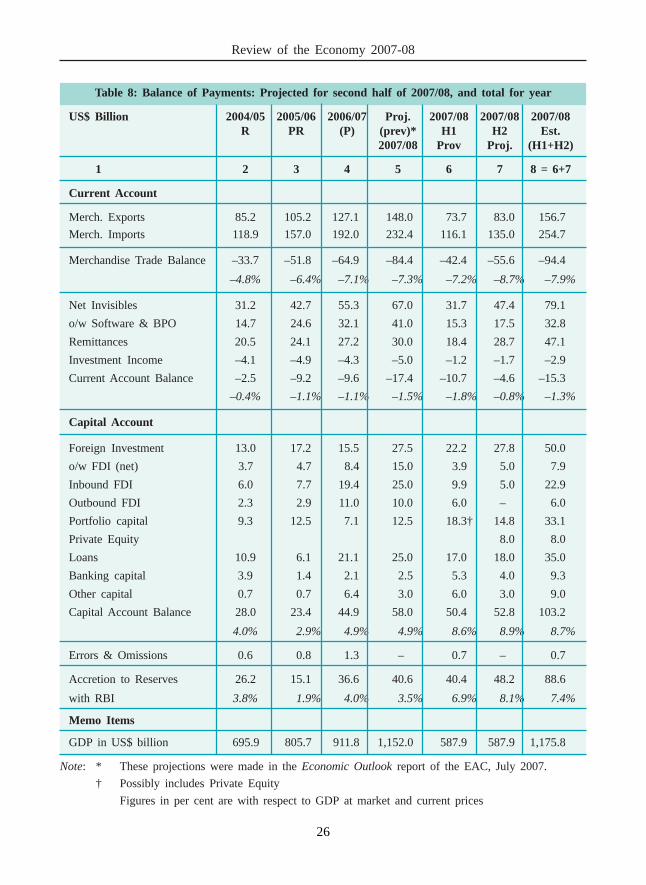
65. The current account deficit (CAD) in Q1 (Apr–Jun) of 2007/08 wasinitially estimated at $4.7 billion. This has been revised upwards slightly to $5.2billion. In Q2 (July-Sept) 2007/08, the CAD has been provisionally estimated tobe $5.5 billion. Thus the combined CAD for the first half of 2007/08 is $10.7billion, about the same as in the corresponding period last year ($10.3 billion).However, as a proportion of GDP the CAD in the first half of 2007/08 at 1.8%was actually lower than for the same period last year (2.3%). Merchandise tradedeficit as a proportion of GDP was also slightly lower in the first half of 2007/08, compared to the same period last year
66. There is an ongoing structural shift in India’s total export earnings towardsservices whose share in total export (goods and services) earnings increased froman average of 18% during 1990-95 to 39% in 2006-07. The key development onthe services & remittances side was the big increase in the net surplus on invisibletransactions to $31.7 billion in the first half of 2007/08, representing an increaseof 35% over the corresponding period last year. The other notable feature is theactual decline by 3.5% from $ 15.84 billion to $ 15.39 billion in the net receipts
25
Economic Advisory Council to Prime Minister
on account of international trade in software and business process outsourcing(BPO). This is matched by very large increases in net receipts from privatetransfers (up 69%) though this possibly has more to do with the change in theaccounting treatment of the salary and other incomes of employees of Indiancompanies working in off-shore locations, than to any fundamental change in thedirection of either software earnings or remittances per se. The net result is thatthat the current account deficit is now estimated at –1.3% of the GDP, marginallylower than the –1.5% projected in the July 2007 Economic Outlook.
Capital Flows
67. In the first half of 2007/08, the largest items accounting for net capitalinflows were portfolio capital ($18.3 billion) and loans ($17.0 billion). Net inflowon account of banking capital was surprisingly high at $5.3 billion, flowing fromnet inflows of $6.2 billion in Q2. This was not on account of NRI deposits whichincreased by a mere $0.4 billion in Q2 and registered a small decline for the firsthalf as a whole. The other large entry in Q2 is that under “Other capital” at $7.1billion.
68. Net inflow of foreign direct investment (FDI) in the first half of the yearwas $3.9 billion, the same as in the first half of 2006/07. Inflows of Private Equity(PE) investments have also been quite large. Since in most cases PE flowsconstitute less than 10% of the capital of the company being invested they shouldideally be reported under Portfolio Capital, and not under FDI. It is not clear whatthe current accounting practice is.
69. In Q1 of 2007/08, there was a difference of about $2.5 billion between thesum of net purchases by foreign institutional investors (FII) and overseas equityissuance by Indian companies (GDR/ADR). It is possible that represented PEinvestments, in full or part measure since as per the RBI definition what isreported is the “inflow of funds (net) by Foreign Institutional Investors (FIIs)” andnot necessarily investments by FIIs in listed securities and also bearing in mindthat many PE investors are either themselves registered or under commonownership of registered FIIs. In the second quarter, the excess of RBI reportedinflows by FII and that reported by SEBI to be total net purchases amounted to$1.6 billion. However, the quantum of PE investments is reported to be in theregion of $17 billion in calendar year 2007. It is thus possible that there may besome recasting of the BoP statement as it gets finalised and PE investments willhopefully be separately reported under Portfolio Capital. In the process we may
26
Review of the Economy 2007-08
Table 8: Balance of Payments: Projected for second half of 2007/08, and total for year
US$ Billion 2004/05 2005/06 2006/07 Proj. 2007/08 2007/08 2007/08R PR (P) (prev)* H1 H2 Est.
2007/08 Prov Proj. (H1+H2)
1 2 3 4 5 6 7 8 = 6+7
Current Account
Merch. Exports 85.2 105.2 127.1 148.0 73.7 83.0 156.7
Merch. Imports 118.9 157.0 192.0 232.4 116.1 135.0 254.7
Merchandise Trade Balance –33.7 –51.8 –64.9 –84.4 –42.4 –55.6 –94.4
–4.8% –6.4% –7.1% –7.3% –7.2% –8.7% –7.9%
Net Invisibles 31.2 42.7 55.3 67.0 31.7 47.4 79.1
o/w Software & BPO 14.7 24.6 32.1 41.0 15.3 17.5 32.8
Remittances 20.5 24.1 27.2 30.0 18.4 28.7 47.1
Investment Income –4.1 –4.9 –4.3 –5.0 –1.2 –1.7 –2.9
Current Account Balance –2.5 –9.2 –9.6 –17.4 –10.7 –4.6 –15.3
–0.4% –1.1% –1.1% –1.5% –1.8% –0.8% –1.3%
Capital Account
Foreign Investment 13.0 17.2 15.5 27.5 22.2 27.8 50.0
o/w FDI (net) 3.7 4.7 8.4 15.0 3.9 5.0 7.9
Inbound FDI 6.0 7.7 19.4 25.0 9.9 5.0 22.9
Outbound FDI 2.3 2.9 11.0 10.0 6.0 – 6.0
Portfolio capital 9.3 12.5 7.1 12.5 18.3† 14.8 33.1
Private Equity 8.0 8.0
Loans 10.9 6.1 21.1 25.0 17.0 18.0 35.0
Banking capital 3.9 1.4 2.1 2.5 5.3 4.0 9.3
Other capital 0.7 0.7 6.4 3.0 6.0 3.0 9.0
Capital Account Balance 28.0 23.4 44.9 58.0 50.4 52.8 103.2
4.0% 2.9% 4.9% 4.9% 8.6% 8.9% 8.7%
Errors & Omissions 0.6 0.8 1.3 – 0.7 – 0.7
Accretion to Reserves 26.2 15.1 36.6 40.6 40.4 48.2 88.6
with RBI 3.8% 1.9% 4.0% 3.5% 6.9% 8.1% 7.4%
Memo Items
GDP in US$ billion 695.9 805.7 911.8 1,152.0 587.9 587.9 1,175.8
Note: * These projections were made in the Economic Outlook report of the EAC, July 2007.
† Possibly includes Private Equity
Figures in per cent are with respect to GDP at market and current prices
27
Economic Advisory Council to Prime Minister
see a decline in the amounts booked under “Other” capital or perhaps evenbanking capital.
Projections for the second half of 2007/08
70. The merchandise trade account numbers up to November 2007 have beentaken into account in woking out the figures for Q3 (i.e. for December). Q4numbers have been estimated after factoring in the impact of much moreexpensive imported crude oil, the trend in the import of gold up to November2007 and understanding of the nature of change in non-oil, non-gold imports,based on the experience of the first six months of this fiscal year.
71. Overall, in the second half of 2007/08 it is expected that the value of theoil import bill will increase by 45% over the corresponding period last year andby 31% over the first half of 2007/08. For the year as a whole, the oil import billis projected at nearly $73 billion. Gold imports had shot up in Q1; they haveslowed since, recording only a small rise in Q2. It is projected that for the yearas a whole the value of bullion imports will be close to $17 billion, representingan increase of 14% over the previous year. Non-oil, non-gold imports rose by32% in the first half of 2007/08 and is expected to rise by 40% in the second halfof the year.
72. The computation of levels for each entry has been first done for Q3 andQ4 separately, and combined to give the second half estimate. The reportedfigures for the first two quarters have been added to the projections for the secondhalf to obtain the full year estimates for 2007/08. Merchandise exports in 2007/08 are thus expected to be nearly $156 billion (increase of 23%) and importsnearly $240 billion (rise of 29%). The trade deficit (on DGCI&S) basis is thusexpected to be about $85 billion, compared to $59 billion in the previous year (upby 43%). There are some adjustments that need to be made for arriving at the BoPtrade equivalents, which have been done for the second half by using the reportednumbers for the first half of 2007/08. The BoP merchandise trade deficit in thesecond half of 2007/08 has accordingly been computed at $52.0 billion. Thisyields a total trade deficit for 2007/08 of $94.4 billion, equivalent to 7.9% of theexpected GDP for the year, which is about $ 10 billion higher than what wasestimated in the July 2007 Economic Outlook.
73. In computing net invisible earnings in Q3 and Q4 of 2007/08, the levelshave been scaled up bearing in mind developments in the first half of the year.The changing trend in respect of software earnings and private remittance has
28
Review of the Economy 2007-08
been taken forward. Thus, there are differences between the figure for softwareearnings previously projected in July 2007 and that being estimated now, both onaccount of the projected growth of earnings and also in the distribution betweensoftware earnings and private remittances.
74. The projected CAD for the second half of 2007/08 is $4.6 billion whichgives us a total for the year of $15.3 billion or 1.3% of expected GDP for the year.The main difference in these projections and those made previously derives froma more rapid increase in the surplus of net invisible earnings than what waspreviously estimated by the Council.
75. Net FDI receipts for the second half of 2007/08 have been projected at thesame level as in the corresponding period last year, bearing in mind the experienceof the first half of the current fiscal. Net purchases by FIIs in Q3, according toSEBI, were $6.3 billion. We project a somewhat smaller figure for Q4, bearing inmind the experience of net selling in March during previous years. To this mustbe added the proceeds of GDR/ADR issuance, estimated at about $3.0 billion inthe second half of 2007/08. The aggregate of portfolio flows thus comes to $14.8billion in the second half. Inflows on account of Private Equity are shownseparately and placed at $8.0 billion for the second half of 2007/08. Total foreigninvestment in the second half is thus estimated at $27.8 billion, a little more thanthat in the first half. Loans have been kept at about the same level as the first half,while banking capital and “other” capital have been scaled down.
76. The total surplus on the capital account is thus estimated at $52.8 billionfor the second half of 2007/08, somewhat larger than in the first half. For 2007/08 as a whole, the surplus on the capital account is thus estimated to be a littleover $103 billion or 8.7% of the expected GDP for the year. This is significantlyhigher than $ 58 billion projected in the July 2007 Economic Outlook.
Reserve Accretion and Exchange Rate Movement
77. The large excess of capital inflows over and above that required to financethe CAD has resulted in reserve accretion to the tune of $40.4 billion (excludingrevaluation) in the first half of the year. The nominal increase in the value offoreign currency assets of RBI in Q3 was over $27 billion. The EAC’s assessmentis that accretion in Q4 will not be smaller. On the basis of projections of the BoPfor Q3 and Q4, likely accretion to reserves will be $48 billion in the second halfof 2007/08. Total accretion for the year will thus be close to $89 billion.
29
Economic Advisory Council to Prime Minister
78. This order of reserve accretion is a consequence of the central bank’sefforts to prevent a runaway appreciation of the currency as capital flows surgebeyond the financing need of the current account deficit. To offset the monetaryeffect of its intervention, the RBI has issued instruments under its marketstabilization scheme. The inflation adjusted currency weighted or Real EffectiveExchange Rate (REER) has risen between March 2007 upto the middle ofNovember by 7.2% both in respect of the 1993/94 base and the 2005/06 base.Almost all this appreciation took place in April and May 2007.
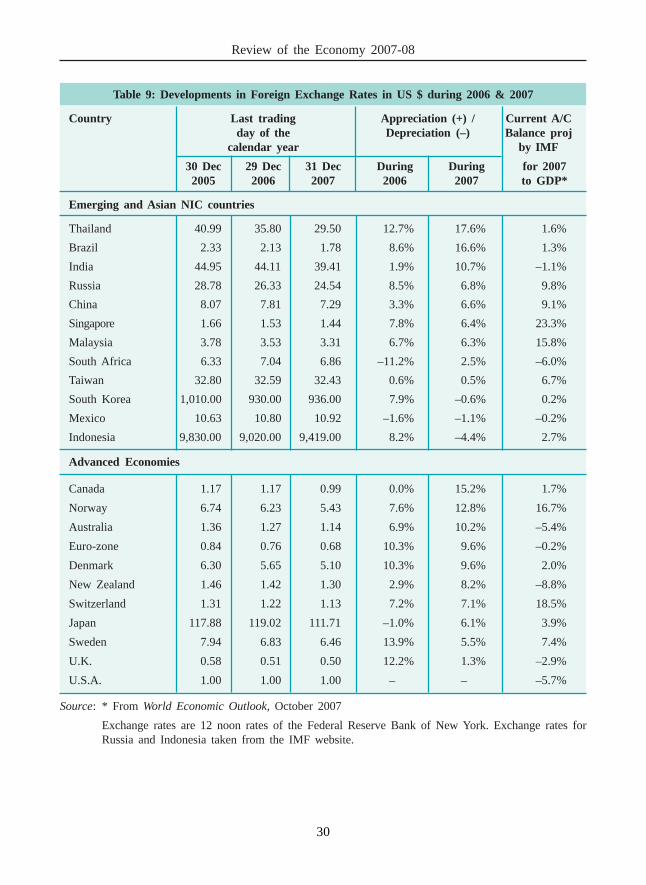
79. As has been the case in recent years, there has been considerable movementin the exchange rates between the major currencies of the world. In 2007, oneprominent characteristic has been the appreciation of some emerging marketcurrencies. A summary is provided at Table 9 of exchange rate developments in2006 and 2007. The rates are expressed in US dollars both for convenience as alsofor reasons discussed subsequently.
80. In the calendar year 2007 the Indian rupee was amongst the threeemerging market currencies that appreciated the most, after the Brazilian real andThai baht, recording appreciation in double digits. In the advanced economies,Canada, Norway and Australia led the appreciation surge, also in double-digits. Toappreciate the extent of change in the nominal exchange rate, the last column inTable 9 represents the ratio of the current account balance to GDP. It is interestingto note that India was one of the very few emerging and NIC (newly industrialisedcountry) economies in this list whose currency appreciated strongly despitehaving a current account deficit. Almost all other emerging & NIC economieshave sizable current account surpluses, and yet have seen their currencies gain bymuch less than India. The reason is the widespread practice of managingexchange rate movements through central bank intervention – even where thecurrent account surplus as a proportion of GDP is 10% or more. It may be notedthat the large appreciation in Australia and New Zealand and to some extent theBritish pound, is wholly on account of high interest rates maintained there forseveral years.
81. To be fair, the Indian rupee had barely budged in 2006, despite a largeoverall BoP surplus, whilst the currencies of most other emerging & NICeconomies had moved up by 3% to 8%. However, the gradualist path adopted byso many economically successful countries, notwithstanding colossal currentaccount surpluses, underscores the ability of enterprises to adjust to changes in theexchange rate. In recent times, India has had the additional disadvantage of
30
Review of the Economy 2007-08
Table 9: Developments in Foreign Exchange Rates in US $ during 2006 & 2007
Country Last trading Appreciation (+) / Current A/Cday of the Depreciation (–) Balance proj
calendar year by IMF
30 Dec 29 Dec 31 Dec During During for 20072005 2006 2007 2006 2007 to GDP*
Emerging and Asian NIC countries
Thailand 40.99 35.80 29.50 12.7% 17.6% 1.6%
Brazil 2.33 2.13 1.78 8.6% 16.6% 1.3%
India 44.95 44.11 39.41 1.9% 10.7% –1.1%
Russia 28.78 26.33 24.54 8.5% 6.8% 9.8%
China 8.07 7.81 7.29 3.3% 6.6% 9.1%
Singapore 1.66 1.53 1.44 7.8% 6.4% 23.3%
Malaysia 3.78 3.53 3.31 6.7% 6.3% 15.8%
South Africa 6.33 7.04 6.86 –11.2% 2.5% –6.0%
Taiwan 32.80 32.59 32.43 0.6% 0.5% 6.7%
South Korea 1,010.00 930.00 936.00 7.9% –0.6% 0.2%
Mexico 10.63 10.80 10.92 –1.6% –1.1% –0.2%
Indonesia 9,830.00 9,020.00 9,419.00 8.2% –4.4% 2.7%
Advanced Economies
Canada 1.17 1.17 0.99 0.0% 15.2% 1.7%
Norway 6.74 6.23 5.43 7.6% 12.8% 16.7%
Australia 1.36 1.27 1.14 6.9% 10.2% –5.4%
Euro-zone 0.84 0.76 0.68 10.3% 9.6% –0.2%
Denmark 6.30 5.65 5.10 10.3% 9.6% 2.0%
New Zealand 1.46 1.42 1.30 2.9% 8.2% –8.8%
Switzerland 1.31 1.22 1.13 7.2% 7.1% 18.5%
Japan 117.88 119.02 111.71 –1.0% 6.1% 3.9%
Sweden 7.94 6.83 6.46 13.9% 5.5% 7.4%
U.K. 0.58 0.51 0.50 12.2% 1.3% –2.9%
U.S.A. 1.00 1.00 1.00 – – –5.7%
Source: * From World Economic Outlook, October 2007
Exchange rates are 12 noon rates of the Federal Reserve Bank of New York. Exchange rates forRussia and Indonesia taken from the IMF website.
31
Economic Advisory Council to Prime Minister
having higher inflation than in East and South East Asia. In theory, the effect ofhigher relative inflation should be neutralised by a corresponding devaluation; infact the tendency has been for the currency to consistently appreciate in nominalterms.
82. India is a relatively small player in world trade, even when compared withother Asian economies. For most products, especially manufactures, Indianenterprises are price takers, with benchmark prices set by major East Asiansuppliers whose currencies are tied to the US dollar. Certainly there aremanufactures where Asian markets may not determine the price, but in most casesthese are high technology products where Indian enterprises at best figure at themargin. For the bulk of the market serviced by Indian enterprises, it is the Asianmarkets that are of greater relevance. Under the circumstances, irrespective of thedestination market, it is the US dollar price of manufactured commodities thatdirectly or indirectly determines the ability to survive in a highly competitivemarket. In other words, the actions of some large central banks in the region setconstraints that limit the ability of any one currency to get ahead in theappreciation game, without incurring an avoidably large economic cost.
83. In the Council’s earlier report, the approach towards dealing with theexchange rate was spelt out in terms of a judicious combination of interventionand sterilisation, liberalisation of outflows and some appreciation. The rise of thecurrency in April and May 2007 appears to have exhausted the last instrument forsome time now, unless other economies allow their currencies to appreciate bymuch more than what was witnessed in recent months. Steps have been taken toremove administrative and other procedural hurdles to outflows, but perhaps morecan be done. The introduction of limits on external borrowings for funding rupeeexpenditure appears to have channelled corporate borrowing energy into thefinancing of capital goods import and overseas acquisitions. For the balance of2007/08, it is hard to see any other substantial instrument other than continuedintervention, accompanied by adequate sterilisation. Since the pressure on therupee to appreciate is likely to continue in the immediate future, given that thecapital account surplus is several multiples of the current account deficit, clearsignals should be given to the Indian industry to make adjustments throughproductivity increases and to tap the booming domestic market. However sometransitional package targeted specifically at labour intensive industries may becalled for.
32
Review of the Economy 2007-08
V. PRICES, MONETARY, FINANCIAL
AND FISCAL MANAGEMENT
Inflation – Wholesale and Consumer Price
84. In the July 2007 Economic Outlook of the Council, the assessment wasthat wholesale price (WPI) inflation would drop below the 4% level in Aug/Sept2007, which assuming an overdue upward revision in prices of refined petroleumproducts, would enable the headline rate to be maintained close to 4%. In theevent, gasoline and diesel prices have not yet been revised, and as a result, theheadline rate has dropped to between 3.0% and 3.5%.
85. The pressure on prices from primary food, including foodgrain, has abatedbut the story can yet turn sour later in the year if world grain prices continue toremain strong, while domestic output gains are limited and pressure mounts toraise support prices further. In manufactured goods, inflation has dropped frombetween 5% and 6% in the summer of 2007 to 3.6% at the end of December 2007.Part of this is a consequence of the falling price of sugar and cotton textiles, theresult of less than happy circumstances in these industries, and may be reversedto some extent in the coming fiscal year. The decline in inflation in manufacturedgoods is also partly on account of the decline in highly volatile prices of non-ferrous metals, a development that may be quickly reversed if global sentimentturns optimistic. In fact, the core inflation rate is still at 4.2% (in part due tostrong prices for raw cotton and oilseeds) reflecting the lower room for manoeuvrethan indicated by the current headline rate.
86. Inflation, as measured by the CPI, has been consistently higher than thatindicated by the WPI primarily on account of the greater weight of food in theCPI compared to the WPI. Though there was no corresponding decline in the CPIwhen the WPI began to decline in recent months the CPI has also fallen. The CPI(UNME) and CPI (IW) show inflation in November 2007 at 5.1% and 5.5%respectively, a significant drop from 6.4% to 7.3% in August 2007.
87. On a cumulative basis – that is, from the last week of March onwards –inflation represented by the WPI has been 2.6% up to the middle of Decembercompared to 5.7% for the same period last year and 4.0% and 4.5% respectivelyfor the previous two years. The same trend is visible in the CPI. The CPI (UNME)saw a cumulative increase of 4.2% in the period upto November in 2007/08,compared to 6.7% in the corresponding period last year. Likewise the CPI (IW)
33
Economic Advisory Council to Prime Minister
saw a cumulative increase of 5.5% during the period compared to 6.7% in thecomparable period of 2006/07.
88. Even adjusting for some increase in prices of automotive fuels, the year-to-date WPI inflation is likely to be about 3.2% up to mid-December 2007.08,which may seem comfortably low by our own recent experience. The problemhowever is that inflation in India has been uncomfortably higher vis-à-vis ourcompetitor economies in the region. This has made handling of the exchange ratethat much more difficult. 2007 was the first year where Indian inflation was notthe highest in the region – an outcome that needs to be sustained.
89. If automotive fuel prices are indeed revised soon, the headline WPIinflation rate should go to a little over 4.0%, and remain stable there till the endof the fiscal year. The impact would depend on the extent of revision inautomotive fuel prices. The CPI is likely to show inflation at close to 5% at theend of 2007/08.
Monetary & Credit Developments
90. The large increase in foreign currency assets of the RBI has meantcounterpart injection of high-powered (M0) money, a large part of which hashowever been sterilised by the issue of instruments under the Market StabilisationScheme (MSS). As on December 21, 2007 a total of Rs. 162,665 crore of MSSbonds were outstanding – an increase of Rs 99,691 crore during the course of2007/08. The purchase of excess capital inflows by the RBI is represented byequivalent increase in bank deposits (of the private beneficiaries of the capitalinflow).
91. A part of this was impounded by the increase in the Cash Reserve Ratio(CRR), and a larger part absorbed by the issue of MSS bonds. In addition, to theextent of negative cash injection (acceptance of deposits) under the LiquidityAdjustment Facility (LAF), liquidity is further impounded by the RBI. A roughand ready assessment for the week ending December 21, 2007 suggests that ona year-to-date basis about Rs 260,000 crore of foreign exchange had beenpurchased by RBI in 2007/08. Of this, about Rs 100,000 crore was absorbedthrough issuance of MSS bonds over and above that outstanding at the end ofMarch 2007. About Rs. 51,000 crore was the additional increase in bank reserveswith RBI. Further Rs 22,400 crore was absorbed under the LAF facility on Dec21, 2007.
34
Review of the Economy 2007-08
92. The reported increase in Reserve Money for 2007/08 upto Dec 21, 2007 wasRs. 98,513 crore. This is equivalent to an increase of 13.9% over the end-Marchfigure. The broad money aggregate (M3) increased on a year-to-date basis by11.2% up to Dec 7, 2007, exactly the same order of increase as in the comparableperiod of 2006/07. The extent by which intervention has been higher in 2007/08relative to the comparable period last year has been offset by greater use ofsterilisation and reserve requirement instruments. It may be recollected that up tothe end of December, in 2006 the real accretion to reserves was just $16 billion,compared to a likely figure of $66 billion for the same period in 2007/08 – analmost 4-fold increase. The increased level of intervention of about $50 billion orRs. 200,000 crore is more than the total of MSS issuance (about Rs. 100,000 crore).Hence, the rise in reserve money has been at a faster pace than last year. Theexpansion of M3 at a pace comparable with last year is a consequence of morecareful lending this year and a greater allocation to investment in securities, asidefrom the decelerating impact of higher prescribed CRR.
93. Off-take of both non-food credit and total bank accommodation to thecommercial sector has slowed sharply in the first and second quarters of 2007/08.At the end of September 2007, the year-to-date increase in non-food credit was6.0%, more than 4 percentage points lower than in the first half of 2006/07 and2005/06. The trend in total accommodation has not been markedly different fromthat for non-food credit in the current fiscal. In the third quarter of 2007/08, andespecially since November 2007, the off-take of both non-food credit and totalaccommodation has increased with the Q3 increase in non-food credit on year-to-date basis being 9.4% upto 7 Dec 2007, compared to 14.0% for the same periodlast year.
94. The slowdown in credit growth has not only slightly lightened the task ofmonetary management, it has also provided a respite to banks which have beenreassessing some of their lending operations, especially on the retail side. In theaftermath of the sub-prime crisis world-wide attention is being refocused on theimportance of credit quality and risk management and this is as good a time asany for the Indian banking system to invest some human and organisationalcapital towards improving risk mitigation in retail lending.
Fiscal Developments
95. Central government finances have continued with their improving trend,propelled by a sharp increase in direct tax collections which far outstripped
35
Economic Advisory Council to Prime Minister
budget estimates upto the end of November 2007. Gross tax collections for thefirst eight months of the year rose by 25% compared to 17% envisaged in the2007/08 Union Budget. According to current estimates, direct tax collectionswould cross Rs 300,000 crore in 2007-08, an increase of about 30% over the lastyear. Direct taxes have now overtaken indirect taxes in the Centre’s tax revenues.This tax buoyancy has come about to a great extent from an outstanding collectionrecord in Income Tax, consequent on the vast improvements in the tax informationnetwork, even as corporation tax collections have remained very strong. The highbuoyancy in the service tax collections witnessed in recent years has alsocontinued. Overall net central government revenues have risen in the first eightmonths by 24% as compared to expectations of 15% in the Budget.
96. Even as revenue expenditures have outstripped budget estimates, deficitindicators have improved in absolute terms relative to the comparable period lastyear. The combined gross fiscal deficit of the Centre and States is expected todecline further from 6.4% of the GDP in 2006-07 to 5.6% in 2007-08.
97. While fiscal consolidation has been an unmitigated good, making availablemuch larger resources for financing the sharp increase in productive investmentin the economy, it has avoided the need to take a hard look at expenditure. Indeedalmost the entire reduction in the deficit since 2001-02 is accounted for byincrease in direct tax collections in the Centre, through the switchover to VAT inthe states, and reduction in interest payments. It had been pointed out in the July2007 Outlook that the practice of taking subsidy expenditures below the line inthe form of issuance of securities in lieu of outright subsidies is not desirable. TheJuly 2007 Outlook had estimated off balance sheet liabilities at about 2% of theGDP. In view of rising oil, fertilizer and food prices, there is reason to believe thatthese might in fact be higher.
36
Review of the Economy 2007-08
VI – PROSPECTS FOR 2008/09
98. This section takes a preliminary view of prospects for the economy in2008/09. The underlying dynamics that have characterised the rapid expansion ofthe economy in recent years are: robust investment growth, strong corporateperformance, high rates of domestic savings, good tax buoyancy that has helpedgovernment at the Centre and in the States to move ahead on fiscal consolidationand perhaps, most importantly, strong confidence amongst our citizen-consumersand entrepreneurs. These factors are not likely to change much in the comingfiscal year.
99. Nevertheless there are several perceptible risks going forward. The first, isthe extent of slowdown that may manifest in the economies of the developedworld. As discussed in the first part of this review, the Council is of the opinionthat the slowdown will be a modest one which would not significantly impactIndia’s next year’s growth prospects by much. There could however be continuedinflationary pressure. On balance, with the usual caveat of a normal monsoon, theIndian economy is likely to grow by about 8.5% in 2008/09. The reasons whygrowth next year is expected to be a bit lower than in the current fiscal can beascribed to: (a) continuation of slower growth in the demand for consumer goods;(b) slightly slower growth in the trade, hotels, transport & communication sectors;and (c) farm sector growth closer to the trend of 2.5%, than to the strongerperformance evident in 2007/08. The figure of 8.5% may be seen to be a baselineprojection that would be impacted if the underlying assumptions were to change.
100. However, there is a possibility that the slowdown may turn intorecessionary conditions in the US, especially if there are adverse geo-politicaldevelopments, which, at times, act as triggers. In such an event, a decline inbusiness confidence at the general level can combine with a prospective compressionof export demand, to cause a significant slowing of the domestic economy. Theeffects are likely to be felt through both trade and capital flows, with Indiancompanies experiencing greater challenges in gaining market share, as also tofinance ambitious investment projects or overseas acquisitions.
101. The second downside risk stems from the availability of power. As hasbeen noted, in 2007/08 a record level of capacity will have been incorporated inthe public sector, but that has not seen a decline in supply deficits or in thestrained capacity utilisation of plants. In 2008/09 sustained pressure at all levelsmust be maintained, not only to bring into generation the capacity spill-over from
37
Economic Advisory Council to Prime Minister
the current fiscal, but also to target a significantly higher level of capacitycreation, compared to 2007/08. The economy is growing fast, so is the demandfor power – and inadequate provision of this key ingredient has the potential ofcausing significant economic slowdown by both reducing the absolute availabilityand causing factories to depend more on captive power that is often veryexpensive.
102. The third downside risk stems from the 2008 South West monsoon. Indiahas been fortunate to witness five successive good monsoon seasons. Were thatrun of good luck to be broken, the farm sector would undoubtedly suffer loss ofoutput and income. This may in turn exacerbate the pressure on food prices andtherefore on the general level of prices.
103. The farm sector also presents a possible upside. It has been seen that inthe current year, the strong growth in agricultural GDP has come mostly fromactivity other than food grain production, namely commercial crops, horticultureand animal husbandry. Were the South West monsoon rains to be good in 2008,it is possible that the farm sector may grow at a pace that is similar to this year,thereby pushing the overall rate of economic growth, both directly and indirectly.
104. There are some downside risks that can stem from not being able to takemuch needed decisions. Among them are the early and appropriate revision in theselling prices of automotive fuel and a longer-term policy on fertilisers that canencourage fresh investment into the sector. The impact of the Sixth Pay Commissionmay also have to be taken into consideration in 2008-09.
105. Taking all factors into consideration, the Council expects the economy togrow at about 8.5% in 2008-09.
Related Documents