Economic Overview With a Focus on Housing Citigroup Global Markets Inc. | Municipal Securities Division Michael Koessel Director, Head of Housing Group [email protected] (212) 723-4967 1

Welcome message from author
This document is posted to help you gain knowledge. Please leave a comment to let me know what you think about it! Share it to your friends and learn new things together.
Transcript
Economic Overview
With a Focus on Housing
Citigroup Global Markets Inc. | Municipal Securities Division
Michael Koessel
Director, Head of Housing Group
(212) 723-4967 1
Introduction
Indicators of Economic Strength – GDP, Employment and Asset Prices
Policy Decisions: Fed Decisions and Potential Tax Reform
State of the Housing Market – The General and the Affordable Markets
2
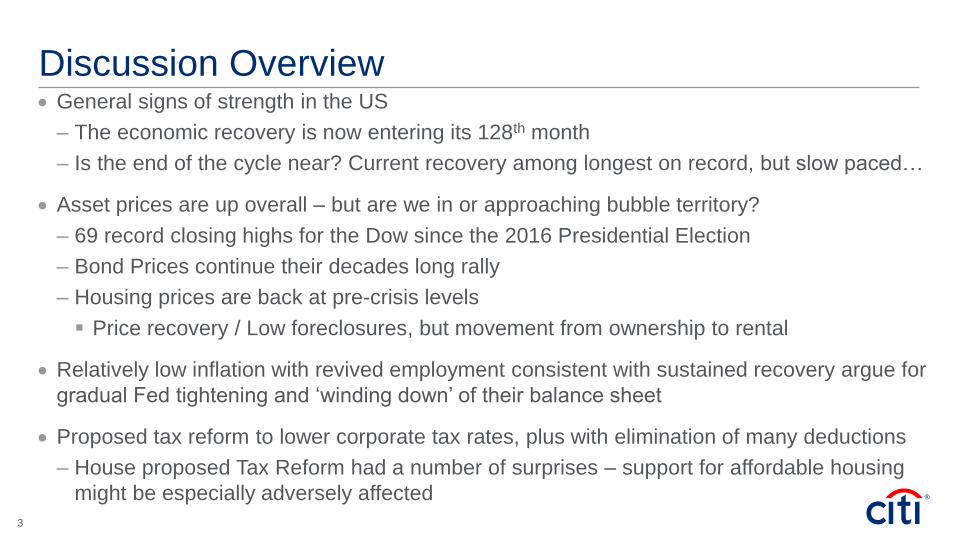
Discussion Overview General signs of strength in the US
– The economic recovery is now entering its 128th month
– Is the end of the cycle near? Current recovery among longest on record, but slow paced…
Asset prices are up overall – but are we in or approaching bubble territory?
– 69 record closing highs for the Dow since the 2016 Presidential Election
– Bond Prices continue their decades long rally
– Housing prices are back at pre-crisis levels
Price recovery / Low foreclosures, but movement from ownership to rental
Relatively low inflation with revived employment consistent with sustained recovery argue for
gradual Fed tightening and ‘winding down’ of their balance sheet
Proposed tax reform to lower corporate tax rates, plus with elimination of many deductions
– House proposed Tax Reform had a number of surprises – support for affordable housing
might be especially adversely affected
3

Asset Prices: Indicators of Economic Strength
4
Recession
-8.0
-6.0
-4.0
-2.0
0.0
2.0
4.0
6.0
8.0
1986 1991 1996 2001 2007 2012 2017
GD
P G
row
th Y
oY
(%
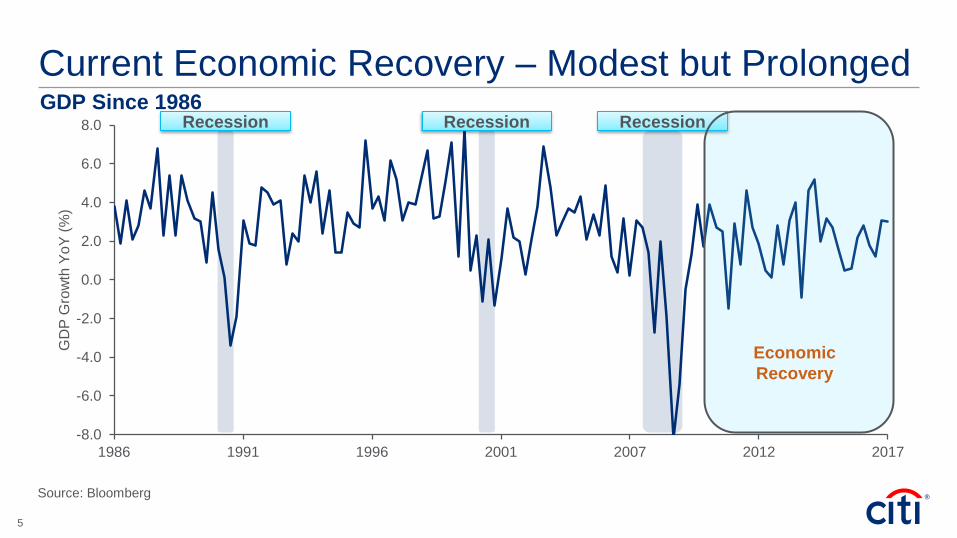
)Current Economic Recovery – Modest but Prolonged GDP Since 1986
Source: Bloomberg
Recession Recession
Economic
Recovery
5
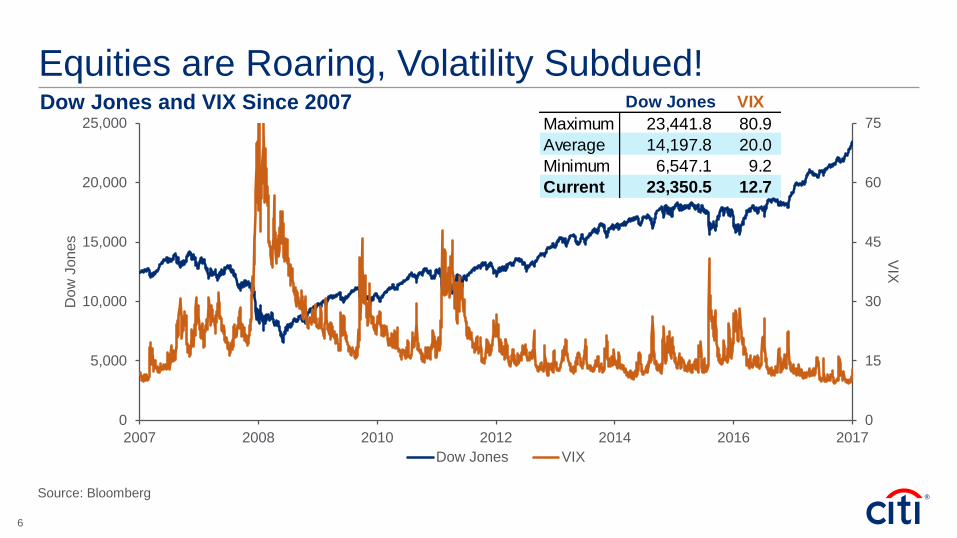
Equities are Roaring, Volatility Subdued! Dow Jones and VIX Since 2007
Source: Bloomberg
Dow Jones VIX
Maximum 23,441.8 80.9
Average 14,197.8 20.0
Minimum 6,547.1 9.2
Current 23,350.5 12.7
0
15
30
45
60
75
0
5,000
10,000
15,000
20,000
25,000
2007 2008 2010 2012 2014 2016 2017
VIX
Dow
Jones
Dow Jones VIX
6
0
5
10
15
20
25
30
35
40
45
50
1900 1919 1939 1958 1978 1998 2017
Ratio
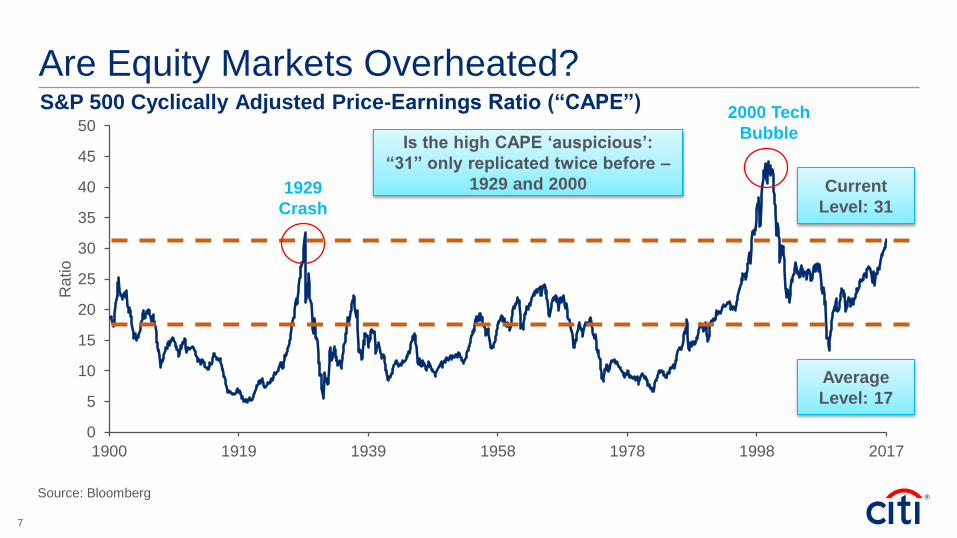
Are Equity Markets Overheated? S&P 500 Cyclically Adjusted Price-Earnings Ratio (“CAPE”)
Source: Bloomberg
Is the high CAPE ‘auspicious’:
“31” only replicated twice before –
1929 and 2000 1929
Crash
2000 Tech
Bubble
Current
Level: 31
Average
Level: 17
7
0.0
2.0
4.0
6.0
8.0
10.0
12.0
14.0
16.0
18.0
1962 1971 1980 1989 1999 2008 2017
Yie
ld (
%)
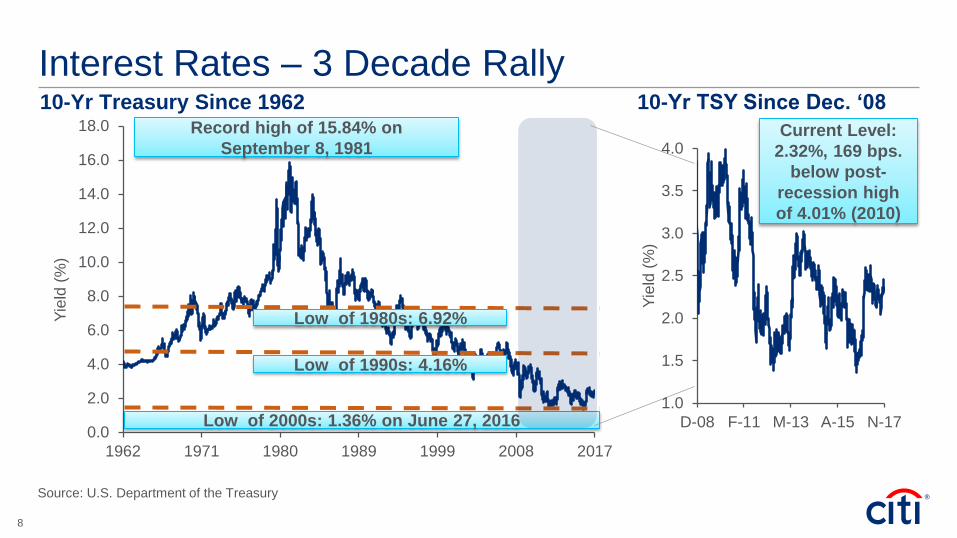
Interest Rates – 3 Decade Rally 10-Yr Treasury Since 1962
Low of 1980s: 6.92%
Low of 1990s: 4.16%
Low of 2000s: 1.36% on June 27, 2016
10-Yr TSY Since Dec. ‘08
Source: U.S. Department of the Treasury
1.0
1.5
2.0
2.5
3.0
3.5
4.0
D-08 F-11 M-13 A-15 N-17
Yie
ld (
%)
Record high of 15.84% on
September 8, 1981 Current Level:
2.32%, 169 bps.
below post-
recession high
of 4.01% (2010)
8
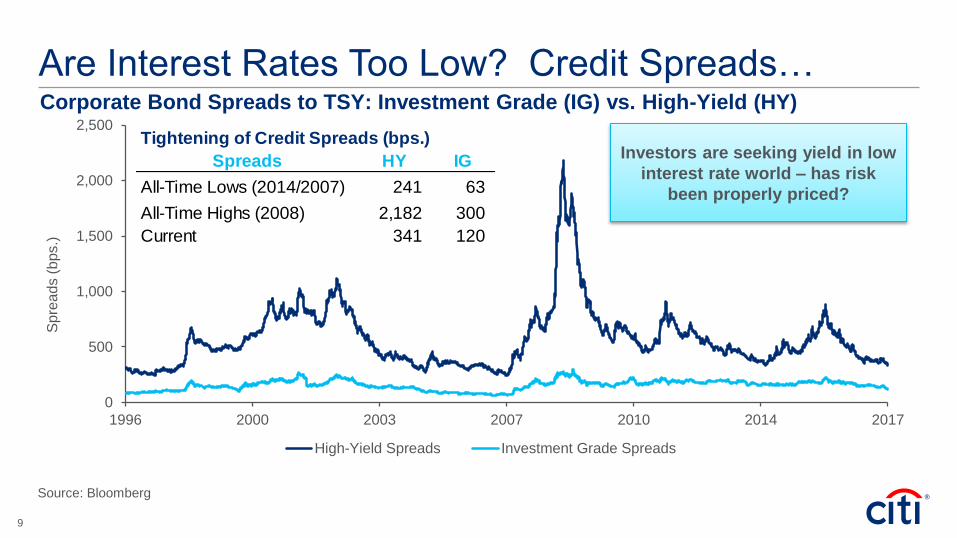
Are Interest Rates Too Low? Credit Spreads… Corporate Bond Spreads to TSY: Investment Grade (IG) vs. High-Yield (HY)
Source: Bloomberg
Investors are seeking yield in low
interest rate world – has risk
been properly priced?
Tightening of Credit Spreads (bps.)
Spreads HY IG
All-Time Lows (2014/2007) 241 63
All-Time Highs (2008) 2,182 300
Current 341 120
0
500
1,000
1,500
2,000
2,500
1996 2000 2003 2007 2010 2014 2017
Sp
rea
ds (
bps.)
High-Yield Spreads Investment Grade Spreads
9
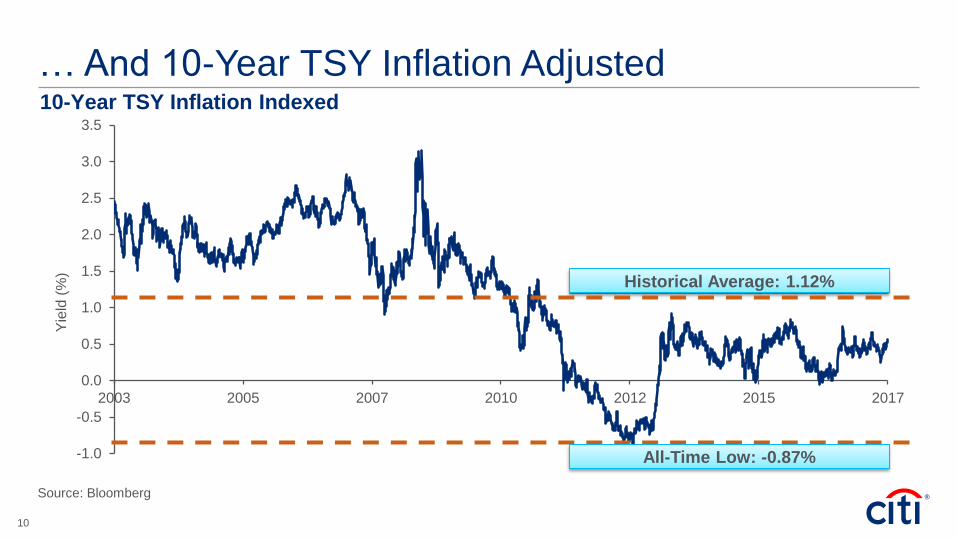
… And 10-Year TSY Inflation Adjusted 10-Year TSY Inflation Indexed
-1.0
-0.5
0.0
0.5
1.0
1.5
2.0
2.5
3.0
3.5
2003 2005 2007 2010 2012 2015 2017
Yie
ld (
%)
Source: Bloomberg
Historical Average: 1.12%
All-Time Low: -0.87%
10
1.25
1.75
2.25
2.75
3.25
Jan-15 Sep-15 May-16 Jan-17 Sep-17 May-18 Jan-19
Yie
ld (
%)
10-Year UST UST Street Consensus UST Citi Forecast
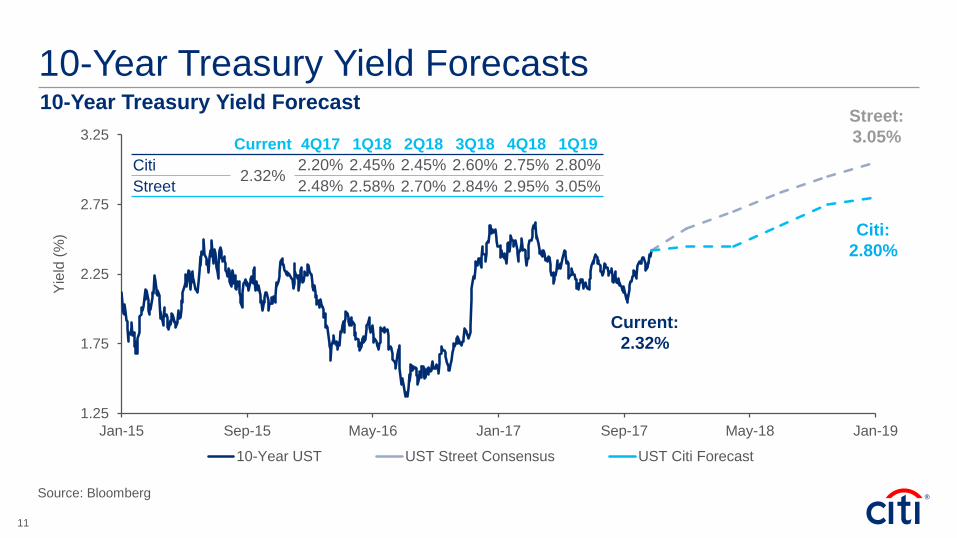
10-Year Treasury Yield Forecasts 10-Year Treasury Yield Forecast
Current 4Q17 1Q18 2Q18 3Q18 4Q18 1Q19
Citi 2.32%
2.20% 2.45% 2.45% 2.60% 2.75% 2.80%
Street 2.48% 2.58% 2.70% 2.84% 2.95% 3.05%
Street:
3.05%
Citi:
2.80%
Current:
2.32%
Source: Bloomberg
11
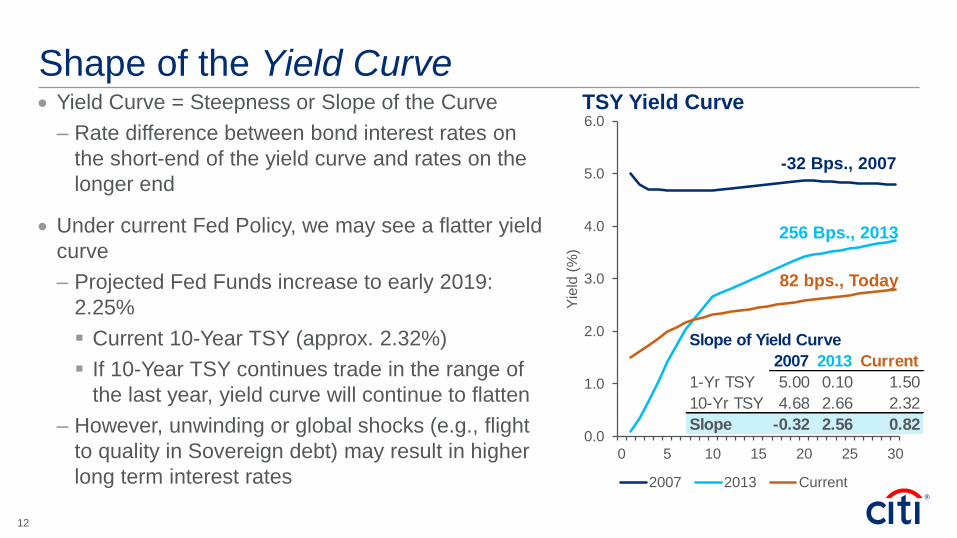
Shape of the Yield Curve Yield Curve = Steepness or Slope of the Curve
– Rate difference between bond interest rates on
the short-end of the yield curve and rates on the
longer end
Under current Fed Policy, we may see a flatter yield
curve
– Projected Fed Funds increase to early 2019:
2.25%
Current 10-Year TSY (approx. 2.32%)
If 10-Year TSY continues trade in the range of
the last year, yield curve will continue to flatten
– However, unwinding or global shocks (e.g., flight
to quality in Sovereign debt) may result in higher
long term interest rates
TSY Yield Curve
0.0
1.0
2.0
3.0
4.0
5.0
6.0
0 5 10 15 20 25 30
Yie
ld (
%)
2007 2013 Current
-32 Bps., 2007
256 Bps., 2013
82 bps., Today
Slope of Yield Curve
2007 2013 Current
1-Yr TSY 5.00 0.10 1.50
10-Yr TSY 4.68 2.66 2.32
Slope -0.32 2.56 0.82
12
-50
0
50
100
150
200
250
300
350
1986 1991 1995 2000 2005 2009 2014 2019
Spre
ad (
Bps.)
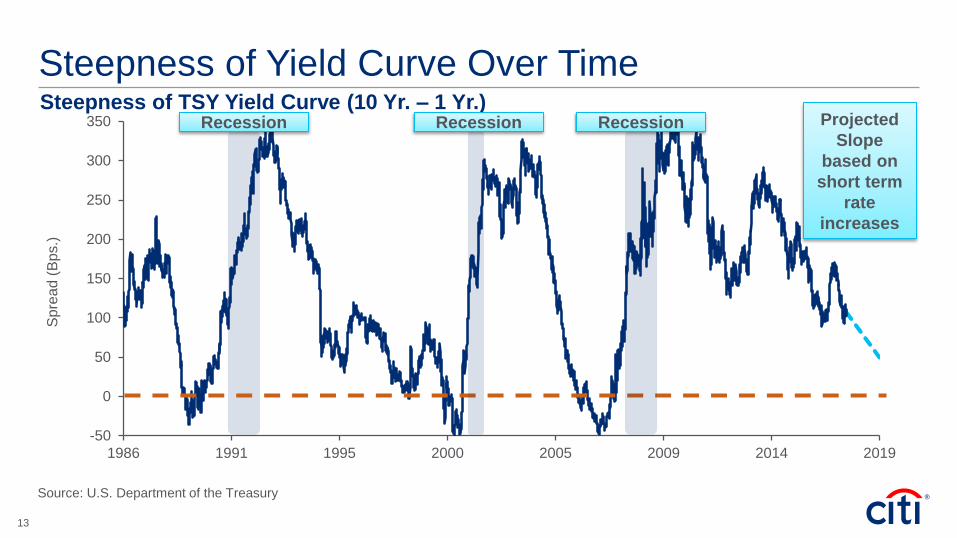
Steepness of Yield Curve Over Time Steepness of TSY Yield Curve (10 Yr. – 1 Yr.)
Source: U.S. Department of the Treasury
Recession Recession Recession Projected
Slope
based on
short term
rate
increases
13
Policy Decisions: Fed Decisions and Potential
Tax Reform
14
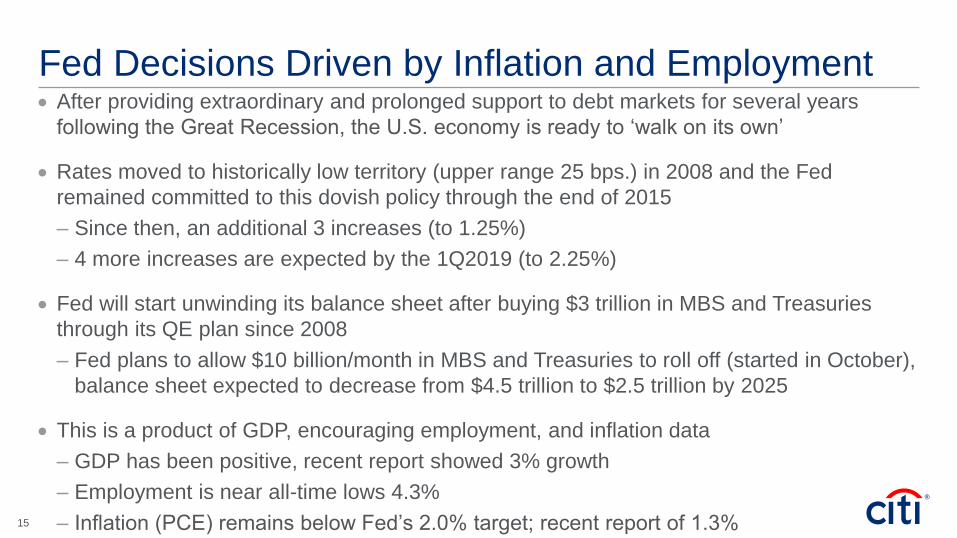
Fed Decisions Driven by Inflation and Employment After providing extraordinary and prolonged support to debt markets for several years
following the Great Recession, the U.S. economy is ready to ‘walk on its own’
Rates moved to historically low territory (upper range 25 bps.) in 2008 and the Fed
remained committed to this dovish policy through the end of 2015
– Since then, an additional 3 increases (to 1.25%)
– 4 more increases are expected by the 1Q2019 (to 2.25%)
Fed will start unwinding its balance sheet after buying $3 trillion in MBS and Treasuries
through its QE plan since 2008
– Fed plans to allow $10 billion/month in MBS and Treasuries to roll off (started in October),
balance sheet expected to decrease from $4.5 trillion to $2.5 trillion by 2025
This is a product of GDP, encouraging employment, and inflation data
– GDP has been positive, recent report showed 3% growth
– Employment is near all-time lows 4.3%
– Inflation (PCE) remains below Fed’s 2.0% target; recent report of 1.3%
15
2.0
4.0
6.0
8.0
10.0
12.0
86 92 98 04 11 17
Un
em
plo
ym
ent R
ate
(%
)
Ohio United States
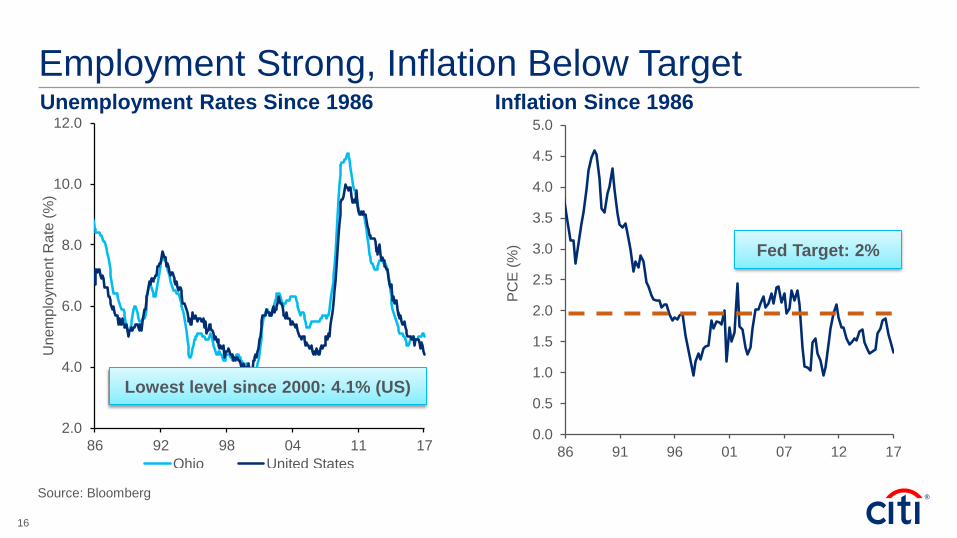
Employment Strong, Inflation Below Target Unemployment Rates Since 1986 Inflation Since 1986
0.0
0.5
1.0
1.5
2.0
2.5
3.0
3.5
4.0
4.5
5.0
86 91 96 01 07 12 17
PC
E (
%) Fed Target: 2%
Lowest level since 2000: 4.1% (US)
Source: Bloomberg
16
0
5
10
15
20
1962 1971 1980 1989 1999 2008 2017
Yie
ld (
%)
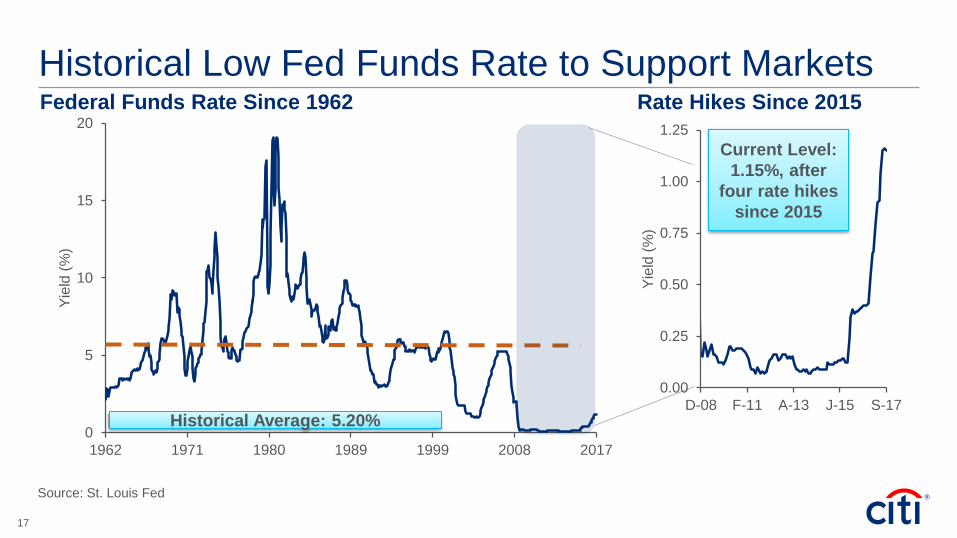
Historical Low Fed Funds Rate to Support Markets Federal Funds Rate Since 1962
Historical Average: 5.20%
Rate Hikes Since 2015
Source: St. Louis Fed
0.00
0.25
0.50
0.75
1.00
1.25
D-08 F-11 A-13 J-15 S-17
Yie
ld (
%)
Current Level:
1.15%, after
four rate hikes
since 2015
17
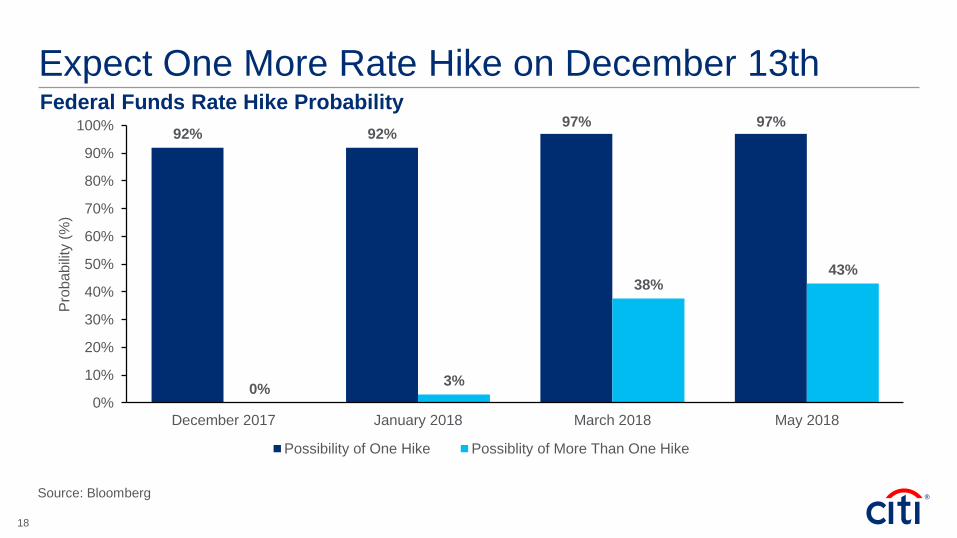
92% 92%97% 97%
0%3%
38%43%
0%
10%
20%
30%
40%
50%
60%
70%
80%
90%
100%
December 2017 January 2018 March 2018 May 2018
Pro
ba
bili
ty (
%)
Possibility of One Hike Possiblity of More Than One Hike
Expect One More Rate Hike on December 13th Federal Funds Rate Hike Probability
Source: Bloomberg
18
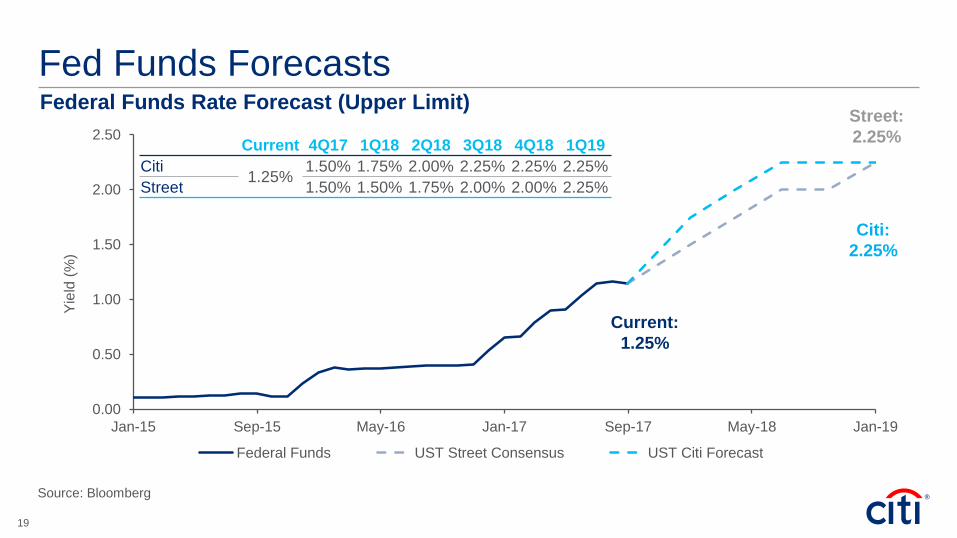
Fed Funds Forecasts Federal Funds Rate Forecast (Upper Limit)
Street:
2.25%
Citi:
2.25%
Current:
1.25%
Current 4Q17 1Q18 2Q18 3Q18 4Q18 1Q19
Citi 1.25%
1.50% 1.75% 2.00% 2.25% 2.25% 2.25%
Street 1.50% 1.50% 1.75% 2.00% 2.00% 2.25%
Source: Bloomberg
0.00
0.50
1.00
1.50
2.00
2.50
Jan-15 Sep-15 May-16 Jan-17 Sep-17 May-18 Jan-19
Yie
ld (
%)
Federal Funds UST Street Consensus UST Citi Forecast
19

0.0
0.5
1.0
1.5
2.0
2.5
3.0
3.5
4.0
4.5
5.0
Trilli
on
s (
$)
Traditional Security Holdings Long Term Treasury Purchases
Lending to Financial Institutions Liquidity to Key Credit Markets
Fed Agency Debt Mortgage-Backed Securities Purch
“Quantitative Easing” – Unwinding Commences
Rise and
Plateau of
Balance
Sheet
Projected
Balance
Sheet
Decline
20
Tax Reform
The Administration is working with Republican Congress to “fix a broken tax code”
Goals of Tax Reform: Provide tax relief, Simplification, Increase International
Competitiveness, Stimulate the Economy
– Aiming for long-term economic growth target of 5% (GDP)
On November 2nd, the House Republican leaders released the Tax Cuts and Jobs Act
Plan estimates a reduction of $2 Trillion in tax revenues over next 10 years
– Budget shortfalls will ensue unless spending cuts - or projected 5% growth?
The timing still unclear; but there is a possibility this is passed by the end of 2017
21
Key Changes in the Tax Cuts and Jobs Act
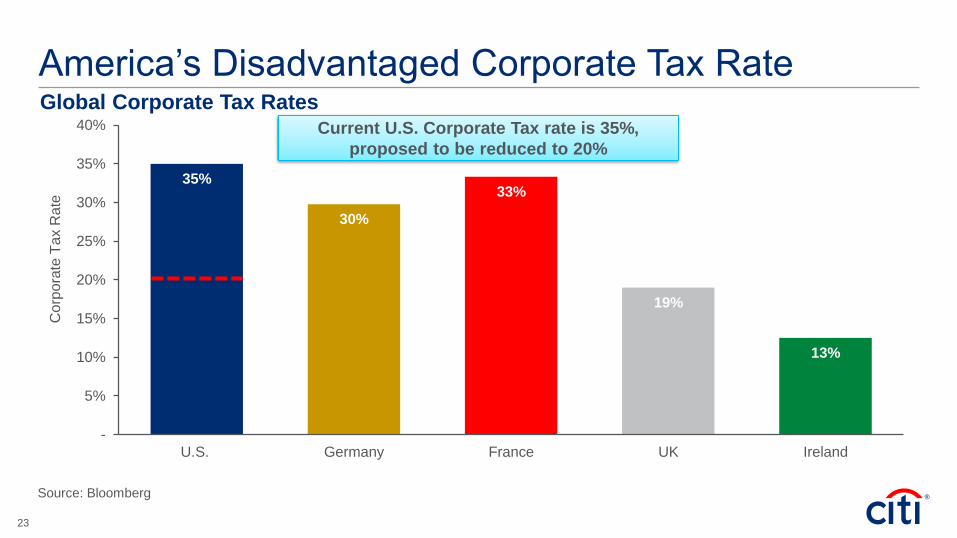
Reduces Corporate Taxes (from 35% to 20%) (but closes loopholes)
Reduce number of tax brackets for individuals from 7 to 4 (12%, 25%, 35% and 39.6%)
Increases the standard deduction
Repeal of Alternative Minimum Tax
Repeal Estate Tax
Modifies the mortgage interest deduction (limits to $500,000 on new purchases)
Eliminate State and Local Tax (“SALT”) deduction
Repatriate Corporate earnings made abroad
Additional changes directly impacting municipals and affordable housing as detailed below
22
35%
30%
33%
19%
13%
-
5%
10%
15%
20%
25%
30%
35%
40%
U.S. Germany France UK Ireland
Co
rpo
rate
Ta
x R
ate
America’s Disadvantaged Corporate Tax Rate
Current U.S. Corporate Tax rate is 35%,
proposed to be reduced to 20%
Global Corporate Tax Rates
Source: Bloomberg
23
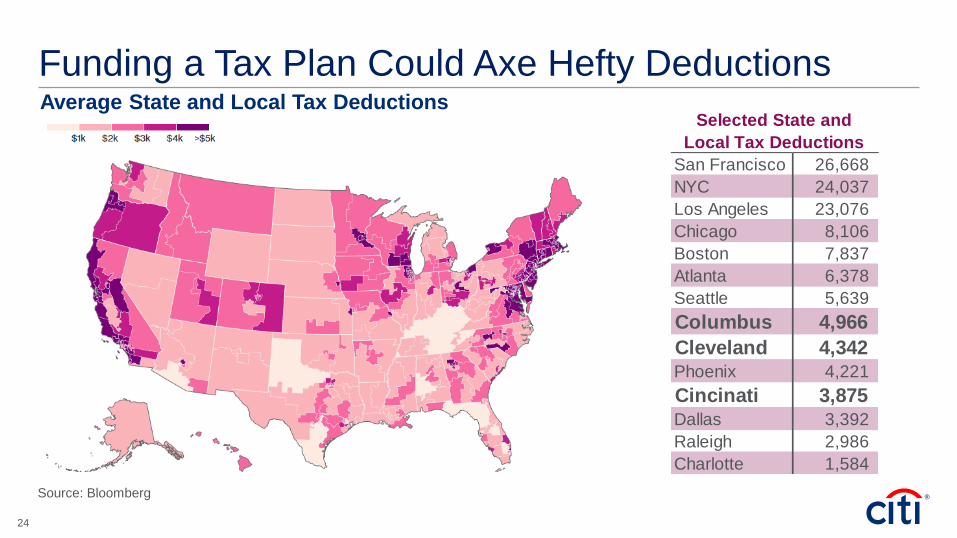
Funding a Tax Plan Could Axe Hefty Deductions Average State and Local Tax Deductions
Source: Bloomberg
San Francisco 26,668
NYC 24,037
Los Angeles 23,076
Chicago 8,106
Boston 7,837
Atlanta 6,378
Seattle 5,639
Columbus 4,966
Cleveland 4,342 Phoenix 4,221
Cincinati 3,875 Dallas 3,392
Raleigh 2,986
Charlotte 1,584
Selected State and
Local Tax Deductions
24
Proposed tax reform, if passed in current form, will significantly affect HFAs ability to
finance affordable housing using traditional methods
HR.1 eliminates tax-exemption on Private Activity Bonds (“PAB”) which includes
– Single-family housing in support of First Time Homebuyers
– Multifamily housing bond debt (generally in association with 4% LIHTC Credits)
Repeals Mortgage Credit Certificates (“MCC”)
Will not cause any direct changes to Housing Credit
– However, more than half of the annual affordable Rental Housing production would be
lost with the elimination of PABs and the effectiveness of 4% LIHTC Credits
Potential Tax Reform Effects on Affordable Housing
Source: NCSHA
25

Housing: Rise in Home Prices and Affordability
Concerns
26
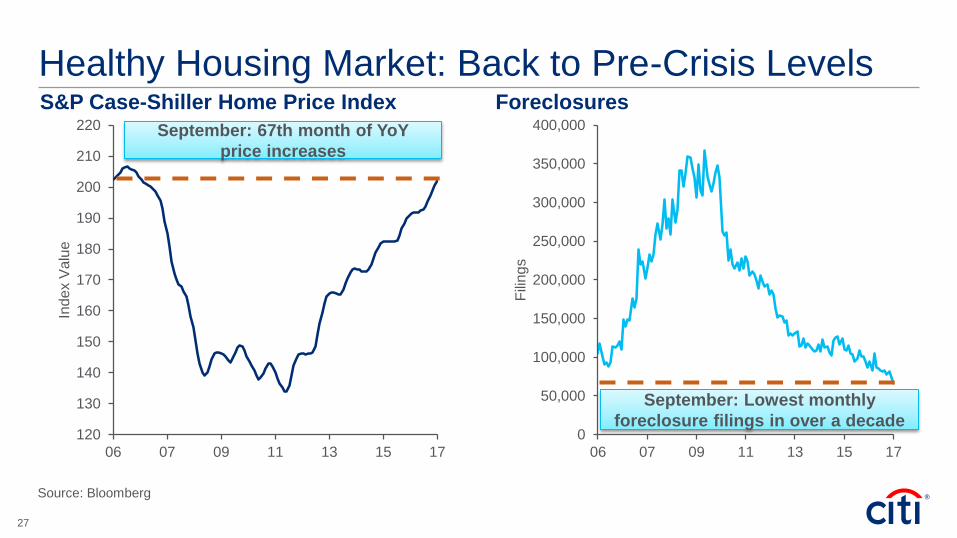
Healthy Housing Market: Back to Pre-Crisis Levels S&P Case-Shiller Home Price Index Foreclosures
120
130
140
150
160
170
180
190
200
210
220
06 07 09 11 13 15 17
Inde
x V
alu
e
September: 67th month of YoY
price increases
0
50,000
100,000
150,000
200,000
250,000
300,000
350,000
400,000
06 07 09 11 13 15 17
Fili
ng
s
September: Lowest monthly
foreclosure filings in over a decade
Source: Bloomberg
27
0
50
100
150
200
250
300
1986 1992 1998 2004 2011 2017
Ho
usin
g P
rice
In
de
x
Ohio United States
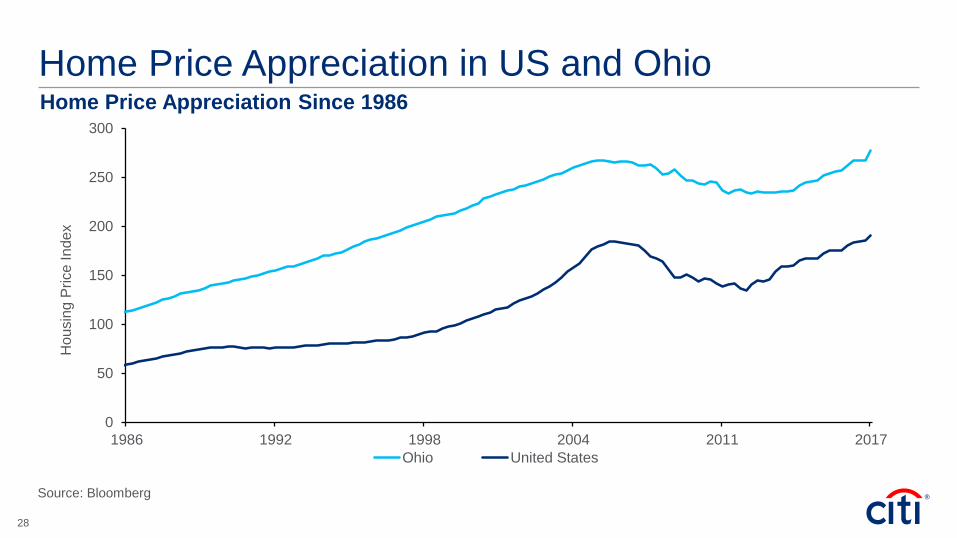
Home Price Appreciation in US and Ohio Home Price Appreciation Since 1986
Source: Bloomberg
28
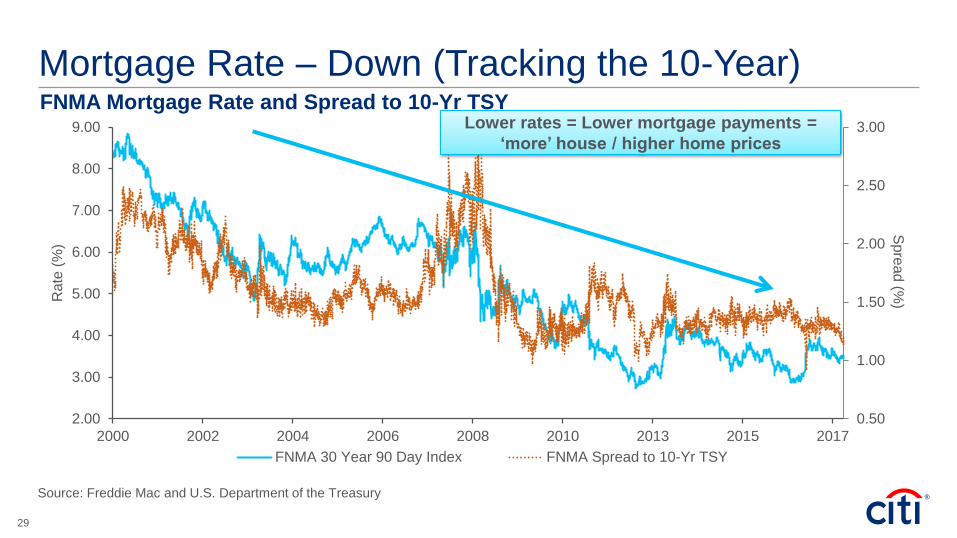
Mortgage Rate – Down (Tracking the 10-Year) FNMA Mortgage Rate and Spread to 10-Yr TSY
0.50
1.00
1.50
2.00
2.50
3.00
2.00
3.00
4.00
5.00
6.00
7.00
8.00
9.00
2000 2002 2004 2006 2008 2010 2013 2015 2017
Sp
rea
d (%
)Ra
te (
%)
FNMA 30 Year 90 Day Index FNMA Spread to 10-Yr TSY
Lower rates = Lower mortgage payments =
‘more’ house / higher home prices
Source: Freddie Mac and U.S. Department of the Treasury
29
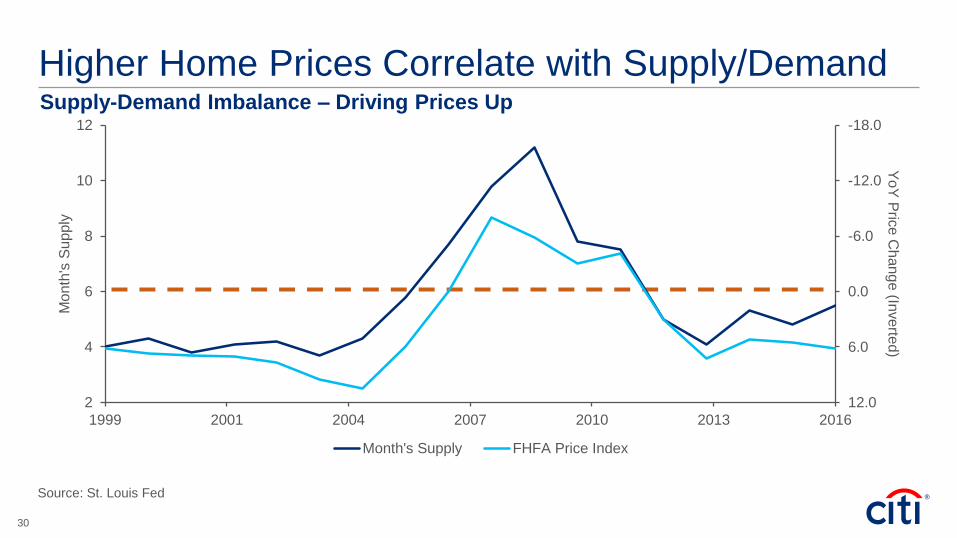
Higher Home Prices Correlate with Supply/Demand Supply-Demand Imbalance – Driving Prices Up
Source: St. Louis Fed
-18.0
-12.0
-6.0
0.0
6.0
12.02
4
6
8
10
12
1999 2001 2004 2007 2010 2013 2016
Yo
Y P
rice
Ch
an
ge
(Inve
rted)
Mo
nth
's S
upp
ly
Month's Supply FHFA Price Index
30
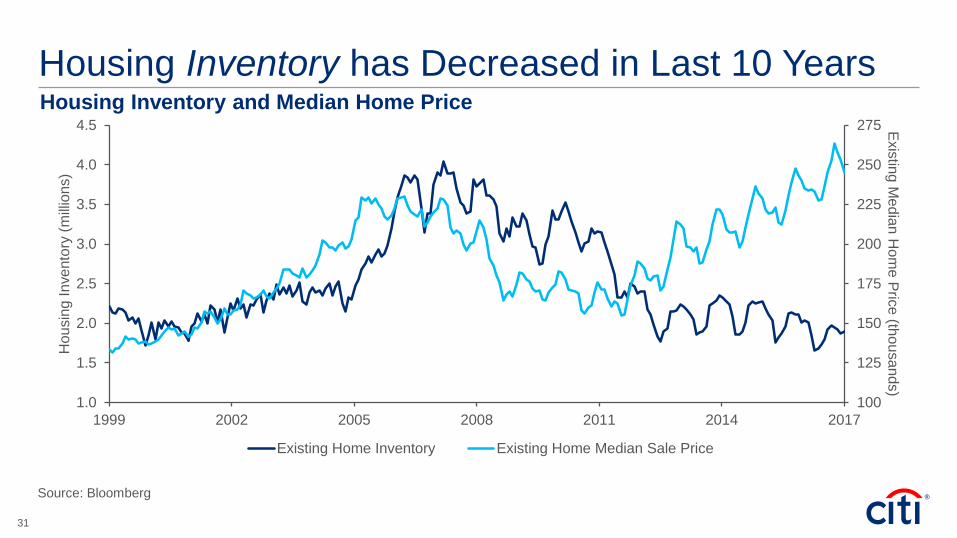
Housing Inventory has Decreased in Last 10 Years Housing Inventory and Median Home Price
100
125
150
175
200
225
250
275
1.0
1.5
2.0
2.5
3.0
3.5
4.0
4.5
1999 2002 2005 2008 2011 2014 2017
Exis
ting
Me
dia
n H
om
e P
rice
(thou
san
ds)
Hou
sin
g In
ve
nto
ry (
mill
ions)
Existing Home Inventory Existing Home Median Sale Price
Source: Bloomberg
31
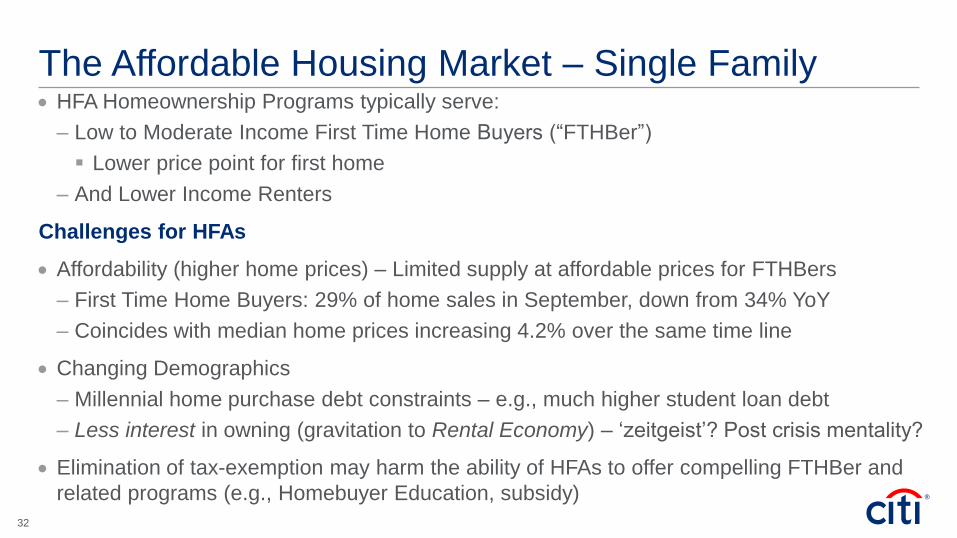
HFA Homeownership Programs typically serve:
– Low to Moderate Income First Time Home Buyers (“FTHBer”)
Lower price point for first home
– And Lower Income Renters
Challenges for HFAs
Affordability (higher home prices) – Limited supply at affordable prices for FTHBers
– First Time Home Buyers: 29% of home sales in September, down from 34% YoY
– Coincides with median home prices increasing 4.2% over the same time line
Changing Demographics
– Millennial home purchase debt constraints – e.g., much higher student loan debt
– Less interest in owning (gravitation to Rental Economy) – ‘zeitgeist’? Post crisis mentality?
Elimination of tax-exemption may harm the ability of HFAs to offer compelling FTHBer and
related programs (e.g., Homebuyer Education, subsidy)
The Affordable Housing Market – Single Family
32
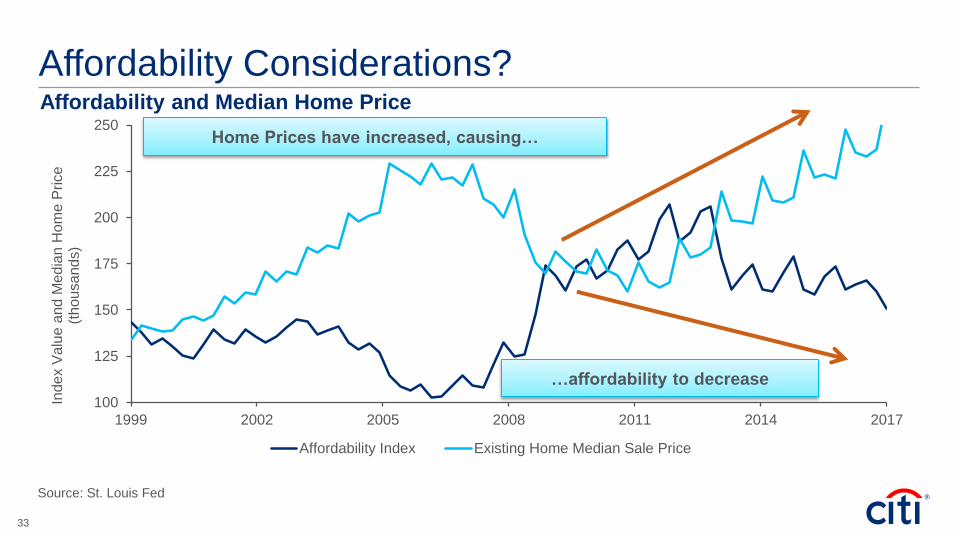
Affordability Considerations? Affordability and Median Home Price
100
125
150
175
200
225
250
1999 2002 2005 2008 2011 2014 2017
Inde
x V
alu
e a
nd
Me
dia
n H
om
e P
rice
(t
hou
san
ds)
Affordability Index Existing Home Median Sale Price
…affordability to decrease
Home Prices have increased, causing…
Source: St. Louis Fed
33
62
63
64
65
66
67
68
69
70
30
31
32
33
34
35
36
37
38
39
40
41
42
43
44
45
2000 2003 2005 2008 2011 2014 2017
Ho
me
ow
ners
hip
Rate
(%)
Re
nta
l O
ccu
pie
d U
nits (
mill
ions)
Rental Occupied Units Homeownership Rate
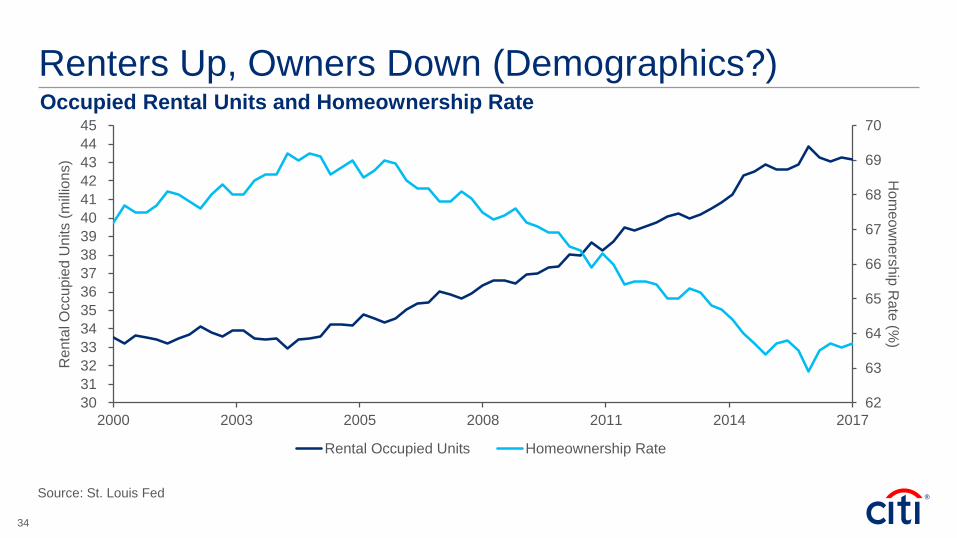
Renters Up, Owners Down (Demographics?) Occupied Rental Units and Homeownership Rate
Source: St. Louis Fed
34
Roaring markets and ever higher prices tend to introduce risk
In today’s markets, this may be more true at lower income registers / affordable housing
– Higher prices imply greater leverage – higher LTVs (loan-to-value)
– And higher DTI (debt-to-income) ratios – wages have been stagnant for a number of
years
Full documentation and 30-year fixed is the norm
– No Subprime, Alt-A, etc. in current market
– Higher credit scores are also the norm post crisis
Risk Factors: Leverage (Income/Loan Size) & Credit
35
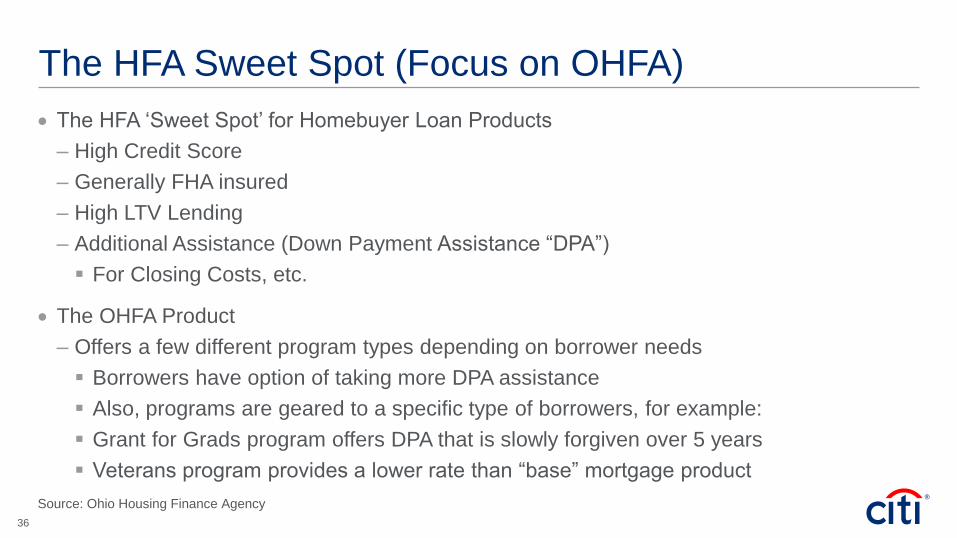
The HFA ‘Sweet Spot’ for Homebuyer Loan Products
– High Credit Score
– Generally FHA insured
– High LTV Lending
– Additional Assistance (Down Payment Assistance “DPA”)
For Closing Costs, etc.
The OHFA Product
– Offers a few different program types depending on borrower needs
Borrowers have option of taking more DPA assistance
Also, programs are geared to a specific type of borrowers, for example:
Grant for Grads program offers DPA that is slowly forgiven over 5 years
Veterans program provides a lower rate than “base” mortgage product
The HFA Sweet Spot (Focus on OHFA)
Source: Ohio Housing Finance Agency
36
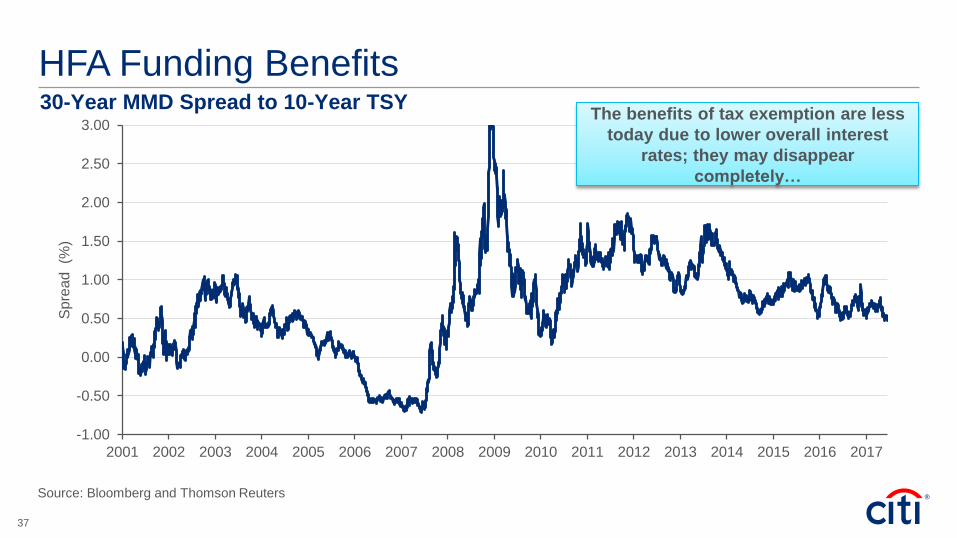
HFA Funding Benefits
-1.00
-0.50
0.00
0.50
1.00
1.50
2.00
2.50
3.00
2001 2002 2003 2004 2005 2006 2007 2008 2009 2010 2011 2012 2013 2014 2015 2016 2017
Sp
rea
d (%
)
30-Year MMD Spread to 10-Year TSY
Source: Bloomberg and Thomson Reuters
The benefits of tax exemption are less
today due to lower overall interest
rates; they may disappear
completely…
37

As mentioned above, since the recession there has been a significant decrease in
homeownership and an increase in occupied rental units
– Homeownership has declined 69% to 63.5%
– Occupied rental units have increased from 34 million to 43 million
National Vacancy rate has fallen to 7.3% from 11.1% in 2009
– Demand for rental units has caused rents to increase
Rents as a percentage of income are at a historic high of 29.1%, compared to average rate
of 25.8% from 1985 to 2000
– Most new buildings tend to be too expensive for most renters – luxury development is
more profitable for developers
With the demise of PABs…
– Housing bonds are a partner to the Housing Credit
– 4% Credits with Tax-Exempt Bonds constitute over 50% of rental housing production
under the Low Income Housing Tax Credit program
The Rental Affordable Housing Market
38
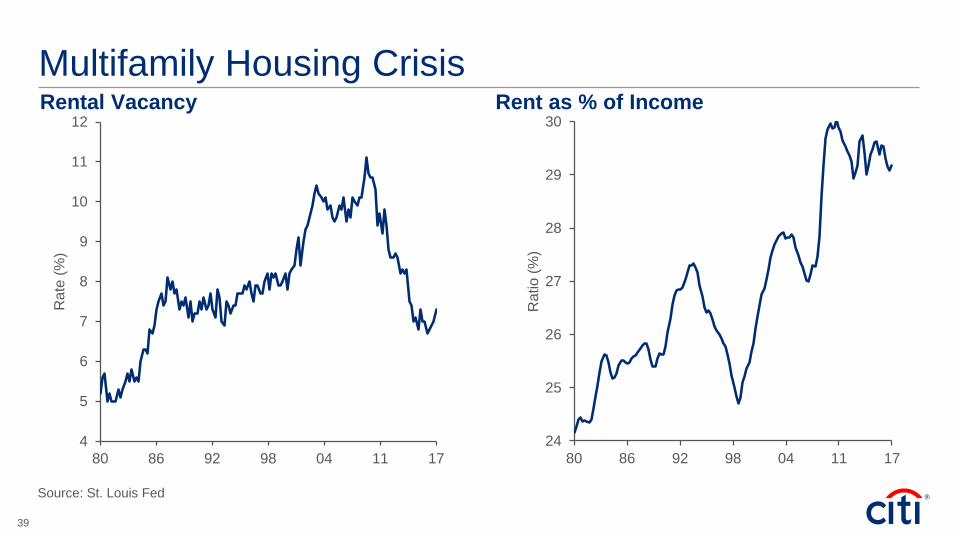
Multifamily Housing Crisis Rental Vacancy Rent as % of Income
4
5
6
7
8
9
10
11
12
80 86 92 98 04 11 17
Rate
(%
)
Source: St. Louis Fed
24
25
26
27
28
29
30
80 86 92 98 04 11 17
Ra
tio (
%)
39
The economic expansion continues to run
– To some extent it is picking up in pace
– Asset Prices may be high, but are they in bubble territory?
Pay attention to Fed Policy
– New Chair Powell is unlikely to differ significantly from Yellen’s approach
– Will strive to avoid any moves that jeopardize continued economic growth
Tax Code implementation and passage is a high priority of current administration
– Tax rate cuts of some sort seem certain
– Negotiations have a ways to go - nothing definitive yet
Healthy housing market by most indications
– Changing demographics and affordability concerns as price rise
Tax reform could have huge impact on the affordable housing market!
Some Takeaways
40
In any instance where distribution of this communication is subject to the rules of the US Commodity Futures Trading Commission (“CFTC”), this communication constitutes an invitation to consider entering into a derivatives transaction under U.S.
CFTC Regulations §§ 1.71 and 23.605, where applicable, but is not a binding offer to buy/sell any financial instrument. This presentation has been prepared by individual personnel of Citigroup Global Markets Inc., Citigroup Global Markets Limited or
their subsidiaries or affiliates (collectively, “Citi”). Such employees are not research analysts and are not subject to SEC or FSA rules designed to promote the independence of research and research analysts and accordingly may receive
compensation related to securities or products to which these materials relate. These materials may contain general market commentary and excerpts of research; however they are not intended to constitute investment research, a research
recommendation, research analysis or a research report for purposes of such rules. In connection with any proposed transaction, Citi will be acting solely as a principal and not as your agent, advisor, account manager or fiduciary. Citi has not
assumed a fiduciary responsibility with respect to the proposed transaction, and nothing in this or in any prior relationship between you and Citi will be deemed to create an advisory, fiduciary or agency relationship between us in respect of a
proposed transaction. You should consider carefully whether you would like to engage an independent advisor to represent or otherwise advise you in connection with any proposed transaction, if you have not already done so. Any terms set forth
herein are intended for discussion purposes only and are subject to the final terms as set forth in separate definitive written agreements. This presentation is not a commitment to lend, syndicate a financing, underwrite or purchase securities, or
commit capital nor does it obligate us to enter into such a commitment. By accepting this presentation, subject to applicable law or regulation, you agree to keep confidential the existence of and proposed terms for any contemplated transaction. The
provision of information in this presentation is not based on your individual circumstances and should not be relied upon as an assessment of suitability for you of a particular product or transaction. Even if Citi possesses information as to your
objectives in relation to any transaction, series of transactions or trading strategy, this will not be deemed sufficient for any assessment of suitability for you of any transaction, series of transactions or trading strategy. This presentation is provided for
information purposes and is intended for your use only. Except in those jurisdictions where it is impermissible to make such a statement, Citi hereby informs you that this presentation should not be considered as an offer to sell or the solicitation of an
offer to purchase any securities or other financial products. This presentation does not constitute investment advice and does not purport to identify all risks or material considerations which should be considered when undertaking a transaction. Citi
makes no recommendation as to the suitability of any of the products or transactions mentioned. Any trading or investment decisions you take are in reliance on your own analysis and judgment and/or that of your advisors and not in reliance on us.
Certain transactions, including those involving swaps and options, give rise to substantial risk including the potential loss of the principal amount invested, and are not suitable for all investors. Citi does not provide investment, accounting, tax,
financial or legal advice; however, you should be aware that any proposed indicative transaction could have accounting, tax, legal or other implications that should be discussed with your independent advisors. Therefore, prior to entering into any
transaction, you should determine, without reliance on Citi, the economic risks or merits, as well as the legal, tax and accounting characteristics and consequences of the transaction and that you are able to assume these risks. By acceptance of
these materials, you and Citi hereby agree that from the commencement of discussions with respect to any transaction, and notwithstanding any other provision in this presentation, Citi hereby confirms that no participant in any transaction shall be
limited from disclosing the U.S. tax treatment or U.S. tax structure of such transaction. This presentation is not intended to forecast or predict future events. Past performance is not a guarantee or indication of future results. Any estimates and
opinions included herein constitute Citi’s judgment as of the date hereof and are subject to change without any notice. This presentation may contain "forward-looking" information. Such information may include, but not be limited to, projections,
forecasts or estimates of cash flows, yields or return, scenario analyses and proposed or expected portfolio composition. Any forward-looking information is based upon certain assumptions about future events or conditions and is intended only to
illustrate hypothetical results under those assumptions (not all of which are specified herein or can be ascertained at this time). It does not represent actual termination or unwind prices that may be available to you. Actual events or conditions are
unlikely to be consistent with, and may differ significantly from, those assumed. Illustrative performance results may be based on mathematical models that calculate those results by using inputs that are based on assumptions about a variety of
future conditions and events and not all relevant events or conditions may have been considered in developing such assumptions. Accordingly, actual results may vary and the variations may be substantial. The products or securities identified in any
of the illustrative calculations presented herein may therefore not perform as described and actual performance may differ, and may differ substantially, from those illustrated in this material. When evaluating any forward looking information you
should understand the assumptions used and, together with your independent advisors, consider whether they are appropriate for your purposes. Any securities or other financial products described herein may be subject to fluctuations of their mark-
to market price or value. Such fluctuations may be substantial, depending on the type of securities or other financial products and the financial environment. In addition certain securities described in the presentation may provide for payments linked
to or derived from prices or yields of one or more securities or other instruments or foreign currencies, and such provisions may result in negative fluctuations in the value of and the amounts payable with respect to such securities prior to or at
redemption. You should consider the implication of such fluctuation with your independent accounting, tax and risk advisors. Citi shall have no liability to you, the user or to third parties, for the quality, accuracy, timeliness, continued availability or
completeness of the data nor for any special, direct, indirect, incidental or consequential loss or damage which may be experienced because of the use of the information in this presentation or otherwise arising in connection with this presentation,
provided that this exclusion of liability shall not exclude or limit any liability under any law or regulation applicable to Citi that may not be excluded or restricted. These materials are intended for distribution solely to customers of Citi in jurisdictions
where such distribution is permitted. The information contained herein is proprietary information of Citi and may not be reproduced or otherwise disseminated in whole or in part without Citi’s prior written consent. Citi often acts as (i) a market maker;
(ii) an issuer of financial instruments and other products; and (iii) trades as principal in many different financial instruments and other products, and can be expected to perform or seek to perform investment banking and other services for the issuer
of such financial instruments or other products. The author of this presentation may have discussed the information contained herein with others within or outside Citi and the author and/or such other Citi personnel may have already acted on the
basis of this information (including by trading for Citi's proprietary accounts or communicating the information contained herein to other customers of Citi). Citi, Citi's personnel (including those with whom the author may have consulted in the
preparation of this presentation), and other customers of Citi may be long or short the financial instruments or other products referred to in this presentation, may have acquired such positions at prices and market conditions that are no longer
available, and may have interests different from or adverse to your interests. Citi is required to obtain, verify and record certain information that identifies each entity that enters into a formal business relationship with Citi. Citi will ask for your
complete name, street address, and taxpayer ID number. Citi may also request corporate formation documents, or other forms of identification, to verify information provided. Although Citibank, N.A. (together with its subsidiaries and branches
worldwide, "Citibank") is an affiliate of Citi, you should be aware that none of the financial instruments or other products mentioned in this presentation (unless expressly stated otherwise) are (i) insured by the Federal Deposit Insurance Corporation
or any other governmental authority, or (ii) deposits or other obligations of, or guaranteed by, Citibank or any other insured depository institution.
IRS Circular 230 Disclosure: Citi and its employees are not in the business of providing, and do not provide, tax or legal advice to any taxpayer outside of Citi. Any statements in this presentation regarding tax matters were not intended or written to
be used, and cannot be used or relied upon, by any taxpayer for the purpose of avoiding tax penalties. Any such taxpayer should seek advice based on the taxpayer’s particular circumstances from an independent tax advisor.
© 2011 Citigroup Global Markets Inc. Member SIPC. All rights reserved. Citi and Arc Design are trademarks and service marks of Citigroup Inc. or its affiliates and are used and registered throughout the world.
Disclaimer

The Rosy Outlook and the
Dreary Reality
Robert Vogt Vogt Strategic Insights
November 8, 2017

Rental Housing is Emerging as The Haves and The Have Nots
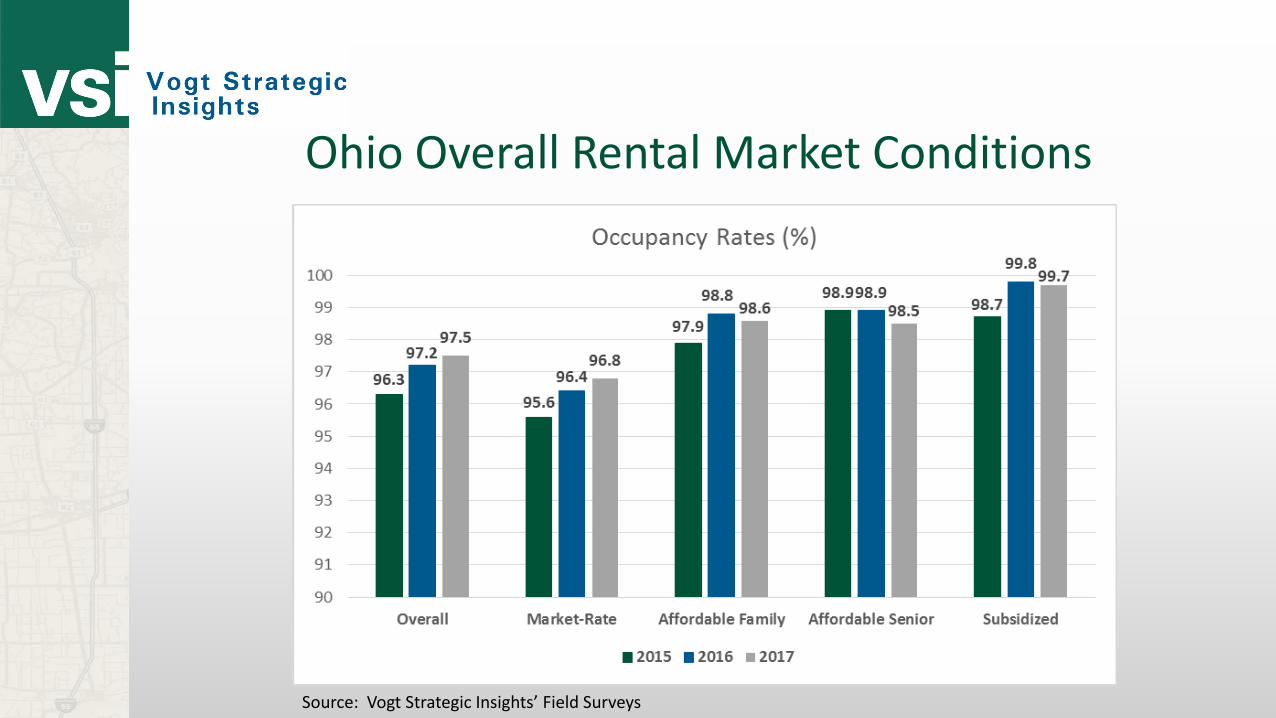
Ohio Overall Rental Market Conditions
Source: Vogt Strategic Insights’ Field Surveys
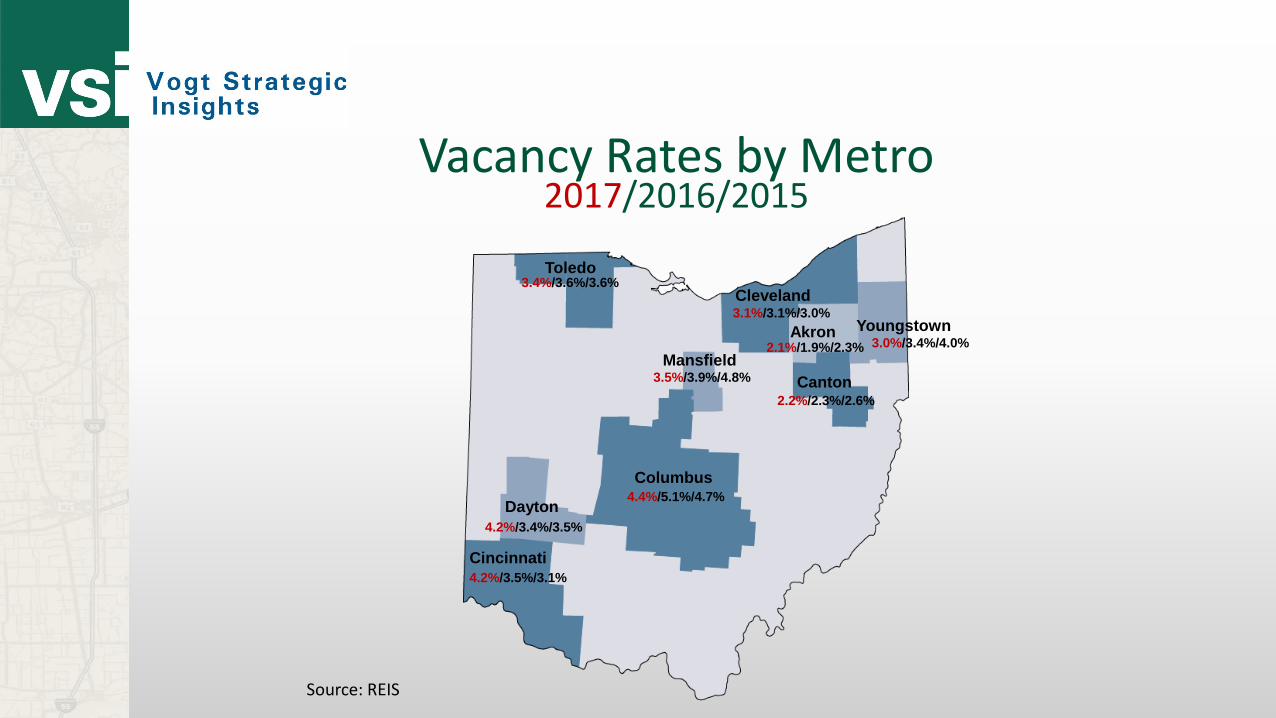
Vacancy Rates by Metro2017/2016/2015
4.4%/5.1%/4.7%
3.4%/3.6%/3.6%
4.2%/3.4%/3.5%
2.1%/1.9%/2.3% 3.0%/3.4%/4.0%
3.1%/3.1%/3.0%
4.2%/3.5%/3.1%
Akron
ToledoCleveland
Dayton
Columbus
Cincinnati
Youngstown
Source: REIS
Canton2.2%/2.3%/2.6%
Mansfield3.5%/3.9%/4.8%
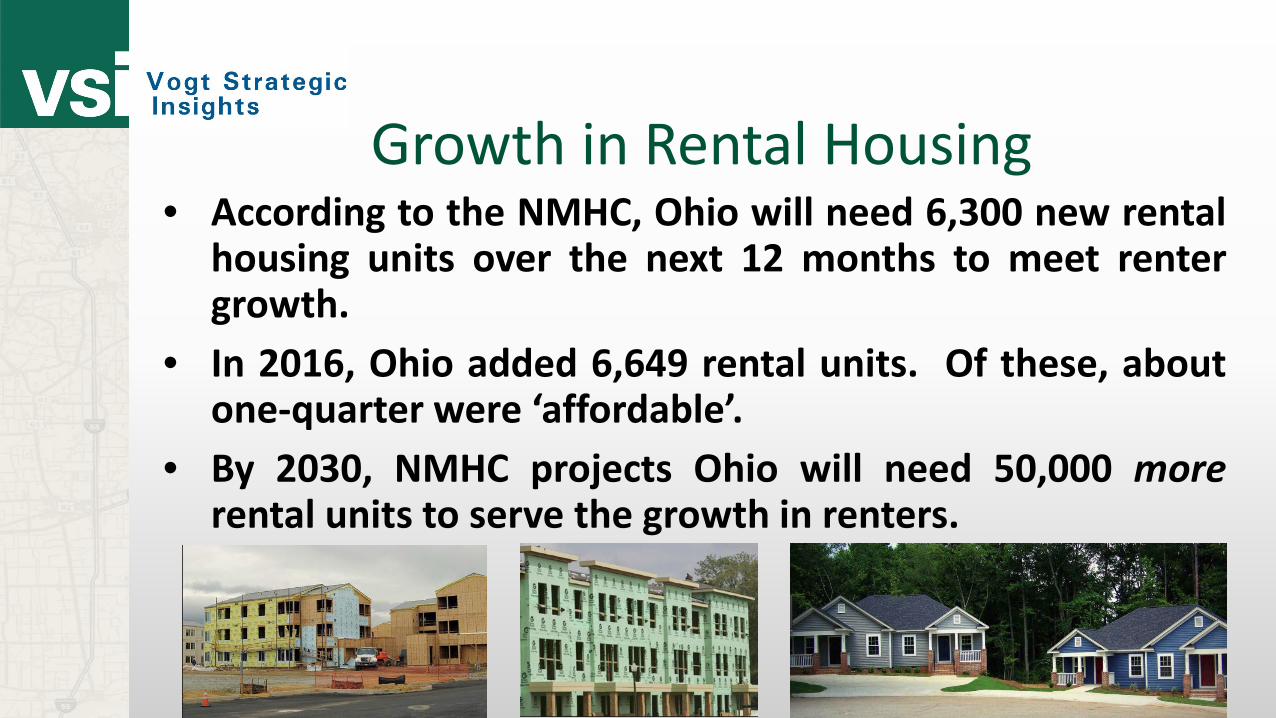
Growth in Rental Housing• According to the NMHC, Ohio will need 6,300 new rental
housing units over the next 12 months to meet rentergrowth.
• In 2016, Ohio added 6,649 rental units. Of these, aboutone-quarter were ‘affordable’.
• By 2030, NMHC projects Ohio will need 50,000 morerental units to serve the growth in renters.

The Fuel for Renter Growth• Households age 55+; accounted for 44% of renter
household growth 2005-2016.• Millennials. Delayed entry into home buying market,
marriages and kids.• Families with children; continuing fallout from the
recession.

And High Income HouseholdsHouseholds earning $100,000 or more accountednearly half (47%) of the growth in renters between2013 and 2016.
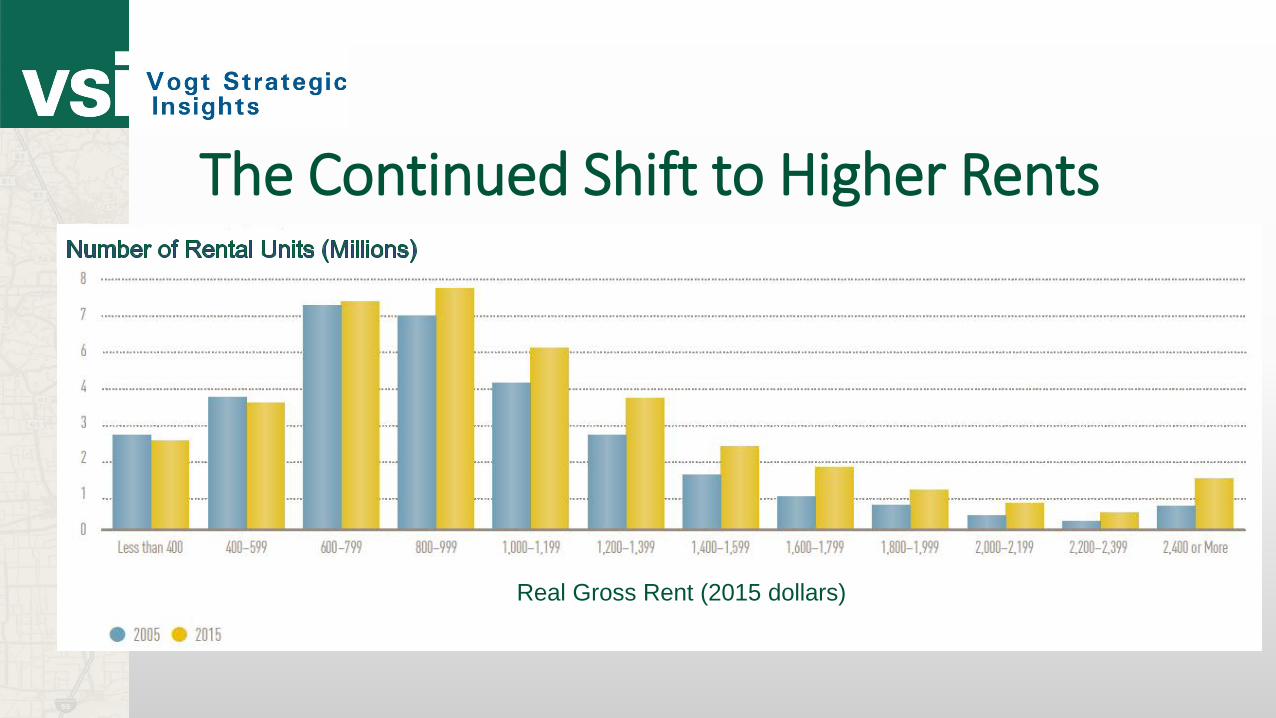
The Continued Shift to Higher Rents
Real Gross Rent (2015 dollars)
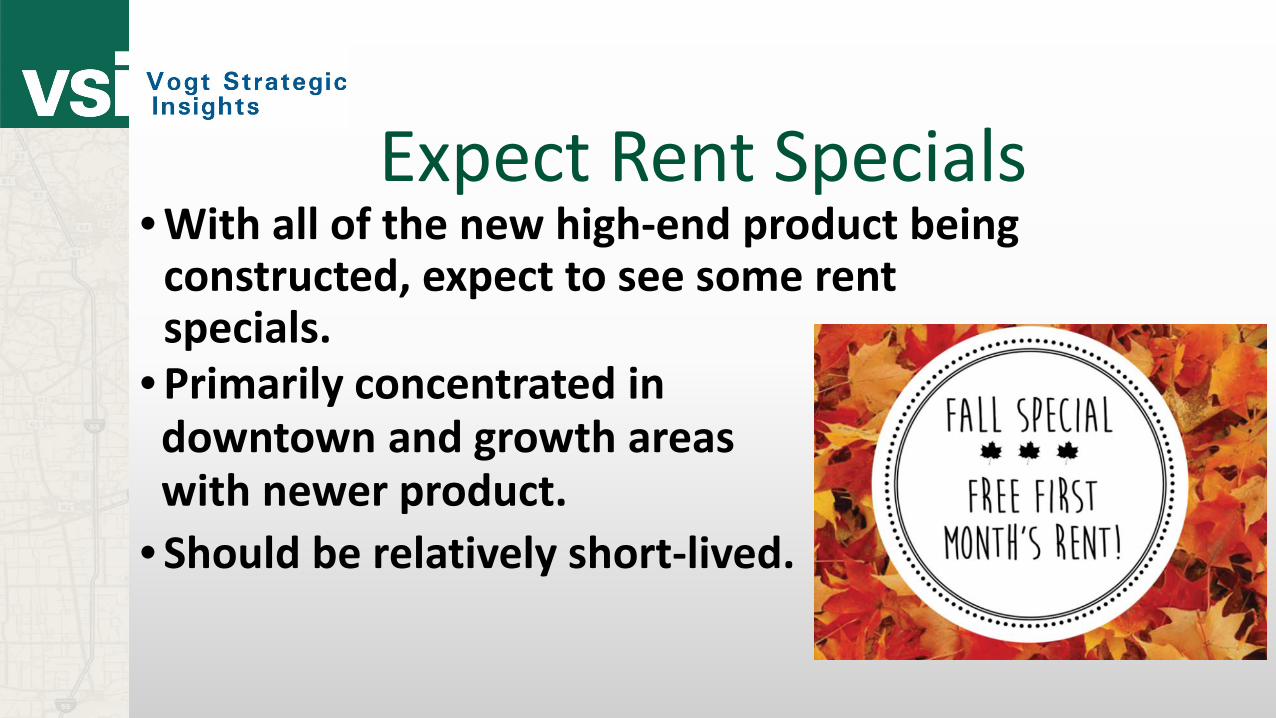
Expect Rent Specials• With all of the new high-end product being
constructed, expect to see some rent specials.
• Primarily concentrated in downtown and growth areas with newer product.
• Should be relatively short-lived.
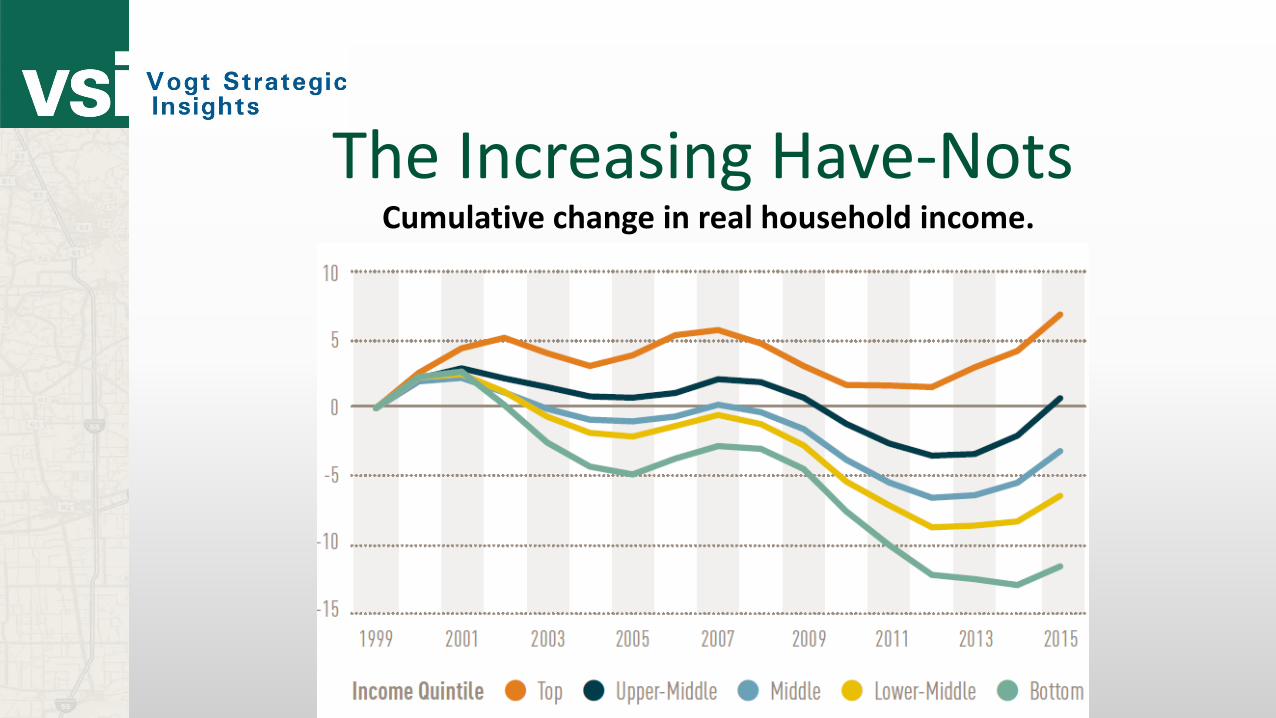
The Increasing Have-NotsCumulative change in real household income.
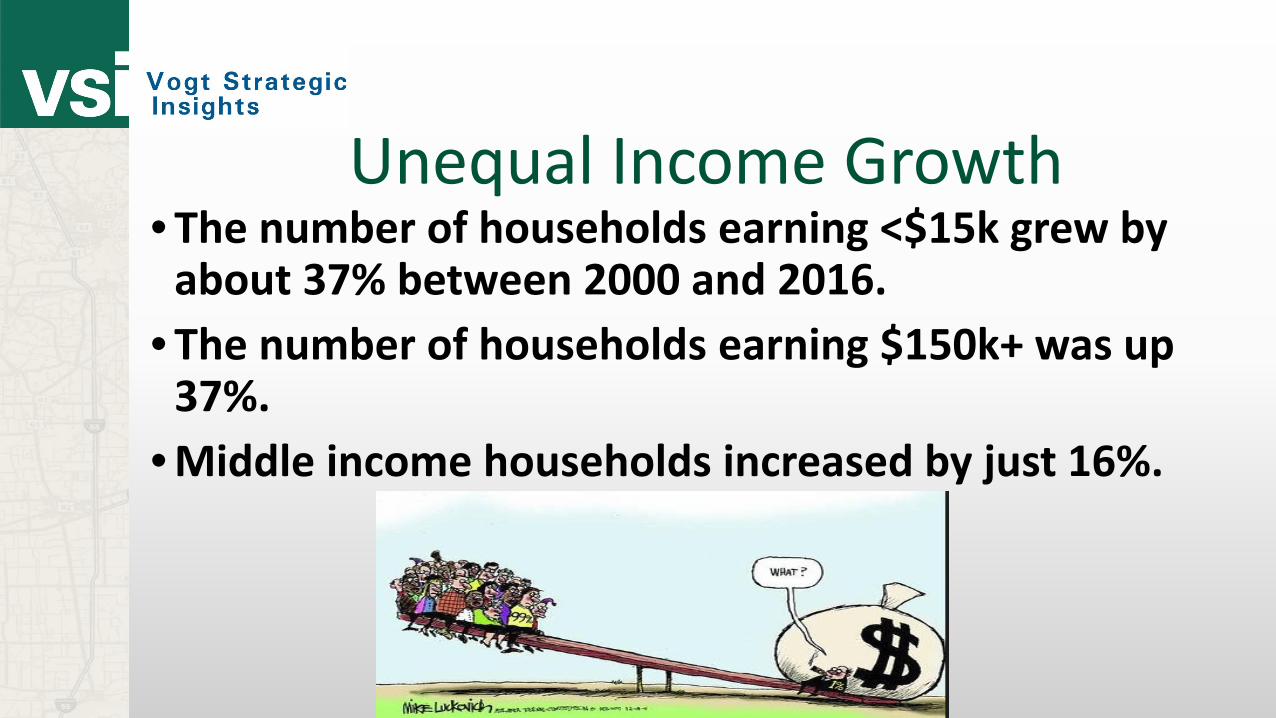
Unequal Income Growth• The number of households earning <$15k grew by
about 37% between 2000 and 2016.• The number of households earning $150k+ was up
37%.• Middle income households increased by just 16%.


The Housing Cost BurdenSh
are
of H
slds
. Pay
ing
50%
+
Household Income

The Numbers are Staggering• According to the NLIHC, Ohio has a current shortage
of over 260,000 rental units for those households earning at or below 30% of AMHI.
• For those below 50% AMHI, the shortage is over 170,000 units.
• Rents for B and C quality projects are increasing faster than A properties.
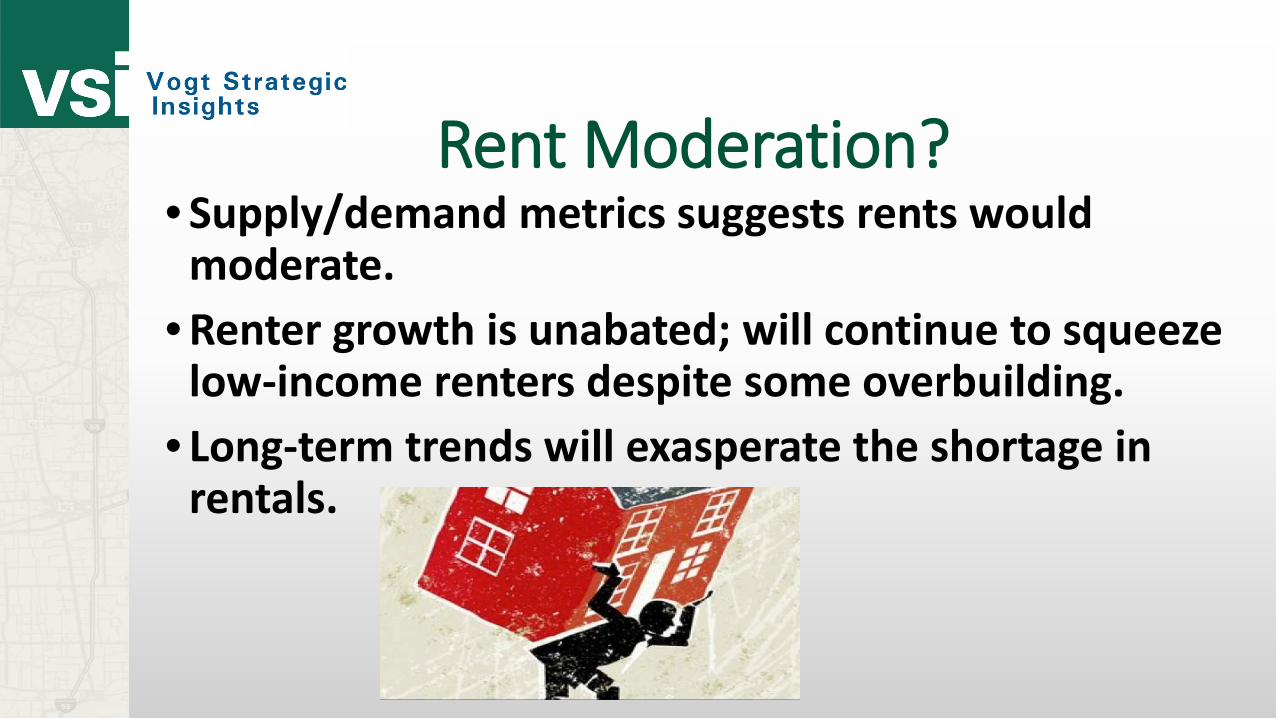
Rent Moderation?• Supply/demand metrics suggests rents would
moderate.• Renter growth is unabated; will continue to squeeze
low-income renters despite some overbuilding.• Long-term trends will exasperate the shortage in
rentals.
Strategies to Meet Demand• Adopt local public policies to make housing affordability
more feasible. • Increase public-private partnerships.• Leverage state-level authority to overcome obstacles to
apartment construction.• Collaborate with business and community leaders to
champion apartments.• Look at other housing resources; under utilized housing
exists in neighborhoods.
2018 Outlook• Overall, rental markets will remain well occupied
in Ohio.• Pockets of higher vacancies; rent specials.• Continued rent growth among lower quality
properties.• Increasing share of distressed renter households.• More senior households will transition to rent.

Related Documents