Strategic Planning Professorial Fellow of Edinburgh Business School, The Graduate School of Business, Heriot-Watt University, Alex Scott (MA, MSc, PhD) is an economist and has published over thirty research papers into efficiency in education, efficient use of energy, energy and the environment and the cost to the taxpayer of government industrial aid programmes. He is a pioneer in developing and carrying out research into new educational techniques, particularly in the field of business simulations. Professor Scott’s executive teaching includes running strategic planning sessions for groups of senior managers, widening the perspectives of functional managers, and teaching financial specialists the principles of how economies function in today’s highly complex and interdependent world. Among the companies for which he has run man- agement programmes are American Express, British Rail, British Telecom, Cathay Pacific, Fiskars, Hewlett-Packard, National Health Service, ScottishPower, Scottish Widows, Swiss Bank Corporation. Release SP-A1.3 ISBN 0 273 60924 6

Welcome message from author
This document is posted to help you gain knowledge. Please leave a comment to let me know what you think about it! Share it to your friends and learn new things together.
Transcript
StrategicPlanning
Professorial Fellow of Edinburgh Business School, The Graduate School of Business,Heriot-Watt University, Alex Scott (MA, MSc, PhD) is an economist and has published overthirty research papers into efficiency in education, efficient use of energy, energy andthe environment and the cost to the taxpayer of government industrial aid programmes.He is a pioneer in developing and carrying out research into new educational techniques,particularly in the field of business simulations.
Professor Scott’s executive teaching includes running strategic planning sessions forgroups of senior managers, widening the perspectives of functional managers, andteaching financial specialists the principles of how economies function in today’s highlycomplex and interdependent world. Among the companies for which he has run man-agement programmes are American Express, British Rail, British Telecom, Cathay Pacific,Fiskars, Hewlett-Packard, National Health Service, ScottishPower, Scottish Widows, SwissBank Corporation.
Release SP-A1.3
ISBN 0 273 60924 6

HERIOT-WATT UNIVERSITY
StrategicPlanning
Professor Alex Scott MA, MSc, Phd
Edinburgh Gate, Harlow, Essex CM20 2JE, United KingdomTel: +44 (0) 1279 623112Fax: +44 (0) 1279 623223
Pearson Education website: www.pearsoned-ema.com
A Pearson company
Release SP-A1.3
First published in Great Britain in 2003
c© 2003 Alex Scott
The right of Professor Alex Scott to be identified as Author of thisWork has been asserted by him in accordance with the Copyright, Designsand Patents Act 1988.
ISBN 0 273 60924 6
British Library Cataloguing in Publication DataA CIP catalogue record for this book can be obtained from the British Library.
All rights reserved; no part of this publication may be reproduced, storedin a retrieval system, or transmitted in any form or by any means, electronic,mechanical, photocopying, recording, or otherwise without the prior writtenpermission of the Publishers. This book may not be lent, resold, hiredout or otherwise disposed of by way of trade in any form of binding orcover other than that in which it is published, without the prior consentof the Publishers.
Typesetting and SGML/XML source management by CAPDM Ltd. (www.capdm.com)Printed and bound in Great Britain.
The publisher’s policy is to use paper manufactured from sustainable forests.
Contents
Using the Course Package 9
Module 1 Introduction to Strategy, Planning and Structure 1/11.1 Strategic Planning: The Context 1/21.2 What Is Strategic Planning? 1/41.3 The Process of Strategy and Decision Making 1/231.4 Business Unit and Corporate Strategy 1/401.5 Is Strategic Planning Only for Top Management? 1/47
Module 2 Modelling the Strategic Planning Process 2/12.1 The Modelling Approach 2/12.2 Strategy Making 2/8
Module 3 Company Objectives 3/13.1 Setting Objectives 3/23.2 From Vision to Mission to Objectives 3/33.3 The Gap Concept 3/73.4 Credible Objectives 3/103.5 Quantifiable and Non-Quantifiable Objectives 3/113.6 Aggregate Objectives 3/133.7 Disaggregated Objectives 3/143.8 The Principal/Agent Problem 3/153.9 Means and Ends 3/173.10 Behavioural versus Economic and Financial Objectives 3/183.11 Economic Objectives 3/183.12 Financial Objectives 3/213.13 Social Objectives 3/293.14 Stakeholders 3/313.15 Ethical Considerations 3/38
Module 4 The Company and the Economy 4/14.1 The Company in the Economic Environment 4/24.2 Revenue and Costs: The Basic Model 4/34.3 The Workings of the Economy 4/44.4 Forecasting: What Will Happen Next? 4/214.5 PEST Analysis 4/254.6 Environmental Scanning 4/264.7 Scenarios 4/274.8 The Economy and Profitability 4/274.9 Environmental Threat and Opportunity Profile: Part 1 4/31
Module 5 The Company and The Market 5/15.1 The Market 5/35.2 The Demand Curve 5/3
Strategic Planning Edinburgh Business School 5
Contents
5.3 Competitive Reaction 5/135.4 Segmentation 5/185.5 Product Quality 5/245.6 Product Life Cycles 5/315.7 Portfolio Models 5/345.8 Supply 5/435.9 Markets and Prices 5/455.10 Market Structures 5/475.11 The Role of Government 5/545.12 The Structural Analysis of Industries 5/575.13 Strategic Groups 5/605.14 An Overview of Macro and Micro Models 5/615.15 Environmental Threat and Opportunity Profile: Part 2 5/62
Module 6 Internal Analysis of the Company 6/16.1 Opportunity Cost 6/26.2 Fixed Costs, Variable Costs and Sunk Costs 6/46.3 Marginal Analysis 6/56.4 Diminishing Marginal Product 6/86.5 Profit Maximisation 6/106.6 Economies of Scale and the Experience Curve 6/116.7 Economies of Scope 6/136.8 Production Costs 6/146.9 Joint Production 6/156.10 Break-Even Analysis 6/166.11 Payback Period 6/176.12 Accounting Ratios 6/186.13 Benchmarking 6/216.14 Sensitivity Analysis 6/236.15 Research and Innovation 6/246.16 Development 6/266.17 Resource Management 6/316.18 Human Resource Management 6/336.19 Vertical Integration 6/356.20 The Value Chain 6/386.21 Diversification 6/406.22 Synergy 6/416.23 Competence 6/446.24 Strategic Architecture 6/496.25 The Definition of Competitive Advantage 6/506.26 Strategic Advantage Profile 6/53
Module 7 Making Choices among Strategies 7/17.1 A Structure for Rational Choice 7/27.2 Strengths, Weaknesses, Opportunities and Threats 7/37.3 Generic Strategies 7/57.4 Identifying Strategic Variations 7/177.5 Strategy Choice 7/26
6 Edinburgh Business School Strategic Planning
Contents
Module 8 Implementing and Evaluating Strategy 8/18.1 Implementing Plans 8/28.2 Organisational Structure 8/38.3 Resource Allocation 8/68.4 Evaluation and Control 8/128.5 Feedback 8/188.6 The Augmented Process Model 8/198.7 Postscript: Strategic Planning Works 8/23
Appendix 1 Strategy Report A1/1
Appendix 2 Answers to Review Questions and Case Analyses A2/1
Appendix 3 Practice Final Examinations A3/1
Appendix 4 Guide to Strategic Planning Practice Final Examinations A4/1
Index I/1
Strategic Planning Edinburgh Business School 7

Using the Course Package
It is widely accepted that strategic planning is extremely difficult to teacheffectively. This is because, at the MBA level, it is not sufficient to know aboutthe subject – it is necessary to be able to apply ideas in order to carry outstrategic analysis of real problems. While there are many strategy models onwhich analyses can be based, the strategic approach also requires the applicationof a great many ideas and models drawn from the core business disciplines; thisis what gives substance to strategic analysis and this integrative element iswhy strategic planning is typically regarded as the capstone course in MBAprogrammes.
A further problem is that strategy solutions are to a large extent a matter ofpersonal judgement. A strategic planning analysis is judged on the structureand approach of the analysis and the justification for the policy proposals rec-ommended rather than the proposals themselves. While it may be possible torecognise that recommendations are unlikely to be successful because of mis-understandings about the basic business tools which are applied, it is usuallydifficult to judge how good or bad the results of a particular set of recommenda-tions are likely to be because no one really knows what is going to happen in thefuture. In real life strategy is undertaken in a constantly changing environmentwhich is full of uncertainty, and it is difficult to replicate these conditions in theclassroom. But it is obvious when students are using analytical ideas rather thanadopting a subjective and unstructured approach.
The approach adopted in this course is based on cases. There are some reviewexercises which are intended to reinforce your comprehension of specific topics,but the overall objective of the course is to enable you to apply strategic analysisto real life issues.
CasesThe case method is the most widely used technique for teaching strategicplanning, and was pioneered at Harvard Business School. The case is a powerfulteaching tool in class because it enables students to tackle real life examples,which have been abstracted and structured by teachers, and to present, discussand defend their analysis. The case method as used in class teaching cannotbe implemented for distance learning because it is based on interaction amongstudents and between students and teacher. In this course each case has beenanalysed fully by the professor, and many of the cases have been used in asimilar form in examinations and the analysis has benefited from the wisdomof large numbers of students. Each case has been analysed using a varietyof business models, and as you work through the course you will learn byanalysing the cases and comparing your solutions with those of the professor.It may often be the case that you consider your analysis to be superior to theprofessor’s; this is all to the good, particularly if you can justify your position.
The case method is a static approach, in that the you analyse a given situation,but cannot then experience how a plan might work out in practice, and how
Strategic Planning Edinburgh Business School 9
Using the Course Package
it might need to be adjusted as time proceeds. Strategic planning is a dynamicprocess in real life, and no case can capture this fully. A drawback of the casemethod is therefore that you will not have to live with the consequences of yourstrategy recommendations.
Feedback on student performance presents difficulties when using cases in thedistance learning mode. The professor’s analysis provides a benchmark againstwhich you can evaluate your own answer, but it cannot be regarded as a ‘perfectanswer’ to the case. This is because there can be legitimate disagreement onthe weights to ascribe to different aspects of the issue, such as the relativeimportance of different types of risk. Therefore the professor’s analysis can beregarded as an analytical framework within which you can judge the quality ofyour own thinking.
One of the difficulties in using real life cases is that they typically touch onmany issues. Several of the cases in the course attempt to focus on particulartopic areas, but the cases in the earlier Modules will be difficult to analyse fullybecause you do not have many of the analytical tools available with which totackle them. However, it is a salutory lesson to attempt cases without havingthe benefit of a full framework because there are still many lessons to be learnedfrom applying what you do know.
Because strategic planning is about applying ideas to the real world it isimportant that you tackle the exercises, in the form of cases and review questions,and assess your analysis in relation to the model answers provided. You willfind that many issues are elaborated on and reinforced in the model answersand these are an essential complement to the ideas developed in the text. Infact, the text and the exercises must be regarded as a single learning tool.
The cases, by their nature, are a snapshot at a particular time and, whilethey contain important lessons, time does march on and it is quite possible thatactual events will turn out differently to what might have been expected in thecases. Accordingly, each case is dated with the time the ‘snapshot’ was taken.An important feature of these cases is that they are not based on privilegedinformation nor in depth analysis of the organisations concerned; they havebeen constructed from the information available to everyone which is freelyavailable in the public domain, i.e. newspaper reports, magazine articles,television programmes and company reports. You will find that the cases aremuch shorter than those typically used in business school courses, and thoseof you who are familiar with Harvard Business School cases, for example, mayat first feel that they are ‘too short’. However, it is not the sheer amount ofinformation in a case which is important rather than what you can make of theinformation which is available. In fact you will find it instructive to keep trackof developments relating to the examples in the text and the cases; naturally youwill expect to keep track of developments in periodicals such as the Economistand newspapers such as the Financial Times, but you will also come uponrelevant information in the most surprising places – magazines, gossip columns,or whatever. Keep your eyes open.
10 Edinburgh Business School Strategic Planning
Using the Course Package
Your Learning StyleIt is entirely up to you how you decide to learn about strategy. Two totallydifferent learning models reported by students appear to have been equallysuccessful for them. One student worked through each Module and spenta lot of time on each case or review question both analysing the problemand comparing the outcome with the analysis provided in Appendix 2 beforeproceeding. Her intention was to build up comprehension in an incrementalfashion. Another student started by reading Modules 1 to 8 without attemptingthe cases or review exercises with the intention of gaining a general perspective;he then went back to the beginning and worked through the cases and exercises.Each felt that this approach was right for them. Whichever approach you adoptbear in mind that strategic planning is not an individual discipline which isunrelated to the core courses; when ideas from the core courses are used youmay often find it worthwhile to revisit the relevant text to refresh your mind onideas which are discussed and applied in the strategic context.
But there is one important piece of advice which you should keep in mindwhatever your learning style: do not get obsessed with detail. For example,some of the cases contain numerical information relating to company accountsand market position; you might make a computational mistake when using thesenumbers but that is not important. What is important is that the conclusions youarrive at are consistent with whatever numerical answers you have produced.Strategic planning is about the big picture and the quality of your thinking; ifyou lose sight of that you will find yourself in the classic position of not beingable to see the wood for the trees.
Strategic Planning Edinburgh Business School 11

Module 1
Introduction to Strategy, Planningand Structure
Contents
1.1 Strategic Planning: The Context 1/2
1.2 What Is Strategic Planning? 1/41.2.1 Managers’ Definitions of Strategy 1/51.2.2 Strategy in the Business Context 1/61.2.3 Three Approaches to Strategic Planning 1/81.2.4 Rittell’s Tame And Wicked Problems 1/131.2.5 The Origins of Strategy and Tactics 1/151.2.6 Strategy and the Scientific Approach 1/171.2.7 Strategic Planning and Strategic Thinking 1/21
1.3 The Process of Strategy and Decision Making 1/231.3.1 Strategy Dynamics 1/231.3.2 The Mythical Company 1/251.3.3 How Well Are We Performing? 1/251.3.4 What Should We Be Doing in the Future? 1/281.3.5 How Can We Achieve Successful Change? 1/311.3.6 Strategy and Crises 1/311.3.7 Elements of Strategic Planning 1/33
1.4 Business Unit and Corporate Strategy 1/401.4.1 Allocating Corporate Resources 1/411.4.2 Development of Corporate Strategies 1/42
1.5 Is Strategic Planning Only for Top Management? 1/471.5.1 Company Benefits of Strategic Planning 1/471.5.2 Individual Benefits of Understanding Strategic Planning 1/481.5.3 Understanding Strategic Planning: Who Should Pay? 1/48
Review Question 1 1/49
Review Question 2 1/49
Review Question 3 1/49
Review Question 4 1/49
Review Question 5 1/49
Strategic Planning Edinburgh Business School 1/1
Module 1 / Introduction to Strategy, Planning and Structure
Learning Objectives
• The meaning of strategic planning as it is used in business.• To visualise strategy as a structure of thought which can be applied to the
complex strategy process.• The different strategy concerns at the corporate and business levels.• How the major approaches to corporate strategy have developed.
1.1 Strategic Planning: The Context
It has been mentioned that strategic planning is usually the capstone course inMBA courses; it is therefore useful to look at what the core courses are concernedwith and how strategic planning fits with them. Because the core courses aretaught individually it is easy to get the impression that they are independent ofeach other, but this is far from the case. The following story tries to capture therationale for studying the core courses.
• Organisational behaviour: this subject should come at the top of the listof requirements for any management course because if you cannot handlepeople then you are not a manager. It is as simple as that. The fact isthat organisations are run by people, and if you have no understanding ofwhat motivates people and how they interact in the organisational settingthen you are unlikely to get an efficient response from the people you aremanaging. One of the most successful companies in history, IBM, appearedto lose its way in the early 1990s and reported the biggest loss in corporatehistory in 1993: it was unable to convert its inventions, such as the newRISC chips, into marketable products as fast as competitors, and it wasunable to respond quickly to changing circumstances; this was largelyattributable to the huge bureaucratic structure which had evolved and IBMwas forced to take steps to reorganise itself so that it could once againreact in a competitive manner. The people problem lay at the root of IBM’sdifficulties and this had to be sorted before real progress could be made.
• Economics: everything that happens in business is related to economic influ-ences and these operate at three levels. At the highest level it is importantto have some understanding of how the economy operates. Every businessis affected by the business cycle, the rate of interest, the exchange rate andgovernment economic policies; a manager’s view on what is happening inthe economy can greatly affect decisions on what to do next; for example,should a major investment be taken now, when all the signs are that theeconomy is heading for recession, or should it be delayed until there isan improvement? The next level concerns how markets operate and howprices are determined. What type of competitive forces prevail in yourindustry? How does market structure affect profitability? What is signalledby a change in prices? An understanding of basic economic ideas enablesyou to discuss and interpret such questions; without that understandingyou have no idea what is going on. The third level concerns ideas aboutefficiency, primarily based on marginal analysis. Rational decision making
1/2 Edinburgh Business School Strategic Planning
Module 1 / Introduction to Strategy, Planning and Structure
is based on an understanding of relevant costs and benefits, and seriousmistakes are often made because efficiency ideas are not understood.
• Marketing: there is little point to being able to manage people, interpretsurveys and make rational economic decisions if you cannot sell effectivelyin markets. Marketing is often mistakenly thought of as advertising, butadvertising is simply one of many marketing tools. Marketing is the complexprocess of relating product characteristics to market demand and attemptingto win competitive advantage in a dynamic competitive setting. Why is itthat some brands of whisky are much more successful than others, despitethe fact that the majority of people cannot tell one brand from another?Without an understanding of marketing principles and ideas it is impossibleto answer such a difficult question.
• Finance: you may be running your company well and selling effectively,but managers always have to bear in mind that perhaps they should havebeen doing something different which is more profitable. How is the choiceamong competing courses of action made in a world of uncertainty? Financetakes all available information on projected future cash flows and subjectsthem to rigorous evaluation; a company might have the choice of revampingan existing product or launching a new product which is a close substitute,and the projected cash flows both in and out are totally different while therisks associated with each are also different. The tools of financial theoryprovide you with a quantitative solution to such problems, and this takesyou a long way towards deciding on the most appropriate course of action.
• Accounting: you may have decided on the best course of action using finan-cial techniques, but it is then necessary to ensure that over time resourcesare allocated efficiently; in a company which produces more than oneproduct it is difficult to isolate relevant costs, but knowing the costs of whatyou produce is central to running a business. While finance is concernedwith deciding what should be done, accounting concentrates on how effi-ciently resources are subsequently allocated. In many ways a knowledgeof accounting helps in the same way as an understanding of quantitativemethods: you should be able to ask the correct questions and be able tointerpret the answers. Otherwise you are at the mercy of accountants, andobviously no one wants to be in that position.
• Project management: while it may appear to be a good idea to embarkon a new course of action, such as launching a new product, unless youunderstand how to implement projects effectively there is a good chancethat the launch will fail. The success of the launch will depend on meetingcriteria centred on time, cost and quality because the product will have tobe on the market by a certain date, the development and production costswill have to be maintained within budget and the quality has to be asgood as competitors’. In addition, the launch of any new product generatesrisk. Project management tools and techniques allow the risk profile to bemapped, assessed and monitored over time and any changes in risk impact,such as those due to the actions of competitors, can be tracked. As the launchprogresses tools such as earned value analysis and trade-off analysis enablethe project manager to consider different combinations of time, cost and
Strategic Planning Edinburgh Business School 1/3
Module 1 / Introduction to Strategy, Planning and Structure
performance both at present and at the projected end condition. Clearly,the lack of the project management approach can result in a haphazardproduct launch. Project management tools and techniques enable the projectmanager to plan and implement change effectively, hence increasing thelikelihood of success. A major problem confronting organisations is thatthey do not realise that their approach to managing change is haphazardbecause they are not aware that most change activities are in fact projectsin their own right and should be managed as such.
• Strategic planning: the areas covered by the six core disciplines can bedefined reasonably easily, and it is clear that they all have an important roleto play in running a company. Strategic planning is less easy to define, andthe content and role of strategic planning is what the rest of this course isabout. But one thing is certain: strategic planning is not independent of theother core disciplines.
1.2 What Is Strategic Planning?
Strategic planning is a complex activity and before attempting a definition itis useful to compare its degree of complexity with another complex activity:economic policy making, which has a general similarity with strategic planningin that strategic planning is concerned with running a company and economicpolicy is concerned with running the economy of a country. The study ofmacroeconomics reveals the complexity of fiscal and monetary policy and themany ideas and theories which are involved; furthermore, there are no com-pletely right or wrong economic policy decisions because information has to beinterpreted and conflicting theories reconciled. Although the scale of a companyis very much less than that of an industrialised country such as the UK orJapan the job of business policy making is probably just as complex. That is onereason why effective CEOs are as rare as effective Presidents, Prime Ministersand Central Bank Governors; in fact, effective CEOs are typically paid muchmore than government ministers. The complexity of economic policy becomesapparent when a list of the issues involved is compiled:
• growth of GNP• unemployment• inflation• the budget balance• the role of markets• the trade balance• the rate of interest• the exchange rate• income redistribution• pollution• government expenditure• business investment
1/4 Edinburgh Business School Strategic Planning
Module 1 / Introduction to Strategy, Planning and Structure
This list is by no means complete; in fact, the list could be extended to fill thispage. When we turn to strategic planning it is not difficult to generate a list ofequal length:
• profitability• growth in sales• market share• relative costs• competitive position• pricing• environmental scanning• human resource management• accounting ratios• investment appraisal• shareholder value• dividend policy
The theories of microeconomics and macroeconomics are used to make senseof the relationships among the many variables involved in the economy andto provide an understanding of how economies operate; this provides the basisfor interpreting government economic policy making. The approach in strategicplanning is to bring together business concepts and ideas in order to understandhow companies (and other organisations) operate in a competitive environment,develop an understanding of the inter-relationships involved, and hence providethe basis for arriving at explanations of why companies have succeeded or failedin the past and how they might operate successfully in the future.
There is an added dimension to the scope and complexity of strategic plan-ning which does not occur in economic policy making. Looking at the list ofstrategic planning issues there is an item called ‘environmental scanning’. Thisactivity is concerned with monitoring the environment within which the com-pany operates and assessing the extent to which current and potential changesin that environment are likely to impact on the company. But the macroeco-nomic environment is largely determined by the state of the economy, which inturn is greatly influenced by economic policy making. Thus to make sense ofthe macroeconomic environment it is necessary to have some understanding ofeconomic policy making and its implications. The need to understand economicpolicy making is not confined to government policy makers and it is subsumedinto strategic analysis.
1.2.1 Managers’ Definitions of Strategy
Over many years I have posed the question ‘What do you understand bystrategy?’ to experienced executives attending management programmes, andeach time the groups have responded with a wide range of answers includingthe following.
Strategic Planning Edinburgh Business School 1/5
Module 1 / Introduction to Strategy, Planning and Structure
1 Knowing where you are going and how you are going to get there.2 Setting a clear set of objectives and mobilising resources to achieve them.3 Thinking in the long rather than the short term.4 Working out how to do better in the market place than your competitors.5 Deriving and selecting a course of action.
There are some common threads running through these definitions, but indi-vidually they could lead to different courses of action. For example, definition2 focuses on objectives, but does not differentiate between short term and longterm as in definition 3; definition 4 is the only one explicitly concerned withmarkets. Definition 5 is the only one which explicitly considers choice.
It is not unusual to obtain ten different definitions from a single group. Thesemanagers are typically involved in formulating and implementing strategy so itmight appear strange that there is such apparent confusion in their minds aboutwhat is meant by the term.
1.2.2 Strategy in the Business Context
If you were to visit a large or medium sized company, chosen at random, andattempt to identify and track the formulation and implementation of a ‘strategicplan’, you may well find the task to be elusive and perplexing. In pursuing thestrategic planning process some questions which you might ask, in no particularorder, include: ‘Was the strategy ever written down?’ ‘ Where did it originate?’‘Why was it selected rather than alternatives?’ ‘Who was responsible for it?’‘Who knew if it was working or not?’ In some cases you would find it diffi-cult to elicit answers to these seemingly straightforward questions. Despite this,individual companies may consider that they have a well-developed strategicplanning process, although it is informal and subject to constant revision in thelight of circumstances. On the other hand, in some companies you would finda formal planning system complete with clearly specified objectives, responsi-bilities and control procedures. You would therefore encounter a wide diversityof activity which individual companies would consider to be strategic planning.Some additional questions might include: ‘Is there a payoff to the companyfrom the resources devoted to strategic planning?’ ‘Which is more appropriate,the informal approach or the structured formal plan?’ You would probably findthat managers offered a variety of views on both the effectiveness of planningin general and the most appropriate approach to planning.
One reason that questions relating to strategy are difficult to answer unam-biguously is that strategic planning takes place in a complex and ever-changingbusiness environment. One description of strategy is
A pattern in a stream of decisions; the pattern may not be comprehensive, unifiedor integrated1
This raises the question as to whether strategic planning is a conceptually validconcept in business; the study of strategic planning may merely be an attemptto impose a structure on events after they have occurred. The central question iswhether strategy is a rational process, in the sense that it was carefully thought
1/6 Edinburgh Business School Strategic Planning
Module 1 / Introduction to Strategy, Planning and Structure
out by senior management and then put into practice, or whether it is emergent,in the sense that it develops over a period as the result of many influences fromall levels in the organisation.
The following are some academic definitions of strategy, each with its ownparticular focus.
The decisions taken over time by top managers, which, when understood as awhole, reveal the goals they are seeking and the means used to reach these goals.Such a definition of strategy is different from common business use of the term inthat it does not refer to an explicit plan. In fact, by my definition strategy may beimplicit as well as explicit.2
the determination of the basic long term goals and objectives of an enterprise,and the adoption of courses of action and the allocation of resources necessary forcarrying out these goals.3
the pattern of objectives, purposes or goals, and the major policies and plans forachieving these goals, stated in such a way as to define what business the companyis in or should be in and the kind of company it is or should be.4
what determines the framework of a firm’s business activities and provides guide-lines for coordinating activities so that the firm can cope with and influence thechanging environment. Strategy articulates the firm’s preferred environment andthe type of organisation it is striving to become.5
Each of these quotes can be interpreted as saying different things. The firstdefinition seems to suggest that strategy can only be understood after the event,and is revealed by studying what management actually did. The second claimsthat strategy is a proactive process where long term goals are determined beforethe event and resources deployed accordingly. The third portrays strategy asa pattern of objectives which define what the company is and intends to bein a broad sense. The fourth presents strategy as a set of guidelines whichwill help it operate in a changing environment. The fact that there are suchdifferent perspectives on the issue suggests that some observers will see strategicbehaviour where others will not.
A different approach to strategy can be derived from economics: the forces ofcompetition ensure that, on average, successful companies are those which, bychance or otherwise, choose the most effective strategies. As a result it mightbe expected that such companies would tend to exhibit various characteris-tics of strategic planning contained in the definitions, such as identification ofobjectives, plans and guidelines for dealing with the unexpected, and effectiveallocation of resources. Since many companies have a record of success stretchingover decades, it is reasonable to conclude that there is scope for distilling lessonsfrom their experience and formalising these into a set of generally applicableprinciples.
However, any attempt to identify characteristics which lead to success orfailure is dependent on relating actions to outcomes, i.e. attributing cause andeffect. This is difficult in the field of business. There are numerous instancesof companies which have a record of success because they happened to bein the right market position at the right time to take advantage of favourable
Strategic Planning Edinburgh Business School 1/7
Module 1 / Introduction to Strategy, Planning and Structure
economic circumstances; investigation of such companies may reveal that theyhad little understanding of their markets and generally haphazard managementcontrols, and from this there would be little to learn about successful behaviour.However, the subsequent performance of such companies may have the potentialto generate lessons for strategic planning: do they capitalise on their goodfortune, consolidate their market position, ensure that resources are deployedefficiently and start looking forward with the objective of identifying and seizingsimilar opportunities in the future? If not, they may be caught out by the nextadverse event.
But the major problem in trying to relate cause and effect is that strategyis also concerned with the behaviour of competitors. Decisions are not onlytaken in the context of unpredictable outcomes such as market growth and thebusiness cycle, but have to take into account confrontation with other companies,each of which is trying to achieve a competitive advantage. If one company iscapable of carrying out an analysis of market conditions, it stands to reasonthat other companies can do so also, and may well have exactly the sameinformation at their disposal. Strategy decisions may then become something ofa guessing game, where managers attempt to predict what competitors will dorather than analyse options derived from financial and economic appraisal. Asa result an elaborate and sophisticated strategy based upon the latest thinkingin the business disciplines may be associated with failure because a majorcompetitor did something totally unexpected. Another way of looking at thisis that strategy is about the unknowable as well as the unpredictable. This meansthat it is necessary to go beyond the application of concepts from the individualbusiness disciplines on their own to derive effective courses of action.
Everyone should be aware that there are no simple answers to strategy issues;you only have to read the continual newspaper reports on the varying fortunesof prominent business personalities and famous companies. In internationalpublishing and communications the careers of Rupert Murdoch and the lateRobert Maxwell provide a strong contrast. The huge Bond empire based inAustralia fell apart in 1991. Richard Branson capitalised on the success of musicpublishing and is now an important player in the airline business and is movinginto the financial sector. Lord Hanson was one of the most successful take-overspecialists in the world and by 1996 had started to dismember his corporateempire. The list of successes and failures is endless, and it is a useful exerciseto write down a list of companies from your own experience, and label themsuccess or failure at the moment; then put yourself back five years and see ifyou could have predicted what has happened to them. It is obviously importantto determine whether general principles exist whose application would haveprevented the failures, and whether such principles are the underlying reasonfor the successes.
1.2.3 Three Approaches to Strategic Planning
Since strategy is such a troublesome concept to define it is to be expected thatthere are several ways of approaching the idea. Strategy can be regarded as apurely planning exercise, or a course of action which emerges over time, or asthe outcome of the resources which are available to the company.
1/8 Edinburgh Business School Strategic Planning
Module 1 / Introduction to Strategy, Planning and Structure
The Planning Approach
This approach is based on the notion that once a set of objectives have beendetermined, the business environment analysed and forecasts made, a plancan be worked out by senior management which is then passed down forimplementation; this plan is then adhered to over the planning time scale. Thisis usually thought of as the strategic planning approach, and it has been claimedby its supporters that this prescriptive form of strategy is rational and objective;but as Mintzberg6 and many others have pointed out, it makes a number ofassumptions about the world which are highly questionable.
• The future can be predicted accurately enough to make rational choices. It is infact a widespread fallacy that the future can be predicted with any realisticdegree of accuracy. At the macro level economists disagree quite markedlyon the economic prospects for any given country during the course ofthe next year; such forecasts can never take into account unforeseeableevents such as the Asian economic crisis in 1997 or the collapse of theRussian financial system in 1998. At the micro level market innovationsand the actions of competitors can have fundamental effects which are alsoimpossible to predict, such as the introduction of direct telephone insuranceselling in the UK in the early 1990s. One reason that many market changesare impossible to predict is that that they are dependent on the uniquevision of individuals; if such unique vision did not exist there would bevirtually no scope for competitive action in the first place.
• It is possible to detach strategy formulation from everyday management. In arrivingat a strategy it is necessary to have a full set of data which can be subjectedto analysis and from which conclusions can be drawn. But this assumes thatthere is some technique whereby the relevant information is extracted fromthe organisation, and from individual managers, and presented to strategymakers in a tidy bundle. This dodges the question of who is to decideon which information is relevant, and indeed whether the information isreadily available. Furthermore, as events unfold information is continuallyevolving and can go out of date very quickly. As a consequence everydaymanagement is closely tied in with strategy formulation because it is ineveryday events that information is generated.
• It is possible to forego short-term benefit in order to gain long-term advantage. Ina situation of uncertainty, and lack of knowledge about the future becauseof the difficulties of forecasting mentioned above, it may often appearpreferable to reap short-term benefits which can be achieved with a highdegree of certainty rather than waiting for highly uncertain returns. It canalso be extremely difficult to convince those who lose in the short termthat the trade-off is worthwhile. Many companies may find it virtuallyimpossible to undertake action which relates to the long term when thereare viable short term alternatives.
• The strategies proposed are capable of being managed in the way proposed. Anystrategic initiative which involves change is dependent on company person-nel adapting and working in alignment with company objectives. Changemanagement is one of the most problematical areas of strategy implemen-tation, and it can not be taken for granted. Time and again it is found in
Strategic Planning Edinburgh Business School 1/9
Module 1 / Introduction to Strategy, Planning and Structure
practice that prescriptive actions simply do not take the human dimensionadequately into account.
• The Chief Executive has the knowledge and power to choose among options. Hedoes not need to persuade anyone, nor compromise his decisions. This takesa naive view of leadership and how it is exercised. In reality, very fewbusiness leaders can behave like dictators, and certainly not for very long.It is necessary to achieve consensus and agreement at all levels of theorganisation, otherwise a prescriptive plan simply cannot be made to work.The fact of selecting one option implies that some individuals will bemade better off and some worse off (or perceive that this is the case) thanthey otherwise would have been. Compromises are inevitable during theimplementation process.
• After careful analysis, strategy decisions can be clearly specified, summarised andpresented; they do not need to be altered because circumstances outside the companyhave changed. This is perhaps one of the greatest and most potent fallacies: itis never possible to avoid ambiguity completely, and it is potentially lethalto ignore changing competitive circumstances. One of the most importantreasons for company failure is the lack of a feedback mechanism and thechannels of communication that make it possible for decision makers toadapt to changing circumstances.
• Implementation is a separate and distinctive phase that only comes after a strategyhas been agreed. This assumption is possibly a reflection of the fact that theimplementation stage of strategy has always received much less attentionthan the more glamorous and exciting areas of objective setting and strategychoice. In reality nothing ‘just happens’, and an essential part of strategymaking is to evaluate the feasibility of different courses of action. It maywell be desirable, on financial grounds, to close a factory, but the actualprocess of achieving this may have widespread and damaging effects onthe company as a whole.
During the early 1960s the notion of prescriptive planning was quite popularand many corporations set up corporate strategic planning departments. How-ever, experience has revealed that the attempt to drive corporate strategy in thisrestrictive fashion is unproductive. A major problem arises when individualsbecome committed to the strategic plan itself, and not to the success of thecompany; this can occur when performance measures have been expressed infinancial terms and the pursuit of favourable financial reports takes precedenceover longer term issues.
Emergent Strategy
This approach starts from a different premise: that people are not totally rationaland logical. The extent of this irrationality has been the subject of some researchand the general findings accord with common sense.
• Managers can only handle a relatively small number of options.• Managers are biased in their interpretation of data – in fact any data set can
be interpreted in a number of legitimate ways, and it is not surprising that
1/10 Edinburgh Business School Strategic Planning
Module 1 / Introduction to Strategy, Planning and Structure
managers often select the interpretation which backs up their previouslydetermined views.
• Managers are likely to seek a satisfactory solution rather than maximiseprofits.
• Organisations consist of coalitions of interest groups. The implementationof decisions depends on negotiation and compromise between those groups,leading to unpredictable outcomes.
• When making decisions, managers pay as much attention to a company’sculture and politics as to factors such as resource availability and externalfactors.
According to this approach strategy is not planned before the event butemerges over time in an unpredictable manner and hence may appear to havelittle structure; it is therefore argued that the claim of a cause and effect relation-ship between analysis and strategy choice and implementation is fundamentallyflawed.
There is another very good reason why there is a limited use of informationin decision making: the world is actually too complex to be understood by thehuman brain. Rationality has to be seen in the context of what is possible in thereal world, rather than what might be done in an ideal world. The term usedto describe rationality when it is impossible to take into account the complexityof real life is ‘bounded rationality’; the decision maker is rational given theinformation available, but is quite aware that more information could be obtainedat a cost. In economics it is argued that broadly speaking decision makers actin accordance with profit maximisation, but it is impossible to reconcile profitmaximisation with bounded rationality. This means that a different view ofdecision making has to be taken and the term ‘satisficing’7 was invented toreflect the fact that decision makers collect information and defer selecting acourse of action until the costs of further delay and information collection areconsidered to be greater than the potential benefits of searching out a betteroption. Thus rather than simply attempting to maximise profit, the decisionmaker satisfies himself that there is nothing more to be gained from furtherdelay. This helps to explain why decision makers are so eager to find out whatmanagement gurus have said and are continually searching for ways of makingsense of the real world. To decision makers any information is better than noinformation, and it does not matter very much to them that the information theyare acting on does not accord with accepted views of what is proper scientificenquiry.
Another way of looking at this is to make up a list of things which thecompany does not know with any certainty when about to launch a newproduct; for example
• How customers will perceive quality• How far it will be possible to meet production cost targets• How competitors will react• When a substitute will appear on the market• The impact on sales of a one year delay in launch
Strategic Planning Edinburgh Business School 1/11
Module 1 / Introduction to Strategy, Planning and Structure
It is certainly possible to collect some information on such issues, but it willnot be complete and is likely to be unreliable. In fact, it turns out that youcan not actually get hold of the really important information and it is alwaysnecessary to make assumptions and to take many things on trust.
However, it can be argued that just because the world is a complex andchanging place does not mean that decision makers should simply sit back andlet things happen and that there is still a role for the proactive approach.
• While there are bound to be adjustments to corporate objectives as timegoes on, the company can still be directed along the general lines of abroad mission. The Board need to do more than simply react to changingcircumstances.
• There is a need for efficient resource allocation; if this is not tackled resourcesmight as well be allocated randomly.
• While compromises need to be made with interest groups within the organ-isation, this is more of a constraint than a barrier to action. Decisions stillhave to be taken, and it is nonsense to avoid this simply because people aredifficult to manage.
• In many cases investments take a considerable time to reach fruition, there-fore a degree of long term planning is inevitable.
• Satisficing is in itself a rational basis for choice, since it is better to make aninformed judgement on the basis of some information than no informationat all, or to ignore information altogether.
• The act of attempting to plan at least makes the basis for managementaction clear.
Therefore there is some middle ground between trying to plan for all eventu-alities and simply reacting to events as they occur.
Resource Based Strategy
This approach lays emphasis on the internal resources available to the company.While it does not overlook the importance of the competitive environment,it starts from the basic premise that strategy is primarily concerned with thesearch for competitive advantage, and to a large extent the source of competitiveadvantage rests within the organisation’s resources. The resource based viewdoes not focus so much on the actual labour and capital deployed by thecompany, but rather on the way in which these resources are utilised. It startsfrom the premise that a successful company is not a passive collection ofresources which reacts to changes in the competitive environment, but is onethat develops the ability not only to take advantage of opportunities as theyarise, but to create the opportunities themselves by innovative behaviour.
Ways in which this might be put into practice include the idea of totalquality management, which attempts to orientate all resources in the company todelivering high quality output to customers and establishing a reputation whichis a significant competitive asset. Another is the development of distinctivecompetencies which other companies do not have and cannot imitate and whichprovide the basis for lasting competitive advantage. None of the resource based
1/12 Edinburgh Business School Strategic Planning
Module 1 / Introduction to Strategy, Planning and Structure
approaches provides a full prescription for success, and research into theireffectiveness is still at a relatively early stage; this being the case, it is notsurprising that there is a great deal of controversy surrounding the pay off fromthe resource based approach.
1.2.4 Rittell’s Tame And Wicked Problems
It should be clear from the preceding discussions that strategic planning, orstrategy, is a complicated subject. If you think of strategy as being a problemto solve, say for a particular company, it does not take long to realise that itis incredibly complex; the trouble is that there is a lot of confusion about whatthe terms ‘difficult’ and ‘complex’ actually mean. At one time, for example, itwas thought that the problem of running an economy efficiently was solvablein the sense that a sufficiently powerful computer program could work out allinput requirements for feasible outputs and allocate resources accordingly. Theplanners in the old Soviet economies fell into this trap, and were of the opinionthat it if you worked at it long enough it would be possible to plan the economy.But what if the basic premise were totally wrong, i.e. it is not possible even inprinciple to plan an economy or a company with any degree of precision? Theimplications of this are quite profound because if the notion that a ‘perfect’ planis mistaken in principle we move into different conceptual territory.
Here is a warning before you tackle the rest of this section. Some studentsfind this argument somewhat academic and feel that it merely defines thedifference between ‘scientific’ and ‘non-scientific’ problems. However, this is notthe case because the distinction is between different types of problem, whetherthey are defined as scientific or not. It is usually felt that strategy problemsare difficult because they are complex, but the shortcoming of focusing oncomplexity becomes clear when problems are classified as ‘tame’ or ‘wicked’in the sense used by Rittel8. In this scheme, wicked means much more thanincredibly complex. For example, consider Fermat’s Last Theorem; in about 1637the mathematician Fermat noted that he had a proof for the proposition thatthere were no three numbers which would fit the expression
xn + yn = zn, where n > 2
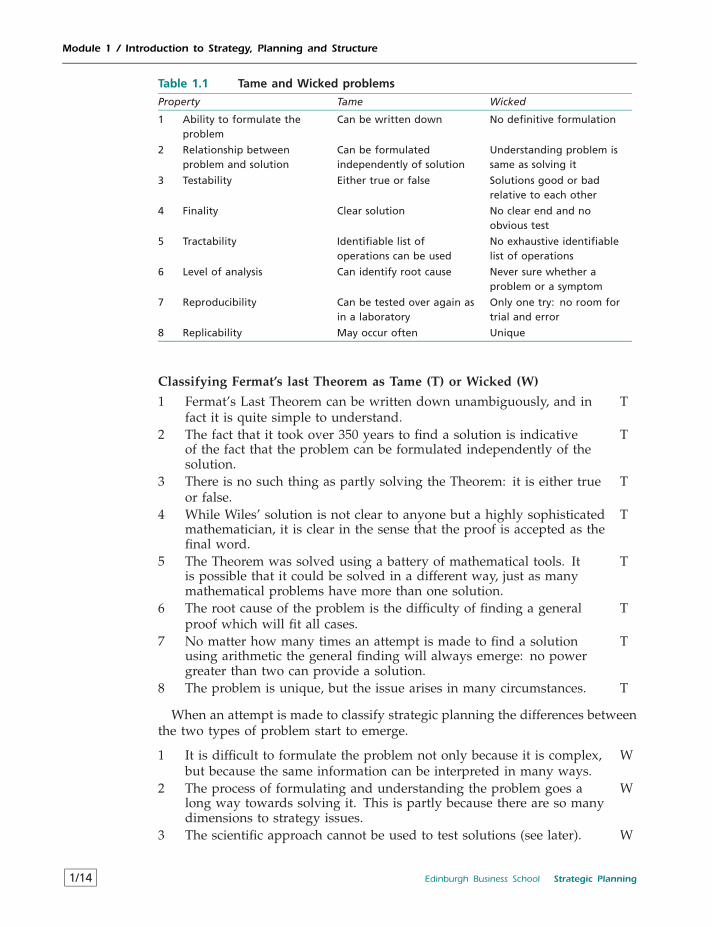
The trouble was that he claimed not to have sufficient room in the marginto elaborate the proof. The search for the proof occupied many mathematiciansfor the next three hundred years, and it was not until 1993 that Andrew Wiles,after many years of effort, found the solution using highly refined and abstractmathematical concepts. There is no doubt that Fermat’s Last Theorem is anincredibly complex problem, but consider it in the light of Rittell’s distinctionbetween tame and wicked characterised in Table 1.1.
Is Fermat’s Last Theorem a tame or wicked problem? The following classi-fication suggests that it is overwhelmingly a tame problem, despite its greatdifficulty and complexity. You may disagree with some of the individual classi-fications, but it is unlikely that more than two categories can be unambiguouslyclassified as wicked.
Strategic Planning Edinburgh Business School 1/13
Module 1 / Introduction to Strategy, Planning and Structure
Table 1.1 Tame and Wicked problems
Property Tame Wicked
1 Ability to formulate theproblem
Can be written down No definitive formulation
2 Relationship betweenproblem and solution
Can be formulatedindependently of solution
Understanding problem issame as solving it
3 Testability Either true or false Solutions good or badrelative to each other
4 Finality Clear solution No clear end and noobvious test
5 Tractability Identifiable list ofoperations can be used
No exhaustive identifiablelist of operations
6 Level of analysis Can identify root cause Never sure whether aproblem or a symptom
7 Reproducibility Can be tested over again asin a laboratory
Only one try: no room fortrial and error
8 Replicability May occur often Unique
Classifying Fermat’s last Theorem as Tame (T) or Wicked (W)
1 Fermat’s Last Theorem can be written down unambiguously, and infact it is quite simple to understand.
T
2 The fact that it took over 350 years to find a solution is indicativeof the fact that the problem can be formulated independently of thesolution.
T
3 There is no such thing as partly solving the Theorem: it is either trueor false.
T
4 While Wiles’ solution is not clear to anyone but a highly sophisticatedmathematician, it is clear in the sense that the proof is accepted as thefinal word.
T
5 The Theorem was solved using a battery of mathematical tools. Itis possible that it could be solved in a different way, just as manymathematical problems have more than one solution.
T
6 The root cause of the problem is the difficulty of finding a generalproof which will fit all cases.
T
7 No matter how many times an attempt is made to find a solutionusing arithmetic the general finding will always emerge: no powergreater than two can provide a solution.
T
8 The problem is unique, but the issue arises in many circumstances. T
When an attempt is made to classify strategic planning the differences betweenthe two types of problem start to emerge.
1 It is difficult to formulate the problem not only because it is complex,but because the same information can be interpreted in many ways.
W
2 The process of formulating and understanding the problem goes along way towards solving it. This is partly because there are so manydimensions to strategy issues.
W
3 The scientific approach cannot be used to test solutions (see later). W
1/14 Edinburgh Business School Strategic Planning
Module 1 / Introduction to Strategy, Planning and Structure
4 It is not clear where the problem ends because of real worlddynamics. It is impossible even to visualise the time frame overwhich a proposed solution will prevail.
W
5 There are many techniques which can be applied, and no agreementon which is most effective in which circumstances. This ischaracterised by management ‘fads’ which come and go regularly.
W
6 The cause is usually not clear, and symptoms are often confused withproblems; for example, a falling market share may be a symptom ofdiminishing competitive advantage.
W
7 Opportunities typically only present themselves once, and it isimpossible to go back in time and try again.
W
8 Each business problem is unique, although it may share commonfeatures with other situations.
W
While there is room for discussion on the extent to which each issue can beclassified as tame or wicked, there is no doubt that strategic planning emergesoverwhelmingly as a wicked problem. Managers may feel that they understandstrategy problems better than Fermat’s Last Theorem, and that they could neverremotely understand the solution to the Theorem; but in fact it is meaninglessto compare the two types of problem because they are intrinsically different.
1.2.5 The Origins of Strategy and Tactics
The roots of the word ‘strategy’ lie in the Greek strategio, meaning a general,stratos meaning an army, and agein meaning to lead. Some dictionaries definestrategy as the planning and implementation of military campaigns; its meaninghas widened in common use to include activities such as gaming and busi-ness, in which planning and the implementation of plans are undertaken. In theexpression ‘strategic planning’ the term ‘planning’ is therefore tautologous, sinceit is already included in the concept of strategy. Despite the tautology, the termhas now been accepted in general use, particularly in business schools and in theliterature relating to strategic activities in business. Given the origins of strategy,it is not surprising to find that many of the ideas of military strategy havebeen carried over to business strategy; these include setting objectives, identify-ing strengths and weaknesses, organising resources accordingly and evaluatingoutcomes.
Tactics is a notion which is closely related to strategy. Again, the meaningcan be clarified by the Greek roots: taktikos meaning fit for arranging, andtaktos meaning ordered. The military definition relates to the science or art ofmanoeuvring in the presence of the enemy. Thus, in the military context, strategyis deciding what is to be done, and tactics is deciding how individual objectivesare to be achieved.
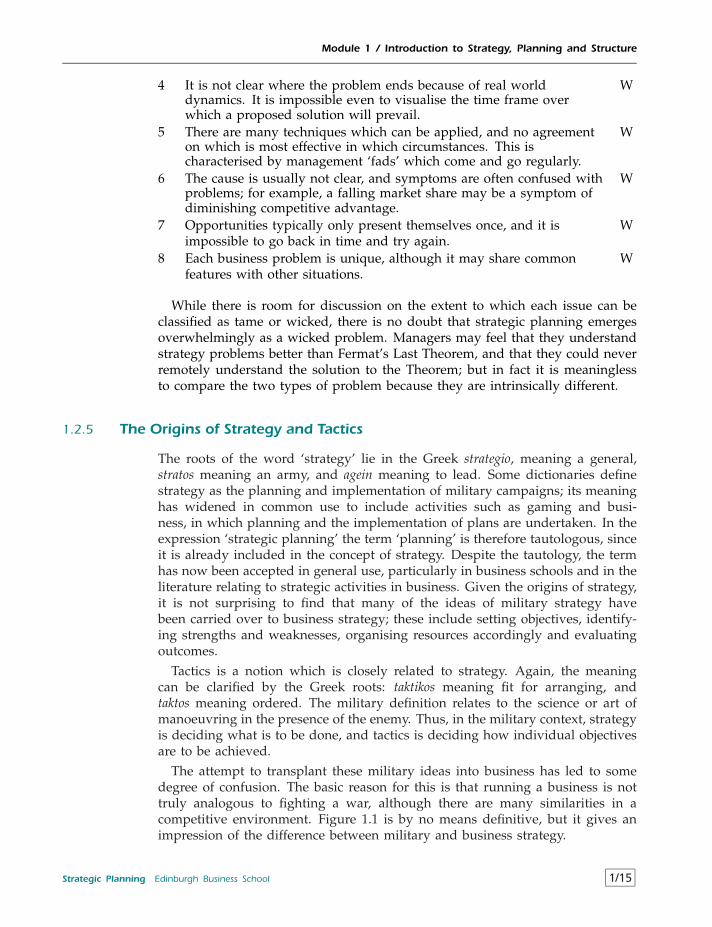
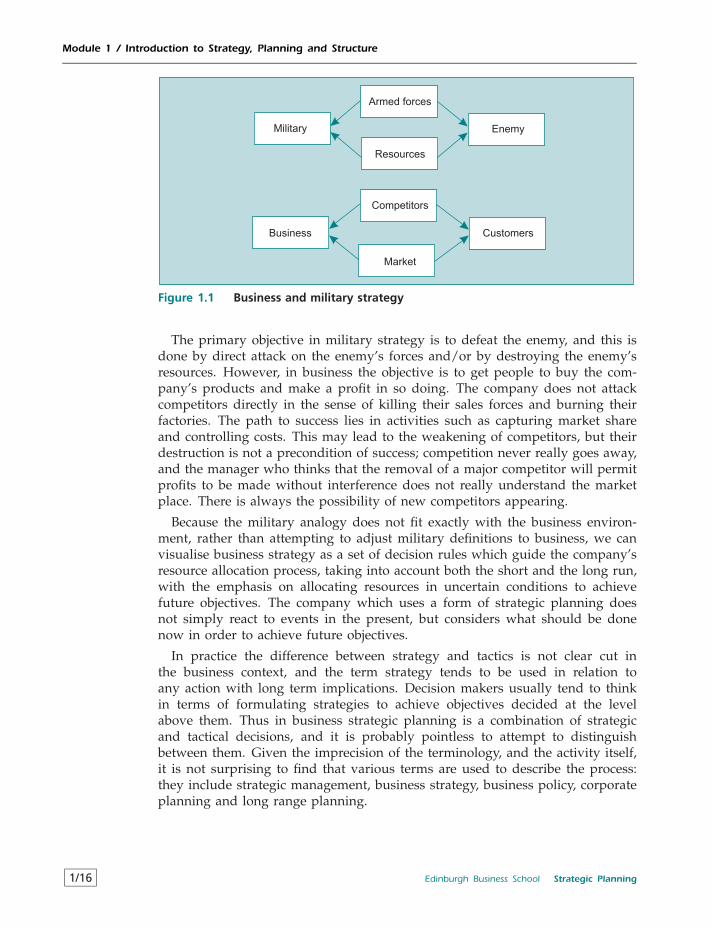
The attempt to transplant these military ideas into business has led to somedegree of confusion. The basic reason for this is that running a business is nottruly analogous to fighting a war, although there are many similarities in acompetitive environment. Figure 1.1 is by no means definitive, but it gives animpression of the difference between military and business strategy.
Strategic Planning Edinburgh Business School 1/15
Module 1 / Introduction to Strategy, Planning and Structure
Armed forces
Resources
EnemyMilitary
Competitors
Business
Market
Customers
Figure 1.1 Business and military strategy
The primary objective in military strategy is to defeat the enemy, and this isdone by direct attack on the enemy’s forces and/or by destroying the enemy’sresources. However, in business the objective is to get people to buy the com-pany’s products and make a profit in so doing. The company does not attackcompetitors directly in the sense of killing their sales forces and burning theirfactories. The path to success lies in activities such as capturing market shareand controlling costs. This may lead to the weakening of competitors, but theirdestruction is not a precondition of success; competition never really goes away,and the manager who thinks that the removal of a major competitor will permitprofits to be made without interference does not really understand the marketplace. There is always the possibility of new competitors appearing.
Because the military analogy does not fit exactly with the business environ-ment, rather than attempting to adjust military definitions to business, we canvisualise business strategy as a set of decision rules which guide the company’sresource allocation process, taking into account both the short and the long run,with the emphasis on allocating resources in uncertain conditions to achievefuture objectives. The company which uses a form of strategic planning doesnot simply react to events in the present, but considers what should be donenow in order to achieve future objectives.
In practice the difference between strategy and tactics is not clear cut inthe business context, and the term strategy tends to be used in relation toany action with long term implications. Decision makers usually tend to thinkin terms of formulating strategies to achieve objectives decided at the levelabove them. Thus in business strategic planning is a combination of strategicand tactical decisions, and it is probably pointless to attempt to distinguishbetween them. Given the imprecision of the terminology, and the activity itself,it is not surprising to find that various terms are used to describe the process:they include strategic management, business strategy, business policy, corporateplanning and long range planning.
1/16 Edinburgh Business School Strategic Planning
Module 1 / Introduction to Strategy, Planning and Structure
1.2.6 Strategy and the Scientific Approach
The social sciences are concerned with analysing and explaining humanbehaviour in the areas of economics, behavioural relationships, social inter-action, and so on. The business disciplines are largely concerned with applyingthe methods of the social sciences to the running of companies. For example,the idea of economies of scale originates from economic theories relating to thecombination of the factors of production, and has been subjected to a greatdeal of empirical testing. It is well known that economies of scale can lead tolower average costs, possibly up to some point beyond which costs no longerfall; however, the theory underlying economies of scale is quite subtle and doesnot lead to the expectation that decreasing average cost with size will actuallybe observed even in those industries where economies of scale exist. This isbecause of the concepts of short run and long run adjustment to different levelsof output; economies of scale will only be observed where firms have made‘long run’ adjustments to their factor inputs. As a result, it is necessary to takea sample of firms in order to carry out statistical analysis because, for any givensize of firm, there is likely to be a range of unit cost; the statistical analysis takesaccount of the random variations from the underlying relationship between sizeand unit cost.
Those who have been trained in science will recognise elements of what isknown as the scientific method in the description of how economies of scalemight be estimated: a theory is developed based on ideas relating to costs, ahypothesis is derived from the theory (i.e. something which can be tested), dataare collected, subjected to appropriate analysis, and the hypothesis is acceptedor rejected. This rigorous approach appeals to the ordered mind, and is usuallyused as a benchmark as to whether a subject ought to be deemed scientific.Disciplines are often (explicitly or implicitly) ranked according to where theylie on the scientific spectrum on the basis of whether the scientific method isapplied. Physics lies at the top end of the scientific spectrum and the socialsciences lie near the bottom and above the arts; among the social scienceseconomics is typically regarded as the most scientific. But it is important to beaware that philosophers of science do not agree on what the scientific methodactually is. It is not necessary to go into the subject in detail, but a brief outlineof the main strands of thought gives an impression of how scientific thinkingitself has developed.
The best known view, advanced by the philosopher Karl Popper, is thathypotheses or theories can only ever be falsified; it is impossible to verifya theory because the possibility that it might be falsified always exists. Thetrouble is that, by the same token, it is not possible to falsify a theory either,because the reverse is also true. In other words, it is never possible to arrive at adefinite answer on the basis of the evidence available. A wider view, associatedwith Kalakos, is that it is not the testing of individual theories that is important,but the overall research programme; individual projects only have relevancein the context of the programme and there is no such thing as falsification.Finally, a contrary view expressed by Feyerabend is that the scientific method isunduly constrictive, and the major discoveries have not been made as a resultof following it. In fact, this view holds that discoveries are much more the
Strategic Planning Edinburgh Business School 1/17
Module 1 / Introduction to Strategy, Planning and Structure
result of lateral thinking and chance events, and that subsequently they aremade respectable by framing the discoveries in the scientific manner. ThomasKuhn pointed out that the prevailing mode of thought, or scientific paradigm,determines what is thought of as science, and the paradigm itself is subject tochange over time. The scientific paradigm that the earth is flat and is orbitedby the sun was only overturned after a great deal of controversy; similarly, thescientific approach outlined above is just a paradigm of thought, and is noteven rigorously applied in physics, a discipline in which there is a great deal ofspeculative thinking.
It is intuitively attractive to apply the scientific method to strategy makingand, by following the approach used to estimate economies of scale, identifycriteria for effectiveness which can be applied in a variety of circumstances. Butwhen attempting to apply the scientific method to the question of what courseof action is likely to lead to success for a company, we are faced with severalintractable problems.
• As indicated above, there are different views on what strategic planningactually is; for example, many studies have attempted to measure the impactof planning systems on company performance, but planning systems andstrategic planning are not necessarily closely related.
• The types of company, the environments in which they operate, and theproblems facing them, are so different that it is difficult to do more thandraw general similarities among companies and situations. In other words,the range of variables which would have to be controlled for is enormous.
• There may be significant interactions among variables; for example,economies of scale may only occur in certain circumstances, and the use ofcompany size on its own as an indicator of potential economies of scale maybe misleading. Another way of expressing this is that the company as awhole is more than the sum of its individual parts, and undue emphasis ondisaggregating the functions and characteristics of a company can obscurethe overall picture.
• Companies and their markets change with the passage of time, and com-bined with the inevitable lags between actions and outcomes, it becomesimpossible to disentangle cause and effect. In other words, it cannot beinferred with certainty that a company succeeded either because it madethe right decisions or because circumstances turned out to be favourable inrelation to what it did. It is easy to fall into the trap of post hoc, ergo propterhoc, i.e. the fallacious reasoning of being after this, therefore being becauseof this.
So there are two levels of problem in trying to find out anything about thereal world. First, the scientific method cannot provide definite answers; at bestit is a rigorous approach which identifies the necessary steps in an investigation.Second, the data available in real life do not make it possible to test hypothesesabout strategy.
The problem of dealing with large numbers of interacting variables subjectto lags is not unique to the analysis of strategic planning; research into edu-cation is another example where student, teacher and social characteristics are
1/18 Edinburgh Business School Strategic Planning
Module 1 / Introduction to Strategy, Planning and Structure
notoriously difficult to measure, and interaction effects between teachers andstudents are likely to be important. Researchers have to make a choice betweentwo approaches to educational studies: concentrate on relatively few institutionsin depth, or carry out a large scale survey on many institutions. The large scalestudy cannot take into account as many variables as the in-depth study, andmay omit many potentially important variables; furthermore, those variablesincluded in the study may not be the most important but merely those mostsusceptible to measurement. However, the results obtained in the large scalestudy are likely to be of general applicability; while the small scale study cantake into account many more variables the results cannot be generalised becausethey may be particular to the cases studied. There are therefore costs and benefitsassociated with both large scale and in-depth methodologies.
Research into strategy is dominated by the in-depth approach, which meansthat any prescription for ‘best practice’ strategy can only be corroborated byreference to relatively few cases. A feature of the strategy literature is that it isheavily spiced with anecdotes, and evidence in favour of hypotheses comes inthe form of what is sometimes known as casual empiricism. But if there is noscientific proof in favour of different courses of action, how is it that expertsin strategy command very high fees for telling companies what they should bedoing? To some extent there is a degree of fashion in strategy advice. There is nodoubt that experts have offered different prescriptions for strategy approaches:that consistency of delivery is the key issue; that striving for higher qualityis a major success factor in its own right; that diversification is an essentialaspect of company growth; that company success depends on the identificationand exploitation of core competencies; that internationalisation is the engine ofgrowth; that a strong home base is a prerequisite for international success. Thescientifically trained may find it puzzling that so much credibility is attached toprescriptions which have no empirical foundation. On the other hand, managerspoint out that they have to operate in an environment in which the scientificapproach cannot be applied, that the anecdotal approach is better than nothing,and it is necessary to use what we do know in order to introduce rationalityinto decision making. The question of whether a company strategy will work inpractice is as uncertain as an economic strategy for a country as a whole.
In 1990 the UK adopted the strategy of entering the European Exchange RateMechanism (ERM) with the objective of curing both inflation and a chronicimbalance of trade; despite the enthusiasm for this move in many quarters, byearly 1991 it was obvious that membership of the ERM was not an immediatecure for the underlying problems of relatively low productivity and overheatedlabour markets. This led to a loss of confidence in the UK economy on thepart of international speculators, and in September 1992 the UK had no optionbut to leave the ERM and the currency immediately depreciated by about 15%against the German mark. Some prominent economists gloated that they hadpredicted this outcome from the beginning; others were dumbfounded. Thepoint to ponder is that if this strategy, which was subject to so much informedanalysis, could end in utter disaster, then the same fate can well lie in store forcompany strategies.
One of the best known attempts to identify the company characteristics which
Strategic Planning Edinburgh Business School 1/19
Module 1 / Introduction to Strategy, Planning and Structure
lead to strategic success is contained in the book In Search of Excellence.9 Theirquest for the characteristics of excellent companies was based on a non-randomsample of 43 US companies which fulfilled stringent market conditions forsuccess; these included three measures of growth and long term wealth creationover a 20 year period, three measures of return on capital and sales, and the viewof industry experts on the company’s innovative track record. With the resourcesat their disposal it was possible to interview 21 of the companies in depth, andconduct less intensive studies on the remainder. The research identified eightattributes which characterised the excellent, innovative companies as defined.Without going into the details of these attributes, the authors acknowledge that‘Most of these eight attributes are not startling.’ They also acknowledge thatthe eight attributes were not present to the same degree in all of the companiesstudied; however, the authors claimed that there was a preponderance of theeight in each company, and that the general traits of the companies wereobvious. This is something which we have to take on trust. The point here isnot to criticise the research, but to use it as an example of how difficult it is tofind out anything from the experience of actual companies.
The authors also acknowledge that they cannot guarantee that the companieswill remain in the excellent category, but they do maintain that these com-panies will cope with adversity better than companies which do not have theirattributes. This brings us to the logical problem in interpreting the researchfindings: the companies were defined as being excellent on the basis of beinggood market performers and having a good innovative track record; anotherway of looking at this conclusion is to say that successful companies stand abetter chance of being successful in the future, and the attributes identified inthe research may have little to do with future success. It does seem rather oddthat all of the excellent companies exhibited the identified attributes; there isclearly a danger here of having identified companies as being excellent on thebasis of the attributes in the first place, because that was what the researcherswere looking for. Because business conditions are continually changing, it isdifficult to falsify or verify the authors’ claim of continuing success; there isno doubt that the 43 companies listed on pages 20–21 of their book have gonein different directions: Wang Laboratories failed as did Digital Equipment, andGeneral Motors’ market share in the US dropped from 55 per cent to 33 percent, the company losing $4 billion in 1991; on the other hand companies suchas Disney Productions have continued to be highly successful. But this is not thewhole story, since Disney found it extremely difficult to transplant its successfulUS operations into France – the troubled history of Euro Disney is discussed inPractice Final Examination 2.
An important issue is whether they have performed, and will continue toperform, as a group better than companies which did not exhibit the excellentattributes; this would be the subject of another research project. On balance itseems that the research did not identify all the attributes of successful com-panies, nor can we be confident that those which it did identify were relativelyimportant. For example, it may be that the history of these companies since1982 can be explained by changes in competitive conditions, and the degreeof competitive edge conferred on them by the identified attributes had only aminor impact on their performance.
1/20 Edinburgh Business School Strategic Planning
Module 1 / Introduction to Strategy, Planning and Structure
An attempt to determine whether strategy making processes rather than othercompany characteristics make a difference to company performance was carriedout by Hall and Banbury.10 This was a large scale study which obtained responsesfrom over 300 companies, and it is interesting for the light which it sheds on theproblems of carrying out research in the area rather than in the statistical findingsthemselves (which are hedged with qualifications because of the limitations ofthe study). The objective of the study was to concentrate on whether a strategyprocess was followed rather than what it was; for example, the split betweenthe rational and the incremental approaches was considered too simple to beuseful. What the authors considered important was the accumulation of strategyskills over time, or the development of a strategy making process capability;this is clearly a subjective variable and is open to interpretation based on theinformation provided by the respondents. They pointed out that the one variablewhich cannot be used as a performance measure is current profitability, becauseof lagged effects; this means it is necessary to use measures such as new productdevelopment, innovation, social responsiveness and growth, all of which are alsosubject to subjectivity and may be irrelevant in certain cases. By and large, itwas found that strategic process capability counts: that the more firms in thestudy were able to develop competence in multiple modes of strategy makingprocesses then the higher their performance. But the authors make a telling pointwhich makes it impossible to draw specific lessons from the study: the directionof causation may be the other way round, and it may be that successful firmsadopt processes which accord with the definitions of strategic process capability.This is a particular problem when looking at a cross section of companies atone time, where it is not possible to pursue the dynamics of strategy makingand performance. So even a well specified and conducted study which producesstatistically significant findings may contain little more than a description of theway the world is.
1.2.7 Strategic Planning and Strategic Thinking
So far we have seen that strategic planning is a complex activity, that it hasmany definitions, that there are at least three different approaches to strategy,that strategy has the characteristics of a wicked problem, and that the scientificmethod cannot easily be applied to strategy. By this time you might well feelthat we have not been able to pin down exactly what strategic planning is,but all is not lost. We can in fact arrive at a useful definition of what strategicthinking is about.
It emerges from the discussion in 1.2.2 that functional specialists tend toregard business issues from their own perspective. Take the case of a newproduct launch. To the organisational behaviour manager a new product launchmeans internal change and its management; to the marketer it means marketresearch and consumer behaviour; the economist is concerned with whether itis the right time to be investing in expansion; to the accountant it means breakeven analysis; to the financer it means discounted cash flow and the rate ofreturn; to the quantifier it means understanding market research surveys andinterpreting often conflicting numerical arguments. Therefore to visualise the
Strategic Planning Edinburgh Business School 1/21
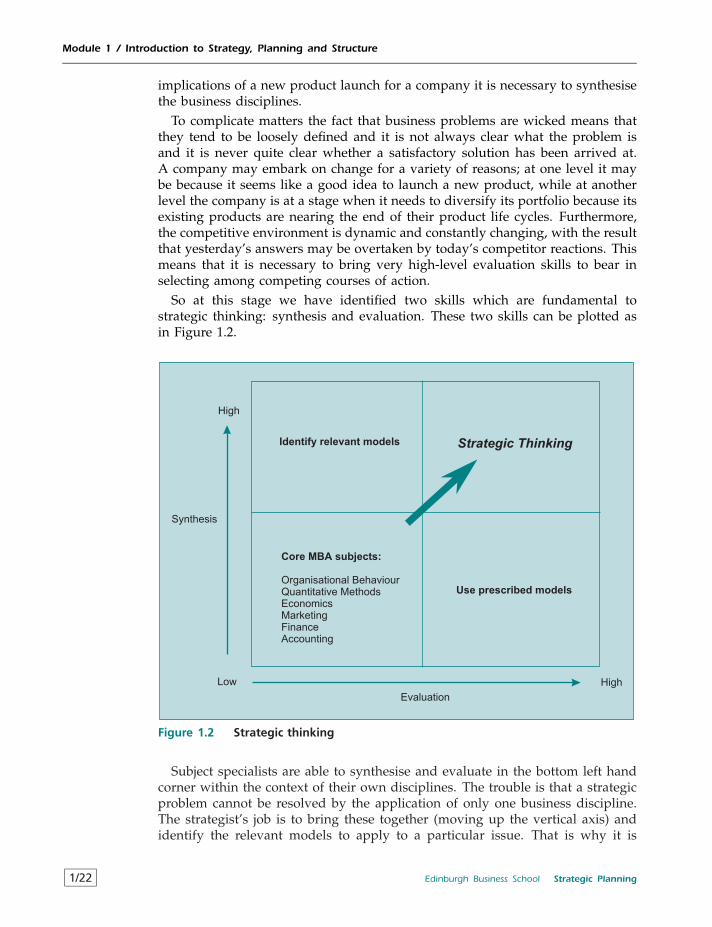
Module 1 / Introduction to Strategy, Planning and Structure
implications of a new product launch for a company it is necessary to synthesisethe business disciplines.
To complicate matters the fact that business problems are wicked means thatthey tend to be loosely defined and it is not always clear what the problem isand it is never quite clear whether a satisfactory solution has been arrived at.A company may embark on change for a variety of reasons; at one level it maybe because it seems like a good idea to launch a new product, while at anotherlevel the company is at a stage when it needs to diversify its portfolio because itsexisting products are nearing the end of their product life cycles. Furthermore,the competitive environment is dynamic and constantly changing, with the resultthat yesterday’s answers may be overtaken by today’s competitor reactions. Thismeans that it is necessary to bring very high-level evaluation skills to bear inselecting among competing courses of action.
So at this stage we have identified two skills which are fundamental tostrategic thinking: synthesis and evaluation. These two skills can be plotted asin Figure 1.2.
Low High
High
Synthesis
Identify relevant models
Core MBA subjects:
Organisational BehaviourQuantitative MethodsEconomicsMarketingFinanceAccounting
Strategic Thinking
Use prescribed models
Evaluation
Figure 1.2 Strategic thinking
Subject specialists are able to synthesise and evaluate in the bottom left handcorner within the context of their own disciplines. The trouble is that a strategicproblem cannot be resolved by the application of only one business discipline.The strategist’s job is to bring these together (moving up the vertical axis) andidentify the relevant models to apply to a particular issue. That is why it is
1/22 Edinburgh Business School Strategic Planning
Module 1 / Introduction to Strategy, Planning and Structure
necessary to have a sound knowledge of the core business disciplines beforeundertaking the study of strategic planning.
The strategist then has to weigh up the pros and cons of potential courses ofaction and arrive at a reasoned conclusion (moving along the horizontal axis)Thus the strategist has to think more widely and deeply than the individualfunctional specialists. This is an extremely difficult game to play and it goeswithout saying that unless you practice you will never get into the top righthand box. This course provides the structure within which the disciplines canbe synthesised and evaluation skills developed.
1.3 The Process of Strategy and Decision Making
Strategy decisions are by their nature complex, and involve many imponderables.The selection of a course of action depends on the availability and interpretationof information, analysis, intuition, emotion, political awareness and many otherfactors. Different individuals and groups emphasise different aspects and, in thesense that a strategy decision is an advance into the unknown, there is no correctcourse of action; all that can be done is to interpret the current situation, formexpectations about the future, and act according to personal views on risk andthe likely course of events. It is usually possible to identify courses of actionwhich are unlikely to be successful, and in that sense the strategy process canhave real benefits in helping to avoid disastrous courses of action. It must bestressed at the outset that it is naive to suggest that strategy decision makingcan be expressed in a mechanistic fashion, where the optimum course of actionis identified solely on the basis of an analytical investigation. However, it wouldbe defeatist to conclude that strategic planning is not susceptible to structuredanalysis; many complex areas of human endeavour can be systematised with aview to providing managers with insights into events.
1.3.1 Strategy Dynamics
It is important to stress from the outset that strategy problems cannot be analysedand resolved and then more or less forgotten about. In real life the day nevercomes when strategy decisions are made and all problems are solved. Thisis because the environment within which the company competes is constantlychanging: products move through the life cycle; new companies enter the market;consumer preferences change; government regulations change; major politicalevents alter markets both domestically and internationally. Thus the functionalview of management, i.e. the view that there is a set number of objectivesto be tackled by individual managers which, taken together, determine theeffectiveness of the company, is a limited interpretation of the strategy problemswhich companies face. Strategy can only be properly understood in a dynamicrather than a static setting.
It is only relatively recently that scientists have discovered the peculiar proper-ties of complex interdependent non-linear dynamical systems. The best knownexamples are in weather forecasting, where the models are so complex thatchanges in the inputs have unpredictable effects; in fact, the patterns over time
Strategic Planning Edinburgh Business School 1/23
Module 1 / Introduction to Strategy, Planning and Structure
produced by such systems are highly sensitive to initial conditions. It wasdiscovered that a great deal of what was thought to be random was in factdeterministic but chaotic, in the sense that it could be described mathematicallybut exhibited what appeared to be random behaviour. This led to renewedinterest in modelling the behaviour of the stock market, the behaviour of whichhas always defeated attempts at prediction. Needless to say, this has not beenat all successful (or if it has been no one is saying). A company can be regardedas a complex dynamical system interacting with its environment; this can bemodelled in such a way that relatively small changes in the environment will attimes cause significant changes in company performance. If the performance ofcompanies is chaotic it is impossible to model them or to predict their behaviour;the firm itself can be regarded as a complex adaptive system which attempts todevelop rules which will enable it to function in the complex environment. Atfirst, this might seem to be a bit theoretical, but it is as well to bear in mindthe possibility that the business system itself is possibly not capable of beingexplained or predicted because of dynamical effects.
To illustrate the importance of a dynamic approach to strategy, considerone of the numerous examples of how companies have been ‘turned round’by the application of strategy ideas. Without going into details, by the early1980s the Bank of Ireland was losing market share and was hampered in itsability to adapt to changing market conditions by the management structureand internal relations of a traditional bank. A number of strategic changes weremade: the Bank was reorientated as a retailer of financial services, and manyinternal changes were made, for example communications were improved aspart of the change process. As a result the Bank of Ireland regained its marketposition, increased its product portfolio, and prepared itself to operate on theforefront of changes in the banking market during the 1990s. But this did notmean that the senior executives of the Bank could regard their strategy job ascompleted. Factors such as the development of the free trade area in Europe,the increasing strength of international financial entities, the changing patternof personal expenditure, rapid technological advances in payment methods, andthe reaction of competitors still have to be monitored. Therefore, while it ispossible to pin-point specific strategy successes in a particular company, it isnecessary to ensure that these are not simply temporary, and that when the nextmajor change occurs the company does not lose its competitive advantage again.
Another example is British Airways, which in the early 1980s was an inefficientstate owned airline with a poor record on service and profitability. After BritishAirways was privatised, the dynamic Lord King was largely credited withturning the company into ‘the world’s favourite airline’, and by the mid 1990s itwas recognised as one of the most effective airlines in the world. Both profits andpassengers carried increased steadily during the 1990s. But in 1996 the companyannounced the need for further rationalisation and the prospect of severalthousand job losses; subsequently it changed focus towards attracting high farepaying business passengers at the expense of the low fare high volume holidaymarket. A complicating factor is that the only real assets that British Airways(or any other airline, for that matter) needs is the route structure and brand.Everything else can be purchased or contracted in. This set British Airways online to be the world’s first ‘virtual airline’. In the face of its earlier success why
1/24 Edinburgh Business School Strategic Planning
Module 1 / Introduction to Strategy, Planning and Structure
was such a radical restructure required? Looking ahead, the company could seethat as regulation was relaxed and competition from low price carriers increasedthe current cost structure of British Airways would plunge it into the red. Inother words, it no longer had a sustainable competitive advantage.
To pursue the dynamic dimension of strategy further, the following exampleexamines the process by which a mythical company arrives at a strategy decision.It is not derived from a specific ‘real life’ company example because it is designedto bring out many facets of strategy without relating it to a specific case; it ispartly based on discussions monitored in management groups when runningsimulations of companies.
The CEO of this mythical company is cast in the role of strategic planner, andevery day he comes into work he asks himself questions like the following:
• How well are we performing?• What should we be doing in the future?• How can we achieve successful change?
1.3.2 The Mythical Company
The company is engaged in the production of electrical components for bothconsumers and companies. It has been in existence for five years, and currentlyproduces three products which are related to each other both in their productiveand market characteristics (Plugs, Switches and Fuses). Current sales amount toabout $35 million per annum, and the company employs about 300 people. Ofthese, 250 are employed in manufacturing, and the remaining 50 in research,development, administration and marketing. The company is organised intothree product divisions.
From now on we follow the CEO as he pursues his role in strategic manage-ment by tackling his three questions.
1.3.3 How Well Are We Performing?
CEO’S STATEMENT TO THE BOARDThe company has been making a profit for the past three years, but there aresigns of increasing competitive pressures in existing markets; the researchdepartment has some products under development which at this stage seemto have the potential to generate profits, but might entail some change ofdirection. The first step is to get reports on current activities from eachfunctional area in the company; these reports should be expressed in non-numerical terms because we are concerned with the overall view at thisstage rather than the precise details.
ACCOUNTING REPORTThe company is currently making 14 per cent return on assets. But the Plug,which was launched last year, is currently making a negative contribution tooverall performance, and profitability would be increased by abandoning it.While our overall operating surpluses generate a good return on assets, our
Strategic Planning Edinburgh Business School 1/25
Module 1 / Introduction to Strategy, Planning and Structure
cash flow position is not good because of current expenditure on researchand development. Are we convinced that there is a long term payoff fromcontinued expenditure on research and development at the current level?
RESEARCH AND DEVELOPMENT REPORTWe currently have four products under development which will be readyfor launch in the next year. These will complement our existing productlines, and one of them represents a major technological breakthrough. Fur-thermore, we have a highly productive team engaged in the search for newideas, and we are confident that we shall continue to produce a streamof potentially profitable prototypes in the future; these are, after all, thelife blood of our company, since without new products we shall not lastvery long. The company should not adopt a short-sighted and restrictiveapproach to our budget.
MARKETING REPORTWe are in a highly competitive market, and the product life cycles are quiteshort, and may become shorter in the future. At the moment we have twocash generating products in the Switch and the Fuse, and a potentiallyprofitable product in the form of the Plug. At the moment the Switch andthe Fuse are subsidising the Plug, but the prospects for the Plug are verygood in the longer term; we cannot make decisions on abandoning the Plugon the basis of its historical contribution. It is essential that we not only keepthe Plug on the market, but that we continue to search for new products.We need to increase our product portfolio if we are to accommodate thecombination of life cycle effects and increased competition. However, weshould be wary of diversifying into areas where we have no experienceof selling, and where production skills may be different. While marketshares are reasonably secure for the Switch and the Fuse, our technologicaladvantage in both has been undermined by imitators from abroad; it looksas though we can expect the selling price of both to fall by about 20 percent over the next couple of years as competition increases.
FINANCE REPORTThe marketing department has provided projections of demand for the fourproducts which are in the development stage, and the accounting depart-ment has provided details of likely cost. A detailed financial appraisalsuggests that only two of the four projects currently being developedseem capable of generating an adequate rate of return. Development ofthe two poorest products should be abandoned, and we should devotemore resources to basic research, i.e. to identifying new market opportuni-ties. The marketing department have pointed out the problems of movinginto new markets; however, there may be some advantage to diversifyingour portfolio of risks.
ECONOMIC REPORTThe economy has been in a depression for the last couple of years, butthe government’s more liberal monetary policy seems likely to cause asubstantial stimulus to economic activity. In fact, if the economy had been
1/26 Edinburgh Business School Strategic Planning
Module 1 / Introduction to Strategy, Planning and Structure
in better shape we would have been more profitable than we have been.We should be looking forward to buoyant demand in most sectors duringthe next year. However, the international sector has become increasinglyuncertain. The government has recently announced that monetary policywill be relaxed, and this is likely to be associated with a reduction ininterest rates, which may cause the currency to depreciate; this would beto our advantage in export markets. However, there is a move towardsprotectionism which could have serious consequences for our sales in somecountries.
PRODUCTION REPORT
We have not coordinated production and orders very well, and we havebuilt up substantial inventories of Switches and Plugs, while we havebacklog orders for Fuses. We should be diverting resources to the productionof Fuses at the expense of Switches and Plugs. However, if we switchmanpower about we may adversely affect productivity. It may be more costeffective to sacrifice sales of the Fuse because of the increase in unit costwhich would result from reducing, even temporarily, output of the Switchand Plug. Furthermore, I have some reservations about the accountingdepartment’s conclusion that the Plug is a liability; we have been producinga substantial proportion of output for inventory; the problem is not thatwe are incurring high production costs, but that we are not actually sellingwhat we are making. We currently have a poor system for communicatingproduction requirements.
MANPOWER REPORT
We have now developed a skilled and motivated labour force, and this isreflected in the fact that unit labour costs are now ten per cent lower thanthey were three years ago. We have been able to provide stable employmentfor the labour force and a general feeling of confidence in job security withthe result that the attrition rate is minimal.
CEO’S SUMMARY
We now have information on which to base an analysis of our strengthsand weaknesses. Our strength is that we have carved out profitable marketsfor two products, and there are some signs that our third will make acontribution to profits in the future. We have a company which has astructure and workforce which provides us with a potential cost advantage;we also have a productive research department. We have some internalweaknesses, such as the fact that we are not always coordinating productionand sales, with consequent inventories and backlogs. Our main weaknessis external; there are ominous signs that competition is increasing in ourestablished markets and if we wish to grow it may have to be in a differentdirection. We may not be equipped to do this.
Strategic Planning Edinburgh Business School 1/27
Module 1 / Introduction to Strategy, Planning and Structure
1.3.4 What Should We Be Doing in the Future?
CEO’S STATEMENTThere are three broad strategies which we could follow. First, we couldcarry on doing the same things as in the past, and accept that our marketsare likely to come under increasing competitive pressure. We can rely onthe invention of new products to carry us into new markets as the old onesdisappear. Second, we could attack our existing markets more aggressively,attempt to maintain or increase market share, and accept that this will leadto short term reductions in profitability. However, over the longer periodthis has the potential to pay off. Third, we could combine the secondoption with expansion into new markets to diversify our activities. I havehad some informal discussions with Easy Turbines, who would welcomea friendly take-over because of their cash flow problems. This would giveus a relatively painless entry into the turbine market, but carries the riskthat we do not know much about making turbines or the turbine market.However, this will provide us with a basis from which to grow in the longerterm. We now require a report from each functional area on potential futurecourses of action.
RESEARCH AND DEVELOPMENT REPORTGiven the four products we are currently developing, and the number ofideas which we have for prototypes, we see the possibility for significantdiversified expansion in the medium term. All we need is an additional$5 million over the next year to speed up the launch of our developmentprojects.
FINANCE REPORTOur colleagues in research are being a bit optimistic, because only two ofthe products they are working on seem capable of generating a positiveNPV at the current cost of capital, even on the most optimistic marketingestimates. Furthermore, we have not been explicit enough in the past inrelation to the measurement of risk, and our attitude to risk taking. Therisk adjusted rates of return suggest that we should stay in the markets wehave already developed, and only venture into new ones as a last resort.However, the fact that Easy Turbines has cash flow problems at the momentmeans that we might be able to acquire it at a bargain basement price.
ECONOMIC REPORTThe prospects for the economy are good, and profitability will increase nextyear even if we do not change our current marketing strategy. However, it islikely to be difficult to increase market shares because the price elasticity ofdemand for our products is quite low. The new products should be highlysuccessful on launch, because they are mainly aimed at export marketsand there are signs that the currency is going to depreciate significantly inthe next few months. Longer term prospects will be partly dependent ondiplomatic solutions to increased protectionism.
1/28 Edinburgh Business School Strategic Planning
Module 1 / Introduction to Strategy, Planning and Structure
MARKETING REPORTThere is a limit to how long we can stay in our established markets. Ourcash cows could come under competitive attack at any time. We need todiversify to stay alive in the long run, and the four products which theresearch department have on the stocks would fit the bill perfectly. Someof them may not seem financially attractive, but the financial analysis takesa very narrow approach to the benefits of developing a new range ofproducts. I am not sure about the proposal to enter the turbine marketthrough acquisition because at this stage I do not know much about thatmarket. I would like to know if Easy Turbines’s cash flow problems havebeen due to sales problems.
ACCOUNTING REPORTIf we try to follow a strategy of diversification we shall quickly run out ofcash, because the payback period of the new products on the stocks is quitelong, even assuming that the marketing department is not being overlyoptimistic in relation to expected sales. Furthermore, the measures of returnon investment and capital employed will be adversely affected, and this islikely to affect our share price, perhaps making us susceptible to take-over,never mind us taking over Easy Turbines. I think the idea of taking overanother company is far too speculative and is not a realistic option.
OPERATIONS REPORTAt the moment we have spare factory capacity, and there is no problem inrecruiting more labour, given the current state of employment in the localarea. However, if we do embark on expansion into new products we shallhave to undertake a major training programme.
MANPOWER REPORTAny attempt to diversify must take into account that an infusion of labour,and a change in what people are doing, may have substantial implicationsfor morale. The attempt to exploit new markets will require a change inwhat people do, and we shall have to ensure that we have the backingof the complete workforce to achieve success. There is little doubt thatwe shall be faced with many problems in implementing a growth anddiversification strategy, and we may be faced with much higher attritionrates and lower productivity growth than in the past. In this situation thereis a real productivity payoff from better communications, incentives gearedto performance, and the development of a company culture.
CEO’S SUMMARYThe immediate threat facing us is that we are in danger of isolating ourselvesin declining markets where competition is becoming increasingly fierce. Thepotential threat facing us is that if we decide on expansion we are movinginto unknown markets which have a high degree of risk; this move maymake us open to take-over. While we could pre-empt this by taking overEasy Turbines, I do not think the idea of diversifying through take-over isappropriate at this stage: as far as I know, the chances of such a venturebeing successful in the long run are not high – in any case it would take
Strategic Planning Edinburgh Business School 1/29
Module 1 / Introduction to Strategy, Planning and Structure
a long time to set up the financial infrastructure necessary even to thinkabout making a hostile bid for a company.However, there are clearly many opportunities. We have the resources toexploit our existing markets, and we have products which can be used tobroaden our portfolio. The price of the company’s shares on the stock markethas been reasonably stable for some time. However, the Board feels thatour shares are undervalued, and that the market has not taken into accountthe recent relatively large expenditures on research and development. Oneof the Board members recently received this confidential report on us fromhis stockbroker.
MARKET ANALYST’S REPORTThis company displayed strong growth for the first three years of its existence.Since then it has tended to rest on its laurels, despite the fact that it is in a highlycompetitive and changing market. Recent expenditures on research and developmenthave tended to depress profitability, and to some extent this has been reflected inthe share price. But there is no guarantee as yet that the company managementhas the vision to maintain its current market position, or to diversify into relatedmarkets which will lead to continued growth.It is therefore time that we shed the image of conservatism and proved tothe market that we have the ability to grow and generate profits in the longrun.
There are clearly different views on what course the company should pur-sue. For example, the finance department is opposed to expansion because ofreservations about the new products, but do think that an acquisition might bethe way forward. The marketing department is in favour of expansion becauseof optimism concerning future prospects for a diversified company, and theeconomics department is in favour of expansion but has reservations about themarketing strategy. The CEO’s job is then to arrive at a decision which willbe supported by the functional managers, since without them nothing can bemade to work; he must acknowledge the fact that while each of the functionalmanagers is able to offer a reasoned exposition of how things are and whatthe company should do, each is preoccupied with his own viewpoint. You willnotice that each functional manager tends to talk his own ‘language’. If the CEOis not educated in management he might find some of the discussion baffling;for example, the marketing manager referred to product life cycles, the accoun-tant to return on assets, the finance manager to a positive NPV, the economist tomonetary policy and so on. In the course of a discussion like this each managercannot keep asking the others to define terms. So in order to develop a strategyfrom the range of views it is essential that the full implications of what mightappear to be innocuous statements are appreciated by everyone concerned, andin particular by the CEO who is charged with the responsibility of deciding whatto do next. The process by which the decision is arrived at would be a story inits own right, but suffice it to say that the management team is persuaded bythe CEO’s vision of shedding the company’s conservative image, and agrees topursue an expansionary, diversified strategy but without attempting to acquireEasy Turbines.
1/30 Edinburgh Business School Strategic Planning
Module 1 / Introduction to Strategy, Planning and Structure
1.3.5 How Can We Achieve Successful Change?
The CEO set the functional managers to work to prepare a programme forchange. Based on their understanding of what needs to be achieved in theirindividual areas the team arrives at a five point plan.
1 Attempt to attain a higher degree of competitive advantage in existingproducts and step up research and development efforts.
2 Improve resource planning by introducing ‘just in time’ techniques andco-ordinating more closely with marketing.
3 Improve market intelligence and improve economic analysis.4 Introduce more rigorous control systems to monitor company performance.5 Communicate company goals to everyone; develop a company culture so
that individuals can identify with the company’s objectives.
The exact details of how the new company objective is attained will dependon how events unfold.
1.3.6 Strategy and Crises
Why do managers find it so difficult to get together to devise and implementcompany strategy? Part of the answer is that there are many pressing problemswhich must be dealt with on a day to day basis which divert attention fromstrategy, and which do not apparently bear on the immediate problems facingmanagers. Imagine that the outcome of the strategy discussions is circulated onWednesday. By Friday the following incidents have occurred.
CASH FLOWA major customer has run into problems and will not be able to settlecurrent accounts for six months. This means that cash flow for the next sixmonths will be negative.MEMO from Accounting Department to CEO. In view of the additionalcash flow strains which the proposed strategy changes will involve, thestrategy changes should be shelved.
JAPANESE INVASIONIn a surprise announcement, the Japanese have revealed the developmentof an electrical device which will reduce market share of the Fuse by about5 per cent, unless a strong marketing offensive is launched.MEMO from Marketing Department to CEO. All marketing resources willhave to be diverted to meet the Japanese challenge for the next few months;the strategy changes should be shelved.
HEAD-HUNTEDThe finance director has been head-huntedMEMO from Finance Department to CEO. In view of the many complexfinancial issues which will be raised by the proposed strategy, we musthave a finance director of experience and vision; until we can recruit areplacement the strategy changes should be shelved.
Strategic Planning Edinburgh Business School 1/31
Module 1 / Introduction to Strategy, Planning and Structure
DEVELOPMENT COST OVERRUNSSome unexpected problems have been encountered and the developmentdepartment will not be able to bring the new products to the market withinthe original projected budget.MEMO from Development Department to CEO. We need to re-evaluateour options but, given the turmoil in the Finance Department, this will notbe possible for some time; the strategy changes should be shelved.
LABOUR RELATIONSThe first attempt at communicating the new strategy was disastrous. Aftera preliminary discussion labour representatives interpreted the proposedchanges as an attempt to increase productivity at the expense of a deteri-oration in working conditions; the notion of a new incentive system wascriticised severely.MEMO from Personnel Department to CEO. It looks like it will take moretime than we thought to sell the proposed strategy to the workforce; thestrategy changes should be shelved until such time as we can achieveprogress on this front.
No doubt more issues will crop up the following Monday, and will continueto emerge. The salient point is that even though the individual managers haveagreed with the overall interpretation of the current state of the company andwhat it should be doing in the future, their own immediate concerns naturallyappear to be more urgent than the implementation of a course of action whichhas no obvious short term payoff. The CEO now has several options.
• He can agree with his managers, and shelve the changes until times aremore favourable; he will be aware that this is likely to be a fond hope.
• He can attempt to amend the proposed changes to take account of what hashappened; in this case he will find himself attempting to hit a target whichnever stops moving.
• He can point out that the strategy is based on an agreed vision of thecompany as it exists and the necessity to adjust to the changing marketplace; the crises are evidence that the company does need a strong sense ofdirection so that management is not merely a series of reactions to everydayevents. The job of the managers is to achieve the general objectives giventhat these crises are always going to occur.
But there is another way of looking at the problems which have arisen and theindividual managers’ reaction to them. The CEO decided on a course of actionand set his managers the task of determining what should be done. But it seemsthat no one was given the job of determining how the five point plan wouldactually be implemented. Thus the CEO’s approach was strong on identifyingobjectives and courses of action, but weak on implementation; as a result theoverall plan was vulnerable to the types of crisis which occurred.
It must be accepted that no plan can be inflexible, and that it should bemodified as additional information becomes available; the crisis events can beregarded as new information to take into account in refining the overall strategy.
1/32 Edinburgh Business School Strategic Planning
Module 1 / Introduction to Strategy, Planning and Structure
For example, the Japanese invasion is indicative of the fact that competitivepressures are changing more quickly than anticipated, and that some resourcesshould be diverted to protecting the Fuse; where these resources should comefrom is a problem for the management team.
1.3.7 Elements of Strategic Planning
Apart from recognising that some degree of forward thinking is important, isit possible to extract any lessons of general applicability from what happened?The CEO asked specialist managers various questions, and they generated a lotof information and opinions, and finally a course of action was decided on. Infact there are five aspects of what happened which are important to recognise.First, individual managers used a structure of thought to tackle problems withintheir area. Second, managers applied this structure to the analysis of data. Third,the CEO integrated the different types of analysis presented by the managersin order to arrive at a decision. Fourth, a system of evaluation was devised tomonitor the allocation of resources. Finally, the door was left open to modify thestrategy as events unfolded. These components of strategic planning are worthconsidering in some detail.
Structure
The first thing the CEO did was to ask his functional managers to provideinformation on the current state of the company. He expected to get differentinformation from each because the functional managers bring different typesof expertise to the issue. For example, the finance manager used the theoryof finance to evaluate alternatives; the marketing manager used the theoryof competitive advantage to work out marketing strategies; the economist usedmacroeconomic theories to explain and predict the impact of government policieson product markets; the manpower manager used theories of group behaviourand motivation in drawing up work schemes. These theories provide functionalmanagers with a structure within which to tackle problems. This structure iscomprised of a body of theory which introduces order into the complexities ofthe real world; without a structure the answers which any of the functionalmanagers produced could have been based on completely irrelevant factors, andthis would not have been apparent. That is why it was noted earlier that eachmanager appeared to be speaking a particular language.
In order to make sense out of the complexity of life it is necessary to imposean intellectual structure on events and processes. A theoretical structure makesit possible to tackle new problems in a systematic manner; the lack of generalprinciples which can be applied to seemingly different issues leads to inconsis-tency, and to an impartial observer decisions may appear to be taken at random.When there is no structure, managers will not appreciate that apparently dif-ferent situations share common themes and are susceptible to similar types ofanalysis and solution. It is something of a paradox that while most companieswould like to have a system for allocating resources in the long run, i.e. ameans of seeing how things fit together, which potential opportunities shouldbe pursued, and how resources should be mobilised to take advantage of them,
Strategic Planning Edinburgh Business School 1/33
Module 1 / Introduction to Strategy, Planning and Structure
it is not necessarily appreciated that this presupposes structured thinking. Forexample, everyone is aware that prices vary over time. But what is not alwaysobvious is that relative prices often change significantly, because changes in rel-ative prices are often masked by general price changes, i.e. inflation. A managerneeds to be aware of the difference between nominal and real price changes, beable to identify where there have been significant changes in relative prices, andthen be able to analyse the factors which have caused relative prices to change.
To put this in perspective, the real price of television sets has declined duringthe past fifteen years. However, the decline in real price has generally beenoffset by inflationary price increases, with the result that the nominal priceof television sets has risen in most countries. But what has happened to therelative price of colour and monochrome television sets? Demand and supplyinfluences in these markets have led to changes in the ratio between the pricesof monochrome and colour television sets, i.e. to changes in the relative prices.In order to understand why the relative prices of the two types of televisionset have changed it is necessary to have a theory of supply, demand and pricedetermination.
An aspect of business which makes the application of structured approachesdifficult is that the manager’s average day is characterised by a continuoussequence of seemingly unrelated activities; many researchers have attempted torecord and classify managers’ daily routines with the objective of identifyingwhat comprises efficient managerial behaviour. A general finding is that theeffective manager needs to do more than provide fast, efficient reaction toevents as they occur; it is also necessary for managers to have a structure withinwhich priorities can be established and objectives identified. Such a structure canbe based on the core business disciplines which contain a body of theory whichcan be brought to bear on general problems in the areas of finance, marketing,human relations, and so on.
The notion of a conceptual structure can be generalised from the individualspecialities to the company as a whole. The lack of a structured approach toplanning activities can lead to a reactive management style and arbitrary decisionmaking criteria. It is a common observation in business that individual managersbecome frustrated by apparently arbitrary decisions which do not relate to anyoverall purpose; decisions which may be unpleasant for the individual can bemade acceptable if they are seen to occur within a recognisable framework.When it comes to making choices between competing alternatives, the absenceof a structure within which to allocate resources can lead to the companydeveloping a random portfolio of products; it is possible for the company toexist and grow indefinitely in such a manner, but it is continually faced withthe prospect of being confronted by problems which might have been avoidableor predictable within an understood structure.
In the Mythical Company, the CEO imposed a general structure on the infor-mation presented to him by thinking in terms of the company’s strengths andweaknesses: the threats posed by changes in market conditions and the oppor-tunities existing in related markets. By balancing up these categories he arrivedat his vision, or the strategic thrust which the company would follow.
A word of caution is necessary about structured approaches. The decision
1/34 Edinburgh Business School Strategic Planning
Module 1 / Introduction to Strategy, Planning and Structure
structure which has been developed for the company may be inappropriateor out of date; the classic instance is the control system which no one reallyunderstands but which gives the illusion of control. To operate in the beliefthat because a structure has been developed it is the right one is possibly moredamaging than to have no control system at all. Even when the right choice hasbeen made initially, to be effective the structure must be continually adapted tocope with changing circumstances, and be known and understood by the rightpeople in the company.
Analysis
The information the functional managers provided was in the form of analysesbased on their individual areas of expertise. A structure is of little use inbusiness unless it can be applied to real world problems. Many advancedeconomic theories comprise a powerful structure of thought, but they have norelevance to business because they cannot be used to analyse issues which arisein companies. In this case each functional manager analysed the informationrelevant to his part of the company’s operation and came up with a variety ofconclusions.
The structure of thought requires to be supplemented with tools and tech-niques of analysis in order to make sense of relationships and data. Informationavailable in real life often appears to be conflicting, and at times downrightuseless: this can lead to the ‘don’t confuse me with the facts’ syndrome. Theability to make sense of data and interpret statistics requires an understandingof basic concepts – in finance, accounting, economics and marketing – togetherwith the tools of quantitative methods which enable data to be manipulatedand events better understood; for example, why is it that when the price of ginrises the quantity of tonic sold falls and the quantity of whisky sold increases?The reason is that gin and tonic are complements, while gin and whisky aresubstitutes; when the price of gin increases relative to the price of whisky, somedrinkers will substitute whisky for gin. Since gin and tonic are complements,the quantity of tonic purchased will fall with the quantity of gin purchased. Theextent to which the quantities of gin, tonic and whisky purchased will changedepends on the responsiveness of demand to price changes, otherwise knownas elasticity.
Analytical techniques also help to identify what information is importantand what is irrelevant; in modern life the problem is typically not the lack ofinformation, but the lack of relevant information. For example, there is plentyof information available on the sales of gin, tonic and whisky over time, bygeographical area, across different social groups, by brand and so on. But thereally important information is difficult to obtain: what is the price elasticity ofgin, and what is the degree of substitution between gin and whisky.
Many managers take the view that management is an art rather than ascience, and that concentration on data is counter-productive. It is, of course,naive to suggest that management problems can always be solved by recourseto numbers, and by statistical and financial calculations. However, rigour andanalysis should not be confused with manipulation of numbers. Sometimes allthat is available is qualitative rather than quantitative information, but this does
Strategic Planning Edinburgh Business School 1/35
Module 1 / Introduction to Strategy, Planning and Structure
not imply that analysis is irrelevant. For example, at the very least it is usefulto know whether we are dealing with positive or negative quantities, suchas whether cash flow is likely to be positive or negative; the rough order ofmagnitude may be all that can be concluded from available information, buteven this can be useful in determining whether a project is likely to be within acompany’s resources. The non-quantitative analytical approach can help identifywhether the balance of influences is favourable or not to a potential course ofaction. Always bear in mind that your competitors will also be trying to make asmuch sense as possible from available data; adopting a non-analytical approachcould put the company at a serious disadvantage.
To summarise, the following issues have an important bearing on the analyticalapproach.
1 Do not confuse rigour with numbers.2 Precision is not essential.3 Data can be expressed as:
• relative orders of magnitude.• positive or negative.• quantitative or qualitative.
A rigorous approach to issues does not necessarily mean that numbers areinvolved; the use of theories and concepts to clarify problems and evaluatepotential solutions can be independent of the precise numerical quantities. Con-versely, the fact that numbers are presented as part of an argument is noguarantee of the rigour with which the argument itself has been developed.
All information about markets, finance and the economy is subject to a degreeof error. This means that there is nothing to be gained by attempting to be highlyaccurate; while the appearance of several figures after the decimal point mayimpress the unwary, such precision is spurious. Rather than concentrating on theaccuracy of calculations, there are some general issues to which attention shouldbe paid when dealing with numbers. First, whether the orders of magnitudesuggested by the numbers are large or small in relation to the operationsinvolved. If the relative magnitude of the numbers is small, the issue is ofminor importance; for example, a marketing analyst may predict that the costof introducing a new brand to maintain market share is around $5 million,but if the total value of sales is $385 million there is not much to be gainedby attempting to be more exact about the figure of $5 million. It is sensibleto avoid spending time refining relatively unimportant items of information.Second, whether the numbers are positive or negative; examples are whether itis expected that a market will increase or decrease in the future, or whether cashflows are likely to be positive or negative. Third, impressionistic or qualitativeinformation has a role as opposed to numerical information.
For example, a feeling that fashions were likely to change in the late 1980sas a result of the change in attitudes towards wearing animal fur could notbe quantified, but it had important strategic implications for manufacturers offur coats. A fur company which realised early on what was happening couldhave investigated the likely effect of, say, a 10 per cent reduction in demand for
1/36 Edinburgh Business School Strategic Planning
Module 1 / Introduction to Strategy, Planning and Structure
fur coats and decide whether production should be reduced immediately andinventories run down to a new level; it could also attempt to predict the effect onprices using its knowledge of demand and supply conditions in the fur market,and produce a forecast of the implications for cash flows. The company couldalso investigate the implications of a continuing fall in demand, or stabilisationof demand at the new low level, or an eventual return to original levels as man-ufacturers took action to counter the ‘endangered species’ argument. Comparethe likely competitive position of such a company with one which made nopreparation for the change in market conditions and suddenly found itself in asituation of unsold stocks, falling prices and cash flow difficulties.
This perspective on the effective use of information can help to throw lighton the seeming contradiction between what theory says managers should do,and what they are actually observed to do. The theory suggests that managersshould make careful use of information in analysing situations and arriving atconclusions. But the research reveals that managers have a tendency to rely onabbreviated and verbal accounts. The argument above suggests that in the firstinstance it is important for managers to determine the direction of change andthe rough order of magnitude; in many instances the course of action whichthese suggest may be virtually unaltered by more detailed information which,because of the errors associated with information, may itself be suspect. As aresult, there are likely to be significantly diminishing returns at the margin tothe effort devoted to analytical detail. This leads to the paradoxical situationthat the educated manager is able to identify what information is really requiredto deal with a particular issue, and the level of detail to arrive at an informedconclusion in an economical manner, but that this behaviour may appear to beshallow and impressionistic when observed by a researcher who concentratesonly on identifying the use of detail.
Integration
In the example discussed above, the CEO was faced with a variety of analysesbased on different structures. His task was then to integrate them; no singlefunctional manager provided the perspective to decide which of the strategyoptions to pursue. The CEO added a vision of where the company was goingand an overview of the information provided by the functional managers inarriving at a strategic thrust.
Each of the business disciplines has a part to play in developing the overallstrategy; an important management skill is to recognise when specific disciplinescan be applied, and to identify the tools and concepts relevant to differentsituations. It is not necessary for the manager himself to be able to carry outa financial appraisal or a marketing study, but it is necessary to be able tosee when such studies are required, to understand them well enough to makeconstructive criticism, to visualise the relative importance of the various results,and to be able to fit the results into the formulation of strategy.
Consider the process of deciding whether to develop and market a brandnew product. Market research techniques are used to identify the potential salesand the marketing strategy to adopt to manage the product once it has beenlaunched. Financial appraisal shows the likely rate of return on investment
Strategic Planning Edinburgh Business School 1/37
Module 1 / Introduction to Strategy, Planning and Structure
in the product, and provides information to compare it with other potentiallycompeting investments. Economic analysis provides information on optimumpricing and potential threats which may arise at industry, national or interna-tional levels. Organisational behaviour theories will suggest policies designedto get the best out of the workforce. Accounting techniques will monitor thecosts of production in relation to the revenues from sales. It is the manager’sjob to ensure that the appropriate techniques are applied at the right time, andthe manager needs to be able to grasp the meaning of the diverse types ofinformation which different techniques generate.
Integration is an essential component of strategy because the implications ofspecific recommendations in one area can have implications for other aspectsof company operations. For example, a proposal to abandon a product may bebased on a financial appraisal which suggests that the value of the companywould be decreased as a result of a reduction in cash flows; the financial argu-ment needs to be weighed up against potential negative effects. The personneldepartment might argue that the effect on employee motivation and commit-ment could be serious because everyone feels that it is a ‘worthwhile’ product tomake; the production department might claim that while the product has a pooraccounting contribution it has helped to eliminate excess capacity in the past,and this is not reflected in the accounts; the marketing department might arguethat the product is still at an early stage in the evolution of its life cycle and hasa substantial longer term potential. The strategy problem is to incorporate andreconcile the implications of the specialist disciplines, which in this case suggestdifferent courses of action.
Integration goes beyond simply adding up the pros and cons as presentedby the individual disciplines. The decision on abandoning the product willultimately depend on the extent to which it fits with the strategic thrust of thecompany. For example, broad economic and social trends might indicate thatthere is no future in current and related markets beyond the medium term, andthe company should be thinking in terms of a change in direction. In this casethe real strategy question may be when, rather than whether, to abandon theproduct.
Evaluation
It was recognised by several functional managers that it was necessary toevaluate performance. In the light of the many crises which the companywould be facing, it was clear that it would be essential to attempt to determinehow well resources were being allocated in the pursuit of the strategy goals.
In order to monitor the performance of the company it is necessary to devisemeasures which generate information on how well objectives are being attained.A variety of measurements can be used to evaluate company performancesuch as Return on Investment and Profit Margin, and the efficiency with whichresources have been allocated can be judged by measures such as Asset Turnover,Contribution on Assets and Sales per Employee. While difficulties are oftenencountered in interpreting and reconciling aggregate measures of performanceand efficiency, such measures serve the functions of providing an early warningof potential problems, and of identifying areas of potential concern. A further
1/38 Edinburgh Business School Strategic Planning
Module 1 / Introduction to Strategy, Planning and Structure
problem is that it is not possible to express all targets in quantitative terms;for example standards of service, corporate image and degree of product dif-ferentiation cannot be measured in ways which provide a clear indication ofperformance.
In a competitive environment absolute measures of performance are lessimportant than measures relative to the competition. Studies have found thatcompanies rarely set even their financial goals relative to competitors. A verygood reason for the lack of competitively set benchmarks is the difficulty ofobtaining information about competitors; but even if it is difficult to obtainrelevant information, it is well worth the trouble. This is because industry-widechanges affect all firms, and by focusing on performance relative to competi-tors this distorting influence is minimised. For example, the absolute target ofincreasing return on assets by 2 per cent may be rendered impossible by anunexpected 10 per cent increase in raw material costs; if the target had beendefined as achieving a return on assets 2 per cent higher than a major competitorthe firm would be able to judge its reaction against the indication of best practiceas achieved by the competitor.
Aggregate measurements of company performance cannot be used to provideguidelines at all levels in the organisation, and it is necessary to devise measureswhich relate properly to the objectives which have been set for individuals andgroups. This is difficult to achieve in practice, and it is possible to end up witha set of performance measures which do not adequately reflect the efficiencywith which resources are allocated at different levels in the company. Therecan be few more pointless activities than to censure departmental managers fornot performing well on the basis of performance measures which are almosttotally meaningless. In fact, the use of irrelevant performance measures can becounter-productive and have serious long term consequences for the companyas a whole. In the short term, it is only to be expected that employees willbecome dispirited and lose their motivation if their efforts and successes arenot reflected in measured outcomes; this has implications for productivity andinnovative behaviour. In the longer term, the company is liable to misallocateits resources in striving to maximise misleading measurements of objectives. Forexample, evaluation of the sales force on the basis of growth in sales valuemay lead to a level of sales where the full cost of additional sales is greaterthan the additional revenue generated: capacity may be overstretched to meetthe demand, service teams may be unable to support sales outside large cities,and resources may be diverted from product development. Thus while the salesmanager is performing well in terms of his measure, managers in other areassuch as production and support will find their performance measures declining.
Feedback
If a company does not monitor, react to and learn from feedback its strategieswill quickly cease to be aligned with actual events. In the case of the MythicalCompany, the CEO was immediately confronted with feedback on both internaland external factors, all of which had implications for carrying out the agreedstrategy; he now has to make decisions on how to adapt to these changes. Inthe longer term the CEO would require feedback on the implementation of thestrategy and measures of company performance.
Strategic Planning Edinburgh Business School 1/39
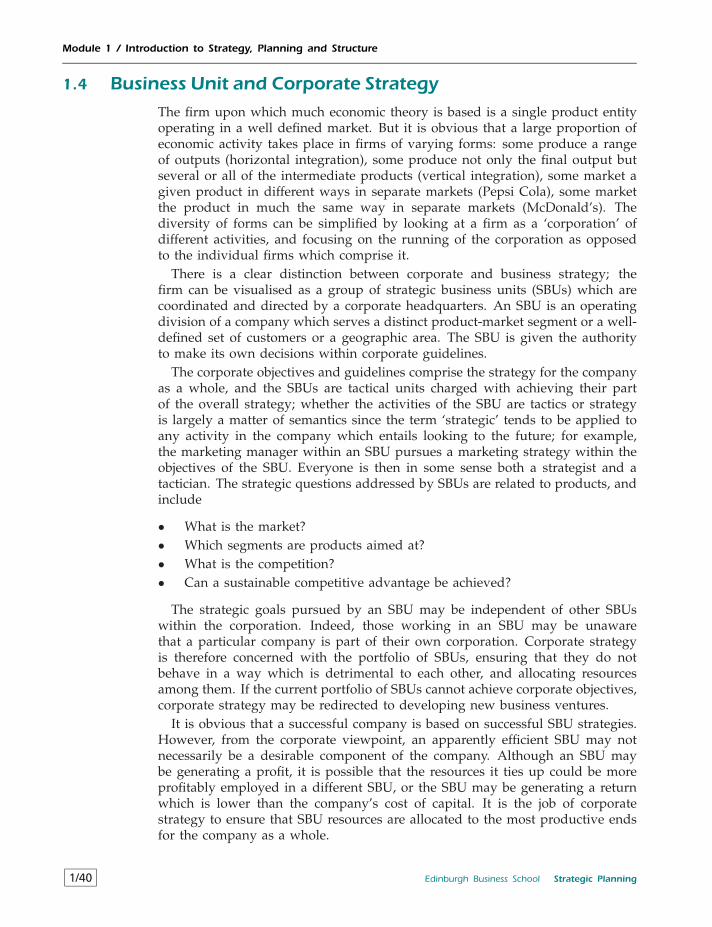
Module 1 / Introduction to Strategy, Planning and Structure
1.4 Business Unit and Corporate StrategyThe firm upon which much economic theory is based is a single product entityoperating in a well defined market. But it is obvious that a large proportion ofeconomic activity takes place in firms of varying forms: some produce a rangeof outputs (horizontal integration), some produce not only the final output butseveral or all of the intermediate products (vertical integration), some market agiven product in different ways in separate markets (Pepsi Cola), some marketthe product in much the same way in separate markets (McDonald’s). Thediversity of forms can be simplified by looking at a firm as a ‘corporation’ ofdifferent activities, and focusing on the running of the corporation as opposedto the individual firms which comprise it.
There is a clear distinction between corporate and business strategy; thefirm can be visualised as a group of strategic business units (SBUs) which arecoordinated and directed by a corporate headquarters. An SBU is an operatingdivision of a company which serves a distinct product-market segment or a well-defined set of customers or a geographic area. The SBU is given the authorityto make its own decisions within corporate guidelines.
The corporate objectives and guidelines comprise the strategy for the companyas a whole, and the SBUs are tactical units charged with achieving their partof the overall strategy; whether the activities of the SBU are tactics or strategyis largely a matter of semantics since the term ‘strategic’ tends to be applied toany activity in the company which entails looking to the future; for example,the marketing manager within an SBU pursues a marketing strategy within theobjectives of the SBU. Everyone is then in some sense both a strategist and atactician. The strategic questions addressed by SBUs are related to products, andinclude
• What is the market?• Which segments are products aimed at?• What is the competition?• Can a sustainable competitive advantage be achieved?
The strategic goals pursued by an SBU may be independent of other SBUswithin the corporation. Indeed, those working in an SBU may be unawarethat a particular company is part of their own corporation. Corporate strategyis therefore concerned with the portfolio of SBUs, ensuring that they do notbehave in a way which is detrimental to each other, and allocating resourcesamong them. If the current portfolio of SBUs cannot achieve corporate objectives,corporate strategy may be redirected to developing new business ventures.
It is obvious that a successful company is based on successful SBU strategies.However, from the corporate viewpoint, an apparently efficient SBU may notnecessarily be a desirable component of the company. Although an SBU maybe generating a profit, it is possible that the resources it ties up could be moreprofitably employed in a different SBU, or the SBU may be generating a returnwhich is lower than the company’s cost of capital. It is the job of corporatestrategy to ensure that SBU resources are allocated to the most productive endsfor the company as a whole.
1/40 Edinburgh Business School Strategic Planning

Module 1 / Introduction to Strategy, Planning and Structure
1.4.1 Allocating Corporate Resources
A relatively simple example involves the corporate policy on rationing capitalamong SBUs. Take the case where a company has two business groups eachcomprised of three SBUs. When an SBU requests capital, it states the amountrequired and the value which it would create by using the capital. For themoment, the precise method of deriving this value does not matter. Corporateheadquarters has received bids from the two business groups and the details ofthe value created by the SBUs are shown in Table 1.2.
Table 1.2 Capital requested and value created
Group A Group B
SBU CapitalRequested ($000)
Value Created($000)
CapitalRequested ($000)
Value Created($000)
1 100 80 100 50
2 100 40 100 50
3 100 30 100 50
Total 300 150 300 150
The corporate role is to ensure that a set of rules exist which lead to efficientresource allocation, since every resource allocation decision cannot be subjectedto detailed analysis. This example will show that the corporate decision rulechosen can itself have important implications for company success. There are atleast two approaches to corporate resource allocation:
1 Use competitive bidding; the component parts of the company competewith each other for scarce funds, on the assumption that this competitiveelement will go a long way towards ensuring efficient resource allocation.In this case the criterion is to allocate capital to groups on the basis of thetotal capital cost to each group of identified value creating investments. Themethod used is to allocate capital between the groups according to the ratioof the total requested by each, and the group manager then allocates capitalto the SBUs using the criterion of value created. On the face of it, thismight appear to be an efficient procedure because it combines the notion ofthe demand for capital by groups with efficient allocation within groups. Italso serves the function of being clear to everyone concerned and providesgroup managers with financial accountability for their SBUs.
2 Allocate capital directly to the individual SBUs using the ratio of valueadded. This would by-pass the group structure and reduce the responsibilityof group executives.
The two policies can result in different allocations of resources. Take thecase where the company has only $400 000 available rather than the $600 000requested. The group allocation approach dictates that $200 000 be allocated toeach group because they requested the same amount originally, i.e. the ratio ofthe value of requests was 1:1. The group managers would then allocate $100 000each to their two top value creating SBUs. The outcome of allocating capital togroups compared to SBUs directly can be compared as shown in Table 1.3.
Strategic Planning Edinburgh Business School 1/41
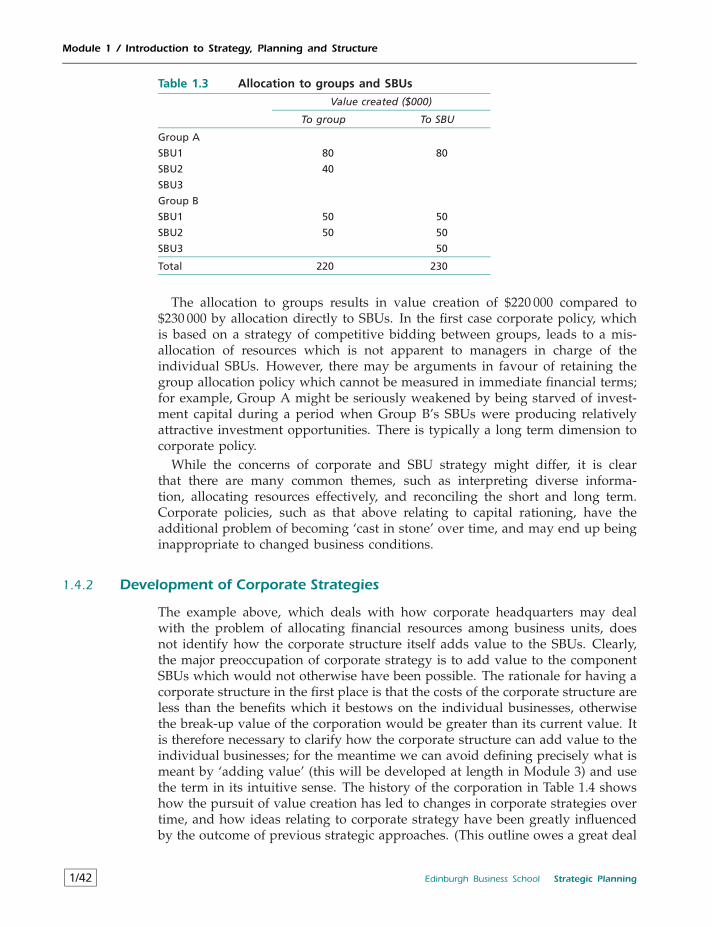
Module 1 / Introduction to Strategy, Planning and Structure
Table 1.3 Allocation to groups and SBUs
Value created ($000)
To group To SBU
Group A
SBU1 80 80
SBU2 40
SBU3
Group B
SBU1 50 50
SBU2 50 50
SBU3 50
Total 220 230
The allocation to groups results in value creation of $220 000 compared to$230 000 by allocation directly to SBUs. In the first case corporate policy, whichis based on a strategy of competitive bidding between groups, leads to a mis-allocation of resources which is not apparent to managers in charge of theindividual SBUs. However, there may be arguments in favour of retaining thegroup allocation policy which cannot be measured in immediate financial terms;for example, Group A might be seriously weakened by being starved of invest-ment capital during a period when Group B’s SBUs were producing relativelyattractive investment opportunities. There is typically a long term dimension tocorporate policy.
While the concerns of corporate and SBU strategy might differ, it is clearthat there are many common themes, such as interpreting diverse informa-tion, allocating resources effectively, and reconciling the short and long term.Corporate policies, such as that above relating to capital rationing, have theadditional problem of becoming ‘cast in stone’ over time, and may end up beinginappropriate to changed business conditions.
1.4.2 Development of Corporate Strategies
The example above, which deals with how corporate headquarters may dealwith the problem of allocating financial resources among business units, doesnot identify how the corporate structure itself adds value to the SBUs. Clearly,the major preoccupation of corporate strategy is to add value to the componentSBUs which would not otherwise have been possible. The rationale for having acorporate structure in the first place is that the costs of the corporate structure areless than the benefits which it bestows on the individual businesses, otherwisethe break-up value of the corporation would be greater than its current value. Itis therefore necessary to clarify how the corporate structure can add value to theindividual businesses; for the meantime we can avoid defining precisely what ismeant by ‘adding value’ (this will be developed at length in Module 3) and usethe term in its intuitive sense. The history of the corporation in Table 1.4 showshow the pursuit of value creation has led to changes in corporate strategies overtime, and how ideas relating to corporate strategy have been greatly influencedby the outcome of previous strategic approaches. (This outline owes a great deal
1/42 Edinburgh Business School Strategic Planning
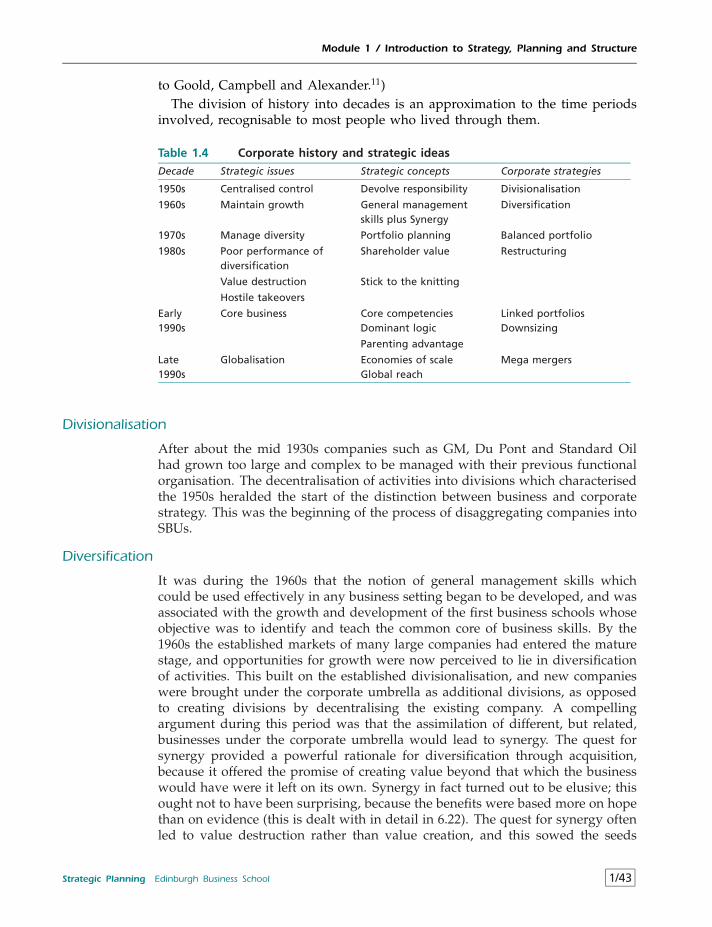
Module 1 / Introduction to Strategy, Planning and Structure
to Goold, Campbell and Alexander.11)The division of history into decades is an approximation to the time periods
involved, recognisable to most people who lived through them.
Table 1.4 Corporate history and strategic ideas
Decade Strategic issues Strategic concepts Corporate strategies
1950s Centralised control Devolve responsibility Divisionalisation
1960s Maintain growth General managementskills plus Synergy
Diversification
1970s Manage diversity Portfolio planning Balanced portfolio
1980s Poor performance ofdiversification
Shareholder value Restructuring
Value destruction Stick to the knitting
Hostile takeovers
Early1990s
Core business Core competenciesDominant logic
Linked portfoliosDownsizing
Parenting advantage
Late1990s
Globalisation Economies of scaleGlobal reach
Mega mergers
Divisionalisation
After about the mid 1930s companies such as GM, Du Pont and Standard Oilhad grown too large and complex to be managed with their previous functionalorganisation. The decentralisation of activities into divisions which characterisedthe 1950s heralded the start of the distinction between business and corporatestrategy. This was the beginning of the process of disaggregating companies intoSBUs.
Diversification
It was during the 1960s that the notion of general management skills whichcould be used effectively in any business setting began to be developed, and wasassociated with the growth and development of the first business schools whoseobjective was to identify and teach the common core of business skills. By the1960s the established markets of many large companies had entered the maturestage, and opportunities for growth were now perceived to lie in diversificationof activities. This built on the established divisionalisation, and new companieswere brought under the corporate umbrella as additional divisions, as opposedto creating divisions by decentralising the existing company. A compellingargument during this period was that the assimilation of different, but related,businesses under the corporate umbrella would lead to synergy. The quest forsynergy provided a powerful rationale for diversification through acquisition,because it offered the promise of creating value beyond that which the businesswould have were it left on its own. Synergy in fact turned out to be elusive; thisought not to have been surprising, because the benefits were based more on hopethan on evidence (this is dealt with in detail in 6.22). The quest for synergy oftenled to value destruction rather than value creation, and this sowed the seeds
Strategic Planning Edinburgh Business School 1/43
Module 1 / Introduction to Strategy, Planning and Structure
for later corporate strategies. Another reason advanced for diversification wasrisk spreading (dealt with in 6.21); this was a questionable basis for corporatestrategy because it spread management risk rather than shareholder risk.
As the number of take-overs increased, the forces of competition led toincreased prices for acquisitions, and this reduced the scope for value cre-ation. In fact, as take-over prices began to reflect not only the current but thepotential value of companies, diversification often led to the destruction of valuebecause companies were caught up in take-over battles, and ended up literallypaying too much for their acquisitions. At the same time the notion of the gen-eralist manager started to come under criticism: it started to become clear that‘management’ could not be viewed as independent of the particular business,and the emphasis turned to the importance of focused skills.
Portfolio Planning
Economic conditions changed in the 1970s: slower national growth rates, reces-sion, and historically high inflation: at the same time it was generally felt thatcompetitive pressures had increased with advances in technology, reduction oftrade barriers and the growth of the Pacific rim economies. It was generallyfelt that the market environment was much more complex and unpredictablethan in the 1960s. The management of diversity was increasingly recognised tobe a problem, and the search for a balanced portfolio of products led to thedevelopment of the portfolio approach to product management (dealt with indetail in 5.7).
It was now widely recognised that unless the parent company could identifyvalue creating potential that had not already been realised and which had notbeen recognised by another bidder, the company would pay the full price of atake-over, including potential value increases. At the same time capital marketshad developed to a level of sophistication far greater than in the 1960s, andthe argument that a portfolio must include high profit products (cash cows) topay for products which had still to generate profits (stars and question marks)no longer applied with the same force; this is because in many ways internalfinancing is not more efficient than external financing. It is questionable whetheran investment project which cannot satisfy external financiers should be fundedby retained earnings; it is reasonable to ask whether shareholders would bewilling to invest their funds in an internal project rather than in some othercompany which offers a potentially higher return.
Restructuring
The inability of many companies to manage and add value to diverse portfoliosled to take-overs by corporate raiders who saw opportunities for releasing valuefrom failed corporate strategies. This development was largely confined to theUS and the UK partly because of their more developed capital markets and theindependence of corporations from banks. The scale of the take-over strategywas staggering: in the US in 1988 over 2000 companies were acquired with atotal market value of over $850 billion. The take-over battles made the specialistsinto household names: Goldsmith, Milken, Kravis and Boesky (who went to jail)in the US, Hanson and White in the UK (both of whom were rewarded with the
1/44 Edinburgh Business School Strategic Planning
Module 1 / Introduction to Strategy, Planning and Structure
title of Lord), and Robert Maxwell. The excitement of these times was capturedin the film Wall Street in 1987 starring Michael Douglas as Gordon Gekko, towhom ‘greed is good’. The search for value creation focused on cash flows andled to the development of techniques known as value based planning, whichinclude discounted cash flows and net present values. These financial ideasare central to understanding company valuations and value creation, and hadlargely been ignored in the preceding decades.
The approaches adopted to release value in diversified companies includeddelayering, which involved reducing management structures, and divestment,which involved selling off parts of the corporation. The Peters and Watermanstudy mentioned above concluded that successful firms had a focus (they called it‘stick to the knitting’); they concluded that diversified companies had performedless well than those which concentrated on a core activity. There was now a greatdeal of concern about pseudo-professional managers who knew nothing aboutthe businesses they were running. The inevitable conclusion was that manyparents were destroying value by the 1980s; it was no wonder their break-upvalue was often found to be greater than their corporate value.
Core Businesses
Available evidence suggests that the performance of conglomerates has not beenimproved by take-overs. The Financial Times Stock Exchange Index for the 100leading UK companies grew from 100 in the base year 1986 to 240 in 1996;during the same period the Financial Times Index of 350 diversified indus-trial companies increased from 100 to 130. Clearly some radical thinking wasrequired if conglomerates were to remain viable in the long run. The process ofrestructuring implies the selection of appropriate core businesses which remainonce the process of breaking up is complete. The trouble is that it is not nec-essarily obvious where a company’s core advantages lie. One possible answerwas to focus on related diversifications; but this would not necessarily solvethe problem of value destruction because related activities do not necessarilyreduce complexity, and there are no guarantees that the simple fact of runningtwo apparently related businesses under the same corporate umbrella will leadto overall cost reductions. An alternative approach was to utilise the company’sdominant general management logic by selecting companies in strategicallysimilar industries.
A dominant general management logic is defined as the way in which managersconceptualise the business and make critical resource allocation decisions – be it intechnologies, product development, distribution, advertising or in human resourcemanagement.12
A rather different view is that the only valid justification for a diversified com-pany is sharing resources and particular competitive advantages– which cameto be called core competences13 – across businesses; otherwise diversification isnothing more than mutual fund portfolio management. One view is that busi-nesses comprising the diversified company should be viewed as a collection ofcompetences. Even a poorly performing business, in terms of financial indicators,may make a significant contribution to overall company performance in terms
Strategic Planning Edinburgh Business School 1/45
Module 1 / Introduction to Strategy, Planning and Structure
of competence. But it is difficult to transform this idea into practice, becauseit means suspending the normal investment criteria which had been so usefulin the era of value based planning. While the research suggests in retrospectthat there are instances of companies which have benefited from concentratingon core competences, it is difficult in practice to predict how companies willachieve benefits from corporate strategies based on linkages, core competencesand synergy.
Benefits of synergy are now truly legendary. Diversification and synergy havebecome virtually inseparable in texts and business language. Yet. . . those particularbenefits show an almost unshakeable resolve not to appear when it becomes timefor their release.14
While there is no doubt that the concept is important, it is not unreasonable toconclude that linking businesses by core competences is neither a necessary norsufficient condition for success. The story of corporate strategy and the potentialfor value creation is by no means fully worked out.
Parenting Advantage
While it is uncertain how the future will unfold, Goold et al. make a persuasivecase for the development of parenting advantage as the basis for corporatevalue creation. They identify four potential ways by which the parent mightadd value.
1 Stand-alone influence: the parenting activities include agreeing and monitor-ing performance targets, approving major capital expenditures and selectingbusiness unit managing directors; the parenting influence may extend toproduct-market strategies, pricing and human resource management. But itcan be argued that the more the parent extends its influence into the affairsof the individual businesses, the more likely it is that it will destroy value;this is the 10 per cent versus 100 per cent paradox: why should a parentmanager working part time do better than a business manager working fulltime?
2 Linkage influence: the parent can encourage relationships to capitalise onsynergy. But in the absence of a parent, business managers are free toestablish linkages without parental involvement; so why should the parentdo any better? This is the ‘enlightened self-interest’ paradox.
3 Functional and services influence: the parent can provide functional leader-ship and cost effective services. But this creates a supplier insulated fromoutside competition, and it is difficult to guarantee that internal supplierswill be as efficient as the market. This is the ‘beating the specialists’ paradox.
4 Corporate development activities: the main role of the parent is usuallyseen as buying and selling businesses, creating new businesses, and redefin-ing businesses. This amounts to changing the businesses in the corporateportfolio. But since the weight of research indicates that the majority ofcorporately sponsored acquisitions, new ventures and business redefinitionsfail to create value, the odds against success are long; this is the ‘beatingthe odds’ paradox.
1/46 Edinburgh Business School Strategic Planning
Module 1 / Introduction to Strategy, Planning and Structure
While there is a real potential role for the parent in the areas outlined above, ithas to be recognised that success is not guaranteed and that there are formidableobstacles in the path of value creation. Given these obstacles, it is not surprisingto find that value has often been destroyed rather than created, and whenthe parent organisation is responsible for poor executive appointments, invalidobjectives, inappropriate strategies, and unsuitable review processes the potentialfor value destruction is multiplied.
Globalisation
As trade barriers have continued to fall, through the work of the World TradeOrganisation and the formation of trading blocks such as the European Union,and capital markets have transcended national frontiers, companies have increas-ingly found themselves competing in an international market place. Companiesin many industries began to fear that nationally based operations would standlittle chance against powerful multi nationals. Thus the late 1990s witnessedhuge international mergers in industries such as financial institutions, telecom-munications, energy supply, car production and pharmaceuticals. While thearguments in favour of mega mergers are clearly persuasive enough to providecompanies with the incentive to embark on these ventures, it is an open questionwhether the outcome in the longer term will be viable, value generating opera-tions. There is no guarantee that scale economies will be realised, nor is thereany guarantee that size will confer a real competitive advantage in servicingdistinctive local markets for goods and services.
1.5 Is Strategic Planning Only for Top Management?Since strategic planning is typically visualised as the grand strategy of a com-pany, it could be argued that this is the domain of top management, and thatmiddle and lower management need not be concerned with such issues. How-ever, there are potential returns to both the company and the individual fromcomprehension of strategic planning at all levels of management.
1.5.1 Company Benefits of Strategic Planning
Some organisational behaviour experts maintain that it is not so much theexistence of a plan which benefits the company, but the process by which aplan is developed; this process leads to relationships among employees, andapproaches to the job, which would otherwise be missing. Apart from thisgeneral potential benefit, the company stands to benefit in several ways frommanagers’ comprehension of strategic planning.
• The individual manager is enabled to see where his sub-unit fits into theoverall system of objectives, and is able to interpret corporate objectivesin that light. The manager competing for scarce resources has a betterunderstanding of the true opportunity cost of his demands. Similarly, themanager is in a better position to understand instances where cooperationis required; the reason for such cooperation might not be obvious in thecontext of a limited set of objectives. In many circumstances, managers
Strategic Planning Edinburgh Business School 1/47
Module 1 / Introduction to Strategy, Planning and Structure
can be excused for feeling that decisions are simply made at the whim oftheir superiors since they do not appreciate the overall resource allocationpicture and have no understanding of the direction in which the company isheaded. This reasoning applies to all aspects of management education, i.e.that a better appreciation of company functions provides individuals witha more balanced view of the actions of others; comprehension of strategicplanning has a particularly powerful role to play in the elimination ofunnecessary conflicts, and the associated effects on morale and productivity.
• The manager will better understand which of his potential proposals arelikely to contribute to the overall plan; he will also be in a position to pro-duce arguments for a proposal which will be consistent with the objectivesof higher level managers.
• Because strategies are developed in a dynamic fashion, managers who areactually involved in the process of making the company’s strategy work maynot be aware of the strategy within which they are operating; for example,economic circumstances may lead to a change in general objectives and thecriteria used to judge company performance. It cannot be taken for grantedthat managers will have an up-to-date appreciation of the company’s currentstrategy.
Thus, company-wide knowledge of the approach to strategic planning, andthe process by which it is arrived at, can have a positive impact on resourceallocation within the company by helping to minimise unnecessary conflict andto provide an overall sense of direction. It is difficult for managers to feel partof a team working towards a common goal when that goal is not clear to themand they do not see how their individual actions contribute to achieving it.
1.5.2 Individual Benefits of Understanding Strategic Planning
If comprehension of strategic planning generates returns to the company, itis clearly worthwhile for the company to persuade managers to spend timelearning about it. However, individual managers must have incentives to spendtime on this activity. The payoff to the individual manager comes in two ways.First, the manager will achieve a better understanding of where the companyis going, and what it is attempting to achieve. The manager should be ableto take advantage of this to predict changes likely to occur in the organisationwhich will be personally advantageous, or disadvantageous. Second, proposalsand arguments submitted to higher level managers will be consistent with andrelevant to the aspirations of the manager’s superiors, and this can enhanceprestige and career prospects.
1.5.3 Understanding Strategic Planning: Who Should Pay?
The fact that there are benefits both to the company and to the individualraises an interesting issue concerning who should pay for the education. Sinceindividuals benefit from understanding strategic planning they have an incentiveto pay something towards their education; the same goes for the company.However, since both parties will obtain some benefit the issue of who should
1/48 Edinburgh Business School Strategic Planning
Module 1 / Introduction to Strategy, Planning and Structure
pay is a negotiating point. There is a maximum amount which the company iswilling to pay for any individual’s strategic planning education, and there is amaximum amount which any individual is willing to pay for his own education.In principle, the compromise will fall in between these two extremes. In practice,it is usually not possible for such a negotiation to take place, and this accountsfor the fact that some individuals are willing to pay for their own education,and some companies are willing to pay for some employees’ education.
Review Question 1
The following is a hypothetical statement by the Chief Executive Officer of a mediumsized company producing packaged breakfast cereals.
‘The people who sell strategic planning are certainly on to a good thing. They don’tdefine their product, they have no measure of success or failure when applying theirmethods, many of them seem to provide contradictory solutions, and they can provideno proof whatsoever that they have done any good. As an ex-army man I know a lotabout strategy, and in my business I simply keep an eye on who is doing what in themarket, try to make sure my costs are under control and keep my customers and myemployees as happy as I reasonably can. I have given up trying to look more than ayear ahead, because every time I have done so in the past, events have turned out to becompletely unpredictable. In the past 10 years we have managed a 12 per cent returnon capital and have kept our market share. I don’t think I have much to learn fromstudying strategic planning.’
This CEO gives the impression of being complacent, and perhaps he has goodreason for feeling this way. Think up a series of questions which might unsettle him.
Review Question 2
Analyse the strategic planning experiences of the Mythical company in terms of thethree approaches to strategy: planning, emergent and resource based.
Review Question 3
Assess the Mythical company’s five point plan in terms of business unit and corporatestrategy.
Review Question 4
Assess the experience of the Mythical company’s CEO in terms of Rittell’s properties.
Review Question 5
Some time in the future the Mythical company ran into another problem. Abouthalf way through the financial year the company finance director informed theCEO that half year profits were much reduced and that there was little prospectof maintaining the performance of the past three years. The CEO gathered his
Strategic Planning Edinburgh Business School 1/49
Module 1 / Introduction to Strategy, Planning and Structure
senior management team to discuss the reasons for this setback and hired a strategyconsultant to contribute. This is an extract from the discussion.
CEO: I don’t think our profit problem is simply due to external events such as therecent problems with the economy. It seems to me that it is more to do with theway we do things – I am not certain that we are acting as efficiently as we couldbe.
Operations manager: we have actually invested heavily in more productive assetsand in training programmes in the last two years. I am not sure there is much morewe can do in that respect.
Marketing manager: I don’t think we exploited the market opportunities for ournew range of products as well as we could have done. We invested a great dealin attempting to capture an increased share of the market early on last year; whenthat didn’t work we should have channelled a lot more resources into the marketingeffort. We should have allowed for changing market conditions.
Finance director: but we had no spare resources.
CEO: we put a lot of effort into the plan and it was a great disappointment whenit didn’t work out. Maybe we need to spend even more time planning in the future.
Marketing manager: what is the point of planning in ever more detail when wecan’t seem to react to the unexpected?
Operations manager: that is a defeatist attitude. We just don’t spend enoughtime collecting and analysing information.
Strategy consultant: you are approaching the strategy problem from two differentperspectives; once you have recognised this you might be able to work out whereto go from here.
What did the strategy consultant mean?
References
1 Mintzberg, H. (1978) ‘Patterns in strategy formation’, Management Science, pp. 934–48.
2 Lorsch, J. (1986) ‘Managing culture: the invisible barrier to strategic change’, CaliforniaManagement Review, 28, pp. 95–109.
3 Chandler, A.D. (1974) Strategy and Structure, Cambridge, MA.: MIT Press.
4 Andrews, K. (1971) The Concept of Corporate Strategy, Homewood, IL: Irwin.
5 Itami, H. (1987) Mobilising Invisible Assets, Cambridge, MA: Harvard University Press.
6 Mintzberg, H. (1994) The Rise and Fall of Strategic Planning, New York: Free Press.
7 Simon, H. (1957) Models of Man, New York: Wiley, p.198.
8 Rittel, H. (1972) ‘On the planning crisis: systems analysis of the first and secondgenerations’, Bedriftsokonomen No 8, pp. 390-6.
9 Peters, T. J. and Waterman, R. H. (1982) In Search of Excellence, Harper & Row.
10 Hall, S. and Banbury, C. (1994) ‘How strategy-making processes can make a difference’,Strategic Management Journal, Vol. 15, pp. 251–63.
11 Goold, M., Campbell, A. and Alexander, M. (1994) Corporate-Level Strategy: CreatingValue in the Multi-Business Company, New York: John Wiley.
1/50 Edinburgh Business School Strategic Planning

Module 1 / Introduction to Strategy, Planning and Structure
12 Prahalad, C.K. and Bettis, R.A. (1986) ‘The dominant logic: a new linkage betweendiversity and performance’, Strategic Management Journal, 7, pp. 485–501.
13 Prahalad, C.K. and Hamel, G. (1990) ‘The core competence of the corporation’, HarvardBusiness Review, May–June, pp. 79–91.
14 Reed, R. and Juffman, G.A. (1986) ‘Diversification: the growing confusion’, StrategicManagement Journal, Vol. 7, pp.29–35.
Strategic Planning Edinburgh Business School 1/51

Module 2
Modelling the Strategic PlanningProcess
Contents
2.1 The Modelling Approach 2/12.1.1 The Components of a Model 2/22.1.2 Benefits and Costs of the Modelling Approach 2/42.1.3 A Functional Model 2/5
2.2 Strategy Making 2/82.2.1 Strategy and the Evolution of the Company 2/92.2.2 Strategists 2/10
Review Question 2/13
Case 1: Rover Accelerates into the Fast Lane (1994) 2/13
Case 2: The Millennium Dome: How to Lose Money in the 21st Century(2001)
2/16
Learning Objectives
• To represent the complex strategy process in terms of a model.• To show how strategic planning depends on the evolution of the company.• To identify who makes strategy.
2.1 The Modelling ApproachA model of the strategic planning process provides a structure within whichstrategy problems can be analysed. A model is a structured method of thinkingwhich enables the component parts of complex processes to be identified andrelated to each other; this does not imply that the process of strategic planningoccurs in individual companies exactly as described by a model. No modelcan describe a process exactly; for example, in economics the objective of mostmodels is to summarise important causal economic relationships so that a viewcan be developed of how the economy operates; an economic model does notaspire to represent the world with total accuracy, but it is intended to capturesome of the main elements which determine how the economy functions. Theeconomic model can then be used as the basis for explaining what is currentlyhappening, and predicting what is likely to happen in the future.
A strategic planning model is not based on cause and effect relationships in thesame way as an economic or financial model. A strategic planning model is an
Strategic Planning Edinburgh Business School 2/1
Module 2 / Modelling the Strategic Planning Process
attempt to rationalise the complex processes of company decision making wherethe connection between cause and effect is obscure. When trying to make senseof complicated human interactions it is inevitable that an observer will haveto use subjective impressions of what is actually happening. Since subjectiveimpressions are used to interpret how strategy processes work, a strategicplanning model can take various forms. The fact that such variety exists is nota weakness of the modelling approach, as the power of the modelling approachlies in simplifying and making understandable what at first sight appears tobe impenetrable; different models can throw light on different aspects of thestrategy process.
It is essential to think explicitly in terms of models from the beginning.Whenever you attempt to explain what is happening in the world, or express aview as to how things should be done, you are implicitly using a model withinwhich your ideas are structured. For example, the issue of how to eliminate theUS budget deficit was an important concern in the early 1990s. Many peoplethought that this could be achieved simply by increasing the tax rate; to holdsuch a view this group must have had an implicit model of the economy inwhich an increase in taxes would lead to higher tax revenues. However, analternative model, in which increased taxes could lead to lower incomes andhence to reduced tax revenues, is also feasible. The problem is that neithermodel could be proved nor disproved at the time, and people often lost sightof the fact that they were really disagreeing about an implicit model of theeconomy rather than the objective of eliminating the budget deficit.
In companies, different views on the process of how to plan are based ondifferent models of how strategic planning works, whether this is recognisedexplicitly or not. It was discussed previously how managers often have com-pletely different definitions of strategic planning; this is usually associated withdifferences in their views of how planning should work in practice. For example,some managers believe that planning should take the form of a series of speci-fied targets, together with a monitoring and control system; other managers feelthat this approach is unnecessarily rigid and that an informal, flexible approachis more effective. These views are based on two different models of the planningprocess.
2.1.1 The Components of a Model
The simple strategic planning model shown in Table 2.1 represents planning asa flow process.
The model identifies seven activities which occur in a logical progression:Step 1 is concerned with identifying company goals, which may be in the formof market shares or rates of return; Steps 2 and 3 are concerned with forecastswhich identify the potential payoffs and problems associated with differentcourses of action; from these potential alternatives the strategy option is chosenin Steps 4 and 5; having decided what to achieve, Step 6 is concerned withhow to achieve it by identifying critical success factors and allocating resources;finally, in Step 7, procedures are set up to monitor how effectively the objectivesare being achieved, together with an ongoing system of reappraisal to ensure
2/2 Edinburgh Business School Strategic Planning
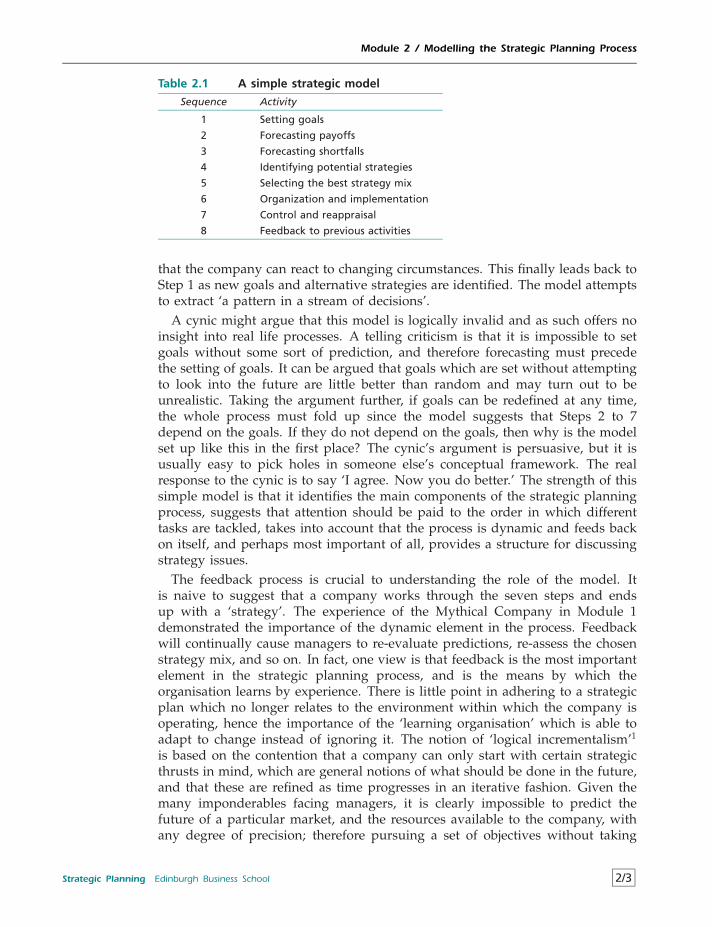
Module 2 / Modelling the Strategic Planning Process
Table 2.1 A simple strategic model
Sequence Activity
1 Setting goals
2 Forecasting payoffs
3 Forecasting shortfalls
4 Identifying potential strategies
5 Selecting the best strategy mix
6 Organization and implementation
7 Control and reappraisal
8 Feedback to previous activities
that the company can react to changing circumstances. This finally leads back toStep 1 as new goals and alternative strategies are identified. The model attemptsto extract ‘a pattern in a stream of decisions’.
A cynic might argue that this model is logically invalid and as such offers noinsight into real life processes. A telling criticism is that it is impossible to setgoals without some sort of prediction, and therefore forecasting must precedethe setting of goals. It can be argued that goals which are set without attemptingto look into the future are little better than random and may turn out to beunrealistic. Taking the argument further, if goals can be redefined at any time,the whole process must fold up since the model suggests that Steps 2 to 7depend on the goals. If they do not depend on the goals, then why is the modelset up like this in the first place? The cynic’s argument is persuasive, but it isusually easy to pick holes in someone else’s conceptual framework. The realresponse to the cynic is to say ‘I agree. Now you do better.’ The strength of thissimple model is that it identifies the main components of the strategic planningprocess, suggests that attention should be paid to the order in which differenttasks are tackled, takes into account that the process is dynamic and feeds backon itself, and perhaps most important of all, provides a structure for discussingstrategy issues.
The feedback process is crucial to understanding the role of the model. Itis naive to suggest that a company works through the seven steps and endsup with a ‘strategy’. The experience of the Mythical Company in Module 1demonstrated the importance of the dynamic element in the process. Feedbackwill continually cause managers to re-evaluate predictions, re-assess the chosenstrategy mix, and so on. In fact, one view is that feedback is the most importantelement in the strategic planning process, and is the means by which theorganisation learns by experience. There is little point in adhering to a strategicplan which no longer relates to the environment within which the company isoperating, hence the importance of the ‘learning organisation’ which is able toadapt to change instead of ignoring it. The notion of ‘logical incrementalism’1
is based on the contention that a company can only start with certain strategicthrusts in mind, which are general notions of what should be done in the future,and that these are refined as time progresses in an iterative fashion. Given themany imponderables facing managers, it is clearly impossible to predict thefuture of a particular market, and the resources available to the company, withany degree of precision; therefore pursuing a set of objectives without taking
Strategic Planning Edinburgh Business School 2/3
Module 2 / Modelling the Strategic Planning Process
into account the ongoing course of events hardly makes sense. It is possible thatthe incrementalist process itself is subject to management, and that techniquescan be developed which will help ensure that the iteration is effective.
The debate on the validity of models is not unique to strategic planning. Thefamous economist Milton Friedman advanced the argument that the real testof a model is how well it predicts events. If it is able to predict accuratelyand consistently then it does not matter if economists disagree on the validityof the underlying economic relationships. Opponents of this view claim thata model must be based on sound theories before its predictions can havecredibility; without these it is impossible to explain why predictions turn outto be wrong. This argument has led to heated exchanges in academic journals,and the philosophical issue has yet to be resolved. So far as the modelling ofstrategic planning is concerned, there is a limited amount of theory which can beapplied, and the models are intended to be explanatory rather than predictive;in principle, their usefulness can be judged on the contribution which they maketo understanding and improving the process of strategic planning.
In the model illustrated above, it is certainly true that the ordering of thesteps is based on a logical framework which may not exist in real life, andthere is scope for debate about which part of the process ought to come firstin practice; while most managers will agree from their experience that theseven steps do occur, they are not necessarily consecutive. This is becauseadditional information and perspectives generated during the later stages cancause reversion to an earlier step. The model is in fact an attempt to represent adynamic process in a static setting; thus while the conceptual structure may bevalid, it may be impossible to observe in practice.
An important attribute of a model lies in providing the basis for a check thatthe necessary steps have been carried out prior to committing the company toa course of action. For example, Step 3, which is concerned with identifyingpotential weaknesses, may have been virtually ignored in the process of devel-oping the strategic plan; the mere fact of focusing attention on this aspect couldchange the emphasis of the strategy, once it has been discovered that thereare potential weaknesses which have not hitherto been taken into account. Asubsequent revision of Step 4, which is concerned with identifying alternativestrategies, might reveal that the original goals were much too ambitious becauseno feasible strategy seems likely to achieve them.
2.1.2 Benefits and Costs of the Modelling Approach
All approaches to problems have benefits and costs, and if a particular approachis adopted it must be because the perceived benefits outweigh the perceivedcosts. The idea of using a modelling approach to strategic planning can give riseto heated argument: those in favour consider that actions undertaken without astructured or theoretical base are little more than random; those against considerthat it is naive to approach issues in this way and that the modelling approachconstrains rather than enriches understanding of decision making. There is noclear cut answer to this argument, and typically both sides can provide instanceswhere both structured and unstructured approaches to decision making have
2/4 Edinburgh Business School Strategic Planning
Module 2 / Modelling the Strategic Planning Process
been effective; disagreements in this area cannot be resolved by recourse todata, and the difficulties of applying the scientific approach in this area werediscussed at 1.2.2. However, it is impossible to identify general principles fromunstructured and one-off examples, and the anecdotal approach to strategicplanning, while usually entertaining, gives no real indication of why the par-ticular circumstances led to success rather than to failure. Furthermore, there isa natural tendency to concentrate attention on strategic approaches associatedwith success rather than failure, which biases the conclusions generated by theanecdotal approach. If there is no carry over from one case to another thenthe very attempt to teach strategic planning is open to question. Therefore, tothe extent that there are general principles involved, the modelling approach isvalid; it could be argued that to dismiss the possibility of modelling the processis to deny the existence of general strategic principles.
The following are some of the benefits and costs which might be associatedwith modelling the strategic planning process.
Costs and benefits of modelling planning• Benefits
– Provides a structure– Simplifies complex processes– Acts as a check list– Identifies areas of disagreement
• Costs– Imparts a mechanistic impression to the process– Introduces rigidity to a dynamic process– Gives impression that strategy can be derived from a model
It is important to realise that a strategy model is not a prescription for howstrategic planning should be carried out. It is intended to help in understandingstrategy making, and does not imply that a company should adopt a particularplanning system which itself might constrain the inventiveness and innovationon which much of strategic planning depends.
2.1.3 A Functional Model
A more detailed model, shown in Figure 2.1, indicates the tasks involved at thevarious stages of the process.
This model conveys more information than the previous one about the activ-ities related to the process of strategic planning, and uses different explanatoryheadings. For example, four areas have been identified in which analysis anddiagnosis should be carried out; these include the general environment, which isconcerned with the state of the economy and social trends, competition withinthe industry, the internal strengths and weaknesses of the company, and itscurrent and potential competitive position. Steps 6 and 7 in the previous modelare included under Implementation, which is concerned with the organisationalstructure of the company, techniques for efficient resource allocation, and themeasurement of outcomes.
Strategic Planning Edinburgh Business School 2/5
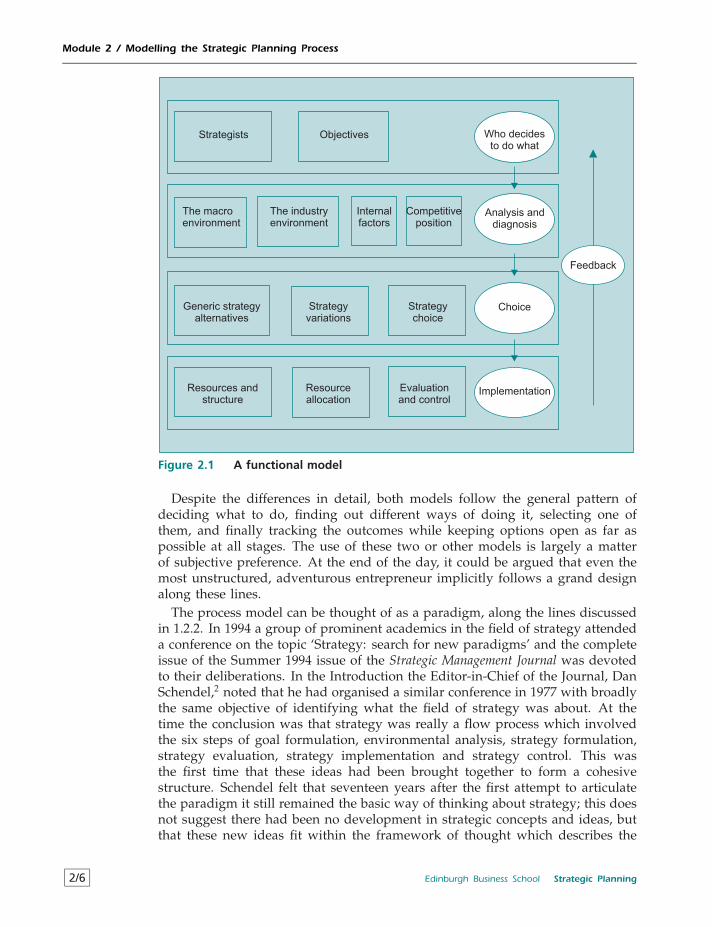
Module 2 / Modelling the Strategic Planning Process
Strategists Objectives
The macroenvironment
The industryenvironment
Internalfactors
Competitiveposition
Generic strategyalternatives
Strategyvariations
Who decidesto do what
Analysis anddiagnosis
Choice
Implementation
Strategychoice
Resources andstructure
Resourceallocation
Evaluationand control
Feedback
Figure 2.1 A functional model
Despite the differences in detail, both models follow the general pattern ofdeciding what to do, finding out different ways of doing it, selecting one ofthem, and finally tracking the outcomes while keeping options open as far aspossible at all stages. The use of these two or other models is largely a matterof subjective preference. At the end of the day, it could be argued that even themost unstructured, adventurous entrepreneur implicitly follows a grand designalong these lines.
The process model can be thought of as a paradigm, along the lines discussedin 1.2.2. In 1994 a group of prominent academics in the field of strategy attendeda conference on the topic ‘Strategy: search for new paradigms’ and the completeissue of the Summer 1994 issue of the Strategic Management Journal was devotedto their deliberations. In the Introduction the Editor-in-Chief of the Journal, DanSchendel,2 noted that he had organised a similar conference in 1977 with broadlythe same objective of identifying what the field of strategy was about. At thetime the conclusion was that strategy was really a flow process which involvedthe six steps of goal formulation, environmental analysis, strategy formulation,strategy evaluation, strategy implementation and strategy control. This wasthe first time that these ideas had been brought together to form a cohesivestructure. Schendel felt that seventeen years after the first attempt to articulatethe paradigm it still remained the basic way of thinking about strategy; this doesnot suggest there had been no development in strategic concepts and ideas, butthat these new ideas fit within the framework of thought which describes the
2/6 Edinburgh Business School Strategic Planning
Module 2 / Modelling the Strategic Planning Process
strategic process. The functional process model shown in Figure 2.1 followsSchendel’s notion of a paradigm quite closely; instead of six steps there are four,but the boxes contain the same ideas.
An appreciation of the strategy process model is fundamental to understand-ing strategy issues because the model provides a framework within whichconcepts and ideas can be located. The model provides a basis for formulatingquestions when addressing strategy problems, and these tend to be commonamong different situations. The general questions which arise from the modelinclude
Do the strategists have the appropriate characteristics for the type of com-pany? Have they formulated clear objectives?
Has adequate analysis of the environment and the company been carriedout?
Was an appropriate choice of strategy made in the light of the potentialalternatives?
Were company resources used effectively to achieve the strategic objectives?
Was the company able to learn from subsequent feedback and adapt accord-ingly?
One of the most important outcomes of the process model approach is torecognise that there is typically no single reason for company failure or success.When attempting to explain why a particular company got into difficulties thereis a tendency to answer in terms of a single factor, for example that the marketturned down, that technology moved on, or whatever. But it is unlikely thatany one factor can really account for failure, since companies are run by peoplewho are able to adapt to changing circumstances. The root causes of failure liein the strength or weakness of the company’s strategic process; it then becomesa question of how many areas of weakness can a strategic process bear.
The approach adopted in the remainder of this course follows this processmodel; it starts by looking at strategy makers and company objectives, then goeson to discuss the company in the economic environment – both at the economy-wide and market levels; this is followed by an analysis of the internal factorsaffecting competitive advantage which leads on to an analysis of strategic choice;implementation, control and feedback are the final parts of the story. Strategicplanning is thus not a plan or a blueprint for company success but a frameworkfor understanding strategy making. The first step in analysing the variousaspects of the strategic planning process is to consider who makes strategy inthe first place.
Strategic Planning Edinburgh Business School 2/7
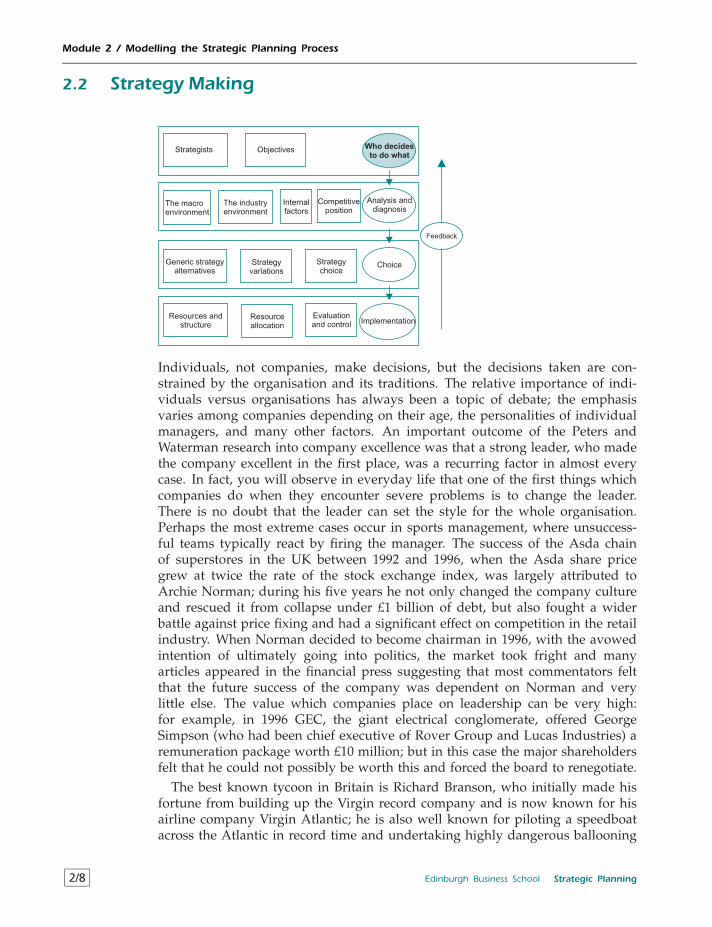
Module 2 / Modelling the Strategic Planning Process
2.2 Strategy Making
Strategists Objectives
The macroenvironment
The industryenvironment
Internalfactors
Competitiveposition
Generic strategyalternatives
Strategyvariations
Who decides
to do what
Analysis anddiagnosis
Choice
Implementation
Strategychoice
Resources andstructure
Resourceallocation
Evaluationand control
Feedback
Individuals, not companies, make decisions, but the decisions taken are con-strained by the organisation and its traditions. The relative importance of indi-viduals versus organisations has always been a topic of debate; the emphasisvaries among companies depending on their age, the personalities of individualmanagers, and many other factors. An important outcome of the Peters andWaterman research into company excellence was that a strong leader, who madethe company excellent in the first place, was a recurring factor in almost everycase. In fact, you will observe in everyday life that one of the first things whichcompanies do when they encounter severe problems is to change the leader.There is no doubt that the leader can set the style for the whole organisation.Perhaps the most extreme cases occur in sports management, where unsuccess-ful teams typically react by firing the manager. The success of the Asda chainof superstores in the UK between 1992 and 1996, when the Asda share pricegrew at twice the rate of the stock exchange index, was largely attributed toArchie Norman; during his five years he not only changed the company cultureand rescued it from collapse under £1 billion of debt, but also fought a widerbattle against price fixing and had a significant effect on competition in the retailindustry. When Norman decided to become chairman in 1996, with the avowedintention of ultimately going into politics, the market took fright and manyarticles appeared in the financial press suggesting that most commentators feltthat the future success of the company was dependent on Norman and verylittle else. The value which companies place on leadership can be very high:for example, in 1996 GEC, the giant electrical conglomerate, offered GeorgeSimpson (who had been chief executive of Rover Group and Lucas Industries) aremuneration package worth £10 million; but in this case the major shareholdersfelt that he could not possibly be worth this and forced the board to renegotiate.
The best known tycoon in Britain is Richard Branson, who initially made hisfortune from building up the Virgin record company and is now known for hisairline company Virgin Atlantic; he is also well known for piloting a speedboatacross the Atlantic in record time and undertaking highly dangerous ballooning
2/8 Edinburgh Business School Strategic Planning
Module 2 / Modelling the Strategic Planning Process
expeditions. A champion of competition with a clear dislike of monopolies,he challenged British Airways by obtaining slots at Heathrow and providingstandards of service which rapidly gained a significant share of the marketin the face of intense competition. But it is not widely known that Branson’sbusiness empire spans retailing, media, design and modelling, and financialservices besides his airline, which accounts for only about half of the £1.8 billionvalue of his companies. In a Sunday Times interview in October 1996 Bransonstated that his next priority would be to develop a structure for his group sothat its existence will not be threatened by his disappearance.
We know from everyday experience that different individuals have differentobjectives, view the same information in different ways, and often act differentlydepending on the decision making environment. Those who sit on boards orcommittees often feel that decisions arrived at would have been different hadthe decisions been taken by any individual member of the group. Thus thesetting of the company’s objectives may appear to be arbitrary to the extent thatit is dependent on who is involved at the time. This raises the question: If thesetting of objectives is not systematic, is there any point in attempting to besystematic about meeting these objectives? The answer is that objectives are setby people, with their particular insights into the world, together with all theirdefects, but they are the only ones we have.
2.2.1 Strategy and the Evolution of the Company
The typical company is continuously evolving, and the roles undertaken bydecision makers are to some extent dependent on the stage of the company’sevolution, which can be classified in three stages: the small single-productcompany, the integrated company, and the large diversified company. Only avery small minority of companies actually ‘evolve’ in the sense that they endup as large diversified companies. However, the classification makes it possibleto characterise the role of the strategy maker as follows:
Small orEntrepreneurial
Single-product company with little formal structurecontrolled by the owner-manager.
Integrated Single product-line company with vertically integratedmanufacturing and specialised functional organisation.The owner-manager still retains control over strategicdecisions, but most operating decisions are delegatedthrough policy.
Diversified Multi-product company with formalised managerialsystems which are evaluated by objective criteria, suchas return on investment. Product and market decisionsare delegated to the heads of SBUs.
In smaller companies the individual owner plays a dominant role in determin-ing strategy, but in the larger, diversified company it may be difficult to identifystrategists. The latter is the type of company in which ownership and controltend to be differentiated, with managers answerable to shareholders rather thanto individual owners. In fact, many aspects of the company’s operations dependon the stage of evolution of the company. For example, the ability of a company
Strategic Planning Edinburgh Business School 2/9
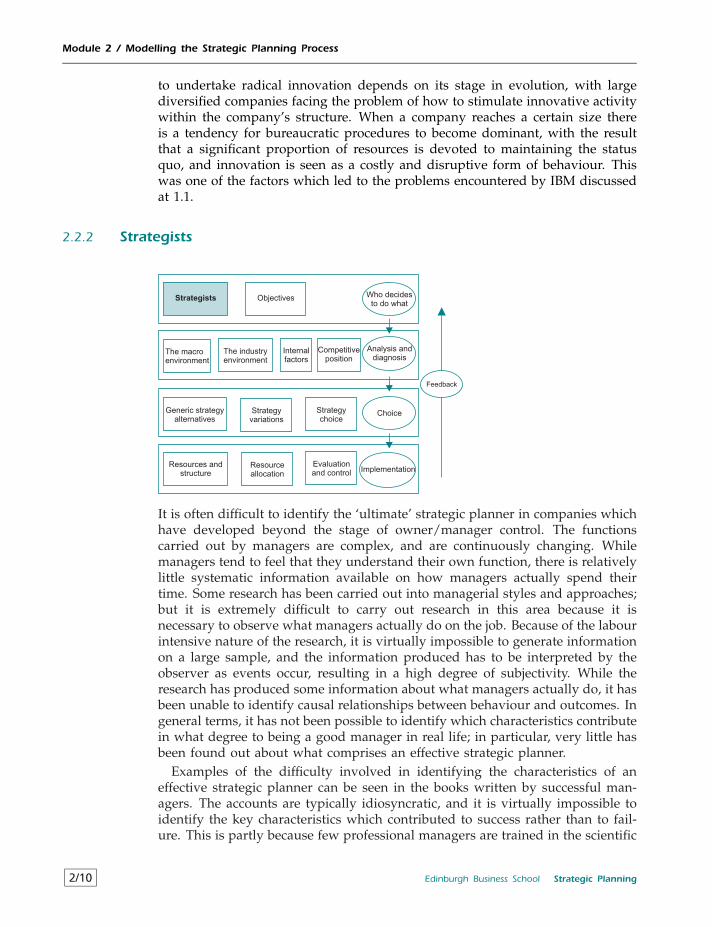
Module 2 / Modelling the Strategic Planning Process
to undertake radical innovation depends on its stage in evolution, with largediversified companies facing the problem of how to stimulate innovative activitywithin the company’s structure. When a company reaches a certain size thereis a tendency for bureaucratic procedures to become dominant, with the resultthat a significant proportion of resources is devoted to maintaining the statusquo, and innovation is seen as a costly and disruptive form of behaviour. Thiswas one of the factors which led to the problems encountered by IBM discussedat 1.1.
2.2.2 Strategists
Strategists Objectives
The macroenvironment
The industryenvironment
Internalfactors
Competitiveposition
Generic strategyalternatives
Strategyvariations
Who decidesto do what
Analysis anddiagnosis
Choice
Implementation
Strategychoice
Resources andstructure
Resourceallocation
Evaluationand control
Feedback
It is often difficult to identify the ‘ultimate’ strategic planner in companies whichhave developed beyond the stage of owner/manager control. The functionscarried out by managers are complex, and are continuously changing. Whilemanagers tend to feel that they understand their own function, there is relativelylittle systematic information available on how managers actually spend theirtime. Some research has been carried out into managerial styles and approaches;but it is extremely difficult to carry out research in this area because it isnecessary to observe what managers actually do on the job. Because of the labourintensive nature of the research, it is virtually impossible to generate informationon a large sample, and the information produced has to be interpreted by theobserver as events occur, resulting in a high degree of subjectivity. While theresearch has produced some information about what managers actually do, it hasbeen unable to identify causal relationships between behaviour and outcomes. Ingeneral terms, it has not been possible to identify which characteristics contributein what degree to being a good manager in real life; in particular, very little hasbeen found out about what comprises an effective strategic planner.
Examples of the difficulty involved in identifying the characteristics of aneffective strategic planner can be seen in the books written by successful man-agers. The accounts are typically idiosyncratic, and it is virtually impossible toidentify the key characteristics which contributed to success rather than to fail-ure. This is partly because few professional managers are trained in the scientific
2/10 Edinburgh Business School Strategic Planning
Module 2 / Modelling the Strategic Planning Process
approach, and this is compounded by the fact that their accounts are at leastpartially concerned with portraying themselves in a favourable light.
One of the best known research findings is that there is a significant differencebetween what general managers actually do and what theory suggests that theyought to do. For example, when seeking out information, theorists suggest thatthe general manager should think in terms of obtaining data which will enablethorough organisational and environmental analysis to be carried out, whichin turn will assist the manager in arriving at effective strategies. However,research suggests that general managers prefer verbal sources and that theyavoid documented information; their approach is impressionistic rather thandetailed. Added to this is the widely known fact, which does not requireresearch to verify it, that there are significant differences in management style:some general managers are naturally reflective while others tend to be doers.There is therefore no particular reason to expect that observed managementbehaviour will be identical for different individuals; what is not known iswhether such variation has an impact on effectiveness. The observer basedresearch has not uncovered significant connections between management styleand effectiveness.
Since the activities of managers cannot be readily classified and fitted intoa model of behaviour, the precise role of different managers in the strategicplanning process is not subject to hard and fast rules. The roles which managersplay depend on many factors unique to the individual company; for example, incompanies with a rigid hierarchical structure the process may be concentratedon one person, such as the managing director. For many managers the identityof the strategic planner in their own company is obscure, and many may not beable to identify any one person with responsibility for the function.
Strategic planning can be regarded as a multidimensional role which is under-taken by many individuals working at different levels. For example, there arecorporate level strategists, typically the Board of Directors and the CEO; belowthese are the SBU strategists, who comprise executives, planning departmentsand consultants. In some cases the pinnacle of the strategic planning process isoccupied by the General Manager who sits at the top of the decision makingprocess. It is thus the case that control of the strategic planning process canrest in the hands of different people. This does not mean that the process itselfcannot be identified and analysed, but it does suggest that companies shouldgive some thought to how the function is undertaken in their organisations. Ifno one is very sure about who is carrying out the strategic planning function, itcould well be that the process itself could be greatly improved.
Our attempt to categorise the experiences of the Mythical Company helps toexplain why the attempts to identify what managers do, and the functions ofstrategic planners, have produced little in the way of results. A glance at thefunctional model of Figure 2.1 suggests one good reason for this: the wholeprocess is very complex. There are 12 separate boxes in the functional model,each of which may relate to a number of functional specialists. In any one daya manager may be involved in evaluation and control problems, discussionson strategy variations, investigating changes in the competitive environment,and resource allocation problems. Sometimes the activities in these boxes may
Strategic Planning Edinburgh Business School 2/11
Module 2 / Modelling the Strategic Planning Process
overlap, and the manager may give very little thought to why particular actionsare being undertaken in terms of the general strategy picture, being only awarethat specific problems need to be solved quickly. The trouble is that immediatesolutions may be mistaken when viewed against the backdrop of the functionalmodel; for example, decisions on resource allocation may be made solely withreference to accounting rather than taking relevant marketing information intoaccount.
The functional process model also provides insights into the complexity ofthe management function in terms of the roles which managers are requiredto adopt at different times, and because of the fluid nature of everyday eventsthe manager is likely to flit from one role to another without giving the matterconscious thought. The four ‘eggs’ on the right hand side of the process modelserve to identify several roles.
• Strategist, entrepreneur and goal setter. Even in large companies these functionsare not the sole domain of the chief executive, and some aspects are typicallydevolved to managers. While managers are to some extent constrainedby existing plans and commitments, they have a role to play in makingdecisions about potential investments, reacting to changing circumstances,identifying new courses of action and so on.
• Analyser and competitor. The manager needs to be constantly aware ofchanges in the economic environment, the efficiency of the firm, and itscompetitive position. The process of information collection and analysis istime consuming, and it is necessary for managers to filter out what is unim-portant and focus on factors which are likely to impact significantly on thefirm. Managers are typically keenly aware that time spent on analysing isat the expense of more immediate concerns and this role tends to be givena low priority because of its lack of immediate payoff.
• Strategy decision maker. It is rare that major strategy decisions are taken with-out wide managerial consultation. Options must be identified and differentpoints of view brought to bear in order to assess the costs and benefitsassociated with each. At times the manager will be involved in higher levelstrategy assessment, and at others he will be making devolved strategy typedecisions at his own level.
• Implementer and controller. Once decisions have been taken the managerhas a major role to play in making them happen. This involves allocatingresources in the first instance. Organising resources is typically thought ofas being the major role a manager has to perform, but in fact it is onlyone of several, and it may not consume most time. As well as allocatingresources, the manager has to monitor how effectively resources are beingutilised, and this means that systems must be set up which adequatelymeasure performance.
• Communicator. As new information becomes available and competitive con-ditions change the manager has to ensure that everyone is kept aware ofchanges in direction as far as possible.
There is more to the problem of management than complexity and competingdemands on the manager’s time and intellectual resources. There is also a degree
2/12 Edinburgh Business School Strategic Planning
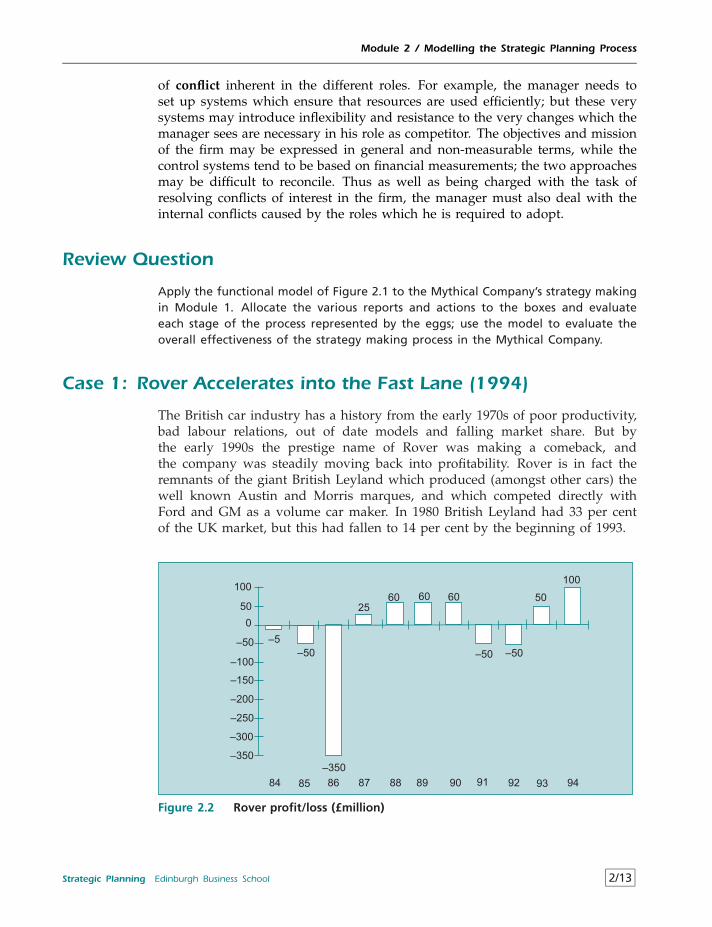
Module 2 / Modelling the Strategic Planning Process
of conflict inherent in the different roles. For example, the manager needs toset up systems which ensure that resources are used efficiently; but these verysystems may introduce inflexibility and resistance to the very changes which themanager sees are necessary in his role as competitor. The objectives and missionof the firm may be expressed in general and non-measurable terms, while thecontrol systems tend to be based on financial measurements; the two approachesmay be difficult to reconcile. Thus as well as being charged with the task ofresolving conflicts of interest in the firm, the manager must also deal with theinternal conflicts caused by the roles which he is required to adopt.
Review Question
Apply the functional model of Figure 2.1 to the Mythical Company’s strategy makingin Module 1. Allocate the various reports and actions to the boxes and evaluateeach stage of the process represented by the eggs; use the model to evaluate theoverall effectiveness of the strategy making process in the Mythical Company.
Case 1: Rover Accelerates into the Fast Lane (1994)
The British car industry has a history from the early 1970s of poor productivity,bad labour relations, out of date models and falling market share. But bythe early 1990s the prestige name of Rover was making a comeback, andthe company was steadily moving back into profitability. Rover is in fact theremnants of the giant British Leyland which produced (amongst other cars) thewell known Austin and Morris marques, and which competed directly withFord and GM as a volume car maker. In 1980 British Leyland had 33 per centof the UK market, but this had fallen to 14 per cent by the beginning of 1993.
–50
–5
60
84 85 86 87 88 89 90 91 92 93 94
–350
–300
–250
–200
–150
–100
–50
0
50
100
–50
–350
25
60 60
–50
50
100
Figure 2.2 Rover profit/loss (£million)
Strategic Planning Edinburgh Business School 2/13
Module 2 / Modelling the Strategic Planning Process
The approximate trading profitability record of Rover since 1984 is shown inFigure 2.2. The productivity record can be judged from the fact that in 1988 thecompany produced 10 cars per worker (one of the worst productivity records inthe world industry), and by 1993 it produced 14 cars per worker. This was stillshort of the company objective of 20 cars per worker, already achieved by theJapanese. The workforce had been reduced to 32 000 by 1993 from 44 000 threeyears earlier.
By 1993 the company still faced the problem that its car production madelosses, while all trading profits were due to the 4-wheel drive Range Rover andDiscovery models; by 1994 profits on this division were about £200 million – sothe other 80 per cent of the company was making a loss of about £100 million.
The market performance of Rover by 1993 was outstanding in many respects.During 1993 continental Europe was in recession, while the UK was emergingfrom recession. The sales picture is shown in Table 2.2.
Table 2.2 Rover’s relative sales growth in 1993
Area Total Market Growth Rover Sales Growth
UK +5% +9%
Europe −20% +5%
How Rover got there
The recovery was not an overnight affair, but dated back 15 years or more. Roverwas fortunate to have had two outstanding leaders who paved the way forfuture success. During the late 1970s Sir Michael Edwardes effectively ended thelong term labour unrest in British Leyland by much improved labour relationspolicies, and forged the link with Honda which gave Rover access to moderncar technology. His successor, Sir Graham Day, provoked a cultural revolutionby convincing his managers that Rover was no longer a volume producer whichcould compete with Ford and GM; this was not easy, because he had to convincelong serving managers that the company did not have the volumes to be a lowcost producer. He changed the name to Rover and disposed of the Austin andMorris marques. Rover established partnerships with a few key suppliers andas a result restrained cost increases and improved systems reliability.
In 1985 Rover’s break-even output was 500 000 cars per year; by 1993 this wasdown to 400 000, and the objective was to reduce this further in line with beinga niche producer. The CEO in 1993, George Simpson, felt that there was plentyof scope for a ‘medium sized, slightly upmarket, semi-autonomous’ car maker.However, he felt that the future for European car makers was unclear becausethere will be significant levels of over-capacity for up to 10 years, and this maylead to price wars. Rover would also need to raise a significant level of longterm debt if it was to develop a new small car to replace the Metro.
Enter BMW
2/14 Edinburgh Business School Strategic Planning
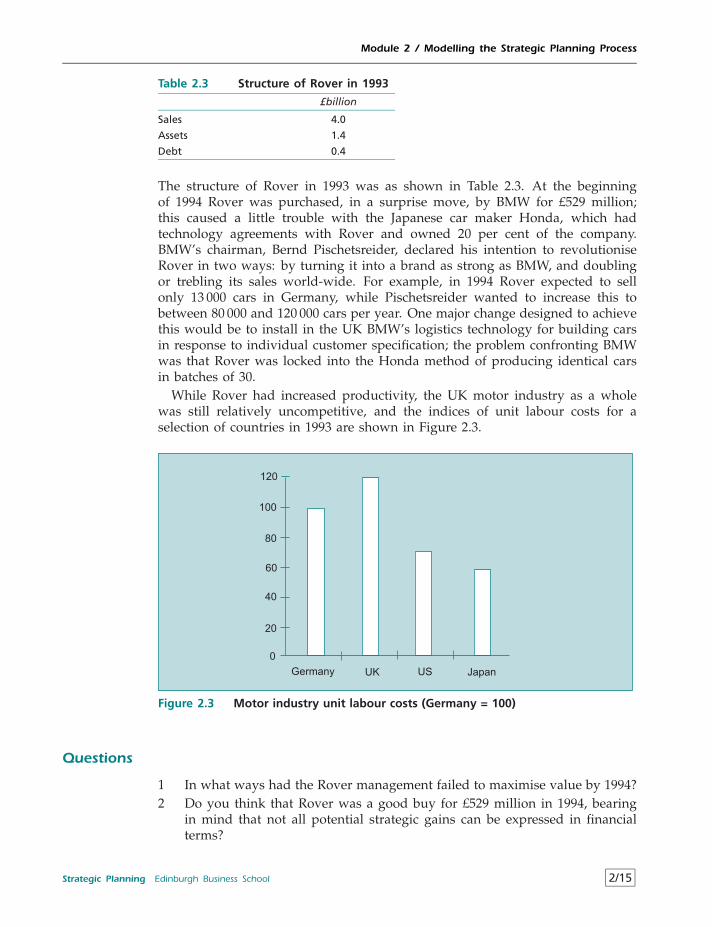
Module 2 / Modelling the Strategic Planning Process
Table 2.3 Structure of Rover in 1993
£billion
Sales 4.0
Assets 1.4
Debt 0.4
The structure of Rover in 1993 was as shown in Table 2.3. At the beginningof 1994 Rover was purchased, in a surprise move, by BMW for £529 million;this caused a little trouble with the Japanese car maker Honda, which hadtechnology agreements with Rover and owned 20 per cent of the company.BMW’s chairman, Bernd Pischetsreider, declared his intention to revolutioniseRover in two ways: by turning it into a brand as strong as BMW, and doublingor trebling its sales world-wide. For example, in 1994 Rover expected to sellonly 13 000 cars in Germany, while Pischetsreider wanted to increase this tobetween 80 000 and 120 000 cars per year. One major change designed to achievethis would be to install in the UK BMW’s logistics technology for building carsin response to individual customer specification; the problem confronting BMWwas that Rover was locked into the Honda method of producing identical carsin batches of 30.
While Rover had increased productivity, the UK motor industry as a wholewas still relatively uncompetitive, and the indices of unit labour costs for aselection of countries in 1993 are shown in Figure 2.3.
0
20
40
60
80
100
120
Germany UK US Japan
Figure 2.3 Motor industry unit labour costs (Germany = 100)
Questions
1 In what ways had the Rover management failed to maximise value by 1994?2 Do you think that Rover was a good buy for £529 million in 1994, bearing
in mind that not all potential strategic gains can be expressed in financialterms?
Strategic Planning Edinburgh Business School 2/15
Module 2 / Modelling the Strategic Planning Process
3 Discuss the strategies of Edwardes, Day and Pischetsreider using the processmodel.
Case 2: The Millennium Dome: How to Lose Money in the 21stCentury (2001)
The Millennium Dome was designed to mark Britain’s triumphant entry intothe new millennium and, as the Prime Minister Mr Tony Blair said, it was goingto be ‘the greatest show on earth’. But after six months of operation both theChairman and the CEO had been sacked and it was eating up public money atthe rate of about £20 million per month while little more than half the expectednumber of visitors had turned up. What could have caused this drastic outcomefor such a high profile national investment?
The Millennium Dome was conceived by the Conservative government in themid 1990s and was taken on by the Labour government which was electedin 1997; however, newspaper reports at the time suggested that a significantminority of Cabinet Ministers were opposed to the idea.
The original notion was that the Dome would open for the Millennium cele-brations and its attractions would subsequently stay open for a year; after thatthe Dome would be sold to the highest bidder, most probably for scrap. It wasto be funded by a combination of Lottery grants through the Millennium Com-mission and company sponsorship; these companies would figure prominentlyin the various zones within the Dome.
Mission and Objectives
The following is taken from the Millennium Dome website.
Mission• To create, build, and operate a national Millennium Experience which
attracts, inspires, entertains, educates and involves visitors and participants.• To seek, through the Experience, to influence positively each individual’s
view of themselves and the world’s view of this nation.• The Millennium Experience incorporates the Dome at Greenwich and a
linked programme of events and activities throughout the UK which willbe branded as The Challenge.
Objectives• To deliver a once in a lifetime, high quality Experience at Greenwich and a
country-wide Challenge programme to time and to budget.• To achieve at least 12 million visits to the Dome at Greenwich.• To deliver value for money to the Millennium Commission, sponsors and
paying visitors.• To develop and implement the Experience in a way which:
– Optimises access, in the widest sense, by people of all ages, back-grounds and interests achieving a nationally and socially inclusiveevent.
2/16 Edinburgh Business School Strategic Planning
Module 2 / Modelling the Strategic Planning Process
– Involves, engages, entertains, educates and transforms the visitor andparticipant.
– Makes best use of British and international creative talent and state ofthe art technology.
• To create a world profile for the celebration of the millennium in the UK. Toassist, and where possible contribute to, the Government’s policy that therewill be a lasting legacy for the nation from the Experience.
Forecasts of Visitor Numbers
The New Millennium Experience Company (NMEC) was responsible for runningthe Dome and projected in 1997 that the Dome would attract 11 million payingcustomers during the Millennium year, and that 1 million free visits would alsobe provided. Despite the fact that advance ticket sales were very poor the NMECstill adhered to this forecast by January 2000. Later that month the figure wasrevised down to 10 million and the NMEC still claimed that the Dome wouldbreak even over the course of the year. By May 2000 the dome had attractedonly 2 million paying customers and the prospect of meeting the target lookedremote. In June the target was reduced to 6 million. By the end of the year 5million visitors actually turned up.
The grand opening was a farce, with many VIPs being stranded at the railwaystation for hours. Subsequently there were many complaints of the length oftime spent in queues. In August 2000 a government report concluded thatan important reason for the poor attendance figures was the lack of a ‘wow’factor: the exhibits were all interesting but none of them really captured theimagination.
What Was Spent on the Dome
The Dome costs as estimated in 1997 were as follows.
£ millionConstruction & infrastructure 198Exhibition & central attraction 95Operations & running costs in year of operation:
The Challenge 54Marketing 29Support services 34Central contingency 88
Total 498
The Dome Revenue
The original projections were
£ millionSponsorship 150
Strategic Planning Edinburgh Business School 2/17
Module 2 / Modelling the Strategic Planning Process
Commercial activities 194Final sale value (probably for scrap) 15Total 359
It is assumed that the ‘commercial activities’ refer to the sales of tickets. Ifthis were the case it would appear that from the outset the Dome was expectedto have a financial shortfall of £139 million.
The tickets were priced at a basic £20 per adult and £16.50 per child; specialrates were set for families and parties so it is likely that the average price paidwas in the region of £17. Using this figure the following revenues would havebeen generated with the three estimates of attendance.
£ million11 million (up to January 200) 18710 million (from end January 2000) 1706 million (from June 2000) 102
The figure of £187 million is not far away from the original estimate of £194million. However, using the 6 million figure for visitors the shortfall increasesfrom £139 million to £231 million. This amounts to a subsidy of about £40 forevery ticket sold.
Pouring the Cash In
It should come as no surprise that, when the number of paying visitors fell farbelow expectations, significant cash flow problems arose and it became necessaryto inject more public money.
The original Millennium Commission lottery grant was for £399 million; anadditional grant of £50 million was paid in November 1999, another £60 millionin February 2000 and a further £29 million in May 2000. This meant that atotal of £538 million of public money had been injected into the Dome. This,of course, was only half way through 2000 by which time only about halfof the running and operating costs of the Dome would have been incurred.But ignoring this, given the cost and revenue estimates, it should only havebeen necessary to inject about £231 million into the Dome. So where had theadditional £307 million gone? It was later discovered that accounting procedureswere very poor and it was almost impossible to construct a balance sheet.
Who Were the Managers?
The Board of the NMEC was comprised of some well known and highly success-ful British business personalities. The Chairman was Mr Robert Ayling whosemain employment was CEO of British Airways. The Dome CEO was Miss JennyPage who had overseen the construction and launch of the whole project; MissPage had previously been CEO of the Millennium Commission and English Her-itage and was a forceful and dynamic character. Her top priority was to completethe Dome on time and to achieve this was a remarkable accomplishment.
2/18 Edinburgh Business School Strategic Planning
Module 2 / Modelling the Strategic Planning Process
When the Dome’s financial problems started to become apparent in FebruaryMr Ayling sacked Miss Page. Soon afterwards Mr Ayling was fired by BritishAirways which was experiencing heavy losses. In May, at the time of the £29million handout, Mr Ayling was fired from his position as Chairman of NMEC.
The new CEO was Mr Pierre-Yves Gerbeau who took over in a blaze ofpublicity but was unable to revive the Dome’s failing fortunes.
What Next for the Dome?
In July 2000 it was announced that a consortium backed by Nomura Internationalwas to invest more than £800 million in the Dome to turn it into a hugeentertainment resort with hotels, restaurants, shops and offices; some £200million would be spent on refurbishing the Dome and its exhibits in order toattract tenants. The investment included a payment of £53 million to MNEC.However, agreement could not be reached on the details and Nomura withdrew;no credible bid was subsequently received and the contents of the Dome wereauctioned off for a few million pounds at the beginning of 2001.
Questions
1 Assess the Dome as a financially viable concept if its life had not beenrestricted to one year.
2 Discuss the fortunes of the Dome using the process model.
References
1 Quinn, J. B. (1980) Strategies for Change: Logical Incrementalism, Richard D. Irwin.
2 Schendel, D. (1994) ‘Introduction to the Summer 1994 Special Issue – Strategy: searchfor new paradigms’, Strategic Management Journal, Vol. 15 (Special Issue), pp. 1–5.
Strategic Planning Edinburgh Business School 2/19

Module 3
Company Objectives
Contents
3.1 Setting Objectives 3/2
3.2 From Vision to Mission to Objectives 3/33.2.1 Defining the Business of the Organisation 3/43.2.2 Deriving the Mission Statement 3/53.2.3 Disaggregating the Mission 3/63.2.4 Setting Objectives 3/7
3.3 The Gap Concept 3/73.3.1 External versus Internal Gap Factors 3/93.3.2 Gaps and Resources 3/93.3.3 Gaps and Incentives 3/10
3.4 Credible Objectives 3/10
3.5 Quantifiable and Non-Quantifiable Objectives 3/11
3.6 Aggregate Objectives 3/13
3.7 Disaggregated Objectives 3/14
3.8 The Principal/Agent Problem 3/15
3.9 Means and Ends 3/17
3.10 Behavioural versus Economic and Financial Objectives 3/18
3.11 Economic Objectives 3/18
3.12 Financial Objectives 3/213.12.1 Discounting and Present Value 3/213.12.2 Net Present Value 3/223.12.3 Capitalised Value 3/223.12.4 Choice of Interest Rate: The Cost of Capital 3/233.12.5 Return on Investment 3/253.12.6 Shareholder Wealth 3/26
3.13 Social Objectives 3/29
3.14 Stakeholders 3/313.14.1 Stakeholder Interest 3/313.14.2 Stakeholder Interests: The Priorities 3/323.14.3 Stakeholder Influence 3/343.14.4 Mapping Stakeholders 3/37
3.15 Ethical Considerations 3/38
Review Question 1 3/40
Review Question 2 3/40
Strategic Planning Edinburgh Business School 3/1
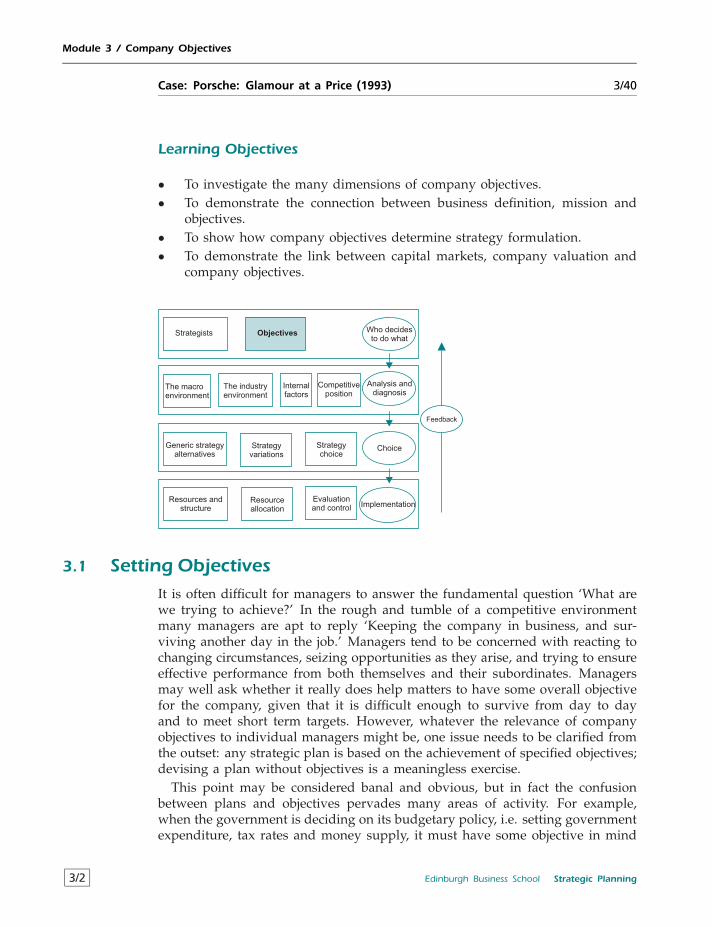
Module 3 / Company Objectives
Case: Porsche: Glamour at a Price (1993) 3/40
Learning Objectives
• To investigate the many dimensions of company objectives.• To demonstrate the connection between business definition, mission and
objectives.• To show how company objectives determine strategy formulation.• To demonstrate the link between capital markets, company valuation and
company objectives.
Strategists Objectives
The macroenvironment
The industryenvironment
Internalfactors
Competitiveposition
Generic strategyalternatives
Strategyvariations
Who decidesto do what
Analysis anddiagnosis
Choice
Implementation
Strategychoice
Resources andstructure
Resourceallocation
Evaluationand control
Feedback
3.1 Setting ObjectivesIt is often difficult for managers to answer the fundamental question ‘What arewe trying to achieve?’ In the rough and tumble of a competitive environmentmany managers are apt to reply ‘Keeping the company in business, and sur-viving another day in the job.’ Managers tend to be concerned with reacting tochanging circumstances, seizing opportunities as they arise, and trying to ensureeffective performance from both themselves and their subordinates. Managersmay well ask whether it really does help matters to have some overall objectivefor the company, given that it is difficult enough to survive from day to dayand to meet short term targets. However, whatever the relevance of companyobjectives to individual managers might be, one issue needs to be clarified fromthe outset: any strategic plan is based on the achievement of specified objectives;devising a plan without objectives is a meaningless exercise.
This point may be considered banal and obvious, but in fact the confusionbetween plans and objectives pervades many areas of activity. For example,when the government is deciding on its budgetary policy, i.e. setting governmentexpenditure, tax rates and money supply, it must have some objective in mind
3/2 Edinburgh Business School Strategic Planning
Module 3 / Company Objectives
in terms of real income per head, inflation and unemployment; if not, it wouldnot matter which policies were undertaken. But try to get any member ofthe government to be explicit about the objectives which the government isattempting to achieve, and see how far you get. At the level of the company,some managers become so involved in the planning process that they overlookwhat it is meant to achieve; there is a danger that managers confuse the meansby which ends are to be achieved with the ends themselves.
Since strategy is at least partly concerned with confrontation with competitors,it may not always be advisable for a company to be explicit about its objectives.For example, a company may identify an increased market share in a particularmarket segment as a major policy objective. However, if competitors becameaware of this they could pre-empt the company’s moves by reducing prices, withthe result that the company becomes worse off than before. There is clearly abalance to be struck between informing managers about objectives and ensuringthat competitors cannot pre-empt strategic moves. Reluctance on the part ofsenior managers to be specific about company objectives may help account forthe fact that many companies express their objectives in terms of bland ‘missionstatements’ which are devoid of operational implications. It is also likely thatin the early stages of strategy formulation it is not possible to identify morethan the general thrust of strategy, and at this stage it is not possible to bespecific.
The mission statement can be an important dimension of the company objec-tive because it captures the attitudes and expectations of employees and providesa general focus for its activities with which people can identify. Although themission may not be an operational idea, it can provide the general frameworkover time within which strategies are worked out. However, it needs to be bornein mind that a company is a collection of many individuals, each with their ownset of goals, and it may not be possible to find a general statement of intentwhich is consistent with these sub-goals and which will galvanise everyone in acommon purpose. Whether the mission statement is a powerful, visionary focusfor company activity, or whether it is no more than a meaningless compromisedepends on the individual circumstances.
3.2 From Vision to Mission to Objectives
One of the primary roles of the CEO is to develop a long term view of what thecompany is about and the markets within which it should be operating. Thisis sometimes referred to as the vision because it is not expressed in detailedterms and is perhaps no more than a broad thrust within which the companywill be directed. But it is necessary to translate this vision into a tangible set ofdirections which can be used by employees to direct their efforts in a mannerwhich is consistent throughout the organisation. There are a number of stepswhich are necessary to achieve this:
1 develop the mission statement;2 disaggregate the mission;3 derive objectives.
Strategic Planning Edinburgh Business School 3/3
Module 3 / Company Objectives
There is no absolutely right or wrong way to proceed in developing objectiveswhich serve as the basis for directing resources, but it needs to be recognisedthat if objectives are to serve a useful function they need to be logically thoughtout.
The mission statement needs to have several characteristics including thefollowing.
• Serve as a definition of the business the organisation is in.• Be clearly understood by employees.• Provide a focus for activities.
The characteristic which raises most difficulty is defining the business of theorganisation. Because this issue is of central importance it is worth spendingsome time considering how this definition might be arrived at.
3.2.1 Defining the Business of the Organisation
In a world of constant change it is worth stepping back on a regular basis andconfronting the issue of what business the company is actually in; this is becausemarkets can change without managers being aware of the fact because they aretoo closely involved in the day to day running of the company to appreciatewider events. For example, the managers of a football club may run the clubunder the impression that they are in the sport business; but if they realised thatthe club was really in the entertainment business they would approach theirmanagement job in a different way.
It is not always obvious what the business definition is even when a welldefined product is involved. Take the case of a soft drinks company, where afew questions reveal potentially significant differences in business definition.
1 Does the company control all stages of production or does it purchase allingredients and merely mix and bottle?
2 Does the company control distribution and marketing channels?3 Does the company compete in the soft drinks or beverage market?4 Is the drink a stand alone or is it also intended as a mixer?
• Question 1 relates to the productive scope of the company, i.e. the extentto which it buys in its inputs and hence how it perceives its own supplychain. For example, a soft drinks company which makes its own bottles hasa whole series of concerns which are absent from a company which buys itsbottles from a bottle making company. In particular, it has to be concernedwith the efficiency of its own bottle making plant, rather than relying on theforces of the market to enable it to purchase bottles at the lowest cost. Thescope of the company also impacts on the skill set which the company needsto develop, and has an effect on how the company focuses its resources.For example, the company which buys in bottles needs a negotiator whocan work out deals with bottle manufacturers which generate a competitiveprice and a guarantee of supplies; the company which makes its own bottles
3/4 Edinburgh Business School Strategic Planning
Module 3 / Company Objectives
needs to recruit individuals with productive expertise in this function. Theseare clearly quite different skill sets.
• Question 2 relates to the market positioning of the product; for example, thecompany may produce soft drinks for ‘own brand’ supermarket products,and have little need for marketing the product in its own right. This is offundamental importance for company expansion, because the own brandproducer can only expand if its customer base grows or by finding morelarge customers to supply, while the company which markets directly toconsumers can increase its sales by marketing more aggressively.
• Question 3 relates to the breadth and focus of the business definition; forexample, soft drinks are sold alongside alcoholic drinks in restaurants andpublic houses, and could be promoted as an alternative to alcoholic drinks.Or it might be possible to present the soft drink as an alternative to coffee,which contains caffeine and is a mild stimulant.
• Question 4 relates to the target markets; for example, tonic water is relativelyrarely consumed on its own and is usually mixed with gin. It is unlikelythat tonic water could be aimed at both this market and the health market.
The first step, then, in arriving at a vision for the company and its future isto understand properly what business the company is in. Unless this is clearlydefined the company vision is likely to be meaningless at best, and misleadingat worst.
3.2.2 Deriving the Mission Statement
Once the business definition has been arrived at it is possible to derive astatement of how the company intends to operate within that business area. Thestatement may be related to factors such as the following.
• the quality of the company’s products;• the degree of differentiation;• the geographical area which it intends to serve;• the segment of consumers which it targets.
Reverting to the hypothetical soft drinks company discussed above, the mis-sion statement could take the following forms depending on how the businessis visualised.
• To deliver high energy drinks to energetic individuals who care about theirhealth.
• To service the soft drink needs of supermarket chains who need a highquality dependable product to market under their umbrella brand.
• To target teenage consumers who want a brightly coloured effervescentdrink in an unusually shaped container.
Each of these mission statements provides employees with a different focus,and implies a different allocation of resources and marketing approaches. But theoperational usefulness of the mission statement can be exaggerated, and it can
Strategic Planning Edinburgh Business School 3/5
Module 3 / Company Objectives
often be argued that the mission statement is merely a description of what thecompany is rather than providing any new direction to employees. For example,the company may have been producing own brand drinks to supermarkets sinceit began business, so the introduction of a mission statement has virtually noimpact on employees.
Sometimes the mission is a statement of where senior management wish theorganisation to be at some point in the future. For example, a company mightaspire to be the market leader in terms of market share, and therefore themission statement is based not only on what business the company is in, butwhere it would like to be positioned within the relevant market. But in thesecases it is important not to produce a mission which employees see as beingunattainable and to which they cannot relate. The consequences could be quitefar reaching, as middle managers and employees may develop a cynical view ofsenior management and their aspirations.
3.2.3 Disaggregating the Mission
The mission statement for the company as a whole can be quite general, but itcan be modified and applied to individual parts of the organisation to ensure,as far as possible, that the focus of functional departments is aligned with thevision of the senior managers. The missions of functional departments could beexpressed as follows.
• Corporate security’s mission is to protect corporate personnel in an unob-trusive fashion by preventative measures whenever possible.
• Human resources’ mission is to identify and develop effective leaders, createhigh performance teams and enable individuals to maximise their potential.
While such mission statements might appear to be obvious, in their turn theycan have a major influence on the focus of the functional departments. Forexample, compare the following mission statements with those above.
• Corporate security’s mission is to provide a feeling of corporate security bya high profile stance of uniformed patrols and fast response.
• Human resources’ mission is to focus on the development of the individualrather than that of groups and foster the benevolent culture created by itsfounder.
The type of security personnel required for the first mission statement would,of course, be totally different to those required for the second. The focus ofhuman resources on developing leaders and effective teams rather than activelypursuing the development of individuals as a top priority implies differentcriteria for recruitment and promotion.
3/6 Edinburgh Business School Strategic Planning
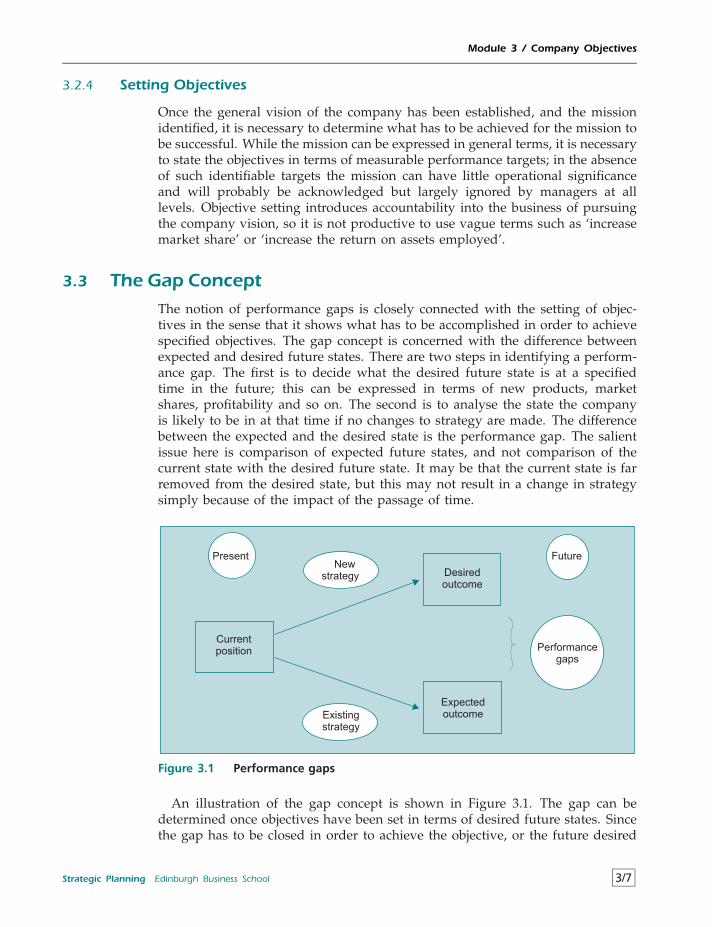
Module 3 / Company Objectives
3.2.4 Setting Objectives
Once the general vision of the company has been established, and the missionidentified, it is necessary to determine what has to be achieved for the mission tobe successful. While the mission can be expressed in general terms, it is necessaryto state the objectives in terms of measurable performance targets; in the absenceof such identifiable targets the mission can have little operational significanceand will probably be acknowledged but largely ignored by managers at alllevels. Objective setting introduces accountability into the business of pursuingthe company vision, so it is not productive to use vague terms such as ‘increasemarket share’ or ‘increase the return on assets employed’.
3.3 The Gap ConceptThe notion of performance gaps is closely connected with the setting of objec-tives in the sense that it shows what has to be accomplished in order to achievespecified objectives. The gap concept is concerned with the difference betweenexpected and desired future states. There are two steps in identifying a perform-ance gap. The first is to decide what the desired future state is at a specifiedtime in the future; this can be expressed in terms of new products, marketshares, profitability and so on. The second is to analyse the state the companyis likely to be in at that time if no changes to strategy are made. The differencebetween the expected and the desired state is the performance gap. The salientissue here is comparison of expected future states, and not comparison of thecurrent state with the desired future state. It may be that the current state is farremoved from the desired state, but this may not result in a change in strategysimply because of the impact of the passage of time.
Present
Currentposition
Existingstrategy
Newstrategy Desired
outcome
Expectedoutcome
Future
Performancegaps
Figure 3.1 Performance gaps
An illustration of the gap concept is shown in Figure 3.1. The gap can bedetermined once objectives have been set in terms of desired future states. Sincethe gap has to be closed in order to achieve the objective, or the future desired
Strategic Planning Edinburgh Business School 3/7
Module 3 / Company Objectives
state of the company, the closing of the gap could be defined as the companyobjective. This is not quite consistent with the definition of an objective, sincethe closing of the gap is a means to an end, not the end itself. It may turn outthat identification of the gap results in a modification of the company objective,because it transpires that the gap cannot be closed; there is continual feedbackbetween objective setting and gap analysis.
The problem facing planners is to make projections of total company perform-ance; this can be complicated, and is typically carried out by using the scenarioapproach. A scenario comprises a series of ‘what if’ projections, and should notbe confused with a forecast. For example, if the desired future state involvedachieving a 3 per cent higher market share in two years, a scenario could beinvestigated whereby marketing expenditure would be increased by 30 per centduring the next two years. The resulting scenario would include the impact oncash flow, the likely effect on market share, the reaction of competitors, and theidentification of what additional measures might be required, such as a pricereduction and increased productive capacity. This is clearly a difficult process,but it is of considerable value in focusing attention on the potentially mostimportant factors determining the ability to achieve objectives.
There is more to scenario planning than meets the eye, because it is based ona premise that makes many people uncomfortable, namely, that it is impossibleto foretell the future and possibly dangerous to attempt to do so. A scenario isactually a carefully argued narrative about a particular way in which the futuremight take shape. It is therefore a story about what could happen if particularassumptions hold true. It is not an attempt to say what will happen. Instead,the idea is to compare the scenario’s implications with the implications of rivalscenarios and then examine the costs of being prepared to cope with thesepossible futures.
The approach is usually associated with Shell International Petroleum Com-pany. The Shell senior planners had been disturbed by the quality of their ownpredictions round about the time of the 1973 oil price rises, and developed themethod as a means of coping with a great deal of uncertainty over oil supplies,prices and related issues. However, they encountered resistance to this approachfrom colleagues; this is because to most people, planning is an activity thatshould reduce uncertainty rather than increase awareness of it – and there is awidespread predisposition to converting alternative scenarios to single point orline estimates. This is what the Shell planners encountered, and they reckonedthat it took about eight years for management to accept that scenario planningwas an appropriate tool for developing strategy.
Once the gap has been identified, three questions can be tackled:
• Does the gap arise because of external or internal factors?• Does the company have potential resources to close the gap?• Can a strategy be developed which will close the gap?
A revealing outcome of gap analysis is that while it may appear that thedifference between the current and the desired state is not large, there may wellbe a substantial difference between expected and desired states. Gap analysiscan reveal that the company is not actually moving in the direction desired,
3/8 Edinburgh Business School Strategic Planning
Module 3 / Company Objectives
and closing such a gap may imply substantial redeployment of resources andchanges in marketing strategy.
3.3.1 External versus Internal Gap Factors
Broadly speaking, there are two reasons for the emergence of gaps: those factorsoutside and those within the control of the company. If the gap is due to factorsoutside the control of the company, such as a predicted reduction in marketsize and product prices, the original company objectives may be revealed asunfeasible because the changes in the market are too great to counter. Thereis clearly no point in pursuing a target level of sales and revenues if marketconditions will make it impossible to achieve; this would lead to a waste ofresources, and could have far reaching implications for employee incentivesand commitment. Other external factors might be aggressive competitor actionsor government intervention, both of which it might be possible to counter byappropriate marketing policies. The fact that gaps are due to external causesdoes not necessarily mean that the company can do nothing about them, butthose instances where they cannot be fully counteracted need to be recognised.
Internal gap constraints arise when the current allocation of resources isnot consistent with achieving the future desired state. The process of resourcereallocation may not be easy, and some managers may be unwilling to cutback on resources in some areas and increase them in others when there isno immediate and obvious benefit. Another internal gap factor arises whenthe resources available to the company are insufficient in quantity or quality toachieve the desired objective. Capital equipment may be obsolete, managers maynot be sufficiently enterprising or labour might not have the necessary skills.Internal gap factors are related to the mobilisation of resources, and as such aremore likely to lie within the control of the company. However, it may well bethat the restructuring of the company implied by some internal gap factors istoo great to be accomplished with the skills and finance at its disposal. It maybe possible to overcome this by initiating a programme of change management,but this may not be an immediate solution.
3.3.2 Gaps and Resources
It is not just the company’s ability to acquire and deploy resources which isimportant, but the timing involved. By combining gap analysis with the dynamicscenario approach it is possible to estimate the timing of resource acquisition andreallocation required to achieve a desired future state. By taking a view on thefuture course of events it is possible to identify those actions which are essentialfor implementation; these are known as critical success factors. Once these havebeen identified steps can be taken to arrange finance, recruit personnel, increaseproductive capacity and ensure that the various service functions are in place inadvance of requirements. This helps to avoid the emergence of production bottle-necks, skill shortages and financial headaches which typically beset companiesduring the process of change. Often managers point to the cause of failure as‘We could have done it, but we started too late. All that we needed was a littlebit of foresight’.
Strategic Planning Edinburgh Business School 3/9
Module 3 / Company Objectives
Another potential advantage of scenario projection is somewhat less obvious.For example, it may be found that significant redeployment of resources isrequired only towards the end of the scenario period, despite the fact that asubstantial gap has been identified. This can make it possible to identify whencommitment to a course of action can be delayed; the chance to hedge positionscan have significant implications for success and failure.
3.3.3 Gaps and Incentives
One reason for the existence of a gap is that the current incentive system isconsistent with what is expected to happen as opposed to what is desired. Giventhe issues of timing discussed above, it is necessary to ensure that the workforceis given the appropriate motivation to change objectives and behaviour at therequired times. It is necessary to initiate a system of incentives which convertsthe gap closing objective, which is conceptual in nature, into a series of attainableobjectives. This can be difficult to achieve, and it may be somewhat difficult fora strategist to convince managers that they need to alter their behaviour at atime when the company is performing well, and when there may not appear tobe a great deal of difference between current and desired positions.
3.4 Credible Objectives
Setting objectives, including the determination of future desired states, is not anactivity which can be carried out in isolation from the particular circumstancesof the company. There is no point to setting objectives, even where these arederived from the company mission, which employees think cannot be achievedand hence do not serve as a guide for resource allocation. Thus the setting ofobjectives is partly dependent on past decisions and on the state of the companyat the moment, as well as on perceived market opportunities. The setting ofrealistic objectives is a dynamic process which is constantly under review. Itwould be naive to characterise objectives as immutable goals set by isolatedpolicy makers, and the process models discussed in Module 2 emphasised thefeedback which makes it possible to adjust objectives in the light of experience.
It might be deduced from the fact that objectives need to be constantly revisedthat it is easier to frame them in loose terms which can cover a variety ofsituations; this has the added advantage that objectives will not impose toomuch constraint on the company’s operations. The danger inherent in thisapproach is that loose objectives may be interpreted merely as wishful thinkingby those charged with implementing them. Objectives must be relevant to themanagers involved and seen to be achievable if they are to have credibility andoperational validity.
This is where gap analysis can play an important role. For example, anobjective may not appear to be feasible at the present, but in terms of gapanalysis it can be demonstrated that it is achievable in relation to where thecompany is expected to be in the future.
3/10 Edinburgh Business School Strategic Planning
Module 3 / Company Objectives
3.5 Quantifiable and Non-Quantifiable ObjectivesCompany objectives can be expressed in terms of a single variable, such as atarget rate of return on investment. However, few companies claim to focuson only one objective, and companies typically express objectives in terms ofa number of components or characteristics. For example, a company objectivemight be defined as
• being associated with high-quality products• having a happy and stable workforce• having a dominant market share• generating a specified rate of return on investment.
Some of these components are not readily measurable, and hence their relativeimportance is difficult to identify. For example, what is meant by ‘high-quality’needs to be made explicit, because it may not be possible to have both a ‘high-quality’ product, as defined by the development engineers, and a dominantmarket share. To a large extent factors such as ‘happiness’ and ‘quality’ can onlybe measured subjectively, and it is inevitable that different managers will attachdifferent weights to these components of the company objective. It is reasonableto ask whether there are any guidelines which managers can use in attemptingto determine the relative importance of such intangible factors.
Some light can be shed on this issue by considering how managers makedecisions in enterprises where the value of outputs cannot be measured becausethe output is not sold on the market, for example in deciding where to builda new road, or whether to set up a national park. This problem is addressedby using the tools of cost benefit analysis, which attempts to determine thevalues which society assigns to such factors as the value of a human lifesaved, or a stretch of scenic water made available for leisure use. The handlingof intangibles in cost benefit analysis has lessons for managers who wish toincorporate non-measurable components into company objectives.
Take the case of a new by-pass which is expected to cut journey timesround a town by 20 per cent on average, but which involves the destructionof a local beauty spot. Calculations can be made of the impact of the road onnational income, taking into account the initial investment, time savings, relativeaccident rates and so on; while the answer cannot be exact, the outcome willbe an approximate figure which is likely to lie within an upper and a lowerbound. Assume that the analysis suggests that there is a 95 per cent chance thatthe impact on national income will be between $20 million and $25 million. Thedecision can then be framed as: Is the local beauty spot worth $20 million to$25 million?
It is then up to society, usually through its elected representatives in govern-ment, to decide on the trade-off in the light of this information. It would benonsense for a cost benefit analyst to assign a value of, say $14 million to thebeauty spot and therefore conclude that the investment was worthwhile becausethe net gain to society was likely to be between $6 million and $11 million (i.e.between $20 million minus $14 million and $25 million minus $14 million). Acomplicating factor is that the issue may not be decided on the basis of relative
Strategic Planning Edinburgh Business School 3/11
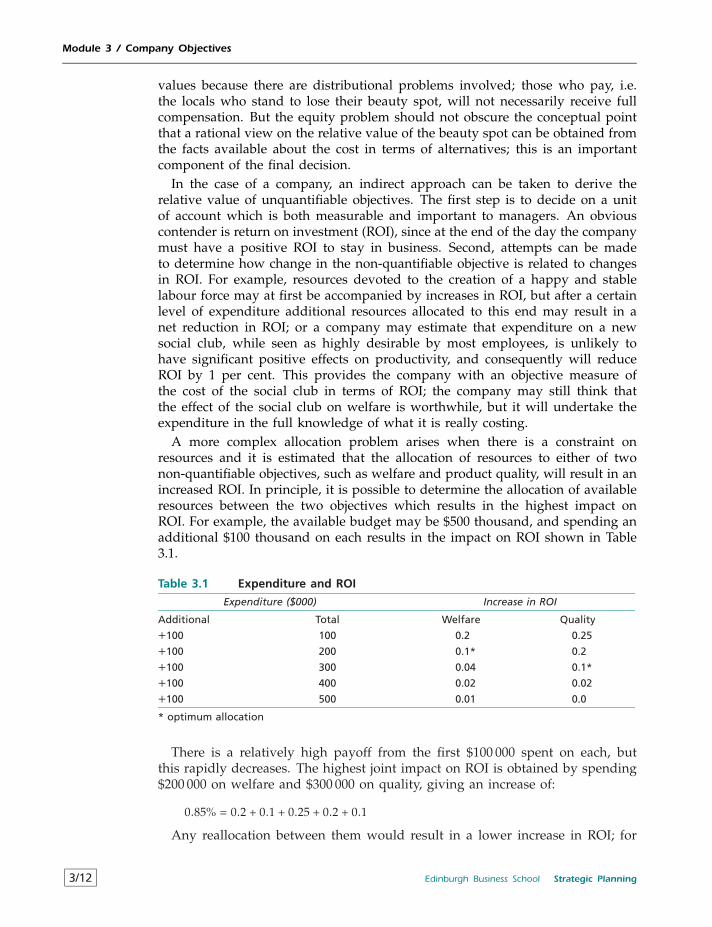
Module 3 / Company Objectives
values because there are distributional problems involved; those who pay, i.e.the locals who stand to lose their beauty spot, will not necessarily receive fullcompensation. But the equity problem should not obscure the conceptual pointthat a rational view on the relative value of the beauty spot can be obtained fromthe facts available about the cost in terms of alternatives; this is an importantcomponent of the final decision.
In the case of a company, an indirect approach can be taken to derive therelative value of unquantifiable objectives. The first step is to decide on a unitof account which is both measurable and important to managers. An obviouscontender is return on investment (ROI), since at the end of the day the companymust have a positive ROI to stay in business. Second, attempts can be madeto determine how change in the non-quantifiable objective is related to changesin ROI. For example, resources devoted to the creation of a happy and stablelabour force may at first be accompanied by increases in ROI, but after a certainlevel of expenditure additional resources allocated to this end may result in anet reduction in ROI; or a company may estimate that expenditure on a newsocial club, while seen as highly desirable by most employees, is unlikely tohave significant positive effects on productivity, and consequently will reduceROI by 1 per cent. This provides the company with an objective measure ofthe cost of the social club in terms of ROI; the company may still think thatthe effect of the social club on welfare is worthwhile, but it will undertake theexpenditure in the full knowledge of what it is really costing.
A more complex allocation problem arises when there is a constraint onresources and it is estimated that the allocation of resources to either of twonon-quantifiable objectives, such as welfare and product quality, will result in anincreased ROI. In principle, it is possible to determine the allocation of availableresources between the two objectives which results in the highest impact onROI. For example, the available budget may be $500 thousand, and spending anadditional $100 thousand on each results in the impact on ROI shown in Table3.1.
Table 3.1 Expenditure and ROI
Expenditure ($000) Increase in ROI
Additional Total Welfare Quality
+100 100 0.2 0.25
+100 200 0.1* 0.2
+100 300 0.04 0.1*
+100 400 0.02 0.02
+100 500 0.01 0.0
* optimum allocation
There is a relatively high payoff from the first $100 000 spent on each, butthis rapidly decreases. The highest joint impact on ROI is obtained by spending$200 000 on welfare and $300 000 on quality, giving an increase of:
0.85% = 0.2 + 0.1 + 0.25 + 0.2 + 0.1
Any reallocation between them would result in a lower increase in ROI; for
3/12 Edinburgh Business School Strategic Planning
Module 3 / Company Objectives
example switching $100 thousand from quality to welfare would result in anincrease of:
0.79% = 0.2 + 0.1 + 0.04 + 0.25 + 0.2
The fundamental issue here is to visualise the issue in terms of trade-offs.The final decision may well be based on other factors, but the expressionof the alternatives in terms of a common unit of account such as ROI is apowerful technique for focusing what otherwise is likely to be a highly subjectivediscussion.
3.6 Aggregate ObjectivesThe corporate objective as derived from the mission statement is an aggregateconcept in the sense that it applies to overall company performance, size, targetmarkets, financial structure and so on. The specification of corporate aggregateobjectives has profound implications for the structure of the company and theoperations of SBUs.
Aggregate objectives are sometimes indistinguishable from mission statementsand may be expressed in vague terms such as ‘being in the transport business’or ‘being innovative and quality orientated’; this is possibly because it is difficultto visualise a single objective which applies to a range of products and SBUs.One way of combining these is to use the notion of maximising shareholderwealth (or shareholder value1); this idea is discussed in detail at 3.12.6. Thenotion of maximising shareholder wealth is central to corporate strategy, andthe rationale for framing the company objective in this form can be expressedas follows:
Those who criticise the goal of share value maximisation are forgetting that stock-holders are not merely the beneficiaries of the corporation’s financial success, butalso the referees who determine the management’s financial power.
Any management – no matter how powerful and independent – that flouts thefinancial objective of maximising share value does so at its own peril.2
One important reason for adopting a quantitative view of aggregate objectivesis that it can be used as a measure of the effectiveness of corporate executives.The separation between ownership and control is a well known problem (knownin economics as the principal agent problem and dealt with in 3.8), and can resultin a wide divergence between the objectives of managers and shareholders. Anobvious example is where the remuneration of corporate executives is relatedto the size of the corporation, which may not be consistent with maximisingshareholder wealth.
An alternative to measuring shareholder wealth is to estimate the value of thecompany to its stakeholders.The relationship between stakeholders and com-pany management is discussed at 3.14. These stakeholders are the variousgroups without whom the company could not exist and include shareholders,government, customers, community, employees, suppliers, and any other groupswhich share in the value produced by the company. There is a minimum valuewhich must accrue to each group to sustain its involvement with the enterprise;
Strategic Planning Edinburgh Business School 3/13
Module 3 / Company Objectives
for example, shareholders must receive the appropriate market return on theirinvestments; employees must feel that the combination of working conditions,career prospects and remuneration give them an adequate incentive to continueworking productively rather than seek to work somewhere else; suppliers mustfeel that the price and quantity of orders received is worthwhile in relation to theresources allocated to dealing with the company. A possible measure of valuecreation is the surplus over these minimum requirements. This is a much widerconcept than shareholder wealth, and is obviously impossible to measure withany accuracy. In fact, it is more of an intuitive than a quantitative idea. A majorproblem with the notion of creating wealth for stakeholders is that they haveconflicting interests, and this brings us back to the principal agent problem: ifsacrifices are made on the part of one group, such as employees, in order toensure an adequate stakeholder return to another, such as suppliers, then who isto judge whether this makes all stakeholders better off? Any attempt to interferewith the market forces which set stakeholder returns in the first place may havea disastrous effect on the profitability, and hence survival, of the company.
3.7 Disaggregated ObjectivesThe process of converting corporate or aggregate objectives to a series of objec-tives for managers at lower levels raises many difficulties. This is because itis necessary to interpret the aggregate objective in terms which are realisticand achievable, and make sense to managers at each level in the company. Aprerequisite is to identify the individual objectives which must be achieved inpursuit of the aggregate objectives. For example, there is little point in tellinga sales force manager that the corporate objective is to achieve 15 per cent rateof return on investment. Instead, the manager needs to be told what level ofsales is consistent with the objective of a 15 per cent rate of return. If he isnot given explicit guidance, the sales force manager may attempt to maximisethe sales of all products in response to being given the general objective, whilethe optimum corporate strategy may be to maintain market share at the currentlevel and take-over a key competitor. An example of how objectives might be setat different levels, partly determined by the constraints faced by the companyat the corporate level, is as follows:
• CORPORATE OBJECTIVEAchieve target ROI
• MEANSMaintain market shareTake-over competitors
• CONSTRAINTSExisting productive capacitySharply increasing marginal costCurrent high debt ratio
• SBU OBJECTIVESMaintain existing market shares
3/14 Edinburgh Business School Strategic Planning
Module 3 / Company Objectives
Control costs• CONSTRAINTS
No investment capital
• SALES OBJECTIVESMaintain market sharesCut marketing expenditure
• PRODUCTION OBJECTIVESIncrease productivityReduce inventories
The objectives set by corporate headquarters may not be consistent with theobjectives of individual managers. For example, a sales manager may see hiscareer prospects being dependent on maximising sales rather than restrictingsales to some predetermined level; the manager may fight against a cut inmarketing expenditures because from his viewpoint this will lead to missedopportunities. It may be very difficult to convince the marketing manager that itis not in the corporate interest to pursue what he perceives as being potentiallyprofitable opportunities. This is an example of the principal agent problemwhich is discussed in the next section.
Ensuring consistency with corporate objectives is not the only problem; somemanagers may perceive their objectives as being in conflict with those of othermanagers. For example, consider the following objectives:
• SALES OBJECTIVESIncrease market share
• PRODUCTION OBJECTIVESReduce inventories
The marketing manager will want to have access to sufficient inventories sothat new customers can be supplied immediately, otherwise some marketingresources will be wasted. The production manager will have an incentive totailor production and inventories in relation to historic and immediate demandrequirements, and will have no incentive to respond to the marketing manager’scase that supplies must be available to satisfy unpredictable new orders as theyarise.
3.8 The Principal/Agent ProblemThe problem which permeates management at all levels is the need to strike abargain with subordinates which ensures that the manager’s objectives are metwithout the need for constant monitoring of activity. The personal objectives ofan individual manager may include maximisation of wealth, ambition, desirefor a quiet life, desire to avoid confrontation, and so on. There is no guaranteethat the manager will place the company’s objectives high in this personal setof priorities. For example, a CEO may have a remuneration package whichincludes a bonus for growth in current profits; to ensure that current profits
Strategic Planning Edinburgh Business School 3/15
Module 3 / Company Objectives
continue to grow the CEO may reduce expenditure on R&D, which has theeffect of increasing current profit at the expense of long term competitiveness.
The problem is to generate a series of objectives which ensure that corporateand SBU objectives are achieved. This involves drawing up a contract betweenthe manager (principal) and the subordinate (agent) which ensures that theagent attempts to achieve the objectives laid down in the contract. By and large,the manager is contracted by superiors to carry out certain functions, and thenis left free to determine how they are to be achieved. In the absence of closemonitoring, the fact that the terms of the contract are not being adhered tomay not become evident for some time, and during that time a misallocationof resources can occur. To exacerbate the problem, the individual manager hasan incentive to conceal the fact that objectives have not been achieved, andwill possibly attempt to ascribe an unsuccessful outcome to other factors, suchas supply problems lying outside the manager’s control. The misallocation ofresources can be compounded by invoking the efforts of accountants and otherspecialists in attempting to find out what has gone wrong, while the problemreally lies with the contract and incentive system. This is an area of economicswhich has provided valuable insights into the relationship between principal andagent, and the types of contract which might be drawn up to ensure that theprincipal’s objectives are met by the agent, given differing degrees of uncertaintyregarding outcomes, risk aversion, and budget constraints. A central issue formanagers at all levels is that the setting of objectives cannot be isolated fromthe design of incentive systems.
The difficulty of ensuring that the agent acts in the interests of the principalcan become apparent when one company mounts a take-over bid for another.This always has the effect of initially increasing the share price of the targetcompany. If the managers running the company had acted in the best interestsof the shareholders then this could not happen, because they would have runthe company efficiently and exploited opportunities, all of which would havebeen reflected in the current share price. In these circumstances it would appearthat the outsider actually knows more about the company than the incumbentmanagement, and has spotted opportunities for increasing shareholder wealthwhich these managers have not. The trouble is that there is no effective mecha-nism by which shareholders can ensure that their managers act efficiently; thisis because the ownership of the company is spread among many shareholderswhile the running of the company is concentrated in the hands of relatively fewsenior managers and board members.
An example of the lack of control on the part of shareholders occurred inthe UK in the years following the privatisation of huge nationalised industriesincluding gas and water utilities. In all cases the existing management receivedenormous increases in remuneration, and the argument that it was necessary topay such large salaries in order to attract the best talent appeared spurious tomost shareholders because they had been in the job prior to privatisation. In thecase of British Gas this coincided with a high degree of dissatisfaction with theprovision of gas as measured by the number of official complaints received by thegas regulator, and in 1995 the British Gas Annual General Meeting was attendedby a pig by the name of Cedric (the unfortunate CEO of British Gas was called
3/16 Edinburgh Business School Strategic Planning
Module 3 / Company Objectives
Cedric Brown) brought by a group of dissatisfied small shareholders. In the eventit proved impossible for the small shareholders to censure the management boardbecause the large institutional investors supported the existing management.The privatised Water Companies caused similar dissatisfaction; for example, thepeople of Yorkshire (one of the rainiest areas in Europe) had to suffer restrictedsupplies because of water shortages at a time when management freely admittedthat about one third of all water was being lost through leaks in the pipes.Once more it proved impossible for the small shareholders to oust what theyperceived as incompetent and greedy top management. No position is takenhere on whether the top management of these organisations were in fact greedyand incompetent; the point is that a significant minority of shareholders felt thatthey were but were unable to do anything about it.
3.9 Means and EndsAn issue which is closely related to the process of disaggregating objectives isthe difference between means and ends, i.e. what is to be achieved ought tobe differentiated from how it is to be achieved; the distinction between meansand ends is not always clear cut when applied to many real life situations,and this can lead to confusion as to the nature of objectives. For example,the objective of a company may be to achieve a 15 per cent rate of returnon investment. The extent to which this is best achieved by a happy andstable workforce, or by being associated with high-quality products, depends onsubjective judgements concerning the contribution of each to the profit objective;because of the importance a company lays on a happy and stable workforce,many managers, and their subordinates, may gain the impression that this is anobjective of the company. Strictly speaking, it is a means to an end. It may intime become embedded in the culture of the company, and trade-offs may bemade between profits and the perceived well-being of the workforce.
As an alternative to specifying aggregate and disaggregated objectives, theprocess of achieving a corporate objective could be set out as a series of meansto achieve the desired end as follows:
• ENDAchieve 15 per cent ROI
• MARKETING MEANSAchieve 23 per cent market shareImprove qualityAchieve more effective quality control
• PRODUCTION MEANSReduce unit cost by 4 per centStabilise labour forceImprove sports facilities
Some managers might argue that the distinction between means and endsis merely a semantic issue, and has no operational significance. However, thenotion can be applied in many real life situations. For example, the issue of
Strategic Planning Edinburgh Business School 3/17
Module 3 / Company Objectives
providing amenable working conditions can generate heated discussions; it isimportant to discover if the parties are disagreeing about the level of expen-diture because of differing views on the contribution of working conditions toproductivity (the connection between working conditions and job performanceusing the two-factor theory of motivation was discussed at 1.3, where the neces-sary but not sufficient condition relating working conditions to job performancewas identified), or because one party to the argument feels that good workingconditions are desirable in their own right. In the former case a judgement canbe reached based on differing estimates of productivity, but in the latter therecan be no recourse to facts because the matter hinges on a question of individualvalue systems. Some managers see good working conditions as an end in itself,others as a means to an end.
3.10 Behavioural versus Economic and Financial Objectives
There are two approaches to this issue. The approach which stems fromeconomics, marketing and finance stresses that objectives must be primarilyexpressed in economic or financial terms, otherwise they are not related to mar-ket conditions, do not indicate the efficiency of the resource conversion process,and hence cannot be used as a basis for rational resource allocation.
The behaviourist approach argues that effective interpersonal processes greatlyimprove the probability of success for the company as a whole; a companywhich has efficient communication systems, good labour relations and a con-tented workforce is in a strong position to succeed in the competitive marketplace. Even imprecise behavioural notions, such as maintaining a socially con-scious public profile, are real enough to employees and can be interpreted as areflection of their performance. Behaviourists point out that in many cases finan-cial and economic objectives are no more than wishful thinking, and are basedon assumptions and projections which are even less precise than behaviouralcharacteristics.
There is no right or wrong approach to setting objectives, given the speculativebase on which they are founded. While it may be true that behavioural objectivescontribute significantly to a company’s success, no company can afford to ignoreeconomic and financial objectives which, by their very nature, are susceptibleto measurement and evaluation. A company which does not meet minimumeconomic and financial objectives may not stay in business long enough to berescued by behavioural attributes. The two approaches are complementary, butit is impossible to say which comes first. The achievement of financial objectivesmakes it possible to create the behavioural environment which makes it possibleto aspire to higher financial objectives which, etc.
3.11 Economic Objectives
Those who have not been instructed in economics often assume that economicand financial objectives are the same, but this is not necessarily the case.Economists have always taken into account motives which cannot be expressedin financial or monetary terms. In fact, the first question asked by an economist
3/18 Edinburgh Business School Strategic Planning
Module 3 / Company Objectives
when analysing behaviour is ‘What is being maximised?’ The reason for express-ing the issue in this way is that, unless an objective is specified, decisions andactions could be random because the consequences do not matter. The idea ofmaximisation takes the notion of objectives a stage further, in that it takes intoaccount the fact that additional resources devoted to the achievement of anyparticular objective are likely to yield diminishing returns after some point. Forexample, a company may have the objective of maximising the contributionfrom the sales of a certain product; this does not imply that a limitless amountof resources should be devoted to the product because, after a certain level, itbecomes virtually impossible to increase market share without disproportionateincreases in marketing expenditure, causing contribution to decline. Thus thenotion of maximisation combines an objective with a resource allocation impli-cation, i.e. additional resources should be devoted to the achievement of anobjective up to the point where additional resources have no positive impact.
The confusion between economic and financial objectives is partly accountedfor by the fact that, when constructing theories of behaviour, economists assumethat individuals attempt to maximise their welfare or happiness, and companiesattempt to maximise profits. While it is accepted that this is a simplified versionof what motivates individuals and companies, these assumptions are normallyregarded as being strong enough to capture a large element of motivation.Naturally, there has always been debate about the extent to which individualsand companies attempt to maximise anything. The best known objection isthat altruism, both on the part of individuals and companies, is an example ofnon-maximising behaviour. However, this is not necessarily the case, becauseit may be that the altruistic individual derives more satisfaction from givingsome money away to the poor than by spending it, and is therefore maximisingsatisfaction by giving money away. Companies which donate cash to causessuch as charities, orchestras and sports may be pursuing similar objectives: theirshareholders are jointly willing to forgo some income for altruistic purposes,and/or the management considers that there is a market payoff from at leastsome of these activities.
A strong position on maximisation is that actions which are inconsistentwith maximising welfare are illogical for the individual, because a preferredposition is by definition one which makes the individual happier. Similarly, itis illogical for a company to act in a manner which is inconsistent with profitmaximisation, because in a competitive market it will eventually be drivenout of business. In fact, despite the arguments surrounding it, the welfareand profit maximisation concept is consistent with a wide variety of behaviourand provides the theoretical basis for analysing and explaining many economicphenomena.
The central role which profit maximisation plays as a company objective canbe illustrated by considering the impact of any other objective on profits. Forexample, a company which pursues what it considers to be enlightened labourrelations policies may cause labour productivity to be lower than it otherwisewould have been, putting the company at a potential competitive disadvantage.Similarly, if the company has a policy of high quality output, the rationale mustbe that policy makers believe the consequences for segmentation, market share
Strategic Planning Edinburgh Business School 3/19
Module 3 / Company Objectives
and hence profits are worthwhile; otherwise, insistence on quality may place thecompany under threat. Thus when setting objectives, policy makers need to payattention to the potential contribution of each option to long run profits. Thisapproach may appear at first to be somewhat ruthless; managers may considerthat there is little point in running a company which is not a pleasant placeto work. However, in a competitive labour market, companies which are notpleasant to work in are likely to have more difficulty in recruitment and turnoverrates than those which are pleasant, with implications for productivity and costs.Indeed, economists argue that the operation of the market is the vehicle by whichmany improvements in working conditions are introduced into companies: thosewhich do not improve conditions in line with the general desires of the workingpopulation are likely to end up at a competitive disadvantage.
A practical objection which is often levelled at the notion of profit maximi-sation is that it is an unattainable ideal because of the vast number of optionswhich would have to be evaluated to find the one which maximises profit. Thereis no doubt that there are significant costs associated with search, and that theseshould be taken into account in the process of evaluating alternative courses ofaction.
The problem of bounded rationality, and its solution known as ‘satisficing’,which involves choosing the first alternative which meets a predeterminedcriterion of acceptability, was discussed in 1.3. An example of a satisficingcriterion is the ‘hurdle’ rate used in financial appraisal, where the most profitableamong a set of identified alternatives is accepted only if it generates a returnhigher than the ‘hurdle’ rate.
A further objection is that companies exist in a continuously changing dynamicenvironment, and there is no such thing as a single profit maximising decision.Decisions are of varying importance to the company, and many decisions have tobe taken at relatively short notice leaving little opportunity for detailed analysis.This is a valid criticism of the idea of profit maximisation, as it may well beimpossible to ascertain the connection between profit maximisation and decisionmaking, given the number of issues which bear on individual decisions in adynamic setting. For example, it may be decided not to undertake a potentiallyprofitable investment because the company is marshalling its resources for astrategic assault in a different market; taken in isolation the decision may notappear to be consistent with profit maximisation, but in the wider strategicsense it is. This is illustrative of the fact that the simple textbook objective ofprofit maximisation is difficult to translate into real life actions; the issue thenbecomes whether companies act in a manner which is generally consistent withthe concept of profit maximisation.
Empirical research reveals that few companies actually express their objectivesin terms that an economist would recognise as approximating to long run profitmaximisation. A possible explanation for this finding is that the profit max-imisation objective is a self fulfilling prophecy, in that the competitive processweeds out those companies which do not follow policies broadly consistent withit. If this is true, then the company which is explicit in defining its profit max-imisation objective in a strategic planning context is likely to be taking accountof one of the major forces determining company survival.
3/20 Edinburgh Business School Strategic Planning
Module 3 / Company Objectives
3.12 Financial ObjectivesThe application of financial concepts makes it possible to quantify the profit max-imisation objective. In economics, the profit maximisation objective is expressedin terms of comparative statics, i.e. it is assumed that all future cash flows canbe collapsed to a present value so that projects which are undertaken at thepresent with different cash flows in the future can be compared. The applica-tion of rigorous financial appraisal to the quantification of objectives is of basicimportance in understanding shareholder wealth creation, and it is necessary atthis stage to outline the main financial concepts which underlie the approach.The intention is not to present a full exposition of financial concepts and theory,but simply to indicate those areas of finance which are of particular relevancein the derivation of measures of company objectives.
3.12.1 Discounting and Present Value
The notion of discounting is fundamental to understanding financial appraisal.It is the technique for converting streams of future positive and negative netcash flows into current terms. It takes account of the fact that a dollar in thefuture, say in five years’ time, is worth less than a dollar now because a dollarnow can be invested to produce a stream of income over the next five years.
The value of a dollar in one year’s time is the original dollar plus the interestfor the year, i.e.
Dollar in one year = 1× (1 + r)
where r is the rate of interest.
Looking at a dollar which is received in a year’s time, the value today of onedollar is:
Dollar today =1
(1 + r)
The value today of a dollar in two years’ time is:
Dollar today =1
(1 + r)× (1 + r)
=1
(1 + r)2
This can be generalised to give the value today of a dollar at any time in thefuture:
Dollar today =1
(1 + r)n
where n is the number of years in the future.
Thus by using the rate of interest and the time period, it is possible to expressa dollar in what is known as ‘present value’ terms. This makes it possible tocompare the value of cash received at different times.
Strategic Planning Edinburgh Business School 3/21
Module 3 / Company Objectives
X dollars today =X
(1 + r)n
3.12.2 Net Present Value
When an investment is undertaken, the cash flow pattern is usually negative atthe beginning, when the expenditures are made, and positive thereafter whenthe investment generates income. A typical cash flow stream associated with aninvestment is:
−A1, A2, A3, . . . , An
where A1 = expenditure in Year 1, and A2, . . . , An = income in Years 2 to n.
The net present value (NPV) is found by summing the discounted streams offuture expenditure and income over the life of a project:
NPV =−A1
(1 + r)+
A2
(1 + r)2 +A3
(1 + r)3 + . . . +An
(1 + r)n
where r = cost of capital to the company
If the NPV is positive, it means that the investment yields a value over itslife, and is worth considering. Typically the choice between potential projectsis made on the basis of which generates the higher NPV. If a project has anegative NPV the company would be better off putting the money in the bank.One way of assessing strategy options is to think in terms of cash flows: whatare the initial costs of the strategy and what are the expected cash flows? Aswill be seen, it is typically not possible to reduce strategic choice to such astraightforward calculation, but the approach is valuable in focusing on a veryimportant aspect of the strategy process, namely the potential for generatingcash flows.
3.12.3 Capitalised Value
Imagine you were left a bond which provided an annual income of $100; howmuch would you be willing to sell this bond for? You would be willing toconsider any offer of at least the amount which, when invested at the currentrate of interest, gave an income of $100 per year. If the current interest rate were5 per cent you would work out the following:
Income stream = Capital sum × Interest rate
100 = Capital sum × 0.05
therefore
Capital sum =Income stream
Interest rate
Capital sum =100
0.05= 2000
3/22 Edinburgh Business School Strategic Planning
Module 3 / Company Objectives
Thus the capitalised value of a stream of income is found by dividing theannual income by the interest rate. The same reasoning applies to a constantstream of costs. Any future stream of income or cost can be converted to acapitalised value.
Another way of looking at this is that a guaranteed income and a capital sumcome to the same thing. Take the case of holding a share in a company: dividethe expected income by the going interest rate and you obtain an approximationto the share price. You would, in fact, add a premium to the interest rateto reflect your estimate of risk associated with that company. One method ofevaluating the return on a share is to use the price earnings ratio. For example, aratio of 20 suggests that the interest rate (plus risk premium) is 5 per cent. Whydo some shares have very high price earnings ratios, i.e. low rates of return?It is because earnings are expected to grow in the future; for example, if thegrowth rate in earnings was expected to be 1 per cent for ever, the capitalisedvalue of the income stream shown above would be approximately:
Capital sum =100
0.05− 0.01= 2500
This gives a current price earnings ratio of 25. Thus the value of a share,or the value of any asset, is determined by the expected future income streamaccruing from that asset. In fact, the calculation demonstrates that the sharevalue is quite sensitive to relatively marginal changes in expectations of futuregrowth rates. This is why companies go to great lengths to maintain confidencein their prospects and why they are averse to releasing information which mightaffect the financial market’s perception. Thus the Annual Report is usually anoptimistic document and rarely contains unexpected bad news such as a majorloss; if a loss is in prospect the information will typically be leaked to the pressover a period so that when the information does become public the impact onthe share price is not catastrophic.
In July 1996 the shares in Great Universal Stores, a UK home shopping tofinance conglomerate, fell by 35p to 637p after reporting a rise of 3.25 percent in profits over the previous year. This was in fact GUS’s 48th consecutiveyear of profit increases. How could the share price fall when reported profitshad increased? The answer is that market analysts had expected a much largerincrease in profits, and this expectation had been included in the share price.When the ‘disappointing’ news became public the price immediately adjustedto a revised profit expectation.
3.12.4 Choice of Interest Rate: The Cost of Capital
When carrying out NPV calculations it is necessary to select a rate of interestto use for discounting. The obvious choice of interest rate is the cost to thecompany of raising money on the open market, and this is usually termed thecost of capital. There are two methods of raising finance: debt and equity. Thecost of finance from the two sources can be significantly different, and thus theproportion of finance raised by the two methods can affect the composite costof capital.
Strategic Planning Edinburgh Business School 3/23
Module 3 / Company Objectives
So far as debt is concerned, the relevant rate of interest is the cost to thecompany of the capital over the planning period, i.e. the rate of interest payableon debt which matures at the end of the planning period. The cost of debtcannot be determined on a historical basis; it is the cost of new debt whichdetermines the true present value of future cash flow streams. It may not bepossible to predict the cost of debt precisely because a company may operate onthe basis of short term debts, with continuous loan restructuring. However, thebest estimate of the cost of debt is the interest rate on a loan of the appropriateduration, not the cost of debt in the past.
Equity finance raises a number of problems, the most obvious of which is thatthe rate of return on equity is not known, and therefore must be estimated. Inconceptual terms, the rate of return which should be estimated is the implicitrate of return, which is the rate that just induces shareholders to purchaseequity in the company. The implicit rate has two components: the risk free rateand an allowance for risk, known as the equity risk premium. The risk freerate comprises the market rate plus the expected inflation rate; the risk freerate is partly a function of the current interest rate, and partly determined byexpectations. It can be approximated to by the rate of return offered on long termgovernment debt, which is the nearest thing to a risk free investment availableon the market. The equity risk premium is based on the market assessment ofthe risk associated with the company. This is affected by the track record of thecompany’s managers, past dividend payments and profitability.
The theory known as capital asset pricing provides a perspective on theappropriate method of calculating and allowing for risk. The objective of thistheory is to explain what determines the value of a company’s shares by takinginto account different forms of risk, and it is an important part of modernfinance theory. The value of the common stock of a company can be interpretedas the capitalised value of the future expected stream of income from the stock,i.e. the expected future stream of dividends. The capitalised value of the futureexpected stream depends on the current interest rate plus an adjustment for risk.It is the approach to risk which differentiates the capital asset pricing model.In simplified terms, the appropriate risk is that which cannot be eliminatedby holding the shares of the company in a portfolio. This is known as non-diversifiable risk. It is estimated by taking into account not only the variabilityof a company’s dividends in the past, but the correlation between companydividends and those paid by the rest of the market. (The Beta coefficient is awell known method of calculating risk of this type.)
An important implication of the capital asset pricing model is that the discountrate applied to individual investments by the company should include themeasure of non-diversifiable risk; this is because the company is in competitionfor funds, and suppliers of funds require information on risk when structuringtheir portfolios. While there are many problems associated with measuring theappropriate cost of capital for the company, it is important that the issues ofthe cost of debt, the risk free rate and the equity risk premium are taken intoaccount. If a discount rate is used which does not properly represent the cost ofcapital the calculation will generate misleading information on value creation.The connection between market performance and the discount factor which
3/24 Edinburgh Business School Strategic Planning
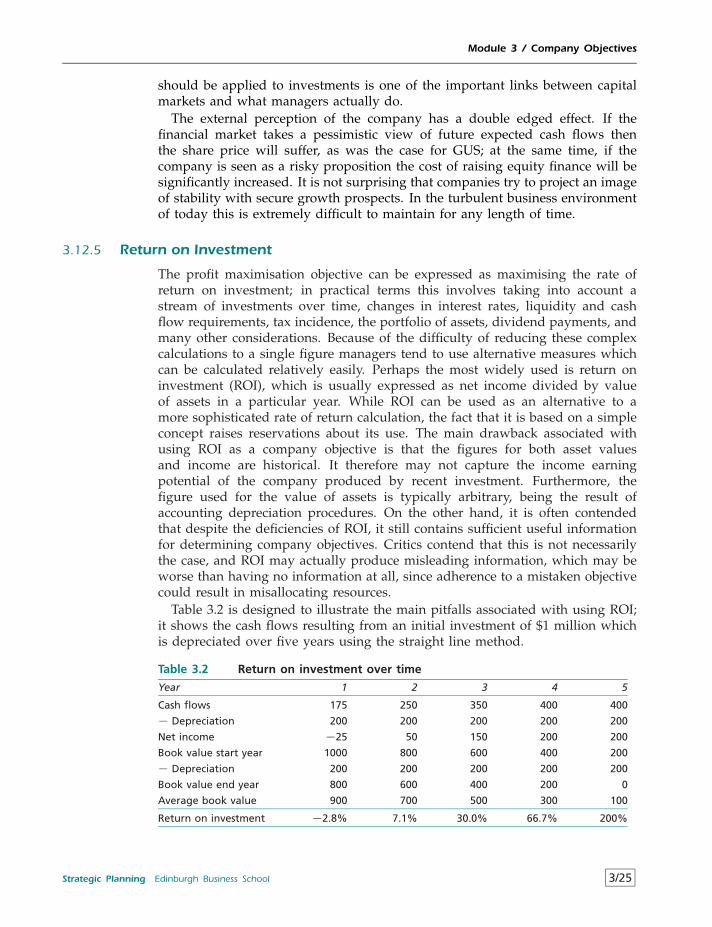
Module 3 / Company Objectives
should be applied to investments is one of the important links between capitalmarkets and what managers actually do.
The external perception of the company has a double edged effect. If thefinancial market takes a pessimistic view of future expected cash flows thenthe share price will suffer, as was the case for GUS; at the same time, if thecompany is seen as a risky proposition the cost of raising equity finance will besignificantly increased. It is not surprising that companies try to project an imageof stability with secure growth prospects. In the turbulent business environmentof today this is extremely difficult to maintain for any length of time.
3.12.5 Return on Investment
The profit maximisation objective can be expressed as maximising the rate ofreturn on investment; in practical terms this involves taking into account astream of investments over time, changes in interest rates, liquidity and cashflow requirements, tax incidence, the portfolio of assets, dividend payments, andmany other considerations. Because of the difficulty of reducing these complexcalculations to a single figure managers tend to use alternative measures whichcan be calculated relatively easily. Perhaps the most widely used is return oninvestment (ROI), which is usually expressed as net income divided by valueof assets in a particular year. While ROI can be used as an alternative to amore sophisticated rate of return calculation, the fact that it is based on a simpleconcept raises reservations about its use. The main drawback associated withusing ROI as a company objective is that the figures for both asset valuesand income are historical. It therefore may not capture the income earningpotential of the company produced by recent investment. Furthermore, thefigure used for the value of assets is typically arbitrary, being the result ofaccounting depreciation procedures. On the other hand, it is often contendedthat despite the deficiencies of ROI, it still contains sufficient useful informationfor determining company objectives. Critics contend that this is not necessarilythe case, and ROI may actually produce misleading information, which may beworse than having no information at all, since adherence to a mistaken objectivecould result in misallocating resources.
Table 3.2 is designed to illustrate the main pitfalls associated with using ROI;it shows the cash flows resulting from an initial investment of $1 million whichis depreciated over five years using the straight line method.
Table 3.2 Return on investment over time
Year 1 2 3 4 5
Cash flows 175 250 350 400 400
− Depreciation 200 200 200 200 200
Net income −25 50 150 200 200
Book value start year 1000 800 600 400 200
− Depreciation 200 200 200 200 200
Book value end year 800 600 400 200 0
Average book value 900 700 500 300 100
Return on investment −2.8% 7.1% 30.0% 66.7% 200%
Strategic Planning Edinburgh Business School 3/25
Module 3 / Company Objectives
The ROI varies between −2.8 per cent and 200 per cent during the five years;different depreciation conventions would lead to different series of ROIs. It isdifficult to relate the ROIs for different years to relative cash flows. For example,the increase in ROI from 7.1 per cent in Year 2 to 30 per cent in Year 3 is partlydue to the increase in cash flow and partly due to the lower book value whichappears in the denominator; the 200 per cent ROI in Year 5 is based on the samecash flow as the 66.7 per cent in Year 4. It is therefore virtually impossible touse the ROI calculations as the basis for choosing among competing investmentpossibilities. One method of generating a single ROI is to calculate the averageROI using the average book value and the average cash flow; this gives an ROIof 29 per cent. The drawback of this calculation is that it takes no account of thedistribution of cash flows over time; the discounting approach gives an InternalRate of Return of 15 per cent (the interest rate which just gives an NPV of zero);thus not only does the ROI calculation provide results which are difficult tointerpret, but the ROI calculation may result in an overestimate of the rate ofreturn on the investment.
Despite the difficulties associated with ROI it should not be dismissed asirrelevant to decision making. While it may provide a misleading view of therate of return on a single investment, the average ROI for a company as a whole,which is comprised of returns derived from many assets of various vintages, maybe sufficiently accurate to monitor a company’s performance. For example, if theROI were to fall from 18 per cent to 8 per cent from one year to the next, this isa clear signal that something is amiss and that resources are not being utilisedas efficiently in the second year. This may be a ‘red herring’ at times, but it isunlikely that major changes in the company’s ROI are due merely to accountingconventions. The fact is that accounting information is extremely difficult to usein an unambiguous fashion, but it is the only information available and it isessential that as much use of it is made as possible.
3.12.6 Shareholder Wealth
This definition of company objectives originates from the proposition that theprimary objective of a company is to maximise the wealth of those who ownit, namely the shareholders. It ignores value which may accrue to other stake-holders because they do not have a direct impact on the allocation of financialresources among companies. The approach is similar to that of working out acapitalised value:
Shareholder wealth =Expected income stream
Interest rate
The market forms its view on the expected income stream on the basis of pub-lished company accounts, the track record of the company, and announcementsabout company plans. The interest rate which is used to derive the capitalisedvalue will contain an allowance for the risk associated with the company. Thismeasure of shareholder wealth differs from the total capitalisation of the com-pany on the stock market; it is more useful than market capitalisation becausewhile there is a connection between share value and effective management in
3/26 Edinburgh Business School Strategic Planning
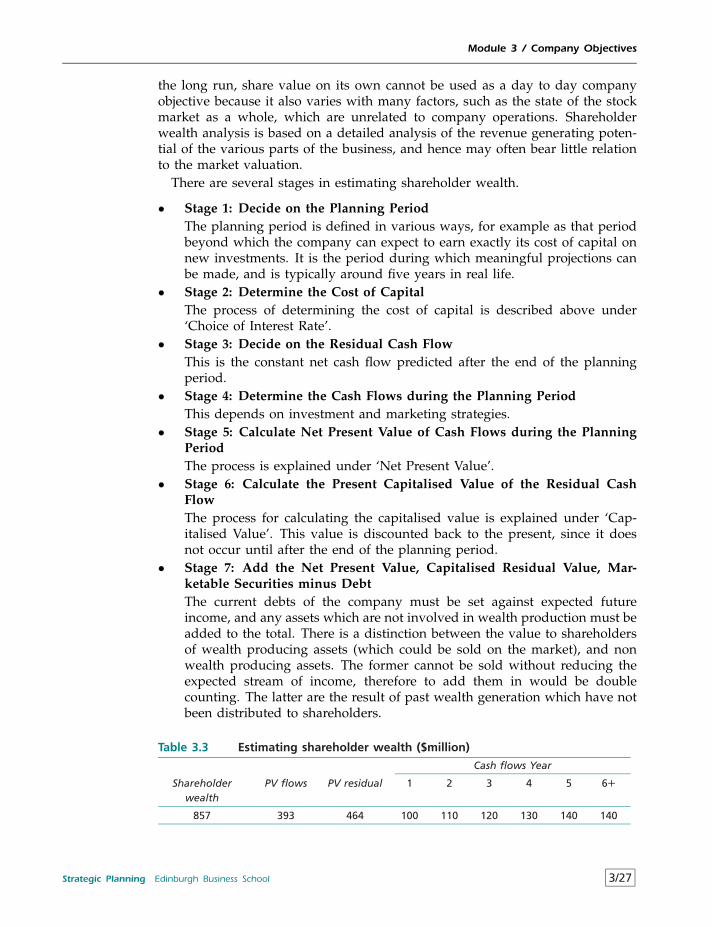
Module 3 / Company Objectives
the long run, share value on its own cannot be used as a day to day companyobjective because it also varies with many factors, such as the state of the stockmarket as a whole, which are unrelated to company operations. Shareholderwealth analysis is based on a detailed analysis of the revenue generating poten-tial of the various parts of the business, and hence may often bear little relationto the market valuation.
There are several stages in estimating shareholder wealth.
• Stage 1: Decide on the Planning PeriodThe planning period is defined in various ways, for example as that periodbeyond which the company can expect to earn exactly its cost of capital onnew investments. It is the period during which meaningful projections canbe made, and is typically around five years in real life.
• Stage 2: Determine the Cost of CapitalThe process of determining the cost of capital is described above under‘Choice of Interest Rate’.
• Stage 3: Decide on the Residual Cash FlowThis is the constant net cash flow predicted after the end of the planningperiod.
• Stage 4: Determine the Cash Flows during the Planning PeriodThis depends on investment and marketing strategies.
• Stage 5: Calculate Net Present Value of Cash Flows during the PlanningPeriodThe process is explained under ‘Net Present Value’.
• Stage 6: Calculate the Present Capitalised Value of the Residual CashFlowThe process for calculating the capitalised value is explained under ‘Cap-italised Value’. This value is discounted back to the present, since it doesnot occur until after the end of the planning period.
• Stage 7: Add the Net Present Value, Capitalised Residual Value, Mar-ketable Securities minus DebtThe current debts of the company must be set against expected futureincome, and any assets which are not involved in wealth production must beadded to the total. There is a distinction between the value to shareholdersof wealth producing assets (which could be sold on the market), and nonwealth producing assets. The former cannot be sold without reducing theexpected stream of income, therefore to add them in would be doublecounting. The latter are the result of past wealth generation which have notbeen distributed to shareholders.
Table 3.3 Estimating shareholder wealth ($million)
Cash flows Year
Shareholderwealth
PV flows PV residual 1 2 3 4 5 6+
857 393 464 100 110 120 130 140 140
Strategic Planning Edinburgh Business School 3/27
Module 3 / Company Objectives
Table 3.3 is an example of a shareholder wealth calculation using a 5 yearplanning period and a cost of capital of 15 per cent. The cash flows start at $100million and increase to $140 million by Year 5; from Year 6 on it is assumed thatcash flows will be constant at $140 million. The Present Value of the cash flowsfrom Year 1 to Year 5 is $393 million, and the Present Value of the residual is$464 million. In this case the present value of the residual cash flow is greaterthan the present value of cash flows during the planning period. It should beclear from the above that the calculations made by the company, using all theinformation available on future prospects, is unlikely to accord with the marketvaluation of shares. However, it is a fair indication of the underlying valuecreation potential of the company. This is a more sophisticated approach thansimply using a constant growth factor in perpetuity, because it takes into accountthat the company cannot be expected to grow indefinitely.
This approach to value creation has important implications for the perspectivetaken on potential strategies because the ultimate test of a strategy is whetherit is likely to add to shareholder wealth. It concentrates attention on the impactof strategies on future cash flows, and forces managers to be explicit about howpotential cash flows will be generated. Because it is a company-wide idea, theimpact of strategies on the cash flows of the company as a whole is taken intoaccount, enabling a wider perspective on investment appraisal, which typicallyfocuses on directly relevant cash flows.
An additional use of the shareholder wealth approach is to break down thecompany into its value generating components. It is a revealing exercise toestimate which activities generate value and compare these to the activities onwhich managers spend their time.
The notion of using shareholder value as a company objective might at firstappear to be somewhat unrealistic, being based on projections of cash flowsand the residual value which may have little operational meaning to individualmanagers. However, the underlying idea is simple, and should be borne inmind by managers at all levels in an organisation; posing the question ‘in whatsense is this activity adding value to the company?’ is a powerful method forfocusing the mind on the relevance of alternative courses of action.
Shareholder wealth is in fact used by sophisticated stock exchange analyststo assess the underlying effectiveness of companies. During 1991 Lord Hanson,a noted take-over expert, bought a very small percentage of the huge Britishcompany Imperial Chemical Industries (ICI). Immediately there was public con-cern that this previously successful company, with its distinguished record ofR&D, would fall prey to asset stripping. Fears were expressed that the hugeICI R& D programme would be abandoned if Hanson was successful, and ICImounted a vigorous defence. But a different viewpoint was expressed by NewYork analyst Mark Gressle (employed by Stern Stewart), who uses a model ofshareholder value creation (which he calls Market Value Added, or MVA); theMVA technique is similar to the shareholder wealth approach described above.Gressle argued that in the period 1984 to 1988 Hanson had generated £2.7 billionin wealth for investors compared to the £0.5 billion generated by ICI. In fact,some quite famous companies have been wealth destroyers, according to theMVA model, which identified some famous British wealth destroyers as shown
3/28 Edinburgh Business School Strategic Planning
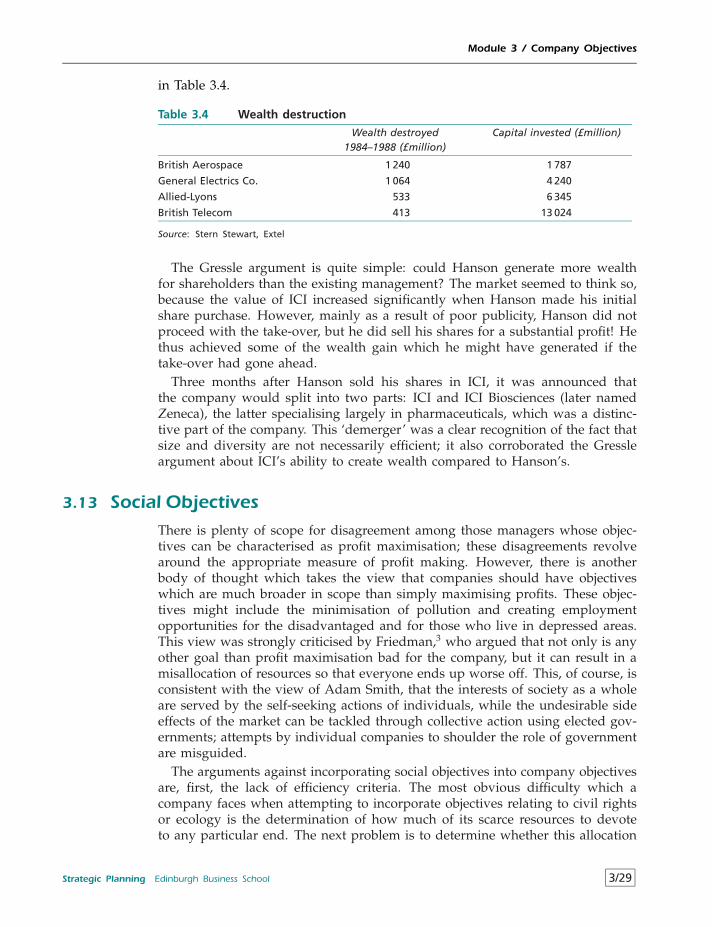
Module 3 / Company Objectives
in Table 3.4.
Table 3.4 Wealth destruction
Wealth destroyed1984–1988 (£million)
Capital invested (£million)
British Aerospace 1 240 1 787
General Electrics Co. 1 064 4 240
Allied-Lyons 533 6 345
British Telecom 413 13 024
Source: Stern Stewart, Extel
The Gressle argument is quite simple: could Hanson generate more wealthfor shareholders than the existing management? The market seemed to think so,because the value of ICI increased significantly when Hanson made his initialshare purchase. However, mainly as a result of poor publicity, Hanson did notproceed with the take-over, but he did sell his shares for a substantial profit! Hethus achieved some of the wealth gain which he might have generated if thetake-over had gone ahead.
Three months after Hanson sold his shares in ICI, it was announced thatthe company would split into two parts: ICI and ICI Biosciences (later namedZeneca), the latter specialising largely in pharmaceuticals, which was a distinc-tive part of the company. This ‘demerger’ was a clear recognition of the fact thatsize and diversity are not necessarily efficient; it also corroborated the Gressleargument about ICI’s ability to create wealth compared to Hanson’s.
3.13 Social ObjectivesThere is plenty of scope for disagreement among those managers whose objec-tives can be characterised as profit maximisation; these disagreements revolvearound the appropriate measure of profit making. However, there is anotherbody of thought which takes the view that companies should have objectiveswhich are much broader in scope than simply maximising profits. These objec-tives might include the minimisation of pollution and creating employmentopportunities for the disadvantaged and for those who live in depressed areas.This view was strongly criticised by Friedman,3 who argued that not only is anyother goal than profit maximisation bad for the company, but it can result in amisallocation of resources so that everyone ends up worse off. This, of course, isconsistent with the view of Adam Smith, that the interests of society as a wholeare served by the self-seeking actions of individuals, while the undesirable sideeffects of the market can be tackled through collective action using elected gov-ernments; attempts by individual companies to shoulder the role of governmentare misguided.
The arguments against incorporating social objectives into company objectivesare, first, the lack of efficiency criteria. The most obvious difficulty which acompany faces when attempting to incorporate objectives relating to civil rightsor ecology is the determination of how much of its scarce resources to devoteto any particular end. The next problem is to determine whether this allocation
Strategic Planning Edinburgh Business School 3/29
Module 3 / Company Objectives
of resources is efficient. Given the difficulty managers have in determining theefficiency of resource allocation within the company itself, such a venture isbound to be frustrating. It may be that there is a real return on being associatedwith a ‘green’ approach to production, and in this case ecological concern isreally a form of marketing expenditure; furthermore, these returns may onlybe achieved in the long term. In the extreme, the attempt to achieve socialobjectives may generate a paternalistic attitude in large companies which iscontrary to the concepts of freedom of action upon which the notion of themarket system is based. It may also lead to an allocation of resources whichan elected government would not agree with; if the government’s view is anexpression of the will of the majority, it could be argued that society is less welloff than if the government had been allowed to make the choice. The secondargument relates to the self-interest of the shareholders. Any company pursuingsocial objectives which incur costs which the company would not otherwise bearhas to compete against rivals who are pursuing a purely profit maximising setof objectives; this means that the company will have higher relative costs. If theend result is that the company goes out of business and shareholders lose theirwealth, the attempt to achieve social objectives becomes rather pointless andself-defeating.
However, it may be the case that the pursuit of some social objectives incurstrivial costs. In that case the issue of whether to use social objectives is amatter for the owners of the company. The problem is that managers are likelyto be unaware of the costs involved, and this is an area where shareholderwealth analysis could be put to use. Attention could be focused on the likelyimpact of pursuing social objectives on expected cash flows, with the consequentimplications for shareholder wealth.
The underlying issue here is what is referred to by economists as ‘efficiencyversus equity’. The efficiency issue is concerned with maximising the output ofgoods and services. The equity issue is how the output should be distributedamong members of society, bearing in mind that different distribution systemsthemselves have implications for incentives and hence for efficiency.
A generally accepted view now is that managers should not attempt to achievesocial objectives directly. Once profits have been made, attempts can be made todischarge social responsibilities which are consistent with the interests of thosewhom managers represent, i.e. the shareholders in the business. Managers whofeel that they should follow their social conscience in the general process ofresource allocation may well be doing net harm both to their own companyand to society as a whole. This is an example of what the Austrian economistHayek referred to as the ‘unintended consequences of human action’. Whilethere is no absolute right or wrong concerning which course of action shouldbe taken, managers should be aware of the practical dangers which a non profitmaximising approach can generate.
3/30 Edinburgh Business School Strategic Planning
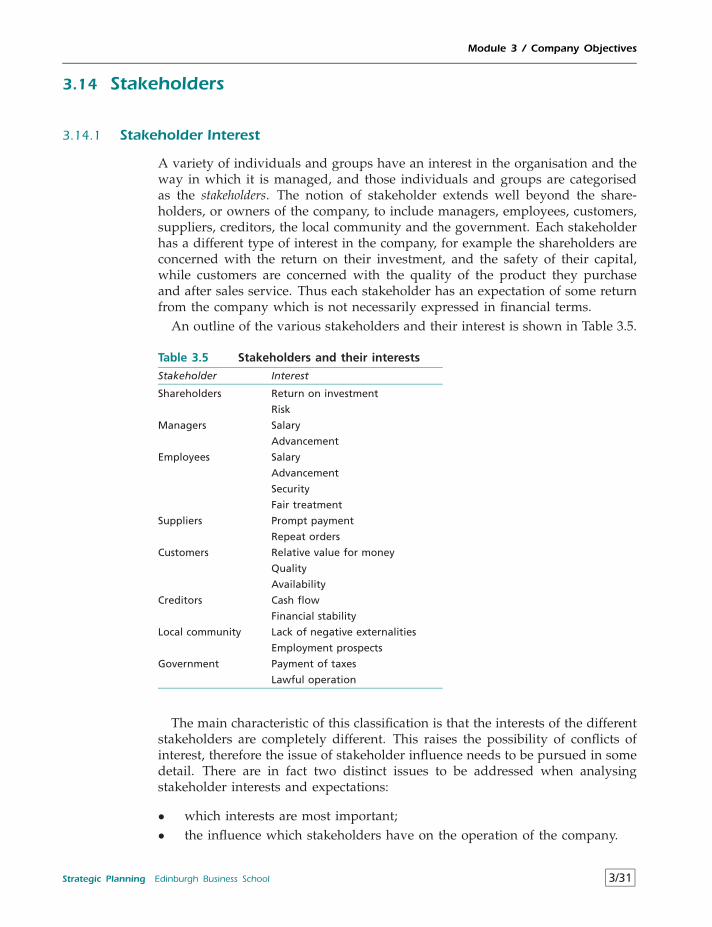
Module 3 / Company Objectives
3.14 Stakeholders
3.14.1 Stakeholder Interest
A variety of individuals and groups have an interest in the organisation and theway in which it is managed, and those individuals and groups are categorisedas the stakeholders. The notion of stakeholder extends well beyond the share-holders, or owners of the company, to include managers, employees, customers,suppliers, creditors, the local community and the government. Each stakeholderhas a different type of interest in the company, for example the shareholders areconcerned with the return on their investment, and the safety of their capital,while customers are concerned with the quality of the product they purchaseand after sales service. Thus each stakeholder has an expectation of some returnfrom the company which is not necessarily expressed in financial terms.
An outline of the various stakeholders and their interest is shown in Table 3.5.
Table 3.5 Stakeholders and their interests
Stakeholder Interest
Shareholders Return on investment
Risk
Managers Salary
Advancement
Employees Salary
Advancement
Security
Fair treatment
Suppliers Prompt payment
Repeat orders
Customers Relative value for money
Quality
Availability
Creditors Cash flow
Financial stability
Local community Lack of negative externalities
Employment prospects
Government Payment of taxes
Lawful operation
The main characteristic of this classification is that the interests of the differentstakeholders are completely different. This raises the possibility of conflicts ofinterest, therefore the issue of stakeholder influence needs to be pursued in somedetail. There are in fact two distinct issues to be addressed when analysingstakeholder interests and expectations:
• which interests are most important;• the influence which stakeholders have on the operation of the company.
Strategic Planning Edinburgh Business School 3/31
Module 3 / Company Objectives
The first of these largely relates to how stakeholders feel the company shouldbe run, while the second relates to how the company is actually run.
3.14.2 Stakeholder Interests: The Priorities
It could be argued that this is really a discussion about how society shouldbe run, for example, in a general sense should employees or shareholders beregarded as more important? An individual’s judgement on this is likely to beaffected by which group he or she is in, for example it is quite natural for anemployee to consider that his day to day involvement with the company is moreimportant than that of the shareholder who may never have been inside the door.It is important to be explicit about the issue of shareholder priorities because ithas implications for the efficiency with which the company can be operated. Thefollowing are the type of arguments you will encounter on stakeholder priorities,but it is important that you keep an open mind on the issue. Furthermore, thisdiscussion is conducted in terms of a commercial organisation; the not-for-profitsector, which includes education, health provision and charities, will differ inmany respects.
Shareholders
The shareholders can be regarded as the most important because they providethe capital for the company and if it does not operate efficiently shareholderscan withdraw their funds and invest it in something more profitable. In thisrespect the shareholders provide a service to the rest of the economy in that theydirect resources to those operations which provide the highest financial returns;in that sense everyone benefits from the freedom of choice to pursue the bestreturn on their money.
On the other hand it can be argued that shareholders tend to take a short termview of company prospects and it is not safe to leave the destiny of companiesto their discretion. This in turn becomes an argument about how efficientlycapital markets work, and the fact is that no method has yet been discoveredwhich is as effective as capital markets in directing the allocation of resourcesin the economy as a whole. Central planning was exposed as a failure with thefall of communism; variations on free market operations have been tried, butthese amount to attempts at influencing the way the market works rather thanreplacing it.
So far as the company is concerned, it needs to be recognised that shareholderscontrol the supply of capital, and if their interests are not met in the form ofa rate of return which is comparable to other investment opportunities thenthe company will most likely cease to exist. It is because of this that it isoften concluded that shareholder interest is the highest priority stakeholder andcompanies ignore this at their peril.
Managers
Managers comprise the group which is charged with determining the direction,scope and effectiveness of the business. They are responsible for the allocationof resources, and it is largely upon them that the stakeholders depend for their
3/32 Edinburgh Business School Strategic Planning
Module 3 / Company Objectives
returns. In addition, if managers make the wrong decisions the employees losetheir jobs and customers are deprived of the company’s products. It can thus beargued that managers are the most important stakeholders and therefore shouldbe rewarded accordingly.
While this is true, there is also a market in managers, and so long as thecompany treats them at least as well as companies which might compete fortheir services then they do not need to be singled out for special treatment. Theirstakeholder priority is high, but it need not be at the expense of shareholder oremployee returns.
Employees
It is on the productive effort of employees that the success of the companydepends. But exactly the same argument applies in the case of managers: thereis a market in employees which determines the conditions under which they areemployed, and again it is unnecessary to single them out for special stakeholdertreatment above and beyond that dictated by the market.
Suppliers
The stakeholder priority depends on the number of suppliers which the companyuses. The five forces model discussed at 5.12 highlights the bargaining powerof suppliers, and when the company is greatly dependent on one supplier itfollows that its stakeholder priority is relatively high. But before assigning toohigh a priority to suppliers it is necessary to determine whether the companycan substitute for other suppliers, or increase the number of suppliers. If there isa high degree of dependence with a supplier then this may be a case for verticalintegration, but typically recourse to the market will reveal that there are plentyof other suppliers.
It may be that a long term relationship has been developed with certainsuppliers which provides security of supplies, flexibility and so on. But it has tobe recognised that there are costs as well as benefits in such a relationship, andif dependence on particular suppliers is found to have an unjustified influenceon the management and direction of the company then the stakeholder prioritymust be reconsidered.
Customers
It is clearly important to provide customers with what they want, but this isbecause they can take their custom elsewhere in competitive markets. Otherthan the obvious fact that the company sells to customers, it is difficult to seewhat priority should be accorded to customers as stakeholders.
Creditors
As capital markets have become increasingly competitive the interests of indi-vidual creditors has diminished. If the creditor has made a realistic estimate ofthe client then it will be reasonably confident that its debts will be serviced andneed have no other interest in the company.
Strategic Planning Edinburgh Business School 3/33
Module 3 / Company Objectives
Local community
Companies depend on their local community for employees, services, land, plan-ning permission and so on; the local community depends on the company foremployment and the creation of wealth. Both sides benefit from the arrangementand in this respect it is important for the company to live in harmony with thelocal community.
There is no doubt that the local community has a valid stakeholder interest,and these need to be taken into account in company decision making.
Government
So long as the company pays its taxes and acts according to the law there is noneed for the government to figure in its decision making. In a market economythe role of the government is to set the rules of the game and monitor that theyare being adhered to. The government really has no stakeholder interest beyondthis for market companies. In government run organisations such as the civilservice this is not the case, but here the government acts as a shareholder and itis in that sense that it has a high stakeholder priority.
3.14.3 Stakeholder Influence
While it can be argued that in principle some stakeholders should have littleinterest in the company, the existence of legislative, institutional and historicalfactors can imbue stakeholders with a significant degree of influence; for exam-ple, a strong trade union can result in employees having a significant impact onmajor company decisions. In the not-for-profit sector there are typically manyinterest groups who have to be consulted.
It is not only the degree of influence which is important, but the fact that theinterests of stakeholders are often in conflict; this leads to the principal agentproblem discussed in section 3.8. While the profile of stakeholder influencevaries among different companies, the following indicates the factors whichdetermine how important that influence is likely to be.
Shareholders
Despite their importance, shareholders usually exert little influence on majorcompany decisions or how the company is run from day to day. Large companiestypically have many shareholders and they are geographically isolated, comingtogether, if at all, only for the annual general meeting. Power rests with theexecutives, and it is only in exceptional circumstances that CEOs are censuredor dismissed at the AGM; this is an aspect of the principal agent problemdiscussed at 3.8.
In some cases large financial institutions, which manage portfolios for pensionfunds and investment trusts, may have a significant shareholding in a particularcompany; if the institutional shareholders together take a similar view on aparticular issue they may wield some power over company executives at theAGM. However, it must be recognised that these financial institutions are reallythe representatives of the individuals whose money they manage, and there is
3/34 Edinburgh Business School Strategic Planning
Module 3 / Company Objectives
no guarantee that they will act in accordance with these individuals’ wishes.In smaller companies, which are family owned or have a few partners, theshareholders wield a direct influence on company operations. But in this casethey typically play the dual role of shareholders and managers, and this negatesthe principal agent problem.
Managers
By and large the influence of managers increases with the size of the company,as the influence of the shareholders diminishes. The independence of managersalso depends on the type of remuneration package – whether it is related toabsolute profits, growth in sales, successful acquisitions, or whatever. Ideally,the management incentive structure would be aligned with shareholder interests,which are largely profit maximisation, but this is notoriously difficult to achieve.There are many examples of CEOs receiving huge salary increases at the sametime as company fortunes are falling – this is usually because remuneration islagged and is related not to current but to past performance.
One method of attempting to align the two is to make the CEO a shareholderby giving stock options instead of direct remuneration. While the outcome ofthis should be the maximisation of shareholder wealth, the CEO has an incentiveto cash in the options at the most opportune time, and this may not be consistentwith long term profit maximisation. In principle, the role of the non executiveboard members, and an independent chairman, is to provide the countervailingpower which will balance up the interests of managers and stakeholders, butgiven the limited time which the non-executives spend in the company, and thefact that directorships are often interlocking, the non-executives often wield littlereal power.
Employees
There was a time in the UK when trade unions had sufficient numerical strength,and the backing of legislation, to ensure that employees had a significant impacton company decision making. The changes in the legislation in the 1980s, cou-pled with an absolute decline in trade union membership led to a significantreduction in this form of employee influence. In some countries, such as Ger-many, employee influence is much higher because of labour legislation which ismore favourable to employees than is the case in the UK. Thus much dependson the individual country and its legislation.
However, employees wield influence in a different way. At the simplest level,it is not feasible for a company to replace its entire workforce at a stroke. Evenif it were, the new employees would start off far down the experience curveand productivity and competitiveness would be severely undermined. Thus thecompany is to a great extent dependent on the skills and attributes of the currentemployees. In this case it is not so much the direct influence of employees oncompany decision making which is important, but the extent to which they areable and willing to collaborate in the changes which strategic decision makinginvolves. This in turn depends on the company culture, organisational structure,incentives and so on. The more specific the employee skill sets are to theindividual company the more important this factor is likely to be.
Strategic Planning Edinburgh Business School 3/35
Module 3 / Company Objectives
Suppliers
As discussed above, the important considerations are the number of suppliersand the availability of substitutes.
Customers
Again, the five forces model reveals that the number of customers or customergroups largely determines customer influence. On the other hand, if there are fewsubstitutes for the company’s products this power will be greatly diminished.
Creditors
Companies tend to build relationships with sources of credit, such as banks, sothat they can rely on a fast and fairly sympathetic reaction to credit requirements.Some companies have representatives of creditors on the board; this is usuallythe outcome of venture capital being provided by banks for high risk startups who wish to monitor their investments. But typically this involvementdiminishes as the management establishes a track record.
Companies have the option of financing investments from retained earnings,obtaining loans, or a combination of both. It could be argued that a companywhich has become so dependent on a particular bank that it exerts influenceon company operations only has itself to blame. In principle, the influencewielded by the bank is to decide whether to provide a loan, and it does this incompetition with other banks. Where a relationship has been established it canbe costly to change creditor, but this is an issue of costs and benefits rather thancreditor influence. The fact that the company is highly geared (as discussed at6.12) may constrain its activities, but it is difficult to see how the creditor canexert direct influence on the company unless it has put the creditors’ funds atrisk.
Local community
The influence of the local community is in the form of a series of constraints.For example, if the company develops a reputation as a good employer, it willtypically have little difficulty in recruiting at the going wage rate; however theopposite is likely to apply if its reputation is suspect. If the company pollutesthe locality it will probably have difficulty obtaining permission for expansion.
Government
Apart from regulation, the government can influence companies by its ownrole as a purchaser and its policies on subsidies and trade. The purchasinginfluence affects companies in the defence industry, subsidies affect companiesin the sectors which the government is attempting to encourage, and tradepolicy affects importers and exporters. Again the extent of shareholder influencedepends on the individual case.
3/36 Edinburgh Business School Strategic Planning
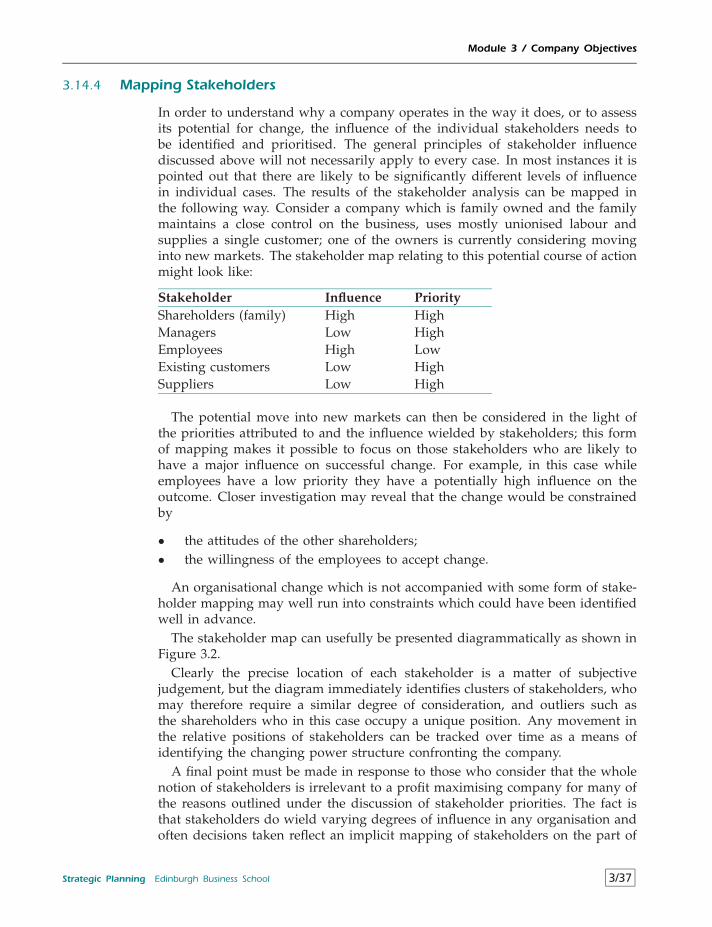
Module 3 / Company Objectives
3.14.4 Mapping Stakeholders
In order to understand why a company operates in the way it does, or to assessits potential for change, the influence of the individual stakeholders needs tobe identified and prioritised. The general principles of stakeholder influencediscussed above will not necessarily apply to every case. In most instances it ispointed out that there are likely to be significantly different levels of influencein individual cases. The results of the stakeholder analysis can be mapped inthe following way. Consider a company which is family owned and the familymaintains a close control on the business, uses mostly unionised labour andsupplies a single customer; one of the owners is currently considering movinginto new markets. The stakeholder map relating to this potential course of actionmight look like:
Stakeholder Influence PriorityShareholders (family) High HighManagers Low HighEmployees High LowExisting customers Low HighSuppliers Low High
The potential move into new markets can then be considered in the light ofthe priorities attributed to and the influence wielded by stakeholders; this formof mapping makes it possible to focus on those stakeholders who are likely tohave a major influence on successful change. For example, in this case whileemployees have a low priority they have a potentially high influence on theoutcome. Closer investigation may reveal that the change would be constrainedby
• the attitudes of the other shareholders;• the willingness of the employees to accept change.
An organisational change which is not accompanied with some form of stake-holder mapping may well run into constraints which could have been identifiedwell in advance.
The stakeholder map can usefully be presented diagrammatically as shown inFigure 3.2.
Clearly the precise location of each stakeholder is a matter of subjectivejudgement, but the diagram immediately identifies clusters of stakeholders, whomay therefore require a similar degree of consideration, and outliers such asthe shareholders who in this case occupy a unique position. Any movement inthe relative positions of stakeholders can be tracked over time as a means ofidentifying the changing power structure confronting the company.
A final point must be made in response to those who consider that the wholenotion of stakeholders is irrelevant to a profit maximising company for many ofthe reasons outlined under the discussion of stakeholder priorities. The fact isthat stakeholders do wield varying degrees of influence in any organisation andoften decisions taken reflect an implicit mapping of stakeholders on the part of
Strategic Planning Edinburgh Business School 3/37
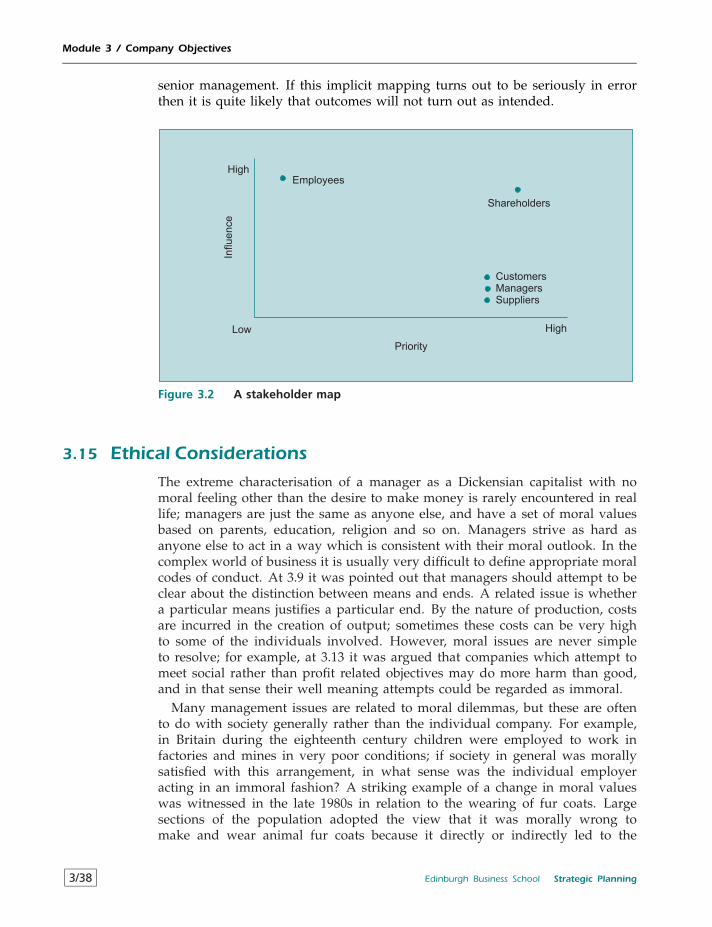
Module 3 / Company Objectives
senior management. If this implicit mapping turns out to be seriously in errorthen it is quite likely that outcomes will not turn out as intended.
Priority
Low High
High
Influence
Employees
Shareholders
CustomersManagersSuppliers
Figure 3.2 A stakeholder map
3.15 Ethical Considerations
The extreme characterisation of a manager as a Dickensian capitalist with nomoral feeling other than the desire to make money is rarely encountered in reallife; managers are just the same as anyone else, and have a set of moral valuesbased on parents, education, religion and so on. Managers strive as hard asanyone else to act in a way which is consistent with their moral outlook. In thecomplex world of business it is usually very difficult to define appropriate moralcodes of conduct. At 3.9 it was pointed out that managers should attempt to beclear about the distinction between means and ends. A related issue is whethera particular means justifies a particular end. By the nature of production, costsare incurred in the creation of output; sometimes these costs can be very highto some of the individuals involved. However, moral issues are never simpleto resolve; for example, at 3.13 it was argued that companies which attempt tomeet social rather than profit related objectives may do more harm than good,and in that sense their well meaning attempts could be regarded as immoral.
Many management issues are related to moral dilemmas, but these are oftento do with society generally rather than the individual company. For example,in Britain during the eighteenth century children were employed to work infactories and mines in very poor conditions; if society in general was morallysatisfied with this arrangement, in what sense was the individual employeracting in an immoral fashion? A striking example of a change in moral valueswas witnessed in the late 1980s in relation to the wearing of fur coats. Largesections of the population adopted the view that it was morally wrong tomake and wear animal fur coats because it directly or indirectly led to the
3/38 Edinburgh Business School Strategic Planning
Module 3 / Company Objectives
endangerment of species. The moral arguments related to this issue cannot beaddressed here but some relevant questions are:
• Does it matter if tigers disappear? Species are eliminated all the time, sowhat is so special about big cats?
• There can be genuine disagreement on the contribution of wearing fur coatsto the endangerment of species; what are the real facts relating to wearinganimal furs?
• What proportion of the population does it take to decide whether somethingis immoral or not? It is bad luck for a manager to wake up one morningand find that he is no longer acting in a moral fashion.
Some companies impose a code of ethics on their employees, such as neveraccepting bribes. This is somewhat difficult to enforce in countries where briberyis socially acceptable, and is not seen as immoral behaviour. To some observers,such ethical attitudes are reminiscent of the zeal with which missionaries attemptto transplant their concepts of morality into other societies. On the other hand, itmay simply be the case that such companies are using moral values as a meanstowards the end of promoting an image of honesty, integrity and dependabilitywhich will enhance their competitive potential.
To summarise, moral behaviour is difficult to define for companies and formanagers. The manager may find it counter-productive to take a stand ‘for thesake of principle’ when that principle is based on a series of dubious premises.
The impact which ethical considerations can have on a company becameevident when Shell attempted to dispose of the obsolete Brent Spar oil rig bysinking it in the North Sea. The company had carried out exhaustive scientificanalyses of the various options, and sinking had emerged as the clear favouritein terms of environmental pollution and cost. However, Greenpeace took theview that the oil rig would be the cause of major pollution on the sea bed, andwould lead to many more such disposals. A campaign to boycott Shell petrolstations was instigated, and a group of protestors occupied the oil rig at sea.Eventually, Shell backed down and moved the Brent Spar to a location where itcould be dismantled on land. Soon afterwards, Shell announced its intention toinvest $2.6 billion in a Nigerian gas plant. Environmentalists claimed that Shellhad been responsible for most of the pollution in the Niger Delta during thepast 40 years, and that this investment would make things even worse. Shellcame under intense pressure not to proceed with this investment. The rightsand wrongs of the Brent Spar and Nigerian issues are not the issue: the fact isthat these ethical issues had a significant effect on the company.
Not only is it virtually impossible to incorporate ethical issues into companyobjectives, but one survey4 reports that practicing managers have little idea ofwhat ethical behaviour should be. Many felt that performing well and beingloyal to the company constituted behaving ethically, while less than one third ofemployees believed that their firms respected employees who blew the whistleon unethical practices.
Strategic Planning Edinburgh Business School 3/39
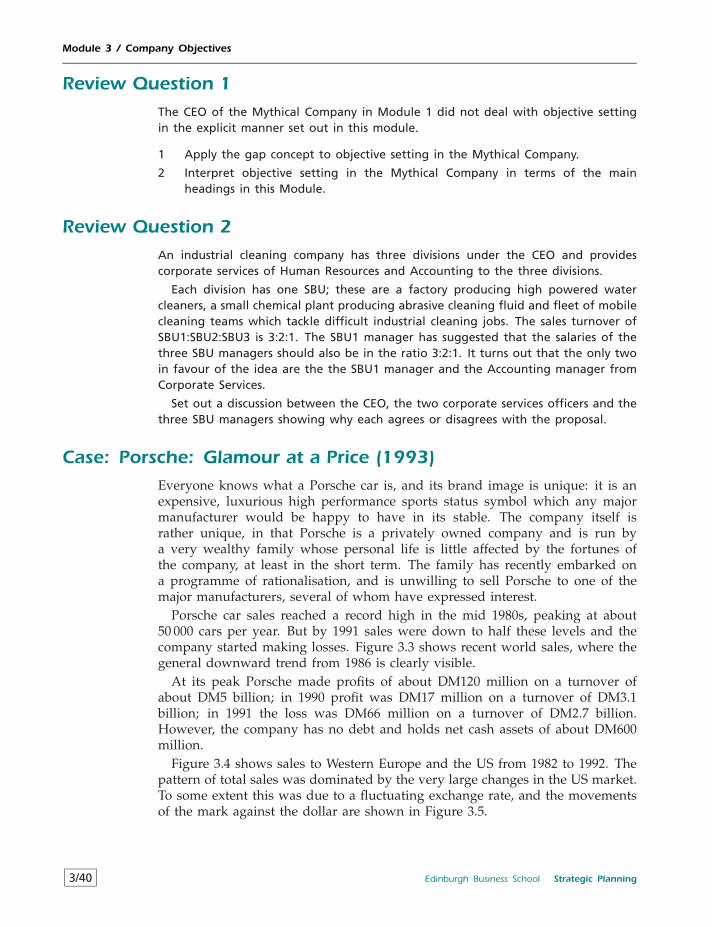
Module 3 / Company Objectives
Review Question 1The CEO of the Mythical Company in Module 1 did not deal with objective settingin the explicit manner set out in this module.
1 Apply the gap concept to objective setting in the Mythical Company.
2 Interpret objective setting in the Mythical Company in terms of the mainheadings in this Module.
Review Question 2An industrial cleaning company has three divisions under the CEO and providescorporate services of Human Resources and Accounting to the three divisions.
Each division has one SBU; these are a factory producing high powered watercleaners, a small chemical plant producing abrasive cleaning fluid and fleet of mobilecleaning teams which tackle difficult industrial cleaning jobs. The sales turnover ofSBU1:SBU2:SBU3 is 3:2:1. The SBU1 manager has suggested that the salaries of thethree SBU managers should also be in the ratio 3:2:1. It turns out that the only twoin favour of the idea are the the SBU1 manager and the Accounting manager fromCorporate Services.
Set out a discussion between the CEO, the two corporate services officers and thethree SBU managers showing why each agrees or disagrees with the proposal.
Case: Porsche: Glamour at a Price (1993)Everyone knows what a Porsche car is, and its brand image is unique: it is anexpensive, luxurious high performance sports status symbol which any majormanufacturer would be happy to have in its stable. The company itself israther unique, in that Porsche is a privately owned company and is run bya very wealthy family whose personal life is little affected by the fortunes ofthe company, at least in the short term. The family has recently embarked ona programme of rationalisation, and is unwilling to sell Porsche to one of themajor manufacturers, several of whom have expressed interest.
Porsche car sales reached a record high in the mid 1980s, peaking at about50 000 cars per year. But by 1991 sales were down to half these levels and thecompany started making losses. Figure 3.3 shows recent world sales, where thegeneral downward trend from 1986 is clearly visible.
At its peak Porsche made profits of about DM120 million on a turnover ofabout DM5 billion; in 1990 profit was DM17 million on a turnover of DM3.1billion; in 1991 the loss was DM66 million on a turnover of DM2.7 billion.However, the company has no debt and holds net cash assets of about DM600million.
Figure 3.4 shows sales to Western Europe and the US from 1982 to 1992. Thepattern of total sales was dominated by the very large changes in the US market.To some extent this was due to a fluctuating exchange rate, and the movementsof the mark against the dollar are shown in Figure 3.5.
3/40 Edinburgh Business School Strategic Planning
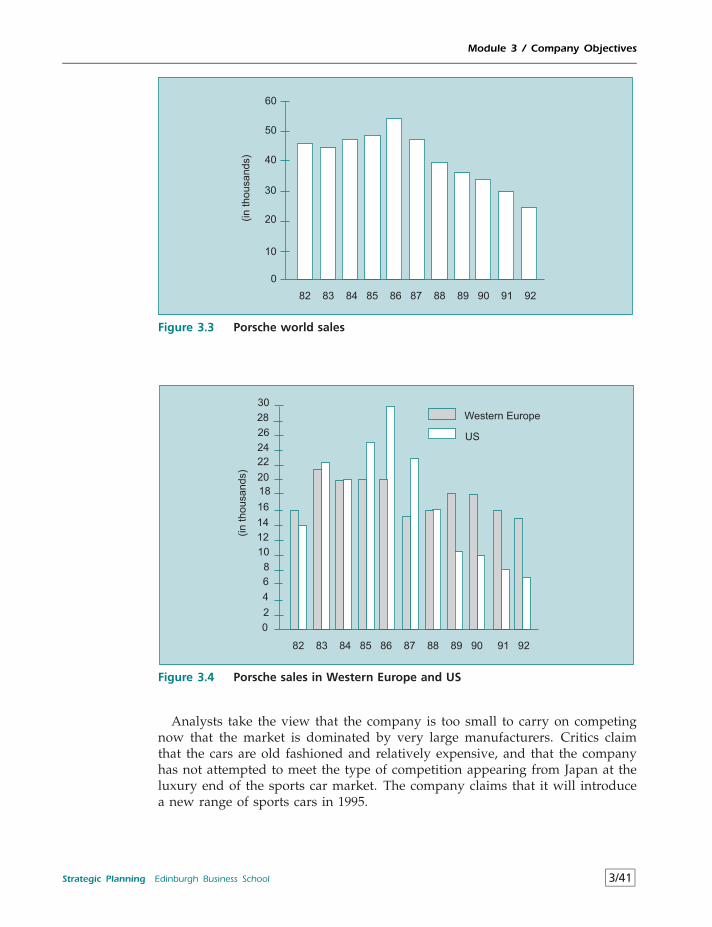
Module 3 / Company Objectives
0
10
20
30
40
50
60
82 83 84 85 86 87 88 89 90 91 92
(in
thousands)
Figure 3.3 Porsche world sales
0
4
8
82 83 84 85 86 87 88 89 90 91 92
(in
thousands)
2
6
10
12
14
16
18
20
22
24
26
28
30
Western Europe
US
Figure 3.4 Porsche sales in Western Europe and US
Analysts take the view that the company is too small to carry on competingnow that the market is dominated by very large manufacturers. Critics claimthat the cars are old fashioned and relatively expensive, and that the companyhas not attempted to meet the type of competition appearing from Japan at theluxury end of the sports car market. The company claims that it will introducea new range of sports cars in 1995.
Strategic Planning Edinburgh Business School 3/41
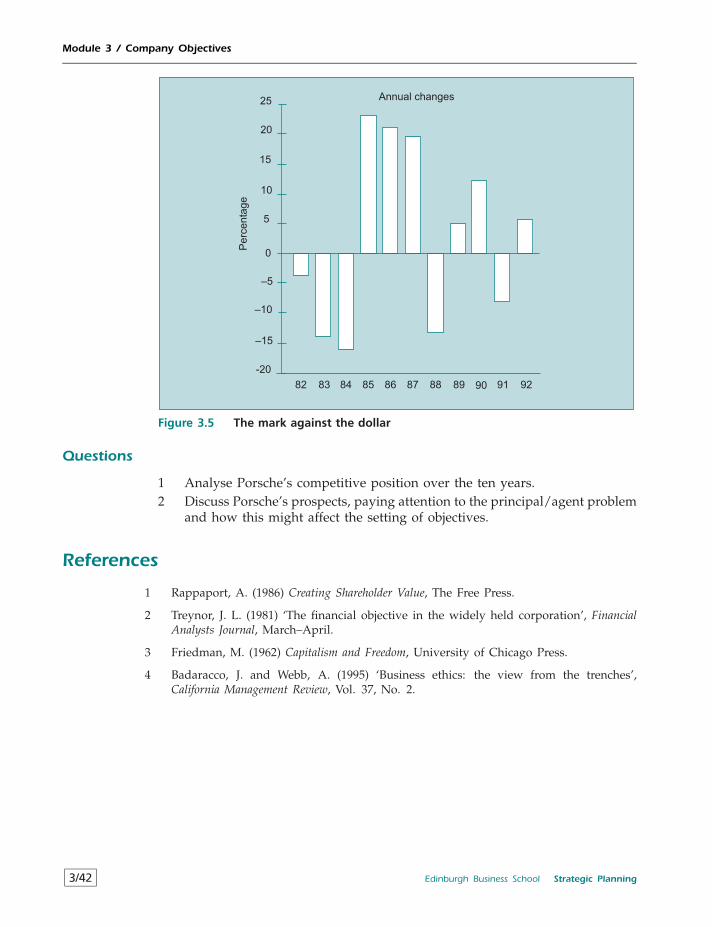
Module 3 / Company Objectives
-20
–15
–10
–5
0
5
10
82 83 84 85 86 87 88 89 90 91 92
15
20
25
Perc
enta
ge
Annual changes
Figure 3.5 The mark against the dollar
Questions
1 Analyse Porsche’s competitive position over the ten years.2 Discuss Porsche’s prospects, paying attention to the principal/agent problem
and how this might affect the setting of objectives.
References
1 Rappaport, A. (1986) Creating Shareholder Value, The Free Press.
2 Treynor, J. L. (1981) ‘The financial objective in the widely held corporation’, FinancialAnalysts Journal, March–April.
3 Friedman, M. (1962) Capitalism and Freedom, University of Chicago Press.
4 Badaracco, J. and Webb, A. (1995) ‘Business ethics: the view from the trenches’,California Management Review, Vol. 37, No. 2.
3/42 Edinburgh Business School Strategic Planning
Module 4
The Company and the Economy
Contents
4.1 The Company in the Economic Environment 4/2
4.2 Revenue and Costs: The Basic Model 4/3
4.3 The Workings of the Economy 4/44.3.1 Understanding and Using Economic Information 4/74.3.2 Supply and Demand in the Economy 4/104.3.3 Unemployment and Inflation 4/134.3.4 The International Economy 4/16
4.4 Forecasting: What Will Happen Next? 4/21
4.5 PEST Analysis 4/25
4.6 Environmental Scanning 4/26
4.7 Scenarios 4/27
4.8 The Economy and Profitability 4/274.8.1 Implications for Company Sales and Revenues 4/284.8.2 Competitive Reaction and the Economic Environment 4/294.8.3 Implications for Inputs and Company Costs 4/30
4.9 Environmental Threat and Opportunity Profile: Part 1 4/31
Review Questions 4/34
Case: Revisit Porsche: Glamour at a Price 4/34
Learning Objectives
• To demonstrate why an understanding of the economy is important formanagers.
• To show how different aspects of the economy affect the company.• To develop a framework for analysing the state of the economy and under-
standing economic forecasts.• To show how competitive forces are influenced by economic events.• To use economic data in deriving an environmental threat and opportunity
profile.
Strategic Planning Edinburgh Business School 4/1
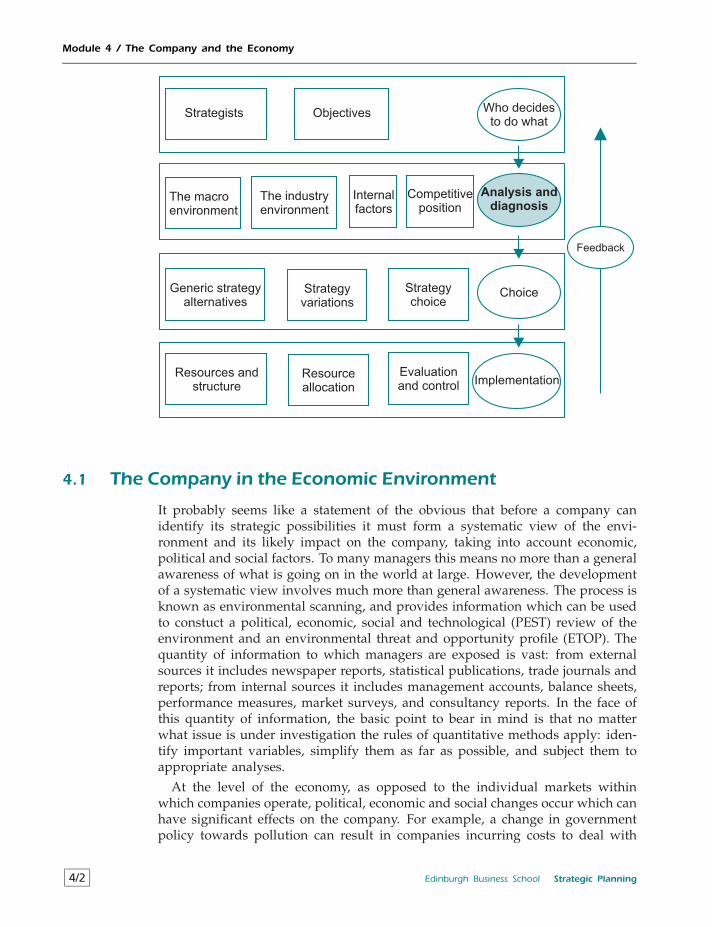
Module 4 / The Company and the Economy
Strategists Objectives
The macroenvironment
The industryenvironment
Internalfactors
Competitiveposition
Generic strategyalternatives
Strategyvariations
Who decidesto do what
Analysis anddiagnosis
Choice
Implementation
Strategychoice
Resources andstructure
Resourceallocation
Evaluationand control
Feedback
4.1 The Company in the Economic Environment
It probably seems like a statement of the obvious that before a company canidentify its strategic possibilities it must form a systematic view of the envi-ronment and its likely impact on the company, taking into account economic,political and social factors. To many managers this means no more than a generalawareness of what is going on in the world at large. However, the developmentof a systematic view involves much more than general awareness. The process isknown as environmental scanning, and provides information which can be usedto constuct a political, economic, social and technological (PEST) review of theenvironment and an environmental threat and opportunity profile (ETOP). Thequantity of information to which managers are exposed is vast: from externalsources it includes newspaper reports, statistical publications, trade journals andreports; from internal sources it includes management accounts, balance sheets,performance measures, market surveys, and consultancy reports. In the face ofthis quantity of information, the basic point to bear in mind is that no matterwhat issue is under investigation the rules of quantitative methods apply: iden-tify important variables, simplify them as far as possible, and subject them toappropriate analyses.
At the level of the economy, as opposed to the individual markets withinwhich companies operate, political, economic and social changes occur which canhave significant effects on the company. For example, a change in governmentpolicy towards pollution can result in companies incurring costs to deal with
4/2 Edinburgh Business School Strategic Planning
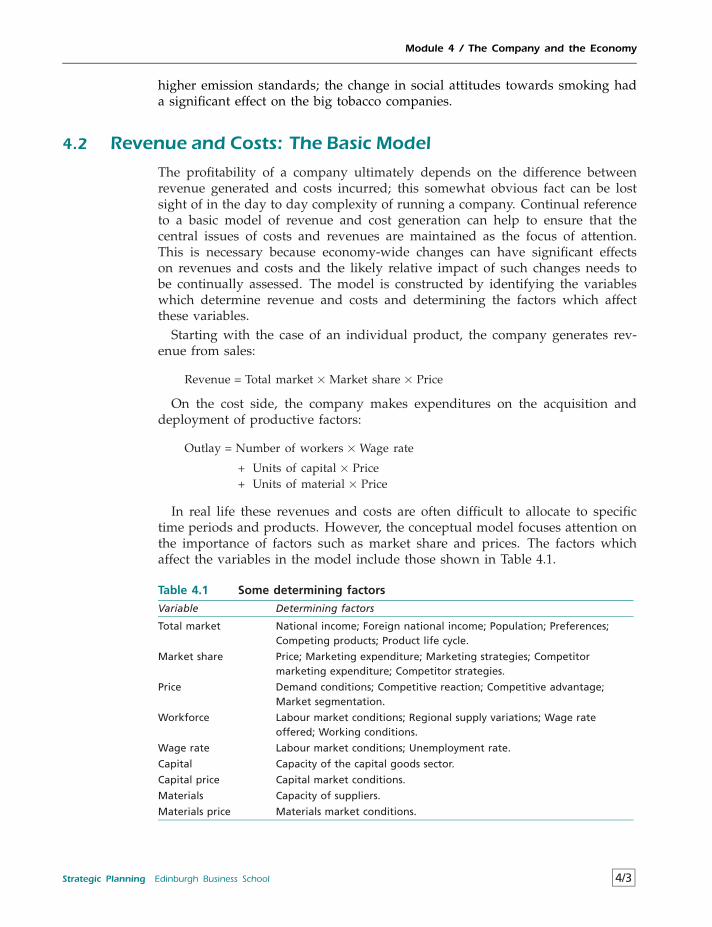
Module 4 / The Company and the Economy
higher emission standards; the change in social attitudes towards smoking hada significant effect on the big tobacco companies.
4.2 Revenue and Costs: The Basic Model
The profitability of a company ultimately depends on the difference betweenrevenue generated and costs incurred; this somewhat obvious fact can be lostsight of in the day to day complexity of running a company. Continual referenceto a basic model of revenue and cost generation can help to ensure that thecentral issues of costs and revenues are maintained as the focus of attention.This is necessary because economy-wide changes can have significant effectson revenues and costs and the likely relative impact of such changes needs tobe continually assessed. The model is constructed by identifying the variableswhich determine revenue and costs and determining the factors which affectthese variables.
Starting with the case of an individual product, the company generates rev-enue from sales:
Revenue = Total market×Market share× Price
On the cost side, the company makes expenditures on the acquisition anddeployment of productive factors:
Outlay = Number of workers×Wage rate
+ Units of capital× Price+ Units of material× Price
In real life these revenues and costs are often difficult to allocate to specifictime periods and products. However, the conceptual model focuses attention onthe importance of factors such as market share and prices. The factors whichaffect the variables in the model include those shown in Table 4.1.
Table 4.1 Some determining factors
Variable Determining factors
Total market National income; Foreign national income; Population; Preferences;Competing products; Product life cycle.
Market share Price; Marketing expenditure; Marketing strategies; Competitormarketing expenditure; Competitor strategies.
Price Demand conditions; Competitive reaction; Competitive advantage;Market segmentation.
Workforce Labour market conditions; Regional supply variations; Wage rateoffered; Working conditions.
Wage rate Labour market conditions; Unemployment rate.
Capital Capacity of the capital goods sector.
Capital price Capital market conditions.
Materials Capacity of suppliers.
Materials price Materials market conditions.
Strategic Planning Edinburgh Business School 4/3
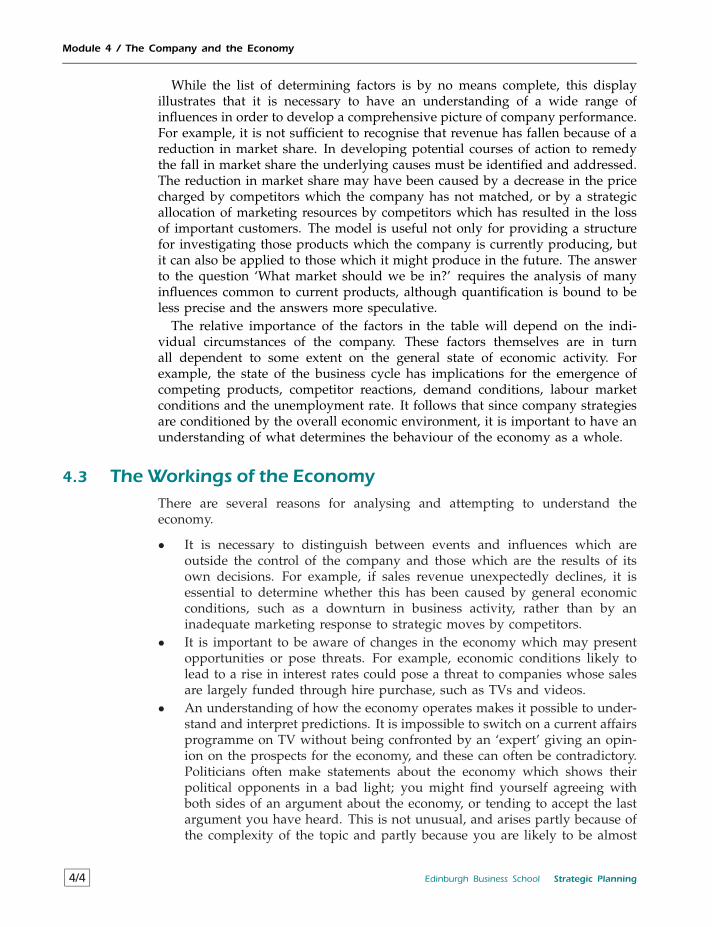
Module 4 / The Company and the Economy
While the list of determining factors is by no means complete, this displayillustrates that it is necessary to have an understanding of a wide range ofinfluences in order to develop a comprehensive picture of company performance.For example, it is not sufficient to recognise that revenue has fallen because of areduction in market share. In developing potential courses of action to remedythe fall in market share the underlying causes must be identified and addressed.The reduction in market share may have been caused by a decrease in the pricecharged by competitors which the company has not matched, or by a strategicallocation of marketing resources by competitors which has resulted in the lossof important customers. The model is useful not only for providing a structurefor investigating those products which the company is currently producing, butit can also be applied to those which it might produce in the future. The answerto the question ‘What market should we be in?’ requires the analysis of manyinfluences common to current products, although quantification is bound to beless precise and the answers more speculative.
The relative importance of the factors in the table will depend on the indi-vidual circumstances of the company. These factors themselves are in turnall dependent to some extent on the general state of economic activity. Forexample, the state of the business cycle has implications for the emergence ofcompeting products, competitor reactions, demand conditions, labour marketconditions and the unemployment rate. It follows that since company strategiesare conditioned by the overall economic environment, it is important to have anunderstanding of what determines the behaviour of the economy as a whole.
4.3 The Workings of the EconomyThere are several reasons for analysing and attempting to understand theeconomy.
• It is necessary to distinguish between events and influences which areoutside the control of the company and those which are the results of itsown decisions. For example, if sales revenue unexpectedly declines, it isessential to determine whether this has been caused by general economicconditions, such as a downturn in business activity, rather than by aninadequate marketing response to strategic moves by competitors.
• It is important to be aware of changes in the economy which may presentopportunities or pose threats. For example, economic conditions likely tolead to a rise in interest rates could pose a threat to companies whose salesare largely funded through hire purchase, such as TVs and videos.
• An understanding of how the economy operates makes it possible to under-stand and interpret predictions. It is impossible to switch on a current affairsprogramme on TV without being confronted by an ‘expert’ giving an opin-ion on the prospects for the economy, and these can often be contradictory.Politicians often make statements about the economy which shows theirpolitical opponents in a bad light; you might find yourself agreeing withboth sides of an argument about the economy, or tending to accept the lastargument you have heard. This is not unusual, and arises partly because ofthe complexity of the topic and partly because you are likely to be almost
4/4 Edinburgh Business School Strategic Planning
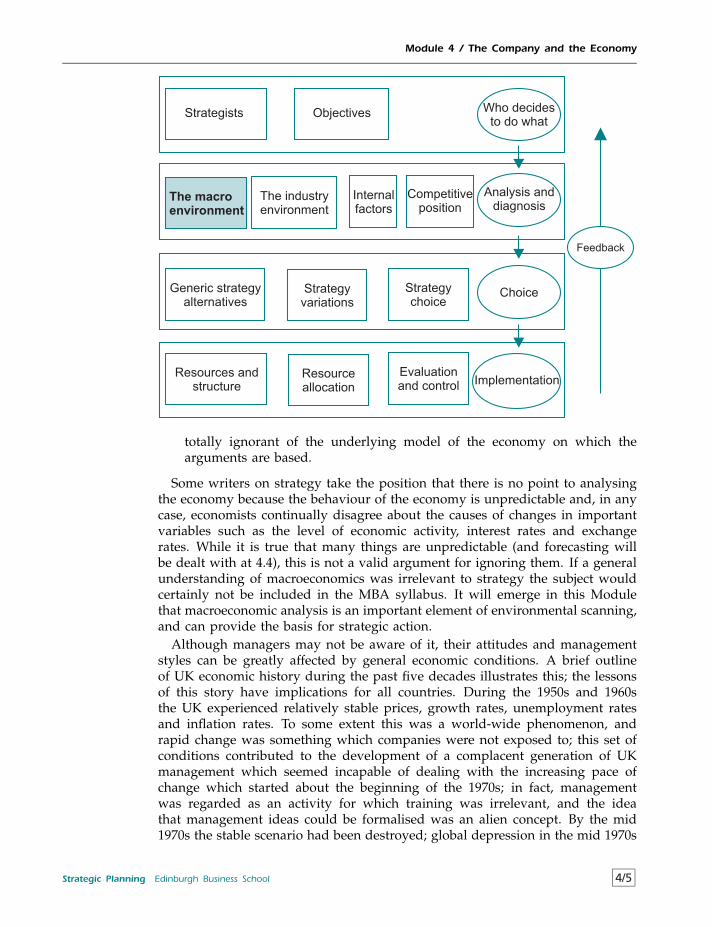
Module 4 / The Company and the Economy
Strategists Objectives
The macro
environment
The industryenvironment
Internalfactors
Competitiveposition
Generic strategyalternatives
Strategyvariations
Who decidesto do what
Analysis anddiagnosis
Choice
Implementation
Strategychoice
Resources andstructure
Resourceallocation
Evaluationand control
Feedback
totally ignorant of the underlying model of the economy on which thearguments are based.
Some writers on strategy take the position that there is no point to analysingthe economy because the behaviour of the economy is unpredictable and, in anycase, economists continually disagree about the causes of changes in importantvariables such as the level of economic activity, interest rates and exchangerates. While it is true that many things are unpredictable (and forecasting willbe dealt with at 4.4), this is not a valid argument for ignoring them. If a generalunderstanding of macroeconomics was irrelevant to strategy the subject wouldcertainly not be included in the MBA syllabus. It will emerge in this Modulethat macroeconomic analysis is an important element of environmental scanning,and can provide the basis for strategic action.
Although managers may not be aware of it, their attitudes and managementstyles can be greatly affected by general economic conditions. A brief outlineof UK economic history during the past five decades illustrates this; the lessonsof this story have implications for all countries. During the 1950s and 1960sthe UK experienced relatively stable prices, growth rates, unemployment ratesand inflation rates. To some extent this was a world-wide phenomenon, andrapid change was something which companies were not exposed to; this set ofconditions contributed to the development of a complacent generation of UKmanagement which seemed incapable of dealing with the increasing pace ofchange which started about the beginning of the 1970s; in fact, managementwas regarded as an activity for which training was irrelevant, and the ideathat management ideas could be formalised was an alien concept. By the mid1970s the stable scenario had been destroyed; global depression in the mid 1970s
Strategic Planning Edinburgh Business School 4/5
Module 4 / The Company and the Economy
was partly caused by the trebling of oil prices, which in turn caused substan-tial economic upheavals. This period also saw the end of stable internationalexchange rates with the collapse of the Bretton Woods agreement in 1973, andthe emergence of powerful competition from the Far East economies. It is nosecret that UK managers were ill equipped to deal with these changes, and theeconomic traumas of the 1970s, which included 25 per cent inflation rates, poorproductivity growth, the loss of important markets and endless labour disputes,were at least partly caused by lack of foresight and adaptability on the part ofmanagers.
The period up to 1979 also saw a significant increase in the extent to whichgovernments attempted to regulate the level of economic activity. The share ofgovernment in the economy (measured by the sum of government expenditureson goods and services and transfer payments) increased to well over 40 percent of national income by 1979, and the notorious ‘stop-go’ policies whichwere utilised in response to economic fluctuations seemed at times to make thesituation worse rather than better. The incomes policy introduced in the mid1970s, which was a misguided attempt to reduce the inflation rate, coupledwith very high marginal tax rates, led to a significant reduction in incentivesfor managers generally. By the end of the 1970s the prevailing view was thatgovernment would continue to increase its involvement in the economy, andmanagers should learn to function in a government dominated economy. Aprolonged period of intervention had undermined the ethos of self-relianceand personal initiative; the result was a marked reluctance to take risks andundertake new ventures.
The pace of change and the volatility of economic activity and related factorsincreased in the 1980s. In the UK there were substantial changes in unemploy-ment rates, industrial output, inflation rates, interest rates, productivity, exports,imports, capital flows, and exchange rates. But a major change in the politicalclimate had led to the election of a right wing free market orientated govern-ment under the leadership of Margaret Thatcher in 1979. There was a consciouseffort on the part of government to disengage from the economy and allowmarket forces to operate more freely; this in turn led to deregulation, sellingstate owned companies, and lower marginal tax rates. These economic changesaffected individual company performances in many ways. For example, by thelate 1980s the UK was experiencing a boom, with record growth rates and thelowest unemployment rate for ten years; in particular, asset prices spiralled,and many successful large companies started to diversify into property, whilethose already in the property business began to extend themselves. To manyobservers it seemed that the pinnacle of credit and unfettered expectations onwhich this boom depended was unstable, but developers pressed on regardless.After the economic downturn in 1990 the bubble burst and there were manydisasters, the best known being the Canary Wharf development – the largestbuilding in London – which went bankrupt before it was even occupied. Eco-nomic circumstances had led yet again to a ‘gold rush’ outlook on the part ofotherwise sensible managers, who did not seem to appreciate that they weregambling entirely on the continuation of boom time conditions. A rudimentaryunderstanding of economics might have given cause for concern about the infla-tionary pressures being generated during the boom and the possibility that the
4/6 Edinburgh Business School Strategic Planning
Module 4 / The Company and the Economy
government might be forced to take deflationary measures.The major recession which the UK experienced from 1991 to 1993 was rela-
tively short lived, but recovery from the recession was very slow, and by thelate 1990s the unemployment rate was still well above the 1990 level. By themid 1990s the economy had improved dramatically in real terms: productivityhad soared, the inflation rate was low compared with other major economies,the interest rate was historically low, and the economy was the fastest growingin Europe. But despite this managers were greatly affected by the experience ofthe early 1990s recession, and the absence of a ‘feel good’ factor was a generallyaccepted fact; confidence on the part of both consumers and producers was low,leading to an unwillingness to spend on the part of consumers and to investon the part of companies. In the mid 1990s it was as if companies felt that theprosperity was fragile and that recession could return at any time.
Managers who have not been educated in general economic principles canbe excused for finding it difficult, or impossible, to explain the various changesobserved in the economy, which is subject to a seemingly perplexing varietyof influences of the type described above. It has already been pointed out thatmanagers are bombarded with information of all kinds; information on eco-nomic conditions arrives in the form of news reports, national and internationalstatistics, news commentaries by experts, and reports prepared by specialistswho may be independent economic consultants, stockbrokers, or employed bythe company. The problem facing the manager is to decide which informationis relevant, and interpret it in order to form a view on what is happening inthe economy as a whole; this is a prerequisite to deriving implications for theindustry and the company itself. Managers therefore often ask if it is possible tomake sense of the multitude of factors which they have to take into account, andwhether anything can be done to accommodate them. This is in fact the areaof study known as macroeconomics. A sample of what macroeconomic theoriescover is:
• the determination of GNP through the interaction of demand and supplyin the economy as a whole, and the effect of changes in both demand andsupply factors; full employment output, actual output, the unemploymentrate and the inflation rate;
• the role of expectations;• money supply and the rate of interest;• the rate of interest and investment expenditure;• factors affecting the demand for and supply of imports and exports;• the determination of the exchange rate and international financial flows.
4.3.1 Understanding and Using Economic Information
At the very least, a manager needs to be able to use economic information toform a view of the current state of the economy. An overall impression of thelevel of economic activity can be obtained from general economic indicators suchas unemployment rates, industrial output and consumer spending. A typical setof data published each week in The Economist is shown in Table 4.2.
Strategic Planning Edinburgh Business School 4/7
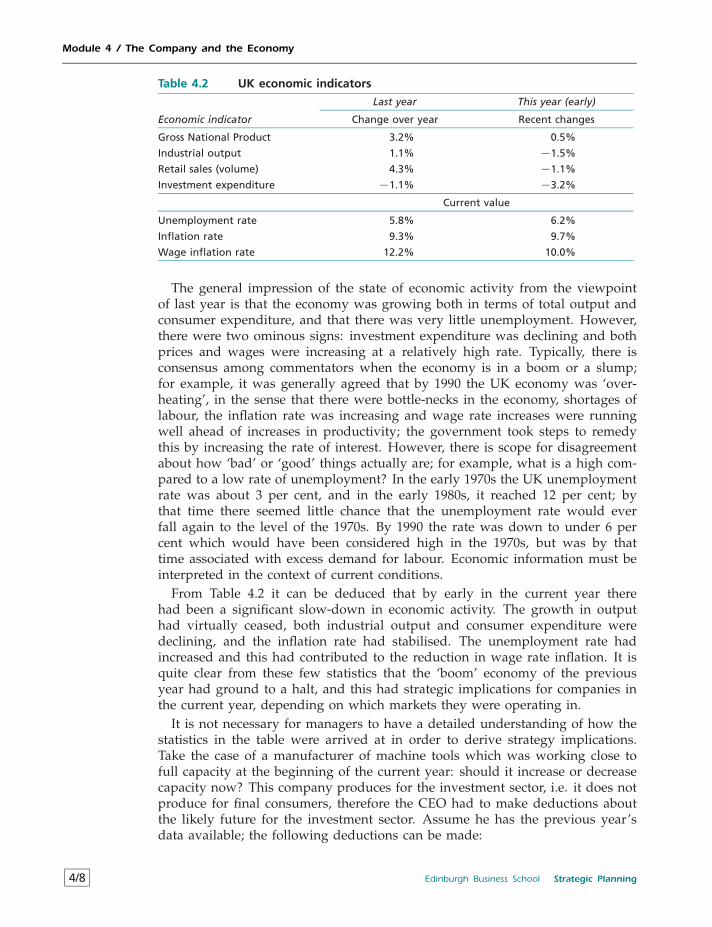
Module 4 / The Company and the Economy
Table 4.2 UK economic indicators
Last year This year (early)
Economic indicator Change over year Recent changes
Gross National Product 3.2% 0.5%
Industrial output 1.1% −1.5%
Retail sales (volume) 4.3% −1.1%
Investment expenditure −1.1% −3.2%
Current value
Unemployment rate 5.8% 6.2%
Inflation rate 9.3% 9.7%
Wage inflation rate 12.2% 10.0%
The general impression of the state of economic activity from the viewpointof last year is that the economy was growing both in terms of total output andconsumer expenditure, and that there was very little unemployment. However,there were two ominous signs: investment expenditure was declining and bothprices and wages were increasing at a relatively high rate. Typically, there isconsensus among commentators when the economy is in a boom or a slump;for example, it was generally agreed that by 1990 the UK economy was ‘over-heating’, in the sense that there were bottle-necks in the economy, shortages oflabour, the inflation rate was increasing and wage rate increases were runningwell ahead of increases in productivity; the government took steps to remedythis by increasing the rate of interest. However, there is scope for disagreementabout how ‘bad’ or ‘good’ things actually are; for example, what is a high com-pared to a low rate of unemployment? In the early 1970s the UK unemploymentrate was about 3 per cent, and in the early 1980s, it reached 12 per cent; bythat time there seemed little chance that the unemployment rate would everfall again to the level of the 1970s. By 1990 the rate was down to under 6 percent which would have been considered high in the 1970s, but was by thattime associated with excess demand for labour. Economic information must beinterpreted in the context of current conditions.
From Table 4.2 it can be deduced that by early in the current year therehad been a significant slow-down in economic activity. The growth in outputhad virtually ceased, both industrial output and consumer expenditure weredeclining, and the inflation rate had stabilised. The unemployment rate hadincreased and this had contributed to the reduction in wage rate inflation. It isquite clear from these few statistics that the ‘boom’ economy of the previousyear had ground to a halt, and this had strategic implications for companies inthe current year, depending on which markets they were operating in.
It is not necessary for managers to have a detailed understanding of how thestatistics in the table were arrived at in order to derive strategy implications.Take the case of a manufacturer of machine tools which was working close tofull capacity at the beginning of the current year: should it increase or decreasecapacity now? This company produces for the investment sector, i.e. it does notproduce for final consumers, therefore the CEO had to make deductions aboutthe likely future for the investment sector. Assume he has the previous year’sdata available; the following deductions can be made:
4/8 Edinburgh Business School Strategic Planning
Module 4 / The Company and the Economy
• The increase in Gross National Product (GNP) during the previous yearwas largely due to an increase in consumer expenditure (see the increasein Retail Sales); in other words, the economy was experiencing a consumerboom.
• The consumer boom had not led to an increase in capital equipment, ascan be seen from the fact that Investment Expenditure had fallen. In fact,Industrial Output had not grown as much as Retail Sales. Companies musthave been selling from inventories and/or imports must have increased.
• Wage costs were rising faster than the inflation rate.
The CEO could start by assessing what would happen to net cash flow if theconditions for the previous year carried on through the rest of the current yearusing the basic model of revenues and costs:
Revenue = Total market × Market share × PriceRevenue = 0.99 × 1 × 1.093
= 1.08
This simple calculation makes a number of assumptions: the price of output isassumed to move in line with the inflation rate (i.e. multiplied by 1.093), marketshare is assumed to remain unchanged (i.e. multiplied by 1), and the change inmarket size is assumed to be equal to the change in investment expenditure (i.e.multiplied by 0.99). The net effect is that cash flows would increase by about 8per cent.
Table 4.1 provides less information on which to judge the likely change inoutlays:
Outlay = Number of workers × Wage rate +Units of capital × Price +
Units of material × Price
The one figure which is known with certainty is the wage inflation rate whichis currently 12.2 per cent. If other costs move in line with wages then outlayswill increase by more than revenues, resulting in a reduction in net cash flow ofabout 4 per cent.
However, this calculation assumes that trends will remain unaltered duringthe rest of the year, and this may not be the case. First, it is likely that theconsumer expenditure boom will cause an increase in investment spending inthe relatively near future because of lagged effects as companies adjust theircapacity to new levels of demand. This suggests that the appropriate strategyis to increase capacity now to be ready for the increase in investment demand.Second, it follows that in order to increase capacity it would be necessary toincrease recruitment, and the historically low unemployment rate suggests thatthere is likely to be a shortage of labour, particularly of workers with skills.Third, political commentators take the view that the government intends tobring down the inflation rate by maintaining high interest rates, and this islikely to have an effect on economic activity in the short term. The dilemmafacing the company is that the markets for its products are likely to get worse
Strategic Planning Edinburgh Business School 4/9
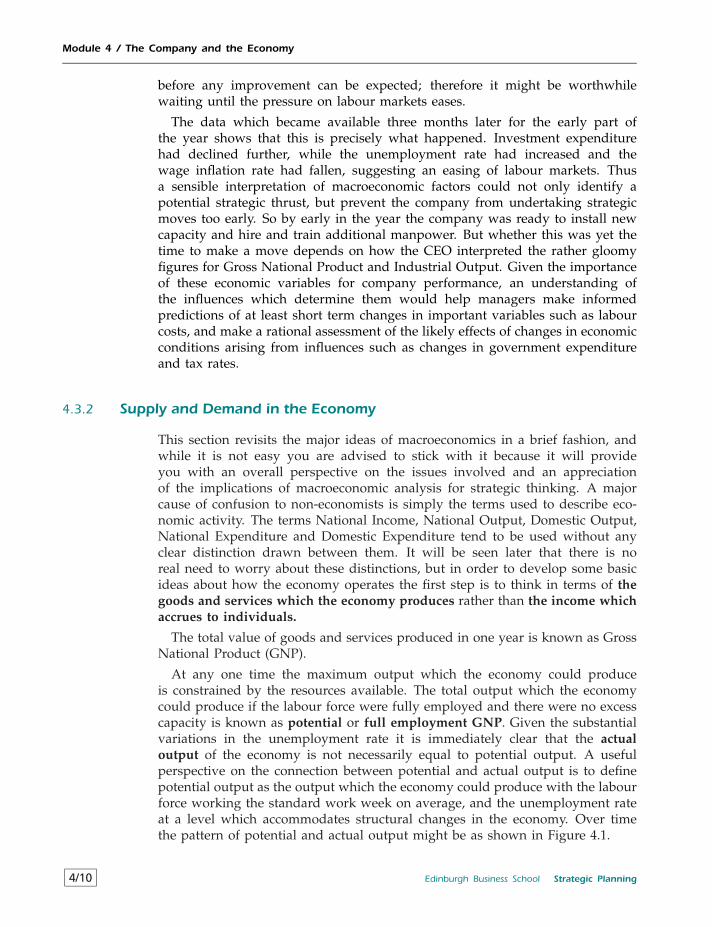
Module 4 / The Company and the Economy
before any improvement can be expected; therefore it might be worthwhilewaiting until the pressure on labour markets eases.
The data which became available three months later for the early part ofthe year shows that this is precisely what happened. Investment expenditurehad declined further, while the unemployment rate had increased and thewage inflation rate had fallen, suggesting an easing of labour markets. Thusa sensible interpretation of macroeconomic factors could not only identify apotential strategic thrust, but prevent the company from undertaking strategicmoves too early. So by early in the year the company was ready to install newcapacity and hire and train additional manpower. But whether this was yet thetime to make a move depends on how the CEO interpreted the rather gloomyfigures for Gross National Product and Industrial Output. Given the importanceof these economic variables for company performance, an understanding ofthe influences which determine them would help managers make informedpredictions of at least short term changes in important variables such as labourcosts, and make a rational assessment of the likely effects of changes in economicconditions arising from influences such as changes in government expenditureand tax rates.
4.3.2 Supply and Demand in the Economy
This section revisits the major ideas of macroeconomics in a brief fashion, andwhile it is not easy you are advised to stick with it because it will provideyou with an overall perspective on the issues involved and an appreciationof the implications of macroeconomic analysis for strategic thinking. A majorcause of confusion to non-economists is simply the terms used to describe eco-nomic activity. The terms National Income, National Output, Domestic Output,National Expenditure and Domestic Expenditure tend to be used without anyclear distinction drawn between them. It will be seen later that there is noreal need to worry about these distinctions, but in order to develop some basicideas about how the economy operates the first step is to think in terms of thegoods and services which the economy produces rather than the income whichaccrues to individuals.
The total value of goods and services produced in one year is known as GrossNational Product (GNP).
At any one time the maximum output which the economy could produceis constrained by the resources available. The total output which the economycould produce if the labour force were fully employed and there were no excesscapacity is known as potential or full employment GNP. Given the substantialvariations in the unemployment rate it is immediately clear that the actualoutput of the economy is not necessarily equal to potential output. A usefulperspective on the connection between potential and actual output is to definepotential output as the output which the economy could produce with the labourforce working the standard work week on average, and the unemployment rateat a level which accommodates structural changes in the economy. Over timethe pattern of potential and actual output might be as shown in Figure 4.1.
4/10 Edinburgh Business School Strategic Planning
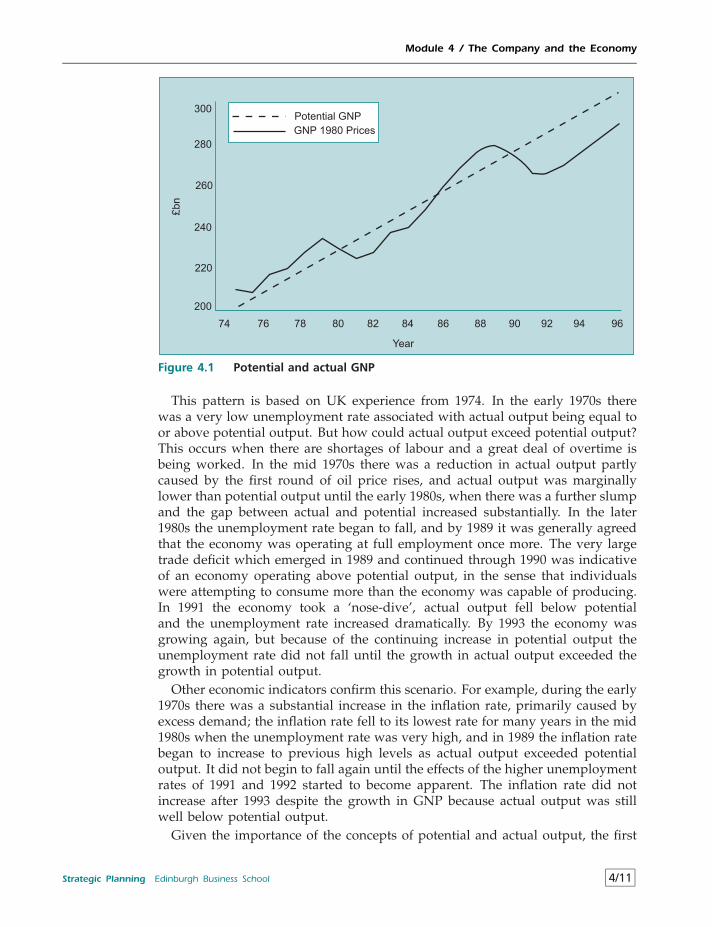
Module 4 / The Company and the Economy
200
220
240
260
280
300
74 76 78 80 82 84 86 88 90 92 94 96
£bn
Potential GNP
GNP 1980 Prices
Year
Figure 4.1 Potential and actual GNP
This pattern is based on UK experience from 1974. In the early 1970s therewas a very low unemployment rate associated with actual output being equal toor above potential output. But how could actual output exceed potential output?This occurs when there are shortages of labour and a great deal of overtime isbeing worked. In the mid 1970s there was a reduction in actual output partlycaused by the first round of oil price rises, and actual output was marginallylower than potential output until the early 1980s, when there was a further slumpand the gap between actual and potential increased substantially. In the later1980s the unemployment rate began to fall, and by 1989 it was generally agreedthat the economy was operating at full employment once more. The very largetrade deficit which emerged in 1989 and continued through 1990 was indicativeof an economy operating above potential output, in the sense that individualswere attempting to consume more than the economy was capable of producing.In 1991 the economy took a ‘nose-dive’, actual output fell below potentialand the unemployment rate increased dramatically. By 1993 the economy wasgrowing again, but because of the continuing increase in potential output theunemployment rate did not fall until the growth in actual output exceeded thegrowth in potential output.
Other economic indicators confirm this scenario. For example, during the early1970s there was a substantial increase in the inflation rate, primarily caused byexcess demand; the inflation rate fell to its lowest rate for many years in the mid1980s when the unemployment rate was very high, and in 1989 the inflation ratebegan to increase to previous high levels as actual output exceeded potentialoutput. It did not begin to fall again until the effects of the higher unemploymentrates of 1991 and 1992 started to become apparent. The inflation rate did notincrease after 1993 despite the growth in GNP because actual output was stillwell below potential output.
Given the importance of the concepts of potential and actual output, the first
Strategic Planning Edinburgh Business School 4/11
Module 4 / The Company and the Economy
question the manager should ask is: what is the difference between potentialand actual output?
By framing the issue in this way, it is possible to explain how the unemploy-ment rate can increase despite the fact that actual output is increasing; the effecton the unemployment rate depends on the relative rates of growth of potentialand actual output. The important factor is the gap between potential and actualoutput, and this will be reflected in the current rate of unemployment. Therelationship between the unemployment rate and the gap between potential andactual output is not exact because of changes in the definition of unemploymentand changing labour market conditions, and the connection between the twotends to change over long periods of time. To put this in context, it is useful tothink of unemployment as being comprised of three elements:
1 Structural unemployment: this is typically associated with large scale dis-ruptions in the economy when whole industries close down, for examplethe mining industry in the UK in the 1980s, or changes towards servicebased economies which have occurred in all mature economies duringthe past twenty years. The impact of structural changes on the long termunemployment rate depends on how quickly the working population adaptsto new conditions. Structural unemployment has grown in relative impor-tance in mature economies in the past few decades.
2 Frictional unemployment: the pool of unemployed can be regarded as theoutcome of a flow process, which is continually being added to as peo-ple decide to change jobs, and reduced as people find jobs. If the cost ofunemployment is reduced, perhaps because of an increase in unemploy-ment compensation, then individuals may spend longer in job search, thusincreasing the number of people in the unemployment pool. There are manyfactors which affect how long individuals choose to remain unemployed,and there is little which can be done about it in the short term.
3 Demand related unemployment: this is the element caused by the differencebetween actual and potential output. It can be seen from Figure 4.1 thatthe difference between actual and potential output varies dramatically overrelatively short periods, therefore it is to be expected that demand relatedunemployment will also vary in the short run.
By thinking of the issue in these terms it is possible to interpret statisticssuch as ‘the rate of unemployment was 2.8 per cent in 1972, 11.8 per centin 1984 and 5.8 per cent in 1989’. There was an increase over the periodin structural and frictional unemployment, but between 1984 and 1989 thereduction in demand related unemployment greatly exceeded the increase in theother forms of unemployment. This simplified approach to the behaviour of theeconomy using actual and potential output coupled with the different types ofunemployment gives managers a common-sense basis on which to assess thelikely impact of government policy measures.
4/12 Edinburgh Business School Strategic Planning
Module 4 / The Company and the Economy
4.3.3 Unemployment and Inflation
One reason why managers are sceptical of economics is that the debates onthe causes of inflation often seem to be contradictory, and mostly baffling to thenon-economist. In fact, the ideas which underlie the determinants of inflation arequite simple, but they are rarely explained properly in the contexts of politicaldebate or newspaper analysis.
It is a well known feature of market economies that when the economyapproaches full employment there is a pronounced tendency for supply bottle-necks to emerge, and as a result wage rates, capital costs and material pricestend to increase. Improvements in expectations fuelled by a reduction in theunemployment rate leads companies to bid up the price of resources in localmarkets, particularly where labour is concerned. For example, in the South Eastof England there was virtually no unemployment by 1990, and wage rates weresignificantly higher than in the rest of the country. On the other hand, whenthere is significant unemployment the wage rate is rarely observed to decline;it might be expected that when there is an excess supply of labour the priceof labour (i.e. the wage rate) might be expected to fall, leading to the eventualelimination of unemployment. However, the labour market does not operatelike that; wage rates are ‘sticky’ when labour market conditions suggest thatthere ‘should be’ a reduction. At the same time, there is excess demand forfinal goods and services, which tends to push prices up. Taken together, theseinfluences are known as ‘demand pull’ inflation; generally, people think of it interms of ‘too much money chasing too few goods’.
It is a reasonable proposition that the lower the unemployment rate, thehigher will be the wage inflation rate, and this relationship was investigated inthe 1950s by Phillips, who estimated the trade-off between the unemploymentrate and the wage inflation rate. Nowadays the relationship is usually expressedin terms of the inflation rate and the unemployment rate, and looks somethinglike that shown in Figure 4.2.
However, during the 1970s there was an onset of historically high unem-ployment and inflation rates at the same time, which the ideas underlying thePhillips curve suggested should not happen because as the unemployment rateincreased the inflation rate should fall. This became known as ‘stagflation’. Oneway of explaining what had happened was that the Phillips curve had shifted,and at the new position the trade-off between unemployment and inflation wasdifferent. This is shown in Figure 4.3.
But what might have caused the curve to move? And if the curve couldmove all over the place, did it have any operational use? The answer to thefirst question was that a new variable had entered the arena: expectations; onceinflation existed in the economy everyone expected that it would continue andmade their forward contracts accordingly, causing the inflation rate to carryon unchanged although the unemployment rate was greatly increased. Theanswer to the second question was that the Phillips curve was still important ifsomething could be done about expectations.
The policy objective therefore became to shift the Phillips curve back to theleft so that the trade-off between unemployment and inflation would occur ata lower level. Since this shift could only be accomplished by eliminating the
Strategic Planning Edinburgh Business School 4/13
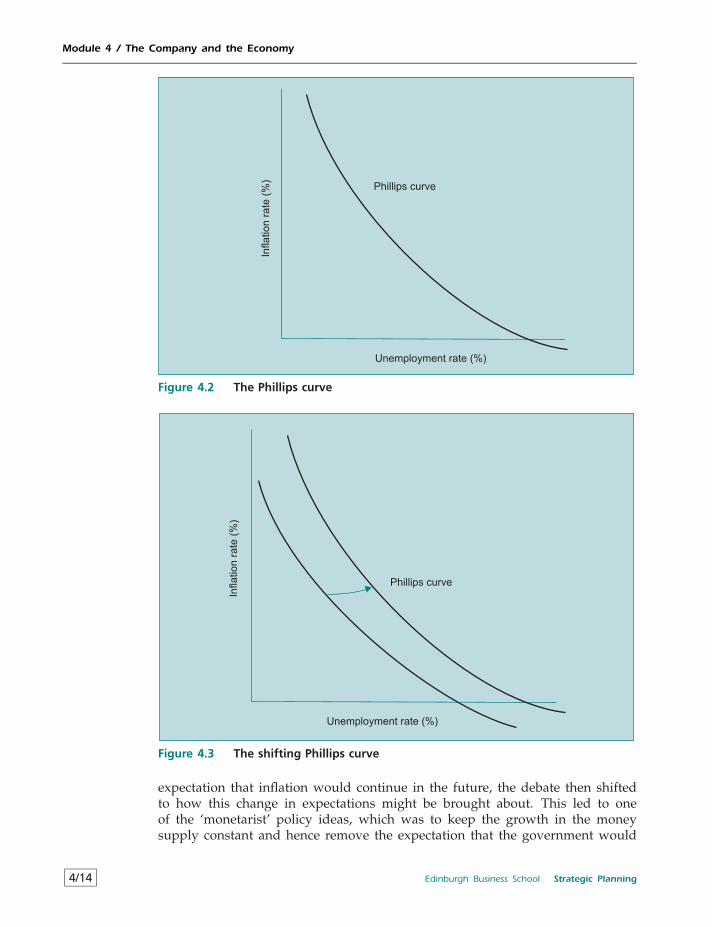
Module 4 / The Company and the Economy
Unemployment rate (%)
Phillips curve
Infla
tio
nra
te(%
)
Figure 4.2 The Phillips curve
Unemployment rate (%)
Inflation
rate
(%)
Phillips curve
Figure 4.3 The shifting Phillips curve
expectation that inflation would continue in the future, the debate then shiftedto how this change in expectations might be brought about. This led to oneof the ‘monetarist’ policy ideas, which was to keep the growth in the moneysupply constant and hence remove the expectation that the government would
4/14 Edinburgh Business School Strategic Planning
Module 4 / The Company and the Economy
accommodate inflation in the future. This policy has been greatly misrepresented,and in most people’s minds monetarists are probably associated with the ideaof reducing the money supply. This is incorrect, since the monetarist policywas directed towards removing the expectation that future inflation would beaccommodated by increases in the money supply, therefore the solution wasto make it clear that money supply would only be allowed to grow by apredetermined percentage each year. Another approach was simply to increasethe unemployment rate and wait until the inflation rate itself fell, and this wouldcertainly eliminate expectations of future inflation. A potential advantage of themonetarist approach was that it raised the possibility of eliminating expectationswithout incurring the high cost of unemployment.
The fact that general price increases are apt to set in quickly when theeconomy is at full employment output, combined with ‘sticky’ prices whenthere is unemployment, suggests that once inflation has been generated it willbe difficult to get rid of; this is made worse by the effect of expectations. Inorder to demonstrate the problems of reducing inflation, the following modelshows how prices and wages might be determined by the unemployment rateand inflationary expectations.
Wage inf ratet = a× (Inflation ratet−1)− b× (Unemployment ratet)Inflation ratet = c× (Inflation ratet−1)− d× (Unemployment ratet)
+ e× (Wage inflation ratet−1)
where a, b, c, d, e are parameters
The rationale for the two equations is as follows.The Wage Inflation Rate depends on the current unemployment rate plus an
allowance for last period’s Inflation Rate; this is because recent inflation ratesaffect current wage negotiations. The values of a and b depend on many factors,and many attempts have been made to estimate them. As an example, assumethat it was generally expected that the current inflation rate would be 80 per centof the previous year’s rate, and wage negotiators on average scaled down theirwage demands by 0.5 per cent for every 1 per cent increase in the unemploymentrate. If the inflation rate in the previous year was 12 per cent and the currentunemployment rate was 8 per cent, the current wage inflation rate would be:
Wage inf ratet = (0.8× 12)− (0.5× 8)= 5.6
This helps to explain why wage rates can continue to increase even duringa period of relatively high unemployment. In this example the unemploymentrate required to achieve a zero wage rate inflation rate would be 19.2 per cent.
The Inflation Rate depends on the current unemployment rate (demand pull),plus the amount of last period’s Wage Inflation Rate which has found its wayinto final prices through increased production costs (cost push), plus last period’sInflation Rate (expectations). It is immediately obvious that an increase in thecurrent unemployment rate will not eliminate a high inflation rate immediately,because the expectations and cost effects of previous inflation rates still have tobe worked out of the system. Assume that last year’s wage inflation rate was 10
Strategic Planning Edinburgh Business School 4/15
Module 4 / The Company and the Economy
per cent, and that 60 per cent of this will emerge in prices due to cost increasesin the current year; last year’s inflation rate was 12 per cent, the unemploymentrate was 8 per cent, and expectations are as above. This results in the followinginflation rate:
Inflation ratet = (0.8× 12)− (0.5× 8) + (0.6× 10)= 11.6
Clearly it will take some time before the unemployment rate of 8 per centeliminates inflation. In this model the only way to reduce expectations of futureinflation is to get rid of inflation now; if this is roughly what happens in reallife the implication is that inflation can only be countered by a period of highunemployment rates. In fact, this model, which is based on simple but notunrealistic assumptions, does capture the connection between unemployment,inflation and wage inflation rates in developed economies. It would be possibleto include the effect of a constant increase of the money supply in the model,but it is generally accepted that this is not a short term solution because it wouldtake some time to convince people that the central bank meant what it said.
From the strategic viewpoint managers should therefore be aware that oncefactor prices have increased because of inflation caused by excess demand, itwill be some time before the wage inflation rate is likely to fall. Managers withan understanding of the determinants of inflation would have recognised thatthe inflation which built up in the UK in the late 1980s was likely to remainfor some time, and would probably lead to government actions designed toeliminate excess demand. A likely consequence would be restrictive monetaryand fiscal policies leading to a significant reduction in the growth rate of GNP.This view of economic prospects could have important implications for thetiming of a company’s strategy. By the mid 1990s the UK inflation rate hadfallen to its lowest level for 30 years, and a great deal of debate centred onwhether inflationary expectations had finally been purged from the economy.Bear in mind that expectations do not operate only at the economy-wide level;it is a salutory lesson to sit back and imagine that you are about to make aforward contract of some sort in your own business; this could be renting aphotocopier for five years, agreeing with a supplier a fixed price for four years,or deciding whether to go for a fixed interest or variable interest loan. Whatallowance for inflation over the period would you build into your negotiatingstance? And why?
4.3.4 The International Economy
Few companies are immune from international factors. Those which sell directlyin foreign markets are continuously exposed to changes in trading conditions;under conditions of relatively free trade even those companies which sell onlyin domestic markets are open to competition from imports. Consequently, manycompanies are concerned with factors such as differences in local and foreigninflation rates, variable exchange rates, and the impact of economic conditionson competitive advantage.
4/16 Edinburgh Business School Strategic Planning
Module 4 / The Company and the Economy
Relative Inflation Rates
There can be substantial differences in the inflation rates in different countrieswhich are not compensated for by changes in the exchange rate. Thus it maynot be adequate simply to convert selling prices at the going exchange rate; forexample, if the domestic inflation rate has been higher than the foreign rate thismay result in entering foreign markets at too high a price.
There are potential implications for costs also. For example, if the domesticinflation rate appears likely to continue at a higher level than the foreign rate,domestic costs can be expected to increase relative to foreign costs. Thus whatmight appear to be an attractive foreign market at the moment may contain theseeds of disaster as relative costs increase.
Exchange Rate Fluctuations
The standard textbook analysis of the determinants of the exchange rate laysstress on the value of exports and imports, which determines the demand andsupply of the currency. For example, when U.S. exports exceed imports therewill be a balance of trade surplus, the demand for dollars will exceed the supplyof that currency, and the value of the dollar will appreciate. This in turn willcause exports to be more expensive to sell abroad, and imports to be relativelycheaper. The end result is that the value of exports will decline, the value ofimports will increase, and the balance of trade will deteriorate. However, intoday’s world the textbook explanation is obsolete. This is because the demandfor and supply of currencies is dominated by international capital flows, whichare currently about 80 times the value of payments for real trade flows. It istherefore possible for exchange rate changes to be independent of the balanceof trade. The factors which affect capital flows are relative interest rates andexpectations, and since neither of these can be predicted with any accuracy itstands to reason that exchange rates themselves cannot be predicted.
There is therefore no guarantee that differences in relative inflation rates willbe compensated for by changes in the exchange rate, and that the exchangerate will take care of cost disadvantages caused by a higher domestic pricelevel. Indeed, it has long been argued that exchange rates will consistently‘overshoot’ and ‘undershoot’ because of capital flows. For example, imaginea currency has been in equilibrium and the country suddenly experiences asurge in exports. The demand for the currency will increase, and there will bea revaluation. Observing this revaluation, owners of ‘hot money’ will purchasethe currency in the expectation of making a capital gain from the expectedcontinuing increase in price. The effect is that the currency will increase in valueby more than the amount necessary to balance the additional demand causedby the original increase in exports. Taking the effect further, the currency isnow ‘over-valued’, and there could be a significant reduction in exports as aresult, causing a devaluation because the demand for the currency has fallen.The effect on owners of ‘hot money’ is now reversed: they sell their holdings inorder to avoid a capital loss, with the result that the currency is devalued bymore than would be required by the reduction in exports, i.e. it ‘undershoots’.The international exchange system therefore has a built-in bias towards cyclical
Strategic Planning Edinburgh Business School 4/17
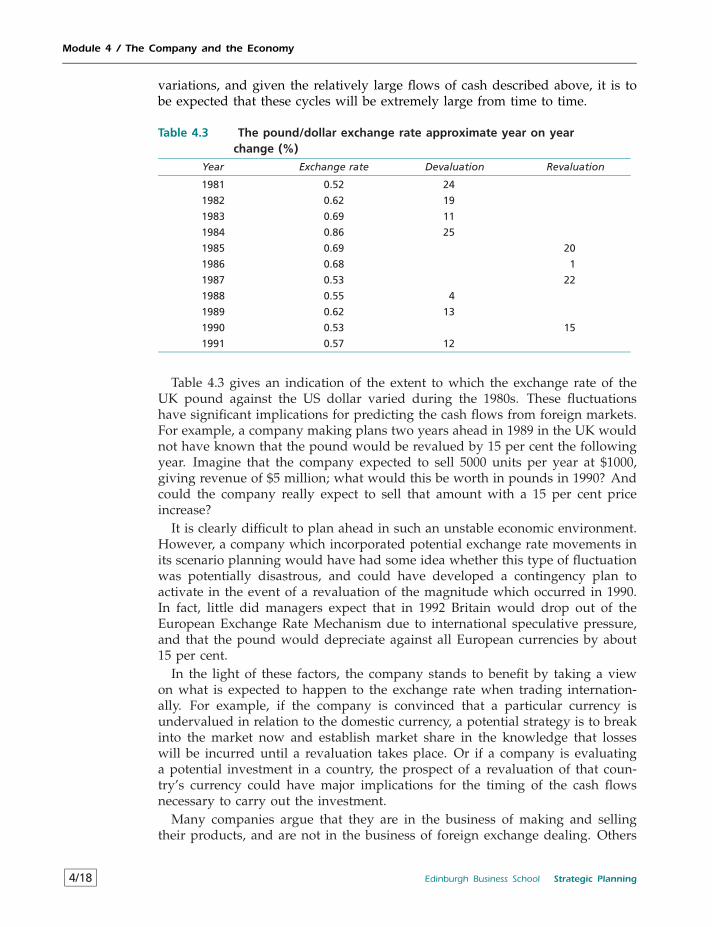
Module 4 / The Company and the Economy
variations, and given the relatively large flows of cash described above, it is tobe expected that these cycles will be extremely large from time to time.
Table 4.3 The pound/dollar exchange rate approximate year on yearchange (%)
Year Exchange rate Devaluation Revaluation
1981 0.52 24
1982 0.62 19
1983 0.69 11
1984 0.86 25
1985 0.69 20
1986 0.68 1
1987 0.53 22
1988 0.55 4
1989 0.62 13
1990 0.53 15
1991 0.57 12
Table 4.3 gives an indication of the extent to which the exchange rate of theUK pound against the US dollar varied during the 1980s. These fluctuationshave significant implications for predicting the cash flows from foreign markets.For example, a company making plans two years ahead in 1989 in the UK wouldnot have known that the pound would be revalued by 15 per cent the followingyear. Imagine that the company expected to sell 5000 units per year at $1000,giving revenue of $5 million; what would this be worth in pounds in 1990? Andcould the company really expect to sell that amount with a 15 per cent priceincrease?
It is clearly difficult to plan ahead in such an unstable economic environment.However, a company which incorporated potential exchange rate movements inits scenario planning would have had some idea whether this type of fluctuationwas potentially disastrous, and could have developed a contingency plan toactivate in the event of a revaluation of the magnitude which occurred in 1990.In fact, little did managers expect that in 1992 Britain would drop out of theEuropean Exchange Rate Mechanism due to international speculative pressure,and that the pound would depreciate against all European currencies by about15 per cent.
In the light of these factors, the company stands to benefit by taking a viewon what is expected to happen to the exchange rate when trading internation-ally. For example, if the company is convinced that a particular currency isundervalued in relation to the domestic currency, a potential strategy is to breakinto the market now and establish market share in the knowledge that losseswill be incurred until a revaluation takes place. Or if a company is evaluatinga potential investment in a country, the prospect of a revaluation of that coun-try’s currency could have major implications for the timing of the cash flowsnecessary to carry out the investment.
Many companies argue that they are in the business of making and sellingtheir products, and are not in the business of foreign exchange dealing. Others
4/18 Edinburgh Business School Strategic Planning
Module 4 / The Company and the Economy
justify ignoring possible future changes on the grounds that they do not seewhat they can do about them. However, a decision to ignore the problem ofuncertain exchange rates is equivalent to adopting the view that there will beno changes in the future; this is as much a response as a forecast that changeswill occur.
There are various methods of hedging bets in relation to exchange rates, forexample buying currency forward; this makes it possible to predict some futurecash flows, but it means that the company will not gain from any favourablemovements in the exchange rate. It is not possible for a company to coverfuture exchange rates entirely, because cash flows will extend for years in thefuture, and these cash flows are difficult to predict with any degree of certainty.There is no reason to view exchange rate risks as being different from theother uncertainties facing the company, and in the current volatile state of theinternational economy it makes sense to attempt to identify risks and incorporatethem into decision making.
As the risks inherent in an unstable international monetary system haveincreased, a great deal of ingenuity has been applied to finding ways of hedgingthese risks. The whole world knows about the activities of Nick Leeson, the‘rogue’ Barings bank trader who lost £800 million on the foreign exchangemarket and destroyed one of Britain’s oldest and most respected banks in theprocess; Leeson was able to do what he did because his superiors had nounderstanding of how the market in options worked. The risks generated by theforeign exchange markets affect everyone, for example the Barings bondholderslost everything and had no idea that their cash was at risk to such an extent.
The Competitive Advantage of Nations
The role which national location can play in influencing the competitive positionof companies was developed by Michael Porter1 who pointed out that competi-tive advantage is often strongly concentrated in a few locations; for example, theclustering of electrical distribution equipment in Sweden, tunnelling equipmentin Switzerland, large diesel trucks in the USA and microwaves in Japan. Porteridentified several ways in which a nation can affect the competitive advantageof individual companies.
• A firm’s home nation plays a critical role in shaping managers’ perceptionsabout the opportunities that can be exploited by supporting the accumula-tion of valuable resources and capabilities and creating pressures on the firmto innovate, invest and improve over time. The impact of the history andenvironment of a country is often obvious. Scotland has had a long historyof industrial decline and the development of a dependence ethos fosteredby many years of misguided government aid policies. As a result the rateof new business start ups is roughly half the rate in England; this is inmarked contrast to a small state such as Singapore, where the governmenthas been at least as interventionist but in a totally different way.
• It is the existence of conditions which contribute to sustaining competitiveadvantage in a dynamic sense which is important. A country can offerfavourable factor conditions, in particular those that are highly specialisedto the needs of particular industries. But this is only part of the story; it
Strategic Planning Edinburgh Business School 4/19
Module 4 / The Company and the Economy
can also offer favourable demand conditions in the form of sophisticatedhome consumers who continually force firms to produce the right things.The willingness of British governments to bail out ‘lame ducks’ in manu-facturing industries contributed to the lack of incentive to invest in theinnovations which would sustain competitive advantage. One of the dan-gers of protectionism is that local companies have little incentive to retaincompetitive advantage; the current situation in India, where British cars andmotorcycles of the 1970s are still produced and sold in large numbers, isan illustration of how consumers as well as companies stand to lose froma lack of international competition. The most extreme example of all isthe plight of companies in the Eastern Bloc economies which had been soconditioned by their national environment that the notions of profitabilityand cost control were unknown.
The impact of the national environment on the competitiveness of individualcompanies is largely determined by the following influences:
• Domestic factor conditions• Related and supporting industries• Demand conditions• Strategy, structure and rivalry
all of which interact to affect the competitiveness of individual companies.
• Factor conditions: highly specialised resources develop in different countriesover time; the development of computer businesses in Silicon Valley inCalifornia meant that there was a large pool of highly skilled manpower.
• Related and supporting industries: all types of computer related industries areto be found in Silicon Valley; few computer manufacturers would considersetting up business in Spain, for example, where there is a lack of accessiblesuppliers.
• Demand conditions: sophisticated consumers force companies to innovateand shape their market orientation. The dominance of Japanese camerasis partly explained by the popularity of amateur photography in Japan;the success of German motor manufacturers in producing quality cars asopposed to mass produced cheap cars is partly due to the German respectfor quality engineering.
• Strategy, structure and rivalry: a country which fosters competition at homepotentially breeds a strong core of companies which is capable of competingin the international arena. There are few instances of powerful internationalcompanies emerging from protected or subsidised home markets. The highlyprotected British car industry was unable to compete in the 1970s andvirtually ceased to exist. Japanese companies, which had been subject tointense home competition, invested heavily in new car plants in Britain inthe 1980s.
When assessing its international competitive position, a company needs todetermine whether its competitive advantage is due to country specific or com-pany specific attributes. This is of fundamental importance to the way in whichit can exploit foreign markets.
4/20 Edinburgh Business School Strategic Planning
Module 4 / The Company and the Economy
• If the advantage is country specific then foreign markets can be exploited byexporting. This is because the impact of the national environment discussedabove which will become apparent in a cost advantage.
• If the advantage is company specific it can invest in the country concernedprovided that these advantages can be transfered from one country toanother. This partly explains why Japanese car makers invested heavily inBritain: their management skills and production techniques were companyspecific and hence transferable.
The problem is that it may not be obvious, even to the company itself, howmuch of its competitive advantage is due to the two influences. In addition,exchange rate uncertainty can influence locational decisions because producingin the country where the company sells its products insulates it from potentiallyunfavourable exchange rate movements. Decision makers thus have to trade offperceived competitive advantages against exchange rate risks.
4.4 Forecasting: What Will Happen Next?From the strategy viewpoint, the main reason for trying to understand what ishappening in the economy is to provide a basis for predicting the future courseof events. Since no one can look into the future with any degree of certainty, thisamounts to trying to ascertain what is likely to happen. A cynical manager mightask, if it is impossible to predict the future with accuracy, is there really anypoint to making forecasts? The answer to this is that even vague predictions canbe valuable. For example, for companies whose products are highly GNP elasticit makes a difference if national income is likely to increase or decrease; it followsthat it would be useful to predict whether national income is likely to increaseor decrease next year. In other words, the direction of change is important in itsown right; it may be possible to go further and predict the dimension of change,but often the very fact of predicting an increase or a decrease is the majordeterminant of strategy. Any action which has future consequences takes a viewof future events, if only by default; therefore it is better to be explicit about whatis thought likely to happen. For example, during the second half of 1991 in theUK politicians repeatedly claimed that the preconditions for economic recoveryexisted and that the country could look forward to 1992 with a great deal ofconfidence. However, it was never made clear what these preconditions actuallywere, and a manager who understood the basic principles of macroeconomicswould have treated such claims with a great deal of caution. As it turned out, ittook another three years for significant improvements in the economy to becomeapparent.
One problem facing managers is the number of forecasts available. Practicallyevery day professional forecasters issue predictions of what is going to happennext week, month or year: some are academically prestigious, such as theLondon Business School, some are issued by well known stockbrokers andcan affect the behaviour of the stock market. Can any use be made of theseforecasts? The simple answer is no, because all forecasters share the same poortrack record. Some are right in some cases, others are right in others, and thereis always someone ready to claim that their institution successfully predicted
Strategic Planning Edinburgh Business School 4/21
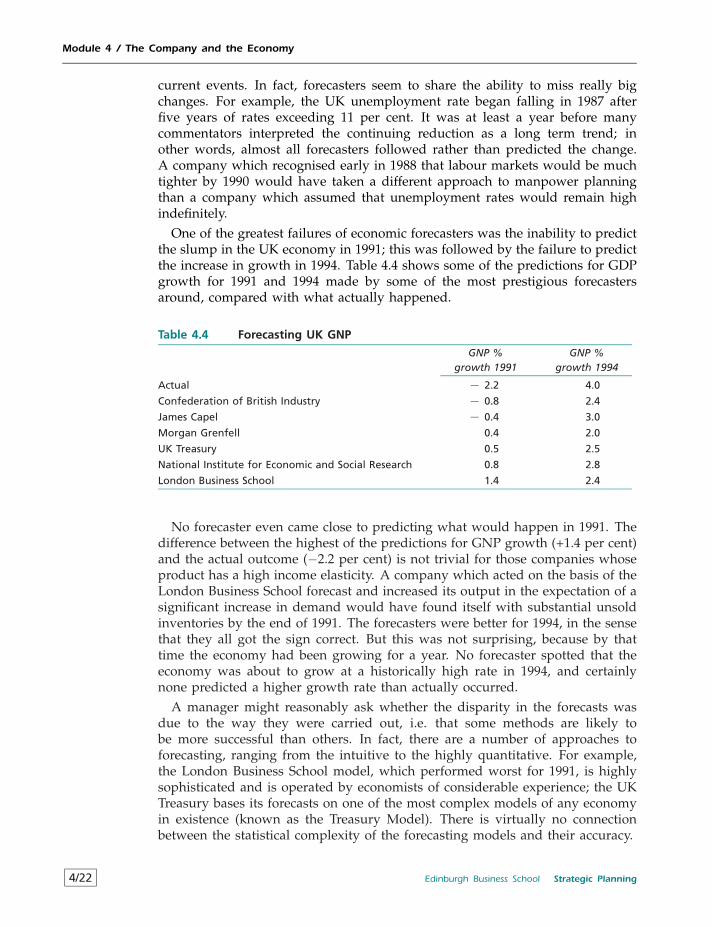
Module 4 / The Company and the Economy
current events. In fact, forecasters seem to share the ability to miss really bigchanges. For example, the UK unemployment rate began falling in 1987 afterfive years of rates exceeding 11 per cent. It was at least a year before manycommentators interpreted the continuing reduction as a long term trend; inother words, almost all forecasters followed rather than predicted the change.A company which recognised early in 1988 that labour markets would be muchtighter by 1990 would have taken a different approach to manpower planningthan a company which assumed that unemployment rates would remain highindefinitely.
One of the greatest failures of economic forecasters was the inability to predictthe slump in the UK economy in 1991; this was followed by the failure to predictthe increase in growth in 1994. Table 4.4 shows some of the predictions for GDPgrowth for 1991 and 1994 made by some of the most prestigious forecastersaround, compared with what actually happened.
Table 4.4 Forecasting UK GNP
GNP %growth 1991
GNP %growth 1994
Actual − 2.2 4.0
Confederation of British Industry − 0.8 2.4
James Capel − 0.4 3.0
Morgan Grenfell 0.4 2.0
UK Treasury 0.5 2.5
National Institute for Economic and Social Research 0.8 2.8
London Business School 1.4 2.4
No forecaster even came close to predicting what would happen in 1991. Thedifference between the highest of the predictions for GNP growth (+1.4 per cent)and the actual outcome (−2.2 per cent) is not trivial for those companies whoseproduct has a high income elasticity. A company which acted on the basis of theLondon Business School forecast and increased its output in the expectation of asignificant increase in demand would have found itself with substantial unsoldinventories by the end of 1991. The forecasters were better for 1994, in the sensethat they all got the sign correct. But this was not surprising, because by thattime the economy had been growing for a year. No forecaster spotted that theeconomy was about to grow at a historically high rate in 1994, and certainlynone predicted a higher growth rate than actually occurred.
A manager might reasonably ask whether the disparity in the forecasts wasdue to the way they were carried out, i.e. that some methods are likely tobe more successful than others. In fact, there are a number of approaches toforecasting, ranging from the intuitive to the highly quantitative. For example,the London Business School model, which performed worst for 1991, is highlysophisticated and is operated by economists of considerable experience; the UKTreasury bases its forecasts on one of the most complex models of any economyin existence (known as the Treasury Model). There is virtually no connectionbetween the statistical complexity of the forecasting models and their accuracy.
4/22 Edinburgh Business School Strategic Planning
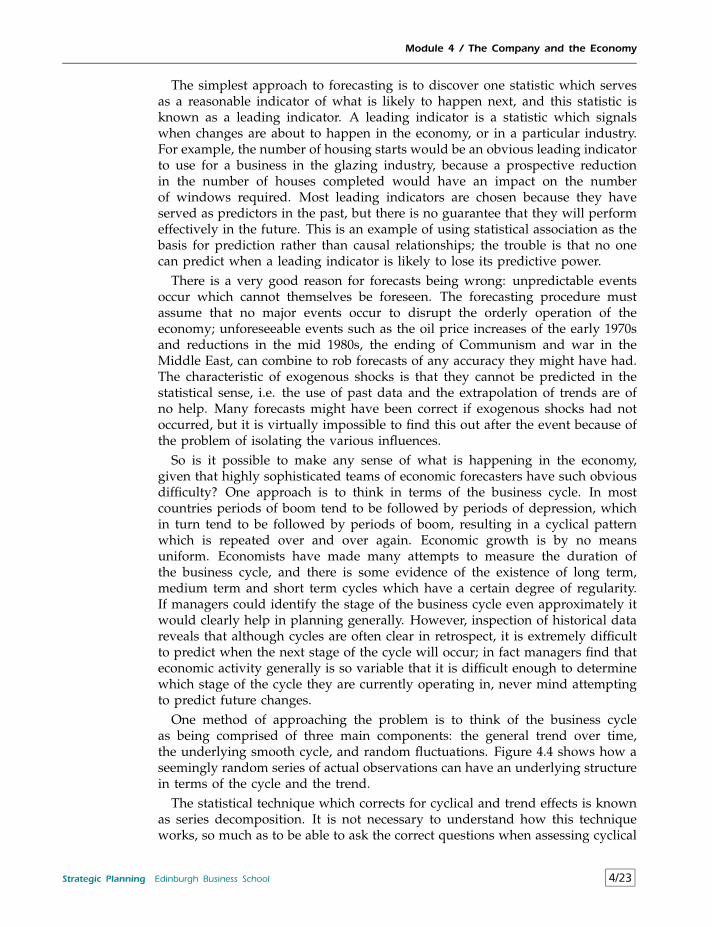
Module 4 / The Company and the Economy
The simplest approach to forecasting is to discover one statistic which servesas a reasonable indicator of what is likely to happen next, and this statistic isknown as a leading indicator. A leading indicator is a statistic which signalswhen changes are about to happen in the economy, or in a particular industry.For example, the number of housing starts would be an obvious leading indicatorto use for a business in the glazing industry, because a prospective reductionin the number of houses completed would have an impact on the numberof windows required. Most leading indicators are chosen because they haveserved as predictors in the past, but there is no guarantee that they will performeffectively in the future. This is an example of using statistical association as thebasis for prediction rather than causal relationships; the trouble is that no onecan predict when a leading indicator is likely to lose its predictive power.
There is a very good reason for forecasts being wrong: unpredictable eventsoccur which cannot themselves be foreseen. The forecasting procedure mustassume that no major events occur to disrupt the orderly operation of theeconomy; unforeseeable events such as the oil price increases of the early 1970sand reductions in the mid 1980s, the ending of Communism and war in theMiddle East, can combine to rob forecasts of any accuracy they might have had.The characteristic of exogenous shocks is that they cannot be predicted in thestatistical sense, i.e. the use of past data and the extrapolation of trends are ofno help. Many forecasts might have been correct if exogenous shocks had notoccurred, but it is virtually impossible to find this out after the event because ofthe problem of isolating the various influences.
So is it possible to make any sense of what is happening in the economy,given that highly sophisticated teams of economic forecasters have such obviousdifficulty? One approach is to think in terms of the business cycle. In mostcountries periods of boom tend to be followed by periods of depression, whichin turn tend to be followed by periods of boom, resulting in a cyclical patternwhich is repeated over and over again. Economic growth is by no meansuniform. Economists have made many attempts to measure the duration ofthe business cycle, and there is some evidence of the existence of long term,medium term and short term cycles which have a certain degree of regularity.If managers could identify the stage of the business cycle even approximately itwould clearly help in planning generally. However, inspection of historical datareveals that although cycles are often clear in retrospect, it is extremely difficultto predict when the next stage of the cycle will occur; in fact managers find thateconomic activity generally is so variable that it is difficult enough to determinewhich stage of the cycle they are currently operating in, never mind attemptingto predict future changes.
One method of approaching the problem is to think of the business cycleas being comprised of three main components: the general trend over time,the underlying smooth cycle, and random fluctuations. Figure 4.4 shows how aseemingly random series of actual observations can have an underlying structurein terms of the cycle and the trend.
The statistical technique which corrects for cyclical and trend effects is knownas series decomposition. It is not necessary to understand how this techniqueworks, so much as to be able to ask the correct questions when assessing cyclical
Strategic Planning Edinburgh Business School 4/23
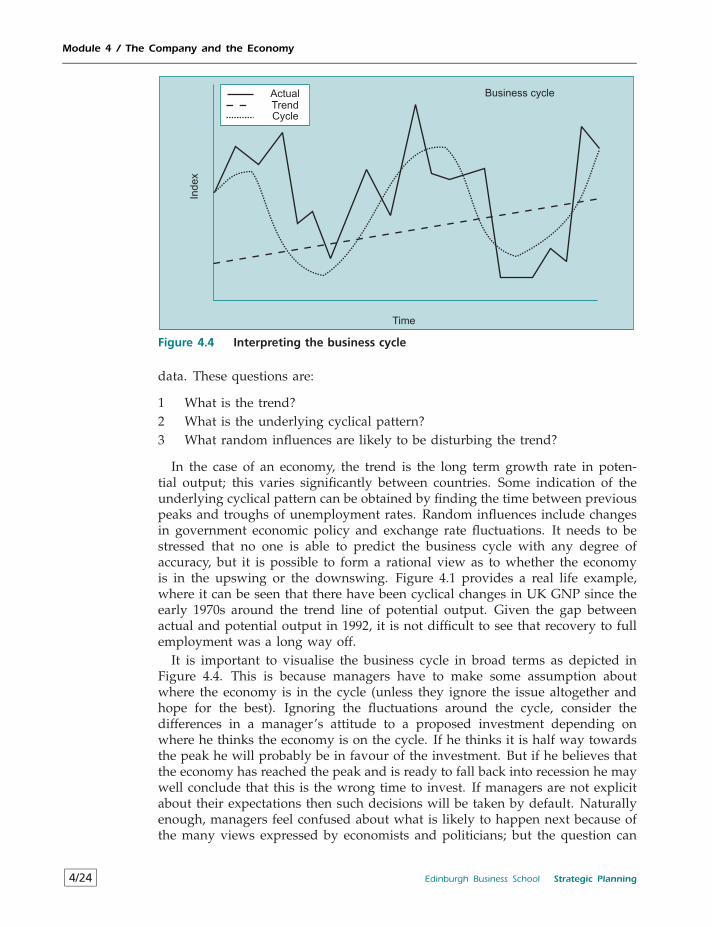
Module 4 / The Company and the Economy
Index
Business cycle
Time
ActualTrendCycle
Figure 4.4 Interpreting the business cycle
data. These questions are:
1 What is the trend?2 What is the underlying cyclical pattern?3 What random influences are likely to be disturbing the trend?
In the case of an economy, the trend is the long term growth rate in poten-tial output; this varies significantly between countries. Some indication of theunderlying cyclical pattern can be obtained by finding the time between previouspeaks and troughs of unemployment rates. Random influences include changesin government economic policy and exchange rate fluctuations. It needs to bestressed that no one is able to predict the business cycle with any degree ofaccuracy, but it is possible to form a rational view as to whether the economyis in the upswing or the downswing. Figure 4.1 provides a real life example,where it can be seen that there have been cyclical changes in UK GNP since theearly 1970s around the trend line of potential output. Given the gap betweenactual and potential output in 1992, it is not difficult to see that recovery to fullemployment was a long way off.
It is important to visualise the business cycle in broad terms as depicted inFigure 4.4. This is because managers have to make some assumption aboutwhere the economy is in the cycle (unless they ignore the issue altogether andhope for the best). Ignoring the fluctuations around the cycle, consider thedifferences in a manager’s attitude to a proposed investment depending onwhere he thinks the economy is on the cycle. If he thinks it is half way towardsthe peak he will probably be in favour of the investment. But if he believes thatthe economy has reached the peak and is ready to fall back into recession he maywell conclude that this is the wrong time to invest. If managers are not explicitabout their expectations then such decisions will be taken by default. Naturallyenough, managers feel confused about what is likely to happen next because ofthe many views expressed by economists and politicians; but the question can
4/24 Edinburgh Business School Strategic Planning
Module 4 / The Company and the Economy
still be posed: ‘is this a sensible course of action given our particular expectationof what is going to happen to GNP in the next two years?’
4.5 PEST AnalysisIt is now clear that trends and events in the national and international economyneed to be monitored because of their impact on the company. It is also neces-sary to be able to interpret forecasts, because every decision undertaken impliessome assumptions about the future, so it is as well to make them explicit. Butthe macroeconomy is only one dimension of the overall environment; others aresocial changes, changes in tastes and preferences, technological changes, ecolog-ical, political and so on. The checklist of Political Economic Social Technologicalfactors provides a useful framework for assessing these influences; at one levelthe PEST analysis is nothing more than four lists, and as such is of little value.But the identification of a range of relevant factors, and an analysis of therelationships among them, can provide important insights into the company’sprospects.
• Political: changes in the political climate are usually relatively slow but theycan have far reaching implications for company operations. For example,the change from a largely right wing to left wing government may heraldthe emergence of stricter laws on monopoly behaviour and relaxation oflabour laws in favour of employees.
• Economic: many relevant macroeconomic influences have been discussedin this Module. The economic effects of factors at the market level will bediscussed in the next Module.
• Social: Many changes in society can have impacts on the company; forexample, changes in the demographic composition of the population haveimplications for manufacturers of baby products. Changes in social norms,such as attitudes to marriage, divorce and to the optimum number ofchildren in a family, have implications for many consumer products. Theinformation tends to be qualitative rather than quantitative, and there is nospecific conceptual structure involved; however, an awareness of societalchanges is central to wide strategy issues, and the identification of potentialopportunities and threats. Social analysis is complementary to economicanalysis, in that economic factors operate within the given social structure;for example, predicting social changes can help to explain why demandcurves are likely to shift in the future. The fact that information is qualitativedoes not mean that it cannot be used in an analytical fashion. Typically,qualitative information will indicate whether something is likely to increase,decrease, or remain unchanged; knowing about the direction of change canbe extremely valuable on its own, independent of the expected dimensionof change. Opportunities may lie in the anticipation of new trends, whilethreats may be identified in factors such as changing fashions.
• Technological: technological change is a continuous process, but it can alsohappen in short bursts, for example, the impact of new technologies suchas cellular telephone systems and the internet has fundamental implicationsfor the way in which business is conducted. While it is important to see the
Strategic Planning Edinburgh Business School 4/25
Module 4 / The Company and the Economy
relevance of new technologies at an early stage, it is also necessary to beaware of the continuing nature of technological change in most industries;unless new methods and techniques are incorporated into company sys-tems, and the company is willing to invest in new approaches, competitiveadvantage can disappear with alarming speed.
To show how PEST analysis can be made specific consider the case of amonopolistic electricity utility which has recently been privatised.
Political• Recent elections resulted in a new government which is more inclined to
stricter regulation and opening up the market.• The new government is committed to subsidising domestic house insulation.• There is increasing international political agreement to cut pollution.
Economic• New gas fields are being opened up with implications for the price of gas.• There are several indications of a slow down in economic activity which
will have a significant effect on industrial demand for energy of all types.• The price of coal on international markets has started to increase.
Social• There is a rising public awareness of the need to conserve energy.• The aversion to nuclear energy is increasing.• The number of single occupancy households is predicted to increase by 25%
over the next two decades.
Technological• Improved techniques for insulating houses are being developed.• Studies have shown that alternative energy sources such as wind, water
and solar power are now cost effective.
If the company had confined its environmental analysis to the economicdimension alone, it would have been concerned about the imminent economicslow down, competition from gas and higher costs of coal. But the wider PESTanalysis shows that the company is likely to be squeezed by political eventsand by changing social trends which are possibly going to find expressionthrough improved insulation and alternative power sources. In the longer termthe outlook for the company looks troubled and now is the time to considerstrategic responses.
4.6 Environmental ScanningThe PEST analysis deals with what is known about the environment, but it ispossible to take this a step forward by speculating about the future, given thelimited information available at the moment. For example in the early 1980sfew computer industry companies even imagined the importance of personalcomputers and the impact it would have on their industry. The end of the Cold
4/26 Edinburgh Business School Strategic Planning
Module 4 / The Company and the Economy
War in 1990 and the destruction of the Berlin Wall heralded a major change intrading relationships, but who would have predicted that ten years after the endof communism Russia would still be in severe financial trouble? Environmentalscanning is an attempt to predict these changes and assess their implications forthe company.
In effect this involves monitoring a wider range of variables than wouldnormally be included in the PEST analysis to raise managers’ consciousnessof what the future might hold and where opportunities and threats are likelyto emerge. Environmental scanning is in a sense an attempt to predict wellbeyond the extrapolations of short term forecasting and market research typeinformation; it is therefore bound to be highly subjective, and it could be arguedthat it is so speculative that it serves no useful purpose. On the other hand, itcan be argued that it serves as a kind of early warning system which, when itis correct, easily justifies the resources which it uses.
4.7 ScenariosOnce some projections of possible futures have been made they can be used asthe basis of scenarios; this has already been introduced as a component of gapanalysis and in the discussion about the impact of changes in GNP on revenuesand costs. It needs to be reiterated that a scenario is not a forecast, but it is anattempt to investigate the implications of possible futures for the company. Insome instances it may be based on a short run issue, such as the likely impactof a price reduction by a major competitor; the potential impact on market shareand the cash flow implications can be mapped out, or the implications for thecompany’s profitability of matching the price reduction. A long term scenario ismuch more speculative, and many managers doubt their value. However, putyourself in the position of a European financial services company in 1990 andvisualise the implications of inflation falling to zero by the year 2000. Financialproducts such as insurance policies are typically sold on the basis of nominalinterest rates. But if inflation disappears the interest rate will tend to fall to itsreal long term level of about 3%. When the inflation rate fell to almost zeroby 1998 most insurance companies were unprepared for the impact on expectedpayouts. Furthermore, inflation was not the only major change in the 1990s;direct telephone selling had altered the basis of competition in the market formany financial products. The very fact of thinking about these potential futurescould have an impact on the company’s long term strategic planning.
4.8 The Economy and ProfitabilityIt has been argued that the state of the economy has significant implicationsfor the operation of the individual company, and consequently for its strategy.Because of this the main macroeconomic concepts relating to the determina-tion of economic activity, and related issues such as the inflation rate and theexchange rate, have been discussed in some detail. The various factors affectingthe company can now be brought together to identify the likely impact of eco-nomic conditions on company operations; these include the effects on sales andrevenues, competitive conditions and input costs.
Strategic Planning Edinburgh Business School 4/27
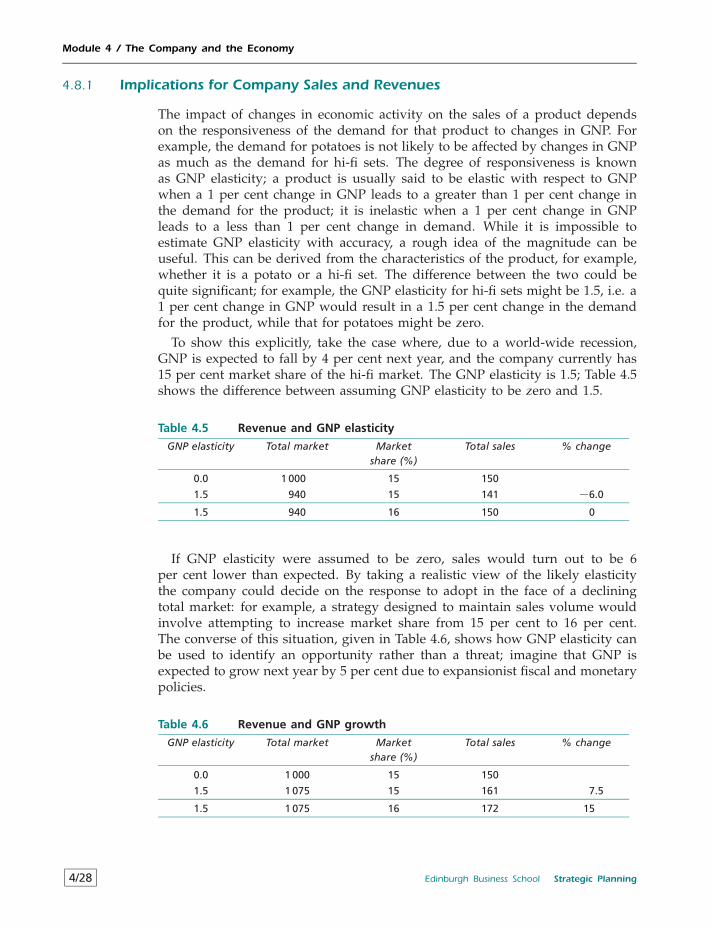
Module 4 / The Company and the Economy
4.8.1 Implications for Company Sales and Revenues
The impact of changes in economic activity on the sales of a product dependson the responsiveness of the demand for that product to changes in GNP. Forexample, the demand for potatoes is not likely to be affected by changes in GNPas much as the demand for hi-fi sets. The degree of responsiveness is knownas GNP elasticity; a product is usually said to be elastic with respect to GNPwhen a 1 per cent change in GNP leads to a greater than 1 per cent change inthe demand for the product; it is inelastic when a 1 per cent change in GNPleads to a less than 1 per cent change in demand. While it is impossible toestimate GNP elasticity with accuracy, a rough idea of the magnitude can beuseful. This can be derived from the characteristics of the product, for example,whether it is a potato or a hi-fi set. The difference between the two could bequite significant; for example, the GNP elasticity for hi-fi sets might be 1.5, i.e. a1 per cent change in GNP would result in a 1.5 per cent change in the demandfor the product, while that for potatoes might be zero.
To show this explicitly, take the case where, due to a world-wide recession,GNP is expected to fall by 4 per cent next year, and the company currently has15 per cent market share of the hi-fi market. The GNP elasticity is 1.5; Table 4.5shows the difference between assuming GNP elasticity to be zero and 1.5.
Table 4.5 Revenue and GNP elasticity
GNP elasticity Total market Marketshare (%)
Total sales % change
0.0 1 000 15 150
1.5 940 15 141 −6.0
1.5 940 16 150 0
If GNP elasticity were assumed to be zero, sales would turn out to be 6per cent lower than expected. By taking a realistic view of the likely elasticitythe company could decide on the response to adopt in the face of a decliningtotal market: for example, a strategy designed to maintain sales volume wouldinvolve attempting to increase market share from 15 per cent to 16 per cent.The converse of this situation, given in Table 4.6, shows how GNP elasticity canbe used to identify an opportunity rather than a threat; imagine that GNP isexpected to grow next year by 5 per cent due to expansionist fiscal and monetarypolicies.
Table 4.6 Revenue and GNP growth
GNP elasticity Total market Marketshare (%)
Total sales % change
0.0 1 000 15 150
1.5 1 075 15 161 7.5
1.5 1 075 16 172 15
4/28 Edinburgh Business School Strategic Planning
Module 4 / The Company and the Economy
Using a reasonable estimate of GNP elasticity, it could be predicted thatsales would be 7.5 per cent higher than if the elasticity were assumed to bezero; an opportunity which presents itself is to grab a slightly larger marketshare in the growing market, leading to a 15 per cent growth in sales. Whenthe economy starts to grow strongly, an effective response might well be toconcentrate resources on those products with a relatively high GNP elasticity.
The GNP elasticity does not tell the whole story about the connection betweenGNP and demand for a product. It is not only the size of GNP which is impor-tant, but also the distribution of national expenditure among its components.For example, a reduction in income tax, which leads to an increase in dispos-able incomes and hence to consumption expenditure, may be accompanied bya reduction in government expenditure due to the end of the Cold War, thenet effect of which is to leave GNP unchanged. Consequently, those industrieswhich rely on government expenditure on defence, such as the electronics indus-try, may find market size reduced, while those in consumer goods industries,such as TV sets, may find market size increased. At the same time, the govern-ment may have increased the rate of interest, which would affect the demand forinvestment goods. It is therefore possible for individual sectors of the economyto have a falling market size despite a relatively high level of growth in theeconomy as a whole.
4.8.2 Competitive Reaction and the Economic Environment
Having identified the various relationships between change in GNP and demandfor the product and the likely consequences for the company, attention canthen be turned to how competitors will behave in the light of the changingcircumstances. If competitors have not carried out analyses of GNP trends andelasticities, the company may have an advantage by being the first to takedefensive action in the face of a potentially decreasing market, or by being thefirst to take the initiative to take advantage of a predicted increase in marketsize. However, if competitors do have the same kind of information at theirdisposal, will they not react in the same way as our company? For example, inthe declining market case shown above, competitors may attempt to protect theirsales by reducing price in order to increase market share. Since it is impossiblefor all companies to increase market share, some company is bound to suffer asa result. It is likely that the outcome would be a general reduction in the priceof the product.
Consider what happens to the company which had not attempted to makepredictions and found itself in a declining market in which competitors areacting aggressively in order to protect their total sales volume. The companywould then have a falling market share in a declining market with a decreasingcompetitive price. The combined effect of these influences could be catastrophicdespite the fact that the reductions in total market, market share and price wererelatively small individually. This can be illustrated as shown in Table 4.7.
In Period 2a, despite the fact that the total market fell by only 5 per cent,market share by 2 per cent and price by 10 per cent, the cumulative effect ontotal revenue was a reduction of 23 per cent. Thus a set of changes in market and
Strategic Planning Edinburgh Business School 4/29
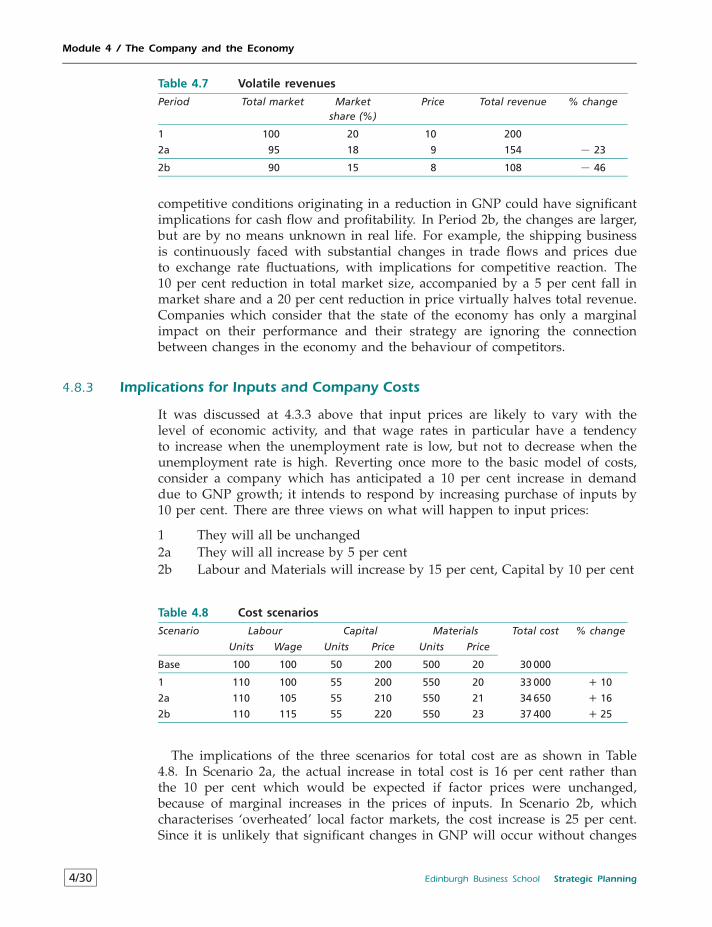
Module 4 / The Company and the Economy
Table 4.7 Volatile revenues
Period Total market Marketshare (%)
Price Total revenue % change
1 100 20 10 200
2a 95 18 9 154 − 23
2b 90 15 8 108 − 46
competitive conditions originating in a reduction in GNP could have significantimplications for cash flow and profitability. In Period 2b, the changes are larger,but are by no means unknown in real life. For example, the shipping businessis continuously faced with substantial changes in trade flows and prices dueto exchange rate fluctuations, with implications for competitive reaction. The10 per cent reduction in total market size, accompanied by a 5 per cent fall inmarket share and a 20 per cent reduction in price virtually halves total revenue.Companies which consider that the state of the economy has only a marginalimpact on their performance and their strategy are ignoring the connectionbetween changes in the economy and the behaviour of competitors.
4.8.3 Implications for Inputs and Company Costs
It was discussed at 4.3.3 above that input prices are likely to vary with thelevel of economic activity, and that wage rates in particular have a tendencyto increase when the unemployment rate is low, but not to decrease when theunemployment rate is high. Reverting once more to the basic model of costs,consider a company which has anticipated a 10 per cent increase in demanddue to GNP growth; it intends to respond by increasing purchase of inputs by10 per cent. There are three views on what will happen to input prices:
1 They will all be unchanged2a They will all increase by 5 per cent2b Labour and Materials will increase by 15 per cent, Capital by 10 per cent
Table 4.8 Cost scenarios
Scenario Labour Capital Materials Total cost % change
Units Wage Units Price Units Price
Base 100 100 50 200 500 20 30 000
1 110 100 55 200 550 20 33 000 + 10
2a 110 105 55 210 550 21 34 650 + 16
2b 110 115 55 220 550 23 37 400 + 25
The implications of the three scenarios for total cost are as shown in Table4.8. In Scenario 2a, the actual increase in total cost is 16 per cent rather thanthe 10 per cent which would be expected if factor prices were unchanged,because of marginal increases in the prices of inputs. In Scenario 2b, whichcharacterises ‘overheated’ local factor markets, the cost increase is 25 per cent.Since it is unlikely that significant changes in GNP will occur without changes
4/30 Edinburgh Business School Strategic Planning
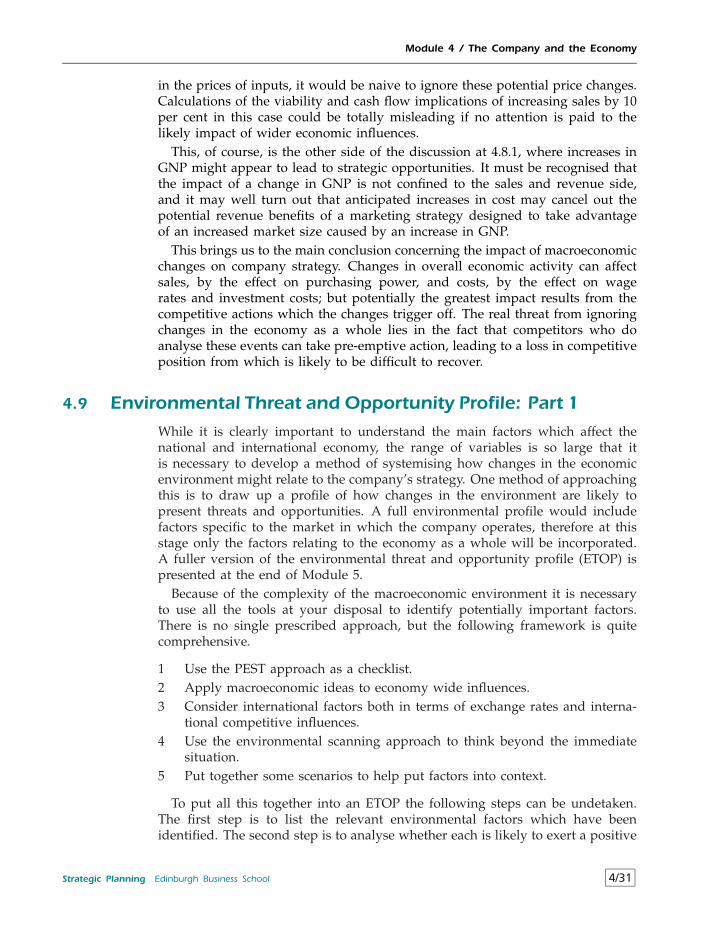
Module 4 / The Company and the Economy
in the prices of inputs, it would be naive to ignore these potential price changes.Calculations of the viability and cash flow implications of increasing sales by 10per cent in this case could be totally misleading if no attention is paid to thelikely impact of wider economic influences.
This, of course, is the other side of the discussion at 4.8.1, where increases inGNP might appear to lead to strategic opportunities. It must be recognised thatthe impact of a change in GNP is not confined to the sales and revenue side,and it may well turn out that anticipated increases in cost may cancel out thepotential revenue benefits of a marketing strategy designed to take advantageof an increased market size caused by an increase in GNP.
This brings us to the main conclusion concerning the impact of macroeconomicchanges on company strategy. Changes in overall economic activity can affectsales, by the effect on purchasing power, and costs, by the effect on wagerates and investment costs; but potentially the greatest impact results from thecompetitive actions which the changes trigger off. The real threat from ignoringchanges in the economy as a whole lies in the fact that competitors who doanalyse these events can take pre-emptive action, leading to a loss in competitiveposition from which is likely to be difficult to recover.
4.9 Environmental Threat and Opportunity Profile: Part 1
While it is clearly important to understand the main factors which affect thenational and international economy, the range of variables is so large that itis necessary to develop a method of systemising how changes in the economicenvironment might relate to the company’s strategy. One method of approachingthis is to draw up a profile of how changes in the environment are likely topresent threats and opportunities. A full environmental profile would includefactors specific to the market in which the company operates, therefore at thisstage only the factors relating to the economy as a whole will be incorporated.A fuller version of the environmental threat and opportunity profile (ETOP) ispresented at the end of Module 5.
Because of the complexity of the macroeconomic environment it is necessaryto use all the tools at your disposal to identify potentially important factors.There is no single prescribed approach, but the following framework is quitecomprehensive.
1 Use the PEST approach as a checklist.2 Apply macroeconomic ideas to economy wide influences.3 Consider international factors both in terms of exchange rates and interna-
tional competitive influences.4 Use the environmental scanning approach to think beyond the immediate
situation.5 Put together some scenarios to help put factors into context.
To put all this together into an ETOP the following steps can be undetaken.The first step is to list the relevant environmental factors which have beenidentified. The second step is to analyse whether each is likely to exert a positive
Strategic Planning Edinburgh Business School 4/31
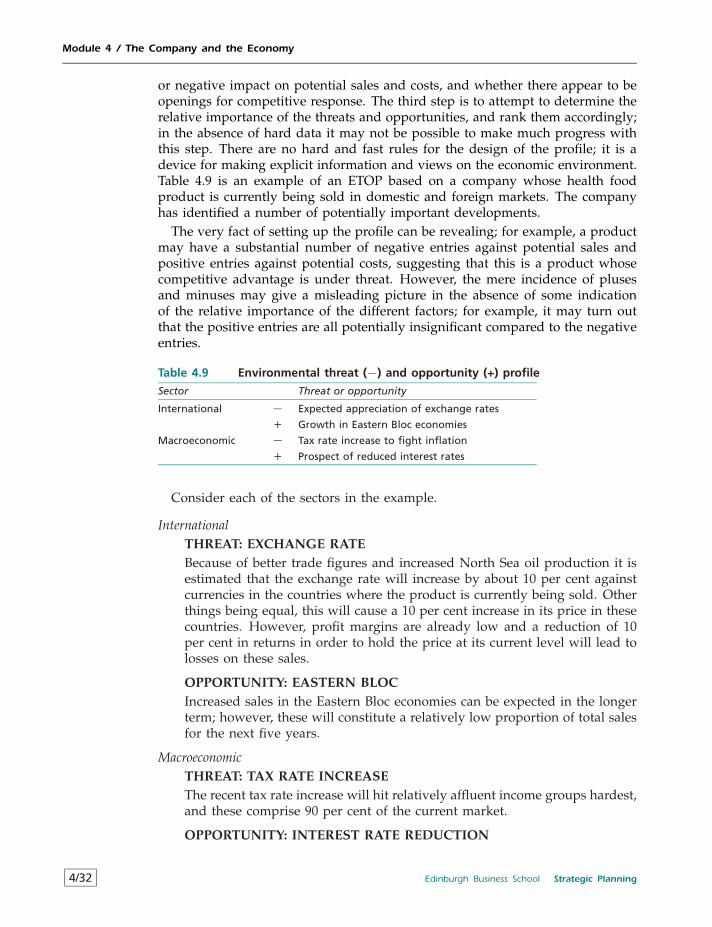
Module 4 / The Company and the Economy
or negative impact on potential sales and costs, and whether there appear to beopenings for competitive response. The third step is to attempt to determine therelative importance of the threats and opportunities, and rank them accordingly;in the absence of hard data it may not be possible to make much progress withthis step. There are no hard and fast rules for the design of the profile; it is adevice for making explicit information and views on the economic environment.Table 4.9 is an example of an ETOP based on a company whose health foodproduct is currently being sold in domestic and foreign markets. The companyhas identified a number of potentially important developments.
The very fact of setting up the profile can be revealing; for example, a productmay have a substantial number of negative entries against potential sales andpositive entries against potential costs, suggesting that this is a product whosecompetitive advantage is under threat. However, the mere incidence of plusesand minuses may give a misleading picture in the absence of some indicationof the relative importance of the different factors; for example, it may turn outthat the positive entries are all potentially insignificant compared to the negativeentries.
Table 4.9 Environmental threat (−) and opportunity (+) profile
Sector Threat or opportunity
International − Expected appreciation of exchange rates
+ Growth in Eastern Bloc economies
Macroeconomic − Tax rate increase to fight inflation
+ Prospect of reduced interest rates
Consider each of the sectors in the example.
InternationalTHREAT: EXCHANGE RATEBecause of better trade figures and increased North Sea oil production it isestimated that the exchange rate will increase by about 10 per cent againstcurrencies in the countries where the product is currently being sold. Otherthings being equal, this will cause a 10 per cent increase in its price in thesecountries. However, profit margins are already low and a reduction of 10per cent in returns in order to hold the price at its current level will lead tolosses on these sales.
OPPORTUNITY: EASTERN BLOCIncreased sales in the Eastern Bloc economies can be expected in the longerterm; however, these will constitute a relatively low proportion of total salesfor the next five years.
MacroeconomicTHREAT: TAX RATE INCREASEThe recent tax rate increase will hit relatively affluent income groups hardest,and these comprise 90 per cent of the current market.
OPPORTUNITY: INTEREST RATE REDUCTION
4/32 Edinburgh Business School Strategic Planning
Module 4 / The Company and the Economy
Since health foods are not financed by loans the reduction in interest rateswill have little effect on sales. However, reduced personal debt charges mayhelp mitigate the effect of the tax increase.
This brief outline suggests that the immediate threats outweigh the opportu-nities. Changes in both the exchange rate and the tax rate are likely to hit thevalue of sales, and this will not be compensated for by the effect of reducedinterest rates; the Eastern Bloc holds out the prospect of long term sales growthat best. Without going through a process such as this it is unlikely that the com-pany would have a clear understanding of the current threats and opportunitiesposed by the macro environment.
Strategic Planning Edinburgh Business School 4/33
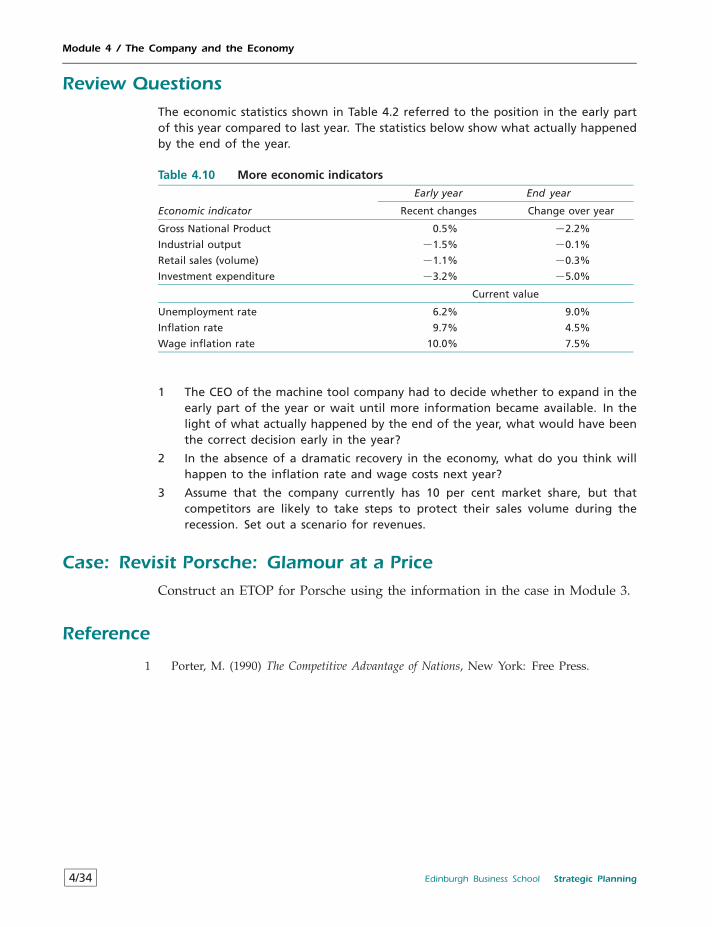
Module 4 / The Company and the Economy
Review QuestionsThe economic statistics shown in Table 4.2 referred to the position in the early partof this year compared to last year. The statistics below show what actually happenedby the end of the year.
Table 4.10 More economic indicators
Early year End year
Economic indicator Recent changes Change over year
Gross National Product 0.5% −2.2%
Industrial output −1.5% −0.1%
Retail sales (volume) −1.1% −0.3%
Investment expenditure −3.2% −5.0%
Current value
Unemployment rate 6.2% 9.0%
Inflation rate 9.7% 4.5%
Wage inflation rate 10.0% 7.5%
1 The CEO of the machine tool company had to decide whether to expand in theearly part of the year or wait until more information became available. In thelight of what actually happened by the end of the year, what would have beenthe correct decision early in the year?
2 In the absence of a dramatic recovery in the economy, what do you think willhappen to the inflation rate and wage costs next year?
3 Assume that the company currently has 10 per cent market share, but thatcompetitors are likely to take steps to protect their sales volume during therecession. Set out a scenario for revenues.
Case: Revisit Porsche: Glamour at a PriceConstruct an ETOP for Porsche using the information in the case in Module 3.
Reference
1 Porter, M. (1990) The Competitive Advantage of Nations, New York: Free Press.
4/34 Edinburgh Business School Strategic Planning
Module 5
The Company and The Market
Contents
5.1 The Market 5/3
5.2 The Demand Curve 5/35.2.1 Demand Factors 5/55.2.2 Demand Curve and Revenue 5/65.2.3 Demand Curve and Market Share 5/85.2.4 Demand Curve and Marketing Expenditure 5/105.2.5 Estimating the Demand Curve 5/12
5.3 Competitive Reaction 5/135.3.1 Game Theory 5/135.3.2 The Kinked Demand Curve 5/165.3.3 Competitive Pricing 5/17
5.4 Segmentation 5/185.4.1 The Effect of Product Differentiation 5/215.4.2 Pricing in Segments 5/23
5.5 Product Quality 5/245.5.1 Dimensions of Quality 5/275.5.2 Quality and Strategy 5/29
5.6 Product Life Cycles 5/31
5.7 Portfolio Models 5/345.7.1 The BCG Relative Share Growth Matrix 5/355.7.2 Other Portfolio Models 5/385.7.3 Limitations of Portfolio Models 5/395.7.4 Portfolio Models and Corporate Strategy 5/395.7.5 Strategy and Product Information 5/43
5.8 Supply 5/435.8.1 The Industry Supply Curve and Strategy 5/445.8.2 Shifting the Industry Supply Curve 5/44
5.9 Markets and Prices 5/45
5.10 Market Structures 5/475.10.1 Perfect Competition 5/485.10.2 Monopoly 5/505.10.3 Barriers to Entry 5/515.10.4 Contestable Markets 5/535.10.5 Competition among the Few: Oligopoly 5/54
5.11 The Role of Government 5/545.11.1 Government and Rule Making 5/54
Strategic Planning Edinburgh Business School 5/1
Module 5 / The Company and The Market
5.11.2 Government and Regulating 5/555.11.3 Government and Allocating 5/56
5.12 The Structural Analysis of Industries 5/575.12.1 Profiling the Five Forces 5/59
5.13 Strategic Groups 5/60
5.14 An Overview of Macro and Micro Models 5/61
5.15 Environmental Threat and Opportunity Profile: Part 2 5/62
Review Question 1 5/64
Review Question 2 5/64
Case 1: Apple Computer (1991) 5/64
Case 2: Salmon Farming (1992) 5/65
Case 3: Lymeswold Cheese (1991) 5/66
Case 4: Cigarette Price Wars (1994) 5/67
Case 5: A Prestigious Price War (1996) 5/71
Case 6: An International Romance that Failed: British Telecom and MCI(1998)
5/73
Learning Objectives
• To develop a framework for analysing market demand.• To analyse product life cycles.• To show the relevance of the BCG portfolio matrix for strategy.• To demonstrate the importance of supply side cost factors.• To show why prices vary.• To demonstrate the effect of different market structures.• To assess the importance of product quality.• To show why governments intervene in the market and how this can affect
individual companies.• To show how non-economic variables can be included in market analysis.• To include market factors in the environmental threat and opportunity
profile.
5/2 Edinburgh Business School Strategic Planning
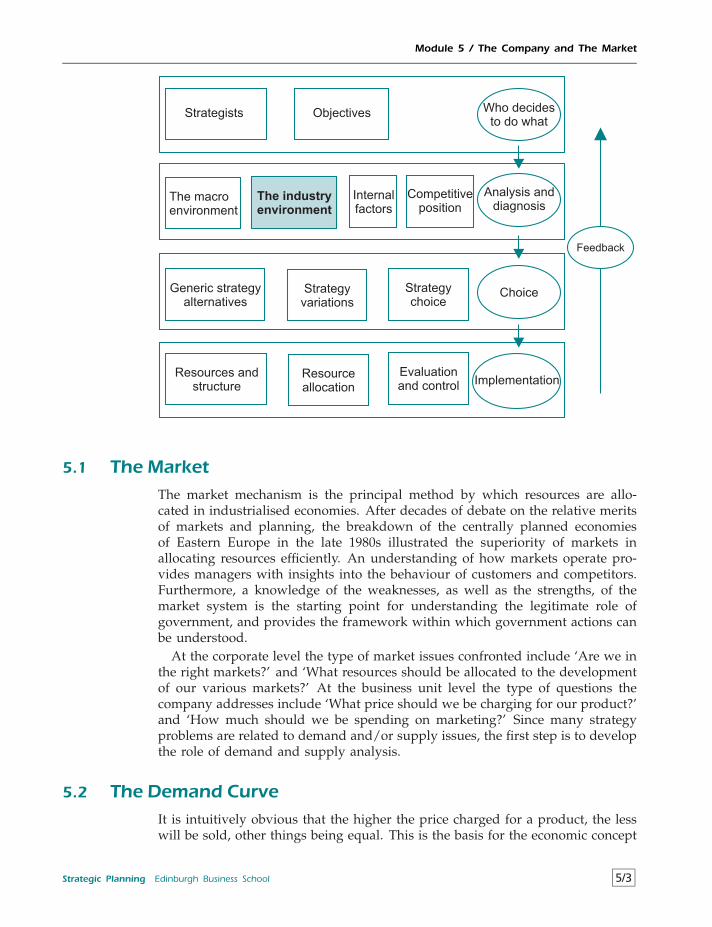
Module 5 / The Company and The Market
Strategists Objectives
The macroenvironment
The industryenvironment
Internalfactors
Competitiveposition
Generic strategyalternatives
Strategyvariations
Who decidesto do what
Analysis anddiagnosis
Choice
Implementation
Strategychoice
Resources andstructure
Resourceallocation
Evaluationand control
Feedback
5.1 The MarketThe market mechanism is the principal method by which resources are allo-cated in industrialised economies. After decades of debate on the relative meritsof markets and planning, the breakdown of the centrally planned economiesof Eastern Europe in the late 1980s illustrated the superiority of markets inallocating resources efficiently. An understanding of how markets operate pro-vides managers with insights into the behaviour of customers and competitors.Furthermore, a knowledge of the weaknesses, as well as the strengths, of themarket system is the starting point for understanding the legitimate role ofgovernment, and provides the framework within which government actions canbe understood.
At the corporate level the type of market issues confronted include ‘Are we inthe right markets?’ and ‘What resources should be allocated to the developmentof our various markets?’ At the business unit level the type of questions thecompany addresses include ‘What price should we be charging for our product?’and ‘How much should we be spending on marketing?’ Since many strategyproblems are related to demand and/or supply issues, the first step is to developthe role of demand and supply analysis.
5.2 The Demand CurveIt is intuitively obvious that the higher the price charged for a product, the lesswill be sold, other things being equal. This is the basis for the economic concept
Strategic Planning Edinburgh Business School 5/3
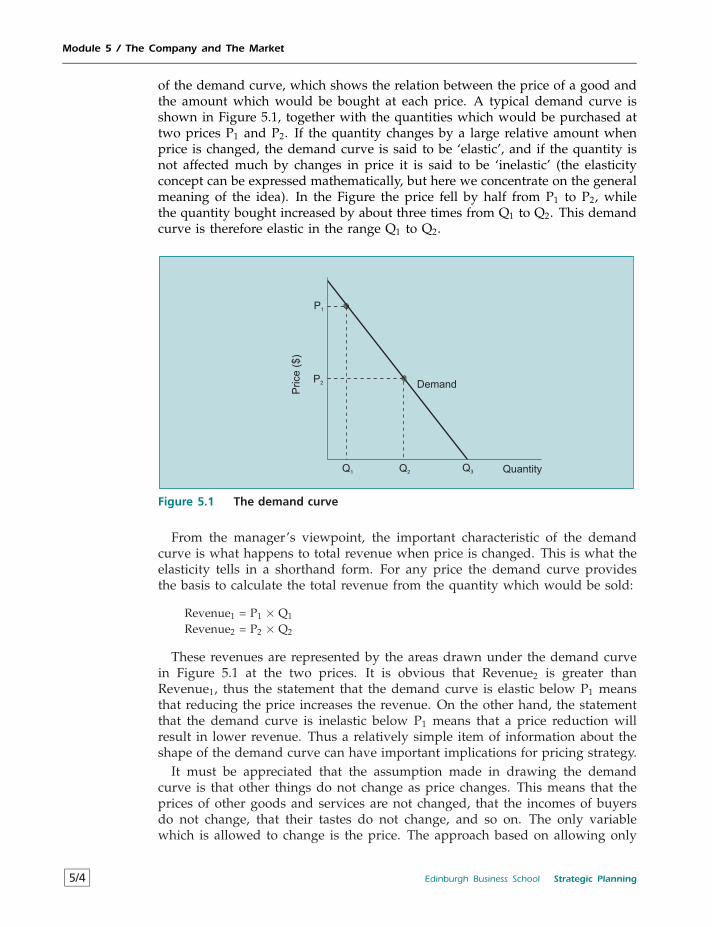
Module 5 / The Company and The Market
of the demand curve, which shows the relation between the price of a good andthe amount which would be bought at each price. A typical demand curve isshown in Figure 5.1, together with the quantities which would be purchased attwo prices P1 and P2. If the quantity changes by a large relative amount whenprice is changed, the demand curve is said to be ‘elastic’, and if the quantity isnot affected much by changes in price it is said to be ‘inelastic’ (the elasticityconcept can be expressed mathematically, but here we concentrate on the generalmeaning of the idea). In the Figure the price fell by half from P1 to P2, whilethe quantity bought increased by about three times from Q1 to Q2. This demandcurve is therefore elastic in the range Q1 to Q2.
P1
P2
Q1 Q3 Quantity
Demand
Price
($)
Q2
Figure 5.1 The demand curve
From the manager’s viewpoint, the important characteristic of the demandcurve is what happens to total revenue when price is changed. This is what theelasticity tells in a shorthand form. For any price the demand curve providesthe basis to calculate the total revenue from the quantity which would be sold:
Revenue1 = P1 × Q1
Revenue2 = P2 × Q2
These revenues are represented by the areas drawn under the demand curvein Figure 5.1 at the two prices. It is obvious that Revenue2 is greater thanRevenue1, thus the statement that the demand curve is elastic below P1 meansthat reducing the price increases the revenue. On the other hand, the statementthat the demand curve is inelastic below P1 means that a price reduction willresult in lower revenue. Thus a relatively simple item of information about theshape of the demand curve can have important implications for pricing strategy.
It must be appreciated that the assumption made in drawing the demandcurve is that other things do not change as price changes. This means that theprices of other goods and services are not changed, that the incomes of buyersdo not change, that their tastes do not change, and so on. The only variablewhich is allowed to change is the price. The approach based on allowing only
5/4 Edinburgh Business School Strategic Planning
Module 5 / The Company and The Market
one variable to change is widely used in economics, and is usually referred toas ceteris paribus: holding other things constant. The objective of this approachis not to ignore the potential impact of other factors, but to make it possible tofocus on the likely effects relating to individual factors.
A natural reaction of many managers on being introduced to the concept ofthe demand curve and the ceteris paribus approach is that it does not relate tothe world they live in, where everything changes at once in a dynamic fashion.In fact, the approach is not meant to be about the real world directly, but is apowerful method of focusing on individual variables and how they affect thecompany. Unless a degree of abstraction from real life is achieved it is impossibleto think in terms of ‘what if’; it is the abstraction from real life which manymanagers find difficult, but without making this abstraction they will find itdifficult to follow economic discussions.
5.2.1 Demand Factors
Different factors affect demand for a product in different ways; for example,some affect the market as a whole, while others affect only potential companysales.
DETERMINANTS OF MARKET SIZE:• Product life cycle• Business cycle• Exogenous shocks• GNP elasticity• Exchange rates
DETERMINANTS OF MARKET SHARE:• Price• Marketing
The factors which influence the total market are usually outside the controlof the company. The product life cycle could lead to a reduction in marketsize because the market had become saturated and demand only remainedfor replacement. The business cycle is affected by the factors discussed at 4.4.Exogenous shocks can be due to factors such as government regulation on theallowable emissions from car exhausts. GNP elasticity varies among products,and some implications for cash flows were discussed at 4.8.1. Exchange ratesare impossible to predict with any degree of consistency and can also havesubstantial effects on cash flow. On the other hand, pricing and marketingdecisions affect the market share which the company achieves out of the giventotal market.
In terms of the demand curve, all of the variables except for price affect theposition of the demand curve; it is useful to think of the direction in which thedemand curve is likely to be shifted by a particular change, and the possibleorder of magnitude. Thus when a number of changes occur in the economicenvironment at one time some idea of the potential net impact can be obtained.For example, a predicted increase in GNP next year might shift the demand
Strategic Planning Edinburgh Business School 5/5
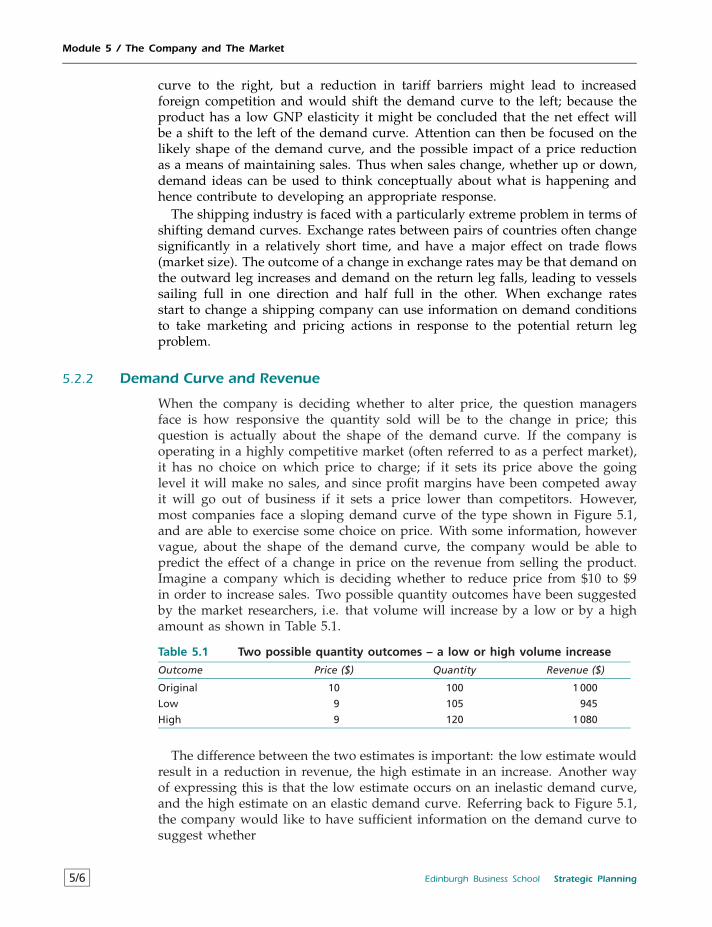
Module 5 / The Company and The Market
curve to the right, but a reduction in tariff barriers might lead to increasedforeign competition and would shift the demand curve to the left; because theproduct has a low GNP elasticity it might be concluded that the net effect willbe a shift to the left of the demand curve. Attention can then be focused on thelikely shape of the demand curve, and the possible impact of a price reductionas a means of maintaining sales. Thus when sales change, whether up or down,demand ideas can be used to think conceptually about what is happening andhence contribute to developing an appropriate response.
The shipping industry is faced with a particularly extreme problem in terms ofshifting demand curves. Exchange rates between pairs of countries often changesignificantly in a relatively short time, and have a major effect on trade flows(market size). The outcome of a change in exchange rates may be that demand onthe outward leg increases and demand on the return leg falls, leading to vesselssailing full in one direction and half full in the other. When exchange ratesstart to change a shipping company can use information on demand conditionsto take marketing and pricing actions in response to the potential return legproblem.
5.2.2 Demand Curve and Revenue
When the company is deciding whether to alter price, the question managersface is how responsive the quantity sold will be to the change in price; thisquestion is actually about the shape of the demand curve. If the company isoperating in a highly competitive market (often referred to as a perfect market),it has no choice on which price to charge; if it sets its price above the goinglevel it will make no sales, and since profit margins have been competed awayit will go out of business if it sets a price lower than competitors. However,most companies face a sloping demand curve of the type shown in Figure 5.1,and are able to exercise some choice on price. With some information, howevervague, about the shape of the demand curve, the company would be able topredict the effect of a change in price on the revenue from selling the product.Imagine a company which is deciding whether to reduce price from $10 to $9in order to increase sales. Two possible quantity outcomes have been suggestedby the market researchers, i.e. that volume will increase by a low or by a highamount as shown in Table 5.1.
Table 5.1 Two possible quantity outcomes – a low or high volume increase
Outcome Price ($) Quantity Revenue ($)
Original 10 100 1 000
Low 9 105 945
High 9 120 1 080
The difference between the two estimates is important: the low estimate wouldresult in a reduction in revenue, the high estimate in an increase. Another wayof expressing this is that the low estimate occurs on an inelastic demand curve,and the high estimate on an elastic demand curve. Referring back to Figure 5.1,the company would like to have sufficient information on the demand curve tosuggest whether
5/6 Edinburgh Business School Strategic Planning
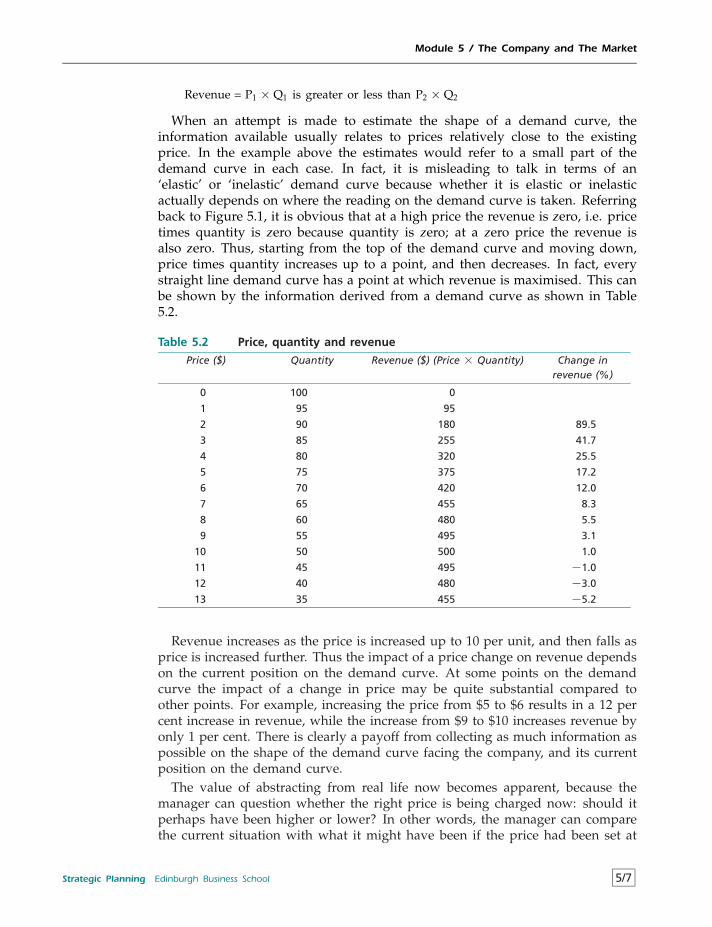
Module 5 / The Company and The Market
Revenue = P1 × Q1 is greater or less than P2 × Q2
When an attempt is made to estimate the shape of a demand curve, theinformation available usually relates to prices relatively close to the existingprice. In the example above the estimates would refer to a small part of thedemand curve in each case. In fact, it is misleading to talk in terms of an‘elastic’ or ‘inelastic’ demand curve because whether it is elastic or inelasticactually depends on where the reading on the demand curve is taken. Referringback to Figure 5.1, it is obvious that at a high price the revenue is zero, i.e. pricetimes quantity is zero because quantity is zero; at a zero price the revenue isalso zero. Thus, starting from the top of the demand curve and moving down,price times quantity increases up to a point, and then decreases. In fact, everystraight line demand curve has a point at which revenue is maximised. This canbe shown by the information derived from a demand curve as shown in Table5.2.
Table 5.2 Price, quantity and revenue
Price ($) Quantity Revenue ($) (Price × Quantity) Change inrevenue (%)
0 100 0
1 95 95
2 90 180 89.5
3 85 255 41.7
4 80 320 25.5
5 75 375 17.2
6 70 420 12.0
7 65 455 8.3
8 60 480 5.5
9 55 495 3.1
10 50 500 1.0
11 45 495 −1.0
12 40 480 −3.0
13 35 455 −5.2
Revenue increases as the price is increased up to 10 per unit, and then falls asprice is increased further. Thus the impact of a price change on revenue dependson the current position on the demand curve. At some points on the demandcurve the impact of a change in price may be quite substantial compared toother points. For example, increasing the price from $5 to $6 results in a 12 percent increase in revenue, while the increase from $9 to $10 increases revenue byonly 1 per cent. There is clearly a payoff from collecting as much information aspossible on the shape of the demand curve facing the company, and its currentposition on the demand curve.
The value of abstracting from real life now becomes apparent, because themanager can question whether the right price is being charged now: should itperhaps have been higher or lower? In other words, the manager can comparethe current situation with what it might have been if the price had been set at
Strategic Planning Edinburgh Business School 5/7
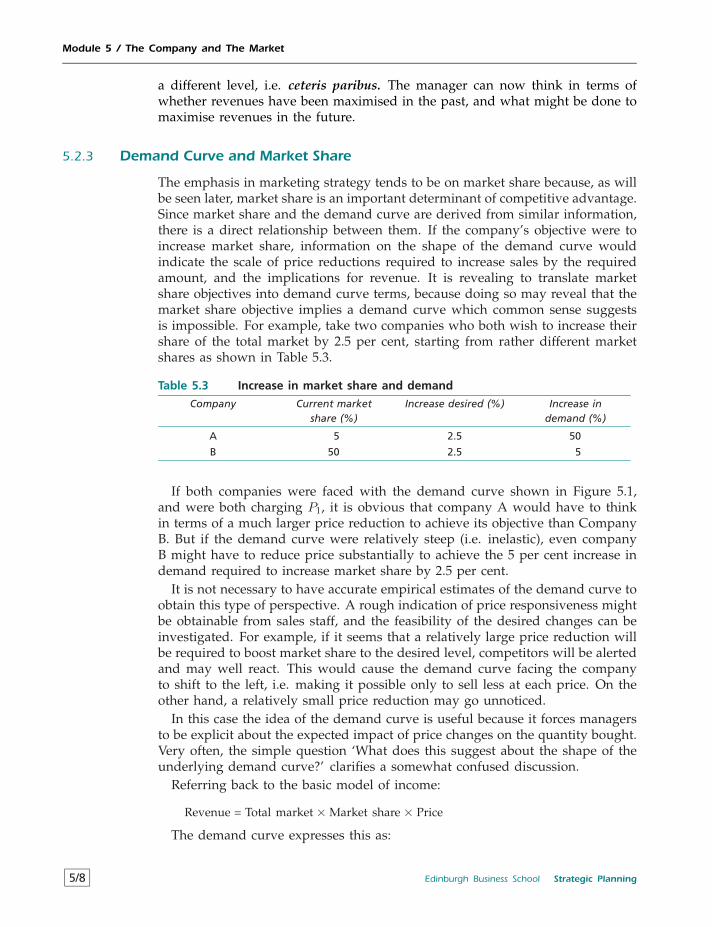
Module 5 / The Company and The Market
a different level, i.e. ceteris paribus. The manager can now think in terms ofwhether revenues have been maximised in the past, and what might be done tomaximise revenues in the future.
5.2.3 Demand Curve and Market Share
The emphasis in marketing strategy tends to be on market share because, as willbe seen later, market share is an important determinant of competitive advantage.Since market share and the demand curve are derived from similar information,there is a direct relationship between them. If the company’s objective were toincrease market share, information on the shape of the demand curve wouldindicate the scale of price reductions required to increase sales by the requiredamount, and the implications for revenue. It is revealing to translate marketshare objectives into demand curve terms, because doing so may reveal that themarket share objective implies a demand curve which common sense suggestsis impossible. For example, take two companies who both wish to increase theirshare of the total market by 2.5 per cent, starting from rather different marketshares as shown in Table 5.3.
Table 5.3 Increase in market share and demand
Company Current marketshare (%)
Increase desired (%) Increase indemand (%)
A 5 2.5 50
B 50 2.5 5
If both companies were faced with the demand curve shown in Figure 5.1,and were both charging P1, it is obvious that company A would have to thinkin terms of a much larger price reduction to achieve its objective than CompanyB. But if the demand curve were relatively steep (i.e. inelastic), even companyB might have to reduce price substantially to achieve the 5 per cent increase indemand required to increase market share by 2.5 per cent.
It is not necessary to have accurate empirical estimates of the demand curve toobtain this type of perspective. A rough indication of price responsiveness mightbe obtainable from sales staff, and the feasibility of the desired changes can beinvestigated. For example, if it seems that a relatively large price reduction willbe required to boost market share to the desired level, competitors will be alertedand may well react. This would cause the demand curve facing the companyto shift to the left, i.e. making it possible only to sell less at each price. On theother hand, a relatively small price reduction may go unnoticed.
In this case the idea of the demand curve is useful because it forces managersto be explicit about the expected impact of price changes on the quantity bought.Very often, the simple question ‘What does this suggest about the shape of theunderlying demand curve?’ clarifies a somewhat confused discussion.
Referring back to the basic model of income:
Revenue = Total market×Market share× Price
The demand curve expresses this as:
5/8 Edinburgh Business School Strategic Planning
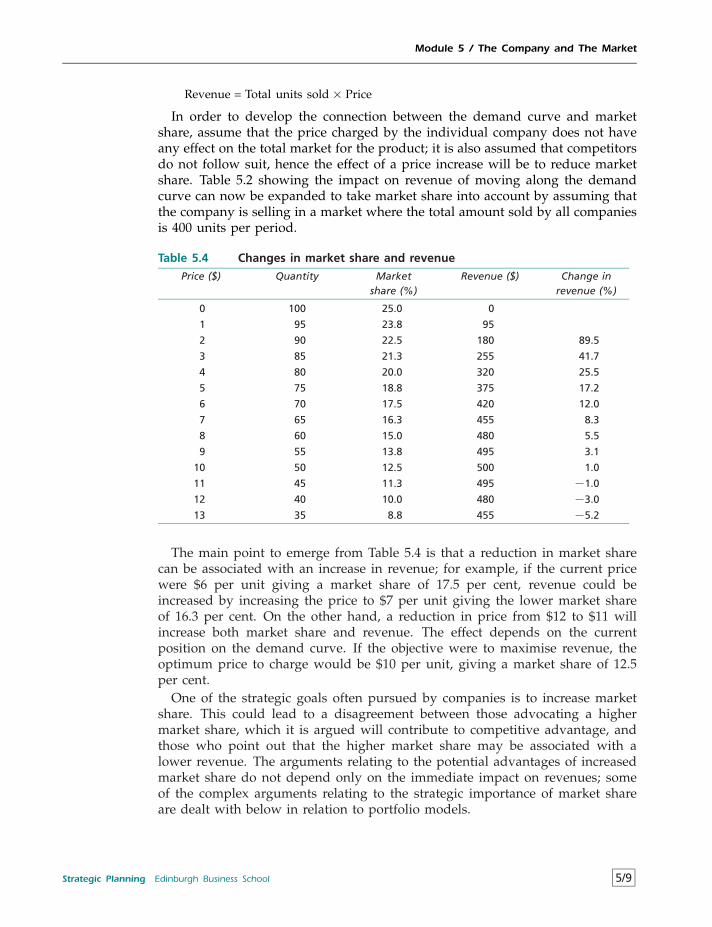
Module 5 / The Company and The Market
Revenue = Total units sold× Price
In order to develop the connection between the demand curve and marketshare, assume that the price charged by the individual company does not haveany effect on the total market for the product; it is also assumed that competitorsdo not follow suit, hence the effect of a price increase will be to reduce marketshare. Table 5.2 showing the impact on revenue of moving along the demandcurve can now be expanded to take market share into account by assuming thatthe company is selling in a market where the total amount sold by all companiesis 400 units per period.
Table 5.4 Changes in market share and revenue
Price ($) Quantity Marketshare (%)
Revenue ($) Change inrevenue (%)
0 100 25.0 0
1 95 23.8 95
2 90 22.5 180 89.5
3 85 21.3 255 41.7
4 80 20.0 320 25.5
5 75 18.8 375 17.2
6 70 17.5 420 12.0
7 65 16.3 455 8.3
8 60 15.0 480 5.5
9 55 13.8 495 3.1
10 50 12.5 500 1.0
11 45 11.3 495 −1.0
12 40 10.0 480 −3.0
13 35 8.8 455 −5.2
The main point to emerge from Table 5.4 is that a reduction in market sharecan be associated with an increase in revenue; for example, if the current pricewere $6 per unit giving a market share of 17.5 per cent, revenue could beincreased by increasing the price to $7 per unit giving the lower market shareof 16.3 per cent. On the other hand, a reduction in price from $12 to $11 willincrease both market share and revenue. The effect depends on the currentposition on the demand curve. If the objective were to maximise revenue, theoptimum price to charge would be $10 per unit, giving a market share of 12.5per cent.
One of the strategic goals often pursued by companies is to increase marketshare. This could lead to a disagreement between those advocating a highermarket share, which it is argued will contribute to competitive advantage, andthose who point out that the higher market share may be associated with alower revenue. The arguments relating to the potential advantages of increasedmarket share do not depend only on the immediate impact on revenues; someof the complex arguments relating to the strategic importance of market shareare dealt with below in relation to portfolio models.
Strategic Planning Edinburgh Business School 5/9
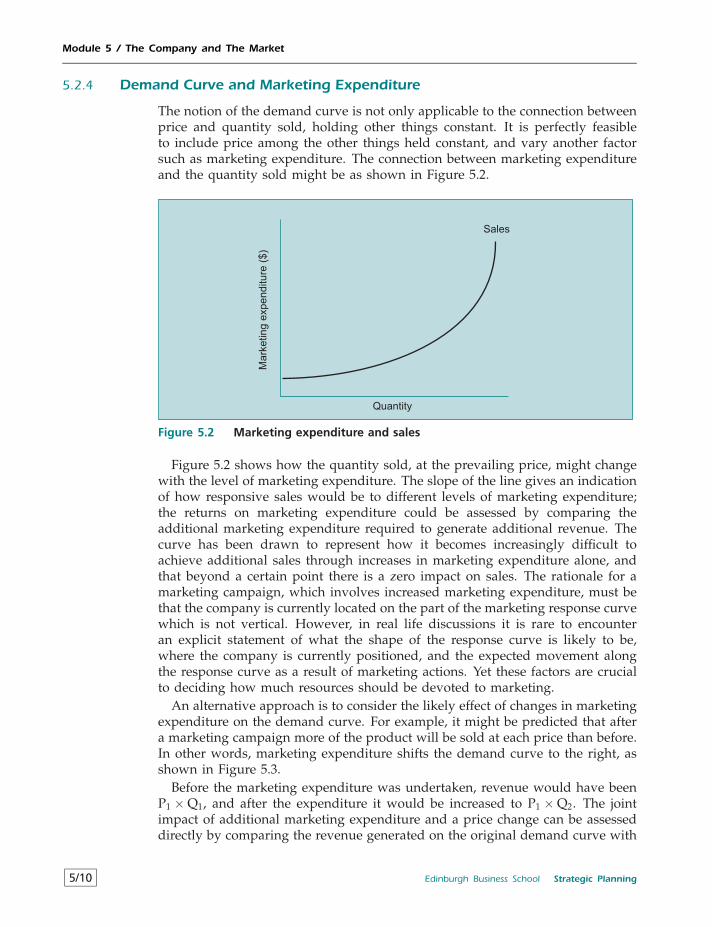
Module 5 / The Company and The Market
5.2.4 Demand Curve and Marketing Expenditure
The notion of the demand curve is not only applicable to the connection betweenprice and quantity sold, holding other things constant. It is perfectly feasibleto include price among the other things held constant, and vary another factorsuch as marketing expenditure. The connection between marketing expenditureand the quantity sold might be as shown in Figure 5.2.
Sales
Quantity
Mark
eting
expenditure
($)
Figure 5.2 Marketing expenditure and sales
Figure 5.2 shows how the quantity sold, at the prevailing price, might changewith the level of marketing expenditure. The slope of the line gives an indicationof how responsive sales would be to different levels of marketing expenditure;the returns on marketing expenditure could be assessed by comparing theadditional marketing expenditure required to generate additional revenue. Thecurve has been drawn to represent how it becomes increasingly difficult toachieve additional sales through increases in marketing expenditure alone, andthat beyond a certain point there is a zero impact on sales. The rationale for amarketing campaign, which involves increased marketing expenditure, must bethat the company is currently located on the part of the marketing response curvewhich is not vertical. However, in real life discussions it is rare to encounteran explicit statement of what the shape of the response curve is likely to be,where the company is currently positioned, and the expected movement alongthe response curve as a result of marketing actions. Yet these factors are crucialto deciding how much resources should be devoted to marketing.
An alternative approach is to consider the likely effect of changes in marketingexpenditure on the demand curve. For example, it might be predicted that aftera marketing campaign more of the product will be sold at each price than before.In other words, marketing expenditure shifts the demand curve to the right, asshown in Figure 5.3.
Before the marketing expenditure was undertaken, revenue would have beenP1 ×Q1, and after the expenditure it would be increased to P1 ×Q2. The jointimpact of additional marketing expenditure and a price change can be assesseddirectly by comparing the revenue generated on the original demand curve with
5/10 Edinburgh Business School Strategic Planning
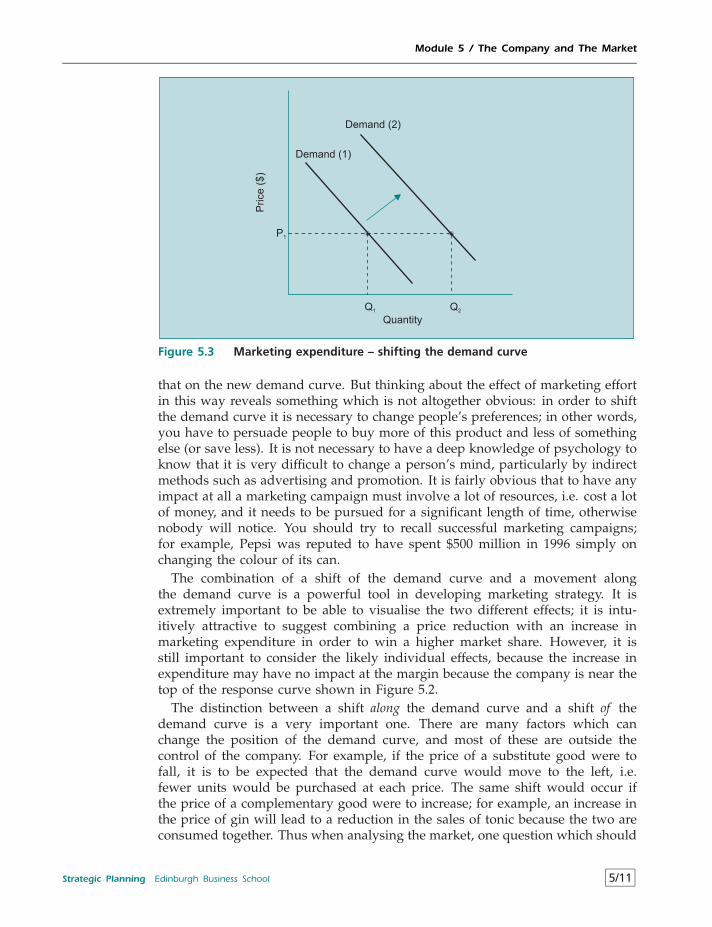
Module 5 / The Company and The Market
Demand (1)
Demand (2)
Quantity
Price
($)
P1
Q1 Q2
Figure 5.3 Marketing expenditure – shifting the demand curve
that on the new demand curve. But thinking about the effect of marketing effortin this way reveals something which is not altogether obvious: in order to shiftthe demand curve it is necessary to change people’s preferences; in other words,you have to persuade people to buy more of this product and less of somethingelse (or save less). It is not necessary to have a deep knowledge of psychology toknow that it is very difficult to change a person’s mind, particularly by indirectmethods such as advertising and promotion. It is fairly obvious that to have anyimpact at all a marketing campaign must involve a lot of resources, i.e. cost a lotof money, and it needs to be pursued for a significant length of time, otherwisenobody will notice. You should try to recall successful marketing campaigns;for example, Pepsi was reputed to have spent $500 million in 1996 simply onchanging the colour of its can.
The combination of a shift of the demand curve and a movement alongthe demand curve is a powerful tool in developing marketing strategy. It isextremely important to be able to visualise the two different effects; it is intu-itively attractive to suggest combining a price reduction with an increase inmarketing expenditure in order to win a higher market share. However, it isstill important to consider the likely individual effects, because the increase inexpenditure may have no impact at the margin because the company is near thetop of the response curve shown in Figure 5.2.
The distinction between a shift along the demand curve and a shift of thedemand curve is a very important one. There are many factors which canchange the position of the demand curve, and most of these are outside thecontrol of the company. For example, if the price of a substitute good were tofall, it is to be expected that the demand curve would move to the left, i.e.fewer units would be purchased at each price. The same shift would occur ifthe price of a complementary good were to increase; for example, an increase inthe price of gin will lead to a reduction in the sales of tonic because the two areconsumed together. Thus when analysing the market, one question which should
Strategic Planning Edinburgh Business School 5/11
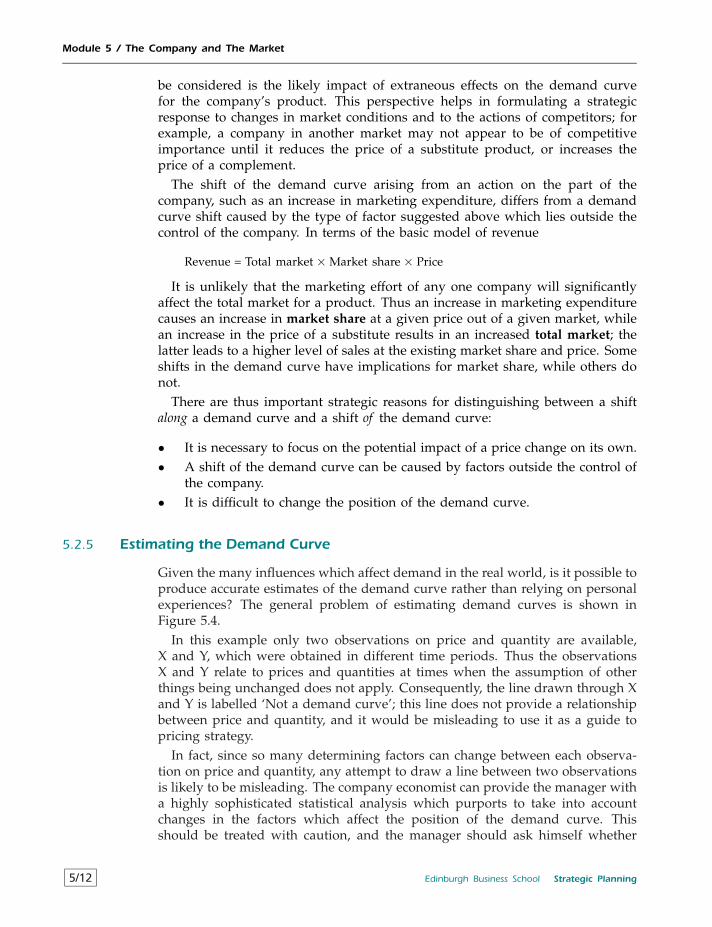
Module 5 / The Company and The Market
be considered is the likely impact of extraneous effects on the demand curvefor the company’s product. This perspective helps in formulating a strategicresponse to changes in market conditions and to the actions of competitors; forexample, a company in another market may not appear to be of competitiveimportance until it reduces the price of a substitute product, or increases theprice of a complement.
The shift of the demand curve arising from an action on the part of thecompany, such as an increase in marketing expenditure, differs from a demandcurve shift caused by the type of factor suggested above which lies outside thecontrol of the company. In terms of the basic model of revenue
Revenue = Total market×Market share× Price
It is unlikely that the marketing effort of any one company will significantlyaffect the total market for a product. Thus an increase in marketing expenditurecauses an increase in market share at a given price out of a given market, whilean increase in the price of a substitute results in an increased total market; thelatter leads to a higher level of sales at the existing market share and price. Someshifts in the demand curve have implications for market share, while others donot.
There are thus important strategic reasons for distinguishing between a shiftalong a demand curve and a shift of the demand curve:
• It is necessary to focus on the potential impact of a price change on its own.• A shift of the demand curve can be caused by factors outside the control of
the company.• It is difficult to change the position of the demand curve.
5.2.5 Estimating the Demand Curve
Given the many influences which affect demand in the real world, is it possible toproduce accurate estimates of the demand curve rather than relying on personalexperiences? The general problem of estimating demand curves is shown inFigure 5.4.
In this example only two observations on price and quantity are available,X and Y, which were obtained in different time periods. Thus the observationsX and Y relate to prices and quantities at times when the assumption of otherthings being unchanged does not apply. Consequently, the line drawn through Xand Y is labelled ‘Not a demand curve’; this line does not provide a relationshipbetween price and quantity, and it would be misleading to use it as a guide topricing strategy.
In fact, since so many determining factors can change between each observa-tion on price and quantity, any attempt to draw a line between two observationsis likely to be misleading. The company economist can provide the manager witha highly sophisticated statistical analysis which purports to take into accountchanges in the factors which affect the position of the demand curve. Thisshould be treated with caution, and the manager should ask himself whether
5/12 Edinburgh Business School Strategic Planning
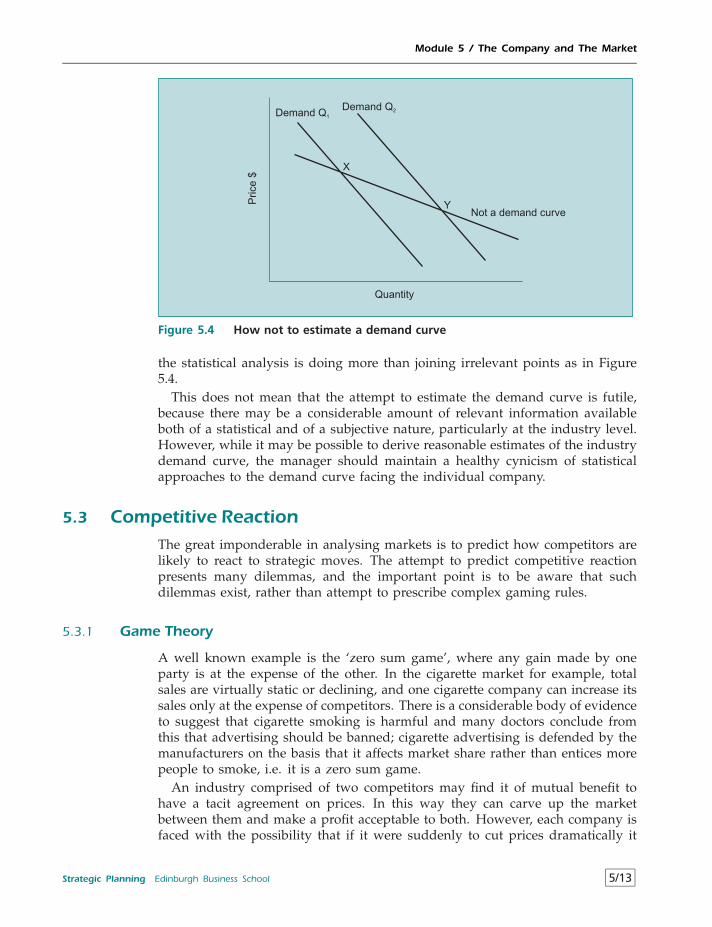
Module 5 / The Company and The Market
Not a demand curve
X
Y
Quantity
Price
$
Demand Q1
Demand Q2
Figure 5.4 How not to estimate a demand curve
the statistical analysis is doing more than joining irrelevant points as in Figure5.4.
This does not mean that the attempt to estimate the demand curve is futile,because there may be a considerable amount of relevant information availableboth of a statistical and of a subjective nature, particularly at the industry level.However, while it may be possible to derive reasonable estimates of the industrydemand curve, the manager should maintain a healthy cynicism of statisticalapproaches to the demand curve facing the individual company.
5.3 Competitive ReactionThe great imponderable in analysing markets is to predict how competitors arelikely to react to strategic moves. The attempt to predict competitive reactionpresents many dilemmas, and the important point is to be aware that suchdilemmas exist, rather than attempt to prescribe complex gaming rules.
5.3.1 Game Theory
A well known example is the ‘zero sum game’, where any gain made by oneparty is at the expense of the other. In the cigarette market for example, totalsales are virtually static or declining, and one cigarette company can increase itssales only at the expense of competitors. There is a considerable body of evidenceto suggest that cigarette smoking is harmful and many doctors conclude fromthis that advertising should be banned; cigarette advertising is defended by themanufacturers on the basis that it affects market share rather than entices morepeople to smoke, i.e. it is a zero sum game.
An industry comprised of two competitors may find it of mutual benefit tohave a tacit agreement on prices. In this way they can carve up the marketbetween them and make a profit acceptable to both. However, each company isfaced with the possibility that if it were suddenly to cut prices dramatically it
Strategic Planning Edinburgh Business School 5/13
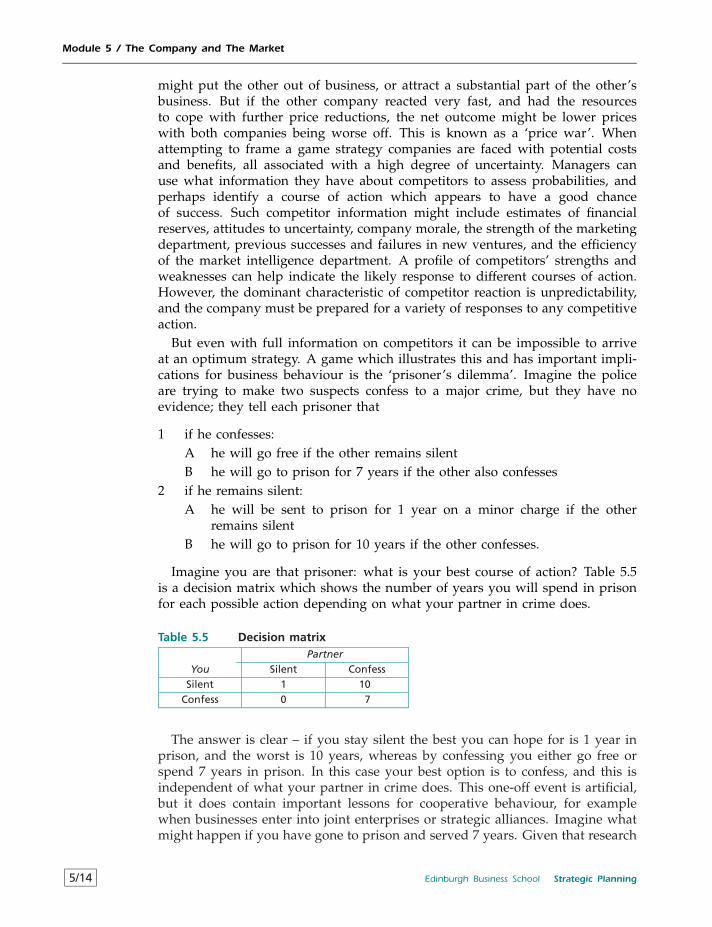
Module 5 / The Company and The Market
might put the other out of business, or attract a substantial part of the other’sbusiness. But if the other company reacted very fast, and had the resourcesto cope with further price reductions, the net outcome might be lower priceswith both companies being worse off. This is known as a ‘price war’. Whenattempting to frame a game strategy companies are faced with potential costsand benefits, all associated with a high degree of uncertainty. Managers canuse what information they have about competitors to assess probabilities, andperhaps identify a course of action which appears to have a good chanceof success. Such competitor information might include estimates of financialreserves, attitudes to uncertainty, company morale, the strength of the marketingdepartment, previous successes and failures in new ventures, and the efficiencyof the market intelligence department. A profile of competitors’ strengths andweaknesses can help indicate the likely response to different courses of action.However, the dominant characteristic of competitor reaction is unpredictability,and the company must be prepared for a variety of responses to any competitiveaction.
But even with full information on competitors it can be impossible to arriveat an optimum strategy. A game which illustrates this and has important impli-cations for business behaviour is the ‘prisoner’s dilemma’. Imagine the policeare trying to make two suspects confess to a major crime, but they have noevidence; they tell each prisoner that
1 if he confesses:A he will go free if the other remains silentB he will go to prison for 7 years if the other also confesses
2 if he remains silent:A he will be sent to prison for 1 year on a minor charge if the other
remains silentB he will go to prison for 10 years if the other confesses.
Imagine you are that prisoner: what is your best course of action? Table 5.5is a decision matrix which shows the number of years you will spend in prisonfor each possible action depending on what your partner in crime does.
Table 5.5 Decision matrixPartner
You Silent ConfessSilent 1 10
Confess 0 7
The answer is clear – if you stay silent the best you can hope for is 1 year inprison, and the worst is 10 years, whereas by confessing you either go free orspend 7 years in prison. In this case your best option is to confess, and this isindependent of what your partner in crime does. This one-off event is artificial,but it does contain important lessons for cooperative behaviour, for examplewhen businesses enter into joint enterprises or strategic alliances. Imagine whatmight happen if you have gone to prison and served 7 years. Given that research
5/14 Edinburgh Business School Strategic Planning
Module 5 / The Company and The Market
into criminals has shown that prison has very little effect on behaviour, assumethat you and your partner commit the same crime and end up in exactly thesame position once more. Both of you know very well by this time that if bothof you do stay silent then you will spend only 1 year in prison, so will yourexperience affect your behaviour this time round? If you are convinced that yourpartner sees the virtue of not confessing then it is in your interest to confess,because that way you go free. But the same logic applies to your partner, soonce again you will both end up confessing and going back to prison for 7years. The point of the dilemma is that not only does the situation lead to anoutcome which is not in the best interests of either party, but experience doesnot lead to a different outcome.
Turning to the parallel with the business world, you would immediately pointout that the two parties are free to discuss what they should do, and as a resultof their collusion would agree to stay silent, hence serving only 1 year. Butthis is a true dilemma: once you have reached the agreement then you havean incentive to confess, because you will go free. The only way out of thisdilemma is to introduce another variable which gives an incentive to stick to theagreement. This variable is the knowledge that the situation will be repeated anunknown number of times. Why an unknown number of times? Because aftereach 1 year sentence it is worthwhile to enter into the agreement, but if it isknown that this is the last time then both of you will have an incentive to breakit.
A great deal of stress is laid on trust and commitment in cooperative businessventures. For example, both parties have an incentive to conceal information ontrue costs and profits, and both have to be sure that the other will not breakranks and make a profit at the expense of the other. But if agreements arenot legally binding, both parties are continually faced with the equivalent ofthe prisoner’s dilemma. One way of building trust is to make a commitmentto the venture which would make it costly to break ranks. In the absence ofsignificant financial commitments it is not difficult to see why cooperation ina competitive environment is so fragile and difficult to maintain. You may feelthat this devalues the concept of trustworthiness as a moral virtue. But in thebusiness setting it is necessary to be realistic about the likely actions of businesspartners and interpret them in terms of the incentives involved.
As you might imagine game theory is a complex subject; while it is highlymathematical it provides important insights into behaviour. The prisoner’sdilemma has what is known as a dominant strategy equilibrium because thebest strategy is independent of the choice of the other party. If there is nota dominant strategy then it is necessary to estimate the other party’s likelyresponse. The logic then becomes rather involved, but it is worth noting that anequilibrium strategy can be achieved in a variety of situations; the mathemati-cian Nash demonstrated the circumstances under which each party makes thebest response given what the other has chosen to do. But the fundamental pointof the original dilemma is unaltered: unless there is trust and commitment to acourse of action there is always an incentive for one party to break ranks.
Strategic Planning Edinburgh Business School 5/15
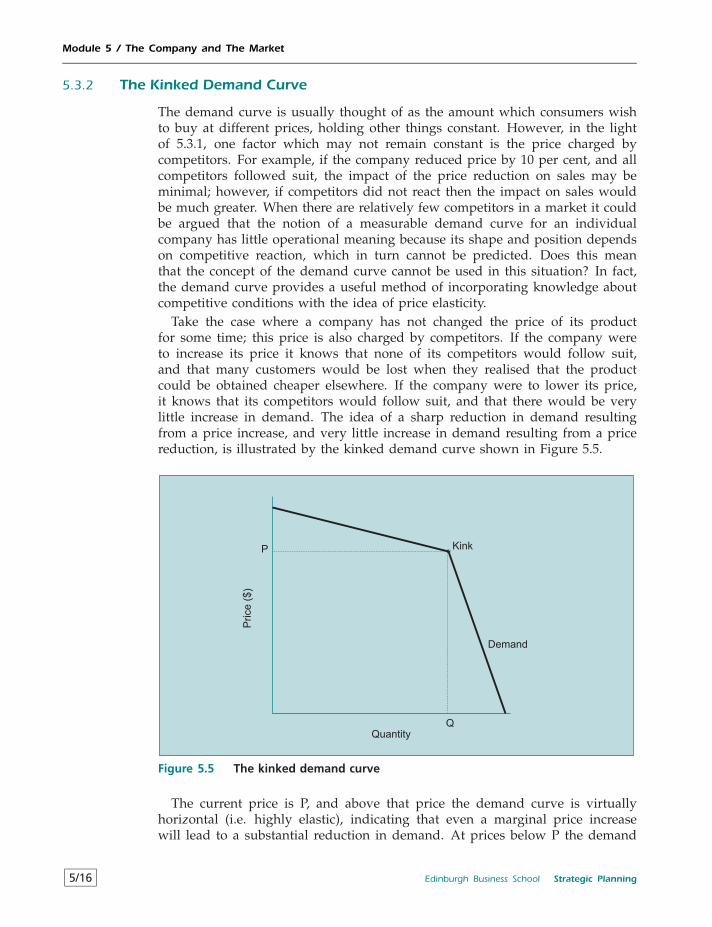
Module 5 / The Company and The Market
5.3.2 The Kinked Demand Curve
The demand curve is usually thought of as the amount which consumers wishto buy at different prices, holding other things constant. However, in the lightof 5.3.1, one factor which may not remain constant is the price charged bycompetitors. For example, if the company reduced price by 10 per cent, and allcompetitors followed suit, the impact of the price reduction on sales may beminimal; however, if competitors did not react then the impact on sales wouldbe much greater. When there are relatively few competitors in a market it couldbe argued that the notion of a measurable demand curve for an individualcompany has little operational meaning because its shape and position dependson competitive reaction, which in turn cannot be predicted. Does this meanthat the concept of the demand curve cannot be used in this situation? In fact,the demand curve provides a useful method of incorporating knowledge aboutcompetitive conditions with the idea of price elasticity.
Take the case where a company has not changed the price of its productfor some time; this price is also charged by competitors. If the company wereto increase its price it knows that none of its competitors would follow suit,and that many customers would be lost when they realised that the productcould be obtained cheaper elsewhere. If the company were to lower its price,it knows that its competitors would follow suit, and that there would be verylittle increase in demand. The idea of a sharp reduction in demand resultingfrom a price increase, and very little increase in demand resulting from a pricereduction, is illustrated by the kinked demand curve shown in Figure 5.5.
Kink
Demand
Quantity
Price
($)
P
Q
Figure 5.5 The kinked demand curve
The current price is P, and above that price the demand curve is virtuallyhorizontal (i.e. highly elastic), indicating that even a marginal price increasewill lead to a substantial reduction in demand. At prices below P the demand
5/16 Edinburgh Business School Strategic Planning
Module 5 / The Company and The Market
curve is relatively steep (i.e. highly inelastic), indicating that price reductionswill have very little impact on sales. The shape of the kinked demand curve hasimportant implications for sales revenue. At 5.2.2 it was shown that revenue,i.e. price times quantity, changes along the demand curve, and that on a straightline demand curve there was one position at which revenue was maximised. Inthe example, which is probably typical of kinked demand curves in real life,revenue is maximised at the current price, i.e. at price P sales revenue (P ×Q)is maximised.
This has important strategic implications for the company. If the companyis not making profit on a product, it is unlikely to be possible to improve netcontribution by increasing the price because any price increase would lead to asubstantial loss in sales. On the other hand, if the company wishes to increasemarket share by reducing the price, it follows that when the price is reducedtotal revenue will be smaller than it otherwise would have been, and henceso will net contribution. When competitive conditions suggest that the demandcurve is kinked, the attempt to increase market share by reducing price canonly be justified if future net contribution will be significantly higher than itotherwise would have been to compensate for the revenue forgone in creatingthe higher market share. This means that there is a trade-off between giving uprevenues now in order to increase market share, and the expectation of higherrevenues in the future when price can be returned to its original level at thehigher market share.
As market conditions change the extent to which the demand curve is kinkedmay also change. For example, if two or three competitors take over a numberof small companies in the industry, it is to be expected that the part of thedemand curve below the kink will steepen. Thus when discussing competitivereaction, it is useful to frame the issue in terms of whether the demand curve islikely to have a significant kink, and what the slope of the demand curve bothabove and below the kink is likely to be.
The idea of the kinked demand curve has an important strategic implicationfor pricing: if it is thought that the demand curve is kinked it follows that itis necessary to make a significant price change and stick with it. Otherwise theprice change will have virtually no effect because of competitor reaction. But thedanger is that a competitive pricing move may lead to a price war the outcomeof which is unpredictable.
5.3.3 Competitive Pricing
Price setting can be used as a competitive tool and short term revenue flowsmay be sacrificed in the pursuit of wider strategic objectives. The three mainforms of competitive pricing are price leadership, limit pricing and predatorypricing.
• Price leadership: the dominant firm in the industry announces its pricechanges before all other firms, which then match the leader’s price. Theproblem for the price leader is that it has to retaliate against defectors tomaintain credibility, and this can be difficult to achieve without sendingout conflicting signals; in fact, it is difficult to see how the price leader
Strategic Planning Edinburgh Business School 5/17
Module 5 / The Company and The Market
can penalise a defector without penalising all of the smaller companies inthe industry. The smaller firms should benefit because they do not need toworry that rivals will secretly reduce price to steal market share, and henceit is in their interest to adopt a passive pricing role. But in a continuallychanging competitive environment price leadership is bound to be a fragilesituation.
• Limit pricing: this is an attempt by a firm to erect an entry barrier by charginga low price in order to deter entry; this is only worthwhile if it has a costadvantage and can set the price low enough to deter entry but still make aprofit. However, in reality incumbent firms should not limit price becausepotential entrants will recognise that any price reductions prior to entry areartificial. Once entry occurs, it would make no sense for the incumbent tocontinue to suppress price. This is because the lost profit opportunities fromhaving previously set the limit price are sunk: once the entrant is in themarket, the incumbent should attempt to maximise future profits. On theother hand, the potential entrant cannot be certain that the incumbent willin fact attempt to maximise profits after his entry, so it then becomes a gamewhere the incumbent attempts to affect the potential entrant’s expectationsabout his subsequent behaviour. It is obviously too simple to think of limitpricing simply as a method of keeping out potential competitors by makingreturns appear low; it is really an issue of expectations.
• Predatory pricing: in this case a firm sets a price with the objective of drivingnew entrants or existing firms out of business. In order to make this strategywork it is necessary for the predator to have some strength, such as a largecash reserve or relatively low costs, which other firms in the industry donot share. This approach could work where a competitor is known to befinancially unstable, but otherwise it is likely to lead to competitive reaction,and we are back to the two person zero sum game.
These approaches to competitive pricing are typically encountered in text-books, but they are rarely found in practice. Probably this is because theycharacterise extreme forms of competitive behaviour which do not occur muchin real life. It is unrealistic to expect one firm to set prices in a competitivemarket, where changes are occurring all the time; firms rarely expect to be ableto deter competitors from entry by engaging in a price war, and recognise thattheir real future lies in competing effectively rather than trying to destroy com-petition; the same applies to eliminating existing competition – it is one thingto try to win market share by pricing competitively, but it is quite another toset out deliberately to ruin a competitor. The point is that competition cannotbe avoided, and a price change which deters or eliminates one competitor isunlikely to have a permanent effect on competitive pressures.
5.4 SegmentationFrom the strategy viewpoint, it is often misleading to think in terms of a productwhich is sold to a homogeneous group of consumers. The theory of competitionin markets starts with the assumption that consumers have identical characteris-tics and have full information about the prices charged for the product; this leads
5/18 Edinburgh Business School Strategic Planning
Module 5 / The Company and The Market
to the notion of a single demand curve for the product, and implies a marketingstrategy which concentrates on the average consumer. However, an appraisalof the potential worth of a product may be radically altered by relaxing theseassumptions and investigating potential market segments based on variationsfrom the average consumer, and the marketing strategies which might be able toexploit them. It may be found that a 5 per cent price reduction may lead to a 1per cent increase in sales volume, suggesting that the product is price inelastic.However, the additional sales due to lower prices may be concentrated amongconsumers in the lowest income group; rather than offering a price reduction toeveryone in the market, it would be more effective to offer the price reductiononly to those in the group who are likely to respond. In this case the lowestincome group is a segment of the market. Thus a market segment is a group ofconsumers within a broader market who possess a common set of characteristics,and consumers in a segment respond to market mix variables in broadly thesame way. An example of a company which focuses on a particular segment isCray Research, which manufactures super computers.
The economic idea underlying segmentation is that the market demand curveis the summation of the demand curves for market segments; these segmentdemand curves can vary significantly in their characteristics. The objective insegmentation is to identify different groups according to their characteristics,estimate how they are likely to react to different selling approaches directed atthem, and allocate marketing effort accordingly.
For example, assume that a company has carried out market research whichhas established that the price elasticity for one of its products varies amongsegments. In terms of the basic model of revenue, segmentation can be expressedas follows.
Revenues = Total markets ×Market shares × Prices
where s = 1, 2, . . . , n andn = segments of the market
The company would attempt to set Price in each of the n segments so that thesum of the Revenues is greater than the original revenue from the non-segmentedmarket. There are many characteristics on the basis of which the market canbe segmented, such as income, social class, geographical location, age, sex,family size, educational background, etc. When the segments are not separatedgeographically it may not be feasible to charge different prices among segments,and in this case the marketing thrust would accentuate product characteristicswhich have a particular appeal to individuals in the different segments.
There are in fact four main characteristics which a segment needs to have if itis to be potentially exploitable:
1 Identifiable: there must be sufficient common features that enable the segmentto be identified in the market place.
2 Demand related: the identified segment must have at least one characteristicwhich translates into demand terms, such as the willingness to pay morefor a high quality product.
Strategic Planning Edinburgh Business School 5/19
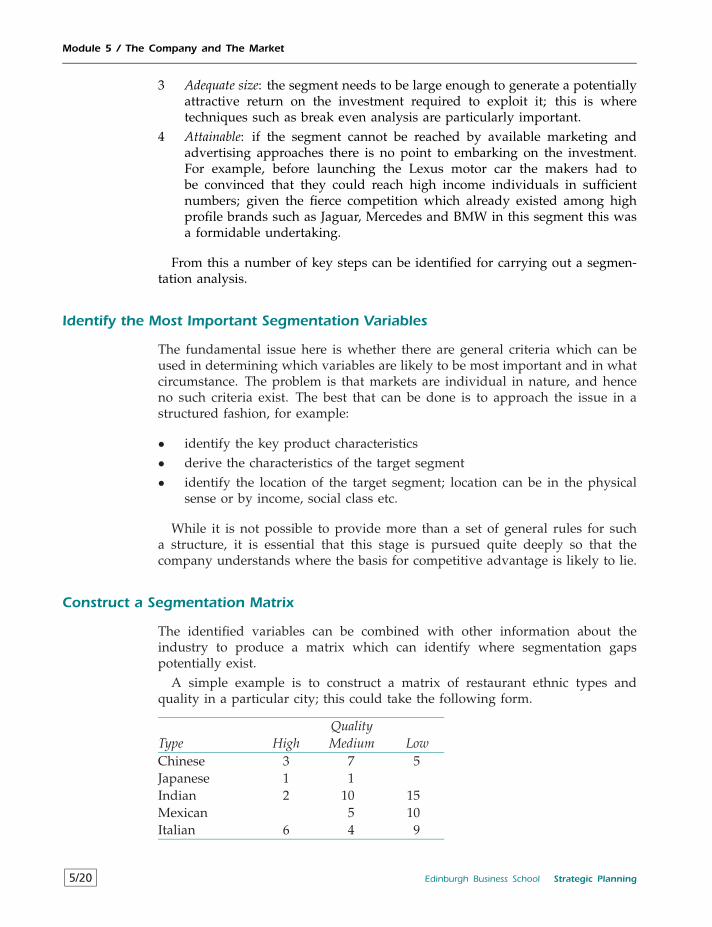
Module 5 / The Company and The Market
3 Adequate size: the segment needs to be large enough to generate a potentiallyattractive return on the investment required to exploit it; this is wheretechniques such as break even analysis are particularly important.
4 Attainable: if the segment cannot be reached by available marketing andadvertising approaches there is no point to embarking on the investment.For example, before launching the Lexus motor car the makers had tobe convinced that they could reach high income individuals in sufficientnumbers; given the fierce competition which already existed among highprofile brands such as Jaguar, Mercedes and BMW in this segment this wasa formidable undertaking.
From this a number of key steps can be identified for carrying out a segmen-tation analysis.
Identify the Most Important Segmentation Variables
The fundamental issue here is whether there are general criteria which can beused in determining which variables are likely to be most important and in whatcircumstance. The problem is that markets are individual in nature, and henceno such criteria exist. The best that can be done is to approach the issue in astructured fashion, for example:
• identify the key product characteristics• derive the characteristics of the target segment• identify the location of the target segment; location can be in the physical
sense or by income, social class etc.
While it is not possible to provide more than a set of general rules for sucha structure, it is essential that this stage is pursued quite deeply so that thecompany understands where the basis for competitive advantage is likely to lie.
Construct a Segmentation Matrix
The identified variables can be combined with other information about theindustry to produce a matrix which can identify where segmentation gapspotentially exist.
A simple example is to construct a matrix of restaurant ethnic types andquality in a particular city; this could take the following form.
QualityType High Medium LowChinese 3 7 5Japanese 1 1Indian 2 10 15Mexican 5 10Italian 6 4 9
5/20 Edinburgh Business School Strategic Planning
Module 5 / The Company and The Market
This classification suggests that there is a gap in the market for high qualityMexican and low quality Japanese restaurants. But care must be taken at thispoint, because the fact that these gaps have been identified does not meanthat they can be profitably filled. For example, there are very few low qualityJapanese restaurants anywhere because of their accent on fresh produce. Thevarious criteria outlined above have also to be taken into account before decidingwhether an investment is worthwhile. It is always necessary to bear in mindthat in a competitive economy there is usually a very good reason for such gapsexisting: they have already been tested and found to be unprofitable.
Analyse Segment Attractiveness
This is a complex process, and involves the use of a variety of strategic mod-els depending on the circumstances. These tools include demand and supplyanalysis, market structures, barriers to entry and many others which will bedeveloped later in the course.
Identify the Key Success Factors
The key success factors are the necessary, but not sufficient, conditions forsuccess. It is possible to identify those activities which must be completed as aprecondition for success. Unless close attention is paid to the identification ofthese factors there is little chance that the segment will be effectively exploited.For example, from the matrix above it might be concluded that there is a gapfor another high quality Japanese restaurant. Some key success factors involvedin exploiting this segment are:
• identify a source of totally fresh sea food;• obtain the services of a highly qualified Japanese cook (who are very rare);• find and decorate premises which provide a Japanese ‘look and feel’.
5.4.1 The Effect of Product Differentiation
For some products it may be virtually impossible to differentiate among con-sumers on the basis of product characteristics because the product does notlend itself to this approach; for example, there is little difference between onegrain of wheat and another. But it may be possible to change the characteristicsof a product in ways which will have particular appeal to different types ofsegment. An obvious example is a car; for the low income family with youngchildren the optimum car is certainly not a two seater high performance sportscar which is relatively expensive both to purchase and run. The product can bethought of as a bundle of characteristics which appeal to different consumers indifferent ways. Product differentiation extends the concept of segmentation tothe determination of which bundle of characteristics should be incorporated inthe version of the product targeted at each group.
There are times when differentiation may be more apparent than real. Dif-ferentiation may simply be a perception on the part of potential buyers, for
Strategic Planning Edinburgh Business School 5/21
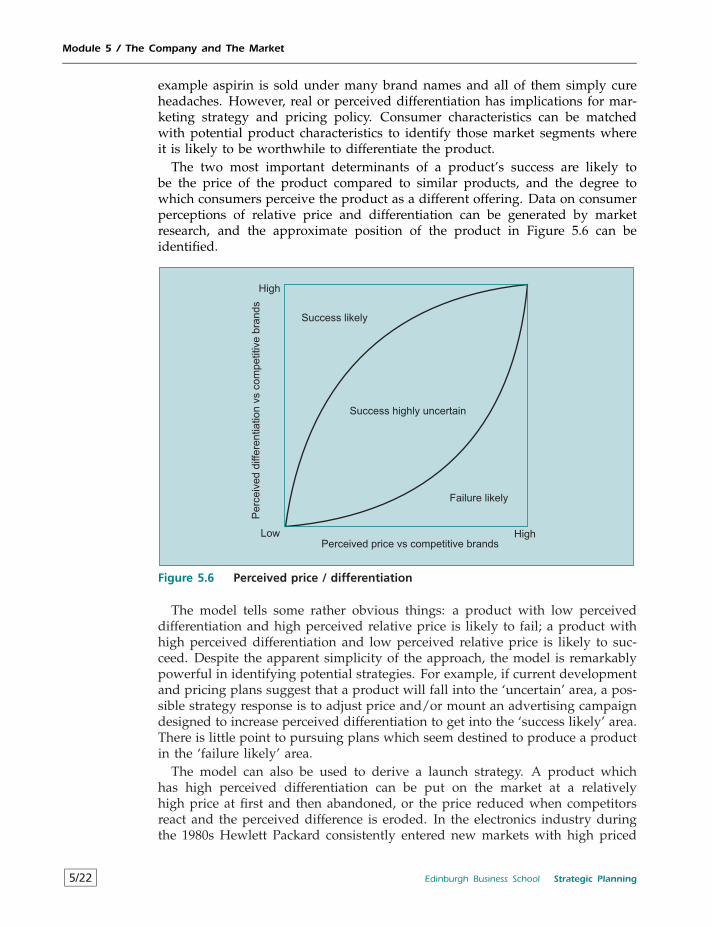
Module 5 / The Company and The Market
example aspirin is sold under many brand names and all of them simply cureheadaches. However, real or perceived differentiation has implications for mar-keting strategy and pricing policy. Consumer characteristics can be matchedwith potential product characteristics to identify those market segments whereit is likely to be worthwhile to differentiate the product.
The two most important determinants of a product’s success are likely tobe the price of the product compared to similar products, and the degree towhich consumers perceive the product as a different offering. Data on consumerperceptions of relative price and differentiation can be generated by marketresearch, and the approximate position of the product in Figure 5.6 can beidentified.
Perc
eiv
ed
diffe
rentiation
vs
com
petitive
bra
nds
Success likely
Success highly uncertain
Failure likely
Perceived price vs competitive brands
High
HighLow
Figure 5.6 Perceived price / differentiation
The model tells some rather obvious things: a product with low perceiveddifferentiation and high perceived relative price is likely to fail; a product withhigh perceived differentiation and low perceived relative price is likely to suc-ceed. Despite the apparent simplicity of the approach, the model is remarkablypowerful in identifying potential strategies. For example, if current developmentand pricing plans suggest that a product will fall into the ‘uncertain’ area, a pos-sible strategy response is to adjust price and/or mount an advertising campaigndesigned to increase perceived differentiation to get into the ‘success likely’ area.There is little point to pursuing plans which seem destined to produce a productin the ‘failure likely’ area.
The model can also be used to derive a launch strategy. A product whichhas high perceived differentiation can be put on the market at a relativelyhigh price at first and then abandoned, or the price reduced when competitorsreact and the perceived difference is eroded. In the electronics industry duringthe 1980s Hewlett Packard consistently entered new markets with high priced
5/22 Edinburgh Business School Strategic Planning
Module 5 / The Company and The Market
differentiated calculators in the knowledge that their competitive advantagewould be relatively short lived. This is because the technology could be copied;the subsequent entry of new competitors bid away monopoly profits, but bythat time Hewlett Packard had made its return and could move on to anotherdifferentiated product.
5.4.2 Pricing in Segments
It goes without saying that market conditions differ among segments, and thatdifferent prices can be charged in each. However, it may well be the casethat there are virtually no differences in the cost of products sold in differentsegments; for example, where segments are based on geographical rather thanproduct differentiation there may be no difference in the production cost ineach. What is the optimum price to charge in each segment? This topic has beenextensively treated in economics, and is known as discriminating monopoly. Theeconomic theory is relevant here because the effect of segmentation is to confersome degree of monopoly power to the company in the different segments; italso stresses the importance of market rather than cost conditions when settingprices.
Without elaborating the theory (which can be found in any intermediate leveleconomics textbook), it will come as no surprise that the conclusion arrived at isthat, in pursuit of profit maximisation, a monopolist will charge different pricesin different markets depending on demand conditions.
The monopolist will charge a higher price in a market with a low demandelasticity than in a market with a high demand elasticity.
This follows despite the fact that the marginal cost of production is identical ineach market. In terms of the basic model, the theory is concerned with findingthe price in each market for which revenue minus cost is maximised.
The implication for pricing is clear: if different demand conditions exist indifferent parts of the market different prices should be charged, even thoughcosts are the same in each. There is a real payoff from finding out what thedifferent demand conditions are, rather than setting a uniform price in all partsof the market. This is because total profit from the uniform price is lowerthan the sum of profits obtained from differential pricing. This arises fromselling more of the product at a lower price in the segments where demandis relatively responsive to price, and less of the product at a higher price insegments where demand is relatively unresponsive to price. Segmentation istherefore a potentially powerful tool for transforming a loss-making productinto a profitable product without changing anything but the price charged todifferent groups of consumers.
Marketing practitioners have turned segmentation into an operational toolfor exploiting markets. The first step is to carry out research to determine thecharacteristics of different segments of the market, and the product characteristicswhich might best match with them. The second step is to derive estimates ofprice and income elasticities; in marketing terminology, this is often expressedas price and income responsiveness. The additional feature added by marketingstrategy is that the product itself is adjusted to match as closely as possible the
Strategic Planning Edinburgh Business School 5/23
Module 5 / The Company and The Market
demand characteristics of the different segments, or advertising campaigns aremounted to affect the perception of potential consumers that differences exist indifferent brands of the same product.
Because resources are required to differentiate products, marginal cost maynot be identical in the different market segments; however, the principle ofdifferential pricing based on market conditions still applies despite the fact thatproduction costs are different. The theory of price discrimination, on whichdifferentiation is based, can be developed further to demonstrate that there arelimits to the extent of segmentation depending on the impact of segmentationon costs. The potentially higher revenues from segmenting the market, differ-entiating the product and setting different prices can be balanced against theadditional costs incurred in each segment in order to obtain an approximationto the limits imposed by cost differences.
Market segmentation is a good example of how economic, accounting andmarketing approaches can be integrated to provide a conceptual structure to dealwith the diverse information encountered in real life. For example, marketingideas identify a product where segmentation is potentially viable; economic ideasare used to measure demand characteristics, and emphasise the role of marginalcost in decision making; accounting ideas are applied to abstract marginal cost. Itcan be noted that relevant accounting information on marginal costs is essentialfor making rational segmenting decisions: unless the marginal costs relating toproduct differentiation are properly estimated, the result may be what appears tobe a successful marketing strategy in terms of capturing market share, but poorprofits because the use of the wrong costs led to a misallocation of resources.
5.5 Product QualityOne of the most frequently encountered methods of product differentiation is byreference to the superior quality of a company’s product or service. But whilemany managers believe that part of their company’s appeal to customers isattributable to the superior quality of their products, they are often vague aboutexactly what the quality difference comprises. The consumer magazines, suchas Which? in the UK, which carry out comparative studies of products made bydifferent companies often find that products differ only marginally, and that theirdefinition of a ‘best buy’ often bears little relation to manufacturers’ advertisingclaims. This confusion is not restricted to consumers; disagreement is oftenencountered among employees within a given company on what constitutesquality. Some take the view that quality depends on the production process, inother words it depends on how the product is made; others feel that qualitydepends on reliability in use. There are several approaches to the definition andmeasurement of quality, therefore it is important that managers are clear aboutwhat they mean by quality prior to allocating resources either to increasingquality or exploiting it in the market place.
Transcendent Quality
The philosophical approach to quality is based on a form of circular reason-ing which robs the concept of operational use for decision making purposes.
5/24 Edinburgh Business School Strategic Planning
Module 5 / The Company and The Market
Essentially, the Platonic definition relates quality to high standards of excellenceand achievement which can only be recognised in the light of experience. Thusa painting by a great master appeals to an art critic who has devoted a largepart of his life to the study of art, but will be little more than a pretty pictureto a 16-year-old who has had no art education. The pursuit of transcendentstandards by managers is unlikely to be related to commercial criteria given thedifficulty of defining what comprises these standards.
Product Based Quality
A product can be viewed as a bundle of characteristics, most of which aresusceptible to some form of measurement. For example, compare flying fromLondon to New York first class in a Boeing 747 with flying Concorde. Concordetakes less time, and this can be measured. However, first class is more com-fortable than the rather cramped Concorde, and different passengers will havedifferent views on how great the difference in comfort actually is. There is there-fore no guarantee that passengers would agree on which is the higher qualityflight. Those who actually chose to fly Concorde have obviously decided that itprovides a higher quality service for the price charged.
The characteristics approach has considerable power in classifying productsand identifying what it is that consumers are willing to pay for, but productcharacteristics are not necessarily determinants of product quality; this is becausequality may be dependent on how well the characteristics are produced orcombined together.
Sometimes manufacturers incorporate characteristics which have little rele-vance to consumers, but which are thought to enhance the quality image ofthe product. For example, it does not matter much to the average consumerthat a particular make of watch will function at 100 metres below water. Whilethe resulting image of dependability may help sales of the watch, the cost ofbuilding a case which can withstand high pressure may far outweigh the returnfrom the additional sales. In that sense it could be claimed that the watch had‘too much’ quality.
This notion of quality also applies to service industries, where quality andconsistency are closely linked; most people have had the experience of recom-mending a restaurant which failed to deliver the same quality for someone else.The consistency characteristic is important, because if it has not been achievedthe consumer can have no confidence that he will be able to buy the sameproduct each time. But consistency is not actually part of the quality itself,which in the restaurant depends on the raw materials and the ability of the chef.
There can be very high costs associated with improving dimensions of qual-ity. For example, an important quality dimension in electricity supply is theincidence of interruptions. It is impossible to guarantee zero interruptions to allconsumers and everyone accepts this; however, consumers would not be satis-fied with hourly interruptions. Imagine that the supply company operated witha 5 per cent probability that the average consumer will have an interruptionduring any one month period. A huge number of complaints were received andthe company decided to improve on the 5 per cent figure. It might well discover
Strategic Planning Edinburgh Business School 5/25
Module 5 / The Company and The Market
that the cost of reducing the probability to 4 per cent was relatively low, but thecost of reducing it a further point to 3 per cent was twice as much, while thecost of getting down to 2 per cent was ten times as much. The electricity supplycompany would then try to balance up the marginal costs with the increasein consumer satisfaction. For example, if consumers were unable to tell thedifference between 3 per cent and 2 per cent it might be worthwhile reducingthe probability to 3 per cent but no further.
User Based Quality
This approach departs from the functionally based product characteristic differ-entiation, and enters the conceptual minefield of what it is that contributes toquality in the eyes of the consumer. An economic interpretation is that productquality variations cause differences in the position of the demand curve forproducts which are otherwise identical. But it is difficult to determine whatthese quality variations might be. For example, take the case of two productswhich have identical functional characteristics; what is left to vary? One mightlook better than the other to many consumers, or have what is typically referredto as a ‘better design’. For example, this is a feature ascribed to different makesof electric kettle, where the appearance can be changed but it is virtually impos-sible to alter the functional characteristics: the kettle still boils water and nothingelse.
Almost every user based definition of quality can be reinterpreted as a func-tional, measurable characteristic. For example, durability, flexibility, strength andspeed are all definable as functional characteristics. One marketing approach isto attempt to identify ‘ideal points’, which are precise combinations of char-acteristics which provide maximum satisfaction to consumers. This takes intoaccount that the interaction of different quality dimensions can produce moreutility than the sum of the individual parts. While this can provide useful guide-lines, it is really an operational application of quality characteristics in relationto consumer satisfaction rather than a method of defining quality itself.
Production Based Quality
This approach relates to production in conformance with specifications. Notionssuch as getting it right first time, statistical quality control, and designs intendedto reduce the scope for manufacturing mistakes, all have the objective of pro-ducing the same product each time. To some extent the manufacturing basedapproach can be interpreted as a cost reduction exercise, with the objective ofproducing a given set of product characteristics at the lowest average cost. Whilea component of the concept of quality is that each unit performs to the designstandards, it begs the question of what comprises the quality standard in thefirst place, and why the particular array of characteristics was originally chosen.
Value Based Quality
This is a hybrid notion which combines the price, or production cost, with thequality. According to this definition, a running shoe costing $600 is not a quality
5/26 Edinburgh Business School Strategic Planning
Module 5 / The Company and The Market
product, since no one would buy it. This definition can be interpreted in termsof the economic ideas of marginal and total utility. The value based definitionof the running shoe hinges on the fact that at the margin consumers would beunwilling to pay the high marginal cost associated with virtually undetectablemarginal differences in product characteristics. The marginal cost associated withimproving aspects of the running shoe’s characteristics becomes progressivelyhigher, while the additional utility which the consumer obtains from incrementsto these characteristics continually declines. Thus while the total utility whichthe consumer would obtain from the $600 running shoe would be much higherthan for a shoe costing $120, consumers do not value the difference at $480.
Many cases do exist, however, where seemingly marginal differences in char-acteristics are translated into very large price differences which consumers arewilling to pay. An obvious example is the willingness to pay three times asmuch for a Rolls-Royce as a Jaguar; it might be argued that the marginal utilityof the additional $150 000 is less than the dimly perceived additional comfortand performance of the Rolls-Royce. Indeed, it may be that the quality differencehas been established by prolonged advertising campaigns, which have stressedthe quality aspects of the product process without being clear what the qualitydifference amounts to for the consumer. Rolls-Royce advertising campaigns havestressed the care taken over the production standard of every single component,but whether this can be translated to the consumer in terms of an identifiabledifference in utility in use is left open. Whether it matters to the consumerthat a particular part of the car is ‘hand built’ is another matter; producers areoften confused about the difference between the production process and the finalcharacteristics of the product. Managers should attempt to determine when aparticular production process merely adds to costs rather than to market appeal.The Morgan car company, a British company which makes a range of old stylesports cars, refused to alter its production processes in line with technology, andinsisted that the whole car be built ‘by hand’; while this helped to foster theimage of a unique product, the costs associated with this form of quality weresuch that the firm ran into serious financial problems. The Morgan car companycould not translate the hand built image into a price which consumers werewilling to pay.
It is possible that a great deal of what is thought of as quality rests on aperception which is reinforced by the norms of society. It may well be that amarket does exist for a $600 Gucci running shoe, which is merely a standardrunning shoe with the exclusive label attached.
5.5.1 Dimensions of Quality
A framework for assessing the multidimensional nature of quality can be gen-erated by being explicit about the potential dimensions of quality, for exampleGarvin1 suggests:
• performance• features• reliability
Strategic Planning Edinburgh Business School 5/27
Module 5 / The Company and The Market
• conformance• durability• serviceability• aesthetics• overall perceived quality
It is not claimed that these dimensions can be defined precisely, but it ispossible for informed consumers to rate these dimensions to reflect their ownperceptions. It is reasonable to conclude that a product which achieves a lowrating on all dimensions will also have a low weighting for overall perceivedquality. This can by taken further by asking a sample of consumers to rate aproduct’s characteristics to use as the basis for identifying those dimensionswhich contribute to the average consumer’s perception of overall quality. Thisimplies a relationship between overall perceived quality and the individualdimensions of the following type:
Perceived Quality = a1 × Performance + a2 × Features + . . . + a7 × Aesthetics
where a1, . . . , a7 are weights
Without entering into the details, statistical methods can be used to estimatethe weights which determine the contribution which each dimension makes tooverall perceived quality. For example, it may be found that the dimensionwith the highest contribution to overall quality is ‘durability’ in the case ofphotocopiers, and ‘features’ in the case of video recorders. The results canprovide information on the basis of which to differentiate the product, and todetermine which product characteristics should be enhanced.
It is likely that people of different backgrounds will attribute different weightsto different dimensions; statistical techniques, such as cluster analysis, can beused to relate market segments and product dimensions. The process of iden-tifying dimensions of quality and segmenting the market makes it potentiallypossible to identify exploitable niches and identify which quality dimensionshave the potential for profitable development. For example, it might be foundthat higher income groups give a higher weighting to aesthetics than lowerincome groups; this would clearly be a valuable item of information for thepurposes of targeting an advertising campaign.
A similar approach uses the price as the dependent variable and variousproduct characteristics as the explanatory variables. The relationship wouldlook like this for a washing machine:
Price = b1 × Capacity + b2 × Spin speed + . . . + b7 × Reliability
where b1, . . . , b7 are weights
The statistical analysis would be carried out for a variety of washing machinesand the estimated weights would show how much consumers are willing to payfor different characteristics. This is known as a hedonic price index and is auseful measure of the value of product characteristics since it measures whatconsumers are willing to pay for. While the statistical analysis is rarely donein practice, the process is implicitly carried out every time a pricing decision ismade for a differentiated product.
5/28 Edinburgh Business School Strategic Planning
Module 5 / The Company and The Market
5.5.2 Quality and Strategy
A considerable amount of research has been carried out into the relationshipbetween product characteristics and market performance; the findings providesome pointers which are helpful for strategy formulation. Some quality relatedissues which might appear to be self-evident are not necessarily true. For exam-ple, quality and price may be expected to be positively related, other thingsbeing equal, because of the additional production costs associated with higherquality. However, when different dimensions of quality are taken into account,the price-quality relationship is obscure. This means that a company cannotassume that it will be able to charge a higher price after having improved theperceived quality of its product. Another finding relates to quality and advertis-ing; it might be expected that quality and advertising expenditure are positivelyrelated, given the higher returns to advertising for higher quality products.Again, the evidence is ambivalent. It may be the case that investment in higherperceived quality is a substitute for advertising expenditure. The trouble is thatconsumers do not always have much direct information on quality, and it isnecessary to infer quality from the behaviour of others. For example, in 1994American Express launched an advertising campaign based on the length oftime that famous people had been subscribers; the clear implication is that thequality of American Express service can be inferred from the fact that manyfamous people were willing to be associated with it.
There is some evidence that quality is positively related to market share,suggesting that investment in perceived quality has paid off in the past inmarketing terms. There is also some evidence that quality and profitability (asmeasured by ROI) are correlated. Thus on balance, there is some evidence thatthe pursuit of quality may generate returns in terms of competitive advantageand profits. However, while the empirical evidence suggests that importantinfluences are at work, it is not clear cut, and the payoff from quality may varysubstantially depending on the circumstances. The high quality ice cream madeby Haagen-Dazs is a major success in America and Japan; it was launched inEurope in 1990 and had a significant impact on the ice cream market, causingexisting producers such as Nestle and Unilever to introduce their own luxurybrands and heightening the awareness of quality ice cream among Europeanconsumers. But five years later Haagen-Dazs was still making substantial lossesand had a relatively small share of the market. Thus having virtually createdthe high quality ice cream market in Europe, Haagen-Dazs was unable to profitfrom it; there are many reasons for the lack of profitability, including the logisticsof the ice cream market, the scale of operations and the reaction of competitors.But the clear message is that a product with a high perceived quality does notguarantee financial viability.
While quality appears to be a potentially powerful strategy tool, it is difficultto be precise about exactly how it might contribute to company success:
Managers must learn to think carefully about how their approach to quality changesas a product moves from design to market, and they must devise ways to cultivatethese multiple perspectives. Attention must be focused on the separate dimensionsof quality; markets must be closely examined for any untapped quality niches;and the organisation must be tailored to support the desired focus. Once these
Strategic Planning Edinburgh Business School 5/29
Module 5 / The Company and The Market
approaches have been adopted, cost savings, market share gains, and profitabilityimprovements can hardly be far behind.2
The idea that quality is a fundamental determinant of success has generatedan approach known as total quality management (TQM). As its name suggests,quality in all its dimensions is pursued with a high degree of rigour and commit-ment. Notions of quality are brought to the forefront of awareness, and includeall aspects of company performance through production processes and customerservice. Some countries have introduced formal quality standards against whichcompanies can be appraised; for example, in the UK the BS5750 award signalsthat a company has met various quality criteria relating to production processes.But the pursuit of TQM is by no means an exact science because of the diffi-culty of defining quality and providing the incentives which will make qualityinitiatives work. TQM took on the characteristics of a philosophy rather thana particular business technique, and is greatly dependent for its success on theenergy and commitment of the approach in particular circumstances. TQM isa relatively recent development and gained its momentum during the 1980s,but by the mid 1990s scepticism had set in. This occurred because, while therewere some well publicised instances where TQM appeared to have been suc-cessful (for example Rank Xerox and Motorola), surveys revealed that up to 80per cent of TQM initiatives failed. Systematic research on the issue3 concludesthat the features most generally associated with TQM, such as quality training,process improvement and benchmarking, do not in themselves produce com-petitive advantage; this is probably because these can be imitated by competitorswithout necessarily being associated with a TQM programme. However, sometacit and behavioural features such as an open culture, employee empowermentand executive commitment do appear to be associated with advantage. In otherwords these tacit characteristics, and not TQM tools and techniques, drive TQMsuccess, and organisations that acquire them can perform relatively better thancompetitors without the accompanying TQM ideology.
From the perspective of the basic model of revenue and cost, the variousnotions of quality can be related to the determinants of revenue and cost.
Revenue = Total market × Market share × PriceOutlay = Number of workers × Wage rate +
Units of capital × Price +Units of material × Price
Discussions on quality can benefit from identifying which areas of revenueand/or cost are likely to be affected by different quality dimensions, and inwhich market segments. One of the effects of TQM was to demonstrate thatthere was not necessarily a trade-off between quality and cost, and many com-panies which successfully implemented TQM programmes reported simultane-ous increases in productivity and quality. However, it may be that successfulTQM programmes have merely eliminated inefficiencies in companies and afterthis has been achieved there is no such thing as a costless improvement inquality. Table 5.6 shows how it might be possible to relate variations in differentquality dimensions to potential implications for market share and production
5/30 Edinburgh Business School Strategic Planning
Module 5 / The Company and The Market
cost in a particular market segment; the entries would depend on the circum-stances facing the individual company.
Table 5.6 The effect of quality
Impact on
Dimension market share production cost
Performance High High
Reliability High Low
Conformance Low Medium
Aesthetics Medium Low
For this company a relatively low production cost incurred to improve relia-bility would lead to a potentially high impact on market share. While improve-ments in performance are also likely to lead to a high impact on market share,the high cost associated with performance may make it a less attractive optionthan improving aesthetics. This cost based approach is at odds with TQM, whichholds that all aspects of quality are important because of the interdependence ofthe various functions in the company.
5.6 Product Life CyclesThe notion of product life cycles has implications for all aspects of strategy.Managers are well aware that markets are not static, and that they are continuallychanging in terms of growth rates and competitive conditions; the product lifecycle is a powerful tool for systemising many of the changes in these factorsby providing an overview of the evolution of the market for a product, thusenabling managers to interpret the current market situation and future prospectsin a structured manner. It is a widely held view that the product lives of manygoods are likely to continue to shorten as the pace of technological change andinformation transfer increases.
The product life cycle is depicted in Figure 5.7, which is a general representa-tion rather than referring to any particular product.
Introduction: the product is invented and introduced to the market; it can takesome time for information about the product to be disseminated
Growth: the product becomes increasingly well known, markets are penetratedand it possibly replaces other products
Maturity: all markets are exploited and there is no further increase in salesDecline: the product is superseded by technological progress, or substitutes
appearSince industries are composed of products the idea of the life cycle can be gen-
eralised to the industry level, and Figure 5.7 can be regarded as either referringto a product or to the industry. Everyone is familiar with industry life cycles inbroad terms, for example, the very high rates of growth in the personal computermarket, which have now slackened off as the industry approaches maturity, orthe decline of the cigarette industry in Western countries as information on thehealth risk of smoking reduces the number of consumers. In fact, as the pace of
Strategic Planning Edinburgh Business School 5/31
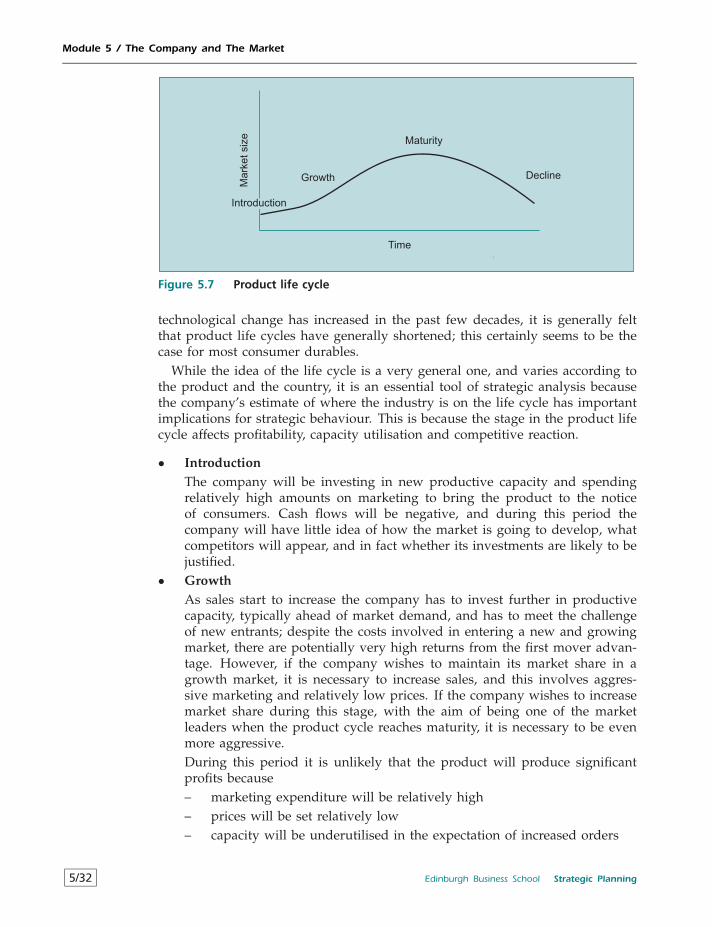
Module 5 / The Company and The Market
TimeM
ark
etsiz
e
Growth
Maturity
Decline
Introduction
Figure 5.7 Product life cycle
technological change has increased in the past few decades, it is generally feltthat product life cycles have generally shortened; this certainly seems to be thecase for most consumer durables.
While the idea of the life cycle is a very general one, and varies according tothe product and the country, it is an essential tool of strategic analysis becausethe company’s estimate of where the industry is on the life cycle has importantimplications for strategic behaviour. This is because the stage in the product lifecycle affects profitability, capacity utilisation and competitive reaction.
• IntroductionThe company will be investing in new productive capacity and spendingrelatively high amounts on marketing to bring the product to the noticeof consumers. Cash flows will be negative, and during this period thecompany will have little idea of how the market is going to develop, whatcompetitors will appear, and in fact whether its investments are likely to bejustified.
• GrowthAs sales start to increase the company has to invest further in productivecapacity, typically ahead of market demand, and has to meet the challengeof new entrants; despite the costs involved in entering a new and growingmarket, there are potentially very high returns from the first mover advan-tage. However, if the company wishes to maintain its market share in agrowth market, it is necessary to increase sales, and this involves aggres-sive marketing and relatively low prices. If the company wishes to increasemarket share during this stage, with the aim of being one of the marketleaders when the product cycle reaches maturity, it is necessary to be evenmore aggressive.During this period it is unlikely that the product will produce significantprofits because– marketing expenditure will be relatively high– prices will be set relatively low– capacity will be underutilised in the expectation of increased orders
5/32 Edinburgh Business School Strategic Planning
Module 5 / The Company and The Market
• MaturityDuring this stage the company is able to gear its productive capacity todemand, and techniques such as Just In time can be introduced to minimisecosts. If the company has not gained a significant market share by the timethe market matures it will find it very difficult to do so because takingcustomers away from competitors is difficult and costly; on the other hand,if the company has achieved a high market share it will have the basis fora strong competitive advantage. Unless there is strong competitive pressureprice does not need to be set below that of competitors to keep the existingmarket share, and marketing expenditure can be reduced. Thus once themarket has stabilised selling costs can be reduced and this generates thepotential for substantial positive net cash flows.
• DeclineThe company has to decide whether to exit the industry, or phase out itsproductive capacity. This is not the time to be undertaking new investments,which is why it is important that companies recognise the threat posed bythis stage of the life cycle.
The product life cycle model needs to be seen in the context of the businesscycle. If consumer incomes are increasing, this may cause an increase in marketsize during the mature part of the life cycle, at a time when significant increaseswould not normally be expected. Real product life cycles will not be smoothbut will have an uneven pattern depending on the extent to which the productis affected by economic circumstances. It is obviously difficult to differentiatebusiness cycle effects from the underlying product life cycle. However, it isimportant to do so, because the strategy implications of a fall in sales due to atemporary reduction in consumer incomes differ from those due to the onset ofthe end of the product life cycle.
There are various approaches to defining the product life cycle; some analystsuse the pattern of company sales, others total market sales, and others profitgeneration. It is therefore important to define what is meant by the market. Forexample, definitions of the market for TV sets include:
1 The total number of TV sets in existence.2 The total number of TV sets sold this year.3 The total value of TV sets sold this year.4 The number of TV sets sold by the company this year.5 The value of TV sets sold by the company this year.
Definition one tells us how many people are using TV sets, not how manypeople are likely to buy a TV set and how much they are likely to spend, whichis the concern of producers and sellers of TV sets; definitions two and threeare of direct interest to companies in the industry since they relate to potentialsales volumes and revenues. Definitions four and five are the outcome of thecompany’s strategy; it is obviously a mistake to define the market in terms ofthe sales which the company actually makes, rather than in terms of the total
Strategic Planning Edinburgh Business School 5/33
Module 5 / The Company and The Market
sales of the product. Definition two is the same definition of the Total Marketused in the basic model of revenue:
Revenue = Total market×Market share× Price
In the absence of significant changes in Market Share and Price, the TotalMarket drives revenue over the product life cycle. Thus any information aboutthe likely shape and duration of the product life cycle would be of immensevalue to the company. Predictions of product life cycles are as imprecise as anyother type of forecasting, but some product characteristics can help to generatea rough idea of what the life cycle might look like.
• Substitutes: can the want which the product satisfies be performed in someother way which has not yet been marketed? For example, the telex machine(which few people now know about) was the method of sending messagesworld-wide until the advent of the fax machine in the mid 1980s, whichdid the same job but was easier to use and did not need messages to betyped in. The fax heralded the end of the telex product life cycle, but it wasimpossible to predict in, say, 1970 when such a substitute would appear.
• Technology: if there is rapid technological change a product may soon besuperseded by something superior and probably cheaper. Again, it is impos-sible to predict obsolescence but technological advances can be incorporatedinto new products quite quickly.
• Durability and replacement: some goods are bought for immediate con-sumption, such as food, while others are bought for the services theywill generate some time into the future, such as a TV set. Once everyonewho wants a TV set has one then sales will be dependent on replacementdemand.
This is not an exhaustive list of the factors which are likely to affect the productlife cycle. The individuals who work with a product, both on production andsales, will typically have a detailed knowledge of the product in relation to themarket and can often provide a reasoned outline of how they see the productlife cycle developing.
As you might expect, there is some debate about the validity of the productlife cycle concept, and whether it is of universal applicability. The researchinto product life cycles has revealed that they have many shapes, durations andsequences, and this has added to the doubts which many people have. However,the fact that product life cycles take many forms does not necessarily mean thatthe idea of product life cycles is useless. The idea provides a structure withinwhich data can be interpreted and, as will be seen, is an important dimensionof a more general strategic framework.
5.7 Portfolio ModelsThe concepts of demand analysis, differentiation and segmentation are importantcomponents in the formulation of strategy. But a major drawback of the economicapproach is the use of comparative statics, which compares one time periodwith another, rather than taking the passage of time explicitly into account. It is
5/34 Edinburgh Business School Strategic Planning
Module 5 / The Company and The Market
the dynamic development of markets and competition over time which makesstrategy so complex. The portfolio model approach incorporates dynamics intothe interpretation of product positioning.
5.7.1 The BCG Relative Share Growth Matrix
The best known of the portfolio models focuses on two factors: relative marketshare, and the stage of the product life cycle. The relative market share isdefined in terms of the company’s market share compared to that of its leadingcompetitors. The implications of relative market share are potentially importantfor competitive advantage, and arise from two influences.
1 Economies of scale: as the productive capacity of the company increasesaverage cost falls (up to some limiting size). The higher a company’smarket share the larger must be its productive capacity compared to itscompetitors. A sale made by one company is a sale not made by anothercompany, thus the higher the market share of one company, the smallermust be competing companies on average, and the less their opportunitiesto capture economies of scale. When economies of scale exist, it follows thatthe higher the market share of a company compared to that of competitors,the lower will be its relative unit cost. This assumes, of course, that thelarger company is sufficiently efficient to benefit from potential economiesof scale.
2 The experience effect: a company with the highest market share to date musthave a higher cumulative output to date than its competitors, and hence itslabour force has the potential to be higher up the learning curve, resultingin lower per unit labour costs. As a company produces additional unitsof output, other factors also contribute to continuing cost reductions; theseinclude fewer rejects and better designed production lines. The combinationof the effect of the learning curve and these influences results in what isknown as the experience curve; research suggests that each doubling ofoutput leads to a 20 per cent reduction in unit cost because of experienceeffects.
Thus having a high market share confers two types of cost advantage on thecompany: economies of scale and experience effects. The combination of thetwo is a potentially important determinant of relative production costs.
Expanding the basic model to include unit cost gives the following:
Revenue = Total market × Market share × PriceOutlay = Number of workers × Wage rate +
Units of capital × Price +Units of material × Price
Unit cost = Outlay / (Total market × Market share)
The potential advantage conferred by a higher market share is that unit costwill be lower than that of competitors.
Strategic Planning Edinburgh Business School 5/35
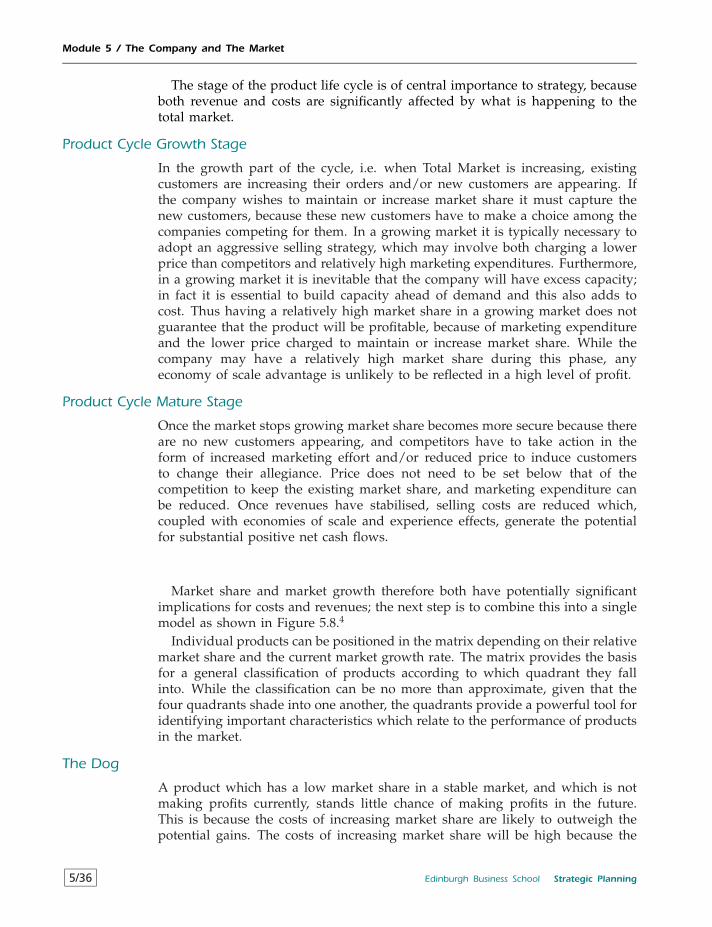
Module 5 / The Company and The Market
The stage of the product life cycle is of central importance to strategy, becauseboth revenue and costs are significantly affected by what is happening to thetotal market.
Product Cycle Growth Stage
In the growth part of the cycle, i.e. when Total Market is increasing, existingcustomers are increasing their orders and/or new customers are appearing. Ifthe company wishes to maintain or increase market share it must capture thenew customers, because these new customers have to make a choice among thecompanies competing for them. In a growing market it is typically necessary toadopt an aggressive selling strategy, which may involve both charging a lowerprice than competitors and relatively high marketing expenditures. Furthermore,in a growing market it is inevitable that the company will have excess capacity;in fact it is essential to build capacity ahead of demand and this also adds tocost. Thus having a relatively high market share in a growing market does notguarantee that the product will be profitable, because of marketing expenditureand the lower price charged to maintain or increase market share. While thecompany may have a relatively high market share during this phase, anyeconomy of scale advantage is unlikely to be reflected in a high level of profit.
Product Cycle Mature Stage
Once the market stops growing market share becomes more secure because thereare no new customers appearing, and competitors have to take action in theform of increased marketing effort and/or reduced price to induce customersto change their allegiance. Price does not need to be set below that of thecompetition to keep the existing market share, and marketing expenditure canbe reduced. Once revenues have stabilised, selling costs are reduced which,coupled with economies of scale and experience effects, generate the potentialfor substantial positive net cash flows.
Market share and market growth therefore both have potentially significantimplications for costs and revenues; the next step is to combine this into a singlemodel as shown in Figure 5.8.4
Individual products can be positioned in the matrix depending on their relativemarket share and the current market growth rate. The matrix provides the basisfor a general classification of products according to which quadrant they fallinto. While the classification can be no more than approximate, given that thefour quadrants shade into one another, the quadrants provide a powerful tool foridentifying important characteristics which relate to the performance of productsin the market.
The Dog
A product which has a low market share in a stable market, and which is notmaking profits currently, stands little chance of making profits in the future.This is because the costs of increasing market share are likely to outweigh thepotential gains. The costs of increasing market share will be high because the
5/36 Edinburgh Business School Strategic Planning
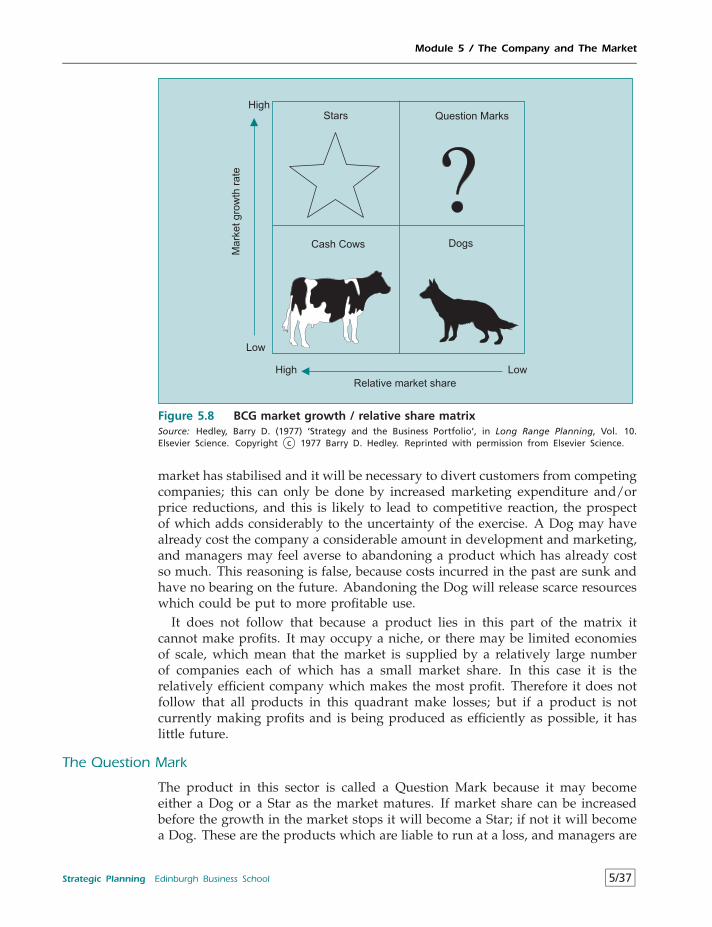
Module 5 / The Company and The Market
Cash Cows Dogs
Stars Question Marks
Relative market share
Ma
rke
tg
row
thra
te
High
Low
High Low
Figure 5.8 BCG market growth / relative share matrixSource: Hedley, Barry D. (1977) ‘Strategy and the Business Portfolio’, in Long Range Planning, Vol. 10.Elsevier Science. Copyright c© 1977 Barry D. Hedley. Reprinted with permission from Elsevier Science.
market has stabilised and it will be necessary to divert customers from competingcompanies; this can only be done by increased marketing expenditure and/orprice reductions, and this is likely to lead to competitive reaction, the prospectof which adds considerably to the uncertainty of the exercise. A Dog may havealready cost the company a considerable amount in development and marketing,and managers may feel averse to abandoning a product which has already costso much. This reasoning is false, because costs incurred in the past are sunk andhave no bearing on the future. Abandoning the Dog will release scarce resourceswhich could be put to more profitable use.
It does not follow that because a product lies in this part of the matrix itcannot make profits. It may occupy a niche, or there may be limited economiesof scale, which mean that the market is supplied by a relatively large numberof companies each of which has a small market share. In this case it is therelatively efficient company which makes the most profit. Therefore it does notfollow that all products in this quadrant make losses; but if a product is notcurrently making profits and is being produced as efficiently as possible, it haslittle future.
The Question Mark
The product in this sector is called a Question Mark because it may becomeeither a Dog or a Star as the market matures. If market share can be increasedbefore the growth in the market stops it will become a Star; if not it will becomea Dog. These are the products which are liable to run at a loss, and managers are
Strategic Planning Edinburgh Business School 5/37
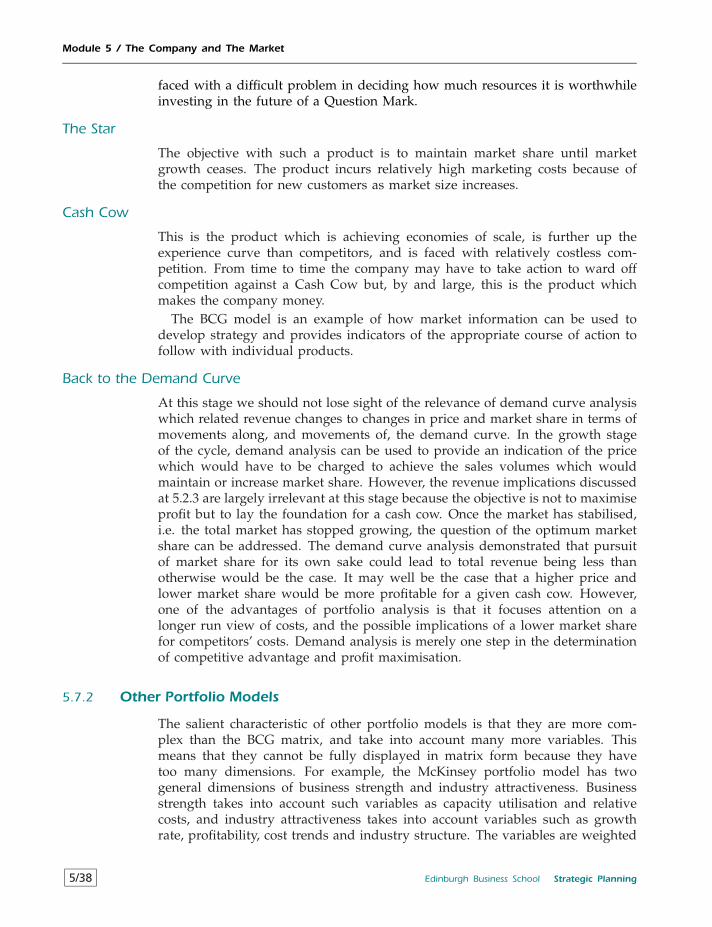
Module 5 / The Company and The Market
faced with a difficult problem in deciding how much resources it is worthwhileinvesting in the future of a Question Mark.
The Star
The objective with such a product is to maintain market share until marketgrowth ceases. The product incurs relatively high marketing costs because ofthe competition for new customers as market size increases.
Cash Cow
This is the product which is achieving economies of scale, is further up theexperience curve than competitors, and is faced with relatively costless com-petition. From time to time the company may have to take action to ward offcompetition against a Cash Cow but, by and large, this is the product whichmakes the company money.
The BCG model is an example of how market information can be used todevelop strategy and provides indicators of the appropriate course of action tofollow with individual products.
Back to the Demand Curve
At this stage we should not lose sight of the relevance of demand curve analysiswhich related revenue changes to changes in price and market share in terms ofmovements along, and movements of, the demand curve. In the growth stageof the cycle, demand analysis can be used to provide an indication of the pricewhich would have to be charged to achieve the sales volumes which wouldmaintain or increase market share. However, the revenue implications discussedat 5.2.3 are largely irrelevant at this stage because the objective is not to maximiseprofit but to lay the foundation for a cash cow. Once the market has stabilised,i.e. the total market has stopped growing, the question of the optimum marketshare can be addressed. The demand curve analysis demonstrated that pursuitof market share for its own sake could lead to total revenue being less thanotherwise would be the case. It may well be the case that a higher price andlower market share would be more profitable for a given cash cow. However,one of the advantages of portfolio analysis is that it focuses attention on alonger run view of costs, and the possible implications of a lower market sharefor competitors’ costs. Demand analysis is merely one step in the determinationof competitive advantage and profit maximisation.
5.7.2 Other Portfolio Models
The salient characteristic of other portfolio models is that they are more com-plex than the BCG matrix, and take into account many more variables. Thismeans that they cannot be fully displayed in matrix form because they havetoo many dimensions. For example, the McKinsey portfolio model has twogeneral dimensions of business strength and industry attractiveness. Businessstrength takes into account such variables as capacity utilisation and relativecosts, and industry attractiveness takes into account variables such as growthrate, profitability, cost trends and industry structure. The variables are weighted
5/38 Edinburgh Business School Strategic Planning
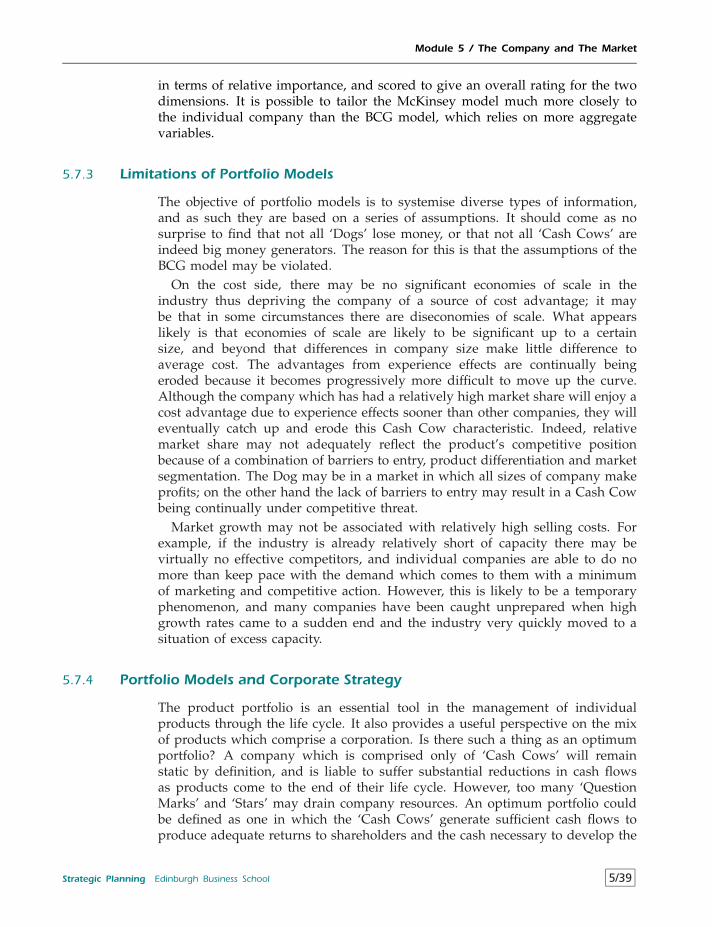
Module 5 / The Company and The Market
in terms of relative importance, and scored to give an overall rating for the twodimensions. It is possible to tailor the McKinsey model much more closely tothe individual company than the BCG model, which relies on more aggregatevariables.
5.7.3 Limitations of Portfolio Models
The objective of portfolio models is to systemise diverse types of information,and as such they are based on a series of assumptions. It should come as nosurprise to find that not all ‘Dogs’ lose money, or that not all ‘Cash Cows’ areindeed big money generators. The reason for this is that the assumptions of theBCG model may be violated.
On the cost side, there may be no significant economies of scale in theindustry thus depriving the company of a source of cost advantage; it maybe that in some circumstances there are diseconomies of scale. What appearslikely is that economies of scale are likely to be significant up to a certainsize, and beyond that differences in company size make little difference toaverage cost. The advantages from experience effects are continually beingeroded because it becomes progressively more difficult to move up the curve.Although the company which has had a relatively high market share will enjoy acost advantage due to experience effects sooner than other companies, they willeventually catch up and erode this Cash Cow characteristic. Indeed, relativemarket share may not adequately reflect the product’s competitive positionbecause of a combination of barriers to entry, product differentiation and marketsegmentation. The Dog may be in a market in which all sizes of company makeprofits; on the other hand the lack of barriers to entry may result in a Cash Cowbeing continually under competitive threat.
Market growth may not be associated with relatively high selling costs. Forexample, if the industry is already relatively short of capacity there may bevirtually no effective competitors, and individual companies are able to do nomore than keep pace with the demand which comes to them with a minimumof marketing and competitive action. However, this is likely to be a temporaryphenomenon, and many companies have been caught unprepared when highgrowth rates came to a sudden end and the industry very quickly moved to asituation of excess capacity.
5.7.4 Portfolio Models and Corporate Strategy
The product portfolio is an essential tool in the management of individualproducts through the life cycle. It also provides a useful perspective on the mixof products which comprise a corporation. Is there such a thing as an optimumportfolio? A company which is comprised only of ‘Cash Cows’ will remainstatic by definition, and is liable to suffer substantial reductions in cash flowsas products come to the end of their life cycle. However, too many ‘QuestionMarks’ and ‘Stars’ may drain company resources. An optimum portfolio couldbe defined as one in which the ‘Cash Cows’ generate sufficient cash flows toproduce adequate returns to shareholders and the cash necessary to develop the
Strategic Planning Edinburgh Business School 5/39
Module 5 / The Company and The Market
potential of ‘Question Marks’ and ‘Stars’ to replace the ‘Cash Cows’ in time. Ifthe company had ambitions to grow, the balance between ‘Cash Cows’, ‘Stars’and ‘Question Marks’ would be adjusted accordingly.
Portfolio selection is not a mechanistic process based on the selection ofproducts as they appear in the BCG matrix. There are many difficulties involvedin identifying which ‘Question Marks’ and ‘Stars’ are likely to succeed. Theportfolio decision will depend on the various risks involved, and the company’sattitude to risk bearing. Furthermore, the variables in the matrix do not captureall relevant product characteristics. A company may have an optimum portfolioin the sense that it has no loss-making ‘Dogs’, and several ‘Stars’ and ‘QuestionMarks’ which will replace ageing ‘Cash Cows’. But products are not conceptualentities to be guided through the stages of the product life cycle; managershave to know a lot about their products, including how to make them at thelowest cost and sell them effectively against competitors. A portfolio whichis comprised of totally unrelated products in a diversified company may bevirtually unmanageable, and there is no guarantee that the corporation is addingvalue by including all of them in the portfolio. Consideration needs to be givento developing a portfolio in which products are linked in such a way as to benefitfrom the competencies of the corporation. Diversifications which are intendedto optimise the portfolio, in the sense that there is a balance between the costof the stars and the profitability of the cash cows, may be totally misguided;the company can end up with an unmanageable portfolio, and this has been acontributing factor to the failure of so many diversifications in the past.
Portfolio models can be used for more than the determination of companypriorities. If they have validity for one company, they may have validity forcompetitors; competitors can be analysed in terms of whatever information isavailable on their product positioning in the BCG matrix, and this can serve asthe basis for competitive strategies. Take the case where the company is con-cerned about the development of a competitor’s ‘Star’ versus its own ‘Star’. Isthe appropriate strategy to mount an attack on the ‘Star’ directly? Presumablythe competitor is prepared to accept the drain on resources which the devel-opment of a ‘Star’ demands, therefore he may be prepared to fight back. Theappropriate strategy may well be to attack the competitor’s ‘Cash Cow’, with theobjective of reducing the competitor’s cash flow surpluses which are necessaryto finance the development of the ‘Star’.
A competitor may decide to undertake a change of direction through diversi-fication into new markets; the fact that this results in a preponderance of ‘Stars’and ‘Question Marks’ has implications for the total resources available to thecompetitor in common markets. Portfolio analysis of competitors can provideinsights into what their reaction is likely to be to competitive action, and mayprovide a means of predicting when competitors are likely to make a strategicmove.
The portfolio model throws light on the principal agent problem betweencorporate and SBU CEOs. The SBU manager may be unwilling to dispose ofa ‘Star’ which is seen as having considerable future potential; but from thecorporate viewpoint the product may not fit with the company’s aggregateportfolio and more value could be created by selling it and allocating the
5/40 Edinburgh Business School Strategic Planning
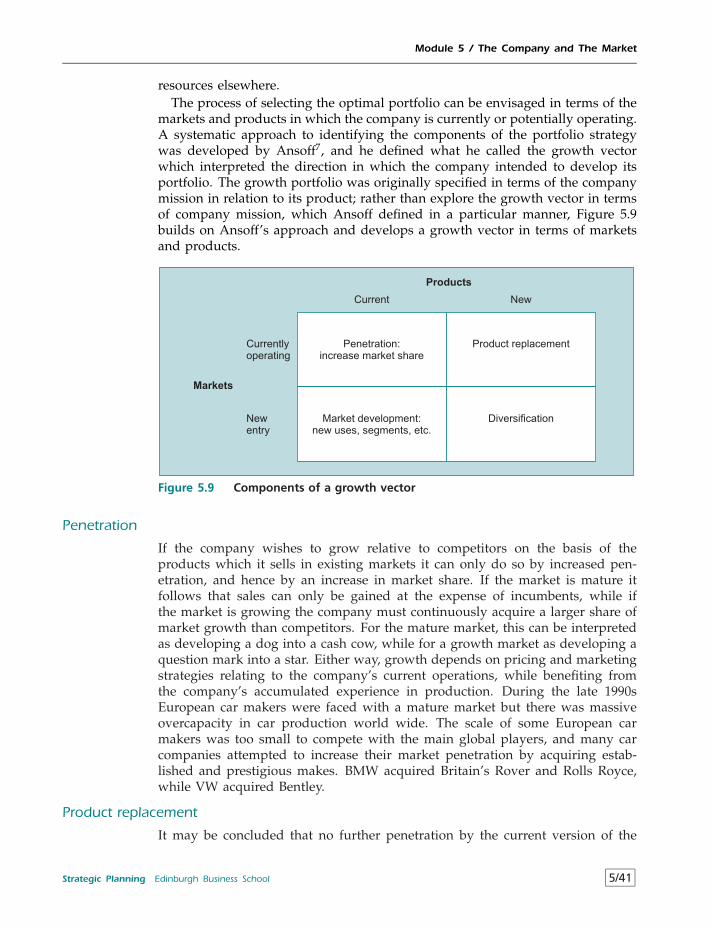
Module 5 / The Company and The Market
resources elsewhere.The process of selecting the optimal portfolio can be envisaged in terms of the
markets and products in which the company is currently or potentially operating.A systematic approach to identifying the components of the portfolio strategywas developed by Ansoff7, and he defined what he called the growth vectorwhich interpreted the direction in which the company intended to develop itsportfolio. The growth portfolio was originally specified in terms of the companymission in relation to its product; rather than explore the growth vector in termsof company mission, which Ansoff defined in a particular manner, Figure 5.9builds on Ansoff’s approach and develops a growth vector in terms of marketsand products.
Penetration:increase market share
Currentlyoperating
Current
Market development:new uses, segments, etc.
Newentry
Product replacement
New
Diversification
Products
Markets
Figure 5.9 Components of a growth vector
Penetration
If the company wishes to grow relative to competitors on the basis of theproducts which it sells in existing markets it can only do so by increased pen-etration, and hence by an increase in market share. If the market is mature itfollows that sales can only be gained at the expense of incumbents, while ifthe market is growing the company must continuously acquire a larger share ofmarket growth than competitors. For the mature market, this can be interpretedas developing a dog into a cash cow, while for a growth market as developing aquestion mark into a star. Either way, growth depends on pricing and marketingstrategies relating to the company’s current operations, while benefiting fromthe company’s accumulated experience in production. During the late 1990sEuropean car makers were faced with a mature market but there was massiveovercapacity in car production world wide. The scale of some European carmakers was too small to compete with the main global players, and many carcompanies attempted to increase their market penetration by acquiring estab-lished and prestigious makes. BMW acquired Britain’s Rover and Rolls Royce,while VW acquired Bentley.
Product replacement
It may be concluded that no further penetration by the current version of the
Strategic Planning Edinburgh Business School 5/41
Module 5 / The Company and The Market
product can be achieved, and it is necessary to add characteristics and perhapsabandon some existing characteristics; it could also be due to the productapproaching the end of the product life cycle. The replacement can be anenhancement of an existing product or a totally revised version with a differentset of characteristics, but it is important that it at least fulfils the requirementsof the replaced product, and/or satisfies changing consumer preferences. Thistype of growth involves the company in investment in product developmentand a shift away from the set of products in which it has built up expertiseproducing efficiently and marketing effectively. However, the company is ableto capitalise on its knowledge of the market, its brand name and its existingdistribution systems. One of the most significant product enhancements in thecar business during the 1990s was the advent of the off-road vehicle. Instead ofpurchasing a standard road car, many consumers selected the high-body, fourwheel drive, rugged off road vehicle; this was a car with a completely differentset of characteristics, but within a few years every major car maker had such avehicle in its portfolio. It was not a new concept, as Britain’s Rover car companyhad been producing the world famous Range Rover for several decades; butthe new entrants went for more luxury, better handling and state of the arttechnology – the very characteristics which sold standard road cars anyway.
Market development
The search for new markets for existing products can take a number of forms,such as finding markets in new geographical locations and identifying unex-ploited segments or niches. This means that new techniques need to be devel-oped for selling products with known characteristics, and this requires effectivestrategies for market entry. This in turn raises issues relating to the product lifecycle, as entry into a growth market requires a different approach to entry intoa mature market. But as with market penetration, the success of the growthstrategy depends on pricing and marketing approaches. The Korean car makerDaewoo entered the British market in the early 1990s with a standard range ofcars, but used a fixed price selling approach which market research suggestedwould appeal to many car buyers. The idea was that there were no salespeoplein the showroom and that no negotiation would take place on the price. Despitethe fact that the Daewoo cars were no better than other makes in their range,the company made significant inroads into the British market.
Diversification
In this context diversification has a particular meaning, in that the companyenters new markets with a new set of products and is therefore akin to thenotion of unrelated diversification discussed at 7.4.1. In this case there is no directexperience of marketing strategy which can be applied, while the company hasno experience of production. Car makers often have a wide portfolio of car types,and often have interests in lorries (or trucks) and buses; but few have productivecapacity in earth moving equipment, for example. An interesting exercise is totry to identify car companies which have moved into the diversification part ofthe matrix.
No growth strategy will ever fit exactly into a particular segment of the matrix,but this simple classification helps to interpret the impact of a particular course
5/42 Edinburgh Business School Strategic Planning
Module 5 / The Company and The Market
of action on the product portfolio, and the extent to which it fits with the currentknowledge of markets and products. The matrix can be greatly elaborated toincorporate dimensions such as geographical location and product technologies,but the fundamental message is the same: make explicit the direction of changein which the growth strategy will take the company, and incorporate this intothe design of the portfolio.
5.7.5 Strategy and Product Information
In the business school, or business seminar, setting managers are alwaysmore comfortable discussing actual product examples than discussing abstractproducts, usually a ‘widget’. Think about the items of information on a productwhich you need to make decisions; these include:
• price elasticity• income elasticity• the effect of marketing on the position of the demand curve• competitive conditions in the industry• size and growth of the market• relative market share• product life cycle
The reason managers would like to know what the product actually is mustbe because they feel such knowledge would give additional insights into thesecharacteristics. But knowing whether a particular business problem relates tothe plastics rather than the cheese industry does not make any difference to theunderlying issues. There is no doubt that each time a new product is analysed theproblems seem to some extent unique. But the objective of a market analysis isto go beyond the immediate product characteristics and quantify the conceptualfactors as far as possible.
5.8 SupplyAttention tends to be focused on the demand side of company performance,but supply and cost considerations are equally important in the determinationof competitive advantage. The supply curve for an industry shows the amountwhich companies in total would be willing to sell at different prices, holdingother factors constant. The position and shape of the supply curve dependson production costs; it is reasonable to conclude that the higher the price onthe market the greater the quantity companies in aggregate would be willingto supply, therefore it is to be expected that the supply curve will be upwardsloping. A typical supply curve is as shown in Figure 5.10.
At price P the total quantity supplied by the industry would be Q. If pricewere higher than P then more than Q would be supplied, and vice versa. Theslope of the supply curve depends on the cost structure of the companies in theindustry.
Strategic Planning Edinburgh Business School 5/43
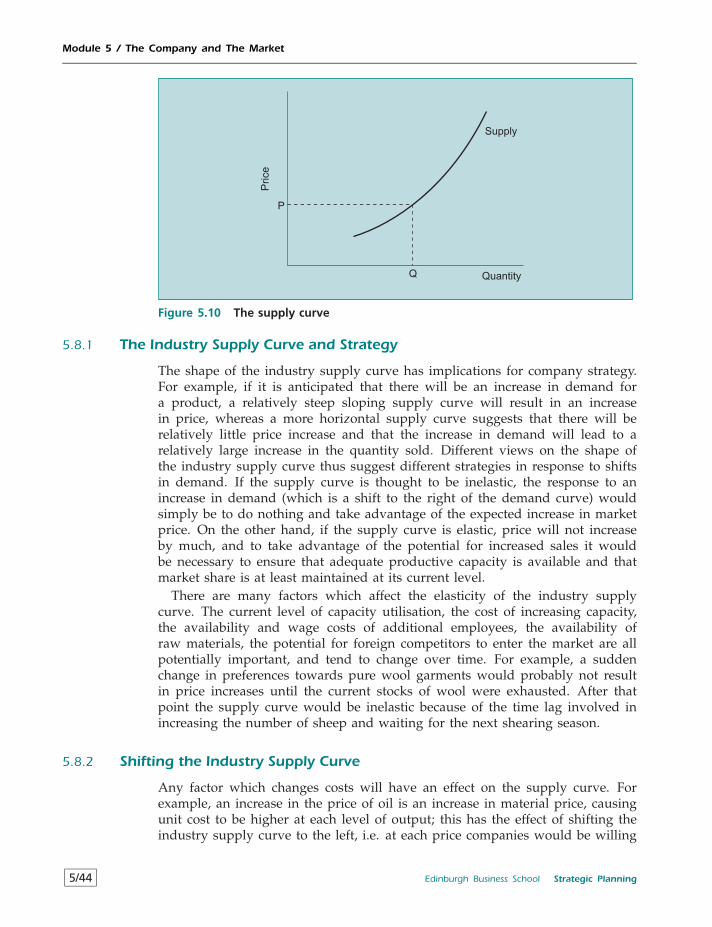
Module 5 / The Company and The Market
Supply
QuantityP
rice
P
Q
Figure 5.10 The supply curve
5.8.1 The Industry Supply Curve and Strategy
The shape of the industry supply curve has implications for company strategy.For example, if it is anticipated that there will be an increase in demand fora product, a relatively steep sloping supply curve will result in an increasein price, whereas a more horizontal supply curve suggests that there will berelatively little price increase and that the increase in demand will lead to arelatively large increase in the quantity sold. Different views on the shape ofthe industry supply curve thus suggest different strategies in response to shiftsin demand. If the supply curve is thought to be inelastic, the response to anincrease in demand (which is a shift to the right of the demand curve) wouldsimply be to do nothing and take advantage of the expected increase in marketprice. On the other hand, if the supply curve is elastic, price will not increaseby much, and to take advantage of the potential for increased sales it wouldbe necessary to ensure that adequate productive capacity is available and thatmarket share is at least maintained at its current level.
There are many factors which affect the elasticity of the industry supplycurve. The current level of capacity utilisation, the cost of increasing capacity,the availability and wage costs of additional employees, the availability ofraw materials, the potential for foreign competitors to enter the market are allpotentially important, and tend to change over time. For example, a suddenchange in preferences towards pure wool garments would probably not resultin price increases until the current stocks of wool were exhausted. After thatpoint the supply curve would be inelastic because of the time lag involved inincreasing the number of sheep and waiting for the next shearing season.
5.8.2 Shifting the Industry Supply Curve
Any factor which changes costs will have an effect on the supply curve. Forexample, an increase in the price of oil is an increase in material price, causingunit cost to be higher at each level of output; this has the effect of shifting theindustry supply curve to the left, i.e. at each price companies would be willing
5/44 Edinburgh Business School Strategic Planning
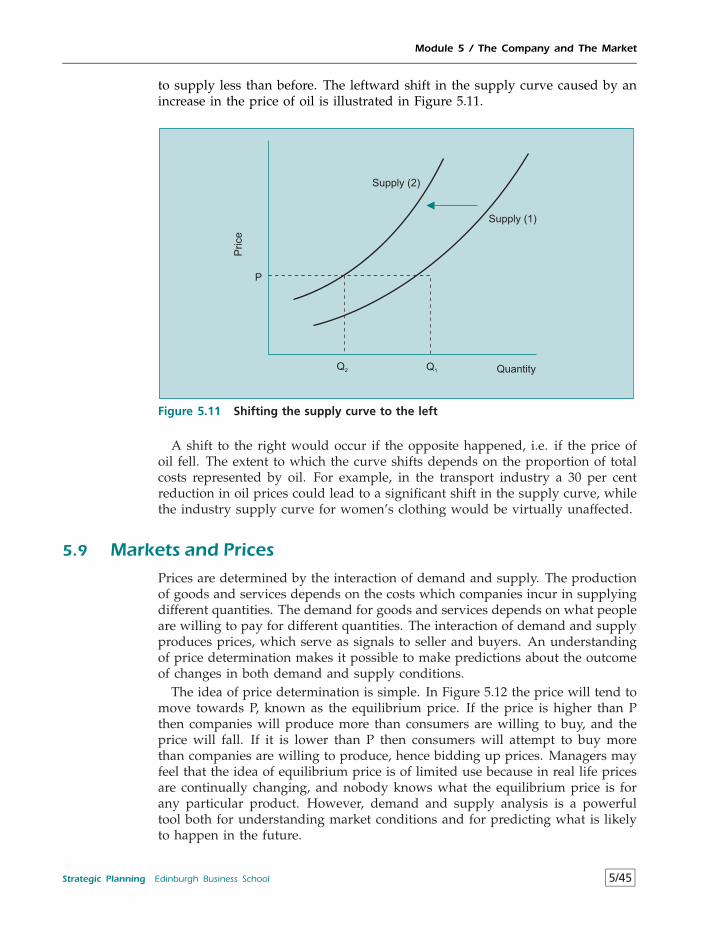
Module 5 / The Company and The Market
to supply less than before. The leftward shift in the supply curve caused by anincrease in the price of oil is illustrated in Figure 5.11.
Supply (1)
Quantity
Price
P
Supply (2)
Q2 Q1
Figure 5.11 Shifting the supply curve to the left
A shift to the right would occur if the opposite happened, i.e. if the price ofoil fell. The extent to which the curve shifts depends on the proportion of totalcosts represented by oil. For example, in the transport industry a 30 per centreduction in oil prices could lead to a significant shift in the supply curve, whilethe industry supply curve for women’s clothing would be virtually unaffected.
5.9 Markets and PricesPrices are determined by the interaction of demand and supply. The productionof goods and services depends on the costs which companies incur in supplyingdifferent quantities. The demand for goods and services depends on what peopleare willing to pay for different quantities. The interaction of demand and supplyproduces prices, which serve as signals to seller and buyers. An understandingof price determination makes it possible to make predictions about the outcomeof changes in both demand and supply conditions.
The idea of price determination is simple. In Figure 5.12 the price will tend tomove towards P, known as the equilibrium price. If the price is higher than Pthen companies will produce more than consumers are willing to buy, and theprice will fall. If it is lower than P then consumers will attempt to buy morethan companies are willing to produce, hence bidding up prices. Managers mayfeel that the idea of equilibrium price is of limited use because in real life pricesare continually changing, and nobody knows what the equilibrium price is forany particular product. However, demand and supply analysis is a powerfultool both for understanding market conditions and for predicting what is likelyto happen in the future.
Strategic Planning Edinburgh Business School 5/45
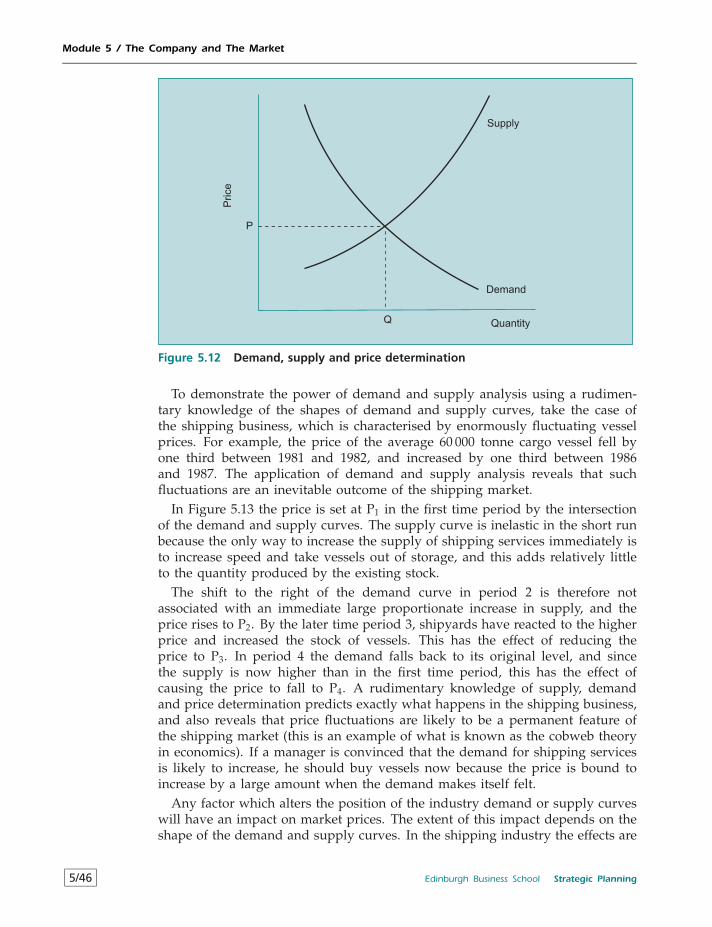
Module 5 / The Company and The Market
Supply
Quantity
Price
P
Q
Demand
Figure 5.12 Demand, supply and price determination
To demonstrate the power of demand and supply analysis using a rudimen-tary knowledge of the shapes of demand and supply curves, take the case ofthe shipping business, which is characterised by enormously fluctuating vesselprices. For example, the price of the average 60 000 tonne cargo vessel fell byone third between 1981 and 1982, and increased by one third between 1986and 1987. The application of demand and supply analysis reveals that suchfluctuations are an inevitable outcome of the shipping market.
In Figure 5.13 the price is set at P1 in the first time period by the intersectionof the demand and supply curves. The supply curve is inelastic in the short runbecause the only way to increase the supply of shipping services immediately isto increase speed and take vessels out of storage, and this adds relatively littleto the quantity produced by the existing stock.
The shift to the right of the demand curve in period 2 is therefore notassociated with an immediate large proportionate increase in supply, and theprice rises to P2. By the later time period 3, shipyards have reacted to the higherprice and increased the stock of vessels. This has the effect of reducing theprice to P3. In period 4 the demand falls back to its original level, and sincethe supply is now higher than in the first time period, this has the effect ofcausing the price to fall to P4. A rudimentary knowledge of supply, demandand price determination predicts exactly what happens in the shipping business,and also reveals that price fluctuations are likely to be a permanent feature ofthe shipping market (this is an example of what is known as the cobweb theoryin economics). If a manager is convinced that the demand for shipping servicesis likely to increase, he should buy vessels now because the price is bound toincrease by a large amount when the demand makes itself felt.
Any factor which alters the position of the industry demand or supply curveswill have an impact on market prices. The extent of this impact depends on theshape of the demand and supply curves. In the shipping industry the effects are
5/46 Edinburgh Business School Strategic Planning
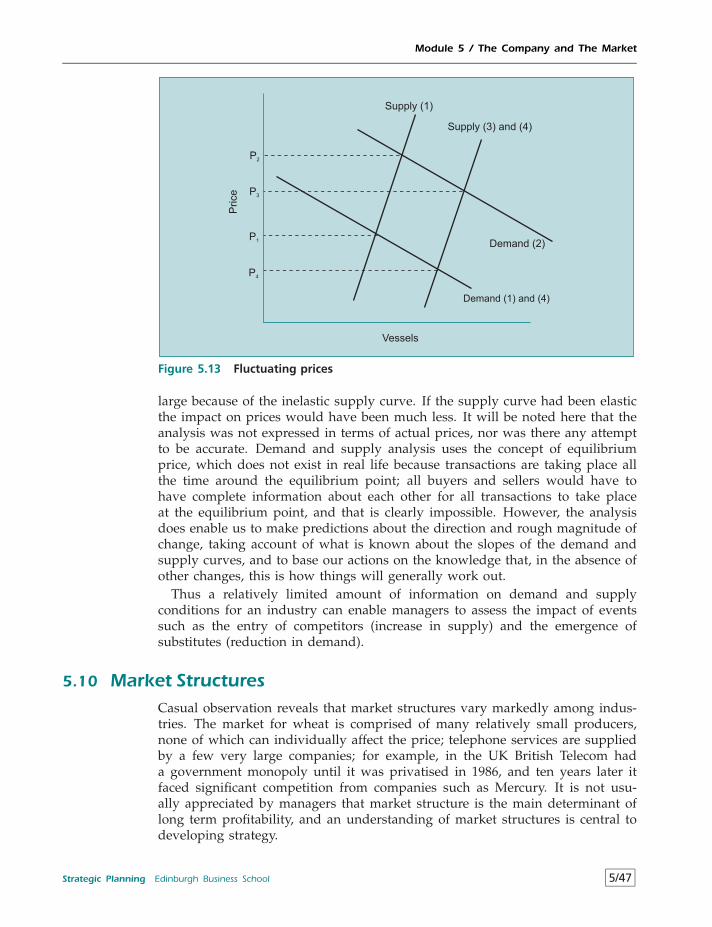
Module 5 / The Company and The Market
Demand (1) and (4)
Demand (2)
Supply (3) and (4)
Supply (1)
Vessels
P1
P4
P3
P2
Price
Figure 5.13 Fluctuating prices
large because of the inelastic supply curve. If the supply curve had been elasticthe impact on prices would have been much less. It will be noted here that theanalysis was not expressed in terms of actual prices, nor was there any attemptto be accurate. Demand and supply analysis uses the concept of equilibriumprice, which does not exist in real life because transactions are taking place allthe time around the equilibrium point; all buyers and sellers would have tohave complete information about each other for all transactions to take placeat the equilibrium point, and that is clearly impossible. However, the analysisdoes enable us to make predictions about the direction and rough magnitude ofchange, taking account of what is known about the slopes of the demand andsupply curves, and to base our actions on the knowledge that, in the absence ofother changes, this is how things will generally work out.
Thus a relatively limited amount of information on demand and supplyconditions for an industry can enable managers to assess the impact of eventssuch as the entry of competitors (increase in supply) and the emergence ofsubstitutes (reduction in demand).
5.10 Market StructuresCasual observation reveals that market structures vary markedly among indus-tries. The market for wheat is comprised of many relatively small producers,none of which can individually affect the price; telephone services are suppliedby a few very large companies; for example, in the UK British Telecom hada government monopoly until it was privatised in 1986, and ten years later itfaced significant competition from companies such as Mercury. It is not usu-ally appreciated by managers that market structure is the main determinant oflong term profitability, and an understanding of market structures is central todeveloping strategy.
Strategic Planning Edinburgh Business School 5/47
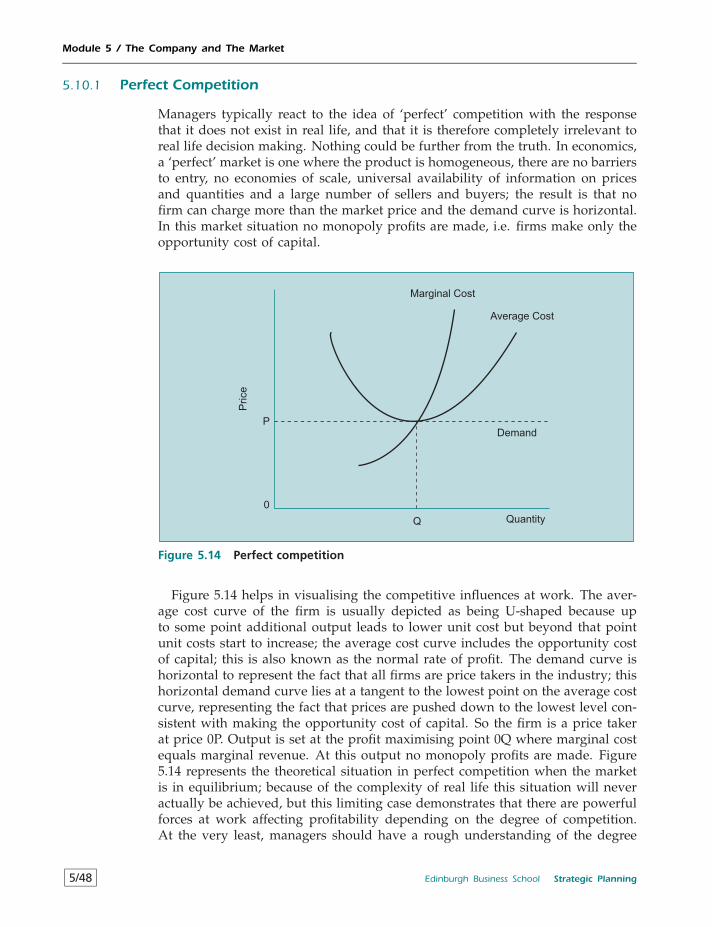
Module 5 / The Company and The Market
5.10.1 Perfect Competition
Managers typically react to the idea of ‘perfect’ competition with the responsethat it does not exist in real life, and that it is therefore completely irrelevant toreal life decision making. Nothing could be further from the truth. In economics,a ‘perfect’ market is one where the product is homogeneous, there are no barriersto entry, no economies of scale, universal availability of information on pricesand quantities and a large number of sellers and buyers; the result is that nofirm can charge more than the market price and the demand curve is horizontal.In this market situation no monopoly profits are made, i.e. firms make only theopportunity cost of capital.
Marginal Cost
Average Cost
Demand
QuantityQ
0
P
Price
Figure 5.14 Perfect competition
Figure 5.14 helps in visualising the competitive influences at work. The aver-age cost curve of the firm is usually depicted as being U-shaped because upto some point additional output leads to lower unit cost but beyond that pointunit costs start to increase; the average cost curve includes the opportunity costof capital; this is also known as the normal rate of profit. The demand curve ishorizontal to represent the fact that all firms are price takers in the industry; thishorizontal demand curve lies at a tangent to the lowest point on the average costcurve, representing the fact that prices are pushed down to the lowest level con-sistent with making the opportunity cost of capital. So the firm is a price takerat price 0P. Output is set at the profit maximising point 0Q where marginal costequals marginal revenue. At this output no monopoly profits are made. Figure5.14 represents the theoretical situation in perfect competition when the marketis in equilibrium; because of the complexity of real life this situation will neveractually be achieved, but this limiting case demonstrates that there are powerfulforces at work affecting profitability depending on the degree of competition.At the very least, managers should have a rough understanding of the degree
5/48 Edinburgh Business School Strategic Planning
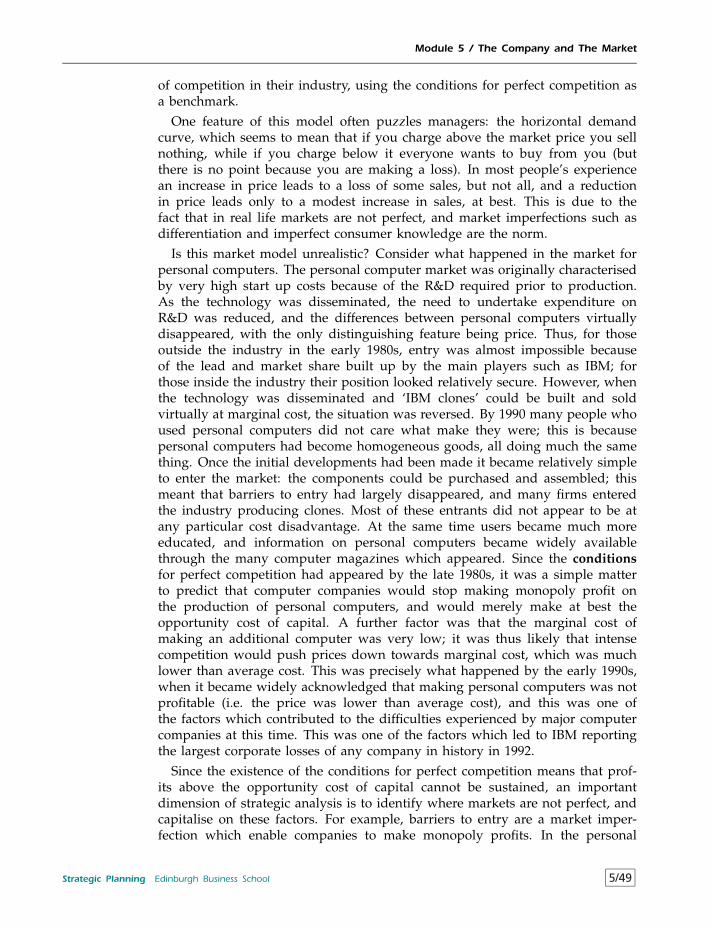
Module 5 / The Company and The Market
of competition in their industry, using the conditions for perfect competition asa benchmark.
One feature of this model often puzzles managers: the horizontal demandcurve, which seems to mean that if you charge above the market price you sellnothing, while if you charge below it everyone wants to buy from you (butthere is no point because you are making a loss). In most people’s experiencean increase in price leads to a loss of some sales, but not all, and a reductionin price leads only to a modest increase in sales, at best. This is due to thefact that in real life markets are not perfect, and market imperfections such asdifferentiation and imperfect consumer knowledge are the norm.
Is this market model unrealistic? Consider what happened in the market forpersonal computers. The personal computer market was originally characterisedby very high start up costs because of the R&D required prior to production.As the technology was disseminated, the need to undertake expenditure onR&D was reduced, and the differences between personal computers virtuallydisappeared, with the only distinguishing feature being price. Thus, for thoseoutside the industry in the early 1980s, entry was almost impossible becauseof the lead and market share built up by the main players such as IBM; forthose inside the industry their position looked relatively secure. However, whenthe technology was disseminated and ‘IBM clones’ could be built and soldvirtually at marginal cost, the situation was reversed. By 1990 many people whoused personal computers did not care what make they were; this is becausepersonal computers had become homogeneous goods, all doing much the samething. Once the initial developments had been made it became relatively simpleto enter the market: the components could be purchased and assembled; thismeant that barriers to entry had largely disappeared, and many firms enteredthe industry producing clones. Most of these entrants did not appear to be atany particular cost disadvantage. At the same time users became much moreeducated, and information on personal computers became widely availablethrough the many computer magazines which appeared. Since the conditionsfor perfect competition had appeared by the late 1980s, it was a simple matterto predict that computer companies would stop making monopoly profit onthe production of personal computers, and would merely make at best theopportunity cost of capital. A further factor was that the marginal cost ofmaking an additional computer was very low; it was thus likely that intensecompetition would push prices down towards marginal cost, which was muchlower than average cost. This was precisely what happened by the early 1990s,when it became widely acknowledged that making personal computers was notprofitable (i.e. the price was lower than average cost), and this was one ofthe factors which contributed to the difficulties experienced by major computercompanies at this time. This was one of the factors which led to IBM reportingthe largest corporate losses of any company in history in 1992.
Since the existence of the conditions for perfect competition means that prof-its above the opportunity cost of capital cannot be sustained, an importantdimension of strategic analysis is to identify where markets are not perfect, andcapitalise on these factors. For example, barriers to entry are a market imper-fection which enable companies to make monopoly profits. In the personal
Strategic Planning Edinburgh Business School 5/49
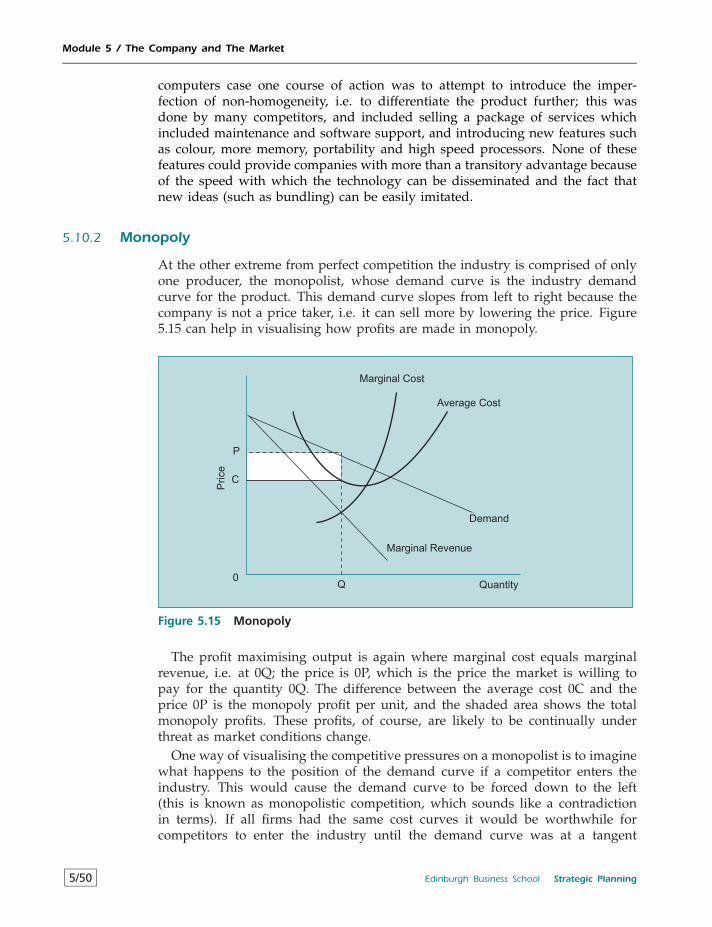
Module 5 / The Company and The Market
computers case one course of action was to attempt to introduce the imper-fection of non-homogeneity, i.e. to differentiate the product further; this wasdone by many competitors, and included selling a package of services whichincluded maintenance and software support, and introducing new features suchas colour, more memory, portability and high speed processors. None of thesefeatures could provide companies with more than a transitory advantage becauseof the speed with which the technology can be disseminated and the fact thatnew ideas (such as bundling) can be easily imitated.
5.10.2 Monopoly
At the other extreme from perfect competition the industry is comprised of onlyone producer, the monopolist, whose demand curve is the industry demandcurve for the product. This demand curve slopes from left to right because thecompany is not a price taker, i.e. it can sell more by lowering the price. Figure5.15 can help in visualising how profits are made in monopoly.
Marginal Cost
Average Cost
Demand
QuantityQ0
P
C
Marginal Revenue
Price
Figure 5.15 Monopoly
The profit maximising output is again where marginal cost equals marginalrevenue, i.e. at 0Q; the price is 0P, which is the price the market is willing topay for the quantity 0Q. The difference between the average cost 0C and theprice 0P is the monopoly profit per unit, and the shaded area shows the totalmonopoly profits. These profits, of course, are likely to be continually underthreat as market conditions change.
One way of visualising the competitive pressures on a monopolist is to imaginewhat happens to the position of the demand curve if a competitor enters theindustry. This would cause the demand curve to be forced down to the left(this is known as monopolistic competition, which sounds like a contradictionin terms). If all firms had the same cost curves it would be worthwhile forcompetitors to enter the industry until the demand curve was at a tangent
5/50 Edinburgh Business School Strategic Planning
Module 5 / The Company and The Market
to the average cost curve; at this point no monopoly profits would be made.To counteract this, companies attempt to maintain their monopoly profits bycapitalising on market imperfections such as barriers to entry and productdifferentiation.
The effects of competition do not act only on the demand side. On thecost side, you could imagine the average cost curve moving from right toleft as competition for inputs increases and the prices of labour, capital andmaterials increase. This would also have the effect of reducing monopoly profits.Sometimes companies are able to affect competitive conditions in factor markets,for example by entering into agreements with trade unions.
While the analysis of markets has been theoretical, the messages from Figure5.14 and 5.15 are quite clear: a manager needs to continually address thefollowing types of issue:
• What is happening to the demand curve?• What is happening to the cost curve?• What market imperfections do we depend on for our profits?• Are there potential market imperfections which we have not yet capitalised
on?
5.10.3 Barriers to Entry
Up to this point barriers to entry have not been defined, but given the importanceof barriers to entry in maintaining monopoly profits, it is clear that they are animportant dimension of competitive advantage. Any firm enjoying monopolyprofits will be continually concerned about the threat from potential entrants.The incumbent monopolist will be motivated to find out if there are ways inwhich barriers to entry can be erected, or if there are existing barriers whichmake entry impossible and hence will protect its monopoly profit. In fact, bothentry and exit are common, and research suggests that on average there is a30–40 per cent turnover in companies every five years.
Barriers to entry can be classified as structural or strategic. The differencebetween these is that structural barriers are outside the control of the firm whilestrategic barriers depend on specific actions undertaken by the firm to deterentry. Structural barriers include:
• Size of the market: because of investment and infrastructure costs it may notbe feasible for more than one company to operate in the industry. A wellknown example is electricity generation and supply, where duplication ofelectricity lines would clearly be wasteful. This is usually known as a naturalmonopoly, and was the rationale for nationalisation; but the experience ofprivatisation in the UK has demonstrated that infrastructure can be sharedamong competing firms in a variety of ways, and the UK electricity marketwas opened to free competition in 1998.
• Sunk costs: it is not only the costs of entry which are important, but the costsof exit. It is usually assumed that a high capital entry cost deters entrants,but this is not necessarily the case. Certainly a high investment requirement
Strategic Planning Edinburgh Business School 5/51
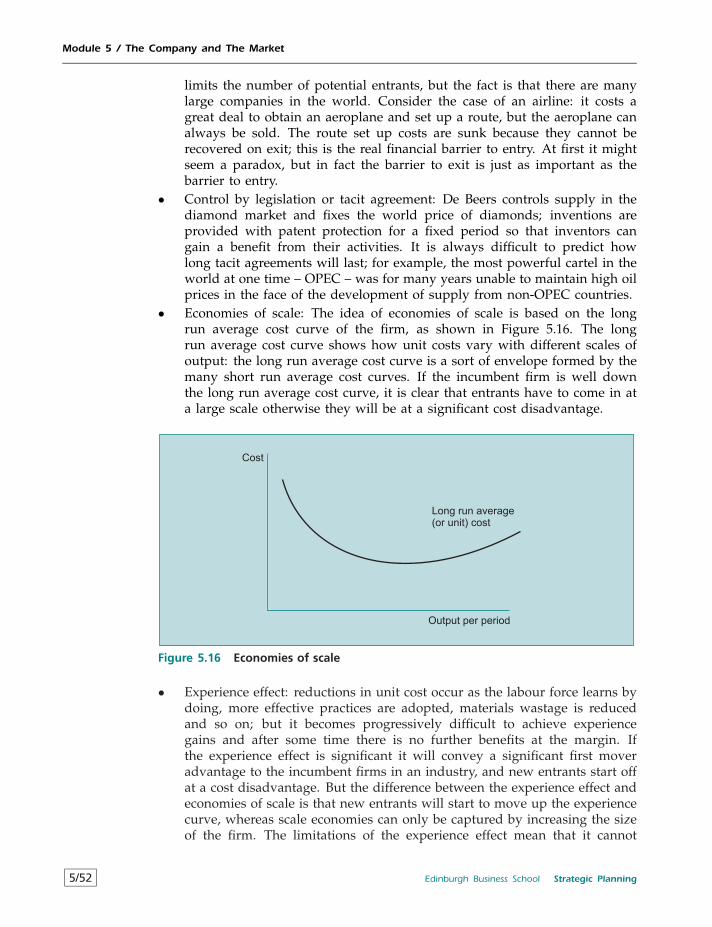
Module 5 / The Company and The Market
limits the number of potential entrants, but the fact is that there are manylarge companies in the world. Consider the case of an airline: it costs agreat deal to obtain an aeroplane and set up a route, but the aeroplane canalways be sold. The route set up costs are sunk because they cannot berecovered on exit; this is the real financial barrier to entry. At first it mightseem a paradox, but in fact the barrier to exit is just as important as thebarrier to entry.
• Control by legislation or tacit agreement: De Beers controls supply in thediamond market and fixes the world price of diamonds; inventions areprovided with patent protection for a fixed period so that inventors cangain a benefit from their activities. It is always difficult to predict howlong tacit agreements will last; for example, the most powerful cartel in theworld at one time – OPEC – was for many years unable to maintain high oilprices in the face of the development of supply from non-OPEC countries.
• Economies of scale: The idea of economies of scale is based on the longrun average cost curve of the firm, as shown in Figure 5.16. The longrun average cost curve shows how unit costs vary with different scales ofoutput: the long run average cost curve is a sort of envelope formed by themany short run average cost curves. If the incumbent firm is well downthe long run average cost curve, it is clear that entrants have to come in ata large scale otherwise they will be at a significant cost disadvantage.
Cost
Output per period
Long run average(or unit) cost
Figure 5.16 Economies of scale
• Experience effect: reductions in unit cost occur as the labour force learns bydoing, more effective practices are adopted, materials wastage is reducedand so on; but it becomes progressively difficult to achieve experiencegains and after some time there is no further benefits at the margin. Ifthe experience effect is significant it will convey a significant first moveradvantage to the incumbent firms in an industry, and new entrants start offat a cost disadvantage. But the difference between the experience effect andeconomies of scale is that new entrants will start to move up the experiencecurve, whereas scale economies can only be captured by increasing the sizeof the firm. The limitations of the experience effect mean that it cannot
5/52 Edinburgh Business School Strategic Planning
Module 5 / The Company and The Market
provide an incumbent firm with a permanent entry barrier in the form of acost advantage.
Strategic barriers include limit pricing and predatory pricing discussed in5.3.3, where it was pointed out that the long term effectiveness of such actionsis doubtful.
Since competitive pressures are not always obvious, it is not surprising thatthere is very little research evidence on the effectiveness of strategic barriersor entry deterrent behaviour. However, managers report that they frequentlyengage in such strategies, especially to protect new products. This is mostlikely because of the lack of information on the part of potential entrants asto underlying profitability. It takes time to generate information on the likelyreturns from competitive action, and setting a low price can serve as a misleadingsignal to potential entrants. While competition usually cannot be avoided in thelong run, entry deterring strategies may provide sufficient time for the companyto build up market share and achieve scale economies which might not havebeen possible had entrants been enticed into the market earlier.
5.10.4 Contestable Markets
It is doubtful if strategic barriers to entry can be effective in the absence ofstructural barriers. It is quite likely that where structural barriers are low entrydeterring strategies would be ineffective because the cost to the incumbent wouldexceed the benefit. In this case entry is so attractive that the incumbent shouldnot waste time trying to prevent it. A market in which entry costs are not sunk,and exit can be achieved costlessly, is known as a perfectly contestable market.The ability to exit without having made any capital commitment guaranteesfreedom of entry, and the fear of hit-and-run raids forces incumbents to setprices lower than they would have done otherwise.
If sunk costs are zero, would-be entrants do not have to worry about thekinds of retaliatory measures that incumbents might implement, because if theentrants find they cannot make a profit they can simply exit. If incumbentsrealise this, then they will set their prices so as to stop the entrants fromwanting to enter in the first place. Hence, whether there is one firm or severalfirms actually operating in it at any time, a perfectly contestable market neveroffers the incumbent(s) more than the normal rate of profit. This explains whymany companies which apparently have a monopoly do not actually makemonopoly profits; this is a different situation from a true monopoly which doesnot make profits because it is relatively inefficient as a result of the absenceof direct competition. For a firm contemplating entry, it is clearly important todifferentiate between the two cases.
Contestability will not have the effect of controlling profits if the incumbentcompany is able to exercise market power in such a way as to erect artificialbarriers to entry. This was one of the issues involved in the case of Microsoft,which was accused of using its monopoly of the Windows operating system tomake it difficult for other software manufacturers to enter, among other things,the internet browser market. It was not the fact that Microsoft dominated themarket and made enormous profits which was the problem; instead it was the
Strategic Planning Edinburgh Business School 5/53
Module 5 / The Company and The Market
perception that free market forces were not being allowed to play their role.These issues are, of course, never very clear and Microsoft was involved inanti-trust litigation for years with the US government.
5.10.5 Competition among the Few: Oligopoly
When there are relatively few competitors in a market the likely reaction ofcompetitors to changes in pricing and marketing strategy must be taken intoaccount. This is obviously a situation in which game theory is important; this iswhere the kind of thinking depicted by the prisoner’s dilemma discussed at 5.3.1comes into play. Another way of looking at it is in terms of the kinked demandcurve, discussed at 5.3.2. In this market the outcomes cannot be predictedbecause they depend on the reactions of the individuals; for example, a priceincrease by one company as a result of higher costs may result in all othercompetitors raising their prices by a similar amount, or one of the companiesmay see an opportunity to grab a larger market share and may therefore reduceprice. The indeterminate outcomes in this situation can result in the biddingaway of potential monopoly profits which might be attained because of marketimperfections.
5.11 The Role of Government
Although the market is an efficient resource allocator, there are some areas inwhich it does not appear to function very well. Why does the market allowpollution to occur? What is the optimum amount to spend on defence? Themanager should be able to view ‘market failure’ issues in context; the fact that‘market failures’ exist does not mean that the price system itself should beabandoned. It does mean that managers should understand why governmentis involved in the economy, and recognise when it is fulfilling a positive role.An understanding of this aspect of government is an important input into PESTanalysis and environmental scanning; it can also add an important dimension tothe construction of scenarios particularly when it is anticipated that there maybe a change of government.
5.11.1 Government and Rule Making
The government is responsible for determining the framework of rules withinwhich markets function. These vary significantly among countries and can haveprofound implications for individual companies; some aspects of governmentrule making are:
• Employment law: in Europe there are many laws which govern employmentcontracts, and these severely limit the mobility of labour, while in the USemployees have fewer statutory rights. The fact that it is much more difficultand costly to shed excess labour in Europe than in the US is consideredby many economists to be the main reason for Europe’s much higherunemployment rates.
5/54 Edinburgh Business School Strategic Planning
Module 5 / The Company and The Market
• Monopoly: when a single company becomes large enough to dominate anindustry, it becomes less subject to competitive pressures. Consequently,there may be little incentive to pursue efficiency (although the theory ofcontestable markets casts some doubt on this), and the company may notact in the public interest, however this is defined. In such circumstances thegovernment can break-up the monopoly into smaller competing companies.Such legislation frequently causes heated debate about the definition ofmonopoly and monopoly power, and there is often doubt as to the ultimateimpact on social welfare. These disagreements are reflected in the fact thatthe law in the US is much more opposed to the formation of monopoliesthan the law in Europe.
• Health and safety at work: since increasing both safety and health standardstends to add to costs without any observable positive impact on revenues,it is often maintained that companies will tend to operate at the loweststandards possible. An opposing view is that in a competitive labour marketthose companies which do offer higher standards will be able to attract thebest and most productive members of the labour force. Whatever the rightsand wrongs of the argument, governments do take an active role in settingstandards, which can have significant cost implications for companies.
• Separation of management and ownership: professional managers typi-cally do not own their companies, and are only indirectly accountable toshareholders (the Principal/Agent problem). There is therefore a role forgovernment in deciding what comprises lawful behaviour on the part ofthose actually running companies, and the extent to which they can bemade responsible to shareholders for their actions.
It is not just the existence of these rules which affects companies, but the factthat they are liable to be changed when governments change. For example, theThatcher government which was elected in Britain in 1979 took about five yearsto change radically the approach to monopolies and public ownership; in fact,within a decade the selling of public companies (privatisation) was being under-taken by governments all over the world. The fact that the framework variessignificantly among countries can have significant implications for internationalexpansion, since it is not an easy matter to adapt to a completely differentregulatory regime.
5.11.2 Government and Regulating
One of the best known instances of government regulation is the attempt toreduce pollution. Where pollution occurs, it is the outcome of ‘externalities’, i.e.costs and benefits which do not accrue to the parties involved in an exchange.Inspection of the basic model of costs shows clearly that there is no separatecost entry for costs to the environment such as pollution, or for any other costswhich are borne by other producers or consumers.
This would not be a cause for concern if material price included an allowancefor pollution, but we know that it does not. The cost which is actually paid bythe company is known as private cost, and the cost to the company plus thecost to the environment is known as social cost. Since producers do not bear the
Strategic Planning Edinburgh Business School 5/55
Module 5 / The Company and The Market
costs of pollution the industry supply curve is derived from private cost, notsocial cost; in other words it lies too far to the right, and too much is produced,resulting in a misallocation of resources.
Where externalities occur there is a case for government action in some form.It may simply be to ‘internalise’ the externality, i.e. to set up a frameworkwithin which the costs and benefits can be traded off among affected parties.For example, a chemical company which pollutes a river could be awarded thefishing rights in the river; if the company attempts to maximise profits thiswill lead to the optimum level of pollution. If this is not possible governmentintervention may take the form of regulating output, setting emission standards,or imposing taxes designed to equalise private and social cost. Governmentregulations include requirements to fit scrubbers to coal fired electricity stations,which increases the price of electricity to companies and individuals; somegovernments require catalytic convertors to be fitted to the exhausts of all cars,and this cost is ultimately borne by the road user. At the very least, managersshould have an awareness of the externalities in their industry and whetherthese are likely to be subject to government regulation in the future.
5.11.3 Government and Allocating
Another area of market failure occurs when it is not possible to exclude non-payers from consuming a good or service. The most obvious is defence, becauseonce defence for a country is provided it is not possible to exclude from beingdefended those who do not wish to pay. Another characteristic of such goods,known as public goods, is that if they were to be provided by individuals orcompanies, the amount provided would not be optimum. An example is wheretwo shipping companies may individually consider it worthwhile to build alighthouse to prevent vessels sinking on the rocks. But the optimum numberof lighthouses is one, not two. Unless there is collective action, in the formof collusion between the two shipping companies or government action, twolighthouses may be built, which is one too many. On the other hand, eachcompany may wait in the hope that the lighthouse will be built by the other,resulting in no lighthouses. A possible solution might appear to be to bring thecompanies together to agree to share the cost of building one lighthouse; anagreement can be reached between the two companies to build the lighthouse,but after it has been built one of the parties may refuse to pay. Since bothare aware that this might occur, neither may be willing to take the chance thatthe other may not honour the agreement, with the result that no lighthouse isactually built. The chances of one lighthouse being constructed in the absenceof government action are therefore remote.
The provision of public goods is one of the legitimate roles of government. Butit is also important to the individual company, which should recognise when it isentering a market where public goods are involved. Demand is dictated by whatthe government perceives to be the ‘right’ quantity, and this may be affectedby political and philosophical views. For example, during election campaignspoliticians tend to promise increases in those expenditures which they thinkwill result in gaining the most votes. Managers should be able to form realisticviews on the credibility of such statements of intent. When the Berlin wall came
5/56 Edinburgh Business School Strategic Planning
Module 5 / The Company and The Market
down in 1989 companies in defence industries should immediately have startedto anticipate the likely effect on defence expenditures.
5.12 The Structural Analysis of Industries
The economic models of market structure demonstrate that the degree of com-petition in an industry is the result of structural factors over which individualcompanies have little control. A firm in an approximately competitive markethas no option but to be a price taker; a firm in a monopoly position may beable to limit competition, but entry deterring strategies may have a limitedeffect because of contestability; oligopolists have to exercise restraint because ofretaliation from major competitors.
In an attempt to make explicit the various factors which determine competitiveconditions within an industry, Porter5 identified what became known as the fiveforces. The basic idea is that the degree of competition, or rivalry, within anindustry depends on the threats posed by potential new entrants and substitutes,coupled with the bargaining power of suppliers of factor inputs to the industryand the bargaining power of the purchasers of industry output. The five forcesare thus
• Threat of new entrants• Threat of substitutes• Suppliers’ bargaining power• Buyers’ bargaining power• Industry competitors’ rivalry
Porter’s view is that the collective strength of these competitive forces deter-mines the ability of firms in an industry to earn rates of return on investmentabove the opportunity cost of capital. There is a close connection between thefive forces approach and the analysis of perfect competition in section 5.10.1; inperfect competition there are low barriers to entry (high threat of new entrants),a homogeneous product (everyone makes the same thing so each company’soutput is a substitute), freedom to purchase from competing suppliers (lowsuppliers’ bargaining power), and well educated consumers (high buyers’ bar-gaining power in that they can purchase from any company). In the absenceof scale economies, this leads to industry rivalry comprising many companieseach of which is a price taker. Now take the case where there are high barri-ers to entry (perhaps because of scale economies) and no threat of substitutes(perhaps because of a patent); as a result the bargaining power of buyers islimited. In this case industry rivalry takes the form of a monopoly, where onecompany dominates the market. The five forces model therefore explains whythe company is currently making monopoly profits, but it can also be used toconsider what will happen when the patent expires: will substitutes emerge andwill barriers to entry fall?
The following are a selection of issues to consider when applying the fiveforces framework to a particular competitive situation.
Strategic Planning Edinburgh Business School 5/57
Module 5 / The Company and The Market
• Industry Competitors’ RivalryIn order to assess the intensity of rivalry, start by assessing the number ofcompetitors in the industry.– Large number of relatively small firms: approximates to perfect com-
petition.– A few large firms: competition among the few, with implications for
competitive reaction.– One dominant firm: monopoly or price leadership.Another dimension is the extent to which firms are able to segment themarket by differentiating their product. The extent to which this will lead toprofits above the cost of capital depends on market conditions. For example,if there are many competitors the cost of differentiation may eventually bebalanced by the additional price which can be charged for the differentiatedproduct, and hence there will be no long term profit advantage. Where thereare few firms differentiation can be used as a competitive tool in additionto price.
• Threat of New EntrantsThe threat posed by new entrants depends on the barriers to entry discussedat 5.10.3. The issues which companies should address include:– Economies of scale: do existing firms have an advantage because of
their size?– Regulation: are there laws or legal requirements which inhibit poten-
tial competitors? Are these likely to be relaxed in the future as thegovernment adopts a less direct role in the economy?
– Entry price: is there a price at which entry will appear attractive tofirms outside the industry?
– Technological factors: where entry in the past has been difficult becauseof high R&D costs, the firm may eventually be at risk because thetechnology becomes disseminated.
• Threat of SubstitutesTo a large extent the emergence of substitutes depends on technologicalprogress. One way of assessing the potential for substitutes is to use theproduct characteristics approach to assess whether there are characteristicsof the final product which uniquely depend on the production process.For example, wool can only be produced from sheep, but many of thecharacteristics of woollen cloth can be achieved by artificial fibres.The impact of the emergence of a substitute is to reduce the total size of themarket, as opposed to the entry of competitors who attempt to achieve amarket share at the expense of existing firms in the industry. The responseto these is different.
• Suppliers’ Bargaining PowerThis depends on the degree of competition in supplier markets, and whetherthe firm is paying a price which includes profits over and above the oppor-tunity cost. It is clearly important to determine whether the firm is payingmore or less for its inputs than other firms in the industry.
5/58 Edinburgh Business School Strategic Planning
Module 5 / The Company and The Market
– Monopoly: the best known is probably trade unions which have amonopoly over the supply of labour and which can set the price oflabour above the competitive level.
– Monopsony: some firms are large enough to act as monopoly buyersand can ensure that they pay no more than the competitive price, andmay pay less than smaller competing firms.
• Buyers’ Bargaining PowerIt is essential for the firm to have some knowledge of the characteristics ofdemand and buyer power.– Price elasticity: how responsive are sales to changes in price; is the
demand curve likely to be ‘kinked’?– Income elasticity: how dependent are sales on the level of economic
activity? As consumers get better off will they buy more or less of theproduct?
– Information: are consumers well informed about the characteristics ofcompeting products? Is this likely to change in the future? Bear inmind that free flow of information is one of the conditions for perfectcompetition, and the more educated consumers are the less it maybe possible to attract sales by accenting spurious differences amongproducts.
– Brand identity: is market share dependent on brand loyalty or relativeprices?
– Buyer groups: are there relatively few large buyers who can exert aninfluence on price?
5.12.1 Profiling the Five Forces
Consider two companies which have carried out a five forces analysis and havecome up with the following:
Company 1 2Threat of new entrants High LowThreat of substitutes High LowBargaining power of suppliers Low HighBargaining power of buyers Low HighIndustry rivalry Low High
This classification identifies two totally different competitive situations.
• Company 1 will focus on potential competitors and technological change.It will be able to obtain competitive prices from suppliers through theoperation of market forces and it will probably enjoy a high degree ofbrand loyalty. It will not be subject to significant price competition.
• Company 2 will focus on trying to get better deals from suppliers, mar-keting aggressively to buyers, and on its cost and price position relativeto competitors. It will not be concerned with changes to the market eitherfrom new entrants or from substitute products.
Strategic Planning Edinburgh Business School 5/59
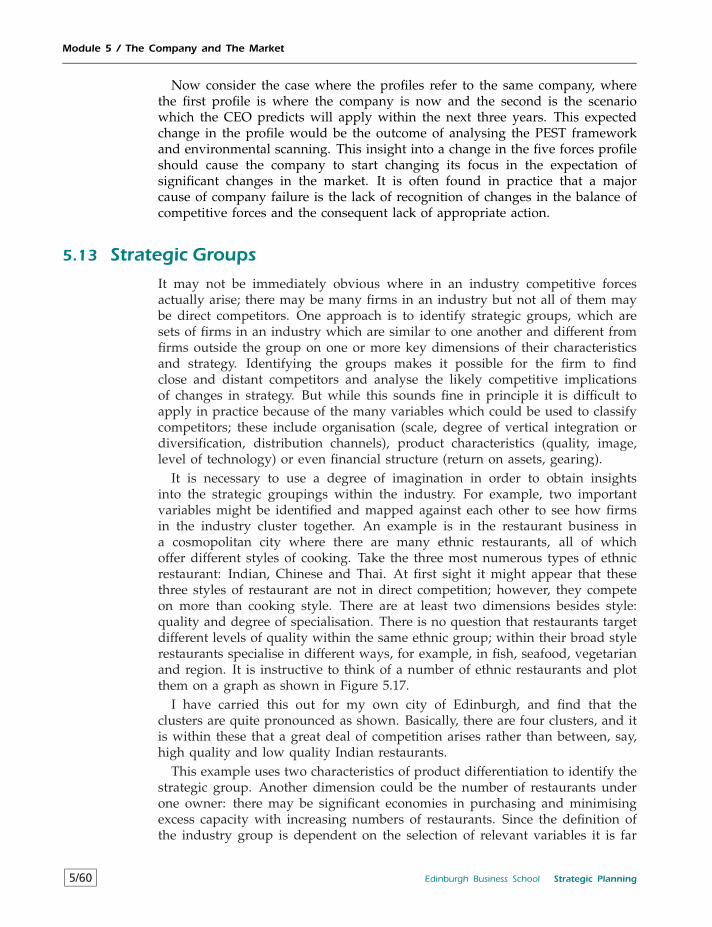
Module 5 / The Company and The Market
Now consider the case where the profiles refer to the same company, wherethe first profile is where the company is now and the second is the scenariowhich the CEO predicts will apply within the next three years. This expectedchange in the profile would be the outcome of analysing the PEST frameworkand environmental scanning. This insight into a change in the five forces profileshould cause the company to start changing its focus in the expectation ofsignificant changes in the market. It is often found in practice that a majorcause of company failure is the lack of recognition of changes in the balance ofcompetitive forces and the consequent lack of appropriate action.
5.13 Strategic Groups
It may not be immediately obvious where in an industry competitive forcesactually arise; there may be many firms in an industry but not all of them maybe direct competitors. One approach is to identify strategic groups, which aresets of firms in an industry which are similar to one another and different fromfirms outside the group on one or more key dimensions of their characteristicsand strategy. Identifying the groups makes it possible for the firm to findclose and distant competitors and analyse the likely competitive implicationsof changes in strategy. But while this sounds fine in principle it is difficult toapply in practice because of the many variables which could be used to classifycompetitors; these include organisation (scale, degree of vertical integration ordiversification, distribution channels), product characteristics (quality, image,level of technology) or even financial structure (return on assets, gearing).
It is necessary to use a degree of imagination in order to obtain insightsinto the strategic groupings within the industry. For example, two importantvariables might be identified and mapped against each other to see how firmsin the industry cluster together. An example is in the restaurant business ina cosmopolitan city where there are many ethnic restaurants, all of whichoffer different styles of cooking. Take the three most numerous types of ethnicrestaurant: Indian, Chinese and Thai. At first sight it might appear that thesethree styles of restaurant are not in direct competition; however, they competeon more than cooking style. There are at least two dimensions besides style:quality and degree of specialisation. There is no question that restaurants targetdifferent levels of quality within the same ethnic group; within their broad stylerestaurants specialise in different ways, for example, in fish, seafood, vegetarianand region. It is instructive to think of a number of ethnic restaurants and plotthem on a graph as shown in Figure 5.17.
I have carried this out for my own city of Edinburgh, and find that theclusters are quite pronounced as shown. Basically, there are four clusters, and itis within these that a great deal of competition arises rather than between, say,high quality and low quality Indian restaurants.
This example uses two characteristics of product differentiation to identify thestrategic group. Another dimension could be the number of restaurants underone owner: there may be significant economies in purchasing and minimisingexcess capacity with increasing numbers of restaurants. Since the definition ofthe industry group is dependent on the selection of relevant variables it is far
5/60 Edinburgh Business School Strategic Planning
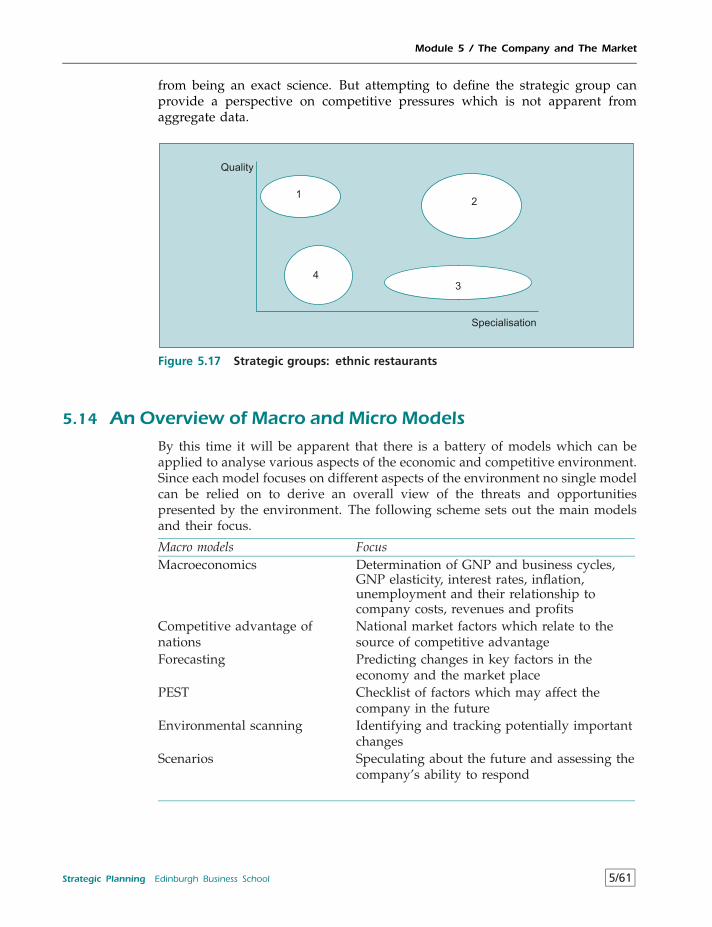
Module 5 / The Company and The Market
from being an exact science. But attempting to define the strategic group canprovide a perspective on competitive pressures which is not apparent fromaggregate data.
Quality
Specialisation
1
34
2
Figure 5.17 Strategic groups: ethnic restaurants
5.14 An Overview of Macro and Micro ModelsBy this time it will be apparent that there is a battery of models which can beapplied to analyse various aspects of the economic and competitive environment.Since each model focuses on different aspects of the environment no single modelcan be relied on to derive an overall view of the threats and opportunitiespresented by the environment. The following scheme sets out the main modelsand their focus.
Macro models FocusMacroeconomics Determination of GNP and business cycles,
GNP elasticity, interest rates, inflation,unemployment and their relationship tocompany costs, revenues and profits
Competitive advantage ofnations
National market factors which relate to thesource of competitive advantage
Forecasting Predicting changes in key factors in theeconomy and the market place
PEST Checklist of factors which may affect thecompany in the future
Environmental scanning Identifying and tracking potentially importantchanges
Scenarios Speculating about the future and assessing thecompany’s ability to respond
Strategic Planning Edinburgh Business School 5/61
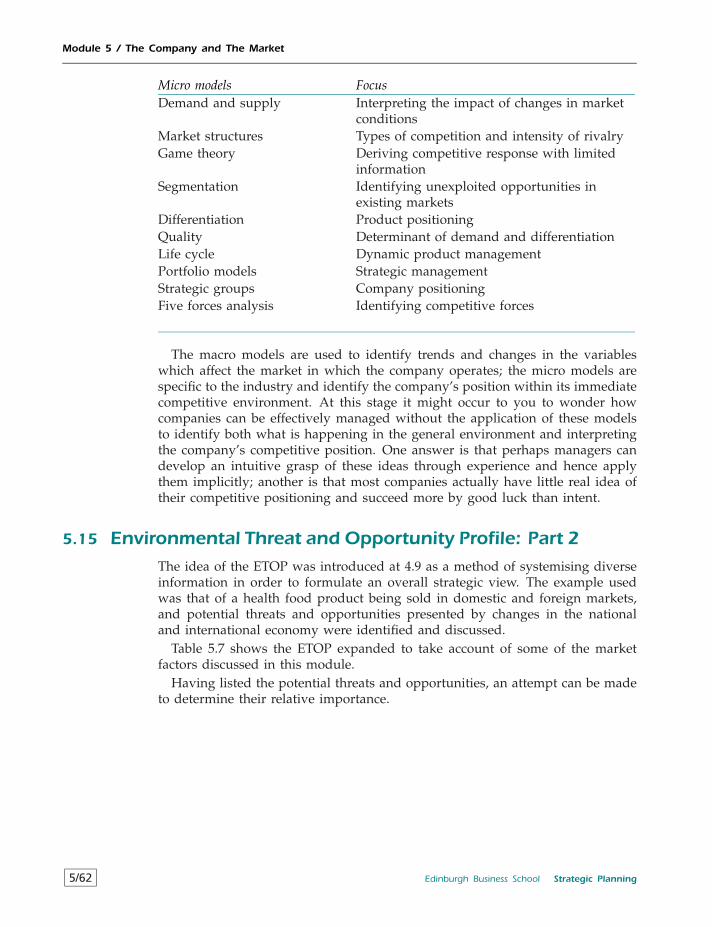
Module 5 / The Company and The Market
Micro models FocusDemand and supply Interpreting the impact of changes in market
conditionsMarket structures Types of competition and intensity of rivalryGame theory Deriving competitive response with limited
informationSegmentation Identifying unexploited opportunities in
existing marketsDifferentiation Product positioningQuality Determinant of demand and differentiationLife cycle Dynamic product managementPortfolio models Strategic managementStrategic groups Company positioningFive forces analysis Identifying competitive forces
The macro models are used to identify trends and changes in the variableswhich affect the market in which the company operates; the micro models arespecific to the industry and identify the company’s position within its immediatecompetitive environment. At this stage it might occur to you to wonder howcompanies can be effectively managed without the application of these modelsto identify both what is happening in the general environment and interpretingthe company’s competitive position. One answer is that perhaps managers candevelop an intuitive grasp of these ideas through experience and hence applythem implicitly; another is that most companies actually have little real idea oftheir competitive positioning and succeed more by good luck than intent.
5.15 Environmental Threat and Opportunity Profile: Part 2The idea of the ETOP was introduced at 4.9 as a method of systemising diverseinformation in order to formulate an overall strategic view. The example usedwas that of a health food product being sold in domestic and foreign markets,and potential threats and opportunities presented by changes in the nationaland international economy were identified and discussed.
Table 5.7 shows the ETOP expanded to take account of some of the marketfactors discussed in this module.
Having listed the potential threats and opportunities, an attempt can be madeto determine their relative importance.
5/62 Edinburgh Business School Strategic Planning
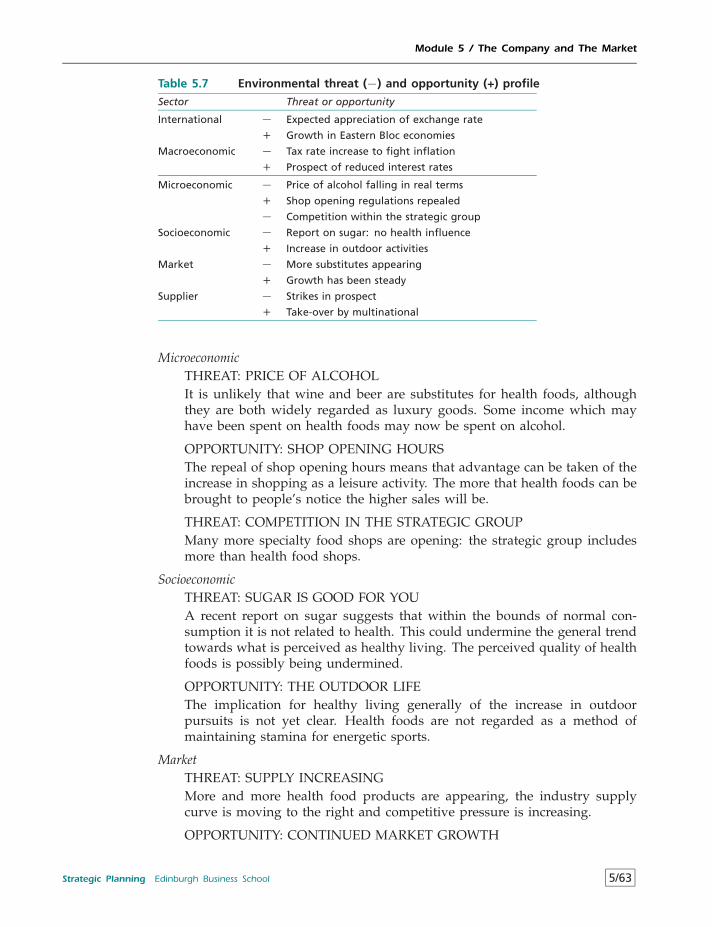
Module 5 / The Company and The Market
Table 5.7 Environmental threat (−) and opportunity (+) profile
Sector Threat or opportunity
International − Expected appreciation of exchange rate
+ Growth in Eastern Bloc economies
Macroeconomic − Tax rate increase to fight inflation
+ Prospect of reduced interest rates
Microeconomic − Price of alcohol falling in real terms
+ Shop opening regulations repealed
− Competition within the strategic group
Socioeconomic − Report on sugar: no health influence
+ Increase in outdoor activities
Market − More substitutes appearing
+ Growth has been steady
Supplier − Strikes in prospect
+ Take-over by multinational
MicroeconomicTHREAT: PRICE OF ALCOHOLIt is unlikely that wine and beer are substitutes for health foods, althoughthey are both widely regarded as luxury goods. Some income which mayhave been spent on health foods may now be spent on alcohol.
OPPORTUNITY: SHOP OPENING HOURSThe repeal of shop opening hours means that advantage can be taken of theincrease in shopping as a leisure activity. The more that health foods can bebrought to people’s notice the higher sales will be.
THREAT: COMPETITION IN THE STRATEGIC GROUPMany more specialty food shops are opening: the strategic group includesmore than health food shops.
SocioeconomicTHREAT: SUGAR IS GOOD FOR YOUA recent report on sugar suggests that within the bounds of normal con-sumption it is not related to health. This could undermine the general trendtowards what is perceived as healthy living. The perceived quality of healthfoods is possibly being undermined.
OPPORTUNITY: THE OUTDOOR LIFEThe implication for healthy living generally of the increase in outdoorpursuits is not yet clear. Health foods are not regarded as a method ofmaintaining stamina for energetic sports.
MarketTHREAT: SUPPLY INCREASINGMore and more health food products are appearing, the industry supplycurve is moving to the right and competitive pressure is increasing.
OPPORTUNITY: CONTINUED MARKET GROWTH
Strategic Planning Edinburgh Business School 5/63
Module 5 / The Company and The Market
The market has seen steady growth in the past 5 years, and the increasein tax rates is likely to reduce this temporarily at most. Thus while thedemand curve has been shifting to the right so has the supply curve; thishas implications for the general price level in this market.
SupplierTHREAT: LABOUR DISPUTEThe supplier’s workforce is threatening to go on strike in protest against thetake-over, and there is a real prospect of interruption in supply; alternativesuppliers are geographically remote and difficult to communicate with.
OPPORTUNITY: PROSPECT OF EFFICIENT SUPPLYThe main supplier has been unreliable in the past, and the take-over wouldalmost certainly lead to an increase in efficiency.
It was concluded in Module 4 that on balance the national and internationalenvironment posed more threats than opportunities. The market orientated partof the profile suggests a further balance in favour of threats: alternatives suchas alcohol and sugar are becoming more attractive, competitive pressures areincreasing, and there is a prospect of supply disruption. On the other hand thereis a prospect of long term growth in the market, and more efficient supply inthe future. While the ETOP has not provided ready made answers to strategy,it has enabled us to bring together many ideas in a framework which makes itpossible to identify key issues in context.
Review Question 1
Bring together the information from Modules 4 and 5 on the health food man-ufacturer, and analyse it using Porter’s framework for the structural analysis ofindustries.
Review Question 2
The CEO of a major company recently said that he did not see how the fiveforces analysis could be helpful in strategic decision making. He said that it givesthe impression that all of the forces are equally important, that it seems overlyconcerned with threats rather than opportunities and that it does not deal withinternal issues. Can you counter these arguments and make a case for the relevanceof the five forces analysis?
Case 1: Apple Computer (1991)
The Apple Macintosh personal computer was launched in 1984 into a fastgrowing market which was already dominated by IBM and compatible models.The distinguishing features of the Macintosh were its copyrighted user interface(which made the Macintosh relatively easy to use) and graphics features; itwas also not compatible with the IBM. Users committed to the Macintosh seemalmost to be zealots, and consider it to be far superior to the IBM design; others
5/64 Edinburgh Business School Strategic Planning
Module 5 / The Company and The Market
seem indifferent. The decision was made at the time of launch to price theMacintosh significantly above the IBM range. The Macintosh was launched witha marketing budget which exceeded Apple Computer’s total R&D budget. Thelaunch was encouraging to start with, in the sense that it quickly gained 10per cent of the market; however, market share was not significantly increasedthereafter. Subsequently, a key concern of the company was to achieve grossmargins of at least 50 per cent, with the objective of ploughing a great deal backinto the development of more powerful computers; the R&D budget increasedby about two times in real terms between 1986 and 1990, and in 1987 theMacintosh II was launched with colour and fast processors. However, marketshare remained at about 10 per cent during the late 1980s, and this was barelylarge enough to provide software innovators with the potential market requiredto justify the development of new products. By 1990 the Windows interfacewas developed for the IBM compatible personal computer, which gave thecheaper IBMs much the same characteristics as the Macintosh. In the Autumnof 1990 Apple cut its prices by about 40 per cent and a range of new low costMacintoshes was introduced. The effect of this on sales was quite dramatic: sixmonths later quarterly sales had doubled, and after a year were running at 85per cent higher than before the price cuts. However, most of the increase wasat the lower end of the product range, and Apple had to shed 10 per cent of itslabour force six months after the price cuts; it has now reallocated its resourcesto be a supplier of high volume, low margin boxes. The problem is that thismeans it cannot support its previous R&D efforts, and Apple has entered intojoint development deals, one with its rival IBM.
Questions
1 Analyse the Apple experience using the models developed in this Module.2 What future do you predict for Apple Computer?
Case 2: Salmon Farming (1992)
The salmon farming industry developed rapidly in Scotland during the 1980s,but by the early 1990s producers experienced substantial problems. It wasgenerally felt that the 6300 Scottish salmon farming jobs, and the £120 millionwhich had so far been invested in the industry, were in danger of being lost.The mid-1991 crisis was caused by Norwegian fish farmers dumping salmon inthe European Community to get rid of a huge surplus.
By 1991 salmon farming was the main source of employment in many westcoast Scottish communities; its output value was greater than that of beef andlamb. However, the industry lost £15 million during 1990. The problems werenot unique to Scotland, and many Norwegian fish farms had also gone bankrupt;this was because the price had been forced down all over Europe. Over 90per cent of salmon consumed is now farmed; the wild variety commands asubstantial price premium, and there is widespread concern that the farmedvariety is inferior to wild salmon.
Strategic Planning Edinburgh Business School 5/65
Module 5 / The Company and The Market
The following is abstracted from a letter from the chief executive of the ScottishSalmon Growers Association (SSGA) to the Prime Minister.
There is a clear view among my members of all political persuasions that thisvital industry is simply being ignored and let down by your government. Thisuniquely Scottish industry which has infused so much life back into the Highlandsand Islands economy is about to be destroyed by the piratical trading activities ofa non-member of the EU. I can see personal tragedies happening because of thissituation. People are in debt to the bank, their houses are at stake, and there isintense pressure on their families.
The SSGA wants the European Commission to impose a duty on Norwegiansalmon.
Many farms have made employees redundant, and some have sold out to thebig multinationals. But even these are experiencing difficulties; Marine Harvest,which is part of Unilever, lost around £19 million last year on its world-wideoperations.
The allegations of dumping are based on incidents such as the arrival of 250tonnes of Norwegian salmon in France, which caused the price to drop by 30per cent to £1.50 per pound, at which price it is claimed that farmers werelosing £0.40 per pound. In the US, a charge of dumping was found to be provedagainst Norway in 1990; Norway gave an undertaking that it would not happenagain; recently the US introduced a 26 per cent duty on Norwegian salmon,which effectively ended imports.
One fish farm claimed that the price they were paid in the UK had halved inthree years, and that their survival depended on a price recovery.
A salmon tourist centre was opened in 1991, which cost £0.5 million toconstruct. It is expected to attract 65 000 visitors per year.
Questions
1 Explain why the salmon farming industry is subject to low profits andhighly fluctuating prices.
2 What are the prospects for the salmon farming industry? Discuss the actionwhich existing UK producers might take to improve their competitive posi-tion.
Use the Strategy Report framework in Appendix 1 to organise your analysis,and set it out as though you were reporting to a strategy client.
Case 3: Lymeswold Cheese (1991)When Lymeswold cheese was taken off the market in 1991 it had an emotionalimpact on the British people far in excess of its economic importance; maybethis is because it was seen as yet another great British disaster along the linesof Concorde and the coal mining industry.
France is famous for the quality of its food and wine, and in particular ithas a reputation for fine cheese. The British made a direct challenge to the
5/66 Edinburgh Business School Strategic Planning
Module 5 / The Company and The Market
market for soft blue cheeses with the introduction by Dairy Crest in 1982 ofLymeswold, which resembled French blue Brie and German Cambozola. Duringthe early 1980s British consumers were becoming increasingly sophisticated, andthe consumption of soft cheeses was growing by 30 per cent per year.
The launch was more successful than expected, and within a short time therewere shortages due to a lack of productive capacity. This meant that Dairy Cresthad to make a choice of which customers to supply, and the decision was madeto carry on supplying supermarkets, who were its existing customers, ratherthan delicatessens.
In 1983 additional capacity was created and productive output was increasedto 4000 tonnes per year. However, despite the early success sales never exceeded2000 tonnes per year; to make matters worse, demand started to fall after 1986.A massive advertising campaign was mounted both in Britain and abroad, butthe decline continued.
Customers were not very happy about the cheese and a typical complaint wasthat it was too often bland or immature. There was no evidence that Dairy Crestimproved its quality control in order to ensure that the quality of the cheesewas at least consistent. Furthermore, Lymeswold is relatively mild and doesnot go runny as it matures, compared to Brie which is runny and has a muchmore distinctive taste. Some retailers felt that consumers used Lymeswold as astepping stone to the more sophisticated continental cheeses.
Dairy Crest is an arm of the Milk Marketing Board, which is a farmer-ownedlegal monopoly buyer of milk.
Identify what went wrong.
Case 4: Cigarette Price Wars (1994)
It was the dumbest decision in corporate history. They have ruined one of the bestbrand names in the world and have created permanent damage.
Henry Kravis, Wall Street buyout specialist, addressing Harvard Business School.
It is commercial suicide. All that investment in the brand, then you tell people thatyou can now buy for less than $2 what was worth $2.15 until yesterday. The buyeris never going to believe you again.
Bruce Davidson, tobacco analyst at the broker Smith New Court.
Kravis was referring to the decision by Philip Morris to cut the price of Marlborocigarettes by 20 per cent. He was not, however, an unbiased observer, havingbeen responsible in 1989 for a take-over of RJR Nabisco, which responded bycutting the prices on their Camel and Winston brands. Financial markets expectthe price war will have a significant impact on the profitability of cigarettecompanies – Philip Morris’ share price fell from $64 to $51 (23 per cent) withinminutes of the announcement of the price reduction, and fell further to $46 thefollowing week. Wall Street itself took fright and fell by 50 points. However,the notion that Philip Morris have simply ruined a brand name must be seenagainst the wider economic forces against which the Marlboro brand has beenstruggling for a considerable time
Strategic Planning Edinburgh Business School 5/67
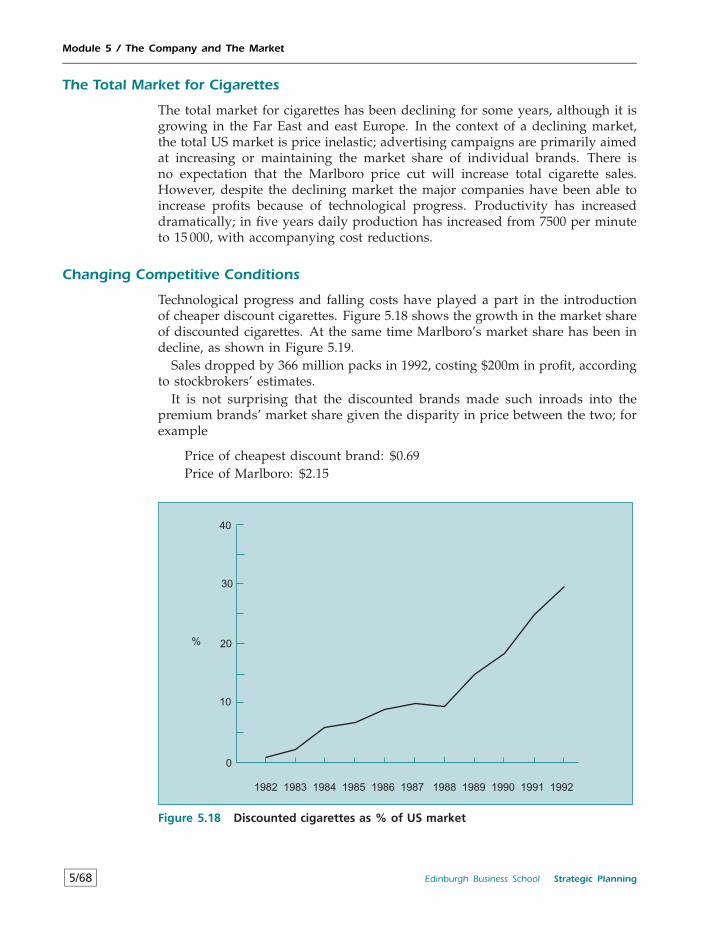
Module 5 / The Company and The Market
The Total Market for Cigarettes
The total market for cigarettes has been declining for some years, although it isgrowing in the Far East and east Europe. In the context of a declining market,the total US market is price inelastic; advertising campaigns are primarily aimedat increasing or maintaining the market share of individual brands. There isno expectation that the Marlboro price cut will increase total cigarette sales.However, despite the declining market the major companies have been able toincrease profits because of technological progress. Productivity has increaseddramatically; in five years daily production has increased from 7500 per minuteto 15 000, with accompanying cost reductions.
Changing Competitive Conditions
Technological progress and falling costs have played a part in the introductionof cheaper discount cigarettes. Figure 5.18 shows the growth in the market shareof discounted cigarettes. At the same time Marlboro’s market share has been indecline, as shown in Figure 5.19.
Sales dropped by 366 million packs in 1992, costing $200m in profit, accordingto stockbrokers’ estimates.
It is not surprising that the discounted brands made such inroads into thepremium brands’ market share given the disparity in price between the two; forexample
Price of cheapest discount brand: $0.69Price of Marlboro: $2.15
0
10
20
30
40
%
1982 1983 1984 1985 1986 1987 1988 1989 1990 1991 1992
Figure 5.18 Discounted cigarettes as % of US market
5/68 Edinburgh Business School Strategic Planning
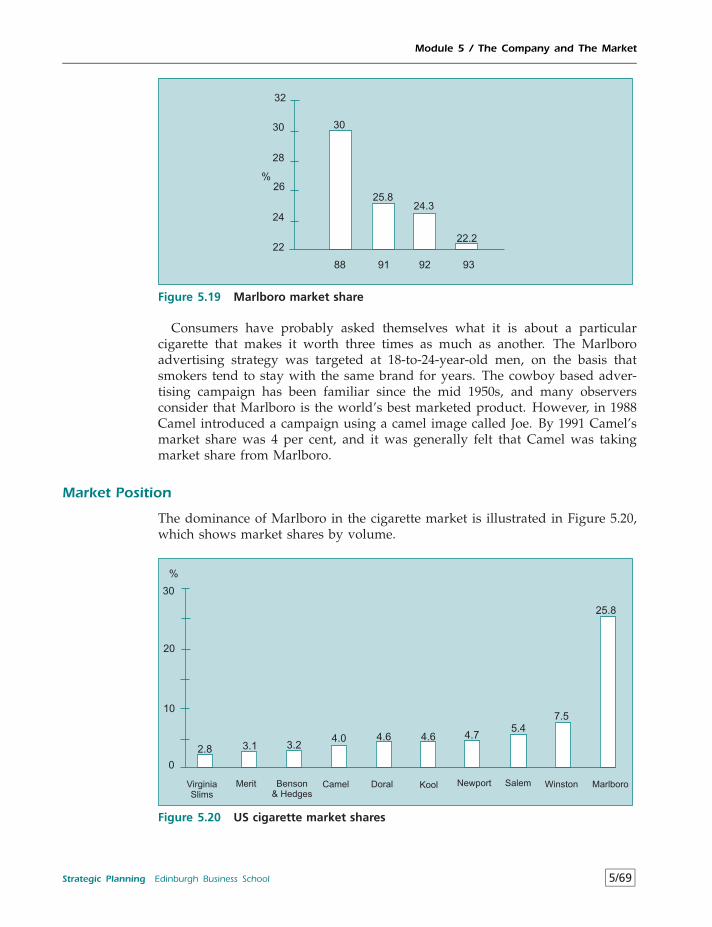
Module 5 / The Company and The Market
22
24
26
28
30
32
88 91 92 93
%
30
25.824.3
22.2
Figure 5.19 Marlboro market share
Consumers have probably asked themselves what it is about a particularcigarette that makes it worth three times as much as another. The Marlboroadvertising strategy was targeted at 18-to-24-year-old men, on the basis thatsmokers tend to stay with the same brand for years. The cowboy based adver-tising campaign has been familiar since the mid 1950s, and many observersconsider that Marlboro is the world’s best marketed product. However, in 1988Camel introduced a campaign using a camel image called Joe. By 1991 Camel’smarket share was 4 per cent, and it was generally felt that Camel was takingmarket share from Marlboro.
Market Position
The dominance of Marlboro in the cigarette market is illustrated in Figure 5.20,which shows market shares by volume.
0
10
20
30
VirginiaSlims
Merit Benson& Hedges
Camel Doral Kool Newport Salem Winston Marlboro
%
2.8 3.1 3.24.0 4.6 4.6 4.7
5.47.5
25.8
Figure 5.20 US cigarette market shares
Strategic Planning Edinburgh Business School 5/69
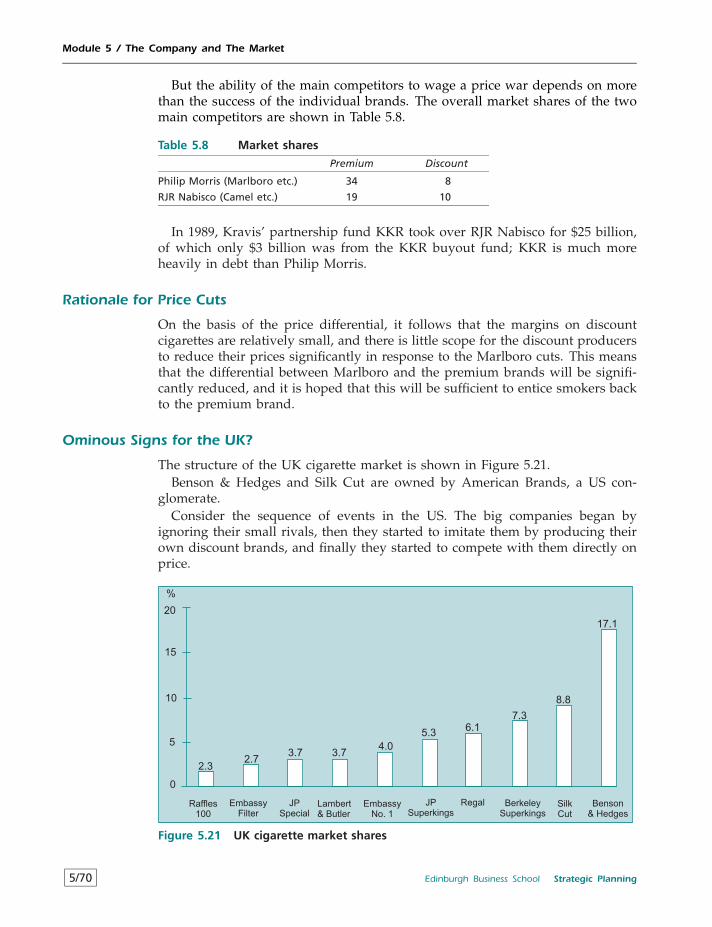
Module 5 / The Company and The Market
But the ability of the main competitors to wage a price war depends on morethan the success of the individual brands. The overall market shares of the twomain competitors are shown in Table 5.8.
Table 5.8 Market shares
Premium Discount
Philip Morris (Marlboro etc.) 34 8
RJR Nabisco (Camel etc.) 19 10
In 1989, Kravis’ partnership fund KKR took over RJR Nabisco for $25 billion,of which only $3 billion was from the KKR buyout fund; KKR is much moreheavily in debt than Philip Morris.
Rationale for Price Cuts
On the basis of the price differential, it follows that the margins on discountcigarettes are relatively small, and there is little scope for the discount producersto reduce their prices significantly in response to the Marlboro cuts. This meansthat the differential between Marlboro and the premium brands will be signifi-cantly reduced, and it is hoped that this will be sufficient to entice smokers backto the premium brand.
Ominous Signs for the UK?
The structure of the UK cigarette market is shown in Figure 5.21.Benson & Hedges and Silk Cut are owned by American Brands, a US con-
glomerate.Consider the sequence of events in the US. The big companies began by
ignoring their small rivals, then they started to imitate them by producing theirown discount brands, and finally they started to compete with them directly onprice.
0
5
10
20
Raffles100
EmbassyFilter
Benson& Hedges
Lambert& Butler
EmbassyNo. 1
Regal BerkeleySuperkings
SilkCut
%
2.3
4.0
15
JPSpecial
JPSuperkings
2.73.7 3.7
5.36.1
7.3
8.8
17.1
Figure 5.21 UK cigarette market shares
5/70 Edinburgh Business School Strategic Planning
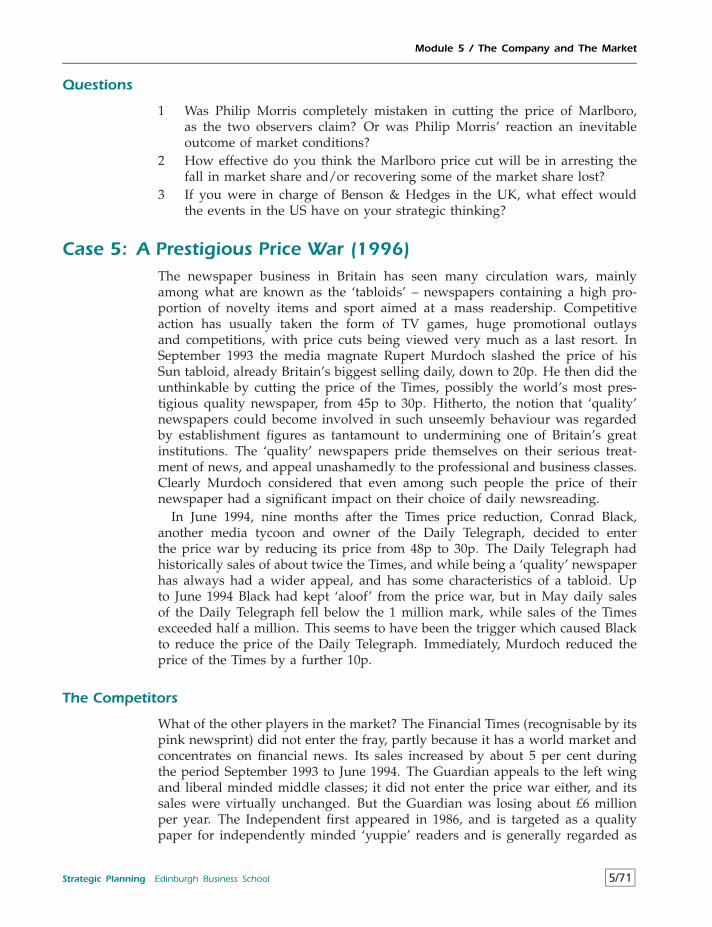
Module 5 / The Company and The Market
Questions
1 Was Philip Morris completely mistaken in cutting the price of Marlboro,as the two observers claim? Or was Philip Morris’ reaction an inevitableoutcome of market conditions?
2 How effective do you think the Marlboro price cut will be in arresting thefall in market share and/or recovering some of the market share lost?
3 If you were in charge of Benson & Hedges in the UK, what effect wouldthe events in the US have on your strategic thinking?
Case 5: A Prestigious Price War (1996)The newspaper business in Britain has seen many circulation wars, mainlyamong what are known as the ‘tabloids’ – newspapers containing a high pro-portion of novelty items and sport aimed at a mass readership. Competitiveaction has usually taken the form of TV games, huge promotional outlaysand competitions, with price cuts being viewed very much as a last resort. InSeptember 1993 the media magnate Rupert Murdoch slashed the price of hisSun tabloid, already Britain’s biggest selling daily, down to 20p. He then did theunthinkable by cutting the price of the Times, possibly the world’s most pres-tigious quality newspaper, from 45p to 30p. Hitherto, the notion that ‘quality’newspapers could become involved in such unseemly behaviour was regardedby establishment figures as tantamount to undermining one of Britain’s greatinstitutions. The ‘quality’ newspapers pride themselves on their serious treat-ment of news, and appeal unashamedly to the professional and business classes.Clearly Murdoch considered that even among such people the price of theirnewspaper had a significant impact on their choice of daily newsreading.
In June 1994, nine months after the Times price reduction, Conrad Black,another media tycoon and owner of the Daily Telegraph, decided to enterthe price war by reducing its price from 48p to 30p. The Daily Telegraph hadhistorically sales of about twice the Times, and while being a ‘quality’ newspaperhas always had a wider appeal, and has some characteristics of a tabloid. Upto June 1994 Black had kept ‘aloof’ from the price war, but in May daily salesof the Daily Telegraph fell below the 1 million mark, while sales of the Timesexceeded half a million. This seems to have been the trigger which caused Blackto reduce the price of the Daily Telegraph. Immediately, Murdoch reduced theprice of the Times by a further 10p.
The Competitors
What of the other players in the market? The Financial Times (recognisable by itspink newsprint) did not enter the fray, partly because it has a world market andconcentrates on financial news. Its sales increased by about 5 per cent duringthe period September 1993 to June 1994. The Guardian appeals to the left wingand liberal minded middle classes; it did not enter the price war either, and itssales were virtually unchanged. But the Guardian was losing about £6 millionper year. The Independent first appeared in 1986, and is targeted as a qualitypaper for independently minded ‘yuppie’ readers and is generally regarded as
Strategic Planning Edinburgh Business School 5/71
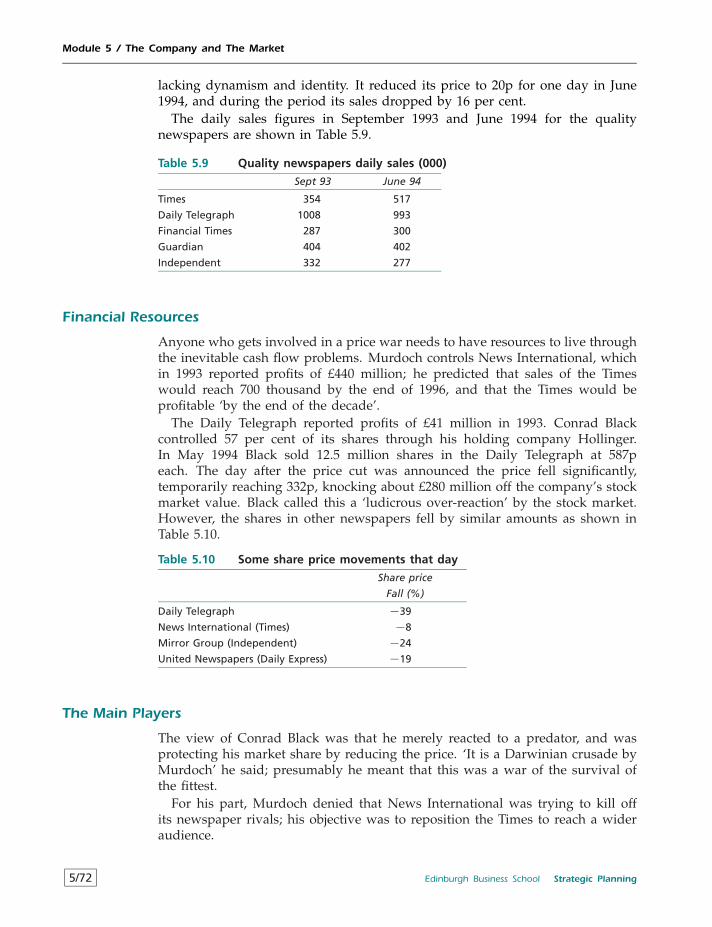
Module 5 / The Company and The Market
lacking dynamism and identity. It reduced its price to 20p for one day in June1994, and during the period its sales dropped by 16 per cent.
The daily sales figures in September 1993 and June 1994 for the qualitynewspapers are shown in Table 5.9.
Table 5.9 Quality newspapers daily sales (000)
Sept 93 June 94
Times 354 517
Daily Telegraph 1008 993
Financial Times 287 300
Guardian 404 402
Independent 332 277
Financial Resources
Anyone who gets involved in a price war needs to have resources to live throughthe inevitable cash flow problems. Murdoch controls News International, whichin 1993 reported profits of £440 million; he predicted that sales of the Timeswould reach 700 thousand by the end of 1996, and that the Times would beprofitable ‘by the end of the decade’.
The Daily Telegraph reported profits of £41 million in 1993. Conrad Blackcontrolled 57 per cent of its shares through his holding company Hollinger.In May 1994 Black sold 12.5 million shares in the Daily Telegraph at 587peach. The day after the price cut was announced the price fell significantly,temporarily reaching 332p, knocking about £280 million off the company’s stockmarket value. Black called this a ‘ludicrous over-reaction’ by the stock market.However, the shares in other newspapers fell by similar amounts as shown inTable 5.10.
Table 5.10 Some share price movements that day
Share price
Fall (%)
Daily Telegraph −39
News International (Times) −8
Mirror Group (Independent) −24
United Newspapers (Daily Express) −19
The Main Players
The view of Conrad Black was that he merely reacted to a predator, and wasprotecting his market share by reducing the price. ‘It is a Darwinian crusade byMurdoch’ he said; presumably he meant that this was a war of the survival ofthe fittest.
For his part, Murdoch denied that News International was trying to kill offits newspaper rivals; his objective was to reposition the Times to reach a wideraudience.
5/72 Edinburgh Business School Strategic Planning
Module 5 / The Company and The Market
The Outlook
By July 1996 the Times was able to boast that it had doubled its circulation sinceAugust 1993 while the Daily Telegraph had remained more or less static. It wasclaimed that more people between the ages of 25–44 now read the Times thanany other quality daily newspaper. It also pointed out that the 17 page Sportssection, Times Sport, was the largest of any daily newspaper.
Questions
1 Analyse the competition in the quality newspaper market.2 Do you think the Daily Telegraph share price reduction was simply ‘ludi-
crous over-reaction’ on the part of stock exchange investors?
Case 6: An International Romance that Failed: British Telecomand MCI (1998)
It was going to be the biggest transatlantic merger in history: British Telecom(BT), the giant supplier of UK telephone services and MCI, America’s secondlargest long-distance telecoms carrier. BT had first bought 20% of MCI in 1993and in 1996 BT made a $24 billion bid for the remaining 80%. But a fewmonths later the value of the takeover had been devalued by $5 billion, andanother suitor – WorldCom – stepped in with a bid of $30 billion. BT’s hopes ofbuilding a major international telecoms presence had ground to a halt. So whatwent wrong?
The BT MCI rationale
BT’s intention was to build on its existing alliance with MCI to offer multina-tional firms one-stop worldwide telecoms services. MCI hoped to use BT’s skillsand financial strength to enter America’s vast market for local telephone calls;this business was controlled by regional companies known as ‘Baby Bells’.
MCI and Expansion in the US
Various reports suggested that the merger might not achieve its strategic aimsin the US.
1 MCI’s core business was the mature market for long-distance telephone callsinside the US. Critics pointed out that this could make little contribution tothe corporate customers sought by BT.
2 During the period up to 1995 there had been a significant liberalisation ofthe US telecoms market, and it was to take advantage of this that MCI wastrying to enter the local markets. But it turned out to be much more difficultthan expected, and in the first quarter of 1997 MCI won only $80 millionof local market business; this was less than 2% of MCI’s normal quarterlyrevenue. This was bad enough, but by September 1997 MCI announced anunexpectedly high loss of $800 million on its domestic operations. It was
Strategic Planning Edinburgh Business School 5/73
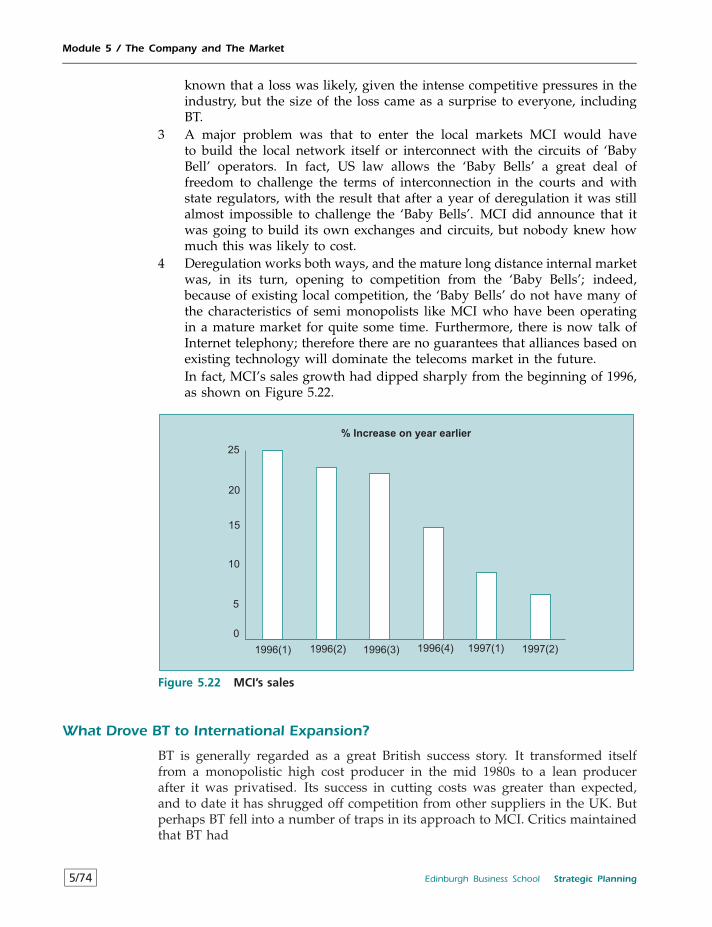
Module 5 / The Company and The Market
known that a loss was likely, given the intense competitive pressures in theindustry, but the size of the loss came as a surprise to everyone, includingBT.
3 A major problem was that to enter the local markets MCI would haveto build the local network itself or interconnect with the circuits of ‘BabyBell’ operators. In fact, US law allows the ‘Baby Bells’ a great deal offreedom to challenge the terms of interconnection in the courts and withstate regulators, with the result that after a year of deregulation it was stillalmost impossible to challenge the ‘Baby Bells’. MCI did announce that itwas going to build its own exchanges and circuits, but nobody knew howmuch this was likely to cost.
4 Deregulation works both ways, and the mature long distance internal marketwas, in its turn, opening to competition from the ‘Baby Bells’; indeed,because of existing local competition, the ‘Baby Bells’ do not have many ofthe characteristics of semi monopolists like MCI who have been operatingin a mature market for quite some time. Furthermore, there is now talk ofInternet telephony; therefore there are no guarantees that alliances based onexisting technology will dominate the telecoms market in the future.In fact, MCI’s sales growth had dipped sharply from the beginning of 1996,as shown on Figure 5.22.
1996(1) 1996(2) 1996(3) 1996(4) 1997(1) 1997(2)
0
5
10
15
20
25
% Increase on year earlier
Figure 5.22 MCI’s sales
What Drove BT to International Expansion?
BT is generally regarded as a great British success story. It transformed itselffrom a monopolistic high cost producer in the mid 1980s to a lean producerafter it was privatised. Its success in cutting costs was greater than expected,and to date it has shrugged off competition from other suppliers in the UK. Butperhaps BT fell into a number of traps in its approach to MCI. Critics maintainedthat BT had
5/74 Edinburgh Business School Strategic Planning
Module 5 / The Company and The Market
• overstated the value of its target.• focused on new business at the expense of its existing markets.• drawn unreliable parallels between its own experience in Britain and condi-
tions in the US. The fact that BT had transformed itself from being a flabbygiant did not necessarily generate insights into the competitive potential ofthe ‘Baby Bells’.
Would They Fit?
Little was said in the press about the potential problems of getting BT and MCIworking together. These were two massive operations, and integrating theirmarkets would necessarily involve close working relationships. The feasibility ofintegrating the cultures of organisations from different countries and competitiveenvironments was open to question
But There Was Something There
The announcement of MCI’s losses was not the only shock BT received. InSeptember 1997 WorldCom made a bid of $30 billion for MCI, which was thebiggest takeover bid in history. MCI shares immediately increased in value byabout 20%. What was it about a merger with WorldCom that could producesuch value?
First of all, WorldCom was relatively young: it was still less than 15 yearsold by the time it made its bid for MCI and was regarded by the market asinnovative and dynamic. Second, it focused on carrying data for businessesrather than voice calls over long distances. In 1996 it spent $14 billion on MFSCommunications, which is a telecoms and Internet access company. It then spent$1.2 billion on the network services units of CompuServe and America Online.These were the latest in a series of deals which made WorldCom the largestprovider of Internet services in the world and an important player in local, longdistance and international telephony. To back up these services WorldCom hadalmost total fibre optic coverage in the US and a substantial satellite coverage.
All this could be combined with MCI’s known brand marketing expertise andbilling systems to take local business away from the Baby Bells. WorldComreckoned that the two companies would save $2.5 billion in costs per annumimmediately, and this could grow to $5 billion in five years.
Another potential benefit was that WorldCom has a reputation for realigningmanagement in its new companies, and this might be beneficial to MCI.
Into the New Competitive Environment
Even if the takeover is successful, there are severe competitive challenges aheadfor WorldCom. Total revenues from local calls are likely to grow only slowlyduring the next few years, while the cost of long distance calls in the US fell by50% between 1994 and 1997; international prices fell by 60% in the same period.Furthermore, other global alliances involving companies such as AT&T are alsocompeting for the same business.
Strategic Planning Edinburgh Business School 5/75
Module 5 / The Company and The Market
Question
Did BT really understand competition in the US telecoms market?
References
1 Garvin, D.A. (1986) ‘What does product quality really mean?’, Sloan ManagementReview, Vol. 26, No. 1.
2 Ibid.
3 Powell, T.C. (1995) ‘Total Quality Management as competitive advantage’, StrategicManagement Journal, Vol. 16, pp. 15–37.
4 Boston Consulting Group (1970) The Product Portfolio Concept: Perspective No 66. BostonConsulting Group.
5 Porter, M.E. (1980) Competitive Strategy: Techniques for Analyzing Industries and Competi-tors, New York: Free Press.
6 ‘Dumping crisis threatens salmon farming’, The Scotsman, 10 July 1991.
7 Igor Ansoff (1987) Corporate Strategy, McGraw Hill.
5/76 Edinburgh Business School Strategic Planning
Module 6
Internal Analysis of the Company
Contents
6.1 Opportunity Cost 6/2
6.2 Fixed Costs, Variable Costs and Sunk Costs 6/4
6.3 Marginal Analysis 6/5
6.4 Diminishing Marginal Product 6/8
6.5 Profit Maximisation 6/10
6.6 Economies of Scale and the Experience Curve 6/11
6.7 Economies of Scope 6/13
6.8 Production Costs 6/14
6.9 Joint Production 6/15
6.10 Break-Even Analysis 6/16
6.11 Payback Period 6/17
6.12 Accounting Ratios 6/18
6.13 Benchmarking 6/21
6.14 Sensitivity Analysis 6/23
6.15 Research and Innovation 6/24
6.16 Development 6/26
6.17 Resource Management 6/31
6.18 Human Resource Management 6/33
6.19 Vertical Integration 6/35
6.20 The Value Chain 6/38
6.21 Diversification 6/40
6.22 Synergy 6/41
6.23 Competence 6/44
6.24 Strategic Architecture 6/49
6.25 The Definition of Competitive Advantage 6/50
6.26 Strategic Advantage Profile 6/53
Case 1: Analysing Company Accounts 6/55
Case 2: Analysing Company Information 6/57
Case 3: Lufthansa Has a Rough Landing (1993) 6/60
Case 4: General Motors: the Story of an Empire (1998) 6/61
Strategic Planning Edinburgh Business School 6/1
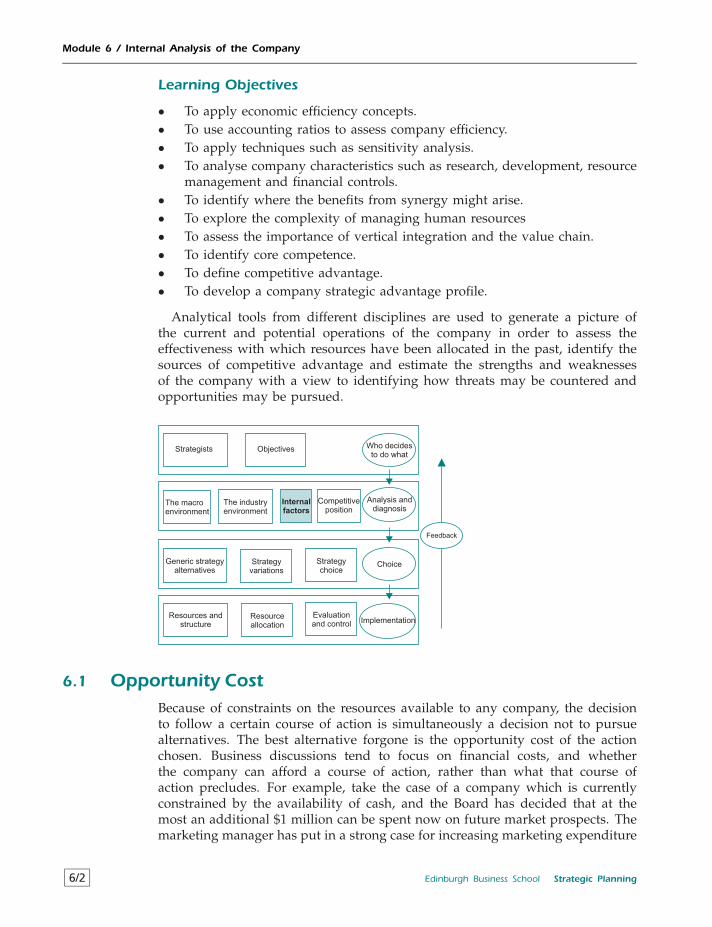
Module 6 / Internal Analysis of the Company
Learning Objectives
• To apply economic efficiency concepts.• To use accounting ratios to assess company efficiency.• To apply techniques such as sensitivity analysis.• To analyse company characteristics such as research, development, resource
management and financial controls.• To identify where the benefits from synergy might arise.• To explore the complexity of managing human resources• To assess the importance of vertical integration and the value chain.• To identify core competence.• To define competitive advantage.• To develop a company strategic advantage profile.
Analytical tools from different disciplines are used to generate a picture ofthe current and potential operations of the company in order to assess theeffectiveness with which resources have been allocated in the past, identify thesources of competitive advantage and estimate the strengths and weaknessesof the company with a view to identifying how threats may be countered andopportunities may be pursued.
Strategists Objectives
The macroenvironment
The industryenvironment
Internal
factors
Competitiveposition
Generic strategyalternatives
Strategyvariations
Who decidesto do what
Analysis anddiagnosis
Choice
Implementation
Strategychoice
Resources andstructure
Resourceallocation
Evaluationand control
Feedback
6.1 Opportunity CostBecause of constraints on the resources available to any company, the decisionto follow a certain course of action is simultaneously a decision not to pursuealternatives. The best alternative forgone is the opportunity cost of the actionchosen. Business discussions tend to focus on financial costs, and whetherthe company can afford a course of action, rather than what that course ofaction precludes. For example, take the case of a company which is currentlyconstrained by the availability of cash, and the Board has decided that at themost an additional $1 million can be spent now on future market prospects. Themarketing manager has put in a strong case for increasing marketing expenditure
6/2 Edinburgh Business School Strategic Planning
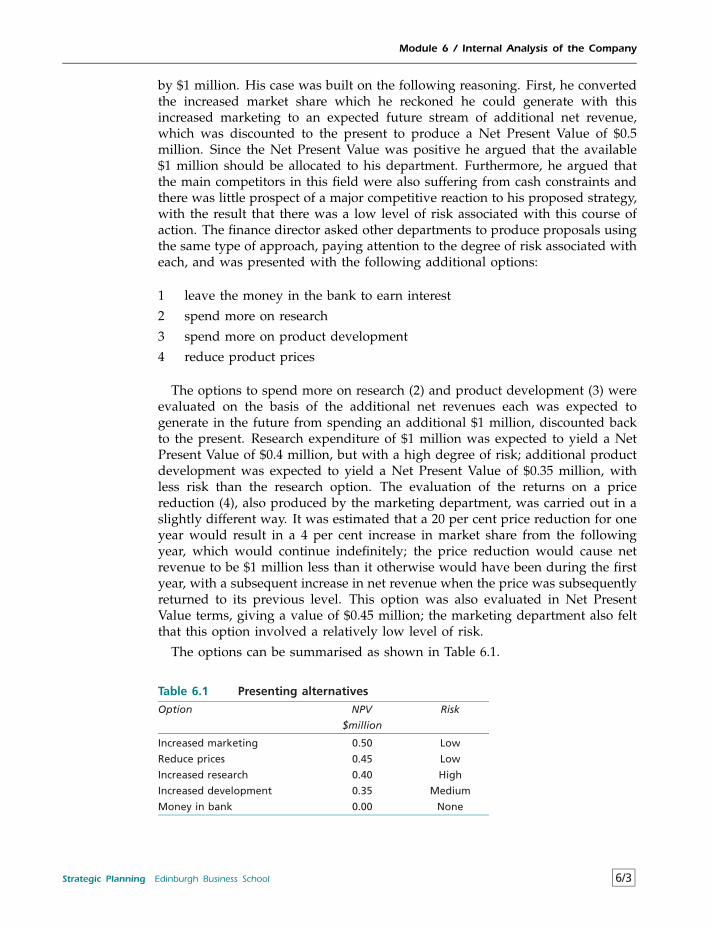
Module 6 / Internal Analysis of the Company
by $1 million. His case was built on the following reasoning. First, he convertedthe increased market share which he reckoned he could generate with thisincreased marketing to an expected future stream of additional net revenue,which was discounted to the present to produce a Net Present Value of $0.5million. Since the Net Present Value was positive he argued that the available$1 million should be allocated to his department. Furthermore, he argued thatthe main competitors in this field were also suffering from cash constraints andthere was little prospect of a major competitive reaction to his proposed strategy,with the result that there was a low level of risk associated with this course ofaction. The finance director asked other departments to produce proposals usingthe same type of approach, paying attention to the degree of risk associated witheach, and was presented with the following additional options:
1 leave the money in the bank to earn interest
2 spend more on research
3 spend more on product development
4 reduce product prices
The options to spend more on research (2) and product development (3) wereevaluated on the basis of the additional net revenues each was expected togenerate in the future from spending an additional $1 million, discounted backto the present. Research expenditure of $1 million was expected to yield a NetPresent Value of $0.4 million, but with a high degree of risk; additional productdevelopment was expected to yield a Net Present Value of $0.35 million, withless risk than the research option. The evaluation of the returns on a pricereduction (4), also produced by the marketing department, was carried out in aslightly different way. It was estimated that a 20 per cent price reduction for oneyear would result in a 4 per cent increase in market share from the followingyear, which would continue indefinitely; the price reduction would cause netrevenue to be $1 million less than it otherwise would have been during the firstyear, with a subsequent increase in net revenue when the price was subsequentlyreturned to its previous level. This option was also evaluated in Net PresentValue terms, giving a value of $0.45 million; the marketing department also feltthat this option involved a relatively low level of risk.
The options can be summarised as shown in Table 6.1.
Table 6.1 Presenting alternatives
Option NPV Risk
$million
Increased marketing 0.50 Low
Reduce prices 0.45 Low
Increased research 0.40 High
Increased development 0.35 Medium
Money in bank 0.00 None
Strategic Planning Edinburgh Business School 6/3
Module 6 / Internal Analysis of the Company
The opportunity cost, in purely financial terms, of spending the $1 million onmarketing is to reduce prices because this is the next best alternative; since thesetwo options have a similar level of risk they can be compared directly. However,the ranking of the other two active options is a matter of judgement because,while increased research has a higher NPV than increased development, it alsohas a higher degree of risk. Leaving the money in the bank is a poor optionin terms of generating value. It is not strictly true that the risk associated withmoney in the bank is ‘none’, because there might be an unexpected fall in theinterest rate and a substantial increase in the inflation rate, i.e. the real rate ofinterest may go negative.
Presentation of the options in opportunity cost terms is an important step inhelping managers to identify relevant trade-offs and establish priorities. The ideacan be used to evaluate resource allocation options at all levels in the company;from the strategy viewpoint the opportunity cost concept helps to focus on thefollowing questions: ‘Have we identified all relevant options?’ and ‘How do theoptions compare with each other?’
6.2 Fixed Costs, Variable Costs and Sunk CostsAt first sight the distinction between fixed and variable costs might appear tobe so obvious as not to require discussion. However, many accounting systemsignore the fact that some costs are fixed and some are variable with respect tochanges in output. One widespread practice is to allocate overheads such ascentral administration costs to each product on a per unit basis. In the previousexample the return on a price reduction was estimated, and the estimate ofthe future net cash flows would obviously have taken into account expectedfuture production costs. However, an arbitrary allocation of ‘overheads’ to theadditional output would have given an entirely different result in terms of thefuture net cash flow and the net present value, despite the fact that the additionaloutput had no impact on ‘overheads’. Many accountants are firmly convincedthat each product must bear its share of overheads. Application of this principlecan lead to misallocation of resources.
Perhaps an even more serious error is to take sunk costs into account incurrent decision making. Sunk costs are the costs which were incurred in thepast, and as a result cannot vary with respect to output. It may well be thatpast expenditure can be used as a guide to what expenditure might be in thefuture, but it is senseless to attempt to allocate sunk costs to variations in currentoutput.
Factory rent is an example of a fixed cost; since it does not vary with output ithas no implication for the quantity which should be produced; when consideringthe proposal to increase output by 10 per cent, there is no point to reallocatingfactory rent over the new range of output and changing the calculation of unitcost. Doing so would not reveal whether it was worthwhile to increase output.
Materials are a variable input, hence the cost of materials must be taken intoaccount in deciding the level of output.
Expenditure on development incurred last quarter is a sunk cost, and thereforehas no bearing on whether to continue developing a product. One of the classical
6/4 Edinburgh Business School Strategic Planning
Module 6 / Internal Analysis of the Company
mistakes is to say ‘We have spent so much on this product that we MUSTcontinue with it.’
Reverting to the basic model of costs makes it possible to clarify which costsare relevant when making decisions about individual products:
Outlayp = Number of workersp ×Wage rate+ Units of capitalp × Price+ Units of materialp × Price
Unit costp = Outlayp/Outputpwhere p = individual product
The model helps to identify which inputs vary with output, and then assigncosts to those inputs. This may not be simple to do in practice, and giventhe complexity of modern companies there is an incentive to use existing costaccounting procedures which are intended to approximate to the relevant costs;however, there is no guarantee that the costs produced by existing proceduresare actually those which will lead to rational decisions. When making strategydecisions it is obviously important to make sure that the appropriate costsare taken into account; merely posing questions about whether costs are fixed,variable or sunk can suggest where accounting cost data may be misleading.Sunk costs are a particularly important strategic consideration for barriers toentry, as discussed at 5.10.3; if the costs of entry are recoverable then they arenot sunk as far as the strategic move is concerned. The fact that a cost wasincurred in the past does not necessarily make it sunk.
6.3 Marginal AnalysisOne of the outcomes of failing to distinguish between fixed and variable cost isthat decision makers focus on average costs, and this can often be a major error.It has been pointed out that companies often allocate overhead costs to productsirrespective of whether these costs are directly related to changes in output.The concept of marginal cost is a development of the notion that only relevantcosts should be taken into account in making pricing and output decisions. Themarginal cost principle is simple enough, being the change in costs as outputvaries. In terms of the basic model:
Marginal cost = Outlayq+1 − Outlayq
where q = level of output
Since the marginal cost excludes fixed cost, it can be significantly lower thanaverage cost; thus when making output and pricing decisions the marginal costcan be used as a guide to the minimum acceptable price. The company cancompare the marginal cost of production with the market price when decidinghow much to produce. In fact, the marginal principle provides the basis for adecision rule: carry on producing and selling so long as the marginal cost is lessthan the price.
In most instances it is likely that marginal cost is constant or increasing, atleast in the short run. The combination of increasing marginal cost and the
Strategic Planning Edinburgh Business School 6/5
Module 6 / Internal Analysis of the Company
rule that it is worthwhile to produce and sell when marginal cost is less thanprice leads to a decision rule on setting output: carry on producing and sellinguntil marginal cost and price are equal. Beyond this point marginal cost willbe greater than price and a loss will be made on each unit. The rule is moredifficult to apply when it is necessary to reduce price in order to increase sales;in this case marginal cost is not compared with price but with the additionalrevenue generated by increased sales, taking account of the reduction in price.The additional amount gained from the sale of each additional unit is known asmarginal revenue; when it is not necessary to reduce the price in order to selladditional units then marginal revenue and price are equal.
The concept of the margin is typically associated with small changes whichare continually undertaken in the quest for efficiency. The questions to whichmarginal analysis can be applied include: ‘How many units should the companyproduce and sell?’, ‘How much should be spent on development?’ and ‘Howmuch should be spent on marketing?’ The analytical issue which is commonto these questions is: ‘Does the last dollar spent generate at least a dollar ofrevenue?’ If not, there is little point in spending it. The benefit of thinking inmarginal terms is that it focuses on the costs and benefits associated with specificactions. It will often be found that marginal costs are difficult to quantify, and themarginal revenues, since they occur in the future, can only be estimated; whilemeasurement presents a real difficulty in applying the marginal principle, itshould not be used as an excuse to revert to a conventional historical accountingapproach.
Some decisions may not be regarded as marginal in the sense that they affectthe whole company. The decision to enter a new market may require a changein company organisation, and it may be difficult to visualise what is meantby marginal cost and marginal revenue. In economics, the distinction is drawnbetween short run and long run marginal cost. One way of describing thedifference between the two is that in the short run the productive capacity ofthe company is held constant, and only variable inputs are allowed to change;long run marginal cost allows all inputs to vary, including these which aretypically regarded as ‘fixed’ in real life. While it is difficult to be precise aboutthe distinction between the two in practice, the underlying theory allows forchanges in all dimensions of a company’s operations. Consequently, the marginalapproach need not be concerned only with small changes. What is important isthat the marginal concept is used to identify those costs and revenues which willbe affected by the decision. In accounting terms, this is sometimes referred toas ‘relevant costs’; in arriving at relevant costs the emphasis is on the extractionof marginal cost from the confusing array of real life accounting information.
The marginal concept can be applied to most aspects of decision making.For example, what is the value of the additional output associated with thehiring of one more worker, or the installation of one more assembly line?Given the importance of marginal analysis to decision making, it is strikingthat managers are often unaware of the idea; perhaps this is due to companies’information collection approaches, which tend to concentrate on average ratherthan marginal data. Another important application is in marginal cost pricing.Often a company finds that it faces ‘one-off’ situations when prices have to be
6/6 Edinburgh Business School Strategic Planning
Module 6 / Internal Analysis of the Company
negotiated. For example, in the hotel business a potential customer walks in offthe street and asks how much a room is for the night; the reply is usually the‘rack rate’, which is the full undiscounted price for the room. But if the hotel isnot completely full, what is the lowest price the manager should be willing toaccept? It is simply the marginal cost of providing the room for the customerthat night, and managers should have some idea of what this is. But typicallythe minimum acceptable price set by managers is the average cost. Companiesoften lose potentially profitable business because they do not appreciate thatthe appropriate minimum price is the marginal cost, not the average cost, whenmaking deals at the margin. Recognition of the importance of marginal costalso has implications for the degree of empowerment which can be devolved toemployees; in the hotel example the hotel company is made better off by everymarginal deal which generates more than the marginal cost. The duty managercan be provided with appropriate incentives and encouraged to haggle at themargin so long as he does not strike deals at below marginal cost; otherwise themarginal business will be lost.
An important application of marginal analysis relates to the selling of invento-ries as a product’s life cycle draws to a close. Take the case where the companyexpects to have an inventory of 800 units of the product in the final quarter ofthe product life, and does not intend to produce any additional units duringthat quarter. Given that there are no production costs, and assuming that sellingcosts are zero, what price should be charged for the product inventory in thefinal quarter?
The type of response which this question elicits includes:
1 ‘As high a price as the market will bear’2 ‘A price which will clear all of the inventory’3 ‘A price which will cover the costs of production’
All of these are wrong.In this case the marginal cost is zero, so attention is focused on marginal
revenue, and this leads to the demand concept developed at 5.2.2 and therevenue maximising price. If a price of $1 million is charged then zero unitswill be sold; if a price of zero is charged, then all units will be sold. In betweenthese two extremes is a price at which the revenue obtained from sales will bemaximised, irrespective of whether or not all units have actually been sold.
As shown in Figure 6.1, a straight line demand curve has been drawn forillustration. At price P and quantity 500 price times quantity is maximised.This is also the point at which marginal revenue is zero. Since all costs havealready been incurred, the appropriate price is the revenue maximising price.The application of mistaken notions of revenue maximisation at this stage couldcost the company a great deal in terms of lost revenue.
But what might this revenue maximising price be? The manager only has onechance to set the price, and will not know if this was the revenue maximisingprice or not. However, some knowledge of market conditions can help. If thecompany is operating in conditions of oligopoly, or competition among the few,it is likely to be faced with the kinked demand curve at 5.3.2. Since this is thelast quarter of the product life cycle and there are no future strategic implications
Strategic Planning Edinburgh Business School 6/7
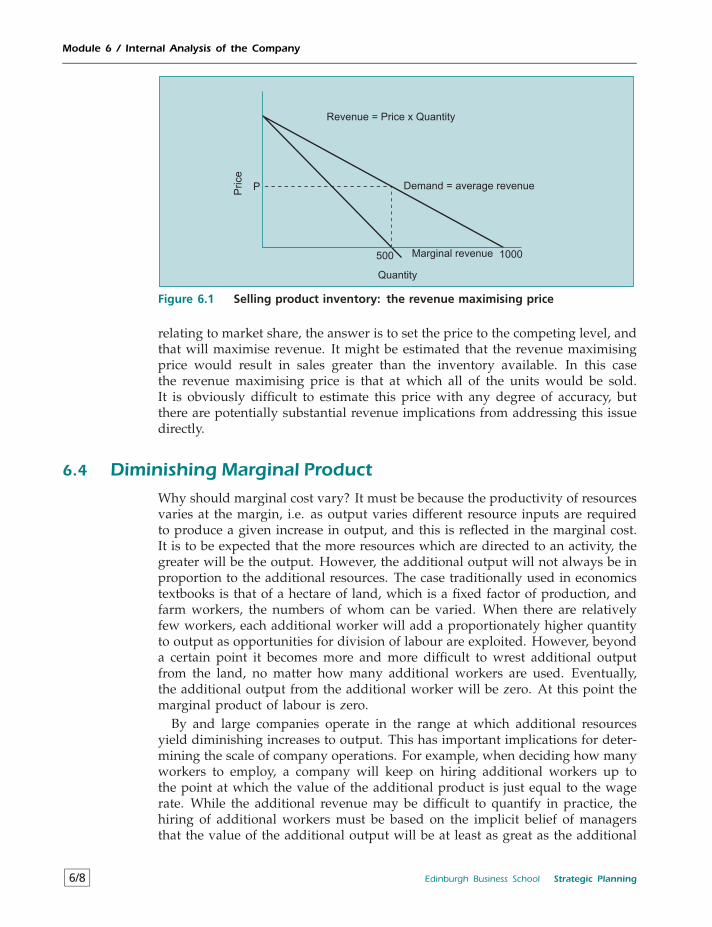
Module 6 / Internal Analysis of the Company
Demand = average revenue
Marginal revenue500 1000
Price
P
Quantity
Revenue = Price x Quantity
Figure 6.1 Selling product inventory: the revenue maximising price
relating to market share, the answer is to set the price to the competing level, andthat will maximise revenue. It might be estimated that the revenue maximisingprice would result in sales greater than the inventory available. In this casethe revenue maximising price is that at which all of the units would be sold.It is obviously difficult to estimate this price with any degree of accuracy, butthere are potentially substantial revenue implications from addressing this issuedirectly.
6.4 Diminishing Marginal ProductWhy should marginal cost vary? It must be because the productivity of resourcesvaries at the margin, i.e. as output varies different resource inputs are requiredto produce a given increase in output, and this is reflected in the marginal cost.It is to be expected that the more resources which are directed to an activity, thegreater will be the output. However, the additional output will not always be inproportion to the additional resources. The case traditionally used in economicstextbooks is that of a hectare of land, which is a fixed factor of production, andfarm workers, the numbers of whom can be varied. When there are relativelyfew workers, each additional worker will add a proportionately higher quantityto output as opportunities for division of labour are exploited. However, beyonda certain point it becomes more and more difficult to wrest additional outputfrom the land, no matter how many additional workers are used. Eventually,the additional output from the additional worker will be zero. At this point themarginal product of labour is zero.
By and large companies operate in the range at which additional resourcesyield diminishing increases to output. This has important implications for deter-mining the scale of company operations. For example, when deciding how manyworkers to employ, a company will keep on hiring additional workers up tothe point at which the value of the additional product is just equal to the wagerate. While the additional revenue may be difficult to quantify in practice, thehiring of additional workers must be based on the implicit belief of managersthat the value of the additional output will be at least as great as the additional
6/8 Edinburgh Business School Strategic Planning
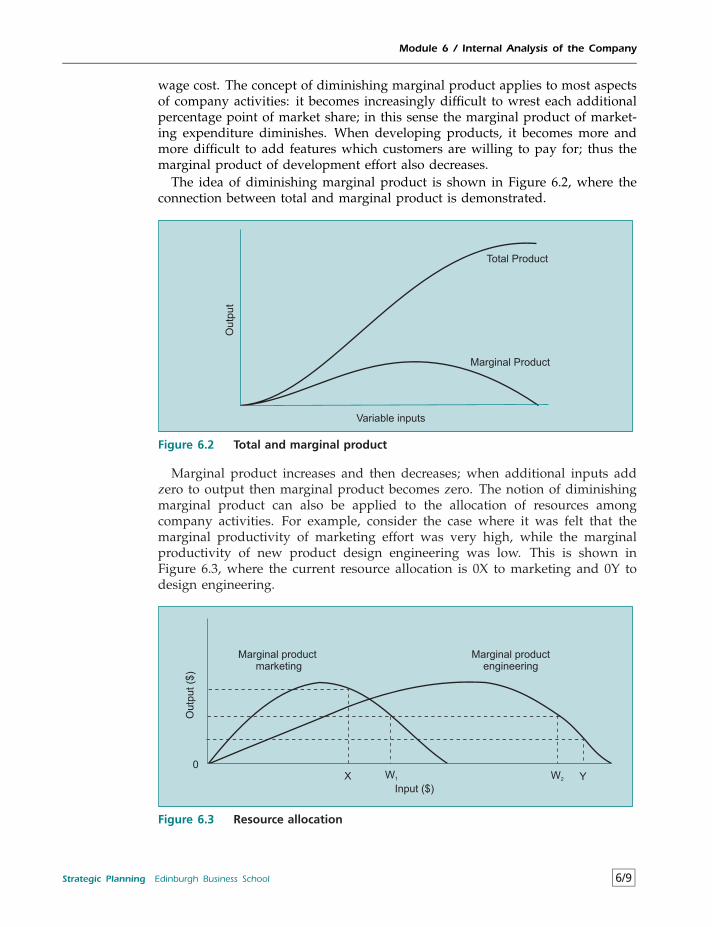
Module 6 / Internal Analysis of the Company
wage cost. The concept of diminishing marginal product applies to most aspectsof company activities: it becomes increasingly difficult to wrest each additionalpercentage point of market share; in this sense the marginal product of market-ing expenditure diminishes. When developing products, it becomes more andmore difficult to add features which customers are willing to pay for; thus themarginal product of development effort also decreases.
The idea of diminishing marginal product is shown in Figure 6.2, where theconnection between total and marginal product is demonstrated.
Total Product
Marginal Product
Variable inputs
Ou
tpu
t
Figure 6.2 Total and marginal product
Marginal product increases and then decreases; when additional inputs addzero to output then marginal product becomes zero. The notion of diminishingmarginal product can also be applied to the allocation of resources amongcompany activities. For example, consider the case where it was felt that themarginal productivity of marketing effort was very high, while the marginalproductivity of new product design engineering was low. This is shown inFigure 6.3, where the current resource allocation is 0X to marketing and 0Y todesign engineering.
Outp
ut($
)
0X W1 W2 Y
Marginal productengineering
Marginal productmarketing
Input ($)
Figure 6.3 Resource allocation
Strategic Planning Edinburgh Business School 6/9
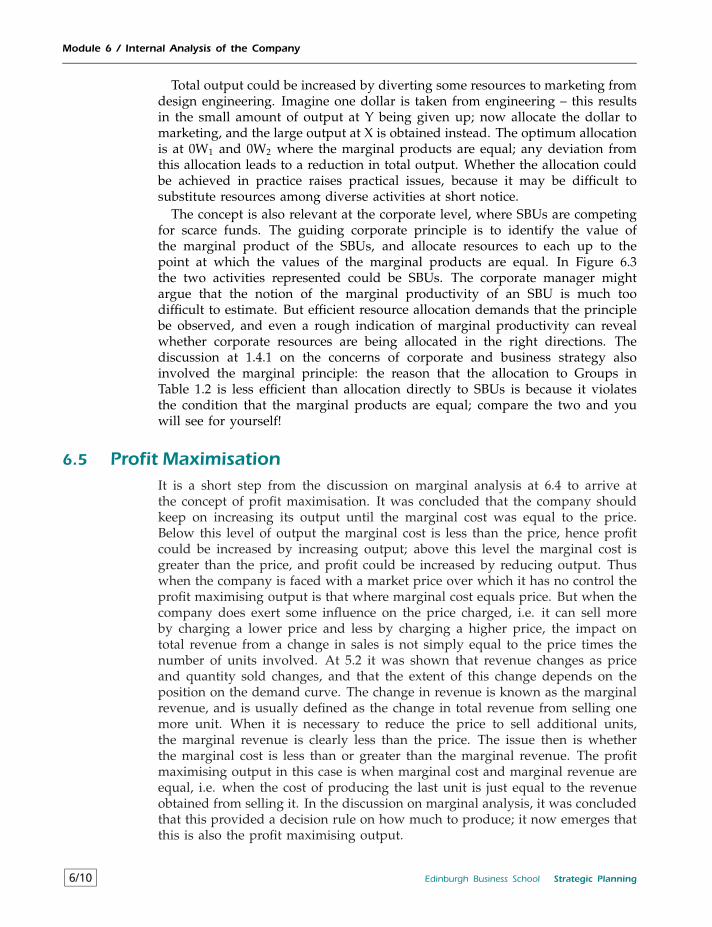
Module 6 / Internal Analysis of the Company
Total output could be increased by diverting some resources to marketing fromdesign engineering. Imagine one dollar is taken from engineering – this resultsin the small amount of output at Y being given up; now allocate the dollar tomarketing, and the large output at X is obtained instead. The optimum allocationis at 0W1 and 0W2 where the marginal products are equal; any deviation fromthis allocation leads to a reduction in total output. Whether the allocation couldbe achieved in practice raises practical issues, because it may be difficult tosubstitute resources among diverse activities at short notice.
The concept is also relevant at the corporate level, where SBUs are competingfor scarce funds. The guiding corporate principle is to identify the value ofthe marginal product of the SBUs, and allocate resources to each up to thepoint at which the values of the marginal products are equal. In Figure 6.3the two activities represented could be SBUs. The corporate manager mightargue that the notion of the marginal productivity of an SBU is much toodifficult to estimate. But efficient resource allocation demands that the principlebe observed, and even a rough indication of marginal productivity can revealwhether corporate resources are being allocated in the right directions. Thediscussion at 1.4.1 on the concerns of corporate and business strategy alsoinvolved the marginal principle: the reason that the allocation to Groups inTable 1.2 is less efficient than allocation directly to SBUs is because it violatesthe condition that the marginal products are equal; compare the two and youwill see for yourself!
6.5 Profit MaximisationIt is a short step from the discussion on marginal analysis at 6.4 to arrive atthe concept of profit maximisation. It was concluded that the company shouldkeep on increasing its output until the marginal cost was equal to the price.Below this level of output the marginal cost is less than the price, hence profitcould be increased by increasing output; above this level the marginal cost isgreater than the price, and profit could be increased by reducing output. Thuswhen the company is faced with a market price over which it has no control theprofit maximising output is that where marginal cost equals price. But when thecompany does exert some influence on the price charged, i.e. it can sell moreby charging a lower price and less by charging a higher price, the impact ontotal revenue from a change in sales is not simply equal to the price times thenumber of units involved. At 5.2 it was shown that revenue changes as priceand quantity sold changes, and that the extent of this change depends on theposition on the demand curve. The change in revenue is known as the marginalrevenue, and is usually defined as the change in total revenue from selling onemore unit. When it is necessary to reduce the price to sell additional units,the marginal revenue is clearly less than the price. The issue then is whetherthe marginal cost is less than or greater than the marginal revenue. The profitmaximising output in this case is when marginal cost and marginal revenue areequal, i.e. when the cost of producing the last unit is just equal to the revenueobtained from selling it. In the discussion on marginal analysis, it was concludedthat this provided a decision rule on how much to produce; it now emerges thatthis is also the profit maximising output.
6/10 Edinburgh Business School Strategic Planning
Module 6 / Internal Analysis of the Company
In real life, where many changes are not marginal, where costs and revenuesare not known with any certainty, where problems of market share, relativecosts, competitor reaction, and so on tend to dominate decision making, theidea of profit maximisation might at first appear to be of limited usefulness. Butit can be illuminating to use the profit maximisation framework when evalu-ating competing courses of action. The two questions ‘What are the additionalexpected costs?’ and ‘What are the additional expected revenues?’ are reallyabout profit maximisation. Any course of action where only a weak case existsfor asserting that the additional revenues are greater than the additional costsmust be viewed with some reserve.
A proper understanding of what is meant by profit maximisation is useful tomanagers for another reason. Many managers feel defensive about the represen-tation of company goals as primarily directed towards profit maximisation. Theexpression has come to have overtones of the ‘unacceptable face of capitalism’,and gives the impression that the company’s objective is to extort as much aspossible from the consumer while delivering the least possible in return. In fact,the notion of profit maximisation is concerned with efficient resource alloca-tion given the tastes and preferences of consumers; the great economist AdamSmith pointed out that everyone can be made better off through the pursuitof profit maximisation, since this leads to the most efficient use of resources inan economy. There is nothing morally reprehensible about the pursuit of profitmaximisation within the set of legal rules decided by a democratic government.
6.6 Economies of Scale and the Experience CurveThe concept of economies of scale was introduced at 5.10.3 because of itsimportance as an entry barrier; it starts from the notion of comparative statics,i.e. what the cost of production would be at different scales of operation. Itis concerned with the average cost of production in relation to the productivecapacity of a company. For example, if the productive capacity of a companywere doubled, economies of scale would exist if the average cost fell. Theempirical evidence on economies of scale is mixed: in some industries it issignificant, and in others it hardly exists. The difficulty in attempting to measurethe impact of scale economies in real life is that it is not merely the increasein productive capacity which is relevant, but whether the higher productivecapacity is based on a more efficient combination of labour and capital. It maybe that some larger companies have not selected the optimum combination ofinputs, and hence do not benefit from potential scale economies; this does notmean to say that they do not exist and that they might not be exploited bysome companies in an industry. It may be that the difficulties of managerialcoordination beyond some company size make it impossible to benefit frompotential scale economies. In 1995 two very large Japanese banks, MitsubishiBank and Bank of Tokyo, merged to create by far the largest bank in the worldwith assets of well over $500 billion; this is close to the value of Britain’s annualgross national product. But none of the reports on the merger discussed itsrationale in terms of potential economies of scale; in fact, the Bank of Tokyoannounced that there would be no job losses as a result of the merger. While therationale for the merger may well be justified in terms of factors such as global
Strategic Planning Edinburgh Business School 6/11
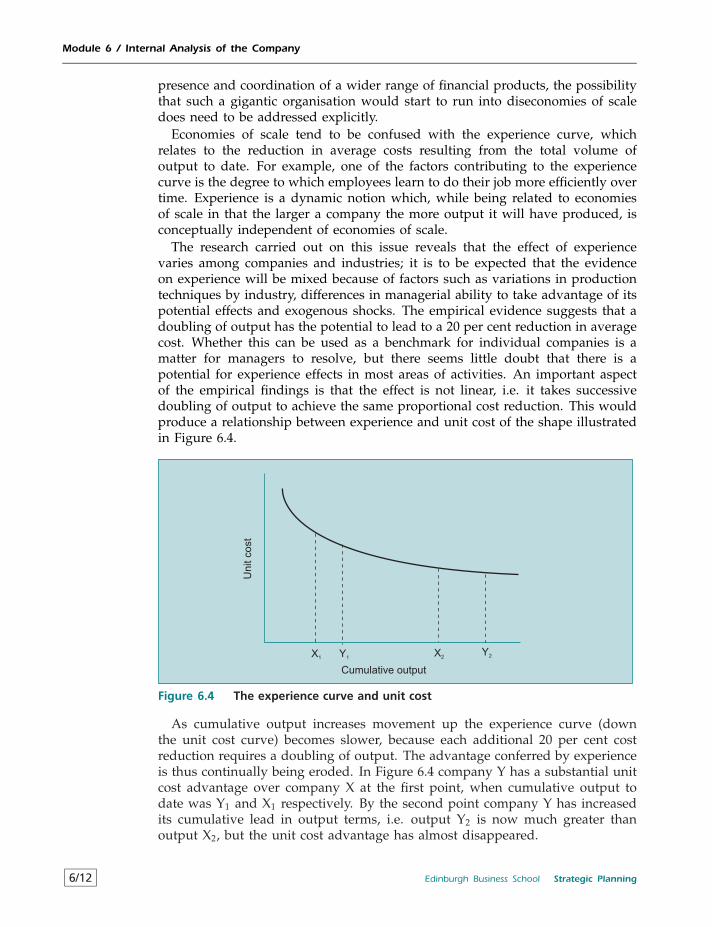
Module 6 / Internal Analysis of the Company
presence and coordination of a wider range of financial products, the possibilitythat such a gigantic organisation would start to run into diseconomies of scaledoes need to be addressed explicitly.
Economies of scale tend to be confused with the experience curve, whichrelates to the reduction in average costs resulting from the total volume ofoutput to date. For example, one of the factors contributing to the experiencecurve is the degree to which employees learn to do their job more efficiently overtime. Experience is a dynamic notion which, while being related to economiesof scale in that the larger a company the more output it will have produced, isconceptually independent of economies of scale.
The research carried out on this issue reveals that the effect of experiencevaries among companies and industries; it is to be expected that the evidenceon experience will be mixed because of factors such as variations in productiontechniques by industry, differences in managerial ability to take advantage of itspotential effects and exogenous shocks. The empirical evidence suggests that adoubling of output has the potential to lead to a 20 per cent reduction in averagecost. Whether this can be used as a benchmark for individual companies is amatter for managers to resolve, but there seems little doubt that there is apotential for experience effects in most areas of activities. An important aspectof the empirical findings is that the effect is not linear, i.e. it takes successivedoubling of output to achieve the same proportional cost reduction. This wouldproduce a relationship between experience and unit cost of the shape illustratedin Figure 6.4.
X1X2
Y2
Un
itco
st
Cumulative output
Y1
Figure 6.4 The experience curve and unit cost
As cumulative output increases movement up the experience curve (downthe unit cost curve) becomes slower, because each additional 20 per cent costreduction requires a doubling of output. The advantage conferred by experienceis thus continually being eroded. In Figure 6.4 company Y has a substantial unitcost advantage over company X at the first point, when cumulative output todate was Y1 and X1 respectively. By the second point company Y has increasedits cumulative lead in output terms, i.e. output Y2 is now much greater thanoutput X2, but the unit cost advantage has almost disappeared.
6/12 Edinburgh Business School Strategic Planning
Module 6 / Internal Analysis of the Company
The difference between economies of scale and experience effects has stra-tegic implications. If there are significant experience effects to be exploited, thecompany has a limited time to take advantage of them because of the reducingpercentage effect as cumulative output is increased. If there are also significanteconomies of scale in the industry, the company which is first in and is biggerthan competitors has the potential for an early cost advantage. A companywhich feels it has a cost advantage over rivals should attempt to identify wherethe advantage is derived. If it is from experience effects, the advantage can beexpected to decline over time; if it is from economies of scale the advantage willbe retained so long as competing companies do not increase in size.
The combination of economies of scale and experience effects confers a sig-nificant first mover advantage in new markets. The company which is first in ispotentially able to grab the largest market share and thus benefit from whatevereconomies of scale exist; followers start at a higher point on the experience curveand are thus faced with a two pronged cost disadvantage.
6.7 Economies of Scope
Economies of scope are similar to economies of scale, but the idea refers to areduction in unit cost as the number of products is increased rather than thenumber of units produced. The idea bears a resemblance to synergy, which isdiscussed in 6.21. There are a number of reasons why it may be cheaper for onefirm to produce two goods than for two firms to do so.
• The possibility of sharing inputs among several outputs: for example, thecellophane tape manufacturer 3M had capabilities in adhesives which couldbe used in making adhesive message notes; retailers sell many items –Sainsbury’s sells about 30 000 items – because below some critical numbercustomers do not find it worthwhile to come in.
• The good reputation associated with some products may have a beneficialeffect on others: for example, the quality image of Rolls Royce cars carriesover to its aero engines.
• There may be significant R&D spill-over effects among different products;for example, advanced heat resistant materials developed for turbines haveapplications in kitchen utensils.
• Enhanced ability to compete in a range of related industries with a coor-dinated strategy: this comes back to the potential benefits from a relatedportfolio of businesses; given the problems of diversification such potentialbenefits may be no more than wishful thinking.
Economies of scope are clearly by no means an automatic outcome of diver-sification. If products are in unrelated markets, using different resources andrequiring different management skills it is just as likely that diseconomies ofscope will result as scarce management skills are spread ever more thinly.
Strategic Planning Edinburgh Business School 6/13
Module 6 / Internal Analysis of the Company
6.8 Production Costs
The modern literature on costing reveals that there is disagreement betweenacademic and practising accountants on how to determine the costs of productionfor decision making purposes. An indication of the scope of this debate can beobtained from the titles of major articles written by accounting theorists
• How cost accounting systematically distorts product costs;1
• Yesterday’s accounting undermines production;2
• One cost system isn’t enough.3
The investigations carried out by researchers into accounting practice revealthat many companies have accounting systems which do not generate informa-tion on costs which are relevant to decision making. This is partly because manyaccountants studied for their qualification before accounting education started totake account of management accounting issues, and partly because companiesdo not realise that their accounting system has not been adapted in line withchanges in the company and its competitive environment. Many accountingsystems are simply incapable of providing an answer to the question of howmuch it costs to produce a particular product, and how costs vary as the levelof output changes.
Dissatisfaction with accounting techniques is not confined to the account-ing profession. There has always been disagreement between economists andaccountants in this area; while not all accountants hold the same views on costs,the debate can be characterised as follows. Economists accuse accountants ofignoring economic ideas when reporting costs, while accountants respond thateconomists do not understand the difficulties involved in producing informationin day to day business. The debate has centred on the concept of marginalversus average costs, and on expected future costs versus historical costs. Onthe marginal versus average costs issue, economists maintain that accountantsshould identify the marginal cost of production (as discussed at 6.3) so thatthe cost of expansion or contraction can be sensibly compared with changes inrevenues; accountants typically argue that average costs, which include arbitrarycost allocations, are appropriate because all costs have to be taken into account.On the future versus historical cost issue, economists argue that sunk costsshould be excluded from decision making information, and that the only usefor historical costs is to provide guidance on what costs are likely to be in thefuture; accountants argue that unless all historical costs are taken into account abiased view of costs is obtained.
The problem facing the manager is that accounting systems are complex, andit may be difficult for the non specialist accountant to determine whether theyare doing the proper job. The application of economic concepts can go someway towards cutting through the technical complexity of accounting systems.The general principle to apply is that if the company accounting system doesnot provide information which is consistent with economic concepts there is agood chance that mistaken decisions will be made.
Some of the factors affecting unit cost are illustrated in Figure 6.5.
6/14 Edinburgh Business School Strategic Planning
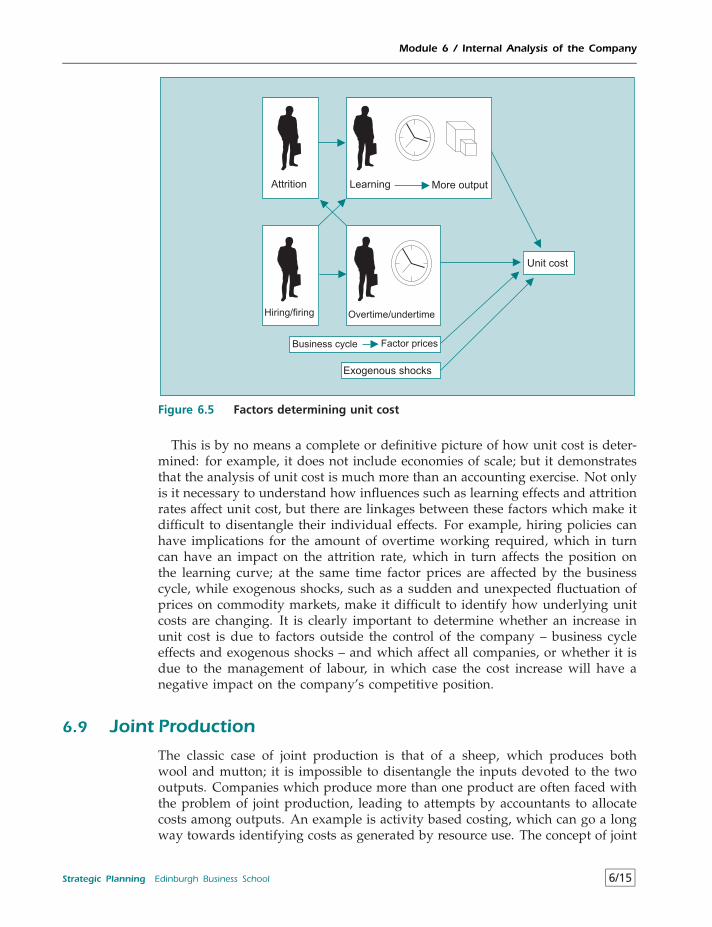
Module 6 / Internal Analysis of the Company
Figure 6.5 Factors determining unit cost
This is by no means a complete or definitive picture of how unit cost is deter-mined: for example, it does not include economies of scale; but it demonstratesthat the analysis of unit cost is much more than an accounting exercise. Not onlyis it necessary to understand how influences such as learning effects and attritionrates affect unit cost, but there are linkages between these factors which make itdifficult to disentangle their individual effects. For example, hiring policies canhave implications for the amount of overtime working required, which in turncan have an impact on the attrition rate, which in turn affects the position onthe learning curve; at the same time factor prices are affected by the businesscycle, while exogenous shocks, such as a sudden and unexpected fluctuation ofprices on commodity markets, make it difficult to identify how underlying unitcosts are changing. It is clearly important to determine whether an increase inunit cost is due to factors outside the control of the company – business cycleeffects and exogenous shocks – and which affect all companies, or whether it isdue to the management of labour, in which case the cost increase will have anegative impact on the company’s competitive position.
6.9 Joint Production
The classic case of joint production is that of a sheep, which produces bothwool and mutton; it is impossible to disentangle the inputs devoted to the twooutputs. Companies which produce more than one product are often faced withthe problem of joint production, leading to attempts by accountants to allocatecosts among outputs. An example is activity based costing, which can go a longway towards identifying costs as generated by resource use. The concept of joint
Strategic Planning Edinburgh Business School 6/15
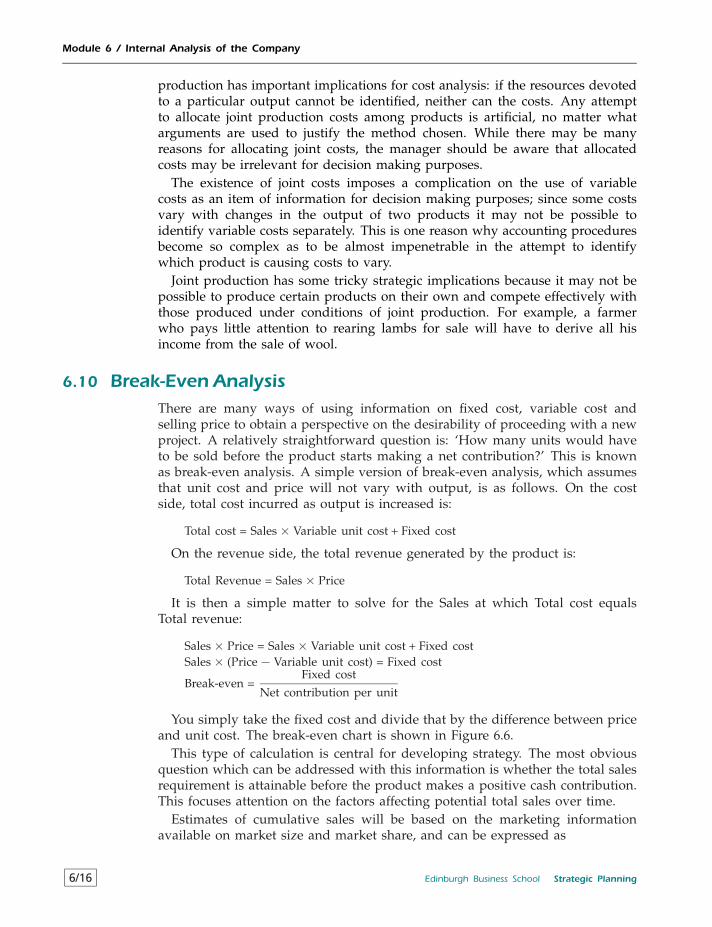
Module 6 / Internal Analysis of the Company
production has important implications for cost analysis: if the resources devotedto a particular output cannot be identified, neither can the costs. Any attemptto allocate joint production costs among products is artificial, no matter whatarguments are used to justify the method chosen. While there may be manyreasons for allocating joint costs, the manager should be aware that allocatedcosts may be irrelevant for decision making purposes.
The existence of joint costs imposes a complication on the use of variablecosts as an item of information for decision making purposes; since some costsvary with changes in the output of two products it may not be possible toidentify variable costs separately. This is one reason why accounting proceduresbecome so complex as to be almost impenetrable in the attempt to identifywhich product is causing costs to vary.
Joint production has some tricky strategic implications because it may not bepossible to produce certain products on their own and compete effectively withthose produced under conditions of joint production. For example, a farmerwho pays little attention to rearing lambs for sale will have to derive all hisincome from the sale of wool.
6.10 Break-Even AnalysisThere are many ways of using information on fixed cost, variable cost andselling price to obtain a perspective on the desirability of proceeding with a newproject. A relatively straightforward question is: ‘How many units would haveto be sold before the product starts making a net contribution?’ This is knownas break-even analysis. A simple version of break-even analysis, which assumesthat unit cost and price will not vary with output, is as follows. On the costside, total cost incurred as output is increased is:
Total cost = Sales× Variable unit cost + Fixed cost
On the revenue side, the total revenue generated by the product is:
Total Revenue = Sales× Price
It is then a simple matter to solve for the Sales at which Total cost equalsTotal revenue:
Sales× Price = Sales× Variable unit cost + Fixed costSales× (Price− Variable unit cost) = Fixed cost
Break-even =Fixed cost
Net contribution per unit
You simply take the fixed cost and divide that by the difference between priceand unit cost. The break-even chart is shown in Figure 6.6.
This type of calculation is central for developing strategy. The most obviousquestion which can be addressed with this information is whether the total salesrequirement is attainable before the product makes a positive cash contribution.This focuses attention on the factors affecting potential total sales over time.
Estimates of cumulative sales will be based on the marketing informationavailable on market size and market share, and can be expressed as
6/16 Edinburgh Business School Strategic Planning
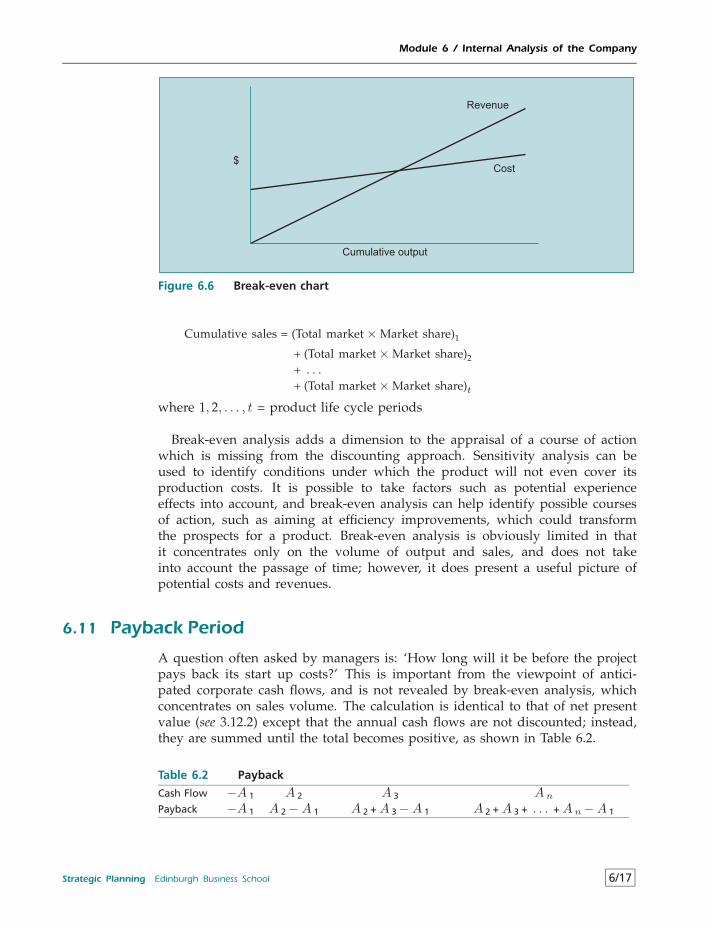
Module 6 / Internal Analysis of the Company
Revenue
Cost$
Cumulative output
Figure 6.6 Break-even chart
Cumulative sales = (Total market×Market share)1
+ (Total market×Market share)2+ . . .+ (Total market×Market share)t
where 1, 2, . . . , t = product life cycle periods
Break-even analysis adds a dimension to the appraisal of a course of actionwhich is missing from the discounting approach. Sensitivity analysis can beused to identify conditions under which the product will not even cover itsproduction costs. It is possible to take factors such as potential experienceeffects into account, and break-even analysis can help identify possible coursesof action, such as aiming at efficiency improvements, which could transformthe prospects for a product. Break-even analysis is obviously limited in thatit concentrates only on the volume of output and sales, and does not takeinto account the passage of time; however, it does present a useful picture ofpotential costs and revenues.
6.11 Payback Period
A question often asked by managers is: ‘How long will it be before the projectpays back its start up costs?’ This is important from the viewpoint of antici-pated corporate cash flows, and is not revealed by break-even analysis, whichconcentrates on sales volume. The calculation is identical to that of net presentvalue (see 3.12.2) except that the annual cash flows are not discounted; instead,they are summed until the total becomes positive, as shown in Table 6.2.
Table 6.2 Payback
Cash Flow −A 1 A 2 A 3 A n
Payback −A 1 A 2−A 1 A 2 + A 3−A 1 A 2 + A 3 + . . . + A n−A 1
Strategic Planning Edinburgh Business School 6/17
Module 6 / Internal Analysis of the Company
The payback period is the length of time until the running total becomespositive.
There is some dispute as to whether the payback period adds to the informa-tion produced by a properly executed net present value analysis. The discountingapproach takes into account both the incidence of cash flows over time and riskfactors; in theoretical terms the argument that the company needs to predictits net cash position is irrelevant, because a bank which used the same NPVcriterion as the company would be willing to lend money against the securityof the expected future income stream. This suggests that there is no such thingas ‘running out of cash’ for an investment which has a positive NPV.
However, from the corporate viewpoint there are situations in which the pay-back criterion may have implications for the selection of the product portfolio.For example, the prospect of increasing the ratio of debts to assets may beunacceptable, even for a short period. Whether the notions of break-even andpayback appeal to the financial purist is irrelevant; what is important is to gen-erate information on different aspects of investments so that corporate decisionmakers can arrive at a well balanced view of the implications of different coursesof action.
6.12 Accounting Ratios
The company has at its disposal a great deal of information which it can use inidentifying the effectiveness with which resources are being, or have been, allo-cated. It is at this point that an apparent disagreement between the practitionersof finance and those of accounting needs to be clarified. Various problems inusing ROI as an investment appraisal criterion have been discussed; the balanceis heavily in favour of using the formal tools of financial appraisal in deter-mining how resources should be deployed in the future. But formal financialtechniques do not reveal how well resources are actually being deployed; thequestions which confront the company include: Are we moving up the learningcurve? Are we producing the level of sales value per person employed which weoriginally thought possible? Are we making effective use of our capital? Are wekeeping inventories under control? The list of questions relating to effectivenessis endless, but they can be tackled by using historical accounting informationrelating to costs and revenues. Therefore the theory of finance provides the toolsfor allocating resources in the future; accounting procedures reveal the efficiencywith which resources have been allocated to date.
Accountants usually try to identify a set of useful ratios which relate inputsand outputs in a meaningful fashion, and track these over time. It goes withoutsaying that individual ratios have limitations, but it is not suggested that ratiosshould be used blindly. Rather, they provide information on different dimensionsof company performance.
The objective of calculating accounting ratios is to assess the effectivenesswith which resources have been allocated in the past. The ratios are a usefultool for analysing accounts; they help to reduce the amount of information inthe accounts which require analysis, and can identify potential weaknesses incompany management. Since the objective of ratios is to simplify the complexity
6/18 Edinburgh Business School Strategic Planning
Module 6 / Internal Analysis of the Company
of accounting information, it would be pointless to use a vast number of ratios.However, there is no definitive set of ratios which will provide the correctinformation for managers; not only are there many ratios to choose among,individual ratios can be defined in different ways. It is therefore necessary toselect a number of potentially useful ratios which can be employed over a periodof time to ensure the consistency of the information from which the ratios arederived. The following ratios are typically encountered in company accounts:
• ROI Return on Investment• RONA Return on Net Assets• ROCE Return on Capital Employed• ROTA Return on Total Assets• Value Added• Earnings per Share• Gearing ratio
To ensure that these ratios produce performance measures which relate to theefficiency with which resources are allocated, appropriate measures of revenues,costs and assets must be used. While it may appear obvious, it needs to bestressed that revenues and costs must not include changes in the portfolio ofassets; the buying and selling of assets is not directly related to the efficiency withwhich inputs are being converted to outputs. However, inspection of publishedcompany accounts reveals that the sale or acquisition of assets is often slippedinto the accounts, perhaps to disguise a particularly good or bad year.
The importance of understanding what accounts are telling you cannot beoverestimated. In his book the stockbroker Smith4 asked a simple question: howcan it be that companies which appear to be financially sound can suddenlygo bankrupt? He cited the example of Polly Peck as one of the most blatantexamples of financial deception, but he pointed out that the signs of financialmalaise were detectable if you knew what to look for in the published accounts.He then went on to ask what the average investor should know, and he iden-tified 11 practices which could be misleading, although they were not illegal.Smith constructed a table, which became notorious for its ‘blobs’, which simplylisted major companies and how many of these dubious practices they pursued.Although the information was in the public domain, his analysis touched a sen-sitive nerve with the companies concerned and with his employers. The upshotwas that Smith was fired and the reputations of the companies with a lot of‘blobs’ were badly affected.
Since assets appear in the bottom line of most of the measures, it is importantthat they are calculated in a manner which is consistent with the opportunitycost of the resources tied up in the company. In practice, it is extremely difficultto assign a value to assets. In the first instance, many assets were purchased inthe past and have depreciated through use and obsolescence. The book valueattributed to them by accounting procedures may bear little relation to what theasset would realise on the market, nor to the replacement cost of the asset. Twocompanies may have identical performance in terms of RONA, but because ofdifferent accounting methods one may appear to be performing more profitably.
Strategic Planning Edinburgh Business School 6/19
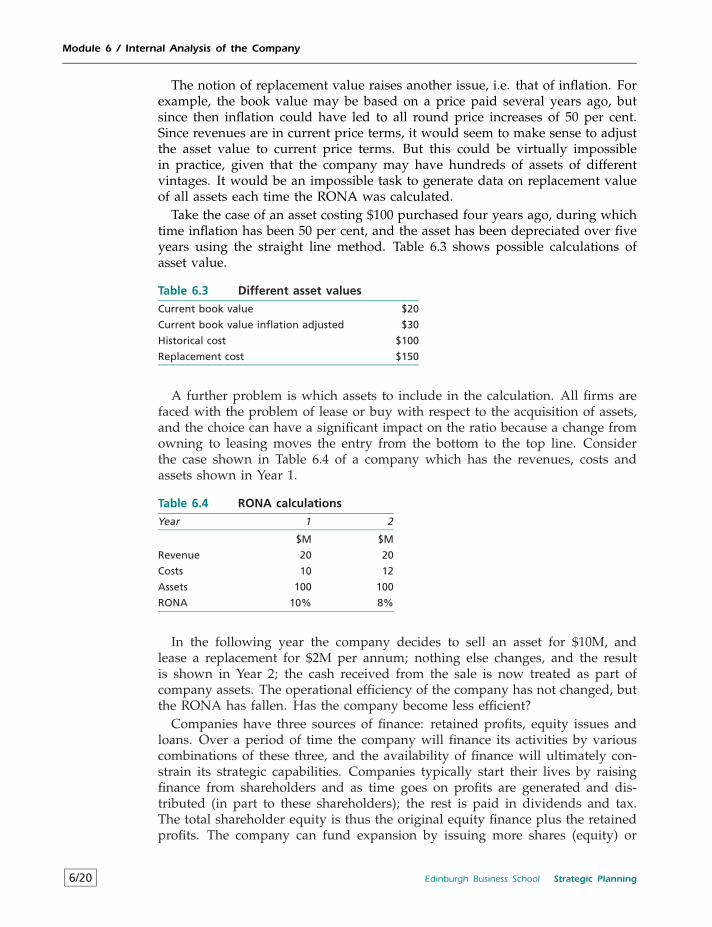
Module 6 / Internal Analysis of the Company
The notion of replacement value raises another issue, i.e. that of inflation. Forexample, the book value may be based on a price paid several years ago, butsince then inflation could have led to all round price increases of 50 per cent.Since revenues are in current price terms, it would seem to make sense to adjustthe asset value to current price terms. But this could be virtually impossiblein practice, given that the company may have hundreds of assets of differentvintages. It would be an impossible task to generate data on replacement valueof all assets each time the RONA was calculated.
Take the case of an asset costing $100 purchased four years ago, during whichtime inflation has been 50 per cent, and the asset has been depreciated over fiveyears using the straight line method. Table 6.3 shows possible calculations ofasset value.
Table 6.3 Different asset values
Current book value $20
Current book value inflation adjusted $30
Historical cost $100
Replacement cost $150
A further problem is which assets to include in the calculation. All firms arefaced with the problem of lease or buy with respect to the acquisition of assets,and the choice can have a significant impact on the ratio because a change fromowning to leasing moves the entry from the bottom to the top line. Considerthe case shown in Table 6.4 of a company which has the revenues, costs andassets shown in Year 1.
Table 6.4 RONA calculations
Year 1 2
$M $M
Revenue 20 20
Costs 10 12
Assets 100 100
RONA 10% 8%
In the following year the company decides to sell an asset for $10M, andlease a replacement for $2M per annum; nothing else changes, and the resultis shown in Year 2; the cash received from the sale is now treated as part ofcompany assets. The operational efficiency of the company has not changed, butthe RONA has fallen. Has the company become less efficient?
Companies have three sources of finance: retained profits, equity issues andloans. Over a period of time the company will finance its activities by variouscombinations of these three, and the availability of finance will ultimately con-strain its strategic capabilities. Companies typically start their lives by raisingfinance from shareholders and as time goes on profits are generated and dis-tributed (in part to these shareholders); the rest is paid in dividends and tax.The total shareholder equity is thus the original equity finance plus the retainedprofits. The company can fund expansion by issuing more shares (equity) or
6/20 Edinburgh Business School Strategic Planning
Module 6 / Internal Analysis of the Company
by incurring debt; this type of debt is typically in the form of long term loansfor specific investment projects rather than the short term loans necessary forcovering variations in short term cash flow.
The main difference between debt finance and equity finance is that the intereston debt takes priority over payments of dividends to shareholders, and must bepaid no matter how profits fluctuate; the more debt there is in relation to equitythen the more dividends will fluctuate with profitability. If the interest cannotbe paid then the company goes bankrupt. This means that the shareholdersbear the risk of fluctuations in profit and therefore look for a higher returnon their funds than the providers of loan finance. As a result it is cheaper tofinance investments by debt, but each time this is undertaken the risk to existingshareholders increases.
A measure of the risk associated with debt financing is the gearing ratio,defined as
Debt finance
Shareholder equity
which is usually expressed as a percentage.It is a simple matter to calculate a company’s gearing ratio, but the real
question is: what is the optimal gearing ratio for a particular company? Thereare a number of factors which have to be taken into account.
• A company which has a sound track record will be regarded as a good loanprospect by banks and should have little difficulty raising debt for growth.A company which has not taken advantage of this, and has constrainedits growth to finance by retained earnings, may not be taking advantageof opportunities. This could be an indication of a cautious and risk aversemanagement, or perhaps of a management with little strategic vision.
• The higher the gearing ratio, say around 100%, the more reliant it is onsteady and non fluctuating profits over time. This is likely to make banksnervous and beyond some point it will be difficult or impossible to raiseadditional finance no matter how attractive the investment might appear tobe. The company needs to balance off dividend payments against the lossof flexibility which may result from a high gearing ratio.
There is therefore no optimal gearing ratio which applies to all companies, oreven to a given company over a period. A company which has embarked on astrategic initiative may have a high gearing ratio, while a company which hasestablished itself as a market leader and has little room for expansion in existingmarkets may have a low gearing ratio. But on a profitability basis they may beconsidered equally successful.
6.13 Benchmarking
A company’s competitive position can only really be assessed in relation toother companies in the industry. One way of achieving a perspective on this isto develop quantifiable measures of performance which can be compared with
Strategic Planning Edinburgh Business School 6/21
Module 6 / Internal Analysis of the Company
other firms. The performance of major competitors can be ascertained from theinformation in their annual reports, which contain the main indicators such asreturn on investment, return on capital, growth in sales, margins and so on.But given what has been discussed already, obviously these cannot be taken attheir face value, and it is necessary to ensure that like is compared with like.This means that it is necessary to interpret published information, and hencecomparisons are bound to be approximate.
While it is important to develop a picture of the company’s relative financialstrength in relation to competitors, the objective of doing so is to provide infor-mation for strategic purposes rather than to attempt to emulate the performanceof other companies. This is because there is no guarantee that competitorsare pursuing best practice. The type of question which needs to be addressedincludes
Why are competitors’ return on capital greater or less than ours, and whatdoes this tell us about our own use of resources?
How does competitors’ financial strength (in terms of gearing, cash reservesetc.) compare with ours, and what flexibility does this give them?
There are many dimensions of company performance, and benchmarkingmeasures can be applied to just about everything: delivery times, stockholdingratios, manpower turnover, etc. Benchmarking is clearly an important diagnostictool because it can indicate where resources might be deployed more efficiently.
But there are at least two reasons why benchmarking must be treated withcaution if it is to be used as a guide to achieving competitive advantage.
1 It is virtually impossible to compare like with like. It is not always apparentthat there are differences which can render comparison meaningless or mis-leading. Some questions which need to be posed include: are the portfoliosof the companies sufficiently similar? Are there synergies which cannot beeasily identified? Are products at similar stages in the life cycle? Are com-petitive conditions similar? These questions are particularly important wheninternational comparisons are being made because competitive conditionsfor otherwise similar products can be greatly different. An example of thisis the market for telephone services in the US and the UK, which is dealtwith in Module 5 Case 6.
2 Measurable dimensions of company performance are unlikely to revealhow competitive advantage is achieved, otherwise the characteristics wouldalready have been imitated. It is how performance is achieved, rather thanthe fact that it is being achieved, which is needs to be identified, but thisis very difficult to achieve. The UK retailer Marks and Spencer served as abenchmark for other retailers for many years; but when it lost its competitiveadvantage it was actually quite difficult to pinpoint exactly what had gonewrong.
6/22 Edinburgh Business School Strategic Planning
Module 6 / Internal Analysis of the Company
6.14 Sensitivity AnalysisWhen making predictions about the future it is not possible to be precise, butit is possible to have some idea of the range of values likely to be associatedwith important variables. At the very least, the best possible and worst possiblescenario for each important variable can be projected. Sensitivity analysis isrelated to the investigation of scenarios, but is conducted at a more detailedlevel.
One approach is to use the investment appraisal framework as shown in Table6.5.
Table 6.5 Base contribution calculation
Revenue = Total market × Market share × Price
minus
Outlay = Number of workers × Wage rate +Units of capital × Price +
Units of material × Price
equals contribution in each period
It may be felt by forecasters that the values used in the appraisal are unlikelyto be significantly wrong; however, some managers may express reservations,for example, about the prospects for the labour market due to predictions thatthe economy is likely to be entering a new period of sustained growth. Thiscould result in wage rates being 20 per cent higher than would otherwise bethe case. The framework can be adjusted to take this possibility into account asshown in Table 6.6.
Table 6.6 Adjusted contribution calculation
Revenue = Total market × Market share × Price
minus
Outlay = Number of workers × Wage rate × 1.2 +Units of capital × Price +
Units of material × Price
equals contribution in each period
It may be that because wage costs are a relatively small proportion of totalcost, a 20 per cent higher wage rate would have little impact on the profitabilityof the investment. On the other hand, it may turn out that the attractiveness ofthe investment is highly responsive to the wage rate. This could cause managersto take a rather different view of the desirability of undertaking this investmentrather than alternatives.
Sensitivity analysis can be carried out in relation to different dimensions ofperformance. For example, the impact of the potentially higher wage rate onNPV, break-even, payback and cash flow can be investigated. Sensitivity analysisis therefore a powerful technique for generating a perspective on the potentialreturns from a course of action. It identifies which are the crucial variables,and where unexpected threats may exist. It can pin-point issues about which
Strategic Planning Edinburgh Business School 6/23
Module 6 / Internal Analysis of the Company
attempts to obtain more information should be undertaken before a decisionis taken. A somewhat less obvious aspect of sensitivity analysis is to identifythe combination of circumstances which are necessary to ensure success. Inthe example above, sensitivity analysis might have revealed that a 10 per centhigher price for either labour or capital would lead to failure, as would a marketshare of 14 per cent or less. Managers must then seriously address the issue ofwhether it is likely that the following will actually occur:
Market share greater than 14 per cent; and
Wage rate no more than 10 per cent greater; and
Capital price no more than 10 per cent greater.
Put in this way, this might appear to be an unlikely combination of cir-cumstances. The reason that some projects fail is the lack of recognition thattheir success was actually dependent on the simultaneous occurrence of severalfavourable circumstances.
6.15 Research and Innovation
The great historian Schumpeter developed the idea of ‘creative destruction’,whereby periods of comparative quiet are punctuated by shocks when oldsources of competitive advantage are destroyed and replaced by new ones.He argued that the entrepreneurs who exploit the opportunities created by theshocks go on to achieve positive profits during the next period of calm. Thusdynamic resource allocation is more important than static efficiency, and inthe historical sense competitive conditions are not permanent; this idea offersa different perspective to the notion that competitive advantage can never bepermanent because it is continually being eroded by competitors. Thus one ofthe requirements for achieving competitive advantage is to adopt an innovativestance, recognise new ideas and changes and be ready to implement them whenthey occur.
A modern advocate of the importance of innovation is D’Aveni5 who arguesthat due to technological progress and information technology the sources ofcompetitive advantage are being eroded at an increasing rate. The answer is todisrupt existing sources of advantage in the industry and create new ones. Inthe context of ‘hypercompetition’ the best the firm can do is seek to achieve asequence of temporary advantages that keep it ahead of the rest of the industry.If this is true then an awareness of research and innovation is central to companysuccess.
All companies are faced with a dilemma when attempting to decide howmuch to spend on research. It is well established that the returns on researchexpenditure are potentially high in many industries. A large scale researchproject6 carried out in the US back tracked innovations, and found that the rateof return on research expenditure was of the order of 30 per cent. However,this rate of return related only to those inventions which reached the marketingstage, and did not take into account failures. The research demonstrated thatthe rate of return on successful research is high, but left open the issue of the
6/24 Edinburgh Business School Strategic Planning
Module 6 / Internal Analysis of the Company
return on total research expenditure by companies, given that a proportion ofresearch does not lead to marketable products.
There are in fact two stages to the problem of allocating resources to research:how much to spend, and what criteria to use in order to identify potentiallyprofitable products from the possibilities produced by research, since the com-pany may have insufficient resources to exploit all potential products. It couldbe argued that since so little is known about the likely success of new products,the most efficient approach is simply to develop products on a ‘first come’ basis,and tailor research expenditure to produce the number of new products whichthe company is capable of dealing with. To do this it would be necessary tohave some idea of the productivity of research expenditure in terms of produc-ing new ideas. It is interesting to note that although many academic economistshave spent the past thirty years attempting to identify a relationship betweenresearch expenditure and the production of inventions, the findings have beenat the aggregate level and consequently this type of research has produced noguidelines on which an individual company can base its research expendituredecisions. This is partly due to the fact that in aggregate there is a reasonablystable output of inventions by the economy, but for the individual company itis highly unlikely that marketable ideas will occur at a constant rate over time.The production of ideas, so far as the individual company is concerned, is likelyto be unpredictable and sporadic, with periods when there are no new ideasand others when there are too many to deal with.
The identification of the potential returns from research expenditure is onlypart of the story, since the company must also consider the opportunity costof research expenditure. In the extreme case, it is self-evident that there is nopoint in generating more inventions than can be developed and marketed. Butdecisions are not normally concerned with extreme cases, and it is necessary todecide whether a particular dollar should be spent on research, or competinguses such as marketing new products or investing in new equipment. Thisinvolves a trade-off among the need to spend sufficient to produce new productsin the future to ensure the long term viability of the company, and the additionalcash which could be generated by increased sales, and cost savings which mightbe made by using new equipment.
The fact that the opportunity cost comparison is based on largely unpredictablereturns in the perhaps distant future against more identifiable revenue andcost advantages arising from other courses of action means that the researchdepartment is particularly susceptible to changes in the company’s fortunes.In times of difficulty, the argument that it will not matter all that much ifresearch expenditure is reduced for a period to help solve short term cashflow problems is usually persuasive, given that if cash flow problems are notsolved the company may go out of business and there would be no need forresearch expenditure. However, in companies where the research departmenthas a highly prestigious staff with a strong power base, the department maybe insulated from such immediate considerations as cash flow. Given the manyinfluences which affect research, it is likely that most company decisions onresearch expenditure are based on considerations other than the likely rate ofreturn. The first step in taking a rational view of research expenditure is therefore
Strategic Planning Edinburgh Business School 6/25
Module 6 / Internal Analysis of the Company
to be clear about the basis on which decisions have been taken in the past: hasthe allocation of resources been determined by short term considerations, byindividual personalities, or by other factors such as the fear of what competitorsare spending? One approach is to adopt a rule of thumb, for example to keepresearch expenditure at some constant percentage of total costs, or total sales.The benefit to the manager of taking this approach is that the formula can beworked out on a basis which is agreeable to all concerned, and therefore mayserve to avoid conflict until such time as the outcome derived from the ruleis no longer acceptable, while ensuring that research expenditure will remainwithin reasonable bounds. The potential cost to the company is that the processis arbitrary and may result in a misallocation of resources.
A complicating factor is that it is not always possible accurately to identifyresearch expenditure in a company. There is a significant amount of joint produc-tion involved in research and development output. Researchers typically spendpart of their time on product development, and consequently the expendituredevoted to research into potential products (sometimes called pure research) canonly be estimated. An outcome of the joint production of research and develop-ment is that there may be a spill-over effect: the higher is research expenditure,the lower the development expenditure required to attain a given developmentobjective. Thus expenditure on research which does not generate prototypes maynot be totally wasted, in that it causes development expenditure to be lowerthan it otherwise would have been.
Bringing these various factors together, the quest for efficiency in researchexpenditure can be assisted by identifying the most important indicative factorsand assessing their relative importance.
RESEARCH EXPENDITURE: INDICATIVE FACTORS• Measurement of research expenditure• Past research budget: constant or variable• Expenditure as proportion of sales, total cost• Track record of new ideas• Spill-over effects• Power base
6.16 Development
Product development starts when the product is selected for development fromthe prototype stage, and often continues after launch and throughout the productlife. In order to maintain market share, companies continually upgrade theirproducts in line with new technologies and customer expectations. It is impor-tant to be clear about the difference between the outcome of research anddevelopment inputs. Research expenditure results in the creation of a proto-type which is potentially profitable. However, this leaves various questions tobe tackled, including how much should be spent on developing the product,when it should be launched, what price should be charged, what marketingeffort should be devoted to it, and so on. These questions cannot be answered
6/26 Edinburgh Business School Strategic Planning
Module 6 / Internal Analysis of the Company
in a vacuum, i.e. only with reference to the product itself, because there areopportunity costs associated with each course of action. For example, it maynot be worth developing a potentially viable prototype because the marketingdepartment would not be able to sell it without reducing other, more profitable,activities.
The development of a product sets the stage for a series of conflicts amonggroups whose objectives differ.
• The development engineer has an interest in producing what is regardedas a ‘good’ product by his peers; this might involve characteristics ofconstruction and operation which may be understood only by engineers.The development engineer also wants to make sure that the product willfunction in all possible circumstances, since his own reputation and careerprospects will be affected by association with a product which has a poorreputation for performance and durability. He will therefore concentrate onmaximising some aspects of ‘quality’ which were discussed at 5.5.
• The financial controller wishes to keep costs within budget limits, andexerts continual pressure on the development engineer to seek the mosteconomical solutions to technical problems.
• The marketing manager wants to get the product to customers as soon aspossible, as he sees competitors moving in and making entry to the marketprogressively difficult. He will wish to gain first mover advantage whichmay well be more important than characteristics such as product reliabilityin the short to medium term. Thus the marketing manager will not be soconcerned with marginal improvements to the product specification, andwill push for as early a launch date as possible.
• The corporate manager will be concerned with the alternative uses to whichthe resources might be put, and at the same time has to worry about themotivation of both the development engineers and marketing staff.
In many companies these different groups do not communicate directly, andindividually they feel that those in other functions have little appreciation ofthe real problems associated with turning out a profitable product. There is nosimple answer to the issue, but a contribution to reconciling these differenceswould be to ensure that the different groups communicate and attempt to makecompromises which will result in a profitable outcome.
It is possible to address the issue of whether the company is allocatingits development resources efficiently. Once a prototype has been identified aspotentially viable, the relevant question is ‘How much should be spent ondeveloping it?’ Managers often reply that since there are so many unknownsthe question has no operational relevance. However, a considerable amount ofinformation is available which can be used in structuring the decision.
The first step is to apply the microeconomic concept of marginal analysis, andconcentrate attention on marginal cost and marginal benefit.
Does the last dollar spent on development yield more or less than anadditional dollar of profit?
Strategic Planning Edinburgh Business School 6/27
Module 6 / Internal Analysis of the Company
This is much more than an exercise in prediction, because the issue is centralto decision making under uncertainty in general. It is worth pondering thefollowing:
The decision to increase development expenditure by one dollar must bebased on the implicit assumption that the marginal benefit is at least onedollar.
If the manager does not believe this to be the case the decision to spendan additional dollar is irrational. There is no sense in a manager claiming thatdevelopment expenditure is based purely on guesswork; it is illogical to spendthe money unless there is a basis for believing that on balance there is anacceptable probability of achieving an economic return on the investment. Is itpossible to go beyond ‘gut feeling’ and develop a rationale for this belief?
At this point, in real life, the accountant is likely to make the point thatnot only are the expected marginal revenues unknown, but the identification ofmarginal cost may not be possible using the existing accounting system. Thismay be due to accounting systems which should be able to generate the costsrelevant to marginal decisions but which cannot. The accountant may attempt toargue that average costs should be used, but this is due to lack of understandingof the concept of marginal analysis.
How can expected marginal benefit be estimated? One method is to regard thedevelopment stage as the period during which the launch date characteristicsare determined. These launch date characteristics include expected market share,unit cost and selling price. In fact, the dialogue which takes place amongengineers, marketers, accountants and financial analysts is largely concernedwith identifying what these launch date characteristics are likely to be dependingon how much is spent during the development stage. For example, designengineering expenditure will affect market share at launch; this is becausethe function of design engineering is to align product specifications with theperceived wants of potential customers. Production engineering expendituredetermines the production techniques and hence unit cost at launch. Thus thelaunch date, or start values, for both market share and unit cost are derivedduring the development stage. Market research can provide information on theexpected selling price at launch date, the size of the market and the product lifecycle.
However, this is only part of the story. After launch date, market share andunit cost are determined by marketing strategy and production managementrespectively. The marketing department can produce an estimate of how bothmarket share and prices will develop over the product life cycle, while theproduction department can provide estimates of unit cost, taking into accountsuch factors as learning effects over the product life. For example, the netrevenue for a given year can be estimated as follows:
Net revenuet = Market sharet × Total markett × (Pricet − Unit costt)
where t = time period
This gives a stream of expected revenues in the future which, together with thedevelopment expenditure, can be discounted to the present to give a net present
6/28 Edinburgh Business School Strategic Planning
Module 6 / Internal Analysis of the Company
value. Changes in development expenditure are associated with a change in atleast one of the variables, and the impact of the change on the expected streamof revenues can be calculated; this is the marginal revenue associated with thechange in development expenditure. Comparisons of the expected net presentvalues of different courses of action can then be made.
Apart from the need to discount future revenues the problems of risk anduncertainty must be faced. How likely is the market share to be achieved? Willcompetitive pressures increase and the competing price decline? Will economicconditions change and in turn affect both demand for the product and inputprices? The structure outlined above makes it possible to use sensitivity analysisto identify the impact of different assumptions. For example, it may be foundthat it is worth doubling development expenditure simply to achieve an addi-tional 1 per cent market share. One benefit of the approach is that it can identifysituations where additional expenditure is clearly uneconomic. The importantlesson here is to structure the issue in such a way that assumptions can be madeexplicit and the implications measured as far as possible. This is the differencebetween taking an informed decision and operating on the basis of ‘gut feeling’.
The fact that a company has a history of successful R&D management does notguarantee that it will continue to have success. To return to IBM, up to 1991 IBMwas one of the most successful managers of R&D in the world; the company hadover 30 000 patents, and two researchers had won the Nobel prize. But despitethis the new technologies developed by IBM were often beaten to the market. Forexample, IBM was one of the first companies to design a RISC microprocessor,but was the fourth to commercialise the device. On 26th November 1991 IBMannounced a ‘fundamental redefinition’ of its businesses, with the accent onshifting power from corporate headquarters to the people making and sellingproducts. One of the objectives was to make the company more flexible sothat it could take more immediate advantage of new products and markets.But to do this it is necessary to integrate innovation with the market place,and IBM suffered from the widespread problem that the marketing departmentunderstood its customers and wanted to get new products into the market assoon as possible, while the R&D department understood the technology andhad little idea of precisely what customers want from a product. Too oftenthis led to the situation where the wrong product was produced too late. Bydecentralising it was hoped that researchers would be brought closer to the realissues confronted by marketers, and good ideas would not be unnecessarilydelayed by their progress through the corporate decision making structure.
The discussion on research, innovation and development can be broughttogether into a single model which identifies the stages which must be passedin bringing an idea from the inventor’s head to successful market exploitation.This can be visualised as a process in Figure 6.7.
This whole process can be termed ‘innovation’ because each stage requiresnew thinking. When viewed as a process two distinct management problemsbecome apparent:
• each stage must be managed effectively• the link between stages must be efficient
Strategic Planning Edinburgh Business School 6/29
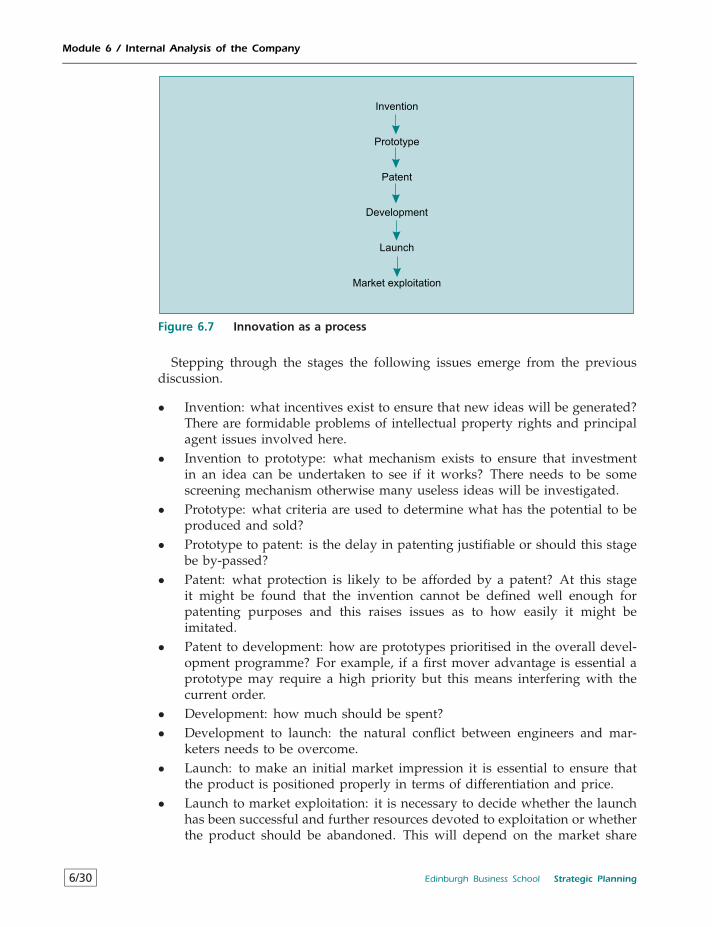
Module 6 / Internal Analysis of the Company
Invention
Prototype
Patent
Development
Launch
Market exploitation
Figure 6.7 Innovation as a process
Stepping through the stages the following issues emerge from the previousdiscussion.
• Invention: what incentives exist to ensure that new ideas will be generated?There are formidable problems of intellectual property rights and principalagent issues involved here.
• Invention to prototype: what mechanism exists to ensure that investmentin an idea can be undertaken to see if it works? There needs to be somescreening mechanism otherwise many useless ideas will be investigated.
• Prototype: what criteria are used to determine what has the potential to beproduced and sold?
• Prototype to patent: is the delay in patenting justifiable or should this stagebe by-passed?
• Patent: what protection is likely to be afforded by a patent? At this stageit might be found that the invention cannot be defined well enough forpatenting purposes and this raises issues as to how easily it might beimitated.
• Patent to development: how are prototypes prioritised in the overall devel-opment programme? For example, if a first mover advantage is essential aprototype may require a high priority but this means interfering with thecurrent order.
• Development: how much should be spent?• Development to launch: the natural conflict between engineers and mar-
keters needs to be overcome.• Launch: to make an initial market impression it is essential to ensure that
the product is positioned properly in terms of differentiation and price.• Launch to market exploitation: it is necessary to decide whether the launch
has been successful and further resources devoted to exploitation or whetherthe product should be abandoned. This will depend on the market share
6/30 Edinburgh Business School Strategic Planning
Module 6 / Internal Analysis of the Company
captured, the reaction of competitors, predicted changes in consumer tastesetc.
• Market exploitation: the product is now entrenched as part of the productportfolio; but new and different products may require different marketingapproaches to existing products.
The process reveals that there are many possibilities for delay within eachstage, if it is not monitored effectively, and between each stage, if there areinsufficient incentives and effective procedures for taking products through eachtransition. It is instructive to consider the IBM experience and identify thoseaspects of the process which were not being managed well and led to thelags between invention and market exploitation. What emerges is that for thisprocess to be effective an organisation needs to pay a great deal of attention toincentives and be adaptable to changing priorities at different stages.
6.17 Resource Management
The management of resources has a direct bearing on the competitive positionof the company; there is little point in producing an ambitious and innovativemarket strategy if the goods cannot be produced at a competitive cost. Infact, the outcome of inadequate resource management will inevitably emergeas unnecessarily high costs. How can the company set about rationalising itsapproach to resource planning and allocation, given the continuously changingdemand for the factors of production due to market conditions and productlife cycles? Varying product life cycles, changes in productivity and transitionamong products can result in major variations in factor requirements. Withoutsome foresight the company may find itself hiring and firing in an indiscriminatefashion.
The first step is to identify the company’s approach to resource planning. Twogeneral approaches to resource planning, the reactive and the proactive, can becharacterised as follows:
• REACTIVELook one period ahead
• PROACTIVEThink about– product life cycles– product launch periods– selecting a planning horizon– developing a resource plan– the implications for marketing strategy
The reactive mode simply looks at what will be happening next period, whichmay be no more than a quarter year, and hires and fires accordingly. In manycompanies this is precisely what happens, in that lip service is paid to resourceplanning but in fact operations are conducted from day to day.
Strategic Planning Edinburgh Business School 6/31
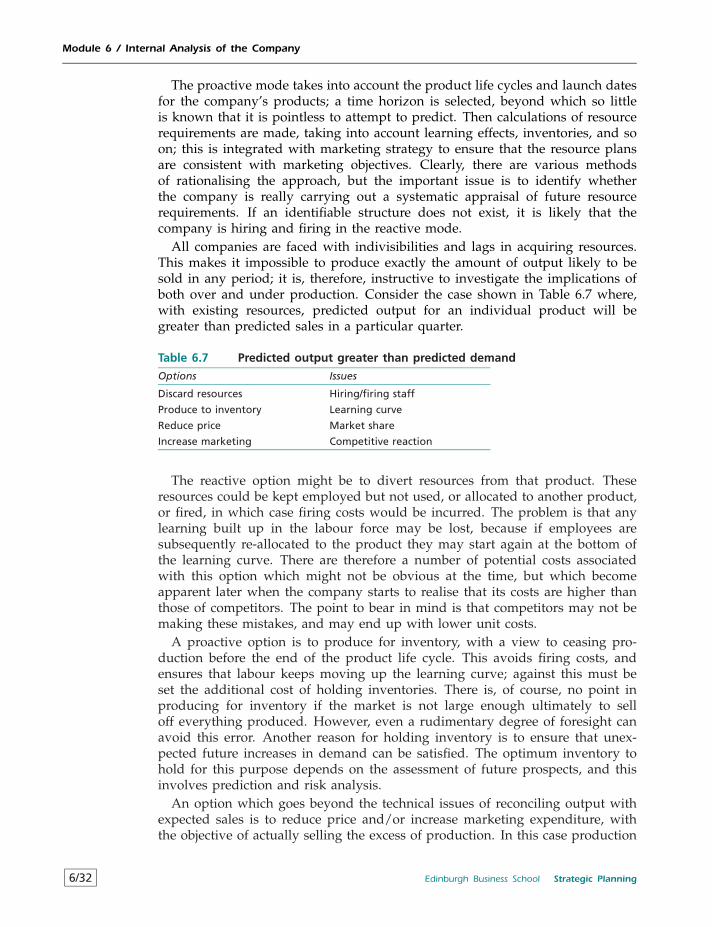
Module 6 / Internal Analysis of the Company
The proactive mode takes into account the product life cycles and launch datesfor the company’s products; a time horizon is selected, beyond which so littleis known that it is pointless to attempt to predict. Then calculations of resourcerequirements are made, taking into account learning effects, inventories, and soon; this is integrated with marketing strategy to ensure that the resource plansare consistent with marketing objectives. Clearly, there are various methodsof rationalising the approach, but the important issue is to identify whetherthe company is really carrying out a systematic appraisal of future resourcerequirements. If an identifiable structure does not exist, it is likely that thecompany is hiring and firing in the reactive mode.
All companies are faced with indivisibilities and lags in acquiring resources.This makes it impossible to produce exactly the amount of output likely to besold in any period; it is, therefore, instructive to investigate the implications ofboth over and under production. Consider the case shown in Table 6.7 where,with existing resources, predicted output for an individual product will begreater than predicted sales in a particular quarter.
Table 6.7 Predicted output greater than predicted demand
Options Issues
Discard resources Hiring/firing staff
Produce to inventory Learning curve
Reduce price Market share
Increase marketing Competitive reaction
The reactive option might be to divert resources from that product. Theseresources could be kept employed but not used, or allocated to another product,or fired, in which case firing costs would be incurred. The problem is that anylearning built up in the labour force may be lost, because if employees aresubsequently re-allocated to the product they may start again at the bottom ofthe learning curve. There are therefore a number of potential costs associatedwith this option which might not be obvious at the time, but which becomeapparent later when the company starts to realise that its costs are higher thanthose of competitors. The point to bear in mind is that competitors may not bemaking these mistakes, and may end up with lower unit costs.
A proactive option is to produce for inventory, with a view to ceasing pro-duction before the end of the product life cycle. This avoids firing costs, andensures that labour keeps moving up the learning curve; against this must beset the additional cost of holding inventories. There is, of course, no point inproducing for inventory if the market is not large enough ultimately to selloff everything produced. However, even a rudimentary degree of foresight canavoid this error. Another reason for holding inventory is to ensure that unex-pected future increases in demand can be satisfied. The optimum inventory tohold for this purpose depends on the assessment of future prospects, and thisinvolves prediction and risk analysis.
An option which goes beyond the technical issues of reconciling output withexpected sales is to reduce price and/or increase marketing expenditure, withthe objective of actually selling the excess of production. In this case production
6/32 Edinburgh Business School Strategic Planning
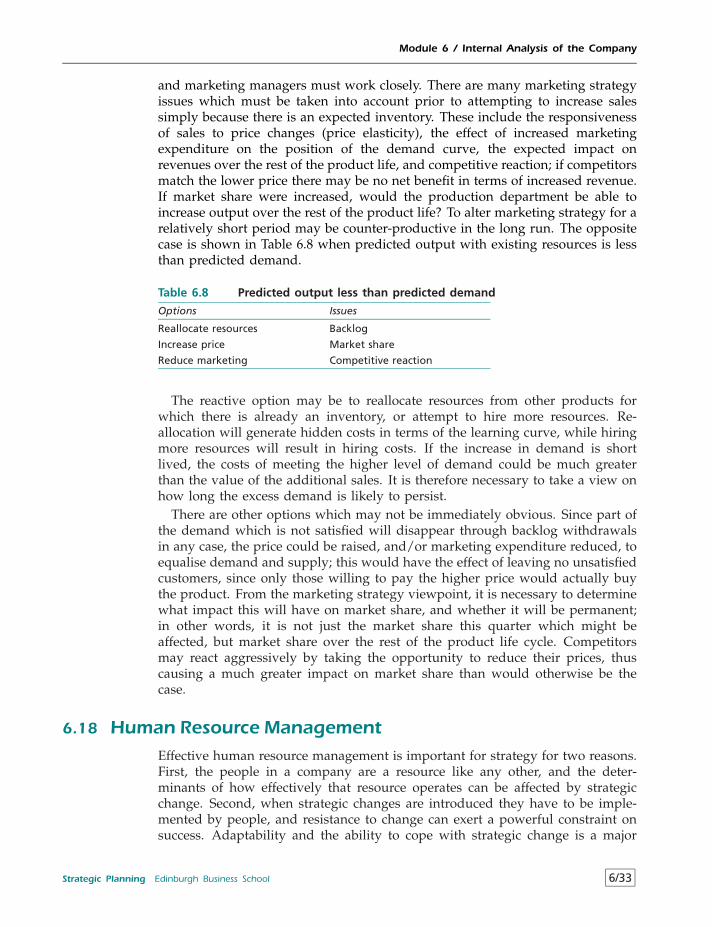
Module 6 / Internal Analysis of the Company
and marketing managers must work closely. There are many marketing strategyissues which must be taken into account prior to attempting to increase salessimply because there is an expected inventory. These include the responsivenessof sales to price changes (price elasticity), the effect of increased marketingexpenditure on the position of the demand curve, the expected impact onrevenues over the rest of the product life, and competitive reaction; if competitorsmatch the lower price there may be no net benefit in terms of increased revenue.If market share were increased, would the production department be able toincrease output over the rest of the product life? To alter marketing strategy for arelatively short period may be counter-productive in the long run. The oppositecase is shown in Table 6.8 when predicted output with existing resources is lessthan predicted demand.
Table 6.8 Predicted output less than predicted demand
Options Issues
Reallocate resources Backlog
Increase price Market share
Reduce marketing Competitive reaction
The reactive option may be to reallocate resources from other products forwhich there is already an inventory, or attempt to hire more resources. Re-allocation will generate hidden costs in terms of the learning curve, while hiringmore resources will result in hiring costs. If the increase in demand is shortlived, the costs of meeting the higher level of demand could be much greaterthan the value of the additional sales. It is therefore necessary to take a view onhow long the excess demand is likely to persist.
There are other options which may not be immediately obvious. Since part ofthe demand which is not satisfied will disappear through backlog withdrawalsin any case, the price could be raised, and/or marketing expenditure reduced, toequalise demand and supply; this would have the effect of leaving no unsatisfiedcustomers, since only those willing to pay the higher price would actually buythe product. From the marketing strategy viewpoint, it is necessary to determinewhat impact this will have on market share, and whether it will be permanent;in other words, it is not just the market share this quarter which might beaffected, but market share over the rest of the product life cycle. Competitorsmay react aggressively by taking the opportunity to reduce their prices, thuscausing a much greater impact on market share than would otherwise be thecase.
6.18 Human Resource ManagementEffective human resource management is important for strategy for two reasons.First, the people in a company are a resource like any other, and the deter-minants of how effectively that resource operates can be affected by strategicchange. Second, when strategic changes are introduced they have to be imple-mented by people, and resistance to change can exert a powerful constraint onsuccess. Adaptability and the ability to cope with strategic change is a major
Strategic Planning Edinburgh Business School 6/33
Module 6 / Internal Analysis of the Company
objective of human resource management. One of the main characteristics of anorganisation is its culture, which comprises its set of beliefs, values and manage-rial approaches; this culture is reflected in its structures, systems ad approachto the development of strategy. The culture itself is derived from the company’spast history, type of leadership, the people involved, its use of technology andresources. But since each company has a different history and different combi-nations of people and other resources the culture of each is likely to be unique.However, four broad types of culture can be identified which provide a basisfor understanding how the workforce is likely to react to change.7
1 Power CultureThe organisation tends to revolve around one individual (or small group),who dominates decision making and determines how things are done.This culture usually occurs in a relatively new or small company whichis entrepreneurial in nature. However, as this type of organisation growsit becomes increasingly difficult to maintain central control, and there isa tendency for smaller groups to form who are, in their turn, dominatedby their own leaders. In this type of organisation there is unlikely to bean explicit strategic plan, but if there is one it will tend to reflect theinterests of the dominant leader rather than being based on analysis ofthe environment and explicit strategy choice. An example of this type ofculture is in the newspaper industry, where the old style proprietors dictatededitorial approach and newspaper layout.
2 Role CultureThis is a distinctive type of organisation which relies on committees, struc-tures, analysis and the application of logic. While a small group of seniormanagers make final decisions, they rely on procedures and systems andclearly defined rules of communication. This bureaucratic type of structureworks well when the environment is stable, but the fact that it relies on rulesand procedures means that external changes are not typically recognised atan early stage, and the company is not well equipped to deal with thembecause it is relatively inflexible. Major changes tend to be dealt with by achange in the top management team. This type of culture is prevalent inthe civil service and the old style retail banks and their strategic changestend to be slow and methodical.
3 Task CultureThis type of culture arises in organisations which are geared to tackle specifictasks which tend to be of limited duration. The organisation is based onflexible teams who tackle assignments, and these teams will typically bemultidisciplinary, and power rests within the team structures. As a resultcontrol relies largely on the efficiency of the individual teams, and topmanagement must allow teams a great deal of autonomy. This culture isapparent in advertising agencies and consultancies; it is less appropriatefor factory style operations, although the team approach is being usedincreasingly in all work environments.
4 Personal CultureWhile this culture does not occur often in business, it is as well to be awareof it. In this case the individual pays little attention to the organisation and
6/34 Edinburgh Business School Strategic Planning
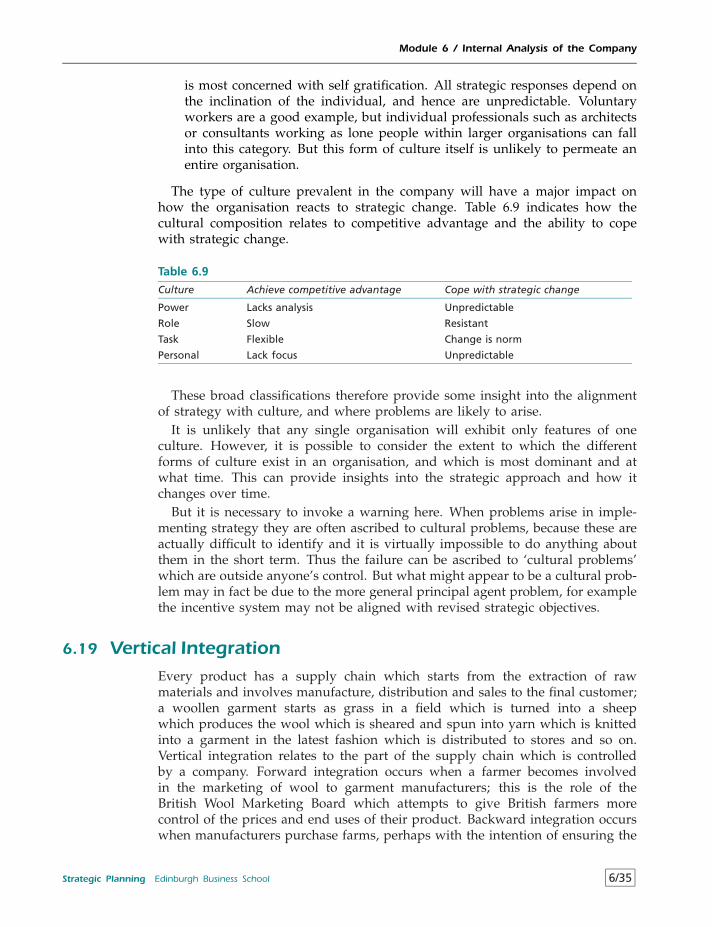
Module 6 / Internal Analysis of the Company
is most concerned with self gratification. All strategic responses depend onthe inclination of the individual, and hence are unpredictable. Voluntaryworkers are a good example, but individual professionals such as architectsor consultants working as lone people within larger organisations can fallinto this category. But this form of culture itself is unlikely to permeate anentire organisation.
The type of culture prevalent in the company will have a major impact onhow the organisation reacts to strategic change. Table 6.9 indicates how thecultural composition relates to competitive advantage and the ability to copewith strategic change.
Table 6.9
Culture Achieve competitive advantage Cope with strategic change
Power Lacks analysis Unpredictable
Role Slow Resistant
Task Flexible Change is norm
Personal Lack focus Unpredictable
These broad classifications therefore provide some insight into the alignmentof strategy with culture, and where problems are likely to arise.
It is unlikely that any single organisation will exhibit only features of oneculture. However, it is possible to consider the extent to which the differentforms of culture exist in an organisation, and which is most dominant and atwhat time. This can provide insights into the strategic approach and how itchanges over time.
But it is necessary to invoke a warning here. When problems arise in imple-menting strategy they are often ascribed to cultural problems, because these areactually difficult to identify and it is virtually impossible to do anything aboutthem in the short term. Thus the failure can be ascribed to ‘cultural problems’which are outside anyone’s control. But what might appear to be a cultural prob-lem may in fact be due to the more general principal agent problem, for examplethe incentive system may not be aligned with revised strategic objectives.
6.19 Vertical IntegrationEvery product has a supply chain which starts from the extraction of rawmaterials and involves manufacture, distribution and sales to the final customer;a woollen garment starts as grass in a field which is turned into a sheepwhich produces the wool which is sheared and spun into yarn which is knittedinto a garment in the latest fashion which is distributed to stores and so on.Vertical integration relates to the part of the supply chain which is controlledby a company. Forward integration occurs when a farmer becomes involvedin the marketing of wool to garment manufacturers; this is the role of theBritish Wool Marketing Board which attempts to give British farmers morecontrol of the prices and end uses of their product. Backward integration occurswhen manufacturers purchase farms, perhaps with the intention of ensuring the
Strategic Planning Edinburgh Business School 6/35
Module 6 / Internal Analysis of the Company
supply of certain types of wool, although there are probably very few instancesof this happening. The degree of vertical integration is closely bound up withthe business definition of the company as discussed at 3.2.
Every company is to some extent vertically integrated. But what is the ration-ale for vertical integration? This comes down to the well known question ofwhether the company should make something itself or buy it from some othercompany. There are various potential benefits and costs of using the marketrather than producing internally. The benefits include:
• Market firms can achieve economies of scale which the company’s purchaseswould be insufficient to generate on their own.
• Market firms are subject to the discipline of the market; it is unnecessary toimplement rigorous internal controls to ensure efficiency.
The costs include:
• The coordination of production flows may be compromised because thesupplier may have other priorities from time to time.
• Private information may be leaked to competitors who also use the samesuppliers.
• Transaction costs may be incurred.
There is no general answer to these issues, but they do need to be addressedin the light of the circumstances facing each company. There are three incorrectarguments commonly used to justify making rather than buying in from themarket:
• To avoid paying the costs necessary to make the product – this is wrongeven if the company currently has excess capacity since the costs have tobe borne by someone.
• To avoid paying a profit margin to other firms – it is not whether thesupplier makes a profit that is important, but whether the profit made ishigher than could be made by the company were it to undertake the activityitself. Given a lack of experience and scale effects this is doubtful.
• To avoid paying high prices during periods of peak demand or scarcesupply – again it is relative profitability which is relevant; if the supplieroperates in a competitive market the company could not make the productany more cheaply because the higher price reflects higher input costs.
On the other hand, it needs to be recognised that a complete contract witha market supplier cannot be achieved in the way that an internal contract can.There are at least three reasons for this.
• Life is too complex to draw up a contract which can take all eventualitiesinto account; the contract arrived at reflects bounded rationality.
• There are severe difficulties involved in specifying and measuring perform-ance with any accuracy; for example, defining the thrust of an engine exactlyand then predicting its wear and tear over time.
• Neither party is willing to reveal all information to the other, and this mayplace the buyer at a disadvantage.
6/36 Edinburgh Business School Strategic Planning
Module 6 / Internal Analysis of the Company
A potential difficulty that most companies are aware of is the ‘holdup’ prob-lem: a party in a contractual relationship may be able to exploit the other party’svulnerability once the contract has been agreed. This is something which can-not be evaluated in financial terms before the event. There are a number ofways by which internal organisation can better resolve the holdup problem thanarm’s-length market contracting.
• Vertical integration gives access to more powerful governance structures inthe sense that disputes can be settled by internal administrative mechanismssuch as recourse to general rules or informal mediation.
• Because of the guarantee that the internal relationship will be continuousand must be lived with there is more incentive to get things right.
• Depending on the company culture, vertically integrated divisions may bemore likely to behave in a cooperative fashion because they see them-selves bound together in a common purpose. One point of view is that thebalancing of incentives for competitive and cooperative behaviours amongautonomous units within a firm is the single most important task of topmanagement. The sociology of organisations opens up potential avenues fordiscouraging opportunistic behaviour and achieving cooperative outcomesthat are not available in a market contract setting. Of course, these outcomesare likely to be difficult to achieve in practice.
The point that emerges clearly from this discussion is that if the companydecides to make rather than buy in competitive markets it will generate someformidable principal/agent problems. As a result a great deal of managementresources will be devoted to resolving these. A major problem is that the internalpricing system must perform the same function which the market would haveperformed – otherwise it becomes impossible to monitor the performance ofthe sections of the vertical chain and identify where value is being created ordestroyed. For example, internal prices which are based on accounting conven-tions rather than market conditions are likely to provide misleading cost signals.One method of resolving the problem is to allow managers the option of buyingfrom outside suppliers if their price is lower; this has the effect of applying thediscipline of the market to the components of the vertical chain, while hopefullyenabling the company to achieve the potential benefits of vertical integrationoutlined above.
The vertical and horizontal integration of companies has always been a sourceof concern to those who felt that companies would grow so big that they woulddominate their markets and then be in a position to hold consumers to ransom.But this is not how it works in practice. The case of ICI and Hanson wasdiscussed at 3.12.6 in relation to the creation of shareholder wealth. This was acase where a large company comprised of many separate parts, some of whichwere independent of each other, would benefit from a demerger. But ICI isa company producing in a number of competitive markets, and its size doesnot of itself provide it with monopoly powers. Take the case of a verticallyintegrated company with substantial monopoly power such as British Gas, andtrack the product from discovery of gas supplies through distribution to thefinal consumer. Should British Gas do its own exploration, production and
Strategic Planning Edinburgh Business School 6/37
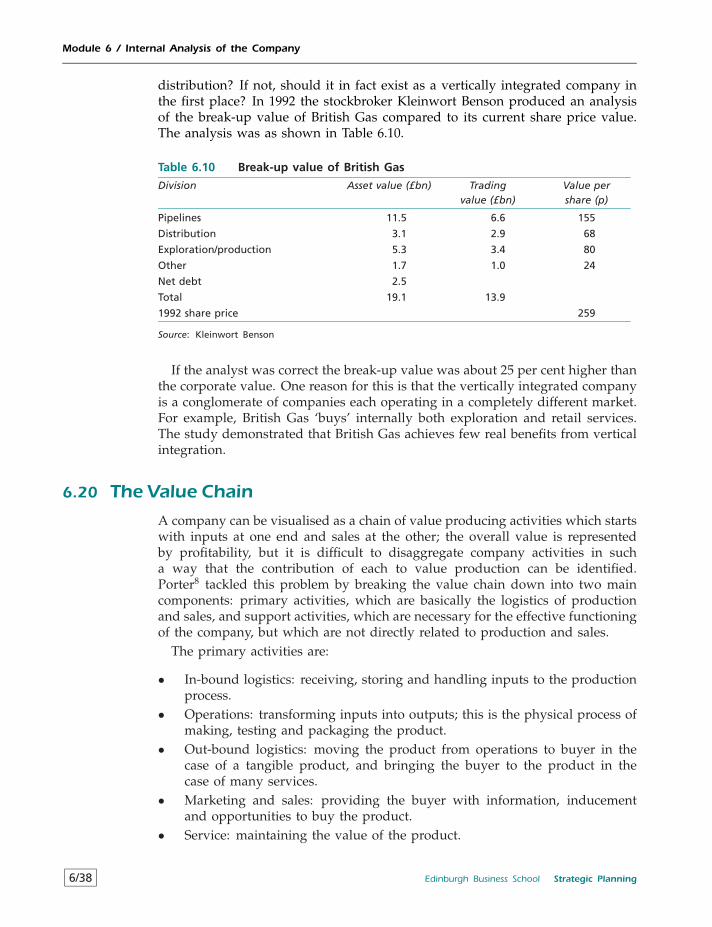
Module 6 / Internal Analysis of the Company
distribution? If not, should it in fact exist as a vertically integrated company inthe first place? In 1992 the stockbroker Kleinwort Benson produced an analysisof the break-up value of British Gas compared to its current share price value.The analysis was as shown in Table 6.10.
Table 6.10 Break-up value of British Gas
Division Asset value (£bn) Tradingvalue (£bn)
Value pershare (p)
Pipelines 11.5 6.6 155
Distribution 3.1 2.9 68
Exploration/production 5.3 3.4 80
Other 1.7 1.0 24
Net debt 2.5
Total 19.1 13.9
1992 share price 259
Source: Kleinwort Benson
If the analyst was correct the break-up value was about 25 per cent higher thanthe corporate value. One reason for this is that the vertically integrated companyis a conglomerate of companies each operating in a completely different market.For example, British Gas ‘buys’ internally both exploration and retail services.The study demonstrated that British Gas achieves few real benefits from verticalintegration.
6.20 The Value Chain
A company can be visualised as a chain of value producing activities which startswith inputs at one end and sales at the other; the overall value is representedby profitability, but it is difficult to disaggregate company activities in sucha way that the contribution of each to value production can be identified.Porter8 tackled this problem by breaking the value chain down into two maincomponents: primary activities, which are basically the logistics of productionand sales, and support activities, which are necessary for the effective functioningof the company, but which are not directly related to production and sales.
The primary activities are:
• In-bound logistics: receiving, storing and handling inputs to the productionprocess.
• Operations: transforming inputs into outputs; this is the physical process ofmaking, testing and packaging the product.
• Out-bound logistics: moving the product from operations to buyer in thecase of a tangible product, and bringing the buyer to the product in thecase of many services.
• Marketing and sales: providing the buyer with information, inducementand opportunities to buy the product.
• Service: maintaining the value of the product.
6/38 Edinburgh Business School Strategic Planning
Module 6 / Internal Analysis of the Company
Each of these primary activities can be identified and analysed to determineits contribution to the value created by the company. But it is not just theeffectiveness with which these primary activities are performed that is important,but their linkages among each other and with the following support activities:
• Procurement: the process by which resources are acquired.• Technology development: the technology associated with each of the value
activities, including learning by doing, product design and processdevelopment.
• Human resource management: the whole business of managing the work-force.
• Management systems: including quality control, finance and operationalplanning.
The notion of value which is used in value chain analysis is how the ulti-mate user views the product in relation to competitive products. Unfortunatelythis is almost impossible to measure, and it is usually necessary to use othermeasures, such as operating margin, profit or shareholder value. Once someidea of competitive differences has been established the value chain can beanalysed to identify how these are determined by its components. The objectiveis to identify distinctive competencies which generate competitive advantage;these distinctive competencies are aspects of performance where the companyis particularly good compared with competitors. However, the value chain isnot just a tool for analysing company effectiveness and identifying the basis forcompetitive advantage. An understanding of the value chain is important foridentifying strategic options as it helps to provide an overview of the strengthsand weaknesses of the company in a competitive setting.
Simply disaggregating the activities of the company into a chain and analysingthe components may not tell the whole story, as it may be the linkages betweenvalue activities which contribute to competitive advantage. This has implicationsfor strategy, because while competitors can copy success in identifiable areassuch as distribution channels or resource management by using techniques suchas benchmarking, it is almost impossible to replicate the linkages among thecomponents because these are unique to the company. The ability to capitaliseon company characteristics which are embedded in the organisational structureis one of the underlying factors which contribute to a sustainable competitiveadvantage. Marks & Spencer, the British retailer, is famous for the linkageswhich it established with producers and the resulting guarantee of high quality;it was also a leader in human resource management which was also linked to ahigh standard of customer service. While each of the elements in the Marks &Spencer value chain could be imitated, it turned out to be almost impossible forother retailers to imitate the linkages between them; as a result Marks & Spencerretained its place as one of the most profitable retailers in the world for severaldecades. However, by 1998 some serious problems with the value chain hademerged; for example, weaknesses in Marks & Spencers’ procurement policiesled to a build up of unwanted stocks amounting to about £150 million. Theimage of quality and value which had been built up by purchasing from Britishsuppliers was undermined by switching to foreign suppliers because British
Strategic Planning Edinburgh Business School 6/39
Module 6 / Internal Analysis of the Company
suppliers were relatively expensive. To cap it all, a series of board room battlesundermined the company’s image as a leader in human resource management.As these problems with the value chain emerged, it came as no surprise thatMarks & Spencer sales and profits fell dramatically at the end of 1998 and theshare price fell by 14 per cent.
6.21 DiversificationAs in the case of vertical integration, the firm needs to confront the issue ofthe optimal degree of diversification. The evidence available on the relativeperformance of diversified companies demonstrates that it is not an automaticrecipe for success. Porter tracked the performance of 32 firms which wereinvolved in acquisitions, and concluded that there had been virtually no benefitin any of the cases. Some accounting studies have been carried out on thedegree of diversification and performance, using measures such as return oninvestment. There is no obvious connection between the two, and it seems thatprofits are more likely to be determined by industry profitability rather thanby diversification itself. A detailed study9 on stock price outcomes found threemain effects:
1 The combined value of parent and target firms tended to rise following theannouncement of a take-over, but this was usually temporary.
2 A preponderance of abnormal returns accrue to target firm shareholders.3 Acquiring firm shareholders eventually receive small statistically insignifi-
cant returns.
Given this lack of positive evidence that there is much real gain from diversi-fication, why has it been such a popular corporate pastime? There are four mainincentives to diversify: to minimise risk, to capture economies of scope, to addvalue through the parenting function and to benefit from synergy. The first ofthese can be dealt with quite briefly, as it is now recognised as a means of min-imising management risk but not shareholder risk. The objective of stabilisingcash flows over time is a weak rationale for diversifying, and certainly providesno basis for expecting any value production.
The idea of economies of scope was developed at 6.7, and it was concludedthat the pursuit of economies of scope might as easily lead to value destructionrather than value creation. Prahalad and Bettis argue that managers of diver-sified firms may see themselves as deriving economies of scope through theirproficiency in spreading scarce top management skills across apparently unre-lated business areas through the application of their dominant management logic(this idea was introduced at 1.4.2); this is the way in which managers conceptu-alise the business and make critical resource allocations – be it in technologies,product development, distribution, advertising or human resource management.The dominant management logic has a direct effect when managers developspecific skills, e.g. information systems, and seemingly unrelated businesses relyon these skills for success. There is a danger that the dominant managementlogic rationale can be mistakenly applied by managers who perceive themselvesas possessing above average general management skills. Furthermore, without
6/40 Edinburgh Business School Strategic Planning
Module 6 / Internal Analysis of the Company
detailed knowledge about a particular business it is impossible to know at thetime of the diversification whether the new business fits the dominant manage-ment logic or whether the managerial skill is above average. In the absence ofobvious relationships between businesses, claims that economies of scope derivefrom a dominant management logic are difficult to defend.
Richard Branson’s business empire was outlined at 2.2, and is a good exampleof a highly diversifed portfolio with nothing to bind it together. In 1996 therewere 27 companies in the group arranged in divisions:
• Travel and tourism, including Virgin Atlantic Airways, Virgin Clubs andHotels and Virgin Airships and Balloons;
• Retail and Cinema;• Media and Entertainment, with companies in publishing, television and
radio;• Consumer Products, including Virgin Cola, Virgin Jeans and Virgin Cosmet-
ics;• Design and Modelling;• Financial Services, which is a major venture in the direct selling by telephone
of financial products.
An obvious linkage among these enterprises is the dominant managementlogic of Branson himself, which is characterised by a high level of activityand commitment. But there is a limit to how far this resource can be spread.Another potential linkage lies through brand stretching; while there may be areal impact here, the underlying rationale for a relationship between cola andfinancial services is unclear. It is therefore difficult to see what the individualcompanies stand to gain in the long term from being part of a group which wascreated by a random process of diversification.
6.22 Synergy
Synergy appears to have first been mentioned by Ansoff10 in 1968. The notiondiffers from economies of scale and experience in that it is independent of thesize of the company, or of the total output to date. Synergy should lead to thesituation where a corporation is valued at more than the sum of the value of itsindividual parts if they could be separated.
In business terms, synergy can be thought of as the 2 + 2 = 5 effect; Fullerdefines it as
. . . behavior of integral, aggregate, whole systems unpredicted by behavior of anyof their components or subassemblies of their components taken separately fromthe whole.11
Some successful companies attribute at least part of their success to synergy.It is therefore important to determine whether synergy can be predicted andtherefore capitalised on in formulating strategy. For example, no one wouldexpect a synergistic effect from a company which produces ball bearings takingover a company producing ice cream; but is it possible to use the concept as
Strategic Planning Edinburgh Business School 6/41
Module 6 / Internal Analysis of the Company
an operational tool to tell the ball bearing company which type of company totake-over? While the idea of synergy has an intuitive appeal it turns out to bea difficult principle to pin down in practice.
There are two problems in attempting to benefit from synergy as a consequenceof company actions. The first is to identify where the benefits of synergy arelikely to be generated. The second is that there is little empirical evidence whichcan guide the company in individual situations; in other words, synergy may belittle more than wishful thinking on the part of companies engaged in expansionwho have heard that synergy is an outcome of diversification.
The Components of Synergy
Synergy is often described as an almost mystical effect which makes itselfapparent in cost and marketing advantages, without being explicit about themechanism which actually causes these effects. There are in fact a number ofareas from which the effects of synergy are likely to originate.
• CORPORATE MANAGEMENTThere may be possibilities for individual SBUs to share common indivisibleresources, and to eliminate excess capacity. However, this is not a caseof 2+2=5, but simply making the optimum use of capacity. This benefitis more properly related to production management. A different corporatemanagement issue is that similarity among SBUs may make them moreamenable to management than a series of SBUs in unconnected markets.This begs the question of what is meant by ‘similar’. An SBU which hasrecently been added to the company may produce similar products, but mayhave inherited a management structure and ethos which is totally alien tothe corporation. Synergy at the corporate level may be identifiable after theevent, but whether the addition of any given SBU to an existing companywould generate a positive synergistic impact is impossible to predict.
• ECONOMIES OF SCALEWhile synergy is different from economies of scale, it is possible that somedimensions of scale economies can be captured by diversification into similarproducts. This is related to the notion that there is a carry over fromexperience in similar production and selling environments, and is obviouslysimilar to economies of scope; operating in a series of similar markets haselements of doing more of the same thing, which is the notion of scale andexperience effects. This argument is not very compelling to the economist,whose rigorous definition of economies of scale takes into account theoptimum deployment of labour and capital. The mere fact of expandingsome functions is no guarantee that scale economies will result.
• VERTICAL INTEGRATIONThe potential for economies was discussed at 6.18. These economies arerelated to capacity utilisation, transport costs and so on. They are usuallyrelated to more efficient use of resources, and do not really accord with thenotion of 2 + 2 = 5.
6/42 Edinburgh Business School Strategic Planning
Module 6 / Internal Analysis of the Company
• CAPACITY UTILISATIONA company may have concealed excess capacity, in the sense that its labourforce could undertake additional tasks without significant increases in wagesor numbers employed, factory space may not be fully utilised, and so on.This potential benefit resembles that of similar SBUs making use of eachother’s spare capacity from time to time.
• JOINT PRODUCTIONIt has already been discussed how joint production permeates the modernmulti-product company. Take the case of two sheep farmers, one of whomproduced only wool and the other produced only meat. If they were tomerge their operations there would obviously be scope for sheep producingboth wool and meat. There are likely to be many instances of much moresubtle benefits from joint production in modern companies.
• INNOVATIVE STIMULUSThe mere fact of incorporating another area of activity may spark off newideas and approaches. While this is an undoubted possibility, it is unlikelyto be predictable.
Even a rudimentary examination of the sources of synergy throws up animportant point: while synergy may exist it is unlikely to be predictable unlessthere is a clear resource sharing effect. From the strategy viewpoint there is nobasis on which to conclude that a particular course of action would lead to apredictable reduction in costs due to synergy. It is likely that synergy is theoutcome of complex interaction effects specific to individual companies, withthe contributing factors varying from case to case.
Empirical Evidence
Because of the problems of defining and identifying synergy, it is extremelydifficult to generate data which can be used as the basis of statistical analysis.An attempt has been made using the large scale PIMS database, which con-tained questions relating to synergy potential in the fields of sales, operations,investment and management.12 The approach adopted was to compare the ROIof companies which claimed synergistic potential with the ROI of those whichdid not. The outcomes demonstrated that while the overall return to synergywas positive, the pattern of returns was mixed. In summary, it was found that:
• On average, synergy has a significant effect on ROI, but the magnitudedepends on both the specific generating components and the type of busi-ness.
• Among the four components of synergy affecting ROI, the results across allSBUs suggest that on the average sales synergy results in higher ROI.
• Operating synergy has a mixed pattern; for example, purchases from otherSBUs depress ROI, and sales within the company have no effect on ROI.
• Investment synergy depresses ROI.• Management synergy increases ROI.• None of the business types analysed benefit from synergy across all four
dimensions of synergy.
Strategic Planning Edinburgh Business School 6/43
Module 6 / Internal Analysis of the Company
This study suggests the impact of synergy varies substantially with circum-stances, and that synergy may have negative as well as positive effects. Thus,despite its intuitive appeal, and despite the exhortations of management textsto capitalise on synergy, it cannot be taken for granted that potential synergywill have a positive impact on ROI. Perhaps this is not surprising in view ofthe difficulty of identifying where synergy effects are likely to be derived. Agreat deal more information requires to be generated on this issue prior toformulating usable rules for managers. From the strategy viewpoint, managersshould confront claims that benefits will accrue from synergy with questionsabout where the effects are likely to come from, and what evidence exists thatthey will be significant in this instance.
To put the potential benefits from diversification into context, bear in mind thatsome of the most successful companies in history have stayed with their originalproduct, and everyone knows about them. Coca Cola, Pepsi and McDonald’sare world-wide brands, and these companies have truly ‘stuck to the knitting’.
6.23 Competence
The fact that competition exists among companies at all, and that companiesare continually going out of business and being replaced by others, suggeststhat different companies are relatively good at different things at different times.The aspects of competitive performance which a company is relatively good atare its capabilities, or competencies (both terms are widely used). The notionof distinctive competencies relates to all of the characteristics of a companywhich give it a competitive edge. But very often it is not so much beingparticularly good at one thing which generates competitive advantage, butthe integration of competencies into a value-generating chain. This is becauseindividual competencies can be imitated and hence do not generate a sustainablecompetitive advantage, while the benefits of organisational integration are muchmore difficult to identify and copy. Thus while technique based competence isa necessary condition for competitive advantage it is not a sufficient condition:it is also necessary for individual competencies to be better than those ofcompetitors, and to have the competencies combined in such a way that theresulting organisation cannot be readily imitated.
The notion of core competencies arises from addressing the question of whatbusiness the company should be in. This question is of importance to companiesinvolved in restructuring, delayering, downsizing or however they choose todescribe their attempts to rationalise activities. But it is also important to com-panies which are concerned with expansion, and feel that they have the capa-bility to grow and thrive, but are perhaps not sure what is the source of theircompetitive advantage.
The idea of core competencies was introduced at 1.4.2. Prahalad and Hameluse the example of two large companies in the evolving information technologybusiness; these were NEC, which, they contended, adopted a core productapproach, and GTE which maintained an SBU mentality. Prahalad and Hamelattribute the success of NEC compared with GTE to the approach it adopted.
They argue that the collective learning in the organisation must be able to
6/44 Edinburgh Business School Strategic Planning
Module 6 / Internal Analysis of the Company
• coordinate diverse production skills• integrate multiple streams of technologies• organise work to deliver value
and that this requires
• communication• involvement• commitment
The conventional SBU mentality leads to
• under-investment in developing core competencies. This is because the SBUsconcentrate on their own effectiveness without taking a wider view of theirlinkages with the rest of the company.
• imprisoned resources within the SBU. While the principles of capital bud-geting are understood as a method of allocating resources there is nocomparable mechanism for allocating human skills that embody core com-petencies.
• bounded innovation. Individual SBU managers will pursue only those inno-vations which relate to their own operations and will ignore, or not recognisethe importance of, hybrid opportunities.
The message which comes across is that the organisation of a company intoSBUs may be highly efficient, but if SBU autonomy is carried too far it may standin the way of developing a long term competitive advantage. Furthermore, thecapital budgeting approach to resource allocation may be inappropriate becauseit is not possible to relate future cash flows to core competencies. But this stilldoes not answer the question of what comprises core competence. Because ofthe difficulty of identifying core competence in a conceptual sense, it is easier tosay what it is not:
• outspending others on R&D• shared costs, for example, SBUs sharing excess capacity• vertical integration.
In order to identify a core competence there are three tests which can beapplied. It
• gives potential access to a wide array of markets• makes a significant contribution to perceived customer benefits of the end
product• is difficult to imitate.
Core competencies are likely to be relatively rare, and Prahalad and Hamelreckon that there are probably no more than five or six per company. If they arenot recognised, companies can unwittingly surrender core competencies whencutting internal investments – cost centres – in favour of outside suppliers. Itis therefore essential to distinguish between divesting a business and losing a
Strategic Planning Edinburgh Business School 6/45
Module 6 / Internal Analysis of the Company
core competence. By its nature, the cost of losing a core competence cannot becalculated in advance, but it may lead to a significant reduction in companyperformance. Furthermore, a core competence may take a decade or more tobuild up – so with no core competence a company will find it difficult to enteremerging markets. Prahalad and Hamel contend that the superior performanceof NEC over GTE was due to NEC’s conformance with the core competenceapproach. But with the passage of time their conclusions appear to be a little lesssecure. While NEC performed better than GTE, during the ten years up to 1996NEC’s shares lagged behind the average of the stockmarket by 28 per cent; infact, much of its financial success was due to its semiconductor business whichis related to the world shortage in memory chips. Critics have also argued thatuntil 1991 NEC was organised in ten vertically integrated divisions which werecontrolled by powerful and independent leaders in a manner which was notconducive to synergy. It was only in 1991 that the company was reorganisedinto three horizontal groups, which was one year after Prahalad and Hamelcompleted their study. While this perspective does not necessarily invalidate theargument put forward by Prahalad and Hamel the fact that the evidence is somixed demonstrates just how difficult it is to use the notions of competence asa source of competitive advantage.
It follows that core competencies lead to core products, but it may be asdifficult to identify a core product as a core competence. For example, a coreproduct might be a component rather than a complete end product; Canonsupplies 84 per cent of laser printer ‘engines’ but has only a small percentageof the laser printer market. Thus end product market share may not reflect theunderlying core competence. Core competencies can be viewed as the pool ofexperience, knowledge and systems etc. that exist in the corporation as a whole,and do not reside within any given SBU, which can be deployed to reduce thecost or time required either to create a new strategic asset or expand the stockof an existing one.
A technique for using the concept of competencies using categories of compe-tence which can be utilised in diversification, rather than attempting to definecompetencies precisely, has been developed by Chiesa and Manzini13. They startby identifying three levels of competence.
• Systems, which comprise the goals, culture and organisational design ofthe company; it is at this level that the opportunities for diversification areidentified.
• Distinctive capabilities, which are the repeatable patterns enabling the co-ordinated and integrated deployment of knowledge and resources withinthe company. These can be exploited in the process of diversification bytransferring bundles of skills and technologies.
• Core outputs, which can be exploited for different or new products andservices in new markets.
These levels of competence can be decomposed to routines and resources;for example, the distinctive capabilities are essentially routines, while the coreinputs are resources. The form of diversification can then be classified dependingon whether it is based on routines and resources currently residing within the
6/46 Edinburgh Business School Strategic Planning
Module 6 / Internal Analysis of the Company
company or routines and resources which have to be acquired or developed.Chiesa and Manzini devised a classification based on routines and resources,and Figure 6.8 is developed from their specification.
Current Developed
Routines
Routine basedAcquired
Replication basedCurrent
Unrelated
Resource based
Resources
Figure 6.8 Competence based diversification
While the classification is bound to be imprecise in real life, each of these formsof diversification has distinctive characteristics depending on the use which ismade of currently available resources and routines within the company. A par-ticular feature of the classification is that it breaks down ‘related’ diversificationinto three categories, and an examination of these helps to interpret the way inwhich diversification occurs.
Routine Based Diversification
In this case new resources need to be added to those currently available in thecompany, but the same routines can be used to manage them. The biggest com-pany in Scotland is ScottishPower which has diversified from being an electricityutility company into water, gas and telecommunications. New resources wererequired for several of these new products, and the top management claim thatthe same competences (or routines) are relevant for the management of differenttypes of utility. In particular, the customer can be provided with a packagedeal covering electricity, gas, water and telecommunications. This is a clear casewhere the systems and distinctive capabilities provide a strong set of routineswhich can serve as the basis for diversification.
Resource Based Diversification
This occurs when a company starts producing outputs which utilise existingresources but which require different routines. The British university system isworld renowned for the excellence of its education, and Edinburgh BusinessSchool (EBS) set about delivering this education in the form of the MBA bydistance learning. But the conventional routines which deliver class-based edu-cational outputs were incompatible with distance learning, and it was necessary
Strategic Planning Edinburgh Business School 6/47
Module 6 / Internal Analysis of the Company
for EBS to develop a totally new set of routines to deliver current educationalassets. The existing routines included regular student-teacher contact, periodicgraded assignments, student peer group interaction and academic counselling.The new routines included self contained teaching packages, self assessment andthe use of sophisticated examinations to measure performance. To change cur-rent routines and introduce new routines can involve much more fundamentalorganisational change than the routine based diversification outlined above.
Replication Based Diversification
This should be the least risky form of diversification because it is based on anexpansion rather than a change in the form of the organisation. A major changein the British financial market in the past few years has been the diversificationof building societies (which are mutually owned organisations) into providers ofthe full range of banking services. Previously building societies had specialisedin providing mortgages for house purchase, and typically charged relatively lowrates to borrowers and paid low (but safe) interest rates to savers. During theperiod up to the mid 1980s, when they were the only providers of housingfinance, there was an imbalance in supply and demand in the market forhousing finance and building societies had to ration available funds. Whenbanks started competing in this market the building societies found that asubstantial part of their business was lost, and they reacted by diversifying intoactivities previously undertaken only by banks. The building societies utilisedtheir existing resources, in the form of a network of branches and experiencedpersonnel, and applied the routines which they already had for the managementof house finance to a wider range of services. It could well be that replicationbased diversification is the underlying reason for the success of building societiesin the highly competitive personal financial sector. During the mid 1990s severalbuilding societies were floated on the stock exchange, and this resulted in largewindfall gains for mutual shareholders, reflecting the enormous value addedwhich their replication based diversification had produced.
Unrelated Diversification
The extreme form of unrelated diversification where the only resource sharedis the financial structure and control system. There are, of course, numerousexamples of companies which have diversified into areas which are unrelated interms of resources and routines; the Virgin business portfolio outlined in 6.20 isan example. It seems fairly obvious that diversification is particularly risky whenthe firm has to acquire new types of resources and manage them using routineswith which it is unfamiliar. It could be argued that much of the Virgin portfoliois in the ‘entertainment’ business and these businesses are therefore related. Butit is worth considering the resources and routines required to produce tourism,cinema, TV and publishing; this would give a different answer on relatedness.It is probable that few boards consider possible diversification strategies usingthis type of classification, and hence tend to embark on the process withouta clear notion of how far from the core activities of the company a particulardiversification is taking them.
6/48 Edinburgh Business School Strategic Planning
Module 6 / Internal Analysis of the Company
Diversification Trajectory
It is possible to introduce a dynamic element and try to plot the trajectory, ordirection in the matrix, of a company’s diversification over time. The Scottish-Power diversification was described above as being primarily routine based.However, a closer examination of each acquisition reveals an underlying direc-tion. The first acquisition was largely replication based: ManWeb was anotherelectricity company in England. The next step was more routine based: South-ern Water was a medium sized water company in the south of England. Itthen moved towards the unrelated area through the development of a telecom-munications business. While this classification is clearly open to alternativeinterpretations, top management should perhaps look at this trajectory as awarning sign that the company is starting to move away from its core.
6.24 Strategic ArchitectureThe way in which the company’s collection of unique attributes is combinedtogether is known as strategic architecture. The strategic architecture of thecompany is derived from the idea of the value chain and the core competen-cies upon which competitive advantage is based. It is a network of relationalcontracts within or around the firm. Firms establish relationships with theiremployees (internal architecture), with their suppliers or customers (externalarchitecture), or among a group of firms engaged in related activities (networks).The value of architecture lies in the capacity of organisations which establish itto create organisational knowledge and routines, to respond flexibly to changingcircumstances and to achieve easy and open exchanges of information. Each ofthese is capable of creating an asset for the firm, i.e. organisational knowledgewhich is more valuable than the sum of individual knowledge, flexibility andresponsiveness which extends to the institution as well as to its members.
Strategic architecture is unique to every company; if it were not so, then itcould be imitated and would not contribute to sustainable competitive advan-tage. It has already been discussed how value chain analysis did not fullydescribe Marks & Spencer because of the linkages between elements in the valuechain. The fact that Marks & Spencer found it extremely difficult to recover itscompetitive advantage suggests that tackling the individual elements in thevalue chain was not sufficient and that something fundamental had happenedto its strategic architecture.
While it is difficult to be precise about the components of strategic architecturesome insight into it should help the company identify which core competenciesto build. The attempt to be explicit about strategic architecture forces organi-sations to identify and commit to the technical and production linkages acrossSBUs that have the potential to create a distinct competitive advantage.
Strategic Planning Edinburgh Business School 6/49
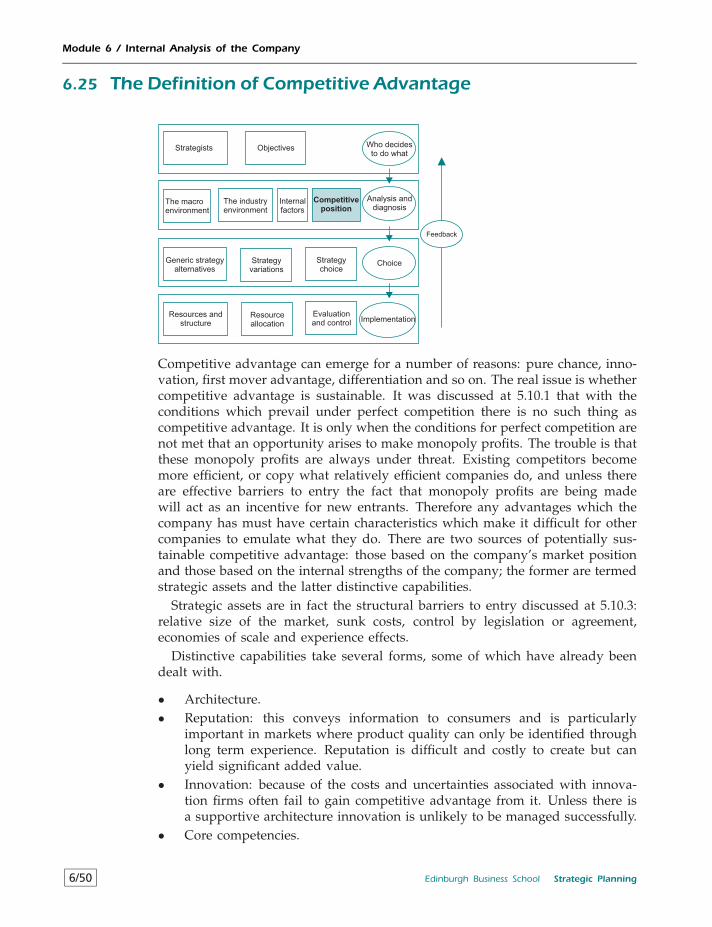
Module 6 / Internal Analysis of the Company
6.25 The Definition of Competitive Advantage
Strategists Objectives
The macroenvironment
The industryenvironment
Internalfactors
Competitiveposition
Generic strategyalternatives
Strategyvariations
Who decidesto do what
Analysis anddiagnosis
Choice
Implementation
Strategychoice
Resources andstructure
Resourceallocation
Evaluationand control
Feedback
Competitive advantage can emerge for a number of reasons: pure chance, inno-vation, first mover advantage, differentiation and so on. The real issue is whethercompetitive advantage is sustainable. It was discussed at 5.10.1 that with theconditions which prevail under perfect competition there is no such thing ascompetitive advantage. It is only when the conditions for perfect competition arenot met that an opportunity arises to make monopoly profits. The trouble is thatthese monopoly profits are always under threat. Existing competitors becomemore efficient, or copy what relatively efficient companies do, and unless thereare effective barriers to entry the fact that monopoly profits are being madewill act as an incentive for new entrants. Therefore any advantages which thecompany has must have certain characteristics which make it difficult for othercompanies to emulate what they do. There are two sources of potentially sus-tainable competitive advantage: those based on the company’s market positionand those based on the internal strengths of the company; the former are termedstrategic assets and the latter distinctive capabilities.
Strategic assets are in fact the structural barriers to entry discussed at 5.10.3:relative size of the market, sunk costs, control by legislation or agreement,economies of scale and experience effects.
Distinctive capabilities take several forms, some of which have already beendealt with.
• Architecture.• Reputation: this conveys information to consumers and is particularly
important in markets where product quality can only be identified throughlong term experience. Reputation is difficult and costly to create but canyield significant added value.
• Innovation: because of the costs and uncertainties associated with innova-tion firms often fail to gain competitive advantage from it. Unless there isa supportive architecture innovation is unlikely to be managed successfully.
• Core competencies.
6/50 Edinburgh Business School Strategic Planning
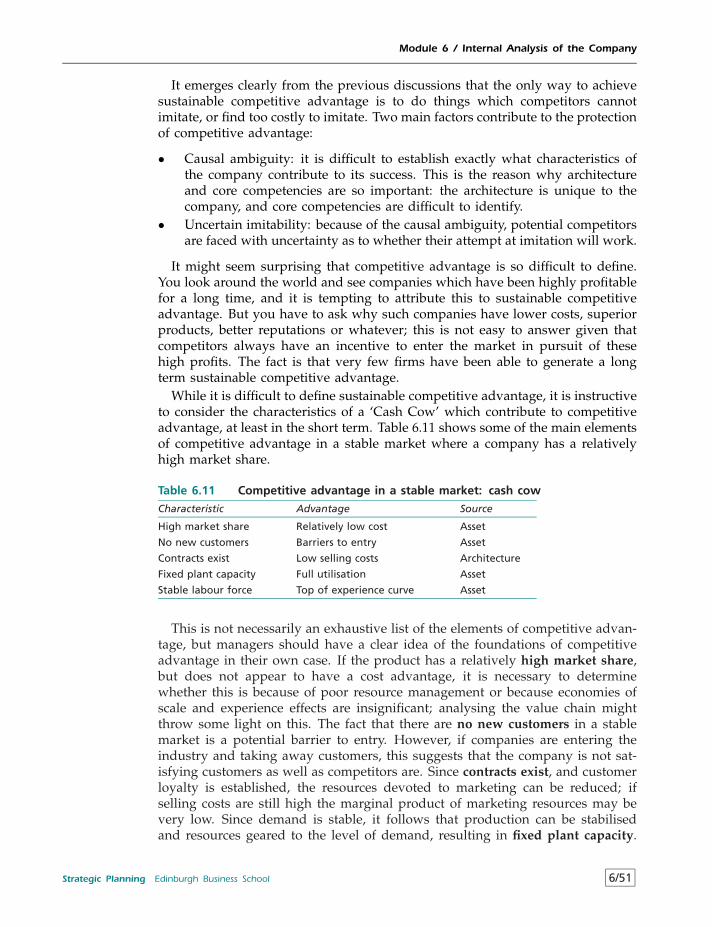
Module 6 / Internal Analysis of the Company
It emerges clearly from the previous discussions that the only way to achievesustainable competitive advantage is to do things which competitors cannotimitate, or find too costly to imitate. Two main factors contribute to the protectionof competitive advantage:
• Causal ambiguity: it is difficult to establish exactly what characteristics ofthe company contribute to its success. This is the reason why architectureand core competencies are so important: the architecture is unique to thecompany, and core competencies are difficult to identify.
• Uncertain imitability: because of the causal ambiguity, potential competitorsare faced with uncertainty as to whether their attempt at imitation will work.
It might seem surprising that competitive advantage is so difficult to define.You look around the world and see companies which have been highly profitablefor a long time, and it is tempting to attribute this to sustainable competitiveadvantage. But you have to ask why such companies have lower costs, superiorproducts, better reputations or whatever; this is not easy to answer given thatcompetitors always have an incentive to enter the market in pursuit of thesehigh profits. The fact is that very few firms have been able to generate a longterm sustainable competitive advantage.
While it is difficult to define sustainable competitive advantage, it is instructiveto consider the characteristics of a ‘Cash Cow’ which contribute to competitiveadvantage, at least in the short term. Table 6.11 shows some of the main elementsof competitive advantage in a stable market where a company has a relativelyhigh market share.
Table 6.11 Competitive advantage in a stable market: cash cow
Characteristic Advantage Source
High market share Relatively low cost Asset
No new customers Barriers to entry Asset
Contracts exist Low selling costs Architecture
Fixed plant capacity Full utilisation Asset
Stable labour force Top of experience curve Asset
This is not necessarily an exhaustive list of the elements of competitive advan-tage, but managers should have a clear idea of the foundations of competitiveadvantage in their own case. If the product has a relatively high market share,but does not appear to have a cost advantage, it is necessary to determinewhether this is because of poor resource management or because economies ofscale and experience effects are insignificant; analysing the value chain mightthrow some light on this. The fact that there are no new customers in a stablemarket is a potential barrier to entry. However, if companies are entering theindustry and taking away customers, this suggests that the company is not sat-isfying customers as well as competitors are. Since contracts exist, and customerloyalty is established, the resources devoted to marketing can be reduced; ifselling costs are still high the marginal product of marketing resources may bevery low. Since demand is stable, it follows that production can be stabilisedand resources geared to the level of demand, resulting in fixed plant capacity.
Strategic Planning Edinburgh Business School 6/51
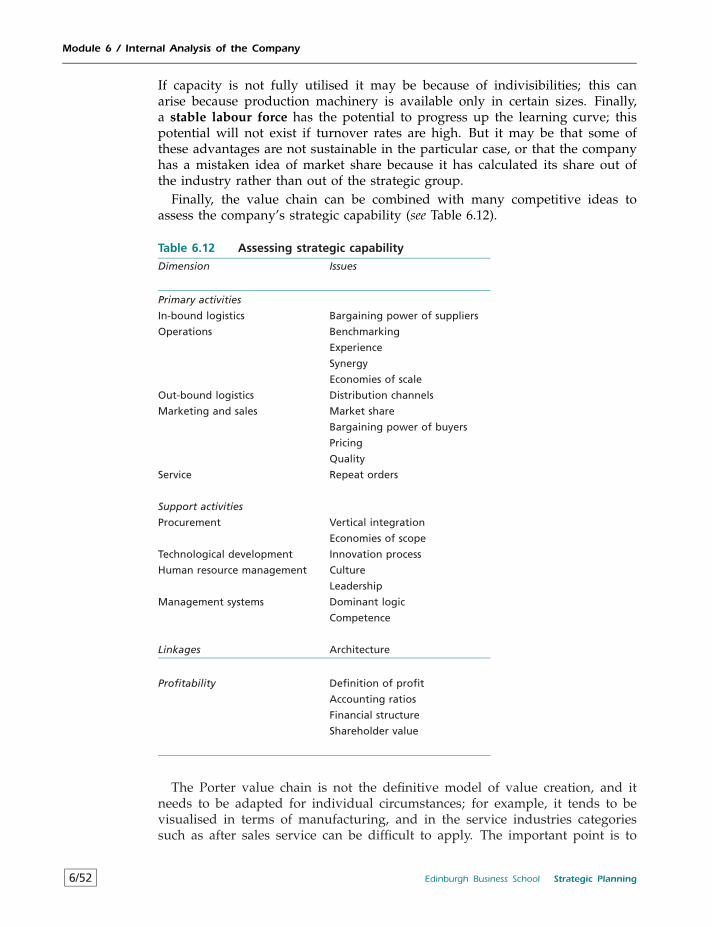
Module 6 / Internal Analysis of the Company
If capacity is not fully utilised it may be because of indivisibilities; this canarise because production machinery is available only in certain sizes. Finally,a stable labour force has the potential to progress up the learning curve; thispotential will not exist if turnover rates are high. But it may be that some ofthese advantages are not sustainable in the particular case, or that the companyhas a mistaken idea of market share because it has calculated its share out ofthe industry rather than out of the strategic group.
Finally, the value chain can be combined with many competitive ideas toassess the company’s strategic capability (see Table 6.12).
Table 6.12 Assessing strategic capability
Dimension Issues
Primary activities
In-bound logistics Bargaining power of suppliers
Operations Benchmarking
Experience
Synergy
Economies of scale
Out-bound logistics Distribution channels
Marketing and sales Market share
Bargaining power of buyers
Pricing
Quality
Service Repeat orders
Support activities
Procurement Vertical integration
Economies of scope
Technological development Innovation process
Human resource management Culture
Leadership
Management systems Dominant logic
Competence
Linkages Architecture
Profitability Definition of profit
Accounting ratios
Financial structure
Shareholder value
The Porter value chain is not the definitive model of value creation, and itneeds to be adapted for individual circumstances; for example, it tends to bevisualised in terms of manufacturing, and in the service industries categoriessuch as after sales service can be difficult to apply. The important point is to
6/52 Edinburgh Business School Strategic Planning
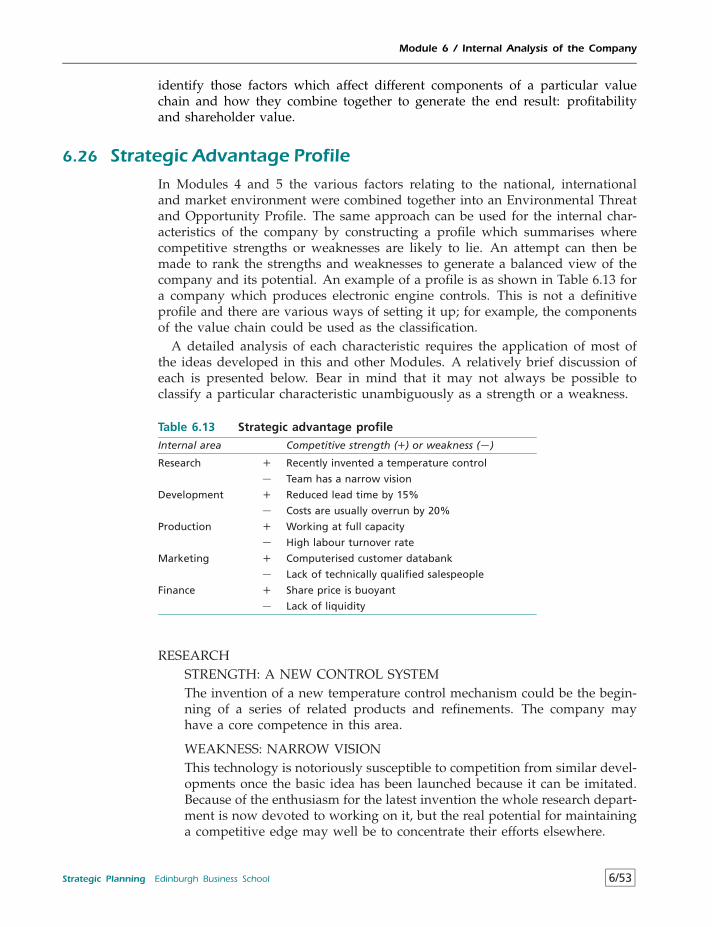
Module 6 / Internal Analysis of the Company
identify those factors which affect different components of a particular valuechain and how they combine together to generate the end result: profitabilityand shareholder value.
6.26 Strategic Advantage ProfileIn Modules 4 and 5 the various factors relating to the national, internationaland market environment were combined together into an Environmental Threatand Opportunity Profile. The same approach can be used for the internal char-acteristics of the company by constructing a profile which summarises wherecompetitive strengths or weaknesses are likely to lie. An attempt can then bemade to rank the strengths and weaknesses to generate a balanced view of thecompany and its potential. An example of a profile is as shown in Table 6.13 fora company which produces electronic engine controls. This is not a definitiveprofile and there are various ways of setting it up; for example, the componentsof the value chain could be used as the classification.
A detailed analysis of each characteristic requires the application of most ofthe ideas developed in this and other Modules. A relatively brief discussion ofeach is presented below. Bear in mind that it may not always be possible toclassify a particular characteristic unambiguously as a strength or a weakness.
Table 6.13 Strategic advantage profile
Internal area Competitive strength (+) or weakness (−)
Research + Recently invented a temperature control
− Team has a narrow vision
Development + Reduced lead time by 15%
− Costs are usually overrun by 20%
Production + Working at full capacity
− High labour turnover rate
Marketing + Computerised customer databank
− Lack of technically qualified salespeople
Finance + Share price is buoyant
− Lack of liquidity
RESEARCHSTRENGTH: A NEW CONTROL SYSTEMThe invention of a new temperature control mechanism could be the begin-ning of a series of related products and refinements. The company mayhave a core competence in this area.
WEAKNESS: NARROW VISIONThis technology is notoriously susceptible to competition from similar devel-opments once the basic idea has been launched because it can be imitated.Because of the enthusiasm for the latest invention the whole research depart-ment is now devoted to working on it, but the real potential for maintaininga competitive edge may well be to concentrate their efforts elsewhere.
Strategic Planning Edinburgh Business School 6/53
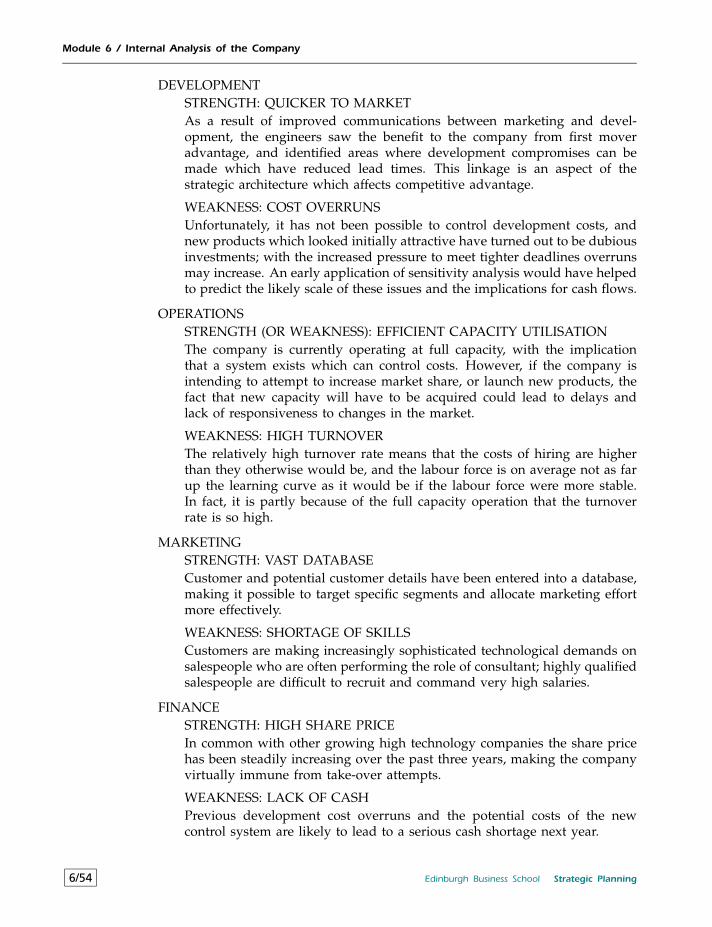
Module 6 / Internal Analysis of the Company
DEVELOPMENTSTRENGTH: QUICKER TO MARKETAs a result of improved communications between marketing and devel-opment, the engineers saw the benefit to the company from first moveradvantage, and identified areas where development compromises can bemade which have reduced lead times. This linkage is an aspect of thestrategic architecture which affects competitive advantage.
WEAKNESS: COST OVERRUNSUnfortunately, it has not been possible to control development costs, andnew products which looked initially attractive have turned out to be dubiousinvestments; with the increased pressure to meet tighter deadlines overrunsmay increase. An early application of sensitivity analysis would have helpedto predict the likely scale of these issues and the implications for cash flows.
OPERATIONSSTRENGTH (OR WEAKNESS): EFFICIENT CAPACITY UTILISATIONThe company is currently operating at full capacity, with the implicationthat a system exists which can control costs. However, if the company isintending to attempt to increase market share, or launch new products, thefact that new capacity will have to be acquired could lead to delays andlack of responsiveness to changes in the market.
WEAKNESS: HIGH TURNOVERThe relatively high turnover rate means that the costs of hiring are higherthan they otherwise would be, and the labour force is on average not as farup the learning curve as it would be if the labour force were more stable.In fact, it is partly because of the full capacity operation that the turnoverrate is so high.
MARKETINGSTRENGTH: VAST DATABASECustomer and potential customer details have been entered into a database,making it possible to target specific segments and allocate marketing effortmore effectively.
WEAKNESS: SHORTAGE OF SKILLSCustomers are making increasingly sophisticated technological demands onsalespeople who are often performing the role of consultant; highly qualifiedsalespeople are difficult to recruit and command very high salaries.
FINANCESTRENGTH: HIGH SHARE PRICEIn common with other growing high technology companies the share pricehas been steadily increasing over the past three years, making the companyvirtually immune from take-over attempts.
WEAKNESS: LACK OF CASHPrevious development cost overruns and the potential costs of the newcontrol system are likely to lead to a serious cash shortage next year.
6/54 Edinburgh Business School Strategic Planning
Module 6 / Internal Analysis of the Company
On the face of it the company is full of new ideas, is dynamic and growing,and has an increasing market value; it looks set to develop further on the basisof its new product line. However, the weaknesses are formidable: the likelyreliance on one product line in a highly competitive area, the unpredictabledevelopment costs, the problems of increasing capacity, the lack of marketingresources and the cash constraint could combine to render the company illiquidwith limited prospects of increasing sales revenues significantly in the shortterm.
Case 1: Analysing Company AccountsThe accounts in Table 6.14 refer to two separate years of AcmeSpend operationsreflecting the large investment undertaken to tool up for a new production line.You are going to have to analyse the company using only these numbers.
• Use financial ratios to compare company performance in the two yearspaying particular attention to the appropriate measure of profitability.
• Can it be deduced that the investment programme was responsible for anyincrease in profitability?
• What strategic implications can be drawn from the analysis?
Strategic Planning Edinburgh Business School 6/55
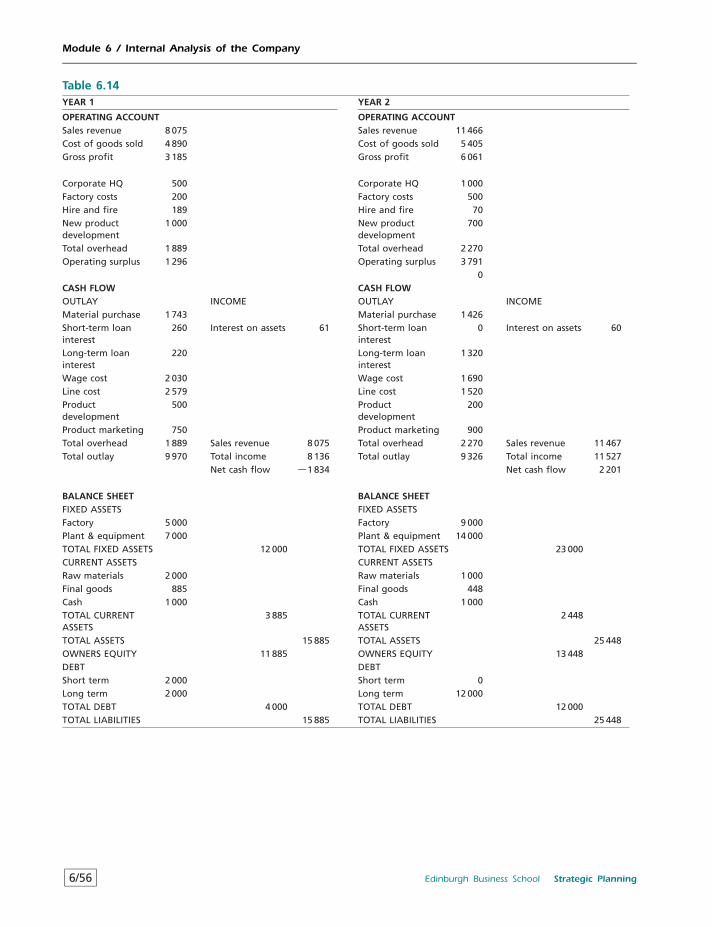
Module 6 / Internal Analysis of the Company
Table 6.14YEAR 1 YEAR 2
OPERATING ACCOUNT OPERATING ACCOUNTSales revenue 8 075 Sales revenue 11 466Cost of goods sold 4 890 Cost of goods sold 5 405Gross profit 3 185 Gross profit 6 061
Corporate HQ 500 Corporate HQ 1 000Factory costs 200 Factory costs 500Hire and fire 189 Hire and fire 70New productdevelopment
1 000 New productdevelopment
700
Total overhead 1 889 Total overhead 2 270Operating surplus 1 296 Operating surplus 3 791
0CASH FLOW CASH FLOWOUTLAY INCOME OUTLAY INCOMEMaterial purchase 1 743 Material purchase 1 426Short-term loaninterest
260 Interest on assets 61 Short-term loaninterest
0 Interest on assets 60
Long-term loaninterest
220 Long-term loaninterest
1 320
Wage cost 2 030 Wage cost 1 690Line cost 2 579 Line cost 1 520Productdevelopment
500 Productdevelopment
200
Product marketing 750 Product marketing 900Total overhead 1 889 Sales revenue 8 075 Total overhead 2 270 Sales revenue 11 467Total outlay 9 970 Total income 8 136 Total outlay 9 326 Total income 11 527
Net cash flow −1 834 Net cash flow 2 201
BALANCE SHEET BALANCE SHEETFIXED ASSETS FIXED ASSETSFactory 5 000 Factory 9 000Plant & equipment 7 000 Plant & equipment 14 000TOTAL FIXED ASSETS 12 000 TOTAL FIXED ASSETS 23 000CURRENT ASSETS CURRENT ASSETSRaw materials 2 000 Raw materials 1 000Final goods 885 Final goods 448Cash 1 000 Cash 1 000TOTAL CURRENTASSETS
3 885 TOTAL CURRENTASSETS
2 448
TOTAL ASSETS 15 885 TOTAL ASSETS 25 448OWNERS EQUITY 11 885 OWNERS EQUITY 13 448DEBT DEBTShort term 2 000 Short term 0Long term 2 000 Long term 12 000TOTAL DEBT 4 000 TOTAL DEBT 12 000TOTAL LIABILITIES 15 885 TOTAL LIABILITIES 25 448
6/56 Edinburgh Business School Strategic Planning
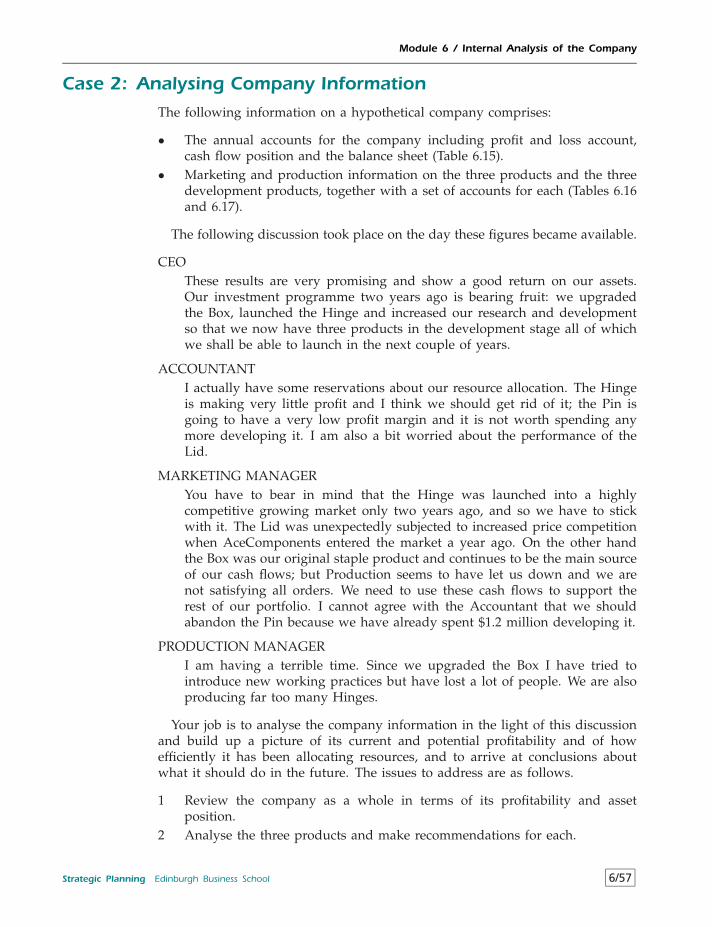
Module 6 / Internal Analysis of the Company
Case 2: Analysing Company Information
The following information on a hypothetical company comprises:
• The annual accounts for the company including profit and loss account,cash flow position and the balance sheet (Table 6.15).
• Marketing and production information on the three products and the threedevelopment products, together with a set of accounts for each (Tables 6.16and 6.17).
The following discussion took place on the day these figures became available.
CEOThese results are very promising and show a good return on our assets.Our investment programme two years ago is bearing fruit: we upgradedthe Box, launched the Hinge and increased our research and developmentso that we now have three products in the development stage all of whichwe shall be able to launch in the next couple of years.
ACCOUNTANTI actually have some reservations about our resource allocation. The Hingeis making very little profit and I think we should get rid of it; the Pin isgoing to have a very low profit margin and it is not worth spending anymore developing it. I am also a bit worried about the performance of theLid.
MARKETING MANAGERYou have to bear in mind that the Hinge was launched into a highlycompetitive growing market only two years ago, and so we have to stickwith it. The Lid was unexpectedly subjected to increased price competitionwhen AceComponents entered the market a year ago. On the other handthe Box was our original staple product and continues to be the main sourceof our cash flows; but Production seems to have let us down and we arenot satisfying all orders. We need to use these cash flows to support therest of our portfolio. I cannot agree with the Accountant that we shouldabandon the Pin because we have already spent $1.2 million developing it.
PRODUCTION MANAGERI am having a terrible time. Since we upgraded the Box I have tried tointroduce new working practices but have lost a lot of people. We are alsoproducing far too many Hinges.
Your job is to analyse the company information in the light of this discussionand build up a picture of its current and potential profitability and of howefficiently it has been allocating resources, and to arrive at conclusions aboutwhat it should do in the future. The issues to address are as follows.
1 Review the company as a whole in terms of its profitability and assetposition.
2 Analyse the three products and make recommendations for each.
Strategic Planning Edinburgh Business School 6/57
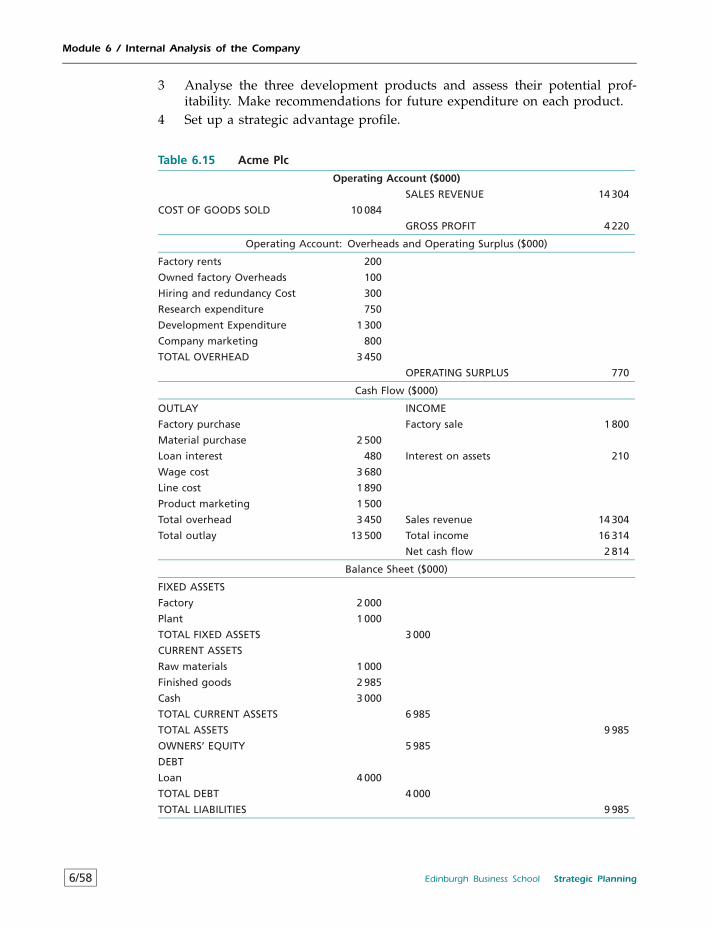
Module 6 / Internal Analysis of the Company
3 Analyse the three development products and assess their potential prof-itability. Make recommendations for future expenditure on each product.
4 Set up a strategic advantage profile.
Table 6.15 Acme Plc
Operating Account ($000)
SALES REVENUE 14 304
COST OF GOODS SOLD 10 084
GROSS PROFIT 4 220
Operating Account: Overheads and Operating Surplus ($000)
Factory rents 200
Owned factory Overheads 100
Hiring and redundancy Cost 300
Research expenditure 750
Development Expenditure 1 300
Company marketing 800
TOTAL OVERHEAD 3 450
OPERATING SURPLUS 770
Cash Flow ($000)
OUTLAY INCOME
Factory purchase Factory sale 1 800
Material purchase 2 500
Loan interest 480 Interest on assets 210
Wage cost 3 680
Line cost 1 890
Product marketing 1 500
Total overhead 3 450 Sales revenue 14 304
Total outlay 13 500 Total income 16 314
Net cash flow 2 814
Balance Sheet ($000)
FIXED ASSETS
Factory 2 000
Plant 1 000
TOTAL FIXED ASSETS 3 000
CURRENT ASSETS
Raw materials 1 000
Finished goods 2 985
Cash 3 000
TOTAL CURRENT ASSETS 6 985
TOTAL ASSETS 9 985
OWNERS’ EQUITY 5 985
DEBT
Loan 4 000
TOTAL DEBT 4 000
TOTAL LIABILITIES 9 985
6/58 Edinburgh Business School Strategic Planning
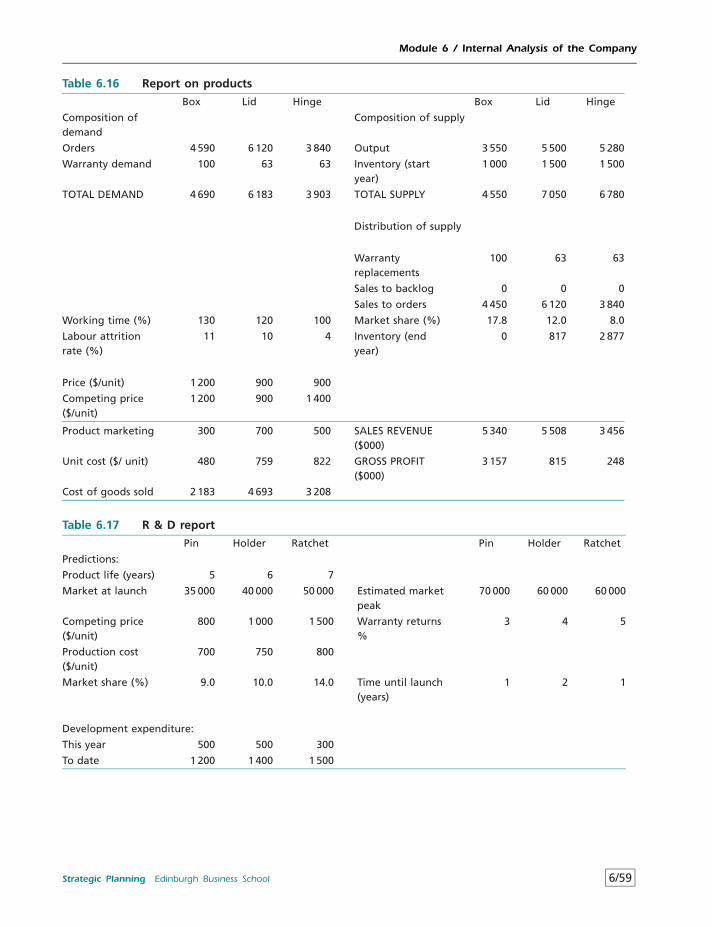
Module 6 / Internal Analysis of the Company
Table 6.16 Report on products
Box Lid Hinge Box Lid Hinge
Composition ofdemand
Composition of supply
Orders 4 590 6 120 3 840 Output 3 550 5 500 5 280
Warranty demand 100 63 63 Inventory (startyear)
1 000 1 500 1 500
TOTAL DEMAND 4 690 6 183 3 903 TOTAL SUPPLY 4 550 7 050 6 780
Distribution of supply
Warrantyreplacements
100 63 63
Sales to backlog 0 0 0
Sales to orders 4 450 6 120 3 840
Working time (%) 130 120 100 Market share (%) 17.8 12.0 8.0
Labour attritionrate (%)
11 10 4 Inventory (endyear)
0 817 2 877
Price ($/unit) 1 200 900 900
Competing price($/unit)
1 200 900 1 400
Product marketing 300 700 500 SALES REVENUE($000)
5 340 5 508 3 456
Unit cost ($/ unit) 480 759 822 GROSS PROFIT($000)
3 157 815 248
Cost of goods sold 2 183 4 693 3 208
Table 6.17 R & D report
Pin Holder Ratchet Pin Holder Ratchet
Predictions:
Product life (years) 5 6 7
Market at launch 35 000 40 000 50 000 Estimated marketpeak
70 000 60 000 60 000
Competing price($/unit)
800 1 000 1 500 Warranty returns%
3 4 5
Production cost($/unit)
700 750 800
Market share (%) 9.0 10.0 14.0 Time until launch(years)
1 2 1
Development expenditure:
This year 500 500 300
To date 1 200 1 400 1 500
Strategic Planning Edinburgh Business School 6/59
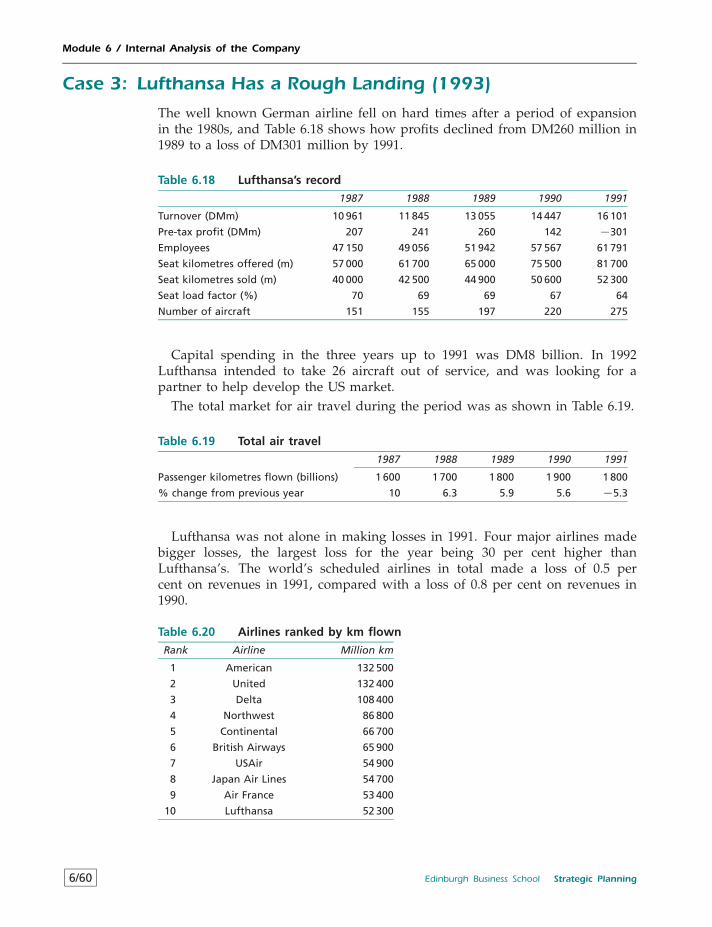
Module 6 / Internal Analysis of the Company
Case 3: Lufthansa Has a Rough Landing (1993)
The well known German airline fell on hard times after a period of expansionin the 1980s, and Table 6.18 shows how profits declined from DM260 million in1989 to a loss of DM301 million by 1991.
Table 6.18 Lufthansa’s record
1987 1988 1989 1990 1991
Turnover (DMm) 10 961 11 845 13 055 14 447 16 101
Pre-tax profit (DMm) 207 241 260 142 −301
Employees 47 150 49 056 51 942 57 567 61 791
Seat kilometres offered (m) 57 000 61 700 65 000 75 500 81 700
Seat kilometres sold (m) 40 000 42 500 44 900 50 600 52 300
Seat load factor (%) 70 69 69 67 64
Number of aircraft 151 155 197 220 275
Capital spending in the three years up to 1991 was DM8 billion. In 1992Lufthansa intended to take 26 aircraft out of service, and was looking for apartner to help develop the US market.
The total market for air travel during the period was as shown in Table 6.19.
Table 6.19 Total air travel
1987 1988 1989 1990 1991
Passenger kilometres flown (billions) 1 600 1 700 1 800 1 900 1 800
% change from previous year 10 6.3 5.9 5.6 −5.3
Lufthansa was not alone in making losses in 1991. Four major airlines madebigger losses, the largest loss for the year being 30 per cent higher thanLufthansa’s. The world’s scheduled airlines in total made a loss of 0.5 percent on revenues in 1991, compared with a loss of 0.8 per cent on revenues in1990.
Table 6.20 Airlines ranked by km flown
Rank Airline Million km
1 American 132 500
2 United 132 400
3 Delta 108 400
4 Northwest 86 800
5 Continental 66 700
6 British Airways 65 900
7 USAir 54 900
8 Japan Air Lines 54 700
9 Air France 53 400
10 Lufthansa 52 300
6/60 Edinburgh Business School Strategic Planning
Module 6 / Internal Analysis of the Company
Lufthansa was the tenth largest airline in the world by 1991 in terms of thenumber of passenger kilometres travelled (excluding Aeroflot). However, it issmall (40 per cent) in comparison with the large US carriers American andUnited (Table 6.20).
Question
Analyse the Lufthansa strategy, assess why it is making losses, and suggest whatit might do in the future.
Case 4: General Motors: the Story of an Empire (1998)By 1998 General Motors was still one of the biggest companies in the world,with over 600 000 employees and sales of over $160 billion. The company hadan important impact on management and industrial organisation during thetwentieth century, primarily because of the foresight of its founder, AlfredSloan. During the 1920s Sloan was the first to introduce a divisional typestructure whereby the company was decentralised and the individual parts weresubjected to detailed control systems. GM was also vertically integrated, makingmost of the components which went into its cars. The company was the modelfor the management theorist Peter Drucker who did much of the pioneeringwork in management theory during the 1940s.
But for the past decade industry analysts have criticised GM. The company’sperformance on the stock exchange suggests that it has lost its competitive edge.Until the mid 1980s GM’s share price moved broadly in line with the market,but since then it has fallen increasingly far behind the Dow Jones Index, and isnow about 70% below. Analysts claim that the total value of GM’s shares canin fact be accounted for by its parts company (Delphi), its financing company(GMAC) and by its 75% stake in Hughes Electronics. This suggests that GM’sindustrial operation is itself worth very little to shareholders.
How could such a mighty industrial enterprise reach such a state?One of the original strengths of GM, its divisional structure, has resulted in
the duplication of many functions, such as marketing and development, withthe result that GM’s competitive advantage has been undermined over the yearsas world trade in cars has become increasingly open. In fact, GM has comein for a good deal of criticism over the years, for example its labour relationscould be greatly improved: in the four years to 1998 GM suffered about 12major strikes, while Ford had one; during 1998 it was claimed that one strikealone cost GM $2 billion. It has been relatively slow to introduce new productsand it has been slow to react to changing market circumstances, with executivesseemingly relying on the sheer size of the organisation to shelter behind.
One objective measure of car company performance is the time it takes toproduce a car, as shown in Figure 6.9.
To some extent these differences can be accounted for by the type of product.For example, a substantial part of GM’s output is for luxury cars. However, thefact that GM’s labour input per car is over 10% greater than Ford’s is clearly aproblem.
Strategic Planning Edinburgh Business School 6/61
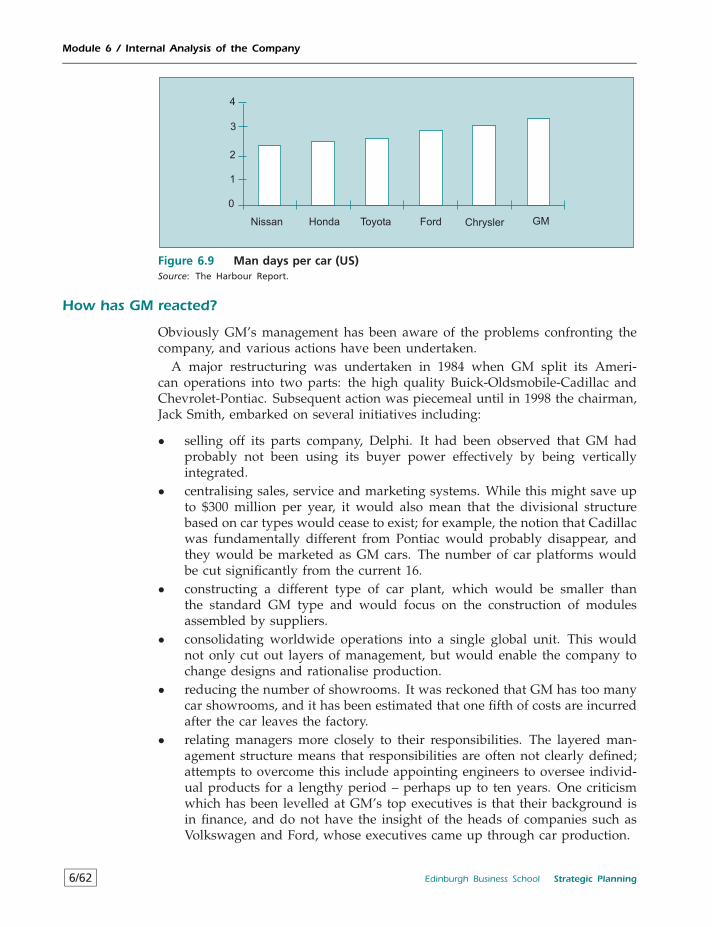
Module 6 / Internal Analysis of the Company
Nissan Honda Toyota Ford Chrysler GM
0
1
2
3
4
Figure 6.9 Man days per car (US)Source: The Harbour Report.
How has GM reacted?
Obviously GM’s management has been aware of the problems confronting thecompany, and various actions have been undertaken.
A major restructuring was undertaken in 1984 when GM split its Ameri-can operations into two parts: the high quality Buick-Oldsmobile-Cadillac andChevrolet-Pontiac. Subsequent action was piecemeal until in 1998 the chairman,Jack Smith, embarked on several initiatives including:
• selling off its parts company, Delphi. It had been observed that GM hadprobably not been using its buyer power effectively by being verticallyintegrated.
• centralising sales, service and marketing systems. While this might save upto $300 million per year, it would also mean that the divisional structurebased on car types would cease to exist; for example, the notion that Cadillacwas fundamentally different from Pontiac would probably disappear, andthey would be marketed as GM cars. The number of car platforms wouldbe cut significantly from the current 16.
• constructing a different type of car plant, which would be smaller thanthe standard GM type and would focus on the construction of modulesassembled by suppliers.
• consolidating worldwide operations into a single global unit. This wouldnot only cut out layers of management, but would enable the company tochange designs and rationalise production.
• reducing the number of showrooms. It was reckoned that GM has too manycar showrooms, and it has been estimated that one fifth of costs are incurredafter the car leaves the factory.
• relating managers more closely to their responsibilities. The layered man-agement structure means that responsibilities are often not clearly defined;attempts to overcome this include appointing engineers to oversee individ-ual products for a lengthy period – perhaps up to ten years. One criticismwhich has been levelled at GM’s top executives is that their background isin finance, and do not have the insight of the heads of companies such asVolkswagen and Ford, whose executives came up through car production.
6/62 Edinburgh Business School Strategic Planning
Module 6 / Internal Analysis of the Company
Not everyone is convinced that these changes have a sound business rationale,but are the outcome of senior executives jockeying for position. For example,the marketing changes could be seen as a victory for Ron Zarrella, the head ofmarketing; the globalisation initiative as a victory for Rick Wagoner, who is dueto succeed Jack Smith, over Lou Hughes, head of international operations.
An important question is not whether GM is able to restructure, but whetherits efforts will bring it up with its competitors. Volkswagen is Europe’s largestcar manufacturer, and it has already reduced the number of platforms to four,while even seemingly totally different cars share many components. GM’s greatrival Ford initiated a global integration programme in 1994 which is thoughtto have saved Ford $3 billion per year. But it is widely recognised that theFord programme was successful only because of the commitment of its chiefexecutive, Scotsman Alex Trotman. Many doubt whether GM’s bureaucraticstructure can deliver such fundamental changes. Another major problem is theconfrontational style of management, which has led to the strikes in recent years;in October 1998 GM announced that it would be shedding 25 000 employees,of whom 20 000 would be in the US; it was estimated that some 10 000 of theUS jobs would come from middle management. The prospects for a successfulchange programme do not seem too bright.
Perhaps the greatest challenge facing GM is to ensure that it continues tomake cars which people will wish to buy in preference to others. In the faceof increased competition, and the high standards of reliability common in carsnowadays, this is becoming difficult. A good example is the experience of theCadillac model, which has a worldwide reputation as a luxury car. GM used tosell 300 000 Cadillacs each year in America, but this has slumped to 200 000 in thepast decade; during the 1980s Cadillac was overtaken by Mercedes, BMW andToyota (Lexus) which, for one thing, highlighted the Cadillac’s poor reliability.During the mid 1980s Cadillac responded by building smaller cars, many ofwhich were in fact indistinguishable from the humbler Buick range. Lincoln isnow America’s top selling luxury brand, it has consolidated its position by beingone of the first in the market with a sport-utility vehicle. Cadillac now facesthe problem of producing cars which appeal to new, and younger, customers aswell as its existing older customers. This will not be easy.
Question
Discuss GM’s reaction to the changing competitive environment using strategicmodels.
References
1 Cooper, R. and Kaplan, R.S. (1987) ‘How cost accounting systematically distortsproduct costs’, in Bruns, W.J. and Kaplan, R.S. (eds) Accounting and Management: FieldStudy Perspectives, HBR Press.
2 Kaplan, R.S. (1984) ‘Yesterday’s accounting undermines production’, Harvard BusinessReview, July–August.
Strategic Planning Edinburgh Business School 6/63
Module 6 / Internal Analysis of the Company
3 Kaplan, R.S. (1988) ‘One cost system isn’t enough’, Harvard Business Review, January–February.
4 Smith, T. (1996) Accounting for Growth, Random House (second edition).
5 D’Aveni, R. (1994) Hypercompetition: Managing the Dynamics of Strategic Manoeuvering,New York: Free Press.
6 Mansfield, E. et al. (1977) ‘Social and private rates of return from industrial innova-tions’, Quarterly Journal of Economics, Vol. 19.
7 Handy, C. (1993) Understanding Organisations, 4th edition, Penguin.
8 Porter, M.E. (1985) Competitive Advantage: Creating and Sustaining Superior Performance.New York: Free Press.
9 Jensen, M.C. and Ruback, R.S. (1983) ‘The market for corporate control: the scientificevidence’, Journal of Financial Economics 11, pp. 5–50.
10 Ansoff, H.I. (1968) Corporate Strategy, Harmondsworth: Penguin.
11 Fuller, R.B. (1975) Synergetics, Macmillan.
12 Mahajan, V. and Wind, Y. (1988) ‘Business synergy does not always pay off’, LongRange Planning, Vol. 2, No. 1.
13 Chiesa, V. and Manzini, R. (1997) ‘Competence Based Diversification’, Long RangePlanning, Vol 30, No 2, pp. 209–217.
6/64 Edinburgh Business School Strategic Planning
Module 7
Making Choices among Strategies
Contents
7.1 A Structure for Rational Choice 7/2
7.2 Strengths, Weaknesses, Opportunities and Threats 7/3
7.3 Generic Strategies 7/57.3.1 Corporate Level Generic Options 7/57.3.2 Business Level Generic Options 7/117.3.3 Decision Maker Generic Strategies 7/147.3.4 Generic Strategies and Company Performance 7/16
7.4 Identifying Strategic Variations 7/177.4.1 Related and Unrelated Options 7/177.4.2 Vertical Integration 7/197.4.3 Acquisitions 7/197.4.4 Alliances and Joint Ventures 7/237.4.5 International Expansion 7/237.4.6 From Generics to Options 7/25
7.5 Strategy Choice 7/267.5.1 Shareholder Wealth 7/277.5.2 Performance Gaps 7/307.5.3 Corporate Management 7/307.5.4 SBU Management 7/337.5.5 Risk and Uncertainty Analysis 7/347.5.6 Managerial Perceptions 7/387.5.7 From SWOT to Generics 7/42
Case 1: Revisit Salmon Farming 7/43
Case 2: Revisit Lymeswold 7/43
Case 3: Revisit a Prestigious Price War 7/43
Case 4: Revisit General Motors 7/43
Case 5: The Rise and Fall of Amstrad (1993) 7/44
Case 6: What Is a Jaguar Worth? (1992) 7/44
Case 7: Good Morning Television Has a Bad Day (1993) 7/45
Case 8: The Rise and Fall of Brands (1996) 7/48
Strategic Planning Edinburgh Business School 7/1
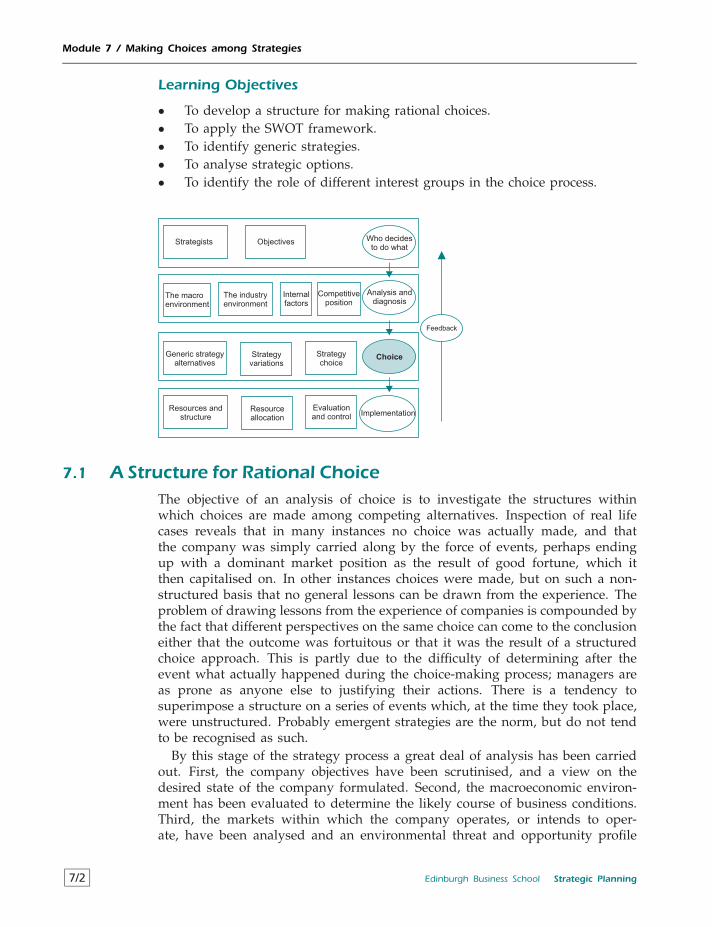
Module 7 / Making Choices among Strategies
Learning Objectives
• To develop a structure for making rational choices.• To apply the SWOT framework.• To identify generic strategies.• To analyse strategic options.• To identify the role of different interest groups in the choice process.
Strategists Objectives
The macroenvironment
The industryenvironment
Internalfactors
Competitiveposition
Generic strategyalternatives
Strategyvariations
Who decidesto do what
Analysis anddiagnosis
Choice
Implementation
Strategychoice
Resources andstructure
Resourceallocation
Evaluationand control
Feedback
7.1 A Structure for Rational ChoiceThe objective of an analysis of choice is to investigate the structures withinwhich choices are made among competing alternatives. Inspection of real lifecases reveals that in many instances no choice was actually made, and thatthe company was simply carried along by the force of events, perhaps endingup with a dominant market position as the result of good fortune, which itthen capitalised on. In other instances choices were made, but on such a non-structured basis that no general lessons can be drawn from the experience. Theproblem of drawing lessons from the experience of companies is compounded bythe fact that different perspectives on the same choice can come to the conclusioneither that the outcome was fortuitous or that it was the result of a structuredchoice approach. This is partly due to the difficulty of determining after theevent what actually happened during the choice-making process; managers areas prone as anyone else to justifying their actions. There is a tendency tosuperimpose a structure on a series of events which, at the time they took place,were unstructured. Probably emergent strategies are the norm, but do not tendto be recognised as such.
By this stage of the strategy process a great deal of analysis has been carriedout. First, the company objectives have been scrutinised, and a view on thedesired state of the company formulated. Second, the macroeconomic environ-ment has been evaluated to determine the likely course of business conditions.Third, the markets within which the company operates, or intends to oper-ate, have been analysed and an environmental threat and opportunity profile
7/2 Edinburgh Business School Strategic Planning
Module 7 / Making Choices among Strategies
constructed. Fourth, the company itself has been examined, and a strategicadvantage profile drawn up. However, no matter how detailed and sophisti-cated the analysis has been, it has not generated an automatic course of action;what the analysis will have done is to identify many relevant factors and esti-mate their relative importance, thus providing the basis on which an informedchoice can be made.
Evolutionary extensions of the satisficing theme suggest that, by trial and error,some management teams may succeed in developing sets of strategic themes andtactical routines that match the current environment rather well. Other teams,which experiment with different decision rules, may fail to generate adequatereturns. If the business environment changes, we should not presume that aformerly successful organisation will come up with – we might say mutate – anew set of procedures that will serve it so well. In a sense, then, we may liken thefirm’s decision rules to genes, with the environment selecting out some corporategenes and allowing others to survive, not because they are the fittest but becausethere is sufficient space for them in the competitive market.1
7.2 Strengths, Weaknesses, Opportunities and Threats
The profiles of environmental threats and opportunities, and company strengthsand weaknesses, can be combined together to identify where matches occurbetween the two. This is known as an analysis of strengths, weaknesses, oppor-tunities and threats (SWOT). For example, a threat might have been identifiedas a result of the entry of foreign competition due to the relaxation of tradebarriers; corresponding to this might be a weakness in company marketing,where the sales force has recently been depleted and the distribution systemis already having difficulty in delivering orders on time. SWOT analysis is anessential first step in assessing what the company needs to do to protect itscurrent market position, and in identifying potential strategic thrusts which cancapitalise on company strengths and market opportunities.
The framework for matching up environmental and company characteristicswill depend on the individual case; the SAP described at 6.26 can be used as astarting point. Assume that an opportunity (from the ETOP) has been identifiedin the form of a government decision to reduce investment in railways andincrease investment in the road network; one of the main markets for the newengine control is in very large trucks. A threat is the relaxation of trade barriers.This sector of the market will therefore start to grow faster in the near future.Which of the strengths and weaknesses shown in Table 7.1 matches with theopportunity?
The company has a strength in the potential to be among the first on themarket with an improved product, based on the new temperature control and therecent reduction in development lead times. However, production is a weaknessin that capacity will require to be increased and labour productivity improved.On the marketing side, while the ability to identify potential customers is astrength, the shortage of personnel actually to do the selling is a weakness.Company finance comprises a potential weakness: development costs are likelyto be high (due to overruns), investment will be required in additional productive
Strategic Planning Edinburgh Business School 7/3
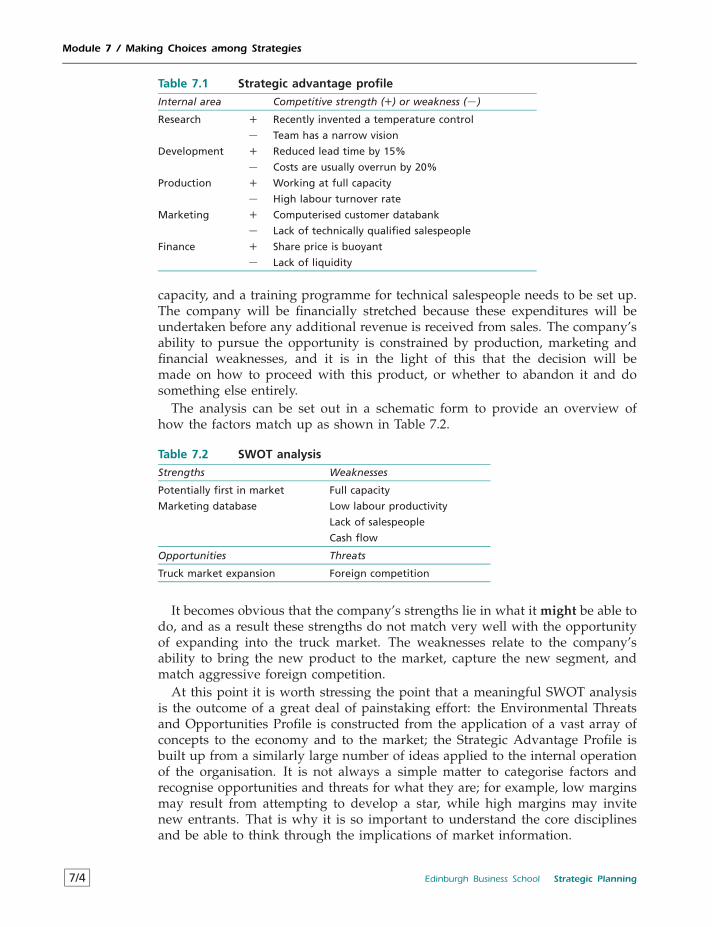
Module 7 / Making Choices among Strategies
Table 7.1 Strategic advantage profile
Internal area Competitive strength (+) or weakness (−)
Research + Recently invented a temperature control
− Team has a narrow vision
Development + Reduced lead time by 15%
− Costs are usually overrun by 20%
Production + Working at full capacity
− High labour turnover rate
Marketing + Computerised customer databank
− Lack of technically qualified salespeople
Finance + Share price is buoyant
− Lack of liquidity
capacity, and a training programme for technical salespeople needs to be set up.The company will be financially stretched because these expenditures will beundertaken before any additional revenue is received from sales. The company’sability to pursue the opportunity is constrained by production, marketing andfinancial weaknesses, and it is in the light of this that the decision will bemade on how to proceed with this product, or whether to abandon it and dosomething else entirely.
The analysis can be set out in a schematic form to provide an overview ofhow the factors match up as shown in Table 7.2.
Table 7.2 SWOT analysis
Strengths Weaknesses
Potentially first in market Full capacity
Marketing database Low labour productivity
Lack of salespeople
Cash flow
Opportunities Threats
Truck market expansion Foreign competition
It becomes obvious that the company’s strengths lie in what it might be able todo, and as a result these strengths do not match very well with the opportunityof expanding into the truck market. The weaknesses relate to the company’sability to bring the new product to the market, capture the new segment, andmatch aggressive foreign competition.
At this point it is worth stressing the point that a meaningful SWOT analysisis the outcome of a great deal of painstaking effort: the Environmental Threatsand Opportunities Profile is constructed from the application of a vast array ofconcepts to the economy and to the market; the Strategic Advantage Profile isbuilt up from a similarly large number of ideas applied to the internal operationof the organisation. It is not always a simple matter to categorise factors andrecognise opportunities and threats for what they are; for example, low marginsmay result from attempting to develop a star, while high margins may invitenew entrants. That is why it is so important to understand the core disciplinesand be able to think through the implications of market information.
7/4 Edinburgh Business School Strategic Planning
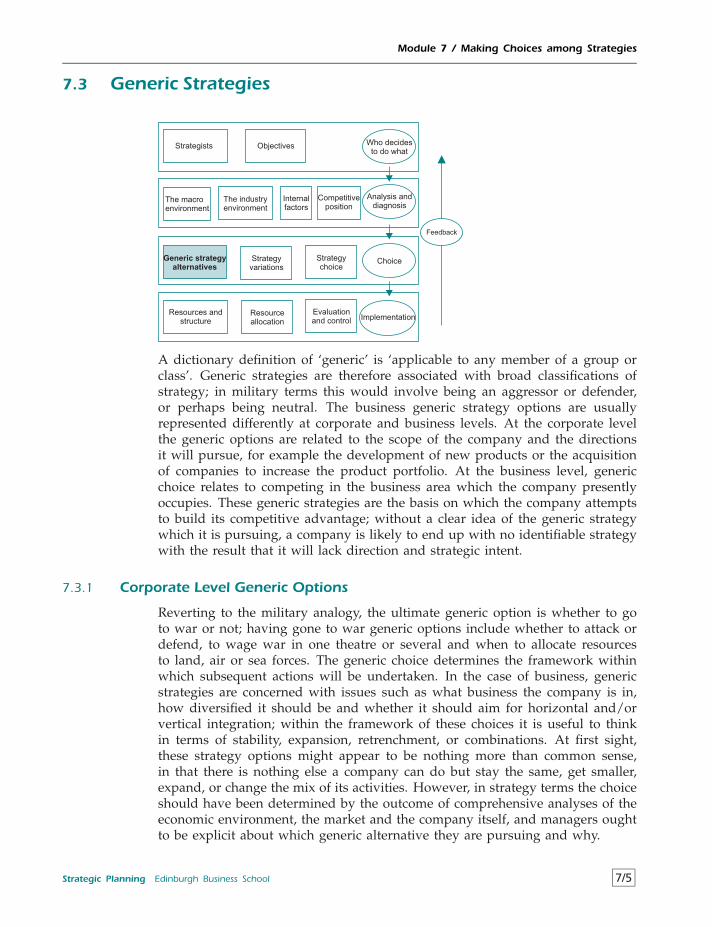
Module 7 / Making Choices among Strategies
7.3 Generic Strategies
Strategists Objectives
The macroenvironment
The industryenvironment
Internalfactors
Competitiveposition
Generic strategyalternatives
Strategyvariations
Who decidesto do what
Analysis anddiagnosis
Choice
Implementation
Strategychoice
Resources andstructure
Resourceallocation
Evaluationand control
Feedback
A dictionary definition of ‘generic’ is ‘applicable to any member of a group orclass’. Generic strategies are therefore associated with broad classifications ofstrategy; in military terms this would involve being an aggressor or defender,or perhaps being neutral. The business generic strategy options are usuallyrepresented differently at corporate and business levels. At the corporate levelthe generic options are related to the scope of the company and the directionsit will pursue, for example the development of new products or the acquisitionof companies to increase the product portfolio. At the business level, genericchoice relates to competing in the business area which the company presentlyoccupies. These generic strategies are the basis on which the company attemptsto build its competitive advantage; without a clear idea of the generic strategywhich it is pursuing, a company is likely to end up with no identifiable strategywith the result that it will lack direction and strategic intent.
7.3.1 Corporate Level Generic Options
Reverting to the military analogy, the ultimate generic option is whether to goto war or not; having gone to war generic options include whether to attack ordefend, to wage war in one theatre or several and when to allocate resourcesto land, air or sea forces. The generic choice determines the framework withinwhich subsequent actions will be undertaken. In the case of business, genericstrategies are concerned with issues such as what business the company is in,how diversified it should be and whether it should aim for horizontal and/orvertical integration; within the framework of these choices it is useful to thinkin terms of stability, expansion, retrenchment, or combinations. At first sight,these strategy options might appear to be nothing more than common sense,in that there is nothing else a company can do but stay the same, get smaller,expand, or change the mix of its activities. However, in strategy terms the choiceshould have been determined by the outcome of comprehensive analyses of theeconomic environment, the market and the company itself, and managers oughtto be explicit about which generic alternative they are pursuing and why.
Strategic Planning Edinburgh Business School 7/5
Module 7 / Making Choices among Strategies
The definition of the generic options of stability, expansion and retrenchmentraises a number of problems because there are so many dimensions of companyperformance. By and large, these ideas relate to the scale and scope of a com-pany’s operations. For example, for a single product company expansion can bedefined as attempting to increase market share, and hence total revenue; a moreambiguous case would be the attempt to increase total revenue by increasing thequality and the price of the product, which could lead to a lower volume of out-put and hence lower market share. For a multiple product company expansionrelates to the revenues from the individual products, together with the introduc-tion of new products. It is important to be clear about what the strategy optionsare NOT. For example, an expansion strategy cannot be defined as increasingprofitability, which can be the outcome of the efficiency with which the com-pany has achieved its objectives. Increased profitability could be achieved bycontracting the company’s activities, and therefore could be associated with aretrenchment generic strategy. The generic strategy is one of the means by whichthe end of profitability may be achieved.
Stability
The initial inclination is to regard this as being ‘no change’; however, the fact thatmanagers do not perceive objectives in terms of increasing markets, introducingnew products or acquiring new businesses, does not mean that the company isin a steady state. An analysis of external and internal factors may have revealedone or more of the following.
RELATIVELY SMALL PERFORMANCE GAPThe matching of the strategic advantage profile to the environmental threatand opportunity profile may have revealed that desired and actual stateswould converge without any significant change to the company’s policies.
MARKETS ARE MATUREPortfolio analysis may have revealed that current markets are no longer intheir growth stage, and that further expansion of market share is unlikelyto pay dividends. Analysis of product life cycles may have revealed thatcurrent products have relatively long life cycles, and that in the meantimethere is no need to invest in new products to take their place.
INTERNAL WEAKNESSESAn analysis of the efficiency with which the company allocates its resourcesmay have revealed that production processes are based on out of dateequipment, that inventories could be reduced, that inadequate training isbeing undertaken and that labour productivity is falling. As a result unitcosts are higher than they need be, and if the company were to embarkon expansion it would rapidly find itself at a cost disadvantage comparedwith its competitors. The stability strategy is therefore primarily concernedwith increasing efficiency, investment in labour-saving capital items, theintroduction of just-in-time procedures, and other actions which will bringcosts under control.
7/6 Edinburgh Business School Strategic Planning

Module 7 / Making Choices among Strategies
UNSTABLE FINANCIAL HISTORYThe previous record of the company may have been characterised by markedswings in profitability and dividends paid to shareholders. As a resultmanagers may feel that the share price is not a proper reflection of the truevalue of the company, and that there is a danger of hostile take-over. Oneway to generate a stable track record may be to make no significant changesin company objectives and operations.
POOR ECONOMIC PROSPECTSAnalysis of the national and international economy may have revealed thatthe business cycle is on the downturn, that markets are likely to decrease,and the company should prepare itself for increased competitive pressureas competitors attempt to maintain their competitive position.
COMPETITIVE THREATThe elimination of trade barriers may have opened up the prospect ofincreased competition from foreign companies who are known to be moreefficient at marketing and producing quality goods on time. Managers mayconsider that the company has to marshal its resources in order to meetthis perceived threat, rather than dissipating them on relatively unknownprospects.
PERCEIVED COSTS OF CHANGEExpansion is usually associated with change, and individuals are oftenaverse to change in organisations. One way of attempting to avoid thepainful effects of change is to pursue a strategy of stability. The trouble isthat stability does not guarantee a static organisation, and many companieshave found that they must initiate significant changes merely to maintaintheir market position. The generic strategy may be pursued for the wrongreason; the longer such a philosophy survives in a company the moredifficult it will become to introduce the changes which will ultimately beforced on it.
MANAGERS AVERSE TO RISKManagers may feel that the prospect of loss greatly outweighs potentialgains from expansion. If the company is already perceived as being suc-cessful, there is a decided attraction to carrying on with what has been donein the past rather than embarking on new enterprises.
Even to maintain their market position is an achievement for many companiesin a rapidly changing competitive environment. In fact, at any one time thegreat majority of companies are likely to be pursuing a generic strategy ofstability. This might well be accompanied by substantial internal changes whichare necessary in order to maintain market position. The list of reasons abovesuggests that stability is not necessarily a trivial option.
Expansion
It is to be expected that a generic strategy may be forced on a company by thecourse of events: for example, portfolio analysis may have revealed that markets
Strategic Planning Edinburgh Business School 7/7
Module 7 / Making Choices among Strategies
for most products are still in the growth stage and that it is necessary to expandin order to maintain market shares. There are several reasons why a companymay actively pursue a strategy of generic expansion.
DIVERSIFYING RISKIt may be felt that an increased portfolio of products reduces the risk forthe company as a whole. Whether diversification actually does reduce therisks facing the company is another matter; some of the issues relatingto diversification of risk were discussed at 6.20. Whatever the rights andwrongs of this method of dealing with risk, there is no doubt that the desireto diversify risk gives management a strong motivation to expand.
SEARCHING FOR COMPETENCIESA line of business may fit with the perceived competencies of the company,and although the expansion does not meet normal investment criteria, inthe eyes of corporate management it may contribute to the company’s longrun competitive advantage.
ECONOMIES OF SCALEInvestigation of the cost structure of the company and its competitors maysuggest that there are significant economies of scale to be exploited. In amature industry the additional sales can only be achieved by increasingmarket share at the expense of competitors; in a growing market it isnecessary to grow faster than competitors if a dominant market position isto be achieved.
EXPERIENCE EFFECTSThis is similar to the economies of scale case, with the qualification that thepotential advantage is only available for a limited period.
BUILDING ADVANCE CAPACITYIt would not be surprising to find many companies following an expansionstrategy when general economic conditions are improving. However, bythe time that economic conditions start to improve it may be too late toexpand, because of shortages of capital and labour. Some companies takethe opportunity of a recession to expand their operations in order to beready for the next upswing.
MANAGERIAL MOTIVATIONIn some companies the remuneration of top management is related to totalrevenue rather than profitability. This naturally leads to a preference forexpansion over stability. Managers who are not rewarded on this basis maystill regard their personal long term success as largely dependent on beingresponsible for a growing company. It is expanding companies which catchthe headlines, and the managers associated with expansion benefit from theaura of success.
Not all of the factors acting in favour of an expansionist strategy are directlyrelated to increasing company value. There is a widespread feeling amongmanagers that if a company is growing it must be basically healthy, but a
7/8 Edinburgh Business School Strategic Planning
Module 7 / Making Choices among Strategies
company which is pursuing an expansion strategy for the wrong reasons couldbe weakening its long term competitive potential.
Retrenchment
Under this heading come the notions downsizing, delayering and restructuring.These initiatives are undertaken in the quest for a more efficient organisationeither in terms of shedding businesses which are not seen as part of the com-pany’s core competence or in terms of enhancing labour productivity. This is thestrategy which many managers often do not want to be associated with, becauseit implies that mistakes have been made in the past. This is why many com-panies find it necessary to appoint a new CEO when retrenchment is necessary,or to use independent consultants to advise on retrenchment policies. But if thenotion of retrenchment can be divorced from that of profitability, and the emo-tive objections overcome, managers can see that retrenchment is not necessarilybrought about by incompetence and can be a perfectly logical strategy.
PRODUCT LIFE CYCLESSome products may be nearing the end of their life cycles and there are noreplacements available to which the company can divert resources. Man-agers may decide it is better to wait and see whether new products canbe developed in the areas in which the company has expertise, rather thandiversifying into areas of high uncertainty.
DOGSIt is not unknown for companies which are ‘cash rich’ to diversify intonumerous areas in which they have little experience. Subsequently, it maytranspire that some of the acquisitions are ‘dogs’, using the BCG definition.Since such products are almost impossible to salvage, because the costs ofincreasing their competitive advantage far outweigh the potential returns,the appropriate strategy is to divest.
OVEREXTENDED MARKETSInternal analysis may have revealed that, at the margin, the companyis losing money on some customers. This can arise from maintaining aproduction, sales and distribution network which incurs very high marginalcosts, while the revenue from many customers is relatively low due tocompetitive pressures. In economic terms, the marginal cost exceeds themarginal revenue, and the remedy is to cut back on the scale of operations.Companies are often able to identify customers that it is not worth having,because, for example, the delivery cost may be high, because extremelyfavourable terms had to be offered to get the order in the first place, orbecause resources were already working at full capacity and filling the ordercaused disruption. Retrenchment will increase profitability because lossesat the margin are avoided.
Retrenchment can therefore be associated with rationalisation and a drive togreater efficiency. These positive reasons need to be distinguished from retrench-ment caused by a series of poor decisions which managers attempt to counterby selling productive assets, or imposing economies on the organisation whichprovide no more than a temporary solution to cash flow problems.
Strategic Planning Edinburgh Business School 7/9
Module 7 / Making Choices among Strategies
Combination
There are two ways of looking at combination strategies. First, they occur whena multiple SBU company is pursuing different generic strategies in relation toindividual SBUs, and it is impossible to characterise the generic strategy forthe company as a whole as stability, expansion or retrenchment. Second, thecompany can pursue a different generic policy sequentially, so that the currentgeneric policy can only be interpreted in the context of the grand overall strategydesign.
OPPORTUNITY COSTIt was discussed at 6.1 that the real cost of a course of action is the bestalternative forgone. Analysis of markets may reveal that some resourcescould be put to better use and that they should be redeployed. However,in order to release these resources it may be necessary to reduce somecurrent activities, and this involves a retrenchment strategy. The periodof retrenchment may be protracted, depending on the circumstances. Theoverall generic strategy may be stability or expansion, depending on themarkets into which the company is diverting resources.
PRODUCT PORTFOLIOBecause of the unpredictability of product successes and failures, and theobjective of maintaining a portfolio as outlined at 5.7, the company may haveno alternative but to go through periods of expansion and retrenchment.Furthermore, at any time the multiple SBU company is likely to find thatsome SBUs are expanding and others are in retrenchment simply becauseof their individual product portfolios.
If a sufficiently long term view is taken, it could be argued that all companiespursue a combination generic strategy, because that is the way things are likelyto turn out. However, it is revealing to consider the combination option explicitlybecause it introduces a time dimension into the generic approach.
Assessing Generic Strategies
It is clear that different generic strategies are appropriate in different circum-stances. The influences outlined above will partly determine which genericstrategy a company will follow in the pursuit of its objectives. The questionnaturally arises of what criteria ought to be employed in deciding on whichgeneric strategy to pursue, given that in any circumstance there will be influ-ences acting in different directions. A large part of the answer lies at 3.12.6under ‘Shareholder Wealth’, from which the question is derived: ‘Which genericstrategy will add most value to the company?’ This focuses attention on theultimate objective of the company rather than on the means by which the objec-tive might be achieved. It is illogical to opt for expansion if it is likely to reducethe value of the company, or if retrenchment would add value. In spite of theemotive implications of the generic alternatives, the distinction between meansand ends must be maintained; otherwise the company will find itself embarkingon a course of action which in reality has nothing to commend it other than itsemotional appeal to managers.
7/10 Edinburgh Business School Strategic Planning
Module 7 / Making Choices among Strategies
7.3.2 Business Level Generic Options
The focus here is on the effective exploitation of individual product markets, asopposed to the overall resource allocation problem facing corporate level strate-gists. This is the responsibility of the SBU, which may have a product portfolioof its own to consider. The generic approaches can be classified according to thestrategy adopted towards individual products, or the strategy approach adoptedby the SBU towards the exploitation of a group of products.
At the product level the focus is on achieving competitive advantage in a givenmarket. Porter2 identified four main generic strategies: overall cost leadership,differentiation, focus and no distinctive strategy.
Overall Cost Leadership
The objective is to achieve a situation where unit costs are significantly lowerthan those of other companies in the industry, thus producing higher profitsthan competitors and the ability to mount a defence against competitive threats.This strategy is partly based on the BCG concept of the advantage conferred byrelatively high market share; this cost advantage derives from those economiesof scale and experience effects which, by definition, are not available to smallercompanies.
The strategy implies two specific preoccupations. First, the company mustattempt to achieve the market share which has the potential to generate the costadvantages desired. This market share must, of course, be achievable; there isno point to adopting a strategy of cost leadership when existing industry giantscontrol 80 per cent of the market. Second, the company must be continuallyconcerned with efficient resource allocation, and be at the forefront of tech-nological developments which have the potential to reduce costs. Once it hasachieved the cost advantage it will be continually concerned with maintaining it.For example, it has already been stressed that experience effects are transitory,that competitive conditions continually change with the result that economies ofscale are always under threat, and that international developments can lead tothe entry of previously excluded efficient producers. Taken together, these twopreoccupations suggest that the product is not differentiated and is capable ofhigh volume low cost production.
The cost leadership strategy can be seen as an investment process. Costs areincurred initially in winning market share and setting up efficient productiontechniques. Subsequently the net cash flows will be higher than they otherwisewould have been because of the unit cost advantage.
Differentiation
The effect of product differentiation was discussed at 5.4.1, the effect of dif-ferentiation being to increase profits by segmenting the market and enablingdifferent prices to be charged in different segments. In this case there is lesspreoccupation with market share, because the company is continually redefiningthe market; it may in fact have 100 per cent market share in the segment for theparticular combination of differentiated characteristics which it has produced.Because the product is not homogeneous, less attention is paid to relative costs.
Strategic Planning Edinburgh Business School 7/11
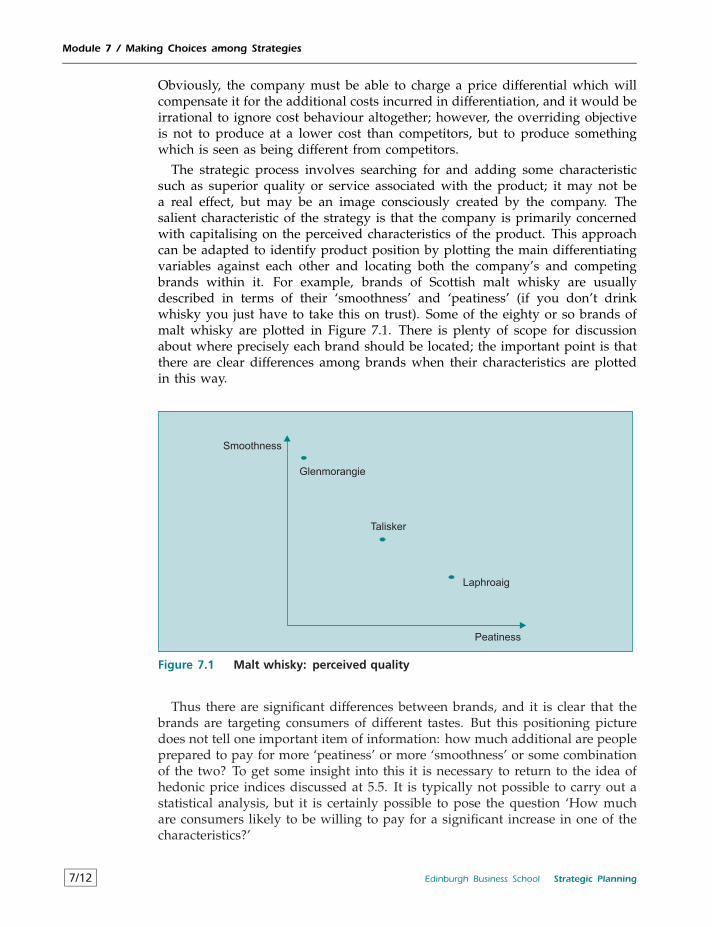
Module 7 / Making Choices among Strategies
Obviously, the company must be able to charge a price differential which willcompensate it for the additional costs incurred in differentiation, and it would beirrational to ignore cost behaviour altogether; however, the overriding objectiveis not to produce at a lower cost than competitors, but to produce somethingwhich is seen as being different from competitors.
The strategic process involves searching for and adding some characteristicsuch as superior quality or service associated with the product; it may not bea real effect, but may be an image consciously created by the company. Thesalient characteristic of the strategy is that the company is primarily concernedwith capitalising on the perceived characteristics of the product. This approachcan be adapted to identify product position by plotting the main differentiatingvariables against each other and locating both the company’s and competingbrands within it. For example, brands of Scottish malt whisky are usuallydescribed in terms of their ‘smoothness’ and ‘peatiness’ (if you don’t drinkwhisky you just have to take this on trust). Some of the eighty or so brands ofmalt whisky are plotted in Figure 7.1. There is plenty of scope for discussionabout where precisely each brand should be located; the important point is thatthere are clear differences among brands when their characteristics are plottedin this way.
Smoothness
Peatiness
Glenmorangie
Talisker
Laphroaig
Figure 7.1 Malt whisky: perceived quality
Thus there are significant differences between brands, and it is clear that thebrands are targeting consumers of different tastes. But this positioning picturedoes not tell one important item of information: how much additional are peopleprepared to pay for more ‘peatiness’ or more ‘smoothness’ or some combinationof the two? To get some insight into this it is necessary to return to the idea ofhedonic price indices discussed at 5.5. It is typically not possible to carry out astatistical analysis, but it is certainly possible to pose the question ‘How muchare consumers likely to be willing to pay for a significant increase in one of thecharacteristics?’
7/12 Edinburgh Business School Strategic Planning
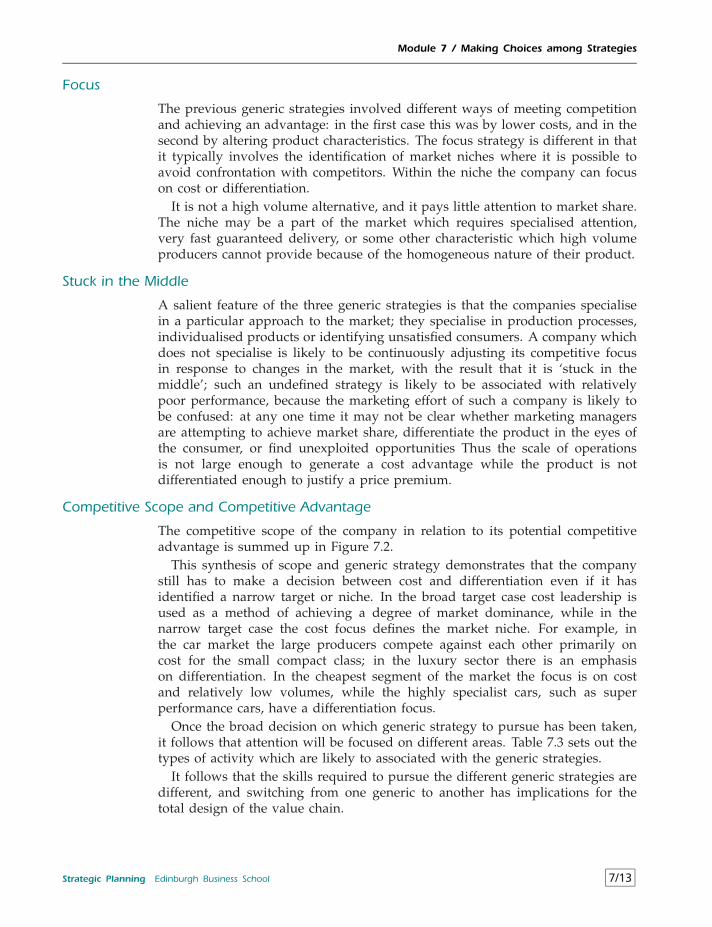
Module 7 / Making Choices among Strategies
Focus
The previous generic strategies involved different ways of meeting competitionand achieving an advantage: in the first case this was by lower costs, and in thesecond by altering product characteristics. The focus strategy is different in thatit typically involves the identification of market niches where it is possible toavoid confrontation with competitors. Within the niche the company can focuson cost or differentiation.
It is not a high volume alternative, and it pays little attention to market share.The niche may be a part of the market which requires specialised attention,very fast guaranteed delivery, or some other characteristic which high volumeproducers cannot provide because of the homogeneous nature of their product.
Stuck in the Middle
A salient feature of the three generic strategies is that the companies specialisein a particular approach to the market; they specialise in production processes,individualised products or identifying unsatisfied consumers. A company whichdoes not specialise is likely to be continuously adjusting its competitive focusin response to changes in the market, with the result that it is ‘stuck in themiddle’; such an undefined strategy is likely to be associated with relativelypoor performance, because the marketing effort of such a company is likely tobe confused: at any one time it may not be clear whether marketing managersare attempting to achieve market share, differentiate the product in the eyes ofthe consumer, or find unexploited opportunities Thus the scale of operationsis not large enough to generate a cost advantage while the product is notdifferentiated enough to justify a price premium.
Competitive Scope and Competitive Advantage
The competitive scope of the company in relation to its potential competitiveadvantage is summed up in Figure 7.2.
This synthesis of scope and generic strategy demonstrates that the companystill has to make a decision between cost and differentiation even if it hasidentified a narrow target or niche. In the broad target case cost leadership isused as a method of achieving a degree of market dominance, while in thenarrow target case the cost focus defines the market niche. For example, inthe car market the large producers compete against each other primarily oncost for the small compact class; in the luxury sector there is an emphasison differentiation. In the cheapest segment of the market the focus is on costand relatively low volumes, while the highly specialist cars, such as superperformance cars, have a differentiation focus.
Once the broad decision on which generic strategy to pursue has been taken,it follows that attention will be focused on different areas. Table 7.3 sets out thetypes of activity which are likely to associated with the generic strategies.
It follows that the skills required to pursue the different generic strategies aredifferent, and switching from one generic to another has implications for thetotal design of the value chain.
Strategic Planning Edinburgh Business School 7/13
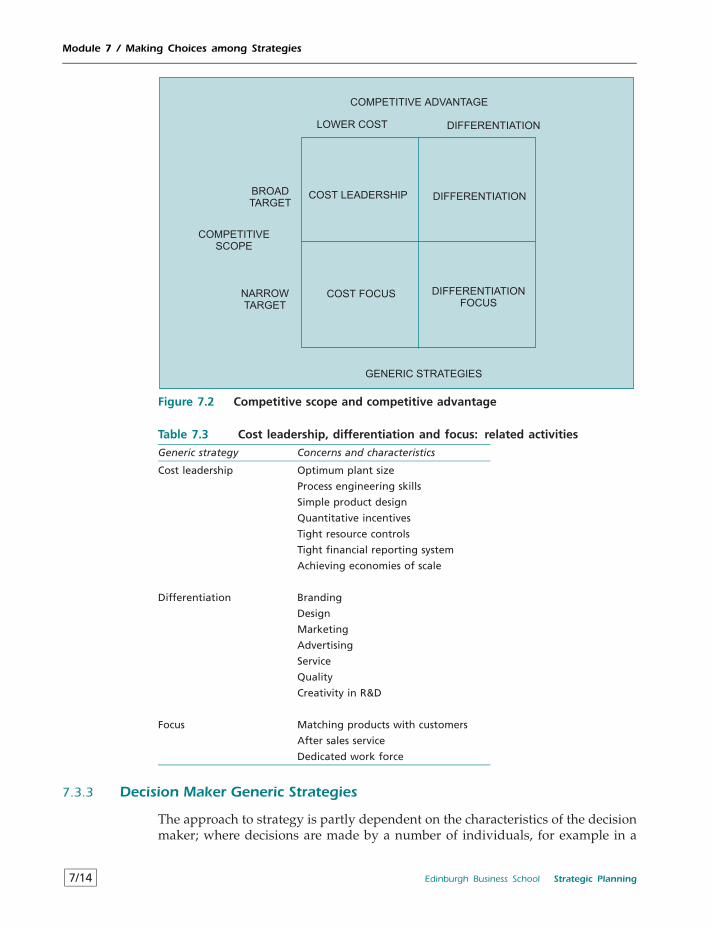
Module 7 / Making Choices among Strategies
COMPETITIVE ADVANTAGE
LOWER COST DIFFERENTIATION
DIFFERENTIATIONCOST LEADERSHIP
COST FOCUS DIFFERENTIATION
FOCUSNARROW
TARGET
BROAD
TARGET
COMPETITIVE
SCOPE
GENERIC STRATEGIES
Figure 7.2 Competitive scope and competitive advantage
Table 7.3 Cost leadership, differentiation and focus: related activities
Generic strategy Concerns and characteristics
Cost leadership Optimum plant size
Process engineering skills
Simple product design
Quantitative incentives
Tight resource controls
Tight financial reporting system
Achieving economies of scale
Differentiation Branding
Design
Marketing
Advertising
Service
Quality
Creativity in R&D
Focus Matching products with customers
After sales service
Dedicated work force
7.3.3 Decision Maker Generic Strategies
The approach to strategy is partly dependent on the characteristics of the decisionmaker; where decisions are made by a number of individuals, for example in a
7/14 Edinburgh Business School Strategic Planning
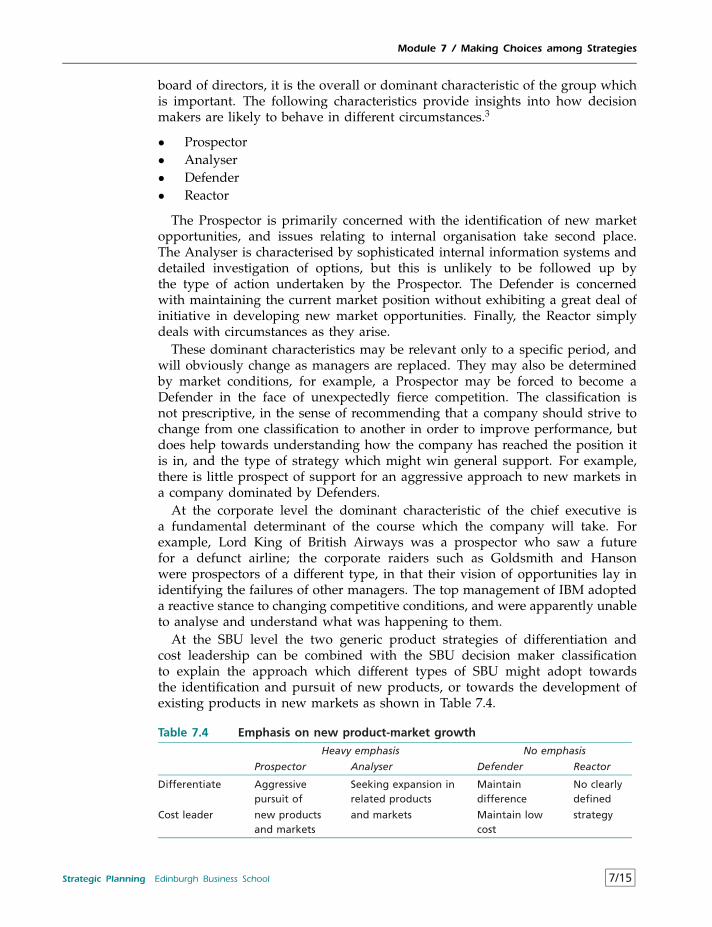
Module 7 / Making Choices among Strategies
board of directors, it is the overall or dominant characteristic of the group whichis important. The following characteristics provide insights into how decisionmakers are likely to behave in different circumstances.3
• Prospector• Analyser• Defender• Reactor
The Prospector is primarily concerned with the identification of new marketopportunities, and issues relating to internal organisation take second place.The Analyser is characterised by sophisticated internal information systems anddetailed investigation of options, but this is unlikely to be followed up bythe type of action undertaken by the Prospector. The Defender is concernedwith maintaining the current market position without exhibiting a great deal ofinitiative in developing new market opportunities. Finally, the Reactor simplydeals with circumstances as they arise.
These dominant characteristics may be relevant only to a specific period, andwill obviously change as managers are replaced. They may also be determinedby market conditions, for example, a Prospector may be forced to become aDefender in the face of unexpectedly fierce competition. The classification isnot prescriptive, in the sense of recommending that a company should strive tochange from one classification to another in order to improve performance, butdoes help towards understanding how the company has reached the position itis in, and the type of strategy which might win general support. For example,there is little prospect of support for an aggressive approach to new markets ina company dominated by Defenders.
At the corporate level the dominant characteristic of the chief executive isa fundamental determinant of the course which the company will take. Forexample, Lord King of British Airways was a prospector who saw a futurefor a defunct airline; the corporate raiders such as Goldsmith and Hansonwere prospectors of a different type, in that their vision of opportunities lay inidentifying the failures of other managers. The top management of IBM adopteda reactive stance to changing competitive conditions, and were apparently unableto analyse and understand what was happening to them.
At the SBU level the two generic product strategies of differentiation andcost leadership can be combined with the SBU decision maker classificationto explain the approach which different types of SBU might adopt towardsthe identification and pursuit of new products, or towards the development ofexisting products in new markets as shown in Table 7.4.
Table 7.4 Emphasis on new product-market growth
Heavy emphasis No emphasis
Prospector Analyser Defender Reactor
Differentiate Aggressivepursuit of
Seeking expansion inrelated products
Maintaindifference
No clearlydefined
Cost leader new productsand markets
and markets Maintain lowcost
strategy
Strategic Planning Edinburgh Business School 7/15
Module 7 / Making Choices among Strategies
Prospectors are primarily concerned with pursuing growth by differentiated orlow cost products, and are probably indifferent to which characteristic generatespotential competitive opportunities. Analysers will tend to start from the baseof a strong core business, and will expand into related areas; this is becauseAnalysers are unwilling to enter markets on which they have little informationand no experience. Defenders will tend to be operating in mature markets, andare concerned with maintaining the position of ‘cash cows’; Defenders’ attitudesmay be largely conditioned by the fact that they are operating in mature markets.Reactors, as might be expected, simply wait until the pressure of events forcessome course of action upon them; at times Reactors will behave like one of theother three types, but there will be no consistency in their approach over time.
This illustration might at first appear to be painfully obvious; however, experi-ence suggests that many managers do not have a clear idea of which classificationtheir company falls within. Many managers would like to be characterised asProspectors, but in fact they are Reactors; managers who feel that they do notalways seize opportunities should ask themselves whether this is because of anaversion to risk or because they are basically Analysers. This type of classifica-tion has a potential payoff in real life. When the opportunity for product-marketgrowth arises, an SBU CEO can start by identifying the main behavioural char-acteristics of the organisation, identify whether the SBU is a Prospector or aReactor, and see from the matrix how he is likely to behave in the circum-stances. The important issue is whether the previous orientation of the companyis likely to be effective in the circumstances which will face it in the future; theDefender, for example, can consider whether it is worth attempting to intro-duce organisational change to instill elements of Analyser and Prospector toencourage the investigation and pursuit of new opportunities.
7.3.4 Generic Strategies and Company Performance
It is reasonable to ask what the most appropriate generic strategy might begiven the circumstances of the company, the positioning of its products, and thepast behaviour of managers. There are three main issues to bear in mind whenattempting to relate generic strategies to company performance. First, the pointhas already been made that the generic strategy is a means, while companyperformance is the end. Therefore a stability strategy is not necessarily lessprofitable than an expansionist strategy, and the cost leader is not necessarily lessprofitable than the differentiator. Second, it has been argued that the underlyingmeasure of profitability relates to the value added by alternative courses ofaction, and this is not necessarily reflected in changes in short term cash flows.However, in some cases value added may not be the immediate concern ofdecision makers; for example, a family may wish to maintain control of acompany despite the fact that its value would be increased by expansion. Third,the data do not exist on which to apply the scientific method of hypothesistesting. Therefore, any conclusions drawn on the most appropriate strategy arelikely to be heavily conditioned by the experience of the individual strategist.
7/16 Edinburgh Business School Strategic Planning
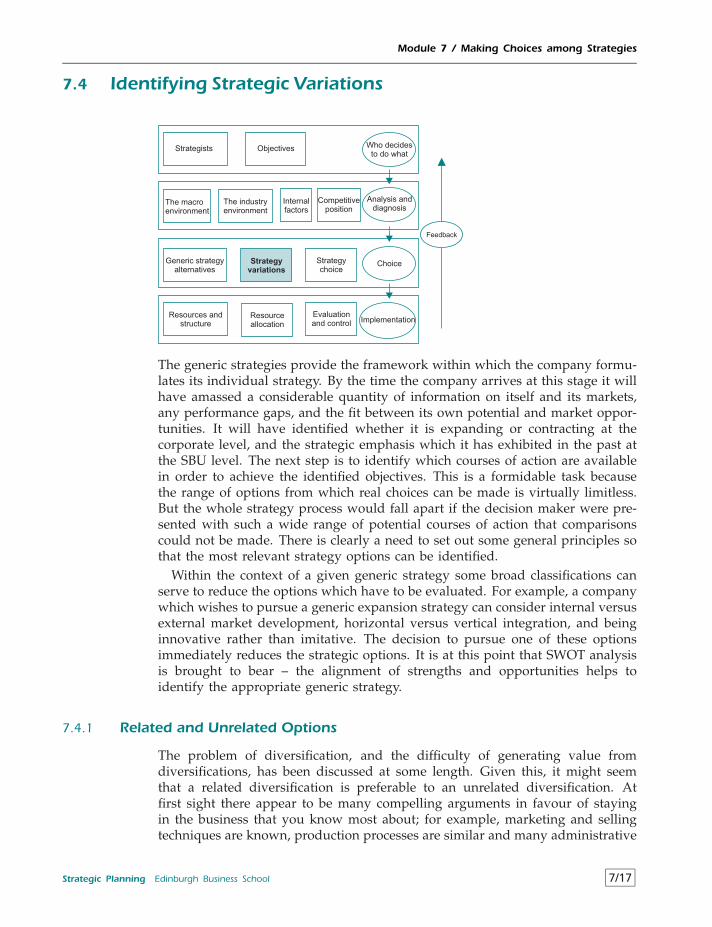
Module 7 / Making Choices among Strategies
7.4 Identifying Strategic Variations
Strategists Objectives
The macroenvironment
The industryenvironment
Internalfactors
Competitiveposition
Generic strategyalternatives
Strategyvariations
Who decidesto do what
Analysis anddiagnosis
Choice
Implementation
Strategychoice
Resources andstructure
Resourceallocation
Evaluationand control
Feedback
The generic strategies provide the framework within which the company formu-lates its individual strategy. By the time the company arrives at this stage it willhave amassed a considerable quantity of information on itself and its markets,any performance gaps, and the fit between its own potential and market oppor-tunities. It will have identified whether it is expanding or contracting at thecorporate level, and the strategic emphasis which it has exhibited in the past atthe SBU level. The next step is to identify which courses of action are availablein order to achieve the identified objectives. This is a formidable task becausethe range of options from which real choices can be made is virtually limitless.But the whole strategy process would fall apart if the decision maker were pre-sented with such a wide range of potential courses of action that comparisonscould not be made. There is clearly a need to set out some general principles sothat the most relevant strategy options can be identified.
Within the context of a given generic strategy some broad classifications canserve to reduce the options which have to be evaluated. For example, a companywhich wishes to pursue a generic expansion strategy can consider internal versusexternal market development, horizontal versus vertical integration, and beinginnovative rather than imitative. The decision to pursue one of these optionsimmediately reduces the strategic options. It is at this point that SWOT analysisis brought to bear – the alignment of strengths and opportunities helps toidentify the appropriate generic strategy.
7.4.1 Related and Unrelated Options
The problem of diversification, and the difficulty of generating value fromdiversifications, has been discussed at some length. Given this, it might seemthat a related diversification is preferable to an unrelated diversification. Atfirst sight there appear to be many compelling arguments in favour of stayingin the business that you know most about; for example, marketing and sellingtechniques are known, production processes are similar and many administrative
Strategic Planning Edinburgh Business School 7/17
Module 7 / Making Choices among Strategies
and distributive overheads can be shared among similar products, and thenature of the competition is well known (or it should be). But there are somereasons why it may not be possible to expand in existing markets; for example,competitive legislation may make any further increases in market share illegal,or the company is cash rich and has already exploited existing markets as faras it is considered economic to do so. Take the case of a company currentlyproducing baby food which is faced with a declining demand for its productbecause of demographic changes. It has the option of moving into the productionof tinned food with a special appeal to young children, or diversifying into theproduction of toys; diversifying into a different type of food product appearsto be a more closely related diversification than getting involved in producingtoys. The factor which makes both related is that they are both in marketsinvolving children. The trouble is that this ranking of relatedness may focus onthe wrong variables. In fact, the research carried out during the past thirty yearshas established little agreement on the contribution of related diversification tocompetitive advantage. The case has been strongly made4 that this is becausetraditional measures of relatedness look only at the industry or market levelwhereas what really matters is relatedness among strategic assets. Researchsuggests that the factors which contribute to long run returns are
• the potential to reap economies of scope across SBUs that can share thesame strategic asset; this could be a common distribution system, and inthe case of the baby food manufacturer diversifying into toys would meansetting up a distribution system with toy shops instead of food stores.
• the potential to use a core competence in the new SBU; this could be anunderstanding of marketing child products, and it may be equally relevantto both options.
• the potential to utilise a core competence to create a new strategic asset in anew business faster; thus while the existing distribution system is commonfor both types of food product, the knowledge of how to build up thesystem may still confer a competitive advantage in the toy market.
• the potential for related diversification to expand the company’s pool ofcore competencies as it learns new skills; the lessons learned in buildinga toy distribution system may be relevant to the existing food distributionsystem.
The usual arguments in favour of related options, which are based on costs,efficiency and market knowledge, may generate only a short term advantagebecause these attributes can be replicated. The four types of relatedness aboveare less obvious, and could provide a totally different perspective on whatappears to be an unrelated diversification, which is so defined because theproducts involved are physically different.
The arguments in favour of unrelated options have tended to be less preciseand more difficult to quantify than those for apparently related options. Forexample, managers may feel that diversification reduces the risk of the companyfailing, or that there is positive synergy to be gained from unrelated activities,or there may be peak load capacity problems which can be evened out bybranching into products with a different seasonal demand.
7/18 Edinburgh Business School Strategic Planning
Module 7 / Making Choices among Strategies
There is clearly much more to the issue of relatedness than meets the eye,and companies need to take a serious introspective look at themselves prior toadopting a stance on the relationship between a possible new course of actionand current capabilities.
7.4.2 Vertical Integration
Vertical integration involves movement into other parts of the production chainby which raw materials are converted into final products; some of these activ-ities may be related, others totally unrelated. The potential costs and benefitsassociated with vertical integration were discussed at 6.18, where the questionof the optimal degree of integration was discussed. The car company whichtakes over a steel rolling business is an example of backward integration, but itis unlikely that the steel company will only produce steel for the car companyitself; the further into other parts of the production chain the company movesthe less likely it will be to produce only for, or buy only from, itself, and it mayfind it owns a series of companies each supplying a different market, of whichthe supply to the company itself at each stage may only be a relatively smallpart. The vertical integration thus starts to present similar types of problemsas related and unrelated options; the company may benefit in some ways fromthe integration, but the benefits may be swamped by the costs of unrelateddiversification.
Forward integration involves the company carrying out the functions of itscustomers; a typical example is when a company distributes its output instead ofusing contractors, or opens its own retail outlets. Much the same considerationsapply as in backward integration. For example, it is unlikely that the company iscurrently the only supplier for the forward customer, and integration can againhave the characteristics of an unrelated diversification.
A variation on this strategy is to adopt the role of a captive company, wherea large proportion of output is purchased by a single customer, and that cus-tomer actually performs some of the functions which would normally be carriedout by the company itself. Whether the captive company is an economicallysound organisation, or whether being captive is a sign of weak management,depends on the circumstances; for example, in the car components industrymany profitable captive companies have existed for a long time.
The crucial question which must always be borne in mind is whether, takingeverything into consideration, the company would add value by controllingother parts of the productive chain. The case of British Gas, discussed at 6.18,demonstrates that vertical integration may not be an efficient option.
7.4.3 Acquisitions
Instead of undertaking internal action through the mobilisation of the company’sown resources to achieve objectives, the company can undertake external actionby taking over or merging with another company. This is an activity mostassociated with Britain and the US until the late 1990s. Some of the moreimportant reasons for considering acquisition are unrealised value potential,
Strategic Planning Edinburgh Business School 7/19
Module 7 / Making Choices among Strategies
buying into markets, reducing competitive pressures, the quest for synergy,balancing the portfolio and developing core competence.
Recognising Unrealised Value
Some chief executives have a skill in identifying companies which have not fullyexploited their value opportunities. The activities of such a company may beunrelated to the current business of the potential acquirer, whose competenceis perceived to be in adding value independent of the type of business. It isinstructive to try to identify the areas in which the company’s performancemight be inadequate, because unless these can be identified it is difficult tounderstand the rationale for a take-over in the first place. At its simplest level,the rationale for a take-over depends on whether the current share value ofthe company could be increased by a reallocation of resources. Reasons for acompany being undervalued include:
DEVELOPMENT EXPENDITURE HAS BEEN INEFFICIENTLY SPENTThe predator may feel that because of inadequate expenditure on productdevelopment, the potential market share is lower and unit cost higher thanthey should be.
MARKETING STRATEGY HAS NOT PURSUED OPPORTUNITIESThe predator may spot opportunities for product differentiation and marketsegmentation which he considers will transform the profitability of productswhich are currently poor cash generators.
RESOURCE MANAGEMENT HAS BEEN POORThe predator may conclude that unit costs are higher than in similar com-panies, and that opportunities exist to reduce costs simply by improvingresource management.
EXPECTED INCREASE IN DEMANDThe predator may expect an upturn in the demand for the company’sproducts because of an improvement in general economic conditions.
WEAK PRODUCTSThe predator may identify products which do not contribute to shareholderwealth; divesting them will release resources for more productive purposes.
This is not an exhaustive list of factors which may contribute to an underval-ued share price, but it illustrates that to a large extent a predator’s motivationis based on a perception of the company which is not reflected in the marketvaluation. He may, of course, be wrong. The extent to which predators can bewrong can be quite startling, as Table 7.5, a history of some acquisitions fromthe 1980s, shows.
All the research studies in this field come to the conclusion that take-oversrarely create value. In the majority of cases it has been found that the value ofthe bidder’s shares falls after the take-over, while many studies point to longerterm negative effects on the profitability of the acquired business units. Even inJapan, where take-overs and mergers have only become important since the mid1980s, there is no evidence that the activity has improved profitability or growth.
7/20 Edinburgh Business School Strategic Planning
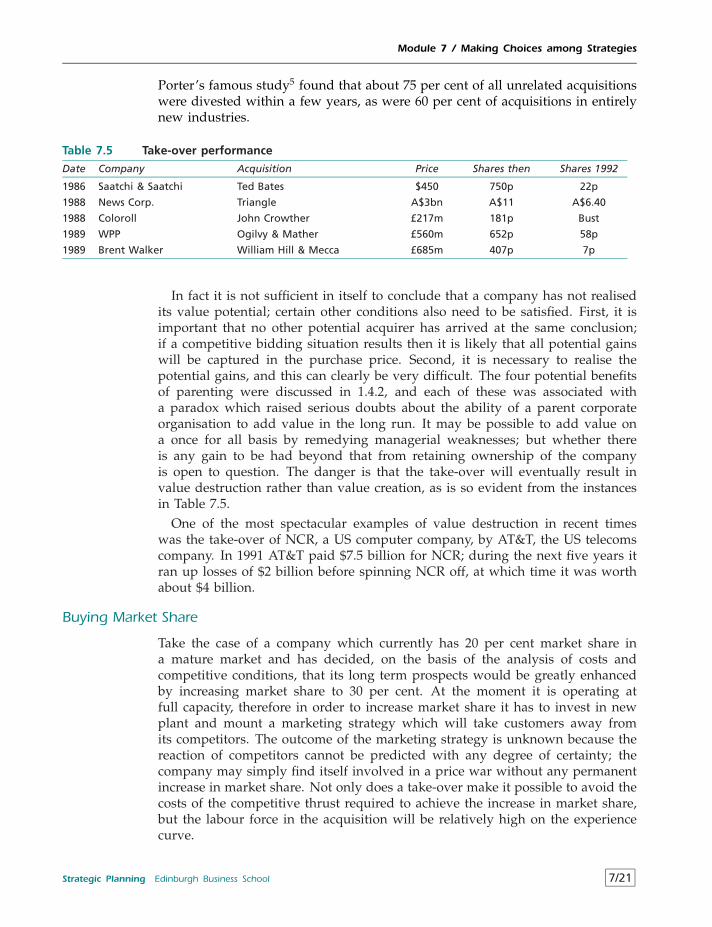
Module 7 / Making Choices among Strategies
Porter’s famous study5 found that about 75 per cent of all unrelated acquisitionswere divested within a few years, as were 60 per cent of acquisitions in entirelynew industries.
Table 7.5 Take-over performance
Date Company Acquisition Price Shares then Shares 1992
1986 Saatchi & Saatchi Ted Bates $450 750p 22p
1988 News Corp. Triangle A$3bn A$11 A$6.40
1988 Coloroll John Crowther £217m 181p Bust
1989 WPP Ogilvy & Mather £560m 652p 58p
1989 Brent Walker William Hill & Mecca £685m 407p 7p
In fact it is not sufficient in itself to conclude that a company has not realisedits value potential; certain other conditions also need to be satisfied. First, it isimportant that no other potential acquirer has arrived at the same conclusion;if a competitive bidding situation results then it is likely that all potential gainswill be captured in the purchase price. Second, it is necessary to realise thepotential gains, and this can clearly be very difficult. The four potential benefitsof parenting were discussed in 1.4.2, and each of these was associated witha paradox which raised serious doubts about the ability of a parent corporateorganisation to add value in the long run. It may be possible to add value ona once for all basis by remedying managerial weaknesses; but whether thereis any gain to be had beyond that from retaining ownership of the companyis open to question. The danger is that the take-over will eventually result invalue destruction rather than value creation, as is so evident from the instancesin Table 7.5.
One of the most spectacular examples of value destruction in recent timeswas the take-over of NCR, a US computer company, by AT&T, the US telecomscompany. In 1991 AT&T paid $7.5 billion for NCR; during the next five years itran up losses of $2 billion before spinning NCR off, at which time it was worthabout $4 billion.
Buying Market Share
Take the case of a company which currently has 20 per cent market share ina mature market and has decided, on the basis of the analysis of costs andcompetitive conditions, that its long term prospects would be greatly enhancedby increasing market share to 30 per cent. At the moment it is operating atfull capacity, therefore in order to increase market share it has to invest in newplant and mount a marketing strategy which will take customers away fromits competitors. The outcome of the marketing strategy is unknown because thereaction of competitors cannot be predicted with any degree of certainty; thecompany may simply find itself involved in a price war without any permanentincrease in market share. Not only does a take-over make it possible to avoid thecosts of the competitive thrust required to achieve the increase in market share,but the labour force in the acquisition will be relatively high on the experiencecurve.
Strategic Planning Edinburgh Business School 7/21
Module 7 / Making Choices among Strategies
Reducing Competitive Pressures
Governments are continually on the lookout for companies which attempt toachieve monopoly power. In the US there is a formidable set of anti trust laws,and in Britain the Monopolies Commission has the power to veto take-overswhich it considers are not in the public interest. In any case, monopoly powerdoes not automatically mean that monopoly profits will be earned, due to theinfluence of contestable markets discussed in 5.10.4.
Synergy
There may be potential gains from sharing resources and making better use ofcapacity. The difficulties of capitalising on synergy were discussed in 6.21, andthe history of acquisitions which attempted to take advantage of synergy hasnot been encouraging. There are no guarantees that economies of scope willautomatically ensue.
Balancing the Portfolio
Rather than introduce a new product into the portfolio from scratch, the companymay be on the lookout for a Star or Question Mark which fits with its existingportfolio and has the potential to be developed into a Cash Cow. The issueof strategic fit is crucial here, because it is unlikely that such a company canbe purchased at a discount to its true value, particularly if it has been runefficiently in the past. The value added by such a product will depend on itscontribution to the long term competitive advantage of the acquiring company,and is probably dependent on issues such as synergy and economies of scope.Unless there is an underlying value added to be gained, the mere fact of addingthe product to the portfolio for the sake of completeness does not guarantee thatit will add value to the company as a whole.
Core Competencies
The acquisition may have the potential to fit with the strategic direction of thecompany in the sense that it complements the set of difficult-to-replicate skillsand attributes on which the company’s competitive advantage is based, whilebeing consistent with the company’s dominant management logic. It may also beseen as fitting with the company’s strategic architecture in terms of the linkagesin the value chain. These characteristics of the acquisition may lead to a longterm addition to competitive advantage and hence to value added. But it is notpossible to subject such an acquisition to an analysis of cash flow implicationsand possible return on investment; the point about core competencies is that theyare difficult to define and are by their nature unique to the situation, otherwisethey would have been copied already. There is no obvious way of identifyingthe potential contribution to core competencies before the event, so it has to berecognised that this option is based on a general view of the strategic thrust andhow the components of the company fit, without being explicit about how thevalue added outcome will be generated.
7/22 Edinburgh Business School Strategic Planning
Module 7 / Making Choices among Strategies
7.4.4 Alliances and Joint Ventures
Alliances and joint ventures take many forms, including licensing agreements,franchise agreements, relational contracting, relational management, consortia,virtual corporations, virtual functions and joint ventures. It is not the detailsof these which are important so much as the underlying rationale for strategicalliances in the first place. It has already been discussed at 7.4.3 that the suc-cess rate of mergers and take-overs has been low; it is therefore important todetermine whether or not this form of cooperative action leads to better results.Although in Porter’s study mentioned in 7.4.3 the rate of divestment of jointventures was lower (50 per cent compared with 75 per cent), other research hasfound no significant long term effects of joint venture activity on profitabilityin any industrial sector. Given this, the real issue is why companies shouldchoose an arm’s-length contract rather than entering into a full merger. This isof particular importance given the problem of the prisoner’s dilemma discussedin 5.3.1; no contract can cover all eventualities, and one side always has anincentive to cheat in some way.
One view is that a strategic alliance is a poor substitute for a merger.6
There have been plenty of articles in the last few years about all the cross-bordermergers in Europe. In fact, the more interesting issue is why there have beenso few. There should be hundreds of them, involving tens of billions of dollars,in industry after industry. But we’re not seeing it. What we’re seeing insteadare strategic alliances and minority investments. Companies buy 15 percent ofeach other’s shares. Or two rivals agree to cooperate in third markets but do notmerge their home market organisations. I worry that many European alliancesare poor substitutes for what we try to do – complete mergers and cross-borderrationalisation.
7.4.5 International Expansion
There is no difference in principle in moving into a foreign market comparedwith opening up new domestic markets. The same considerations of strategicopportunities and threats and competitive advantage must be taken into account.But it has to be recognised that competitive conditions may be significantlydifferent in another country. The competitive advantage of a company relates toits strengths relative to the competition in the market where it currently operates.The fact that a company has a competitive advantage in one location does notmean that it can be readily transferred abroad. An example is the Japanesecar maker Honda: in Japan it had about 10 per cent market share and wasdwarfed by Nissan with about one fifth of the market and Toyota with aboutone third; but for years Honda sold many more cars in the US than either ofits big domestic competitors. The explanation is that in Japan both Toyota andNissan were much stronger in terms of marketing and control of the distributionsystem, but these advantages could not be transferred to the US. Honda usedits competencies in car engines and receptiveness to US marketing ideas to giveit a clear lead in the US. Another instance is the attempts by Hong Kong hotelgroups to capitalise on their reputations, which were earned in Hong Kong, forbeing the best hotels in the world. The leading hoteliers, such as the Mandarin
Strategic Planning Edinburgh Business School 7/23
Module 7 / Making Choices among Strategies
Oriental and the Peninsula, successfully established operations in other parts ofAsia. But it proved far more difficult to do so in the US and Britain because theessential ingredient of high quality service is a relatively high ratio of servicestaff per room; since wage rates are much higher in the US and Britain it provedimpossible to maintain the same ratio without making the hotel impossiblyexpensive. These hotels are thus at no advantage compared with establishedchains when attempting to differentiate through excellence of service.
It is therefore necessary to focus on the elements of competitive advantagewhich can be transferred. In the case of Nissan and Toyota it was not thestrength of their distribution systems in Japan which was potentially transferable,but their knowledge of how to build and efficiently operate large distributionsystems; but because of the differences between Japan and the US it is doubtful ifeven the knowledge was transferable. Successful hotels are more than buildingsand physical features, since all hotel designers and builders are trying to producean attractive environment; unless the service offered is significantly different, andis perceived to be so by customers, then no transfer of advantage has taken place.
Besides the problem of transferring advantages, there are several variableswhich complicate operations on the international scene.
• Volatile exchange rates present serious problems; some of the problemspresented were discussed at 4.3.4 under ‘Exchange Rate Fluctuations’. Thefact that exchange rates cannot be predicted with any certainty, and the factthat relatively significant changes can take place in a short period, can makenonsense of cost and revenue predictions in foreign markets. One wayof hedging against exchange rate movements as part of an expansioniststrategy is to produce as closely as possible to consumers. This meanssetting up productive units in the countries where the markets are. Forexample, in the late 1980s Fiskars, a company producing knives in Finland,had the option of attempting to enter the UK market by exporting to theUK. The purchasing power parity of the UK pound against the Markkaat the time suggested that the Markka was about 20 per cent overvalued;unless the Finnish knives were reduced in price by 20 per cent they wouldbe relatively highly priced in the UK; another way of looking at this is thatthe overvaluation caused relative production costs in Finland to be 20 percent higher than they would have been in the UK. An alternative strategywas for Fiskars to acquire a UK knife producer, or set up a production unitin the UK, thus insulating itself against variations in the exchange valueof the pound. In the event Fiskars purchased Wilkinson Sword, a famouscompany of razor blade makers in the UK, and Gerber, a successful knifemaker, in the US.
• Relative factor costs vary by country. For example, the ratio of the cost oflabour to the cost of capital is lower in the US than in Europe, leading tomore capital intensive production in Europe. It may be more efficient toshift the production of labour intensive goods to the US to take advantageof the relatively cheap labour.
• Productivity varies widely among countries. For example, for many yearsthe UK had a lower output per worker in the manufacturing sector thanany other major country in the European Community. To some extent this
7/24 Edinburgh Business School Strategic Planning
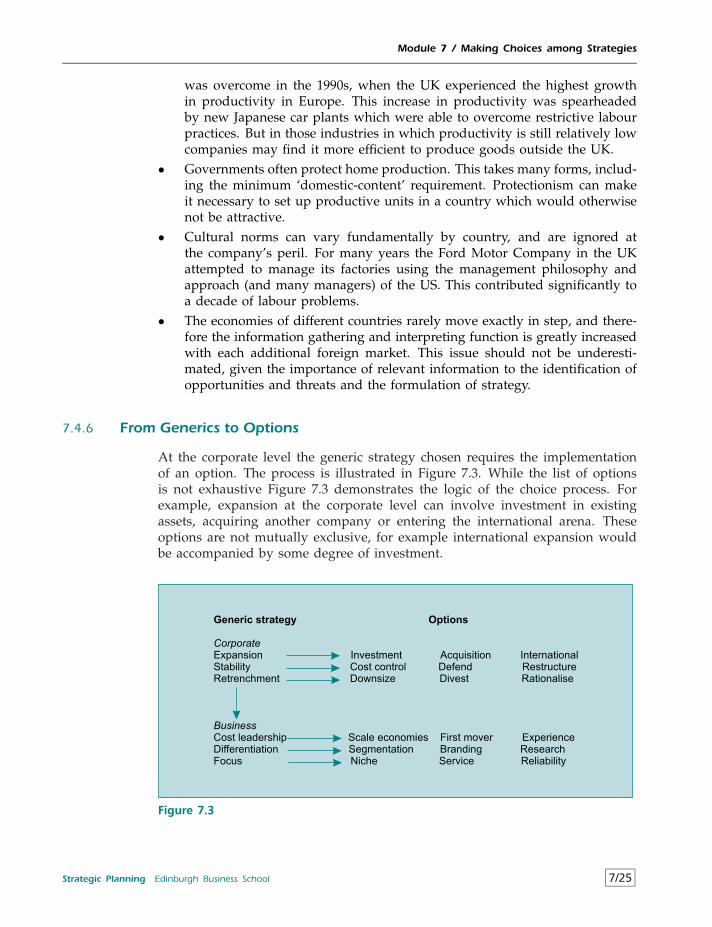
Module 7 / Making Choices among Strategies
was overcome in the 1990s, when the UK experienced the highest growthin productivity in Europe. This increase in productivity was spearheadedby new Japanese car plants which were able to overcome restrictive labourpractices. But in those industries in which productivity is still relatively lowcompanies may find it more efficient to produce goods outside the UK.
• Governments often protect home production. This takes many forms, includ-ing the minimum ‘domestic-content’ requirement. Protectionism can makeit necessary to set up productive units in a country which would otherwisenot be attractive.
• Cultural norms can vary fundamentally by country, and are ignored atthe company’s peril. For many years the Ford Motor Company in the UKattempted to manage its factories using the management philosophy andapproach (and many managers) of the US. This contributed significantly toa decade of labour problems.
• The economies of different countries rarely move exactly in step, and there-fore the information gathering and interpreting function is greatly increasedwith each additional foreign market. This issue should not be underesti-mated, given the importance of relevant information to the identification ofopportunities and threats and the formulation of strategy.
7.4.6 From Generics to Options
At the corporate level the generic strategy chosen requires the implementationof an option. The process is illustrated in Figure 7.3. While the list of optionsis not exhaustive Figure 7.3 demonstrates the logic of the choice process. Forexample, expansion at the corporate level can involve investment in existingassets, acquiring another company or entering the international arena. Theseoptions are not mutually exclusive, for example international expansion wouldbe accompanied by some degree of investment.
Generic strategy Options
Scale economies First mover ExperienceDifferentiation Segmentation Branding ResearchFocus Niche Service Reliability
Expansion Investment Acquisition InternationalStability Cost control Defend RestructureRetrenchment Downsize Divest Rationalise
Cost leadership
Corporate
Business
Figure 7.3
Strategic Planning Edinburgh Business School 7/25
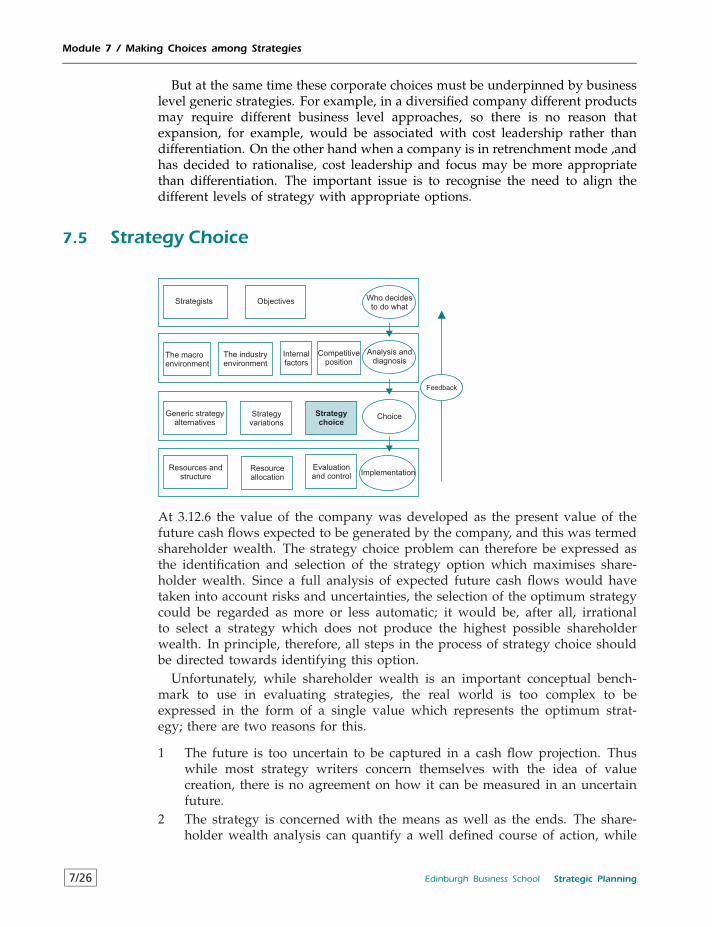
Module 7 / Making Choices among Strategies
But at the same time these corporate choices must be underpinned by businesslevel generic strategies. For example, in a diversified company different productsmay require different business level approaches, so there is no reason thatexpansion, for example, would be associated with cost leadership rather thandifferentiation. On the other hand when a company is in retrenchment mode ,andhas decided to rationalise, cost leadership and focus may be more appropriatethan differentiation. The important issue is to recognise the need to align thedifferent levels of strategy with appropriate options.
7.5 Strategy Choice
Strategists Objectives
The macroenvironment
The industryenvironment
Internalfactors
Competitiveposition
Generic strategyalternatives
Strategyvariations
Who decidesto do what
Analysis anddiagnosis
Choice
Implementation
Strategychoice
Resources andstructure
Resourceallocation
Evaluationand control
Feedback
At 3.12.6 the value of the company was developed as the present value of thefuture cash flows expected to be generated by the company, and this was termedshareholder wealth. The strategy choice problem can therefore be expressed asthe identification and selection of the strategy option which maximises share-holder wealth. Since a full analysis of expected future cash flows would havetaken into account risks and uncertainties, the selection of the optimum strategycould be regarded as more or less automatic; it would be, after all, irrationalto select a strategy which does not produce the highest possible shareholderwealth. In principle, therefore, all steps in the process of strategy choice shouldbe directed towards identifying this option.
Unfortunately, while shareholder wealth is an important conceptual bench-mark to use in evaluating strategies, the real world is too complex to beexpressed in the form of a single value which represents the optimum strat-egy; there are two reasons for this.
1 The future is too uncertain to be captured in a cash flow projection. Thuswhile most strategy writers concern themselves with the idea of valuecreation, there is no agreement on how it can be measured in an uncertainfuture.
2 The strategy is concerned with the means as well as the ends. The share-holder wealth analysis can quantify a well defined course of action, while
7/26 Edinburgh Business School Strategic Planning
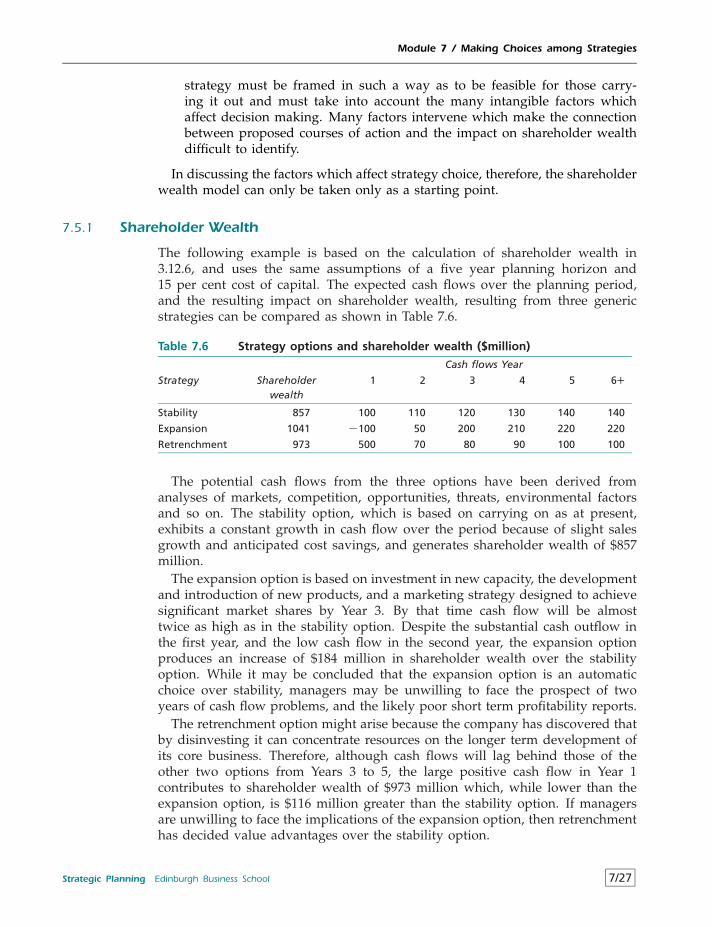
Module 7 / Making Choices among Strategies
strategy must be framed in such a way as to be feasible for those carry-ing it out and must take into account the many intangible factors whichaffect decision making. Many factors intervene which make the connectionbetween proposed courses of action and the impact on shareholder wealthdifficult to identify.
In discussing the factors which affect strategy choice, therefore, the shareholderwealth model can only be taken only as a starting point.
7.5.1 Shareholder Wealth
The following example is based on the calculation of shareholder wealth in3.12.6, and uses the same assumptions of a five year planning horizon and15 per cent cost of capital. The expected cash flows over the planning period,and the resulting impact on shareholder wealth, resulting from three genericstrategies can be compared as shown in Table 7.6.
Table 7.6 Strategy options and shareholder wealth ($million)
Cash flows Year
Strategy Shareholderwealth
1 2 3 4 5 6+
Stability 857 100 110 120 130 140 140
Expansion 1041 −100 50 200 210 220 220
Retrenchment 973 500 70 80 90 100 100
The potential cash flows from the three options have been derived fromanalyses of markets, competition, opportunities, threats, environmental factorsand so on. The stability option, which is based on carrying on as at present,exhibits a constant growth in cash flow over the period because of slight salesgrowth and anticipated cost savings, and generates shareholder wealth of $857million.
The expansion option is based on investment in new capacity, the developmentand introduction of new products, and a marketing strategy designed to achievesignificant market shares by Year 3. By that time cash flow will be almosttwice as high as in the stability option. Despite the substantial cash outflow inthe first year, and the low cash flow in the second year, the expansion optionproduces an increase of $184 million in shareholder wealth over the stabilityoption. While it may be concluded that the expansion option is an automaticchoice over stability, managers may be unwilling to face the prospect of twoyears of cash flow problems, and the likely poor short term profitability reports.
The retrenchment option might arise because the company has discovered thatby disinvesting it can concentrate resources on the longer term development ofits core business. Therefore, although cash flows will lag behind those of theother two options from Years 3 to 5, the large positive cash flow in Year 1contributes to shareholder wealth of $973 million which, while lower than theexpansion option, is $116 million greater than the stability option. If managersare unwilling to face the implications of the expansion option, then retrenchmenthas decided value advantages over the stability option.
Strategic Planning Edinburgh Business School 7/27
Module 7 / Making Choices among Strategies
One of the conceptual difficulties of the shareholder wealth approach is thatit collapses all future expectations to the present. It may appear odd that thedifferent prospects of the expansion and retrenchment options in Year 5 areassociated with much the same shareholder wealth at the present; the expansionoption implies a company with a portfolio of products with relatively highmarket shares and an equilibrium long term cash flow more than double thatof the retrenchment option. This arises because of the discounting process,which takes into account the opportunity cost of capital, and the fact that nofurther growth in cash flows is assumed after the end of the planning period.If managers conclude that the planning period does not adequately take intoaccount the longer term implications of the different strategies then the planningperiod itself can be amended accordingly; however, this does not alter theprinciples on which the analysis is based.
A further powerful application of shareholder wealth analysis is to break downthe activities of the company and estimate the contribution which each makes tothe total value of the company. For example, in the retrenchment example a partof the company had been identified which was subtracting from shareholderwealth; by getting rid of it shareholder wealth was increased. Take the caseof a company which has three SBUs, the largest of which produces computerequipment, the second largest provides maintenance services, and the smallestproduces software and application consulting services (this scenario is looselybased on the famous Apricot Computer case investigated by Sir John HarveyJones in his TV series ‘Troubleshooter’). Such a company will typically regardthe production of equipment as being the ‘core’ business on which the othersare built. However, as often happens, the maintenance and consulting SBUsdevelop markets which are independent of the equipment which the companyproduces, and start to behave as independent entities. The question then arisesof identifying which SBUs are contributing most to the value of the company asa guide to future resource allocation. This type of situation is represented by theexample in Table 7.7, which uses the stability option in the previous exampledisaggregated into three SBUs. Obviously there are problems associated withallocating costs to the SBUs, but for the purposes of the analysis this is assumedto be relatively unimportant.
The current and future revenues from selling products and services are domi-nated by the ‘core’ business of SBU 1; it generates about two thirds of companyrevenue and incurs about two thirds of total cost. However, it has the lowestshareholder wealth of the three SBUs, while the smallest SBU of the three interms of total revenue has the highest shareholder wealth. Taking the costs inYear 1 as an indication of the total allocation of resources, the mismatch shownin Table 7.8 emerges between resources deployed and value created.
7/28 Edinburgh Business School Strategic Planning
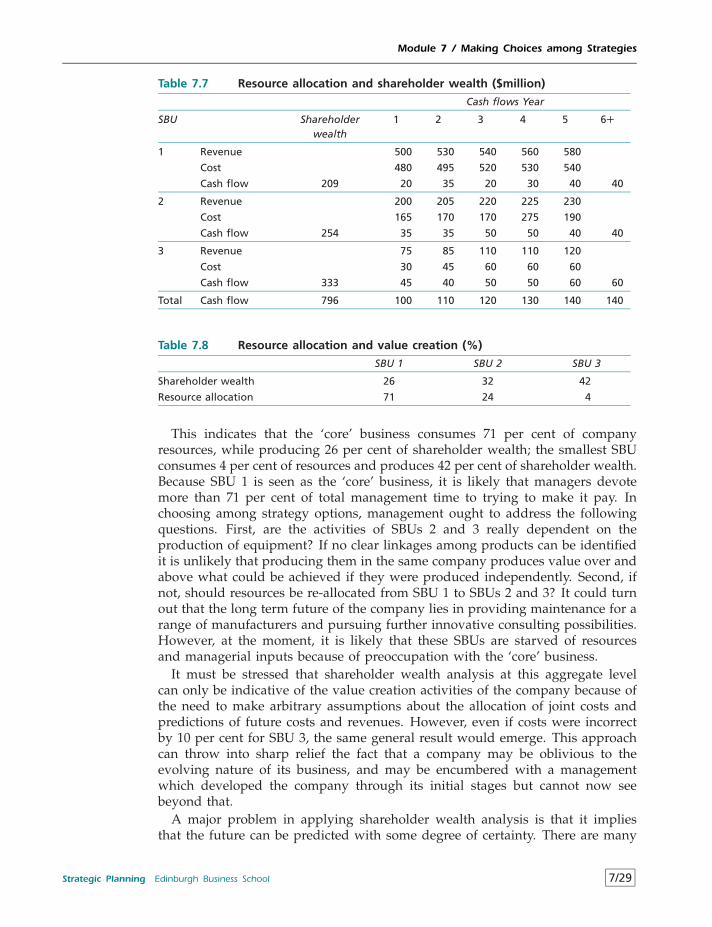
Module 7 / Making Choices among Strategies
Table 7.7 Resource allocation and shareholder wealth ($million)
Cash flows Year
SBU Shareholderwealth
1 2 3 4 5 6+
1 Revenue 500 530 540 560 580
Cost 480 495 520 530 540
Cash flow 209 20 35 20 30 40 40
2 Revenue 200 205 220 225 230
Cost 165 170 170 275 190
Cash flow 254 35 35 50 50 40 40
3 Revenue 75 85 110 110 120
Cost 30 45 60 60 60
Cash flow 333 45 40 50 50 60 60
Total Cash flow 796 100 110 120 130 140 140
Table 7.8 Resource allocation and value creation (%)
SBU 1 SBU 2 SBU 3
Shareholder wealth 26 32 42
Resource allocation 71 24 4
This indicates that the ‘core’ business consumes 71 per cent of companyresources, while producing 26 per cent of shareholder wealth; the smallest SBUconsumes 4 per cent of resources and produces 42 per cent of shareholder wealth.Because SBU 1 is seen as the ‘core’ business, it is likely that managers devotemore than 71 per cent of total management time to trying to make it pay. Inchoosing among strategy options, management ought to address the followingquestions. First, are the activities of SBUs 2 and 3 really dependent on theproduction of equipment? If no clear linkages among products can be identifiedit is unlikely that producing them in the same company produces value over andabove what could be achieved if they were produced independently. Second, ifnot, should resources be re-allocated from SBU 1 to SBUs 2 and 3? It could turnout that the long term future of the company lies in providing maintenance for arange of manufacturers and pursuing further innovative consulting possibilities.However, at the moment, it is likely that these SBUs are starved of resourcesand managerial inputs because of preoccupation with the ‘core’ business.
It must be stressed that shareholder wealth analysis at this aggregate levelcan only be indicative of the value creation activities of the company because ofthe need to make arbitrary assumptions about the allocation of joint costs andpredictions of future costs and revenues. However, even if costs were incorrectby 10 per cent for SBU 3, the same general result would emerge. This approachcan throw into sharp relief the fact that a company may be oblivious to theevolving nature of its business, and may be encumbered with a managementwhich developed the company through its initial stages but cannot now seebeyond that.
A major problem in applying shareholder wealth analysis is that it impliesthat the future can be predicted with some degree of certainty. There are many
Strategic Planning Edinburgh Business School 7/29
Module 7 / Making Choices among Strategies
circumstances where future events are so uncertain that the error associatedwith the calculations is too great to permit their use. For example, the decisionto develop and introduce a new product may be based on little more than anunquantifiable perception that a market for the product can be expected, butmuch depends on developments in other products, changes in consumer tastes,the behaviour of competitors, and so on. While Shareholder Wealth analysisis clearly an important tool in those cases where the future can be estimatedwith some degree of certainty, and focuses attention on the potential of differentcourses of action to generate value, there is still a need for tools which can beapplied to what are essentially leaps into the unknown.
7.5.2 Performance Gaps
The notion of performance gaps was developed at 3.3 as being the differencebetween the expected outcome if the company carried on as at present, andthe desired outcome. The desired outcome itself would be an amalgamationof company characteristics designed to meet overall company objectives; forexample, in the shareholder wealth analysis there may be several strategieswhich would accomplish the expansion option. In this case the company wouldwish to have additional products and higher market shares by Year 5 thanwould occur if no changes were made to current policies. The identification ofthis desired future state greatly narrows the range of feasible strategic options.The application of gap analysis therefore has immediate benefits by identifyingthe appropriate options from which the strategy choice ought to be made.
• The gap identifies whether the company should be pursuing a genericstrategy of stability, expansion or retrenchment.
• The extent of the gap indicates whether the company has to undertake asignificant reallocation of resources in order to close the gap; for example,the company may have specified an ambitious objective in terms of marketshare, but it may turn out that the gap is relatively small, and that closingthe gap does not involve a significant change in direction.
• Within the generic strategy the ways of closing the gap can be identified; forexample, whether strategy should be concentrated on external or internalfactors, such as marketing effort as opposed to cost control.
By structuring the question of where the company is actually going comparedto where managers would like it to go, the gap approach reduces the arrayof strategy alternatives to those which have direct relevance to the company’sobjectives and to its potential capacity. What might appear to be a painfullyobvious process requires managers to step back from the actual running ofthe company and identify in an objective manner options which might not beintuitively obvious were the gap not identified in the first place.
7.5.3 Corporate Management
When the company is comprised of a portfolio of products, the problem facingcorporate management is to decide on the components of the portfolio while
7/30 Edinburgh Business School Strategic Planning
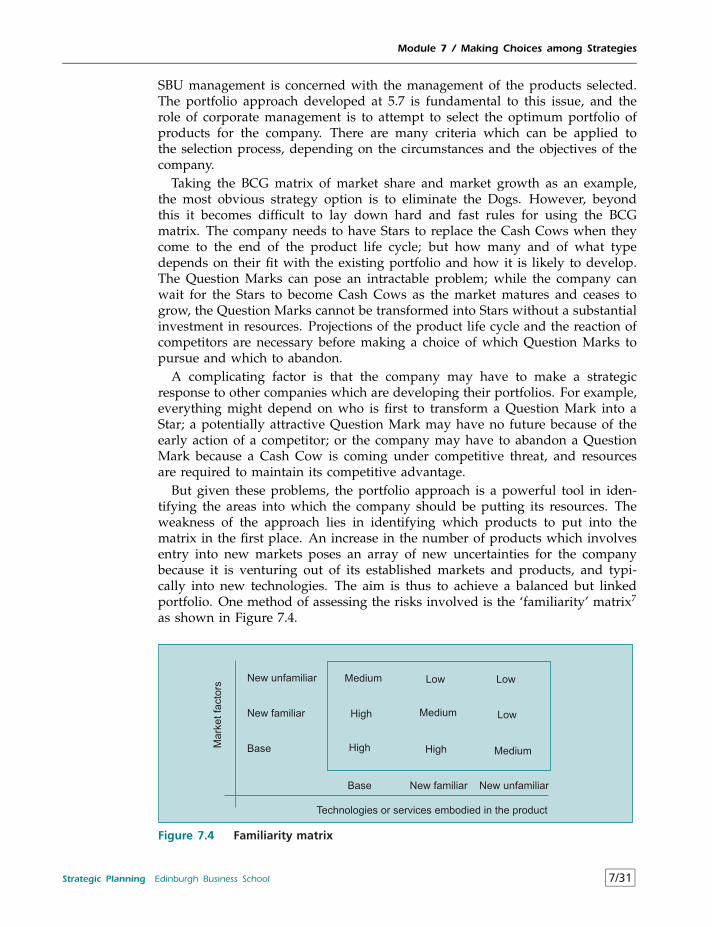
Module 7 / Making Choices among Strategies
SBU management is concerned with the management of the products selected.The portfolio approach developed at 5.7 is fundamental to this issue, and therole of corporate management is to attempt to select the optimum portfolio ofproducts for the company. There are many criteria which can be applied tothe selection process, depending on the circumstances and the objectives of thecompany.
Taking the BCG matrix of market share and market growth as an example,the most obvious strategy option is to eliminate the Dogs. However, beyondthis it becomes difficult to lay down hard and fast rules for using the BCGmatrix. The company needs to have Stars to replace the Cash Cows when theycome to the end of the product life cycle; but how many and of what typedepends on their fit with the existing portfolio and how it is likely to develop.The Question Marks can pose an intractable problem; while the company canwait for the Stars to become Cash Cows as the market matures and ceases togrow, the Question Marks cannot be transformed into Stars without a substantialinvestment in resources. Projections of the product life cycle and the reaction ofcompetitors are necessary before making a choice of which Question Marks topursue and which to abandon.
A complicating factor is that the company may have to make a strategicresponse to other companies which are developing their portfolios. For example,everything might depend on who is first to transform a Question Mark into aStar; a potentially attractive Question Mark may have no future because of theearly action of a competitor; or the company may have to abandon a QuestionMark because a Cash Cow is coming under competitive threat, and resourcesare required to maintain its competitive advantage.
But given these problems, the portfolio approach is a powerful tool in iden-tifying the areas into which the company should be putting its resources. Theweakness of the approach lies in identifying which products to put into thematrix in the first place. An increase in the number of products which involvesentry into new markets poses an array of new uncertainties for the companybecause it is venturing out of its established markets and products, and typi-cally into new technologies. The aim is thus to achieve a balanced but linkedportfolio. One method of assessing the risks involved is the ‘familiarity’ matrix7
as shown in Figure 7.4.
Base New familiar New unfamiliar
Technologies or services embodied in the product
Ma
rke
tfa
cto
rs
New unfamiliar
New familiar
Base
Medium
Medium
Medium
Low Low
LowHigh
High High
Figure 7.4 Familiarity matrix
Strategic Planning Edinburgh Business School 7/31
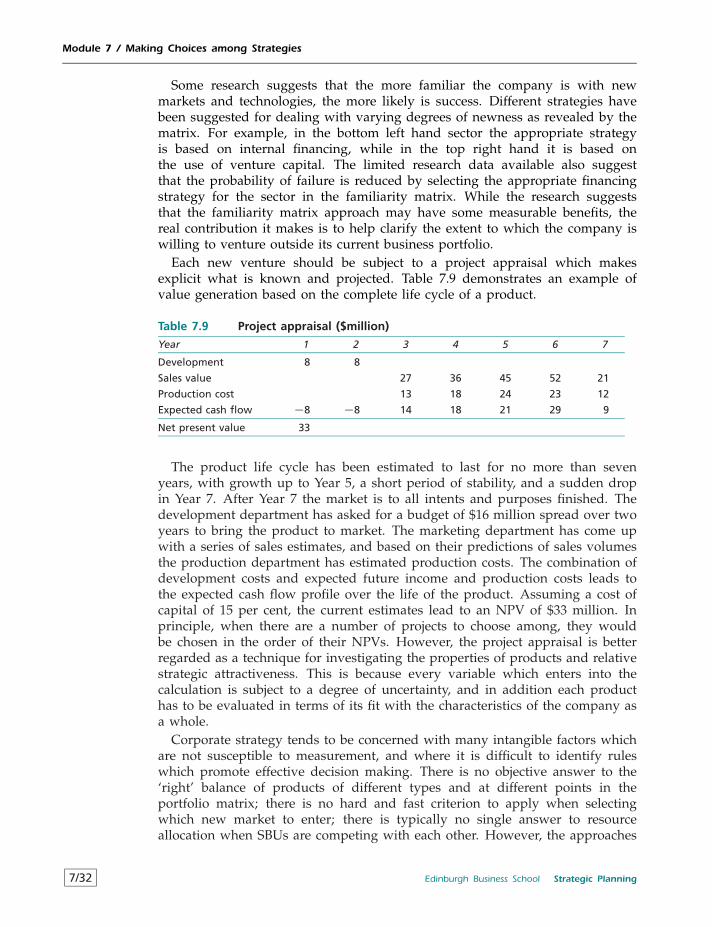
Module 7 / Making Choices among Strategies
Some research suggests that the more familiar the company is with newmarkets and technologies, the more likely is success. Different strategies havebeen suggested for dealing with varying degrees of newness as revealed by thematrix. For example, in the bottom left hand sector the appropriate strategyis based on internal financing, while in the top right hand it is based onthe use of venture capital. The limited research data available also suggestthat the probability of failure is reduced by selecting the appropriate financingstrategy for the sector in the familiarity matrix. While the research suggeststhat the familiarity matrix approach may have some measurable benefits, thereal contribution it makes is to help clarify the extent to which the company iswilling to venture outside its current business portfolio.
Each new venture should be subject to a project appraisal which makesexplicit what is known and projected. Table 7.9 demonstrates an example ofvalue generation based on the complete life cycle of a product.
Table 7.9 Project appraisal ($million)
Year 1 2 3 4 5 6 7
Development 8 8
Sales value 27 36 45 52 21
Production cost 13 18 24 23 12
Expected cash flow −8 −8 14 18 21 29 9
Net present value 33
The product life cycle has been estimated to last for no more than sevenyears, with growth up to Year 5, a short period of stability, and a sudden dropin Year 7. After Year 7 the market is to all intents and purposes finished. Thedevelopment department has asked for a budget of $16 million spread over twoyears to bring the product to market. The marketing department has come upwith a series of sales estimates, and based on their predictions of sales volumesthe production department has estimated production costs. The combination ofdevelopment costs and expected future income and production costs leads tothe expected cash flow profile over the life of the product. Assuming a cost ofcapital of 15 per cent, the current estimates lead to an NPV of $33 million. Inprinciple, when there are a number of projects to choose among, they wouldbe chosen in the order of their NPVs. However, the project appraisal is betterregarded as a technique for investigating the properties of products and relativestrategic attractiveness. This is because every variable which enters into thecalculation is subject to a degree of uncertainty, and in addition each producthas to be evaluated in terms of its fit with the characteristics of the company asa whole.
Corporate strategy tends to be concerned with many intangible factors whichare not susceptible to measurement, and where it is difficult to identify ruleswhich promote effective decision making. There is no objective answer to the‘right’ balance of products of different types and at different points in theportfolio matrix; there is no hard and fast criterion to apply when selectingwhich new market to enter; there is typically no single answer to resourceallocation when SBUs are competing with each other. However, the approaches
7/32 Edinburgh Business School Strategic Planning
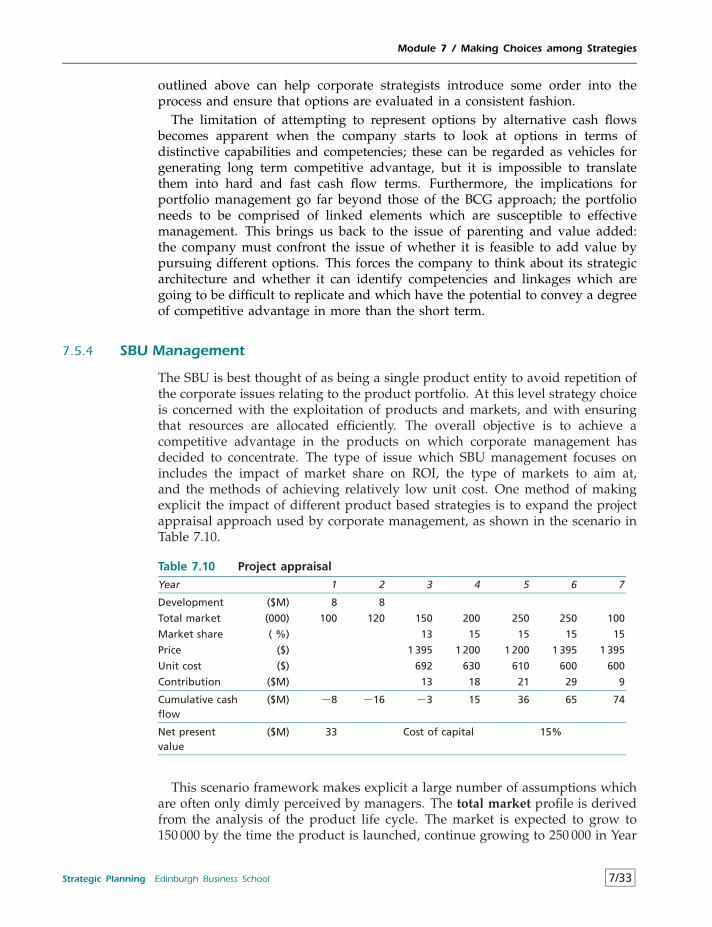
Module 7 / Making Choices among Strategies
outlined above can help corporate strategists introduce some order into theprocess and ensure that options are evaluated in a consistent fashion.
The limitation of attempting to represent options by alternative cash flowsbecomes apparent when the company starts to look at options in terms ofdistinctive capabilities and competencies; these can be regarded as vehicles forgenerating long term competitive advantage, but it is impossible to translatethem into hard and fast cash flow terms. Furthermore, the implications forportfolio management go far beyond those of the BCG approach; the portfolioneeds to be comprised of linked elements which are susceptible to effectivemanagement. This brings us back to the issue of parenting and value added:the company must confront the issue of whether it is feasible to add value bypursuing different options. This forces the company to think about its strategicarchitecture and whether it can identify competencies and linkages which aregoing to be difficult to replicate and which have the potential to convey a degreeof competitive advantage in more than the short term.
7.5.4 SBU Management
The SBU is best thought of as being a single product entity to avoid repetition ofthe corporate issues relating to the product portfolio. At this level strategy choiceis concerned with the exploitation of products and markets, and with ensuringthat resources are allocated efficiently. The overall objective is to achieve acompetitive advantage in the products on which corporate management hasdecided to concentrate. The type of issue which SBU management focuses onincludes the impact of market share on ROI, the type of markets to aim at,and the methods of achieving relatively low unit cost. One method of makingexplicit the impact of different product based strategies is to expand the projectappraisal approach used by corporate management, as shown in the scenario inTable 7.10.
Table 7.10 Project appraisal
Year 1 2 3 4 5 6 7
Development ($M) 8 8
Total market (000) 100 120 150 200 250 250 100
Market share ( %) 13 15 15 15 15
Price ($) 1 395 1 200 1 200 1 395 1 395
Unit cost ($) 692 630 610 600 600
Contribution ($M) 13 18 21 29 9
Cumulative cashflow
($M) −8 −16 −3 15 36 65 74
Net presentvalue
($M) 33 Cost of capital 15%
This scenario framework makes explicit a large number of assumptions whichare often only dimly perceived by managers. The total market profile is derivedfrom the analysis of the product life cycle. The market is expected to grow to150 000 by the time the product is launched, continue growing to 250 000 in Year
Strategic Planning Edinburgh Business School 7/33
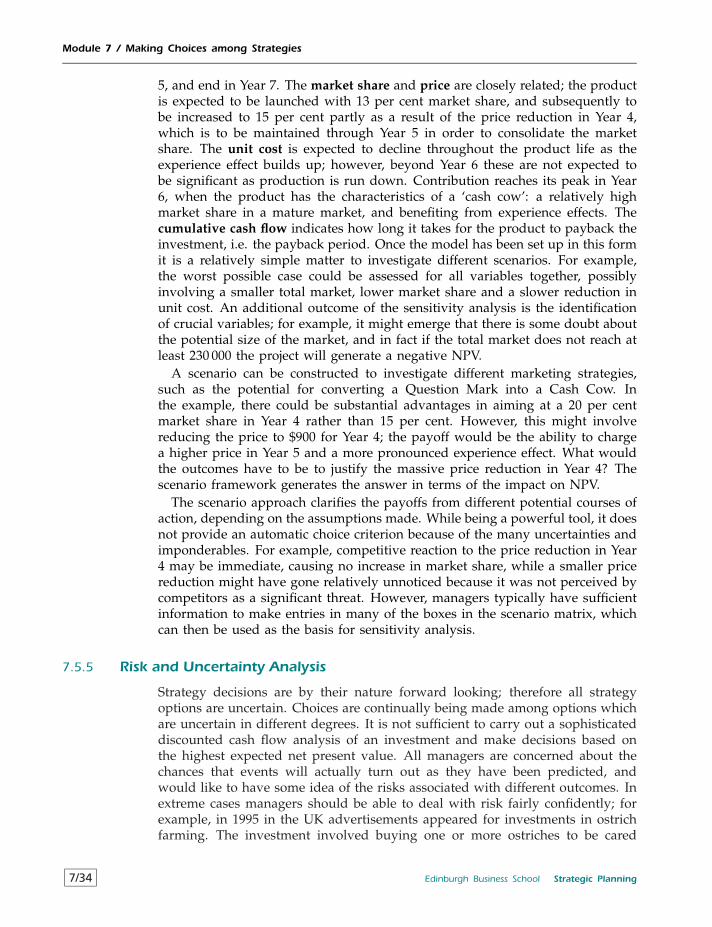
Module 7 / Making Choices among Strategies
5, and end in Year 7. The market share and price are closely related; the productis expected to be launched with 13 per cent market share, and subsequently tobe increased to 15 per cent partly as a result of the price reduction in Year 4,which is to be maintained through Year 5 in order to consolidate the marketshare. The unit cost is expected to decline throughout the product life as theexperience effect builds up; however, beyond Year 6 these are not expected tobe significant as production is run down. Contribution reaches its peak in Year6, when the product has the characteristics of a ‘cash cow’: a relatively highmarket share in a mature market, and benefiting from experience effects. Thecumulative cash flow indicates how long it takes for the product to payback theinvestment, i.e. the payback period. Once the model has been set up in this formit is a relatively simple matter to investigate different scenarios. For example,the worst possible case could be assessed for all variables together, possiblyinvolving a smaller total market, lower market share and a slower reduction inunit cost. An additional outcome of the sensitivity analysis is the identificationof crucial variables; for example, it might emerge that there is some doubt aboutthe potential size of the market, and in fact if the total market does not reach atleast 230 000 the project will generate a negative NPV.
A scenario can be constructed to investigate different marketing strategies,such as the potential for converting a Question Mark into a Cash Cow. Inthe example, there could be substantial advantages in aiming at a 20 per centmarket share in Year 4 rather than 15 per cent. However, this might involvereducing the price to $900 for Year 4; the payoff would be the ability to chargea higher price in Year 5 and a more pronounced experience effect. What wouldthe outcomes have to be to justify the massive price reduction in Year 4? Thescenario framework generates the answer in terms of the impact on NPV.
The scenario approach clarifies the payoffs from different potential courses ofaction, depending on the assumptions made. While being a powerful tool, it doesnot provide an automatic choice criterion because of the many uncertainties andimponderables. For example, competitive reaction to the price reduction in Year4 may be immediate, causing no increase in market share, while a smaller pricereduction might have gone relatively unnoticed because it was not perceived bycompetitors as a significant threat. However, managers typically have sufficientinformation to make entries in many of the boxes in the scenario matrix, whichcan then be used as the basis for sensitivity analysis.
7.5.5 Risk and Uncertainty Analysis
Strategy decisions are by their nature forward looking; therefore all strategyoptions are uncertain. Choices are continually being made among options whichare uncertain in different degrees. It is not sufficient to carry out a sophisticateddiscounted cash flow analysis of an investment and make decisions based onthe highest expected net present value. All managers are concerned about thechances that events will actually turn out as they have been predicted, andwould like to have some idea of the risks associated with different outcomes. Inextreme cases managers should be able to deal with risk fairly confidently; forexample, in 1995 in the UK advertisements appeared for investments in ostrichfarming. The investment involved buying one or more ostriches to be cared
7/34 Edinburgh Business School Strategic Planning
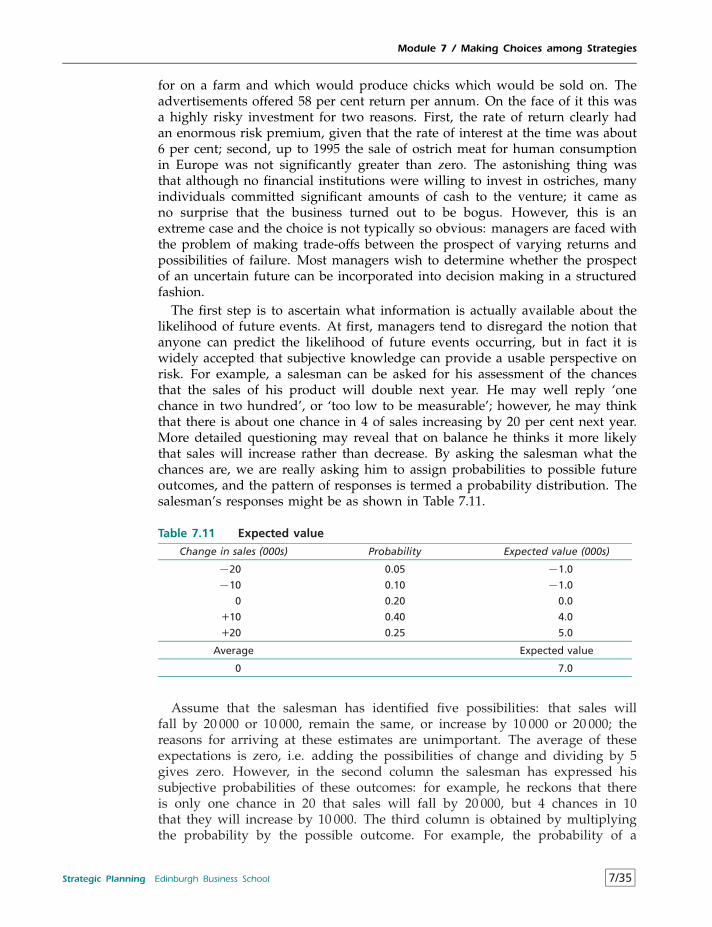
Module 7 / Making Choices among Strategies
for on a farm and which would produce chicks which would be sold on. Theadvertisements offered 58 per cent return per annum. On the face of it this wasa highly risky investment for two reasons. First, the rate of return clearly hadan enormous risk premium, given that the rate of interest at the time was about6 per cent; second, up to 1995 the sale of ostrich meat for human consumptionin Europe was not significantly greater than zero. The astonishing thing wasthat although no financial institutions were willing to invest in ostriches, manyindividuals committed significant amounts of cash to the venture; it came asno surprise that the business turned out to be bogus. However, this is anextreme case and the choice is not typically so obvious: managers are faced withthe problem of making trade-offs between the prospect of varying returns andpossibilities of failure. Most managers wish to determine whether the prospectof an uncertain future can be incorporated into decision making in a structuredfashion.
The first step is to ascertain what information is actually available about thelikelihood of future events. At first, managers tend to disregard the notion thatanyone can predict the likelihood of future events occurring, but in fact it iswidely accepted that subjective knowledge can provide a usable perspective onrisk. For example, a salesman can be asked for his assessment of the chancesthat the sales of his product will double next year. He may well reply ‘onechance in two hundred’, or ‘too low to be measurable’; however, he may thinkthat there is about one chance in 4 of sales increasing by 20 per cent next year.More detailed questioning may reveal that on balance he thinks it more likelythat sales will increase rather than decrease. By asking the salesman what thechances are, we are really asking him to assign probabilities to possible futureoutcomes, and the pattern of responses is termed a probability distribution. Thesalesman’s responses might be as shown in Table 7.11.
Table 7.11 Expected value
Change in sales (000s) Probability Expected value (000s)
−20 0.05 −1.0
−10 0.10 −1.0
0 0.20 0.0
+10 0.40 4.0
+20 0.25 5.0
Average Expected value
0 7.0
Assume that the salesman has identified five possibilities: that sales willfall by 20 000 or 10 000, remain the same, or increase by 10 000 or 20 000; thereasons for arriving at these estimates are unimportant. The average of theseexpectations is zero, i.e. adding the possibilities of change and dividing by 5gives zero. However, in the second column the salesman has expressed hissubjective probabilities of these outcomes: for example, he reckons that thereis only one chance in 20 that sales will fall by 20 000, but 4 chances in 10that they will increase by 10 000. The third column is obtained by multiplyingthe probability by the possible outcome. For example, the probability of a
Strategic Planning Edinburgh Business School 7/35

Module 7 / Making Choices among Strategies
20 000 increase is .25, giving an expected increase of 5000. The summation ofthese expected outcomes comes to 7000, i.e. taking the salesman’s subjectiveprobabilities into account he expects sales to increase by 7000 next year ratherthan the zero suggested by the simple average. Since the 7000 estimate takesinto account what the salesman feels he knows about the future it can be arguedthat it is a better basis for decision making than concluding that there will beno change in sales.
It is usually found that people who are familiar with particular marketsand production processes are able to express future outcomes in terms of theirchances of occurrence, and this information can be used in a systematic fashion.It will come as no surprise that there is a good deal of controversy surroundingthe use of subjective probabilities, and much depends on the credibility whichindividual managers attach to the information obtained. But even if managershave reservations about the probabilistic approach, it can still be used to providea perspective on risk which may otherwise not be appreciated. Take the examplein Table 7.12, where three potential outcomes from an investment have beenidentified and the risk associated with each estimated.
Table 7.12 Average outcome and expected value
Outcome Probability Expected value
−100 0.1 −10
50 0.2 10
200 0.7 140
Average Expected value
50 140
The most likely outcome in this case is that the investment will yield anoutcome of 200. This contributes to the fact that the average outcome is only50 compared to the expected value of 140 when the probabilities are taken intoaccount. The expected value of 140 would be used to compare this project withprojects of broadly similar characteristics. When decisions on investments arecontinually being taken, the proponents of the subjective probabilistic approachargue that over time the company will be more profitable than if it had usedthe unweighted average approach. Whether this is true or not depends on theextent to which subjective probabilities contain real information.
The table of possible outcomes and probabilities ignores an important issue,namely the attitude of managers to risk. A particular manager may feel that eventhough the probability of losing 100 is only one in ten, this is still an unacceptablerisk because it would result in the company going bankrupt. This is known asrisk aversion, and it would result in the manager preferring an investment witha lower expected value which did not contain the risk of bankruptcy in theprobability distribution. The expected value approach can conceal the fact thatrisks are not symmetrical, and therefore it would be folly to base decisions on theexpected values alone no matter what the ‘law of large numbers’ states, becausethe company may end up with a portfolio of projects each of which containedthe potential to bankrupt it. It is a well established fact that individuals do notalways act in accordance with ‘expected utility maximisation’, i.e. do not always
7/36 Edinburgh Business School Strategic Planning
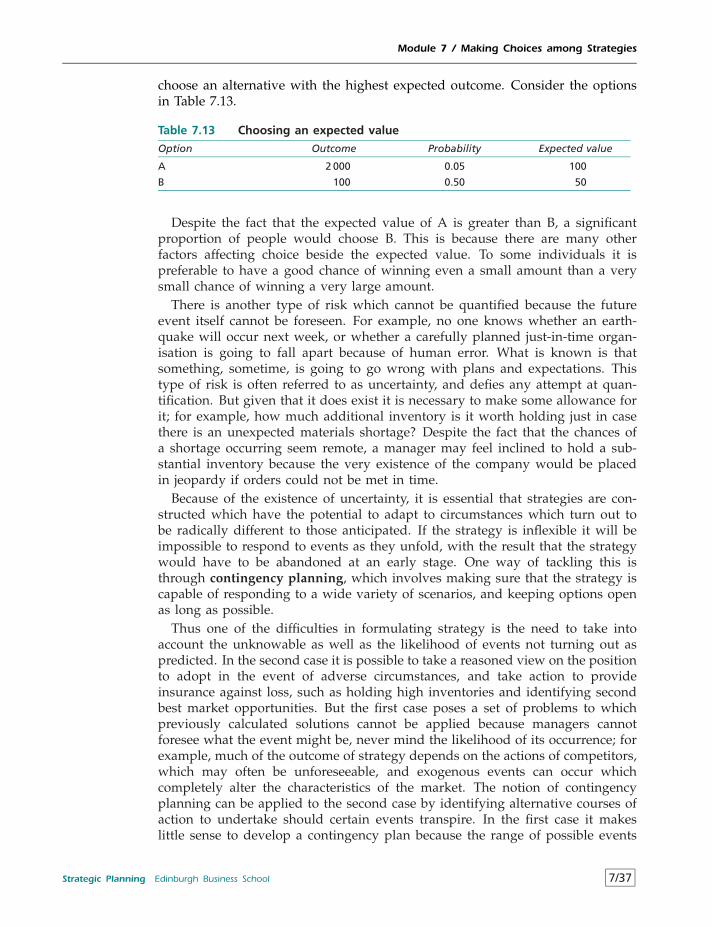
Module 7 / Making Choices among Strategies
choose an alternative with the highest expected outcome. Consider the optionsin Table 7.13.
Table 7.13 Choosing an expected value
Option Outcome Probability Expected value
A 2 000 0.05 100
B 100 0.50 50
Despite the fact that the expected value of A is greater than B, a significantproportion of people would choose B. This is because there are many otherfactors affecting choice beside the expected value. To some individuals it ispreferable to have a good chance of winning even a small amount than a verysmall chance of winning a very large amount.
There is another type of risk which cannot be quantified because the futureevent itself cannot be foreseen. For example, no one knows whether an earth-quake will occur next week, or whether a carefully planned just-in-time organ-isation is going to fall apart because of human error. What is known is thatsomething, sometime, is going to go wrong with plans and expectations. Thistype of risk is often referred to as uncertainty, and defies any attempt at quan-tification. But given that it does exist it is necessary to make some allowance forit; for example, how much additional inventory is it worth holding just in casethere is an unexpected materials shortage? Despite the fact that the chances ofa shortage occurring seem remote, a manager may feel inclined to hold a sub-stantial inventory because the very existence of the company would be placedin jeopardy if orders could not be met in time.
Because of the existence of uncertainty, it is essential that strategies are con-structed which have the potential to adapt to circumstances which turn out tobe radically different to those anticipated. If the strategy is inflexible it will beimpossible to respond to events as they unfold, with the result that the strategywould have to be abandoned at an early stage. One way of tackling this isthrough contingency planning, which involves making sure that the strategy iscapable of responding to a wide variety of scenarios, and keeping options openas long as possible.
Thus one of the difficulties in formulating strategy is the need to take intoaccount the unknowable as well as the likelihood of events not turning out aspredicted. In the second case it is possible to take a reasoned view on the positionto adopt in the event of adverse circumstances, and take action to provideinsurance against loss, such as holding high inventories and identifying secondbest market opportunities. But the first case poses a set of problems to whichpreviously calculated solutions cannot be applied because managers cannotforesee what the event might be, never mind the likelihood of its occurrence; forexample, much of the outcome of strategy depends on the actions of competitors,which may often be unforeseeable, and exogenous events can occur whichcompletely alter the characteristics of the market. The notion of contingencyplanning can be applied to the second case by identifying alternative courses ofaction to undertake should certain events transpire. In the first case it makeslittle sense to develop a contingency plan because the range of possible events
Strategic Planning Edinburgh Business School 7/37
Module 7 / Making Choices among Strategies
is limitless. But this does not alter the fact that managers need to have somealternative course of action in mind if future events make the pursuit of thecurrent strategy impossible.
There are therefore two types of contingency planning: first is the technicalprocess of attempting to minimise the probability of loss due to risk, andidentifying alternative courses of action in the event of potential outcomes;second is the strategic response to major unpredictable events. The first of thesecan be tackled by the application of ideas from the business disciplines, but thesecond poses more intractable problems. Responses to this type of problem arealmost wholly determined by managerial attitudes and perceptions.
Another factor which has a bearing on the choice between risky alternativesis the desire to diversify the portfolio of risks. For example, a company whichis currently making refrigerators may prefer to diversify into pocket TVs ratherthan freezers because the risks associated with refrigerators are less correlatedwith the risks associated with TVs and more correlated with the risks associatedwith freezers. When times are bad for refrigerators the positive cash flow fromTVs can be used to keep refrigerator production going and vice versa. The ideathat diversification can help guarantee the company’s survival is a compellingjustification for seeking opportunities to diversify risk. However, the managershould consider whether the benefits from diversification are imaginary or real.
One way to approach this is to ask whether the share price of a companyproducing refrigerators and TVs is greater than the sum of the share price of twocompanies producing the two goods. After all, a shareholder could diversify hisrisks by buying shares in the two companies, and may prefer this to a compositeshare. Furthermore, if the company feels that it is worthwhile to ‘bail out’ the TVcompany from time to time, the same thing must apply to the financial marketas a whole, which will always be willing to provide finance for a companywhich has a positive net present value.
7.5.6 Managerial Perceptions
The application of sophisticated information gathering and analytical techniquesdoes not of itself generate a strategy choice. At the end of the day someonehas to weigh up the arguments for and against different courses of actionand arrive at a decision on strategy. This someone may be the CEO, or itmay be a group of decision makers, and the process by which the decision isfinally arrived at may be obscure; after the event it may be identified as logicalincrementalism or emergent strategies. Those who carried out the analysesmay feel that little attention was paid to their conclusions; or the CEO maydraw opposite conclusions to the analysts from precisely the same information;analysts themselves may feel that the CEO does not fully comprehend theimplications of their findings. It is in fact very difficult for outside observers toassess the rationality of decision making processes in a particular organisation;this is because the personal objectives of decision makers may not be known,and therefore the weighting which they attribute to different factors cannot betaken into account when attempting to explain their decisions. However, thereare a number of factors which bear on decision makers which might help toexplain observed behaviour.
7/38 Edinburgh Business School Strategic Planning
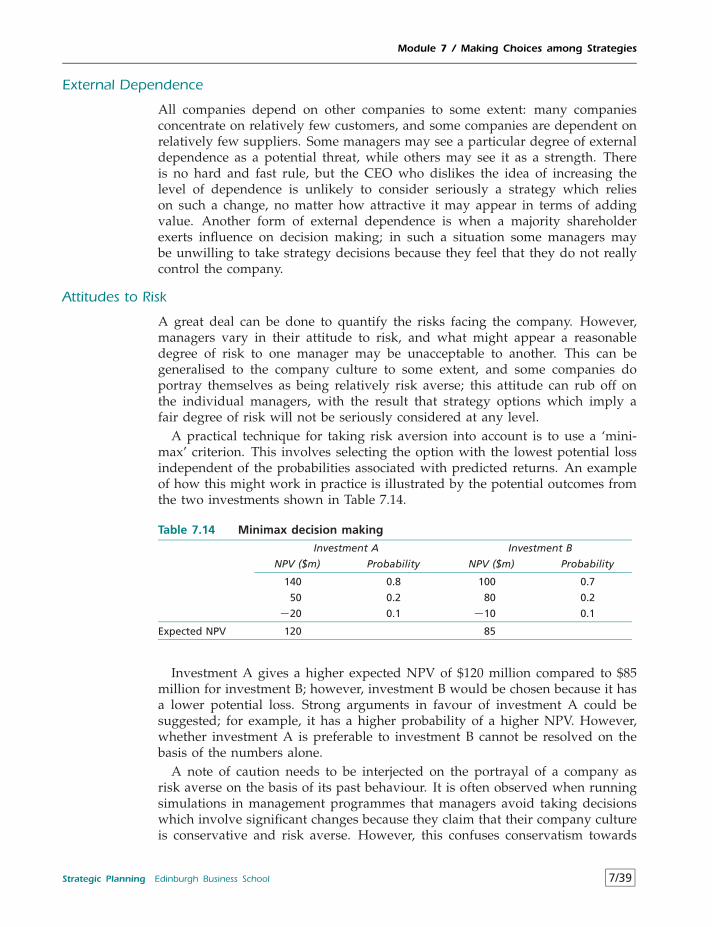
Module 7 / Making Choices among Strategies
External Dependence
All companies depend on other companies to some extent: many companiesconcentrate on relatively few customers, and some companies are dependent onrelatively few suppliers. Some managers may see a particular degree of externaldependence as a potential threat, while others may see it as a strength. Thereis no hard and fast rule, but the CEO who dislikes the idea of increasing thelevel of dependence is unlikely to consider seriously a strategy which relieson such a change, no matter how attractive it may appear in terms of addingvalue. Another form of external dependence is when a majority shareholderexerts influence on decision making; in such a situation some managers maybe unwilling to take strategy decisions because they feel that they do not reallycontrol the company.
Attitudes to Risk
A great deal can be done to quantify the risks facing the company. However,managers vary in their attitude to risk, and what might appear a reasonabledegree of risk to one manager may be unacceptable to another. This can begeneralised to the company culture to some extent, and some companies doportray themselves as being relatively risk averse; this attitude can rub off onthe individual managers, with the result that strategy options which imply afair degree of risk will not be seriously considered at any level.
A practical technique for taking risk aversion into account is to use a ‘mini-max’ criterion. This involves selecting the option with the lowest potential lossindependent of the probabilities associated with predicted returns. An exampleof how this might work in practice is illustrated by the potential outcomes fromthe two investments shown in Table 7.14.
Table 7.14 Minimax decision making
Investment A Investment B
NPV ($m) Probability NPV ($m) Probability
140 0.8 100 0.7
50 0.2 80 0.2
−20 0.1 −10 0.1
Expected NPV 120 85
Investment A gives a higher expected NPV of $120 million compared to $85million for investment B; however, investment B would be chosen because it hasa lower potential loss. Strong arguments in favour of investment A could besuggested; for example, it has a higher probability of a higher NPV. However,whether investment A is preferable to investment B cannot be resolved on thebasis of the numbers alone.
A note of caution needs to be interjected on the portrayal of a company asrisk averse on the basis of its past behaviour. It is often observed when runningsimulations in management programmes that managers avoid taking decisionswhich involve significant changes because they claim that their company cultureis conservative and risk averse. However, this confuses conservatism towards
Strategic Planning Edinburgh Business School 7/39
Module 7 / Making Choices among Strategies
making changes, with risk aversion: this ‘conservative’ approach is not based onan explicit analysis of risk factors, and therefore it may not be recognised thatavoiding change can incur higher risks than decisions involving a reallocationof resources. Indeed, managers are often observed to have a form of decisionparalysis in which they are unwilling to stray far from what has been donein the past, no matter how poor the results of past strategy have been. Somecompanies are better portrayed as being ‘risk ignorant’ rather than ‘risk averse’.
Previous Strategies
The process of strategy is continually evolving, and because of changing circum-stances no particular strategy can be regarded as sacrosanct. The time may comewhen a major strategy decision needs to be taken which involves a significantchange from previous strategies. However, managers may have invested sub-stantial personal resources in the identification and implementation of strategy todate, and the current strategy may be regarded as a component of the corporateculture. In such circumstances, managers may be unwilling to make significantchanges until external factors force a response; this can cause a company toadopt a passive stance to strategy. Indeed, the very success of the previous strat-egy may contain the seeds of future disaster because of the natural tendency totake refuge in a tried and tested approach.
Managerial Power Relationships
All organisations have their own internal politics. The process of decision makinghas infinite variety, from the friendly compromise reached between brothersrunning a family business, to the autocratic dictates of a powerful CEO incharge of a large multinational. The aversion to external dependence on the partof the powerful CEO might dominate decision making, despite the fact that allof the analyses carried out support a greater degree of external dependence, andthat most managers in the company are in favour of it.
To some extent this is related to the principal/agent issue, where the objectivesof managers are not necessarily consistent with those of shareholders. For exam-ple, an SBU manager may be opposed to a strategy which involves retrenchmentof his SBU despite the fact that it is in the interests of the company as a whole;he may have a strong influence on strategy choice because he is regarded as oneof the ‘elder statesmen’ in the company. He will probably not present his oppo-sition in terms of personal predilection; however, those knowing his attachmentto the SBU could probably predict that he would oppose the strategy withoutnecessarily knowing on what grounds he would do so.
The experience of running simulations with groups of managers reveals thatmore time is typically spent on arriving at decisions than analysing informationand working out alternative courses of action. Teams of managers often feelthat they have wasted a great deal of their time in fruitless discussion, and thatdecisions were not always arrived at on the basis of analysis alone. This is areflection of what happens in real life management teams, in that decisions aredifficult to arrive at, and it would be naive to presume that the available factsspeak for themselves and enable decisions to be arrived at relatively painlessly.
7/40 Edinburgh Business School Strategic Planning
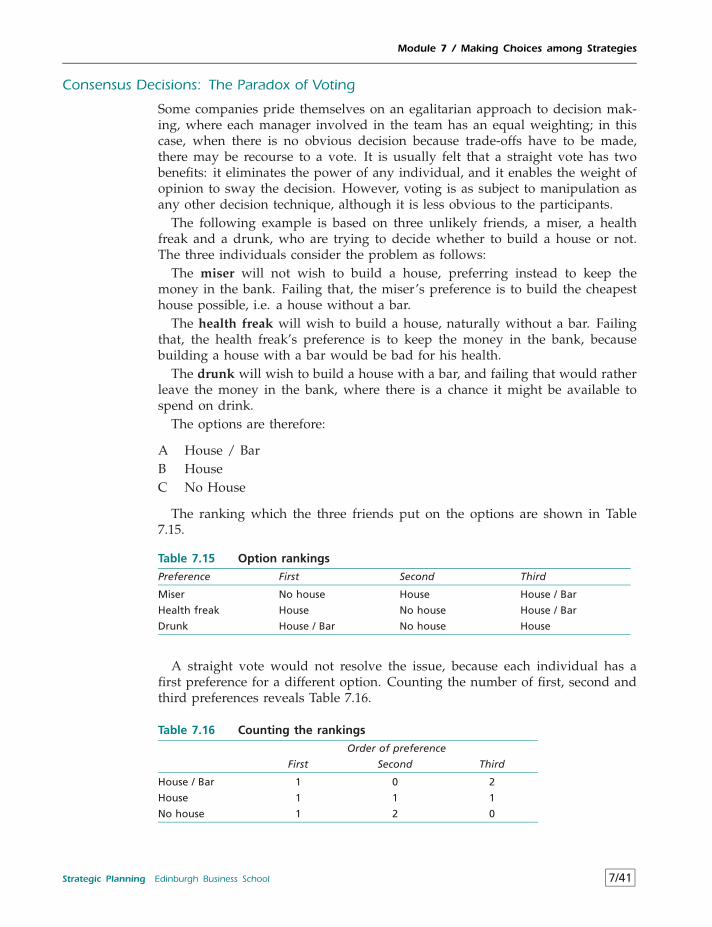
Module 7 / Making Choices among Strategies
Consensus Decisions: The Paradox of Voting
Some companies pride themselves on an egalitarian approach to decision mak-ing, where each manager involved in the team has an equal weighting; in thiscase, when there is no obvious decision because trade-offs have to be made,there may be recourse to a vote. It is usually felt that a straight vote has twobenefits: it eliminates the power of any individual, and it enables the weight ofopinion to sway the decision. However, voting is as subject to manipulation asany other decision technique, although it is less obvious to the participants.
The following example is based on three unlikely friends, a miser, a healthfreak and a drunk, who are trying to decide whether to build a house or not.The three individuals consider the problem as follows:
The miser will not wish to build a house, preferring instead to keep themoney in the bank. Failing that, the miser’s preference is to build the cheapesthouse possible, i.e. a house without a bar.
The health freak will wish to build a house, naturally without a bar. Failingthat, the health freak’s preference is to keep the money in the bank, becausebuilding a house with a bar would be bad for his health.
The drunk will wish to build a house with a bar, and failing that would ratherleave the money in the bank, where there is a chance it might be available tospend on drink.
The options are therefore:
A House / BarB HouseC No House
The ranking which the three friends put on the options are shown in Table7.15.
Table 7.15 Option rankings
Preference First Second Third
Miser No house House House / Bar
Health freak House No house House / Bar
Drunk House / Bar No house House
A straight vote would not resolve the issue, because each individual has afirst preference for a different option. Counting the number of first, second andthird preferences reveals Table 7.16.
Table 7.16 Counting the rankings
Order of preference
First Second Third
House / Bar 1 0 2
House 1 1 1
No house 1 2 0
Strategic Planning Edinburgh Business School 7/41
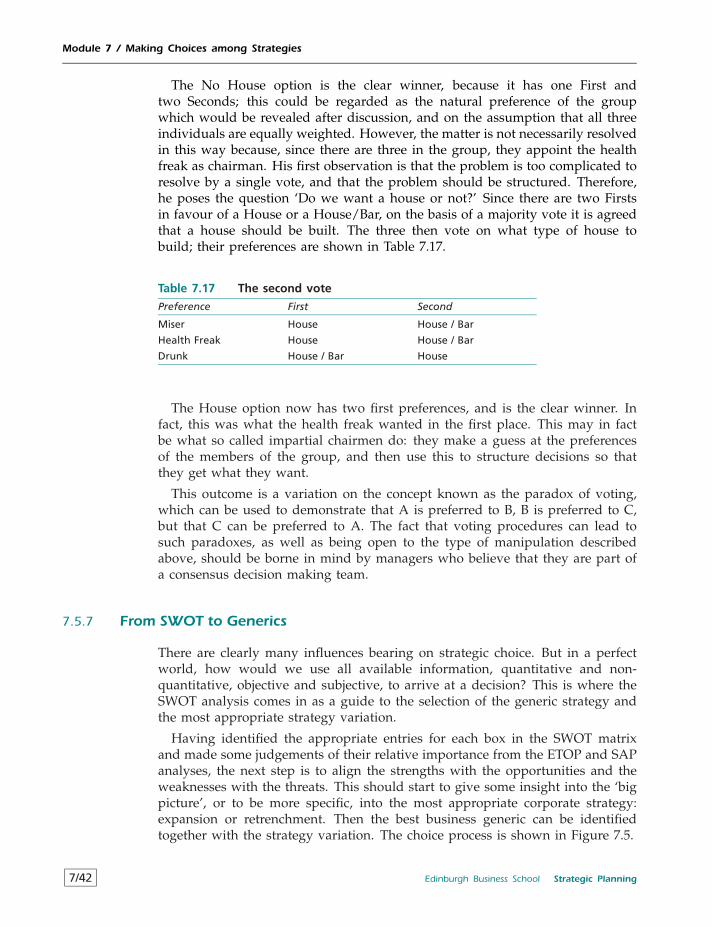
Module 7 / Making Choices among Strategies
The No House option is the clear winner, because it has one First andtwo Seconds; this could be regarded as the natural preference of the groupwhich would be revealed after discussion, and on the assumption that all threeindividuals are equally weighted. However, the matter is not necessarily resolvedin this way because, since there are three in the group, they appoint the healthfreak as chairman. His first observation is that the problem is too complicated toresolve by a single vote, and that the problem should be structured. Therefore,he poses the question ‘Do we want a house or not?’ Since there are two Firstsin favour of a House or a House/Bar, on the basis of a majority vote it is agreedthat a house should be built. The three then vote on what type of house tobuild; their preferences are shown in Table 7.17.
Table 7.17 The second vote
Preference First Second
Miser House House / Bar
Health Freak House House / Bar
Drunk House / Bar House
The House option now has two first preferences, and is the clear winner. Infact, this was what the health freak wanted in the first place. This may in factbe what so called impartial chairmen do: they make a guess at the preferencesof the members of the group, and then use this to structure decisions so thatthey get what they want.
This outcome is a variation on the concept known as the paradox of voting,which can be used to demonstrate that A is preferred to B, B is preferred to C,but that C can be preferred to A. The fact that voting procedures can lead tosuch paradoxes, as well as being open to the type of manipulation describedabove, should be borne in mind by managers who believe that they are part ofa consensus decision making team.
7.5.7 From SWOT to Generics
There are clearly many influences bearing on strategic choice. But in a perfectworld, how would we use all available information, quantitative and non-quantitative, objective and subjective, to arrive at a decision? This is where theSWOT analysis comes in as a guide to the selection of the generic strategy andthe most appropriate strategy variation.
Having identified the appropriate entries for each box in the SWOT matrixand made some judgements of their relative importance from the ETOP and SAPanalyses, the next step is to align the strengths with the opportunities and theweaknesses with the threats. This should start to give some insight into the ‘bigpicture’, or to be more specific, into the most appropriate corporate strategy:expansion or retrenchment. Then the best business generic can be identifiedtogether with the strategy variation. The choice process is shown in Figure 7.5.
7/42 Edinburgh Business School Strategic Planning
Module 7 / Making Choices among Strategies
Strengths Opportunities
Corporate Business
Expansion Low cost
Threats Weaknesses Retrench Differentiatedniche
SWOT STRATEGY
Variation
Alliance
Divest
Figure 7.5 Choice process
The figure shows two diametrically opposed outcomes of a SWOT analysis.One analysis has identified an alignment of strengths and opportunities whichopens the possibility of expansion by alliance. The other shows that the align-ment of weaknesses and threats is such that the company should retrench andfocus on a niche; this could be the outcome of recognising that it is ‘stuck in themiddle’. What happens if both of these are identified within the same SWOTanalysis? That is when the CEO has some tough choices to make and reallystarts to earn her money.
Case 1: Revisit Salmon Farming
In Module 5 you were asked to evaluate the prospects for the future of the salmonfarming industry. Carry out a SWOT analysis for a typical salmon farm and derive ageneric strategy.
Case 2: Revisit Lymeswold
In Module 5 you discussed what went wrong with Lymeswold cheese. Revisit thecase and devise a strategy for success.
Case 3: Revisit a Prestigious Price War
In Module 5 you analysed competition in the quality newspaper market. What actionwould you recommend for the Daily Telegraph, and what do you think its prospectswould be?
Case 4: Revisit General Motors
In Module 6 you analysed General Motors. Suggest a strategy for the future of GM,and be clear about your reasoning.
Strategic Planning Edinburgh Business School 7/43
Module 7 / Making Choices among Strategies
Case 5: The Rise and Fall of Amstrad (1993)Amstrad was something of an electronics industry phenomenon in the 1980sunder the leadership of Alan Sugar. The basis of the company’s success was tooffer consumers products which did not depend on a technological breakthroughbut were based on Sugar’s understanding of what consumers really want. In thelate 1970s the Tower System integrated the amplifier, tuner and cassette deck inone unit and brought sophisticated hi-fi systems within the reach of just abouteveryone. Amstrad then moved on to a low cost, one plug computer systemwhich brought word processing cheaply to a mass market. The company thenmoved into cheap facsimile machines, video recorders and satellite dishes.
Company profits climbed steadily from 1980 from practically zero to about £20million by 1985. In 1986 profits more than doubled, in 1987 they doubled again,and in 1988 reached £160 million. They then proceeded to halve in 1989, fellagain in 1990 and 1991, and a loss was forecast for 1992. As would be expected,the price of Amstrad shares peaked in 1987, and lost about 90 per cent of theirvalue by 1992.
A major element of Sugar’s strategy was to move out of a product as soonas competition became tough and margins were eroded. However, Amstrad didnot leave the personal computer market when margins virtually disappeared,and found itself saddled with unsold stocks of out of date computers and wasrelatively slow to introduce new eye-catching products. At the moment thecompany has a range of new products on offer, such as a user-friendly notepadpersonal computer and a videophone. However, the formula of selling easy touse electronic goods at low prices has been taken up by other companies.
The company went public in 1980, and in 1992 Sugar attempted but failed tobuy back all the shares. The objective of buying back the shares was to renewSugar’s absolute control over the company, and make it possible to revert tohis original strategic vision. However, the shareholders considered that the dealproposed was not in their best interests.
Question
Classify the Amstrad strategy in as many dimensions as you can using the ideasdeveloped in this Module, and apply ideas from previous Modules to interpretthe situation in which Amstrad finds itself.
Case 6: What Is a Jaguar Worth? (1992)The Ford Motor Company took over the British prestige car company Jaguar inNovember 1989 for about £1.5 billion. Two years later Jaguar lost £60 million inthe third quarter, and prospects were not good, for example sales in the US hadfallen from 24 000 cars in 1987 to 10 000 cars in 1989. Even at the time of thetake-over Jaguar was not making a profit, so why was such a large amount paidfor the company? Jaguar had very little value in terms of hard assets – probablyno more than £250 million according to the company accounts; however, it hada reputation and established share in the luxury car market, and £1.1 billion ofthe purchase price was regarded as ‘goodwill’ by Ford. Furthermore, when the
7/44 Edinburgh Business School Strategic Planning
Module 7 / Making Choices among Strategies
Ford executives arrived at the Jaguar factory after the take-over they discoveredthat the much vaunted recovery which Jaguar had experienced during the 1980sunder the direction of Sir John Egan had not extended to efficient workingpractices and quality control; costs were still relatively high, and the workforcehad not adopted modern team-working methods. One Ford executive evencompared Jaguar unfavourably with Russian plants.
The first action taken by Ford was to scrap the J-type model under devel-opment, which was described as being ‘overweight, under-powered and overbudget’. The workforce was trimmed by 30 per cent in two years, and stepswere taken to improve reliability, which was causing the car to generate poorcustomer satisfaction ratings. Face-lifts were carried out to the XJS and the XK6models, but otherwise no changes were made to the product line. The problemshad been compounded by the entry of the Japanese into the market with theLexus, which was much the same price as a Jaguar and had already gained anoutstanding reputation for quality and reliability. The Lexus had increased itssales in the US at a time when the market had slumped and Jaguar sales felldramatically.
One suggestion for the high price paid is that in 1989 Ford had a cashmountain of some $9 billion, and was looking for an opportunity to put thisto work. One route to expansion was to enter the luxury car market, and GMhad already expressed an interest in Jaguar in the role of a minority shareholderwith an injection rumoured to be about £600 million. This could therefore beseen as a pre-emptive bid to ensure that Ford entered the luxury car marketwith a ready made product and an established market share.
Question
Use the list of reasons for a take-over to identify the areas in which Fordmight have reckoned that there was potential for creating value by investing asignificant proportion of this cash mountain in Jaguar.
Case 7: Good Morning Television Has a Bad Day (1993)
The following is an account of the experience of Good Morning Television(GMTV) from the time of making a successful bid for the UK advertiser-financedbreakfast TV franchise in October 1991 until early 1993, three months after itstarted broadcasting on January 1, 1993.
The Bid
The regional independent TV franchises in the UK were auctioned in October1991, to take effect from January 1993. The terms of the bid were an annualfee that an applicant would pay to the Treasury for a licence covering a periodof ten years. This licence conveyed a local monopoly to the franchise holder ofadvertiser-financed television. In the case of breakfast TV it conveyed the rightto broadcast national breakfast programmes; the only other advertising-financed
Strategic Planning Edinburgh Business School 7/45
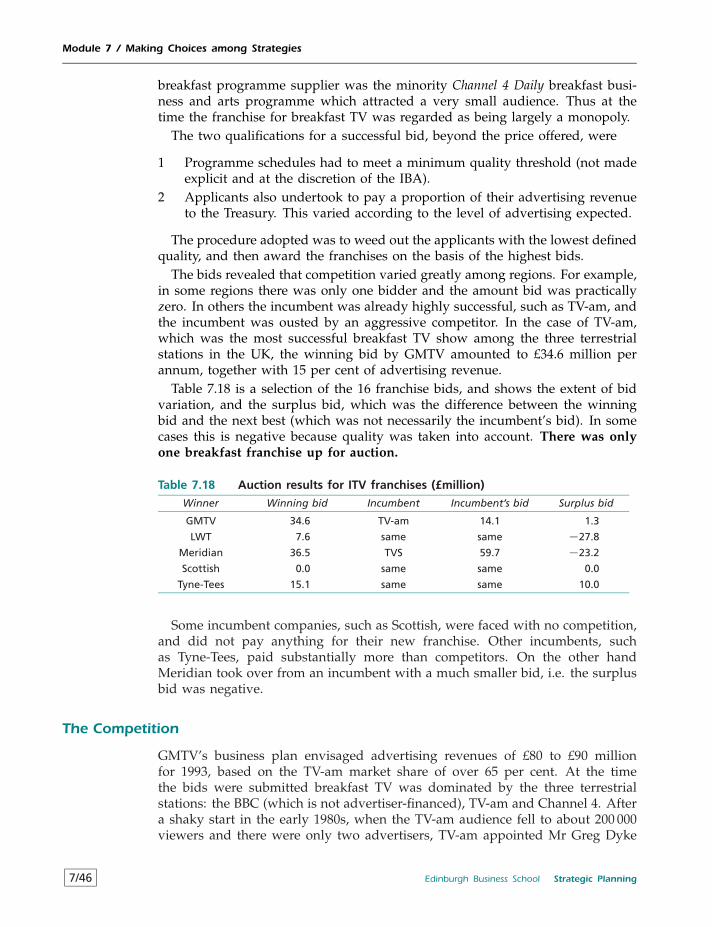
Module 7 / Making Choices among Strategies
breakfast programme supplier was the minority Channel 4 Daily breakfast busi-ness and arts programme which attracted a very small audience. Thus at thetime the franchise for breakfast TV was regarded as being largely a monopoly.
The two qualifications for a successful bid, beyond the price offered, were
1 Programme schedules had to meet a minimum quality threshold (not madeexplicit and at the discretion of the IBA).
2 Applicants also undertook to pay a proportion of their advertising revenueto the Treasury. This varied according to the level of advertising expected.
The procedure adopted was to weed out the applicants with the lowest definedquality, and then award the franchises on the basis of the highest bids.
The bids revealed that competition varied greatly among regions. For example,in some regions there was only one bidder and the amount bid was practicallyzero. In others the incumbent was already highly successful, such as TV-am, andthe incumbent was ousted by an aggressive competitor. In the case of TV-am,which was the most successful breakfast TV show among the three terrestrialstations in the UK, the winning bid by GMTV amounted to £34.6 million perannum, together with 15 per cent of advertising revenue.
Table 7.18 is a selection of the 16 franchise bids, and shows the extent of bidvariation, and the surplus bid, which was the difference between the winningbid and the next best (which was not necessarily the incumbent’s bid). In somecases this is negative because quality was taken into account. There was onlyone breakfast franchise up for auction.
Table 7.18 Auction results for ITV franchises (£million)
Winner Winning bid Incumbent Incumbent’s bid Surplus bid
GMTV 34.6 TV-am 14.1 1.3
LWT 7.6 same same −27.8
Meridian 36.5 TVS 59.7 −23.2
Scottish 0.0 same same 0.0
Tyne-Tees 15.1 same same 10.0
Some incumbent companies, such as Scottish, were faced with no competition,and did not pay anything for their new franchise. Other incumbents, suchas Tyne-Tees, paid substantially more than competitors. On the other handMeridian took over from an incumbent with a much smaller bid, i.e. the surplusbid was negative.
The Competition
GMTV’s business plan envisaged advertising revenues of £80 to £90 millionfor 1993, based on the TV-am market share of over 65 per cent. At the timethe bids were submitted breakfast TV was dominated by the three terrestrialstations: the BBC (which is not advertiser-financed), TV-am and Channel 4. Aftera shaky start in the early 1980s, when the TV-am audience fell to about 200 000viewers and there were only two advertisers, TV-am appointed Mr Greg Dyke
7/46 Edinburgh Business School Strategic Planning
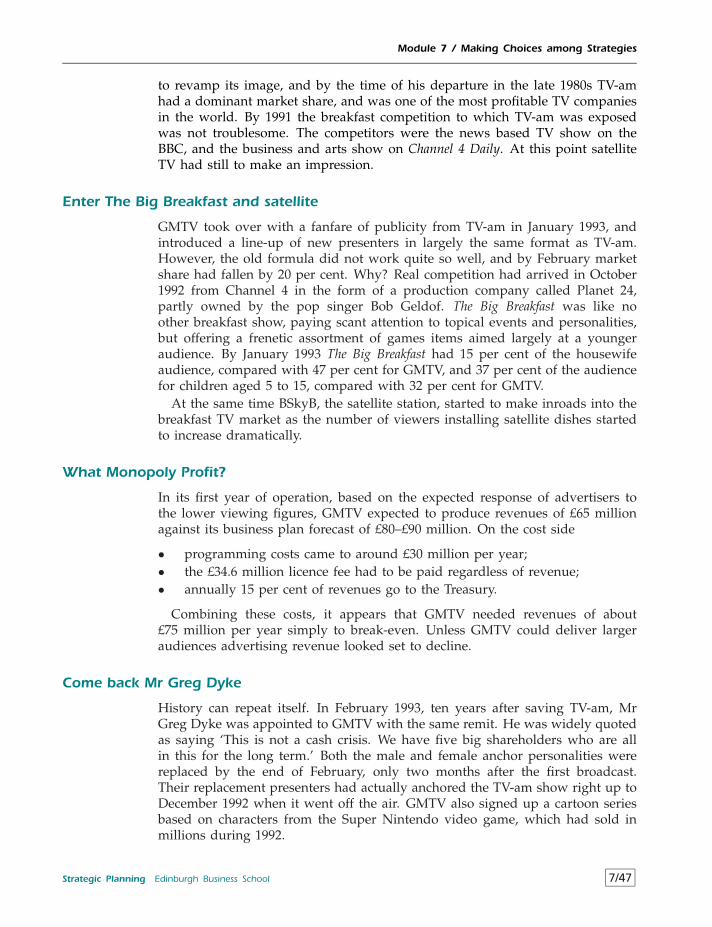
Module 7 / Making Choices among Strategies
to revamp its image, and by the time of his departure in the late 1980s TV-amhad a dominant market share, and was one of the most profitable TV companiesin the world. By 1991 the breakfast competition to which TV-am was exposedwas not troublesome. The competitors were the news based TV show on theBBC, and the business and arts show on Channel 4 Daily. At this point satelliteTV had still to make an impression.
Enter The Big Breakfast and satellite
GMTV took over with a fanfare of publicity from TV-am in January 1993, andintroduced a line-up of new presenters in largely the same format as TV-am.However, the old formula did not work quite so well, and by February marketshare had fallen by 20 per cent. Why? Real competition had arrived in October1992 from Channel 4 in the form of a production company called Planet 24,partly owned by the pop singer Bob Geldof. The Big Breakfast was like noother breakfast show, paying scant attention to topical events and personalities,but offering a frenetic assortment of games items aimed largely at a youngeraudience. By January 1993 The Big Breakfast had 15 per cent of the housewifeaudience, compared with 47 per cent for GMTV, and 37 per cent of the audiencefor children aged 5 to 15, compared with 32 per cent for GMTV.
At the same time BSkyB, the satellite station, started to make inroads into thebreakfast TV market as the number of viewers installing satellite dishes startedto increase dramatically.
What Monopoly Profit?
In its first year of operation, based on the expected response of advertisers tothe lower viewing figures, GMTV expected to produce revenues of £65 millionagainst its business plan forecast of £80–£90 million. On the cost side
• programming costs came to around £30 million per year;• the £34.6 million licence fee had to be paid regardless of revenue;• annually 15 per cent of revenues go to the Treasury.
Combining these costs, it appears that GMTV needed revenues of about£75 million per year simply to break-even. Unless GMTV could deliver largeraudiences advertising revenue looked set to decline.
Come back Mr Greg Dyke
History can repeat itself. In February 1993, ten years after saving TV-am, MrGreg Dyke was appointed to GMTV with the same remit. He was widely quotedas saying ‘This is not a cash crisis. We have five big shareholders who are allin this for the long term.’ Both the male and female anchor personalities werereplaced by the end of February, only two months after the first broadcast.Their replacement presenters had actually anchored the TV-am show right up toDecember 1992 when it went off the air. GMTV also signed up a cartoon seriesbased on characters from the Super Nintendo video game, which had sold inmillions during 1992.
Strategic Planning Edinburgh Business School 7/47
Module 7 / Making Choices among Strategies
Questions
1 Analyse the competitive environment facing a franchise bidder.2 What strategic errors did GMTV make from bid submission up to the arrival
of Greg Dyke?3 What strategic options are available to Greg Dyke?
Case 8: The Rise and Fall of Brands (1996)
The heyday for brands
During the 1980s many companies capitalised on consumer loyalty to brands byincreasing prices in excess of the inflation rate, and firms such as Kellogg andHeinz increased profits by about 15 per cent per year. In 1988 the value placedon brands was reflected in the following acquisition prices.
Buyer Taken over Price Paid Book Value($ billion) ($ billion)
Kohlberg KravisRoberts
RJR Nabisco 25 12
Philip Morris Kraft 13 3Nestle Rowntree 5 1
Admittedly, Book Value does not fully reflect the value of a company, but itis clear that predators were willing to pay substantial amounts for well knownbrand names. For example, by 1990 shares in US packaged-food firms weretrading at a 30 per cent premium to Standard & Poor’s 500-stock index.
Brands lose their magic
By the early 1990s some influences had emerged which undermined the dom-ination of brands. First, there was a recession in the early 1990s which led toincreased competition among established brands. There was a plethora of spe-cial offers for branded goods which may have started to make consumers moreprice aware. Second, retailers began developing their own-label products. Theeffect of these two factors can be gauged from the fact that on 2nd April 1993Philip Morris reduced the price of Marlboro cigarettes, regarded by many as themost successful brand in history. The price reduction was primarily due to thefact that Marlboro had been losing market share to unknown brands for severalyears, rather than losing share to the other major brands. The immediate impactof the price reduction was that 23 per cent was wiped off the value of PhilipMorris shares. But there was also a knock-on effect, and shares in RJR, Procter& Gamble, Coca-Cola, PepsiCo, Quaker Oats and Gillette all suffered.
Consumer research studies found that the proportion of shoppers willing toseek out particular brands and pay more for them fell sharply during the early1990s; it was also found that the market share of the top three brands among
7/48 Edinburgh Business School Strategic Planning
Module 7 / Making Choices among Strategies
many categories of supermarket goods dropped. By 1994 own-label brands took36 per cent of grocery sales in the UK and 24 per cent in the US.
There seem to be three main reasons for this
• Perceived product parity: by 1993 research suggested that about two thirdsof consumers world-wide believe there were ‘no relevant or discernibledifferences’ between rival brands across a wide range of products. In fact,consumers are often faced with a staggering variety of brand choice. Thishas partly been due to technological advances which made it possibleto imitate a wide variety of goods; in 1992 16 800 new products wereintroduced in the US, 30 per cent more than five years previously. Thereare 200 brands of breakfast cereal in the US and 100 perfumes in Argentina.It may also be partly due to increasingly educated consumers who spendmore rationally.
• Promotion monster: with the combination of recession and a huge increasein the number of brands, retailers began to auction shelf space (particularlyin the US). Retailers were also given more discretion over pricing, and inBritain this sometimes led supermarkets to sell top brands at below cost asloss leaders.
• Own-label threat: not only was there a surge in own-label brands, butconsumers are right that there is often no difference in quality. This ispartly because most big branded-goods manufacturers started producingown-label products for supermarkets; once consumers became aware of thisthe magic associated with the brand name was lost. Another dimension tothe own-label brand was that supermarkets starting to use their own label(‘good food costs less at Sainsbury’) as a brand in its own right; this servedas an umbrella to cover hundreds of products.
The advertising industry took the stance that increased expenditure on adver-tising would shore up brand loyalty. But, with the advent of satellite and cabletelevision and the proliferation of channels, audiences were fragmenting withthe result that uniform advertising was no longer possible.
Some reactions
Clearly companies had to adapt in the face of these changing market conditions,and their reactions took different forms.
What Procter & Gamble did
This changing market posed difficulties for giant firms like Procter & Gamble,which had 2300 brand varieties in 1992. During 1992 Procter & Gamble slashedthe wholesale prices of about 70 per cent of its products, and eliminated dis-counts to retailers to reward customer loyalty with low prices. This policy causedsome adverse reaction; for example many retailers who relied on discounts wentas far as denying shelf space to Procter & Gamble, while rivals stepped in withgenerous promotion deals of their own. Market research carried out by SalomonBrothers suggested that Procter & Gamble’s market share fell in 90 per cent of
Strategic Planning Edinburgh Business School 7/49
Module 7 / Making Choices among Strategies
its product categories. At the same time, Procter & Gamble discovered that 25per cent of its brands accounted for only 2 per cent of sales and scrapped someold brands. It is likely that well known brands of shampoo and toothpaste willdisappear in the near future.
What Pepsi did
In 1996 Pepsi spent a reputed $500 million on changing the colour of its colacan.
What Unilever did
Unilever merged its ‘marketing’ and ‘sales’ departments into a series of ‘businessgroups’ focusing on consumer research and product development, and set upa separate ‘customer development’ team responsible for relations with retailersacross all brands. The aim is to make everyone the ‘champion of the brand’,rather than those who used to be labelled ‘marketing’. In fact, this type ofreaction is typical of a number of large companies, and some authorities arepredicting the demise of the marketing department as an entity; some companieshave turned their attention from ‘re-engineering’ their production departmentsto applying the same logic to the marketing department.
Questions
1 Why should the price of shares in companies like Coca Cola fall as a resultof a price cut in Marlboro cigarettes? After all, in 1988 the value of brands(i.e. the difference between market value and book value) was enormous.Does this suggest that the stock market is totally illogical?
2 Explain what was happening in the market for brands using strategy mod-els.
3 Discuss the three types of response.
References
1 Earl, P.E. (1995) Microeconomics for Business and Marketing, E. Elgar, Cheltenham, p.148.
2 Porter, M.E. (1985) Competitive Advantage, New York: The Free Press.
3 Miles, R.E. and Snow, C.C. (1978) Organizational Strategy, Structure and Process,McGraw-Hill.
4 Markides, C.C. and Williamson, P.J. (1994) ‘Related diversification, core competenciesand corporate performance’, Strategic Management Journal, Vol. 15, pp. 149–65.
5 Porter, M.E. (1987) ‘From competitive advantage to corporate strategy’, Harvard Busi-ness Review, May–June, pp. 43–59.
6 Taylor, W. (1991) ‘The logic of global business: an interview with ABBs’ PercyBarnevik, Harvard Business Review, March–April, pp. 90–105.
7 Roberts, E.B. and Berry, C.A. (1985) ‘Entering new businesses: selecting strategies forsuccess’, Sloan Management Review, Vol. 26, No. 3, Spring.
7/50 Edinburgh Business School Strategic Planning
Module 8
Implementing and EvaluatingStrategy
Contents
8.1 Implementing Plans 8/2
8.2 Organisational Structure 8/3
8.3 Resource Allocation 8/68.3.1 Management of Change 8/68.3.2 Critical Success Factors 8/78.3.3 Management Style 8/78.3.4 Budgets 8/88.3.5 Incentives and Alignment 8/98.3.6 Setting Sales Targets 8/108.3.7 Resource Planning 8/11
8.4 Evaluation and Control 8/128.4.1 Monitoring Market Share 8/148.4.2 Monitoring Profitability 8/15
8.5 Feedback 8/18
8.6 The Augmented Process Model 8/19
8.7 Postscript: Strategic Planning Works 8/23
Review Exercise 8/24
Case 1: The Body Shop (1992) 8/24
Case 2: Daimler in a Spin (1996) 8/25
Case 3: Eurotunnel – a Financial Hole in the Ground (1996) 8/27
Case 4: The Balanced Scorecard 8/30
Case 5: Revisit An International Romance that Failed: British Telecom andMCI
8/33
Strategic Planning Edinburgh Business School 8/1
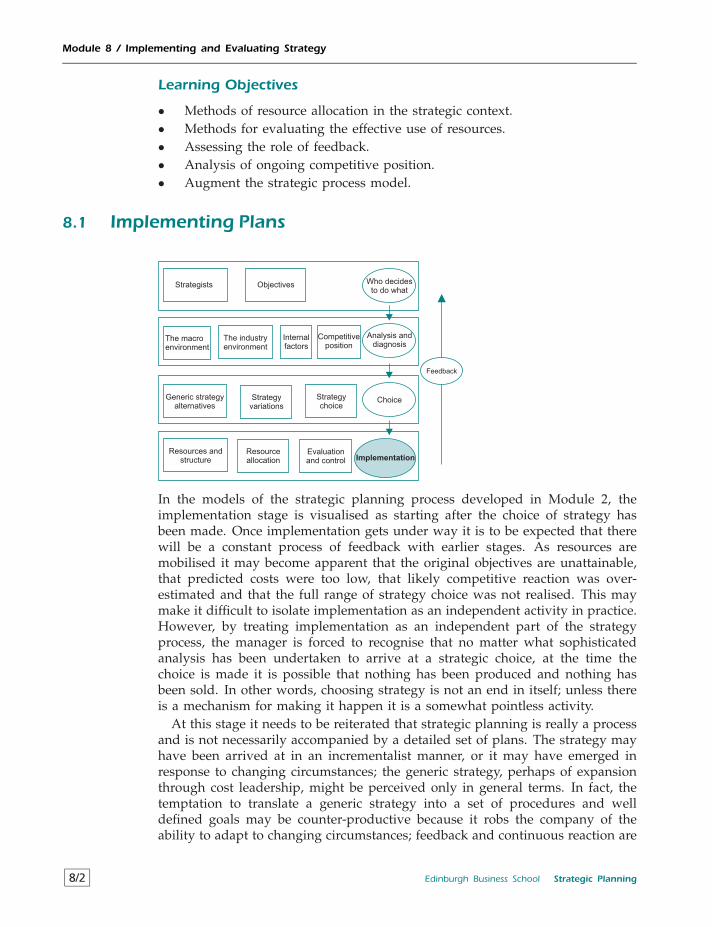
Module 8 / Implementing and Evaluating Strategy
Learning Objectives
• Methods of resource allocation in the strategic context.• Methods for evaluating the effective use of resources.• Assessing the role of feedback.• Analysis of ongoing competitive position.• Augment the strategic process model.
8.1 Implementing Plans
Strategists Objectives
The macroenvironment
The industryenvironment
Internalfactors
Competitiveposition
Generic strategyalternatives
Strategyvariations
Who decidesto do what
Analysis anddiagnosis
Choice
Implementation
Strategychoice
Resources andstructure
Resourceallocation
Evaluationand control
Feedback
In the models of the strategic planning process developed in Module 2, theimplementation stage is visualised as starting after the choice of strategy hasbeen made. Once implementation gets under way it is to be expected that therewill be a constant process of feedback with earlier stages. As resources aremobilised it may become apparent that the original objectives are unattainable,that predicted costs were too low, that likely competitive reaction was over-estimated and that the full range of strategy choice was not realised. This maymake it difficult to isolate implementation as an independent activity in practice.However, by treating implementation as an independent part of the strategyprocess, the manager is forced to recognise that no matter what sophisticatedanalysis has been undertaken to arrive at a strategic choice, at the time thechoice is made it is possible that nothing has been produced and nothing hasbeen sold. In other words, choosing strategy is not an end in itself; unless thereis a mechanism for making it happen it is a somewhat pointless activity.
At this stage it needs to be reiterated that strategic planning is really a processand is not necessarily accompanied by a detailed set of plans. The strategy mayhave been arrived at in an incrementalist manner, or it may have emerged inresponse to changing circumstances; the generic strategy, perhaps of expansionthrough cost leadership, might be perceived only in general terms. In fact, thetemptation to translate a generic strategy into a set of procedures and welldefined goals may be counter-productive because it robs the company of theability to adapt to changing circumstances; feedback and continuous reaction are
8/2 Edinburgh Business School Strategic Planning
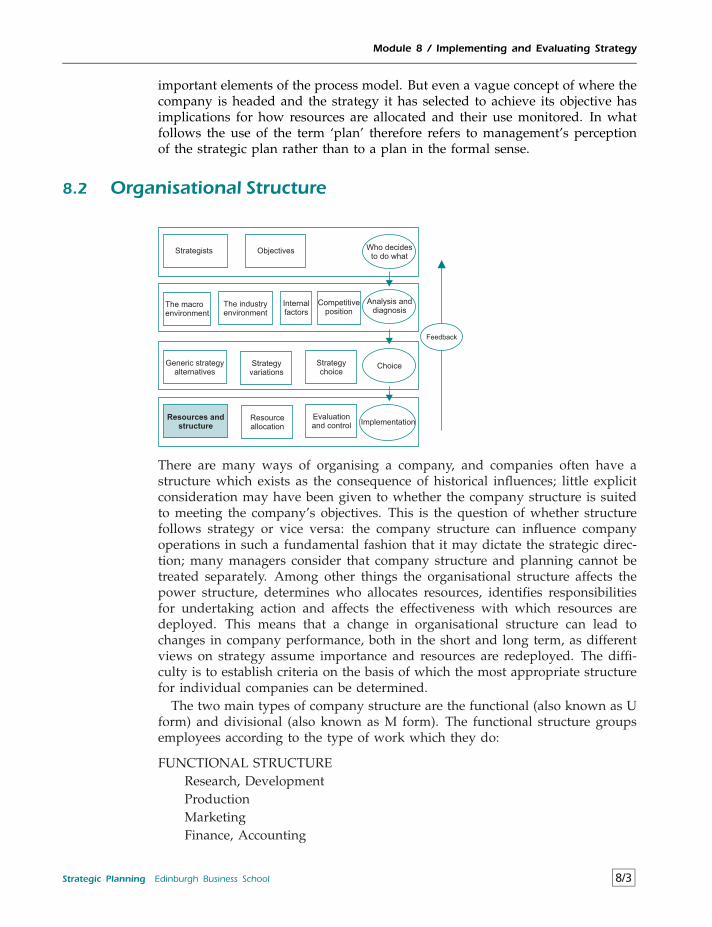
Module 8 / Implementing and Evaluating Strategy
important elements of the process model. But even a vague concept of where thecompany is headed and the strategy it has selected to achieve its objective hasimplications for how resources are allocated and their use monitored. In whatfollows the use of the term ‘plan’ therefore refers to management’s perceptionof the strategic plan rather than to a plan in the formal sense.
8.2 Organisational Structure
Strategists Objectives
The macroenvironment
The industryenvironment
Internalfactors
Competitiveposition
Generic strategyalternatives
Strategyvariations
Who decidesto do what
Analysis anddiagnosis
Choice
Implementation
Strategychoice
Resources and
structure
Resourceallocation
Evaluationand control
Feedback
There are many ways of organising a company, and companies often have astructure which exists as the consequence of historical influences; little explicitconsideration may have been given to whether the company structure is suitedto meeting the company’s objectives. This is the question of whether structurefollows strategy or vice versa: the company structure can influence companyoperations in such a fundamental fashion that it may dictate the strategic direc-tion; many managers consider that company structure and planning cannot betreated separately. Among other things the organisational structure affects thepower structure, determines who allocates resources, identifies responsibilitiesfor undertaking action and affects the effectiveness with which resources aredeployed. This means that a change in organisational structure can lead tochanges in company performance, both in the short and long term, as differentviews on strategy assume importance and resources are redeployed. The diffi-culty is to establish criteria on the basis of which the most appropriate structurefor individual companies can be determined.
The two main types of company structure are the functional (also known as Uform) and divisional (also known as M form). The functional structure groupsemployees according to the type of work which they do:
FUNCTIONAL STRUCTUREResearch, DevelopmentProductionMarketingFinance, Accounting
Strategic Planning Edinburgh Business School 8/3
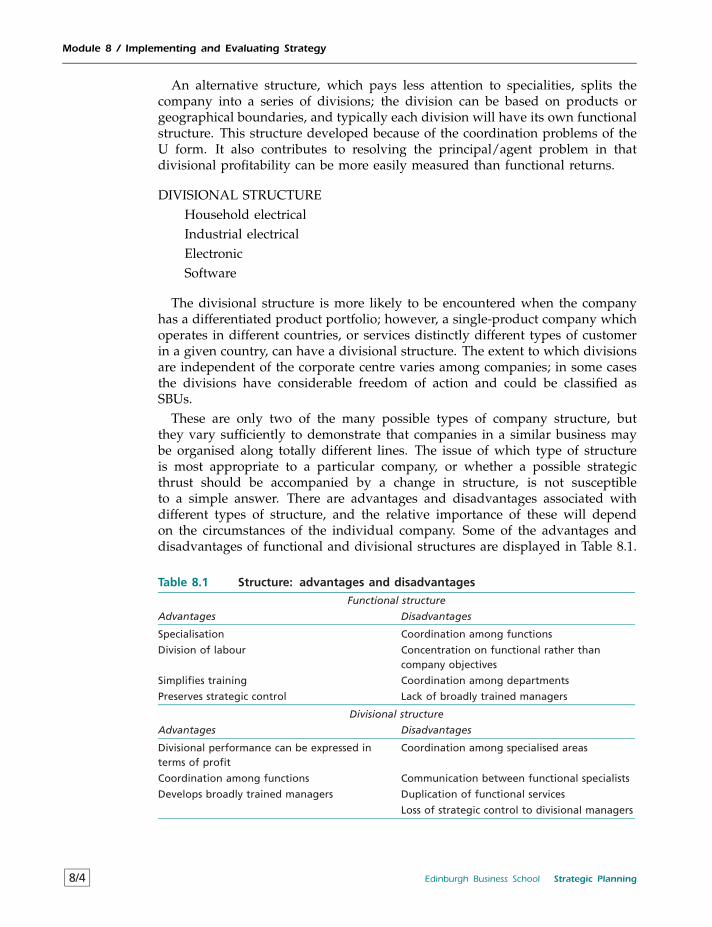
Module 8 / Implementing and Evaluating Strategy
An alternative structure, which pays less attention to specialities, splits thecompany into a series of divisions; the division can be based on products orgeographical boundaries, and typically each division will have its own functionalstructure. This structure developed because of the coordination problems of theU form. It also contributes to resolving the principal/agent problem in thatdivisional profitability can be more easily measured than functional returns.
DIVISIONAL STRUCTUREHousehold electricalIndustrial electricalElectronicSoftware
The divisional structure is more likely to be encountered when the companyhas a differentiated product portfolio; however, a single-product company whichoperates in different countries, or services distinctly different types of customerin a given country, can have a divisional structure. The extent to which divisionsare independent of the corporate centre varies among companies; in some casesthe divisions have considerable freedom of action and could be classified asSBUs.
These are only two of the many possible types of company structure, butthey vary sufficiently to demonstrate that companies in a similar business maybe organised along totally different lines. The issue of which type of structureis most appropriate to a particular company, or whether a possible strategicthrust should be accompanied by a change in structure, is not susceptibleto a simple answer. There are advantages and disadvantages associated withdifferent types of structure, and the relative importance of these will dependon the circumstances of the individual company. Some of the advantages anddisadvantages of functional and divisional structures are displayed in Table 8.1.
Table 8.1 Structure: advantages and disadvantages
Functional structure
Advantages Disadvantages
Specialisation Coordination among functions
Division of labour Concentration on functional rather thancompany objectives
Simplifies training Coordination among departments
Preserves strategic control Lack of broadly trained managers
Divisional structure
Advantages Disadvantages
Divisional performance can be expressed interms of profit
Coordination among specialised areas
Coordination among functions Communication between functional specialists
Develops broadly trained managers Duplication of functional services
Loss of strategic control to divisional managers
8/4 Edinburgh Business School Strategic Planning
Module 8 / Implementing and Evaluating Strategy
These advantages and disadvantages are by no means exhaustive, and therecould be disagreement in the individual case as to what actually comprisesan advantage or disadvantage. There are a number of methods of obtaininga perspective on different structures. One is to pose the question as to howdifferent forms of organisation are likely to contribute to the creation of value.For example, the introduction of a large corporate structure may have littleimpact other than to increase costs, and in this sense would have a negativeimpact on company value. Another is to ask if a structure is likely to beconsistent with, or flexible enough to deal with, predicted changes; for example,a company organised on functional lines may find this structure incapable ofdelivering a planned increase in market share in selected segments of the marketbecause more product specialists are required with the appropriate productionback-up.
A less common form of structure is the matrix. This approach is valuablein principle when economies of scope provide a rationale for organising alongmore than one dimension. The problem is that those at the intersections reportto two hierarchies and have two bosses. This can lead to serious problems ofdirection and control, and can lead to employees lacking focus. This type oforganisation is ready made to cause principal/agent problems.
Another approach which has been found useful in certain circumstances isnetworks, where work groups may be organised by function, geography orcustomer base. Relationships among groups are governed more by often chang-ing implicit and explicit requirements of common tasks than by formal lines ofauthority. Again, this structure raises problems of direction and control.
Given the potential impact which structure has on company performance andthe ability to achieve objectives, it is important not to allow the issue to beresolved by default. Although it is difficult to identify the most appropriatestructure, it may be possible to recognise a structure which is inconsistent withcompany characteristics. When selecting the appropriate structure it is necessaryto balance trade-offs between scale and scope economies, transaction costs,agency costs and information flows. There is no single prescription, and the bestorganisation depends on individual circumstances.
It is important to be clear about the extent to which structure follows strategy.It was discussed in 1.4 how company structure has evolved in response tochanging market demands and developments in strategic approaches: from theoriginal functional form through divisionalisation, diversification and finallyreverting to restructuring and downsizing. The structure must be seen as amethod of resource allocation which is relevant to the company objectives, thecompetitive environment and the strategy being pursued.
Strategic Planning Edinburgh Business School 8/5
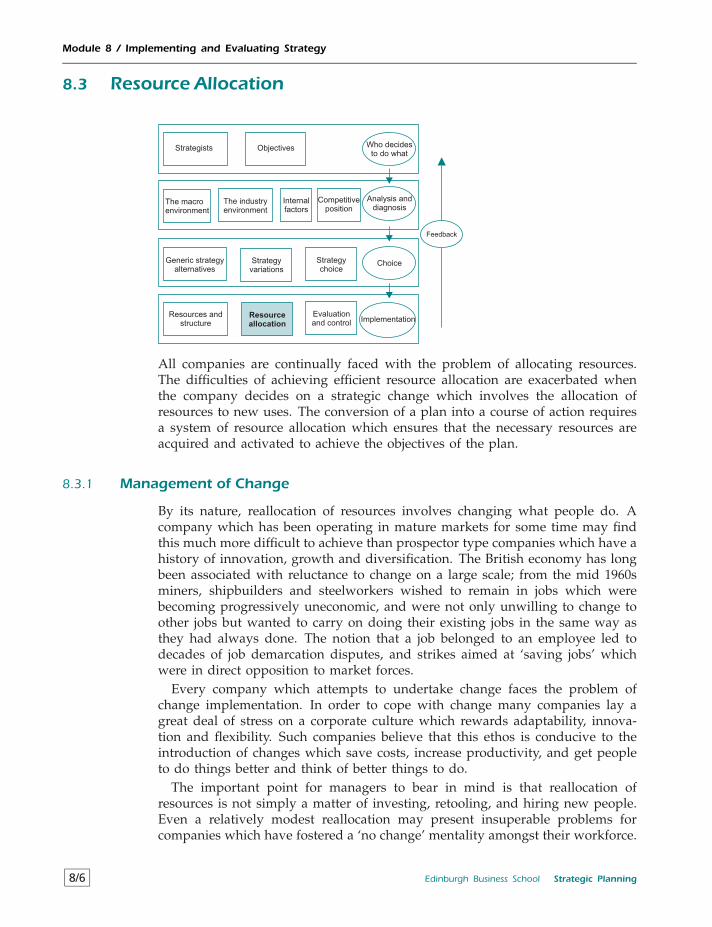
Module 8 / Implementing and Evaluating Strategy
8.3 Resource Allocation
Strategists Objectives
The macroenvironment
The industryenvironment
Internalfactors
Competitiveposition
Generic strategyalternatives
Strategyvariations
Who decidesto do what
Analysis anddiagnosis
Choice
Implementation
Strategychoice
Resources andstructure
Resource
allocation
Evaluationand control
Feedback
All companies are continually faced with the problem of allocating resources.The difficulties of achieving efficient resource allocation are exacerbated whenthe company decides on a strategic change which involves the allocation ofresources to new uses. The conversion of a plan into a course of action requiresa system of resource allocation which ensures that the necessary resources areacquired and activated to achieve the objectives of the plan.
8.3.1 Management of Change
By its nature, reallocation of resources involves changing what people do. Acompany which has been operating in mature markets for some time may findthis much more difficult to achieve than prospector type companies which have ahistory of innovation, growth and diversification. The British economy has longbeen associated with reluctance to change on a large scale; from the mid 1960sminers, shipbuilders and steelworkers wished to remain in jobs which werebecoming progressively uneconomic, and were not only unwilling to change toother jobs but wanted to carry on doing their existing jobs in the same way asthey had always done. The notion that a job belonged to an employee led todecades of job demarcation disputes, and strikes aimed at ‘saving jobs’ whichwere in direct opposition to market forces.
Every company which attempts to undertake change faces the problem ofchange implementation. In order to cope with change many companies lay agreat deal of stress on a corporate culture which rewards adaptability, innova-tion and flexibility. Such companies believe that this ethos is conducive to theintroduction of changes which save costs, increase productivity, and get peopleto do things better and think of better things to do.
The important point for managers to bear in mind is that reallocation ofresources is not simply a matter of investing, retooling, and hiring new people.Even a relatively modest reallocation may present insuperable problems forcompanies which have fostered a ‘no change’ mentality amongst their workforce.
8/6 Edinburgh Business School Strategic Planning
Module 8 / Implementing and Evaluating Strategy
On the positive side, there are a number of techniques which can be appliedto implement change, and these have been effective in a variety of settings.The techniques include survey feedbacks, team building, confrontation andtransactional analysis; in the strategy context, the detail of how these approacheswork is less important than that managers recognise when the organisation is inneed of help in facilitating change.
8.3.2 Critical Success Factors
The notion of critical success factors has its roots in network and critical pathanalyses originally developed for use in military planning. In principle theidea is simple: a project is set out as a sequential network of events with theobjective of identifying the critical path, which is the minimum time for theproject. Inspection of the network reveals that there are some things whichmust happen before others become possible. The same general approach canbe adopted in strategy implementation, but because of the complexity of theprocess, and the fact that so much is unknown about the future, it is really onlypossible to identify events which must occur, or things which must be done, inorder to ensure that the strategy has a chance of coming to fruition.
It is not a straightforward matter to identify critical success factors. It isnecessary to have a detailed understanding of available resources, the resourceswhich will be required, the sequence of events and how individuals are likely toreact to the changes which they will experience. A critical success factor can bethe acquisition of a capital asset or it could be the installation of an appropriateincentive structure. When it is found that a strategy is not being implementedas effectively as originally expected it is more than likely that a critical factorhas been overlooked; the reason that the whole process has ground to a halt isbecause that is the nature of a critical success factor.
8.3.3 Management Style
The current management team may not be well equipped to implement astrategy which involves a significant degree of change. For example, a companywhich decides to diversify will require the senior management team to becomemore concerned with corporate level decision making rather than running asingle product line. The current finance officer may not have the experienceand skills required to handle financial planning in a diversified company; thepersonnel officer may have no experience in introducing significant change intoan organisation, and integrating new and existing activities. At the SBU level,the type of manager who has successfully run a ‘Cash Cow’ may not havethe innovative approach to market development and risk taking required totransform a ‘Star’ into a money-making proposition. The stock of managementskills in the company may not match the requirements of strategic change.
Apart from the skills which the individual managers possess, leadership styleand company culture exert a significant impact on the ability of the organisa-tion to undertake change. Companies vary substantially in their approaches toleadership: some lay stress on a hierarchical structure, and adopt a dictatorial
Strategic Planning Edinburgh Business School 8/7
Module 8 / Implementing and Evaluating Strategy
approach to decision making; others attempt to be democratic, making effortsto involve employees at all levels in the management process by adopting suchpolicies as ‘open door’ and management by walking about. In the Amstrad case(Module 7) the company was virtually indistinguishable from its leader, AlanSugar. In some instances it may appear obvious that the management style isnot consistent with planned strategic changes; for example, a medium sizedfamily run business which has in the past firmly concentrated control amongfamily members, and developed a company culture of subservience to familydecisions, may find it difficult to diversify and develop new markets where aninnovative workforce will be essential. Porsche (Module 3) was owned by thefamily and seemed slow to react to strategic challenges.
As in the case of company structure, it is not possible to prescribe the optimummanagement style for a particular company. However, it should be possibleto identify gaps in management skills and potential inconsistencies betweenplanned and current organisational requirements.
8.3.4 Budgets
The problem of allocating budgets is encountered at many levels, but for strategypurposes these can be reduced to two: the corporate and SBU or functionallevels. At the corporate level the overall budget is rationed among competingalternatives, typically on the basis of proposals submitted by SBUs. Some of theissues involved in corporate budget policy were discussed at 1.3. At the SBUor functional level it is necessary to allocate funds to individual managers sothat they can carry out the tasks which are required to achieve the objectivesof each investment; the investment appraisal which revealed that the net cashflows generate a positive NPV does not usually take into account uncertainty asto how costs will actually be incurred and resources deployed.
At the corporate level it could be argued that no budget constraint exists,because any investment which generates a positive NPV ought to attract fundsfrom the market; by definition, this is a project which generates a return greaterthan the company’s cost of capital. In principle, the capital rationing situationdescribed at 1.4.1 should not occur. However, there are many reasons why acompany may be unable to raise money on the market to finance investments.The most obvious one is when the market does not agree with the company’sestimate of future returns; the track record of the company’s managers may besuch that the market views their plans with considerable reserve. Another reasonis that the company may be unwilling to reveal its intentions to competitors. Thedesirability of an investment may depend on achieving a competitive advantagewhich would be impossible if competitors knew what the company’s strategywas likely to be. In fact, strategic options are often difficult to define with theprecision which will attract investors. It is one thing to use investment appraisalto attempt to estimate the relative value implications of alternative strategies,but it is quite another to translate this into a convincing investment plan.
It therefore seems likely that the company will be faced with a budget con-straint when allocating available funds among competing investments. Thetheory of finance can provide a solution to the capital rationing problem of
8/8 Edinburgh Business School Strategic Planning
Module 8 / Implementing and Evaluating Strategy
determining which combination of investments will add most to shareholderwealth within the context of the chosen strategy. However, the application ofsophisticated capital rationing techniques does not necessarily resolve the bud-get allocation problem. This is because the formal capital rationing solution isin terms of a combination of investments, and may exclude some investmentswith higher NPVs than those included. It may be difficult to explain to anSBU manager that his proposed investment, with a relatively high NPV, hasbeen excluded because of the application of an obscure financial technique. It isobviously important to use appropriate financial techniques to identify the mostprofitable budget allocation; whether it is feasible is another matter.
One way to avoid the difficulties associated with capital rationing is to setacross-the-board budget limits; this has the advantage that all SBUs are treatedin the same way, and in turn the SBUs can set across-the-board limits, since thisis consistent with corporate policy. However, such an approach is inconsistentwith principles of efficient resource allocation. The whole emphasis of the stra-tegic planning process has been on the identification of activities with differentpotential payoffs and directing resources accordingly. For example, if the objec-tive were to increase the market shares of products currently being produced, itwould make little sense to increase the research budget at the same time simplybecause the marketing budget was to be increased. On the other hand, if there isno sensible budgetary control, when companies are faced with adverse marketconditions and decide to follow a retrenchment strategy the first thing that isusually done is to cut back on those budgets which can be manipulated withoutaffecting current performance. Training, research and maintenance budgets areoften pruned to achieve an immediate increase in ROI without proper consid-eration of the overall resource allocation implications. This is often justified bysenior management on the grounds that survival is the primary concern andrefinements can come later. This reaction is probably inevitable when seniormanagement concentrates attention on short term cash flows rather than on theconcept of shareholder wealth, which puts short term cash flows into context.
At the functional level the SBU manager is confronted with many imponder-ables. If a new market is being entered he has to decide how much to allocateto marketing and over what period. The marketing manager has to decide howmuch to allocate to market research, advertising, promotions and so on. By thetime the original funds have been parcelled up and allocated to the variousfunctions, it may be difficult to identify specific expenditure with the origi-nal project. The original investment appraisal assumed that the cash would beused efficiently at the functional level. The management problem at this levelis to ensure that this happens, but there may be relatively few guidelines toassist managers who are in the front line. An ostensibly attractive strategy mayflounder because budgets are disseminated throughout the organisation in ahaphazard fashion.
8.3.5 Incentives and Alignment
Ideally, incentives should be related to the value creating activities of the com-pany; in other words, the incentive system should reward individuals for addingvalue. This is an important step in resolving the principal agent problem. But,
Strategic Planning Edinburgh Business School 8/9
Module 8 / Implementing and Evaluating Strategy
given the difficulty of determining value for the company as a whole, it isclearly impossible to parcel out the components of added value to managersand employees. On the other hand, it should be possible to recognise when theincentive system is not aligned with the value creation objective. For example,a production manager who is rewarded for minimising inventories can causehavoc with a marketing strategy aimed at achieving an increased market share.
It is important for managers to recognise that the incentive system may beat fault when the performance of individuals does not match expectations. Infact, one of the barriers to change is that incentive systems are not reviewed toensure that they are consistent with revised company and individual objectives;what is perceived as being unwillingness to change may be partly due to thefact that individuals can see that a proposed change is not to their advantagegiven the existing system of incentives. It is a basic fact of life that managersand employees will be unwilling to change their behaviour if the benefits ofdoing so are perceived as being lower than the costs to themselves. A change inthe incentive system can go a long way towards easing the implementation ofchange and contributing to the alignment of individual and company objectives.
8.3.6 Setting Sales Targets
The allocation of resources to selling is a basic determinant of strategic success,given that the mechanism by which target market share is achieved is by settingsales targets to SBUs and to individual salespeople. Companies use sales targetsto give the sales force an idea of what is expected of them, and to serve as part ofan incentive system. But what criteria can be used to determine what the targetmarket share should be, or how many units should be sold by a particular salesgroup in a particular segment of the market? Attention is usually not directedtowards how much should be sold, but on how much can be sold; however,concentrating on the maximisation of sales with existing sales resources doesnot address the underlying resource problem. The resource allocation questioncan be framed in the following fashion using the concept of marginal analysis:
Is Marginal Revenue > Marginal Cost?
If the additional revenue associated with the last unit sold is greater than theadditional cost incurred in making the sale, then it is worthwhile aiming for thatlevel of sales. While it is important to bear this principle in mind, it is difficultto apply in practice because the information available is in terms of expectationsof revenues and costs:
Is Additional Expected Net Revenue > Additional Expected Cost?
Furthermore, the evaluation cannot be made simply in terms of the priceversus the unit cost because an increased sales effort which results in a highermarket share can contribute to long term competitive advantage. For example,a higher market share could lead to the ability to set higher prices in the future,and to a lower unit cost because of economies of scale and experience effects.While the expected revenues and costs are difficult to estimate with precision,it is useful to attempt an approximation which will make explicit how the sales
8/10 Edinburgh Business School Strategic Planning
Module 8 / Implementing and Evaluating Strategy
target fits into the general goal of value creation. In the absence of informationon expected revenues and costs many managers set the objective of maximisingsales as a second best; this may be a reasonable basis for ongoing decisions onsales, but it has the potential to promote a serious misallocation of resources.
The trade-offs can be put in context in a similar fashion to the determinationof target market share by applying the basic income and cost model:
Net income = Total market×Market share× (Price− Unit cost)
Sensitivity analysis can be used to project different scenarios over the productlife cycle; the discounting approach can be used to evaluate different scenariosin NPV terms. This can help indicate the appropriate level of sales, and providemanagers with a degree of confidence that the revenue from selling the last unitis at least as high as the cost of producing and selling it.
A further dimension of marginal cost relates to the opportunity cost, ratherthan the financial cost, of additional sales when the product is sold in a numberof segments. If the resources available to allocate to selling the product arelimited, they should be allocated among different segments of the market suchthat the marginal benefit equals the marginal cost in the different segments.If this condition did not hold, net revenue could be increased by allocatingresources from those activities where marginal cost was greater than marginalbenefit to those where marginal cost is less than marginal benefit.
8.3.7 Resource Planning
If the company is ever going to achieve a competitive advantage, it must set upprocedures to ensure that resources are used efficiently and that the componentsand linkages of the value chain are effective. A fundamental requirement ineffective resource planning is that the production department knows what it ismeant to produce; this means setting up communications between marketingand production so that each can understand the other’s viewpoint. For example,it is often found that the production department is frustrated by continuouslychanging volumes of orders, and as a result cannot always react with fastdelivery times; the marketing department may feel that reasonable notice oforders is always given, and that the production department is inefficient andnot really interested in fulfilling the needs of hard won customers. Effectivecommunication between marketing and production would reveal the likely inci-dence of bulk orders, provide guidance to production on how much inventorythe marketing department feels that it can reasonably live with, and enable themarketing department to appreciate the difficulties of capacity utilisation andinventory control, and the benefits of a relatively stable production schedule.
Resource planning has implications for all aspects of the company’s per-formance. The application of sophisticated just-in-time approaches can reduceinventory costs significantly, the smoothing of peaks and troughs in productionschedules can create the stable environment necessary to develop a companyculture, the introduction of new technology at appropriate times enables thecompany to make use of new skills and techniques, and a systematic approachto resource planning is the foundation for monitoring costs.
Strategic Planning Edinburgh Business School 8/11
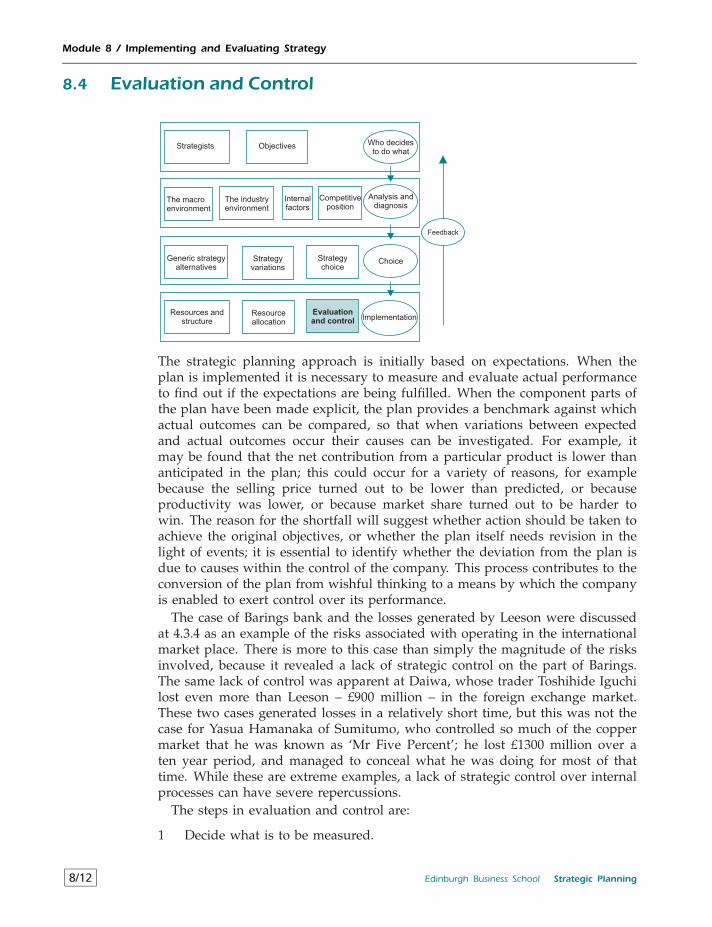
Module 8 / Implementing and Evaluating Strategy
8.4 Evaluation and Control
Strategists Objectives
The macroenvironment
The industryenvironment
Internalfactors
Competitiveposition
Generic strategyalternatives
Strategyvariations
Who decidesto do what
Analysis anddiagnosis
Choice
Implementation
Strategychoice
Resources andstructure
Resourceallocation
Evaluation
and control
Feedback
The strategic planning approach is initially based on expectations. When theplan is implemented it is necessary to measure and evaluate actual performanceto find out if the expectations are being fulfilled. When the component parts ofthe plan have been made explicit, the plan provides a benchmark against whichactual outcomes can be compared, so that when variations between expectedand actual outcomes occur their causes can be investigated. For example, itmay be found that the net contribution from a particular product is lower thananticipated in the plan; this could occur for a variety of reasons, for examplebecause the selling price turned out to be lower than predicted, or becauseproductivity was lower, or because market share turned out to be harder towin. The reason for the shortfall will suggest whether action should be taken toachieve the original objectives, or whether the plan itself needs revision in thelight of events; it is essential to identify whether the deviation from the plan isdue to causes within the control of the company. This process contributes to theconversion of the plan from wishful thinking to a means by which the companyis enabled to exert control over its performance.
The case of Barings bank and the losses generated by Leeson were discussedat 4.3.4 as an example of the risks associated with operating in the internationalmarket place. There is more to this case than simply the magnitude of the risksinvolved, because it revealed a lack of strategic control on the part of Barings.The same lack of control was apparent at Daiwa, whose trader Toshihide Iguchilost even more than Leeson – £900 million – in the foreign exchange market.These two cases generated losses in a relatively short time, but this was not thecase for Yasua Hamanaka of Sumitumo, who controlled so much of the coppermarket that he was known as ‘Mr Five Percent’; he lost £1300 million over aten year period, and managed to conceal what he was doing for most of thattime. While these are extreme examples, a lack of strategic control over internalprocesses can have severe repercussions.
The steps in evaluation and control are:
1 Decide what is to be measured.
8/12 Edinburgh Business School Strategic Planning
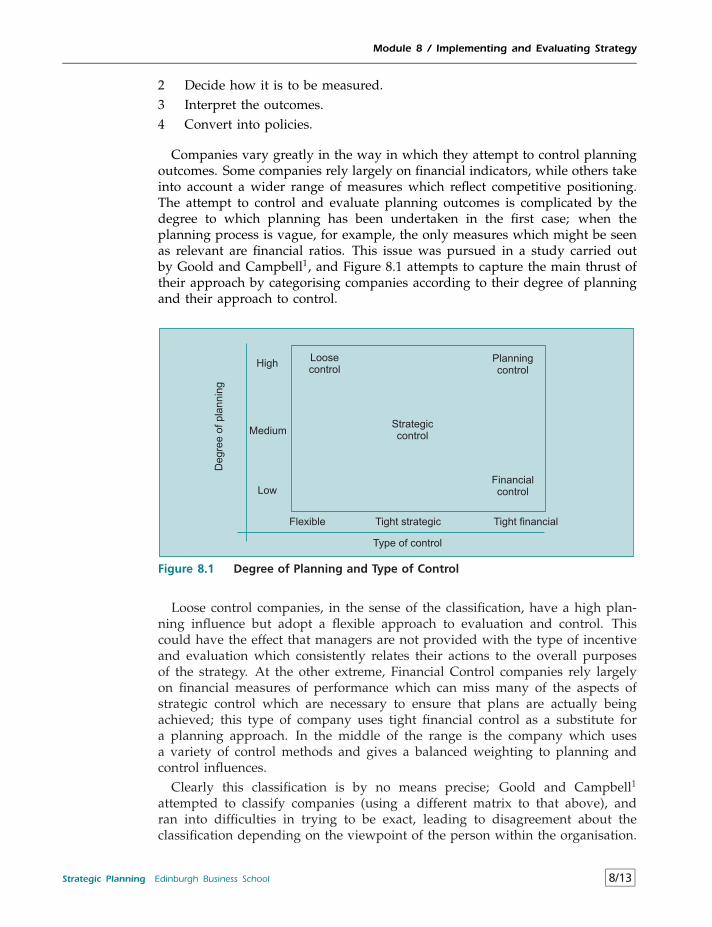
Module 8 / Implementing and Evaluating Strategy
2 Decide how it is to be measured.3 Interpret the outcomes.4 Convert into policies.
Companies vary greatly in the way in which they attempt to control planningoutcomes. Some companies rely largely on financial indicators, while others takeinto account a wider range of measures which reflect competitive positioning.The attempt to control and evaluate planning outcomes is complicated by thedegree to which planning has been undertaken in the first case; when theplanning process is vague, for example, the only measures which might be seenas relevant are financial ratios. This issue was pursued in a study carried outby Goold and Campbell1, and Figure 8.1 attempts to capture the main thrust oftheir approach by categorising companies according to their degree of planningand their approach to control.
Loosecontrol
Strategiccontrol
FinancialcontrolLow
High
Flexible Tight strategic Tight financial
Type of control
De
gre
eo
fp
lan
nin
g
Medium
Planningcontrol
Figure 8.1 Degree of Planning and Type of Control
Loose control companies, in the sense of the classification, have a high plan-ning influence but adopt a flexible approach to evaluation and control. Thiscould have the effect that managers are not provided with the type of incentiveand evaluation which consistently relates their actions to the overall purposesof the strategy. At the other extreme, Financial Control companies rely largelyon financial measures of performance which can miss many of the aspects ofstrategic control which are necessary to ensure that plans are actually beingachieved; this type of company uses tight financial control as a substitute fora planning approach. In the middle of the range is the company which usesa variety of control methods and gives a balanced weighting to planning andcontrol influences.
Clearly this classification is by no means precise; Goold and Campbell1
attempted to classify companies (using a different matrix to that above), andran into difficulties in trying to be exact, leading to disagreement about theclassification depending on the viewpoint of the person within the organisation.
Strategic Planning Edinburgh Business School 8/13
Module 8 / Implementing and Evaluating Strategy
But companies can be entered into the matrix in a rough fashion; for exam-ple, a company which is run by a financially minded CEO who insists on thedevelopment of detailed plans backed up with clear financial targets, but withno attention paid to factors such as market share, sales growth and competitorperformance, could be classified as ‘Financial Control’. The point of the classi-fication is not to imply that some companies are better or worse than others,but to provide insight into the approach to evaluation and control. For examplewhen markets are subject to rapidly changing technological development, theapproach characterised by ‘Financial Control’ may be inappropriate.
In a subsequent study of major British companies, Goold and Campbell2
attempted to identify potentially effective control methods. The general conclu-sions were as follows.
• The first stage in the control process should involve the selection of relativelyfew appropriate objectives.
• From these objectives suitable targets can be derived so that pressure canbe created for effective strategic performance, but without setting up abureaucracy to achieve it.
• A series of milestones can be identified which are tracked over time; theseserve as benchmarks for evaluating strategic performance, and provide earlywarning of deviations from expected outcomes.
• A narrow set of financial measures cannot provide the overall strategic viewwhich is necessary; on the other hand, many of the objectives and targetscannot be measured with accuracy, and a great deal of subjective evaluationis necessary.
These recommendations for effective control methods make practical use ofmany of the concepts outlined in Module 3, which deals with setting credibleobjectives, quantifiable and non-quantifiable objectives, disaggregated objectives,and the distinction between means and ends.
8.4.1 Monitoring Market Share
The part of the overall strategy relating to market share was based on expecta-tions about the comparative advantage accruing from specified market shares,portfolio analysis and corporate objectives. The marketing department’s objec-tive is to achieve sales in accordance with the plan, but as events unfold it islikely to be found that the costs and benefits of attempting to perform strictlyin accordance with the plan’s objectives will change significantly. For example,at the outset it will be decided that achievement of a 12 per cent target marketshare requires a particular combination of increases in marketing expenditureand price reductions; as time progresses experience will tell whether the mar-keting effort has been effectively directed, and whether prices have been set lowenough. It may turn out that the strategy was correct in its general approach, butthat market share is currently 10.5 per cent and a much more aggressive pricingpolicy is necessary to achieve the planned objective of 12 per cent. Should theplan now be revised in the light of events?
8/14 Edinburgh Business School Strategic Planning
Module 8 / Implementing and Evaluating Strategy
The issue can be put in perspective by recourse to the basic income and costmodel, which can be set out as:
Net income = Total market × Market share× (Price − Unit cost)− Marketing expenditure
It is then a relatively simple matter to investigate different scenarios of theimpact of variations in price and marketing expenditure on net income streams.This type of scenario evaluation would already have been carried out duringthe strategy choice stage, and it is now possible to update the scenarios on thebasis of additional market information.
8.4.2 Monitoring Profitability
There are many ways of measuring the profitability of a company, and differentanswers can be obtained depending on which approach and which set of con-ventions is used. It would clearly be folly to track a profitability measure whichgenerated misleading information on company performance. On the other hand,profit measures should not be discarded just because they are imperfect; eachprofit measure conveys a different set of information.
Profit
What is meant by profit in practice? The accounting definition concentrates onthe difference between income from sales and costs of production. There aremany ways of arriving at the accounting figure, depending on what is includedin production costs. For example, some methods allocate overheads accordingto the value of sales, and others according to wage costs; machinery costs maybe allocated over time by straight line depreciation, or by using a decay curve.Thus the profit calculated for a particular SBU depends on how such costs arecalculated.
Since there is considerable discretion involved in arriving at a profit figure,trends in profit may be of limited use as a performance measure if arbitrary costallocation is involved in the calculation. There is very little point in managersattempting to maximise a profit measure which is generated by obscure account-ing conventions and which conceals rather than reveals company performance.
Net Contribution
One of the simplest measures of product performance is net contribution (alsoknown as gross profit), which is defined here as:
Net contribution = Sales revenue− Cost of goods sold= Total market×Market share× Price− Unit cost × Sales
Net contribution is an indicator of how effectively inputs are being convertedinto outputs. However, it may not be a good indicator of cash flows fromcurrent production. This is because not all output is necessarily produced in the
Strategic Planning Edinburgh Business School 8/15
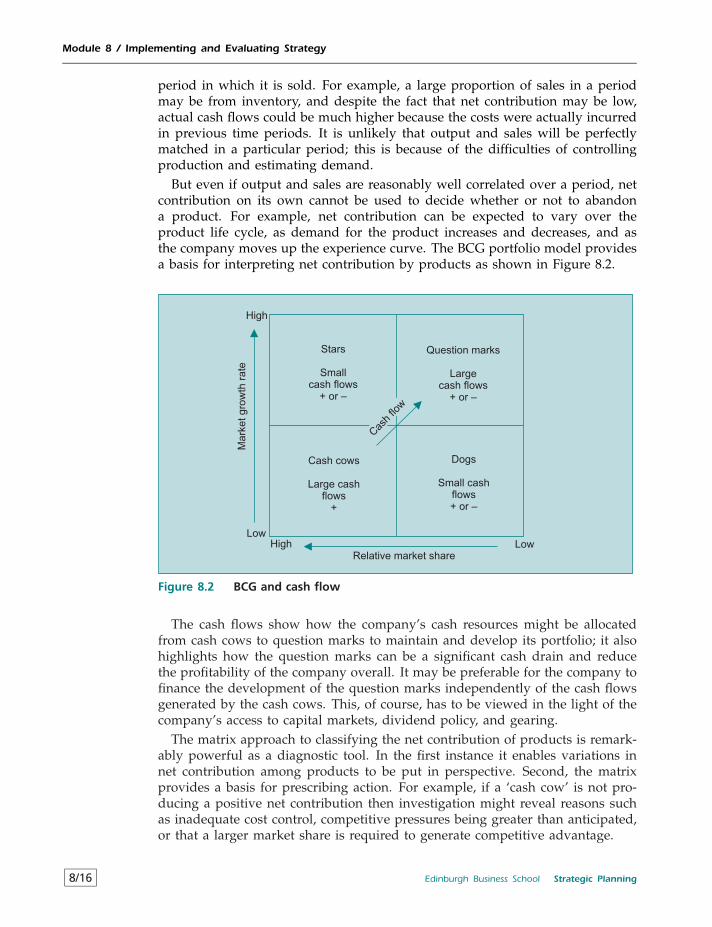
Module 8 / Implementing and Evaluating Strategy
period in which it is sold. For example, a large proportion of sales in a periodmay be from inventory, and despite the fact that net contribution may be low,actual cash flows could be much higher because the costs were actually incurredin previous time periods. It is unlikely that output and sales will be perfectlymatched in a particular period; this is because of the difficulties of controllingproduction and estimating demand.
But even if output and sales are reasonably well correlated over a period, netcontribution on its own cannot be used to decide whether or not to abandona product. For example, net contribution can be expected to vary over theproduct life cycle, as demand for the product increases and decreases, and asthe company moves up the experience curve. The BCG portfolio model providesa basis for interpreting net contribution by products as shown in Figure 8.2.
Stars
Smallcash flows
+ or –
Question marks
Largecash flows
+ or –
Cash cows
Large cashflows
+
Dogs
Small cashflows+ or –
Low
High
High Low
Cas
hflo
w
Relative market share
Ma
rke
tg
row
thra
te
Figure 8.2 BCG and cash flow
The cash flows show how the company’s cash resources might be allocatedfrom cash cows to question marks to maintain and develop its portfolio; it alsohighlights how the question marks can be a significant cash drain and reducethe profitability of the company overall. It may be preferable for the company tofinance the development of the question marks independently of the cash flowsgenerated by the cash cows. This, of course, has to be viewed in the light of thecompany’s access to capital markets, dividend policy, and gearing.
The matrix approach to classifying the net contribution of products is remark-ably powerful as a diagnostic tool. In the first instance it enables variations innet contribution among products to be put in perspective. Second, the matrixprovides a basis for prescribing action. For example, if a ‘cash cow’ is not pro-ducing a positive net contribution then investigation might reveal reasons suchas inadequate cost control, competitive pressures being greater than anticipated,or that a larger market share is required to generate competitive advantage.
8/16 Edinburgh Business School Strategic Planning
Module 8 / Implementing and Evaluating Strategy
Cash Flow
Cash flow is an aggregate view of profitability which looks at all inflows andoutflows. In principle, the calculation of cash flow takes into account only actualincome and expenditure, does not impute profitability by allocating costs, andignores the net contributions of individual products.
Cash flow = Total income− Total expenditure
Income includes sales of assets and new debt, and expenditure includes capitalequipment and the repayment of debt; cash flow could therefore be dominatedin some periods by changes in the company’s portfolio of assets. If cash flowis positive then reserves are increased and/or net debt increased. If cash flowis negative, it stands to reason that reserves are decreased and/or net debtdecreased. If a strategy involves a period of expansion during which cash flowsare expected to be negative, steps must be taken to ensure that finance in theform of reserves and/or borrowing will be available. The ultimate constraint ona company’s operations is the availability of cash; if the business is not able togenerate cash in the form of earnings or borrowing it will come to a grindinghalt. There are numerous examples of companies which have run into problemsbecause they have not monitored and predicted cash flow implications. Whenthe market disagrees with the company about the desirability of an investmentprogramme, it follows that the company will have to finance it from internalcash; if this cash runs out the market has even more justification for not lendingto the company because of the poor foresight of its managers in the face ofmarket scepticism.
It is normal for even a profitable company to have negative cash flowsfrom time to time. For example, individual SBUs may be generating positivenet contributions on all products, but because of a modernisation programmesubstantial outlays are currently being incurred for capital equipment. Thecompany may still report profits during this period because changes in assetsare not counted as part of current expenditure. Furthermore, a period of negativecash flows incurred for this reason will not be associated with a reduction inshareholder wealth; this is because the investments causing the current cashflow deficit are being undertaken in the expectation of generating additionalcash flows in the future. It follows that cash flow and profitability are notnecessarily closely connected in the short run. In fact, it is conceivable that acompany could have a negative cash flow for a considerable time because it iscontinually undertaking new investments. However, eventually cash flow mustbecome positive.
It is clear that cash flow is an undependable measure of profitability. However,the company needs to be aware of those factors which are likely to cause cashflow variations and which are independent of the efficiency with which resourcesare being utilised and markets exploited.
Strategic Planning Edinburgh Business School 8/17
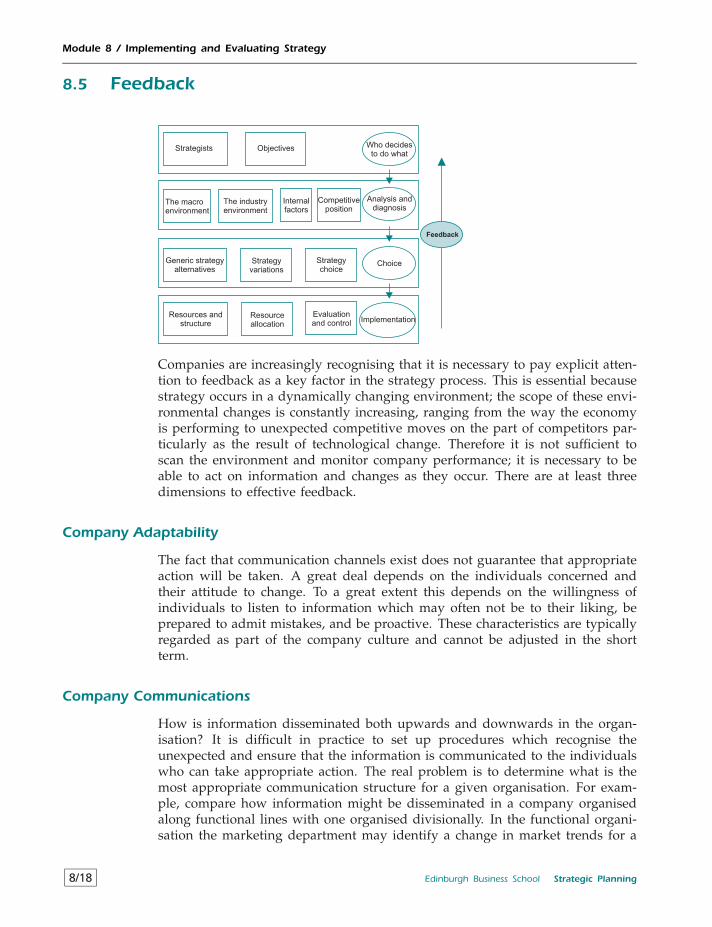
Module 8 / Implementing and Evaluating Strategy
8.5 Feedback
Strategists Objectives
The macroenvironment
The industryenvironment
Internalfactors
Competitiveposition
Generic strategyalternatives
Strategyvariations
Who decidesto do what
Analysis anddiagnosis
Choice
Implementation
Strategychoice
Resources andstructure
Resourceallocation
Evaluationand control
Feedback
Companies are increasingly recognising that it is necessary to pay explicit atten-tion to feedback as a key factor in the strategy process. This is essential becausestrategy occurs in a dynamically changing environment; the scope of these envi-ronmental changes is constantly increasing, ranging from the way the economyis performing to unexpected competitive moves on the part of competitors par-ticularly as the result of technological change. Therefore it is not sufficient toscan the environment and monitor company performance; it is necessary to beable to act on information and changes as they occur. There are at least threedimensions to effective feedback.
Company Adaptability
The fact that communication channels exist does not guarantee that appropriateaction will be taken. A great deal depends on the individuals concerned andtheir attitude to change. To a great extent this depends on the willingness ofindividuals to listen to information which may often not be to their liking, beprepared to admit mistakes, and be proactive. These characteristics are typicallyregarded as part of the company culture and cannot be adjusted in the shortterm.
Company Communications
How is information disseminated both upwards and downwards in the organ-isation? It is difficult in practice to set up procedures which recognise theunexpected and ensure that the information is communicated to the individualswho can take appropriate action. The real problem is to determine what is themost appropriate communication structure for a given organisation. For exam-ple, compare how information might be disseminated in a company organisedalong functional lines with one organised divisionally. In the functional organi-sation the marketing department may identify a change in market trends for a
8/18 Edinburgh Business School Strategic Planning
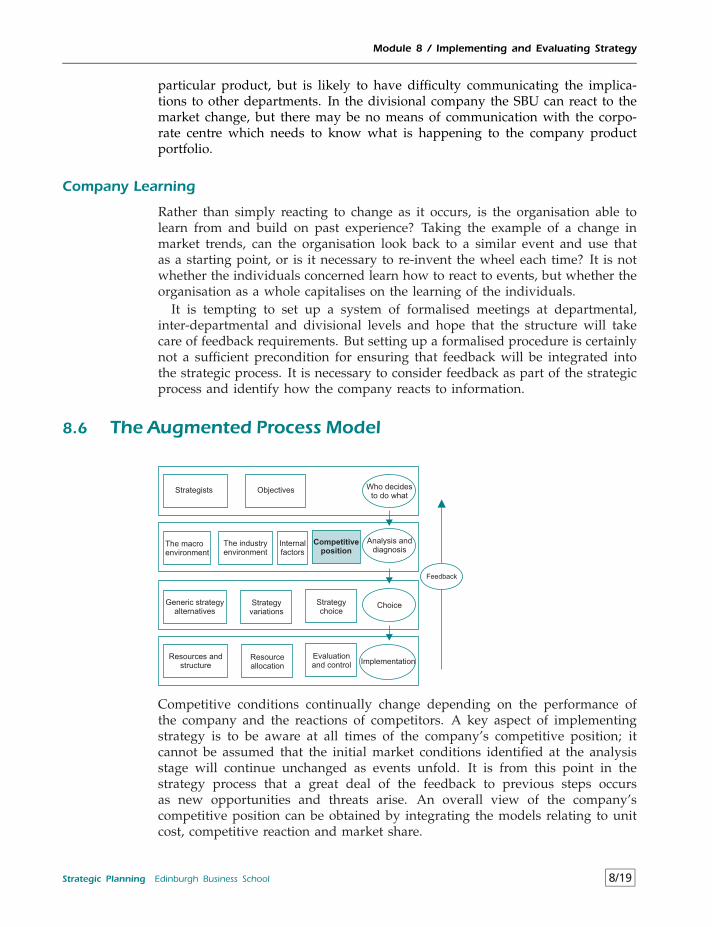
Module 8 / Implementing and Evaluating Strategy
particular product, but is likely to have difficulty communicating the implica-tions to other departments. In the divisional company the SBU can react to themarket change, but there may be no means of communication with the corpo-rate centre which needs to know what is happening to the company productportfolio.
Company Learning
Rather than simply reacting to change as it occurs, is the organisation able tolearn from and build on past experience? Taking the example of a change inmarket trends, can the organisation look back to a similar event and use thatas a starting point, or is it necessary to re-invent the wheel each time? It is notwhether the individuals concerned learn how to react to events, but whether theorganisation as a whole capitalises on the learning of the individuals.
It is tempting to set up a system of formalised meetings at departmental,inter-departmental and divisional levels and hope that the structure will takecare of feedback requirements. But setting up a formalised procedure is certainlynot a sufficient precondition for ensuring that feedback will be integrated intothe strategic process. It is necessary to consider feedback as part of the strategicprocess and identify how the company reacts to information.
8.6 The Augmented Process Model
Strategists Objectives
The macroenvironment
The industryenvironment
Internalfactors
Competitiveposition
Generic strategyalternatives
Strategyvariations
Who decidesto do what
Analysis anddiagnosis
Choice
Implementation
Strategychoice
Resources andstructure
Resourceallocation
Evaluationand control
Feedback
Competitive conditions continually change depending on the performance ofthe company and the reactions of competitors. A key aspect of implementingstrategy is to be aware at all times of the company’s competitive position; itcannot be assumed that the initial market conditions identified at the analysisstage will continue unchanged as events unfold. It is from this point in thestrategy process that a great deal of the feedback to previous steps occursas new opportunities and threats arise. An overall view of the company’scompetitive position can be obtained by integrating the models relating to unitcost, competitive reaction and market share.
Strategic Planning Edinburgh Business School 8/19
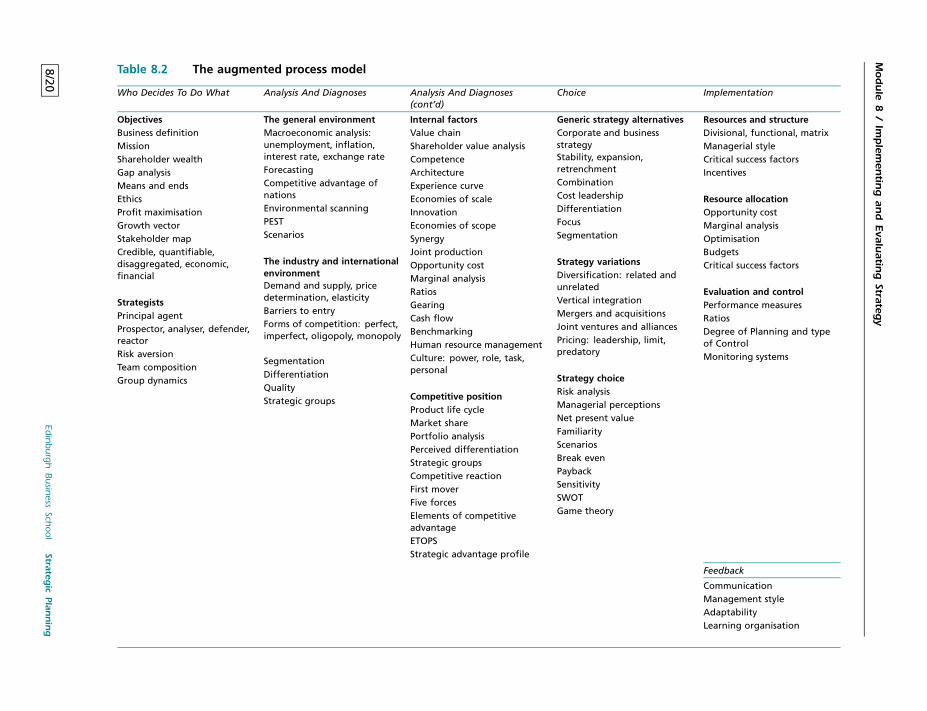
Module
8/
Implem
entin
gan
dEvalu
ating
Strategy
Table 8.2 The augmented process model
Who Decides To Do What Analysis And Diagnoses Analysis And Diagnoses(cont’d)
Choice Implementation
ObjectivesBusiness definitionMissionShareholder wealthGap analysisMeans and endsEthicsProfit maximisationGrowth vectorStakeholder mapCredible, quantifiable,disaggregated, economic,financial
StrategistsPrincipal agentProspector, analyser, defender,reactorRisk aversionTeam compositionGroup dynamics
The general environmentMacroeconomic analysis:unemployment, inflation,interest rate, exchange rateForecastingCompetitive advantage ofnationsEnvironmental scanningPESTScenarios
The industry and internationalenvironmentDemand and supply, pricedetermination, elasticityBarriers to entryForms of competition: perfect,imperfect, oligopoly, monopoly
SegmentationDifferentiationQualityStrategic groups
Internal factorsValue chainShareholder value analysisCompetenceArchitectureExperience curveEconomies of scaleInnovationEconomies of scopeSynergyJoint productionOpportunity costMarginal analysisRatiosGearingCash flowBenchmarkingHuman resource managementCulture: power, role, task,personal
Competitive positionProduct life cycleMarket sharePortfolio analysisPerceived differentiationStrategic groupsCompetitive reactionFirst moverFive forcesElements of competitiveadvantageETOPSStrategic advantage profile
Generic strategy alternativesCorporate and businessstrategyStability, expansion,retrenchmentCombinationCost leadershipDifferentiationFocusSegmentation
Strategy variationsDiversification: related andunrelatedVertical integrationMergers and acquisitionsJoint ventures and alliancesPricing: leadership, limit,predatory
Strategy choiceRisk analysisManagerial perceptionsNet present valueFamiliarityScenariosBreak evenPaybackSensitivitySWOTGame theory
Resources and structureDivisional, functional, matrixManagerial styleCritical success factorsIncentives
Resource allocationOpportunity costMarginal analysisOptimisationBudgetsCritical success factors
Evaluation and controlPerformance measuresRatiosDegree of Planning and typeof ControlMonitoring systems
Feedback
CommunicationManagement styleAdaptabilityLearning organisation
8/20Ed
inbu
rgh
Bu
siness
School
Strategic
Plan
nin
g
Module 8 / Implementing and Evaluating Strategy
This requires the application of a battery of concepts and models as shown inTable 8.2 structured under the headings of the process model. To some extentit is a matter of discretion where a particular idea appears, for example, manyaccounting techniques are used for both internal analysis and evaluation andcontrol, and competence is an internal factor which may also guide strategicchoice. While this is a forbidding list it is actually not exhaustive, as there aremany concepts from the other core disciplines which could be applied to specificstrategy issues but which are not included; a strategy analysis could in principleinclude every idea from the core disciplines, but it is up to the individual analystto determine which ideas are relevant to the particular case and integrate theminto a structure. It is clear from this display that it is only by the consistentapplication of a wide range of tools that a company’s competitiveness can beproperly assessed.
It is the integration of the process model with analytical ideas and modelswhich provides a structure within which competitiveness can be assessed in thewide sense. It will rarely be found that a company is ‘perfect’ in terms of everysingle idea and model: the trick is to identify the areas in which a company isparticularly strong or weak, and which factors have contributed to its successor failure. This is not an easy thing to do, and it is a typical misconceptionthat success or failure can be attributed to a single factor. Perhaps the mostdemanding intellectual challenge of all is to apply the ideas to a company andidentify the seeds of success or failure before either actually occurs.
Strategy problems vary widely, and not all models are applicable to all cases.One of the skills in strategic analysis is to identify which models and ideas areapplicable to a particular case and to derive insights from these models. Butthe sheer variability of real life and the range of potentially applicable conceptsmean that different analysts may focus on different aspects of the problem andas a result two valid analyses may produce different outcomes. This does notnecessarily mean that partial analyses are wrong, because even if all models andconcepts were applied there is still the problem of attributing relative importanceto each in arriving at conclusions.
While the integrated approach in Table 8.2 is intended to provide a basis forevaluating overall competitive position, the individual ideas and concepts can beapplied to a variety of strategic issues including new product development andlaunch, investment appraisal, entering new markets, the rationale for takeovers,make versus buy, and many others. It needs to be borne in mind that all suchissues typically have implications beyond their own confines, and the frameworkin Table 8.2 should always be kept in mind as a means of setting individualissues within the overall strategic context.
It emerges from the augmented process model that all the models you haveencountered so far in this course, and in other courses, are strategic models inthat they contribute to the overall strategic analysis. So a question which asksyou to apply strategic models means that you have to search for relevant modelsand apply them to the issue.
This complexity is what makes strategic analysis such an intellectually demand-ing subject. But if you bear in mind that a structured approach coupled withthe identification of relevant models is the key to strategic insight you will have
Strategic Planning Edinburgh Business School 8/21
Module 8 / Implementing and Evaluating Strategy
learned the most important strategic lesson of all. Without going into a greatdeal of detail, the following outlines the sorts of question which continuallyneed to be addressed when monitoring and evaluating strategy.
• Who Decides to Do WhatOriginally objectives were set on the basis of a vision of the company’sfuture, which in turn would have been derived from a view of how thecompany might grow, and the application of ideas such as gap analysis. Theappropriateness of these objectives is affected by the principal agent issue(where the shareholders might not have the same objectives as the CEO) andthe characteristics of the chief decision makers in the company. Ongoingquestions to ask include whether the perceived performance gap is beingclosed, whether the objectives are still consistent with current competitiveconditions and perhaps whether the strategy selected is now seen to havebeen largely determined by the prospector qualities of the CEO rather thanan outcome of serious strategy appraisal.
• Analysis and DiagnosesThere is an overlap between this stage of the process and implementation,but it is clearly a mistake to treat the analysis and diagnoses stage as aonce for all activity. The general environment must be scanned for changeswhich are likely to affect the market since the type of competitive marketwithin which the company operates can be subject to sudden change. Theway in which value is produced by the internal operations of the companyis certainly not static, and changes in cost structure and value creation areinevitable as the company moves up the experience curve, benefits fromeconomies of scale, launches new products and invests in R&D; the impactof many of these changes on costs is not always obvious. Bringing theseinternal and external factors together to assess the ongoing competitiveposition is a first step, which requires to be supplemented by a further setof questions relating to the stage in the product life cycle, the positioning ofthe portfolio, product differentiation, and the identification of the company’sstrengths and weaknesses in relation to potential opportunities and threats;again, all of these are subject to change, often at short notice, and companieswhich appear to be unresponsive to changes in competitive conditions mayactually be oblivious to what is actually happening.
• ChoiceWhile the main strategic choice may have been made in the past it is essen-tial to question whether the choice is being pursued as originally intendedand whether the choice is still appropriate. For example, the choice mayhave been to pursue a highly differentiated niche and grow by acquisition;the passage of time may reveal that the niche has been poorly defined, thatthe market is wider than anticipated and companies are competing mainlyon the basis of price rather than quality, while the acquisition process hasdelivered higher productive capacity but with increased costs and poorcompany morale. It is the alignment of the chosen strategy with subsequentevents which will greatly determine future success, but as time goes by thecompany may have no mechanism for ensuring that the strategy does notdrift.
8/22 Edinburgh Business School Strategic Planning
Module 8 / Implementing and Evaluating Strategy
• Implementation and FeedbackAgain the issue of alignment arises: are company structure and resourceallocation consistent with the strategy? Does the company have proceduresin place which provide relevant information on competitive performance?Is company structure flexible enough to respond to changes in competitiveconditions?
8.7 Postscript: Strategic Planning WorksThis Strategic Planning course has gone to considerable lengths to attemptto demonstrate how the ideas of the business disciplines can be utilised andintegrated in arriving at strategy decisions. But to some extent strategy can beboiled down to getting the big picture right, and directing resources accordingly.A supreme example of how the general principles can be applied is the caseof Sir William Burrell, who inherited the family steamship company in thelate nineteenth century and ran it with such success that he was able to retirerelatively young and devote the rest of his life to collecting artifacts, which arenow housed in the Burrell Museum in Glasgow. He made an enormous amountof money out of shipping. How? The following is an extract from a letter writtenby the eminent Scottish architect Sir Robert Lorimer to an Australian friend inJanuary 1902.
His [Sir William Burrell’s] scheme is really the nimblest I’ve ever struck. He sellshis fleet when there is the periodical boom and then puts his money into 3 percent stock and lies back until things are absolutely in the gutter – soup kitchentimes – everyone starving for a job. He then goes like a roaring lion. Orders adozen steamers in a week, gets them built at rock bottom prices, less than halfwhat they’d have cost him last year. Then by the time they’re delivered to himthings have begun to improve a little bit and there he is ready with a tip top fleetof brand new steamers and owing to the cheap rate he’s had them built at, readyto carry cheaper than anybody. Sounds like a game anyone could play at but noneof them have the pluck to do it. They simply sit and look at him ‘making moneylike slate stones’ as he expresses it.
Burrell carried out analyses of the national and international economy, andthe operation of the shipping market; he understood concepts such as oppor-tunity cost, and he had figured out how to build a company with a potentialcompetitive advantage; he had a clearly defined set of objectives, and a strategydesigned to achieve them; he evaluated the outcomes so that he could decidewhen to reallocate resources and move into and out of the market. Or did he?
Strategic Planning Edinburgh Business School 8/23
Module 8 / Implementing and Evaluating Strategy
Review ExerciseIn an entertaining article3 Peter Wilson identified seven myths which can com-bine to sink a small company when faced with a recession:
1 Nobody knows our business better than we do.2 The company would not survive without me.3 We aren’t affected by competition.4 Cutting overheads will ensure survival.5 Borrowing money is risky.6 Quality matters, not price.7 We have all the information we need.
Debunk these myths.
Case 1: The Body Shop (1992)In the middle of 1991 The Body Shop International attracted a great deal of pressattention because of its remarkable record of growth during the past decade andthe apparent disregard for conventional business decorum demonstrated by itscharismatic founder, Anita Roddick. She has publicly stated that City people‘do her head in’, and make her head ‘burst with boredom’; she describes herbusiness in terms of ‘magic’ and ‘naıvety’. This is language which does notappeal to investment analysts, who are more at home with profit and lossaccounts and cash flow projections.
The Body Shop is well known in the UK, and retails a wide range of cosmeticsand related goods whose distinguishing feature is that they are not tested onanimals. The operation started in one shop in 1976, and by 1991 had 580stores world-wide, with a stock market value of £470 million. Sales have grownat about 30 per cent per year for some time, and the accounts reported in1991 showed a growth in profits from £14.5 million in the previous year to£20 million. While Roddick’s husband Gordon, who is also The Body Shop’sfinancial director, acknowledged that the company could not be immune fromrecession, profit projections for 1992 predicted another growth year of about 30per cent to between £26 million and £28 million.
There are a number of reasons why The Body Shop could maintain its profitgrowth during a recession. The first is that ‘small-ticket’ items are not greatlyaffected immediately by a halt in the growth of personal incomes. The second isthat The Body Shop continues to expand its operations. In 1991 there were 173shops in the UK, and there was still plenty of scope for growth; for example, uptill that time The Body Shop had only targeted towns with populations greaterthan 50 000. Third, The Body Shop franchises shops and can thus increase the sizeof the chain without increasing overheads. Despite its public image, The BodyShop is in fact a manufacturer and wholesaler rather than a retailer. Fourth, whileThe Body Shop is now in 37 countries, the overseas chains are still relativelysmall. The Body Shop charter, which is to bring ‘humanity, goals and values’ tobusiness, to care for its customers and to ‘generate joy and excitement’ is seenas being particularly appealing to the US market. Roddick has also publicly
8/24 Edinburgh Business School Strategic Planning
Module 8 / Implementing and Evaluating Strategy
espoused causes such as Amnesty International, and has created an image forThe Body Shop which emphasises cooperation with employees, concern for theenvironment and high standards of integrity.
The confidence concerning future profits is reflected in The Body Shop shareprice. In mid 1991 the price/earnings ratio was 28, and it has been as high as 50.One analyst was reported as saying that the shares were still ‘screaming cheap’even at this level. On the other hand, some brokers worry about the dependenceof the company on a charismatic leader.
Questions
1 Discuss The Body Shop’s success in terms of a structured approach tostrategic planning.
2 Account for the relatively high price/earnings ratio.
Case 2: Daimler in a Spin (1996)In 1992 Daimler-Benz, which is Germany’s largest company and reportedlyEurope’s largest manufacturing firm, was handing out a glossy document called‘The New Age’. In it, Daimler’s chairman at the time, Edzard Reuter, boastedhow he had transformed the firm from a car maker into an ‘integrated technologygroup’ involved in aerospace, microelectronics and several kinds of transportwhich would be big enough to compete with the giants of America and Japan.Since 1985 Daimler had spent more than DM8 billion ($6 billion) on acquisitionswhich included the bulk of Germany’s defence and aviation industries. Butdespite this massive effort Daimler’s worth on the stockmarket fell from DM53billion in 1986 to DM35 billion in 1995. At the 1995 annual general meetingshareholders accused Mr Reuter of being ‘the biggest annihilator of capital inthe land’.
Competitive Environment
To some extent Mr Reuter could claim that circumstances beyond his controlhad led to the problems; the cold war ended in 1989 leading to a huge reductionin the demand for arms and the world market for civil aircraft collapsed in thelate 1980s. On the other hand, while Daimler’s purchase of AEG in 1986 hadprovided access to a wide range of markets from white goods to trains, AEGdid not have a dominant place in any of its markets and it could be argued thatMr Reuter had added the wrong kind of product to Daimler’s portfolio.
Germany has long been famous as the land of ‘stakeholder’ capitalism, wherecompanies are run for parties other than shareholders, such as workers and sup-pliers. Managers and bankers tend to club together, and ordinary shareholdersare by and large neglected. This has been strongly contrasted with the apparent‘short termism’ of British and American capitalism where the creation of share-holder value has always taken precedence, and many critics claimed that thishas been at the expense of longer term prosperity. Thus Daimler was consideredto be taking a long term view at the time it was making its acquisitions, and
Strategic Planning Edinburgh Business School 8/25
Module 8 / Implementing and Evaluating Strategy
it took some time for shareholders to realise that the company was destroyingshareholder value rather than creating it. Despite its aggressive role in takingover other companies, Daimler itself was insulated from take-overs: DeutscheBank, which is Germany’s biggest bank, owned about a quarter of Daimler, andanother shell company owned about another quarter.
Changing the CEO
Mr Reuter was not oblivious to the difficulties facing Daimler and made manyimportant changes by the time he left in 1995. He had broken with Germanconvention by having Daimler’s shares listed in the US, he introduced stringentaccounting rules and control processes, and by 1994 even started a divestmentprogramme by selling off the AEG white-goods businesses.
In May 1995 a new CEO, Mr Jurgen Schrempp, was appointed and brought atotally different perspective to the company. He started by announcing a loss ofDM1.57 billion for the first half of 1995, which he partly blamed on the declineof the US dollar. However, it was not so much the reason for the loss thatwas important as the fact that it was publicly recognised; there was widespreadfeeling that the previous management would have avoided admitting such anunprecedented event. Mr Schrempp also laid stress on the pursuit of profitsrather than strategy for its own sake, and insisted that the real owners of thecompany were shareholders, to whom management was responsible. He set inmotion a major programme of divesting substantial parts of the business withthe objective of getting back to the core of transport. He went further than MrReuter by stating his intention to divest all businesses whose pre-tax return wasless than 12 per cent on capital employed. Mr Schrempp also shifted powerfrom the subsidiaries such as Mercedes to the parent. In the past Daimler’smanaging board set guidelines for the four subsidiaries but let them managethemselves. Mr Schrempp’s board was to determine strategy and budgets forall businesses in the group (numbering 35 in 1995) and in the process becomea much tighter conglomerate rather than what was previously no more than acluster of businesses.
There were, of course, problems with this new orientation. First, the aerospacedivision is at the mercy of currency markets and politicians. Second, the notionof a ‘transport group’ strategy is perhaps no less nebulous than the originalprogramme of diversification. Third, Mercedes-Daimler makes up two-thirds ofDaimler sales, but analysts have detected signs of potential weakness in the carsector; Mercedes’ share of the German passenger car market dropped from 11per cent in 1985 to 7 per cent in 1995. Market share in fact reached a low of 6per cent in 1992. Increased competition looms from another major German carcompany, BMW, which had acquired Britain’s Rover car company, and under astrong CEO has the potential to exploit international economies of scale.
By early 1996 Mr Schrempp had rid Daimler of Fokker, and left the Dutchgovernment to worry about the future of its 7800 employees. After a groupboard meeting Mr Schrempp announced ‘Profitability must take precedenceover revenues.’ He conceded that Daimler must shrink, rather than expand,back to profitability.
8/26 Edinburgh Business School Strategic Planning
Module 8 / Implementing and Evaluating Strategy
The full year loss for 1995 was DM6 billion, of which more than one thirdwas attributable to Fokker.
Mr Schrempp’s Track Record
Mr Schrempp was previously chairman of DASA, Daimler’s aerospace division,from 1989. During this time many of DASA’s problems worsened. In 1993Mr Schrempp bought Fokker, which was a chronically loss making regionalDutch aircraft maker; Fokker made large numbers of unwanted aircraft and wasforced to lease them to customers on unprofitable short term deals. He formedan alliance with Aerospatiale, the French state owned company, to producehelicopters and missiles in the shrinking arms market.
His rationale for buying Fokker was that Daimler needed to develop intomedium sized aircraft (80–100 seats) while Fokker had a strong market positionbut needed a partner to develop new models. At the time there was a greatdeal of criticism of the deal by German analysts and fund managers: ‘It was thewrong policy and the wrong company. Fokker had a lot of structural problems.It was just like Reuter’s mistake with AEG. How was it going to compete withSiemens?’
It may seem a little strange to observers in other countries that Mr Schremppis being allowed to perform the task of dismantling what he put together,and to carry on after admitting that he has made serious mistakes. But someGerman commentators reckon that this makes him just the man for the job. Oneindication of the competitive strength of the company is that Mercedes landeda $1 billion dollar joint venture deal with China to build multi purpose vehiclesin the face of strong competition from Chrysler.
Questions
1 Set out the strategic rationale for Mr Reuter’s programme of diversification,and the reasons for its failure.
2 Compare the strategic approaches of Mr Reuter and Mr Schrempp.
Case 3: Eurotunnel – a Financial Hole in the Ground (1996)The Eurotunnel links the South of England with France; it was completed in1994 after seven years of work; it was one of the biggest construction projects inhistory and was financed entirely by the private sector.
‘Eurotunnel has exceeded the City’s worst expectations and unveiled a loss of£925 million for 1995, its first full year of operation, one of the biggest single-yeardeficits ever by a UK company.’ (The Times, April 23, 1996)
Strategic Planning Edinburgh Business School 8/27
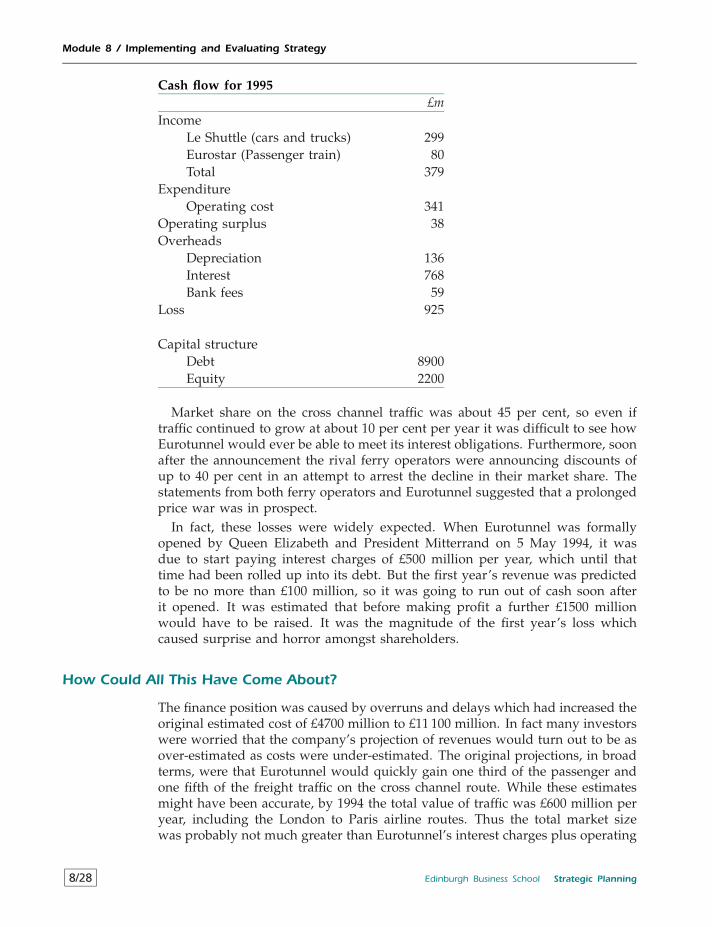
Module 8 / Implementing and Evaluating Strategy
Cash flow for 1995£m
IncomeLe Shuttle (cars and trucks) 299Eurostar (Passenger train) 80Total 379
ExpenditureOperating cost 341
Operating surplus 38Overheads
Depreciation 136Interest 768Bank fees 59
Loss 925
Capital structureDebt 8900Equity 2200
Market share on the cross channel traffic was about 45 per cent, so even iftraffic continued to grow at about 10 per cent per year it was difficult to see howEurotunnel would ever be able to meet its interest obligations. Furthermore, soonafter the announcement the rival ferry operators were announcing discounts ofup to 40 per cent in an attempt to arrest the decline in their market share. Thestatements from both ferry operators and Eurotunnel suggested that a prolongedprice war was in prospect.
In fact, these losses were widely expected. When Eurotunnel was formallyopened by Queen Elizabeth and President Mitterrand on 5 May 1994, it wasdue to start paying interest charges of £500 million per year, which until thattime had been rolled up into its debt. But the first year’s revenue was predictedto be no more than £100 million, so it was going to run out of cash soon afterit opened. It was estimated that before making profit a further £1500 millionwould have to be raised. It was the magnitude of the first year’s loss whichcaused surprise and horror amongst shareholders.
How Could All This Have Come About?
The finance position was caused by overruns and delays which had increased theoriginal estimated cost of £4700 million to £11 100 million. In fact many investorswere worried that the company’s projection of revenues would turn out to be asover-estimated as costs were under-estimated. The original projections, in broadterms, were that Eurotunnel would quickly gain one third of the passenger andone fifth of the freight traffic on the cross channel route. While these estimatesmight have been accurate, by 1994 the total value of traffic was £600 million peryear, including the London to Paris airline routes. Thus the total market sizewas probably not much greater than Eurotunnel’s interest charges plus operating
8/28 Edinburgh Business School Strategic Planning
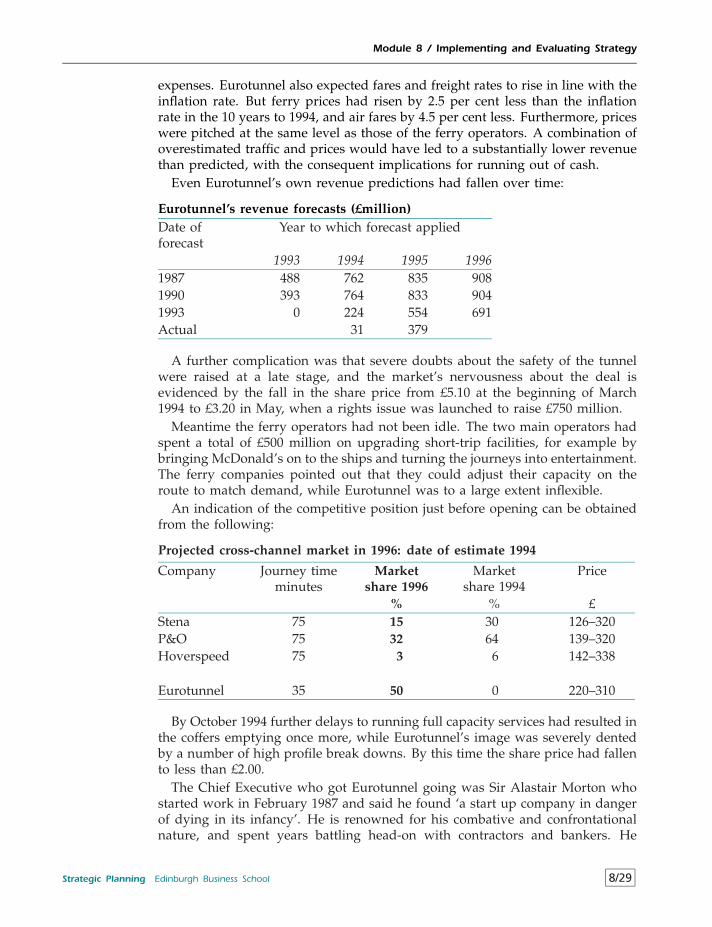
Module 8 / Implementing and Evaluating Strategy
expenses. Eurotunnel also expected fares and freight rates to rise in line with theinflation rate. But ferry prices had risen by 2.5 per cent less than the inflationrate in the 10 years to 1994, and air fares by 4.5 per cent less. Furthermore, priceswere pitched at the same level as those of the ferry operators. A combination ofoverestimated traffic and prices would have led to a substantially lower revenuethan predicted, with the consequent implications for running out of cash.
Even Eurotunnel’s own revenue predictions had fallen over time:
Eurotunnel’s revenue forecasts (£million)Date offorecast
Year to which forecast applied
1993 1994 1995 19961987 488 762 835 9081990 393 764 833 9041993 0 224 554 691Actual 31 379
A further complication was that severe doubts about the safety of the tunnelwere raised at a late stage, and the market’s nervousness about the deal isevidenced by the fall in the share price from £5.10 at the beginning of March1994 to £3.20 in May, when a rights issue was launched to raise £750 million.
Meantime the ferry operators had not been idle. The two main operators hadspent a total of £500 million on upgrading short-trip facilities, for example bybringing McDonald’s on to the ships and turning the journeys into entertainment.The ferry companies pointed out that they could adjust their capacity on theroute to match demand, while Eurotunnel was to a large extent inflexible.
An indication of the competitive position just before opening can be obtainedfrom the following:
Projected cross-channel market in 1996: date of estimate 1994
Company Journey timeminutes
Marketshare 1996
Marketshare 1994
Price
% % £Stena 75 15 30 126–320P&O 75 32 64 139–320Hoverspeed 75 3 6 142–338
Eurotunnel 35 50 0 220–310
By October 1994 further delays to running full capacity services had resulted inthe coffers emptying once more, while Eurotunnel’s image was severely dentedby a number of high profile break downs. By this time the share price had fallento less than £2.00.
The Chief Executive who got Eurotunnel going was Sir Alastair Morton whostarted work in February 1987 and said he found ‘a start up company in dangerof dying in its infancy’. He is renowned for his combative and confrontationalnature, and spent years battling head-on with contractors and bankers. He
Strategic Planning Edinburgh Business School 8/29
Module 8 / Implementing and Evaluating Strategy
has called the contractors names such as schoolboys, blackmailers and chronicdepressives, while bankers have grown weary of his temper. On the other hand,the CEO of the main contractor said ‘There aren’t many people who have hisphysical and mental strength and stamina’. Indeed, on 10 April 1995 Mortonwas forced to apologise to shareholders for the shortfall between predicted 1994revenue (£224 million) and actual revenue (£31 million) leading to a loss for1994 of £387 million.
There seems to be no end in sight. By late 1995 Eurotunnel’s share pricehad reached a new low of £1.20. The emphasis had shifted from short termpredictions of market shares to the idea that by the year 2005 or so Eurotunnelwould be the ‘natural’ way to travel between Britain and France, and that theferry operators would have long gone. This would enable the debt to be repaidand after that those shareholders who had held out would be in for a dividendbonanza.
The Tunnel is one of this century’s greatest contributions to the future of Europeand I am proud to be associated with it as a shareholder. I do not want to see theachievement handed to others at a discount for them to reap the rewards in thefuture. We the shareholders need to take a long-term view and set aside short-termexpediencies. . . . the banks will acquire a very valuable asset at a knockdownprice.
Extract from a letter to the Times 25 June 1996.
Questions
1 Explain the situation which arose in 1996 using strategy models.2 Given the obviously poor chance of making a return, how do you account
for the willingness of banks to lend so much money for the project?3 What future strategy do you suggest for Eurotunnel?
Case 4: The Balanced Scorecard
The Balanced Scorecard∗ was developed by Robert S Kaplan and David P Nor-ton and is a tool for implementing strategy which has been adopted by a largenumber of organisations and many have reported that it has greatly contributedto understanding and implementing strategy; on the other hand some organi-sations have reported difficulty in fully implementing the approach, but this isto be expected with a technique which requires a significant investment in timeand effort and a reconsideration of existing organisational procedures. At theoutset it needs to be stressed that the Scorecard is not a mechanistic tool as itsname might suggest; rather, it is a process which the organisation can adapt toits own particular needs and characteristics therefore the precise definition ofthe Scorecard can vary significantly depending on the circumstances.
The Balanced Scorecard uses four perspectives on the company’s vision andstrategy to identify value creating activities at the SBU level:
* Kaplan R. S. and Norton D. P. (1996) The Balanced Scorecard, Harvard Business School Press, Boston.
8/30 Edinburgh Business School Strategic Planning
Module 8 / Implementing and Evaluating Strategy
• Financial• Internal Business Processes• Customer• Learning and Growth
And for each of these sets out:
• Objectives• Measures• Targets• Initiatives
By being explicit about value creating activities and how to develop andmeasure them the approach provides a framework for translating a strategy intooperational terms and contributes to the development of a strategic managementsystem. The objectives and measures used in the scorecard are derived froma top-down process based on the mission and strategy which have alreadybeen specified for the SBU; the Scorecard is therefore not concerned with thedetermination of objectives but with how to achieve them. The given SBUmission and strategy are expressed as tangible objectives and measures andthe targets and initiatives are then derived from these explicitly understoodobjectives and measures.
The concept of balance reflects the fact that clear and final answers to businessissues do not exist and that it is necessary to employ informed judgement. Sincetrade offs have to be made in the allocation of scarce resources to meet the needsof customers there are two classes of measurement:
• external measures for shareholders and customers• internal measures of critical business processes, innovation, and learning
and growth.
It is not a simple matter to relate measures of internal effectiveness to externaloutcomes because measures are not always available in unambiguous numericalforms thus there is also a balance to be struck between:
• objective and hence quantifiable outcome measures• subjective performance drivers of the outcome measures.
It needs to be pointed out that most organisations will already have perform-ance measurement systems and a decision has to be made whether the Scorecardshould complement these or replace them. This is an important issue, becauseif the Scorecard is seen as just another set of measurements amongst manythen the chances of fully implementing the Scorecard process are likely to bediminished.
In a practical setting the scorecard is used for a series of specific tasks asfollows.
Strategic Planning Edinburgh Business School 8/31
Module 8 / Implementing and Evaluating Strategy
1 Clarify and translate vision and strategy2 Communicate and link strategic objectives and measures3 Plan, set targets and align strategic initiatives4 Enhance feedback and learning
A discussion of each of these tasks helps show how the Scorecard might workin practice.
1 Clarify and translate vision and strategyThe SBU senior management team works together to translate the SBUstrategy into specific strategic objectives. This is often easier said than done,because at the financial level it is first of all necessary to agree on thebalance between revenue and market growth, profitability and cash flow.At the customer level it is necessary to agree on the segments in which tocompete; this will require a degree of consensus to resolve differences ofopinion on the composition of the segments.Once the financial and customer objectives have been determined the objec-tives and measures for internal business processes can be tackled. Thishas the advantage of breaking away from the typical cost, quality andcycle times of existing processes and highlights the processes that are mostcritical for achieving high levels of performance for customers and share-holders. The Balanced Scorecard may reveal entirely new processes that theorganisation needs to excel at for the strategy to succeed.The final step, learning and growth objectives, identifies the rationale forinvesting in retraining, IT systems and new organisational procedures.It is the process of building the Balanced Scorecard which clarifies strategicobjectives and identifies the critical drivers of these objectives. In practiceconsensus on strategic objectives is rarely found initially, with individuals’views being determined by factors such as experience and functional back-ground. It is almost impossible to go on and build complete consensus,but the Balance Scorecard makes disagreements and their rationales morevisible; it helps to accommodate incomplete consensus because the man-agement team adopts joint responsibility for the shared model of the entirebusiness, to which each has contributed.
2 Communicate and link strategic objectives and measuresThe details of how communication is carried out are much less importantthan the fact that it signals to all employees the critical objectives that mustbe accomplished. Once all employees understand high level objectives theycan establish local objectives that support the overall SBU strategy.
3 Plan, set targets and align strategic initiativesThe scorecard is an instrument for driving organisational change. To achieveambitious objectives it is necessary to set ‘stretch targets’ and on the basis ofthese determine resource requirements. This enables strategic planning to beintegrated with the annual budgeting process. As a result the organisationis enabled to• quantify the long term desired outcome• identify mechanisms and resources to achieve these outcomes
8/32 Edinburgh Business School Strategic Planning
Module 8 / Implementing and Evaluating Strategy
• establish short term milestones for the Scorecard measures.4 Enhance feedback and learning
The Scorecard information enables management to review and update with aview to learning about the future rather than dwelling on the past. Strategiclearning starts with the clarification of the shared vision and the use ofmeasures, whether objective or subjective, elevates the discussion beyond illdefined and nebulous ideas. The way in which the pieces fit together can bevisualised, and the comparison between desired and current performanceidentifies performance gaps.
A final wordThe Balanced Scorecard fills a gap which exists in most management systems –
the lack of a systematic process to implement and obtain feedback about strategy.Management processes built around the scorecard enable the organisation toalign itself with the long term strategy and focus on implementing it. Thebalance aspect emerges from a framework which makes it possible to makeexplicit trade offs among a number of objectives. At the same time the authorsstress that the Scorecard is about management first and measurement secondand as such has a major role to play in generating competitive advantage.
Question
What is the relationship between the Process Model and the Balanced Scorecard?
Case 5: Revisit An International Romance that Failed: BritishTelecom and MCI
1 Compare BT’s strategic process with WorldCom’s in relation to the takeoverattempts.
2 What are the strategic prospects for the new WorldCom/MCI company?
References
1 Goold, M. and Campbell, A. (1987) Strategies and Styles. Blackwell Publishers.
2 Goold, M. and Campbell, A. (1990) Strategic Control: Milestones for Long-Term Perfor-mances, Hutchinson Business Books.
3 Wilson, P. (1991) ‘Myths which can sink you’, Financial Times, 9 March.
Strategic Planning Edinburgh Business School 8/33

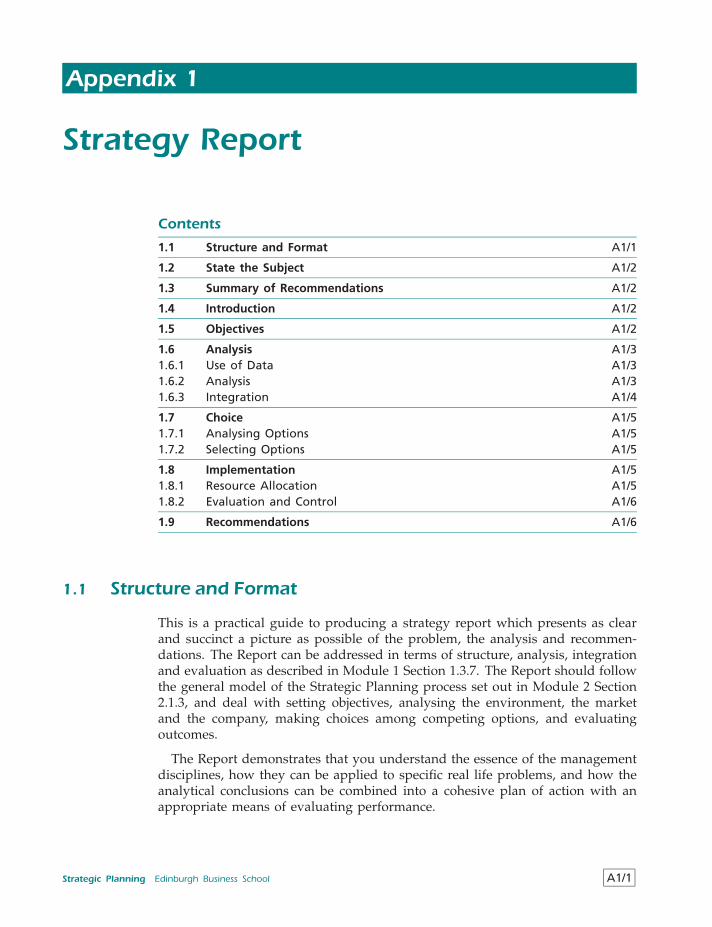
Appendix 1
Strategy Report
Contents
1.1 Structure and Format A1/1
1.2 State the Subject A1/2
1.3 Summary of Recommendations A1/2
1.4 Introduction A1/2
1.5 Objectives A1/2
1.6 Analysis A1/31.6.1 Use of Data A1/31.6.2 Analysis A1/31.6.3 Integration A1/4
1.7 Choice A1/51.7.1 Analysing Options A1/51.7.2 Selecting Options A1/5
1.8 Implementation A1/51.8.1 Resource Allocation A1/51.8.2 Evaluation and Control A1/6
1.9 Recommendations A1/6
1.1 Structure and Format
This is a practical guide to producing a strategy report which presents as clearand succinct a picture as possible of the problem, the analysis and recommen-dations. The Report can be addressed in terms of structure, analysis, integrationand evaluation as described in Module 1 Section 1.3.7. The Report should followthe general model of the Strategic Planning process set out in Module 2 Section2.1.3, and deal with setting objectives, analysing the environment, the marketand the company, making choices among competing options, and evaluatingoutcomes.
The Report demonstrates that you understand the essence of the managementdisciplines, how they can be applied to specific real life problems, and how theanalytical conclusions can be combined into a cohesive plan of action with anappropriate means of evaluating performance.
Strategic Planning Edinburgh Business School A1/1
Appendix 1 / Strategy Report
1.2 State the Subject
Although by their nature strategic problems are complex, the essence of theproblem can be communicated quite briefly. The difficulties confronting a com-pany can often be traced to a few underlying causes, such as the growth ofa new competing technology, escalation of costs, greatly reduced product lifecycles or government intervention.
A bland statement such as ‘The company has run losses for the past threeyears and will go out of business unless this is reversed’ is unsatisfactory. Thealternative is much more revealing. ‘Four years ago the company decided on amodernisation programme and an associated marketing drive to capture a largershare of the market. The investment programme utilised all retained earningsand put the company into substantial debt. Unfortunately, the main competitorsreacted strongly to the marketing drive, and there has been little increase insales revenue. The company is now operating with substantial excess capacityand a higher level of costs than before. The net effect is continuing losses andhigh debt, and no competitive advantage has been achieved.’
1.3 Summary of Recommendations
The strategic analysis can be summarised in a series of recommendations whichare clearly set out at the beginning. The combination of a brief statement ofthe problem together with the recommendations provides the reader with anorientation making it possible to follow the various strands in the argument andsee where they are leading.
1.4 Introduction
This section sets the scene for the later analysis. It deals with the main charac-teristics of the organisation, the economic environment within which it operates,the market and competitors, and the reasons why a strategic move is necessaryat this time.
1.5 Objectives
The strategic plan will hinge on the achievement of objectives, even if thesecan be specified only in the most general way. It is therefore necessary todevote time to identifying the company objectives and providing a rationale asfar as possible. This involves the application of ideas such as Gap Analysis,Shareholder Wealth analysis, the separation of means and ends, and the role ofnon-monetary objectives.
A1/2 Edinburgh Business School Strategic Planning
Appendix 1 / Strategy Report
1.6 Analysis
You will most likely start with an impressionistic view of the issues, given thatreal life problems tend to be rather complex. The objective of the analyticalsection is to rationalise data and information, and systemise it by the applicationof concepts and theories.
1.6.1 Use of Data
Do not allow your analysis to be undermined by an incompetent approach tonumbers. The objective of data communication is to turn data into information.There are a number of rules which can be applied:
1 Use only relevant numbers
There is nothing to be gained by swamping the reader with vast amountsof peripheral information.
2 Simplify the raw numbers
Remove irrelevant numbers.
Round numbers where possible.
Avoid spurious accuracy.
3 Make tables simple
Make tables as small as possible.
Round to sensible digits.
Use meaningful labels.
Include row and column averages.
4 Use graphs
Graphs are useful when simple patterns are involved.
Avoid graphs with complex patterns.
5 Use summary measures
Describe the main points of a table.
Do not leave the reader to draw conclusions.
1.6.2 Analysis
This is when you have to be able to see what ideas can be applied to the fourboxes in the process model. The core disciplines can be used to address issuesas follows:
Strategic Planning Edinburgh Business School A1/3
Appendix 1 / Strategy Report
1 Organisational Behaviour
What are the relationships within the organisation in terms of authority,power communications and management style? Are these likely to be con-ducive to change?
2 Economics
What is the economic climate in the markets the company is operatingin? What is the direction of government policy, and what opportunities orthreats will this present? Are there economies of scale in the industry? Whatare the barriers to entry?
3 Marketing
What are the market characteristics of the products, and what opportunitiesexist for segmentation and differentiation?
4 Finance
Which areas of company activity currently contribute to value creation?
5 Accounting
How well has the company been allocating its resources? What areas ofstrength and weakness does this reveal?
6 Quantitative Methods
What statistical techniques can be applied in the analysis of the market?
Other techniques and ideas can be incorporated, such as more advanceddecision making analysis and the role of negotiating.
Since the objective of using the core disciplines is to impose a structure onreal world events it is usually necessary to make assumptions about unknownfactors; these assumptions must be made explicit, and if relaxing them is likelyto make a significant difference to the analysis, this should be investigated.
1.6.3 Integration
The individual strands of analysis are incorporated into a framework whichcan be used as the basis for identifying strategic options. The emphasis is onapplying models, such as Porter’s five forces, the value chain, portfolio analysis,and any others you consider relevant. This leads to the development of:
1 Environmental threat and opportunity profile (ETOP) which focuses onthe aspects of the economy and the market external to the company.
2 Strategic advantage profile (SAP) which concentrates on the internal char-acteristics of the company.
3 Strengths, weaknesses, opportunities and threats (SWOT) analysis whichprovides a comprehensive view of the strategic position of the company,and attempts to find a fit between the company’s potential and marketopportunities.
A1/4 Edinburgh Business School Strategic Planning
Appendix 1 / Strategy Report
1.7 Choice
This is the stage at which, having collected information and performed theanalysis, the question of what to do next is faced. The analysis will revealpotential generic strategies.
1.7.1 Analysing Options
The application of the core concepts to each option will reveal characteristics suchas expected cash flow, relative net present values and risk. Various perspectivescan be obtained by applying sensitivity analysis, break-even analysis and thepayback criterion. Constraints such as the availability of funds and the mobilityof resources must be made explicit. Allowance for contingencies in the event ofunforeseeable occurrences should also be included.
No strategy can exist in a vacuum, and the likely reaction of competitors mustbe made explicit, together with projected strategic responses to the most likelyoutcomes.
The thrust of the analysis must be to identify the areas in which the strategywill contribute towards achieving, or improving on, competitive advantage.
1.7.2 Selecting Options
The selection of an option involves making trade-offs among different potentialcosts, benefits and risks. There will not be a correct answer because of theuncertain nature of strategy problems, but you must make explicit the reasonsfor the choice, the values awarded to different trade-offs and the attitude adoptedtowards risk. A choice can really only be justified in relation to the other potentialchoices, since the company has to adopt some course of action. It may comedown to selecting the least unpalatable option rather than the most attractive.
1.8 Implementation
Can the strategy be made to work? What company structure is most suited tothe strategy? How will you know if it is working or not?
1.8.1 Resource Allocation
This starts by comparing the current allocation of resources with that whichwill be required to achieve the strategy. Where the strategy implies significantorganisational change, the approach to introducing and managing the changeprocess is an essential component.
The labour implications include organisational structure, incentive systems,promotion and training. The capital implications include capacity utilisation,obsolescence, new technologies and labour substitution.
Strategic Planning Edinburgh Business School A1/5
Appendix 1 / Strategy Report
At the same time, flexibility needs to be built in so that alternative courses ofaction can be pursued if predictions are wrong. There is no point to developinga totally inflexible structure which cannot be deviated from without invalidatingthe whole strategy.
1.8.2 Evaluation and Control
A system of control which includes the production of performance measuresrelating to profitability, activity, efficiency, cash flow and debt is an essentialcomponent of implementation. A system of intermediate targets is also impor-tant so that individual managers know what they are meant to achieve. Takentogether, these goals and performance measures should have the potential to pro-vide a perspective on the overall development of the strategy as time proceeds.They should also serve as an early warning system for detecting differencesbetween expected and actual outcomes.
1.9 Recommendations
A summary of the recommendations appears at the beginning, and this sectionis a fuller version with the various strands of the strategy explained in somedetail, potential problems discussed, and contingencies identified which may beadopted in the event of unfavourable outcomes.
A1/6 Edinburgh Business School Strategic Planning
Appendix 2
Answers to Review Questions andCase Analyses
Contents
Module 1 A2/1
Module 2 A2/7
Module 3 A2/16
Module 4 A2/21
Module 5 A2/24
Module 6 A2/45
Module 7 A2/59
Module 8 A2/70
The analyses of the Review Questions and Cases are designed to demonstratehow to utilise the concepts from the strategic planning course, and how to incor-porate ideas from the individual business disciplines. Because of the complexityof many of the issues raised it is quite likely that you will identify aspects whichare not covered in the analyses and which you consider to have an importantbearing on the problems presented. This is all part of the learning process, andinitiative and originality (so long as these are relevant and logical) are to beencouraged.
Module 1
Review Question 1 Analysis
The CEO is actually implementing a strategic planning approach possibly basedon his knowledge of military strategy: he has established a set of objectives,which is to keep shareholders happy, to achieve about 12 per cent return oninvestment, and not to grow the business other than to follow trends in themarket; this can be deduced from the fact that market share has remainedconstant for several years; he carries out (unspecified) analyses of the marketplace, and has decided on a planning time horizon, i.e. about one year ahead;he has a control process in the sense that he watches costs and tries to keepthem under control. The real issue is whether the skills he has transferred fromthe military environment are likely to be effective in business.
Strategic Planning Edinburgh Business School A2/1
Appendix 2 / Answers to Review Questions and Case Analyses
In order to probe rather more deeply into the process and arrive at a seriesof questions, you can use the elements of Strategic Planning. Under each of theheadings you should generate a series of relevant questions such as:
Structure
• How do you decide what prices to charge for your products?
• What criteria do you use for allocating resources among competing alterna-tives?
• What methods do you use to determine whether potential investments arelikely to be worthwhile?
Analysis
• You criticise the scientific method of strategic planning, but your ownconclusions are based on one observation; how do you know you are right?
• Why do you consider 12 per cent to be a good rate of return in yourindustry?
• How do you assess competitive pressures in your industry?
Integration
• What would be your reaction to the entry of a major aggressive competitor?
• What is your contingency to deal with the worst potential outcome whichyou think is reasonably likely in the next year?
• What would be the likely costs and benefits of attempting to increase marketshare?
• How does the company cope with change?
• How do you keep your employees in touch with the overall objectives anddirection of the company? Do you think it is necessary?
• How often do your functional managers meet with you to discuss the futureof the company?
Evaluation
• What procedures do you use in the company to ensure that you obtainrelevant information in time to make use of it?
• What techniques do you use to ensure that your costs are at least comparablewith competitors?
• What incentive systems do you use to ensure that your employees are‘happy’, and how do you determine whether they are ‘happy’?
A2/2 Edinburgh Business School Strategic Planning
Appendix 2 / Answers to Review Questions and Case Analyses
You could also pose a series of questions about corporate versus SBU issues:for example, what criteria are used to select products, and how resources areallocated among SBUs.
The CEO seems to think that his military background gives him an advantagein the business environment. However, none of his statements about how heruns the company are obviously related to conducting military campaigns. Youcould ask a question relating to the carry over from military to business strategy;for example, in a competitive market there are many ‘enemies’, so how doesthis relate to the military case where typically a single, clearly defined, enemyis engaged?
You will probably have had some difficulty in formulating sensible questionsat this stage. By the end of the course the types of question listed above willbe almost automatic. However, it is unlikely that you could unsettle this CEO,because people who have been moderately successful are usually convinced thatthey are doing the right things.
Review Question 2 Analysis
It is a matter of judgement whether the five point plan is regarded as beingprescriptive. While it was fairly specific it did not specify a time scale norspecific targets in terms of market share, sales revenue, cost reduction nor howincreases in market intelligence would be measured.
The Planning Approach
• The future can be predicted accurately enough to make rational choices. Thevarious crises which occurred as soon as the plan was decided on areconsistent with the argument that the future cannot be predicted accurately.However, the CEO was not so much predicting the future in terms ofevents as the future of the company in terms of three scenarios: carry onas before, be more aggressive in existing markets or combine increasedaggression with an acquisition. He then asked for recommendations fromeach functional specialist and on the basis of that had them put together afive point plan. This course of action was a rational choice in terms of whatcould be divined about the future; it has to be appreciated that even the‘do nothing’ option is a choice in its own right. Therefore the fact that thefuture was unpredictable is not a valid argument for making no change atall.
• It is possible to detach strategy formulation from everyday management. Theinformation presented by the functional managers was slanted towards theirown interest, and each felt that his perspective was the most important. Theinformation certainly did not reach the CEO in a ‘tidy bundle’ and he had tointegrate and interpret it; it is quite possible that a different CEO would havecome to a different set of conclusions with exactly the same information.At the same time the CEO was dependent on the functional managers topresent all relevant information, and he had no guarantee that this wasactually done. For example, the marketing projections might have been
Strategic Planning Edinburgh Business School A2/3
Appendix 2 / Answers to Review Questions and Case Analyses
pure speculation and the ‘detailed financial appraisal’ carried out by thefinance department might have used questionable accounting conventions.As it turned out almost all of the information presented, whether it wasaccurate or not, went out of date very quickly.
• It is possible to forego short-term benefit in order to gain long-term advantage. TheCEO made it clear that the attempt to attain a higher degree of competitiveadvantage would result in reduced profits in the short run, although anattempt would be made to mitigate this by introducing a JIT programme.The fact that the returns would be reaped in the longer term when combinedwith the subsequent crises resulted in the unanimous conclusion that nochanges should be made. The immediate crises focused attention on the factthat the change programme would not deliver immediate benefits.
• The strategies proposed are capable of being managed in the way proposed. There isno doubt that the strategy could not be implemented in the way proposedgiven the reaction of the labour force. It would appear that no considerationhad been given to how the proposed changes would appear to the verypeople who would have to put them into effect.
• The Chief Executive has the knowledge and power to choose among options. Whilethe five point plan had been developed for the CEO by the functionalmanagers they did not exhibit much commitment to it. All of them werehappy to suggest shelving it as soon as circumstances changed; none ofthem produced a suggestion as to how the general thrust of the plan mightbe maintained while accommodating the difficulties they faced.
• After careful analysis, strategy decisions can be clearly specified, summarised andpresented; they do not need to be altered because circumstances outside the companyhave changed. There is no doubt that some adjustments to the five point planwould have to be made in the light of on going events. In fact the five pointplan did not have a time scale attached and it was not set out in a precisefashion.
• Implementation is a separate and distinctive phase that only comes after a strategyhas been agreed. This was certainly one of the drawbacks of the whole process.The five point plan was constructed in isolation from any consideration ofhow it might be implemented, and as soon as an attempt was made to putit into effect it began to founder.
In summary it can be noted that while the strategic process can be criticisedin these terms, the five point plan did not really amount to a prescriptive planand the criticisms, while valid in their own right, do not invalidate what theCEO was trying to achieve.
Emergent Strategy
• The general approach adopted by the CEO accorded with the emergentapproach in that each day he considered the three questions and tried totake the answers into account in running the company. He spent as muchtime as he considered useful in generating information, and then operated
A2/4 Edinburgh Business School Strategic Planning
Appendix 2 / Answers to Review Questions and Case Analyses
in satisficing mode by identifying three courses of action out of manypossibilities and then deciding to go with the expansionary diversificationoption which led to the development of the five point plan.
• It is important not to confuse the five point plan with the CEO’s strategicchoice; the five point plan was a means of achieving the overall objectiveand was likely to be subjected to detailed changes as time progressed. Asmarket conditions changed (for example the Japanese invasion) the CEO’sperception of market possibilities would probably change; but it wouldpresumably take a series of fundamental changes to alter his overall visionof where the company should be going.
Resource Based Strategy
• The CEO’s summary highlighted some distinctive competencies: a produc-tive research department and a sound internal structure. However, the mainfocus was on external market pressures in the form of intensifying com-petition in established markets. The five point plan did not identify theunique competencies of the company which could be aligned with marketopportunities.
Review Question 3 Analysis
At first sight the five point plan has a certain logic and comprises a fairly specificset of recommendations for future action. But does it really provide a focus forfuture deployment of resources?
The salient point is that there does not appear to be a clear distinction betweencorporate and business unit concerns. The role of the corporate CEO lies inmanaging corporate cash flows, deciding which markets to be in, allocatingresources among the business units and acquiring or divesting business units.Detailed actions for business unit efficiency are suggested (such as JIT), but noconsideration is given to the optimal allocation of resources among businessunits. Instead, the first four points are directed at all three business unitsindependent of their individual operations and they essentially boil down toincreasing competitive advantage and reducing costs.
The fifth point refers to corporate communications and the need to developa company culture; this is left totally vague and the issue of whether the sameculture is appropriate for the individual business units is not addressed. Therole of the corporate headquarters in the company is not discussed; while thecurrent three products are related in terms of production techniques and marketsserved there is no indication of what the parenting contribution of the corporatecentre is likely to be in the future.
Thus when viewed from the business versus corporate perspective the fivepoint plan emerges as being incomplete and unstructured. While all of theissues raised in the plan are important they do not identify where the companyis headed as a corporation and what the role of the individual business unitsare within this grand design.
Strategic Planning Edinburgh Business School A2/5
Appendix 2 / Answers to Review Questions and Case Analyses
Review Question 4 Analysis
Rittell’s Tame and Wicked Properties: see Table 1.1
1 The CEO attempted to formulate the problem by asking three questionsevery day. When he decided he needed a full answer to the first questionhe was confronted with a number of reports about current performancewhich he had to interpret and integrate. In this case it was clear that therewas no such thing as a definitive formulation of company performance.When it came to identifying what should be done in the future the optionsmultiplied, while specifying what would achieve successful change wasonly partially addressed.
2 The CEO’s summary of current performance immediately identified whatwould have to be done in many respects: the internal weaknesses in coor-dination and the external threat of increased competition implied action toincrease efficiency and improve marketing.
3 The CEO came up with three broad strategies each of which had its owncosts and benefits. The third option, which he appeared to favour, was notsupported in its entirety by the subsequent information provided in thevarious reports (the acquisition of Easy Turbines was not pursued). Thecourse of action finally undertaken was the best the team could come upwith but it could not be claimed that it was the best possible.
4 Once a start was made to putting the plan into action it immediatelymerged into market dynamics, and it is an open question whether the sameconclusion would have been reached the following week.
5 The CEO did not have a check list of techniques which he could apply.Instead he depended on the skills of the individuals who happened to beon his team at the time.
6 The fact that competition was increasing may have been due to marketentrants or it may have been a symptom of the fact that not enoughresources had been devoted to maintaining product quality and after salesservice.
7 Far from being able to undertake the same course of action again, it wasimmediately doubtful if the five point plan itself could be implemented atall.
8 The chances of the particular combination of circumstances confronting theCEO having occurred before is practically zero. As a result there was noprecedent which could provide him with the answers he was looking for.He may have had experience of a company in a similar competitive situationbut whether it could be similar enough to provide real guidance on whatto do in this situation is an open question.
A2/6 Edinburgh Business School Strategic Planning
Appendix 2 / Answers to Review Questions and Case Analyses
Review Question 5 Analysis
The CEO and the operations manager were advocating the strategic planningapproach in which the company can be managed by applying analysis and logicto existing information. Their view of the world was that they had just not beengood enough at doing this in the past. They were also committed to a resourcebased view, that profitability could be improved by making the company moreefficient in the technical sense. They were backed up in this by the financedirector, who saw the issue in terms of efficient resource allocation.
On the other hand, the marketing manager felt that the emergent approachwould be more effective and that the company needed a greater degree offlexibility. He felt that strategy could emerge as the company developed and asthe environment changed and that it was pointless to plan for the unknowable.He was concerned with the dynamics of the market and felt that the wayforward was to be continually proactive.
The strategy consultant could see that they were disagreeing about the funda-mental approach to decision making. He pointed out that the first step was torecognise these perspectives and then it was up to them to decide on a courseof action instead of arguing about how they see the world individually.
One of the fundamental tasks of business education is to enable managersto understand what it is they are actually arguing about. In this case decliningprofit was a symptom of the wider problem that the company was not equippedto deal with changing market conditions.
Module 2
Review Question Analysis
A large quantity of information is presented in the Mythical story, and an overallperspective on what was happening can be obtained by classifying it within theprocess model.
Strategists
The CEO clearly saw himself in the role of ultimate strategist while askinghis subordinates to provide information, analysis and opinions. The com-pany itself was at the diversified stage but it was not clear that productand marketing decisions had been fully delegated to the SBU chiefs. In fact,the SBU chiefs did not appear to figure in the decision making process.The CEO may have been averse to risk, bearing in mind his commentson the risks associated with moving into new markets and acquiring EasyTurbines.
Objectives
The CEO did not explicitly state the mission and objectives of the company.He did say that it was time to shed the image of conservatism and that
Strategic Planning Edinburgh Business School A2/7
Appendix 2 / Answers to Review Questions and Case Analyses
resources should be devoted to exploiting existing markets more vigorouslyand diversifying. These general statements of intent were not translatedinto measurable objectives even in the five point plan.
WHO DECIDES TO DO WHAT
In this stage of the process the strategist demonstrated the ability to bringtogether information and come to clear conclusions. While a strategic direc-tion for the company was identified this was not associated with the for-mulation of specific objectives.
The general environment
The first Economic Report related general economic conditions to companyperformance.
The industry environment
The first Marketing Report dealt with competitive pressures in relation toproduct life cycles and market entrants.
Internal factors
A great deal of information on the internal situation was provided in thefirst Accounting, R&D, Finance, Production and Manpower Reports. Eachfocused on a particular aspect of the company and as a result it was difficultto determine from the Reports what the company was particularly good at.
Competitive position
This first CEO’s Summary drew together the individual Reports and focusedattention on the fact that competitive pressures were such that the companycould not carry on as before.
ANALYSIS AND DIAGNOSIS
The CEO was clearly determined not to undertake any action without aclear understanding of the current situation of the company in the generaland market environments and its competitive standing. It would have beenpossible, of course, to spend even more time on examining the behaviour ofcompetitors and analysing the internal operations of the company. However,given that time was moving on and the CEO recognised the need to maintaincompetitiveness there is a limit to how much time can be spent on this stageof the process.
Generic strategy alternatives
The CEO identified three generic strategy alternatives: carry on as before,be more aggressive in existing markets, and combine increased aggressionwith diversification. These three options can be regarded as generic becausethey imply fundamentally different future resource allocation.
A2/8 Edinburgh Business School Strategic Planning

Appendix 2 / Answers to Review Questions and Case Analyses
Strategy variations
The second set of Reports introduced some variations on the genericapproaches; for example, there was a great deal of discussion of expan-sion by acquisition, and the R&D Report suggested how much should bespent on new products.
Strategy choice
There was a good deal of comment on the generic alternatives and thestrategy variations in the second set of Reports. The final choice made bythe CEO was for an expansionist diversified approach but not to pursue theacquisitions route.
CHOICE
The CEO did not simply ask for information but actively canvassed hiscolleagues for their views on different courses of action. It is, of course,not known whether he had already decided what to do, but the weightof opinion was certainly against diversification by acquisition and the CEOdid appear to have taken these views into account. Thus the process formaking choice was quite exhaustive and the final decision was certainly nottaken in isolation.
Resources and structure
The five point plan did not specify the structure within which changeswould be implemented, and it was not clear whether responsibilities wouldbe allocated on a functional or divisional basis.
Resource allocation
Specific action was to be undertaken to improve resource use, including theintroduction of JIT, improved coordination and improved communications
Evaluation and control
The intention was to introduce more rigorous controls for monitoring com-pany performance. However, what form these would take was not specified.
IMPLEMENTATION
The five point plan was concerned with the implementation of change.While the plan dealt with a range of issues it is worth considering whatadditional actions might be undertaken. For example, there is no mention ofwhether the incentive system was aligned with the proposed changes; it hasbeen noted that little attention was paid to company structure; there was nodiscussion of how the changes would be sequenced nor of critical successfactors. While a great deal of thought had gone into the identification ofcompany position and definition of strategy it is an open question as towhether the changes could be implemented. The subsequent reaction of theworkforce suggested that there were formidable problems in store.
Strategic Planning Edinburgh Business School A2/9
Appendix 2 / Answers to Review Questions and Case Analyses
FEEDBACK
There was a great deal of feedback by the following week. The reactionof the functional managers was that the change programme should beabandoned. What the CEO would decide to do is another story.
It will be noted that when setting out the events in this way the actual sequencewas ignored. According to the story in the first stage the CEO became concernedabout what what was happening and started with analysis and diagnosis, whichwas dealt with in the first set of reports and the CEO’s summary. The generalenvironment was dealt with in the Economic Report, the competitive positionwas the concern of the Marketing Report, while the Accounting, R&D, Finance,Production and Manpower Reports dealt with internal factors.
The second stage was concerned with choice, and the CEO identified threegeneric strategy alternatives and asked his functional managers for suggestedcourses of action, i.e. strategy variations. It was also during this stage thatthe CEO took the Market Analyst’s Report into account and specified generalobjectives: he stated that the company should shed its conservative image andemerge as a real contender in the market. The CEO’s final strategy choice wasto pursue an expansionist, diversified approach.
The third stage was concerned with implementation and the managementof change; however, no attempt was made to address resources and structure,improved resource allocation was to be achieved by improved internal coordi-nation and ‘just-in-time’ techniques, better internal communications and use ofinformation, and more effective evaluation and control procedures were to beinstalled.
The subsequent crises caused the functional managers to suggest going backup the process (feedback) to the choice level and reverting to the originalstrategy.
The reason for ignoring the actual sequence of events when applying theprocess model is that the intention is to evaluate the process itself. In any case,real life events are typically complex and it is often difficult to determine whatis actually happening. But it is usually possible to relate events to different partsof the process model, therefore having assessed the details of the process it ispossible to identify where strategy is likely to come unstuck. In the Mythicalcompany the main weakness appears to lie in the implementation stage of theprocess. The application of the process model to different companies will revealdifferent strengths and weaknesses in processes and goes a long way towardsexplaining what actually happens.
You should now be able to select at random any of the Reports generatedby Mythical Company managers and have a fair idea of what aspect of thestrategy process it was directed towards. There is always going to be scopefor discussion on where individual aspects should be located; for example, thesecond of the Accounting Reports can be classified as a comment on strategyvariations as a contribution to strategy choice. But you may have a differentview on this Report, and there is nothing wrong with that so long as you canprovide a reasoned argument in favour of your view.
A2/10 Edinburgh Business School Strategic Planning
Appendix 2 / Answers to Review Questions and Case Analyses
Case 1 Analysis: Rover Accelerates into the Fast Lane
1. In what ways had the Rover management failed to maximise value by 1994?
This question is intended to start you thinking about value creation and thedeterminants of company value. This issue will be developed as the courseproceeds. The following are the types of underlying weakness which might beidentified by a predator and, once they have been rectified, lead to a once forall increase in value. The rationale for take-overs at 7.4.3 will deal with theseissues in more detail.
• Development expenditure: this had possibly been inefficiently allocated,given that the company was still waiting for a replacement for the Metro.Its main access to advanced technology appeared to be through its alliancewith Honda rather than through internal development.
• Marketing strategy: Simpson had suggested redefining Rover as a nicheproducer. The fact that the company had performed better than the totalmarket suggests that this approach may have met with success. Pischetsrei-der’s view that the German market could be increased by a factor of up to9 suggested that in his view the marketing strategy had been completelyineffective.
• Resource management: costs were still relatively high in that the break-evenoutput was still high in relation to current sales. But significant progresshad been made in the past, and there was certainly potential for continuingimprovement.
• Expected increase in demand: the 5 per cent UK growth may be a leadingindicator for European demand which had declined by 20 per cent duringthe same period. It was possible, for example, that an increase in Euro-pean demand might have increased sales well beyond the break-even levelwithout any need to alter the current marketing strategy.
• Weak products: Rover had already divested well known model names; itwas acknowledged that the Metro needed replacement; it is possible that theHonda small batch production technology was inappropriate for the nichethat the company was targeting, and that the BMW approach of building toindividual specification would strengthen the product offerings.
2. Do you think that Rover was a good buy for £529 million in 1994, bearing in mindthat not all potential strategic gains can be expressed in financial terms?
The financial aspects of the take-over can be assessed using ideas from thefinance and accounting courses. In 1993 the company assets were valued at £1.4billion less debts of £0.4 billion, so it looks as if BMW bought Rover for about‘half price’. However, the real issue is whether a sensible rate of return couldbe obtained on the £529 million spent plus the £400 million of debt which hadto be repaid. If the current profit of £100 million were to continue, the rate ofreturn comes out at about 10 per cent. Thus in financial terms the attractivenessof the purchase depends on how BMW regards this return on capital.
Strategic Planning Edinburgh Business School A2/11
Appendix 2 / Answers to Review Questions and Case Analyses
The prospects of Rover continuing to make profits depend on factors suchas reducing the break-even output and/or increasing sales. The productivitygraph shows that the UK still had a long way to go to equal Japan and the US;furthermore, Germany was a relatively high cost producer, so it is not clear thatthe merger would result in significantly lower costs. The aspirations voiced byPischetsreider regarding the potential for increased sales did not appear to bebased on any evidence. It appears that BMW had purchased a profitable LandRover model and cars with no track record of profitability.
There are many non-financial aspects of the take-over and these ideas will bedeveloped later in the course; these include:
• Synergy: Rover’s activities may have been a good fit with those of BMW intheir sector of the quality car market.
• Economies of scale: the combination of Rover and BMW may have con-tributed to economies of scale; however, at the time Rover produced only afraction of BMW’s output.
• Think global act local: instead of trying to increase BMW sales in the UK, thepurchase of Rover’s market share provided BMW with immediate marketpenetration.
• Competitive action: the take-over could be interpreted as an indirect attackon Honda, which was a major competitor and had been achieving significantmarket gains in the quality sector. The take-over also gave BMW access toHonda technology; however, given the differences in their approach this wasprobably not significant. The move also eliminated the direct competitionbetween Rover and BMW.
Some of the non-financial aspects have a potentially negative impact.
• Company culture: the management culture of Rover and BMW may notturn out to be compatible.
• Managing change: the achievement of BMW’s ambitions for Rover wouldincur significant change costs; BMW’s plans in fact amounted to reversingthe trend towards Rover becoming a niche producer.
• Honda constraint: the existing 20 per cent ownership of Rover by Hondamight have constrained future BMW plans.
There are clearly a number of arguments both for and against the take-over. Having identified these it is necessary to assign some form of ranking toeach in order to arrive at a balanced judgement on whether the take-over wasworthwhile. This is a subjective process, but it is important that you give somethought to the trade-offs and come to a reasoned conclusion on the take-overgiven the available information.
Another way of looking at the take-over is that BMW would bring someparenting benefits to Rover; from the information available it appears that theonly feasible advantage is synergy, as discussed above. One danger is that
A2/12 Edinburgh Business School Strategic Planning
Appendix 2 / Answers to Review Questions and Case Analyses
the parenting impact will lead to value destruction as the link with Honda isremoved. At the end of the day the acquisition of Rover will have to add morethan £529 million to BMW’s worth to make the take-over worthwhile. From theinformation available it is not at all clear how this might be achieved.
3. Discuss the strategies of Edwardes, Day and Pischetsreider using the process model.
The approaches adopted by the three leaders can be interpreted using the processmodel. The following is an example of how the classification might be carriedout, but you will no doubt have your own approach.
Objectives
– Edwardes: improve labour relations and modernise technology.
– Day: redefine Rover as a niche producer.
– Pischetsreider: make Rover a volume producer.
Analysis and Diagnosis
– Edwardes: totally concerned with the cost side.
– Day: Rover had lost ability to compete against the big players; product lifecycle notion used to get rid of Austin and Morris.
– Pischetsreider: international alliance was the key to competitiveness.
Strategy Choice
– Edwardes: initially was concerned with stability and defence of marketshare.
– Day: recognised that the company had to retrench and redefine itself as aniche producer.
– Pischetsreider: adopted an expansionist approach which was a totally dif-ferent strategy to both previous CEOs.
Implementation
– Edwardes: concentrated on improving labour relations and forging theHonda link.
– Day: emphasise reducing break-even and developing backward integration
– Pischetsreider: a vision was founded on new technology, synergy and hori-zontal integration.
You should be able to see how the process model makes it possible to discussthe strategic approaches of the three CEOs in a structured fashion; it focuseson the differences in objectives, choice and implementation which are the mainelements of their strategies. Without a process model you would find yourselfflitting among objectives, analysis, choice, implementation and so on in a hap-hazard fashion. While there is much that can be said about what the CEOs did,it is visualising it in a structure which is important.
Strategic Planning Edinburgh Business School A2/13
Appendix 2 / Answers to Review Questions and Case Analyses
Case 2 Analysis: The Millennium Dome: how to lose money in the 21st century
1. Assess the Dome as a financially viable concept if its life had not been restricted toone year.
The Dome had an artificially determined product life cycle of one year. Thismeant that if the visitor projections were not achieved there was no secondchance. The operating costs of the Dome were largely fixed, but given the rela-tively short operating time there was no opportunity to move up the experiencecurve. It was therefore a very risky project from the start and its financialviability was extremely uncertain.
On the basis of the first year’s experience it is quite possible that the Domecould generate £100 million per annum in revenue, assuming about six millionpaying customers per year. The operations and running costs in the year ofoperation came to £201 million. This suggests that it would be necessary to cutthe operating costs by more than half to generate a viable concern. Inspection ofthese accounts suggests that there are items, such as Central Contingency, whichmay not really refer to the variable costs of operations, so it is possible that £201million is not a representative figure. It is likely that costs could be significantlyreduced as experience builds up, while it is also possible that the Dome couldbe made to appeal to a wider audience. If it were to be a success in the longerterm it is clear that action is necessary on both the cost and revenue sides.
2. Discuss the fortunes of the Dome using the process model.
Who decides to do what
Strategists
These were initially politicians who were much more concerned with theirpersonal reputations than financial viability. Mr Ayling was a successful busi-nessman but had many interests and may not have been able to focus adequatelyon the Dome; Jenny Page had no experience of running a profit making business.
Objectives
The mission focused on the impact on individuals, and the objectives made nomention of balancing the accounts. The mention of ‘value for money’ for theMillenium Commission was vague – it did not necessarily imply that the Domewould end up with a financial surplus.
The overall objective was to produce ‘the greatest show on earth’, which wouldlast for only one year, while attempting to balance the accounts. These objectiveswere incompatible.
It was not clear what business the Dome was in – education or entertainment.
Overall who decides to do what
There was plenty of will to produce the greatest show on earth, but littleunderstanding of what would be required to generate a profitable businessconcern. There appears to have been significant principal agent problems.
A2/14 Edinburgh Business School Strategic Planning
Appendix 2 / Answers to Review Questions and Case Analyses
Analysis and diagnosis
The general environment
The millennium was a unique time to launch the venture, and the UK itself hadbeen enjoying prosperity for three years under the Labour government.
The industry environment
There is a great deal of competition among attractions, and a high proportionof visitors would have to make the trip to London adding to the cost. Themarket research suggested 11 million paying visitors but this turned out to bewrong by a factor of two; there was little information on elasticity of demand toprovide guidance on pricing. The subsequent government report suggested thatthe Dome was not sufficiently differentiated (the wow factor) to attract visitors.
Internal analysis
The Dome was never expected to make a profit, but there was no understandingof what the ultimate costs were likely to be.
Overall analysis and diagnosis
As might be expected the management received the blame for not succeeding ina task which was probably impossible from the outset.
Choice
Generic strategy
A strategy of differentiation was obviously selected, but given the difficulty ofdefining the objectives it appears that the basis of differentiation was not clear:what would make the Dome the experience of a lifetime?
Strategy variations
The Dome was effectively an alliance with businesses who provided sponsorship.It is debatable whether this was workable given that the businesses wantedadvertising and the government wanted a prestige project.
Strategy choice
The process of selecting the strategy was muddled because of the change ingovernment and interference by politicians.
Overall choice
It is not certain that the end product was based on analysis or whether it simplyevolved.
Implementation
Resources and structure
The senior management may not have had the characteristics required to runthe Dome efficiently. Firing the Chairman and CEO was unlikely to solve thefundamental problems.
Strategic Planning Edinburgh Business School A2/15
Appendix 2 / Answers to Review Questions and Case Analyses
Resource allocation
The lack of operational experience was evident in the queues and the lack offinancial controls. The Dome management had expended so much energy indelivering the Dome on time for the Millenium that they probably had not hadtime to develop sound operational procedures.
Evaluation and control
It was impossible to construct a balance sheet so clearly the financial controlsystem was inadequate.
Overall implementation
There seemed to be no understanding of how to run the Dome efficiently.
Feedback
It became apparent quite early on that things were not turning out as planned(or hoped). But it was difficult to react to events because of the relatively shorttime period.
Overall strategic process
Given the weaknesses in the strategic process it could be argued that theindividuals concerned did a good job in making it as good as it was; after allit did attract millions of visitors. The real weakness lay in the objective settingarea which set an almost impossible task.
Module 3
Review Question 1 Analysis
1. Apply the gap concept to objective setting in the Mythical Company.
The first step is to construct a profile of the current position. For example, thecompany is currently profitable with relatively low labour costs. But its cashflow is poor; it has four products in its portfolio, and there has been a historyof resource allocation problems. The company has several new products in thepipeline, but doubts have been expressed about their potential viability.
To estimate what is likely to occur if no change to current strategy is made,you can start by considering what is happening to competitive pressures; theconsensus is that these will increase. The combination of increased competition,shorter product life cycles, and resource allocation problems strongly suggestthat the company will be less profitable in the future and will certainly not bemuch bigger than at the present. The increase in profits which can be expectedin the short run because of a more favourable economic climate cannot be reliedon to continue.
A2/16 Edinburgh Business School Strategic Planning
Appendix 2 / Answers to Review Questions and Case Analyses
The desired outcome, as stated by the CEO, is to capture larger market shares,diversify into related markets, and ensure that profits do not decrease in thelong run.
From the subsequent reaction of the management team to the various crisesyou could infer that they do not consider that the difference between the currentposition and the desired position is all that great. However, the CEO hasconcluded that the gap between expected and desired outcomes is substantial. Itis the CEO’s perception of this gap which justifies the five point plan for change.
The gap is due to both external and internal factors. The main external factoris the changing competitive position; the main internal factor is the inefficientuse of resources.
2. Interpret objective setting in the Mythical Company in terms of the main headingsin this Module.
Credible objectives: at first sight the objective does not appear to be unattainable;in fact, it seems essential for the future prosperity of the company. However, thesubsequent reaction of the management team suggests that they did not reallybelieve that reformulation of company objectives was necessary.
Quantifiable Objectives: the CEO was primarily concerned with share price,profitability, market shares and productivity. He was concerned with the intan-gible ‘company culture’ only to the extent that it was likely to contribute towardshigher productivity and achievement of the overall objectives.
Aggregate Objective: the CEO had his eye firmly fixed on the prospects for theshare price, and was obviously concerned about the Market Analyst’s report.
Disaggregated Objectives: the five point plan for change can be seen as a seriesof disaggregated objectives; however, responsibility for achieving individualobjectives was not allocated among functional specialists or SBUs.
Principal/Agent Problem: the individual reports reveal that each functional man-ager had different objectives, but there was nothing in the five point plan abouta new incentive system. Perhaps that is why they came up with so many reasonsfor subsequently abandoning the new strategy.
Means and Ends: the CEO had no illusions about the role of the five point plan;it was clearly a means towards the overall end of maintaining the company’svalue.
Economic Objectives: the CEO was a profit maximiser in that he focused onthe likely pattern of profits; he saw increased competitive advantage as being ameans of maximising profit rather than being an end in itself.
Financial Objectives: the CEO was aware of the good ROI for the current year,but did not consider this to be a good predictor of future financial viability. Hedid not carry out a formal shareholder wealth analysis, but he was well aware ofthe direction the company had to take to ensure that wealth would be created.
Social Objectives: these did not figure in any of the discussions.
Strategic Planning Edinburgh Business School A2/17
Appendix 2 / Answers to Review Questions and Case Analyses
Stakeholders: the five point plan gives some indication of the implicit stake-holder map visualised by the management team. For example, it could bededuced that the team positioned employees as high priority but low influence.It then came as a surprise to discover that employees in fact had high influence.
Ethical Considerations: the CEO was apparently not confronted with any ethicaldilemmas other than his responsibility to ensure the success of the company.Because he promoted an expansionary approach he probably did not have tomake any trade-off between the interests of shareholders and the interests ofemployees other than to obtain their cooperation in the process. However, thereaction of employees suggested that they felt they would be made worse off asa result of the proposed changes.
Review Question 2 Analysis
This is an example of the principal agent problem. The details of the discussionare not so important as recognition of the fact that they will all approach theissue from different perspectives, and that maximisation of company profit isunlikely to be the most important consideration for any of them. For example
CEO: turnover is not necessarily a good indicator of profitability, and I need toensure that profitability from the three SBUs is as high as possible because I amanswerable to shareholders. The suggested system would give SBU managersthe incentive to increase turnover at the expense of profitability.
Accounting: it is a good idea from the viewpoint of efficiency because itmeans we have a simple and unambiguous rule to apply when deciding onremuneration.
Human resources: the implication that one manager is three times more valuablethan another can have a serious impact on motivation and cooperation amongthe SBUs. Competitive conditions could worsen for one of the products, forexample if a strong competitor entered the market, and the resulting reductionin revenue would be outside the control of the SBU manager.
SBU3 manager: it is not equitable, because I have to spend a lot of timetravelling and work more hours than the other two.
SBU2 manager: the only reason we have SBU1 producing equipment at allis because of the specialised work we do, so SBU1’s sales really depend onour production of cleaning compounds and SBU3’s ability to generate newcustomers.
SBU1 manager: why is it that only the Accounting manager is in favour ofmy idea? It stands to reason that the bigger your sales are the bigger yourresponsibility and that is what you should be paid for.
The fundamental issue which emerges from this discussion is that individualmembers of the organisation interpret the issue from their own perspectiveand this leads to conflicts; one of the challenges in strategy is to recognise theprincipal agent problem and devise methods of overcoming it.
A2/18 Edinburgh Business School Strategic Planning
Appendix 2 / Answers to Review Questions and Case Analyses
Case Analysis: Porsche: Glamour at a Price
1. Analyse Porsche’s competitive position over the ten years.
This question is presented at this stage to distract you from the immediateissues relating to objectives and reinforce the complexity of strategy. The issueof competitive advantage is a recurrent one, and it is important not to lose sightof this fundamental strategic issue. Issues raised by the case include internationalcompetitive advantage, return on sales, risk, supply and demand factors andratio analysis. You will find it instructive to return to this case after Module 7.
The case highlights some of the problems of competing internationally. Itis important to appreciate the impact of fluctuating exchange rates on relativeprices, costs and competitiveness. It is likely that some of Porsche’s problemswere due to the appreciating mark during the periods 1985–1987 and 1989–1990, which gave Porsche a price disadvantage in the US, which was one of itsmajor markets. However, the 1985–1987 period saw the highest sales in the US.Exchange rate fluctuations often have a lagged effect, and it may have takensome time for the price increases to work through; by 1989 US sales had fallento less than one third of their 1986 peak.
Sales in Western Europe had been much less volatile than US sales, and heldmore or less steady since 1987. The net effect was that world sales declined overa period of seven years, suggesting that something more fundamental than theexchange rate must be wrong. Even if it is assumed that the total market forluxury sports cars had been constant for the seven years to 1992, the fact thatPorsche sales had fallen by nearly 50 per cent suggests a very significant lossin market share. Competition had in fact been increasing from makes such asLexus. From this it can be deduced that Porsche had lost some of its competitiveadvantage.
But even at its ‘peak’, Porsche’s competitive position was in question: profitswere only 2.4 per cent of turnover. A relatively small increase in cost coupledwith a small reduction in revenues (for example caused by a fall in the markagainst the dollar) would lead to losses.
The competitive position of Porsche, and other makers of cars in this segment,is always under threat: the tendency is to rely on the brand image, but withthe technology which is now available there is plenty of scope for cars withsimilar, or even better, characteristics to enter the market; in this sense therelative quality advantage of Porsche cars has been undermined. Consumerswill to some extent be willing to substitute better technological features for theimage associated with the Porsche name.
External Analysis
Porsche cars are susceptible to two main risks. First, the market seems to havea high GNP elasticity. Second, because of fluctuating exchange rates the pricesin different markets, particularly the US, are highly volatile. For example, if arecession coincides with a fall in the dollar, both price in DM and sales will fall,
Strategic Planning Edinburgh Business School A2/19
Appendix 2 / Answers to Review Questions and Case Analyses
with a severe impact on revenues. There may therefore be a case for shiftingproduction to the location of sales (think global, act local). Alternatively, Porschecould have hedged its exposure to currency fluctuations.
The impact of new suppliers, such as the Japanese, is to increase supply; thiscan be expected to reduce the price if demand is constant. If demand falls at thesame time then the impact on equilibrium price could be quite substantial. Onereason for a reduction in demand could be a change in consumer preferences.
Internal analysis
Can Porsche only survive if it becomes part of a large manufacturer? It isdifficult to see what scale economies might be exploited if it were taken over;in fact, Porsche made profits right up until 1991. The problem seems to havebeen that the company was geared up to produce 50 000 cars with the associatedcost structure, and was therefore bound to make losses if it only sold half thatnumber without rationalising its production. Ratio analysis (discussed at 6.12)can help to put the recent history into perspective: losses are currently 2 percent of turnover, so relatively modest cost reductions would keep the companyin profit. The cash mountain would keep the company afloat for another 8 yearsat the current rate of losses.
The fluctuating exchange rate would also have had an effect on revenues,making them difficult to predict; for example, in 1991 the devaluation of themark against the dollar could have contributed to the losses because of the lowerrevenues earned from US sales.
There seems to have been a lack of an effective strategic control mechanismwhich would enable the company to adapt to changing circumstances. The factthat sales have been falling for seven years, finally resulting in losses, togetherwith the fact that a new model range is not expected until 1995, suggests thatthe company was unwilling to accept that its market position had changedfundamentally. By 1988 sales were down by 30 per cent, and it should havebeen clear that action should be taken; however, on the basis of the sales figuresit seems that nothing effective was actually done.
2. Discuss Porsche’s prospects, paying attention to the principal/agent problem andhow this might affect the setting of objectives.
There are no shareholders, therefore the family is not accountable in terms ofvalue creation. The company objective does not therefore need to be consistentwith the maximisation of shareholder wealth; in fact, the family does not seemto be preoccupied with profit maximisation objectives. The family might havefound it difficult to generate incentives which would result in value maximisa-tion. A poorly motivated management could account for the slow response tonew competition, for example the fact that a new car range will not be readyfor several years.
A stakeholder map drawn from the perspective of the owners would revealthe family having high priority and high influence. This is to be expected, but itseems that from the owners’ perspective consumers have high influence but low
A2/20 Edinburgh Business School Strategic Planning
Appendix 2 / Answers to Review Questions and Case Analyses
priority; this can be deduced because of the low priority given to producing anew generation of Porsche cars. It would appear that the owners either did notpay much attention to the interests of stakeholders or their implicit stakeholdermap gave a low weighting in terms of influence to stakeholders other thanthemselves.
Objective setting
The company seemed to lack a sense of overall direction and the ownersappeared to be unwilling to change their mindset from the past. An elementaryapplication of the gap approach would have revealed a significant difference inwhere the company was headed and where the owners would like it to be. It isclear that Porsche needed to arrest the decline in market share and/or break intonew markets. There were a number of approaches which might be followed,given that the company has a substantial family cash asset which could beconverted into a profit generating asset. These include
• updating the models
• further differentiating and segmenting the market
• looking for new markets in the rapidly growing Far Eastern economies
• investigating partnership arrangements with a major manufacturer
All of these would involve a change in the business definition to some extentand the formulation of revised aggregate and disaggregated objectives. But it isunlikely that such fundamental changes can be easily achieved by a managementwhich is unwilling to relinquish personal control and has allowed the companyto lose its markets.
Module 4
Review Question Analysis
Question 1: The CEO of the machine tool company had to decide whether to expandin the early part of the year or wait until more information became available. In thelight of what actually happened by the end of the year, what would have been thecorrect decision early in the year?
The economy seems to have taken something of a ‘nose dive’ during the year,and you can locate the situation in Figure 4.1: actual output is now much lowerthan potential output and there is a substantial output gap. On the basis of pastcyclical experience it will be some time before the economy comes out of therecession, so it looks as though the correct decision would have been to wait.
Question 2: In the absence of a dramatic recovery in the economy, what do you thinkwill happen to the inflation rate and wage costs next year?
The first effect of the higher unemployment rate has been to move down thePhillips curve in Figure 4.2. This will lead to lower expectations of inflation
Strategic Planning Edinburgh Business School A2/21
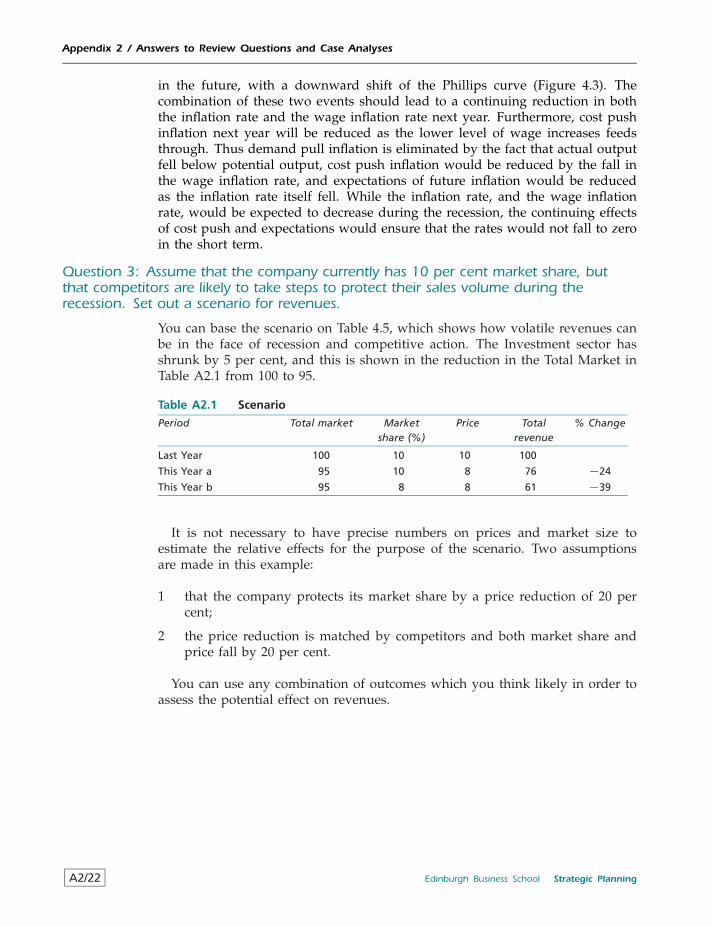
Appendix 2 / Answers to Review Questions and Case Analyses
in the future, with a downward shift of the Phillips curve (Figure 4.3). Thecombination of these two events should lead to a continuing reduction in boththe inflation rate and the wage inflation rate next year. Furthermore, cost pushinflation next year will be reduced as the lower level of wage increases feedsthrough. Thus demand pull inflation is eliminated by the fact that actual outputfell below potential output, cost push inflation would be reduced by the fall inthe wage inflation rate, and expectations of future inflation would be reducedas the inflation rate itself fell. While the inflation rate, and the wage inflationrate, would be expected to decrease during the recession, the continuing effectsof cost push and expectations would ensure that the rates would not fall to zeroin the short term.
Question 3: Assume that the company currently has 10 per cent market share, butthat competitors are likely to take steps to protect their sales volume during therecession. Set out a scenario for revenues.
You can base the scenario on Table 4.5, which shows how volatile revenues canbe in the face of recession and competitive action. The Investment sector hasshrunk by 5 per cent, and this is shown in the reduction in the Total Market inTable A2.1 from 100 to 95.
Table A2.1 Scenario
Period Total market Marketshare (%)
Price Totalrevenue
% Change
Last Year 100 10 10 100
This Year a 95 10 8 76 −24
This Year b 95 8 8 61 −39
It is not necessary to have precise numbers on prices and market size toestimate the relative effects for the purpose of the scenario. Two assumptionsare made in this example:
1 that the company protects its market share by a price reduction of 20 percent;
2 the price reduction is matched by competitors and both market share andprice fall by 20 per cent.
You can use any combination of outcomes which you think likely in order toassess the potential effect on revenues.
A2/22 Edinburgh Business School Strategic Planning
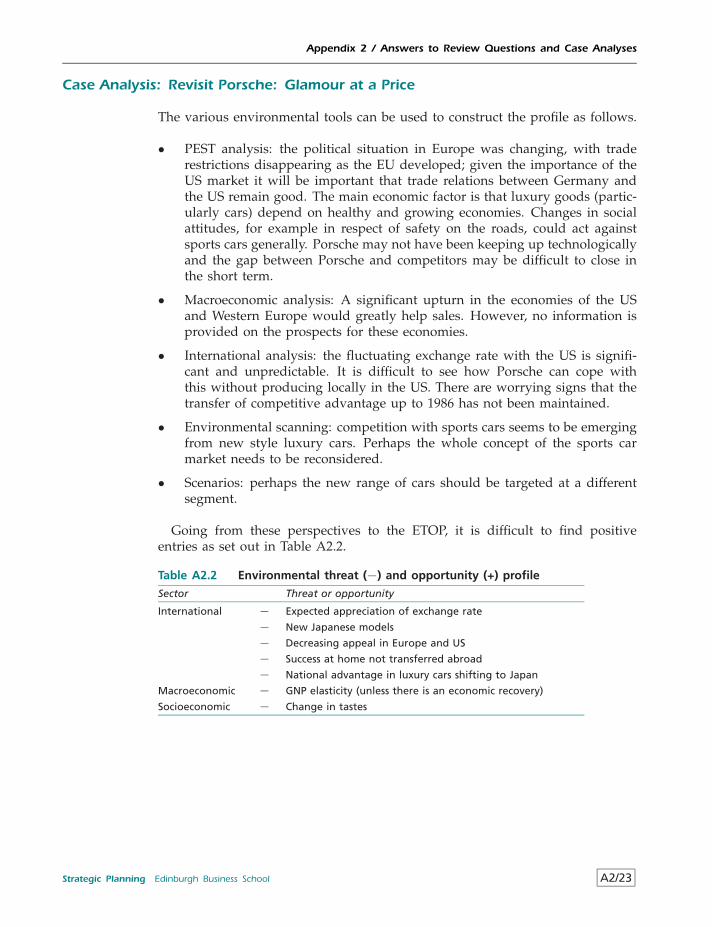
Appendix 2 / Answers to Review Questions and Case Analyses
Case Analysis: Revisit Porsche: Glamour at a Price
The various environmental tools can be used to construct the profile as follows.
• PEST analysis: the political situation in Europe was changing, with traderestrictions disappearing as the EU developed; given the importance of theUS market it will be important that trade relations between Germany andthe US remain good. The main economic factor is that luxury goods (partic-ularly cars) depend on healthy and growing economies. Changes in socialattitudes, for example in respect of safety on the roads, could act againstsports cars generally. Porsche may not have been keeping up technologicallyand the gap between Porsche and competitors may be difficult to close inthe short term.
• Macroeconomic analysis: A significant upturn in the economies of the USand Western Europe would greatly help sales. However, no information isprovided on the prospects for these economies.
• International analysis: the fluctuating exchange rate with the US is signifi-cant and unpredictable. It is difficult to see how Porsche can cope withthis without producing locally in the US. There are worrying signs that thetransfer of competitive advantage up to 1986 has not been maintained.
• Environmental scanning: competition with sports cars seems to be emergingfrom new style luxury cars. Perhaps the whole concept of the sports carmarket needs to be reconsidered.
• Scenarios: perhaps the new range of cars should be targeted at a differentsegment.
Going from these perspectives to the ETOP, it is difficult to find positiveentries as set out in Table A2.2.
Table A2.2 Environmental threat (−) and opportunity (+) profile
Sector Threat or opportunity
International − Expected appreciation of exchange rate
− New Japanese models
− Decreasing appeal in Europe and US
− Success at home not transferred abroad
− National advantage in luxury cars shifting to Japan
Macroeconomic − GNP elasticity (unless there is an economic recovery)
Socioeconomic − Change in tastes
Strategic Planning Edinburgh Business School A2/23
Appendix 2 / Answers to Review Questions and Case Analyses
Module 5
Review Question 1 Analysis
The structural analysis of the industry can be set out as follows.
Buyers – Bargaining Power: MEDIUM
Since buyers are individual consumers they have no bargaining power. But thereare plenty of alternative providers of health products.
Suppliers – Bargaining Power: HIGH
The current supplier is the only one within reasonable geographical reach;this supplier is likely to be affected by a labour dispute. While a take–overmay increase supplier efficiency it would possibly increase supplier bargainingpower.
New Entrants – Threat HIGH
There are few barriers to entry, and the number of health food products iscontinually increasing.
Substitutes – Threat: HIGH
There are a large number of luxury goods competing for consumer expenditure,such as alcohol and consumer durables, but they are not direct substitutes.However, to some extent health foods are homogeneous, and the manufacturerwill be increasingly faced with substitutes for his particular product.
Industry Competitors – Rivalry: HIGH
The lack of barriers to entry and the existence of a large number of competingfirms suggest that the industry is closer to perfect competition than monopoly.The prospects for making monopoly profits in the long run are poor. Competitivepressures may appear from unexpected quarters as strategic groups change.
While the ETOP identified a number of threats and opportunities the fiveforces profile poses the question of whether this is a desirable industry tobe in. Looking ahead there is little prospect that the profile is likely to changesignificantly and the medium term prospect is of exposure to threats, a relativelyweak bargaining position and intense competition.
Review Question 2 Analysis
While the five forces model is an extremely effective technique for analysingcompetitive forces, the CEO is correct in claiming that it does have somepotential drawbacks and that it does not provide the answers to all issuesrelating to competitive analysis.
A2/24 Edinburgh Business School Strategic Planning
Appendix 2 / Answers to Review Questions and Case Analyses
The CEO felt that it gives the impression that all forces are equally important inthe determination of competitive position. It can be argued, for example that thecustomer, or buyer, is the most important dimension of competitive advantageand that the five forces approach disguises this. However, this criticism missesthe point about a framework of analysis; the five forces is merely a structurewithin which various influences can be examined, and while it is probablytrue that most of the time buyers are important, in some circumstances otherinfluences might be just as important.
The CEO is right that it focuses on threats, whereas many companies engagein cooperation and alliances. This course of action may be precluded if, forexample, all suppliers are regarded as threats. But again this misses the point:if suppliers are identified as a potential threat it could be that one method ofeliminating this threat is to enter into an alliance. The function of the model is tohelp identify competitive pressures rather than provide a prescriptive solution.
The five forces approach makes no attempt to deal with internal issues such ashuman resources, efficiency and value creation. This being the case, the modelmust be regarded as only one important component when building up an overallview of profitability.
The five forces model sits squarely in the analysis and diagnoses part of theprocess model of strategy. It is important for analysing competitive influencesand deriving an understanding of the company’s competitive advantage; it is anessential tool for deriving appropriate strategies at the choice stage, but it doesnot do all the work for you.
Case Analysis: Apple Computer
1. Analyse the Apple experience in terms of the models developed in this Module.
Each of the market related models can throw light on different aspects of theApple experience.
• Product Differentiation
At launch Apple attempted to locate the Macintosh in the top right handcorner of the perceived price differentiation model in Figure 5.6. The limitedsuccess after launch suggests that the Macintosh fell into the ‘highly uncer-tain’ area. The perceived differentiation was never sufficient to generate ahigh market share, and when Windows was introduced the Macintosh fellsharply into the ‘failure’ area. This made it necessary to cut the price inorder to bring the Macintosh back towards the ‘success’ area. That did notseem to work either.
• Industry supply and demand
The industry supply was shifting to the right throughout the 1980s; thesupply increase was greater than increases in demand, causing the price ofIBM compatible computers to fall. In the face of falling prices it becameprogressively more difficult for Apple to charge its original prices.
Strategic Planning Edinburgh Business School A2/25
Appendix 2 / Answers to Review Questions and Case Analyses
• Market structure
As the computer market became more ‘perfect’ and monopoly profits werebidded away it became impossible for Apple to aim for a gross margin of50 per cent, with the objective of ploughing back the profits into R&D.
• Price Elasticity
The elasticity of demand for the Macintosh seems to have been quite high,since a 40 per cent price cut led to about 80 per cent increase in sales.However, Apple may have been correct in its original assessment of the priceelasticity for its higher range computers, since most of the sales increaseoccurred for the lower range machines. In terms of the basic model:
Original Revenue = Price × Quantity Sold
New Revenue = (0.6 × Price) × (1.8 × Quantity Sold)= 1.08 × Original Revenue
The net result was that Apple had to incur the costs of almost doublingproduction, but this had only a marginal impact on revenues. It was notsurprising that the company found that its gross margins fell sharply andit became necessary to shed some of its labour force.
• Pricing in Segments
Apple attempted to set a relatively high price to a group of consumers whowere ‘locked into’ its unique technology; the hope was that this group hada low price elasticity.
• Product quality
The notion of quality focused on the graphics interface between the com-puter and the user. However, this notion of quality did not appeal toeveryone.
• Product life cycles
The slow monochrome type computers were largely obsolete by 1988,and the Macintosh II launched in 1987 merely kept up with technologi-cal progress. The fast colour computers can be interpreted as a substitutefor slow monochrome computers.
• Portfolio analysis
The Macintosh never quite became a cash cow; it seemed stuck in thequestion mark part of the BCG matrix, with its low market share in agrowing market.
• Five forces analysis
The profile depends on whether the perspective is taken from within theMacintosh niche or from the personal computer market generally. From theniche viewpoint the threat of new entrants is low, as is the threat of sub-stitutes; supplier bargaining power is low because there are many suppliers
A2/26 Edinburgh Business School Strategic Planning
Appendix 2 / Answers to Review Questions and Case Analyses
of computer parts and buyer bargaining power is low because once a com-mitment to a Macintosh has been made it seems almost addictive; rivalryis low because the Macintosh monopolised the niche. But from the indus-try viewpoint the profile is totally different. The IBM is a direct substituteand there are improvements appearing all the time, so the threat is high.The market was relatively easy to enter so long as supplies were available;while supplier bargaining power is still low buyer bargaining power is highbecause there is a range of choice at the point of purchase; finally, rivalryis intense with some strong competitors such as IBM. This demonstratesthe importance of applying the five forces from the appropriate perspective,otherwise you can end up with a mistaken view of the competition facinga company.
• Strategic groups
The grouping depends greatly on which variables are used to plot therelative positions. For example, if Macintosh had used the axes perceivedquality and relative price the positions of Macintosh and IBM would havebeen quite separate. But if computing speed and capacity were used thetwo would have been very close. As in the case of the five forces it seemsthat Apple did not realise the real nature of its competitive environment.
2. What future do you predict for Apple Computer?
At the time described, the future for Apple was bleak. The Macintosh wasnow an undifferentiated product competing directly on price with the IBM andcompatibles in a market where monopoly profits had largely been bid away. Totempt existing users from IBM is difficult because of the costs of transition toa non-compatible technology and the prospect of a limited range of softwarebeing available. To sell Macintoshes to new users involves high marketing andadvertising outlays. Perhaps the only real possibility for Apple is to return toits high technology roots and identify areas where it can generate an innovativelead, such as in multi-media, which might again lead to a high degree ofdifferentiation. The cooperative venture with IBM may have benefits in termsof spreading R&D costs, but they are still competitors where it matters, i.e. inselling personal computers.
Case Analysis: Salmon Farming
Subject of Strategy Analysis
A large number of investments has been undertaken in the salmon farmingbusiness, particularly in Scotland and Norway, and farms now find themselvesin a highly volatile environment where losses appear to be the norm andthere seems little prospect for improvement in profitability. In retrospect salmonfarming looks like a poor investment. The rationale for ‘going back in time’ is todetermine whether the problems are temporary or endemic to the industry, andwhat courses of action salmon farmers, acting individually or together, mighttake in the future to improve the return on their investment.
Strategic Planning Edinburgh Business School A2/27
Appendix 2 / Answers to Review Questions and Case Analyses
Summary of Recommendations
Further investment in the salmon farming industry is to be avoided. The outlookfor existing farmers is poor, and there is little scope for cost savings based oneconomies of scale arising from integration of existing salmon farms. Protectionfrom foreign competition on its own is unlikely to return profitability to pastlevels; it would also be necessary to regulate new entrants to the industry.
Introduction
The salmon industry is comprised of a large number of small firms and as aresult is highly competitive; this high degree of competition will lead to lowprofits in the long run. There is an endemic tendency for prices to be volatilewhich adds a considerable degree of uncertainty to cash flows. As the generalmovement towards free trade continues, producers can expect little assistancefrom government in the form of tariff protection from foreign competitors.
Objectives
The immediate objective is to restore the industry to profitability from its currentloss making situation. What is the gap likely to be, say five years from now,between the desired position (making profits) and the likely actual position? Itseems clear that if no changes to the current strategy of individual companiesare undertaken, during the next five years the gap between the desired positionand the current loss making position is unlikely to close.
Analysis
Prior to any major investment it is essential to develop an overall view of thepotential size and growth of the market for the product, its likely responsivenessto the overall level of economic activity, and competitive conditions. Withoutthis framework it is impossible for individual companies to interpret factorssuch as falling profits and fluctuating prices.
Characteristics of the Product
The first step is to define what the industry is selling. Farmed salmon wasoriginally conceived of as being a close substitute for wild salmon. But as thesupply of farmed salmon has increased consumers have become more knowl-edgeable about the difference between farmed and wild salmon. Hence thequality of farmed salmon was causing problems. Farmed salmon is now gener-ally regarded as being inferior to wild salmon and does not command the sameprice. In other words, it is no longer regarded as a close substitute.
The quality difference between farmed and wild salmon is not its only impor-tant characteristic: one farmed salmon is identical to another, i.e. the good ishomogeneous. In other words, all salmon farms are competing directly witheach other to sell the same good.
Another important characteristic is that the product is perishable. This meansthat it can be stored only for a short period. To all intents and purposes current
A2/28 Edinburgh Business School Strategic Planning
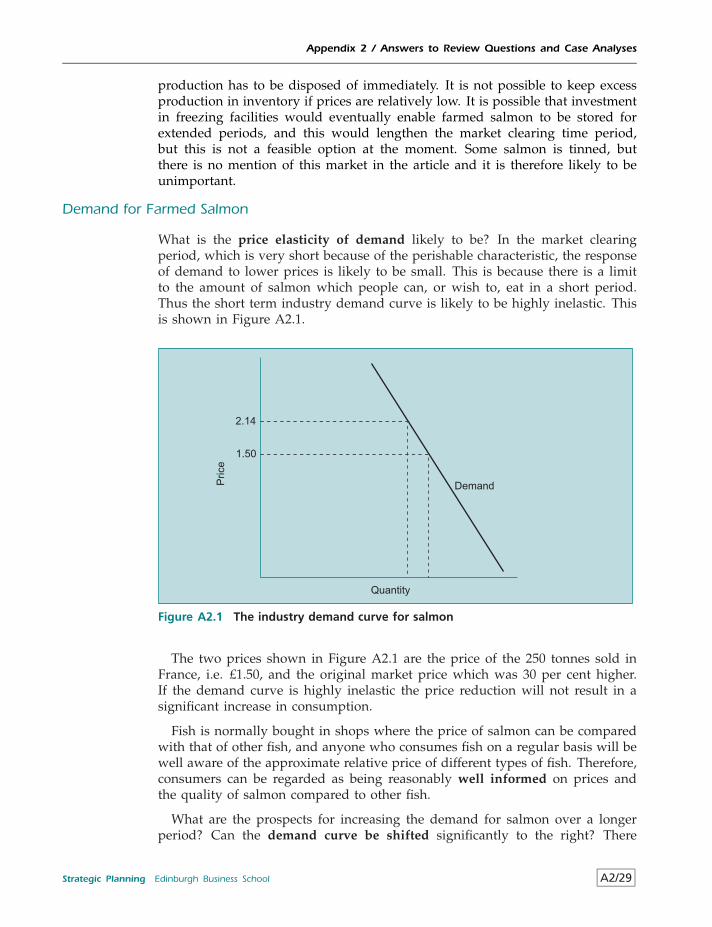
Appendix 2 / Answers to Review Questions and Case Analyses
production has to be disposed of immediately. It is not possible to keep excessproduction in inventory if prices are relatively low. It is possible that investmentin freezing facilities would eventually enable farmed salmon to be stored forextended periods, and this would lengthen the market clearing time period,but this is not a feasible option at the moment. Some salmon is tinned, butthere is no mention of this market in the article and it is therefore likely to beunimportant.
Demand for Farmed Salmon
What is the price elasticity of demand likely to be? In the market clearingperiod, which is very short because of the perishable characteristic, the responseof demand to lower prices is likely to be small. This is because there is a limitto the amount of salmon which people can, or wish to, eat in a short period.Thus the short term industry demand curve is likely to be highly inelastic. Thisis shown in Figure A2.1.
Demand
Quantity
Price
2.14
1.50
Figure A2.1 The industry demand curve for salmon
The two prices shown in Figure A2.1 are the price of the 250 tonnes sold inFrance, i.e. £1.50, and the original market price which was 30 per cent higher.If the demand curve is highly inelastic the price reduction will not result in asignificant increase in consumption.
Fish is normally bought in shops where the price of salmon can be comparedwith that of other fish, and anyone who consumes fish on a regular basis will bewell aware of the approximate relative price of different types of fish. Therefore,consumers can be regarded as being reasonably well informed on prices andthe quality of salmon compared to other fish.
What are the prospects for increasing the demand for salmon over a longerperiod? Can the demand curve be shifted significantly to the right? There
Strategic Planning Edinburgh Business School A2/29
Appendix 2 / Answers to Review Questions and Case Analyses
is no doubt that there has been a substantial increase in demand for farmedsalmon in the last ten years, as a result of increases in domestic consumptionand the exploitation of markets such as airlines. Thus in the early 1980s it wasto be expected that the demand curve would shift to the right as the productpenetrated the market.
However, once markets are more or less saturated any increase in demandwill depend on income elasticity. One definition of a luxury is that the quantitypurchased increases by a greater percentage than the increase in average income;for example, the amount of potatoes purchased does not increase very muchas income increases, but the demand for wild salmon does. It is likely that thedemand for farmed salmon will increase by no more than the average increasein real incomes.
Analysing the Competitive Environment
The salmon farming industry is characterised by a large number of relativelysmall productive units. There are various difficulties involved in starting newfarms, such as finding a site, obtaining necessary permits, and so on, but on thewhole the entry cost is not particularly high. The technology is widely knownand understood. Therefore there are few barriers to entry.
The pieces are by this time starting to fall into place: an industry comprised ofa large number of small producers making a homogeneous product for a marketcomprised of well informed consumers and with low entry barriers, soundsvery much like perfect competition. Certainly, salmon firms are price takers, i.e.they have no control individually over the market price of salmon. This meansthat each firm faces a horizontal demand curve for its product: if it attempts tocharge above the market price it will sell nothing, but it can sell as much as itcan produce at the going price.
It is well known that no market is perfect in the textbook sense. But avery important conclusion can be drawn about a market which has many ofthe features of perfect competition: in perfect competition no profits above theopportunity cost of capital are made in the long run. By definition, there areno monopoly profits. Therefore, the outlook for making profits in the long run,which could be defined as the time beyond the point at which competition reactsto the profits which are being made in the early stages, is virtually non-existent.In the language of finance, the prospective return would be the opportunity costof capital plus the equity risk premium, i.e. the return attributable to the riskassociated with salmon farming. This is a very serious issue because, from theviewpoint of the early 1980s, it suggests strongly that the only way of makinga return on salmon farming would be to enter at an early stage of marketdevelopment, make monopoly profit while it lasted, then convert the asset backinto cash.
One interpretation of strategy is that it is largely a search for market imper-fections. In other words, you look for the ways in which the market may varyfrom the ‘perfect’ case; this could be because of factors such as barriers to entry,lack of consumer knowledge, economies of scale and monopoly power. In thiscase it could be predicted from an early stage that imperfections were unlikely
A2/30 Edinburgh Business School Strategic Planning
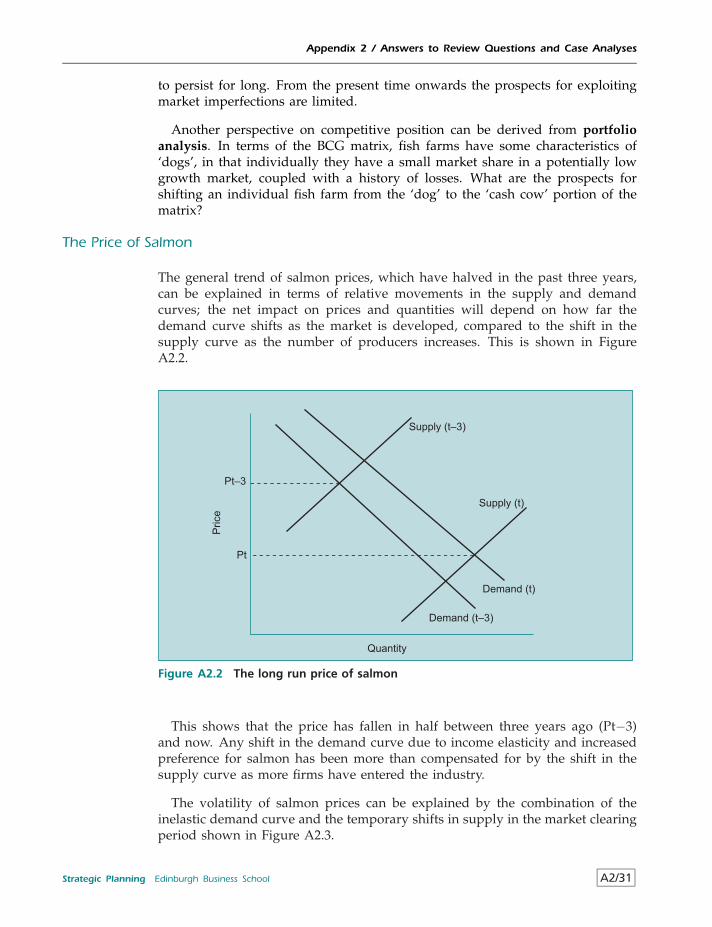
Appendix 2 / Answers to Review Questions and Case Analyses
to persist for long. From the present time onwards the prospects for exploitingmarket imperfections are limited.
Another perspective on competitive position can be derived from portfolioanalysis. In terms of the BCG matrix, fish farms have some characteristics of‘dogs’, in that individually they have a small market share in a potentially lowgrowth market, coupled with a history of losses. What are the prospects forshifting an individual fish farm from the ‘dog’ to the ‘cash cow’ portion of thematrix?
The Price of Salmon
The general trend of salmon prices, which have halved in the past three years,can be explained in terms of relative movements in the supply and demandcurves; the net impact on prices and quantities will depend on how far thedemand curve shifts as the market is developed, compared to the shift in thesupply curve as the number of producers increases. This is shown in FigureA2.2.
Demand (t–3)
Demand (t)
Quantity
Price
Pt–3
Pt
Supply (t)
Supply (t–3)
Figure A2.2 The long run price of salmon
This shows that the price has fallen in half between three years ago (Pt−3)and now. Any shift in the demand curve due to income elasticity and increasedpreference for salmon has been more than compensated for by the shift in thesupply curve as more firms have entered the industry.
The volatility of salmon prices can be explained by the combination of theinelastic demand curve and the temporary shifts in supply in the market clearingperiod shown in Figure A2.3.
Strategic Planning Edinburgh Business School A2/31
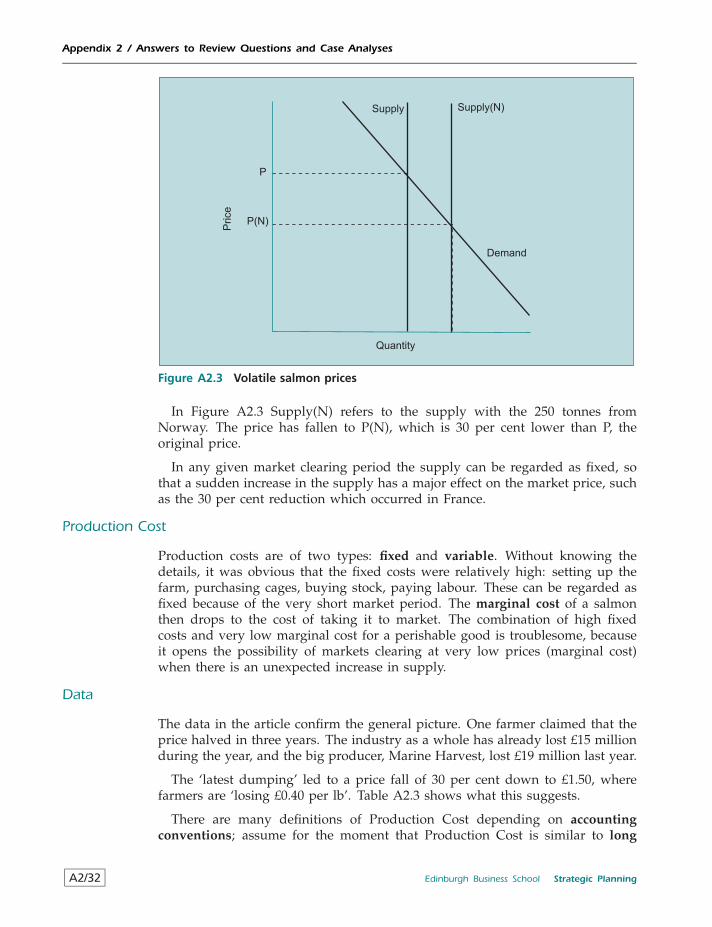
Appendix 2 / Answers to Review Questions and Case Analyses
Demand
Quantity
Price
P
P(N)
Supply Supply(N)
Figure A2.3 Volatile salmon prices
In Figure A2.3 Supply(N) refers to the supply with the 250 tonnes fromNorway. The price has fallen to P(N), which is 30 per cent lower than P, theoriginal price.
In any given market clearing period the supply can be regarded as fixed, sothat a sudden increase in the supply has a major effect on the market price, suchas the 30 per cent reduction which occurred in France.
Production Cost
Production costs are of two types: fixed and variable. Without knowing thedetails, it was obvious that the fixed costs were relatively high: setting up thefarm, purchasing cages, buying stock, paying labour. These can be regarded asfixed because of the very short market period. The marginal cost of a salmonthen drops to the cost of taking it to market. The combination of high fixedcosts and very low marginal cost for a perishable good is troublesome, becauseit opens the possibility of markets clearing at very low prices (marginal cost)when there is an unexpected increase in supply.
Data
The data in the article confirm the general picture. One farmer claimed that theprice halved in three years. The industry as a whole has already lost £15 millionduring the year, and the big producer, Marine Harvest, lost £19 million last year.
The ‘latest dumping’ led to a price fall of 30 per cent down to £1.50, wherefarmers are ‘losing £0.40 per lb’. Table A2.3 shows what this suggests.
There are many definitions of Production Cost depending on accountingconventions; assume for the moment that Production Cost is similar to long
A2/32 Edinburgh Business School Strategic Planning
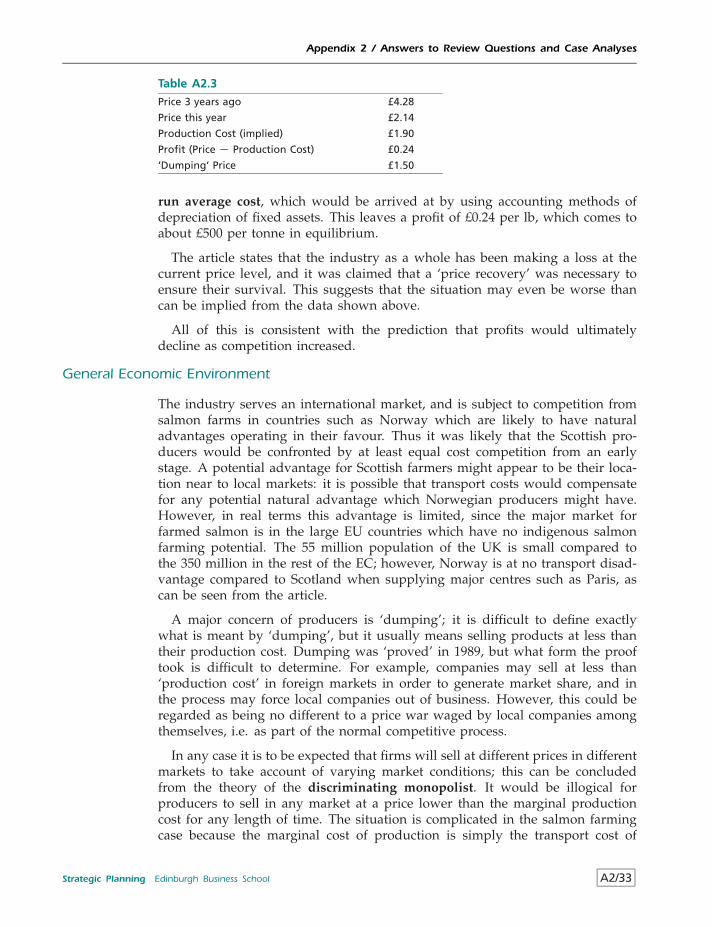
Appendix 2 / Answers to Review Questions and Case Analyses
Table A2.3
Price 3 years ago £4.28
Price this year £2.14
Production Cost (implied) £1.90
Profit (Price − Production Cost) £0.24
‘Dumping’ Price £1.50
run average cost, which would be arrived at by using accounting methods ofdepreciation of fixed assets. This leaves a profit of £0.24 per lb, which comes toabout £500 per tonne in equilibrium.
The article states that the industry as a whole has been making a loss at thecurrent price level, and it was claimed that a ‘price recovery’ was necessary toensure their survival. This suggests that the situation may even be worse thancan be implied from the data shown above.
All of this is consistent with the prediction that profits would ultimatelydecline as competition increased.
General Economic Environment
The industry serves an international market, and is subject to competition fromsalmon farms in countries such as Norway which are likely to have naturaladvantages operating in their favour. Thus it was likely that the Scottish pro-ducers would be confronted by at least equal cost competition from an earlystage. A potential advantage for Scottish farmers might appear to be their loca-tion near to local markets: it is possible that transport costs would compensatefor any potential natural advantage which Norwegian producers might have.However, in real terms this advantage is limited, since the major market forfarmed salmon is in the large EU countries which have no indigenous salmonfarming potential. The 55 million population of the UK is small compared tothe 350 million in the rest of the EC; however, Norway is at no transport disad-vantage compared to Scotland when supplying major centres such as Paris, ascan be seen from the article.
A major concern of producers is ‘dumping’; it is difficult to define exactlywhat is meant by ‘dumping’, but it usually means selling products at less thantheir production cost. Dumping was ‘proved’ in 1989, but what form the prooftook is difficult to determine. For example, companies may sell at less than‘production cost’ in foreign markets in order to generate market share, and inthe process may force local companies out of business. However, this could beregarded as being no different to a price war waged by local companies amongthemselves, i.e. as part of the normal competitive process.
In any case it is to be expected that firms will sell at different prices in differentmarkets to take account of varying market conditions; this can be concludedfrom the theory of the discriminating monopolist. It would be illogical forproducers to sell in any market at a price lower than the marginal productioncost for any length of time. The situation is complicated in the salmon farmingcase because the marginal cost of production is simply the transport cost of
Strategic Planning Edinburgh Business School A2/33
Appendix 2 / Answers to Review Questions and Case Analyses
getting the fish to market; this is relatively low compared to average cost. Oncethe fish have been produced it is worthwhile to send them to market so long asthere is an expectation of generating a price higher than the marginal transportcost.
The combination of relatively low marginal cost and an inelastic demand curvein the market clearing period makes price volatility almost inevitable. The onlyway of countering this is to impose a relatively high tariff, as in the USA. Butgiven the general trend towards free trade in the European area the possibilityof protection in the long run is remote.
A further consideration is that salmon farming imposes externalities on theamenity of the surroundings. Because of its nature, salmon farming tends tobe carried out in areas of scenic beauty, and the possibility exists that publicopinion may ultimately result in moves to limit the impact of the industry onthe environment. This could take the form of entry barriers, but it could alsoresult in increased costs to the salmon farmers as they are forced to take amenityconsiderations into account.
Analysing Options
The objective is to identify courses of action which might lead to increasedprofitability in the future. These include attempting to reduce costs, developingthe market in new ways, diversifying and enlisting the support of government.
Generic Strategy Options
In the face of oversupply, the generic option is clearly one of retrenchment orstability. Expansion is out of the question at the moment, and there is little scopefor increased investment in the industry. It is within the context of the generalneed to stabilise or retrench that specific options can be identified.
Reduce Production Costs
The evidence in the article suggests that there are few economies of scale; theeconomies of scale which Marine Harvest have been able to achieve appear tobe insignificant in relation to the impact of competitive pressures.
Producers currently claim that the ‘dumping’ price is 20 per cent belowproduction costs. It is unlikely that scale economies, or attempts at more efficientoperation, could eliminate this gap. Technological advances will give at best atemporary cost advantage because of the ease of imitation.
Invest in Freezing Facilities
As far as the individual producer is concerned, investment in storage facilitieswould enable advantage to be taken of periods of high prices, if these do occur.At an industry level it could help to reduce the volatility of prices. But theendemic problems of over-capacity and low profits would still remain. Thereis not sufficient information to deduce whether freezing facilities would requirecollective action or could be financed by individual salmon farmers. Giventhe difficulties faced by farmers at the moment, it is unlikely that they willcontemplate additional investment in their farms.
A2/34 Edinburgh Business School Strategic Planning
Appendix 2 / Answers to Review Questions and Case Analyses
Market Development
There is virtually no scope for differentiating the product; indeed, the pricereduction has probably eroded the notion of salmon being a luxury good andmay have undermined further its position as a substitute for wild salmon.
There may be possibilities for identifying market niches, and segmentingthe market to further exploit markets for salmon in different forms, such assmoked and tinned salmon. These will require a fairly substantial marketingeffort, and are unlikely to generate market increases of the dimensions requiredto overcome the problems of excess supply.
Given the ease of entry and existence of excess capacity, any market advan-tages are likely to be competed away fairly quickly.
Diversification
The only real possibility appears to be the tourist related development mentionedin the article. However, a fish centre is unlikely to create more than about 30jobs, which is insignificant compared to the 6300 employed in the industry as awhole.
Lobby for Protection
The reaction of industry representatives has been to lobby the government tointroduce tariff barriers as was done in the USA to eliminate what they see asunfair competition. However, this may not be the complete answer. The easeof entry into the local industry means that profits are likely to remain low. Theerection of entry barriers by government, in the form of regulating the numberof farms in the industry, may be necessary.
Choice
A feasible strategic option for farmers wishing to stay in the industry is to cam-paign for an import tariff and barriers to entry. This may be a case where thereis a legitimate argument for government intervention. But given the movementtowards free trade, and the increased government desire world-wide to pursuenon-interventionist policies, there seems little chance of long term success in thisrespect.
Case Analysis: Lymeswold Cheese
What Went Wrong?
Application of the process model makes it possible to identify factors whichcontributed to failure. As in most cases of company failure there is no singlecause.
Objectives
The general objective was clear enough, i.e. to diversify Dairy Crest and breakinto the high quality cheese market. The series of blunders could be explained
Strategic Planning Edinburgh Business School A2/35
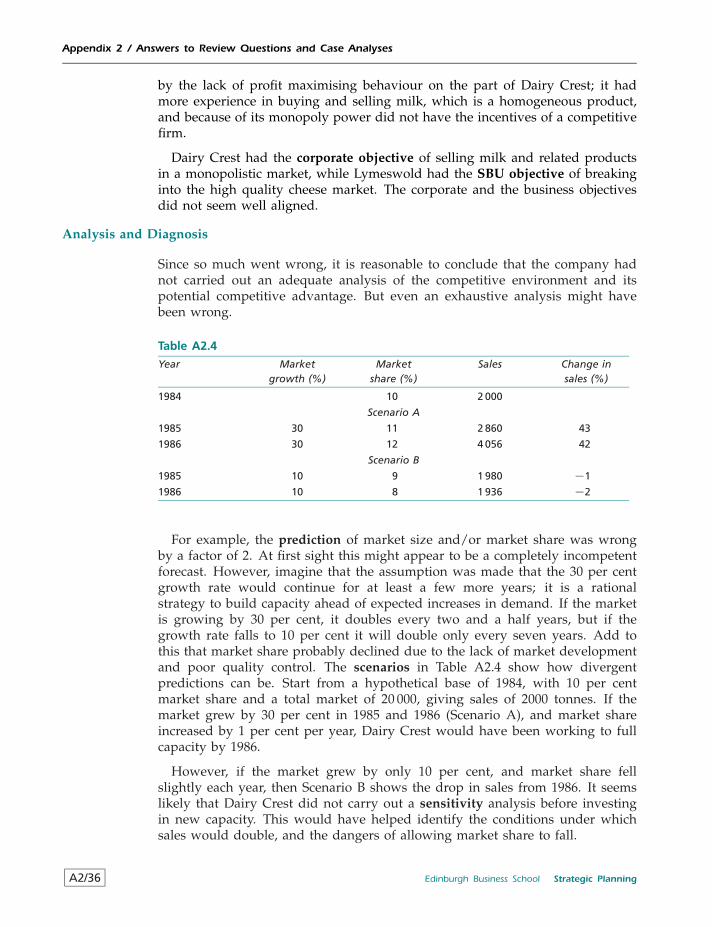
Appendix 2 / Answers to Review Questions and Case Analyses
by the lack of profit maximising behaviour on the part of Dairy Crest; it hadmore experience in buying and selling milk, which is a homogeneous product,and because of its monopoly power did not have the incentives of a competitivefirm.
Dairy Crest had the corporate objective of selling milk and related productsin a monopolistic market, while Lymeswold had the SBU objective of breakinginto the high quality cheese market. The corporate and the business objectivesdid not seem well aligned.
Analysis and Diagnosis
Since so much went wrong, it is reasonable to conclude that the company hadnot carried out an adequate analysis of the competitive environment and itspotential competitive advantage. But even an exhaustive analysis might havebeen wrong.
Table A2.4
Year Marketgrowth (%)
Marketshare (%)
Sales Change insales (%)
1984 10 2 000
Scenario A
1985 30 11 2 860 43
1986 30 12 4 056 42
Scenario B
1985 10 9 1 980 −1
1986 10 8 1 936 −2
For example, the prediction of market size and/or market share was wrongby a factor of 2. At first sight this might appear to be a completely incompetentforecast. However, imagine that the assumption was made that the 30 per centgrowth rate would continue for at least a few more years; it is a rationalstrategy to build capacity ahead of expected increases in demand. If the marketis growing by 30 per cent, it doubles every two and a half years, but if thegrowth rate falls to 10 per cent it will double only every seven years. Add tothis that market share probably declined due to the lack of market developmentand poor quality control. The scenarios in Table A2.4 show how divergentpredictions can be. Start from a hypothetical base of 1984, with 10 per centmarket share and a total market of 20 000, giving sales of 2000 tonnes. If themarket grew by 30 per cent in 1985 and 1986 (Scenario A), and market shareincreased by 1 per cent per year, Dairy Crest would have been working to fullcapacity by 1986.
However, if the market grew by only 10 per cent, and market share fellslightly each year, then Scenario B shows the drop in sales from 1986. It seemslikely that Dairy Crest did not carry out a sensitivity analysis before investingin new capacity. This would have helped identify the conditions under whichsales would double, and the dangers of allowing market share to fall.
A2/36 Edinburgh Business School Strategic Planning
Appendix 2 / Answers to Review Questions and Case Analyses
Choice
Lymeswold was launched into a market containing long established marketleaders, and the basic strategy was to win a significant proportion of the marketas quickly as possible; this probably accounts for the fanfare with which theproduct was launched.
In the UK, high quality cheese was a rapidly growing market, and Lymeswoldstarted off its life as a question mark or star. As such it would not havegenerated significant positive net cash flows during the early part of its productlife, and the strategic thrust at that stage should have been to achieve as higha market share as possible. However, when shortages occurred Dairy Crest didnot attempt to increase the customer base, but simply kept supplying existingcustomers.
Implementation
Once it had committed itself to the new factory, Lymeswold was burdened withexcess capacity and therefore high costs.
One of the reasons for falling sales seems to have been the quality of thecheese. It does not appear to have been attractive enough compared to theFrench and German cheeses, and customers could not count on its consistencyover time. Insufficient attention was paid to the characteristics of the product.Lymeswold could be located in the perceived price differentiation matrix.Nothing is known about the perceived relative price, but it did not have a highlevel of differentiation, therefore the chances are that it falls into the failure orhighly uncertain areas.
It is possible that the outcome was inevitable because the product life cycleof Lymeswold may have been relatively short. This could have been becauseLymeswold was not really a substitute for the stronger French and German softblue cheeses but merely introduced consumers to this market.
There seems to have been little scope for synergy between the original DairyCrest product portfolio and Lymeswold cheese.
Feedback
While there may have been plenty of information flow within the companythere was a distinct lack of learning and responsiveness. There was little or noattempt made to improve quality and consistency, increase the market base andcontrol costs in the light of what was happening.
Case Analysis: Cigarette Price Wars
1. Was Philip Morris completely mistaken in cutting the price of Marlboro, as thetwo observers claim? Or was Philip Morris’ reaction an inevitable outcome of marketconditions?
The argument on destroying the brand can be interpreted in terms of the per-ceived price differentiation model. The Kravis and Davidson arguments suggest
Strategic Planning Edinburgh Business School A2/37
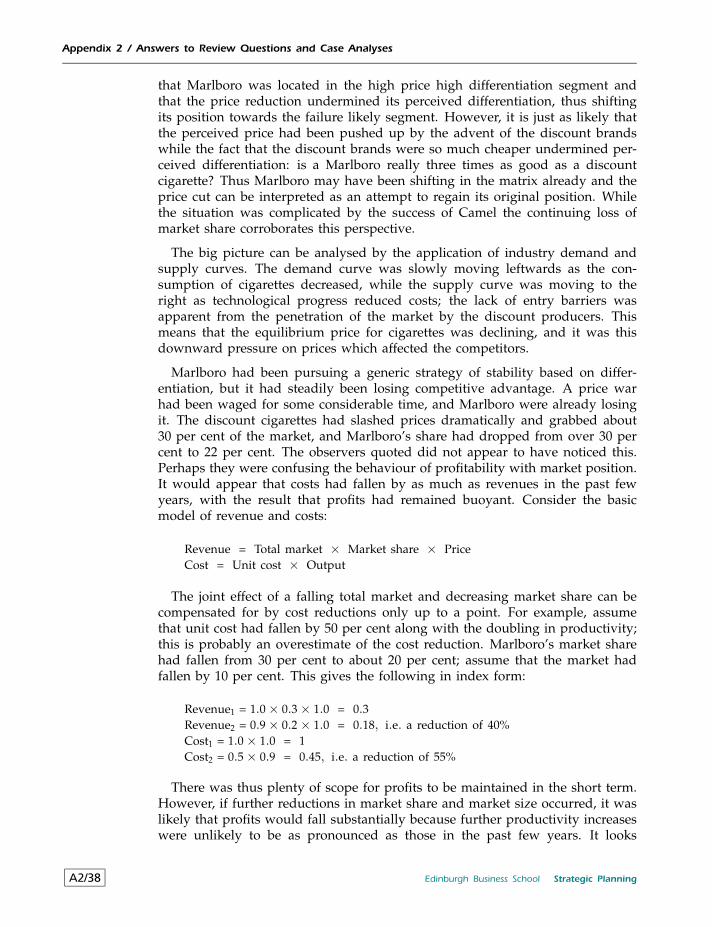
Appendix 2 / Answers to Review Questions and Case Analyses
that Marlboro was located in the high price high differentiation segment andthat the price reduction undermined its perceived differentiation, thus shiftingits position towards the failure likely segment. However, it is just as likely thatthe perceived price had been pushed up by the advent of the discount brandswhile the fact that the discount brands were so much cheaper undermined per-ceived differentiation: is a Marlboro really three times as good as a discountcigarette? Thus Marlboro may have been shifting in the matrix already and theprice cut can be interpreted as an attempt to regain its original position. Whilethe situation was complicated by the success of Camel the continuing loss ofmarket share corroborates this perspective.
The big picture can be analysed by the application of industry demand andsupply curves. The demand curve was slowly moving leftwards as the con-sumption of cigarettes decreased, while the supply curve was moving to theright as technological progress reduced costs; the lack of entry barriers wasapparent from the penetration of the market by the discount producers. Thismeans that the equilibrium price for cigarettes was declining, and it was thisdownward pressure on prices which affected the competitors.
Marlboro had been pursuing a generic strategy of stability based on differ-entiation, but it had steadily been losing competitive advantage. A price warhad been waged for some considerable time, and Marlboro were already losingit. The discount cigarettes had slashed prices dramatically and grabbed about30 per cent of the market, and Marlboro’s share had dropped from over 30 percent to 22 per cent. The observers quoted did not appear to have noticed this.Perhaps they were confusing the behaviour of profitability with market position.It would appear that costs had fallen by as much as revenues in the past fewyears, with the result that profits had remained buoyant. Consider the basicmodel of revenue and costs:
Revenue = Total market × Market share × PriceCost = Unit cost × Output
The joint effect of a falling total market and decreasing market share can becompensated for by cost reductions only up to a point. For example, assumethat unit cost had fallen by 50 per cent along with the doubling in productivity;this is probably an overestimate of the cost reduction. Marlboro’s market sharehad fallen from 30 per cent to about 20 per cent; assume that the market hadfallen by 10 per cent. This gives the following in index form:
Revenue1 = 1.0× 0.3× 1.0 = 0.3Revenue2 = 0.9× 0.2× 1.0 = 0.18, i.e. a reduction of 40%Cost1 = 1.0× 1.0 = 1Cost2 = 0.5× 0.9 = 0.45, i.e. a reduction of 55%
There was thus plenty of scope for profits to be maintained in the short term.However, if further reductions in market share and market size occurred, it waslikely that profits would fall substantially because further productivity increaseswere unlikely to be as pronounced as those in the past few years. It looks
A2/38 Edinburgh Business School Strategic Planning
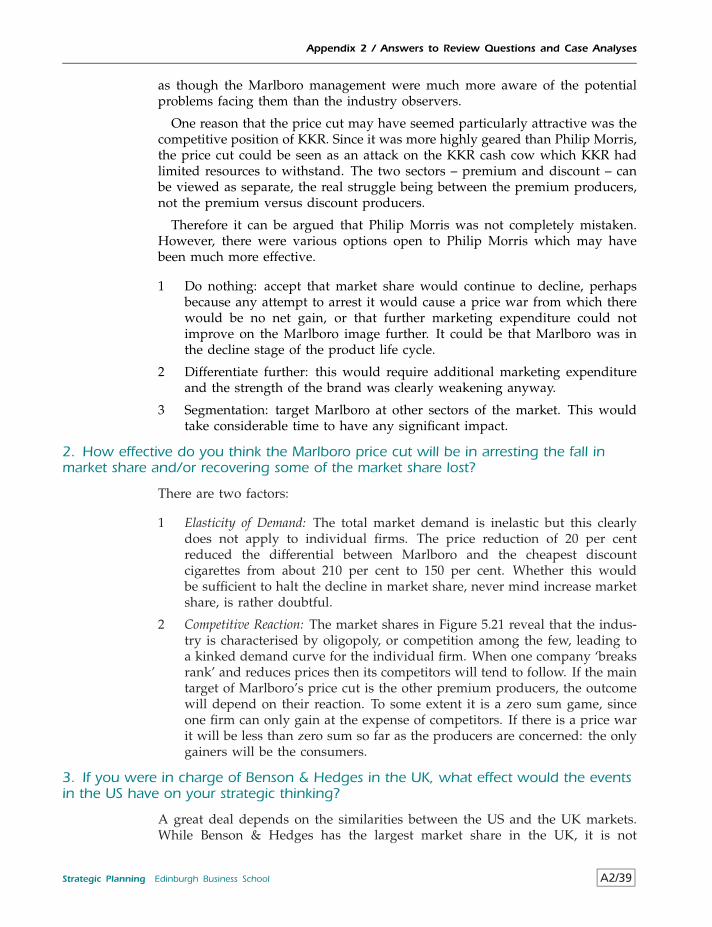
Appendix 2 / Answers to Review Questions and Case Analyses
as though the Marlboro management were much more aware of the potentialproblems facing them than the industry observers.
One reason that the price cut may have seemed particularly attractive was thecompetitive position of KKR. Since it was more highly geared than Philip Morris,the price cut could be seen as an attack on the KKR cash cow which KKR hadlimited resources to withstand. The two sectors – premium and discount – canbe viewed as separate, the real struggle being between the premium producers,not the premium versus discount producers.
Therefore it can be argued that Philip Morris was not completely mistaken.However, there were various options open to Philip Morris which may havebeen much more effective.
1 Do nothing: accept that market share would continue to decline, perhapsbecause any attempt to arrest it would cause a price war from which therewould be no net gain, or that further marketing expenditure could notimprove on the Marlboro image further. It could be that Marlboro was inthe decline stage of the product life cycle.
2 Differentiate further: this would require additional marketing expenditureand the strength of the brand was clearly weakening anyway.
3 Segmentation: target Marlboro at other sectors of the market. This wouldtake considerable time to have any significant impact.
2. How effective do you think the Marlboro price cut will be in arresting the fall inmarket share and/or recovering some of the market share lost?
There are two factors:
1 Elasticity of Demand: The total market demand is inelastic but this clearlydoes not apply to individual firms. The price reduction of 20 per centreduced the differential between Marlboro and the cheapest discountcigarettes from about 210 per cent to 150 per cent. Whether this wouldbe sufficient to halt the decline in market share, never mind increase marketshare, is rather doubtful.
2 Competitive Reaction: The market shares in Figure 5.21 reveal that the indus-try is characterised by oligopoly, or competition among the few, leading toa kinked demand curve for the individual firm. When one company ‘breaksrank’ and reduces prices then its competitors will tend to follow. If the maintarget of Marlboro’s price cut is the other premium producers, the outcomewill depend on their reaction. To some extent it is a zero sum game, sinceone firm can only gain at the expense of competitors. If there is a price warit will be less than zero sum so far as the producers are concerned: the onlygainers will be the consumers.
3. If you were in charge of Benson & Hedges in the UK, what effect would the eventsin the US have on your strategic thinking?
A great deal depends on the similarities between the US and the UK markets.While Benson & Hedges has the largest market share in the UK, it is not
Strategic Planning Edinburgh Business School A2/39
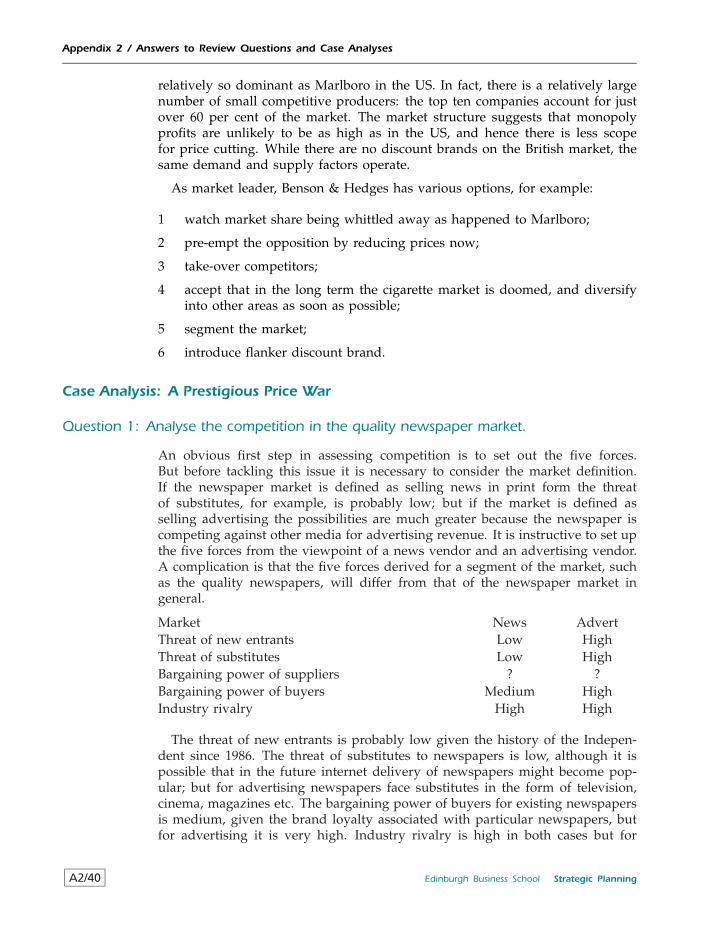
Appendix 2 / Answers to Review Questions and Case Analyses
relatively so dominant as Marlboro in the US. In fact, there is a relatively largenumber of small competitive producers: the top ten companies account for justover 60 per cent of the market. The market structure suggests that monopolyprofits are unlikely to be as high as in the US, and hence there is less scopefor price cutting. While there are no discount brands on the British market, thesame demand and supply factors operate.
As market leader, Benson & Hedges has various options, for example:
1 watch market share being whittled away as happened to Marlboro;
2 pre-empt the opposition by reducing prices now;
3 take-over competitors;
4 accept that in the long term the cigarette market is doomed, and diversifyinto other areas as soon as possible;
5 segment the market;
6 introduce flanker discount brand.
Case Analysis: A Prestigious Price War
Question 1: Analyse the competition in the quality newspaper market.
An obvious first step in assessing competition is to set out the five forces.But before tackling this issue it is necessary to consider the market definition.If the newspaper market is defined as selling news in print form the threatof substitutes, for example, is probably low; but if the market is defined asselling advertising the possibilities are much greater because the newspaper iscompeting against other media for advertising revenue. It is instructive to set upthe five forces from the viewpoint of a news vendor and an advertising vendor.A complication is that the five forces derived for a segment of the market, suchas the quality newspapers, will differ from that of the newspaper market ingeneral.
Market News AdvertThreat of new entrants Low HighThreat of substitutes Low HighBargaining power of suppliers ? ?Bargaining power of buyers Medium HighIndustry rivalry High High
The threat of new entrants is probably low given the history of the Indepen-dent since 1986. The threat of substitutes to newspapers is low, although it ispossible that in the future internet delivery of newspapers might become pop-ular; but for advertising newspapers face substitutes in the form of television,cinema, magazines etc. The bargaining power of buyers for existing newspapersis medium, given the brand loyalty associated with particular newspapers, butfor advertising it is very high. Industry rivalry is high in both cases but for
A2/40 Edinburgh Business School Strategic Planning
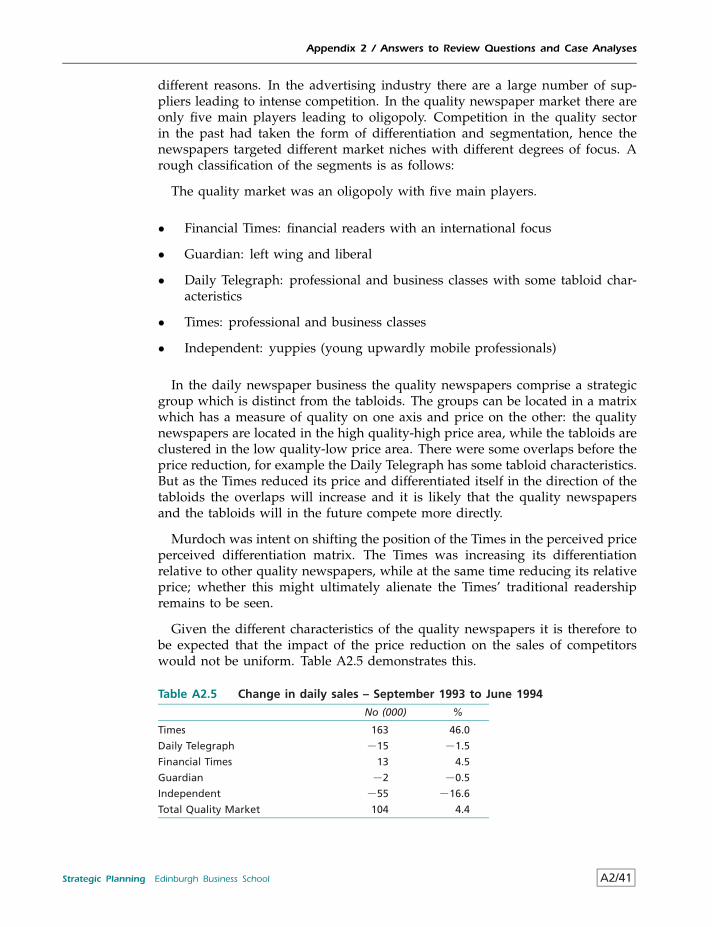
Appendix 2 / Answers to Review Questions and Case Analyses
different reasons. In the advertising industry there are a large number of sup-pliers leading to intense competition. In the quality newspaper market there areonly five main players leading to oligopoly. Competition in the quality sectorin the past had taken the form of differentiation and segmentation, hence thenewspapers targeted different market niches with different degrees of focus. Arough classification of the segments is as follows:
The quality market was an oligopoly with five main players.
• Financial Times: financial readers with an international focus
• Guardian: left wing and liberal
• Daily Telegraph: professional and business classes with some tabloid char-acteristics
• Times: professional and business classes
• Independent: yuppies (young upwardly mobile professionals)
In the daily newspaper business the quality newspapers comprise a strategicgroup which is distinct from the tabloids. The groups can be located in a matrixwhich has a measure of quality on one axis and price on the other: the qualitynewspapers are located in the high quality-high price area, while the tabloids areclustered in the low quality-low price area. There were some overlaps before theprice reduction, for example the Daily Telegraph has some tabloid characteristics.But as the Times reduced its price and differentiated itself in the direction of thetabloids the overlaps will increase and it is likely that the quality newspapersand the tabloids will in the future compete more directly.
Murdoch was intent on shifting the position of the Times in the perceived priceperceived differentiation matrix. The Times was increasing its differentiationrelative to other quality newspapers, while at the same time reducing its relativeprice; whether this might ultimately alienate the Times’ traditional readershipremains to be seen.
Given the different characteristics of the quality newspapers it is therefore tobe expected that the impact of the price reduction on the sales of competitorswould not be uniform. Table A2.5 demonstrates this.
Table A2.5 Change in daily sales – September 1993 to June 1994
No (000) %
Times 163 46.0
Daily Telegraph −15 −1.5
Financial Times 13 4.5
Guardian −2 −0.5
Independent −55 −16.6
Total Quality Market 104 4.4
Strategic Planning Edinburgh Business School A2/41
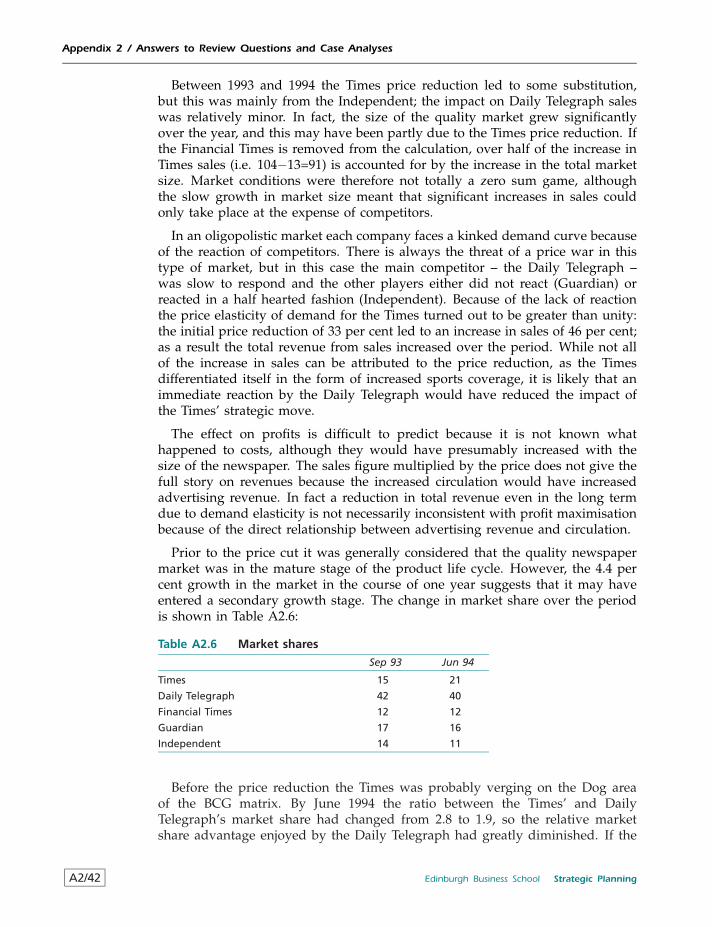
Appendix 2 / Answers to Review Questions and Case Analyses
Between 1993 and 1994 the Times price reduction led to some substitution,but this was mainly from the Independent; the impact on Daily Telegraph saleswas relatively minor. In fact, the size of the quality market grew significantlyover the year, and this may have been partly due to the Times price reduction. Ifthe Financial Times is removed from the calculation, over half of the increase inTimes sales (i.e. 104−13=91) is accounted for by the increase in the total marketsize. Market conditions were therefore not totally a zero sum game, althoughthe slow growth in market size meant that significant increases in sales couldonly take place at the expense of competitors.
In an oligopolistic market each company faces a kinked demand curve becauseof the reaction of competitors. There is always the threat of a price war in thistype of market, but in this case the main competitor – the Daily Telegraph –was slow to respond and the other players either did not react (Guardian) orreacted in a half hearted fashion (Independent). Because of the lack of reactionthe price elasticity of demand for the Times turned out to be greater than unity:the initial price reduction of 33 per cent led to an increase in sales of 46 per cent;as a result the total revenue from sales increased over the period. While not allof the increase in sales can be attributed to the price reduction, as the Timesdifferentiated itself in the form of increased sports coverage, it is likely that animmediate reaction by the Daily Telegraph would have reduced the impact ofthe Times’ strategic move.
The effect on profits is difficult to predict because it is not known whathappened to costs, although they would have presumably increased with thesize of the newspaper. The sales figure multiplied by the price does not give thefull story on revenues because the increased circulation would have increasedadvertising revenue. In fact a reduction in total revenue even in the long termdue to demand elasticity is not necessarily inconsistent with profit maximisationbecause of the direct relationship between advertising revenue and circulation.
Prior to the price cut it was generally considered that the quality newspapermarket was in the mature stage of the product life cycle. However, the 4.4 percent growth in the market in the course of one year suggests that it may haveentered a secondary growth stage. The change in market share over the periodis shown in Table A2.6:
Table A2.6 Market shares
Sep 93 Jun 94
Times 15 21
Daily Telegraph 42 40
Financial Times 12 12
Guardian 17 16
Independent 14 11
Before the price reduction the Times was probably verging on the Dog areaof the BCG matrix. By June 1994 the ratio between the Times’ and DailyTelegraph’s market share had changed from 2.8 to 1.9, so the relative marketshare advantage enjoyed by the Daily Telegraph had greatly diminished. If the
A2/42 Edinburgh Business School Strategic Planning
Appendix 2 / Answers to Review Questions and Case Analyses
market had entered a growth stage the Times could be classified as a rising Star,and hence it is to be expected that it would not be making significant profits.
Question 2: Do you think the Daily Telegraph share price reduction was simply‘ludicrous over-reaction’ on the part of stock exchange investors?
The 38 per cent reduction in the price of the Daily Telegraph was accompaniedby a 39 per cent fall in the share price. This suggests that the market thought thatprice reductions would have little impact on the size of the total market, hencethe net effect on revenues would be negative. The fact that the share price ofthe Times fell by much less than that of the Daily Telegraph or the Independentsuggests that the market felt that by reducing price the Daily Telegraph wouldhalt the loss in market share but would have little impact on the position thatthe Times had built up. This was backed up by the developments up to 1996,by which time Daily Telegraph sales had not increased.
Thus one interpretation is that the financial market predicted that the news-paper market would reach equilibrium at a much lower price than previously.While there will always be a degree of overshooting in financial markets, thestock market reaction was generally in line with reasonable expectations aboutfuture profitability.
Case 6 Analysis : An International Romance that Failed: British Telecom and MCI
Did BT really understand competition in the US telecoms market?
Telephone prices had fallen by 50% in the US in the three years to 1997; thissuggested that supply had been increasing at a much higher rate than demandand that BT would require significant cost advantages if it were to succeed. Itstrack record of reducing costs in the UK was impressive, but this was startingfrom the high base of a government monopoly. At the same time internationalcall prices had fallen by 60% so the supply and demand changes were notconfined to the US.
There are three distinct segments in the US telephone market: corporate, longdistance and local. BT may not have realised that competition was quite differentin each and therefore that different competitive approaches would be required.
The extent to which BT understood the five forces can be inferred as follows.
Strategic Planning Edinburgh Business School A2/43

Appendix 2 / Answers to Review Questions and Case Analyses
Threat of new entrants
– Local segment: low: while deregulation had lowered entry barriers in princi-ple, in practice it turned out to be very difficult to win market share andafter a year MCI had only $80 million of local business.
– Long distance segment: high: the market was mature and, given MCI’s marketposition, it might have been expected that this sector was safe. But it turnedout that the Baby Bells were able to enter this market.
– Corporate segment: high: the fact that international call prices had fallensuggests that there there had been entry into the market for multi–nationalone stop services. MCI was not equipped for this market, and BT lackedexperience in the US.
It is possible that BT did not appreciate the threat of new entrants, both fromthe viewpoint of entrants to the segments in which it wished to operate and itsown ability (with MCI) to enter segments such as local markets.
Threat of substitutes
With the advent of internet technology the threat was high in all three seg-ments. However, the threat was not immediate so it had probably had littleimpact on the market by 1997.
Buyer bargaining power
The objective of deregulation was to increase buyer power in all three seg-ments, and this was bound to increase as new cables were installed, the tech-nology changed and new entrants appeared.
Supplier bargaining power
No information
Competitive rivalry
Competitive conditions were changing in all three segments with deregulation.While direct competition may not have appeared to be increasing in terms ofnumber of competitors, the increased threat of new entrants resulted in allthree becoming increasingly contestable. The long distance segment was matureand monopoly power had been eroded. The corporate segment was beingcontested by major international alliances. The local segment was already highlycompetitive and was become increasingly so. Competitive rivalry in all threesegments was high so none of them provided an easy entry which wouldprovide a platform from which to attack the others.
There were three key forces which were becoming increasingly competitiveand BT did not appear to have recognised this: the increasing threat of newentrants in the corporate and long distance segments and its own difficultyin entering the local market, the increased power of buyers and the increasedrivalry. Together these had contributed to the imbalance between supply anddemand and the falling prices in the previous three years. The problem con-fronting BT was not so much that these competitive forces had been changingbut that BT did not appear to understand their implications.
A2/44 Edinburgh Business School Strategic Planning
Appendix 2 / Answers to Review Questions and Case Analyses
Module 6
Case 1 Analysis : Company Accounts
1. Use financial ratios to compare company performance in the two years payingparticular attention to the appropriate measure of profitability.
The aggregate ratios are as follows
Ratio Year 1 Year 2% %
Return on total assets 8 15Return on equity 11 28Return on investment 11 16
There seems little doubt that company performance has improved significantlybetween the two years. This is primarily due to the fact that the operatingsurplus increased from £1.3 million to £3.8 million, an increase of about threetimes, while the value of assets increased by only two thirds. The reason thatROE and ROI were equal in Year 1 was that the values of owner’s equity andfixed investment were approximately equal; by Year 2 fixed assets had almostdoubled, while owner’s equity had remained almost unchanged, leading to thevery large increase in ROE. This arose from the fact that the increase in fixedassets had been financed almost entirely by loans, as can be seen from theincrease in long term debt from £2 million to £12 million.
The net cash flow position has improved greatly, from a net outgoing of £1.8million to a net inflow of £2.2 million. The fact that the net cash flow in Year 2 is£1.6 million less than the operating surplus needs to be explained; it is obviousthat a major part of the difference is that the company now has a very large longterm loan commitment of £1.3 million per year. This in fact raises the questionof whether operating surplus is the appropriate measure of profitability for thiscompany. Substituting net cash flow for operating surplus in Year 2 gives thefollowing result.
Ratio Year 1 Year 2 Year 2% % %
Operating surplus Net cash flowReturn on total assets 8 15 9Return on equity 11 28 16Return on investment 11 16 10
Using net cash flow for Year 2 reveals that both ROTA and ROI were virtuallyunchanged between the two years. This demonstrates how accounting conven-tions can greatly affect measured performance and raises doubts as to whetherthe underlying profitability of the company has actually been increased.
Strategic Planning Edinburgh Business School A2/45

Appendix 2 / Answers to Review Questions and Case Analyses
2. Can it be deduced that the investment programme was responsible for any increasein profitability?
The company’s cost structure itself changed between the two years:
Percentage of total cost
Year 1 Year 2% %
Wages 33 29Production lines 22 28
These ratios reveal that the company has become more capital intensive, tobe expected as a result of the large investments in equipment made during theperiod. But whether this cost structure is actually more efficient would requiremore detailed figures on unit costs.
The impact of the investment programme on profitability is uncertain, giventhe doubts raised above on the appropriate measure of profit. In fact, salesrevenue increased from £8.1 million to £11.5 million between the two years andit is difficult to see what effect an internal reorganisation of capital and labourinputs could make to the value of final sales – this is more likely to be related togeneral demand for the company’s product, marketing expenditure and pricing.The real issue, then, is what would have happened to profitability if sales hadincreased by that amount and no investment programme had been undertaken.One answer to this can be obtained by simply grossing up the cost of goodssold in Year 1 by the increase in sales revenue:
£4.8 million × £11.5/£8.1 = £6.8 million
It needs to be stressed that the information available cannot provide a defini-tive answer to these questions. It may be possible to arrive at different conclu-sions by conducting the analysis in a different way. The important issue is notto take the numbers at their face value but to try to interpret them in a varietyof ways.
3. What strategic implications can be drawn from the analysis?
The company has taken steps to rationalise and modernise its productive pro-cesses. It appears to have reduced its costs and should be in a position tocompete effectively with other efficient producers in the future. While there aresome concerns about what has really happened to profitability between the twoyears, it is open to question whether the company would have been able toaccommodate significant increases in demand with its Year 1 capital structure.
A2/46 Edinburgh Business School Strategic Planning
Appendix 2 / Answers to Review Questions and Case Analyses
Case 2 Analysis : Company Information
You are confronted with a great deal of information and it is necessary touse every tool at your disposal to glean conclusions. It is possible that someof the comments made by the managers have significant implications for theinterpretation of the company data. You have to bear in mind that this is asnapshot at one point in time and ideally you would like to have informationon past years; however, you can arrive at many conclusions on the basis ofeven this limited information. In real life you would always like to have moreinformation but it is necessary to make do with what you have.
1. Review the company as a whole in terms of its profitability and asset position.
The first step is to use accounting ratios to assess overall company profitabilityin terms of the return on capital (Table A2.7).
Table A2.7
Top line divided by Bottom line Ratio as %
Operating surplus Total assets 7.7
Operating surplus Fixed assets 25.7
Operating surplus Owners’ equity 12.9
Gross profit Total assets 42.3
The company as a whole is making in the region of 10 per cent rate of returnusing operating surplus as the profit measure. But there is a large differencebetween gross profit and operating surplus, and this suggests that two thingshave to be looked at: the amount spent on overheads and the performance ofthe individual products. Some of the questions which need to be addressedinclude the following.
1 Are the overheads under control?
2 Can they be reduced without long term damage in order to increase oper-ating surplus?
3 Are the individual products performing as well as they could?
4 Is a combination of these two factors causing the difference?
The company’s net cash flow position is about $3 million. The company istherefore generating much more cash than suggested by the operating surplus.To compare like with like, adjust the net cash flow by the income from sellinga factory; the resulting net cash flow is still much greater than the operatingsurplus. You have to address the question of why a company which can generatea large positive net cash flow does not return a similar operating surplus. Acontributing factor is the accounting conventions. For example, the cost ofgoods sold approach matches historic costs with sales, and the costs incurredin the current period could be significantly different from historic costs if thecompany is selling some products from inventory and producing others for
Strategic Planning Edinburgh Business School A2/47
Appendix 2 / Answers to Review Questions and Case Analyses
inventory. This is in fact the case, as both Box and Lid ran down inventoriesduring the year.
The company has a gearing ratio of 67%, using the ratio of debt to ownerequity, and this is caused by the long term loan of $4 million. While there isno absolute benchmark for assessing whether this gearing ratio is excessive, ifthe company’s track record to date has been sound there is probably scope forfurther borrowing to finance expansion. On the other hand the interest paymenton the long term loan is less than 4% of total outlays so the company is notunduly exposed to interest rate movements.
Some conclusions about the effectiveness of management at the corporate levelcan be drawn.
1 While the company is making a positive return on assets the fact that cashflow is greater than operating surplus suggests that the return could beimproved.
2 The company could be handling its cash better; at the moment it is holding$3 million in cash, presumably for working capital, while servicing a debtof $4 million.
3 There is a clear need to investigate corporate overheads, which are about80% of gross profit.
Thus while the company embarked on an ambitious programme of investmentand expansion two years ago the benefits are not being fully realised as yet.
2. Analyse the three products and make recommendations for each.
From the business perspective you are interested in how efficiently resourcesare being allocated by product managers, and from the corporate perspectiveyou want to determine whether resources should be reallocated among products.
The Marketing manager’s comments suggest that Box was a Cash Cow,having a high market share in a mature market. In fact, it is responsible forgenerating 75 per cent of gross profit. It has a high market share and a low unitcost compared to the competing price. But the product upgrade has disruptedproduction and overtime is being worked on the product while the attritionrate is relatively high. This suggests that unit cost could be even lower with astable labour force which was not working overtime. Furthermore, there is nowinsufficient production of the Box in relation to market demand: all inventoryplus current production was sold which suggests that some customers wereunsatisfied. This could lead to a loss of competitive advantage.
The Lid has been subjected to increased market pressure, which probably ledto a reduction in market price and hence a reduction in profit margin. It couldbe classified as either a Star or a Question Mark. It has a reasonable marketshare but it is not making much money. Do a sensitivity analysis, for examplecalculate what the Lid could be making with a market share of 20 per cent,and hence how much it might be worth spending on a marketing campaign to
A2/48 Edinburgh Business School Strategic Planning
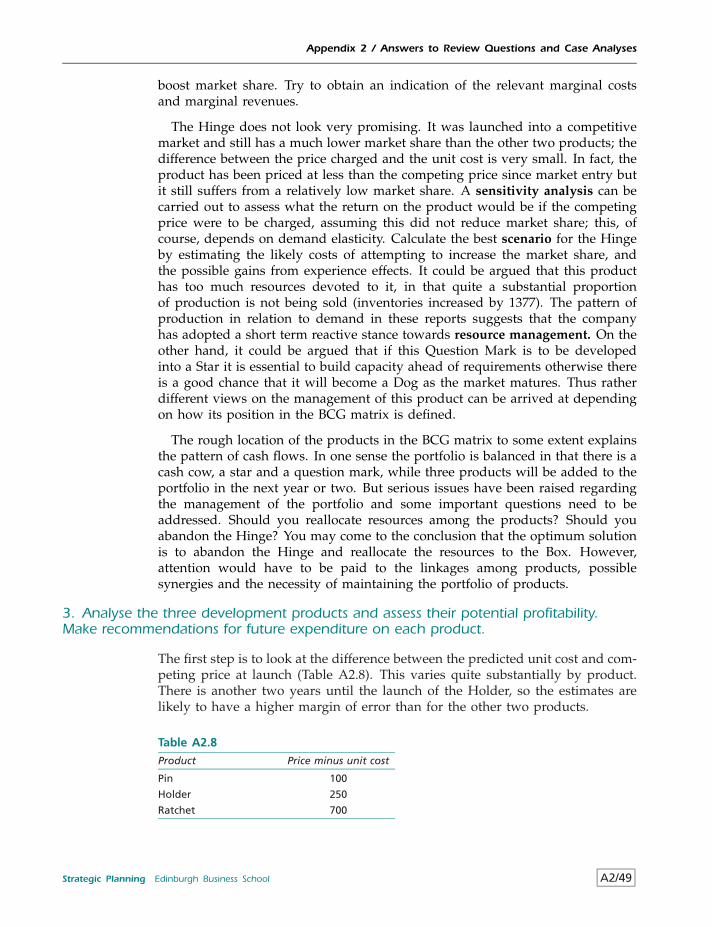
Appendix 2 / Answers to Review Questions and Case Analyses
boost market share. Try to obtain an indication of the relevant marginal costsand marginal revenues.
The Hinge does not look very promising. It was launched into a competitivemarket and still has a much lower market share than the other two products; thedifference between the price charged and the unit cost is very small. In fact, theproduct has been priced at less than the competing price since market entry butit still suffers from a relatively low market share. A sensitivity analysis can becarried out to assess what the return on the product would be if the competingprice were to be charged, assuming this did not reduce market share; this, ofcourse, depends on demand elasticity. Calculate the best scenario for the Hingeby estimating the likely costs of attempting to increase the market share, andthe possible gains from experience effects. It could be argued that this producthas too much resources devoted to it, in that quite a substantial proportionof production is not being sold (inventories increased by 1377). The pattern ofproduction in relation to demand in these reports suggests that the companyhas adopted a short term reactive stance towards resource management. On theother hand, it could be argued that if this Question Mark is to be developedinto a Star it is essential to build capacity ahead of requirements otherwise thereis a good chance that it will become a Dog as the market matures. Thus ratherdifferent views on the management of this product can be arrived at dependingon how its position in the BCG matrix is defined.
The rough location of the products in the BCG matrix to some extent explainsthe pattern of cash flows. In one sense the portfolio is balanced in that there is acash cow, a star and a question mark, while three products will be added to theportfolio in the next year or two. But serious issues have been raised regardingthe management of the portfolio and some important questions need to beaddressed. Should you reallocate resources among the products? Should youabandon the Hinge? You may come to the conclusion that the optimum solutionis to abandon the Hinge and reallocate the resources to the Box. However,attention would have to be paid to the linkages among products, possiblesynergies and the necessity of maintaining the portfolio of products.
3. Analyse the three development products and assess their potential profitability.Make recommendations for future expenditure on each product.
The first step is to look at the difference between the predicted unit cost and com-peting price at launch (Table A2.8). This varies quite substantially by product.There is another two years until the launch of the Holder, so the estimates arelikely to have a higher margin of error than for the other two products.
Table A2.8
Product Price minus unit cost
Pin 100
Holder 250
Ratchet 700
Strategic Planning Edinburgh Business School A2/49
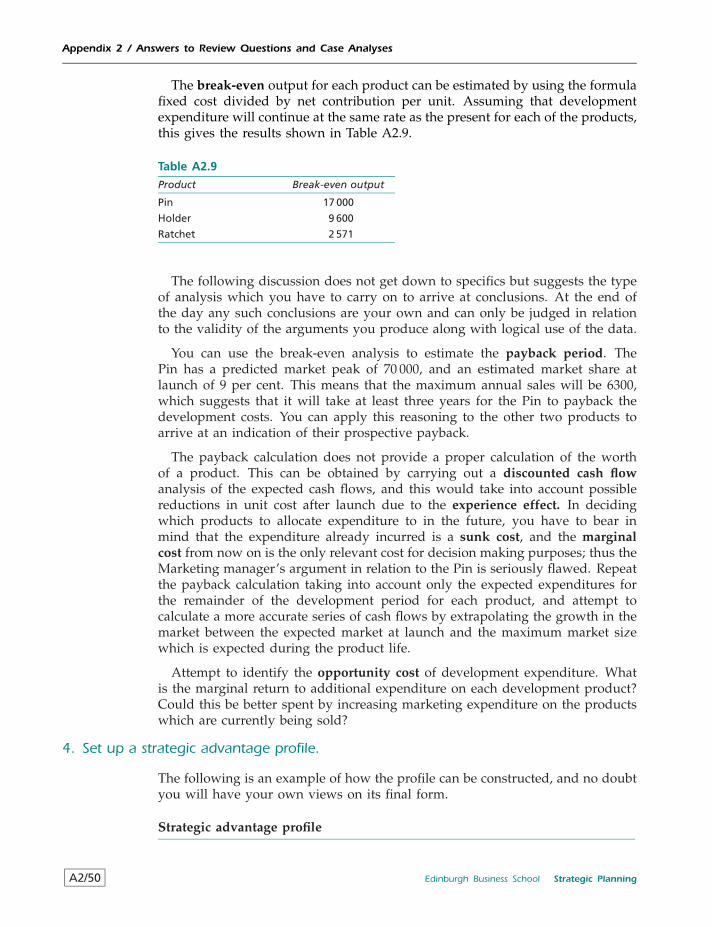
Appendix 2 / Answers to Review Questions and Case Analyses
The break-even output for each product can be estimated by using the formulafixed cost divided by net contribution per unit. Assuming that developmentexpenditure will continue at the same rate as the present for each of the products,this gives the results shown in Table A2.9.
Table A2.9
Product Break-even output
Pin 17 000
Holder 9 600
Ratchet 2 571
The following discussion does not get down to specifics but suggests the typeof analysis which you have to carry on to arrive at conclusions. At the end ofthe day any such conclusions are your own and can only be judged in relationto the validity of the arguments you produce along with logical use of the data.
You can use the break-even analysis to estimate the payback period. ThePin has a predicted market peak of 70 000, and an estimated market share atlaunch of 9 per cent. This means that the maximum annual sales will be 6300,which suggests that it will take at least three years for the Pin to payback thedevelopment costs. You can apply this reasoning to the other two products toarrive at an indication of their prospective payback.
The payback calculation does not provide a proper calculation of the worthof a product. This can be obtained by carrying out a discounted cash flowanalysis of the expected cash flows, and this would take into account possiblereductions in unit cost after launch due to the experience effect. In decidingwhich products to allocate expenditure to in the future, you have to bear inmind that the expenditure already incurred is a sunk cost, and the marginalcost from now on is the only relevant cost for decision making purposes; thus theMarketing manager’s argument in relation to the Pin is seriously flawed. Repeatthe payback calculation taking into account only the expected expenditures forthe remainder of the development period for each product, and attempt tocalculate a more accurate series of cash flows by extrapolating the growth in themarket between the expected market at launch and the maximum market sizewhich is expected during the product life.
Attempt to identify the opportunity cost of development expenditure. Whatis the marginal return to additional expenditure on each development product?Could this be better spent by increasing marketing expenditure on the productswhich are currently being sold?
4. Set up a strategic advantage profile.
The following is an example of how the profile can be constructed, and no doubtyou will have your own views on its final form.
Strategic advantage profile
A2/50 Edinburgh Business School Strategic Planning
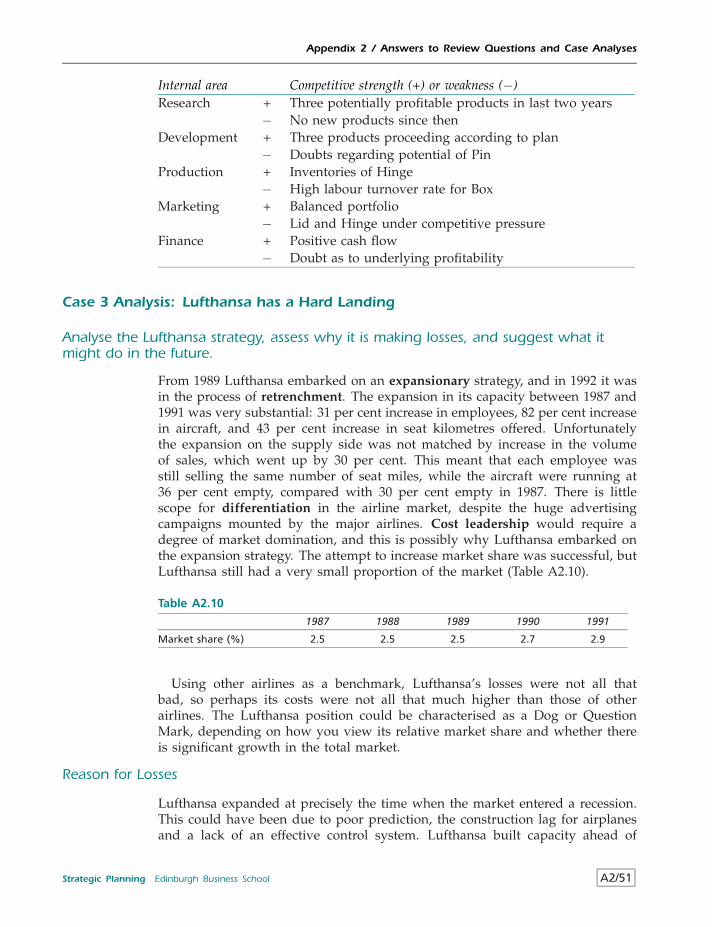
Appendix 2 / Answers to Review Questions and Case Analyses
Internal area Competitive strength (+) or weakness (−)Research + Three potentially profitable products in last two years
− No new products since thenDevelopment + Three products proceeding according to plan
− Doubts regarding potential of PinProduction + Inventories of Hinge
− High labour turnover rate for BoxMarketing + Balanced portfolio
− Lid and Hinge under competitive pressureFinance + Positive cash flow
− Doubt as to underlying profitability
Case 3 Analysis: Lufthansa has a Hard Landing
Analyse the Lufthansa strategy, assess why it is making losses, and suggest what itmight do in the future.
From 1989 Lufthansa embarked on an expansionary strategy, and in 1992 it wasin the process of retrenchment. The expansion in its capacity between 1987 and1991 was very substantial: 31 per cent increase in employees, 82 per cent increasein aircraft, and 43 per cent increase in seat kilometres offered. Unfortunatelythe expansion on the supply side was not matched by increase in the volumeof sales, which went up by 30 per cent. This meant that each employee wasstill selling the same number of seat miles, while the aircraft were running at36 per cent empty, compared with 30 per cent empty in 1987. There is littlescope for differentiation in the airline market, despite the huge advertisingcampaigns mounted by the major airlines. Cost leadership would require adegree of market domination, and this is possibly why Lufthansa embarked onthe expansion strategy. The attempt to increase market share was successful, butLufthansa still had a very small proportion of the market (Table A2.10).
Table A2.10
1987 1988 1989 1990 1991
Market share (%) 2.5 2.5 2.5 2.7 2.9
Using other airlines as a benchmark, Lufthansa’s losses were not all thatbad, so perhaps its costs were not all that much higher than those of otherairlines. The Lufthansa position could be characterised as a Dog or QuestionMark, depending on how you view its relative market share and whether thereis significant growth in the total market.
Reason for Losses
Lufthansa expanded at precisely the time when the market entered a recession.This could have been due to poor prediction, the construction lag for airplanesand a lack of an effective control system. Lufthansa built capacity ahead of
Strategic Planning Edinburgh Business School A2/51
Appendix 2 / Answers to Review Questions and Case Analyses
demand which did not materialise. Thus not only was Lufthansa at a scaledisadvantage compared with competitors but it had to bear the costs of excesscapacity.
Lufthansa was very susceptible to a marginal increase in its costs in relationto its revenues. Ratio analysis shows this very clearly: from 1987 to 1989 profitswere about 2 per cent of turnover, and this dropped to 1 per cent in 1990; in1991 the loss was about 2 per cent of turnover. Something had clearly happenedto the effectiveness of the value chain: productive capacity had been increasedfar in excess of sales.
There are many competitors and no company dominates the market suggestinga market structure with some ‘perfect’ characteristics; it is therefore unlikely thatmonopoly profits will be earned . Even the largest carriers have no more than 7per cent market share and Lufthansa has about 3 per cent market share. In thelight of the following five forces profile it is not surprising to find that profitmargins are low.
Bargaining power of suppliers: low
While there are few aircraft producers there is intense competition amongthem.
Bargaining power of buyers: high
Few airlines have a monopoly of take off slots from a particular airport.
Threat of entrants: high
Since 1993 many budget airlines have entered the market.
Threat of substitutes: low
It is debatable whether developments such as the Channel Tunnel linkingthe UK with France comprise a real substitute for air travel.
Rivalry: high
The high levels of advertising are an outcome of intense rivalry, particularlygiven that the product is relatively homogeneous.
Lufthansa has been looking for a partner, possibly to achieve economies ofscale and utilise excess capacity given that it has not been able to increase marketshare significantly.
Future Prospects
The product is largely homogeneous, therefore differentiation is difficult. Themarket is mature, therefore it is difficult to increase market share because ofthe strength of the larger companies. It may be possible to segment the marketand target specific niche sectors. But since the market is declining, at least inthe short run, it is to be expected that there will be competitive reaction to anystrategic moves. Trying to increase market share is a zero sum game, because
A2/52 Edinburgh Business School Strategic Planning
Appendix 2 / Answers to Review Questions and Case Analyses
of the static market size. Since Lufthansa is only 40 per cent of the size of thelargest company, it cannot easily pursue a low cost strategy because it does nothave the advantage of economies of scale. Furthermore, since marginal costs ofpassengers are very low, price competition at the margin is going to be difficult.In order to achieve a competitive advantage, it needs to reduce its capacity andhence its costs in line with its projected sales, which will get its capacity up tothe level it was at and will once again ensure that profits are made. It shoulduse the marginal cost and revenue approach when assessing which routes tocut, and get rid of the planes with the highest operating costs.
Lufthansa has some characteristics which might contribute to a competitiveadvantage. It has a strong brand name and strategic assets in the form of theroutes which it operates. The problem is that there is a potential conflict betweenattempting to improve profitability in the short run and long term prospects: ifthe airline business were to come out of the recession fairly quickly then shortrun cost cutting measures might restrict its ability to respond to the higher levelsof demand.
Case 4 Analysis: General Motors: the story of an empire
Discuss GM’s reaction to the changing competitive environment using strategic models.
As the competitive environment changed various actions were undertaken andin 1998 Jack Smith embarked on six major initiatives to tackle GM’s problems;strategic models can be used to assess how the actions and initatives are likelyto impact on GM’s operations and the extent to which they will enable GMto recover its market position. Broadly speaking there was a change in thecompetitive conditions which had existed up to the 1980s and the discussionwill focus on the differences before and after that time.
Strategists
Before 1980s: A strong management background which was pathbreaking atthe time.
After 1980s: There is a principal agent problem as senior executives competewith each other hence the characteristics of the CEO may be related more topolitical rather than business ability. The size of GM seemed to have led toinertia. The interests of shareholders were not pursued so far as the industrialoperation of the company was concerned. The share price had fallen 70% underthe Dow Jones. There is no evidence that the process of choosing a new CEOwas related to the changing demands which had arisen since the 1980s.
Objectives
Before 1980s: No clear objective; it had diversified into parts, electronics finance.
After 1980s: Return to the core business of producing cars. However, it isdifficult to know if changing objectives have been the outcome of executivesjockeying for position or the result of a rational analysis. For example themarketing changes and globalisation initiatives can be interpreted as personal
Strategic Planning Edinburgh Business School A2/53
Appendix 2 / Answers to Review Questions and Case Analyses
victories rather than being part of an overall strategic thrust. After the 1980s Itwas not clear whether GM intended to maintain the position of Cadillac as aluxury brand.
Overall who decides to do what
GM lacked a leader with vision; there did not seem to be a clear idea of whereits competitive advantage lay and how this was changing. None of the changeshad improved this significantly.
Analysis
International Environment
Before 1980s: The international environment had not affected GM significantly.
After 1980s: GM was faced with international competition in the US market,and did not seem to be aware of whether its competitive advantage was countryor company specific. GM had not capitalised on the potential to think global andact local. However, for an operation of this size this was going to be difficult, asFord had discovered. The notion of global consolidation was designed to resultin a more design responsive company which could compete cost effectively indifferent markets.
Industry environment
The car market had two distinct segments: the market for high quality highlydifferentiated cars and the mass produced market where price is a dominantcharacteristic.
The first step is to determine the characteristics of the changing competitiveenvironment and then determine the extent to which GM’s reactions werealigned with these changes. The five forces analysis provides a starting point.
A2/54 Edinburgh Business School Strategic Planning
Appendix 2 / Answers to Review Questions and Case Analyses
Market force Before 1980s After 1980s ReactionBuyers’bargainingpower
Restricted choice M More makers H Build smallerCadillacs; reduceshowrooms
Suppliers’bargainingpower
Vertically integrated H Buy rather thanmake
L Sell Delphi; reduceplatforms
Labour ? Labour: strikes H Poor HRmanagement
Threat of newentrants
Dominant in USmarket: high entrybarriers
L Globalisation H None
Threat ofsubstitutes
Brand name L Sport-utilities H None
Rivalry Market leader ? Move towardsperfect competition
H Restructure and cutcost
Market force AlignmentBuyers’ bargaining power New products not aligned with new demands: sports
utility opportunity lost, smaller Cadillac not focused onnew market preferences.
L
Suppliers’ bargaining power Some rationalisation of supply chain, but labour relationspoor.
M
Threat of new entrants Did not respond directly to Lexus etc. and was unable toerect barriers.
L
Threat of substitutes Kept to its old model range LRivalry Internal focus L
There was no clear systematic response to the changes in market conditions.
Perceived differentiation
There are various dimensions to perceived differentiation and in this casetwo aspects of perceived quality were central: reliability and luxury. A separateperceived price differentiation matrix can be constructed for each.
• Because of the improvement in reliability of competitors GM was shiftingacross the perceived differentiation and price matrix towards the failurelikely sector.
• By building smaller Cadillacs and standardising components the perceptionof the luxury brand was undermined and also shifted towards the failurelikely sector.
The net result was that GM was rapidly losing its favourable product posi-tioning.
Strategic Planning Edinburgh Business School A2/55
Appendix 2 / Answers to Review Questions and Case Analyses
There was no identifiable market response to the problem of product posi-tioning: GM was not a first mover in new products. None of the actions of 1998address this issue.
Product life cycle
It is possible that the GM range, particularly in the luxury sector, was in thedecline stage.
Product portfolio
Although GM still had significant market shares the erosion in market share dueto competition and poor product development was shifting at least the luxurybracket in the direction of a dog. If the product life cycle was in decline thestrategic future was poor.
Segmentation
The marketing approach for a highly differentiated luxury product differs fromthat of a relatively homogeneous low price product.
Before 1980s: Clear distinction between the luxury and mass market cars. The1984 restructure was based on this difference.
After 1980s: Centralising sales and marketing systems might have resulted ina misaligned marketing approach for both segments individually. The pursuitof a modular approach to car construction might have further undermined theperceived differentiation between the two segments.
Internal environment
Most of the changes had an internal focus and can be interpreted as attemptsto improve the components of the value chain which were not performingadequately.
Procurement
Vertical integration meant that it was not utilising its buying power nor benefit-ing from market discipline on suppliers.
Action: Delphi was sold.
Impact: strengthen.
Technology development
New approaches were being used by competitors, such as devising commonplatforms, and GM’s reliability was not keeping up with the competition.
Action: new smaller type of car plant focused on modular construction; butthis amounted to following competitors rather than leading it by innovativetechnological advances.
Impact: strengthen.
A2/56 Edinburgh Business School Strategic Planning
Appendix 2 / Answers to Review Questions and Case Analyses
Human resource management
Poor record on strikes. There appeared to be no proactive response to labourproblems.
Action: none
Impact: weaken.
Management systems
The divisional structure and layered management had contributed to GM’s lackof response to changing conditions.
Action: a combination of centralising functions and relating managers moreclosely to their responsibilities.
Impact: strengthen.
In-bound logistics
Operations: the man days per car suggests that operations were relatively inef-ficient. Poor reliability was having a negative impact on brand.
Action: reduce labour force by 25 000.
Impact: weaken.
Out-bound logistics
Large costly (20% of all costs) showroom presence.
Action: reduce the number of showrooms. However, this cost based measurecould have significant implications for brand awareness and product positioning.
Impact: weaken.
Marketing and sales, service
Different sales, service and marketing systems
Action: centralisation.
Impact: reduce perceived differentiation of car types: weaken.
Overall impact: there were weaknesses in the value chain some of which wereaddressed by the initiatives but these were primarily directed at reducing costsand improving management processes rather than generating value for thecustomer, i.e. ensuring that the right cars were produced. Some of the initiativesmay have contributed to improving the links through the value chain, forexample the attempt to relate managers more closely to responsibilities; butthere is no evidence that the overall value chain was considered explicitly.
Overall analysis and diagnosis
GM had lost competitive advantage and did not demonstrate a clear notion ofhow this might be regained. The initiatives were mostly reactive.
Strategic Planning Edinburgh Business School A2/57
Appendix 2 / Answers to Review Questions and Case Analyses
Choice
Generic strategy
The company had undertaken a corporate generic strategy of expansion intounrelated markets such as financing and electronics. However, there appearedto be little synergy from either vertical integration or financial services. This washighlighted by the values of the component parts of the company; none of theacquisitions appeared to have imparted value to the core business of makingcars. The expansion trajectory was not based on existing resources or routinesand resulted in unrelated diversification.
Action: the corporate strategy of retrenchment to core activities.
GM had to some extent changed its business strategy from high price differen-tiation to low cost.
Action: adopt global production to achieve economies of scale. Despite its sizeit was in danger of becoming stuck in the middle.
Implementation
Resources and Structure
The divisional structure had become very costly because of duplication. Verticalintegration was generating no benefits. Layered management was leading tostagnation.
Action: centralisation
Resource Allocation
Costs were relatively high.
Action: build smaller plants; reduce number of showrooms.
Evaluation and Control
The financial background of many existing managers suggests that the companylay towards the ‘tight financial’ sector of the planning and control matrix; thiswas consistent with the lack of response to market changes and the focus of the1998 initiatives on cost reduction.
Action: none.
Overall implementation
The high costs were clearly seen as a major priority and attempts were made toaddress this.
Feedback
The bureaucratic structure is still a drawback. The behaviour of senior executivessuggests that the organisation is not geared to learning but is introspective anddominated by political manoeuvring.
Action: none.
A2/58 Edinburgh Business School Strategic Planning
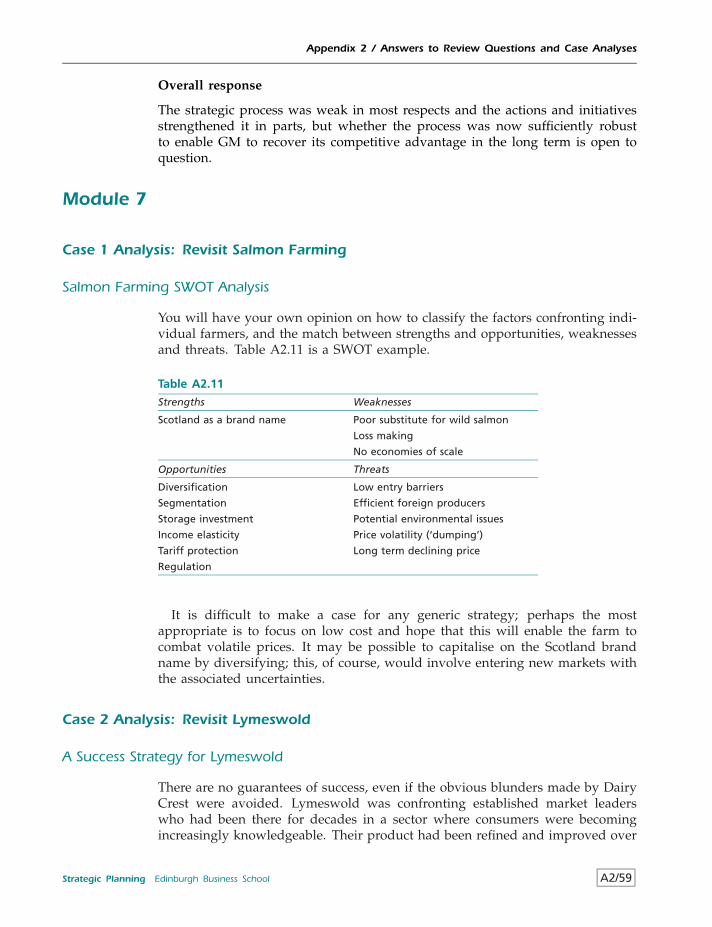
Appendix 2 / Answers to Review Questions and Case Analyses
Overall response
The strategic process was weak in most respects and the actions and initiativesstrengthened it in parts, but whether the process was now sufficiently robustto enable GM to recover its competitive advantage in the long term is open toquestion.
Module 7
Case 1 Analysis: Revisit Salmon Farming
Salmon Farming SWOT Analysis
You will have your own opinion on how to classify the factors confronting indi-vidual farmers, and the match between strengths and opportunities, weaknessesand threats. Table A2.11 is a SWOT example.
Table A2.11
Strengths Weaknesses
Scotland as a brand name Poor substitute for wild salmon
Loss making
No economies of scale
Opportunities Threats
Diversification Low entry barriers
Segmentation Efficient foreign producers
Storage investment Potential environmental issues
Income elasticity Price volatility (‘dumping’)
Tariff protection Long term declining price
Regulation
It is difficult to make a case for any generic strategy; perhaps the mostappropriate is to focus on low cost and hope that this will enable the farm tocombat volatile prices. It may be possible to capitalise on the Scotland brandname by diversifying; this, of course, would involve entering new markets withthe associated uncertainties.
Case 2 Analysis: Revisit Lymeswold
A Success Strategy for Lymeswold
There are no guarantees of success, even if the obvious blunders made by DairyCrest were avoided. Lymeswold was confronting established market leaderswho had been there for decades in a sector where consumers were becomingincreasingly knowledgeable. Their product had been refined and improved over
Strategic Planning Edinburgh Business School A2/59
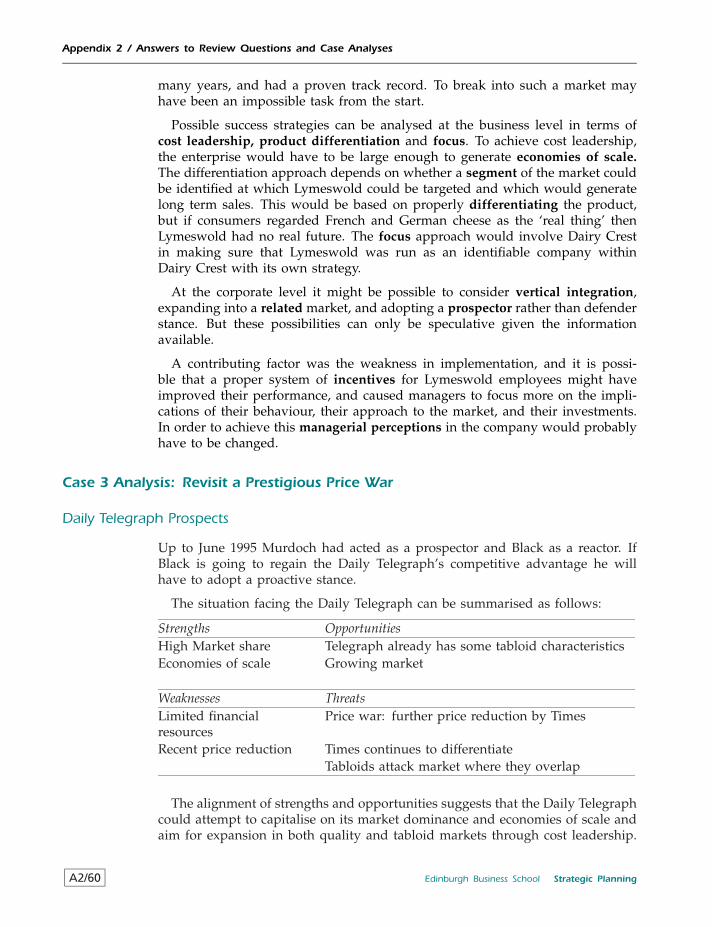
Appendix 2 / Answers to Review Questions and Case Analyses
many years, and had a proven track record. To break into such a market mayhave been an impossible task from the start.
Possible success strategies can be analysed at the business level in terms ofcost leadership, product differentiation and focus. To achieve cost leadership,the enterprise would have to be large enough to generate economies of scale.The differentiation approach depends on whether a segment of the market couldbe identified at which Lymeswold could be targeted and which would generatelong term sales. This would be based on properly differentiating the product,but if consumers regarded French and German cheese as the ‘real thing’ thenLymeswold had no real future. The focus approach would involve Dairy Crestin making sure that Lymeswold was run as an identifiable company withinDairy Crest with its own strategy.
At the corporate level it might be possible to consider vertical integration,expanding into a related market, and adopting a prospector rather than defenderstance. But these possibilities can only be speculative given the informationavailable.
A contributing factor was the weakness in implementation, and it is possi-ble that a proper system of incentives for Lymeswold employees might haveimproved their performance, and caused managers to focus more on the impli-cations of their behaviour, their approach to the market, and their investments.In order to achieve this managerial perceptions in the company would probablyhave to be changed.
Case 3 Analysis: Revisit a Prestigious Price War
Daily Telegraph Prospects
Up to June 1995 Murdoch had acted as a prospector and Black as a reactor. IfBlack is going to regain the Daily Telegraph’s competitive advantage he willhave to adopt a proactive stance.
The situation facing the Daily Telegraph can be summarised as follows:
Strengths OpportunitiesHigh Market share Telegraph already has some tabloid characteristicsEconomies of scale Growing market
Weaknesses ThreatsLimited financialresources
Price war: further price reduction by Times
Recent price reduction Times continues to differentiateTabloids attack market where they overlap
The alignment of strengths and opportunities suggests that the Daily Telegraphcould attempt to capitalise on its market dominance and economies of scale andaim for expansion in both quality and tabloid markets through cost leadership.
A2/60 Edinburgh Business School Strategic Planning
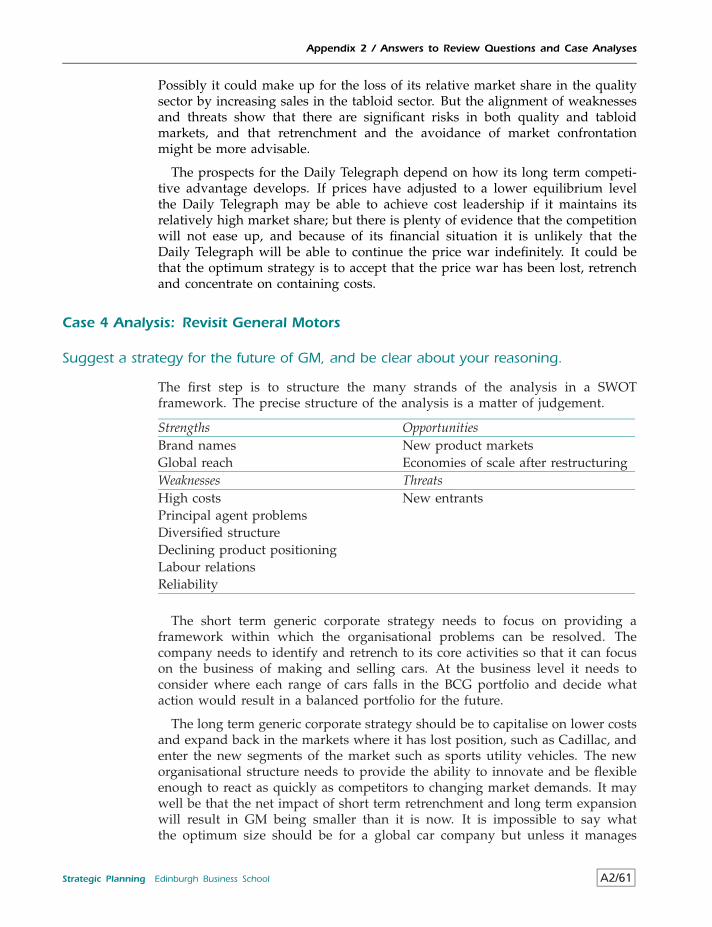
Appendix 2 / Answers to Review Questions and Case Analyses
Possibly it could make up for the loss of its relative market share in the qualitysector by increasing sales in the tabloid sector. But the alignment of weaknessesand threats show that there are significant risks in both quality and tabloidmarkets, and that retrenchment and the avoidance of market confrontationmight be more advisable.
The prospects for the Daily Telegraph depend on how its long term competi-tive advantage develops. If prices have adjusted to a lower equilibrium levelthe Daily Telegraph may be able to achieve cost leadership if it maintains itsrelatively high market share; but there is plenty of evidence that the competitionwill not ease up, and because of its financial situation it is unlikely that theDaily Telegraph will be able to continue the price war indefinitely. It could bethat the optimum strategy is to accept that the price war has been lost, retrenchand concentrate on containing costs.
Case 4 Analysis: Revisit General Motors
Suggest a strategy for the future of GM, and be clear about your reasoning.
The first step is to structure the many strands of the analysis in a SWOTframework. The precise structure of the analysis is a matter of judgement.
Strengths OpportunitiesBrand names New product marketsGlobal reach Economies of scale after restructuringWeaknesses ThreatsHigh costs New entrantsPrincipal agent problemsDiversified structureDeclining product positioningLabour relationsReliability
The short term generic corporate strategy needs to focus on providing aframework within which the organisational problems can be resolved. Thecompany needs to identify and retrench to its core activities so that it can focuson the business of making and selling cars. At the business level it needs toconsider where each range of cars falls in the BCG portfolio and decide whataction would result in a balanced portfolio for the future.
The long term generic corporate strategy should be to capitalise on lower costsand expand back in the markets where it has lost position, such as Cadillac, andenter the new segments of the market such as sports utility vehicles. The neworganisational structure needs to provide the ability to innovate and be flexibleenough to react as quickly as competitors to changing market demands. It maywell be that the net impact of short term retrenchment and long term expansionwill result in GM being smaller than it is now. It is impossible to say whatthe optimum size should be for a global car company but unless it manages
Strategic Planning Edinburgh Business School A2/61
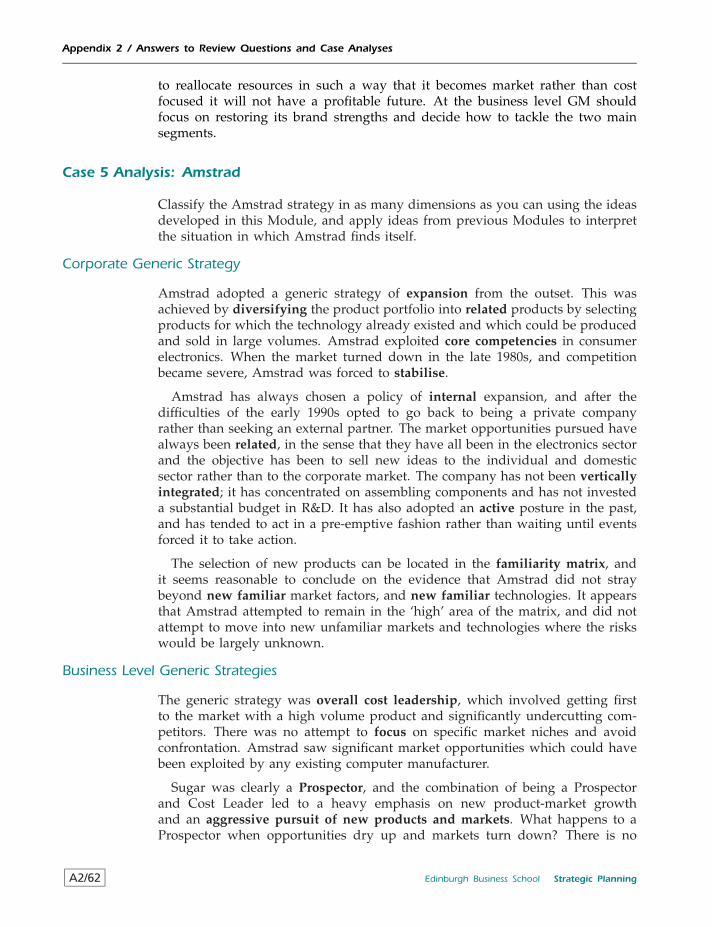
Appendix 2 / Answers to Review Questions and Case Analyses
to reallocate resources in such a way that it becomes market rather than costfocused it will not have a profitable future. At the business level GM shouldfocus on restoring its brand strengths and decide how to tackle the two mainsegments.
Case 5 Analysis: Amstrad
Classify the Amstrad strategy in as many dimensions as you can using the ideasdeveloped in this Module, and apply ideas from previous Modules to interpretthe situation in which Amstrad finds itself.
Corporate Generic Strategy
Amstrad adopted a generic strategy of expansion from the outset. This wasachieved by diversifying the product portfolio into related products by selectingproducts for which the technology already existed and which could be producedand sold in large volumes. Amstrad exploited core competencies in consumerelectronics. When the market turned down in the late 1980s, and competitionbecame severe, Amstrad was forced to stabilise.
Amstrad has always chosen a policy of internal expansion, and after thedifficulties of the early 1990s opted to go back to being a private companyrather than seeking an external partner. The market opportunities pursued havealways been related, in the sense that they have all been in the electronics sectorand the objective has been to sell new ideas to the individual and domesticsector rather than to the corporate market. The company has not been verticallyintegrated; it has concentrated on assembling components and has not investeda substantial budget in R&D. It has also adopted an active posture in the past,and has tended to act in a pre-emptive fashion rather than waiting until eventsforced it to take action.
The selection of new products can be located in the familiarity matrix, andit seems reasonable to conclude on the evidence that Amstrad did not straybeyond new familiar market factors, and new familiar technologies. It appearsthat Amstrad attempted to remain in the ‘high’ area of the matrix, and did notattempt to move into new unfamiliar markets and technologies where the riskswould be largely unknown.
Business Level Generic Strategies
The generic strategy was overall cost leadership, which involved getting firstto the market with a high volume product and significantly undercutting com-petitors. There was no attempt to focus on specific market niches and avoidconfrontation. Amstrad saw significant market opportunities which could havebeen exploited by any existing computer manufacturer.
Sugar was clearly a Prospector, and the combination of being a Prospectorand Cost Leader led to a heavy emphasis on new product-market growthand an aggressive pursuit of new products and markets. What happens to aProspector when opportunities dry up and markets turn down? There is no
A2/62 Edinburgh Business School Strategic Planning
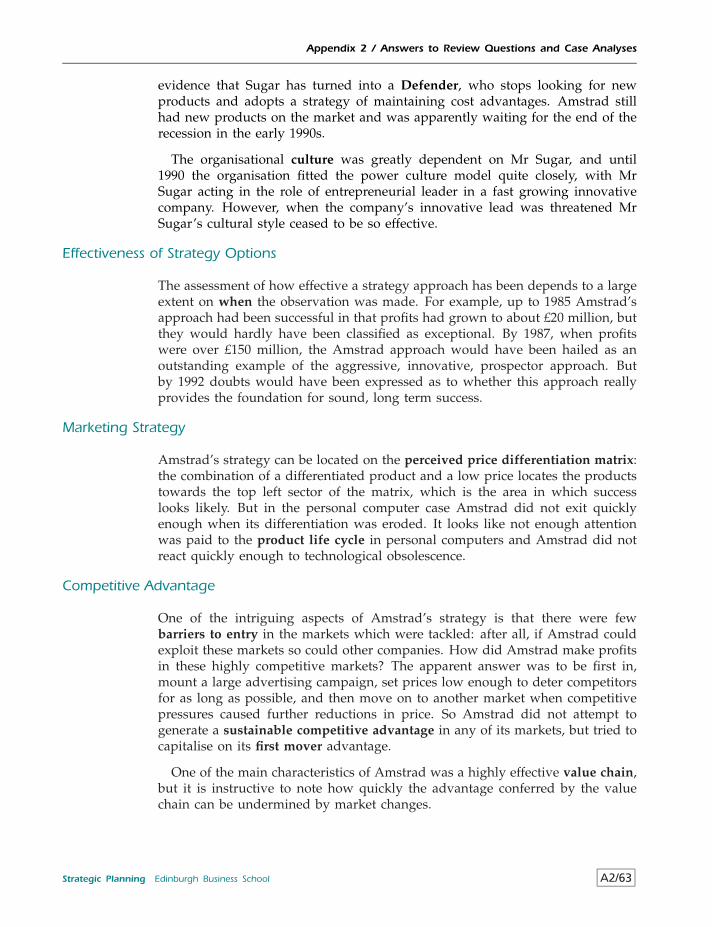
Appendix 2 / Answers to Review Questions and Case Analyses
evidence that Sugar has turned into a Defender, who stops looking for newproducts and adopts a strategy of maintaining cost advantages. Amstrad stillhad new products on the market and was apparently waiting for the end of therecession in the early 1990s.
The organisational culture was greatly dependent on Mr Sugar, and until1990 the organisation fitted the power culture model quite closely, with MrSugar acting in the role of entrepreneurial leader in a fast growing innovativecompany. However, when the company’s innovative lead was threatened MrSugar’s cultural style ceased to be so effective.
Effectiveness of Strategy Options
The assessment of how effective a strategy approach has been depends to a largeextent on when the observation was made. For example, up to 1985 Amstrad’sapproach had been successful in that profits had grown to about £20 million, butthey would hardly have been classified as exceptional. By 1987, when profitswere over £150 million, the Amstrad approach would have been hailed as anoutstanding example of the aggressive, innovative, prospector approach. Butby 1992 doubts would have been expressed as to whether this approach reallyprovides the foundation for sound, long term success.
Marketing Strategy
Amstrad’s strategy can be located on the perceived price differentiation matrix:the combination of a differentiated product and a low price locates the productstowards the top left sector of the matrix, which is the area in which successlooks likely. But in the personal computer case Amstrad did not exit quicklyenough when its differentiation was eroded. It looks like not enough attentionwas paid to the product life cycle in personal computers and Amstrad did notreact quickly enough to technological obsolescence.
Competitive Advantage
One of the intriguing aspects of Amstrad’s strategy is that there were fewbarriers to entry in the markets which were tackled: after all, if Amstrad couldexploit these markets so could other companies. How did Amstrad make profitsin these highly competitive markets? The apparent answer was to be first in,mount a large advertising campaign, set prices low enough to deter competitorsfor as long as possible, and then move on to another market when competitivepressures caused further reductions in price. So Amstrad did not attempt togenerate a sustainable competitive advantage in any of its markets, but tried tocapitalise on its first mover advantage.
One of the main characteristics of Amstrad was a highly effective value chain,but it is instructive to note how quickly the advantage conferred by the valuechain can be undermined by market changes.
Strategic Planning Edinburgh Business School A2/63
Appendix 2 / Answers to Review Questions and Case Analyses
Case 6 Analysis: Jaguar
How Much is a Jaguar Worth?
Use the list of reasons for a take-over to identify the areas in which Fordmight have reckoned that there was potential for creating value by investing asignificant proportion of this cash mountain in Jaguar.
DEVELOPMENT EXPENDITURE HAS BEEN INEFFICIENTLY SPENT
A new model was on the drawing board, but was quickly cancelled afterthe take-over. It was generally felt that the F-type project was not goingto deliver the type of car required in the late 1990s, being relatively heavyand underpowered; this was a severe indictment of the market vision of thedevelopment team. There was some scope for improving current models,and this was done by face-lifting both the XJS and XJ6 models; however, thisprobably had little real impact on sales and was certainly not a foundationfor future success.
MARKETING STRATEGY HAS NOT PURSUED OPPORTUNITIES
It was generally recognised that Sir John Egan had done a brilliant marketingjob in increasing Jaguar’s image and sales during the 1980s. Given theincreasing competition from the Japanese in this sector, it was not clear thatmajor increases in demand could be generated by changes in marketingstrategy.
RESOURCE MANAGEMENT HAS BEEN POOR
There is no doubt that Jaguar costs were higher than they need to have been,and that not enough attention had been paid to quality control. By the endof 1991 the workforce had been cut by 30 per cent. Despite the publicitysurrounding the reactions of the Ford executives to the Jaguar factoryit seems unlikely that Ford was unaware of the potential for improvingproductivity and reducing unit costs.
EXPECTED INCREASE IN DEMAND
The take-over took place when the UK was in the middle of a boomand expectations were high. While this factor may have contributed to thedecision in the short run, by the end of 1991 the international economy wasfaltering, and the Japanese had made a significant impact on the market.
WEAK PRODUCTS
The F-type project was discontinued, but apart from this Jaguar had a lim-ited product range. The company was now wholly reliant on a resurgencein demand for the traditional type of Jaguar car. The problem was that theportfolio was weak, not just one or two products. The entry of competitorssuch as the Lexus was likely to have a major impact on the positioning ofJaguar in the perceived price differentiation matrix.
A2/64 Edinburgh Business School Strategic Planning
Appendix 2 / Answers to Review Questions and Case Analyses
At the time of the take-over the price paid was so high in relation to Jaguar’srecords and immediate prospects that it is possible that the potential valuecreation was bid away in the offer. What are the chances that Ford would evermake a reasonable rate of return on its investment? For example, to make a 10per cent rate of return the Jaguar losses will have to be converted to a profitof at least £160 million per year. To achieve this would require significant unitcost reductions, higher sales volumes and a successful counter to the increasingJapanese competition.
Case 7 Analysis: Good Morning TV Has a Bad Day
1. Analyse the competitive environment facing a franchise bidder.
When a company achieves monopoly power it makes profits in excess of theopportunity cost of capital, i.e. normal profit, and therefore there is someprice which the potential monopolist is willing to pay in order to be awardedmonopoly power. At the auction stage competition hinged on how muchmonopoly profit bidders reckoned they would be able to earn. Individual com-panies varied widely in their estimates of how high this would be.
The bids were greatly influenced by the number of bidders (see Scottish) –if it was known that there was at least one other bidder then the participantswere faced with a blind auction. Clearly there would be no point to biddingaway the entire expected monopoly profit, so the question was how high to go– the outcome for any individual bidder was completely unpredictable giventhat undefined quality was being taken into account. So the auction itself wasdesigned to extract at least some of the monopoly profits from suppliers. Thefive forces model set out below shows the situation when the bidding took placecompared to some time later.
Bargaining power of buyers: before LOW, after HIGH
The bids were made in the expectation that there would be a captiveaudience due to the fact that there was only one breakfast channel.
Bargaining power of suppliers: before LOW, after LOW
While there was a limited supply of presenters and programme makers, theBig Breakfast departed from the previous model.
Threat of new entrants: before LOW, after HIGH
This is a question of perception: the bidders clearly did not see the threatsfacing them. Because of changing technology, for example in the form ofsatellites, there were no real barriers to entry. The fact of winning the biddid not guarantee a monopoly.
Threat of substitutes: before LOW, after HIGH
The remedy to problems in the past had been to tinker with the establishedformat. It had not occurred to the bidders that the viewing public mightwant something completely different.
Strategic Planning Edinburgh Business School A2/65
Appendix 2 / Answers to Review Questions and Case Analyses
Intensity of rivalry: before LOW after HIGH
Not only did GMTV not recognise the potential for competition, they wereunable to mount a positive response and reverted to the previously proventechniques of Mr Greg Dyke. GMTV was confronted by an oligopoly andif the audience size remained much the same was playing in a zero sumgame. In this situation it was highly likely that monopoly profits would bequickly bidded away.
The threats identified by the five forces analysis did not appear to be perceivedby many of the bidders. If the bidders had had even an inkling of what mighthappen then was a major role for scenario and sensitivity analysis to determinebreak-even points for different assumptions and bids, but such elementaryanalyses appeared to have been ignored by GMTV.
From the relatively small surplus bid which GMTV submitted, it would appearthat in the case of breakfast TV there was at least one other company which hadthe same estimate of monopoly profit. However, the incumbent (TV-am) put ina much lower bid – £20 million per year – despite the fact that it would haveno start up costs and had already developed a product which could win marketshare. This was an ominous sign.
After the bid had been won, the new supplier had no guarantee that in theyear before handing over the franchise the incumbent would have any incentiveto maintain the market share.
2. What strategic errors did GMTV make from bid submission up to the arrival of GregDyke?
Applying the elements of the process model helps identify the main errors.
Strategists and Objectives
GMTV intended to acquire a monopoly. The fact that they continued withmuch the same format suggests that they had no vision of altering theproduct or capturing new markets. This mentality was later shown to beinappropriate to deal with changing market conditions.
Analysis and diagnosis
GMTV was faced with an oligopoly instead of its predicted monopoly. Butit did not appear to recognise this, and appears to have carried out littleanalysis and diagnosis of its competitive position.
GMTV altered the product (presenters) but did not appear to have doneany market research.
Strategic choice
GMTV did not have a generic strategic thrust of its own, but was contentto more or less follow the pattern developed by TV-am.
A2/66 Edinburgh Business School Strategic Planning
Appendix 2 / Answers to Review Questions and Case Analyses
Implementation
GMTV did not appear to have any contingency plans.
Little attempt appears to have been made to control costs.
Feedback
Although GMTV was faced with a reduced market share and high fixedcosts (due to its very high franchise bid) it did not react quickly.
When GMTV did react, it reverted to the original product (presenters); therewas some attempt to differentiate by screening Super Nintendo, but this hadlittle impact in comparison to the type of differentiation and targeting whichThe Big Breakfast had pioneered.
3. What strategic options are available to Greg Dyke?
Table A2.12
Strengths Weaknesses
Brand name Costs
Product life cycle
Opportunities Threats
New products Low entry barriers
Technology
From Table A2.12 it appears that the appropriate generic strategy is differentia-tion rather than low cost. Greg Dyke was an acknowledged prospector who hadproved in the past that he could successfully differentiate a TV programme.
Case 8 Analysis: The Rise and Fall of Brands
Question 1: Why should the price of shares in companies like Coca Cola fall as a resultof a price cut in Marlboro cigarettes? After all, in 1988 the value of brands (i.e. thedifference between market value and book value) was enormous. Does this suggestthat the stock market is totally illogical?
The general principle is that the value of a share depends on the expectation offuture returns. To some extent these future returns are dependent on the brandimage, therefore any change in the perception of the brand image will affect theshare price. If this were not the case then the brand image would be worthless.
There are a number of ways in which a brand helps sustain competitiveadvantage. It serves as a signal of quality, contributes to consumers’ perceivedvalue and can have spillover effects on other products in the company’s portfolio.A strong brand can generate a degree of monopoly power because it is a formof entry barrier. If any of these general characteristics are undermined then theexpected cash flow attributable to all brands are likely to be adversely affected.
Strategic Planning Edinburgh Business School A2/67
Appendix 2 / Answers to Review Questions and Case Analyses
Rather than proving that the market is illogical, it could be argued that thereverse is true, i.e. that the market is highly efficient and reacts swiftly wheninformation emerges which could affect future cash flows. The short term impacton share prices can be exaggerated because of the way financial markets operate:there will always be a degree of over and under shooting before an equilibriumis established.
Question 2: Explain what was happening in the market for brands using strategymodels.
Market situations are typically complex, and models drawn from the core disci-plines can provide perspectives on different aspects. Porter’s five forces can beused to identify the main forces at work, and the models can be used to exploretheir implications.
Threat of substitutes: increasing
This is probably the main threat facing brands, and leads to a loss of differenti-ation.
• Perceived price quality differentiation model. Successful brands can be posi-tioned in the high perceived quality and medium-high perceived price areaof the matrix. The appearance of low price own brand substitutes couldcause an increase in the perceived price and a reduction in perceived quality,causing uncertainty regarding long term success.
• Product life cycle model. It is possible that some brands had passed throughthe maturity stage into decline and the emergence of substitutes wasinevitable. It is important to disentangle the product life cycle effect fromthe reduction in brand appeal due to other reasons.
Threat of new entrants: increasing
Entry barriers were being progressively reduced primarily because of the impactof new technologies.
Suppliers’ bargaining power: increasing
As the range of products increased the market power of individual supplierswould fall. Some individual brands may have had supplier problems, but noinformation is available.
Buyers’ bargaining power: increasing
The more choice on the market, and the more information available to con-sumers, the greater is the opportunity for buyers to switch among productsand this leads to a reduction in brand loyalty. The power of retailers as buyersemerged as competition for shelf space became more intense.
Industry rivalry: increasing
The threat of new entrants, emergence of substitutes and increased bargainingpower of buyers discussed above combined to affect competitive forces.
A2/68 Edinburgh Business School Strategic Planning
Appendix 2 / Answers to Review Questions and Case Analyses
• Market models: competition and monopoly. The reduction in differentiation,lowering of entry barriers and increased consumer power can be inter-preted as a shift in the direction of perfect competition, with the result thatmonopoly profits were largely bidded away
• Demand and supply model. The entry of new brands can be characterised asa shift to the right of the supply curve. With a given demand this wouldresult in a fall in price. Because of the recession in the early 1990s thedemand curve was moving to the left, causing an additional downwardinfluence on price.
The combined effect of these influences meant that competitive pressure in themarkets for branded consumer goods had increased greatly, and the incumbentswere confronted with a new situation where the profits associated with even astrong brand could not be relied upon.
Question 3: Discuss the three types of response.
There is plenty of scope for debate on the characterisation of the responses,but it is important to use a structure such as the process model to focus thediscussion.
Objectives
• Procter & Gamble started with the objective of maintaining market share inexisting brands.
• Pepsi intended to maintain the brand image.
• Unilever set out to integrate marketing with other functions.
Analysis
• Procter and Gamble’s analysis focused on identifying which of its 2300brand varieties were worth while. The company had been complacent inthe past, and had not seen the need to rationalise its portfolio until marketpressures forced it to come to a better understanding of which productsgenerated profits.
• Unilever’s analysis concentrated on internal systems and meeting customerneeds rather than on changes in the market place.
Strategy choice
• Procter & Gamble retrenched its product range, and adopted low costleadership in the remainder.
• Pepsi adopted a reactive defender stance, and reinforced its differentiation.
• Unilever concentrated on stability, rationalised its marketing function andfocused on specific markets.
Strategic Planning Edinburgh Business School A2/69
Appendix 2 / Answers to Review Questions and Case Analyses
Implementation
• Unilever was the only case where there was a significant internal reallocationof resources among functions. Unilever had taken a hard look at its valuechain, and had come to the conclusion that the separation of marketing asa primary operation was not working: marketing was being redefined asa support operation and integrated to some extent with development. Inthe other two cases the focus was on rationalisation of product lines andincreased differentiation to meet the challenge.
Module 8
Review Question Analysis
Nobody knows our business better than we do
In a competitive environment this is precisely what you have to watch out for.Changes in technology and consumer preferences are happening all the timeand there are few businesses which operate in a static environment. This relatesto a weakness in the analysis and control aspects of the process model.
The company would not survive without me
This is symptomatic of a centralised management style where there is notsufficient delegation of authority. A serious analysis of what is unique about aparticular manager’s knowledge and attributes will usually reveal that he is byno means irreplaceable. This is an issue of managerial perceptions.
We aren’t affected by competition
It is astonishing how many managers feel that they are insulated from competi-tive pressures and do not understand their competitive position. Posing simplequestions like ‘Why do we charge the prices we do?’, ‘Why don’t we have abigger market share?’, and ‘Why do we bother to control costs?’ will quicklyreveal the type of competitive pressures acting on the company.
Cutting overheads will ensure survival
It depends on how overheads are defined, and whether the company is cur-rently operating efficiently. For example, if marketing and research were cut themedium term impact could well be catastrophic. If overheads could be cut, theyshould already have been. This suggests a weakness in internal analysis.
Borrowing money is risky
This is probably due to a preference for using retained earnings rather than loansto finance investments and short term cash flow problems. A properly structuredportfolio is preferable to drifting into overdraft without any clear idea of why itis happening. Is undertaking an investment using borrowed money more riskythan using retained earnings? This indicates that management does not reallyunderstand the role of financial structure and issues such as gearing.
A2/70 Edinburgh Business School Strategic Planning
Appendix 2 / Answers to Review Questions and Case Analyses
Quality matters, not price
This myth makes an assumption about the price elasticity of demand, andthe responsiveness of sales to perceived differences in quality. The ReviewExercise in Module 5 dealing with Apple Computer demonstrates how facilethis statement is. An understanding of product positioning within the perceivedprice differentiation matrix is central to an analysis of competitive positioning.
We have all the information we need
This is a variation on the first myth, but it is even more dangerous because ittotally discounts the potential value of additional information. How you copewith a changing competitive environment without information on consumersand competitors is a mystery. This is an area where marginal analysis can bebrought to bear.
Case Analysis: The Body Shop International
Discuss The Body Shop’s success in terms of a structured approach to strategicplanning.
At first sight the Roddick approach to strategic management might appear to behaphazard. There are at least three interpretations of what happened.
1 Haphazard management is a successful formula for this type of business.Since there is no scientific evidence which proves that a haphazard approachcannot work this possibility cannot be dismissed. It is possible that oppor-tunities have been seized as they have arisen without any attention beingpaid to planning and control. The reactive approach can be successful for atime, and does not depend on a structured approach to the deployment ofresources.
2 Roddick may have just been lucky so far. It is also possible that Roddickhad the right idea at the right time, and has merely been carried along bythe success of her original product line.
3 Roddick’s public utterances are at variance with the way the company isactually run, and it has a clearly specified strategic plan.
Whichever view is taken of the reasons for The Body Shop’s success so far,the argument can be expressed in terms of a model of the strategic planningprocess. Typically the model incorporates:
• setting objectives;
• analysis and diagnosis;
• strategy choice;
• implementing and monitoring.
Strategic Planning Edinburgh Business School A2/71
Appendix 2 / Answers to Review Questions and Case Analyses
Setting Objectives
From the information provided, the objective of the company seems to be toexpand into markets in a logical sequence; the sequence starts with the majorcentres of population and then exploits smaller centres so long as these arepotentially viable. International markets have been tackled in a similar fashion.The less financially orientated objectives contained in ‘The Body Shop charter’add further dimensions in terms of a statement of objectives which individualscan relate to. There is nothing unusual about attempting to care for customers,and the image of a happy workforce is something which most companies wouldlike to project. In general terms the ‘charter’ as described does not conflict withthe notion of profit maximisation.
Analysis and Diagnosis
It is not possible to tell precisely what analysis has been carried out in arriving atThe Body Shop’s strategy, but the approach of targeting major population centresfirst, followed by towns with fewer than 50 000 people, suggests a structuredand analytical approach, and the concentration on ‘small ticket’ items stronglysuggests that a great deal of systematic analysis has been carried out.
An Environmental Threat and Opportunity Profile may have been constructedto identify the market opportunities, such as the potential for consecutive pene-tration of domestic markets and the potential for international expansion, and thethreats, such as the potential impact of the economic cycle. A Strategic Advan-tage Profile could have identified where the real strengths of the company lay,i.e. as a manufacturer and wholesaler rather than as a retailer.
Strategy Choice
If the company simply reacted to events as they unfolded, or relied on luck toensure success, it is unlikely that there would be so much emphasis placed onlong term growth prospects and how these could be achieved. In other words,the choice of strategy seems to have been explicit. The generic strategy seemsto have been differentiation using the brand name backed up by the powerfulimage of Roddick herself.
There is plenty of evidence of specific choices being made concerning thestrategic thrust, the segment of the market addressed, and the productive pro-cess. For example, The Body Shop is not a retailer, despite how the chain mightappear to customers. It could be argued that the marketing approach is designedto avoid areas of risk.
Implementing and Monitoring
The implementation of the strategy has been anything but haphazard. There isevidence of highly effective cost control, for example by using franchises to limitthe growth of overheads. Growth is not based on following developments inthe general economic environment but on exploiting new market opportunitieswhich are carefully identified in advance.
A2/72 Edinburgh Business School Strategic Planning
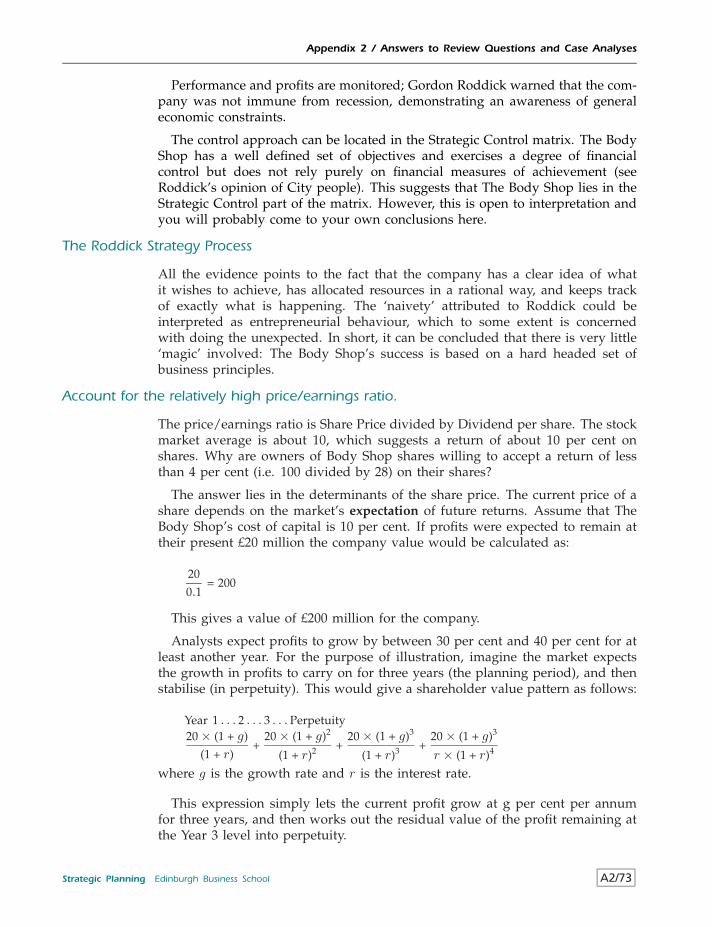
Appendix 2 / Answers to Review Questions and Case Analyses
Performance and profits are monitored; Gordon Roddick warned that the com-pany was not immune from recession, demonstrating an awareness of generaleconomic constraints.
The control approach can be located in the Strategic Control matrix. The BodyShop has a well defined set of objectives and exercises a degree of financialcontrol but does not rely purely on financial measures of achievement (seeRoddick’s opinion of City people). This suggests that The Body Shop lies in theStrategic Control part of the matrix. However, this is open to interpretation andyou will probably come to your own conclusions here.
The Roddick Strategy Process
All the evidence points to the fact that the company has a clear idea of whatit wishes to achieve, has allocated resources in a rational way, and keeps trackof exactly what is happening. The ‘naivety’ attributed to Roddick could beinterpreted as entrepreneurial behaviour, which to some extent is concernedwith doing the unexpected. In short, it can be concluded that there is very little‘magic’ involved: The Body Shop’s success is based on a hard headed set ofbusiness principles.
Account for the relatively high price/earnings ratio.
The price/earnings ratio is Share Price divided by Dividend per share. The stockmarket average is about 10, which suggests a return of about 10 per cent onshares. Why are owners of Body Shop shares willing to accept a return of lessthan 4 per cent (i.e. 100 divided by 28) on their shares?
The answer lies in the determinants of the share price. The current price of ashare depends on the market’s expectation of future returns. Assume that TheBody Shop’s cost of capital is 10 per cent. If profits were expected to remain attheir present £20 million the company value would be calculated as:
20
0.1= 200
This gives a value of £200 million for the company.
Analysts expect profits to grow by between 30 per cent and 40 per cent for atleast another year. For the purpose of illustration, imagine the market expectsthe growth in profits to carry on for three years (the planning period), and thenstabilise (in perpetuity). This would give a shareholder value pattern as follows:
Year 1 . . . 2 . . . 3 . . . Perpetuity20× (1 + g)
(1 + r)+
20× (1 + g)2
(1 + r)2 +20× (1 + g)3
(1 + r)3 +20× (1 + g)3
r × (1 + r)4
where g is the growth rate and r is the interest rate.
This expression simply lets the current profit grow at g per cent per annumfor three years, and then works out the residual value of the profit remaining atthe Year 3 level into perpetuity.
Strategic Planning Edinburgh Business School A2/73
Appendix 2 / Answers to Review Questions and Case Analyses
Assuming an interest rate of 10 per cent, a growth rate of 30 per cent perannum produces a current company value of £385 million, and a growth rate of40 per cent per annum gives a company value of £474 million, which is close tothe current figure quoted in the article.
It is now clear that the high price earnings/ratio depends entirely on themarket’s expectation of high profit growth rates. Are these likely to continue?The Body Shop has had a history of significant profit increases in the past, butprofit forecasts have recently been marginally downgraded.
There are arguments both for and against expecting further growth in profitsbased on the characteristics of the goods sold, their income elasticity, the con-tinued prospects for expanding markets internationally and the possibility ofcompetition and changing tastes.
The shares are really only ‘screaming cheap’ if the market considers that thegrowth rate will be higher than 40 per cent, and/or expects this growth tocontinue beyond the planning period of three years.
This analysis reveals a potential weakness in the company’s valuation. If theprospects for further profit growth were for any reason removed, for examplebecause of the entry of a major competitor or a change in consumer preferences,the share price would probably fall by half immediately, i.e. the company valuewould fall towards £200 million.
Postscript
In September 1992 it was announced that the half yearly profits for The BodyShop would be £8 million, compared to £9 million for the same period in 1991.The growth in profits had ground to a halt, and the market at that point revisedits estimate for future profit growth. The share price immediately fell by 40 percent, which is close to the prediction made above using the information availableone year previously. The Roddicks tried to maintain expectations by pointing tothe continuing expansion of shops abroad, and arguing that the recession wasmuch more pronounced in the UK than in other countries. However, until aresumption of profit growth occurs it is unlikely that the share price will recover.After the share price fall the price/earnings ratio stood at about 20, which wassimilar to the performance of other top stores such as Marks & Spencer. There istherefore no question of The Body Shop being a financial disaster; it was reallyjust a question of when the growth prospects would diminish and bring theshare price back into line with other successful companies.
Case Analysis: Daimler in a Spin
Question 1: Set out the strategic rationale for Mr Reuter’s programme of diversification,and the reasons for its failure.
The strategic rationale was to diversify to become a major international player;Mr Reuter felt that Daimler could not compete with the major US and Japanesecompanies with its current scale of operations. Such a programme of expansion
A2/74 Edinburgh Business School Strategic Planning
Appendix 2 / Answers to Review Questions and Case Analyses
could only be achieved by acquisition, as internal growth in new markets wouldnot be possible on the scale he desired. The acquisition rationale was originallybased on the synergy, or economies of scope, which could be generated byan ‘integrated technology group’ loosely based round the transport industry,but some of the acquisitions (such as white goods) were unrelated to the corebusiness. There may have been a desire to diversify risk, but this was notexplicitly part of the strategy.
The strategic mistakes Mr Reuter made can be identified within the structureof the process model.
Objectives
Historically the interests of German shareholders had not been accorded a highpriority, and this led to the principal agent problem: Mr Reuter’s objective wasto develop his strategic objective and not to maximise profits, and this meantthat he did not separate the means (the strategy) from the ends (value creation).Consequently, the signals from capital markets (in the form of share prices) wereignored, and the programme of expansion continued despite the fact that it wasnot adding value.
Analysis
Mr Reuter made mistakes at three levels. First, at the macro level, he expandedinto defence industries at a time when the cold war was winding down. Itwould be unfair to suggest that Mr Reuter should have been able to predictwhen the cold war would end, but the events during the late 1980s should havebeen taken into account. Second, at the market level, Mr Reuter did not seemto appreciate that many of the products added to the portfolio, for exampleby its purchase of AEG, were not dominant enough to add to the company’scompetitive advantage. This was particularly important at a time when thecar making business itself was coming under increasing competitive pressure.Taken together these factors suggest that the strategy choice was not foundedon a strong analysis of the environment. Third, at the company level he did notappear to have identified the competencies upon which diversification oughtto be based. He was unable to create value by utilising resources and routinescurrently residing within the company, and he did not appear to be awareof how far the diversification process was taking the company from its coreactivities.
Choice
The intended corporate strategy was expansion by related diversification, butin the end a significant part of the expansion was unrelated. This meant thatthe company was venturing into markets where markets and products wereunfamiliar; the clustering of products in the ‘unfamiliar’ sector of the famil-iarity matrix was clearly a problem. The notion that acquisitions should havea strategic fit with Daimler became less and less important as the acquisitionsprogramme progressed.
Strategic Planning Edinburgh Business School A2/75
Appendix 2 / Answers to Review Questions and Case Analyses
Implementation and control
The problem of co-ordinating many businesses was dealt with by a decentralisedstructure; this led to a lack of adequate control, and with this structure it isdifficult to see how the potential synergies or economies of scope could berealised. There appeared to be no contingency planning, and the end of thecold war caused the company insurmountable difficulties. There also seemed tohave been little account taken of the problems of integrating different corporatecultures; given the diverse nature of the acquisitions programme Daimler hadto accommodate a variety of management styles.
Daimler is in fact an example of how the potential advantages from parentingwere not realised:
• The individual companies might have performed better if they were notsubject to interference from the corporate centre.
• Linkages among companies to foster synergy were not achieved.
• There was little scope for provision of common services given the diversityof the portfolio and the lack of vertical integration.
• The corporate centre was inefficient in developing a manageable portfolio.
It could be argued that Mr Reuter was simply unfortunate, and was caughtout by unforeseeable events. However, there were weaknesses in all stages ofthe strategic process: Mr Reuter could be accused of wishing to expand Daimlerat all costs, paying little attention to the macro and competitive environments,being haphazard in his choice of strategy, and failing to control the monster hehad created.
Question 2: Compare the strategic approaches of Mr Reuter and Mr Schrempp.
In the wide sense they were both corporate expansionists who ended up divest-ing and retrenching. Some elements of the process model can be used to focuson their strategic approaches.
Objectives and strategists
It is tempting to categorise Mr Reuter as a prospector and Mr Schrempp as adefender, but in fact their behaviour was largely dictated by the circumstancesin which they found themselves. Mr Reuter was a prospector when he was notsubject to serious constraint up to about 1994, when he became a defender; hechanged from being proactive to reactive. Mr Schrempp started as a prospectorwhen he was in charge of DASA, but by the time he took over Daimler hehad become an analyser and defender. Mr Schrempp started off proactivelyby explicitly setting the objective as profit maximisation, and for the first timeadmitted that Daimler was making a loss.
Choice
As discussed above, Mr Reuter followed a corporate strategy of expansion bydiversification, some of which was unrelated, through acquisition. He then
A2/76 Edinburgh Business School Strategic Planning
Appendix 2 / Answers to Review Questions and Case Analyses
retrenched by selling off the more obvious of the unrelated activities – the AEGwhite goods business. Mr Schrempp attempted to identify the core business andset about divesting large parts of the business. But he still wished to expandinternationally, this time through the joint venture in China. An interestingaspect of the Daimler experience is that the German economy had been insulatedagainst the type of takeover which had been common in the UK and US becauseof the way the capital market worked; thus in the space of 10 years or so Daimlerwent through stages of corporate strategy which had taken several decades towork out in other countries.
Daimler set out on the quest for growth using a devolved divisional structure,but it then ran into problems with its portfolio; this led to the recognitionthat the company should get back to its core activities, and this in turn ledto restructuring. Daimler had to define its core business, but the notion of the‘integrated technology group’ was quite nebulous. The focus then turned tothe creation of value by managing and closely monitoring the portfolio fromthe centre. So another interpretation is that Mr Reuter and Mr Schrempp werecarried along by economic and organisational forces over which they had littlecontrol.
Implementation and control
Their approach to management control was different: Mr Reuter simply setguidelines for the main businesses, while Mr Schrempp set up a tight financialcontrol system. He also introduced a hurdle rate below which a business wouldbe divested. In terms of the planning and control matrix, Mr Reuter’s approachlay in the Strategic Planning sector, while Mr Schrempp had moved into theFinancial Control sector.
This represented a significant change in how the company was to be run, andno doubt it would raise many issues relating to management culture.
Many commentators had asserted that Mr Schrempp was a good choice tolead Daimler, despite his failures in the past. However, this is open to question,and it is an important issue because of the impact which the CEO has onthe direction of the company. Both strategists started off as prospectors whofollowed an expansionist course regardless of the costs, but it was claimedthat Mr Schrempp had learned his lesson and would therefore be able to leadDaimler into profit. It does not require a great deal of imagination to impose tightfinancial controls on an organisation; but Mr Schrempp had not demonstratedmuch capacity to learn in the past: he failed to see the problems associated withFokker and subsequently tried to expand the defence business after the end ofthe cold war when the market was shrinking. It is one thing to learn a hardlesson; it is quite another to demonstrate the entrepreneurial vision which ahighly complex and ailing corporation requires.
Case 3 Analysis: Eurotunnel – a financial hole in the ground
Strategic Planning Edinburgh Business School A2/77
Appendix 2 / Answers to Review Questions and Case Analyses
Question 1: Explain the situation which arose in 1996 using strategy models.
Given the long history of the project, the scrutiny to which it had been subjectedin the media, the importance of Eurotunnel to both Britain and France and thehuge levels of investment, at first sight it seems inexplicable that such losseswould be incurred and that there was little prospect for improvement. Butworking through the process model reveals that the strategy had significantflaws.
Objectives
These were initially framed in terms of building a tunnel rather than maximisingshareholder value. Issues of national pride were involved, with the result thatcost overruns were accepted as inevitable.
Strategist
Mr Morton was capable of maintaining momentum in spite of the constructionproblems and the financial prospects; he was able to keep investors’ confidenceby his sheer force of personality beyond the point which the investment madesense. In fact, there was a significant principal agent problem, in that he pursuedthe tunnel building objective without reference to shareholders. Mr Morton wascertainly a prospector in the sense that he got things done; but an analyserapproach was required to consider the implications of what was being achieved.
The culture of Eurotunnel could be classified as power type, where not onlydid Mr Morton dominate decision making but he was personally responsiblefor ensuring that they were implemented. In the power culture it is likely thatany plan will reflect the interests of the dominant leader, and in the followingdiscussion of the elements of the process model it will emerge that no real notionof strategic planning existed within the organisation.
Analysis
The outcome was a combination of over-estimated revenues and under-estimatedcosts; this suggests that the analysis was inadequate, and this is consistent withthe observations made about Mr Morton above. The primary defect in theanalysis can be seen by considering the basic model of cash flow generation:
Market size × Market share × Price
The early estimates were that Eurotunnel would quickly capture 33 per centmarket share (less on the freight trade). Given this, the estimates of marketsize and price were crucial if a reasonably accurate prediction of cash flowswere to be made. The projected growth in price was well out of line, withferry prices falling by 2.5 per cent per year in real terms over a 10 year periodinstead of remaining constant. For sensitivity analysis assume that the growthin the market had been overestimated by a similar amount over the 10 years;the result is that the market turned out to be about 60 per cent of the size (inrevenue terms) originally anticipated. On the cost side, the operational costs
A2/78 Edinburgh Business School Strategic Planning
Appendix 2 / Answers to Review Questions and Case Analyses
could be predicted reasonably well, but it is not possible to programme capacityso closely to demand as the ferries can, therefore until Eurotunnel can reachcapacity utilisation it is likely to suffer relatively high unit cost. The interestcosts were due to the unexpected level of investment. It was well known fromprevious cases (Concorde, motorway construction etc) that cost overruns ontechnologically based projects were highly likely, but the project was undertakenwith a lack of foresight based on relevant experience.
These mistakes were closely related to the competitive position of Eurotunnel,as revealed by an examination of the five forces.
• Bargaining power of suppliers: HIGH: the contractors had a strong bar-gaining position and which contributed to the overruns and cost escalation.The only bargaining counter which Morton had was to withhold payment,but this would have resulted in no tunnel being built.
• Bargaining power of buyers: HIGH: there was plenty of choice of ferriesand hovercraft and it was relatively easy to switch among them.
• Threat of new entrants: LOW: as a new entrant to the market Eurotunnelcomprised a threat to the incumbents; however, they had plenty of timein which to work out and implement a competitive response. The airlineswere also competing for part of the cross channel market, and had reducedtheir prices even more than the ferry operators over the decade.
• Industry rivalry: HIGH: Eurotunnel did not turn out to be a monopoly inthe short run. Instead it was a relatively mature oligopolistic market whichplunged into a price war; given the slow growth in market size it was azero sum game in the short run. The application of supply and demandanalysis leads to the conclusion that a significant increase in supply in amature, competitive market would be expected to lead to a fall in price.The ferry operators’ long experience in the market and high market sharehad conferred a competitive advantage in terms of first mover advantage.Furthermore, they adopted a proactive competitive response by differenti-ating their products (by improving the quality of the ferry crossing) andreducing the price. The mistake made by Eurotunnel was not to predict thatthe ferries would take such action, and as a result had an over-optimisticexpectation of initial market impact.
• Threat of substitutes: HIGH: while the product is homogeneous in thesense that it is simply a journey, the characteristics of Eurotunnel and theferries mean that to some extent they are substitutes. For example, thedifferentiating tactics of the ferries had converted the travel experience tobeing part of the holiday.
The characteristics of cross channel travel include price, speed, reliability,comfort and additional services; thus differentiation is not only based on speed,which was Eurotunnel’s single selling point. Since Eurotunnel was chargingabout the same as the ferries (with fewer special offers), for many travellersEurotunnel would lie further down the perceived price differentiation matrix
Strategic Planning Edinburgh Business School A2/79
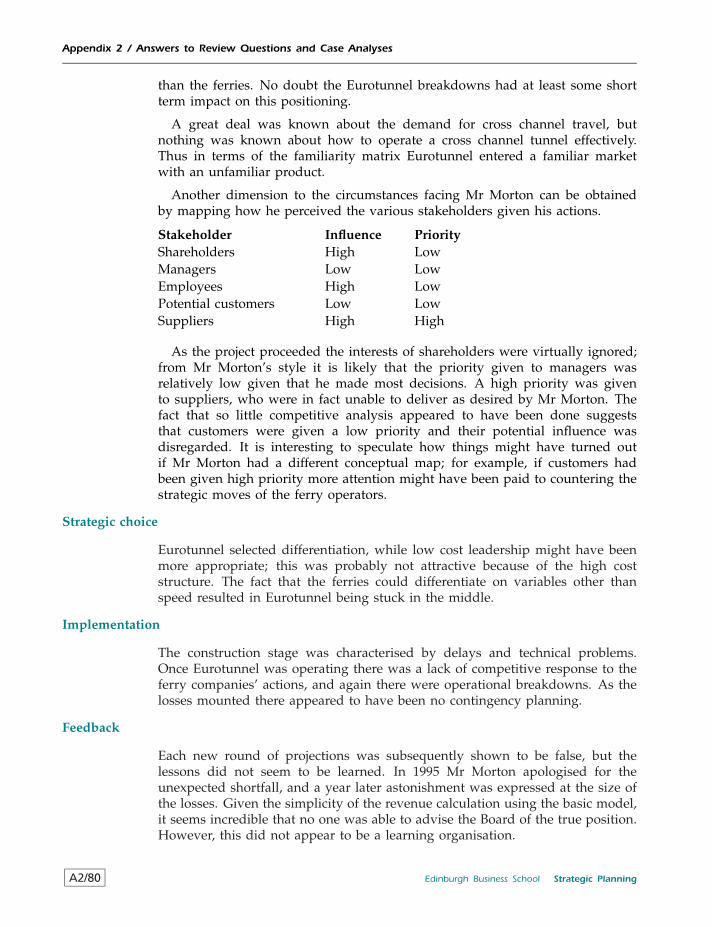
Appendix 2 / Answers to Review Questions and Case Analyses
than the ferries. No doubt the Eurotunnel breakdowns had at least some shortterm impact on this positioning.
A great deal was known about the demand for cross channel travel, butnothing was known about how to operate a cross channel tunnel effectively.Thus in terms of the familiarity matrix Eurotunnel entered a familiar marketwith an unfamiliar product.
Another dimension to the circumstances facing Mr Morton can be obtainedby mapping how he perceived the various stakeholders given his actions.
Stakeholder Influence PriorityShareholders High LowManagers Low LowEmployees High LowPotential customers Low LowSuppliers High High
As the project proceeded the interests of shareholders were virtually ignored;from Mr Morton’s style it is likely that the priority given to managers wasrelatively low given that he made most decisions. A high priority was givento suppliers, who were in fact unable to deliver as desired by Mr Morton. Thefact that so little competitive analysis appeared to have been done suggeststhat customers were given a low priority and their potential influence wasdisregarded. It is interesting to speculate how things might have turned outif Mr Morton had a different conceptual map; for example, if customers hadbeen given high priority more attention might have been paid to countering thestrategic moves of the ferry operators.
Strategic choice
Eurotunnel selected differentiation, while low cost leadership might have beenmore appropriate; this was probably not attractive because of the high coststructure. The fact that the ferries could differentiate on variables other thanspeed resulted in Eurotunnel being stuck in the middle.
Implementation
The construction stage was characterised by delays and technical problems.Once Eurotunnel was operating there was a lack of competitive response to theferry companies’ actions, and again there were operational breakdowns. As thelosses mounted there appeared to have been no contingency planning.
Feedback
Each new round of projections was subsequently shown to be false, but thelessons did not seem to be learned. In 1995 Mr Morton apologised for theunexpected shortfall, and a year later astonishment was expressed at the size ofthe losses. Given the simplicity of the revenue calculation using the basic model,it seems incredible that no one was able to advise the Board of the true position.However, this did not appear to be a learning organisation.
A2/80 Edinburgh Business School Strategic Planning
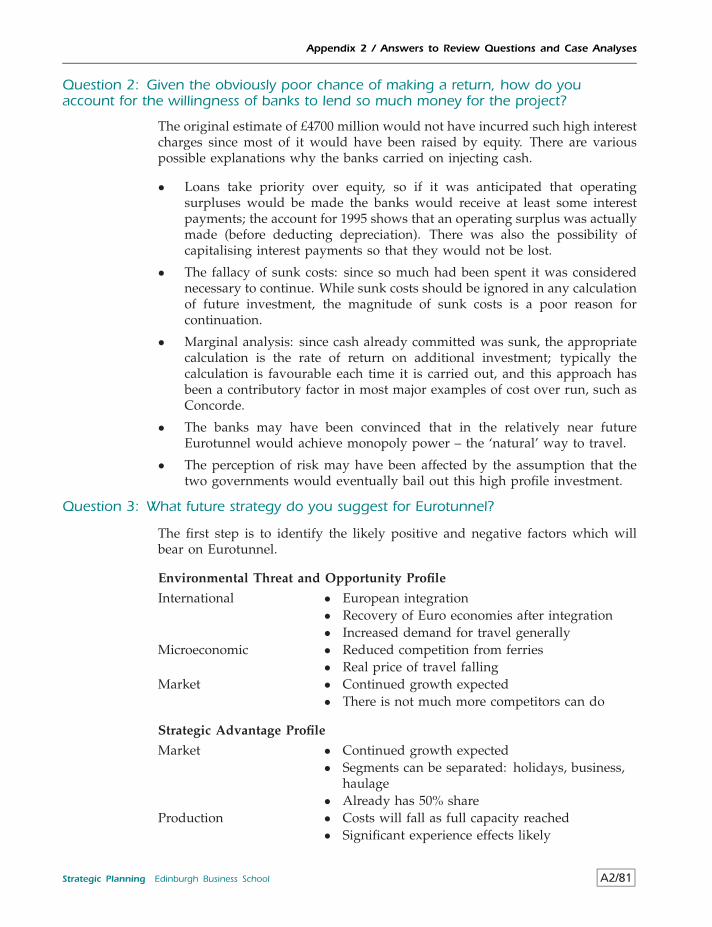
Appendix 2 / Answers to Review Questions and Case Analyses
Question 2: Given the obviously poor chance of making a return, how do youaccount for the willingness of banks to lend so much money for the project?
The original estimate of £4700 million would not have incurred such high interestcharges since most of it would have been raised by equity. There are variouspossible explanations why the banks carried on injecting cash.
• Loans take priority over equity, so if it was anticipated that operatingsurpluses would be made the banks would receive at least some interestpayments; the account for 1995 shows that an operating surplus was actuallymade (before deducting depreciation). There was also the possibility ofcapitalising interest payments so that they would not be lost.
• The fallacy of sunk costs: since so much had been spent it was considerednecessary to continue. While sunk costs should be ignored in any calculationof future investment, the magnitude of sunk costs is a poor reason forcontinuation.
• Marginal analysis: since cash already committed was sunk, the appropriatecalculation is the rate of return on additional investment; typically thecalculation is favourable each time it is carried out, and this approach hasbeen a contributory factor in most major examples of cost over run, such asConcorde.
• The banks may have been convinced that in the relatively near futureEurotunnel would achieve monopoly power – the ‘natural’ way to travel.
• The perception of risk may have been affected by the assumption that thetwo governments would eventually bail out this high profile investment.
Question 3: What future strategy do you suggest for Eurotunnel?
The first step is to identify the likely positive and negative factors which willbear on Eurotunnel.
Environmental Threat and Opportunity Profile
International • European integration• Recovery of Euro economies after integration• Increased demand for travel generally
Microeconomic • Reduced competition from ferries• Real price of travel falling
Market • Continued growth expected• There is not much more competitors can do
Strategic Advantage Profile
Market • Continued growth expected• Segments can be separated: holidays, business,
haulage• Already has 50% share
Production • Costs will fall as full capacity reached• Significant experience effects likely
Strategic Planning Edinburgh Business School A2/81
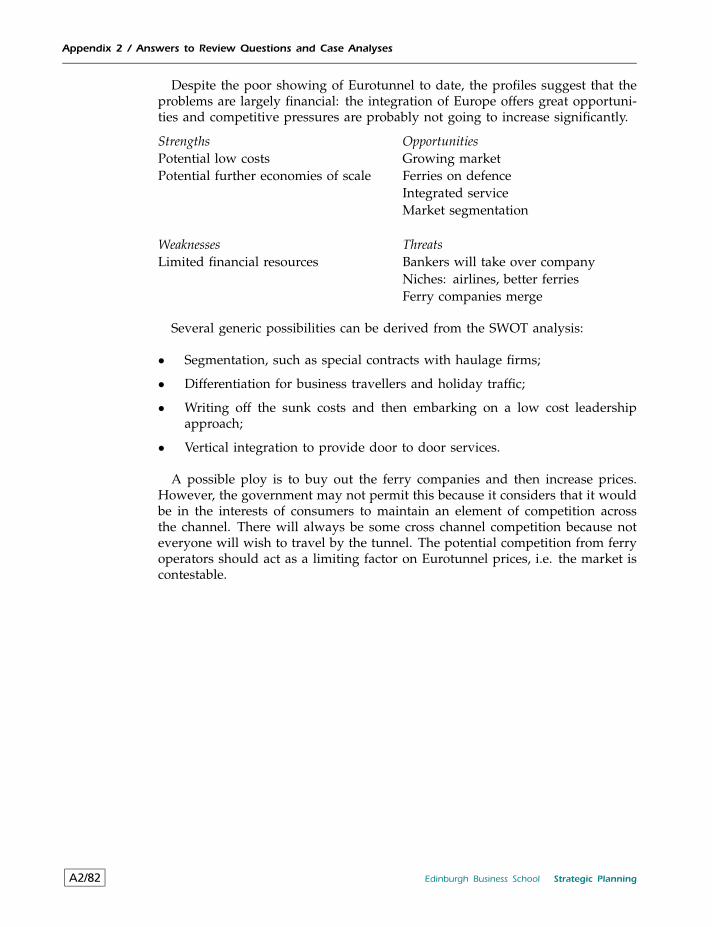
Appendix 2 / Answers to Review Questions and Case Analyses
Despite the poor showing of Eurotunnel to date, the profiles suggest that theproblems are largely financial: the integration of Europe offers great opportuni-ties and competitive pressures are probably not going to increase significantly.
Strengths OpportunitiesPotential low costs Growing marketPotential further economies of scale Ferries on defence
Integrated serviceMarket segmentation
Weaknesses ThreatsLimited financial resources Bankers will take over company
Niches: airlines, better ferriesFerry companies merge
Several generic possibilities can be derived from the SWOT analysis:
• Segmentation, such as special contracts with haulage firms;
• Differentiation for business travellers and holiday traffic;
• Writing off the sunk costs and then embarking on a low cost leadershipapproach;
• Vertical integration to provide door to door services.
A possible ploy is to buy out the ferry companies and then increase prices.However, the government may not permit this because it considers that it wouldbe in the interests of consumers to maintain an element of competition acrossthe channel. There will always be some cross channel competition because noteveryone will wish to travel by the tunnel. The potential competition from ferryoperators should act as a limiting factor on Eurotunnel prices, i.e. the market iscontestable.
A2/82 Edinburgh Business School Strategic Planning
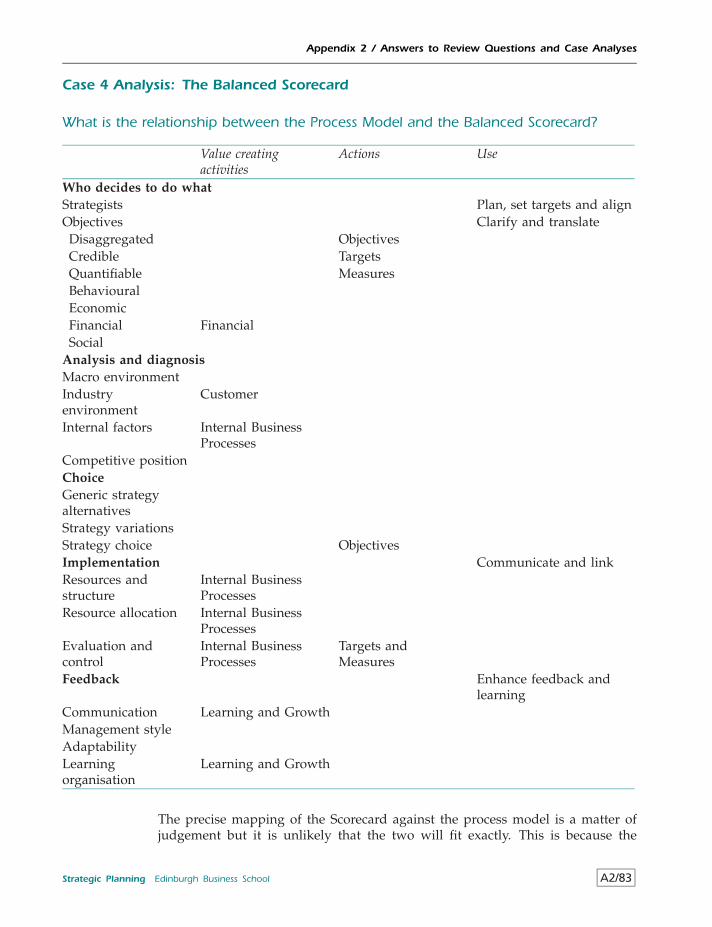
Appendix 2 / Answers to Review Questions and Case Analyses
Case 4 Analysis: The Balanced Scorecard
What is the relationship between the Process Model and the Balanced Scorecard?
Value creatingactivities
Actions Use
Who decides to do whatStrategists Plan, set targets and alignObjectives Clarify and translateDisaggregated ObjectivesCredible TargetsQuantifiable MeasuresBehaviouralEconomicFinancial FinancialSocial
Analysis and diagnosisMacro environmentIndustryenvironment
Customer
Internal factors Internal BusinessProcesses
Competitive positionChoiceGeneric strategyalternativesStrategy variationsStrategy choice ObjectivesImplementation Communicate and linkResources andstructure
Internal BusinessProcesses
Resource allocation Internal BusinessProcesses
Evaluation andcontrol
Internal BusinessProcesses
Targets andMeasures
Feedback Enhance feedback andlearning
Communication Learning and GrowthManagement styleAdaptabilityLearningorganisation
Learning and Growth
The precise mapping of the Scorecard against the process model is a matter ofjudgement but it is unlikely that the two will fit exactly. This is because the
Strategic Planning Edinburgh Business School A2/83
Appendix 2 / Answers to Review Questions and Case Analyses
Scorecard is a top-down concept and takes the SBU objectives as given andfocuses on translating these into disaggregated and measurable objectives whichcan be acted on by the individuals working within the SBU. The Scorecardis not concerned with the formulation of the mission and objectives of theorganisation as a whole, and there is therefore little emphasis on macro economicenvironmental scanning; rather, the focus is on the market and the customer andthe internal actions which must be taken to ensure that a competitive advantagein service provision is achieved.
The Scorecard places a great deal of emphasis on implementation and thedevelopment of management systems which are aligned with organisationalobjectives. In that respect it touches on many aspects of the strategic process,and can contribute significantly to eliminating weaknesses within the processin the areas where it is particularly relevant. But it is essentially an inwardlooking technique which is designed to make the organisation more effective atwhat it is doing, rather than being concerned with the identification of marketopportunities and long term strategic focus.
A major criticism of the Scorecard is that it takes the world largely as given andattempts to optimise the allocation of resources accordingly and consequentlyit introduces a degree of inflexibility. Organisations which are faced with rapidchange and fierce competition may find that the Scorecard inhibits fast strategicresponse. The major difference between the Balanced Scorecard and the processmodel is that it is prescriptive in nature while the process model is concernedwith strategy making as a whole in a dynamic setting. The Balanced Scorecardmay be a highly effective tool for the Implementation stage of the process modelin certain circumstances, but it is the job of the strategist to assess its relevanceas the competitive environment changes.
Case 5 Analysis: Revisit An International Romance that Failed: British Telecomand MCI
Assess BT’s strategic process compared with WorldCom’s in relation to the takeoverattempts.
Objectives
BT wished to enter the US market with the intention of developing one stopservices for multi-national companies and in this respect had a narrow focus.However, MCI appeared to have ambitions in all three market segments andhad a wider focus. It is likely that the objectives of the two companies were notaligned, which in turn would lead to conflicts of interest.
WorldCom had already decided to focus on carrying data for business calls andhad concentrated on building its infrastructure to support this. WorldCom hada clear view of how it would use MCI’s brand name and billing systems.
Strategists
BT and MCI were headed by two powerful characters and it was not clear whowas ultimately going to be in charge; the outcome would have a significant
A2/84 Edinburgh Business School Strategic Planning
Appendix 2 / Answers to Review Questions and Case Analyses
impact on which set of objectives was pursued. BT did not have a track recordin acquisitions and had not long emerged from being a monopoly. On the otherhand WorldCom had built up a reputation for success in generating value fromacquisitions.
Overall Who Decides to Do What
The fact that questions can be raised about the alignment of business objectivesbetween BT and MCI and the possible differences in view between the two CEOsraises doubts on the strength of this part of the BT strategic process. WorldComwas pursuing a strategy in which it already had experience.
Macro environment
The BT strategy of international expansion was intended to transfer its competi-tive advantage from Britain to the US. However, BT’s success in the UK wasnot based on meeting competitive forces but was primarily based on makingan existing monopoly more efficient. BT’s competitive advantage in the UK wasbased on country specific rather than company specific factors. WorldCom wasready to take advantage of deregulation in a market in which it was alreadyhighly competitive. The basis of competitive advantage for the two companieswas totally different, and BT did not recognise that it would have difficultytransferring competitive advantage to the highly competitive market profiled.
Industry environment
A number of models can be applied to assess the differences in the twoapproaches.
Product life cycle
– The corporate segment was on the growth stage while both long distanceand local segments appeared to be in the mature stage. Different strategicapproaches are required at different stages in the product life cycle, andit was not clear that BT recognised this. WorldCom had a clearer viewof competitive conditions and did not attempt to break into these marketsusing conventional technology but focused on gaining its foothold throughthe internet.
Portfolio
– MCI’s existing markets could be positioned in the cash cow sector, butwere coming under attack from the Baby Bells. The corporate segment hadthe characteristics of a question mark and therefore would require a greatdeal of investment before significant returns could be generated. WorldComtackled the segments as rising stars and acted accordingly.
Relative price and differentiation
– Telephone services are largely homogeneous, and it is not clear how ser-vices could be differentiated in any of the segments. Consequently successdepended on being able to price lower than competitors, and there was noreason to conclude that BT and MCI could adopt the role of cost leaders.
Strategic Planning Edinburgh Business School A2/85
Appendix 2 / Answers to Review Questions and Case Analyses
WorldCom had already demonstrated the ability to cut costs, and its inten-tion was to cut costs by up to $5 billion; it might also be able to differentiateusing the internet and coupling telephony with a range of other services.
Internal factors
Competence
– It was not clear what unique competence BT was bringing to the US.WorldCom had already demonstrated competence in change managementand had a track record in the industry.
Value chain
– There was no obvious fit between the value chains of BT and MCI andno clear linkages which would lead to enhanced value creation; there wasno obvious match of skills in the two organisations. WorldCom seemedconfident that the value chains were compatible and could lead to costsavings of $2.5 to 5$ billion.
Economies of scale
– It was not clear that the combination of BT and MCI would lead to lowerunit cost. On the other hand, WorldCom appeared to have thought throughthose areas where costs could be reduced by combining activities.
Competitive position
BT seemed to be intent on becoming a major international player in the telecomsmarket but did not seem to be clear on what form this business would ultimatelytake. It was not clear how the joint company would be positioned. WorldComappeared to be focusing on innovative approaches to the market.
Overall analysis and diagnosis
BT appeared to lack an understanding of the differences between the US andBritish markets and seemed unclear on how it would generate competitiveadvantage. The fact that the fit between BT and MCI was suspect suggests thatthis part of the strategic process was also weak. WorldCom was specific abouthow it would integrate the two organisations and the implications for the jointvalue chain.
Choice
BT undertook a generic corporate strategy of international expansion by acqui-sition. WorldCom focused on national expansion by acquisition.
At the business level BT was a low cost leader in Britain, and attempted totransfer that to US. However, low cost in Britain might not translate to low costin the US, while MCI did not appear to be a lean producer.
A significant difference between BT and WorldCom was in the process of makingchoice. While BT appeared to have searched for a weak target WorldCom had arecord of searching for an appropriate strategic fit.
A2/86 Edinburgh Business School Strategic Planning
Appendix 2 / Answers to Review Questions and Case Analyses
Overall Choice
In the analysis section it was concluded that BT was uncertain about the basisfor its competitive advantage and this is consistent with a choice process whichlacked focus.
Implementation
Resources and structure
There were potential culture problems in integrating major US and Britishcompanies. WorldCom already had experience in dealing with these successfullyin the US.
Resource allocation
WorldCom had a plan for more efficient use of resources which would result incost savings, but BT and MCI did not clarify how their joint resources would beput to better use.
Evaluation and control
BT did not know that MCI was heading for losses. This demonstrated that therewas little control at this early stage. It would appear that BT was in the lowfinancial control and low planning sector of the planning and control matrix.This is not a good place to be because it suggests a lack of both strategic planningand financial controls. WorldCom appeared to be strong in both financial andplanning aspects and was thus in a different part of the planning and controlmatrix.
Overall implementation
Even before it began the BT MCI partnership had no clear direction for imple-mentation, and something would have to be done to introduce a proper controlsystem. On the other hand implementation was one of WorldCom’s core com-petences.
Overall strategic process
It is an open question whether the BT MCI merger could have been successfulgiven the weaknesses in the process which can be inferred even from this briefaccount. At the time of the take over battle it looked like WorldCom had a muchmore robust strategic process.
What are the strategic prospects for the new WorldCom/MCI company?
The strategic future of the WorldCom MCI company will be based on relativelystrong elements in the combined value chain. Some of these can be inferredfrom the case.
Support Activities
Human resource management: record of aligning management in diverse com-panies.
Technology development: total fibre optic coverage, satellite coverage andinternet developments.
Procurement: had already purchased MFS, Compuserve and America Online.
Strategic Planning Edinburgh Business School A2/87
Appendix 2 / Answers to Review Questions and Case Analyses
Primary activities
Logistics: integrated billing.
Operations: set to take advantage of potential cost savings, based on synergy,shared resources etc.
Marketing: intended to capitalise on MCI’s brand name.
The evidence suggests that WorldCom had a clearer notion than BT how thelinkages between the different value chains could be capitalised on.
A SWOT analysis reveals alignments between company strengths and marketopportunities, but there are significant threats which are aligned with someweaknesses.
Strengths
Innovative and dynamic
Largest internet services provider in the world
MCI’s brand name and expertise
Skill in realigning companies
Fibre optic and satellite coverage
Opportunities
Take local business from Baby Bells
Growing internet market
Weaknesses
Probably highly geared after takeovers
MCI experiencing low growth and losses.
Threats
Other global alliances
Mature local market
Falling prices
A possible generic choice is to exploit first mover advantage to achieve lowcost leadership in a market with undifferentiated products. The problem is howto differentiate in a manner which cannot be easily imitated, and this might beachieved by using innovative Internet technology. The alignment of threats andweaknesses indicates that WorldCom will be subject to long term competitivepressures, particularly in global markets. If business does not grow as fast ashoped, and prices continue to fall, WorldCome could run into cash problems.
A2/88 Edinburgh Business School Strategic Planning
Appendix 3
Practice Final Examinations
Contents
Some Tips on Analysing Cases and Question A3/1
Practice Final Examination 1 A3/4
Practice Final Examination 2 A3/9
This section contains two practice final examinations which are indicative of thetype and level of material which appears in the Final MBA degree examination.The duration of the examination is three hours. Within the time of three hoursyou may allocate their time among sections as you see fit. There is no choice inthe selection of questions to be answered.
For each question a guide is provided in Appendix 4 which will allow youto assess your performance. The practice examination serves two purposes: totest understanding of the course and to provide information on the standardsrequired to pass the University Final degree examination.
Some Tips on Analysing Cases and Question
In business three types of strategic problem are typically encountered and theseare reflected in the composition of the examination.
1 Detailed internal and environmental information on a particular company,together with some indication of current thinking in the company.
2 A story of a company typically spanning several years in which there is lessdetailed information on the company but more information on changingcompetitive circumstances.
3 You are asked a question about strategic ideas.
These broad categories are encountered again and again in real life. Examplesof each are as follows.
A company is carrying out a strategic review on the appointment of a newCEO and is attempting to determine why it is in its current position andwhat it should do in the future. Members of the management team expressdifferent points of view on how to interpret the present position and dealwith perceived problems.
Strategic Planning Edinburgh Business School A3/1
Appendix 3 / Practice Final Examinations
A company has failed to capitalise on previous competitive advantage, andfrom being an industry leader has lost market share and is no longer highlyprofitable.
The CEO asks for advice on how risk should be incorporated into strategicdecision making.
While there are no hard and fast rules on how to tackle each type of question,here are a few general pointers.
Numerical cases
The data typically refer to one or two years of accounting information, somedata on internal operations and market information on sales, market size and soon. In real life much more data would be available, but the principles involvedare the same. Before addressing the specific question asked it is necessary todetermine what the data are telling us. This then raises the basic question: wheredo I start? The answer is: anywhere! Here are two approaches.
1 Start from the inside of the company and work out and ‘follow yournose’. For example, start with assessing if the company is profitable overallbecause this both reveals overall levels of efficiency and identifies potentialconstraints on future action. Consider the operating surpluses, both beforeand after overheads, and the cash flow; look at the capital tied up in thecompany and work out ratios such as return on investment and gearing.Then look at the individual products and start thinking about applyingsome models. For example, where the products are located on the BCGmatrix, whether they are related and the prospects for product life cycles.Then consider any information about external events, such as new entrants;this may be the opportunity to apply the five forces model, or identifymarket structures and you can certainly consider drawing up profiles anddeveloping a SWOT framework. This provides you with the basis for inter-preting the product costs and revenues. You are then in a position to answerjust about any question.
2 Work through the process model. Start by asking what business the com-pany is in and where it sees its markets and the approach of the decisionmakers. Then analyse the environment, the industry and internal operations(this was the starting point for the first approach). This takes you on toconsidering the choices made in the past and the choices which might bemade in the future. Some of the analysis will be relevant to assessing howstrategy has been implemented and finally there might be some informa-tion on how the company has reacted to changes in the past. This thoughtprocess will result in a similar set of analyses to the first approach, but it israther more structured and you can use the augmented process model as arough check list for ideas.
A3/2 Edinburgh Business School Strategic Planning
Appendix 3 / Practice Final Examinations
Case questions
The case is typically a two to three page narrative and may be supplementedwith a few tables and diagrams. As in the numerical case the there is lessinformation available than in real life, but again the principles are the same.While one or two of the questions in the case may focus on specific aspectsof the story, the real challenge is to rationalise what happened using strategymodels. Once more this comes down to the basic issue: where do I start? Thereare several approaches of which two are as follows.
1 Ignore the question and ask what has really been happening. This can bedone by following the steps in the process model: did the organisationhave clear objectives? did it understand its markets? did it make a rationalchoice? did it implement effectively and did it learn from its mistakes?Once you have derived a few rough answers to the questions raised by theprocess model you should understand enough about what has happenedto answer the question and to flesh out your answer by applying relevantmodels.
2 Focus on the question asked and identify relevant models to generate ananswer. The question itself can act as the stimulus for applying strategicmodels, and in fact one reason that specific questions are posed is to helpcandidates focus on relevant issues.
Bear in mind that you cannot answer the question by simply reproducingthe contents of the case. For example, the answer to a question on what wentwrong may focus on the characteristics of the strategist and the lack of clearobjectives, coupled with inadequate market analysis; this provides insight intothe strategic process which a description of events does not. Many candidatesconfuse narrative with analysis.
Essay questions
The essay places you in the position of formulating an answer to a questionwhich raises an issue of principle and cannot really be answered on the basis ofinformation. You will not always be doing strategic analysis: sometimes you willbe expected to talk about strategy issues and provide clarification. For example,you might be asked by a colleague ‘What is the point of trying to plan forthe future?’ You cannot answer this by recourse to the successes of planning(remember the difficulty of attempting to prove an hypothesis) but you can setout the concept of the process model and the costs and benefits of a planningapproach. The important point is to identify what the question is really aboutand then consider the arguments for and against.
Strategic Planning Edinburgh Business School A3/3
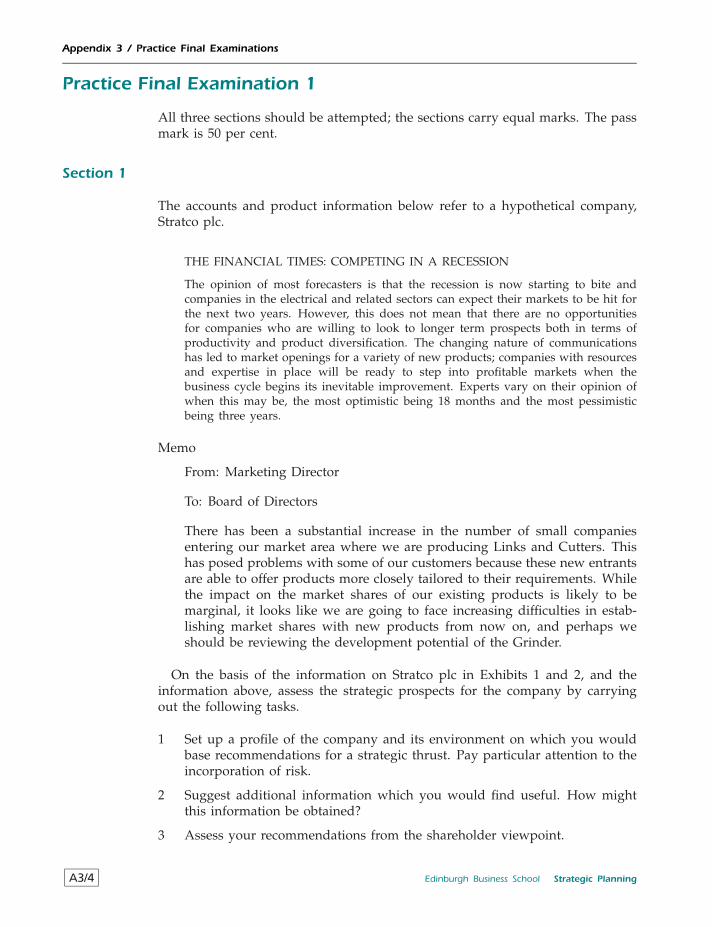
Appendix 3 / Practice Final Examinations
Practice Final Examination 1
All three sections should be attempted; the sections carry equal marks. The passmark is 50 per cent.
Section 1
The accounts and product information below refer to a hypothetical company,Stratco plc.
THE FINANCIAL TIMES: COMPETING IN A RECESSION
The opinion of most forecasters is that the recession is now starting to bite andcompanies in the electrical and related sectors can expect their markets to be hit forthe next two years. However, this does not mean that there are no opportunitiesfor companies who are willing to look to longer term prospects both in terms ofproductivity and product diversification. The changing nature of communicationshas led to market openings for a variety of new products; companies with resourcesand expertise in place will be ready to step into profitable markets when thebusiness cycle begins its inevitable improvement. Experts vary on their opinion ofwhen this may be, the most optimistic being 18 months and the most pessimisticbeing three years.
Memo
From: Marketing Director
To: Board of Directors
There has been a substantial increase in the number of small companiesentering our market area where we are producing Links and Cutters. Thishas posed problems with some of our customers because these new entrantsare able to offer products more closely tailored to their requirements. Whilethe impact on the market shares of our existing products is likely to bemarginal, it looks like we are going to face increasing difficulties in estab-lishing market shares with new products from now on, and perhaps weshould be reviewing the development potential of the Grinder.
On the basis of the information on Stratco plc in Exhibits 1 and 2, and theinformation above, assess the strategic prospects for the company by carryingout the following tasks.
1 Set up a profile of the company and its environment on which you wouldbase recommendations for a strategic thrust. Pay particular attention to theincorporation of risk.
2 Suggest additional information which you would find useful. How mightthis information be obtained?
3 Assess your recommendations from the shareholder viewpoint.
A3/4 Edinburgh Business School Strategic Planning
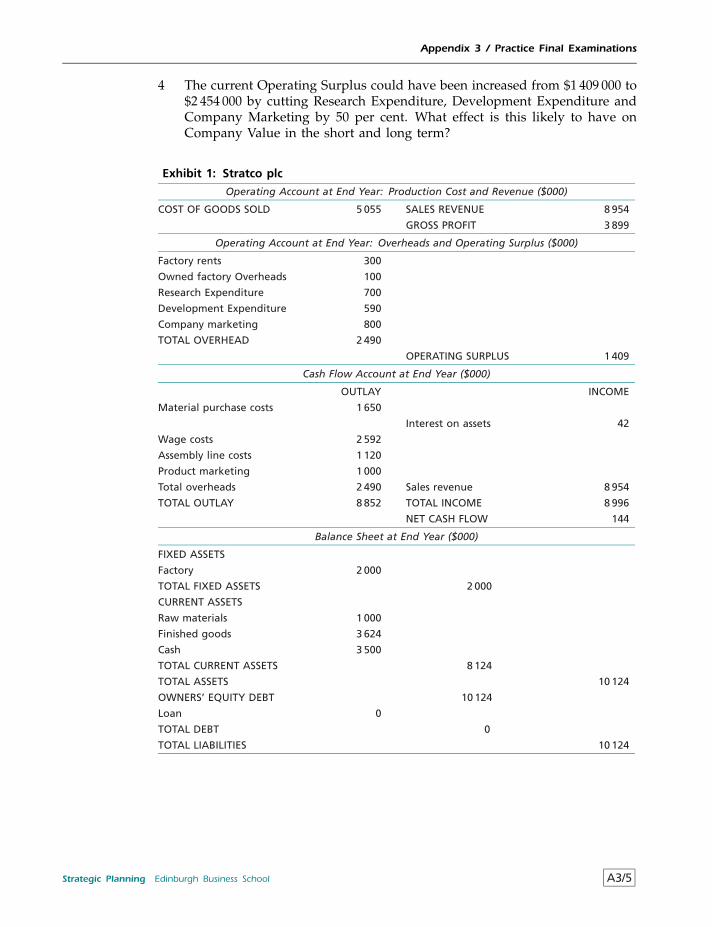
Appendix 3 / Practice Final Examinations
4 The current Operating Surplus could have been increased from $1 409 000 to$2 454 000 by cutting Research Expenditure, Development Expenditure andCompany Marketing by 50 per cent. What effect is this likely to have onCompany Value in the short and long term?
Exhibit 1: Stratco plc
Operating Account at End Year: Production Cost and Revenue ($000)
COST OF GOODS SOLD 5 055 SALES REVENUE 8 954
GROSS PROFIT 3 899
Operating Account at End Year: Overheads and Operating Surplus ($000)
Factory rents 300
Owned factory Overheads 100
Research Expenditure 700
Development Expenditure 590
Company marketing 800
TOTAL OVERHEAD 2 490
OPERATING SURPLUS 1 409
Cash Flow Account at End Year ($000)
OUTLAY INCOME
Material purchase costs 1 650
Interest on assets 42
Wage costs 2 592
Assembly line costs 1 120
Product marketing 1 000
Total overheads 2 490 Sales revenue 8 954
TOTAL OUTLAY 8 852 TOTAL INCOME 8 996
NET CASH FLOW 144
Balance Sheet at End Year ($000)
FIXED ASSETS
Factory 2 000
TOTAL FIXED ASSETS 2 000
CURRENT ASSETS
Raw materials 1 000
Finished goods 3 624
Cash 3 500
TOTAL CURRENT ASSETS 8 124
TOTAL ASSETS 10 124
OWNERS’ EQUITY DEBT 10 124
Loan 0
TOTAL DEBT 0
TOTAL LIABILITIES 10 124
Strategic Planning Edinburgh Business School A3/5
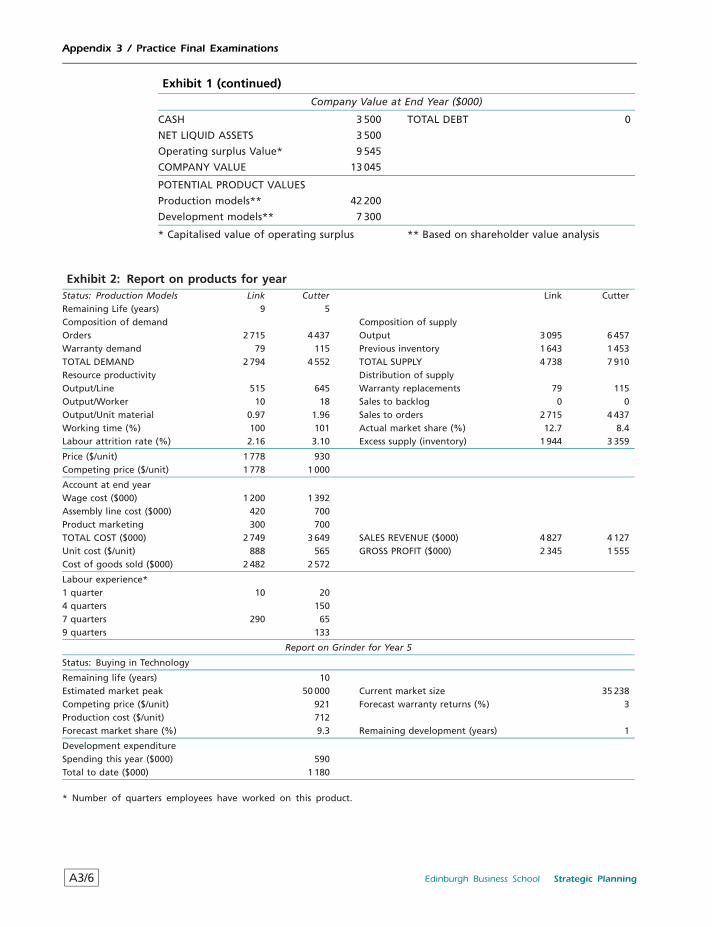
Appendix 3 / Practice Final Examinations
Exhibit 1 (continued)
Company Value at End Year ($000)
CASH 3 500 TOTAL DEBT 0
NET LIQUID ASSETS 3 500
Operating surplus Value* 9 545
COMPANY VALUE 13 045
POTENTIAL PRODUCT VALUES
Production models** 42 200
Development models** 7 300
* Capitalised value of operating surplus ** Based on shareholder value analysis
Exhibit 2: Report on products for yearStatus: Production Models Link Cutter Link CutterRemaining Life (years) 9 5Composition of demand Composition of supplyOrders 2 715 4 437 Output 3 095 6 457Warranty demand 79 115 Previous inventory 1 643 1 453TOTAL DEMAND 2 794 4 552 TOTAL SUPPLY 4 738 7 910Resource productivity Distribution of supplyOutput/Line 515 645 Warranty replacements 79 115Output/Worker 10 18 Sales to backlog 0 0Output/Unit material 0.97 1.96 Sales to orders 2 715 4 437Working time (%) 100 101 Actual market share (%) 12.7 8.4Labour attrition rate (%) 2.16 3.10 Excess supply (inventory) 1 944 3 359
Price ($/unit) 1 778 930Competing price ($/unit) 1 778 1 000
Account at end yearWage cost ($000) 1 200 1 392Assembly line cost ($000) 420 700Product marketing 300 700TOTAL COST ($000) 2 749 3 649 SALES REVENUE ($000) 4 827 4 127Unit cost ($/unit) 888 565 GROSS PROFIT ($000) 2 345 1 555Cost of goods sold ($000) 2 482 2 572
Labour experience*1 quarter 10 204 quarters 1507 quarters 290 659 quarters 133
Report on Grinder for Year 5
Status: Buying in Technology
Remaining life (years) 10Estimated market peak 50 000 Current market size 35 238Competing price ($/unit) 921 Forecast warranty returns (%) 3Production cost ($/unit) 712Forecast market share (%) 9.3 Remaining development (years) 1
Development expenditureSpending this year ($000) 590Total to date ($000) 1 180
* Number of quarters employees have worked on this product.
A3/6 Edinburgh Business School Strategic Planning
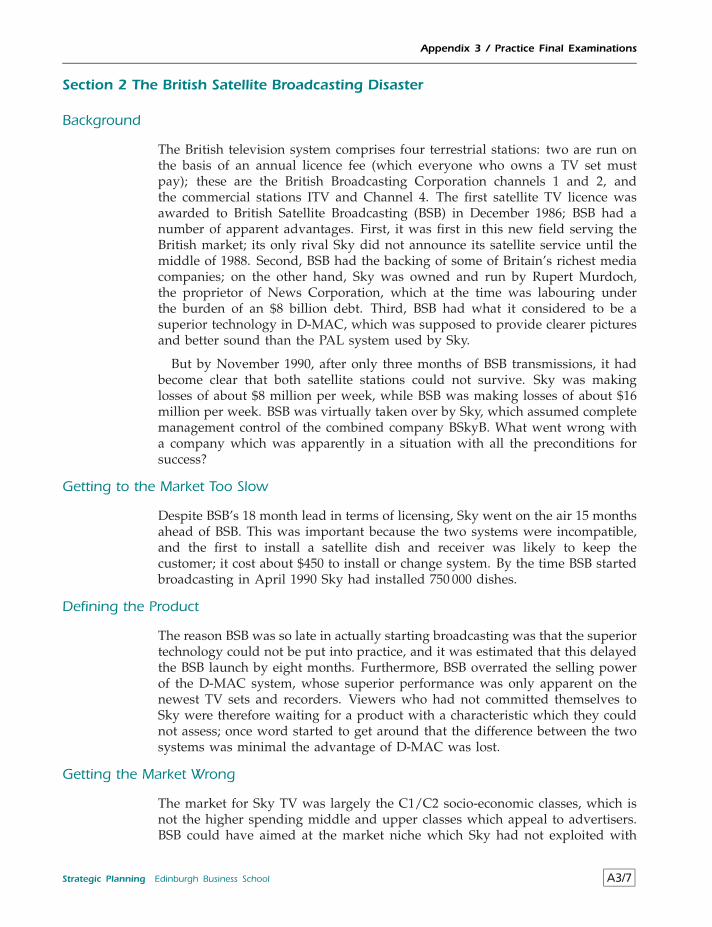
Appendix 3 / Practice Final Examinations
Section 2 The British Satellite Broadcasting Disaster
Background
The British television system comprises four terrestrial stations: two are run onthe basis of an annual licence fee (which everyone who owns a TV set mustpay); these are the British Broadcasting Corporation channels 1 and 2, andthe commercial stations ITV and Channel 4. The first satellite TV licence wasawarded to British Satellite Broadcasting (BSB) in December 1986; BSB had anumber of apparent advantages. First, it was first in this new field serving theBritish market; its only rival Sky did not announce its satellite service until themiddle of 1988. Second, BSB had the backing of some of Britain’s richest mediacompanies; on the other hand, Sky was owned and run by Rupert Murdoch,the proprietor of News Corporation, which at the time was labouring underthe burden of an $8 billion debt. Third, BSB had what it considered to be asuperior technology in D-MAC, which was supposed to provide clearer picturesand better sound than the PAL system used by Sky.
But by November 1990, after only three months of BSB transmissions, it hadbecome clear that both satellite stations could not survive. Sky was makinglosses of about $8 million per week, while BSB was making losses of about $16million per week. BSB was virtually taken over by Sky, which assumed completemanagement control of the combined company BSkyB. What went wrong witha company which was apparently in a situation with all the preconditions forsuccess?
Getting to the Market Too Slow
Despite BSB’s 18 month lead in terms of licensing, Sky went on the air 15 monthsahead of BSB. This was important because the two systems were incompatible,and the first to install a satellite dish and receiver was likely to keep thecustomer; it cost about $450 to install or change system. By the time BSB startedbroadcasting in April 1990 Sky had installed 750 000 dishes.
Defining the Product
The reason BSB was so late in actually starting broadcasting was that the superiortechnology could not be put into practice, and it was estimated that this delayedthe BSB launch by eight months. Furthermore, BSB overrated the selling powerof the D-MAC system, whose superior performance was only apparent on thenewest TV sets and recorders. Viewers who had not committed themselves toSky were therefore waiting for a product with a characteristic which they couldnot assess; once word started to get around that the difference between the twosystems was minimal the advantage of D-MAC was lost.
Getting the Market Wrong
The market for Sky TV was largely the C1/C2 socio-economic classes, which isnot the higher spending middle and upper classes which appeal to advertisers.BSB could have aimed at the market niche which Sky had not exploited with
Strategic Planning Edinburgh Business School A3/7
Appendix 3 / Practice Final Examinations
‘quality’ programming, but it chose to fight Sky in the C1/C2 market where Skywas already well ahead. While, of course, it is impossible to know what lay inthe minds of BSB executives, it seemed that they considered their competitorto be Sky, whereas in fact they also had to compete with the range of qualityand popular programmes available free on the four terrestrial stations. Theirproblem was not just to attract a potential satellite customer from Sky, but toattract a satellite customer in the first place. Since Sky had already decided onthe market and the level of programming, BSB was now competing for part ofthe market which had already been generated by Sky rather than adding to thetotal market by virtue of its unique characteristics.
Getting the Costs Wrong
On the cost side, BSB had various disadvantages. First, the D-MAC technologywas more costly than PAL, which was already in existence and proven. Second,BSB bought and launched its own two Marco Polo satellites, while Sky rentedtime on the Astra satellite which was already in orbit. Third, BSB housed itselfin lavish studios and offices in expensive central London; Sky was located inless ostentatious facilities in the cheaper suburbs. Fourth, it was well known thatBSB had used relatively high salaries to attract executives from the terrestrialstations; Sky had not. Fifth, BSB was determined to outbid Sky for Americanfilms, and sent prices to unheard of levels. One explanation for the runawaycosts at BSB was that it was a consortium, whose owners could not collectivelyact to control expenditure in the way which Rupert Murdoch could.
1 Could BSB have been competitive if a different strategy had been adopted?Set out an argument which, on balance, suggests either YES or NO.
2 If YES – Suggest reasons why the company followed the course which itdid.
3 If NO – Suggest reasons why the enterprise was pursued to the disastrousextent which it reached.
Section 3
Imagine you have been hired to introduce strategic planning into a mediumsized company. The difficulty is that only the CEO believes that on balancethere will be a payoff. The directors for Finance, Marketing and Productionare sceptical because of the constantly changing environment within which thecompany operates. Set out the arguments you would use to justify your case forstrategic planning, and do not ignore the potential drawbacks of the approachwhich are likely to be in the minds of your opponents.
A3/8 Edinburgh Business School Strategic Planning
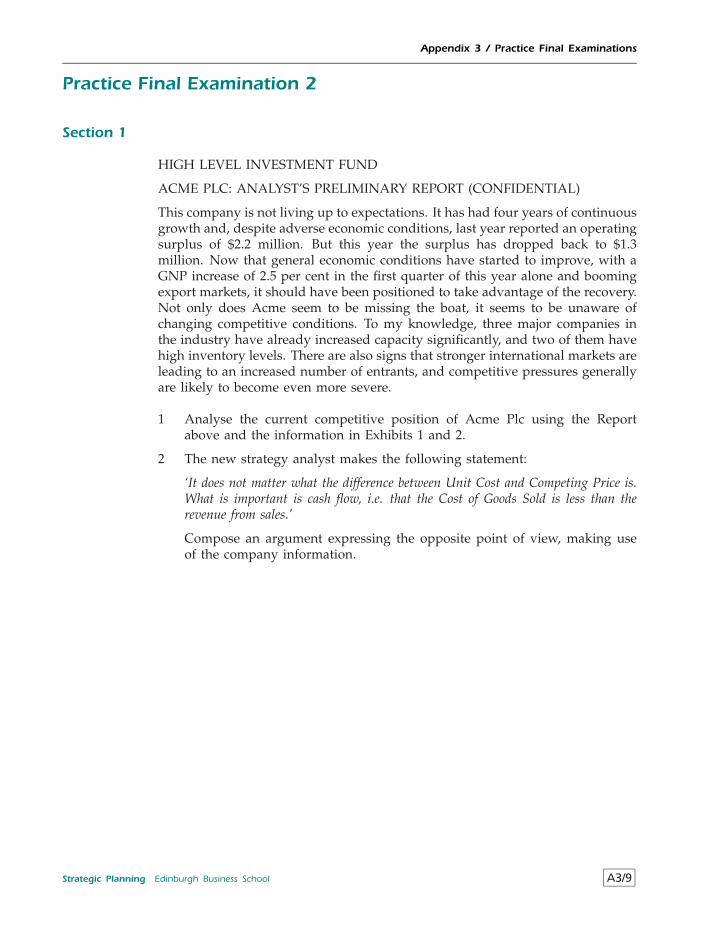
Appendix 3 / Practice Final Examinations
Practice Final Examination 2
Section 1
HIGH LEVEL INVESTMENT FUND
ACME PLC: ANALYST’S PRELIMINARY REPORT (CONFIDENTIAL)
This company is not living up to expectations. It has had four years of continuousgrowth and, despite adverse economic conditions, last year reported an operatingsurplus of $2.2 million. But this year the surplus has dropped back to $1.3million. Now that general economic conditions have started to improve, with aGNP increase of 2.5 per cent in the first quarter of this year alone and boomingexport markets, it should have been positioned to take advantage of the recovery.Not only does Acme seem to be missing the boat, it seems to be unaware ofchanging competitive conditions. To my knowledge, three major companies inthe industry have already increased capacity significantly, and two of them havehigh inventory levels. There are also signs that stronger international markets areleading to an increased number of entrants, and competitive pressures generallyare likely to become even more severe.
1 Analyse the current competitive position of Acme Plc using the Reportabove and the information in Exhibits 1 and 2.
2 The new strategy analyst makes the following statement:
‘It does not matter what the difference between Unit Cost and Competing Price is.What is important is cash flow, i.e. that the Cost of Goods Sold is less than therevenue from sales.’
Compose an argument expressing the opposite point of view, making useof the company information.
Strategic Planning Edinburgh Business School A3/9
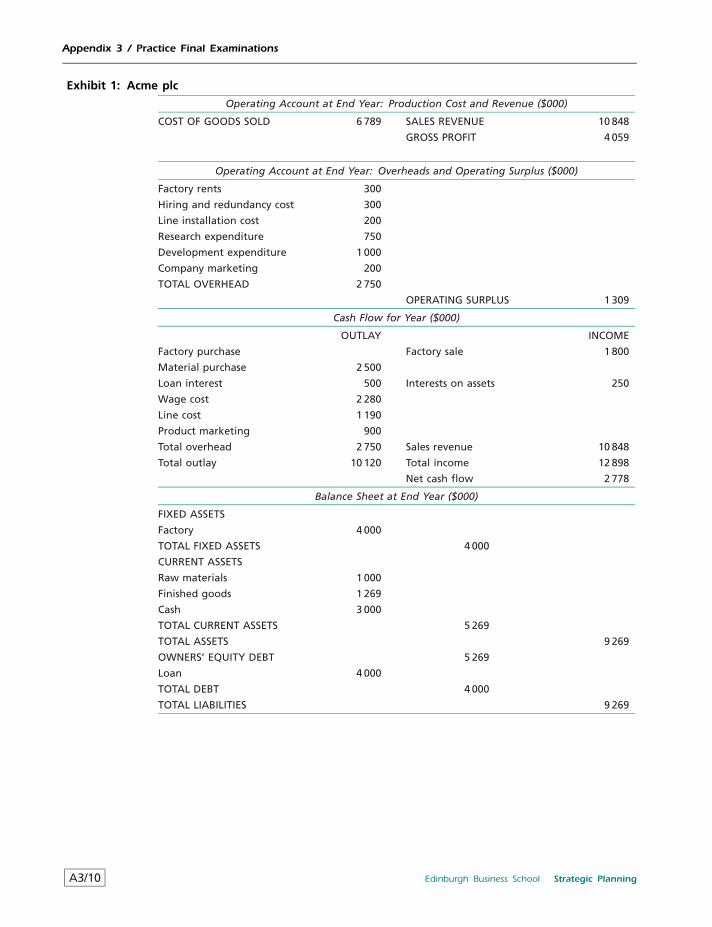
Appendix 3 / Practice Final Examinations
Exhibit 1: Acme plc
Operating Account at End Year: Production Cost and Revenue ($000)
COST OF GOODS SOLD 6 789 SALES REVENUE 10 848
GROSS PROFIT 4 059
Operating Account at End Year: Overheads and Operating Surplus ($000)
Factory rents 300
Hiring and redundancy cost 300
Line installation cost 200
Research expenditure 750
Development expenditure 1 000
Company marketing 200
TOTAL OVERHEAD 2 750
OPERATING SURPLUS 1 309
Cash Flow for Year ($000)
OUTLAY INCOME
Factory purchase Factory sale 1 800
Material purchase 2 500
Loan interest 500 Interests on assets 250
Wage cost 2 280
Line cost 1 190
Product marketing 900
Total overhead 2 750 Sales revenue 10 848
Total outlay 10 120 Total income 12 898
Net cash flow 2 778
Balance Sheet at End Year ($000)
FIXED ASSETS
Factory 4 000
TOTAL FIXED ASSETS 4 000
CURRENT ASSETS
Raw materials 1 000
Finished goods 1 269
Cash 3 000
TOTAL CURRENT ASSETS 5 269
TOTAL ASSETS 9 269
OWNERS’ EQUITY DEBT 5 269
Loan 4 000
TOTAL DEBT 4 000
TOTAL LIABILITIES 9 269
A3/10 Edinburgh Business School Strategic Planning
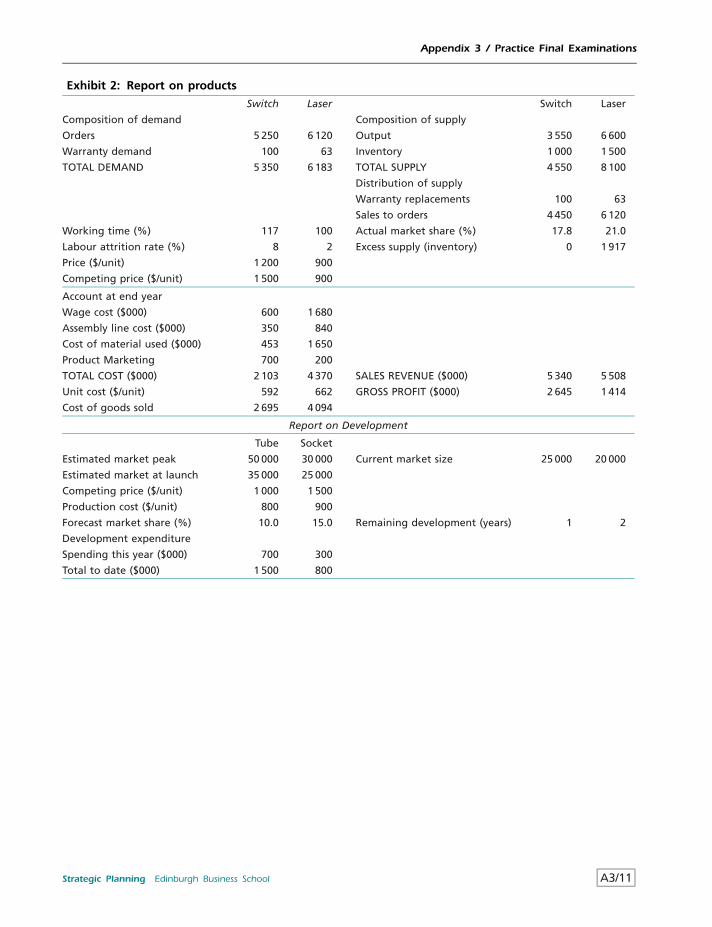
Appendix 3 / Practice Final Examinations
Exhibit 2: Report on products
Switch Laser Switch Laser
Composition of demand Composition of supply
Orders 5 250 6 120 Output 3 550 6 600
Warranty demand 100 63 Inventory 1 000 1 500
TOTAL DEMAND 5 350 6 183 TOTAL SUPPLY 4 550 8 100
Distribution of supply
Warranty replacements 100 63
Sales to orders 4 450 6 120
Working time (%) 117 100 Actual market share (%) 17.8 21.0
Labour attrition rate (%) 8 2 Excess supply (inventory) 0 1 917
Price ($/unit) 1 200 900
Competing price ($/unit) 1 500 900
Account at end year
Wage cost ($000) 600 1 680
Assembly line cost ($000) 350 840
Cost of material used ($000) 453 1 650
Product Marketing 700 200
TOTAL COST ($000) 2 103 4 370 SALES REVENUE ($000) 5 340 5 508
Unit cost ($/unit) 592 662 GROSS PROFIT ($000) 2 645 1 414
Cost of goods sold 2 695 4 094
Report on Development
Tube Socket
Estimated market peak 50 000 30 000 Current market size 25 000 20 000
Estimated market at launch 35 000 25 000
Competing price ($/unit) 1 000 1 500
Production cost ($/unit) 800 900
Forecast market share (%) 10.0 15.0 Remaining development (years) 1 2
Development expenditure
Spending this year ($000) 700 300
Total to date ($000) 1 500 800
Strategic Planning Edinburgh Business School A3/11
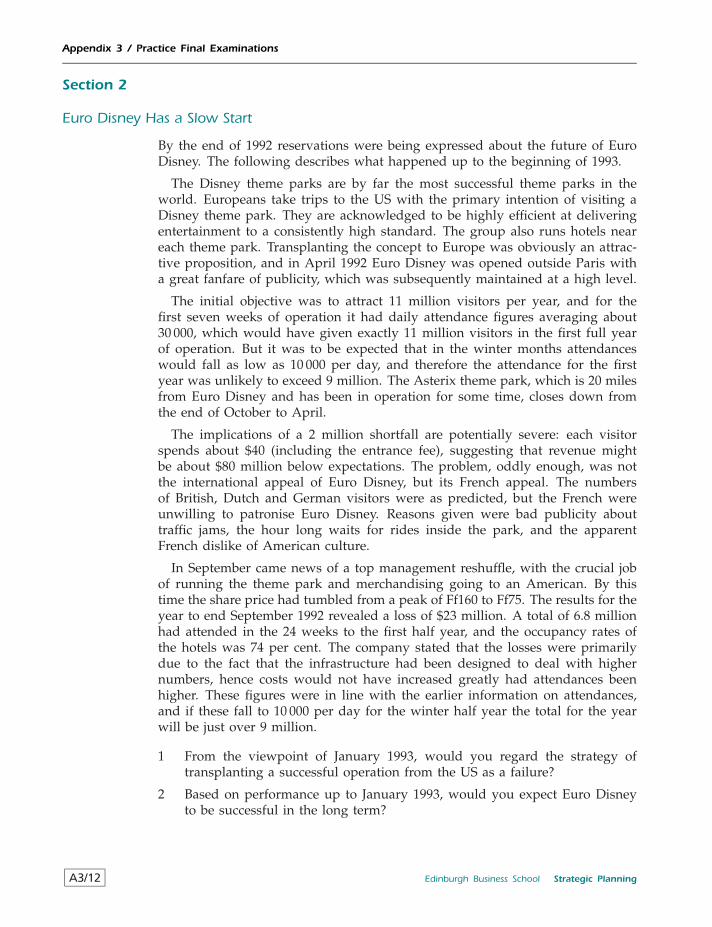
Appendix 3 / Practice Final Examinations
Section 2
Euro Disney Has a Slow Start
By the end of 1992 reservations were being expressed about the future of EuroDisney. The following describes what happened up to the beginning of 1993.
The Disney theme parks are by far the most successful theme parks in theworld. Europeans take trips to the US with the primary intention of visiting aDisney theme park. They are acknowledged to be highly efficient at deliveringentertainment to a consistently high standard. The group also runs hotels neareach theme park. Transplanting the concept to Europe was obviously an attrac-tive proposition, and in April 1992 Euro Disney was opened outside Paris witha great fanfare of publicity, which was subsequently maintained at a high level.
The initial objective was to attract 11 million visitors per year, and for thefirst seven weeks of operation it had daily attendance figures averaging about30 000, which would have given exactly 11 million visitors in the first full yearof operation. But it was to be expected that in the winter months attendanceswould fall as low as 10 000 per day, and therefore the attendance for the firstyear was unlikely to exceed 9 million. The Asterix theme park, which is 20 milesfrom Euro Disney and has been in operation for some time, closes down fromthe end of October to April.
The implications of a 2 million shortfall are potentially severe: each visitorspends about $40 (including the entrance fee), suggesting that revenue mightbe about $80 million below expectations. The problem, oddly enough, was notthe international appeal of Euro Disney, but its French appeal. The numbersof British, Dutch and German visitors were as predicted, but the French wereunwilling to patronise Euro Disney. Reasons given were bad publicity abouttraffic jams, the hour long waits for rides inside the park, and the apparentFrench dislike of American culture.
In September came news of a top management reshuffle, with the crucial jobof running the theme park and merchandising going to an American. By thistime the share price had tumbled from a peak of Ff160 to Ff75. The results for theyear to end September 1992 revealed a loss of $23 million. A total of 6.8 millionhad attended in the 24 weeks to the first half year, and the occupancy rates ofthe hotels was 74 per cent. The company stated that the losses were primarilydue to the fact that the infrastructure had been designed to deal with highernumbers, hence costs would not have increased greatly had attendances beenhigher. These figures were in line with the earlier information on attendances,and if these fall to 10 000 per day for the winter half year the total for the yearwill be just over 9 million.
1 From the viewpoint of January 1993, would you regard the strategy oftransplanting a successful operation from the US as a failure?
2 Based on performance up to January 1993, would you expect Euro Disneyto be successful in the long term?
A3/12 Edinburgh Business School Strategic Planning

Appendix 3 / Practice Final Examinations
Section 3
The setting of company objectives is central to formulating a strategic plan.Discuss how objectives are set and how to ensure that the organisation acts inaccordance with them.
Strategic Planning Edinburgh Business School A3/13

Appendix 4
Guide to Strategic Planning PracticeFinal Examinations
Contents
Guide to Practice Final Examination 1 A4/1
Guide to Practice Final Examination 2 A4/10
The assessment is based on the application of relevant concepts and analysesto the problems. The structure of the examination provides you with a rangeof opportunities to demonstrate your understanding of the business disciplinesand strategic planning. The company specific problem requires the applicationof analytical skills and the ability to draw conclusions from diverse information.The case requires you to recognise where and how to apply strategy ideas toa real life issue. The essay gives you the opportunity to discuss a topic atlength and present your own ideas. Answers which are comprised of a seriesof unconnected observations will receive little credit. However, attempts torationalise complex issues using ideas from the strategic planning course, orany of the core courses, will be handsomely rewarded. This guide suggestshow ideas can be applied; the sample answers are not models to be slavishlyfollowed, and candidates are encouraged to be inventive in their approach tothe issues.
While it is essential that you attempt all three questions in the examinationthe papers are graded on an holistic basis; for example, an outstanding analysisof the case could compensate for deficiencies in the answers to the other ques-tions. The role of the examiner is to assess whether you have demonstrated anadequate knowledge of the subject and the ability to apply strategic ideas.
Guide to Practice Final Examination 1
Section 1
1. Set up a profile of the company and its environment on which you would baserecommendations for a strategic thrust. Pay particular attention to the incorporation ofrisk.
The question requires you to systemise a quantity of diverse information inorder to asses the current situation of the company and arrive at a reasoned
Strategic Planning Edinburgh Business School A4/1
Appendix 4 / Guide to Strategic Planning Practice Final Examinations
conclusion on the strategic direction which it should follow. The Strategy Reportin Appendix 1 provides a framework within which the problem can be tackled.Analytical tools such as supply and demand analysis, product portfolio anal-ysis, financial appraisal and ratio analysis can be used to generate results toincorporate into an Environmental Threat and Opportunity Profile (ETOP) anda Strategic Advantage Profile (SAP); the profiles are then used in the identifica-tion of Strengths, Weaknesses, Opportunities and Threats (SWOT). It has beenstressed in the Modules that there is no unique correct answer to strategy prob-lems because of their wide ranging nature and the possibility of unknowableevents occurring in the future; however, the following shows how factors canbe fitted into a conceptual framework.
ETOP
Environmental factors relating to the economy as a whole and the market inwhich the company is operating can be gleaned from the newspaper article andobservations in the company memo.
Threats
The recession is expected to last for up to three years; the newspaper refersto the ‘inevitable’ improvement in conditions when the business cycle starts itsupward trend. However, no one can predict the duration of the business cyclewith any degree of accuracy. In the absence of any change in strategy by thecompany, the continuing recession will lead to
• reduced total market, depending on income elasticity for the products sold;
• relatively low gross profit because of reduced sales and depressed prices;
• potential action by competitors to attempt to protect existing sales; theseactions might threaten the company’s market share.
There appears to have been a reduction in entry barriers, resulting in increasedcompetition from small companies. These increased competitive pressures couldresult in reduced profits.
The company is therefore faced with threats on two fronts: those due to therecession and those due to changed market conditions.
Opportunities
One view is that the upturn will eventually lead to an increase in market size.But to take full advantage of this it is necessary to get the timing right: thiscould be the right time to start building up market share in anticipation of theincreased total market. On the other hand, because of the increased differentia-tion of products and segmentation of the market no company can afford to waitpassively for better economic conditions to produce higher profitability. Specificaction will have to be undertaken to exploit the changing characteristics of themarket.
A4/2 Edinburgh Business School Strategic Planning
Appendix 4 / Guide to Strategic Planning Practice Final Examinations
Ranking of Threats and Opportunities.
The relative importance of the factors is open to interpretation. For example,in the short run the most important threat appears to be the recession and itspotential impact on cash flows; in the long run the threat is in the form of achange in competitive circumstances. The most important opportunity seems tobe in positioning the company to take advantage of the eventual end to therecession.
SAP
It is necessary to carry out a variety of analyses to determine where the internalstrengths and weaknesses lie. Starting with an overall view of profitability it canbe seen that the Operating Surplus is 36 per cent of Gross Profit; this suggeststhat overheads may be unduly high. The Cash Flow is negligible, and it mustbe a cause for concern that the Gross Profit of nearly $4 million is not beingtranslated into cash inflows. This raises the question of how effectively resourcesas a whole are being allocated.
Ratio analysis provide information on the efficiency with which resources arebeing deployed. Operating surplus as a percentage of total assets shows thatreturn on total assets is 14 per cent; it is a matter for debate whether this is anadequate return given the operating characteristics of the company and returnswithin the industry. The gearing ratio is zero because the company has no debt.This can be interpreted as a sound management approach, or it might suggestthat the company has not pursued opportunities unless they can be financedinternally.
Comparisons between products can reveal differences in the returns on theresources allocated to products. The Link is currently generating a gross profitof $864 (i.e. $2.345 million divided by 2715) per unit sold, while the Cutteris generating $350 (i.e. $1.555 million divided by 4437). Explanations for thisdifference can be found in costs and market position. On the cost side thereare some differences in the cost structures of the two products, but there is notenough information to assess relative effieincy. On the market side the Cutter hasa smaller market share and is currently priced below the competing level. If theunit cost of the Cutter were 5 per cent lower, and the price set to the competinglevel, then the difference between unit cost and price would be increased byabout $100; at the current level of sales this would have added about $0.44million to gross profit. This would have increased the gross profit per unit soldto about $450. Whether this is achievable depends on the elasticity of demand.
You can attempt to position the two products in the BCG portfolio matrix; forexample, the Link has a higher market share, is on the market at the competingprice, has a lower expenditure on product marketing and has a much highergross profit than the Cutter. This suggests that the Link has characteristics of acash cow, and that the Cutter may be a star or question mark. The conclusionyou reach on the position of the products has implications for the interpretationof the accounting cash flows and the future allocation of resources to the twoproducts. For example, gross profit as a percentage of sales revenue is 49 per
Strategic Planning Edinburgh Business School A4/3
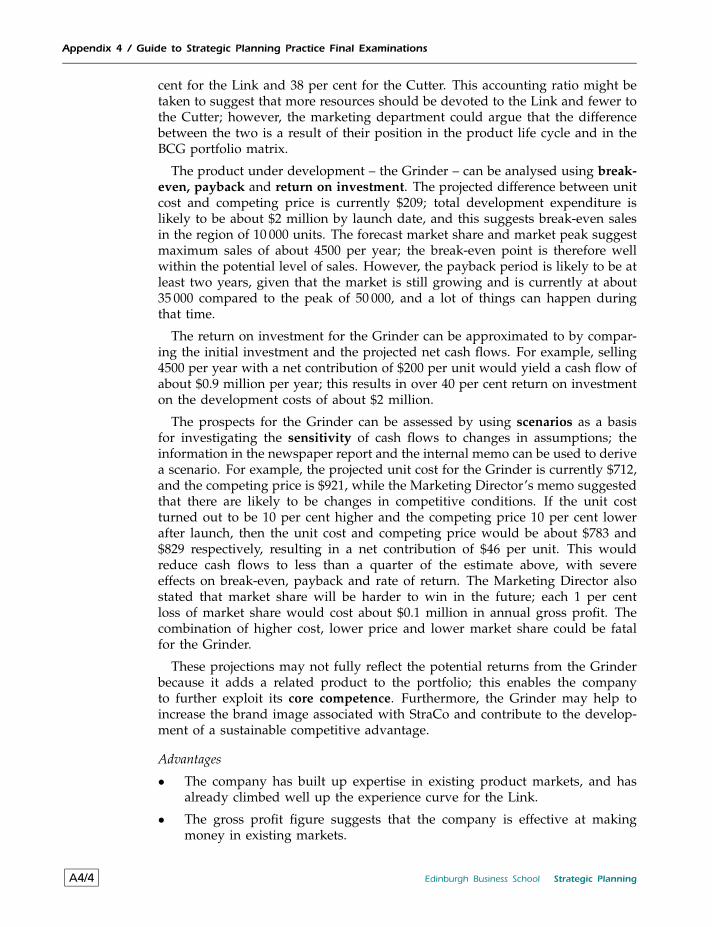
Appendix 4 / Guide to Strategic Planning Practice Final Examinations
cent for the Link and 38 per cent for the Cutter. This accounting ratio might betaken to suggest that more resources should be devoted to the Link and fewer tothe Cutter; however, the marketing department could argue that the differencebetween the two is a result of their position in the product life cycle and in theBCG portfolio matrix.
The product under development – the Grinder – can be analysed using break-even, payback and return on investment. The projected difference between unitcost and competing price is currently $209; total development expenditure islikely to be about $2 million by launch date, and this suggests break-even salesin the region of 10 000 units. The forecast market share and market peak suggestmaximum sales of about 4500 per year; the break-even point is therefore wellwithin the potential level of sales. However, the payback period is likely to be atleast two years, given that the market is still growing and is currently at about35 000 compared to the peak of 50 000, and a lot of things can happen duringthat time.
The return on investment for the Grinder can be approximated to by compar-ing the initial investment and the projected net cash flows. For example, selling4500 per year with a net contribution of $200 per unit would yield a cash flow ofabout $0.9 million per year; this results in over 40 per cent return on investmenton the development costs of about $2 million.
The prospects for the Grinder can be assessed by using scenarios as a basisfor investigating the sensitivity of cash flows to changes in assumptions; theinformation in the newspaper report and the internal memo can be used to derivea scenario. For example, the projected unit cost for the Grinder is currently $712,and the competing price is $921, while the Marketing Director’s memo suggestedthat there are likely to be changes in competitive conditions. If the unit costturned out to be 10 per cent higher and the competing price 10 per cent lowerafter launch, then the unit cost and competing price would be about $783 and$829 respectively, resulting in a net contribution of $46 per unit. This wouldreduce cash flows to less than a quarter of the estimate above, with severeeffects on break-even, payback and rate of return. The Marketing Director alsostated that market share will be harder to win in the future; each 1 per centloss of market share would cost about $0.1 million in annual gross profit. Thecombination of higher cost, lower price and lower market share could be fatalfor the Grinder.
These projections may not fully reflect the potential returns from the Grinderbecause it adds a related product to the portfolio; this enables the companyto further exploit its core competence. Furthermore, the Grinder may help toincrease the brand image associated with StraCo and contribute to the develop-ment of a sustainable competitive advantage.
Advantages
• The company has built up expertise in existing product markets, and hasalready climbed well up the experience curve for the Link.
• The gross profit figure suggests that the company is effective at makingmoney in existing markets.
A4/4 Edinburgh Business School Strategic Planning
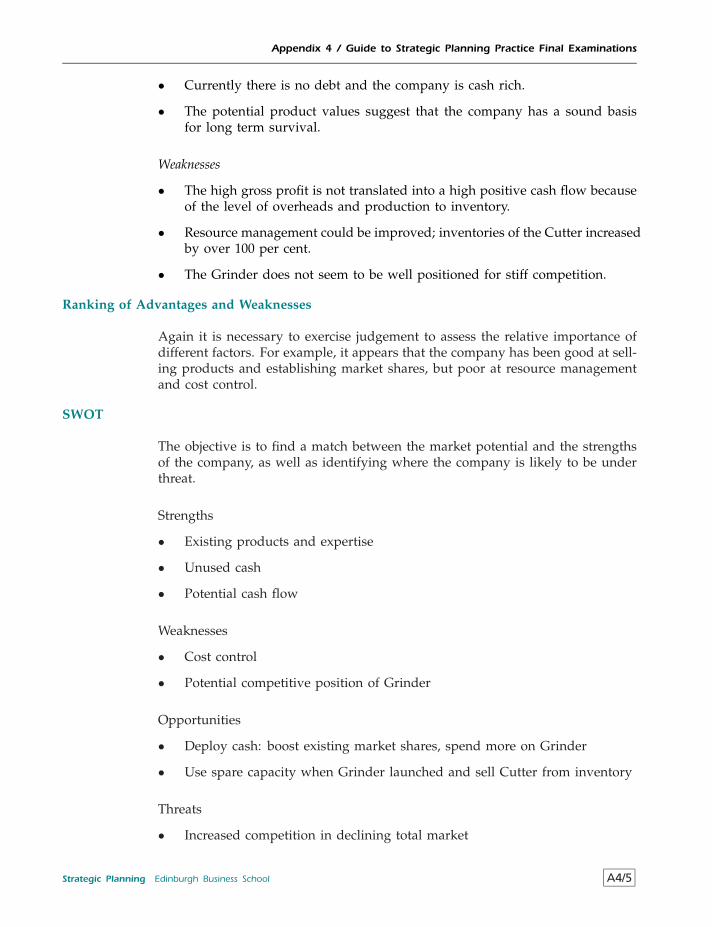
Appendix 4 / Guide to Strategic Planning Practice Final Examinations
• Currently there is no debt and the company is cash rich.
• The potential product values suggest that the company has a sound basisfor long term survival.
Weaknesses
• The high gross profit is not translated into a high positive cash flow becauseof the level of overheads and production to inventory.
• Resource management could be improved; inventories of the Cutter increasedby over 100 per cent.
• The Grinder does not seem to be well positioned for stiff competition.
Ranking of Advantages and Weaknesses
Again it is necessary to exercise judgement to assess the relative importance ofdifferent factors. For example, it appears that the company has been good at sell-ing products and establishing market shares, but poor at resource managementand cost control.
SWOT
The objective is to find a match between the market potential and the strengthsof the company, as well as identifying where the company is likely to be underthreat.
Strengths
• Existing products and expertise
• Unused cash
• Potential cash flow
Weaknesses
• Cost control
• Potential competitive position of Grinder
Opportunities
• Deploy cash: boost existing market shares, spend more on Grinder
• Use spare capacity when Grinder launched and sell Cutter from inventory
Threats
• Increased competition in declining total market
Strategic Planning Edinburgh Business School A4/5
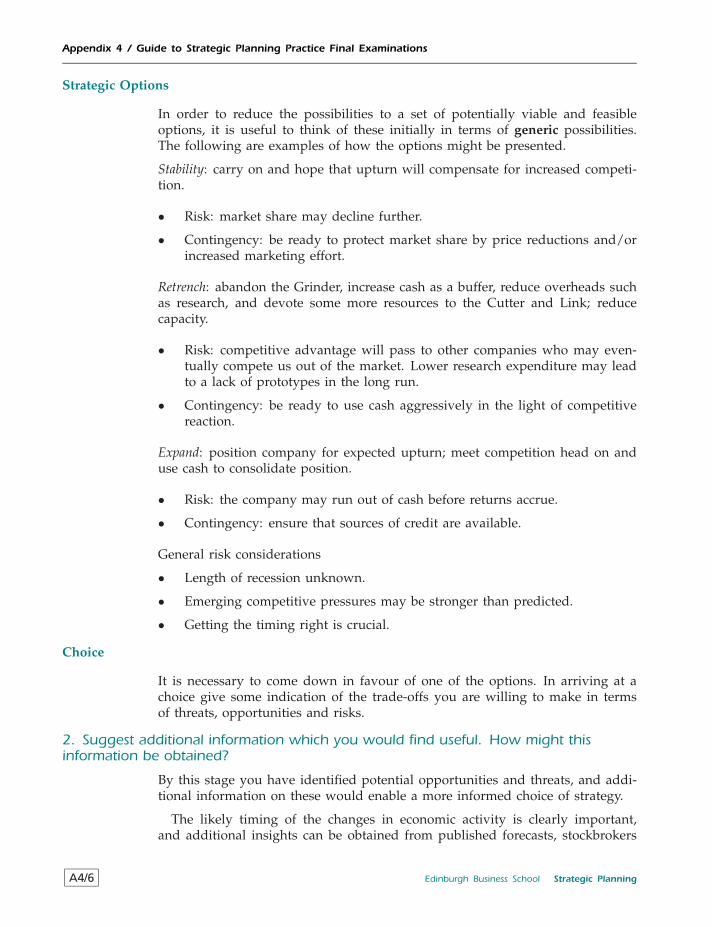
Appendix 4 / Guide to Strategic Planning Practice Final Examinations
Strategic Options
In order to reduce the possibilities to a set of potentially viable and feasibleoptions, it is useful to think of these initially in terms of generic possibilities.The following are examples of how the options might be presented.
Stability: carry on and hope that upturn will compensate for increased competi-tion.
• Risk: market share may decline further.
• Contingency: be ready to protect market share by price reductions and/orincreased marketing effort.
Retrench: abandon the Grinder, increase cash as a buffer, reduce overheads suchas research, and devote some more resources to the Cutter and Link; reducecapacity.
• Risk: competitive advantage will pass to other companies who may even-tually compete us out of the market. Lower research expenditure may leadto a lack of prototypes in the long run.
• Contingency: be ready to use cash aggressively in the light of competitivereaction.
Expand: position company for expected upturn; meet competition head on anduse cash to consolidate position.
• Risk: the company may run out of cash before returns accrue.
• Contingency: ensure that sources of credit are available.
General risk considerations
• Length of recession unknown.
• Emerging competitive pressures may be stronger than predicted.
• Getting the timing right is crucial.
Choice
It is necessary to come down in favour of one of the options. In arriving at achoice give some indication of the trade-offs you are willing to make in termsof threats, opportunities and risks.
2. Suggest additional information which you would find useful. How might thisinformation be obtained?
By this stage you have identified potential opportunities and threats, and addi-tional information on these would enable a more informed choice of strategy.
The likely timing of the changes in economic activity is clearly important,and additional insights can be obtained from published forecasts, stockbrokers
A4/6 Edinburgh Business School Strategic Planning
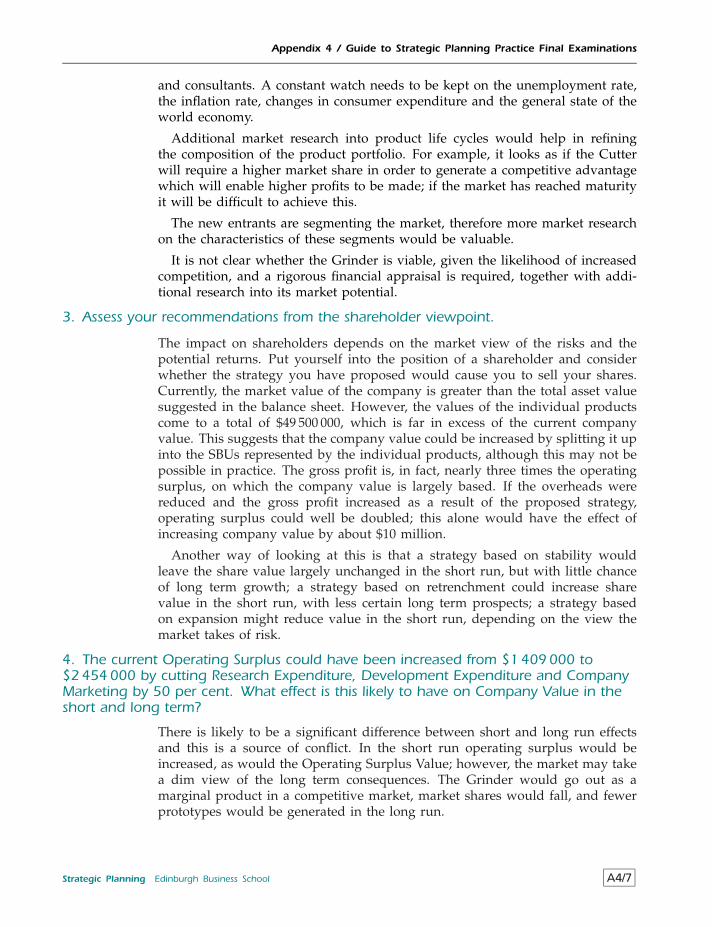
Appendix 4 / Guide to Strategic Planning Practice Final Examinations
and consultants. A constant watch needs to be kept on the unemployment rate,the inflation rate, changes in consumer expenditure and the general state of theworld economy.
Additional market research into product life cycles would help in refiningthe composition of the product portfolio. For example, it looks as if the Cutterwill require a higher market share in order to generate a competitive advantagewhich will enable higher profits to be made; if the market has reached maturityit will be difficult to achieve this.
The new entrants are segmenting the market, therefore more market researchon the characteristics of these segments would be valuable.
It is not clear whether the Grinder is viable, given the likelihood of increasedcompetition, and a rigorous financial appraisal is required, together with addi-tional research into its market potential.
3. Assess your recommendations from the shareholder viewpoint.
The impact on shareholders depends on the market view of the risks and thepotential returns. Put yourself into the position of a shareholder and considerwhether the strategy you have proposed would cause you to sell your shares.Currently, the market value of the company is greater than the total asset valuesuggested in the balance sheet. However, the values of the individual productscome to a total of $49 500 000, which is far in excess of the current companyvalue. This suggests that the company value could be increased by splitting it upinto the SBUs represented by the individual products, although this may not bepossible in practice. The gross profit is, in fact, nearly three times the operatingsurplus, on which the company value is largely based. If the overheads werereduced and the gross profit increased as a result of the proposed strategy,operating surplus could well be doubled; this alone would have the effect ofincreasing company value by about $10 million.
Another way of looking at this is that a strategy based on stability wouldleave the share value largely unchanged in the short run, but with little chanceof long term growth; a strategy based on retrenchment could increase sharevalue in the short run, with less certain long term prospects; a strategy basedon expansion might reduce value in the short run, depending on the view themarket takes of risk.
4. The current Operating Surplus could have been increased from $1 409 000 to$2 454 000 by cutting Research Expenditure, Development Expenditure and CompanyMarketing by 50 per cent. What effect is this likely to have on Company Value in theshort and long term?
There is likely to be a significant difference between short and long run effectsand this is a source of conflict. In the short run operating surplus would beincreased, as would the Operating Surplus Value; however, the market may takea dim view of the long term consequences. The Grinder would go out as amarginal product in a competitive market, market shares would fall, and fewerprototypes would be generated in the long run.
Strategic Planning Edinburgh Business School A4/7
Appendix 4 / Guide to Strategic Planning Practice Final Examinations
Section 2
Could BSB Have Been Competitive?
The events leading up to November 1990 suggest that both companies had madea major strategic blunder, because the market which they targeted was not largeenough to support two major satellite stations. It looks unlikely that controllingcosts on its own would have been sufficient to generate success for BSB, becauseeven the much leaner Sky was losing heavily by the time of the take-over.However, it is possible that BSB might have been successful if it had controlledits costs and developed a different segment of the market; for example, BSB hadnot exploited the A and B socioeconomic groups.
The BSB experience can be expressed in terms of the process model in Figure2.1. The strategists were apparently not a cohesive group because of the consor-tium structure, and a clear set of objectives in terms of intended market, typeof programming and so on does not seem to have been spelt out. The companywas weak on analysis and diagnosis, and did not appear to understand thecompetitive environment well. The choice of strategy seemed to have beendictated by Sky and there seemed to be no clear understanding of the basison which BSB would gain a competitive advantage.BSB appeared to have givenlittle thought to implementation. Resource allocation was poor: resources wereunnecessarily costly, and there was no control mechanism. Finally, the con-sortium seemed unable to utilise feedback, and did not appear to learn frommistakes. From this it can be concluded that the underlying problem facing BSBwas the weakness in its strategic process; while a strategic process will never beperfect the BSB process lacked robustness in any dimension.
The process model analysis can be supplemented by applying strategic models.BSB can be positioned in the perceived price differentiation matrix. Onceperceived differentiation disappeared BSB dropped into the failure likely partof the matrix. In terms of the familiarity matrix BSB was moving into newfamiliar markets with new unfamiliar technology. Competition between the twocompanies led to a zero sum game, where one could benefit only at the expenseof the other; the problem for BSB was that Sky already held a strong position bythe time BSB started playing. The claimed superiority of the BSB product canbe analysed in terms of the dimensions of quality; while there was a great dealof emphasis laid on quality, it looks like the dimensions of quality which BSBmanagement considered important were not so considered by customers. Havingweighed up these factors, you can judge whether BSB could have achieved acompetitive advantage over its rivals.
If YES
If the conclusion is reached that a viable success strategy existed, then it isinteresting to ascertain why BSB did not recognise it. This is probably to do withmanagerial perceptions, and the conviction that the BSB product had the qualityto overcome Sky competition. The lack of an analysis of the company’s ownstrengths and weaknesses (SWOT) compared to Sky probably led to managersbeing unaware of how precarious their position really was.
A4/8 Edinburgh Business School Strategic Planning
Appendix 4 / Guide to Strategic Planning Practice Final Examinations
Because of poor resource allocation BSB was unable to exploit potentiallyprofitable avenues, such as product differentiation and market segmentation.
If NO
Once the course of action had been decided on then no individual seemed to beable to stop it. There seems to have been a lack of feedback from the controland monitoring stage which would have led to a re-evaluation of the strategychoice.
It is possible that the BSB management was not risk averse, and was willingto push ahead despite the lack of any immediate indications of success.
Section 3
There are various ways of tackling the essay, and high marks would be awardedfor a discussion which covered the following points.
The central issue is that Strategic Planning has been promoted by the generalmanager (CEO) but opposed by the specialists, each of whom is likely tobe concerned with protecting his own interests (the principal/agent problem).There are many arguments which can be advanced both for and against strategicplanning systems. The question is concerned with the potential benefits and coststo:
Individual specialists
Benefits:
• Opportunity to contribute within a recognised structure
• More information on other areas in the company
• Constraints on resources made explicit
• Opportunity to contribute to objective setting
Costs:
• Potential loss of control
• More accountability
The company
There is, of course, no empirical evidence from real life studies that planningitself will increase profitability. However, an explicit recognition of objectives, theallocation of resources consistent with these, and the development of control andfeedback systems may increase the probability of success. The attempt to identifyperformance gaps, pursue a general strategic thrust and consider contingenciescan help provide the company as a whole with a sense of common purpose.Opponents could argue that formal strategic planning will introduce rigidityand rob the company of any ability to react to changing circumstances; youwould need to stress that the strategic planning approach is more of a processthan a formalised planning structure.
Strategic Planning Edinburgh Business School A4/9
Appendix 4 / Guide to Strategic Planning Practice Final Examinations
Guide to Practice Final Examination 2
Section 1
Question 1: Analyse the current competitive position of Acme Plc using the Reportabove and the information in Exhibits 1 and 2.
Economic and Competitive Environment
The impact of the recent increase in economic activity on the demand for thecompany’s two products depends on their GNP elasticity. It is possible thatthe GNP elasticity of the Switch is relatively high, which could account for theunderestimate of demand for the Switch, with consequent under-production.The over-production of the Laser could have been due to an over-estimate ofits GNP elasticity. However, it is unlikely that changes in demand conditionsaccount for the fact that supply of Switches was about 20 per cent lower thandemand, while supply of Lasers was 30 per cent greater than demand.
Further increased sales as a result of continued improvement in economicconditions cannot be guaranteed because competitive pressures are expected toincrease. The Analyst’s concerns about increased foreign competition dependson barriers to entry, but he provides no information on these. The problemconfronting the company is that demand is increasing, but supply is likely toincrease by even more; the result would be a reduction in the equilibrium,or competing price. Even if the company were to achieve increased sales, theimpact of increased competition is likely to be a reduction in profit marginsas any monopoly profits are bid away. Apart from this the fact that com-petitors have been building up capacity has some ominous implications. Oncethe investment in production capacity and inventory has been made, competi-tors may start basing their prices on marginal cost thus increasing competitivepressure.
The Company
The overall financial performance of the company was one of the Analyst’sconcerns. A factor contributing towards the fact that Operating Surplus is muchlower than Gross Profit is hiring and line installation costs; if these had increasedfrom last year this could account for up to $0.5 million of the observed drop of$0.6 million in Operating Surplus. The Cash Flow position is distorted by thesale of a factory, which is simply a switch in the company’s portfolio of assets.The Net Cash Flow would have been about $1 million, which is similar to thecurrent Operating Surplus.
Ratio analysis shows that Return on Total Assets was 14 per cent and Returnon Owner Equity was 25 per cent. It is worthwhile to consider different scenar-ios, for example the Return on Total Assets would have been 20 per cent if thehiring, firing and line installation costs had not been incurred. The gearing ratiocan be assessed from the Balance Sheet and it emerges that debt comprises over
A4/10 Edinburgh Business School Strategic Planning
Appendix 4 / Guide to Strategic Planning Practice Final Examinations
40 per cent of total assets and 75 per cent of owner equity. The fact that debt isso high in relation to owner equity might pose constraints on future borrowing.
The fact that company supply is so far out of line with product demand sug-gests that there are some planning and control deficiencies. Overall profitabilitycould well be increased by improved resource management.
In summary the company could be making a much higher Operating Surplus,and has the potential to generate a substantial return on assets; but the debtposition may have an effect on the ability of the company to develop its productsfurther.
Products
Ratio analysis reveals that the Switch is making 49 per cent profit on salesvalue, while the Laser is making only 25 per cent. This is reflected in the grossprofit per unit: the Switch is making about $610 gross profit per unit, while theLaser is making only about $230. This difference could be due to cost factors,market conditions, or a combination of both. On the cost side, the labour forceon the Switch is working 17 per cent overtime, and the attrition rate is 8 percent compared to 2 per cent on the Laser. This suggests that the labour forceon the Switch is not so far up the experience curve as it might be, and hencethe Switch is being produced less efficiently than the Laser. On the market sidethe Switch has even more problems: it did not meet all of potential demand.Thus from both cost and market viewpoints the Switch could have been moreprofitable in relation to the Laser. A scenario could be used to estimate thepotential profitability of the Switch if sufficient numbers had been produced tomeet all demand and unit cost had been significantly lower; the scenario couldinclude price being set equal to competing price and lower product marketingexpenditure (with appropriate assumptions about the impact on market share).A case could be made for reallocating resources from the Laser to the Switch.
An attempt to locate the Switch and the Laser within the BCG matrix tointerpret their likely potential in terms of the product life cycle meets withsome difficulty. The problem is that the two products have virtually identicalmarket shares, but otherwise they are completely different. The price of theSwitch was below the competing level, and product marketing expenditure wasover twice that on the Laser; despite this the Switch’s Gross Profit was almosttwice that of the Laser. This could be due to the Laser being a Star or QuestionMark, i.e. it is struggling to maintain its relative position in a growing market,while the Switch is a Cash Cow, i.e. it has a relatively large market share in amature market; in that case, you would perhaps question the aggressive pricingand marketing policy adopted for the Switch.
The Tube is close to being launched in a highly competitive environment whileprojected unit cost is only $200 less than the competing price. Without beingprecise, the return on the Tube can be calculated roughly by first of all estimatinggross profit; this is done by multiplying market share by estimated market peakby the difference between competing price and unit cost. This comes to about$1 million per annum. At first sight this appears to be a high rate of returnon the projected development expenditure of $2.2 million. The problem is that
Strategic Planning Edinburgh Business School A4/11
Appendix 4 / Guide to Strategic Planning Practice Final Examinations
the profitability of this product is highly sensitive to relatively small changes inmarket share, unit cost and competing price. Furthermore, there is no guaranteethat the estimated market peak will be achieved, while the product life cyclemay be relatively short. Given that the estimated market size at launch will beonly 35 000 units, the minimum payback period for the Tube looks like beingthree years. Would it be worth undertaking a ‘crash’ development programmeof, say, $2 million, on the Tube in the last year of its development to buy moremarket share and start off with a lower production cost? It would be necessaryto develop scenarios based on higher market share and lower cost per unitto obtain a perspective on how much it would be worth spending. On theother hand, since past expenditure is sunk, the best course of action may be toabandon the Tube and allocate development expenditure to the Socket.
The Socket, on the other hand, has the potential to generate about $2.7 millionper year in gross profit, and the total investment in development at the currentrate of expenditure will be about $1.4 million. The problem is that it will beanother two years before the Socket comes on the market, and competitiveconditions may well have changed significantly by then. It may be worthaccelerating expenditure on the Socket to get it on the market sooner.
The company is currently spending about 10 per cent of sales revenue onthe development of the two products; the company is already deeply in debt,and unless it can increase its operating surplus a large increase in developmentexpenditure may cause it to start making losses. Furthermore, with only twoproducts in the development stage, and with uncertain product life cycles for thetwo products currently on the market, the company should be thinking aboutwhere new products are going to emerge from in the longer term, and howthese will be financed.
Competitive Position
The conclusions drawn in the preceeding discussion can be included in a SWOTanalysis.
Strengths
• Healthy Return on Assets and Return on Owner Equity
• Costs temporarily high due to hiring and line installation
• Switch is a cash cow
Weaknesses
• High gearing, which may constrain additional product development
• Resource allocation: Switch not meeting demand while Laser buildinginventories
• High attrition rate on Switch
• Tube sensitive to adverse outcome
• Socket two years from launch
A4/12 Edinburgh Business School Strategic Planning
Appendix 4 / Guide to Strategic Planning Practice Final Examinations
Opportunities
• Possibility of economic upturn
• Laser is a question mark or star
• Invest in Tube and Socket to improve characteristics and launch Socket early
Threats
• Increased competition from abroad
• Competitors building capacity
The alignment between strengths and opportunities, weaknesses and threatscan be assessed to evaluate Acme’ competitive position. For example, the oppor-tunities of developing the Laser into a cash cow and investing in the develop-ment projects require finance are reinforced by the healthy cash flow and thecurrent cash cow characteristics of the Switch; but the weakness of the exist-ing high gearing ratio may pose a constraint on pursuing these opportunities.The threat of increased competition highlights the weaknesses: unless resourceallocation is improved the price pressures will cause further reductions in prof-itability and Acme will find it difficult to diversify into the new product range.Is there a generic strategy choice which will enable Acme to improve its com-petitive position in the future? It could be concluded that Acme should pursuea corporate strategy of stability and focus on improving resource allocation andensuring that the cash cow characteristics of the Switch are capitalised on whilemanaging the Laser through the star stage.
Question 2: Compose an argument expressing the opposite point of view, making useof the company information.
This question is deliberately vague, and presents a rather confused argument.
The issue can be tackled using the basic model of costs and revenues:
Profit = Quantity× (Price − Unit Cost)
It is obvious from this that high volume products with a relatively smalldifference between unit cost and price can be more profitable than low volumeproducts with a large difference. The Laser has higher sales than the Switchbuts its Gross Profit is lower.
The performance of the company as a whole is not simply the sum of theindividual products because some costs, such as R&D, cannot be allocated toindividual products. It is therefore important to control overheads as well as toproduce and sell individual products efficiently. Acme appears to have incurredsignificant debts because in developing its new products. There is a trade offbetween making profits and investing for the future.
Taking Gross Profit figures for individual products at one point in time maynot reflect longer term marketing objectives, such as pricing low in order tomaintain or gain market share for a Star; costs may not be representative of long
Strategic Planning Edinburgh Business School A4/13
Appendix 4 / Guide to Strategic Planning Practice Final Examinations
term prospects because the product may still be relatively low on the experiencecurve.
The Gross Profit for each product may not be an accurate indicator of efficiencybecause accounting procedures can disguise how resources are being used, forexample when selling from inventory on a historic cost basis current Gross Profitmay not reflect current costs and revenues. The Switch sold from inventory andthe Laser increased inventories and this was not captured by the individualGross Profit figures.
However, when assessing what actually determines a company’s cash flow, itis necessary to ascertain where revenue is being generated, and at the end ofthe day this is due to the difference between unit cost and price. The behaviourof unit cost compared to competing price provides an indicator of the efficiencyof resource allocation compared with competitors. Cash flow is not necessarilya good indicator of competitive advantage.
Why would a strategy analyst make such a statement? He was attempting tofocus attention on the revenue generating potential of the company which is,in simple terms, the difference between what the company spends and what itearns. In the long run it stands to reason that cash flow must be positive.
Section 2
1. From the viewpoint of January 1993, would you regard the strategy oftransplanting a successful operation from the US as a failure
The Disney theme parks are often used as an example of excellence in manage-ment, with particular emphasis being placed on the ability of Disney employ-ees to deliver high quality service consistently. It is therefore of considerableimportance to determine if and why Euro Disney is in fact a failure in a differentmarket.
The first step is to decide on appropriate performance measures. One measureis simply the number of visitors; the park attracted 6.8 million visitors in itsfirst 24 weeks of operation, so in that sense it could be regarded as a fantasticsuccess. However, despite the large number, the costs incurred were greater thanrevenues and a loss of $23 million was made. But since costs do not vary muchwith numbers at the margin, this loss would have disappeared with another 0.5million attendances (ignoring the hotel profits), which is about 7 per cent. Thedifficulty with all market research is that it is subject to some margin of error,and to be wrong by 7 per cent in the start up phase of a very large projectis not unknown. The problem is the high sensitivity of profits to relativelysmall variations in attendance. If attendances had been 10 per cent higher theenterprise would have been in profit. In fact, the predictions about non-Frenchvisitors appeared to have been broadly correct. A further performance measureis hotel occupancy, which was 74 per cent; whether this was a good or badfigure depends on the break-even level of hotel occupancy.
It is possible that there was a weakness in the value chain which resulted in alower quality product being delivered at a higher cost. The fact that Euro Disney
A4/14 Edinburgh Business School Strategic Planning
Appendix 4 / Guide to Strategic Planning Practice Final Examinations
attracted millions of visitors, and was subject to the scrutiny of US executives,suggests that the delivered quality was similar to that elsewhere; the troublewas how that quality was perceived by Europeans.
Another way of looking at Euro Disney is that it is a new product in Europeand as such is near the start of its product life cycle. The shape of product lifecycles is notoriously difficult to predict, and it may well be that the ‘growth’stage is proving to be lengthier than predicted. It may be that the problem isthe rate of growth of the market rather than its ultimate size.
The financial loss is a performance measure, but it needs to be interpreted toput the figures in context. The loss is an outcome of the scale of the enterprise:to make the park attractive initially it was necessary to build it and provide thequantity of entertainment services which would make it worthwhile for peopleto come a long way to visit, therefore it had to be able to accommodate at least11 million. The company could not do anything about the consequent runningcosts to operate this scale of theme park. But if Euro Disney had been built to ascale consistent with, say, 8 million attendances the theme park might not havebeen able to produce the required appeal.
Euro Disney performance can also be assessed by using the process model ofstrategic planning. The initial objective was quite clear: to transplant the Disneyconcept to Europe and attract 11 million visitors in the first year. Subsequentlythere was some evidence of lack of direction at the top, with the reshuffleof top management in the face of what might have been short term financialproblems. The efficiency of the analysis and diagnosis aspect has been discussedabove, and it is a matter of judgement as to whether it could have beendone any better. The strategy choice – to go with a theme park more or lessidentical with its American counterparts – was subsequently adhered to with theappointment of the American executive in charge of running and merchandising.Resource allocation was constrained because of the need to build the total EuroDisney infrastructure, and the low marginal cost of additional visitors; whetherincreased resources devoted to marketing will achieve better results cannot bepredicted – this depends on the marginal cost of additional marketing (andmerchandising) and the marginal revenues which it generates. The managementwas slow to act on the feedback that the characteristics of Euro Disney did notentirely meet with approval from Europeans. Overall the strategy process had anumber of weaknesses which contributed to its relative lack of success comparedwith the US Disney parks.
Euro Disney is an example of international expansion which did not transfercompetitive advantage from one country to another. The fact that demandconditions were so different between the US and France meant that the highlysophisticated quality delivery system was simply delivering the wrong product.
Strengths
•
•
•
Strategic Planning Edinburgh Business School A4/15
Appendix 4 / Guide to Strategic Planning Practice Final Examinations
Weaknesses
•
•
•
•
•
Opportunities
•
•
•
Threats
•
•
2. Based on performance up to January 1993, would you expect Euro Disney to besuccessful in the long term?
The long term prospects of the market as reflected in the share price are notvery promising: by September the share price had fallen by half. Is the marketjustified in its pessimistic prediction? It is likely that the market initially valuedthe company on the basis of its success in America, but in the light of eventsexpectations have dropped to a lower level.
An analysis of internal factors can reveal the potential for long term prof-itability by changing the way the company is currently run. The first year’sresults suggested that total cost was:
$272 million (6.8 × 40) + $23 million(loss) = $295 million
A conservative estimate suggests that Euro Disney already has a full yearmarket of about 9 million visitors, generating revenues in the park of about $360million; whether this will generate a profit depends on the marginal cost of theadditional 2.2 million visitors. The marginal cost per visitor is probably very low,so it is difficult to conclude that it would be impossible eventually to generate atleast some profit on such an enterprise. But whether that profit would generatean adequate return on capital invested depends on the set up costs. One crucialissue is whether it will be possible to reduce operating costs without damagingthe quality of the product. The adverse publicity suggests that Euro Disney hadnot performed as well as it might in terms of quality. The misgivings about thetime spent queueing and the ‘American’ image are things the company can dosomething about; in fact, Euro Disney will probably have to take action not onlyto improve the delivery of the product, but to improve its perceived quality.
A4/16 Edinburgh Business School Strategic Planning
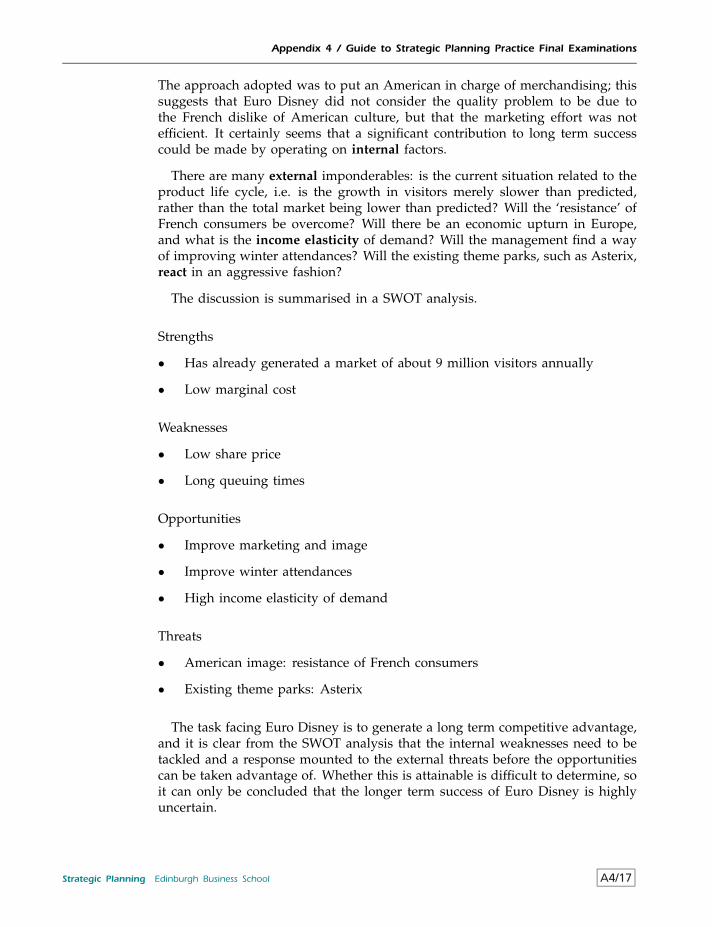
Appendix 4 / Guide to Strategic Planning Practice Final Examinations
The approach adopted was to put an American in charge of merchandising; thissuggests that Euro Disney did not consider the quality problem to be due tothe French dislike of American culture, but that the marketing effort was notefficient. It certainly seems that a significant contribution to long term successcould be made by operating on internal factors.
There are many external imponderables: is the current situation related to theproduct life cycle, i.e. is the growth in visitors merely slower than predicted,rather than the total market being lower than predicted? Will the ‘resistance’ ofFrench consumers be overcome? Will there be an economic upturn in Europe,and what is the income elasticity of demand? Will the management find a wayof improving winter attendances? Will the existing theme parks, such as Asterix,react in an aggressive fashion?
The discussion is summarised in a SWOT analysis.
Strengths
• Has already generated a market of about 9 million visitors annually
• Low marginal cost
Weaknesses
• Low share price
• Long queuing times
Opportunities
• Improve marketing and image
• Improve winter attendances
• High income elasticity of demand
Threats
• American image: resistance of French consumers
• Existing theme parks: Asterix
The task facing Euro Disney is to generate a long term competitive advantage,and it is clear from the SWOT analysis that the internal weaknesses need to betackled and a response mounted to the external threats before the opportunitiescan be taken advantage of. Whether this is attainable is difficult to determine, soit can only be concluded that the longer term success of Euro Disney is highlyuncertain.
Strategic Planning Edinburgh Business School A4/17
Appendix 4 / Guide to Strategic Planning Practice Final Examinations
Section 3
A discussion of objectives should touch on a number of topics, and a good essaywould cover several of the following points.
Without objectives a company has no explicit direction, and there may be nobasis for consistent decision making over time. The overall vision of what theorganisation is about is typically translated into a mission statement which givesa general direction to its allocation of resources; this mission statement thenleads to the specification of objectives which can be understood and acted on bymanagement.
The following factors affect objective setting: the size of company, corpo-rate versus SBU objectives and risk aversion. Objectives are not necessarilyimmutable once they have been determined, but can be adjusted in the light ofchanging circumstances. Objectives are typically set by the top layer of man-agement; the type of objectives pursued are to some extent determined bythe characteristics of decision makers, for example prospectors as opposed toanalysers. Techniques such as gap analysis can be used in the process.
It is necessary to distinguish between means and ends. There are many pos-sible dimensions to objectives: financial objectives, economic and non-financialobjectives, social objectives, behavioural objectives, measurable objectives andethical considerations. All organisations face the problem of ensuring that indi-viduals act in accordance with objectives; this is the principal/agent problem.Some issues which relate to overcoming the principal/agent problem are credibleand achievable objectives, disaggregated objectives, feedback and communica-tion, evaluation and incentives.
A4/18 Edinburgh Business School Strategic Planning
Index
accounting practices 6/14accounting ratios 6/18–21accounting report 1/25, 1/29acquisition 7/19advance capacity 7/8alliances 5/14, 7/23Amstrad case study 7/44, A2/62–63analyser (manager type) 7/15–16Apple computer case study 5/64–65, A2/25–27
balanced scorecard 8/30barriers
strategic 5/51structural 5/51
barriers to entry 5/48–53BCG relative share growth matrix 5/35–38benchmarking 6/21–22Beta coefficient 3/24Body Shop case study 8/24–25, A2/71–74bounded rationality 1/11, 3/20, 6/36break-even analysis 6/16–17budgets 8/8–9business cycles 4/23–25
capacity utilisationand synergy 6/43
capital asset pricing 3/24capital, cost of 3/23–25capital rationing 1/41–42, 8/8capitalised value 3/22–23cash cow (product type) 5/36, 5/38–40, 7/31cash flow 1/31, 3/22, 3/25–26, 3/28, 5/39,
8/17causal ambiguity 6/51CEO’s statement 1/25, 1/28, 1/29change, management of 8/6–7combination strategies 7/10companies, evolution of 2/9–10competences 6/44–46competition 5/58
analysis of 8/19–23oligopoly 5/54perfect 5/48–50
competitive advantage 6/50competitive advantage of nations 4/19–21competitive bidding 1/41competitive position 8/19–23
competitive price 4/29competitive reaction
kinked demand curve 5/16–17competitive threat 7/7consensus decisions 7/41–42consumption expenditure 4/29contingency planning 7/37–38control, and evaluation 8/12–14core business 1/45core competence 6/44–46corporate management 7/30–33
and synergy 6/42corporate strategy 1/40–47
portfolio models and 5/39–41cost push 4/15costs
and economic activity 4/30fixed 6/4production 6/14–15and revenue 4/3–4sunk 6/4variable 6/4
crises 1/31–33critical success factors 2/2, 3/9, 8/7culture
personal 6/34power 6/34role 6/34task 6/34
defender (manager type) 7/14–16demand
factors 5/5–6and output 6/32, 6/33and supply 4/10–12
demand curve 5/3–13, 5/38, 5/46elasticity 5/4estimating 5/12–13kinked 5/16–17and market share 5/8–9and marketing expenditure 5/10–12and revenue 5/6–8shift of and shift along 5/11
demand pull 4/15demand related unemployment 4/12development 6/26–31, 6/54
cost overruns 1/32
Strategic Planning Edinburgh Business School I/1
Index
report 1/26, 1/28development engineer 6/27discounting 3/21distinctive capabilities 6/44–46diversification 1/43, 5/42, 6/40–41
replication based 6/48resource based 6/47routine based 6/47trajectory 6/49unrelated 6/48
divisional structure 8/4divisionalisation 1/43dog (product type) 5/36, 5/36, 5/39–40, 7/9,
7/31dominant management logic 1/45, 6/40durability 5/34dynamical systems 1/23
ecological concern 3/30economic indicators 4/7, 4/34economic report 1/26, 1/28economics 4/2–3economies of scale 6/11–13, 7/8
and synergy 6/42economies of scope 6/13economy
forecasting 4/21–25international 4/16–21and profitability 4/27–31workings of 4/4–21
elasticitydemand curve 5/4GNP 4/28supply 5/44
emergent strategy 1/10environment, economic 4/2–3environmental scanning 4/26environmental threat and opportunity profile 4/2,
4/31–33, 5/62–64, 7/3environmental threats and opportunities A4/2–3ethics 3/38evaluation
and control 8/12–14exchange rate fluctuations 4/17–19, 4/32Exchange Rate Mechanism (ERM) 1/19exogenous shocks 4/23, 6/12, 6/15expansion 7/8–9
international 7/23–25expectations 4/13expected utility maximisation 7/36expected value 7/35experience effects 6/11–13, 7/8
exports 4/6external action 7/19external dependence 7/39externalities 5/55
familiarity matrix 7/31feedback 2/2finance report 1/26, 1/28financial controls 6/27, 8/13first mover advantage 6/13, 6/27five forces 5/57fixed cost 6/4focus strategy 7/13forecasting, economic 4/21–25foreign GNP 4/17frictional unemployment 4/12functional structure 8/3, 8/4
game theory 5/13–15competitive reaction 5/13–15
gap concept 3/7–10gearing ratio 6/21generic strategies 7/5–16
assessing 7/10and company performance 7/16product-based 7/11–13SBUs 7/14–16
globalisation 1/47government
and allocating 5/56expenditure 3/2and market failure 5/54and regulating 5/55and rule making 5/54
gross national product (GNP) 4/10–12elasticity 4/28–29foreign 4/17full employment 4/10potential 4/10
growth vector 5/41
hedonic price index 5/28historical cost 6/14horizontal integration 6/36–38human resource management 6/33
imports 4/6incentives 8/9
and performance gaps 3/10inflation rate 4/5, 4/7, 4/8, 4/11
relative 4/17and unemployment 4/13–16
I/2 Edinburgh Business School Strategic Planning

Index
information, qualitative and quantitative 1/35innovative stimulus, and synergy 6/43input prices, and economic activity 4/30integration 1/37–38, 6/36–38, 6/42interest rate 3/21, 3/23, 3/23internal action 7/19internal analysis 6/2–61
company characteristics 6/21–22international economy 4/16–21international expansion 7/23–25inventories 6/7–8investment appraisal 6/18, 6/23investment expenditure 4/7
Jaguar case study 7/44–45, A2/64–65joint production 6/15
and synergy 6/43joint ventures 7/23
labour relations 1/32labour turnover 6/54launch strategy 5/22leading indicator 4/22learning effect 6/15, 6/28limit pricing 5/18logical incrementalism 2/3Lymeswold Cheese case study 5/66–67,
A2/35–60
macroeconomics 4/7management style 8/7managerial perceptions 7/38–42managerial power relationships 7/40managers
classification 7/15roles of 2/11
manpower report 1/27, 1/29marginal analysis 6/5–8marginal cost 6/5–8marginal product, diminishing 6/8–10market 5/3
definition 5/33–34failure 5/54mature 7/6overextended 7/9perfect 5/48and prices 5/45–47structures 5/47–54
market analyst’s report 1/30market performance, evaluation 8/14market share 4/29, 5/9
and demand curve 5/8–9
Market Value Added (MVA) technique 3/28marketing expenditure, and demand curve
5/10–12marketing manager 6/27marketing report 1/26, 1/29maximisation 3/19–20means and ends 3/17–18, 3/38military strategy 1/15minimax 7/39model(ling) 2/1–7
benefits and costs 2/4components 2/2–4
monopoly 5/50–51moral issues 3/38
national income 4/10national output 4/10net contribution 8/15–16net present value (NPV) 3/22, 6/3, 6/18net revenue 6/28new entrants 5/58
objectives 3/2–42aggregate 3/13behavioural 3/18credible 3/10disaggregate 3/14economic 3/18–20financial 3/18, 3/21–29non-quantifiable 3/11–13and plans 3/2quantifiable 3/11–13social 3/29–30
oligopoly 5/54operations report 1/29opportunity cost 6/2–4, 7/10organisational structure 8/3–11output, and demand 6/32, 6/33overall cost leadership 7/11overtime 6/15
paradox of voting 7/41parenting advantage 1/46pay back period 6/17penetration 5/41performance
assessment 1/25–27projections 3/8
performance gaps 3/7–10, 7/6, 7/30external v internal 3/9and incentives 3/10and resources 3/9
Strategic Planning Edinburgh Business School I/3

Index
PEST 4/2, 4/25Phillips curve 4/13–15plans, and objectives 3/2portfolio models 5/34–43
BCG model 5/35–43and corporate strategy 5/39–41limitations 5/39
portfolio planning 1/44predatory pricing 5/18present value 3/21
net 3/22price leadership 5/17price war 5/14price(s)
determination 5/45fluctuations 5/45and markets 5/45–47in segments 5/23–24
pricing, internal 6/37principal/agent problem 3/15–17, 3/34, 5/55probability
subjective 7/35product differentiation 5/21–23, 7/11product information 5/43product life cycle 5/31–34, 7/9
growth stage 5/36static stage 5/36
product portfolio 7/10product quality 5/24–31product replacement 5/41production costs 6/14–15production report 1/27profit 8/15
maximisation 3/19–20, 6/10profitability
and economy 4/27–31evaluation 8/15–17
project appraisal 7/32prospector (manager type) 7/14–16
quality 5/24–31dimensions of 5/27–28product-based 5/25production-based 5/26and strategy 5/29–31transcendent 5/24user-based 5/26value-based 5/26–27
question mark (product type) 5/36, 5/37, 5/39,7/31
rational choice 7/2
reactor (manager type) 7/14–16replacement demand 5/34reputation 6/50research 6/24–26, 6/53
indicative factors 6/26report 1/26, 1/28
resource allocation 8/6and shareholder wealth 7/27–30and value creation 7/29
resource based strategy 1/12resources
management 6/31–33and performance gaps 3/9planning 8/11
restructuring 1/44retrenchment 7/9return on capital employed (ROCE) 6/19return on investment (ROI) 6/19return on net assets (RONA) 6/19return on total assets (ROTA) 6/19revenue 6/28
and costs 4/3–4and economy 4/28–30and GNP elasticity 4/28
riskanalysis 7/34–38attitudes to 7/39–40aversion 7/36diversifying 7/8non-diversifiable 3/24
salesand economy 4/28–29targets 8/10–11
salmon farming case study 5/65–66, A2/27–35,A2/59
satisficing 3/20scenario 3/8, 3/9, 4/27, 4/30, 7/34segmentation 5/18–24
pricing 5/23–24selling product inventory 6/7–8sensitivity analysis 6/23–24series decomposition 4/23shareholder value 3/13shareholder wealth 3/13, 3/26–29, 7/27–30
estimating 3/27and resource allocation 7/29and strategy options 7/26
skill set 3/4stakeholders 3/13, 3/26, 3/31star (product type) 5/36, 5/38, 5/39, 7/31strategic advantage profile (SAP) 6/53–55, 7/3,
I/4 Edinburgh Business School Strategic Planning

Index
A1/4strategic architecture 6/49strategic barriers 5/53strategic business units (SBUs) 6/10
and corporate strategy 1/40generic strategies 7/5–16management 7/33
strategic groups 5/60–61strategic options
identifying 7/17–25related and unrelated 7/17–19
strategic planninganalysis 1/35–37choice 7/26–42company benefits of 1/47and crises 1/31–33decision-making process 1/23–39dynamics 1/23–25elements of 1/33evaluation 1/38and evolution of company 2/9individual benefits of 1/48integration 1/37models 2/1–7nature of 1/6origins of 1/15payment for 1/48and quality 5/29–31research 1/18scientific approach 1/17–21and shareholder wealth 7/27–30structure 1/33
strategists 2/10–13strategy makers 2/8–13strategy report A1/1–6strengths, weaknesses, opportunities and threats
(SWOT) 7/3–4, A4/5–6structural analysis 5/57–59structural barriers 5/51, 5/53
structural unemployment 4/12substitute products 5/58sunk cost 6/4supply 5/44
and demand 4/10–12supply curve 5/43
elasticity 5/44shifts 5/44strategy and 5/44
synergy 1/43, 6/41–42components of 6/42–43empirical evidence 6/43–44
tactics 1/15takeovers 7/19–22tame problems 1/13top management 1/47–49total quality management (TQM) 5/30–31transfer payments 4/6
uncertain imitability 6/51uncertainty analysis 7/34–38unemployment
and inflation 4/13–16unemployment rate 4/7, 4/10, 4/13
value chain 6/38–40value creation, and resource allocation 7/29variable cost 6/4variable input 6/4vertical integration 6/36–38
and synergy 6/42voting paradox 7/41–42
wage inflation rate 4/15–16wage rate 4/3wicked problems 1/13
zero sum game 5/13
Strategic Planning Edinburgh Business School I/5

Related Documents