1 Earthquake CIVIL 6 TH SEM. LEARNING OUTCOMES After undergoing the subject, students will be able to: Classify the earthquakes Explain seismic behavior of traditionally built constructions Supervise construction of earthquake resistant buildings Monitor reinforcement detailing in earthquake resistant structures Manage all rescue operation caused due to earthquake 1.1 EARTHQUAKE is the disturbance that happens at some depth below the ground level which causes vibrations at the ground surface. These vibrations happen in all the directions and are totally uncertain. The location, time, duration, magnitude and frequency of earthquake are totally unknown. Also, these vibrations are momentary, happening for a short while. It should be noted that earthquakes are totally unpredictable. Earthquake is the shaking or trembling caused by the sudden release of energy below the ground. It is usually associated with faulting or breaking of rocks. Continuing adjustment of position results in aftershocks. Fig. 1explains some terminologies in the field of earthquake engineering.

Welcome message from author
This document is posted to help you gain knowledge. Please leave a comment to let me know what you think about it! Share it to your friends and learn new things together.
Transcript
1
Earthquake CIVIL 6TH SEM. LEARNING OUTCOMES
After undergoing the subject, students will be able to:
Classify the earthquakes
Explain seismic behavior of traditionally built constructions
Supervise construction of earthquake resistant buildings
Monitor reinforcement detailing in earthquake resistant structures
Manage all rescue operation caused due to earthquake
1.1 EARTHQUAKE is the disturbance that happens at some depth below the ground level
which causes vibrations at the ground surface. These vibrations happen in all the directions and
are totally uncertain. The location, time, duration, magnitude and frequency of earthquake are
totally unknown. Also, these vibrations are momentary, happening for a short while. It should
be noted that earthquakes are totally unpredictable. Earthquake is the shaking or trembling
caused by the sudden release of energy below the ground. It is usually associated with faulting
or breaking of rocks. Continuing adjustment of position results in aftershocks. Fig. 1explains
some terminologies in the field of earthquake engineering.
2
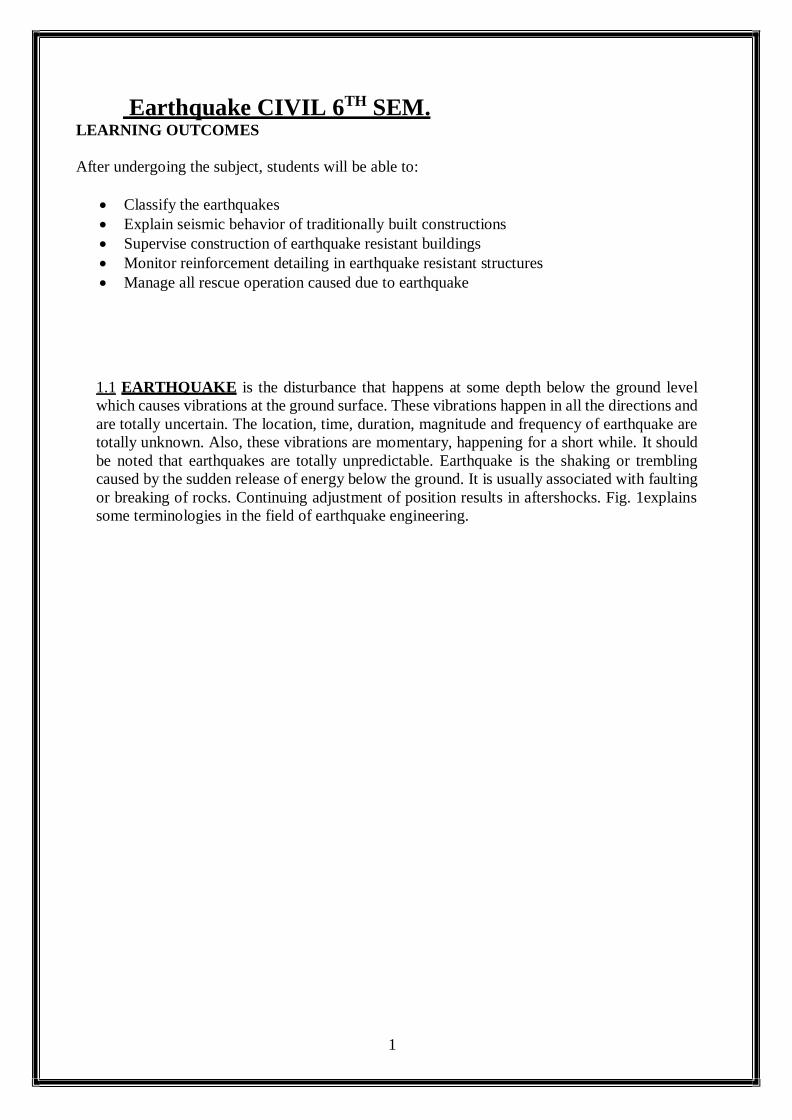
1.1.1 Focus or Hypocenter: It is the location from where earthquake originates. The point
within Earth where faulting begins is the focus, or hypocenter. It may be a point, line or a plane.
It will be deep below the earth surface.
1.1.2 Epicenter: It is the projection of focus on the surface of earth. It is a point which is closest
to point of release of energy. The point directly above the focus on the surface is the epicenter.
1.1.3 Focal Depth: Distance between focus and epicenter is the focal depth. The closer the
focal depth, more damaging is the earthquake.
1.1.4 Epicentral Distance: Distance between point of interest and epicenter is called
Epicentral Disatnce.
Fig. 1 : Terminologies in Earthquake Geotechnical Engineering
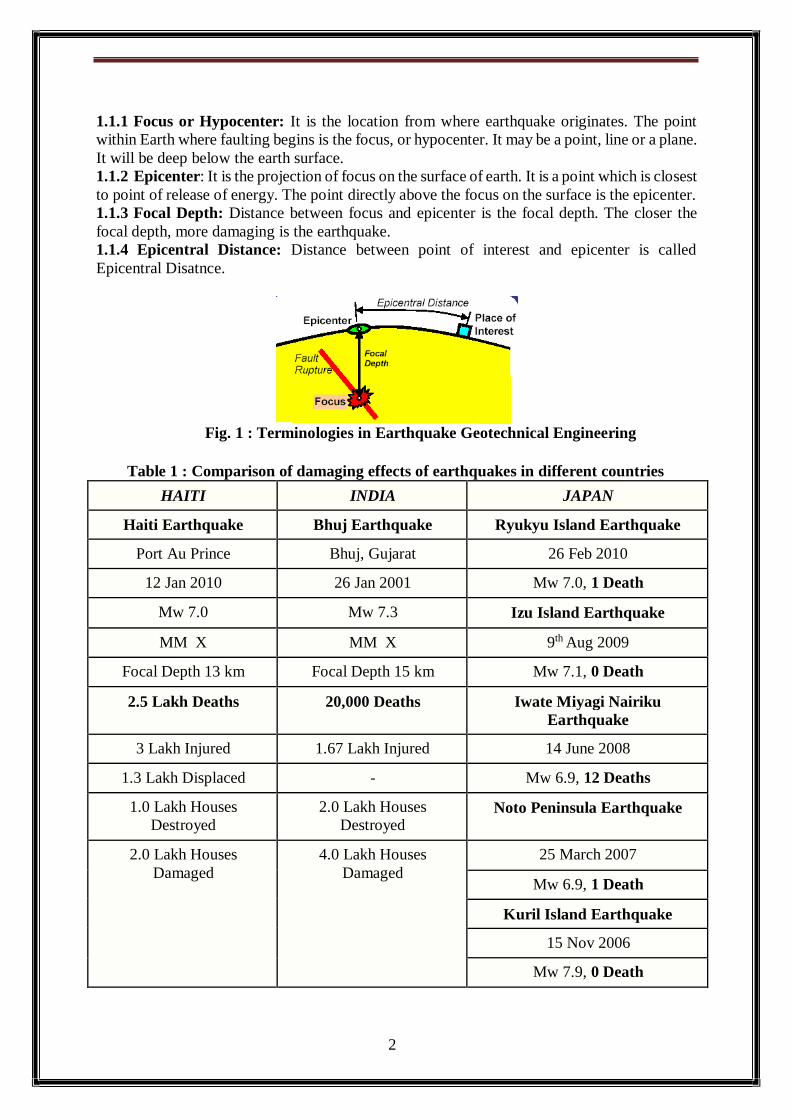
Table 1 : Comparison of damaging effects of earthquakes in different countries
HAITI INDIA JAPAN
Haiti Earthquake Bhuj Earthquake Ryukyu Island Earthquake
Port Au Prince Bhuj, Gujarat 26 Feb 2010
12 Jan 2010 26 Jan 2001 Mw 7.0, 1 Death
Mw 7.0 Mw 7.3 Izu Island Earthquake
MM X MM X 9th Aug 2009
Focal Depth 13 km Focal Depth 15 km Mw 7.1, 0 Death
2.5 Lakh Deaths 20,000 Deaths Iwate Miyagi Nairiku
Earthquake
3 Lakh Injured 1.67 Lakh Injured 14 June 2008
1.3 Lakh Displaced - Mw 6.9, 12 Deaths
1.0 Lakh Houses
Destroyed
2.0 Lakh Houses
Destroyed Noto Peninsula Earthquake
2.0 Lakh Houses
Damaged
4.0 Lakh Houses
Damaged
25 March 2007
Mw 6.9, 1 Death
Kuril Island Earthquake
15 Nov 2006
Mw 7.9, 0 Death
3
Table 1 presents a list of big earthquakes that hit different parts of the globe in recent times.
The list is prepared considering only a few earthquakes that had similar magnitude and focal
depths. It means that the energy released was similar and from similar depths. Hence, the effects
of these earthquakes at the ground level were also similar. What is shocking to note is the
comparison of number of deaths. In Haiti, one out of twelve from capital city Port Au Prince perished leading to 2.5 Lakh casualities, while in India the total death was about 20000. In
contrast, the number of deaths in Japan due to earthquake was insignificant. An inference can
be made that the knowledge about earthquake engineering among engineers and awareness
about importance of earthquake engineering among policy makers and general public is
essential. However, the recent earthquake in Japan on 11th March 2011 had different effect killing more than 25000 people. Some details about this great earthquake are furnished below.
1.1.5 Some vital statistics about Great Japan earthquake of March 2011
Magnitude : 9.0
Intensity : > X
Date : Friday, the 11th March 2011
Time : 11.30 am in Japan (8.00 am IST)
Focal Depth : 24.4 km Region : Near east coast of Honshu Island, Japan, 130 km east of Sendai, 178 kn east of
Yamagata, 178 km east north east of Fukushima, 373 km North east of Tokyo
Death Toll : More than 25000
Evacuated : About 5 Lakh People
Infrastructure : Entire towns were wiped off the map, Houses, cars, ships, buildings were
washed away, roads buckled, highway collapsed, power line tangled, railway track damaged
(1.2 Lakh houses damaged, 15000 houses completely destroyed)
Insured loss : USD 35 Billion (175000 Crore Rupees)
Overall loss : USD 350 Billion (1750000 Crore Rupees)
Honshu Island moved by 2.4 m
Duration of shaking 3 to 5 minutes
Number of after shocks > 400 and some with magnitudes of 7.2
Change in length of day caused by redistribution of earth mass : 1.8 microsecond shorter
It can therefore be inferred that we are still in the process of understanding the nature. Nature
this time was furious on Japan and resulted in a very large earthquake, fourth biggest.
Top five earthquakes ever recorded on earth were
1. Mw9.5 Chile, 5th May 1960, 1600 Killed, 20 Lakh Homeless
2. Mw 9.2 Prince William Sound, Alaska, 27th March 1964, 128 Killed, Tsunami
3. Mw 9.1 Sumatra, 26th Dec 2004, 2.2 Lakh Killed
4. Mw 9.0 Kamchatka Peninsula, Russia, 4th Nov 1952
5. Mw 9.0 Tohoku earthquake, Japan, 11th March 2011
1986 Chernobyl disaster ranked 7, which is the highest in terms of severity in Nuclear
Radiation. Fukushima Power Plant disaster was also ranked more than 6 for Nuclear radiation
indicating that the severity of radiation in Japan was close to the worst.
Table 2 presents some of the popular earthquakes that were eye openers to researchers, policy
makers and general public. Each of these earthquakes had some special features that helped

4
in enhancing the knowledge. Always, it is possible to learn from failures and the below
detailed earthquakes caused many failures.
Table 2: Summary of specialties of different earthquakes
Sl
No
Name Date Location Specialty
1 Kanto earthquake 1 Sep
1923
7.9 Mw One of the first recorded earthquakes with huge number of deaths.
Most deaths were due to fire
2 Hyogo Ken
Nambu
earthquake
Great Hanshin
earthquake
Kobe earthquake
17 Jan
1995 6.8 Mw Earthquake happened exactly one year
after Northridge earthquake in the US.
Japanese experts then had felt that
earthquake management in Japan is better
Japanese experts were shamed due to
more than 5000 deaths
Most deaths were due to fire accident
3 Bhuj earthquake
Gujarath
earthquake
26 Jan
2001 7.2 Mw An eye opener to politicians &
administrators
All the earth dams near epicenter (50 km
radius) were severely damaged
Several newly constructed apartment
buildings in Ahmedabad (200 km away
from epicenter collapsed)
4 Sumatra
earthquake
26 Dec
2004
9.1 Mw 4th largest earthquake magnitude-wise
Caused Tsunami that took away more
than 2 lakh lives
After shocks as big as 8 Mw recorded for
years
5 Haiti earthquake 13 Jan
2010
7.0 Mw Clear indication of lack of knowledge in
earthquake engineering.
More than 2.5 lakh people in the capital
city Port Au Prince were killed (out of 30
Lakhs).
Even after two years the country has not
come to normalcy
6 Christchurch
earthquake
Canterbury
earthquake
22 Feb
2011 4 Sept 2010
6.3 Mw Focal depth among the smallest (5 km)
Widespread liquefaction and Liquefaction
of already liquefied ground
7 Super earthquake
Great East Japan
Earthquake
11 Mar
2011 9.0 Mw 5th largest earthquake ever recorded
Nuclear radiation due to damage to
Fukushima nuclear reactor.
Tsunami waves as high as 20 m
Many permanent structures performed
very well
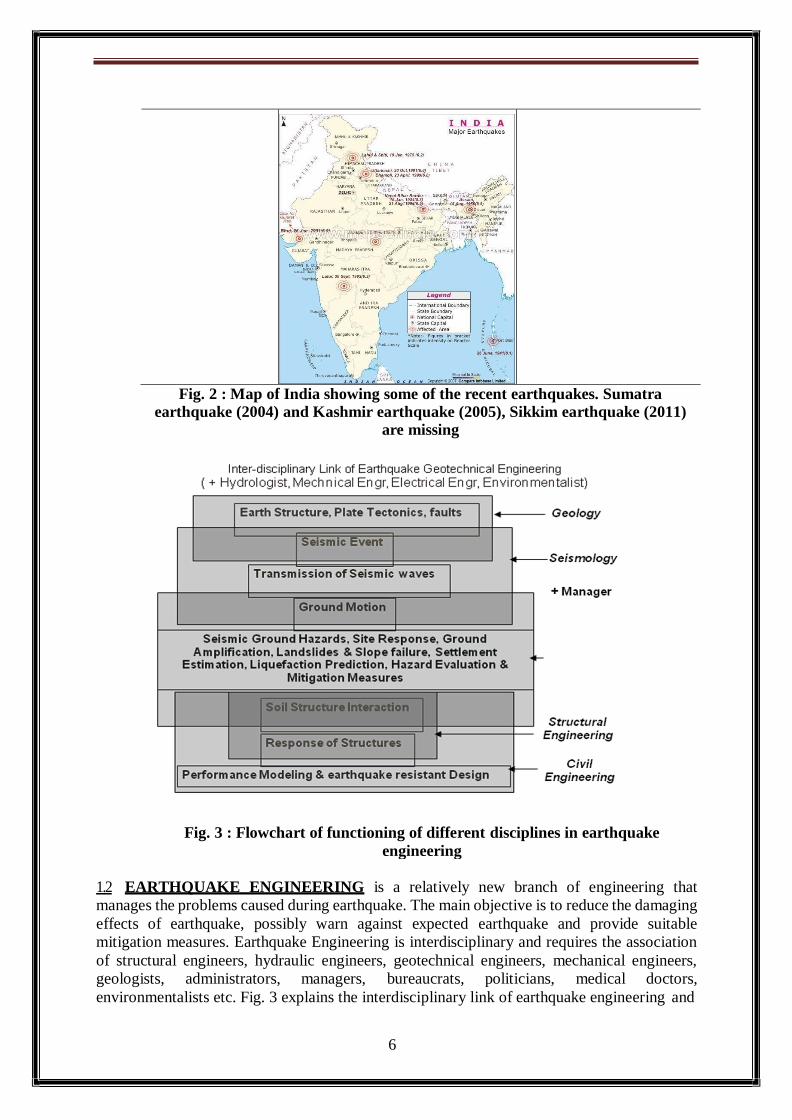
Fig. 2 presents the map of India with the epicenters of most recent earthquakes that hit India.
Sumatra earthquake of 2004, Kashmir earthquake of 2005 and the most recent Sikkim
5
earthquake of 2011 are missing. Sumatra earthquake and Kashmir earthquake had their
epicenters outside of India.
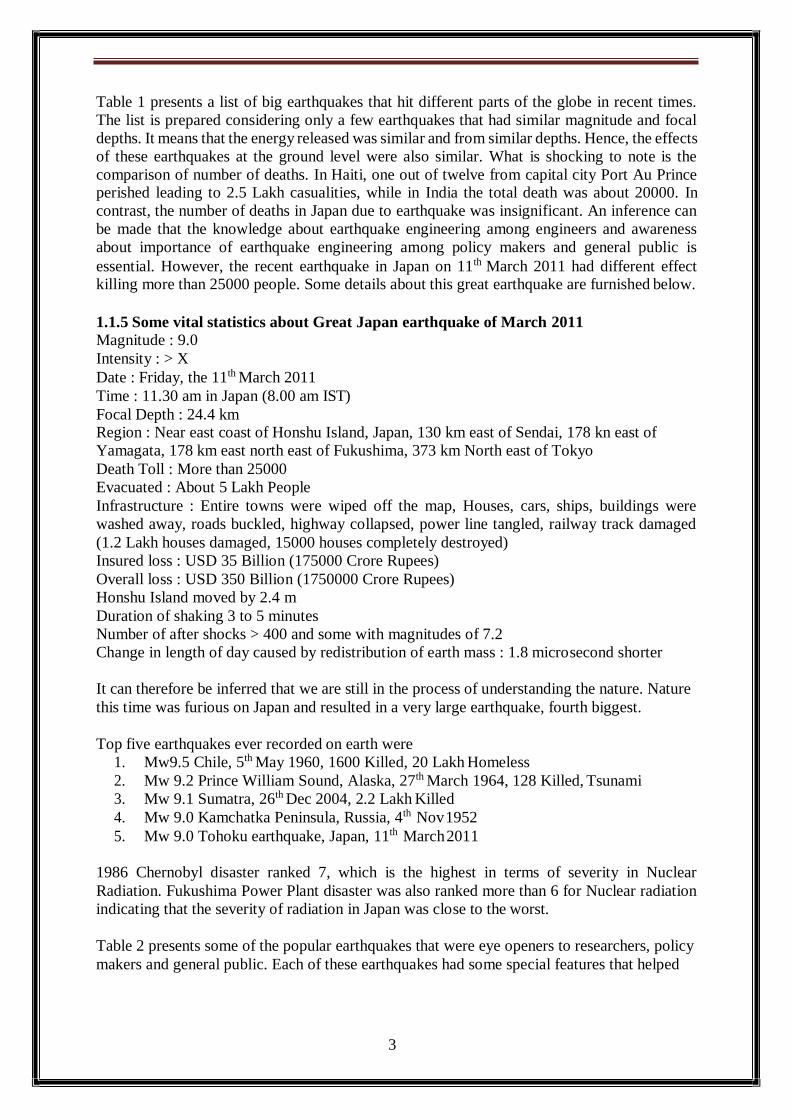
Table 3 provides the list of past earthquakes that affected India. It can be noticed that there
were many earthquakes with magnitudes greater than 6 in about four hundred years indicating
that India is not free from huge earthquakes.
Table 3: List of past earthquakes that affected India
Year Place Magnitude Intensity Other Features
1618 Bombay - - 2000 lives lost
1720 Delhi 6.5 - some lives lost
1737 Bengal - - 300,000 lives lost
1803 Mathura 6.5 - The shock felt up to Calcutta.
1803 Kumaon 6.5 - Killed 200-300 people.
1819 Kutchch 8.0 XI Towns of Tera, Kathara & Mothala razed to ground.
1828 Srinagar 6.0 1000 people killed.
1833 Bihar 7.7 X Hundreds of people killed
1848 Mt.Abu, 6.0 - Few people killed
1869 Assam 7.5 - Affected an area of 2,50,000 Sq. miles.
1885 Srinagar 7.0 - Kamiarary area destroyed.
1897 Shillong 8.7 XII Wide spread destruction in Shillong.
1905 HP 8.0 XI Thousands of people killed.
1906 HP 7.0 - Heavy damage.
1916 Nepal 7.5 - All houses collapsed at Dharchulla.
1918 Assam 7.6 - Heavy damage.
1930 Dhubri,
Meghalaya 7.1 IX Heavy damage in Dhubri.
1934 Bihar, Nepal 8.3 XI Large number of border area people killed.
1935 Quetta (Pak) 7.5 IX 25,000 people killed
1941 Andaman 8.1 X Very heavy damage.
6
Fig. 2 : Map of India showing some of the recent earthquakes. Sumatra
earthquake (2004) and Kashmir earthquake (2005), Sikkim earthquake (2011)
are missing
Fig. 3 : Flowchart of functioning of different disciplines in earthquake
engineering
1.2 EARTHQUAKE ENGINEERING is a relatively new branch of engineering that
manages the problems caused during earthquake. The main objective is to reduce the damaging
effects of earthquake, possibly warn against expected earthquake and provide suitable
mitigation measures. Earthquake Engineering is interdisciplinary and requires the association
of structural engineers, hydraulic engineers, geotechnical engineers, mechanical engineers,
geologists, administrators, managers, bureaucrats, politicians, medical doctors,
environmentalists etc. Fig. 3 explains the interdisciplinary link of earthquake engineering and
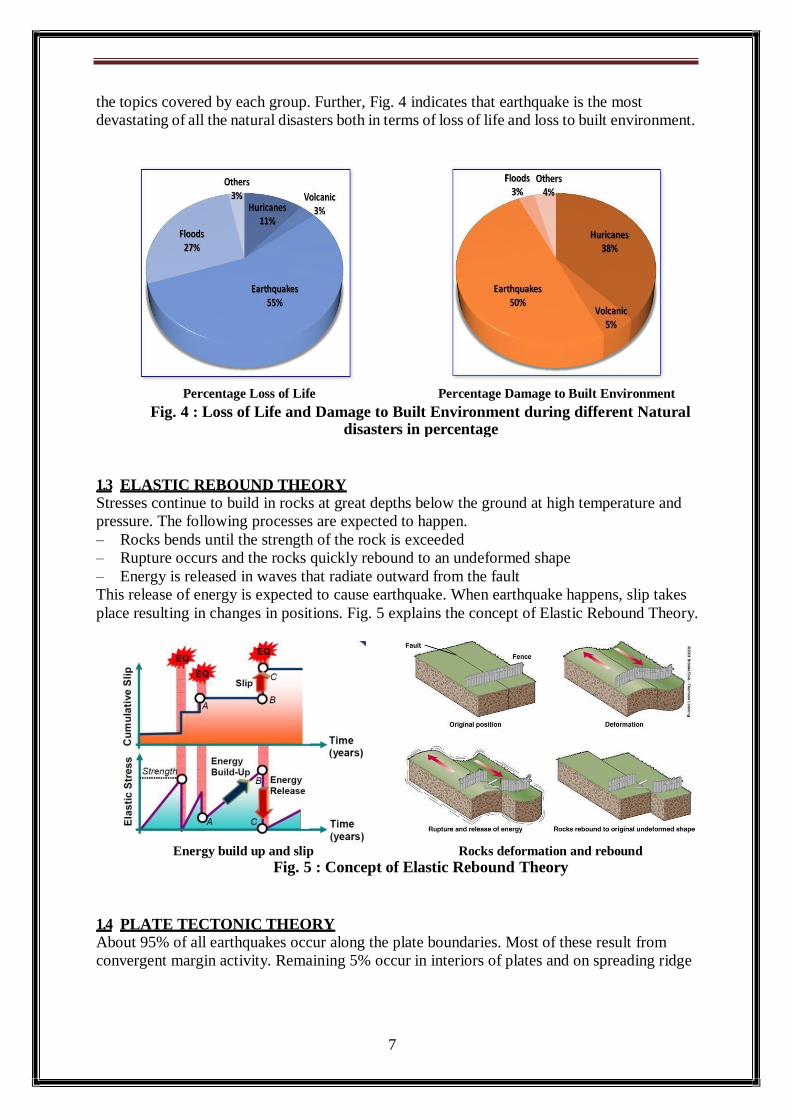
7
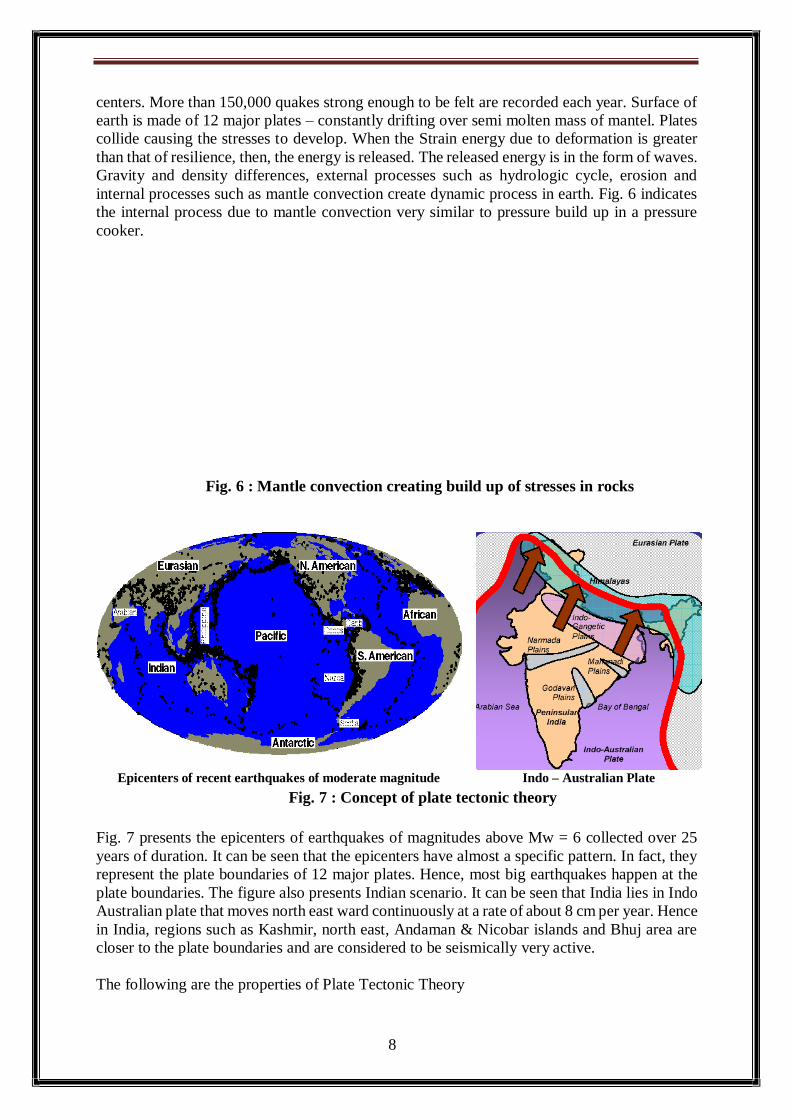
the topics covered by each group. Further, Fig. 4 indicates that earthquake is the most
devastating of all the natural disasters both in terms of loss of life and loss to built environment.
Percentage Loss of Life Percentage Damage to Built Environment
Fig. 4 : Loss of Life and Damage to Built Environment during different Natural disasters in percentage
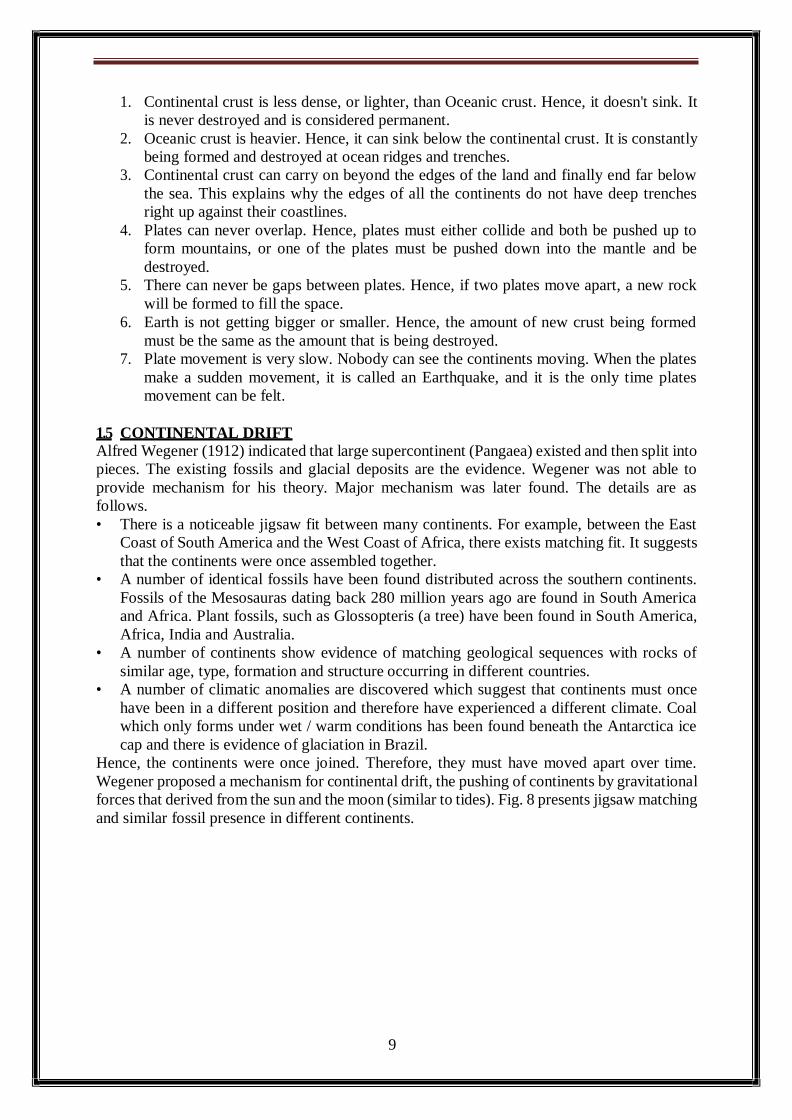
1.3 ELASTIC REBOUND THEORY
Stresses continue to build in rocks at great depths below the ground at high temperature and
pressure. The following processes are expected to happen.
– Rocks bends until the strength of the rock is exceeded
– Rupture occurs and the rocks quickly rebound to an undeformed shape
– Energy is released in waves that radiate outward from the fault
This release of energy is expected to cause earthquake. When earthquake happens, slip takes
place resulting in changes in positions. Fig. 5 explains the concept of Elastic Rebound Theory.
Energy build up and slip Rocks deformation and rebound
Fig. 5 : Concept of Elastic Rebound Theory
1.4 PLATE TECTONIC THEORY
About 95% of all earthquakes occur along the plate boundaries. Most of these result from
convergent margin activity. Remaining 5% occur in interiors of plates and on spreading ridge
8
centers. More than 150,000 quakes strong enough to be felt are recorded each year. Surface of
earth is made of 12 major plates – constantly drifting over semi molten mass of mantel. Plates
collide causing the stresses to develop. When the Strain energy due to deformation is greater
than that of resilience, then, the energy is released. The released energy is in the form of waves.
Gravity and density differences, external processes such as hydrologic cycle, erosion and
internal processes such as mantle convection create dynamic process in earth. Fig. 6 indicates
the internal process due to mantle convection very similar to pressure build up in a pressure
cooker.
Fig. 6 : Mantle convection creating build up of stresses in rocks
Epicenters of recent earthquakes of moderate magnitude Indo – Australian Plate
Fig. 7 : Concept of plate tectonic theory
Fig. 7 presents the epicenters of earthquakes of magnitudes above Mw = 6 collected over 25
years of duration. It can be seen that the epicenters have almost a specific pattern. In fact, they
represent the plate boundaries of 12 major plates. Hence, most big earthquakes happen at the
plate boundaries. The figure also presents Indian scenario. It can be seen that India lies in Indo
Australian plate that moves north east ward continuously at a rate of about 8 cm per year. Hence
in India, regions such as Kashmir, north east, Andaman & Nicobar islands and Bhuj area are
closer to the plate boundaries and are considered to be seismically very active.
The following are the properties of Plate Tectonic Theory
9
1. Continental crust is less dense, or lighter, than Oceanic crust. Hence, it doesn't sink. It
is never destroyed and is considered permanent.
2. Oceanic crust is heavier. Hence, it can sink below the continental crust. It is constantly
being formed and destroyed at ocean ridges and trenches.
3. Continental crust can carry on beyond the edges of the land and finally end far below
the sea. This explains why the edges of all the continents do not have deep trenches
right up against their coastlines.
4. Plates can never overlap. Hence, plates must either collide and both be pushed up to
form mountains, or one of the plates must be pushed down into the mantle and be
destroyed.
5. There can never be gaps between plates. Hence, if two plates move apart, a new rock
will be formed to fill the space.
6. Earth is not getting bigger or smaller. Hence, the amount of new crust being formed
must be the same as the amount that is being destroyed.
7. Plate movement is very slow. Nobody can see the continents moving. When the plates
make a sudden movement, it is called an Earthquake, and it is the only time plates
movement can be felt.
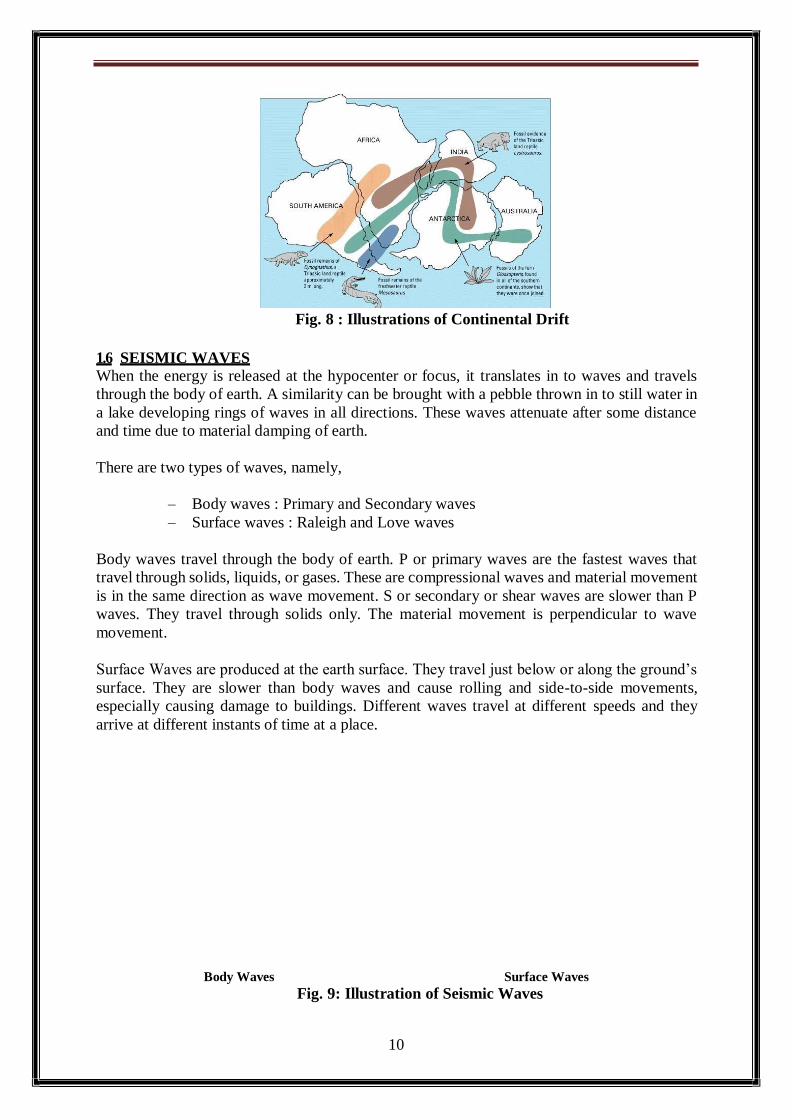
1.5 CONTINENTAL DRIFT
Alfred Wegener (1912) indicated that large supercontinent (Pangaea) existed and then split into
pieces. The existing fossils and glacial deposits are the evidence. Wegener was not able to
provide mechanism for his theory. Major mechanism was later found. The details are as
follows.
• There is a noticeable jigsaw fit between many continents. For example, between the East
Coast of South America and the West Coast of Africa, there exists matching fit. It suggests
that the continents were once assembled together.
• A number of identical fossils have been found distributed across the southern continents.
Fossils of the Mesosauras dating back 280 million years ago are found in South America
and Africa. Plant fossils, such as Glossopteris (a tree) have been found in South America,
Africa, India and Australia.
• A number of continents show evidence of matching geological sequences with rocks of
similar age, type, formation and structure occurring in different countries.
• A number of climatic anomalies are discovered which suggest that continents must once
have been in a different position and therefore have experienced a different climate. Coal
which only forms under wet / warm conditions has been found beneath the Antarctica ice
cap and there is evidence of glaciation in Brazil.
Hence, the continents were once joined. Therefore, they must have moved apart over time.
Wegener proposed a mechanism for continental drift, the pushing of continents by gravitational
forces that derived from the sun and the moon (similar to tides). Fig. 8 presents jigsaw matching
and similar fossil presence in different continents.
10
Fig. 8 : Illustrations of Continental Drift
1.6 SEISMIC WAVES
When the energy is released at the hypocenter or focus, it translates in to waves and travels
through the body of earth. A similarity can be brought with a pebble thrown in to still water in
a lake developing rings of waves in all directions. These waves attenuate after some distance
and time due to material damping of earth.
There are two types of waves, namely,
– Body waves : Primary and Secondary waves
– Surface waves : Raleigh and Love waves
Body waves travel through the body of earth. P or primary waves are the fastest waves that
travel through solids, liquids, or gases. These are compressional waves and material movement
is in the same direction as wave movement. S or secondary or shear waves are slower than P
waves. They travel through solids only. The material movement is perpendicular to wave
movement.
Surface Waves are produced at the earth surface. They travel just below or along the ground’s
surface. They are slower than body waves and cause rolling and side-to-side movements,
especially causing damage to buildings. Different waves travel at different speeds and they
arrive at different instants of time at a place.
Body Waves Surface Waves
Fig. 9: Illustration of Seismic Waves
11
Fig. 9 presents the direction of wave propagation and the direction of particle movement for
different seismic waves.
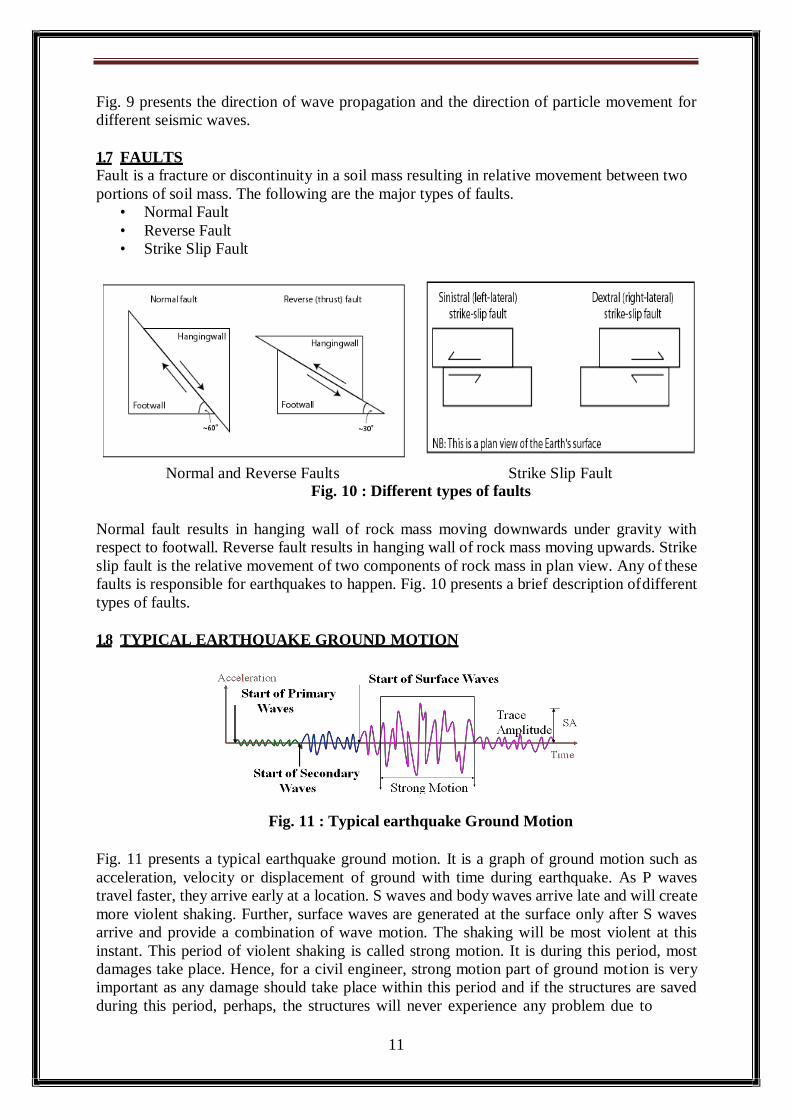
1.7 FAULTS
Fault is a fracture or discontinuity in a soil mass resulting in relative movement between two
portions of soil mass. The following are the major types of faults.
• Normal Fault
• Reverse Fault
• Strike Slip Fault
Normal and Reverse Faults Strike Slip Fault Fig. 10 : Different types of faults
Normal fault results in hanging wall of rock mass moving downwards under gravity with
respect to footwall. Reverse fault results in hanging wall of rock mass moving upwards. Strike
slip fault is the relative movement of two components of rock mass in plan view. Any of these
faults is responsible for earthquakes to happen. Fig. 10 presents a brief description of different
types of faults.
1.8 TYPICAL EARTHQUAKE GROUND MOTION
Fig. 11 : Typical earthquake Ground Motion
Fig. 11 presents a typical earthquake ground motion. It is a graph of ground motion such as
acceleration, velocity or displacement of ground with time during earthquake. As P waves
travel faster, they arrive early at a location. S waves and body waves arrive late and will create
more violent shaking. Further, surface waves are generated at the surface only after S waves
arrive and provide a combination of wave motion. The shaking will be most violent at this
instant. This period of violent shaking is called strong motion. It is during this period, most
damages take place. Hence, for a civil engineer, strong motion part of ground motion is very
important as any damage should take place within this period and if the structures are saved
during this period, perhaps, the structures will never experience any problem due to
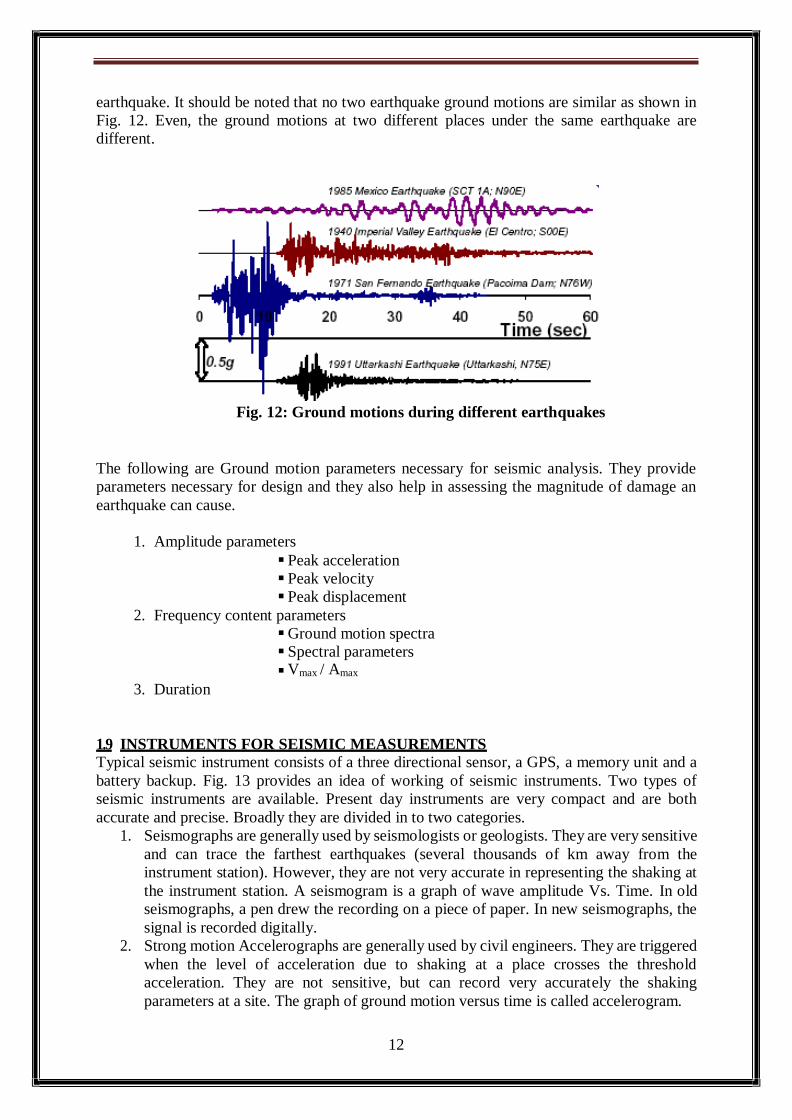
12
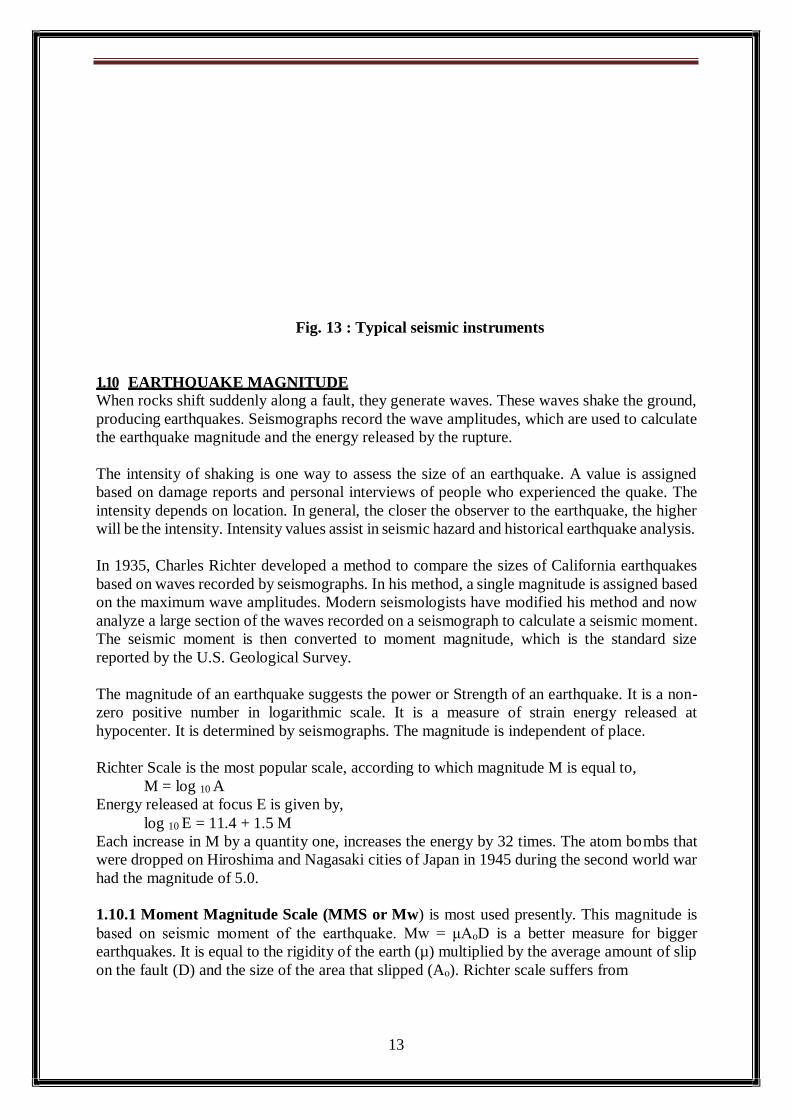
earthquake. It should be noted that no two earthquake ground motions are similar as shown in
Fig. 12. Even, the ground motions at two different places under the same earthquake are
different.
Fig. 12: Ground motions during different earthquakes
The following are Ground motion parameters necessary for seismic analysis. They provide
parameters necessary for design and they also help in assessing the magnitude of damage an
earthquake can cause.
1. Amplitude parameters
Peak acceleration
Peak velocity
Peak displacement
2. Frequency content parameters
Ground motion spectra
Spectral parameters
Vmax / Amax
3. Duration
1.9 INSTRUMENTS FOR SEISMIC MEASUREMENTS
Typical seismic instrument consists of a three directional sensor, a GPS, a memory unit and a
battery backup. Fig. 13 provides an idea of working of seismic instruments. Two types of
seismic instruments are available. Present day instruments are very compact and are both
accurate and precise. Broadly they are divided in to two categories.
1. Seismographs are generally used by seismologists or geologists. They are very sensitive
and can trace the farthest earthquakes (several thousands of km away from the
instrument station). However, they are not very accurate in representing the shaking at
the instrument station. A seismogram is a graph of wave amplitude Vs. Time. In old
seismographs, a pen drew the recording on a piece of paper. In new seismographs, the
signal is recorded digitally.
2. Strong motion Accelerographs are generally used by civil engineers. They are triggered
when the level of acceleration due to shaking at a place crosses the threshold
acceleration. They are not sensitive, but can record very accurately the shaking
parameters at a site. The graph of ground motion versus time is called accelerogram.
13
Fig. 13 : Typical seismic instruments
1.10 EARTHQUAKE MAGNITUDE
When rocks shift suddenly along a fault, they generate waves. These waves shake the ground,
producing earthquakes. Seismographs record the wave amplitudes, which are used to calculate
the earthquake magnitude and the energy released by the rupture.
The intensity of shaking is one way to assess the size of an earthquake. A value is assigned
based on damage reports and personal interviews of people who experienced the quake. The
intensity depends on location. In general, the closer the observer to the earthquake, the higher
will be the intensity. Intensity values assist in seismic hazard and historical earthquake analysis.
In 1935, Charles Richter developed a method to compare the sizes of California earthquakes
based on waves recorded by seismographs. In his method, a single magnitude is assigned based
on the maximum wave amplitudes. Modern seismologists have modified his method and now
analyze a large section of the waves recorded on a seismograph to calculate a seismic moment.
The seismic moment is then converted to moment magnitude, which is the standard size
reported by the U.S. Geological Survey.
The magnitude of an earthquake suggests the power or Strength of an earthquake. It is a non-
zero positive number in logarithmic scale. It is a measure of strain energy released at
hypocenter. It is determined by seismographs. The magnitude is independent of place.
Richter Scale is the most popular scale, according to which magnitude M is equal to,
M = log 10 A Energy released at focus E is given by,
log 10 E = 11.4 + 1.5 M Each increase in M by a quantity one, increases the energy by 32 times. The atom bombs that
were dropped on Hiroshima and Nagasaki cities of Japan in 1945 during the second world war
had the magnitude of 5.0.
1.10.1 Moment Magnitude Scale (MMS or Mw) is most used presently. This magnitude is
based on seismic moment of the earthquake. Mw = μAoD is a better measure for bigger earthquakes. It is equal to the rigidity of the earth (µ) multiplied by the average amount of slip
on the fault (D) and the size of the area that slipped (Ao). Richter scale suffers from
14
saturation for bigger earthquakes and hence not accurate for assessing bigger earthquakes of
magnitudes 7 and higher.
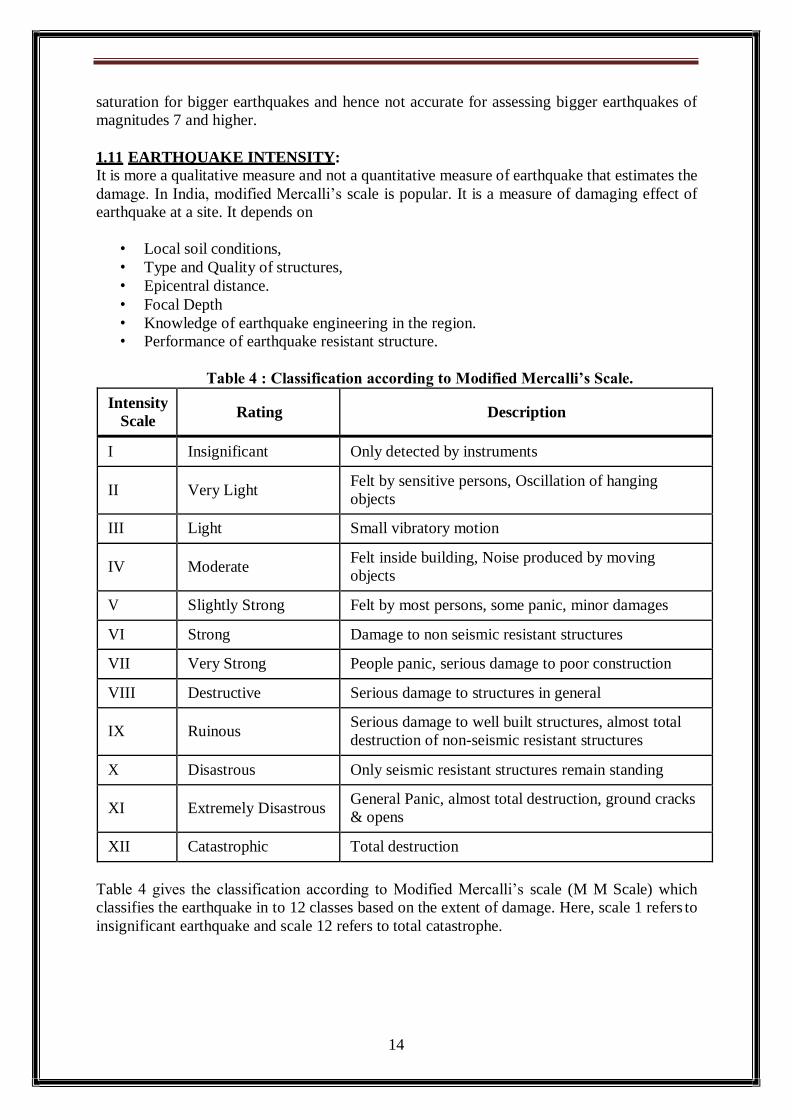
1.11 EARTHQUAKE INTENSITY:
It is more a qualitative measure and not a quantitative measure of earthquake that estimates the
damage. In India, modified Mercalli’s scale is popular. It is a measure of damaging effect of
earthquake at a site. It depends on
• Local soil conditions,
• Type and Quality of structures,
• Epicentral distance.
• Focal Depth
• Knowledge of earthquake engineering in the region.
• Performance of earthquake resistant structure.
Table 4 : Classification according to Modified Mercalli’s Scale.
Intensity
Scale Rating Description
I Insignificant Only detected by instruments
II Very Light Felt by sensitive persons, Oscillation of hanging
objects
III Light Small vibratory motion
IV Moderate Felt inside building, Noise produced by moving
objects
V Slightly Strong Felt by most persons, some panic, minor damages
VI Strong Damage to non seismic resistant structures
VII Very Strong People panic, serious damage to poor construction
VIII Destructive Serious damage to structures in general
IX Ruinous Serious damage to well built structures, almost total
destruction of non-seismic resistant structures
X Disastrous Only seismic resistant structures remain standing
XI Extremely Disastrous General Panic, almost total destruction, ground cracks
& opens
XII Catastrophic Total destruction
Table 4 gives the classification according to Modified Mercalli’s scale (M M Scale) which
classifies the earthquake in to 12 classes based on the extent of damage. Here, scale 1 refers to
insignificant earthquake and scale 12 refers to total catastrophe.
15
1.12 CAUSES FOR EARTHQUAKE
The cause for an earthquake is mostly natural. But, there can be man made reasons for
earthquake. The following is the list of causes for earthquakes.
• Tectonic earthquake
• Volcanic earthquake
• Rock fall or collapse of cavity
• Microseism
• Explosion (Controlled blast)
• Reservoir induced earthquake
• Mining induced earthquake
• Cultural Noise (Industry, Traffic etc.) It should be noted that earthquake by itself may not create problems. But, it develops such a
force that the man made system may not sustain under this force unless proper care is taken.
The following are some characteristics of earthquake.
• An earthquake does not cause death or injury by itself.
• People are hurt by falling plaster and collapsing walls or falling of heavy objects.
• Collapsing buildings and vibrations can cause short circuits and electric fires.
• Lighted gas or stoves may also cause fires.
• All this leads to panic and confusion. • With some precautions it is possible to avoid such confusion.
1.13 CLASSIFICATION OF EARTHQUAKES
Earthquakes can be broadly classified in to following subclasses.
1. Based on Focal Depth
2. Based on magnitude
3. Based on origin
4. Based on location
5. Based on Epicentral distance
1.13.1 Based on Focal Depth
Shallow Focus earthquakes (<70 km)
Intermediate focus earthquakes (70 to 300 km)
Deep focus earthquakes (> 300 km)
1.13.2 Based on magnitude
Micro earthquakes (M < 3)
Intermediate earthquakes (M 3 to 5)
Moderate earthquakes (M 5 to 6)
Strong earthquakes (M 6 to 7)
Major earthquakes (M 7 to 8)
Great earthquakes (M > 8)
1.13.3 Based on origin
Tectonic earthquakes
Plutonic earthquakes
Explosions
Collapse earthquakes
Volcanic earthquakes
Reservoir induced earthquakes
16
1.13.4 Based on location
Inter-plate earthquakes
Convergent boundaries
Divergent boundaries
Transform plane boundaries
Intra-plate earthquakes
Dip slip fault
Strike slip fault
1.13.5 Based on Epicentral distance
Local shock (4 km range)
Near shock (4 to 10 km range)
Distant shock (10 to 20 km range)
Telescopic shock (> 20 km range)
1.14 SEISMIC ZONING MAP OF INDIA – BACKGROUND, BASIS, ZONE FACTOR
India is seismically active and has experienced many earthquakes in the past. Fig. 2 and Table
3 present some of the past earthquakes and their effects on Indian soil. More than 60 % of the
country is considered to be in seismically active regions. Based on the past experience, geologic
activities, presence of active faults and closeness to plate boundary, the country is divided in
to 4 zones - Zone 2 to Zone 5. Zone 2 is seismically least active and zone 5 is seismically most
active. In seismically very active zone, the frequency of big earthquake and possibility of strong
shaking are more. Over years, Indian codal provisions are evolved and the following are the
important modifications in the recent version of IS 1893 – Part 1 – 2002.
Major modifications in the recent I S code
1. Zone I is merged with Zone II. 2. Values of seismic zone factors are changed considering MCE & service life of
structure.
3. Response spectra are specified for THREE types of soils - Rock & Hard Soil,
Medium Soil and Soft Soil.
4. Empirical equations for time period of multi storey buildings are revised.
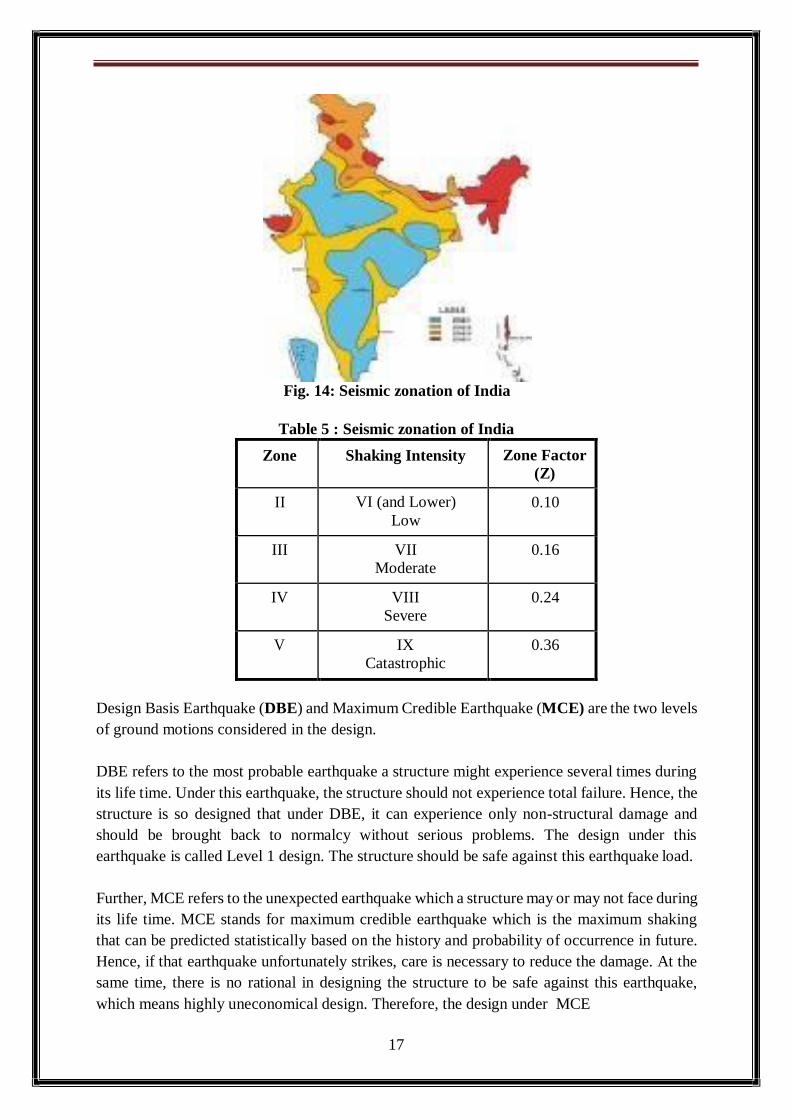
Fig. 14 presents the map of India with different seismic zones. Karnataka is seismically quite
stable and most part of it is in Zone 2. Only coastal Karnataka and some parts in north are in
Zone 3. Table 5 provides the details of zone factor in different zones. It can be seen that the
zone factor is 3.6 times bigger in Zone 5 than in Zone 2. Hence, the horizontal force is 3.6 times
bigger in Zone 5 than in seismically least active places.
17
Fig. 14: Seismic zonation of India
Table 5 : Seismic zonation of India
Zone Shaking Intensity Zone Factor
(Z)
II VI (and Lower)
Low
0.10
III VII
Moderate
0.16
IV VIII
Severe
0.24
V IX
Catastrophic
0.36
Design Basis Earthquake (DBE) and Maximum Credible Earthquake (MCE) are the two levels
of ground motions considered in the design.
DBE refers to the most probable earthquake a structure might experience several times during
its life time. Under this earthquake, the structure should not experience total failure. Hence, the
structure is so designed that under DBE, it can experience only non-structural damage and
should be brought back to normalcy without serious problems. The design under this
earthquake is called Level 1 design. The structure should be safe against this earthquake load.
Further, MCE refers to the unexpected earthquake which a structure may or may not face during
its life time. MCE stands for maximum credible earthquake which is the maximum shaking
that can be predicted statistically based on the history and probability of occurrence in future.
Hence, if that earthquake unfortunately strikes, care is necessary to reduce the damage. At the
same time, there is no rational in designing the structure to be safe against this earthquake,
which means highly uneconomical design. Therefore, the design under MCE

18
is called Level 2 design which focuses on imparting ductility to the structure. A ductile structure
will give enough warning before failure. Level 2 design will allow the structure to have
sufficient ductility such that even under biggest earthquake structure should provide sufficient
time before collapse. The best design is one in which the occupants can come out of the building
and see how the structure is falling.
Hence, the concept of different levels of design is extremely important in earthquake resistant
analysis and design. Hence, MCE is much bigger than DBE. In IS 1893, the level of
acceleration considered in MCE is twice that of DBE.
1.15 SOIL : For a geotechnical engineer, soil is that portion of the ground which supports the
foundation of a structure. The requirement of the foundation soil is that it should be able to
resist the forces from the super-structure without shear failure and excessive settlement. Soil is
one of the widely used construction material. e.g. embankment, dam, brick. Tile.
Soil is perhaps the most complex of all engineering materials because of the following reasons.
Soil is,
Porous
Polyphasic
Permeable
Particulate
Heterogeneous
Anisotropic
Non-Linear
Pressure Level Dependent
Strain Level Dependent
Strain Rate Dependent
Temperature Dependent
Undergoes volume change in shear
Yet, soil is intelligent and interesting because it is,
Colourful
Sensitive
Possesses Memory
Changes its properties with time
1.16 DYNAMICS : It is that portion of engineering mechanics which deals with bodies in
motion or bodies subjected to time dependent forces that are good enough to cause relative
motion. Statics deals with bodies at rest. Hence, it considers static equilibrium of a body.
∑F = 0
However, dynamics considers the dynamic equilibrium of a body. According to D’Alemberts
rule, ∑F – FI = 0
Here, FI is the inertial force in the desired direction. FI = mass X acceleration = m X d2Z/dt2
Dynamics requires the consideration of effects of time. It needs to consider an additional
dimension, i.e., the effect of time. Dynamics is Dangerous, Action Packed, yet interesting

19
1.17 SOIL DYNAMICS deals with the dynamics of soil. Hence forces that are time
dependent act on the soil causing the soil to undergo deformation that changes with time.
Following are some of the agencies responsible for soil dynamics.
Machine Foundation (Reciprocating, Rotary or Hammer types)
Traffic Vibration on subgrade
Wind effect on bridges, transmission line towers
Pile Driving
Bomb Blast
Quarrying
Sea wave force
Earthquake
Carl Terzaghi, father of soil mechanics defined soil mechanics as a systematic study of soil
from construction material view point. He did not separate soil statics from soil dynamics.
However, if the soil is subjected to dynamic stresses (i.e., the stresses that change their
magnitude with time), the study is called soil dynamics.
In soil dynamics, there will be changes with time in
Stress level of soil
Strength and deformation characteristics of soil
Earth pressure
Bearing capacity
Possibility of Liquefaction
The effect of dynamic force on soil is to cause,
Increased strain level
Increased earth pressure
Decreased bearing capacity
Decreased loss of strength
Increased deformation
Failures of slopes, etc.
The following are some of the geotechnical aspects of earthquake
• Primary Effects
– Ground Break, Fault formation
• Secondary Effects – Liquefaction
– Land slides and slope failure
– Foundation Failure
– Failure of water front structures
– Failure of railway, highway & bridges
– Failure of retaining walls
– Tsunami and Seiche
Fig. 15 to Fig. 19 show the typical geotechnical failures of structures during earthquake.
20
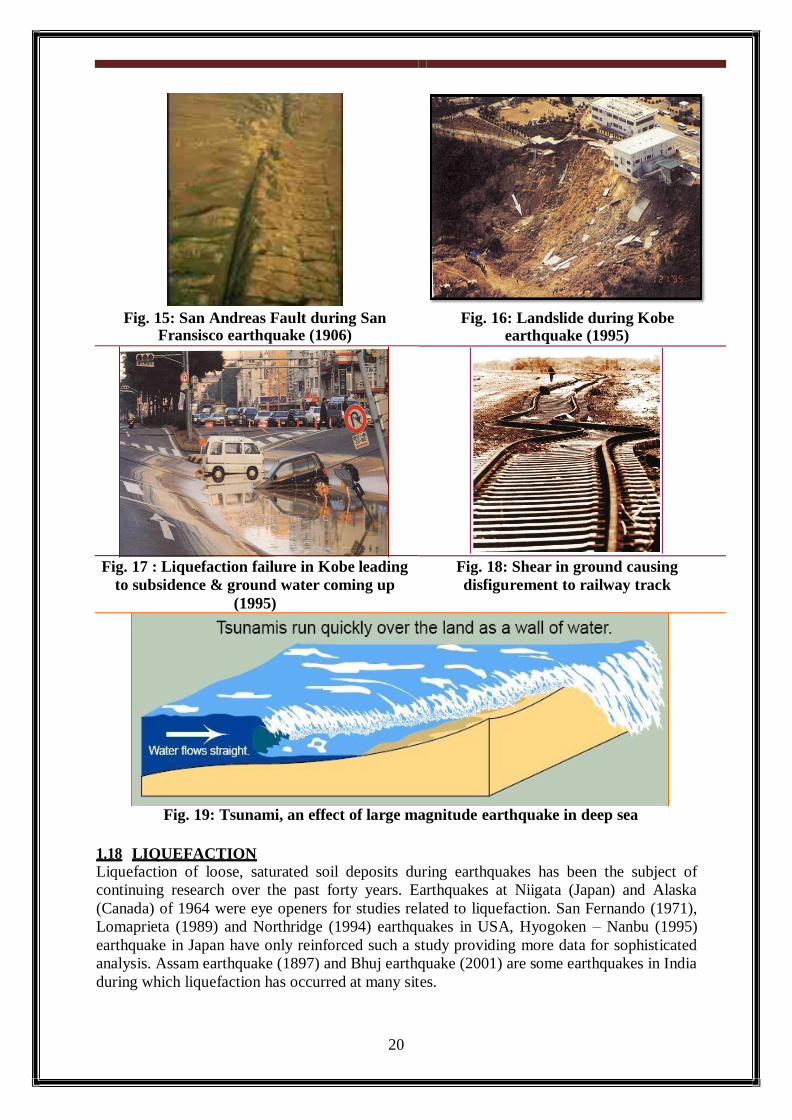
Fig. 15: San Andreas Fault during San Fransisco earthquake (1906)
Fig. 16: Landslide during Kobe earthquake (1995)
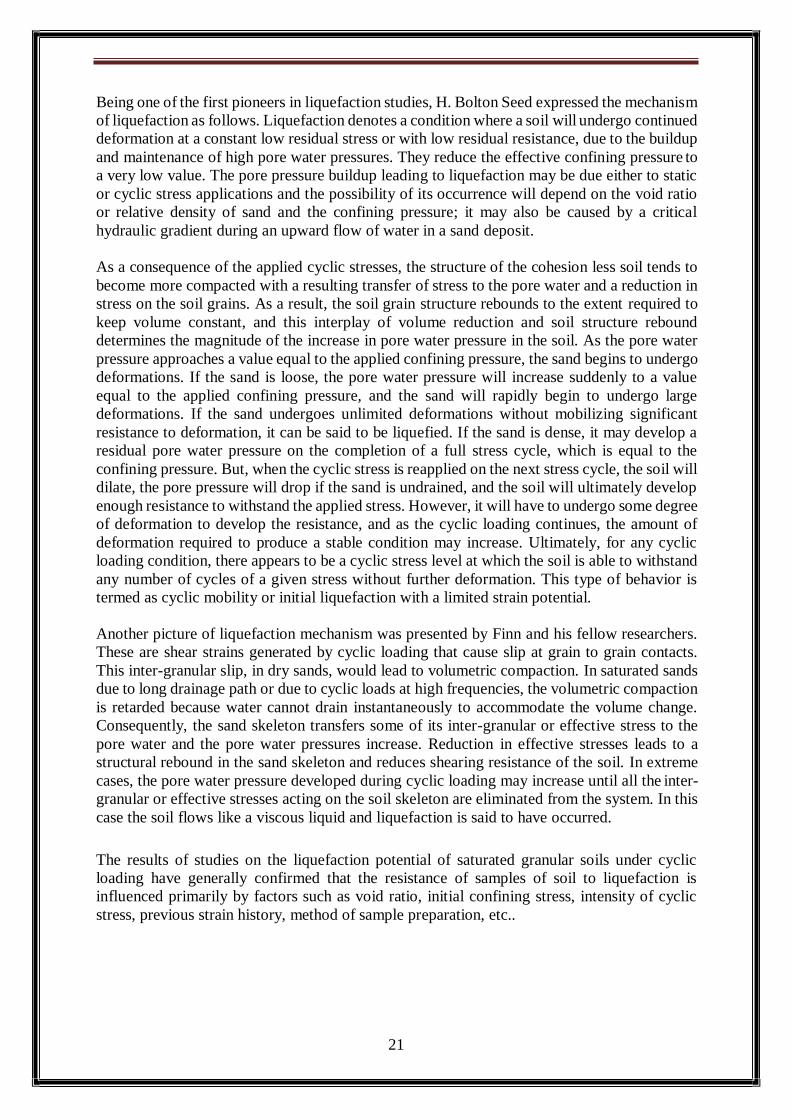
Fig. 17 : Liquefaction failure in Kobe leading
to subsidence & ground water coming up
(1995)
Fig. 18: Shear in ground causing
disfigurement to railway track
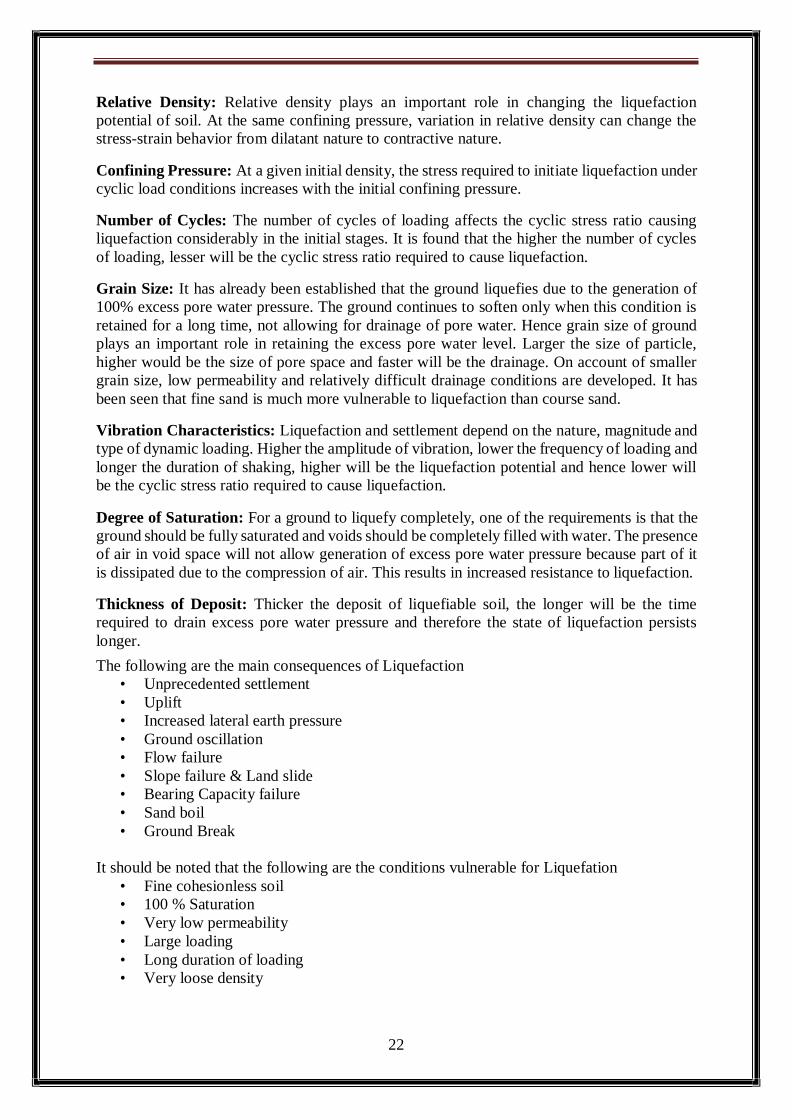
Fig. 19: Tsunami, an effect of large magnitude earthquake in deep sea
1.18 LIQUEFACTION
Liquefaction of loose, saturated soil deposits during earthquakes has been the subject of
continuing research over the past forty years. Earthquakes at Niigata (Japan) and Alaska
(Canada) of 1964 were eye openers for studies related to liquefaction. San Fernando (1971),
Lomaprieta (1989) and Northridge (1994) earthquakes in USA, Hyogoken – Nanbu (1995)
earthquake in Japan have only reinforced such a study providing more data for sophisticated
analysis. Assam earthquake (1897) and Bhuj earthquake (2001) are some earthquakes in India
during which liquefaction has occurred at many sites.
21
Being one of the first pioneers in liquefaction studies, H. Bolton Seed expressed the mechanism
of liquefaction as follows. Liquefaction denotes a condition where a soil will undergo continued
deformation at a constant low residual stress or with low residual resistance, due to the buildup
and maintenance of high pore water pressures. They reduce the effective confining pressure to
a very low value. The pore pressure buildup leading to liquefaction may be due either to static
or cyclic stress applications and the possibility of its occurrence will depend on the void ratio
or relative density of sand and the confining pressure; it may also be caused by a critical
hydraulic gradient during an upward flow of water in a sand deposit.
As a consequence of the applied cyclic stresses, the structure of the cohesion less soil tends to
become more compacted with a resulting transfer of stress to the pore water and a reduction in
stress on the soil grains. As a result, the soil grain structure rebounds to the extent required to
keep volume constant, and this interplay of volume reduction and soil structure rebound
determines the magnitude of the increase in pore water pressure in the soil. As the pore water
pressure approaches a value equal to the applied confining pressure, the sand begins to undergo
deformations. If the sand is loose, the pore water pressure will increase suddenly to a value
equal to the applied confining pressure, and the sand will rapidly begin to undergo large
deformations. If the sand undergoes unlimited deformations without mobilizing significant
resistance to deformation, it can be said to be liquefied. If the sand is dense, it may develop a
residual pore water pressure on the completion of a full stress cycle, which is equal to the
confining pressure. But, when the cyclic stress is reapplied on the next stress cycle, the soil will
dilate, the pore pressure will drop if the sand is undrained, and the soil will ultimately develop
enough resistance to withstand the applied stress. However, it will have to undergo some degree
of deformation to develop the resistance, and as the cyclic loading continues, the amount of
deformation required to produce a stable condition may increase. Ultimately, for any cyclic
loading condition, there appears to be a cyclic stress level at which the soil is able to withstand
any number of cycles of a given stress without further deformation. This type of behavior is
termed as cyclic mobility or initial liquefaction with a limited strain potential.
Another picture of liquefaction mechanism was presented by Finn and his fellow researchers.
These are shear strains generated by cyclic loading that cause slip at grain to grain contacts.
This inter-granular slip, in dry sands, would lead to volumetric compaction. In saturated sands
due to long drainage path or due to cyclic loads at high frequencies, the volumetric compaction
is retarded because water cannot drain instantaneously to accommodate the volume change.
Consequently, the sand skeleton transfers some of its inter-granular or effective stress to the
pore water and the pore water pressures increase. Reduction in effective stresses leads to a
structural rebound in the sand skeleton and reduces shearing resistance of the soil. In extreme
cases, the pore water pressure developed during cyclic loading may increase until all the inter-
granular or effective stresses acting on the soil skeleton are eliminated from the system. In this
case the soil flows like a viscous liquid and liquefaction is said to have occurred.
The results of studies on the liquefaction potential of saturated granular soils under cyclic
loading have generally confirmed that the resistance of samples of soil to liquefaction is
influenced primarily by factors such as void ratio, initial confining stress, intensity of cyclic
stress, previous strain history, method of sample preparation, etc..
22
Relative Density: Relative density plays an important role in changing the liquefaction
potential of soil. At the same confining pressure, variation in relative density can change the
stress-strain behavior from dilatant nature to contractive nature.
Confining Pressure: At a given initial density, the stress required to initiate liquefaction under
cyclic load conditions increases with the initial confining pressure.
Number of Cycles: The number of cycles of loading affects the cyclic stress ratio causing
liquefaction considerably in the initial stages. It is found that the higher the number of cycles
of loading, lesser will be the cyclic stress ratio required to cause liquefaction.
Grain Size: It has already been established that the ground liquefies due to the generation of
100% excess pore water pressure. The ground continues to soften only when this condition is
retained for a long time, not allowing for drainage of pore water. Hence grain size of ground
plays an important role in retaining the excess pore water level. Larger the size of particle,
higher would be the size of pore space and faster will be the drainage. On account of smaller
grain size, low permeability and relatively difficult drainage conditions are developed. It has
been seen that fine sand is much more vulnerable to liquefaction than course sand.
Vibration Characteristics: Liquefaction and settlement depend on the nature, magnitude and
type of dynamic loading. Higher the amplitude of vibration, lower the frequency of loading and
longer the duration of shaking, higher will be the liquefaction potential and hence lower will
be the cyclic stress ratio required to cause liquefaction.
Degree of Saturation: For a ground to liquefy completely, one of the requirements is that the
ground should be fully saturated and voids should be completely filled with water. The presence
of air in void space will not allow generation of excess pore water pressure because part of it
is dissipated due to the compression of air. This results in increased resistance to liquefaction.
Thickness of Deposit: Thicker the deposit of liquefiable soil, the longer will be the time
required to drain excess pore water pressure and therefore the state of liquefaction persists
longer.
The following are the main consequences of Liquefaction
• Unprecedented settlement
• Uplift
• Increased lateral earth pressure
• Ground oscillation
• Flow failure
• Slope failure & Land slide
• Bearing Capacity failure
• Sand boil
• Ground Break
It should be noted that the following are the conditions vulnerable for Liquefation
• Fine cohesionless soil
• 100 % Saturation
• Very low permeability
• Large loading
• Long duration of loading
• Very loose density
23
1.19 SITE CHARACTERIZATION AND SEISMIC GROUND RESPONSE
Earthquake waves travel through rock medium in mantle and crust in soil medium at the top.
The overburden may comprise of layered soil made of soft and stiff layers. When the waves
travel upwards either vertically or inclined, at the interface between layers the waves are
reflected, deflected and refracted leading to multiple reflections and get amplified in motion
when they reach the surface. Further, at the surface, new waves in the form of surface waves
are generated resulting in amplification in ground motion. The vibration and shaking result in
the loss of contact between soil particles and degradation in strength and stiffness of soil mass.
Different locations will have varied thicknesses of overburden, ground water may be present at
different levels, profile at the top may vary, numbers of layers and properties of soil in different
layers may be different. Hence, the level of amplification in ground motion under different
situations and different locations may be different. Hence, it is important to consider the site
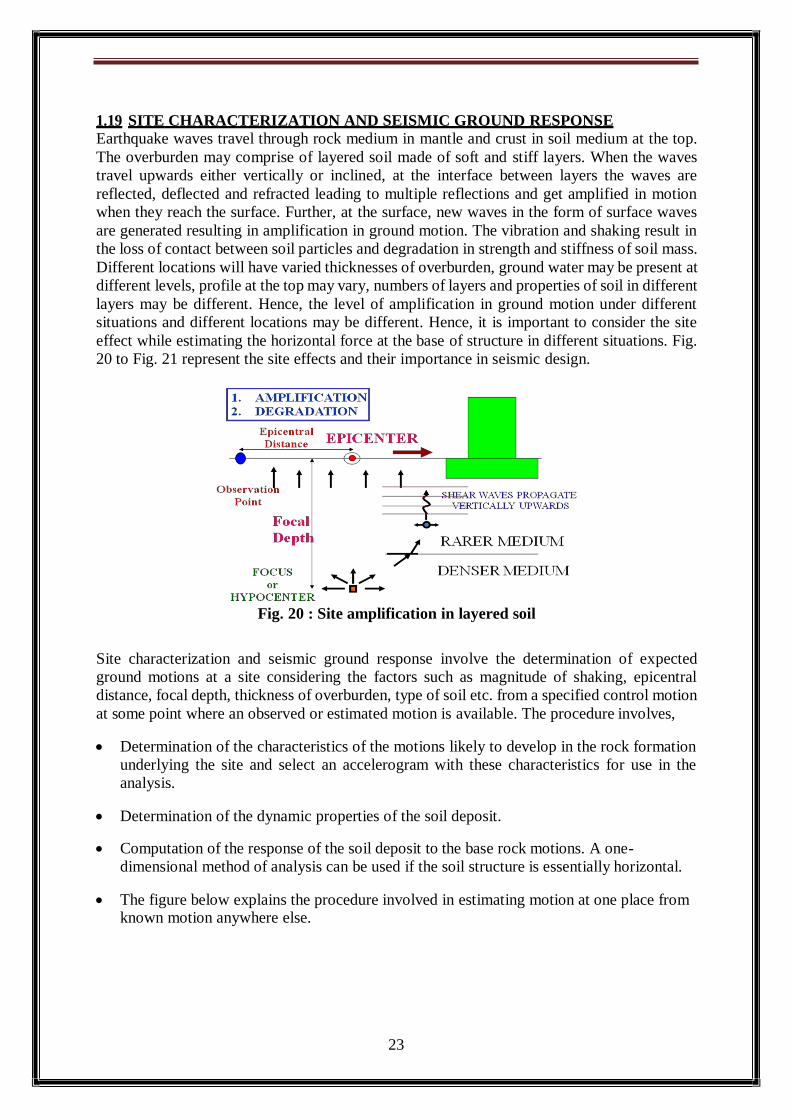
effect while estimating the horizontal force at the base of structure in different situations. Fig.
20 to Fig. 21 represent the site effects and their importance in seismic design.
Fig. 20 : Site amplification in layered soil
Site characterization and seismic ground response involve the determination of expected
ground motions at a site considering the factors such as magnitude of shaking, epicentral
distance, focal depth, thickness of overburden, type of soil etc. from a specified control motion
at some point where an observed or estimated motion is available. The procedure involves,
Determination of the characteristics of the motions likely to develop in the rock formation
underlying the site and select an accelerogram with these characteristics for use in the
analysis.
Determination of the dynamic properties of the soil deposit.
Computation of the response of the soil deposit to the base rock motions. A one-
dimensional method of analysis can be used if the soil structure is essentially horizontal.
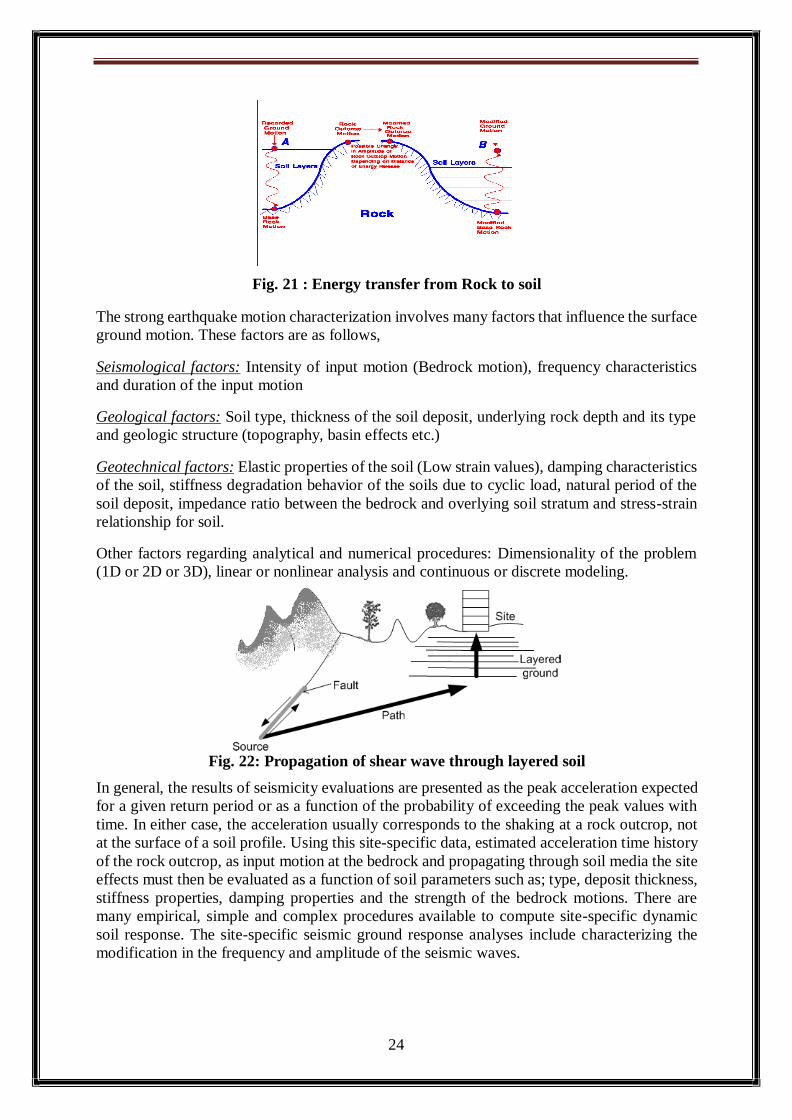
The figure below explains the procedure involved in estimating motion at one place from known motion anywhere else.
24
Fig. 21 : Energy transfer from Rock to soil
The strong earthquake motion characterization involves many factors that influence the surface
ground motion. These factors are as follows,
Seismological factors: Intensity of input motion (Bedrock motion), frequency characteristics
and duration of the input motion
Geological factors: Soil type, thickness of the soil deposit, underlying rock depth and its type
and geologic structure (topography, basin effects etc.)
Geotechnical factors: Elastic properties of the soil (Low strain values), damping characteristics
of the soil, stiffness degradation behavior of the soils due to cyclic load, natural period of the
soil deposit, impedance ratio between the bedrock and overlying soil stratum and stress-strain
relationship for soil.
Other factors regarding analytical and numerical procedures: Dimensionality of the problem
(1D or 2D or 3D), linear or nonlinear analysis and continuous or discrete modeling.
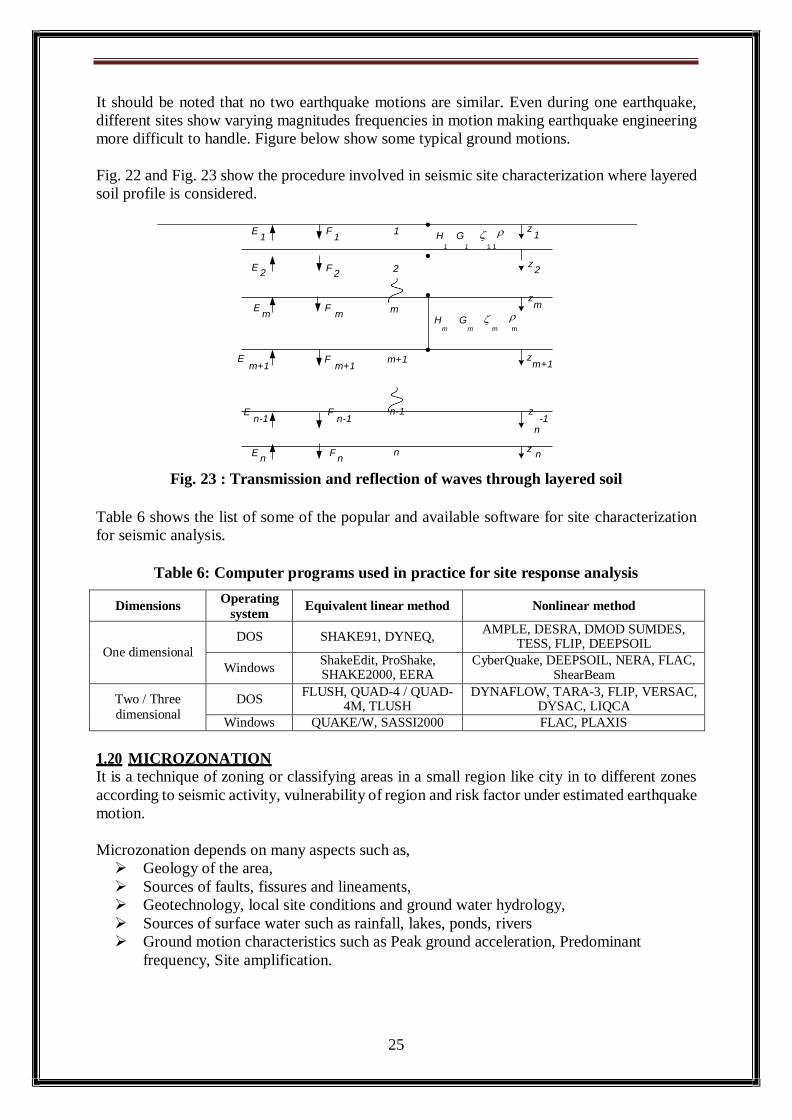
Fig. 22: Propagation of shear wave through layered soil
In general, the results of seismicity evaluations are presented as the peak acceleration expected
for a given return period or as a function of the probability of exceeding the peak values with
time. In either case, the acceleration usually corresponds to the shaking at a rock outcrop, not
at the surface of a soil profile. Using this site-specific data, estimated acceleration time history
of the rock outcrop, as input motion at the bedrock and propagating through soil media the site
effects must then be evaluated as a function of soil parameters such as; type, deposit thickness,
stiffness properties, damping properties and the strength of the bedrock motions. There are
many empirical, simple and complex procedures available to compute site-specific dynamic
soil response. The site-specific seismic ground response analyses include characterizing the
modification in the frequency and amplitude of the seismic waves.
25
It should be noted that no two earthquake motions are similar. Even during one earthquake,
different sites show varying magnitudes frequencies in motion making earthquake engineering
more difficult to handle. Figure below show some typical ground motions.
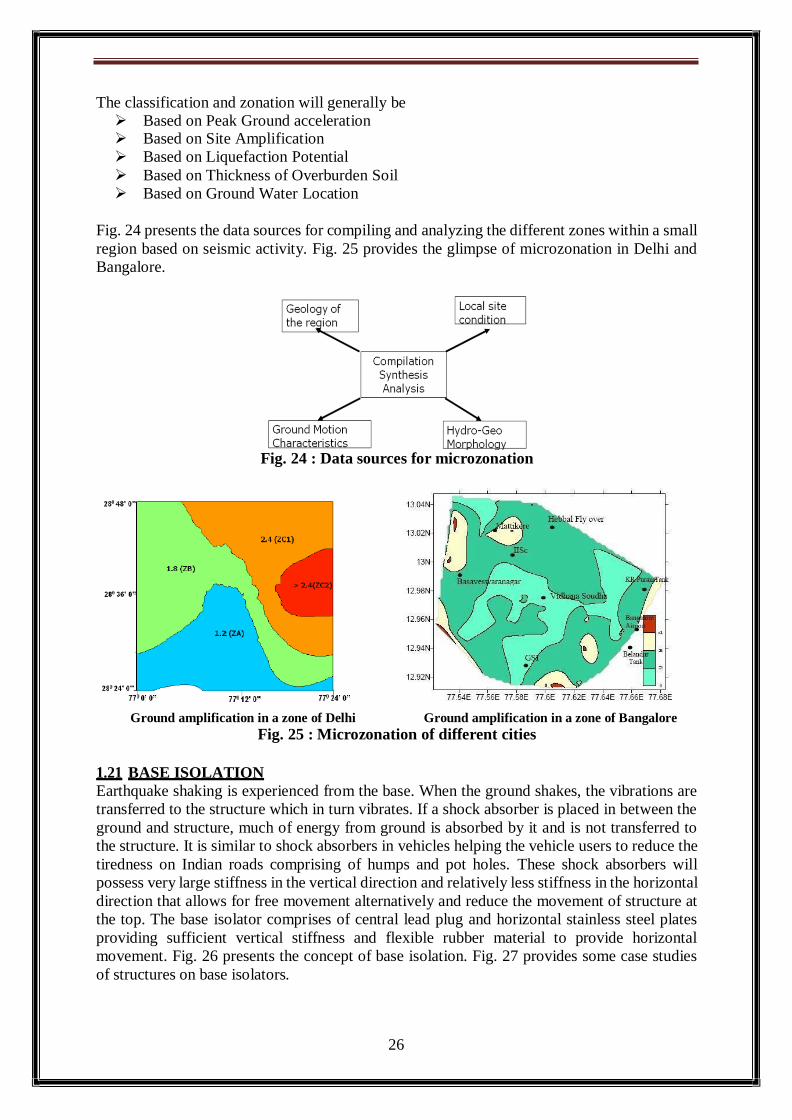
Fig. 22 and Fig. 23 show the procedure involved in seismic site characterization where layered
soil profile is considered.
E
1 F
1 1
H G z 1
1 1 1 1
E 2
F 2
2 z
2
zm
E
m F
m m
H G m m m m
E m+1
F m+1
m+1 zm+1
E n-1
F n-1
n-1 z -1
n
E n
F n
n z n
Fig. 23 : Transmission and reflection of waves through layered soil
Table 6 shows the list of some of the popular and available software for site characterization
for seismic analysis.
Table 6: Computer programs used in practice for site response analysis
Dimensions Operating
system Equivalent linear method Nonlinear method
One dimensional
DOS SHAKE91, DYNEQ, AMPLE, DESRA, DMOD SUMDES,
TESS, FLIP, DEEPSOIL
Windows ShakeEdit, ProShake, SHAKE2000, EERA
CyberQuake, DEEPSOIL, NERA, FLAC, ShearBeam
Two / Three
dimensional
DOS FLUSH, QUAD-4 / QUAD-
4M, TLUSH DYNAFLOW, TARA-3, FLIP, VERSAC,
DYSAC, LIQCA
Windows QUAKE/W, SASSI2000 FLAC, PLAXIS
1.20 MICROZONATION
It is a technique of zoning or classifying areas in a small region like city in to different zones
according to seismic activity, vulnerability of region and risk factor under estimated earthquake
motion.
Microzonation depends on many aspects such as,
Geology of the area,
Sources of faults, fissures and lineaments,
Geotechnology, local site conditions and ground water hydrology,
Sources of surface water such as rainfall, lakes, ponds, rivers
Ground motion characteristics such as Peak ground acceleration, Predominant
frequency, Site amplification.
26
The classification and zonation will generally be
Based on Peak Ground acceleration Based on Site Amplification
Based on Liquefaction Potential
Based on Thickness of Overburden Soil
Based on Ground Water Location
Fig. 24 presents the data sources for compiling and analyzing the different zones within a small
region based on seismic activity. Fig. 25 provides the glimpse of microzonation in Delhi and
Bangalore.
Fig. 24 : Data sources for microzonation
Ground amplification in a zone of Delhi Ground amplification in a zone of Bangalore
Fig. 25 : Microzonation of different cities
1.21 BASE ISOLATION
Earthquake shaking is experienced from the base. When the ground shakes, the vibrations are
transferred to the structure which in turn vibrates. If a shock absorber is placed in between the
ground and structure, much of energy from ground is absorbed by it and is not transferred to
the structure. It is similar to shock absorbers in vehicles helping the vehicle users to reduce the
tiredness on Indian roads comprising of humps and pot holes. These shock absorbers will
possess very large stiffness in the vertical direction and relatively less stiffness in the horizontal
direction that allows for free movement alternatively and reduce the movement of structure at
the top. The base isolator comprises of central lead plug and horizontal stainless steel plates
providing sufficient vertical stiffness and flexible rubber material to provide horizontal
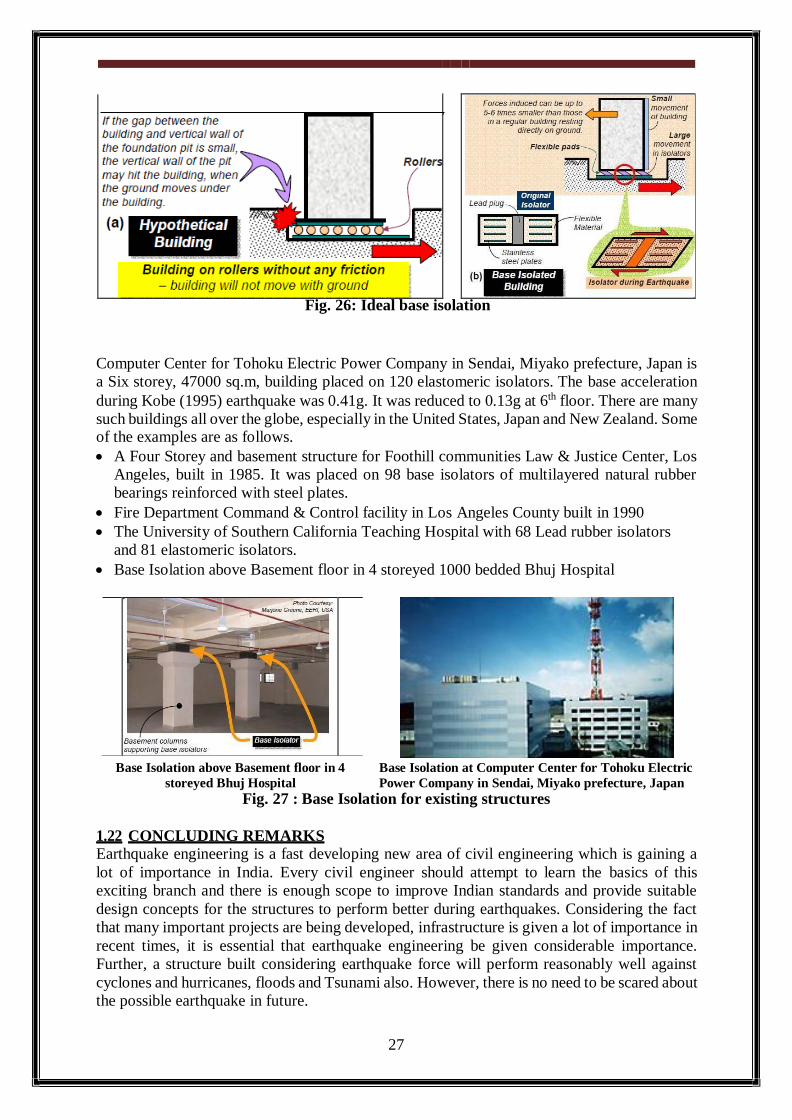
movement. Fig. 26 presents the concept of base isolation. Fig. 27 provides some case studies
of structures on base isolators.
27
Fig. 26: Ideal base isolation
Computer Center for Tohoku Electric Power Company in Sendai, Miyako prefecture, Japan is
a Six storey, 47000 sq.m, building placed on 120 elastomeric isolators. The base acceleration
during Kobe (1995) earthquake was 0.41g. It was reduced to 0.13g at 6th floor. There are many
such buildings all over the globe, especially in the United States, Japan and New Zealand. Some of the examples are as follows.
A Four Storey and basement structure for Foothill communities Law & Justice Center, Los
Angeles, built in 1985. It was placed on 98 base isolators of multilayered natural rubber
bearings reinforced with steel plates.
Fire Department Command & Control facility in Los Angeles County built in 1990
The University of Southern California Teaching Hospital with 68 Lead rubber isolators
and 81 elastomeric isolators.
Base Isolation above Basement floor in 4 storeyed 1000 bedded Bhuj Hospital
Base Isolation above Basement floor in 4
storeyed Bhuj Hospital
Base Isolation at Computer Center for Tohoku Electric
Power Company in Sendai, Miyako prefecture, Japan
Fig. 27 : Base Isolation for existing structures
1.22 CONCLUDING REMARKS
Earthquake engineering is a fast developing new area of civil engineering which is gaining a
lot of importance in India. Every civil engineer should attempt to learn the basics of this
exciting branch and there is enough scope to improve Indian standards and provide suitable
design concepts for the structures to perform better during earthquakes. Considering the fact
that many important projects are being developed, infrastructure is given a lot of importance in
recent times, it is essential that earthquake engineering be given considerable importance.
Further, a structure built considering earthquake force will perform reasonably well against
cyclones and hurricanes, floods and Tsunami also. However, there is no need to be scared about
the possible earthquake in future.
28
SECTION –A (Very Short Answer Type Question)
(a) Pre- cast Slab
(b) Fiber Sheet
(c) Name any two Structural elements
(d) Temperature Steel
(e) Any two reinforcing materials
(f) Static Load
(g) Epicenter
(h) Disaster Rescues
(i) IS:1893 refers to………
(j) Ductility
(k) Space frame
(l) Band
(m) Define IS 1893:2002
(n) Retrofitting
(o) Soft storey
(p) Earthquake
(q) What are primary wave
(r) Hypocenter
SECTION- B (Short Answer Type Questions )
Q- I Explain the energy based seismic design method.
Q-II What do you mean by psychology? Q-III Why knowledge of the foundation soil is essential?
Q-IV Write a note on safety in resource operation?
Q-V What is the purpose of shear wall in a building? Q-VI List the main objective of disaster management?
Q-VII Write notes on long wall?
Q- VIII What do you mean by jacketing of columns? Q- IX Different between magnitude and intensity of earthquake?
Q-X Discuss the impact of earthquake on human being and property?
Q-XI Describe the psychology of rescue?
Q-XII Write a note long waves? Q-XIII What is the various rescue equipment?
Q-XIV Explain seismic zoning map of India?
Q-XV Explain the shear wall?
SECTION-C
(Long Answer Type Questions)
Q-1 Explain the factors on which the ductility will depend ?
Q-2 Write about special construction feature contained in IS 4326:1993 ? Q-3 Write short note on:-
a. Rescue Workers
b. Rescue Plan

29
c. Rescue steps
d. Rescue Equipments
Q-4 Write note on:-
a. Surface wave
b. Body wave
Q-5 Describe in details the seismic behavior of traditionally- build construction of India?

30
Related Documents