2007 HIGHER SCHOOL CERTIFICATE EXAMINATION Earth and Environmental Science General Instructions • Reading time – 5 minutes • Working time – 3 hours • Write using black or blue pen • Draw diagrams using pencil • Board-approved calculators may be used • A Geological Time Scale is provided at the back of this paper • Write your Centre Number and Student Number at the top of pages 9, 13, 17 and 33 Total marks – 100 Section I Pages 2–19 75 marks This section has two parts, Part A and Part B Part A – 15 marks • Attempt Questions 1–15 • Allow about 30 minutes for this part Part B – 60 marks • Attempt Questions 16–27 • Allow about 1 hour and 45 minutes for this part Section II Pages 21–29 25 marks • Attempt ONE question from Questions 28–31 • Allow about 45 minutes for this section 139

Welcome message from author
This document is posted to help you gain knowledge. Please leave a comment to let me know what you think about it! Share it to your friends and learn new things together.
Transcript
2007 H I G H E R S C H O O L C E R T I F I C AT E
E X A M I N AT I O N
Earth and Environmental Science
General Instructions
• Reading time – 5 minutes
• Working time – 3 hours
• Write using black or blue pen
• Draw diagrams using pencil
• Board-approved calculators may be used
• A Geological Time Scale is provided at the back of this paper
• Write your Centre Number and Student Number at the top of pages 9, 13, 17 and 33
Total marks – 100
Section I Pages 2–19
75 marks
This section has two parts, Part A and Part B
Part A – 15 marks
• Attempt Questions 1–15
• Allow about 30 minutes for this part
Part B – 60 marks
• Attempt Questions 16–27
• Allow about 1 hour and 45 minutes for this part
Section II Pages 21–29
25 marks
• Attempt ONE question from Questions 28–31
• Allow about 45 minutes for this section
139
Section I75 marks
Part A – 15 marksAttempt Questions 1–15Allow about 30 minutes for this part
Use the multiple-choice answer sheet for Questions 1–15.
1 If a large volcano erupted in the south-east Asian region, which of the following wouldhave the greatest effect on the global climate?
(A) Lahars
(B) Fine ash
(C) Lava flows
(D) Shock waves
2 What is an essential requirement for ozone formation?
(A) Oxygen molecules split before ozone can form.
(B) Three oxygen molecules react to form one ozone molecule.
(C) Two oxygen molecules directly react to form one ozone molecule.
(D) Carbon dioxide molecules break down to form ozone in the stratosphere.
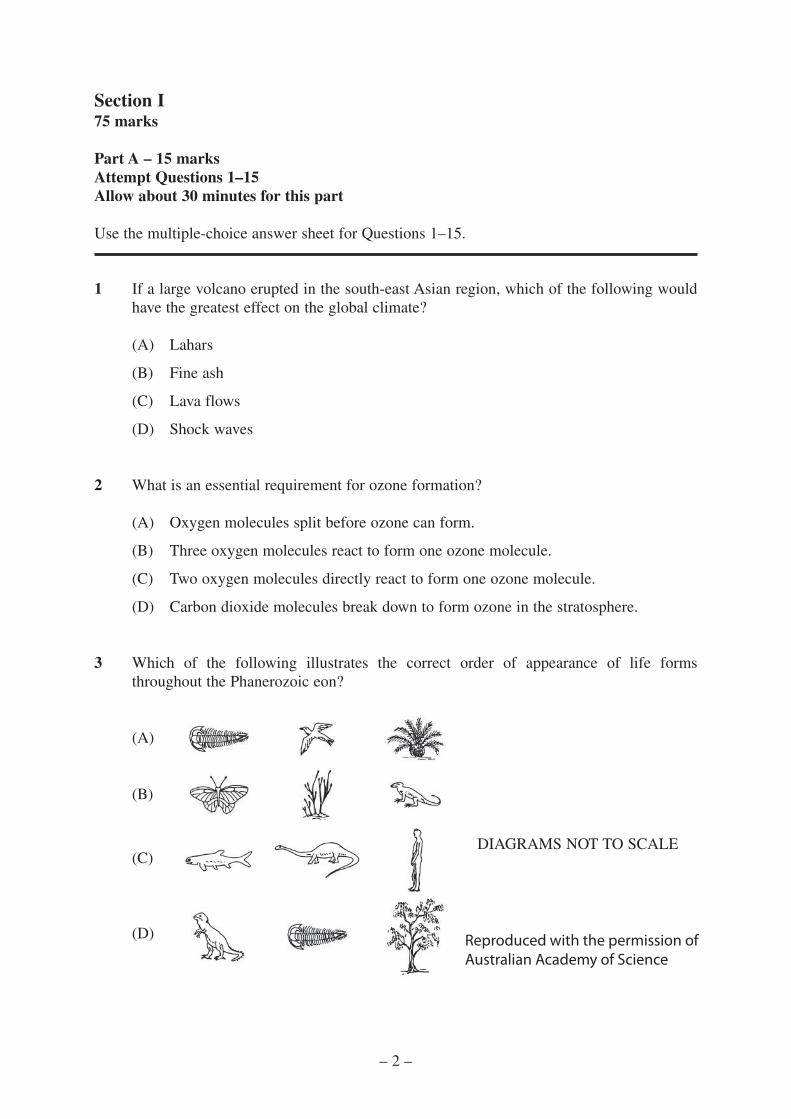
3 Which of the following illustrates the correct order of appearance of life formsthroughout the Phanerozoic eon?
(A)
(B)
(C)
(D)
DIAGRAMS NOT TO SCALE
Reproduced with the permission of Australian Academy of Science
– 2 –
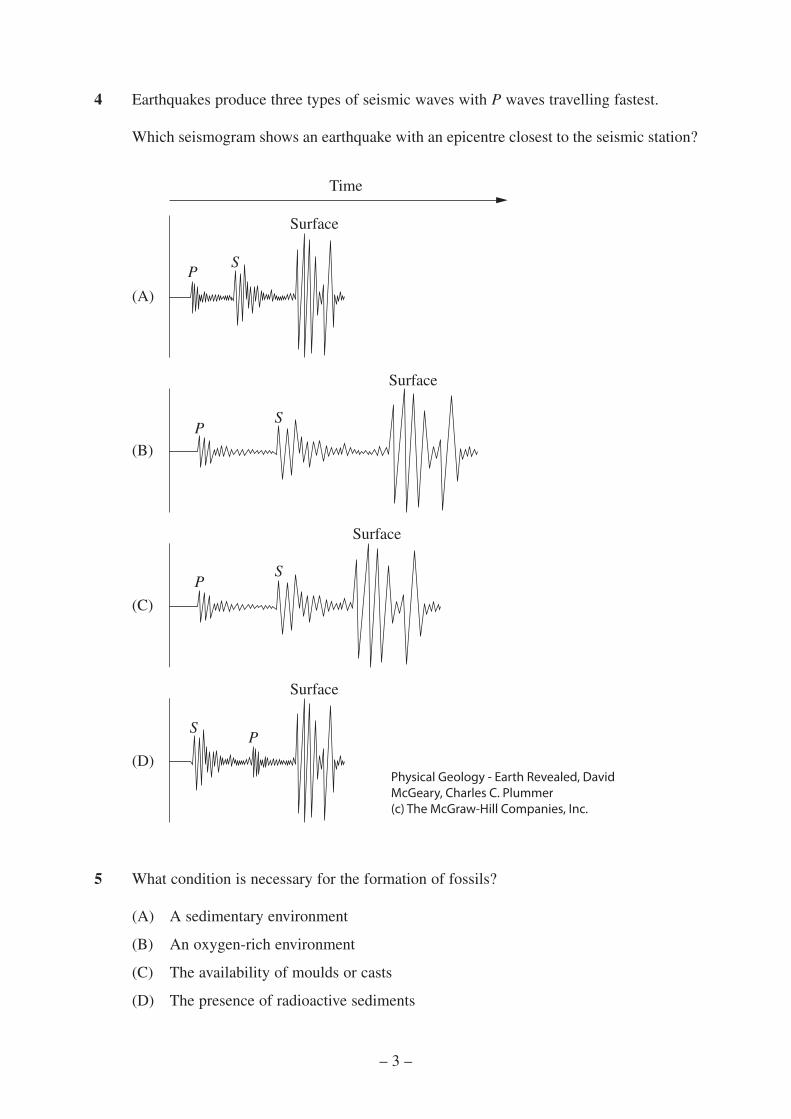
4 Earthquakes produce three types of seismic waves with P waves travelling fastest.
Which seismogram shows an earthquake with an epicentre closest to the seismic station?
5 What condition is necessary for the formation of fossils?
(A) A sedimentary environment
(B) An oxygen-rich environment
(C) The availability of moulds or casts
(D) The presence of radioactive sediments
(A)
PS
Surface
PS
Surface
PS
Surface
PS
Surface
(B)
(C)
(D)
Time
Physical Geology - Earth Revealed, DavidMcGeary, Charles C. Plummer (c) The McGraw-Hill Companies, Inc.
– 3 –
6 Both fertile soils and low-fertility lateritic soils can form from basalts.
What causes the difference in fertility of these soils?
(A) Long periods of erosion
(B) The duration of weathering
(C) The silica content of the soils
(D) The iron content of the basalts
7 What is the most suitable method for reducing sediment content in run-off water from a home construction site?
(A) Divert the run-off water into a storm water drain.
(B) Plant trees across the slope to slow down the run-off.
(C) Place hay bales around the construction site to filter the water. C
rop
yiel
d (D) Treat the run-off water with chemical flocculants to precipitate sediment.
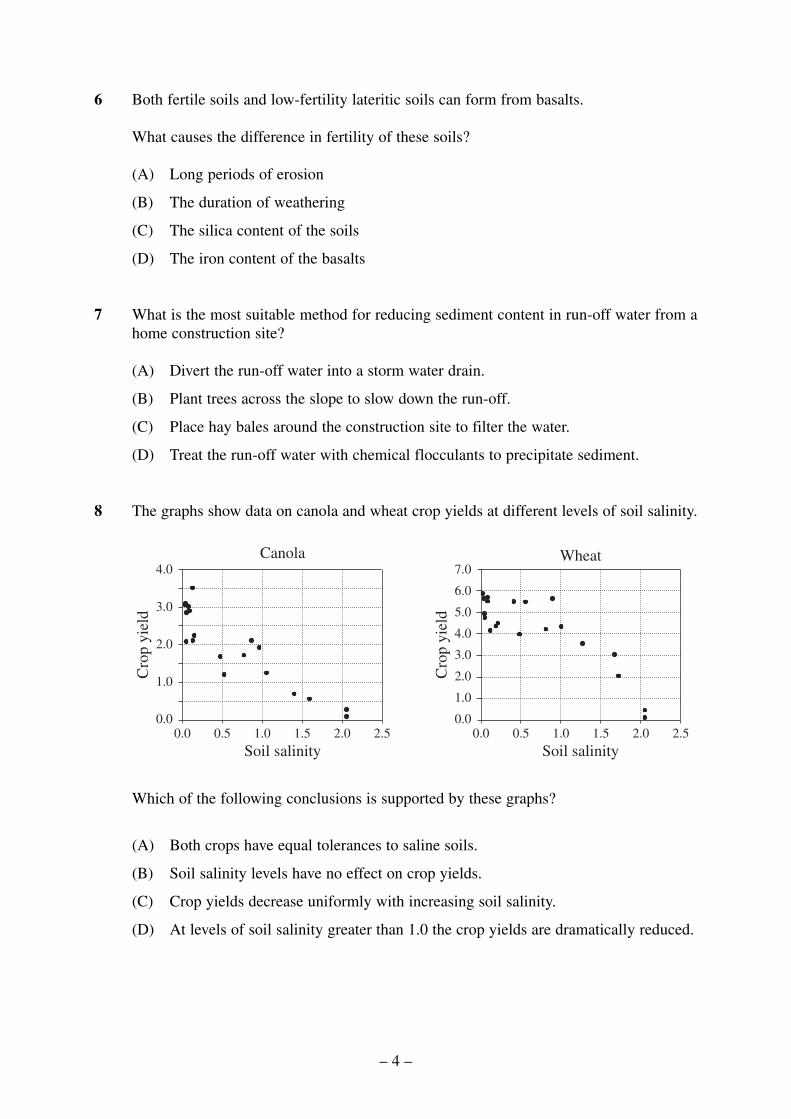
8 The graphs show data on canola and wheat crop yields at different levels of soil salinity.
Canola Wheat 4.0 7.0
6.0 3.0
0.0 0.5 1.0 1.5 2.0 2.5 Soil salinity
Cro
p yi
eld 5.0
4.0
3.0
2.0
2.0
1.0 1.0
0.0 0.0 0.0 0.5 1.0 1.5 2.0 2.5
Soil salinity
Which of the following conclusions is supported by these graphs?
(A) Both crops have equal tolerances to saline soils.
(B) Soil salinity levels have no effect on crop yields.
(C) Crop yields decrease uniformly with increasing soil salinity.
(D) At levels of soil salinity greater than 1.0 the crop yields are dramatically reduced.
– 4 –
9 Which practice may lead to a decrease in soil salinity?
(A) Compaction of soils by cattle
(B) Clearing of trees in valley floors
(C) Planting of trees on nearby hilltops
(D) Repeated use of saline river water for irrigation
10 Which of the following sets of conditions would be the most suitable when selecting a site for a waste dump?
(A)
(B)
(C)
(D)
Slope Soil porosity Geology Rainfall
High High Sandstone Low
Low Moderate Limestone High
Low Low Claystone Low
High High Granite Moderate
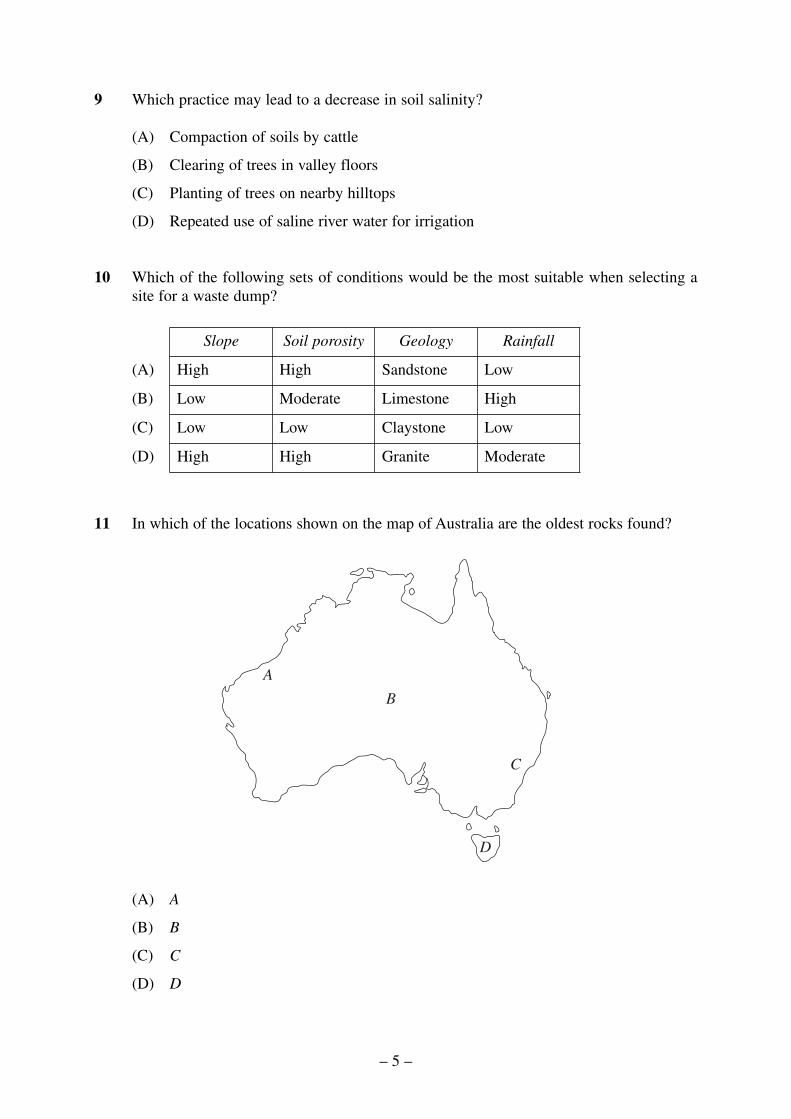
11 In which of the locations shown on the map of Australia are the oldest rocks found?
A
B
C
D
(A) A
(B) B
(C) C
(D) D
– 5 –
12 What is the cause of most earthquakes in central Australia?
(A) Movement along faults
(B) Stress on the Australasian Plate
(C) Convergent plate margin movement
(D) Subsidence caused by mining activities
13 Which of the following best explains the dramatic changes in the composition of the atmosphere that made conditions suitable for the eventual development of life on land?
(A) Ozone was produced by primitive marine organisms.
(B) Metazoans in the oceans produced atmospheric oxygen.
(C) The amount of carbon dioxide in the atmosphere increased.
(D) Photochemical reactions in the upper atmosphere formed ozone.
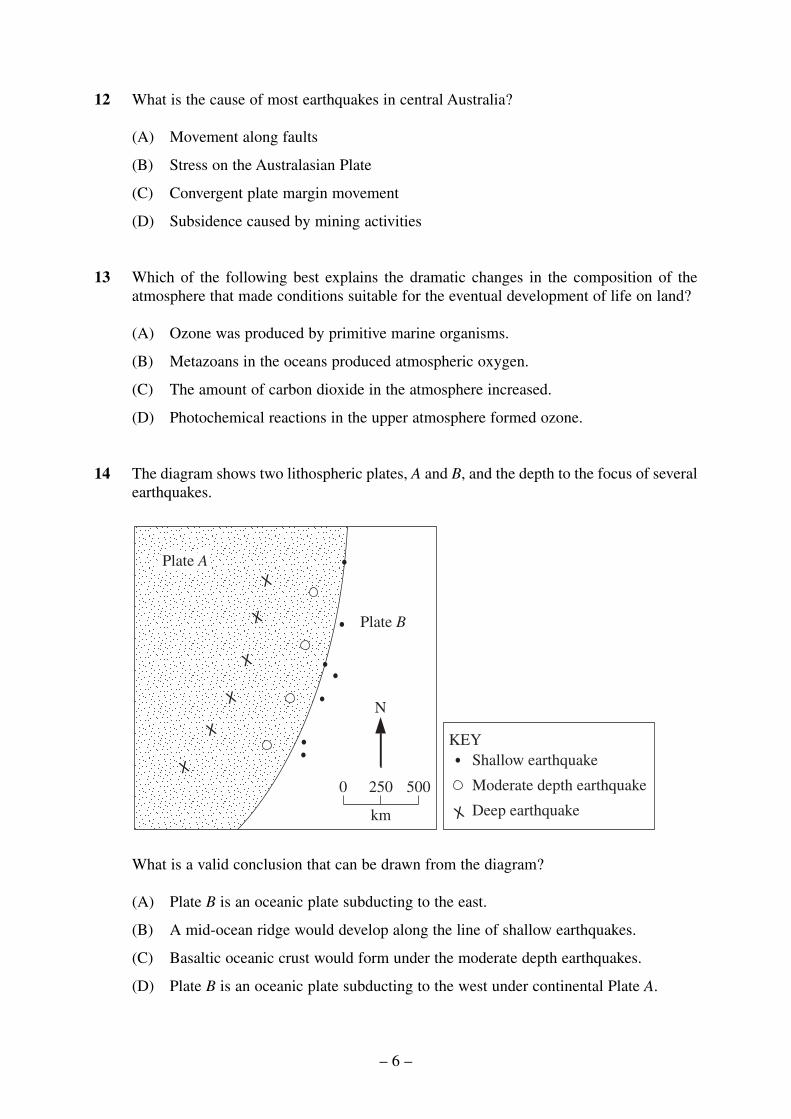
14 The diagram shows two lithospheric plates, A and B, and the depth to the focus of several earthquakes.
Plate B
Plate APlate A
N
KEY
0 250 500
km
Shallow earthquake
Moderate depth earthquake
Deep earthquake
What is a valid conclusion that can be drawn from the diagram?
(A) Plate B is an oceanic plate subducting to the east.
(B) A mid-ocean ridge would develop along the line of shallow earthquakes.
(C) Basaltic oceanic crust would form under the moderate depth earthquakes.
(D) Plate B is an oceanic plate subducting to the west under continental Plate A.
– 6 –
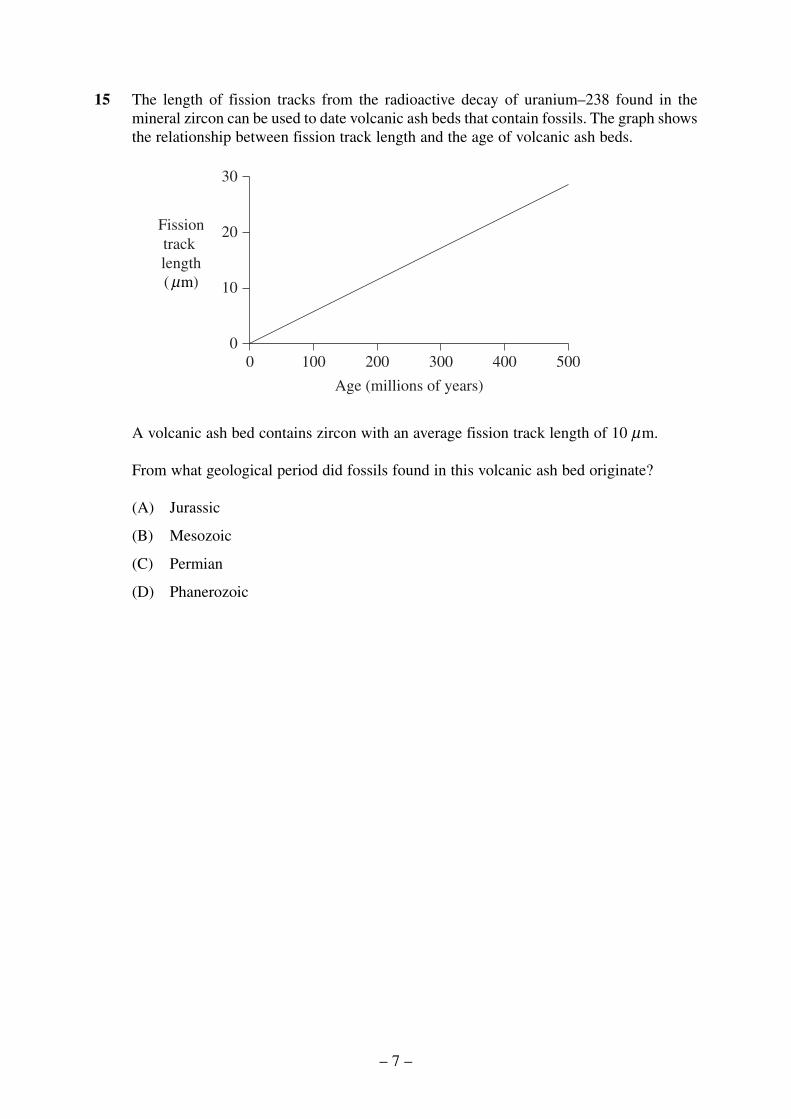
15 The length of fission tracks from the radioactive decay of uranium–238 found in the mineral zircon can be used to date volcanic ash beds that contain fossils. The graph shows the relationship between fission track length and the age of volcanic ash beds.
0 100 200 300 400 500 0
10
20
30
Fission track length ( )μm
Age (millions of years)
A volcanic ash bed contains zircon with an average fission track length of 10 μm.
From what geological period did fossils found in this volcanic ash bed originate?
(A) Jurassic
(B) Mesozoic
(C) Permian
(D) Phanerozoic
– 7 –

BLANK PAGE
– 8 –
© Board of Studies NSW 2007
2007 HIGHER SCHOOL CERTIFICATE EXAMINATION
Earth and Environmental Science Centre Number
Section I (continued)
Part B – 60 marks Student Number Attempt Questions 16–27 Allow about 1 hour and 45 minutes for this part
Answer the questions in the spaces provided.
Question 16 (3 marks)
(a) Identify ONE modern technology used to measure the relative motion of lithospheric plates.
...............................................................................................................................
Marks
1
(b) Describe how this technology is used to measure the relative motion.
...............................................................................................................................
2
...............................................................................................................................
...............................................................................................................................
...............................................................................................................................
Please turn over
140 – 9 –
4
Marks Question 17 (7 marks)
(a) Construct a table to distinguish between the properties of a lithospheric plate containing continental crust and a lithospheric plate containing oceanic crust. In your answer, use THREE properties.
(b) Describe ONE current hypothesis that explains how subduction drives plate motion.
...............................................................................................................................
...............................................................................................................................
...............................................................................................................................
...............................................................................................................................
...............................................................................................................................
...............................................................................................................................
– 10 –
3
Marks Question 18 (6 marks)
(a) (i) Name ONE natural disaster associated with tectonic activity. 1
...................................................................................................................
...................................................................................................................
(ii) Describe the tectonic movement or process that caused this disaster. 2
...................................................................................................................
...................................................................................................................
...................................................................................................................
...................................................................................................................
(b) Explain why people risk farming in active volcanic regions. 3
...............................................................................................................................
...............................................................................................................................
...............................................................................................................................
...............................................................................................................................
...............................................................................................................................
...............................................................................................................................
– 11 –
3
Marks Question 19 (3 marks)
Construct an appropriate scale diagram to show the relative duration of the eons throughout geological time.
Question 20 (3 marks)
(a) Identify TWO gaseous compounds found in vehicle exhaust emissions. 1
...............................................................................................................................
...............................................................................................................................
(b) Write a word equation to show how ONE of these gaseous compounds is formed.
2
– 12 –
© Board of Studies NSW 2007
2007 HIGHER SCHOOL CERTIFICATE EXAMINATION
Earth and Environmental Science Centre Number
Section I – Part B (continued)
Student Number
Marks Question 21 (5 marks)
The Phanerozoic eon began with the Cambrian ‘explosion’.
(a) Why is the term ‘explosion’ used in relation to this event? 1
...............................................................................................................................
...............................................................................................................................
(b) Contrast TWO features of the Ediacaran metazoans with the life-forms that 2 evolved in the Cambrian Period.
...............................................................................................................................
...............................................................................................................................
...............................................................................................................................
...............................................................................................................................
(c) What are possible advantages that the Cambrian life-forms had over the earlier 2 metazoans?
...............................................................................................................................
...............................................................................................................................
...............................................................................................................................
...............................................................................................................................
141 – 13 –
Question 22 (8 marks)
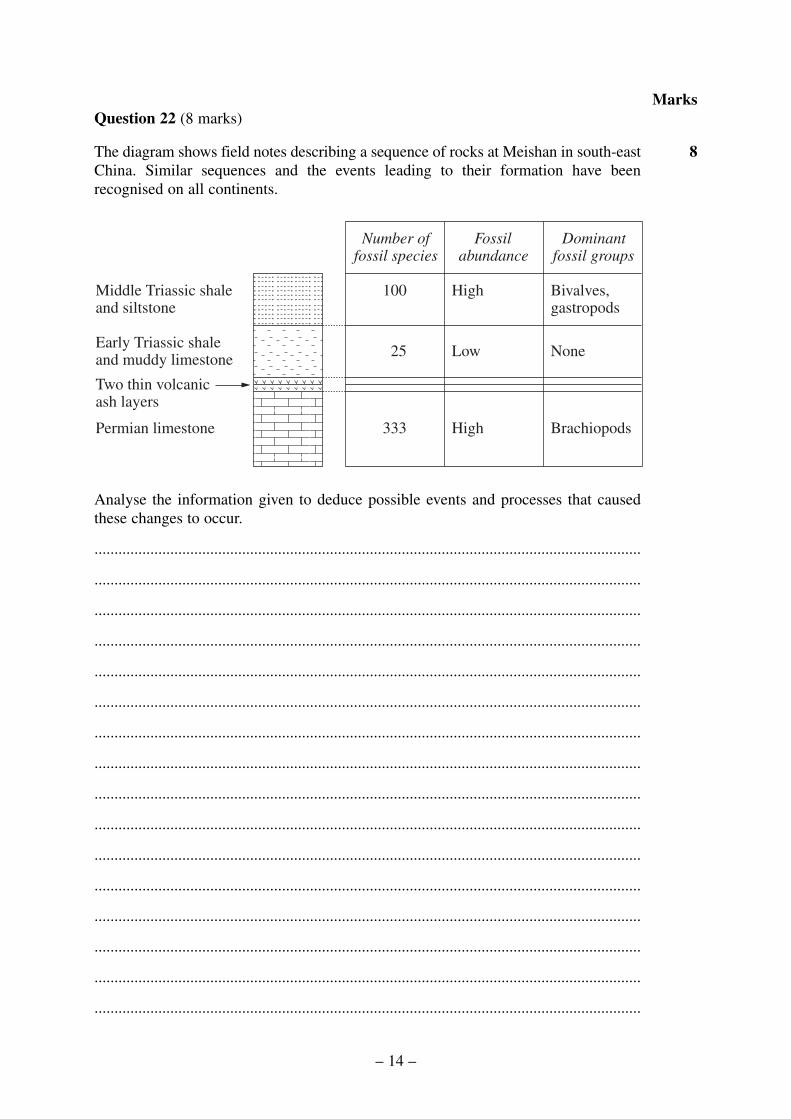
The diagram shows field notes describing a sequence of rocks at Meishan in south-eastChina. Similar sequences and the events leading to their formation have beenrecognised on all continents.
100
25
333
Number offossil species
Bivalves,gastropods
None
Brachiopods
Dominantfossil groups
High
High
Fossilabundance
Middle Triassic shaleand siltstone
LowEarly Triassic shaleand muddy limestone
Permian limestone
Two thin volcanicash layers
Analyse the information given to deduce possible events and processes that causedthese changes to occur.
.........................................................................................................................................
.........................................................................................................................................
.........................................................................................................................................
.........................................................................................................................................
.........................................................................................................................................
.........................................................................................................................................
.........................................................................................................................................
.........................................................................................................................................
.........................................................................................................................................
.........................................................................................................................................
.........................................................................................................................................
.........................................................................................................................................
.........................................................................................................................................
.........................................................................................................................................
.........................................................................................................................................
.........................................................................................................................................
– 14 –
Marks
8

5
Marks Question 23 (5 marks)
How has technology improved our understanding of fossil life-forms?
.........................................................................................................................................
.........................................................................................................................................
.........................................................................................................................................
.........................................................................................................................................
.........................................................................................................................................
.........................................................................................................................................
.........................................................................................................................................
.........................................................................................................................................
.........................................................................................................................................
.........................................................................................................................................
Please turn over
– 15 –
Question 24 (6 marks) Marks
(a) Identify a waste treatment process, and draw a labelled diagram showing how the process was simulated in a school laboratory.
3
Name of the process: ..................................................................................
(b) Evaluate the success and limitation of your simulation for treating waste.
...............................................................................................................................
...............................................................................................................................
...............................................................................................................................
...............................................................................................................................
...............................................................................................................................
...............................................................................................................................
– 16 –
© Board of Studies NSW 2007
3
2007 HIGHER SCHOOL CERTIFICATE EXAMINATION
Earth and Environmental Science Centre Number
Section I – Part B (continued)
Student Number
Question 25 (6 marks)
The halide, methyl bromide, is a highly effective pesticide. In 1991 methyl bromide was identified as a chemical that contributes to the depletion of the ozone layer.
(a) Name a non-chemical alternative to using pesticides.
Marks
1
...............................................................................................................................
(b) Why is it important to stop ozone depletion? 1
...............................................................................................................................
...............................................................................................................................
(c) How can halides reduce ozone levels in the stratosphere? 2
...............................................................................................................................
...............................................................................................................................
...............................................................................................................................
...............................................................................................................................
(d) Outline research into ozone depletion by an Australian scientist or scientific organisation.
2
...............................................................................................................................
...............................................................................................................................
...............................................................................................................................
...............................................................................................................................
142 – 17 –

5
Marks Question 26 (5 marks)
Discuss the effects of continually introducing new pesticides into the environment.
.........................................................................................................................................
.........................................................................................................................................
.........................................................................................................................................
.........................................................................................................................................
.........................................................................................................................................
.........................................................................................................................................
.........................................................................................................................................
.........................................................................................................................................
.........................................................................................................................................
.........................................................................................................................................
– 18 –
– 19 –
Marks
3
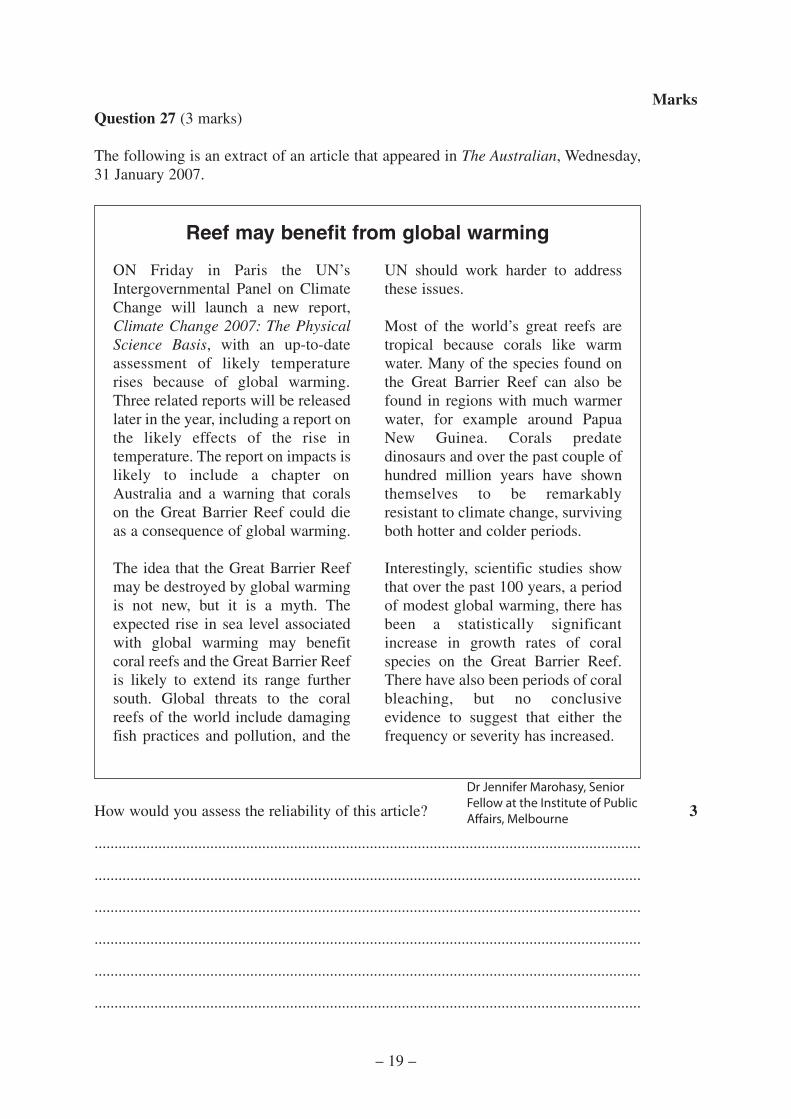
Question 27 (3 marks)
The following is an extract of an article that appeared in The Australian, Wednesday,31 January 2007.
Reef may benefit from global warming
ON Friday in Paris the UN’sIntergovernmental Panel on ClimateChange will launch a new report,Climate Change 2007: The PhysicalScience Basis, with an up-to-dateassessment of likely temperaturerises because of global warming.Three related reports will be releasedlater in the year, including a report onthe likely effects of the rise intemperature. The report on impacts islikely to include a chapter onAustralia and a warning that coralson the Great Barrier Reef could dieas a consequence of global warming.
The idea that the Great Barrier Reefmay be destroyed by global warmingis not new, but it is a myth. Theexpected rise in sea level associatedwith global warming may benefitcoral reefs and the Great Barrier Reefis likely to extend its range furthersouth. Global threats to the coralreefs of the world include damagingfish practices and pollution, and the
UN should work harder to addressthese issues.
Most of the world’s great reefs aretropical because corals like warmwater. Many of the species found onthe Great Barrier Reef can also befound in regions with much warmerwater, for example around PapuaNew Guinea. Corals predatedinosaurs and over the past couple ofhundred million years have shownthemselves to be remarkablyresistant to climate change, survivingboth hotter and colder periods.
Interestingly, scientific studies showthat over the past 100 years, a periodof modest global warming, there hasbeen a statistically significantincrease in growth rates of coralspecies on the Great Barrier Reef.There have also been periods of coralbleaching, but no conclusiveevidence to suggest that either thefrequency or severity has increased.
How would you assess the reliability of this article?
.........................................................................................................................................
.........................................................................................................................................
.........................................................................................................................................
.........................................................................................................................................
.........................................................................................................................................
.........................................................................................................................................
Dr Jennifer Marohasy, Senior Fellow at the Institute of Public

BLANK PAGE
– 20 –
© Board of Studies NSW 2007
2007 HIGHER SCHOOL CERTIFICATE EXAMINATION
Earth and Environmental Science
Section II
25 marks Attempt ONE question from Questions 28–31 Allow about 45 minutes for this section
Answer the question in a writing booklet. Extra writing booklets are available.
Pages
Question 28 Introduced Species and the Australian Environment ........... 22–23
Question 29 Organic Geology – a Non-renewable Resource ................... 24–25
Question 30 Mining and the Australian Environment .............................. 26–27
Question 31 Oceanography ....................................................................... 28–29
143 – 21 –
Question 28 — Introduced Species and the Australian Environment (25 marks)
(a) (i) Define the term biological control.
(ii) Describe, giving an example, ONE type of biological control used inAustralia.
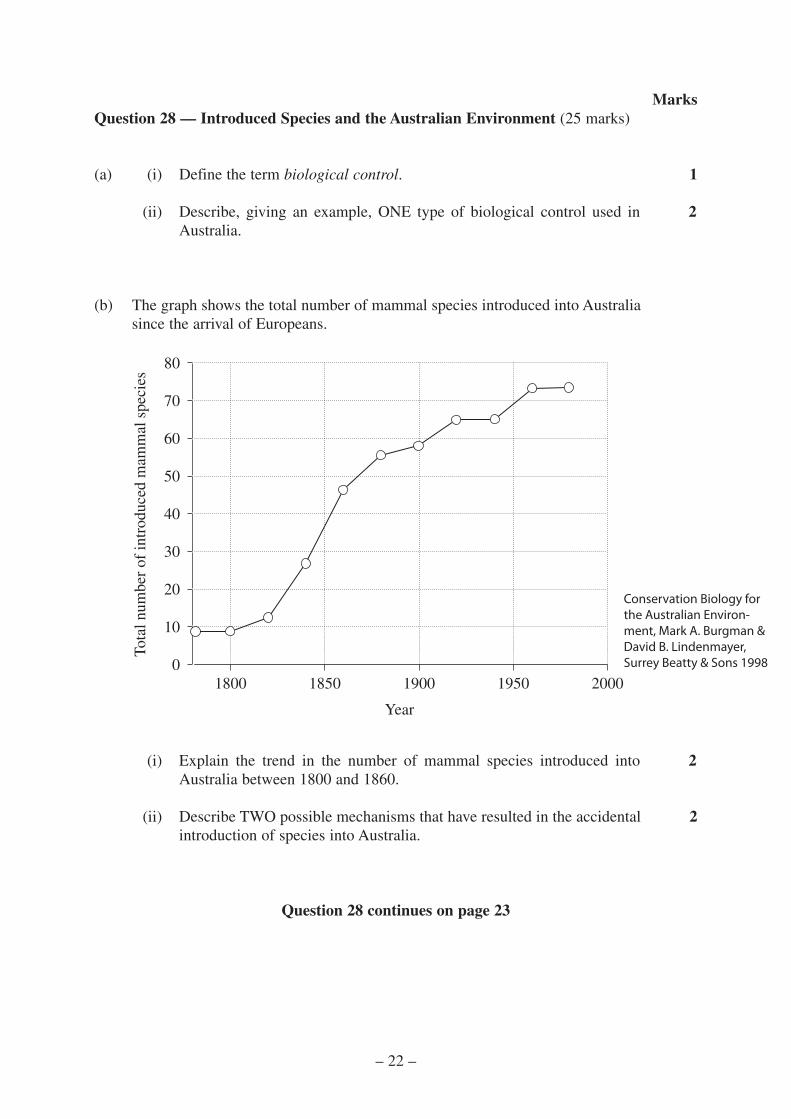
(b) The graph shows the total number of mammal species introduced into Australiasince the arrival of Europeans.
1800 1850 1900 1950 2000
Year
Tota
l num
ber
of in
trod
uced
mam
mal
spe
cies
0
10
20
30
40
50
60
70
80
Conservation Biology for the Australian Environ-ment, Mark A. Burgman & David B. Lindenmayer, Surrey Beatty & Sons 1998
– 22 –
Marks
1
2
2
2
(i) Explain the trend in the number of mammal species introduced intoAustralia between 1800 and 1860.
(ii) Describe TWO possible mechanisms that have resulted in the accidentalintroduction of species into Australia.
Question 28 continues on page 23
Marks
1
2
2
6
4
1
2
Question 28 (continued)
(c) In your study of this option, you performed a first-hand investigation to account for the presence of non-indigenous flora and fauna.
(i) State a suitable hypothesis for your investigation.
(ii) Outline a simple procedure that tested this hypothesis.
(iii) Explain ONE safe work practice that was used during the investigation.
(d) Analyse the effect of a named introduced species on the biotic and abiotic components of the Australian environment it has invaded.
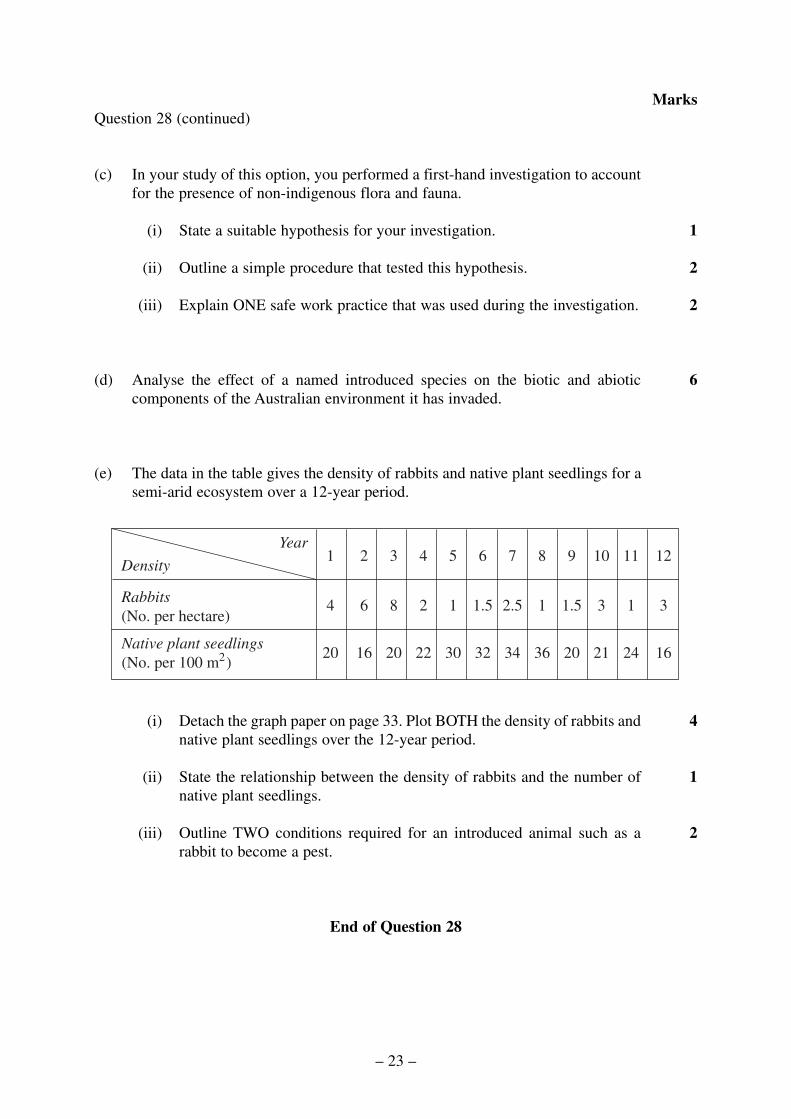
(e) The data in the table gives the density of rabbits and native plant seedlings for a semi-arid ecosystem over a 12-year period.
Year
Density 1 2 3 4 5 6 7 8 9 10 11 12
Rabbits (No. per hectare)
4 6 8 2 1 1.5 2.5 1 1.5 3 1 3
Native plant seedlings (No. per 100 m2)
20 16 20 22 30 32 34 36 20 21 24 16
(i) Detach the graph paper on page 33. Plot BOTH the density of rabbits and native plant seedlings over the 12-year period.
(ii) State the relationship between the density of rabbits and the number of native plant seedlings.
(iii) Outline TWO conditions required for an introduced animal such as a rabbit to become a pest.
End of Question 28
– 23 –
50
40
30
20
10
0
Ene
rgy
yiel
d (k
J/g)
KEY
Petrol
Coal
0 10
Carbon content (%)
20 30 40 50 60 70 80 90
Marks
1
2
2
2
1
2
2
Question 29 — Organic Geology – a Non-renewable Resource (25 marks)
(a) (i) Identify TWO renewable resources as alternatives to fossil fuels.
(ii) Outline the future potential of ONE of these renewable resources.
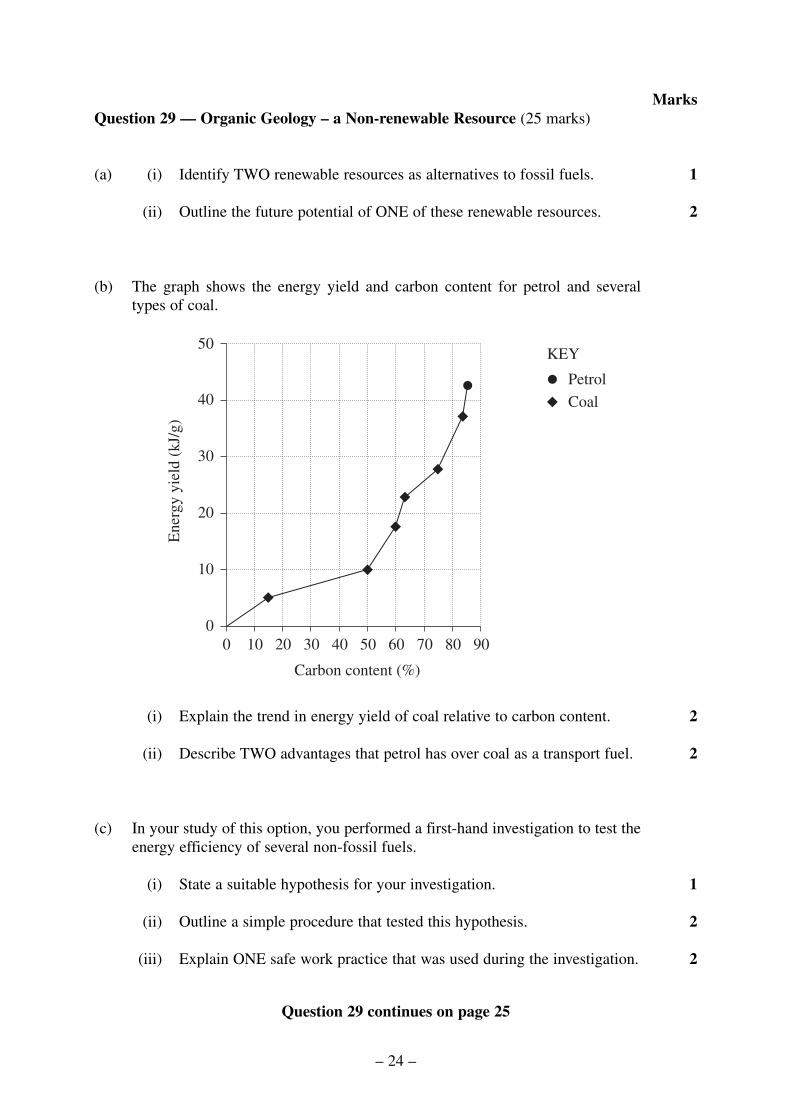
(b) The graph shows the energy yield and carbon content for petrol and several types of coal.
(i) Explain the trend in energy yield of coal relative to carbon content.
(ii) Describe TWO advantages that petrol has over coal as a transport fuel.
(c) In your study of this option, you performed a first-hand investigation to test the energy efficiency of several non-fossil fuels.
(i) State a suitable hypothesis for your investigation.
(ii) Outline a simple procedure that tested this hypothesis.
(iii) Explain ONE safe work practice that was used during the investigation.
Question 29 continues on page 25
– 24 –
Question 29 (continued)
(d) Evaluate methods for conserving energy through architectural design for thebenefit of the individual and the environment.
Marks
6
4
1
2
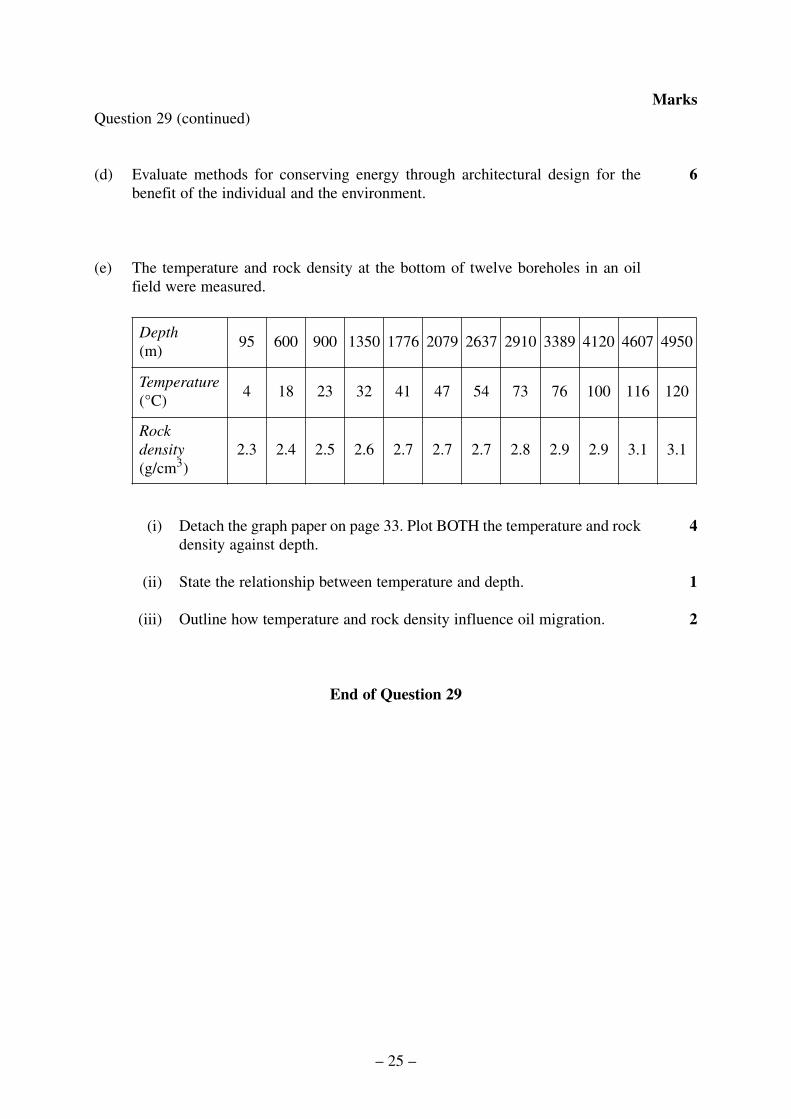
(e) The temperature and rock density at the bottom of twelve boreholes in an oilfield were measured.
Depth (m)
95 600 900 1350 1776 2079 2637 2910 3389 4120 4607 4950
Temperature (°C)
4 18 23 32 41 47 54 73 76 100 116 120
Rock density (g/cm3)
2.3 2.4 2.5 2.6 2.7 2.7 2.7 2.8 2.9 2.9 3.1 3.1
(i) Detach the graph paper on page 33. Plot BOTH the temperature and rockdensity against depth.
(ii) State the relationship between temperature and depth.
(iii) Outline how temperature and rock density influence oil migration.
End of Question 29
– 25 –
Marks
1
2
2
2
1
2
2
Question 30 — Mining and the Australian Environment (25 marks)
(a) (i)
(ii)
Define the term ore.
Outline ONE Australian government policy that affects the sustainability of mining operations.
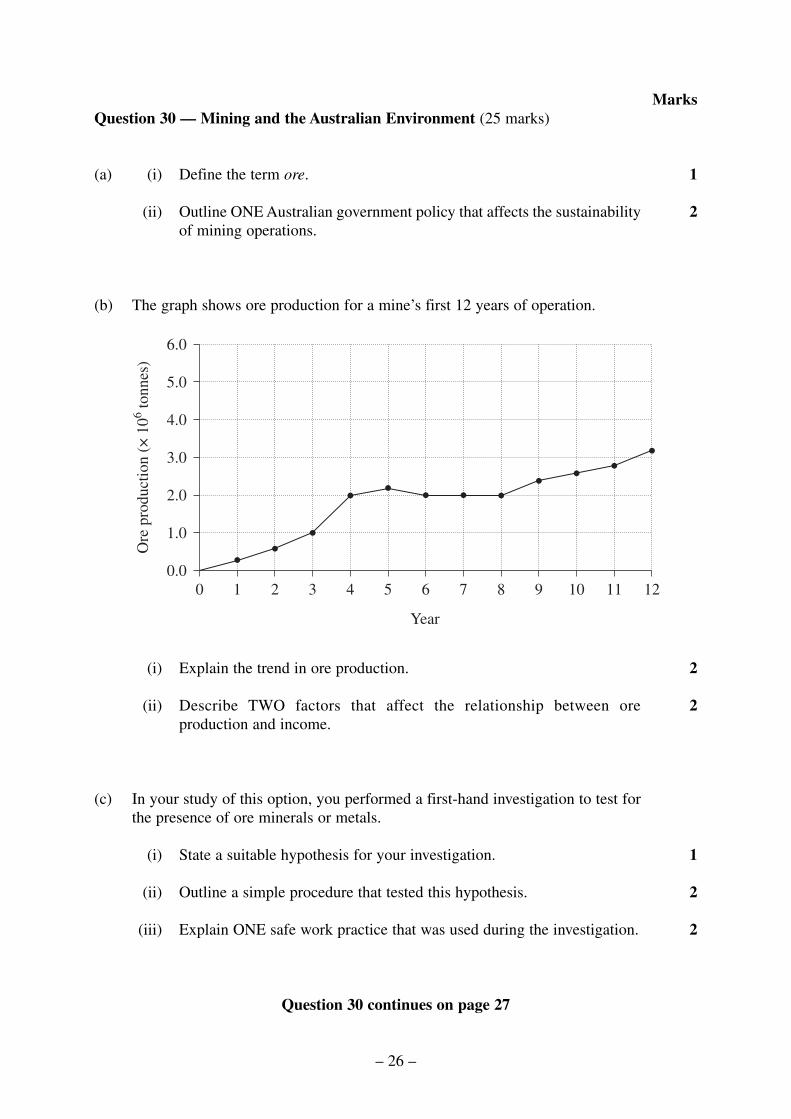
(b) The graph shows ore production for a mine’s first 12 years of operation.
Ore
pro
duct
ion
(× 1
06 tonn
es)
6.0
5.0
4.0
3.0
2.0
1.0
0.0 0 1 2 3 4 5
Year
6 7 8 9 10 11 12
(i)
(ii)
Explain the trend in ore production.
Describe TWO factors that affect the relationship between ore production and income.
(c) In your study of this option, you performed a first-hand investigation to test for the presence of ore minerals or metals.
(i) State a suitable hypothesis for your investigation.
(ii) Outline a simple procedure that tested this hypothesis.
(iii) Explain ONE safe work practice that was used during the investigation.
Question 30 continues on page 27
– 26 –
Marks
6
4
1
2
Question 30 (continued)
(d) Evaluate the need for an environmental impact statement for a company wishing to open a new mine.
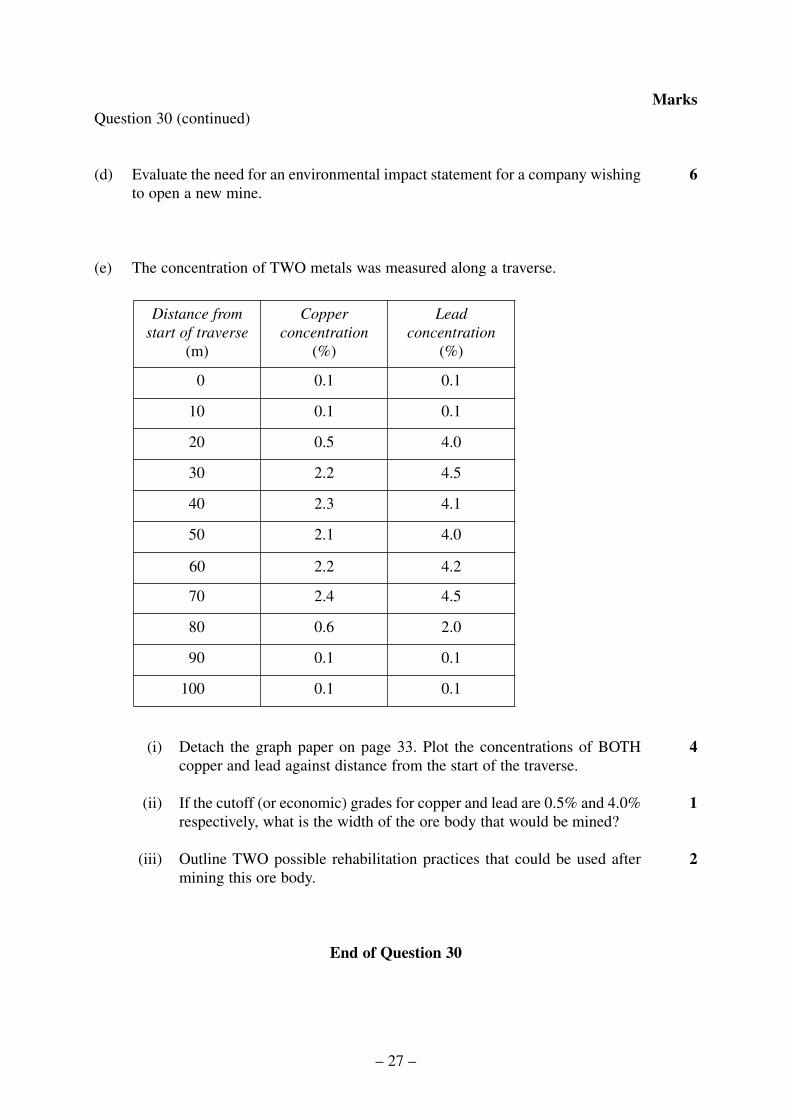
(e) The concentration of TWO metals was measured along a traverse.
Distance from start of traverse
(m)
Copper concentration
(%)
Lead concentration
(%)
0 0.1 0.1
10 0.1 0.1
20 0.5 4.0
30 2.2 4.5
40 2.3 4.1
50 2.1 4.0
60 2.2 4.2
70 2.4 4.5
80 0.6 2.0
90 0.1 0.1
100 0.1 0.1
(i) Detach the graph paper on page 33. Plot the concentrations of BOTH copper and lead against distance from the start of the traverse.
(ii) If the cutoff (or economic) grades for copper and lead are 0.5% and 4.0% respectively, what is the width of the ore body that would be mined?
(iii) Outline TWO possible rehabilitation practices that could be used after mining this ore body.
End of Question 30
– 27 –
18
16
14
12
10
8
6
4
2
0 0 200 400 600 800 1000 1200
Depth (m)
Tem
pera
ture
(°C
)
Marks
1
2
2
2
Question 31 — Oceanography (25 marks)
(a) (i) Identify TWO types of sediment of biological origin that are found in deep ocean basins.
(ii) Outline how manganese nodules form on the deep ocean floor.
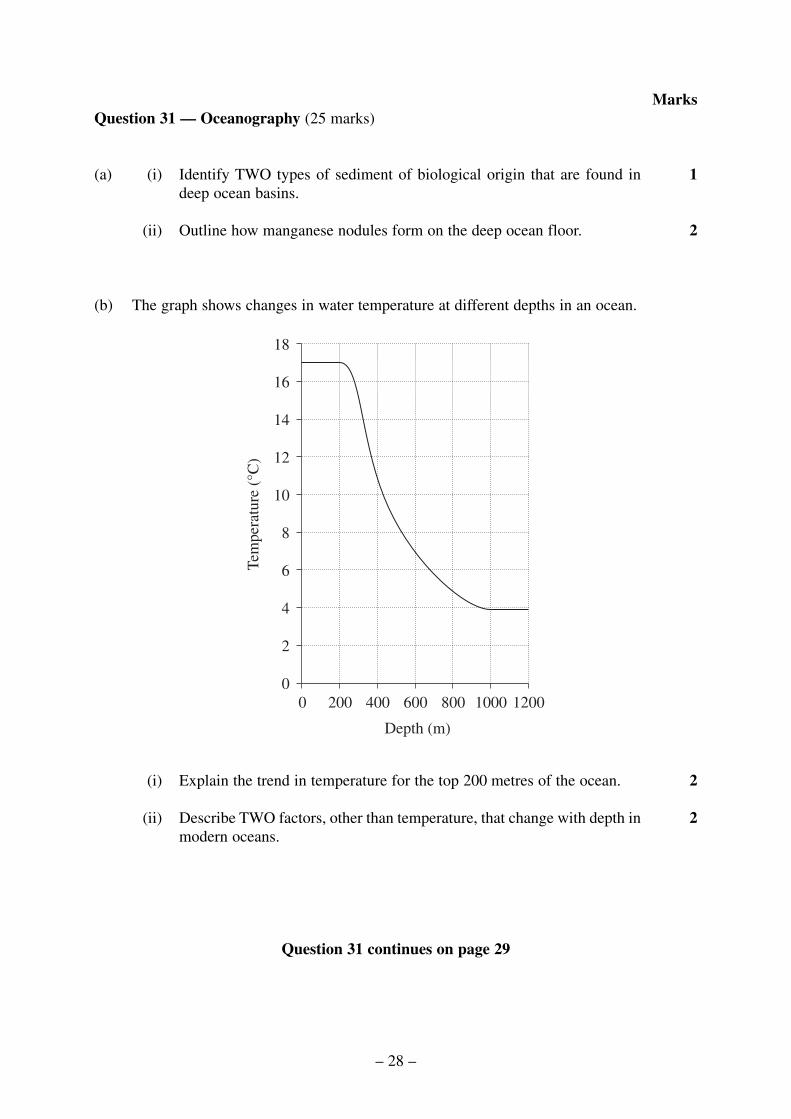
(b) The graph shows changes in water temperature at different depths in an ocean.
(i) Explain the trend in temperature for the top 200 metres of the ocean.
(ii) Describe TWO factors, other than temperature, that change with depth in modern oceans.
Question 31 continues on page 29
– 28 –
Marks
1
2
2
6
4
1
2
Question 31 (continued)
(c) In your study of this option, you performed a first-hand investigation to compare the solubility of common salts in water at different temperatures.
(i) State a suitable hypothesis for your investigation.
(ii) Outline a simple procedure that tested this hypothesis.
(iii) Explain ONE safe work practice that was used during your investigation.
(d) Assess the importance of laws about the ocean for our world society.
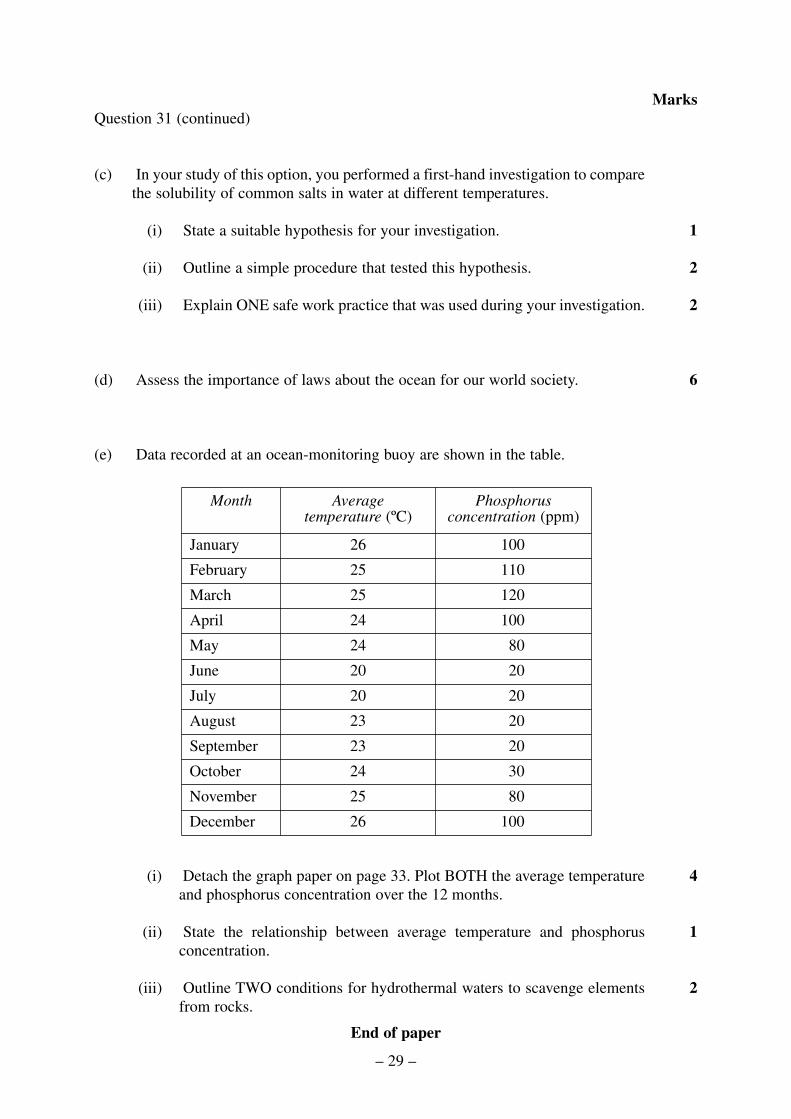
(e) Data recorded at an ocean-monitoring buoy are shown in the table.
Month Average temperature (ºC)
Phosphorus concentration (ppm)
January 26 100
February 25 110
March 25 120
April 24 100
May 24 80
June 20 20
July 20 20
August 23 20
September 23 20
October 24 30
November 25 80
December 26 100
(i) Detach the graph paper on page 33. Plot BOTH the average temperature and phosphorus concentration over the 12 months.
(ii) State the relationship between average temperature and phosphorus concentration.
(iii) Outline TWO conditions for hydrothermal waters to scavenge elements from rocks.
End of paper
– 29 –

BLANK PAGE
– 30 –

BLANK PAGE
– 31 –
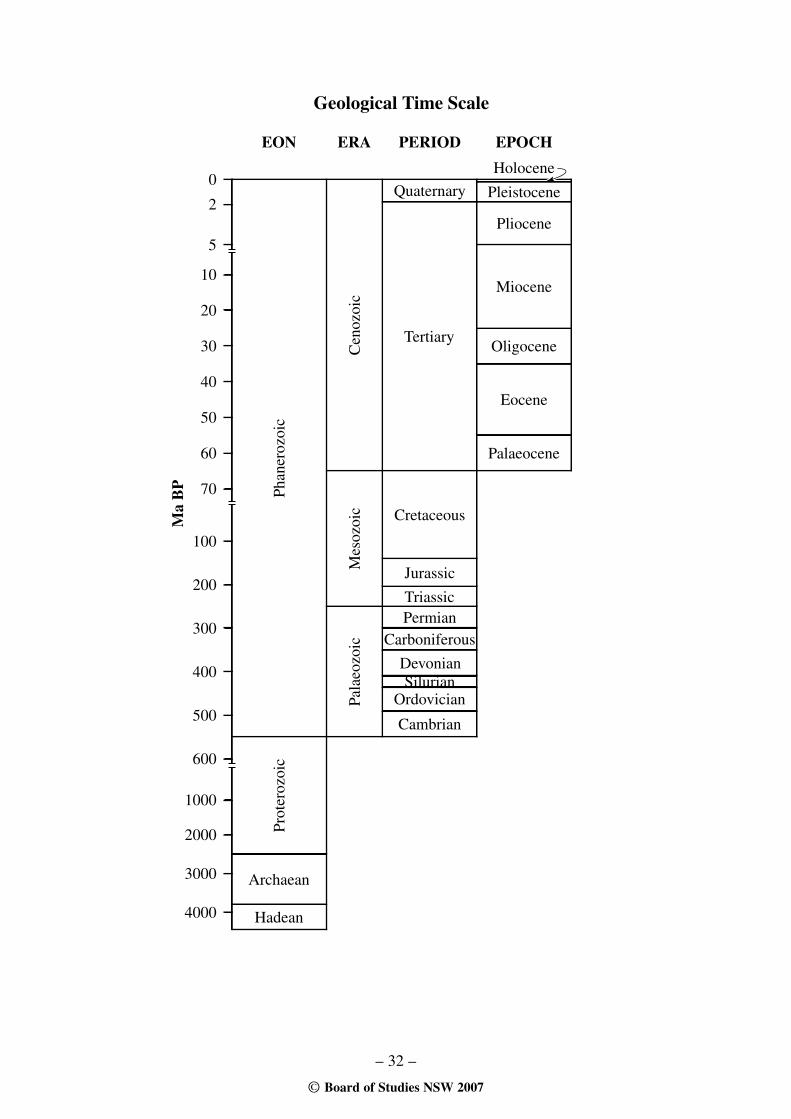
Geological Time Scale
EON ERA PERIOD EPOCH
0
2
5
10
20
30
40
50
60
70
100
200
300
400
500
600
1000
2000
3000
4000 Hadean
Archaean
Oligocene
Eocene
Pliocene
PleistoceneQuaternary
Tertiary
Cretaceous
Permian
Jurassic
Triassic
Devonian Silurian
Ordovician
Cambrian
Carboniferous
Miocene
Palaeocene
Prot
eroz
oic
Phan
eroz
oic
Cen
ozoi
cPa
laeo
zoic
Mes
ozoi
c
Ma
BP
Holocene
– 32 –
© Board of Studies NSW 2007
2007 HIGHER SCHOOL CERTIFICATE EXAMINATION
Earth and Environmental Science Centre Number
Student Number
This page is to be detached, completed and attached to the inside front cover of your writing booklet for the option question you have completed.
Question attempted
144 – 33 –

BLANK PAGE
– 34 –
© Board of Studies NSW 2007
Related Documents