MNRAS 457, 3241–3253 (2016) doi:10.1093/mnras/stw164 Early dust formation and a massive progenitor for SN 2011ja? J. E. Andrews, 1‹ Kelsie M. Krafton, 2 Geoffrey C. Clayton, 2 E. Montiel, 2 R. Wesson, 3 Ben E. K. Sugerman, 4 M. J. Barlow, 5 M. Matsuura 6 and H. Drass 7 1 Steward Observatory, University of Arizona, 933 North Cherry Avenue, Tucson, AZ 85721, USA 2 Department of Physics and Astronomy, Louisiana State University, 202 Nicholson Hall, Baton Rouge, LA 70803, USA 3 European Southern Observatory, Alonso de Cordova 3107, 19001 Casilla, Santiago, Chile 4 Department of Physics and Astronomy, Goucher College, 1021 Dulaney Valley Rd, Baltimore, MD 21204, USA 5 Department of Physics and Astronomy, University College London, Gower Street, London WC1E 6BT, UK 6 School of Physics and Astronomy, Cardiff University, Cardiff CF24 3AA, UK 7 Astronomisches Institut, Ruhr-Universit¨ at Bochum, Universit¨ atsstraße 150, D-44780 Bochum, Germany Accepted 2016 January 18. Received 2016 January 14; in original form 2015 June 30 ABSTRACT SN 2011ja was a bright (I = −18.3) Type II supernova occurring in the nearby edge on spiral galaxy NGC 4945. Flat-topped and multipeaked H α and H β spectral emission lines appear between 64 and 84 d post-explosion, indicating interaction with a disc-like circumstellar medium inclined ∼45 ◦ from edge-on. After day 84, an increase in the H- and K-band flux along with heavy attenuation of the red wing of the emission lines are strong indications of early dust formation, likely located in the cool dense shell created between the forward shock of the SN ejecta and the reverse shock created as the ejecta plows into the existing circumstellar material. Radiative transfer modelling reveals both ≈1 × 10 −5 M ⊙ of pre-existing dust located ∼10 16.7 cm away and up to ≈6 × 10 −4 M ⊙ of newly formed dust. Spectral observations after 1.5 yr reveal the possibility that the fading SN is located within a young (3–6 Myr) massive stellar cluster, which when combined with tentative 56 Ni mass estimates of 0.2 M ⊙ may indicate a massive (≥25 M ⊙ ) progenitor for SN 2011ja. Key words: circumstellar matter – supernovae: general – supernovae: individual: SN 20011ja – stars: winds, outflows. 1 INTRODUCTION Type IIP, the most common type of core collapse supernovae (CC- SNe), have broad (∼10 4 km s −1 ) hydrogen emission lines along with a near constant ‘plateau’ of optical luminosity throughout the first ∼100 d. The widely accepted progenitors of Type IIP SNe, red supergiants (RSGs), have masses ranging between ∼9 and 25 M ⊙ and mass-loss rates of ∼10 −6 to 10 −4 M ⊙ yr −1 (Chevalier, Fransson & Nymark 2006; Mauron & Josselin 2011). Type IIn SNe also show broad hydrogen emission, but, in addition, they show nar- row (∼100 km s −1 ) hydrogen emission due to ionization of the sur- rounding, dense pre-existing circumstellar material (CSM). These SNe likely have more massive progenitors such as Luminous Blue Variables (LBV), or Wolf–Rayet (WR) stars that can have mass-loss rates which are orders of magnitude larger, 10 −5 to 10 −2 M ⊙ yr −1 (Smith et al. 2011; Kiewe et al. 2012; Smith, Mauerhan & Prieto 2014). Whether Type IIP or Type IIn, these massive star progenitors can undergo periods of dramatic mass-loss prior to explosion which has a direct impact on the SN evolution. Over the past decade, we ⋆ E-mail: [email protected] have seen numerous observational signatures of the SN ejecta inter- acting with previously shed layers, anywhere from hours to years after explosion (Leonard et al. 2000; Andrews et al. 2010; Fransson et al. 2014; Maeda et al. 2015; Smith et al. 2015, for example). By observing the SN–CSM interaction, we can get a better understand- ing of pre-supernova mass-loss, pathways of dust production, and the link between progenitor and SN type. Due to their short lifetimes and ability to return material back to the ISM quickly, CCSNe are the likely culprits for the dust produc- tion in dusty high-z galaxies (Gall, Andersen & Hjorth 2011; Dwek et al. 2014). This is a double-edged sword, as they are also efficient destroyers of dust, at least in present-day galaxies (Temim et al. 2015). Although Slavin, Dwek & Jones (2015) propose effective SN dust destruction, but only within a subset of the appropriate assumed parameters. Many recent studies of nearby CCSNe have searched for signatures of dust formation and estimated the dust masses. The results of these studies indicate small amounts of newly formed dust, 10 −2 –10 −4 M ⊙ (Elmhamdi et al. 2003; Sugerman et al. 2006; Meikle et al. 2007; Kotak et al. 2009; Andrews et al. 2010, for example), much less than the 0.1–1 M ⊙ needed to account for the excess of dust seen in the early Universe. Within the past few years, far-IR studies have revealed a few sources which may C ⃝ 2016 The Authors Published by Oxford University Press on behalf of the Royal Astronomical Society by Mikako Matsuura on March 4, 2016 http://mnras.oxfordjournals.org/ Downloaded from

Welcome message from author
This document is posted to help you gain knowledge. Please leave a comment to let me know what you think about it! Share it to your friends and learn new things together.
Transcript

MNRAS 457, 3241–3253 (2016) doi:10.1093/mnras/stw164
Early dust formation and a massive progenitor for SN 2011ja?
J. E. Andrews,1‹ Kelsie M. Krafton,2 Geoffrey C. Clayton,2 E. Montiel,2 R. Wesson,3
Ben E. K. Sugerman,4 M. J. Barlow,5 M. Matsuura6 and H. Drass7
1Steward Observatory, University of Arizona, 933 North Cherry Avenue, Tucson, AZ 85721, USA2Department of Physics and Astronomy, Louisiana State University, 202 Nicholson Hall, Baton Rouge, LA 70803, USA3European Southern Observatory, Alonso de Cordova 3107, 19001 Casilla, Santiago, Chile4Department of Physics and Astronomy, Goucher College, 1021 Dulaney Valley Rd, Baltimore, MD 21204, USA5Department of Physics and Astronomy, University College London, Gower Street, London WC1E 6BT, UK6School of Physics and Astronomy, Cardiff University, Cardiff CF24 3AA, UK7Astronomisches Institut, Ruhr-Universitat Bochum, Universitatsstraße 150, D-44780 Bochum, Germany
Accepted 2016 January 18. Received 2016 January 14; in original form 2015 June 30
ABSTRACTSN 2011ja was a bright (I = −18.3) Type II supernova occurring in the nearby edge on spiralgalaxy NGC 4945. Flat-topped and multipeaked H α and H β spectral emission lines appearbetween 64 and 84 d post-explosion, indicating interaction with a disc-like circumstellarmedium inclined ∼45◦ from edge-on. After day 84, an increase in the H- and K-band fluxalong with heavy attenuation of the red wing of the emission lines are strong indications ofearly dust formation, likely located in the cool dense shell created between the forward shockof the SN ejecta and the reverse shock created as the ejecta plows into the existing circumstellarmaterial. Radiative transfer modelling reveals both ≈1 × 10⁻⁵ M⊙ of pre-existing dust located∼1016.7 cm away and up to ≈6 × 10⁻⁴ M⊙ of newly formed dust. Spectral observations after1.5 yr reveal the possibility that the fading SN is located within a young (3–6 Myr) massivestellar cluster, which when combined with tentative 56Ni mass estimates of 0.2 M⊙ mayindicate a massive (≥25 M⊙) progenitor for SN 2011ja.
Key words: circumstellar matter – supernovae: general – supernovae: individual: SN20011ja – stars: winds, outflows.
1 IN T RO D U C T I O N
Type IIP, the most common type of core collapse supernovae (CC-SNe), have broad (∼104 km s−1) hydrogen emission lines alongwith a near constant ‘plateau’ of optical luminosity throughout thefirst ∼100 d. The widely accepted progenitors of Type IIP SNe, redsupergiants (RSGs), have masses ranging between ∼9 and 25 M⊙and mass-loss rates of ∼10−6 to 10−4 M⊙ yr−1 (Chevalier, Fransson& Nymark 2006; Mauron & Josselin 2011). Type IIn SNe alsoshow broad hydrogen emission, but, in addition, they show nar-row (∼100 km s−1) hydrogen emission due to ionization of the sur-rounding, dense pre-existing circumstellar material (CSM). TheseSNe likely have more massive progenitors such as Luminous BlueVariables (LBV), or Wolf–Rayet (WR) stars that can have mass-lossrates which are orders of magnitude larger, 10−5 to 10−2 M⊙ yr−1
(Smith et al. 2011; Kiewe et al. 2012; Smith, Mauerhan & Prieto2014). Whether Type IIP or Type IIn, these massive star progenitorscan undergo periods of dramatic mass-loss prior to explosion whichhas a direct impact on the SN evolution. Over the past decade, we
⋆ E-mail: [email protected]
have seen numerous observational signatures of the SN ejecta inter-acting with previously shed layers, anywhere from hours to yearsafter explosion (Leonard et al. 2000; Andrews et al. 2010; Franssonet al. 2014; Maeda et al. 2015; Smith et al. 2015, for example). Byobserving the SN–CSM interaction, we can get a better understand-ing of pre-supernova mass-loss, pathways of dust production, andthe link between progenitor and SN type.
Due to their short lifetimes and ability to return material back tothe ISM quickly, CCSNe are the likely culprits for the dust produc-tion in dusty high-z galaxies (Gall, Andersen & Hjorth 2011; Dweket al. 2014). This is a double-edged sword, as they are also efficientdestroyers of dust, at least in present-day galaxies (Temim et al.2015). Although Slavin, Dwek & Jones (2015) propose effectiveSN dust destruction, but only within a subset of the appropriateassumed parameters. Many recent studies of nearby CCSNe havesearched for signatures of dust formation and estimated the dustmasses. The results of these studies indicate small amounts of newlyformed dust, 10−2–10−4 M⊙ (Elmhamdi et al. 2003; Sugermanet al. 2006; Meikle et al. 2007; Kotak et al. 2009; Andrews et al.2010, for example), much less than the 0.1–1 M⊙ needed to accountfor the excess of dust seen in the early Universe. Within the pastfew years, far-IR studies have revealed a few sources which may
C⃝ 2016 The AuthorsPublished by Oxford University Press on behalf of the Royal Astronomical Society
by Mikako M
atsuura on March 4, 2016
http://mnras.oxfordjournals.org/
Dow
nloaded from

3242 J. E. Andrews et al.
Figure 1. Colour composite Gemini/GMOS image of SN 2011ja (indicated in white). Optical standards (Table 3) are indicated by blue solid circles, NIRstandards (Table 4) by dashed yellow circles.
hold promise to unlocking the dust mystery. Herschel observationsof three nearby young supernova remnants indicate the presence of0.1 M⊙ of cool dust in Cas A (Barlow et al. 2010), 0.4–0.7 M⊙ ofcool dust in the ejecta of SN 1987A (Matsuura et al. 2011, 2015) and0.18–0.27 M⊙ of cool dust in the Crab nebula (Gomez et al. 2012;Owen & Barlow 2015). Recent SOFIA observations of a supernovaremnant at the centre of the Milky Way revealed 0.02 M⊙ of warm(100 K) dust, which also has seemed to have survived the passingof the reverse shock (Lau et al. 2015). This strongly suggests thatalmost all of the dust in SNe is formed after >1000 d (Wessonet al. 2015; Bevan & Barlow 2016). While reservoirs of cold dustmay help solve this problem, there is a growing body of evidencethat grain growth may be occurring in the ISM enriched by theseearly SNe and could be the main site for dust production at high-z(Michałowski 2015). However, a plausible mechanism for growingrefractory grains in the ISM has yet to be identified.
Observational signatures of dust formation in CCSNe manifestthemselves in several different forms. The optical luminosity willdecrease while almost simultaneously the NIR will increase as thedust grains absorb the shorter wavelength light and re-emit it in theIR. The grain formation will also alter the optical spectra, creatingasymmetric and blueshifted lines as the dust grains attenuate thered, receding side of the ejecta preferentially. This observationalevidence of dust formation has now been seen in numerous SNe,including the nearby and well-studied SN 1987A (Lucy et al. 1989;Wooden et al. 1993), SN 2003gd (Sugerman et al. 2006; Meikleet al. 2007), SN 2004et (Sahu et al. 2006; Kotak et al. 2009) andmany others. While it was initially believed that the dust grainscould only condense 300–600 d after explosion, when the ejecta hadexpanded and cooled, there have been more and more confirmedcases of dust forming much earlier, within ∼100 d of explosion. This
can occur due to shock interaction with nearby CSM creating anarea between the forward and reverse shocks with temperatures anddensities appropriate for grain growth, this area is known as the cooldense shell (CDS). For example, SN 1998S showed dust formationsignatures between days 140 and 268 (Leonard et al. 2000), and SN2005ip appears to have formed dust both in the CDS between day75 and 150 and then again in the ejecta after day 750 (Fox et al.2009; Smith et al. 2009). The bright IIn SN 2010jl shows continuousdust formation between 40 and 240 d (Gall et al. 2014). Althoughnot classified as Type IIn, the Type Ib/c SN 2006jc also formeddust via CSM interaction between 50–75 d post-explosion (Mattilaet al. 2008; Smith, Foley & Filippenko 2008) and the Type IIP SN2007od formed dust sometime between day 120 and 230 throughthe same mechanism (Andrews et al. 2010). As we will presentbelow, with more and more long-term monitoring of CCSNe, thereseems to be evidence of non-Type-IIn SNe exhibiting signs of CSMinteraction, even months after explosion. This not only allows aseparate channel for dust formation in CCSNe, but can also revealimportant properties of SN evolution.
SN 2011ja was discovered in NGC 4945, an edge-on spiral(Fig. 1) located at a distance of 3.36 ± 0.09 Mpc (Mouhcine et al.2005). NGC 4945 is one of the closest Milky Way analogues witha near solar metallically, particularly at increasing distances fromthe galactic centre where the supernova is located (Stanghellini,Magrini & Casasola 2015). This is of importance, particularly indust formation, as higher metallicity galaxies tend to be able to pro-duce higher dust masses (Draine et al. 2007; Galametz et al. 2011).On 2011 December 19, optical spectra obtained of the object indi-cated that it was a Type II supernova which most closely matchedSN 2004et about a week after maximum (Monard et al. 2011), al-though maximum optical light of SN 2011ja does not appear to have
MNRAS 457, 3241–3253 (2016)
by Mikako M
atsuura on March 4, 2016
http://mnras.oxfordjournals.org/
Dow
nloaded from

SN2011ja evolution 3243
Figure 2. Optical and IR light curves of SN 2011ja from values listed in Tables 1 and 3. The NIR curves have been shifted up one magnitude for clarity. TheV and I photometry prior to day 84 has been obtained from AAVSO. The dashed line follows the decay of 56Co.
Table 1. Gemini/GMOS photometry of SN 2011ja.
Day JD V R I
84 2455991 17.20 ± 0.08 14.87 ± 0.06 13.76 ± 0.06112 2456019 18.00 ± 0.10 15.71 ± 0.06 14.62 ± 0.06159 2456066 18.37 ± 0.05 16.10 ± 0.05 15.03 ± 0.04450 2456357 19.88 ± 0.10 18.42 ± 0.11 17.64 ± 0.10508 2456415 19.95 ± 0.10 18.76 ± 0.12 17.88 ± 0.10807 2456714 19.74 ± 0.11 18.61 ± 0.11 18.05 ± 0.08
been achieved until ∼2012 January 14 (Fig. 2). Radio observationspresented in Chakraborti et al. (2013), further suggest an explosiondate of 2011 December 12 (JD 2455907). Therefore, throughoutthis paper, we choose 2011 December 12 as day 0 for SN 2011ja,and day 34 as the date of maximum light. In Section 2, we discussthe data reductions and present a comprehensive analysis of thesedata in Section 3. Section 4 contains a discussion of the implica-tions of the data, and Section 5 includes analysis in regards to dustformation, CSM location, and progenitor characteristics. Finally, inSection 6 we briefly summarize the significant results of the paper.
2 O B S E RVAT I O N S A N D DATA R E D U C T I O N
Optical imaging and spectra were obtained with GMOS/GeminiSouth (GS-2012A-Q-79, GS-2013-Q-93, PI Andrews). A Colourcomposite Gemini/GMOS image of SN 2011ja is shown in Fig. 1,and a summary of observations and resultant photometry in Table 1.The g′r′i′ images were reduced and stacked using the IRAF1 gemini
1 IRAF is distributed by the National Optical Astronomical Observatory,which is operated by the Association of Universities for Research in Astron-omy, Inc., under cooperative agreement with the National Science Founda-tion.
Table 2. Tertiary VRI standards for NGC 4945.
Star α (J2000) δ (J2000) V R I196h + −49◦ +
A 0.341 633 0.495 212 16.30 15.42 14.98B 0.350 917 0.506 569 15.39 14.90 14.73C 0.353 678 0.507 214 15.70 14.43 14.93D 0.345 111 0.517 944 16.31 16.26 15.67E 0.240 586 0.501 742 16.44 15.82 15.57F 0.243 756 0.514 639 16.60 16.11 15.56G 0.297 883 0.493 965 15.85 14.56 15.12H 0.279 450 0.516 431 16.28 14.88 15.45I 0.297 790 0.494 104 16.77 15.81 16.02
Note. Photometry is from NOMAD and DENIS catalogues.
package. The instrumental g′r′i′ magnitudes were transformed tostandard Johnson-Cousins VRI using tertiary standards created fromstars in the field (Fig. 1 and Table 2) and transformations presentedin Welch et al. (2007). Uncertainties were calculated by addingin quadrature the transformation uncertainty quoted in Welch et al.(2007), photon statistics, and the zero-point deviation of the standardstars for each epoch. Figs 2 and 3 show the resultant light curves.
For each GMOS/Gemini South epoch, three spectra of 900s wereobtained in semester 2012A and six spectra of 900s were obtainedin semester 2013A. The spectra were obtained in longslit mode us-ing grating B600 and a slit width of 0.′′75. With a resolving power R= 1688, this corresponds to a velocity resolution of ∼180 km s−1.Central wavelengths of 5950, 5970, and 5990 Å were chosen to pre-vent important spectral features from falling on chip gaps. A 2x2binning in the low gain setting was used. Spectra were reduced usingthe IRAF gemini package. The sky subtraction regions were deter-mined by visual inspection to prevent contamination from materialnot associated with the SN, and the spectra were extracted using
MNRAS 457, 3241–3253 (2016)
by Mikako M
atsuura on March 4, 2016
http://mnras.oxfordjournals.org/
Dow
nloaded from
3244 J. E. Andrews et al.
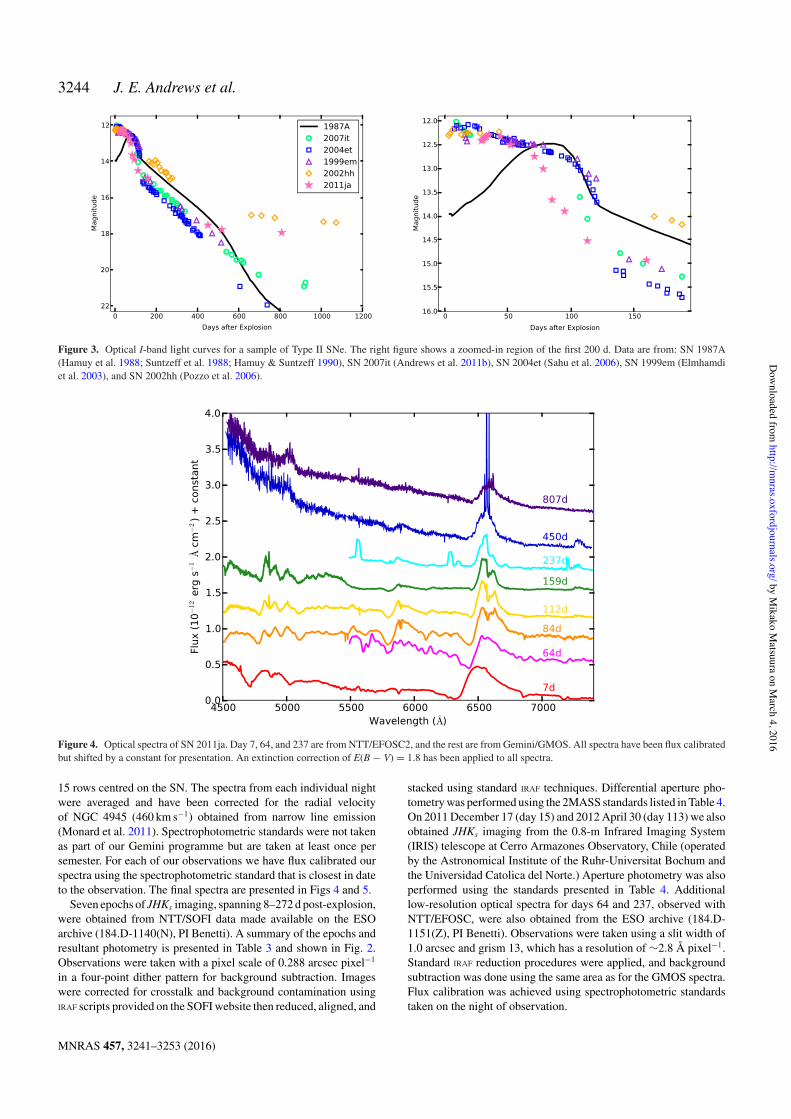
Figure 3. Optical I-band light curves for a sample of Type II SNe. The right figure shows a zoomed-in region of the first 200 d. Data are from: SN 1987A(Hamuy et al. 1988; Suntzeff et al. 1988; Hamuy & Suntzeff 1990), SN 2007it (Andrews et al. 2011b), SN 2004et (Sahu et al. 2006), SN 1999em (Elmhamdiet al. 2003), and SN 2002hh (Pozzo et al. 2006).
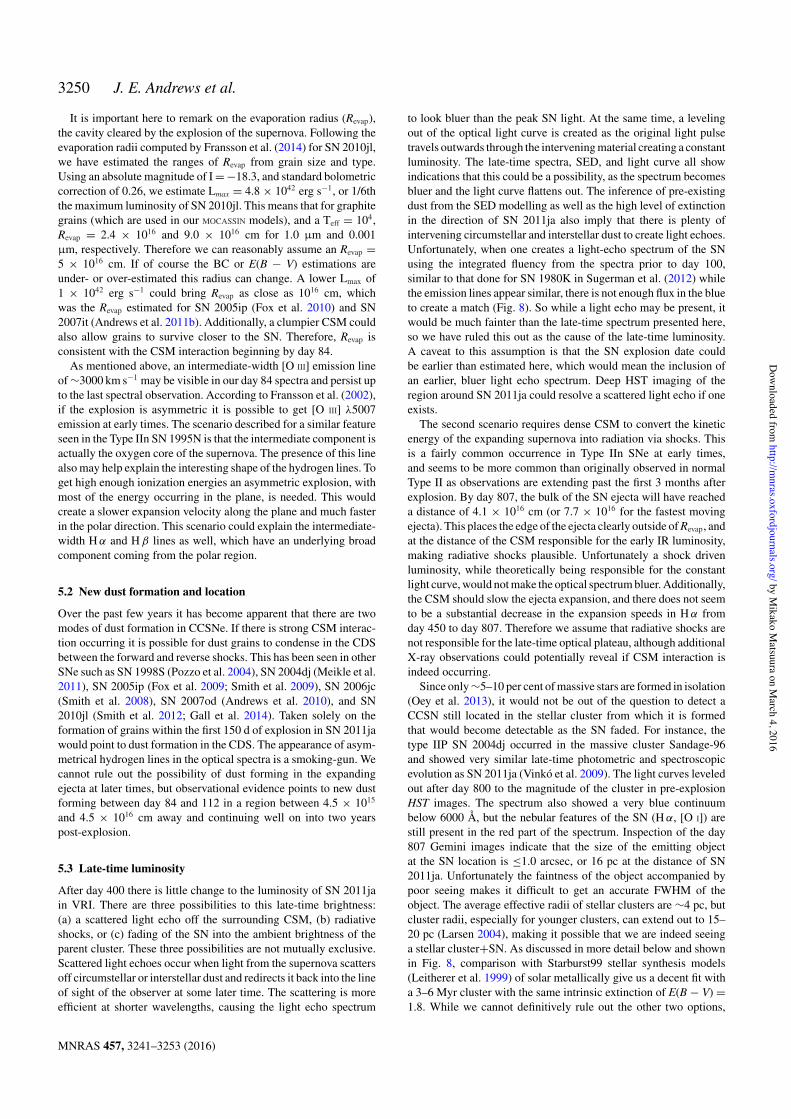
Figure 4. Optical spectra of SN 2011ja. Day 7, 64, and 237 are from NTT/EFOSC2, and the rest are from Gemini/GMOS. All spectra have been flux calibratedbut shifted by a constant for presentation. An extinction correction of E(B − V) = 1.8 has been applied to all spectra.
15 rows centred on the SN. The spectra from each individual nightwere averaged and have been corrected for the radial velocityof NGC 4945 (460 km s−1) obtained from narrow line emission(Monard et al. 2011). Spectrophotometric standards were not takenas part of our Gemini programme but are taken at least once persemester. For each of our observations we have flux calibrated ourspectra using the spectrophotometric standard that is closest in dateto the observation. The final spectra are presented in Figs 4 and 5.
Seven epochs of JHKs imaging, spanning 8–272 d post-explosion,were obtained from NTT/SOFI data made available on the ESOarchive (184.D-1140(N), PI Benetti). A summary of the epochs andresultant photometry is presented in Table 3 and shown in Fig. 2.Observations were taken with a pixel scale of 0.288 arcsec pixel−1
in a four-point dither pattern for background subtraction. Imageswere corrected for crosstalk and background contamination usingIRAF scripts provided on the SOFI website then reduced, aligned, and
stacked using standard IRAF techniques. Differential aperture pho-tometry was performed using the 2MASS standards listed in Table 4.On 2011 December 17 (day 15) and 2012 April 30 (day 113) we alsoobtained JHKs imaging from the 0.8-m Infrared Imaging System(IRIS) telescope at Cerro Armazones Observatory, Chile (operatedby the Astronomical Institute of the Ruhr-Universitat Bochum andthe Universidad Catolica del Norte.) Aperture photometry was alsoperformed using the standards presented in Table 4. Additionallow-resolution optical spectra for days 64 and 237, observed withNTT/EFOSC, were also obtained from the ESO archive (184.D-1151(Z), PI Benetti). Observations were taken using a slit width of1.0 arcsec and grism 13, which has a resolution of ∼2.8 Å pixel−1.Standard IRAF reduction procedures were applied, and backgroundsubtraction was done using the same area as for the GMOS spectra.Flux calibration was achieved using spectrophotometric standardstaken on the night of observation.
MNRAS 457, 3241–3253 (2016)
by Mikako M
atsuura on March 4, 2016
http://mnras.oxfordjournals.org/
Dow
nloaded from

SN2011ja evolution 3245
Figure 5. H α (top) and H β (bottom) evolution for a subset of epochs fromFig. 4. The enhanced red emission in H β on day 84 could be due a blendwith Fe λ 4924 Å.
Spitzer IRAC (3.6 and 4.5 µm) images were obtained at fourepochs from day 105 to 857. The day 857 data were retrievedfrom the Spitzer Heritage Archive as part of the SPIRITS: SPitzerInfraRed Intensive Transients Survey (11603, PI Kasliwal). Thepipeline reduced pbcd images were galaxy subtracted using previous
Table 4. Tertiary 2MASS standards for NGC 4945.
Star α (J2000) δ (J2000) J H K196h + −49◦ +
1 0.265 558 0.507 378 12.68 12.44 12.382 0.279 346 0.516 434 14.77 14.35 14.273 0.264 956 0.535 126 15.08 14.64 14.554 0.316 055 0.519 047 15.79 15.01 14.875 0.287 417 0.534 851 15.50 14.90 14.84
IRAC imaging from 2007 August 07 (40410, PI Reike), and thenaperture photometry was performed on the residual. A summaryof the observations and fluxes are shown in Table 3. Additionalmid-IR observations at 18.72 and 10.77 µm were obtained withVLT/VISIR (288.D-5031(A), PI Wesson) on 2012 February 26 (day76) and March 14 (day 93), respectively. For the B10.7 filter, a total3600s was taken on target as was 7200s for the Q2 filter. Bothobservations resulted in a non-detection, so only upper limits canbe inferred. These are 2 mJy for 10.7 µm and 10 mJy for 18.72 µm.
3 A NA LY SIS
3.1 Internal extinction
The initial discovery spectrum, shown in Fig. 4, suggested a largeamount of extinction towards SN 2011ja (Monard et al. 2011). TheMilky Way foreground is only AV=0.48 mag (Schlafly & Finkbeiner2011) so much of the extinction is internal to NGC 4945, which isnot unexpected as extinction estimates along its galactic plane areAv > 11–13 (Marconi et al. 2000). In order to determine an accurateextinction value for SN 2011ja, we have employed a variety of tests.Because of the low recession velocity of the galaxy (450 km s−1)the use of the Na ID doublet was insufficient for this galaxy due tothe blending of internal and external Na absorption lines. This isnot necessarily a hindrance, as it is still under debate whether thismethod is acceptable for SNe (Poznanski et al. 2011; Poznanski,Prochaska & Bloom 2012), especially in the presence of CSM.Therefore, we compared our unreddened, early-time spectra withoptical spectra of SN 2004et, a prototypical Type IIP, from similarepochs and applied extinction corrections until the spectra werecoincident. SN 2004et has an E(B − V) = 0.43 (Sahu et al. 2006),and comparisons on both day 7 and day 84 yield a total E(B − V)= 1.8 in SN 2011ja, using the reddening law of CCM (Cardelli,Clayton & Mathis 1989). Throughout this paper, we use a value oftotal reddening, foreground to SN2011ja, to be E(B − V) = 1.8.
Table 3. Near- and mid- IR photometry of SN 2011ja.
Day JD J H K 3.6 µm (mJy) 4.5 µm (mJy)
8 2455915 11.46 ± 0.05 11.85 ± 0.03 10.76 ± 0.0615 2455922 11.12 ± 0.04 10.93 ± 0.04 10.32 ± 0.0440 2455947 10.78 ± 0.03 10.29 ± 0.03 9.92 ± 0.0665 2455972 11.15 ± 0.03 10.63 ± 0.02 10.20 ± 0.0793 2456000 12.59 ± 0.03 12.02 ± 0.04 11.60 ± 0.06105 2456012 – – – 8.18 ± 0.15 10.10 ± 0.19113 2456020 12.85 ± 0.10 12.22 ± 0.10 11.60 ± 0.15121 2456028 13.12 ± 0.02 12.45 ± 0.04 11.87 ± 0.06243 2456150 14.11 ± 0.11 12.65 ± 0.07 11.49 ± 0.07272 2456179 14.39 ± 0.04 12.91 ± 0.02 11.63 ± 0.04486 2456393 – – – 9.18 ± 0.15 11.21 ± 0.17637 2456544 – – – 4.61 ± 0.11 5.80 ± 0.12857 2456764 – – – 1.32 ± 0.10 3.50 ± 0.10
MNRAS 457, 3241–3253 (2016)
by Mikako M
atsuura on March 4, 2016
http://mnras.oxfordjournals.org/
Dow
nloaded from

3246 J. E. Andrews et al.
As a second method and sanity check, we measured the relativeline strengths of the H α and H β nebular emission, assuming bothCase A and Case B recombination in the H II region surrounding theSN, as these are the two extremes of hydrogen recombination, andthe area surrounding SN 2011ja must lie somewhere in between.In the absence of reddening we would expect a ratio of 2.85 forCase B and 1.91 for Case A, but we find a ratio closer to 17.25suggesting 1.64 < E(B − V) < 2.01 (Seaton 1979). This is inreasonable agreement with comparison to the SN 2004et spectra.When we measure this ratio on day 159, E(B − V) has increased to2.10, indicating an additional increase in Av of 0.55 mag betweenthese two dates, assuming Rv = 3.1. As we will discuss below, thisis likely due to early-dust formation.
3.2 Optical light-curve evolution
Fig. 2 shows the VRI evolution of SN 2011ja between days 28 and1138. The I-band AAVSO observations up to day 77 indicate thatthe SN may have been increasing in luminosity since discovery andreached a maximum brightness on 2012 January 14, day 34. Shownin detail in Fig. 3, the plateau phase only lasted for ∼35 d, with adecline rate of 0.01 mag d−1. The drop into the radioactive decayportion of the light curve that begins on day ∼70, lasted only 15 dwith a &I of 1 mag, which was similar for the other optical bands.It is possible that the transitional phase lasted until day 112, and ifthis is the case, the SN faded by 1.8 mags in 42 d (a rate of 0.04 magd−1). We have reason to believe, as explained below, that the startof the radioactive decay phase was in fact around the time of ourfirst GMOS observation of SN 2011ja on day 84.
Comparison with the light curves of other Type II SNe shownin Fig. 3, particularly after day 50, shows that SN 2011ja may liesomewhere between a Type IIP and a Type IIL classification-wise.The blurring between ‘plateau’ and ‘linear’ designations of TypeII SNe is becoming more common as the sample of well-studiedobjects increases, with a survey of hydrogen rich SNe presented byAnderson et al. (2015) concluding that there are not two distinctclasses, but rather a continuum based most strongly on the envelopemass at explosion. Contrarily, this is somewhat at odds with Arcaviet al. (2012) who make claim that there are distinct groups based onprogenitor types. The short plateau duration, the absolute magnitudeat maximum (I = −18.3), and the steep drop into the radioactivedecay phase all point to a CCSN with a smaller hydrogen envelope,which we will discuss in more detail below.
Assuming the radioactive decay phase started on day 84, the V-band magnitudes should then be 17.47 on day 112 and 17.92 onday 159 if the only energy source is the decay of 56Co (dashedline in Fig. 2). This is roughly 0.5 mag brighter than the observedmagnitude, requiring an increase in optical depth (τ ) of 0.5 betweenday 84 and 112 to account for the magnitude deficit. Modelling ofthe optical and IR photometry lend credence to this hypothesis, andas we will show in Section 4, radiative transfer modelling shows thatthere is a substantial increase in τV between day 105 and day 486. Byitself this does not necessarily confirm an increase of extinction priorto day 159, but in tandem with the optical spectroscopy presentedin the next section, we have sufficient reason to believe new dustwas being formed within 100 d of explosion in SN 2011ja.
Alternatively, if the radioactive decay phase is assumed to beginon day 112, the SN does not suffer from any increased extinctionand behaves as expected until ∼400 d, when the luminosity levelsout through our last observation on day 857. This late-time plateaucan be caused by various physical mechanisms, notably a scattered-
light echo, shock-interaction, or ambient light from the parent stellarcluster. These scenarios are discussed in detail in Section 5.2.
3.3 Spectra
Early-time spectra of SN 2011ja show a prototypical Type II super-nova (Fig. 4, day 7), with blue-shifted H α and H β emission lines,peaking at −3500 km s−1 and −3000 km s−1, respectively, and verylittle else. While most other SNe show a very blue continuum atthese early times, the high reddening towards SN 2011ja repressesthis feature. This is further exemplified by a strong Na I D absorp-tion feature present around 5900 Å. A high-velocity (HV) featuremay also be present in the day 7 spectrum at ∼13 700 km s−1, likelydue to flash-heated unshocked pre-explosion mass-loss from theprogenitor star (Chugai, Chevalier & Utrobin 2007).
Our first GMOS spectra of SN 2011ja was obtained on day 84,when the multicomponent hydrogen lines that seem to appear in theday 64 spectra are now prevalent (Fig. 5). Blueshifted and redshiftedpeaks are seen in H α at −1400 km s−1, and 2900 km s−1, in additionto the narrow nebular line at 0 km s−1. There is also a possibletertiary peak on the red side at 1700 km s−1. The H β emission showspeaks at −2100 km s−1 and 3100 km s−1, but not the existence ofa second redshifted component. We cannot ascertain if a double-peaked structure exists in the He I λ5876 line due to the blendingwith the Na ID doublets from local and host galaxy extinction.Multipeaked asymmetric hydrogen lines have been seen in otherSNe, such as SN 1993J (Matheson et al. 2000), SN 1998S (Leonardet al. 2000), SN 2004dj (Chugai et al. 2007), SN 2007od (Andrewset al. 2010), SN 2009ip (Mauerhan et al. 2014), and PTF11iqb(Smith et al. 2015), and are mostly attributed to a torrodal or discgeometry of surrounding CSM material. Comparison with modelspresented in Fransson et al. (2005) indicate that the CSM aroundSN 2011ja may be represented by a torus inclined between 30◦ and60◦ with an angular thickness between 30◦ and 50◦.
Other broad nebular lines such as Ba II λ6142, [Sc II] λ5527,λ5658, and λ6246, and [O I] λλ6300,6363 are dominant in the neb-ular spectra. Fe II λλ 4924,5169 may also be present and somewhatblended with H β and other Sc lines. An intermediate-width com-ponent of [O III] λ 5007 Å seems to appear at this time as well, andpersists until our last spectra on day 807. Alternatively, this could bea −735 km s−1 blueshifted peak of Fe λ 5018 Å. If this is the case,then the red emission peak of H β is likely blended with a similarlyblueshifted component of Fe λ4924 Å. The only other publishedexample of broad [O III] emission is in the well-studied Type IIn1995N (Fransson et al. 2002). In that object, lines of a similar width(1500 km s−1) were seen, the only difference being in SN 1995Nthey showed a much more boxy profile, similar to what we see inour H α emission lines. Those authors attributed this emission tounshocked ejecta composed of oxygen core material coupled witha low hydrogen envelope mass.
By days 159 and 237, when the SN is well into the nebular phase,the strong P-Cygni profile in H α has all but disappeared. In additionto having multiple peaks, the H α (and to some extent H β) linesbegin to show signs of flattening as the nebular phase persists. Boxy,flat-topped spectra have also been seen in SNe 1993J (Mathesonet al. 2000), 1998S (Leonard et al. 2000), 2004et (Kotak et al. 2009),and 2007od (Andrews et al. 2010), and are attributable to CSMinteraction. Also noticeable in the H α emission is the degradationof the red peak from the day 64 and 84 observations (Fig. 5). Overthe course of ∼180 d, the ratio of the blue and red peak emission hasevolved from 1:1 to 2:1. Further comparison between H α emissionof SN 2011ja at ∼day 84, SN 2004dj at day 128, and SN 2007od at
MNRAS 457, 3241–3253 (2016)
by Mikako M
atsuura on March 4, 2016
http://mnras.oxfordjournals.org/
Dow
nloaded from

SN2011ja evolution 3247
Figure 6. H α profiles of other SNe with known CSM interaction. Dataare from Andrews et al. (2010) (2007od) and Vinko et al. (2006) (2004dj).All three SNe were classified as normal Type II, yet all three show thesame double-peaked emission profile, with a dominant blue-peak within4–8 months post-explosion.
day 232 (Fig. 6) shows similar structures, particularly in the peaksat ±1500 km s−1. This double-peaked structure was attributed to theinteraction of the ejecta with a torus or disc of material surroundingthe supernova, with the stronger attenuation on the red side due todust forming in the line of sight. The extra peak at +3200 km s−1 ismore of a mystery. It is possible that the multiple peaks seen in thehydrogen lines could come from asymmetries in 56Ni in the ejecta.This non-uniformity could cause uneven ionization and excitationin the ejecta, as was suggested for the He I lines in the Type IIb SN2008ax (Taubenberger et al. 2011).
The H α line width of 5000 km s−1 persists from day 64 until ourlast observation on day 807. Late-time spectra show the emergenceof strong lines of [N II] λλ 6548,6583 and [S II] λλ 6716,6731 Å(see Fig. 4). More striking is the blue continuum that emerged inthe last two epochs. This occurred at the same time as the levellingoff of the optical light curve discussed in Section 3.2. The two arelikely caused by the same phenomenon, and are discussed in detailin Section 5.3.
3.4 IR observations
In Fig. 2 we also show the first ∼300 d of JHK evolution, includinga maximum around day 40. Between day 8 and 40 there is anincrease in the absolute magnitude of all NIR bands, although thelargest increase of 1.5 mag occurred in the H-band. In the weeksfollowing the maximum there is a steep decline, very similar tothe optical light-curve evolution, until day 121. Between day 121and 243 the K-band brightens by ∼0.4 mag and an almost constantplateau in the H-band. This corresponds to the same time periodwhen we believe there was an increase in optical fading by 0.5 mag,and that the H α emission showed the most red-side attenuation. Asimilar increase in the H- and K-bands was observed around day 50in SN 2005ip (Fox et al. 2009) and SN 2006jc (Smith et al. 2008).In both cases, the increase in the NIR can be attributed to dust grainformation. Although there is no NIR photometry available to us afterday 272, the brightness is once again declining into a radioactivetail, indicating that the new grains have either been destroyed in the
reverse shock or have cooled sufficiently to only be detectable atlonger wavelengths.
3.5 56Ni mass estimates
We estimate a 56Ni mass for SN 2011ja of MNi = 0.22 ± 0.03 M⊙employing the methods of Hamuy (2003), using the V magnitudeat day 84. The bolometric luminosity of the radioactive tail (inerg s−1) is calculated as
log10Lt = −[Vt − A(V ) + BC] + 5log10D − 8.142.5
, (1)
with AV = 5.6 mag, and a bolometric correction of BC = 0.26. Thenickel mass is then calculated at various times during this phase,as
MNi = (7.866x10−44)Ltexp
!tt −t01+z
− 6.1
111.26
"M⊙. (2)
Here, 6.1 d is the half-life of 56Ni and 11.26 d is the e-foldingtime of 56Co and tt-t0 is the age of the SN. This calculated Nimass is much larger than other Type IIP SNe. There is, of course,some uncertainty in the extinction correction, not to mention theluminosity at each epoch could be underestimated due to additionaldust formation or overestimated due to circumstellar interaction.If this is an accurate measurement of the 56Ni mass, it would putSN 2011ja in a regime of high mass normally reserved for strippedenvelope CCSNe, particularly IIb and Ib (Lyman et al. 2016). Forcomparison, other ‘normal’ Type IIp SNe such as SNe 1999em,2003gd, and 2004dj each have 56Ni masses ∼0.02 M⊙, or a fullorder of magnitude lower than estimated here (Elmhamdi et al.2003; Hendry et al. 2005; Vinko et al. 2006).
4 R A D I ATI V E TR A N S F E R MO D E L L I N G
To determine the amount and type of dust being formed in SN2011ja, we have used the MOCCASIN 3D Monte Carlo radiative trans-fer code (Ercolano, Barlow & Storey 2005, and references therein).As was done for SN2007it (Andrews et al. 2011b) and SN 2010jl(Andrews et al. 2011a) we assume three different dust geome-tries. The ‘smooth’ distribution describes dust distributed uniformlywithin a spherical shell surrounding the SN. The ‘torus’ model dis-tributes dust uniformly within a torus at some inclination aroundthe SN. Finally, the ‘clumpy’ model places dust in clumps and scat-ters it throughout a spherical shell surrounding the SN. For grainsizes we are using a standard MRN grain size distribution of a−3.5
between 0.005 and 0.05 µm (Mathis, Rumpl & Nordsieck 1977).For each epoch, we use the Spitzer IRAC data to set the date, andextrapolate the optical and NIR photometry from the surroundingobservations. We also correct all photometric points for the assumedE(B − V) = 1.8.
Continuing on in the manner presented in Andrews et al. (2010,2011a,b), the dust and luminosity for the source was located be-tween an inner radius Rin and an outer radius Rout of a sphericallyexpanding shell, with the diffuse emission luminosity being propor-tional to the density at each location. The smooth model assumesthe density of dust in the shell was inversely proportional to thesquare of the radius. For the clumpy model the photons originatein the inhomogeneous interclump medium, where the clumps areconsidered to be optically thick and spherical. For the torus mod-els, densities are specified for the inner and outer walls, with thedust distribution falling off linearly between the two radii (Ercolano,
MNRAS 457, 3241–3253 (2016)
by Mikako M
atsuura on March 4, 2016
http://mnras.oxfordjournals.org/
Dow
nloaded from

3248 J. E. Andrews et al.
Figure 7. SEDs of days 105 (upper left), 486 (upper right), 637 (lower left), and 857 (lower right). All photometric points have been corrected for E(B − V) =1.8, and optical and NIR fluxes have been extrapolated from other observations to match the Spitzer observation dates. Blackbody fits are shown as solid lines.MOCASSIN fits are shown in dashed (smooth), dotted (torus, 45◦), and dash–dotted (clumpy). Note the y-scale is different for epoch 1 than for the other epochs.
Table 5. Monte Carlo radiative transfer shell models.
Smooth ClumpyEpoch Tej (K) Rin (cm) Rout(cm) Ltot. (L⊙) τ v Md (M⊙) Md (M⊙)
105 d 7000 5.3e16 5.3e17 1.8e8 0.01 1.1e-5 1.9e-4486 d 7000 4.8e15 4.8e16 1.0e7 1.29 3.7e-5 6.4e-5637 d 7000 5.3e15 5.3e16 7.4e6 0.73 2.7e-5 3.8e-5857 d 7000 8.5e15 8.5e16 3.5e6 0.71 4.5e-4 6.4e-4
Barlow & Sugerman 2007). For each model we used grains of amor-phous carbon (AC) using the optical constants of Hanner (1988),due to the lack of mid-IR detection at 10.8 µm, which would haveindicated a strong silicate component. Inputs for the models were lu-minosity, ejecta temperature, inner and outer radii, and dust masses.For each epoch and parameter, initial estimates were accomplishedusing blackbody fits to the optical and IR data (solid curves Fig. 7).This yielded dust temperatures (Td) of roughly 950 K for the firstepoch (day 105), then a rise to 1150 K for the second epoch (day435) before returning to 950 K on day 637 and finally to 500 K onour last epoch on day 857. These temperatures are consistent withtypical warm dust temperatures. Inputs and outputs for each epochand geometry are listed in Tables 5 and 6.
For the shell models, the first epoch (day 105) is best fit by anRin of 5.3 × 1016 cm, which roughly corresponds to the evapora-
tion radius of the initial flash of the SN. Day 486 used an Rin of4.8 × 1015 cm, day 637 Rin = 5.3 × 1015 cm, and for our finalepoch (day 857) Rin = 8.5 × 1015 cm. For the torus models, the bestfits were achieved with slightly different values for Rin. On day 105we assumed Rin = 5.0 × 1016 cm, and for the remaining epochsRin = 6.0 × 1015 cm or Rin = 8.5 × 1015 cm (day 857). We also keptthe temperature of the ejecta (Tej) at 7000 K for all epochs, sincethis is a reasonable ejecta temperature (Sugerman et al. 2006) anddoes an adequate job fitting the first epoch of optical points. Thecombination of strong H α and [O I] emission lines in the R bandrelative to the continuum, and at later times the additional blue fluxhas made it unlikely that the visible photometry is consistent withany reasonable blackbody temperature. Keeping those two valuesconstant, we then varied the luminosity, dust masses, and for thetorus models the number density along the inner edge to get the
MNRAS 457, 3241–3253 (2016)
by Mikako M
atsuura on March 4, 2016
http://mnras.oxfordjournals.org/
Dow
nloaded from

SN2011ja evolution 3249
Table 6. Monte Carlo radiative transfer torus todels.
Face-on (0◦) 45◦ Edge-on (90◦)Epoch Tej (K) Rin (cm) Rout(cm) Ltot. (L⊙) τ v Md (M⊙) τ v Md (M⊙) τ v Md (M⊙)
105 d 7000 5.0e16 5.0e17 1.8e8 0.0 7.1e-6 0.0 8.3e-6 0.0 9.6e-6486 d 7000 6.0e15 6.0e16 9.9e6 0.0 5.4e-5 0.82 6.2e-5 1.18 6.2e-5637 d 7000 6.0e15 6.0e16 7.2e6 0.0 3.2e-5 0.43 3.2e-5 0.74 3.9e-5857 d 7000 8.5e15 8.5e16 2.5e6 0.0 1.8e-4 1.46 2.2e-4 2.6 2.5e-4
most accurate fits. For all epochs, we found that the clumpy distri-bution predicted on average about a factor of 2 higher dust massesthan the smooth and torus models.We have also found that vary-ing the grain sizes and exponent on the grain distribution alters thedust mass outputs. In general, increasing the minimum grain sizedoes not alter the dust mass, increasing the exponent integer on thegrain size distribution will decrease the dust mass, and increasingthe maximum grain size from 0.05 µm to 1 µm will increase dustmass by roughly a factor of 2. These values are within the range ofmasses created by varying the dust geometries (Table 6), which isour largest source of uncertainty. A recent in-depth study presentedin Bevan & Barlow (2016) finds that an MRN distribution could notreproduce the line profiles of SN 1987A at early epochs, but as thegrain size distribution is not our largest source of uncertainty weretain our standard MRN distribution for consistency.
We estimate a dust mass for our first epoch of 1.1 × 10⁻⁵ M⊙ forthe smooth model, 1.9 × 10⁻⁵ M⊙ for clumpy, and 8.3 × 10⁻⁶ M⊙for the torus. The remaining epochs yielded smooth dust massesof 3.7 × 10⁻⁵ M⊙ for day 486, 2.7 × 10⁻⁵ M⊙ for day 637, and4.5 × 10−4 M⊙ for day 857. For all epochs we cannot rule out theexistence of an IR-echo caused by the flash heating of pre-exisitingCSM dust that is outside of the shock radius contributing to the dustmass estimates. On day 105, the maximum distance the shock couldhave travelled assuming a velocity of 11 000 km s−1 is 1 × 10¹⁶ cmmaking this scenario entirely plausible. Additionally Rin for thisfirst epoch is larger than Rout for the remaining epochs, indicating adifferent location of the modelled dust. This dust will cool and theIR echo will fade over the next year, so that by the time of Epoch 2,the SED should be dominated by newly formed ejecta dust.
Around the time of Epoch 2, the ejecta should have travelled anaverage distance of 2.5 × 1016 cm (assuming a late-time expan-sion of 6000 km s−1 measured from H α widths.) This places the IRemission, and therefore the newly formed dust, mostly in the CDSinterior to the point of CSM interaction. Of course this is just the SNenvelope that is travelling at this velocity. The metal-rich core ma-terial itself is likely moving much slower, closer to the 1500 km s−1
seen in SN 1987A (McCray 1993), and will only be at a distanceof 6.3 × 1015 cm. Over the next year as the material in the CDScools, the blackbody temperature falls and the dust grains begin tocondense, which is reflected in the general increasing of dust masswith time. Eventually, by day 857 the ejecta cools rapidly to 550 Kcausing an increase in grain growth and the order of magnitudeincrease in dust mass. This is fully consistent with the picture pre-sented in the spectral evolution, although we must point out thatour day 857 SED is only modelled on the two Spitzer photometricpoints.
On day 105, the MOCASSIN models predict a τ v = 0.01. Using meth-ods presented in Fox et al. (2009), we can also independently esti-mate the optical depth. If we assume Lmax = 1.25 × 10⁹ L⊙ for SN2011ja based on the light-curve maximum, then E ∼1.25 × 1049 ergusing the estimates of SN 2005ip and our previous estimation ofSN 2007it. We can constrain the IR energy using the blackbody fits,
which results in an Lbb of 5.6 × 10⁶ L⊙ and therefore an IR energyover the first 105 d of 1.97 × 1047 erg. Inserting these numbers intoτ ∼ EIR
EIR+E, we calculate a τ = 0.015, consistent with our MOCASSIN
fits.An increase in τ v between epochs 1 and 2, as mentioned above,
occurs coincidentally with the emission line and optical light-curveextinction, and therefore the formation of new dust. In Section 3.2we estimate an increase in Av of 0.5 between day 84 and 112, modelresults would therefore indicate that the most likely dust geometrywould be in a torus inclined at roughly 45◦. As can be seen in Table 6,between face-on and 45◦, τ = 0, but increases from 0.82 to 1.18 forinclinations between 45◦ and 90◦. There is a decrease in τ v betweenday 486 and 637 which could be due to grain destruction, but itthen rises again by day 857. Unfortunately the optical light curvesby these late dates have leveled off (as discussed below) and do notfollow a strictly radioactive decay decline, making an independentevaluation of τ v difficult. Overall, the total mass of new, warm dustformed in SN 2011ja appears to be between ∼2.0–6.0 × 10⁻⁴ M⊙by day 857, which although consistent with dust masses of otherCCSNe, is still considerably smaller than the amount needed toaccount for the dust seen at high-z (Morgan & Edmunds 2003).Although in the Introduction, we have described the much largerdust masses seen at longer wavelengths for SN1987A and otherSNe observed at much later epochs.
5 D ISCUSSION
5.1 Circumstellar interaction and environment
The expansion of the supernova shock into the surrounding envi-ronment can create X-ray emission if the CSM is dense enough.Chakraborti et al. (2013) found that the X-ray flux in SN 2011jaincreased by over a factor of 4 between day 29 and day 113 whichwas attributed to the supernova interacting with a CSM createdfrom a non-steady wind. As discussed in detail above, the opticalspectral evolution implies that CSM interaction is occurring by day84 and persists onwards, agreeing with the X-ray observations. Inparticular, Chakraborti et al. (2013) hypothesize the progenitor un-derwent a blue supergiant (BSG) phase shortly before explosion,producing a low-density cavity immediately surrounding the SN.Other CCSNe showing an increase in X-ray emission over the first120 d include the type IIP SN 1999em (Pooley et al. 2002) and thetype Ib SN 2006jc (Immler et al. 2008), and both instances wereattributed to shock interaction with the CSM.
If we use the optical spectra to constrain the date of the onset ofshock interaction, we can safely assume that while it was alreadybeginning on day 64, it was fully occurring by day 84. Assumingthe initial expansion velocity of 11 000 km s−1 was sustained, theCSM is located 8 × 1015 cm away from the SN. On day 113, whenthe X-ray observation was taken, the shock had reached a maximumdistance of 1016 cm.
MNRAS 457, 3241–3253 (2016)
by Mikako M
atsuura on March 4, 2016
http://mnras.oxfordjournals.org/
Dow
nloaded from
3250 J. E. Andrews et al.
It is important here to remark on the evaporation radius (Revap),the cavity cleared by the explosion of the supernova. Following theevaporation radii computed by Fransson et al. (2014) for SN 2010jl,we have estimated the ranges of Revap from grain size and type.Using an absolute magnitude of I = −18.3, and standard bolometriccorrection of 0.26, we estimate Lmax = 4.8 × 1042 erg s−1, or 1/6ththe maximum luminosity of SN 2010jl. This means that for graphitegrains (which are used in our MOCASSIN models), and a Teff = 104,Revap = 2.4 × 10¹⁶ and 9.0 × 1016 cm for 1.0 µm and 0.001µm, respectively. Therefore we can reasonably assume an Revap =5 × 1016 cm. If of course the BC or E(B − V) estimations areunder- or over-estimated this radius can change. A lower Lmax of1 × 1042 erg s−1 could bring Revap as close as 1016 cm, whichwas the Revap estimated for SN 2005ip (Fox et al. 2010) and SN2007it (Andrews et al. 2011b). Additionally, a clumpier CSM couldalso allow grains to survive closer to the SN. Therefore, Revap isconsistent with the CSM interaction beginning by day 84.
As mentioned above, an intermediate-width [O III] emission lineof ∼3000 km s−1 may be visible in our day 84 spectra and persist upto the last spectral observation. According to Fransson et al. (2002),if the explosion is asymmetric it is possible to get [O III] λ5007emission at early times. The scenario described for a similar featureseen in the Type IIn SN 1995N is that the intermediate component isactually the oxygen core of the supernova. The presence of this linealso may help explain the interesting shape of the hydrogen lines. Toget high enough ionization energies an asymmetric explosion, withmost of the energy occurring in the plane, is needed. This wouldcreate a slower expansion velocity along the plane and much fasterin the polar direction. This scenario could explain the intermediate-width H α and H β lines as well, which have an underlying broadcomponent coming from the polar region.
5.2 New dust formation and location
Over the past few years it has become apparent that there are twomodes of dust formation in CCSNe. If there is strong CSM interac-tion occurring it is possible for dust grains to condense in the CDSbetween the forward and reverse shocks. This has been seen in otherSNe such as SN 1998S (Pozzo et al. 2004), SN 2004dj (Meikle et al.2011), SN 2005ip (Fox et al. 2009; Smith et al. 2009), SN 2006jc(Smith et al. 2008), SN 2007od (Andrews et al. 2010), and SN2010jl (Smith et al. 2012; Gall et al. 2014). Taken solely on theformation of grains within the first 150 d of explosion in SN 2011jawould point to dust formation in the CDS. The appearance of asym-metrical hydrogen lines in the optical spectra is a smoking-gun. Wecannot rule out the possibility of dust forming in the expandingejecta at later times, but observational evidence points to new dustforming between day 84 and 112 in a region between 4.5 × 10¹⁵
and 4.5 × 1016 cm away and continuing well on into two yearspost-explosion.
5.3 Late-time luminosity
After day 400 there is little change to the luminosity of SN 2011jain VRI. There are three possibilities to this late-time brightness:(a) a scattered light echo off the surrounding CSM, (b) radiativeshocks, or (c) fading of the SN into the ambient brightness of theparent cluster. These three possibilities are not mutually exclusive.Scattered light echoes occur when light from the supernova scattersoff circumstellar or interstellar dust and redirects it back into the lineof sight of the observer at some later time. The scattering is moreefficient at shorter wavelengths, causing the light echo spectrum
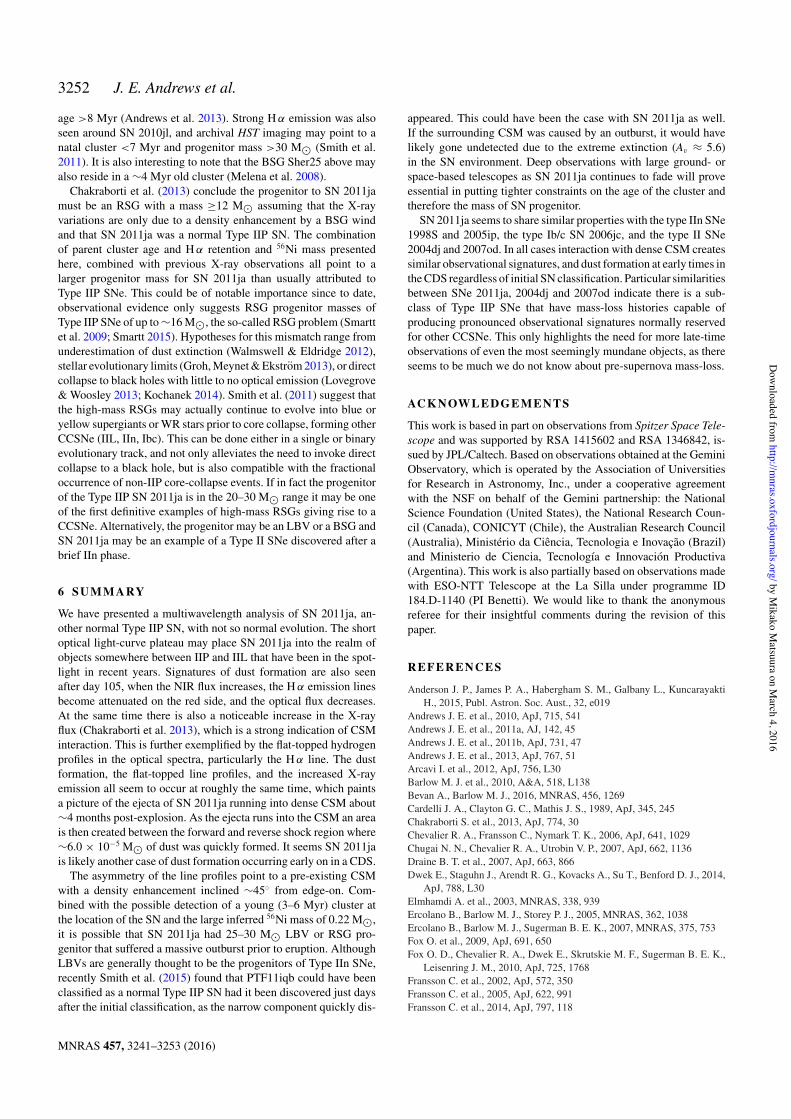
to look bluer than the peak SN light. At the same time, a levelingout of the optical light curve is created as the original light pulsetravels outwards through the intervening material creating a constantluminosity. The late-time spectra, SED, and light curve all showindications that this could be a possibility, as the spectrum becomesbluer and the light curve flattens out. The inference of pre-existingdust from the SED modelling as well as the high level of extinctionin the direction of SN 2011ja also imply that there is plenty ofintervening circumstellar and interstellar dust to create light echoes.Unfortunately, when one creates a light-echo spectrum of the SNusing the integrated fluency from the spectra prior to day 100,similar to that done for SN 1980K in Sugerman et al. (2012) whilethe emission lines appear similar, there is not enough flux in the blueto create a match (Fig. 8). So while a light echo may be present, itwould be much fainter than the late-time spectrum presented here,so we have ruled this out as the cause of the late-time luminosity.A caveat to this assumption is that the SN explosion date couldbe earlier than estimated here, which would mean the inclusion ofan earlier, bluer light echo spectrum. Deep HST imaging of theregion around SN 2011ja could resolve a scattered light echo if oneexists.
The second scenario requires dense CSM to convert the kineticenergy of the expanding supernova into radiation via shocks. Thisis a fairly common occurrence in Type IIn SNe at early times,and seems to be more common than originally observed in normalType II as observations are extending past the first 3 months afterexplosion. By day 807, the bulk of the SN ejecta will have reacheda distance of 4.1 × 1016 cm (or 7.7 × 10¹⁶ for the fastest movingejecta). This places the edge of the ejecta clearly outside of Revap, andat the distance of the CSM responsible for the early IR luminosity,making radiative shocks plausible. Unfortunately a shock drivenluminosity, while theoretically being responsible for the constantlight curve, would not make the optical spectrum bluer. Additionally,the CSM should slow the ejecta expansion, and there does not seemto be a substantial decrease in the expansion speeds in H α fromday 450 to day 807. Therefore we assume that radiative shocks arenot responsible for the late-time optical plateau, although additionalX-ray observations could potentially reveal if CSM interaction isindeed occurring.
Since only ∼5–10 per cent of massive stars are formed in isolation(Oey et al. 2013), it would not be out of the question to detect aCCSN still located in the stellar cluster from which it is formedthat would become detectable as the SN faded. For instance, thetype IIP SN 2004dj occurred in the massive cluster Sandage-96and showed very similar late-time photometric and spectroscopicevolution as SN 2011ja (Vinko et al. 2009). The light curves leveledout after day 800 to the magnitude of the cluster in pre-explosionHST images. The spectrum also showed a very blue continuumbelow 6000 Å, but the nebular features of the SN (H α, [O I]) arestill present in the red part of the spectrum. Inspection of the day807 Gemini images indicate that the size of the emitting objectat the SN location is ≤1.0 arcsec, or 16 pc at the distance of SN2011ja. Unfortunately the faintness of the object accompanied bypoor seeing makes it difficult to get an accurate FWHM of theobject. The average effective radii of stellar clusters are ∼4 pc, butcluster radii, especially for younger clusters, can extend out to 15–20 pc (Larsen 2004), making it possible that we are indeed seeinga stellar cluster+SN. As discussed in more detail below and shownin Fig. 8, comparison with Starburst99 stellar synthesis models(Leitherer et al. 1999) of solar metallically give us a decent fit witha 3–6 Myr cluster with the same intrinsic extinction of E(B − V) =1.8. While we cannot definitively rule out the other two options,
MNRAS 457, 3241–3253 (2016)
by Mikako M
atsuura on March 4, 2016
http://mnras.oxfordjournals.org/
Dow
nloaded from

SN2011ja evolution 3251
Figure 8. Day 807 spectrum (purple) of SN 2011ja showing enhanced blue emission. Comparison with the light echo spectrum created from an integratedfluency of the first 84 d (red) indicates that a light echo cannot be responsible for the flux bluewards of 6000 Å. The orange and yellow spectra are synthesizedstellar populations created with Starburst99 for 3 and 6 Myr. It is possible that the late-time luminosity has a large component of the parental stellar cluster.
the late-time luminosity may be largely due to the bright parentalcluster of SN 2011ja.
5.4 Progenitor characteristics
Mass-loss estimates for the progenitor of SN 2011ja on day 29and 113 derived from X-ray fluxes were presented in Chakrabortiet al. (2013). Using the narrow H α emission component present inour day 84 spectrum, we estimate the velocity of the surroundingmedium to be ∼180 km s−1, using the FWHM. This is of coursethe limiting resolution of the spectra, suggesting that this velocity isonly an upper limit. The true value could be an order of magnitudelower and more closely resemble RSG wind speeds. This wouldmean a mass-loss of 2 × 10⁻⁷ – 10−6 M⊙ on day 29 and 3 × 10⁻⁶
to 10−5 M⊙ on day 113, values consistent with BSG and RSG mass-loss rates, respectively. For comparison HD 168625 is a BSG withmeasured stellar winds of ∼183 km s−1 and M = 1.2 × 10⁻⁶ M⊙(Nota et al. 1996) and SBW1, a near twin of the progenitor of SN1987A, has an estimated mass-loss of 3 × 10⁻⁷ M⊙ (Smith et al.2013). Therefore as hypothesized by Chakraborti et al. (2013), itis likely that the increase in X-ray luminosity could be explainedby the supernova initially expanding into a low-density region thenencountering a high-density RSG-like environment caused by anRSG going through a blue-loop before returning to an RSG phase.If the RSG mass-loss had a density enhancement in the equatorialregion, this could also allow for easy expansion in the polar direc-tions, while further increasing the density of the circumstellar ringvia shocks.
There are other possible explanations for the presence of signifi-cant, asymmetric CSM close to the SN. For example the two BSGslisted above, along with Sher25 are all LBV candidates with triplering structures and more importantly, all have a central ring sur-rounding the star. It is possible that the environment created aroundthese stars was caused by a violent LBV or BSG eruption, not den-
sity enhancements from RSG winds (Smith 2007; Hendry et al.2008; Smith et al. 2013). It is also possible that the progenitor wasa more massive RSG that underwent episodic mass-loss, creatingshells as the faster, less-dense material runs into the slower, densermaterial (Smith, Hinkle & Ryde 2009; Mauerhan et al. 2013). Themajor factor in all of these scenarios is the inferred initial mass of theprogenitor. For an RSG we would expect a progenitor mass <25 M⊙(Levesque et al. 2005), whereas for LBVs we could have masses asgreat as 40–60 M⊙. While originally classified as a normal Type IIPSNe, it is possible that like PTF11iqb (Smith et al. 2015), SN 2011jawas actually a Type IIn for a very brief stage. This could allow forthe possibility of a much larger progenitor, as it is generally thoughtthat IIn SNe come from LBV or massive RSG stars. The explosiondate of 2011 December 12 is only an estimate, though likely a wellconstrained one, and it is possible that the first observed spectrumcould be multiple days older than the projected 7 d. PTF11iqb lostthe narrow IIn features ∼14 d after explosion, and any delay in itsdiscovery would have classified it as a normal Type II.
Fig. 8 shows the day 807 spectrum fit by both a 3 and 6 Myr clus-ter model with solar metallicity produced by Starburst99. Withouthigher S/N and more accurate flux calibration it is impossible to putstrict limits on the cluster age and therefore progenitor mass. Exten-sive stellar synthesis modelling and age-dating is beyond the scopeof this paper, but the spectrum does seem to agree with a 3–6 Myrcluster and a progenitor mass ≥25 M⊙. Using high-resolution KeckLRIS spectroscopy, Vinko et al. (2009) estimate that SN 2004dj hada 10–20 M⊙ progenitor and resided in a 10–20 Myr old cluster.More recently Kuncarayakti et al. (2013) determined a cluster ageof 15.6 Myr, corresponding to a mass of 14.7 M⊙. One notabledifference is the lack of H α emission around Sandage-96, whereaspre-explosion H α imaging of NGC 4945 from the Danish 1.54-mtelescope indicates strong emission at the location of SN 2011ja(Rossa & Dettmar 2003). H α emission can be a strong indica-tor of cluster age, and is not commonly found in clusters with an
MNRAS 457, 3241–3253 (2016)
by Mikako M
atsuura on March 4, 2016
http://mnras.oxfordjournals.org/
Dow
nloaded from
3252 J. E. Andrews et al.
age >8 Myr (Andrews et al. 2013). Strong H α emission was alsoseen around SN 2010jl, and archival HST imaging may point to anatal cluster <7 Myr and progenitor mass >30 M⊙ (Smith et al.2011). It is also interesting to note that the BSG Sher25 above mayalso reside in a ∼4 Myr old cluster (Melena et al. 2008).
Chakraborti et al. (2013) conclude the progenitor to SN 2011jamust be an RSG with a mass ≥12 M⊙ assuming that the X-rayvariations are only due to a density enhancement by a BSG windand that SN 2011ja was a normal Type IIP SN. The combinationof parent cluster age and H α retention and 56Ni mass presentedhere, combined with previous X-ray observations all point to alarger progenitor mass for SN 2011ja than usually attributed toType IIP SNe. This could be of notable importance since to date,observational evidence only suggests RSG progenitor masses ofType IIP SNe of up to ∼16 M⊙, the so-called RSG problem (Smarttet al. 2009; Smartt 2015). Hypotheses for this mismatch range fromunderestimation of dust extinction (Walmswell & Eldridge 2012),stellar evolutionary limits (Groh, Meynet & Ekstrom 2013), or directcollapse to black holes with little to no optical emission (Lovegrove& Woosley 2013; Kochanek 2014). Smith et al. (2011) suggest thatthe high-mass RSGs may actually continue to evolve into blue oryellow supergiants or WR stars prior to core collapse, forming otherCCSNe (IIL, IIn, Ibc). This can be done either in a single or binaryevolutionary track, and not only alleviates the need to invoke directcollapse to a black hole, but is also compatible with the fractionaloccurrence of non-IIP core-collapse events. If in fact the progenitorof the Type IIP SN 2011ja is in the 20–30 M⊙ range it may be oneof the first definitive examples of high-mass RSGs giving rise to aCCSNe. Alternatively, the progenitor may be an LBV or a BSG andSN 2011ja may be an example of a Type II SNe discovered after abrief IIn phase.
6 SU M M A RY
We have presented a multiwavelength analysis of SN 2011ja, an-other normal Type IIP SN, with not so normal evolution. The shortoptical light-curve plateau may place SN 2011ja into the realm ofobjects somewhere between IIP and IIL that have been in the spot-light in recent years. Signatures of dust formation are also seenafter day 105, when the NIR flux increases, the H α emission linesbecome attenuated on the red side, and the optical flux decreases.At the same time there is also a noticeable increase in the X-rayflux (Chakraborti et al. 2013), which is a strong indication of CSMinteraction. This is further exemplified by the flat-topped hydrogenprofiles in the optical spectra, particularly the H α line. The dustformation, the flat-topped line profiles, and the increased X-rayemission all seem to occur at roughly the same time, which paintsa picture of the ejecta of SN 2011ja running into dense CSM about∼4 months post-explosion. As the ejecta runs into the CSM an areais then created between the forward and reverse shock region where∼6.0 × 10⁻⁵ M⊙ of dust was quickly formed. It seems SN 2011jais likely another case of dust formation occurring early on in a CDS.
The asymmetry of the line profiles point to a pre-existing CSMwith a density enhancement inclined ∼45◦ from edge-on. Com-bined with the possible detection of a young (3–6 Myr) cluster atthe location of the SN and the large inferred 56Ni mass of 0.22 M⊙,it is possible that SN 2011ja had 25–30 M⊙ LBV or RSG pro-genitor that suffered a massive outburst prior to eruption. AlthoughLBVs are generally thought to be the progenitors of Type IIn SNe,recently Smith et al. (2015) found that PTF11iqb could have beenclassified as a normal Type IIP SN had it been discovered just daysafter the initial classification, as the narrow component quickly dis-
appeared. This could have been the case with SN 2011ja as well.If the surrounding CSM was caused by an outburst, it would havelikely gone undetected due to the extreme extinction (Av ≈ 5.6)in the SN environment. Deep observations with large ground- orspace-based telescopes as SN 2011ja continues to fade will proveessential in putting tighter constraints on the age of the cluster andtherefore the mass of SN progenitor.
SN 2011ja seems to share similar properties with the type IIn SNe1998S and 2005ip, the type Ib/c SN 2006jc, and the type II SNe2004dj and 2007od. In all cases interaction with dense CSM createssimilar observational signatures, and dust formation at early times inthe CDS regardless of initial SN classification. Particular similaritiesbetween SNe 2011ja, 2004dj and 2007od indicate there is a sub-class of Type IIP SNe that have mass-loss histories capable ofproducing pronounced observational signatures normally reservedfor other CCSNe. This only highlights the need for more late-timeobservations of even the most seemingly mundane objects, as thereseems to be much we do not know about pre-supernova mass-loss.
ACK NOW L E DG E ME NT S
This work is based in part on observations from Spitzer Space Tele-scope and was supported by RSA 1415602 and RSA 1346842, is-sued by JPL/Caltech. Based on observations obtained at the GeminiObservatory, which is operated by the Association of Universitiesfor Research in Astronomy, Inc., under a cooperative agreementwith the NSF on behalf of the Gemini partnership: the NationalScience Foundation (United States), the National Research Coun-cil (Canada), CONICYT (Chile), the Australian Research Council(Australia), Ministerio da Ciencia, Tecnologia e Inovacao (Brazil)and Ministerio de Ciencia, Tecnologıa e Innovacion Productiva(Argentina). This work is also partially based on observations madewith ESO-NTT Telescope at the La Silla under programme ID184.D-1140 (PI Benetti). We would like to thank the anonymousreferee for their insightful comments during the revision of thispaper.
R E F E R E N C E S
Anderson J. P., James P. A., Habergham S. M., Galbany L., KuncarayaktiH., 2015, Publ. Astron. Soc. Aust., 32, e019
Andrews J. E. et al., 2010, ApJ, 715, 541Andrews J. E. et al., 2011a, AJ, 142, 45Andrews J. E. et al., 2011b, ApJ, 731, 47Andrews J. E. et al., 2013, ApJ, 767, 51Arcavi I. et al., 2012, ApJ, 756, L30Barlow M. J. et al., 2010, A&A, 518, L138Bevan A., Barlow M. J., 2016, MNRAS, 456, 1269Cardelli J. A., Clayton G. C., Mathis J. S., 1989, ApJ, 345, 245Chakraborti S. et al., 2013, ApJ, 774, 30Chevalier R. A., Fransson C., Nymark T. K., 2006, ApJ, 641, 1029Chugai N. N., Chevalier R. A., Utrobin V. P., 2007, ApJ, 662, 1136Draine B. T. et al., 2007, ApJ, 663, 866Dwek E., Staguhn J., Arendt R. G., Kovacks A., Su T., Benford D. J., 2014,
ApJ, 788, L30Elmhamdi A. et al., 2003, MNRAS, 338, 939Ercolano B., Barlow M. J., Storey P. J., 2005, MNRAS, 362, 1038Ercolano B., Barlow M. J., Sugerman B. E. K., 2007, MNRAS, 375, 753Fox O. et al., 2009, ApJ, 691, 650Fox O. D., Chevalier R. A., Dwek E., Skrutskie M. F., Sugerman B. E. K.,
Leisenring J. M., 2010, ApJ, 725, 1768Fransson C. et al., 2002, ApJ, 572, 350Fransson C. et al., 2005, ApJ, 622, 991Fransson C. et al., 2014, ApJ, 797, 118
MNRAS 457, 3241–3253 (2016)
by Mikako M
atsuura on March 4, 2016
http://mnras.oxfordjournals.org/
Dow
nloaded from

SN2011ja evolution 3253
Galametz M., Madden S. C., Galliano F., Hony S., Bendo G. J., SauvageM., 2011, A&A, 532, A56
Gall C., Andersen A. C., Hjorth J., 2011, A&A, 528, A14Gall C. et al., 2014, Nature, 511, 326Gomez H. L. et al., 2012, ApJ, 760, 96Groh J. H., Meynet G., Ekstrom S., 2013, A&A, 550, L7Hamuy M., 2003, ApJ, 582, 905Hamuy M., Suntzeff N. B., 1990, AJ, 99, 1146Hamuy M., Suntzeff N. B., Gonzalez R., Martin G., 1988, AJ, 95, 63Hanner M., 1988, Technical Report, Grain Optical Properties. In NASA,
Washington, Infrared Observations of Comets Halley and Wilson andProperties of the Grains, p. 22 (SEE N89-13330 04-89)
Hendry M. A. et al., 2005, MNRAS, 359, 906Hendry M. A., Smartt S. J., Skillman E. D., Evans C. J., Trundle C., Lennon
D. J., Crowther P. A., Hunter I., 2008, MNRAS, 388, 1127Immler et al., 2008, ApJ, 674, L85Kiewe M. et al., 2012, ApJ, 744, 10Kochanek C. S., 2014, ApJ, 785, 28Kotak R. et al., 2009, ApJ, 704, 306Kuncarayakti H. et al., 2013, AJ, 146, 31Larsen S. S., 2004, A&A, 416, 537Lau R. M., Herter T. L., Morris M. R., Li Z., Adams J. D., 2015, Science,
348, 413Leitherer C. et al., 1999, ApJS, 123, 3Leonard D. C., Filippenko A. V., Barth A. J., Matheson T., 2000, ApJ, 536,
239Levesque E. M., Massey P., Olsen K. A. G., Plez B., Josselin E., Maeder A.,
Meynet G., 2005, ApJ, 628, 973Lovegrove E., Woosley S. E., 2013, ApJ, 769, 109Lucy L. B., Danziger I. J., Gouiffes C., Bouchet P., 1989, in Tenorio-Tagle G.,
Moles M., Melnick J., eds, IAU Colloq. 120: Structure and Dynamicsof the Interstellar Medium. Lecture Notes in Physics, Vol. 350, DustCondensation in the Ejecta of SN 1987 A. Springer-Verlag, Berlin,p. 164
Lyman J., Bersier D., James P., Mazzali P., Eldridge J., Fraser M., Pian E.,2016, MNRAS, 457, L328
McCray R., 1993, ARA&A, 31, 175Maeda K. et al., 2015, ApJ, 807, 35Marconi A., Oliva E., van der Werf P. P., Maiolino R., Schreier E. J.,
Macchetto F., Moorwood A. F. M., 2000, A&A, 357, 24Matheson T. et al., 2000, AJ, 120, 1487Mathis J. S., Rumpl W., Nordsieck K. H., 1977, ApJ, 217, 425Matsuura M., 2015, ApJ, 800, 50Matsuura M. et al., 2011, Science, 333, 1258Mattila S. et al., 2008, MNRAS, 389, 141Mauerhan J. C. et al., 2013, MNRAS, 430, 1801Mauerhan J. et al., 2014, MNRAS, 442, 1166Mauron N., Josselin E., 2011, A&A, 526, A156Meikle W. P. S. et al., 2007, ApJ, 665, 608Meikle W. P. S. et al., 2011, ApJ, 732, 109Melena N. W., Massey P., Morrell N. I., Zangari A. M., 2008, AJ, 135,
878Michałowski M. J., 2015, A&A, 577, A80Monard L. A. G. et al., 2011, Cent. Bur. Electron. Telegrams, 2946, 1Morgan H. L., Edmunds M. G., 2003, MNRAS, 343, 427
Mouhcine M., Ferguson H. C., Rich R. M., Brown T. M., Smith T. E., 2005,ApJ, 633, 810
Nota A., Pasquali A., Clampin M., Pollacco D., Scuderi S., Livio M., 1996,ApJ, 473, 946
Oey M. S., Lamb J. B., Kushner C. T., Pellegrini E. W., Graus A. S., 2013,ApJ, 768, 66
Owen P. J., Barlow M. J., 2015, ApJ, 801, 141Pooley D. et al., 2002, ApJ, 569, 405Poznanski D., Ganeshalingam M., Silverman J. M., Filippenko A. V., 2011,
MNRAS, 415, L81Poznanski D., Prochaska J. X., Bloom J. S., 2012, MNRAS, 426, 1465Pozzo M., Meikle W. P. S., Fassia A., Geballe T., Lundqvist P., Chugai N. N.,
Sollerman J., 2004, MNRAS, 352, 457Pozzo M. et al., 2006, MNRAS, 368, 1169Rossa J., Dettmar R.-J., 2003, A&A, 406, 505Sahu D. K., Anupama G. C., Srividya S., Muneer S., 2006, MNRAS, 372,
1315Schlafly E. F., Finkbeiner D. P., 2011, ApJ, 737, 103Seaton M. J., 1979, MNRAS, 187, 73P
Slavin J. D., Dwek E., Jones A. P., 2015, ApJ, 803, 7Smartt S. J., 2015, Publ. Astron. Soc. Aust., 32, e016Smartt S. J., Eldridge J. J., Crockett R. M., Maund J. R., 2009, MNRAS,
395, 1409Smith N., 2007, AJ, 133, 1034Smith N., Foley R. J., Filippenko A. V., 2008, ApJ, 680, 568Smith N. et al., 2009, ApJ, 695, 1334Smith N., Hinkle K. H., Ryde N., 2009, AJ, 137, 3558Smith N. et al., 2011, ApJ, 732, 63Smith N., Silverman J. M., Filippenko A. V., Cooper M. C., Matheson T.,
Bian F., Weiner B. J., Comerford J. M., 2012, AJ, 143, 17Smith N., Arnett W. D., Bally J., Ginsburg A., Filippenko A. V., 2013,
MNRAS, 429, 1324Smith N., Mauerhan J. C., Prieto J. L., 2014, MNRAS, 438, 1191Smith N. et al., 2015, MNRAS, 449, 1876Stanghellini L., Magrini L., Casasola V., 2015, ApJ, 812, 39Sugerman B. E. K. et al., 2006, Science, 313, 196Sugerman B. E. K. et al., 2012, ApJ, 749, 170Suntzeff N. B., Hamuy M., Martin G., Gomez A., Gonzalez R., 1988, AJ,
96, 1864Taubenberger S. et al., 2011, MNRAS, 413, 2140Temim T., Dwek E., Tchernyshyov K., Boyer M. L., Meixner M., Gall C.,
Roman-Duval J., 2015, ApJ, 799, 158Vinko J. et al., 2006, MNRAS, 369, 1780Vinko J. et al., 2009, ApJ, 695, 619Walmswell J. J., Eldridge J. J., 2012, MNRAS, 419, 2054Welch D. L., Clayton G. C., Campbell A., Barlow M. J., Sugerman B. E. K.,
Meixner M., Bank S. H. R., 2007, ApJ, 669, 525Wesson R., Barlow M. J., Matsuura M., Ercolano B., 2015, MNRAS, 446,
2089Wooden D. H., Rank D. M., Bregman J. D., Witteborn F. C., Tielens A. G.
G. M., Cohen M., Pinto P. A., Axelrod T. S., 1993, ApJS, 88, 477
This paper has been typeset from a TEX/LATEX file prepared by the author.
MNRAS 457, 3241–3253 (2016)
by Mikako M
atsuura on March 4, 2016
http://mnras.oxfordjournals.org/
Dow
nloaded from
Related Documents