.Edgar Submission> . Live Test Flag> LIVE . Flags> . Submission Type> N-CSRS . Contact> . Name> Donnelley Financial Solutions . Phone Number> 888-585-9925 . Filer> . Filer Id> 0000842790 . Filer CCC> ********** . Sros> . Sro Id> NONE . Period Of Report> 08-31-2021 . Inv Company> . Inv Company Type> N-1A . Notifications> . Internet Notification Address> [email protected] . Internet Notification Address> [email protected] . Internet Notification Address> [email protected] . Documents> . Document> . Conformed Document Type> N-CSRS . Description> N-CSRS . HTML> [224563.FS] . [224563.ITEM1] . [209435.EDG] . [215753.EDG] . [173173.EDG] . [111462.EDG] . [209905.EDG] . [153547.EDG] . [209907.EDG] . [209925.EDG] . [209927.EDG] . [209933.EDG] . [209935.EDG] . [224563.ITEM2] . [224563.SIG] . Document> . Conformed Document Type> EX-99.CERT . Description> EX-99.CERT . HTML> [224563.EX99_CERT] Donnelley Financial Solutions Nov 01 2021 07:58 EST page 1 of 4 Submission Header Information INVESCO 224563/1 Blackline Date : N/A

Welcome message from author
This document is posted to help you gain knowledge. Please leave a comment to let me know what you think about it! Share it to your friends and learn new things together.
Transcript
.Edgar Submission>
. Live Test Flag> LIVE
. Flags>
. Submission Type> N-CSRS
. Contact>
. Name> Donnelley Financial Solutions
. Phone Number> 888-585-9925
. Filer>
. Filer Id> 0000842790
. Filer CCC> **********
. Sros>
. Sro Id> NONE
. Period Of Report> 08-31-2021
. Inv Company>
. Inv Company Type> N-1A
. Notifications>
. Internet Notification Address> [email protected]
. Internet Notification Address> [email protected]
. Internet Notification Address> [email protected]
. Documents>
. Document>
. Conformed Document Type> N-CSRS
. Description> N-CSRS
. HTML> [224563.FS]
. [224563.ITEM1]
. [209435.EDG]
. [215753.EDG]
. [173173.EDG]
. [111462.EDG]
. [209905.EDG]
. [153547.EDG]
. [209907.EDG]
. [209925.EDG]
. [209927.EDG]
. [209933.EDG]
. [209935.EDG]
. [224563.ITEM2]
. [224563.SIG]
. Document>
. Conformed Document Type> EX-99.CERT
. Description> EX-99.CERT
. HTML> [224563.EX99_CERT]
Donnelley Financial Solutions Nov 01 2021 07:58 EST page 1 of 4
Submission Header Information
INVESCO 224563/1Blackline Date : N/A
. Document>
. Conformed Document Type> EX-99.906 CERT
. Description> EX-99.906 CERT
. HTML> [224563.EX99_906CE]
. Series Classes>
. Report Series Class>
. Rpt Series Class Info>
. Series Id> S000000243 (INVESCO High Yield Fund)
. Class Id> C000000586 (Class A)
. Class Id> C000000588 (Class C)
. Class Id> C000000589 (Investor Class)
. Class Id> C000023117 (CLASS R5)
. Class Id> C000071210 (Class Y)
. Class Id> C000120675 (Class R6)
. Rpt Series Class Info>
. Series Id> S000000251 (INVESCO Income Fund)
. Class Id> C000000601 (Class A)
. Class Id> C000000603 (Class C)
. Class Id> C000000604 (Class R)
. Class Id> C000000605 (Investor Class)
. Class Id> C000029663 (CLASS R5)
. Class Id> C000071212 (Class Y)
. Class Id> C000188949 (Class R6)
. Rpt Series Class Info>
. Series Id> S000000252 (INVESCO Short Duration Inflation Protected Fund)
. Class Id> C000000606 (Class A2)
. Class Id> C000000607 (Class A)
. Class Id> C000023119 (CLASS R5)
. Class Id> C000071213 (Class Y)
. Class Id> C000164285 (Class R6)
. Rpt Series Class Info>
. Series Id> S000000253 (INVESCO Government Money Market Fund)
. Class Id> C000000609 (Class C)
. Class Id> C000000610 (Class R)
. Class Id> C000000611 (Invesco Cash Reserve)
. Class Id> C000023120 (Investor Class)
. Class Id> C000071214 (Class Y)
. Class Id> C000085152 (CLASS AX)
. Class Id> C000085154 (CLASS CX)
. Class Id> C000188950 (Class R6)
. Class Id> C000217953 (Class A)
. Rpt Series Class Info>
Donnelley Financial Solutions Nov 01 2021 07:58 EST page 2 of 4
Submission Header Information
INVESCO 224563/1Blackline Date : N/A
. Series Id> S000000255 (INVESCO Real Estate Fund)
. Class Id> C000000616 (Class A)
. Class Id> C000000618 (Class C)
. Class Id> C000000619 (Class R)
. Class Id> C000000620 (Investor Class)
. Class Id> C000023123 (CLASS R5)
. Class Id> C000071216 (Class Y)
. Class Id> C000120676 (Class R6)
. Rpt Series Class Info>
. Series Id> S000000256 (INVESCO Short Term Bond Fund)
. Class Id> C000000621 (Class A)
. Class Id> C000000622 (Class C)
. Class Id> C000000623 (Class R)
. Class Id> C000023124 (CLASS R5)
. Class Id> C000071217 (Class Y)
. Class Id> C000120677 (Class R6)
. Rpt Series Class Info>
. Series Id> S000010736 (INVESCO Global Real Estate Fund)
. Class Id> C000029658 (Class A)
. Class Id> C000029660 (Class C)
. Class Id> C000029661 (Class R)
. Class Id> C000029662 (CLASS R5)
. Class Id> C000071219 (Class Y)
. Class Id> C000120678 (Class R6)
. Rpt Series Class Info>
. Series Id> S000027851 (INVESCO CORPORATE BOND FUND)
. Class Id> C000084553 (CLASS C)
. Class Id> C000084554 (CLASS Y)
. Class Id> C000084555 (CLASS R5)
. Class Id> C000084556 (CLASS A)
. Class Id> C000095838 (Class R)
. Class Id> C000120680 (Class R6)
. Rpt Series Class Info>
. Series Id> S000064666 (Invesco High Yield Bond Factor Fund)
. Class Id> C000209378 (Class R5)
. Class Id> C000209379 (Class Y)
. Class Id> C000209380 (Class R)
. Class Id> C000209381 (Class A)
. Class Id> C000209382 (Class R6)
. Class Id> C000209383 (Class C)
. Rpt Series Class Info>
. Series Id> S000064667 (Invesco Intermediate Bond Factor Fund)
Donnelley Financial Solutions Nov 01 2021 07:58 EST page 3 of 4
Submission Header Information
INVESCO 224563/1Blackline Date : N/A
. Class Id> C000209384 (Class R6)
. Class Id> C000209385 (Class R5)
. Class Id> C000209386 (Class Y)
. Class Id> C000209387 (Class C)
. Class Id> C000209388 (Class A)
. Class Id> C000209389 (Class R)
. Rpt Series Class Info>
. Series Id> S000064669 (Invesco U.S. Government Money Portfolio)
. Class Id> C000209395 (Invesco Cash Reserve)
. Class Id> C000209396 (Class R)
. Class Id> C000209397 (Class Y)
. Class Id> C000209398 (Class R6)
. Class Id> C000209399 (Class C)
Donnelley Financial Solutions Nov 01 2021 07:58 EST page 4 of 4
Submission Header Information
INVESCO 224563/1Blackline Date : N/A
ˆ200FCfZfKdk8xSoGEŠ200FCfZfKdk8xSoGE
224563 FS 1INVESCOAIS SOX & N-CSRS
27-Oct-2021 05:44 ESTHTMDTF
Donnelley Financial LSWmeenm0apNone
5*ESS 0C
VDI-W10-DPF-16421.7.8.0
Page 1 of 1
UNITED STATESSECURITIES AND EXCHANGE COMMISSION
Washington, D.C. 20549
FORM N-CSR
CERTIFIED SHAREHOLDER REPORT OF REGISTEREDMANAGEMENT INVESTMENT COMPANIES
Investment Company Act file number 811-05686
AIM Investment Securities Funds (Invesco Investment Securities Funds)(Exact name of registrant as specified in charter)
11 Greenway Plaza, Suite 1000Houston, Texas 77046
(Address of principal executive offices) (Zip code)
Sheri Morris11 Greenway Plaza, Suite 1000
Houston, Texas 77046(Name and address of agent for service)
Registrant’s telephone number, including area code: (713) 626-1919
Date of fiscal year end: 2/28
Date of reporting period: 8/31/21

ˆ200FCfZfKdj3@MlGDŠ200FCfZfKdj3@MlGD
224563 ITEM1 1INVESCOAIS SOX & N-CSRS
27-Oct-2021 05:19 ESTHTMDTF
Donnelley Financial LSWpf_rendNone
4*ESS 0C
LSWP64RS3721.10.7.0
Page 1 of 1
ITEM 1. REPORTS TO STOCKHOLDERS.
(a) The Registrant’s semi-annual report transmitted to shareholders pursuant to Rule 30e-1 under the Investment Company Act of 1940 is
as follows:
(b) Not Applicable.
ˆ200F9cJwp$4T4!YoÈŠ200F9cJwp$4T4!Yo¨
209435 EDG 1INVESCOCORPORATE BOND
29-Oct-2021 07:52 ESTHTMLAN
Donnelley Financial LSWmapaa0apNone
5*ESS 0C
VDI-W10-DPF-37821.7.8.0
sp1
Page 1 of 1
Semiannual Report to Shareholders August 31, 2021
Invesco Corporate Bond FundNasdaq:A: ACCBX ∎ C: ACCEX ∎ R: ACCZX ∎ Y: ACCHX ∎ R5: ACCWX ∎ R6: ICBFX
2 Fund Performance 4 Liquidity Risk Management Program 5 Schedule of Investments 23 Financial Statements 26 Financial Highlights 27 Notes to Financial Statements 36 Fund Expenses 37 Approval of Investment Advisory and Sub-Advisory Contracts
For the most current month-end Fund performance and commentary, please visit invesco.com/performance.
Unless otherwise noted, all data provided by Invesco.
This report must be accompanied or preceded by a currently effective Fund prospectus, which contains more complete information, includingsales charges and expenses. Investors should read it carefully before investing. NOT FDIC INSURED | MAY LOSE VALUE | NO BANK GUARANTEE
ˆ200F9cJwp$0XQ%iGBŠ200F9cJwp$0XQ%iGB
209435 EDG 2INVESCOCORPORATE BOND
29-Oct-2021 06:37 ESTHTMLAN
Donnelley Financial LSWjadha1apNone
6*ESS 0C
VDI-W10-DPF-49821.7.8.0
Page 1 of 1
Fund Performance
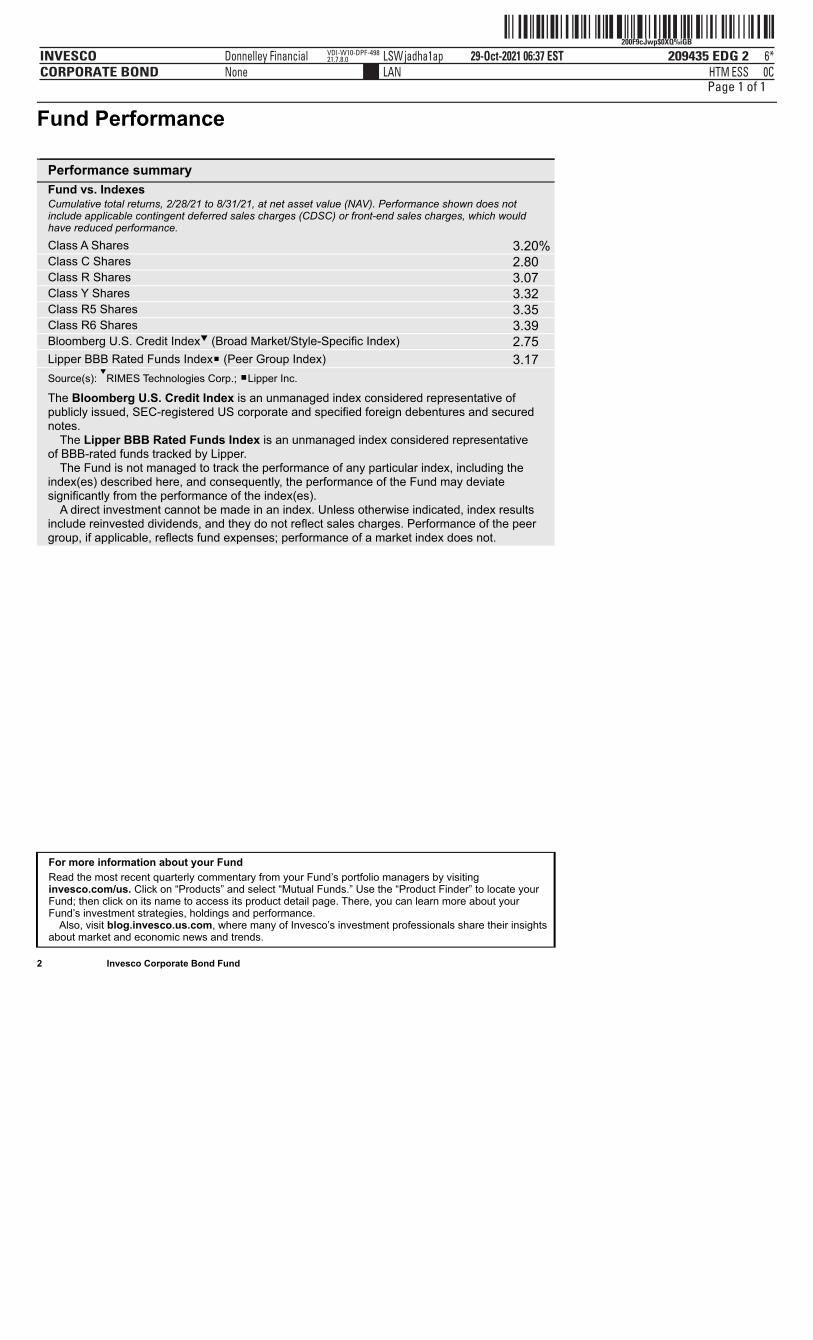
Performance summary Fund vs. Indexes
Cumulative total returns, 2/28/21 to 8/31/21, at net asset value (NAV). Performance shown does notinclude applicable contingent deferred sales charges (CDSC) or front-end sales charges, which wouldhave reduced performance.
Class A Shares 3.20% Class C Shares 2.80 Class R Shares 3.07 Class Y Shares 3.32 Class R5 Shares 3.35 Class R6 Shares 3.39 Bloomberg U.S. Credit Index (Broad Market/Style-Specific Index) 2.75 Lipper BBB Rated Funds Index◾ (Peer Group Index) 3.17 Source(s): RIMES Technologies Corp.; ◾Lipper Inc.
The Bloomberg U.S. Credit Index is an unmanaged index considered representative ofpublicly issued, SEC-registered US corporate and specified foreign debentures and securednotes.
The Lipper BBB Rated Funds Index is an unmanaged index considered representativeof BBB-rated funds tracked by Lipper.
The Fund is not managed to track the performance of any particular index, including theindex(es) described here, and consequently, the performance of the Fund may deviatesignificantly from the performance of the index(es).
A direct investment cannot be made in an index. Unless otherwise indicated, index resultsinclude reinvested dividends, and they do not reflect sales charges. Performance of the peergroup, if applicable, reflects fund expenses; performance of a market index does not.
For more information about your Fund
Read the most recent quarterly commentary from your Fund’s portfolio managers by visitinginvesco.com/us. Click on “Products” and select “Mutual Funds.” Use the “Product Finder” to locate yourFund; then click on its name to access its product detail page. There, you can learn more about yourFund’s investment strategies, holdings and performance.
Also, visit blog.invesco.us.com, where many of Invesco’s investment professionals share their insightsabout market and economic news and trends.
2 Invesco Corporate Bond Fund
ˆ200F9cJwp$0fc3xoWŠ200F9cJwp$0fc3xoW
209435 EDG 3INVESCOCORPORATE BOND
29-Oct-2021 06:39 ESTHTMLAN
Donnelley Financial LSWjadha1apNone
4*ESS 0C
VDI-W10-DPF-49821.7.8.0
Page 1 of 1
3 Invesco Corporate Bond Fund
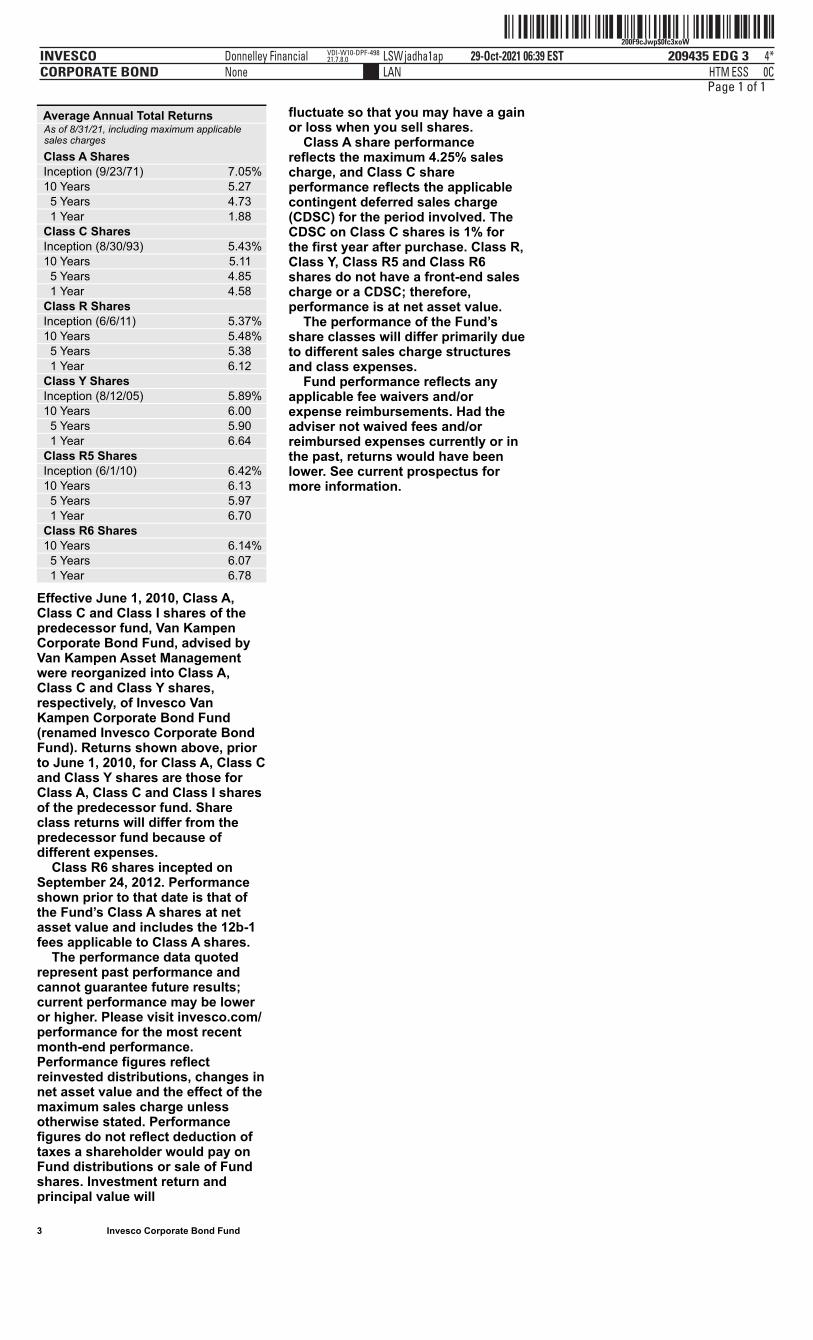
Average Annual Total Returns As of 8/31/21, including maximum applicablesales charges
Class A Shares Inception (9/23/71) 7.05% 10 Years 5.27 5 Years 4.73 1 Year 1.88 Class C Shares Inception (8/30/93) 5.43% 10 Years 5.11 5 Years 4.85 1 Year 4.58 Class R Shares Inception (6/6/11) 5.37% 10 Years 5.48% 5 Years 5.38 1 Year 6.12 Class Y Shares Inception (8/12/05) 5.89% 10 Years 6.00 5 Years 5.90 1 Year 6.64 Class R5 Shares Inception (6/1/10) 6.42% 10 Years 6.13 5 Years 5.97 1 Year 6.70 Class R6 Shares 10 Years 6.14% 5 Years 6.07 1 Year 6.78
Effective June 1, 2010, Class A,Class C and Class I shares of thepredecessor fund, Van KampenCorporate Bond Fund, advised byVan Kampen Asset Managementwere reorganized into Class A,Class C and Class Y shares,respectively, of Invesco VanKampen Corporate Bond Fund(renamed Invesco Corporate BondFund). Returns shown above, priorto June 1, 2010, for Class A, Class Cand Class Y shares are those forClass A, Class C and Class I sharesof the predecessor fund. Shareclass returns will differ from thepredecessor fund because ofdifferent expenses. Class R6 shares incepted onSeptember 24, 2012. Performanceshown prior to that date is that ofthe Fund’s Class A shares at netasset value and includes the 12b-1fees applicable to Class A shares. The performance data quotedrepresent past performance andcannot guarantee future results;current performance may be loweror higher. Please visit invesco.com/performance for the most recentmonth-end performance.Performance figures reflectreinvested distributions, changes innet asset value and the effect of themaximum sales charge unlessotherwise stated. Performancefigures do not reflect deduction oftaxes a shareholder would pay onFund distributions or sale of Fundshares. Investment return andprincipal value will
fluctuate so that you may have a gainor loss when you sell shares. Class A share performancereflects the maximum 4.25% salescharge, and Class C shareperformance reflects the applicablecontingent deferred sales charge(CDSC) for the period involved. TheCDSC on Class C shares is 1% forthe first year after purchase. Class R,Class Y, Class R5 and Class R6shares do not have a front-end salescharge or a CDSC; therefore,performance is at net asset value. The performance of the Fund’sshare classes will differ primarily dueto different sales charge structuresand class expenses. Fund performance reflects anyapplicable fee waivers and/orexpense reimbursements. Had theadviser not waived fees and/orreimbursed expenses currently or inthe past, returns would have beenlower. See current prospectus formore information.
ˆ200F9cJwp#&l4&BG>Š200F9cJwp#&l4&BG>
209435 EDG 4INVESCOCORPORATE BOND
29-Oct-2021 06:21 ESTHTMLAN
Donnelley Financial LSWpatis8apNone
6*ESS 0C
VDI-W10-DPF-28421.7.8.0
Page 1 of 2 Liquidity Risk ManagementProgram
In compliance with Rule 22e-4 underthe Investment Company Act of1940, as amended (the “LiquidityRule”), the Fund has adopted andimplemented a liquidity riskmanagement program inaccordance with the Liquidity Rule(the “Program”). The Program isreasonably designed to assess andmanage the Fund’s liquidity risk,which is the risk that the Fund couldnot meet redemption requestswithout significant dilution ofremaining investors’ interests in theFund. The Board of Trustees of theFund (the “Board”) has appointedInvesco Advisers, Inc. (“Invesco”),the Fund’s investment adviser, asthe Program’s administrator, andInvesco has delegated oversight ofthe Program to the Liquidity RiskManagement Committee (the“Committee”), which is composed ofsenior representatives from relevantbusiness groups at Invesco.
As required by the Liquidity Rule,the Program includes policies andprocedures providing for anassessment, no less frequently thanannually, of the Fund’s liquidity riskthat takes into account, as relevantto the Fund’s liquidity risk: (1) theFund’s investment strategy andliquidity of portfolio investmentsduring both normal and reasonablyforeseeable stressed conditions;(2) short-term and long-term cashflow projections for the Fund duringboth normal and reasonablyforeseeable stressed conditions;and (3) the Fund’s holdings of cashand cash equivalents and anyborrowing arrangements. TheLiquidity Rule also requires theclassification of the Fund’sinvestments into categories thatreflect the assessment of theirrelative liquidity under currentmarket conditions. The Fundclassifies its investments into one offour categories defined in theLiquidity Rule: “Highly Liquid,”“Moderately Liquid,” “Less Liquid,”and “Illiquid.” Funds that are notinvested primarily in “Highly LiquidInvestments” that are assets (cashor investments that are reasonablyexpected to be convertible into cashwithin three business days withoutsignificantly changing the marketvalue of the investment) arerequired to establish a “Highly LiquidInvestment Minimum” (“HLIM”),which is the minimum percentage ofnet assets that must be invested inHighly Liquid Investments. Fundswith HLIMs have procedures foraddressing HLIM shortfalls,including reporting to the Board andthe SEC (on a non-public basis) asrequired by the Program and theLiquidity Rule. In addition, the Fundmay not acquire an investment if,immediately after the acquisition,over 15% of the Fund’s net assetswould consist of “Illiquid
without the sale or dispositionsignificantly changing the marketvalue of the investment). TheLiquidity Rule and the Program alsorequire reporting to the Board and theSEC (on a non-public basis) if aFund’s holdings of IlliquidInvestments exceed 15% of theFund’s assets.
At a meeting held on March 22-24,2021, the Committee presented areport to the Board that addressedthe operation of the Program andassessed the Program’s adequacyand effectiveness of implementation(the “Report”). The Report coveredthe period from January 1, 2020through December 31, 2020 (the“Program Reporting Period”). TheReport discussed notable eventsaffecting liquidity over the ProgramReporting Period, including theimpact of the coronavirus pandemicon the Fund and the overall market.The Report noted that there were nomaterial changes to the Programduring the Program Reporting Period.
The Report stated, in relevant part, thatduring the Program Reporting Period:∎ The Program, as adopted and
implemented, remained reasonablydesigned to assess and manage theFund’s liquidity risk and was operatedeffectively to achieve that goal;
∎ The Fund’s investment strategyremained appropriate for anopen-end fund;
∎ The Fund was able to meet requestsfor redemption without significantdilution of remaining investors’interests in the Fund;
∎ The Fund did not breach the 15%limit on Illiquid Investments; and
∎ The Fund primarily held Highly LiquidInvestments and therefore has notadopted an HLIM.

ˆ200F9cJwp#&l4&BG>Š200F9cJwp#&l4&BG>
209435 EDG 4INVESCOCORPORATE BOND
29-Oct-2021 06:21 ESTHTMLAN
Donnelley Financial LSWpatis8apNone
6*ESS 0C
VDI-W10-DPF-28421.7.8.0
ˆ200F9cJwp#&l4&BG>Š200F9cJwp#&l4&BG>
209435 EDG 4INVESCOCORPORATE BOND
29-Oct-2021 06:21 ESTHTMLAN
Donnelley Financial LSWpatis8apNone
6*ESS 0C
VDI-W10-DPF-28421.7.8.0
Page 2 of 2
4 Invesco Corporate Bond Fund
Investments” that are assets (aninvestment that cannot reasonablybe expected to be sold or disposedof in current market conditions inseven calendar days or less
ˆ200F9cJwp$45#TNoXŠ200F9cJwp$45#TNoX
209435 EDG 5INVESCOCORPORATE BOND
29-Oct-2021 07:47 ESTHTMLAN
Donnelley Financial LSWmalab0apNone
6*ESS 0C
VDI-W10-LPF-12121.7.8.0
Page 1 of 1
See accompanying Notes to Financial Statements which are an integral part of the financial statements.
5 Invesco Corporate Bond Fund
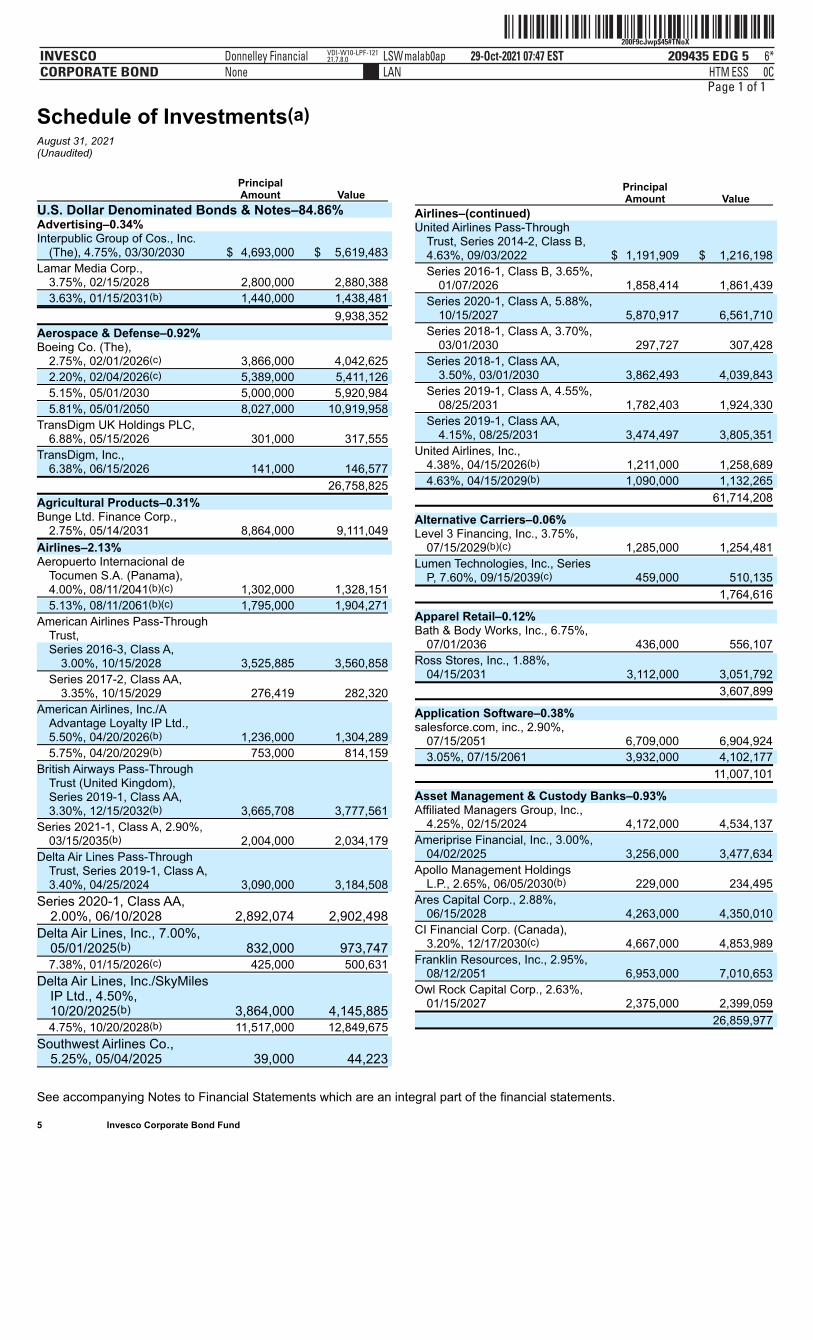
Schedule of Investments(a)August 31, 2021(Unaudited)
PrincipalAmount Value
U.S. Dollar Denominated Bonds & Notes–84.86% Advertising–0.34% Interpublic Group of Cos., Inc.
(The), 4.75%, 03/30/2030 $ 4,693,000 $ 5,619,483
Lamar Media Corp.,3.75%, 02/15/2028 2,800,000 2,880,388
3.63%, 01/15/2031(b) 1,440,000 1,438,481
9,938,352
Aerospace & Defense–0.92% Boeing Co. (The),
2.75%, 02/01/2026(c) 3,866,000 4,042,625
2.20%, 02/04/2026(c) 5,389,000 5,411,126
5.15%, 05/01/2030 5,000,000 5,920,984
5.81%, 05/01/2050 8,027,000 10,919,958
TransDigm UK Holdings PLC,6.88%, 05/15/2026 301,000 317,555
TransDigm, Inc.,6.38%, 06/15/2026 141,000 146,577
26,758,825
Agricultural Products–0.31% Bunge Ltd. Finance Corp.,
2.75%, 05/14/2031 8,864,000 9,111,049
Airlines–2.13% Aeropuerto Internacional de
Tocumen S.A. (Panama),4.00%, 08/11/2041(b)(c) 1,302,000 1,328,151
5.13%, 08/11/2061(b)(c) 1,795,000 1,904,271
American Airlines Pass-ThroughTrust, Series 2016-3, Class A,
3.00%, 10/15/2028 3,525,885 3,560,858
Series 2017-2, Class AA,3.35%, 10/15/2029 276,419 282,320
American Airlines, Inc./AAdvantage Loyalty IP Ltd.,5.50%, 04/20/2026(b) 1,236,000 1,304,289
5.75%, 04/20/2029(b) 753,000 814,159
British Airways Pass-ThroughTrust (United Kingdom),Series 2019-1, Class AA,3.30%, 12/15/2032(b) 3,665,708 3,777,561
Series 2021-1, Class A, 2.90%,03/15/2035(b) 2,004,000 2,034,179
Delta Air Lines Pass-ThroughTrust, Series 2019-1, Class A,3.40%, 04/25/2024 3,090,000 3,184,508
Series 2020-1, Class AA,2.00%, 06/10/2028 2,892,074 2,902,498
Delta Air Lines, Inc., 7.00%,05/01/2025(b) 832,000 973,747
7.38%, 01/15/2026(c) 425,000 500,631
Delta Air Lines, Inc./SkyMilesIP Ltd., 4.50%,10/20/2025(b) 3,864,000 4,145,885
4.75%, 10/20/2028(b) 11,517,000 12,849,675
Southwest Airlines Co.,5.25%, 05/04/2025 39,000 44,223
PrincipalAmount Value
Airlines–(continued) United Airlines Pass-Through
Trust, Series 2014-2, Class B,4.63%, 09/03/2022 $ 1,191,909 $ 1,216,198
Series 2016-1, Class B, 3.65%,01/07/2026 1,858,414 1,861,439
Series 2020-1, Class A, 5.88%,10/15/2027 5,870,917 6,561,710
Series 2018-1, Class A, 3.70%,03/01/2030 297,727 307,428
Series 2018-1, Class AA,3.50%, 03/01/2030 3,862,493 4,039,843
Series 2019-1, Class A, 4.55%,08/25/2031 1,782,403 1,924,330
Series 2019-1, Class AA,4.15%, 08/25/2031 3,474,497 3,805,351
United Airlines, Inc.,4.38%, 04/15/2026(b) 1,211,000 1,258,689
4.63%, 04/15/2029(b) 1,090,000 1,132,265
61,714,208
Alternative Carriers–0.06% Level 3 Financing, Inc., 3.75%,
07/15/2029(b)(c) 1,285,000 1,254,481
Lumen Technologies, Inc., SeriesP, 7.60%, 09/15/2039(c) 459,000 510,135
1,764,616
Apparel Retail–0.12% Bath & Body Works, Inc., 6.75%,
07/01/2036 436,000 556,107
Ross Stores, Inc., 1.88%,04/15/2031 3,112,000 3,051,792
3,607,899
Application Software–0.38% salesforce.com, inc., 2.90%,
07/15/2051 6,709,000 6,904,924
3.05%, 07/15/2061 3,932,000 4,102,177
11,007,101
Asset Management & Custody Banks–0.93% Affiliated Managers Group, Inc.,
4.25%, 02/15/2024 4,172,000 4,534,137
Ameriprise Financial, Inc., 3.00%,04/02/2025 3,256,000 3,477,634
Apollo Management HoldingsL.P., 2.65%, 06/05/2030(b) 229,000 234,495
Ares Capital Corp., 2.88%,06/15/2028 4,263,000 4,350,010
CI Financial Corp. (Canada),3.20%, 12/17/2030(c) 4,667,000 4,853,989
Franklin Resources, Inc., 2.95%,08/12/2051 6,953,000 7,010,653
Owl Rock Capital Corp., 2.63%,01/15/2027 2,375,000 2,399,059
26,859,977
ˆ200F9cJwp$49xTroÉŠ200F9cJwp$49xTro
209435 EDG 6INVESCOCORPORATE BOND
29-Oct-2021 07:48 ESTHTMLAN
Donnelley Financial LSWmalab0apNone
4*ESS 0C
VDI-W10-LPF-12121.7.8.0
Page 1 of 1
See accompanying Notes to Financial Statements which are an integral part of the financial statements.
6 Invesco Corporate Bond Fund
PrincipalAmount Value
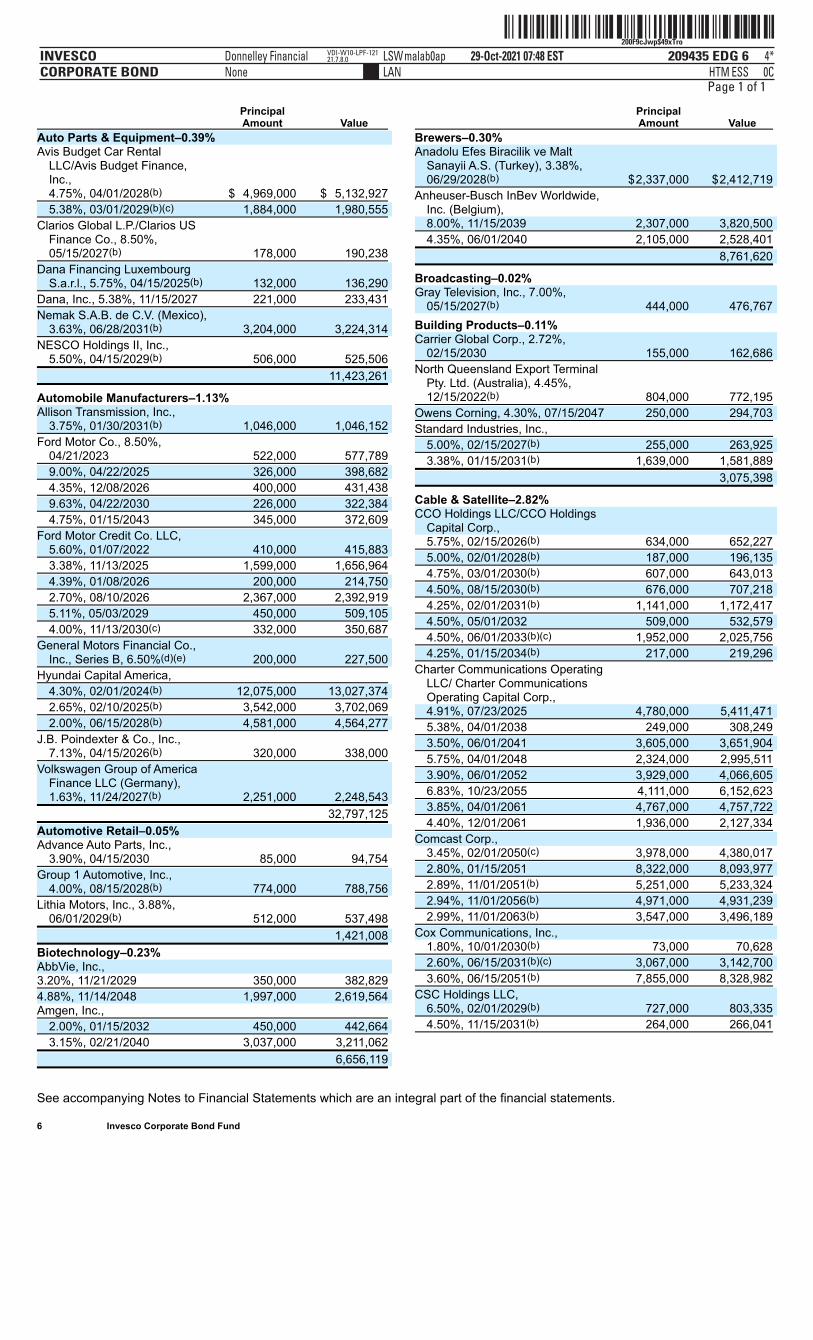
Auto Parts & Equipment–0.39% Avis Budget Car Rental
LLC/Avis Budget Finance,Inc.,4.75%, 04/01/2028(b) $ 4,969,000 $ 5,132,927
5.38%, 03/01/2029(b)(c) 1,884,000 1,980,555
Clarios Global L.P./Clarios USFinance Co., 8.50%,05/15/2027(b) 178,000 190,238
Dana Financing LuxembourgS.a.r.l., 5.75%, 04/15/2025(b) 132,000 136,290
Dana, Inc., 5.38%, 11/15/2027 221,000 233,431
Nemak S.A.B. de C.V. (Mexico),3.63%, 06/28/2031(b) 3,204,000 3,224,314
NESCO Holdings II, Inc.,5.50%, 04/15/2029(b) 506,000 525,506
11,423,261
Automobile Manufacturers–1.13% Allison Transmission, Inc.,
3.75%, 01/30/2031(b) 1,046,000 1,046,152
Ford Motor Co., 8.50%,04/21/2023 522,000 577,789
9.00%, 04/22/2025 326,000 398,682
4.35%, 12/08/2026 400,000 431,438
9.63%, 04/22/2030 226,000 322,384
4.75%, 01/15/2043 345,000 372,609
Ford Motor Credit Co. LLC,5.60%, 01/07/2022 410,000 415,883
3.38%, 11/13/2025 1,599,000 1,656,964
4.39%, 01/08/2026 200,000 214,750
2.70%, 08/10/2026 2,367,000 2,392,919
5.11%, 05/03/2029 450,000 509,105
4.00%, 11/13/2030(c) 332,000 350,687
General Motors Financial Co.,Inc., Series B, 6.50%(d)(e) 200,000 227,500
Hyundai Capital America,
4.30%, 02/01/2024(b) 12,075,000 13,027,374
2.65%, 02/10/2025(b) 3,542,000 3,702,069
2.00%, 06/15/2028(b) 4,581,000 4,564,277
J.B. Poindexter & Co., Inc.,7.13%, 04/15/2026(b) 320,000 338,000
Volkswagen Group of AmericaFinance LLC (Germany),1.63%, 11/24/2027(b) 2,251,000 2,248,543
32,797,125
Automotive Retail–0.05% Advance Auto Parts, Inc.,
3.90%, 04/15/2030 85,000 94,754
Group 1 Automotive, Inc.,4.00%, 08/15/2028(b) 774,000 788,756
Lithia Motors, Inc., 3.88%,06/01/2029(b) 512,000 537,498
1,421,008
Biotechnology–0.23% AbbVie, Inc., 3.20%, 11/21/2029 350,000 382,829
4.88%, 11/14/2048 1,997,000 2,619,564 Amgen, Inc.,
2.00%, 01/15/2032 450,000 442,664
3.15%, 02/21/2040 3,037,000 3,211,062
6,656,119
PrincipalAmount Value
Brewers–0.30% Anadolu Efes Biracilik ve Malt
Sanayii A.S. (Turkey), 3.38%,06/29/2028(b) $2,337,000 $2,412,719
Anheuser-Busch InBev Worldwide,Inc. (Belgium), 8.00%, 11/15/2039 2,307,000 3,820,500
4.35%, 06/01/2040 2,105,000 2,528,401
8,761,620
Broadcasting–0.02% Gray Television, Inc., 7.00%,
05/15/2027(b) 444,000 476,767 Building Products–0.11% Carrier Global Corp., 2.72%,
02/15/2030 155,000 162,686
North Queensland Export TerminalPty. Ltd. (Australia), 4.45%,12/15/2022(b) 804,000 772,195
Owens Corning, 4.30%, 07/15/2047 250,000 294,703
Standard Industries, Inc.,
5.00%, 02/15/2027(b) 255,000 263,925
3.38%, 01/15/2031(b) 1,639,000 1,581,889
3,075,398
Cable & Satellite–2.82% CCO Holdings LLC/CCO Holdings
Capital Corp., 5.75%, 02/15/2026(b) 634,000 652,227
5.00%, 02/01/2028(b) 187,000 196,135
4.75%, 03/01/2030(b) 607,000 643,013
4.50%, 08/15/2030(b) 676,000 707,218
4.25%, 02/01/2031(b) 1,141,000 1,172,417
4.50%, 05/01/2032 509,000 532,579
4.50%, 06/01/2033(b)(c) 1,952,000 2,025,756
4.25%, 01/15/2034(b) 217,000 219,296
Charter Communications OperatingLLC/ Charter CommunicationsOperating Capital Corp., 4.91%, 07/23/2025 4,780,000 5,411,471
5.38%, 04/01/2038 249,000 308,249
3.50%, 06/01/2041 3,605,000 3,651,904
5.75%, 04/01/2048 2,324,000 2,995,511
3.90%, 06/01/2052 3,929,000 4,066,605
6.83%, 10/23/2055 4,111,000 6,152,623
3.85%, 04/01/2061 4,767,000 4,757,722
4.40%, 12/01/2061 1,936,000 2,127,334
Comcast Corp., 3.45%, 02/01/2050(c) 3,978,000 4,380,017
2.80%, 01/15/2051 8,322,000 8,093,977
2.89%, 11/01/2051(b) 5,251,000 5,233,324
2.94%, 11/01/2056(b) 4,971,000 4,931,239
2.99%, 11/01/2063(b) 3,547,000 3,496,189
Cox Communications, Inc., 1.80%, 10/01/2030(b) 73,000 70,628
2.60%, 06/15/2031(b)(c) 3,067,000 3,142,700
3.60%, 06/15/2051(b) 7,855,000 8,328,982
CSC Holdings LLC,6.50%, 02/01/2029(b) 727,000 803,335
4.50%, 11/15/2031(b) 264,000 266,041
ˆ200F9cJwp$4C%3#GPŠ200F9cJwp$4C%3#GP
209435 EDG 7INVESCOCORPORATE BOND
29-Oct-2021 07:49 ESTHTMLAN
Donnelley Financial LSWmalab0apNone
5*ESS 0C
VDI-W10-LPF-12121.7.8.0
Page 1 of 1
See accompanying Notes to Financial Statements which are an integral part of the financial statements.
7 Invesco Corporate Bond Fund
PrincipalAmount Value
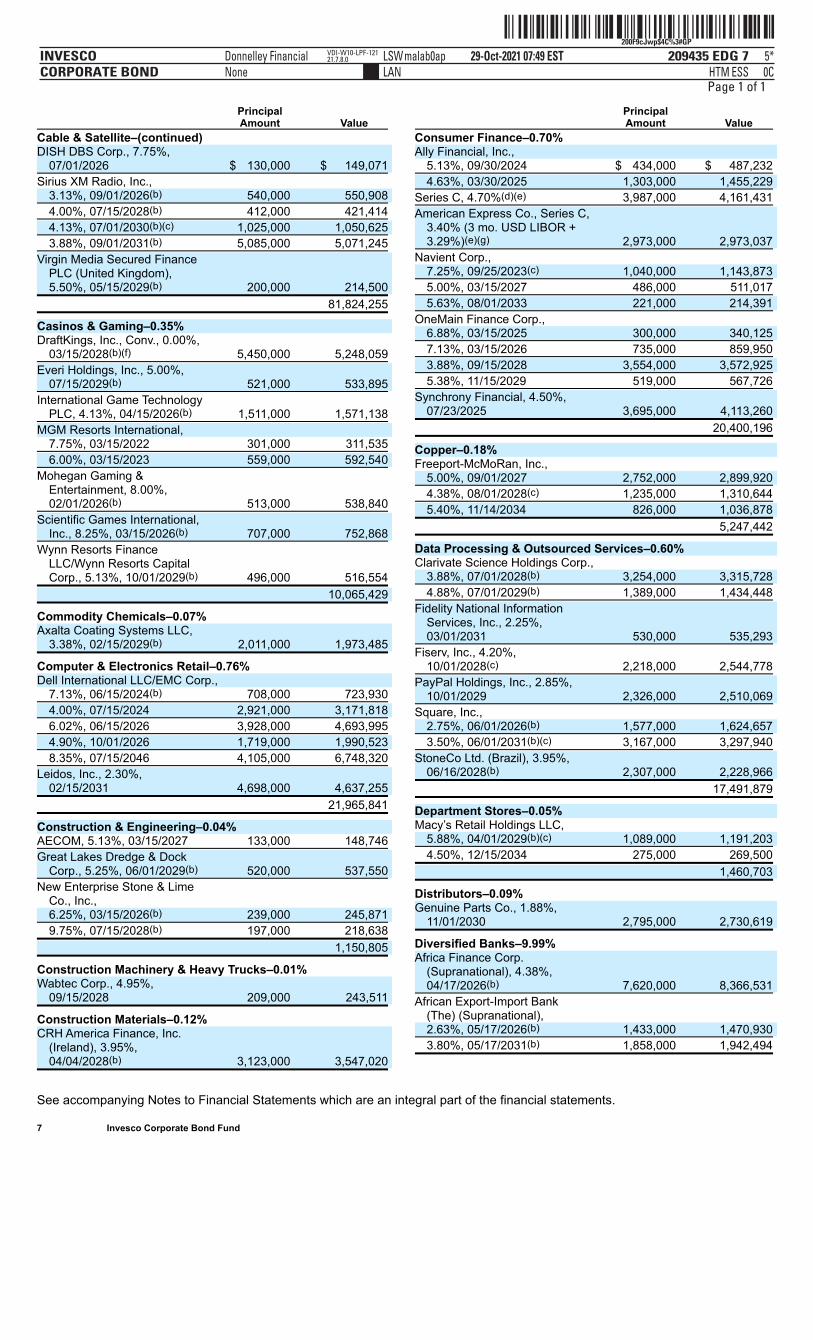
Cable & Satellite–(continued) DISH DBS Corp., 7.75%,
07/01/2026 $ 130,000 $ 149,071
Sirius XM Radio, Inc., 3.13%, 09/01/2026(b) 540,000 550,908
4.00%, 07/15/2028(b) 412,000 421,414
4.13%, 07/01/2030(b)(c) 1,025,000 1,050,625
3.88%, 09/01/2031(b) 5,085,000 5,071,245
Virgin Media Secured FinancePLC (United Kingdom),5.50%, 05/15/2029(b) 200,000 214,500
81,824,255
Casinos & Gaming–0.35% DraftKings, Inc., Conv., 0.00%,
03/15/2028(b)(f) 5,450,000 5,248,059
Everi Holdings, Inc., 5.00%,07/15/2029(b) 521,000 533,895
International Game TechnologyPLC, 4.13%, 04/15/2026(b) 1,511,000 1,571,138
MGM Resorts International, 7.75%, 03/15/2022 301,000 311,535
6.00%, 03/15/2023 559,000 592,540
Mohegan Gaming &Entertainment, 8.00%,02/01/2026(b) 513,000 538,840
Scientific Games International,Inc., 8.25%, 03/15/2026(b) 707,000 752,868
Wynn Resorts FinanceLLC/Wynn Resorts CapitalCorp., 5.13%, 10/01/2029(b) 496,000 516,554
10,065,429
Commodity Chemicals–0.07% Axalta Coating Systems LLC,
3.38%, 02/15/2029(b) 2,011,000 1,973,485
Computer & Electronics Retail–0.76% Dell International LLC/EMC Corp.,
7.13%, 06/15/2024(b) 708,000 723,930
4.00%, 07/15/2024 2,921,000 3,171,818
6.02%, 06/15/2026 3,928,000 4,693,995
4.90%, 10/01/2026 1,719,000 1,990,523
8.35%, 07/15/2046 4,105,000 6,748,320
Leidos, Inc., 2.30%,02/15/2031 4,698,000 4,637,255
21,965,841
Construction & Engineering–0.04% AECOM, 5.13%, 03/15/2027 133,000 148,746
Great Lakes Dredge & DockCorp., 5.25%, 06/01/2029(b) 520,000 537,550
New Enterprise Stone & LimeCo., Inc., 6.25%, 03/15/2026(b) 239,000 245,871
9.75%, 07/15/2028(b) 197,000 218,638
1,150,805
Construction Machinery & Heavy Trucks–0.01% Wabtec Corp., 4.95%,
09/15/2028 209,000 243,511
Construction Materials–0.12% CRH America Finance, Inc.
(Ireland), 3.95%,04/04/2028(b) 3,123,000 3,547,020
PrincipalAmount Value
Consumer Finance–0.70% Ally Financial, Inc.,
5.13%, 09/30/2024 $ 434,000 $ 487,232
4.63%, 03/30/2025 1,303,000 1,455,229
Series C, 4.70%(d)(e) 3,987,000 4,161,431
American Express Co., Series C,3.40% (3 mo. USD LIBOR +3.29%)(e)(g) 2,973,000 2,973,037
Navient Corp., 7.25%, 09/25/2023(c) 1,040,000 1,143,873
5.00%, 03/15/2027 486,000 511,017
5.63%, 08/01/2033 221,000 214,391
OneMain Finance Corp., 6.88%, 03/15/2025 300,000 340,125
7.13%, 03/15/2026 735,000 859,950
3.88%, 09/15/2028 3,554,000 3,572,925
5.38%, 11/15/2029 519,000 567,726
Synchrony Financial, 4.50%,07/23/2025 3,695,000 4,113,260
20,400,196
Copper–0.18% Freeport-McMoRan, Inc.,
5.00%, 09/01/2027 2,752,000 2,899,920
4.38%, 08/01/2028(c) 1,235,000 1,310,644
5.40%, 11/14/2034 826,000 1,036,878
5,247,442
Data Processing & Outsourced Services–0.60% Clarivate Science Holdings Corp.,
3.88%, 07/01/2028(b) 3,254,000 3,315,728
4.88%, 07/01/2029(b) 1,389,000 1,434,448
Fidelity National InformationServices, Inc., 2.25%,03/01/2031 530,000 535,293
Fiserv, Inc., 4.20%,10/01/2028(c) 2,218,000 2,544,778
PayPal Holdings, Inc., 2.85%,10/01/2029 2,326,000 2,510,069
Square, Inc., 2.75%, 06/01/2026(b) 1,577,000 1,624,657
3.50%, 06/01/2031(b)(c) 3,167,000 3,297,940
StoneCo Ltd. (Brazil), 3.95%,06/16/2028(b) 2,307,000 2,228,966
17,491,879
Department Stores–0.05% Macy’s Retail Holdings LLC,
5.88%, 04/01/2029(b)(c) 1,089,000 1,191,203
4.50%, 12/15/2034 275,000 269,500
1,460,703
Distributors–0.09% Genuine Parts Co., 1.88%,
11/01/2030 2,795,000 2,730,619
Diversified Banks–9.99% Africa Finance Corp.
(Supranational), 4.38%,04/17/2026(b) 7,620,000 8,366,531
African Export-Import Bank(The) (Supranational), 2.63%, 05/17/2026(b) 1,433,000 1,470,930
3.80%, 05/17/2031(b) 1,858,000 1,942,494
ˆ200F9cJwp##wgwCGwŠ200F9cJwp##wgwCGw
209435 EDG 8INVESCOCORPORATE BOND
29-Oct-2021 04:57 ESTHTMLAN
Donnelley Financial LSWpatis8apNone
3*ESS 0C
VDI-W10-DPF-28421.7.8.0
Page 1 of 1
See accompanying Notes to Financial Statements which are an integral part of the financial statements.
8 Invesco Corporate Bond Fund
PrincipalAmount Value
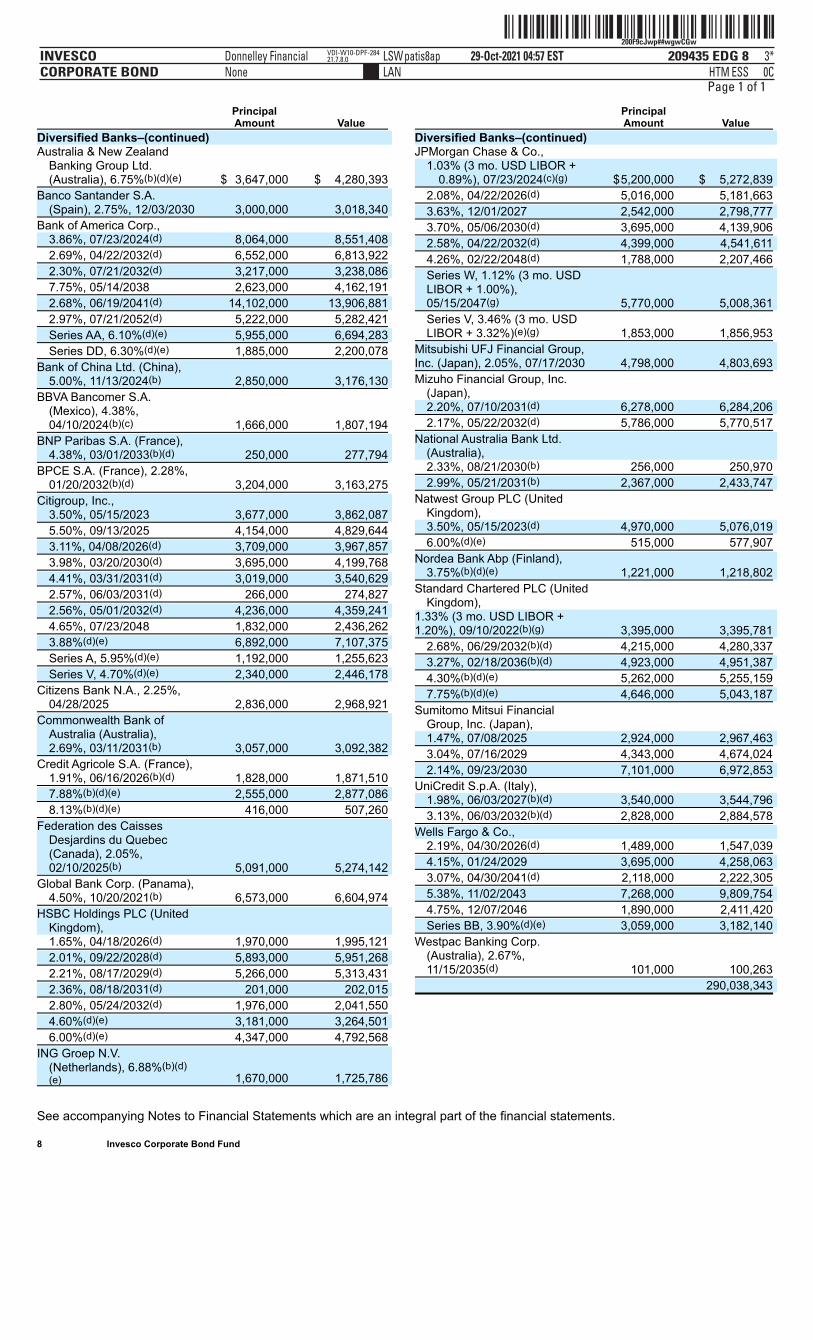
Diversified Banks–(continued) Australia & New Zealand
Banking Group Ltd.(Australia), 6.75%(b)(d)(e) $ 3,647,000 $ 4,280,393
Banco Santander S.A.(Spain), 2.75%, 12/03/2030 3,000,000 3,018,340
Bank of America Corp., 3.86%, 07/23/2024(d) 8,064,000 8,551,408
2.69%, 04/22/2032(d) 6,552,000 6,813,922
2.30%, 07/21/2032(d) 3,217,000 3,238,086
7.75%, 05/14/2038 2,623,000 4,162,191
2.68%, 06/19/2041(d) 14,102,000 13,906,881
2.97%, 07/21/2052(d) 5,222,000 5,282,421
Series AA, 6.10%(d)(e) 5,955,000 6,694,283
Series DD, 6.30%(d)(e) 1,885,000 2,200,078
Bank of China Ltd. (China),5.00%, 11/13/2024(b) 2,850,000 3,176,130
BBVA Bancomer S.A.(Mexico), 4.38%,04/10/2024(b)(c) 1,666,000 1,807,194
BNP Paribas S.A. (France),4.38%, 03/01/2033(b)(d) 250,000 277,794
BPCE S.A. (France), 2.28%,01/20/2032(b)(d) 3,204,000 3,163,275
Citigroup, Inc.,3.50%, 05/15/2023 3,677,000 3,862,087
5.50%, 09/13/2025 4,154,000 4,829,644
3.11%, 04/08/2026(d) 3,709,000 3,967,857
3.98%, 03/20/2030(d) 3,695,000 4,199,768
4.41%, 03/31/2031(d) 3,019,000 3,540,629
2.57%, 06/03/2031(d) 266,000 274,827
2.56%, 05/01/2032(d) 4,236,000 4,359,241
4.65%, 07/23/2048 1,832,000 2,436,262
3.88%(d)(e) 6,892,000 7,107,375
Series A, 5.95%(d)(e) 1,192,000 1,255,623
Series V, 4.70%(d)(e) 2,340,000 2,446,178
Citizens Bank N.A., 2.25%,04/28/2025 2,836,000 2,968,921
Commonwealth Bank ofAustralia (Australia),2.69%, 03/11/2031(b) 3,057,000 3,092,382
Credit Agricole S.A. (France),1.91%, 06/16/2026(b)(d) 1,828,000 1,871,510
7.88%(b)(d)(e) 2,555,000 2,877,086
8.13%(b)(d)(e) 416,000 507,260
Federation des CaissesDesjardins du Quebec(Canada), 2.05%,02/10/2025(b) 5,091,000 5,274,142
Global Bank Corp. (Panama),4.50%, 10/20/2021(b) 6,573,000 6,604,974
HSBC Holdings PLC (UnitedKingdom), 1.65%, 04/18/2026(d) 1,970,000 1,995,121
2.01%, 09/22/2028(d) 5,893,000 5,951,268
2.21%, 08/17/2029(d) 5,266,000 5,313,431
2.36%, 08/18/2031(d) 201,000 202,015
2.80%, 05/24/2032(d) 1,976,000 2,041,550
4.60%(d)(e) 3,181,000 3,264,501
6.00%(d)(e) 4,347,000 4,792,568
ING Groep N.V.(Netherlands), 6.88%(b)(d)(e) 1,670,000 1,725,786
PrincipalAmount Value
Diversified Banks–(continued) JPMorgan Chase & Co.,
1.03% (3 mo. USD LIBOR +0.89%), 07/23/2024(c)(g) $5,200,000 $ 5,272,839
2.08%, 04/22/2026(d) 5,016,000 5,181,663
3.63%, 12/01/2027 2,542,000 2,798,777
3.70%, 05/06/2030(d) 3,695,000 4,139,906
2.58%, 04/22/2032(d) 4,399,000 4,541,611
4.26%, 02/22/2048(d) 1,788,000 2,207,466
Series W, 1.12% (3 mo. USDLIBOR + 1.00%),05/15/2047(g) 5,770,000 5,008,361
Series V, 3.46% (3 mo. USDLIBOR + 3.32%)(e)(g) 1,853,000 1,856,953
Mitsubishi UFJ Financial Group,Inc. (Japan), 2.05%, 07/17/2030 4,798,000 4,803,693
Mizuho Financial Group, Inc.(Japan), 2.20%, 07/10/2031(d) 6,278,000 6,284,206
2.17%, 05/22/2032(d) 5,786,000 5,770,517
National Australia Bank Ltd.(Australia), 2.33%, 08/21/2030(b) 256,000 250,970
2.99%, 05/21/2031(b) 2,367,000 2,433,747
Natwest Group PLC (UnitedKingdom), 3.50%, 05/15/2023(d) 4,970,000 5,076,019
6.00%(d)(e) 515,000 577,907
Nordea Bank Abp (Finland),3.75%(b)(d)(e) 1,221,000 1,218,802
Standard Chartered PLC (UnitedKingdom),
1.33% (3 mo. USD LIBOR +1.20%), 09/10/2022(b)(g) 3,395,000 3,395,781
2.68%, 06/29/2032(b)(d) 4,215,000 4,280,337
3.27%, 02/18/2036(b)(d) 4,923,000 4,951,387
4.30%(b)(d)(e) 5,262,000 5,255,159
7.75%(b)(d)(e) 4,646,000 5,043,187
Sumitomo Mitsui FinancialGroup, Inc. (Japan), 1.47%, 07/08/2025 2,924,000 2,967,463
3.04%, 07/16/2029 4,343,000 4,674,024
2.14%, 09/23/2030 7,101,000 6,972,853
UniCredit S.p.A. (Italy), 1.98%, 06/03/2027(b)(d) 3,540,000 3,544,796
3.13%, 06/03/2032(b)(d) 2,828,000 2,884,578
Wells Fargo & Co., 2.19%, 04/30/2026(d) 1,489,000 1,547,039
4.15%, 01/24/2029 3,695,000 4,258,063
3.07%, 04/30/2041(d) 2,118,000 2,222,305
5.38%, 11/02/2043 7,268,000 9,809,754
4.75%, 12/07/2046 1,890,000 2,411,420
Series BB, 3.90%(d)(e) 3,059,000 3,182,140
Westpac Banking Corp.(Australia), 2.67%,11/15/2035(d) 101,000 100,263
290,038,343
ˆ200F9cJwp$1fzdPG1Š200F9cJwp$1fzdPG1
209435 EDG 9INVESCOCORPORATE BOND
29-Oct-2021 07:00 ESTHTMLAN
Donnelley Financial LSWjadha1apNone
5*ESS 0C
VDI-W10-DPF-49821.7.8.0
Page 1 of 1
See accompanying Notes to Financial Statements which are an integral part of the financial statements.
9 Invesco Corporate Bond Fund
PrincipalAmount Value
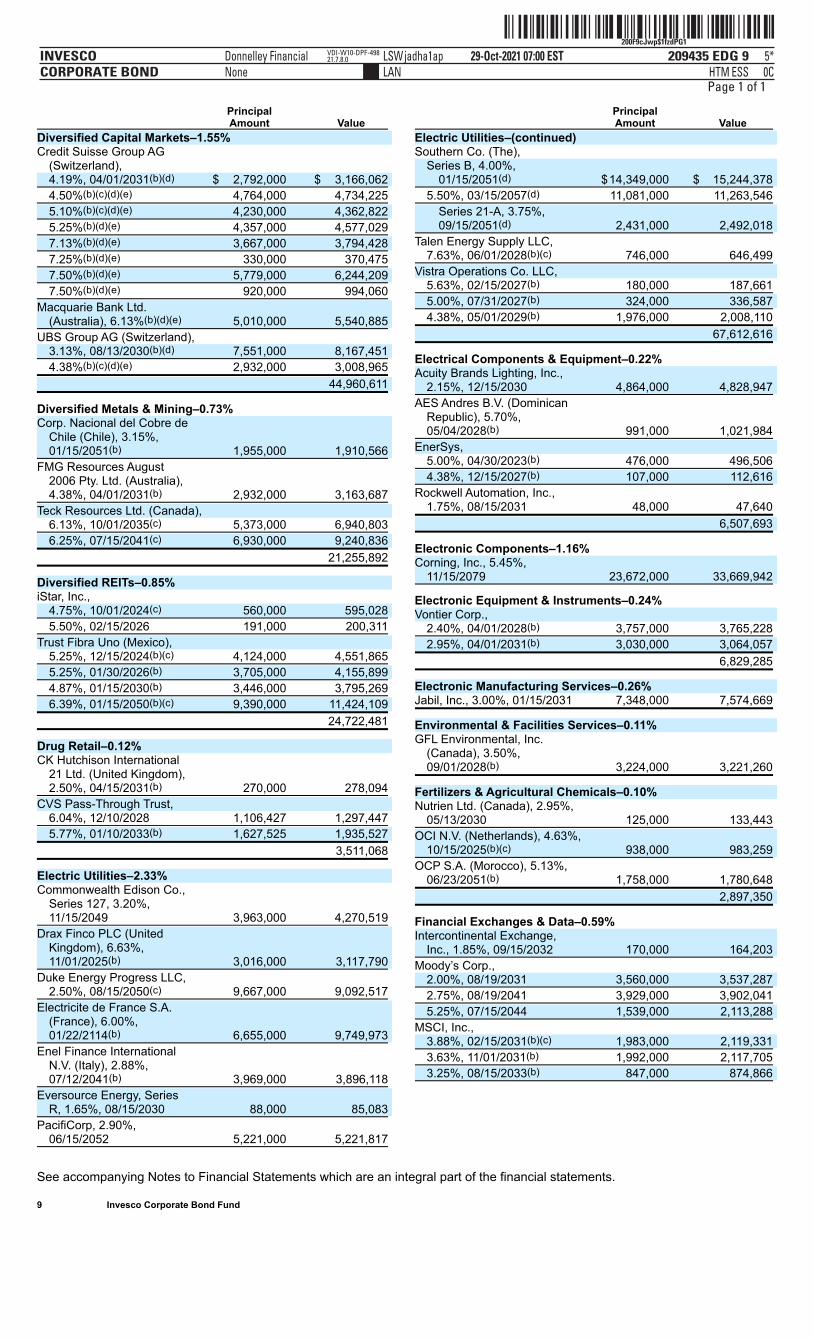
Diversified Capital Markets–1.55% Credit Suisse Group AG
(Switzerland), 4.19%, 04/01/2031(b)(d) $ 2,792,000 $ 3,166,062
4.50%(b)(c)(d)(e) 4,764,000 4,734,225
5.10%(b)(c)(d)(e) 4,230,000 4,362,822
5.25%(b)(d)(e) 4,357,000 4,577,029
7.13%(b)(d)(e) 3,667,000 3,794,428
7.25%(b)(d)(e) 330,000 370,475
7.50%(b)(d)(e) 5,779,000 6,244,209
7.50%(b)(d)(e) 920,000 994,060
Macquarie Bank Ltd.(Australia), 6.13%(b)(d)(e) 5,010,000 5,540,885
UBS Group AG (Switzerland), 3.13%, 08/13/2030(b)(d) 7,551,000 8,167,451
4.38%(b)(c)(d)(e) 2,932,000 3,008,965
44,960,611
Diversified Metals & Mining–0.73% Corp. Nacional del Cobre de
Chile (Chile), 3.15%,01/15/2051(b) 1,955,000 1,910,566
FMG Resources August2006 Pty. Ltd. (Australia),4.38%, 04/01/2031(b) 2,932,000 3,163,687
Teck Resources Ltd. (Canada), 6.13%, 10/01/2035(c) 5,373,000 6,940,803
6.25%, 07/15/2041(c) 6,930,000 9,240,836
21,255,892
Diversified REITs–0.85% iStar, Inc.,
4.75%, 10/01/2024(c) 560,000 595,028
5.50%, 02/15/2026 191,000 200,311
Trust Fibra Uno (Mexico), 5.25%, 12/15/2024(b)(c) 4,124,000 4,551,865
5.25%, 01/30/2026(b) 3,705,000 4,155,899
4.87%, 01/15/2030(b) 3,446,000 3,795,269
6.39%, 01/15/2050(b)(c) 9,390,000 11,424,109
24,722,481
Drug Retail–0.12% CK Hutchison International
21 Ltd. (United Kingdom),2.50%, 04/15/2031(b) 270,000 278,094
CVS Pass-Through Trust, 6.04%, 12/10/2028 1,106,427 1,297,447
5.77%, 01/10/2033(b) 1,627,525 1,935,527
3,511,068
Electric Utilities–2.33% Commonwealth Edison Co.,
Series 127, 3.20%,11/15/2049 3,963,000 4,270,519
Drax Finco PLC (UnitedKingdom), 6.63%,11/01/2025(b) 3,016,000 3,117,790
Duke Energy Progress LLC,2.50%, 08/15/2050(c) 9,667,000 9,092,517
Electricite de France S.A.(France), 6.00%,01/22/2114(b) 6,655,000 9,749,973
Enel Finance InternationalN.V. (Italy), 2.88%,07/12/2041(b) 3,969,000 3,896,118
Eversource Energy, SeriesR, 1.65%, 08/15/2030 88,000 85,083
PacifiCorp, 2.90%,06/15/2052 5,221,000 5,221,817
PrincipalAmount Value
Electric Utilities–(continued) Southern Co. (The),
Series B, 4.00%,01/15/2051(d) $14,349,000 $ 15,244,378
5.50%, 03/15/2057(d) 11,081,000 11,263,546
Series 21-A, 3.75%,09/15/2051(d) 2,431,000 2,492,018
Talen Energy Supply LLC,7.63%, 06/01/2028(b)(c) 746,000 646,499
Vistra Operations Co. LLC, 5.63%, 02/15/2027(b) 180,000 187,661
5.00%, 07/31/2027(b) 324,000 336,587
4.38%, 05/01/2029(b) 1,976,000 2,008,110
67,612,616
Electrical Components & Equipment–0.22% Acuity Brands Lighting, Inc.,
2.15%, 12/15/2030 4,864,000 4,828,947
AES Andres B.V. (DominicanRepublic), 5.70%,05/04/2028(b) 991,000 1,021,984
EnerSys, 5.00%, 04/30/2023(b) 476,000 496,506
4.38%, 12/15/2027(b) 107,000 112,616
Rockwell Automation, Inc.,1.75%, 08/15/2031 48,000 47,640
6,507,693
Electronic Components–1.16% Corning, Inc., 5.45%,
11/15/2079 23,672,000 33,669,942
Electronic Equipment & Instruments–0.24% Vontier Corp.,
2.40%, 04/01/2028(b) 3,757,000 3,765,228
2.95%, 04/01/2031(b) 3,030,000 3,064,057
6,829,285
Electronic Manufacturing Services–0.26% Jabil, Inc., 3.00%, 01/15/2031 7,348,000 7,574,669
Environmental & Facilities Services–0.11% GFL Environmental, Inc.
(Canada), 3.50%,09/01/2028(b) 3,224,000 3,221,260
Fertilizers & Agricultural Chemicals–0.10% Nutrien Ltd. (Canada), 2.95%,
05/13/2030 125,000 133,443
OCI N.V. (Netherlands), 4.63%,10/15/2025(b)(c) 938,000 983,259
OCP S.A. (Morocco), 5.13%,06/23/2051(b) 1,758,000 1,780,648
2,897,350
Financial Exchanges & Data–0.59% Intercontinental Exchange,
Inc., 1.85%, 09/15/2032 170,000 164,203
Moody’s Corp., 2.00%, 08/19/2031 3,560,000 3,537,287
2.75%, 08/19/2041 3,929,000 3,902,041
5.25%, 07/15/2044 1,539,000 2,113,288
MSCI, Inc., 3.88%, 02/15/2031(b)(c) 1,983,000 2,119,331
3.63%, 11/01/2031(b) 1,992,000 2,117,705
3.25%, 08/15/2033(b) 847,000 874,866
ˆ200F9cJwp$1ainnoGŠ200F9cJwp$1ainnoG
209435 EDG 10INVESCOCORPORATE BOND
29-Oct-2021 06:57 ESTHTMLAN
Donnelley Financial LSWjadha1apNone
4*ESS 0C
VDI-W10-DPF-49821.7.8.0
Page 1 of 1
See accompanying Notes to Financial Statements which are an integral part of the financial statements.
10 Invesco Corporate Bond Fund
PrincipalAmount Value
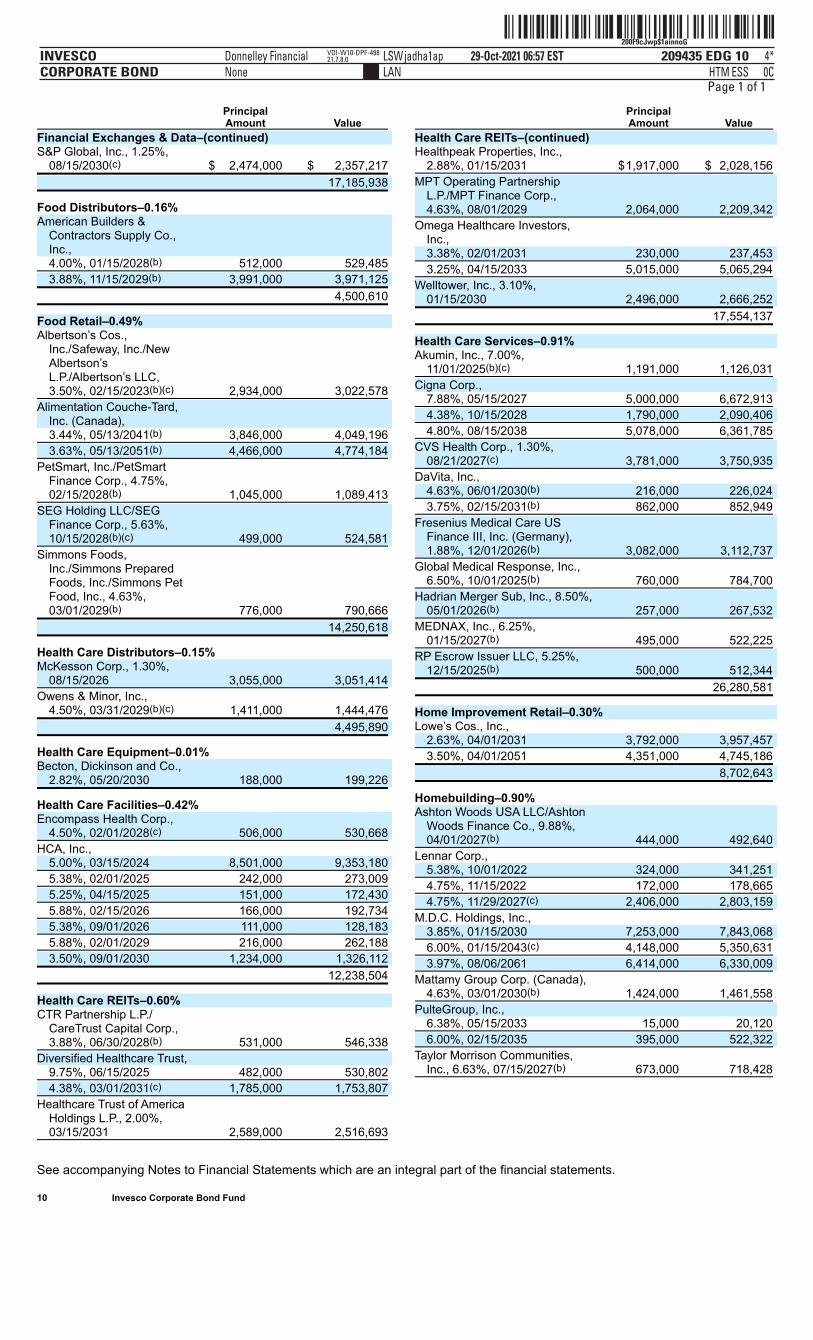
Financial Exchanges & Data–(continued) S&P Global, Inc., 1.25%,
08/15/2030(c) $ 2,474,000 $ 2,357,217
17,185,938
Food Distributors–0.16% American Builders &
Contractors Supply Co.,Inc., 4.00%, 01/15/2028(b) 512,000 529,485
3.88%, 11/15/2029(b) 3,991,000 3,971,125
4,500,610
Food Retail–0.49% Albertson’s Cos.,
Inc./Safeway, Inc./NewAlbertson’sL.P./Albertson’s LLC,3.50%, 02/15/2023(b)(c) 2,934,000 3,022,578
Alimentation Couche-Tard,Inc. (Canada), 3.44%, 05/13/2041(b) 3,846,000 4,049,196
3.63%, 05/13/2051(b) 4,466,000 4,774,184
PetSmart, Inc./PetSmartFinance Corp., 4.75%,02/15/2028(b) 1,045,000 1,089,413
SEG Holding LLC/SEGFinance Corp., 5.63%,10/15/2028(b)(c) 499,000 524,581
Simmons Foods,Inc./Simmons PreparedFoods, Inc./Simmons PetFood, Inc., 4.63%,03/01/2029(b) 776,000 790,666
14,250,618
Health Care Distributors–0.15% McKesson Corp., 1.30%,
08/15/2026 3,055,000 3,051,414
Owens & Minor, Inc.,4.50%, 03/31/2029(b)(c) 1,411,000 1,444,476
4,495,890
Health Care Equipment–0.01% Becton, Dickinson and Co.,
2.82%, 05/20/2030 188,000 199,226
Health Care Facilities–0.42% Encompass Health Corp.,
4.50%, 02/01/2028(c) 506,000 530,668
HCA, Inc., 5.00%, 03/15/2024 8,501,000 9,353,180
5.38%, 02/01/2025 242,000 273,009
5.25%, 04/15/2025 151,000 172,430
5.88%, 02/15/2026 166,000 192,734
5.38%, 09/01/2026 111,000 128,183
5.88%, 02/01/2029 216,000 262,188
3.50%, 09/01/2030 1,234,000 1,326,112
12,238,504
Health Care REITs–0.60% CTR Partnership L.P./
CareTrust Capital Corp.,3.88%, 06/30/2028(b) 531,000 546,338
Diversified Healthcare Trust, 9.75%, 06/15/2025 482,000 530,802
4.38%, 03/01/2031(c) 1,785,000 1,753,807
Healthcare Trust of AmericaHoldings L.P., 2.00%,03/15/2031 2,589,000 2,516,693
PrincipalAmount Value
Health Care REITs–(continued) Healthpeak Properties, Inc.,
2.88%, 01/15/2031 $1,917,000 $ 2,028,156
MPT Operating PartnershipL.P./MPT Finance Corp.,4.63%, 08/01/2029 2,064,000 2,209,342
Omega Healthcare Investors,Inc., 3.38%, 02/01/2031 230,000 237,453
3.25%, 04/15/2033 5,015,000 5,065,294
Welltower, Inc., 3.10%,01/15/2030 2,496,000 2,666,252
17,554,137
Health Care Services–0.91% Akumin, Inc., 7.00%,
11/01/2025(b)(c) 1,191,000 1,126,031
Cigna Corp., 7.88%, 05/15/2027 5,000,000 6,672,913
4.38%, 10/15/2028 1,790,000 2,090,406
4.80%, 08/15/2038 5,078,000 6,361,785
CVS Health Corp., 1.30%,08/21/2027(c) 3,781,000 3,750,935
DaVita, Inc., 4.63%, 06/01/2030(b) 216,000 226,024
3.75%, 02/15/2031(b) 862,000 852,949
Fresenius Medical Care USFinance III, Inc. (Germany),1.88%, 12/01/2026(b) 3,082,000 3,112,737
Global Medical Response, Inc.,6.50%, 10/01/2025(b) 760,000 784,700
Hadrian Merger Sub, Inc., 8.50%,05/01/2026(b) 257,000 267,532
MEDNAX, Inc., 6.25%,01/15/2027(b) 495,000 522,225
RP Escrow Issuer LLC, 5.25%,12/15/2025(b) 500,000 512,344
26,280,581
Home Improvement Retail–0.30% Lowe’s Cos., Inc.,
2.63%, 04/01/2031 3,792,000 3,957,457
3.50%, 04/01/2051 4,351,000 4,745,186
8,702,643
Homebuilding–0.90% Ashton Woods USA LLC/Ashton
Woods Finance Co., 9.88%,04/01/2027(b) 444,000 492,640
Lennar Corp., 5.38%, 10/01/2022 324,000 341,251
4.75%, 11/15/2022 172,000 178,665
4.75%, 11/29/2027(c) 2,406,000 2,803,159
M.D.C. Holdings, Inc., 3.85%, 01/15/2030 7,253,000 7,843,068
6.00%, 01/15/2043(c) 4,148,000 5,350,631
3.97%, 08/06/2061 6,414,000 6,330,009
Mattamy Group Corp. (Canada),4.63%, 03/01/2030(b) 1,424,000 1,461,558
PulteGroup, Inc., 6.38%, 05/15/2033 15,000 20,120
6.00%, 02/15/2035 395,000 522,322
Taylor Morrison Communities,Inc., 6.63%, 07/15/2027(b) 673,000 718,428
ˆ200F9cJwp$1qaeRGjŠ200F9cJwp$1qaeRGj
209435 EDG 11INVESCOCORPORATE BOND
29-Oct-2021 07:03 ESTHTMLAN
Donnelley Financial LSWjadha1apNone
5*ESS 0C
VDI-W10-DPF-49821.7.8.0
Page 1 of 1
See accompanying Notes to Financial Statements which are an integral part of the financial statements.
11 Invesco Corporate Bond Fund
PrincipalAmount Value
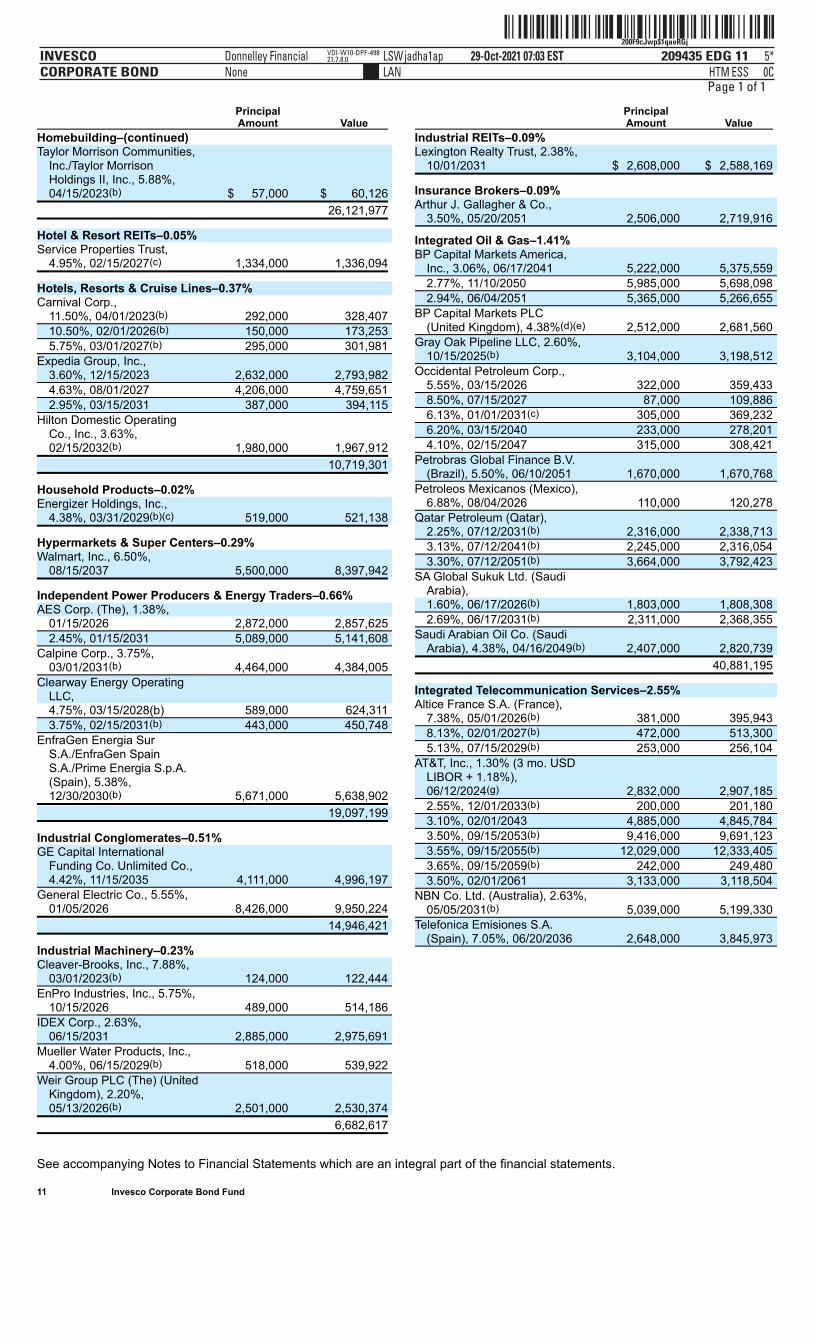
Homebuilding–(continued) Taylor Morrison Communities,
Inc./Taylor MorrisonHoldings II, Inc., 5.88%,04/15/2023(b) $ 57,000 $ 60,126
26,121,977
Hotel & Resort REITs–0.05% Service Properties Trust,
4.95%, 02/15/2027(c) 1,334,000 1,336,094
Hotels, Resorts & Cruise Lines–0.37% Carnival Corp.,
11.50%, 04/01/2023(b) 292,000 328,407 10.50%, 02/01/2026(b) 150,000 173,253 5.75%, 03/01/2027(b) 295,000 301,981
Expedia Group, Inc.,3.60%, 12/15/2023 2,632,000 2,793,982 4.63%, 08/01/2027 4,206,000 4,759,651 2.95%, 03/15/2031 387,000 394,115
Hilton Domestic OperatingCo., Inc., 3.63%,02/15/2032(b) 1,980,000 1,967,912
10,719,301
Household Products–0.02% Energizer Holdings, Inc.,
4.38%, 03/31/2029(b)(c) 519,000 521,138
Hypermarkets & Super Centers–0.29% Walmart, Inc., 6.50%,
08/15/2037 5,500,000 8,397,942
Independent Power Producers & Energy Traders–0.66% AES Corp. (The), 1.38%,
01/15/2026 2,872,000 2,857,625 2.45%, 01/15/2031 5,089,000 5,141,608
Calpine Corp., 3.75%,03/01/2031(b) 4,464,000 4,384,005
Clearway Energy OperatingLLC, 4.75%, 03/15/2028(b) 589,000 624,311 3.75%, 02/15/2031(b) 443,000 450,748
EnfraGen Energia SurS.A./EnfraGen SpainS.A./Prime Energia S.p.A.(Spain), 5.38%,12/30/2030(b) 5,671,000 5,638,902
19,097,199
Industrial Conglomerates–0.51% GE Capital International
Funding Co. Unlimited Co.,4.42%, 11/15/2035 4,111,000 4,996,197
General Electric Co., 5.55%,01/05/2026 8,426,000 9,950,224
14,946,421
Industrial Machinery–0.23% Cleaver-Brooks, Inc., 7.88%,
03/01/2023(b) 124,000 122,444 EnPro Industries, Inc., 5.75%,
10/15/2026 489,000 514,186 IDEX Corp., 2.63%,
06/15/2031 2,885,000 2,975,691 Mueller Water Products, Inc.,
4.00%, 06/15/2029(b) 518,000 539,922 Weir Group PLC (The) (United
Kingdom), 2.20%,05/13/2026(b) 2,501,000 2,530,374
6,682,617
PrincipalAmount Value
Industrial REITs–0.09% Lexington Realty Trust, 2.38%,
10/01/2031 $ 2,608,000 $ 2,588,169
Insurance Brokers–0.09% Arthur J. Gallagher & Co.,
3.50%, 05/20/2051 2,506,000 2,719,916
Integrated Oil & Gas–1.41% BP Capital Markets America,
Inc., 3.06%, 06/17/2041 5,222,000 5,375,559 2.77%, 11/10/2050 5,985,000 5,698,098 2.94%, 06/04/2051 5,365,000 5,266,655
BP Capital Markets PLC(United Kingdom), 4.38%(d)(e) 2,512,000 2,681,560
Gray Oak Pipeline LLC, 2.60%,10/15/2025(b) 3,104,000 3,198,512
Occidental Petroleum Corp.,5.55%, 03/15/2026 322,000 359,433 8.50%, 07/15/2027 87,000 109,886 6.13%, 01/01/2031(c) 305,000 369,232 6.20%, 03/15/2040 233,000 278,201 4.10%, 02/15/2047 315,000 308,421
Petrobras Global Finance B.V.(Brazil), 5.50%, 06/10/2051 1,670,000 1,670,768
Petroleos Mexicanos (Mexico),6.88%, 08/04/2026 110,000 120,278
Qatar Petroleum (Qatar),2.25%, 07/12/2031(b) 2,316,000 2,338,713 3.13%, 07/12/2041(b) 2,245,000 2,316,054 3.30%, 07/12/2051(b) 3,664,000 3,792,423
SA Global Sukuk Ltd. (SaudiArabia), 1.60%, 06/17/2026(b) 1,803,000 1,808,308 2.69%, 06/17/2031(b) 2,311,000 2,368,355
Saudi Arabian Oil Co. (SaudiArabia), 4.38%, 04/16/2049(b) 2,407,000 2,820,739
40,881,195
Integrated Telecommunication Services–2.55% Altice France S.A. (France),
7.38%, 05/01/2026(b) 381,000 395,943 8.13%, 02/01/2027(b) 472,000 513,300 5.13%, 07/15/2029(b) 253,000 256,104
AT&T, Inc., 1.30% (3 mo. USDLIBOR + 1.18%),06/12/2024(g) 2,832,000 2,907,185 2.55%, 12/01/2033(b) 200,000 201,180 3.10%, 02/01/2043 4,885,000 4,845,784 3.50%, 09/15/2053(b) 9,416,000 9,691,123 3.55%, 09/15/2055(b) 12,029,000 12,333,405 3.65%, 09/15/2059(b) 242,000 249,480 3.50%, 02/01/2061 3,133,000 3,118,504
NBN Co. Ltd. (Australia), 2.63%,05/05/2031(b) 5,039,000 5,199,330
Telefonica Emisiones S.A.(Spain), 7.05%, 06/20/2036 2,648,000 3,845,973
ˆ200F9cJwp#$kSl8o/Š200F9cJwp#$kSl8o/
209435 EDG 12INVESCOCORPORATE BOND
29-Oct-2021 05:24 ESTHTMLAN
Donnelley Financial LSWashvh0apNone
4*ESS 0C
VDI-W10-DPF-05221.7.8.0
Page 1 of 1
See accompanying Notes to Financial Statements which are an integral part of the financial statements.
12 Invesco Corporate Bond Fund
PrincipalAmount Value
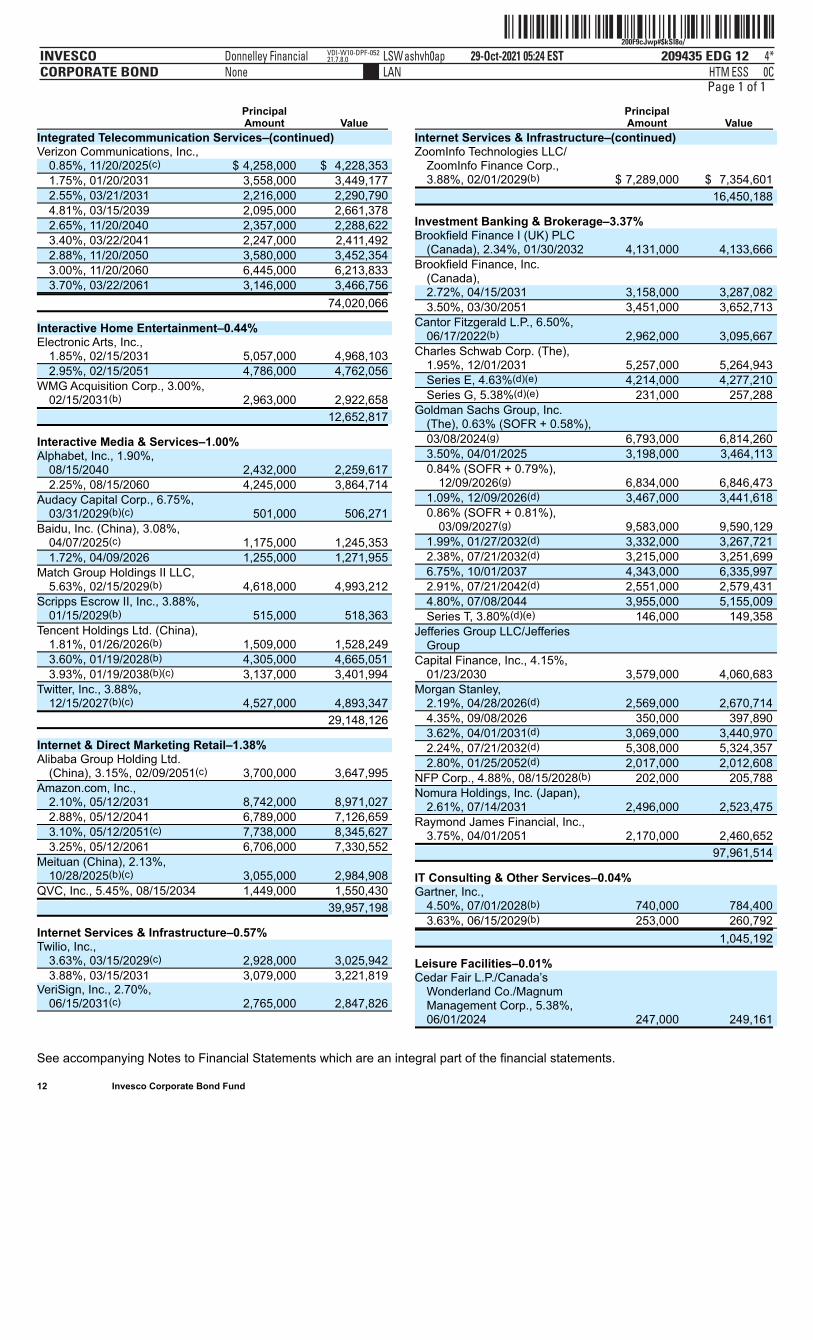
Integrated Telecommunication Services–(continued) Verizon Communications, Inc.,
0.85%, 11/20/2025(c) $ 4,258,000 $ 4,228,353 1.75%, 01/20/2031 3,558,000 3,449,177 2.55%, 03/21/2031 2,216,000 2,290,790 4.81%, 03/15/2039 2,095,000 2,661,378 2.65%, 11/20/2040 2,357,000 2,288,622 3.40%, 03/22/2041 2,247,000 2,411,492 2.88%, 11/20/2050 3,580,000 3,452,354 3.00%, 11/20/2060 6,445,000 6,213,833 3.70%, 03/22/2061 3,146,000 3,466,756
74,020,066
Interactive Home Entertainment–0.44% Electronic Arts, Inc.,
1.85%, 02/15/2031 5,057,000 4,968,103 2.95%, 02/15/2051 4,786,000 4,762,056
WMG Acquisition Corp., 3.00%,02/15/2031(b) 2,963,000 2,922,658
12,652,817
Interactive Media & Services–1.00% Alphabet, Inc., 1.90%,
08/15/2040 2,432,000 2,259,617 2.25%, 08/15/2060 4,245,000 3,864,714
Audacy Capital Corp., 6.75%,03/31/2029(b)(c) 501,000 506,271
Baidu, Inc. (China), 3.08%,04/07/2025(c) 1,175,000 1,245,353 1.72%, 04/09/2026 1,255,000 1,271,955
Match Group Holdings II LLC,5.63%, 02/15/2029(b) 4,618,000 4,993,212
Scripps Escrow II, Inc., 3.88%,01/15/2029(b) 515,000 518,363
Tencent Holdings Ltd. (China),1.81%, 01/26/2026(b) 1,509,000 1,528,249 3.60%, 01/19/2028(b) 4,305,000 4,665,051 3.93%, 01/19/2038(b)(c) 3,137,000 3,401,994
Twitter, Inc., 3.88%,12/15/2027(b)(c) 4,527,000 4,893,347
29,148,126
Internet & Direct Marketing Retail–1.38% Alibaba Group Holding Ltd.
(China), 3.15%, 02/09/2051(c) 3,700,000 3,647,995 Amazon.com, Inc.,
2.10%, 05/12/2031 8,742,000 8,971,027 2.88%, 05/12/2041 6,789,000 7,126,659 3.10%, 05/12/2051(c) 7,738,000 8,345,627 3.25%, 05/12/2061 6,706,000 7,330,552
Meituan (China), 2.13%,10/28/2025(b)(c) 3,055,000 2,984,908
QVC, Inc., 5.45%, 08/15/2034 1,449,000 1,550,430
39,957,198
Internet Services & Infrastructure–0.57% Twilio, Inc.,
3.63%, 03/15/2029(c) 2,928,000 3,025,942 3.88%, 03/15/2031 3,079,000 3,221,819
VeriSign, Inc., 2.70%,06/15/2031(c) 2,765,000 2,847,826
PrincipalAmount Value
Internet Services & Infrastructure–(continued) ZoomInfo Technologies LLC/
ZoomInfo Finance Corp.,3.88%, 02/01/2029(b) $ 7,289,000 $ 7,354,601
16,450,188
Investment Banking & Brokerage–3.37% Brookfield Finance I (UK) PLC
(Canada), 2.34%, 01/30/2032 4,131,000 4,133,666 Brookfield Finance, Inc.
(Canada), 2.72%, 04/15/2031 3,158,000 3,287,082 3.50%, 03/30/2051 3,451,000 3,652,713
Cantor Fitzgerald L.P., 6.50%,06/17/2022(b) 2,962,000 3,095,667
Charles Schwab Corp. (The),1.95%, 12/01/2031 5,257,000 5,264,943 Series E, 4.63%(d)(e) 4,214,000 4,277,210 Series G, 5.38%(d)(e) 231,000 257,288
Goldman Sachs Group, Inc.(The), 0.63% (SOFR + 0.58%), 03/08/2024(g) 6,793,000 6,814,260 3.50%, 04/01/2025 3,198,000 3,464,113 0.84% (SOFR + 0.79%),
12/09/2026(g) 6,834,000 6,846,473 1.09%, 12/09/2026(d) 3,467,000 3,441,618 0.86% (SOFR + 0.81%),
03/09/2027(g) 9,583,000 9,590,129 1.99%, 01/27/2032(d) 3,332,000 3,267,721 2.38%, 07/21/2032(d) 3,215,000 3,251,699 6.75%, 10/01/2037 4,343,000 6,335,997 2.91%, 07/21/2042(d) 2,551,000 2,579,431 4.80%, 07/08/2044 3,955,000 5,155,009 Series T, 3.80%(d)(e) 146,000 149,358
Jefferies Group LLC/JefferiesGroup
Capital Finance, Inc., 4.15%,01/23/2030 3,579,000 4,060,683
Morgan Stanley,2.19%, 04/28/2026(d) 2,569,000 2,670,714 4.35%, 09/08/2026 350,000 397,890 3.62%, 04/01/2031(d) 3,069,000 3,440,970 2.24%, 07/21/2032(d) 5,308,000 5,324,357 2.80%, 01/25/2052(d) 2,017,000 2,012,608
NFP Corp., 4.88%, 08/15/2028(b) 202,000 205,788 Nomura Holdings, Inc. (Japan),
2.61%, 07/14/2031 2,496,000 2,523,475 Raymond James Financial, Inc.,
3.75%, 04/01/2051 2,170,000 2,460,652
97,961,514
IT Consulting & Other Services–0.04% Gartner, Inc.,
4.50%, 07/01/2028(b) 740,000 784,400 3.63%, 06/15/2029(b) 253,000 260,792
1,045,192
Leisure Facilities–0.01% Cedar Fair L.P./Canada’s
Wonderland Co./MagnumManagement Corp., 5.38%,06/01/2024 247,000 249,161
ˆ200F9cJwp#$kp#TGmŠ200F9cJwp#$kp#TGm
209435 EDG 13INVESCOCORPORATE BOND
29-Oct-2021 05:24 ESTHTMLAN
Donnelley Financial LSWashvh0apNone
4*ESS 0C
VDI-W10-DPF-05221.7.8.0
Page 1 of 1
See accompanying Notes to Financial Statements which are an integral part of the financial statements.
13 Invesco Corporate Bond Fund
PrincipalAmount Value
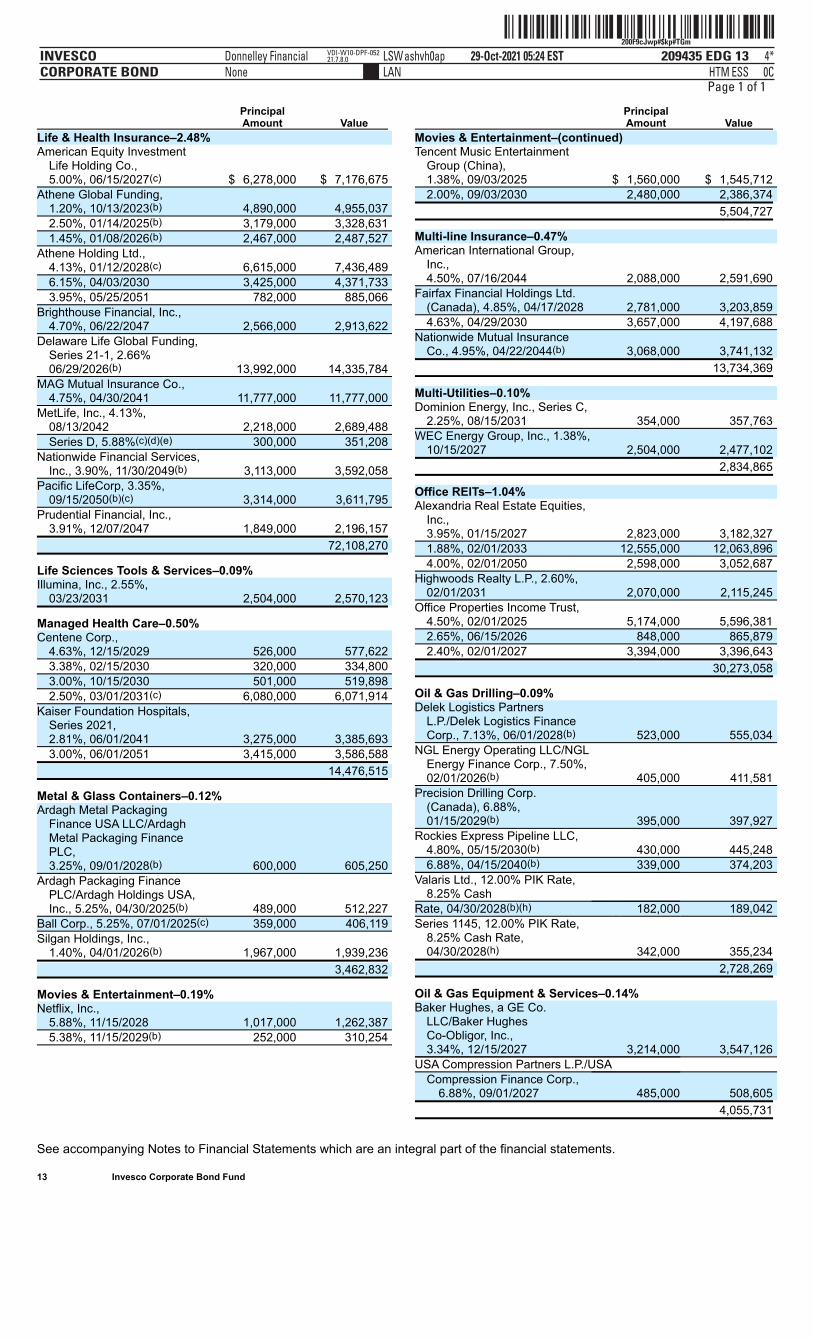
Life & Health Insurance–2.48% American Equity Investment
Life Holding Co.,5.00%, 06/15/2027(c) $ 6,278,000 $ 7,176,675
Athene Global Funding,1.20%, 10/13/2023(b) 4,890,000 4,955,037 2.50%, 01/14/2025(b) 3,179,000 3,328,631 1.45%, 01/08/2026(b) 2,467,000 2,487,527
Athene Holding Ltd.,4.13%, 01/12/2028(c) 6,615,000 7,436,489 6.15%, 04/03/2030 3,425,000 4,371,733 3.95%, 05/25/2051 782,000 885,066
Brighthouse Financial, Inc.,4.70%, 06/22/2047 2,566,000 2,913,622
Delaware Life Global Funding,Series 21-1, 2.66%06/29/2026(b) 13,992,000 14,335,784
MAG Mutual Insurance Co.,4.75%, 04/30/2041 11,777,000 11,777,000
MetLife, Inc., 4.13%,08/13/2042 2,218,000 2,689,488 Series D, 5.88%(c)(d)(e) 300,000 351,208
Nationwide Financial Services,Inc., 3.90%, 11/30/2049(b) 3,113,000 3,592,058
Pacific LifeCorp, 3.35%,09/15/2050(b)(c) 3,314,000 3,611,795
Prudential Financial, Inc.,3.91%, 12/07/2047 1,849,000 2,196,157
72,108,270
Life Sciences Tools & Services–0.09% Illumina, Inc., 2.55%,
03/23/2031 2,504,000 2,570,123
Managed Health Care–0.50% Centene Corp.,
4.63%, 12/15/2029 526,000 577,622 3.38%, 02/15/2030 320,000 334,800 3.00%, 10/15/2030 501,000 519,898 2.50%, 03/01/2031(c) 6,080,000 6,071,914
Kaiser Foundation Hospitals,Series 2021,2.81%, 06/01/2041 3,275,000 3,385,693 3.00%, 06/01/2051 3,415,000 3,586,588
14,476,515
Metal & Glass Containers–0.12% Ardagh Metal Packaging
Finance USA LLC/ArdaghMetal Packaging FinancePLC,3.25%, 09/01/2028(b) 600,000 605,250
Ardagh Packaging FinancePLC/Ardagh Holdings USA,Inc., 5.25%, 04/30/2025(b) 489,000 512,227
Ball Corp., 5.25%, 07/01/2025(c) 359,000 406,119 Silgan Holdings, Inc.,
1.40%, 04/01/2026(b) 1,967,000 1,939,236
3,462,832
Movies & Entertainment–0.19% Netflix, Inc.,
5.88%, 11/15/2028 1,017,000 1,262,387 5.38%, 11/15/2029(b) 252,000 310,254
PrincipalAmount Value
Movies & Entertainment–(continued) Tencent Music Entertainment
Group (China),1.38%, 09/03/2025 $ 1,560,000 $ 1,545,712 2.00%, 09/03/2030 2,480,000 2,386,374
5,504,727
Multi-line Insurance–0.47% American International Group,
Inc.,4.50%, 07/16/2044 2,088,000 2,591,690
Fairfax Financial Holdings Ltd.(Canada), 4.85%, 04/17/2028 2,781,000 3,203,859 4.63%, 04/29/2030 3,657,000 4,197,688
Nationwide Mutual InsuranceCo., 4.95%, 04/22/2044(b) 3,068,000 3,741,132
13,734,369
Multi-Utilities–0.10% Dominion Energy, Inc., Series C,
2.25%, 08/15/2031 354,000 357,763 WEC Energy Group, Inc., 1.38%,
10/15/2027 2,504,000 2,477,102
2,834,865
Office REITs–1.04% Alexandria Real Estate Equities,
Inc.,3.95%, 01/15/2027 2,823,000 3,182,327 1.88%, 02/01/2033 12,555,000 12,063,896 4.00%, 02/01/2050 2,598,000 3,052,687
Highwoods Realty L.P., 2.60%,02/01/2031 2,070,000 2,115,245
Office Properties Income Trust,4.50%, 02/01/2025 5,174,000 5,596,381 2.65%, 06/15/2026 848,000 865,879 2.40%, 02/01/2027 3,394,000 3,396,643
30,273,058
Oil & Gas Drilling–0.09% Delek Logistics Partners
L.P./Delek Logistics FinanceCorp., 7.13%, 06/01/2028(b) 523,000 555,034
NGL Energy Operating LLC/NGLEnergy Finance Corp., 7.50%,02/01/2026(b) 405,000 411,581
Precision Drilling Corp.(Canada), 6.88%,01/15/2029(b) 395,000 397,927
Rockies Express Pipeline LLC,4.80%, 05/15/2030(b) 430,000 445,248 6.88%, 04/15/2040(b) 339,000 374,203
Valaris Ltd., 12.00% PIK Rate,8.25% Cash
Rate, 04/30/2028(b)(h) 182,000 189,042 Series 1145, 12.00% PIK Rate,
8.25% Cash Rate,04/30/2028(h) 342,000 355,234
2,728,269
Oil & Gas Equipment & Services–0.14% Baker Hughes, a GE Co.
LLC/Baker HughesCo-Obligor, Inc.,3.34%, 12/15/2027 3,214,000 3,547,126
USA Compression Partners L.P./USA Compression Finance Corp.,
6.88%, 09/01/2027 485,000 508,605
4,055,731
ˆ200F9cJwp#$Pb!PGÉŠ200F9cJwp#$Pb!PG
209435 EDG 14INVESCOCORPORATE BOND
29-Oct-2021 05:13 ESTHTMLAN
Donnelley Financial LSWrajug0apNone
3*ESS 0C
VDI-W10-LPF-48521.7.8.0
Page 1 of 1
See accompanying Notes to Financial Statements which are an integral part of the financial statements.
14 Invesco Corporate Bond Fund
PrincipalAmount Value
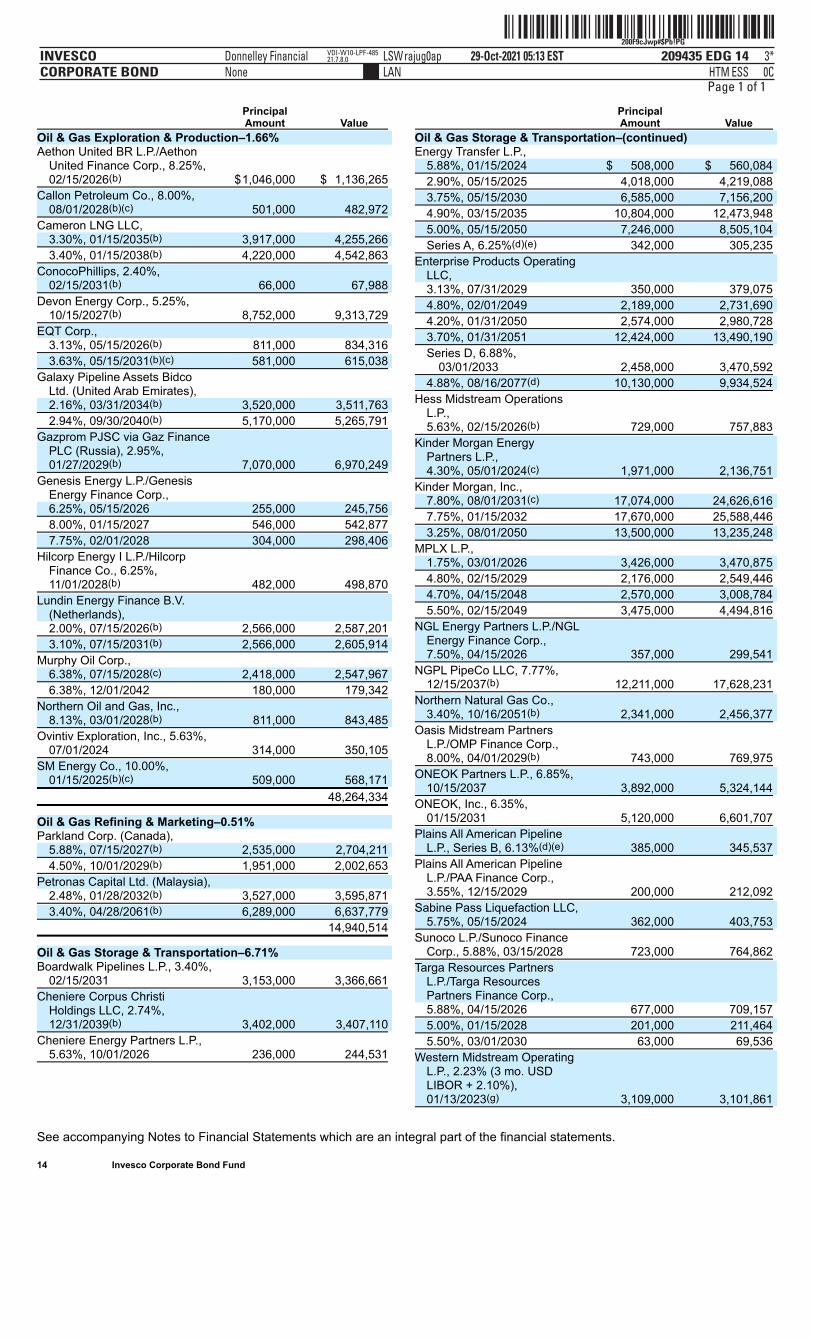
Oil & Gas Exploration & Production–1.66% Aethon United BR L.P./Aethon
United Finance Corp., 8.25%,02/15/2026(b) $1,046,000 $ 1,136,265
Callon Petroleum Co., 8.00%,08/01/2028(b)(c) 501,000 482,972
Cameron LNG LLC, 3.30%, 01/15/2035(b) 3,917,000 4,255,266
3.40%, 01/15/2038(b) 4,220,000 4,542,863
ConocoPhillips, 2.40%,02/15/2031(b) 66,000 67,988
Devon Energy Corp., 5.25%,10/15/2027(b) 8,752,000 9,313,729
EQT Corp., 3.13%, 05/15/2026(b) 811,000 834,316
3.63%, 05/15/2031(b)(c) 581,000 615,038
Galaxy Pipeline Assets BidcoLtd. (United Arab Emirates), 2.16%, 03/31/2034(b) 3,520,000 3,511,763
2.94%, 09/30/2040(b) 5,170,000 5,265,791
Gazprom PJSC via Gaz FinancePLC (Russia), 2.95%,01/27/2029(b) 7,070,000 6,970,249
Genesis Energy L.P./GenesisEnergy Finance Corp., 6.25%, 05/15/2026 255,000 245,756
8.00%, 01/15/2027 546,000 542,877
7.75%, 02/01/2028 304,000 298,406
Hilcorp Energy I L.P./HilcorpFinance Co., 6.25%,11/01/2028(b) 482,000 498,870
Lundin Energy Finance B.V.(Netherlands), 2.00%, 07/15/2026(b) 2,566,000 2,587,201
3.10%, 07/15/2031(b) 2,566,000 2,605,914
Murphy Oil Corp., 6.38%, 07/15/2028(c) 2,418,000 2,547,967
6.38%, 12/01/2042 180,000 179,342
Northern Oil and Gas, Inc.,8.13%, 03/01/2028(b) 811,000 843,485
Ovintiv Exploration, Inc., 5.63%,07/01/2024 314,000 350,105
SM Energy Co., 10.00%,01/15/2025(b)(c) 509,000 568,171
48,264,334
Oil & Gas Refining & Marketing–0.51% Parkland Corp. (Canada),
5.88%, 07/15/2027(b) 2,535,000 2,704,211
4.50%, 10/01/2029(b) 1,951,000 2,002,653
Petronas Capital Ltd. (Malaysia), 2.48%, 01/28/2032(b) 3,527,000 3,595,871
3.40%, 04/28/2061(b) 6,289,000 6,637,779
14,940,514
Oil & Gas Storage & Transportation–6.71% Boardwalk Pipelines L.P., 3.40%,
02/15/2031 3,153,000 3,366,661
Cheniere Corpus ChristiHoldings LLC, 2.74%,12/31/2039(b) 3,402,000 3,407,110
Cheniere Energy Partners L.P.,5.63%, 10/01/2026 236,000 244,531
PrincipalAmount Value
Oil & Gas Storage & Transportation–(continued) Energy Transfer L.P.,
5.88%, 01/15/2024 $ 508,000 $ 560,084
2.90%, 05/15/2025 4,018,000 4,219,088
3.75%, 05/15/2030 6,585,000 7,156,200
4.90%, 03/15/2035 10,804,000 12,473,948
5.00%, 05/15/2050 7,246,000 8,505,104
Series A, 6.25%(d)(e) 342,000 305,235
Enterprise Products OperatingLLC, 3.13%, 07/31/2029 350,000 379,075
4.80%, 02/01/2049 2,189,000 2,731,690
4.20%, 01/31/2050 2,574,000 2,980,728
3.70%, 01/31/2051 12,424,000 13,490,190
Series D, 6.88%,03/01/2033 2,458,000 3,470,592
4.88%, 08/16/2077(d) 10,130,000 9,934,524
Hess Midstream OperationsL.P.,5.63%, 02/15/2026(b) 729,000 757,883
Kinder Morgan EnergyPartners L.P.,4.30%, 05/01/2024(c) 1,971,000 2,136,751
Kinder Morgan, Inc., 7.80%, 08/01/2031(c) 17,074,000 24,626,616
7.75%, 01/15/2032 17,670,000 25,588,446
3.25%, 08/01/2050 13,500,000 13,235,248
MPLX L.P., 1.75%, 03/01/2026 3,426,000 3,470,875
4.80%, 02/15/2029 2,176,000 2,549,446
4.70%, 04/15/2048 2,570,000 3,008,784
5.50%, 02/15/2049 3,475,000 4,494,816
NGL Energy Partners L.P./NGLEnergy Finance Corp.,7.50%, 04/15/2026 357,000 299,541
NGPL PipeCo LLC, 7.77%,12/15/2037(b) 12,211,000 17,628,231
Northern Natural Gas Co.,3.40%, 10/16/2051(b) 2,341,000 2,456,377
Oasis Midstream PartnersL.P./OMP Finance Corp.,8.00%, 04/01/2029(b) 743,000 769,975
ONEOK Partners L.P., 6.85%,10/15/2037 3,892,000 5,324,144
ONEOK, Inc., 6.35%,01/15/2031 5,120,000 6,601,707
Plains All American PipelineL.P., Series B, 6.13%(d)(e) 385,000 345,537
Plains All American PipelineL.P./PAA Finance Corp.,3.55%, 12/15/2029 200,000 212,092
Sabine Pass Liquefaction LLC,5.75%, 05/15/2024 362,000 403,753
Sunoco L.P./Sunoco FinanceCorp., 5.88%, 03/15/2028 723,000 764,862
Targa Resources PartnersL.P./Targa ResourcesPartners Finance Corp., 5.88%, 04/15/2026 677,000 709,157
5.00%, 01/15/2028 201,000 211,464
5.50%, 03/01/2030 63,000 69,536
Western Midstream OperatingL.P., 2.23% (3 mo. USDLIBOR + 2.10%),01/13/2023(g) 3,109,000 3,101,861
ˆ200F9cJwp$4YW0NG4Š200F9cJwp$4YW0NG4
209435 EDG 15INVESCOCORPORATE BOND
29-Oct-2021 07:54 ESTHTMLAN
Donnelley Financial LSWmalab0apNone
4*ESS 0C
VDI-W10-LPF-12121.7.8.0
Page 1 of 1
See accompanying Notes to Financial Statements which are an integral part of the financial statements.
15 Invesco Corporate Bond Fund
PrincipalAmount Value
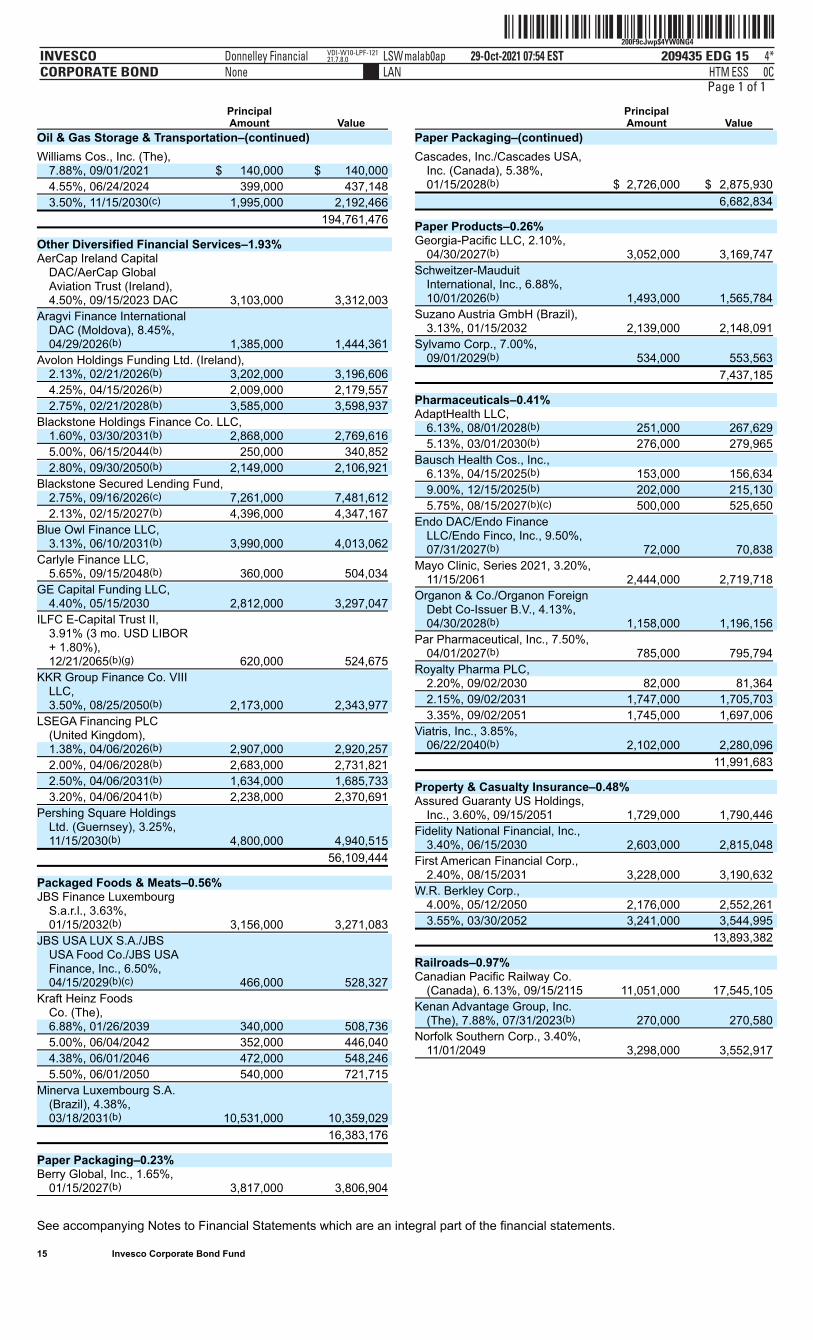
Oil & Gas Storage & Transportation–(continued) Williams Cos., Inc. (The),
7.88%, 09/01/2021 $ 140,000 $ 140,000
4.55%, 06/24/2024 399,000 437,148
3.50%, 11/15/2030(c) 1,995,000 2,192,466
194,761,476
Other Diversified Financial Services–1.93% AerCap Ireland Capital
DAC/AerCap GlobalAviation Trust (Ireland),4.50%, 09/15/2023 DAC 3,103,000 3,312,003
Aragvi Finance InternationalDAC (Moldova), 8.45%,04/29/2026(b) 1,385,000 1,444,361
Avolon Holdings Funding Ltd. (Ireland), 2.13%, 02/21/2026(b) 3,202,000 3,196,606
4.25%, 04/15/2026(b) 2,009,000 2,179,557
2.75%, 02/21/2028(b) 3,585,000 3,598,937
Blackstone Holdings Finance Co. LLC, 1.60%, 03/30/2031(b) 2,868,000 2,769,616
5.00%, 06/15/2044(b) 250,000 340,852
2.80%, 09/30/2050(b) 2,149,000 2,106,921
Blackstone Secured Lending Fund, 2.75%, 09/16/2026(c) 7,261,000 7,481,612
2.13%, 02/15/2027(b) 4,396,000 4,347,167
Blue Owl Finance LLC,3.13%, 06/10/2031(b) 3,990,000 4,013,062
Carlyle Finance LLC,5.65%, 09/15/2048(b) 360,000 504,034
GE Capital Funding LLC,4.40%, 05/15/2030 2,812,000 3,297,047
ILFC E-Capital Trust II,3.91% (3 mo. USD LIBOR+ 1.80%),12/21/2065(b)(g) 620,000 524,675
KKR Group Finance Co. VIIILLC,3.50%, 08/25/2050(b) 2,173,000 2,343,977
LSEGA Financing PLC(United Kingdom), 1.38%, 04/06/2026(b) 2,907,000 2,920,257
2.00%, 04/06/2028(b) 2,683,000 2,731,821
2.50%, 04/06/2031(b) 1,634,000 1,685,733
3.20%, 04/06/2041(b) 2,238,000 2,370,691
Pershing Square HoldingsLtd. (Guernsey), 3.25%,11/15/2030(b) 4,800,000 4,940,515
56,109,444
Packaged Foods & Meats–0.56% JBS Finance Luxembourg
S.a.r.l., 3.63%,01/15/2032(b) 3,156,000 3,271,083
JBS USA LUX S.A./JBSUSA Food Co./JBS USAFinance, Inc., 6.50%,04/15/2029(b)(c) 466,000 528,327
Kraft Heinz FoodsCo. (The), 6.88%, 01/26/2039 340,000 508,736
5.00%, 06/04/2042 352,000 446,040
4.38%, 06/01/2046 472,000 548,246
5.50%, 06/01/2050 540,000 721,715
Minerva Luxembourg S.A.(Brazil), 4.38%,03/18/2031(b) 10,531,000 10,359,029
16,383,176
Paper Packaging–0.23% Berry Global, Inc., 1.65%,
01/15/2027(b) 3,817,000 3,806,904
PrincipalAmount Value
Paper Packaging–(continued) Cascades, Inc./Cascades USA,
Inc. (Canada), 5.38%,01/15/2028(b) $ 2,726,000 $ 2,875,930
6,682,834
Paper Products–0.26% Georgia-Pacific LLC, 2.10%,
04/30/2027(b) 3,052,000 3,169,747
Schweitzer-MauduitInternational, Inc., 6.88%,10/01/2026(b) 1,493,000 1,565,784
Suzano Austria GmbH (Brazil),3.13%, 01/15/2032 2,139,000 2,148,091
Sylvamo Corp., 7.00%,09/01/2029(b) 534,000 553,563
7,437,185
Pharmaceuticals–0.41% AdaptHealth LLC,
6.13%, 08/01/2028(b) 251,000 267,629
5.13%, 03/01/2030(b) 276,000 279,965
Bausch Health Cos., Inc., 6.13%, 04/15/2025(b) 153,000 156,634
9.00%, 12/15/2025(b) 202,000 215,130
5.75%, 08/15/2027(b)(c) 500,000 525,650
Endo DAC/Endo FinanceLLC/Endo Finco, Inc., 9.50%,07/31/2027(b) 72,000 70,838
Mayo Clinic, Series 2021, 3.20%,11/15/2061 2,444,000 2,719,718
Organon & Co./Organon ForeignDebt Co-Issuer B.V., 4.13%,04/30/2028(b) 1,158,000 1,196,156
Par Pharmaceutical, Inc., 7.50%,04/01/2027(b) 785,000 795,794
Royalty Pharma PLC, 2.20%, 09/02/2030 82,000 81,364
2.15%, 09/02/2031 1,747,000 1,705,703
3.35%, 09/02/2051 1,745,000 1,697,006
Viatris, Inc., 3.85%,06/22/2040(b) 2,102,000 2,280,096
11,991,683
Property & Casualty Insurance–0.48% Assured Guaranty US Holdings,
Inc., 3.60%, 09/15/2051 1,729,000 1,790,446
Fidelity National Financial, Inc.,3.40%, 06/15/2030 2,603,000 2,815,048
First American Financial Corp.,2.40%, 08/15/2031 3,228,000 3,190,632
W.R. Berkley Corp., 4.00%, 05/12/2050 2,176,000 2,552,261
3.55%, 03/30/2052 3,241,000 3,544,995
13,893,382
Railroads–0.97% Canadian Pacific Railway Co.
(Canada), 6.13%, 09/15/2115 11,051,000 17,545,105
Kenan Advantage Group, Inc.(The), 7.88%, 07/31/2023(b) 270,000 270,580
Norfolk Southern Corp., 3.40%,11/01/2049 3,298,000 3,552,917
ˆ200F9cJwp#$P5MKooŠ200F9cJwp#$P5MKoo
209435 EDG 16INVESCOCORPORATE BOND
29-Oct-2021 05:13 ESTHTMLAN
Donnelley Financial LSWrajug0apNone
3*ESS 0C
VDI-W10-LPF-48521.7.8.0
Page 1 of 1
See accompanying Notes to Financial Statements which are an integral part of the financial statements.
16 Invesco Corporate Bond Fund
PrincipalAmount Value
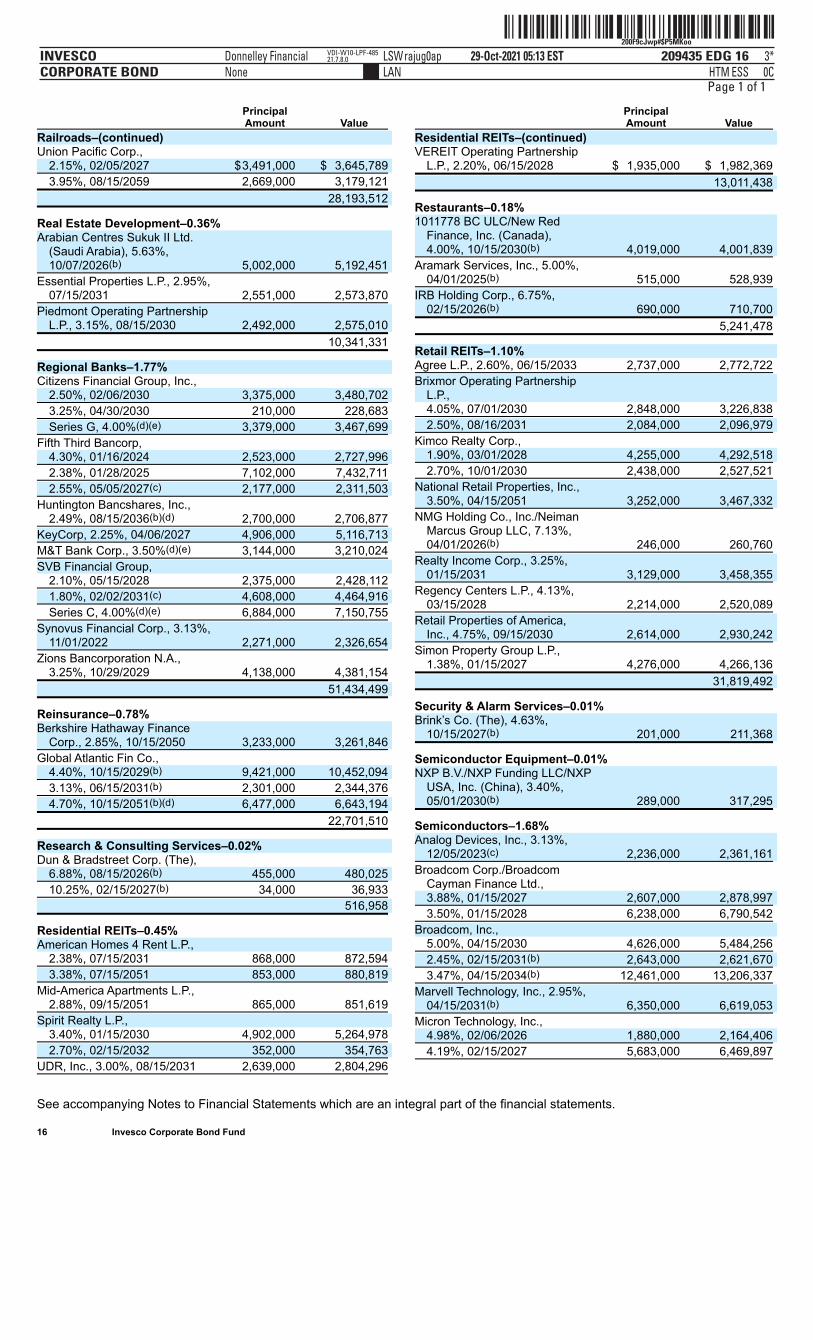
Railroads–(continued) Union Pacific Corp.,
2.15%, 02/05/2027 $3,491,000 $ 3,645,789
3.95%, 08/15/2059 2,669,000 3,179,121
28,193,512
Real Estate Development–0.36% Arabian Centres Sukuk II Ltd.
(Saudi Arabia), 5.63%,10/07/2026(b) 5,002,000 5,192,451
Essential Properties L.P., 2.95%,07/15/2031 2,551,000 2,573,870
Piedmont Operating PartnershipL.P., 3.15%, 08/15/2030 2,492,000 2,575,010
10,341,331
Regional Banks–1.77% Citizens Financial Group, Inc.,
2.50%, 02/06/2030 3,375,000 3,480,702
3.25%, 04/30/2030 210,000 228,683
Series G, 4.00%(d)(e) 3,379,000 3,467,699
Fifth Third Bancorp, 4.30%, 01/16/2024 2,523,000 2,727,996
2.38%, 01/28/2025 7,102,000 7,432,711
2.55%, 05/05/2027(c) 2,177,000 2,311,503
Huntington Bancshares, Inc.,2.49%, 08/15/2036(b)(d) 2,700,000 2,706,877
KeyCorp, 2.25%, 04/06/2027 4,906,000 5,116,713
M&T Bank Corp., 3.50%(d)(e) 3,144,000 3,210,024
SVB Financial Group, 2.10%, 05/15/2028 2,375,000 2,428,112
1.80%, 02/02/2031(c) 4,608,000 4,464,916
Series C, 4.00%(d)(e) 6,884,000 7,150,755
Synovus Financial Corp., 3.13%,11/01/2022 2,271,000 2,326,654
Zions Bancorporation N.A.,3.25%, 10/29/2029 4,138,000 4,381,154
51,434,499
Reinsurance–0.78% Berkshire Hathaway Finance
Corp., 2.85%, 10/15/2050 3,233,000 3,261,846
Global Atlantic Fin Co., 4.40%, 10/15/2029(b) 9,421,000 10,452,094
3.13%, 06/15/2031(b) 2,301,000 2,344,376
4.70%, 10/15/2051(b)(d) 6,477,000 6,643,194
22,701,510
Research & Consulting Services–0.02% Dun & Bradstreet Corp. (The),
6.88%, 08/15/2026(b) 455,000 480,025
10.25%, 02/15/2027(b) 34,000 36,933
516,958
Residential REITs–0.45% American Homes 4 Rent L.P.,
2.38%, 07/15/2031 868,000 872,594
3.38%, 07/15/2051 853,000 880,819
Mid-America Apartments L.P.,2.88%, 09/15/2051 865,000 851,619
Spirit Realty L.P., 3.40%, 01/15/2030 4,902,000 5,264,978
2.70%, 02/15/2032 352,000 354,763
UDR, Inc., 3.00%, 08/15/2031 2,639,000 2,804,296
PrincipalAmount Value
Residential REITs–(continued) VEREIT Operating Partnership
L.P., 2.20%, 06/15/2028 $ 1,935,000 $ 1,982,369
13,011,438
Restaurants–0.18% 1011778 BC ULC/New Red
Finance, Inc. (Canada),4.00%, 10/15/2030(b) 4,019,000 4,001,839
Aramark Services, Inc., 5.00%,04/01/2025(b) 515,000 528,939
IRB Holding Corp., 6.75%,02/15/2026(b) 690,000 710,700
5,241,478
Retail REITs–1.10% Agree L.P., 2.60%, 06/15/2033 2,737,000 2,772,722
Brixmor Operating PartnershipL.P., 4.05%, 07/01/2030 2,848,000 3,226,838
2.50%, 08/16/2031 2,084,000 2,096,979
Kimco Realty Corp., 1.90%, 03/01/2028 4,255,000 4,292,518
2.70%, 10/01/2030 2,438,000 2,527,521
National Retail Properties, Inc.,3.50%, 04/15/2051 3,252,000 3,467,332
NMG Holding Co., Inc./NeimanMarcus Group LLC, 7.13%,04/01/2026(b) 246,000 260,760
Realty Income Corp., 3.25%,01/15/2031 3,129,000 3,458,355
Regency Centers L.P., 4.13%,03/15/2028 2,214,000 2,520,089
Retail Properties of America,Inc., 4.75%, 09/15/2030 2,614,000 2,930,242
Simon Property Group L.P.,1.38%, 01/15/2027 4,276,000 4,266,136
31,819,492
Security & Alarm Services–0.01% Brink’s Co. (The), 4.63%,
10/15/2027(b) 201,000 211,368
Semiconductor Equipment–0.01% NXP B.V./NXP Funding LLC/NXP
USA, Inc. (China), 3.40%,05/01/2030(b) 289,000 317,295
Semiconductors–1.68% Analog Devices, Inc., 3.13%,
12/05/2023(c) 2,236,000 2,361,161
Broadcom Corp./BroadcomCayman Finance Ltd., 3.88%, 01/15/2027 2,607,000 2,878,997
3.50%, 01/15/2028 6,238,000 6,790,542
Broadcom, Inc., 5.00%, 04/15/2030 4,626,000 5,484,256
2.45%, 02/15/2031(b) 2,643,000 2,621,670
3.47%, 04/15/2034(b) 12,461,000 13,206,337
Marvell Technology, Inc., 2.95%,04/15/2031(b) 6,350,000 6,619,053
Micron Technology, Inc., 4.98%, 02/06/2026 1,880,000 2,164,406
4.19%, 02/15/2027 5,683,000 6,469,897
ˆ200F9cJwp$1vzt5oRŠ200F9cJwp$1vzt5oR
209435 EDG 17INVESCOCORPORATE BOND
29-Oct-2021 07:05 ESTHTMLAN
Donnelley Financial LSWjadha1apNone
6*ESS 0C
VDI-W10-DPF-49821.7.8.0
Page 1 of 1
See accompanying Notes to Financial Statements which are an integral part of the financial statements.
17 Invesco Corporate Bond Fund
PrincipalAmount Value
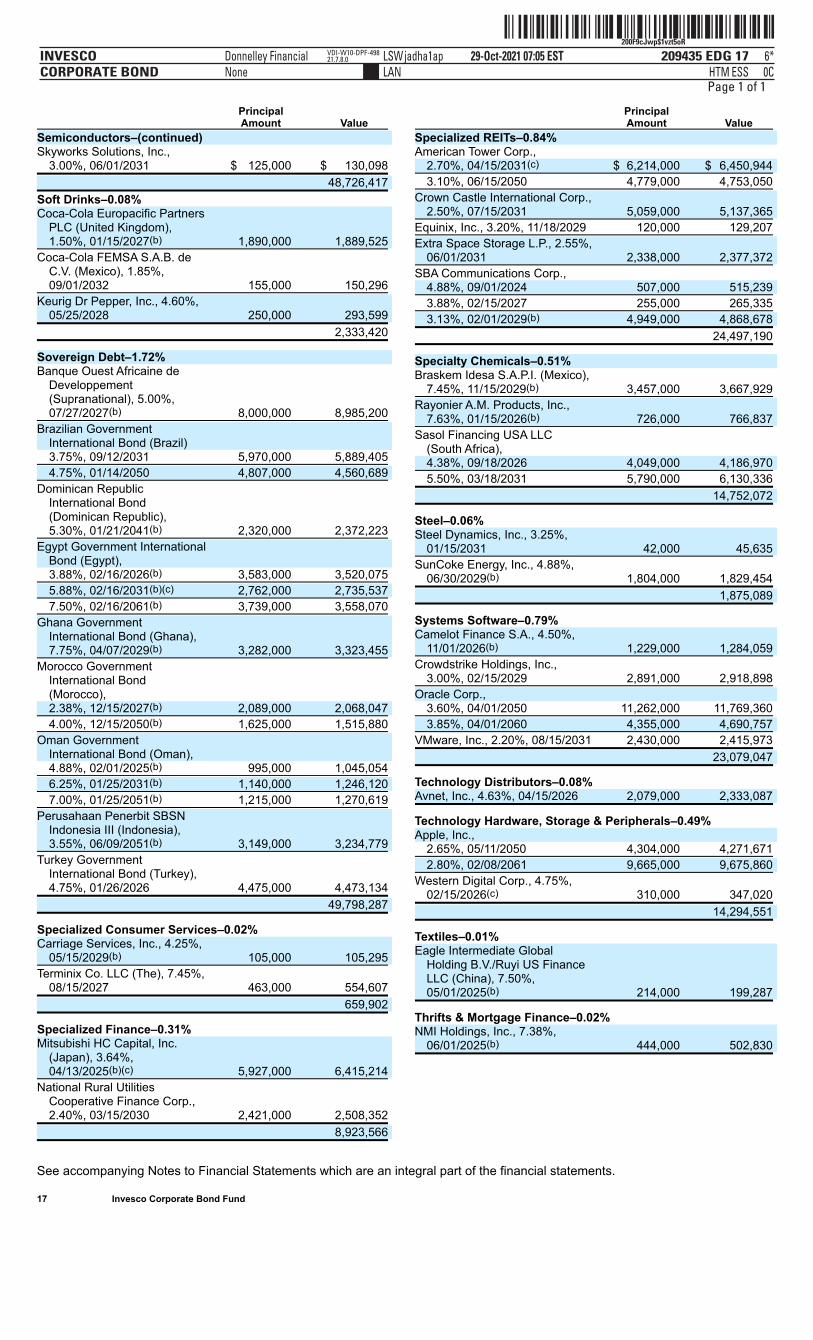
Semiconductors–(continued) Skyworks Solutions, Inc.,
3.00%, 06/01/2031 $ 125,000 $ 130,098
48,726,417
Soft Drinks–0.08% Coca-Cola Europacific Partners
PLC (United Kingdom),1.50%, 01/15/2027(b) 1,890,000 1,889,525
Coca-Cola FEMSA S.A.B. deC.V. (Mexico), 1.85%,09/01/2032 155,000 150,296
Keurig Dr Pepper, Inc., 4.60%,05/25/2028 250,000 293,599
2,333,420
Sovereign Debt–1.72% Banque Ouest Africaine de
Developpement(Supranational), 5.00%,07/27/2027(b) 8,000,000 8,985,200
Brazilian GovernmentInternational Bond (Brazil) 3.75%, 09/12/2031 5,970,000 5,889,405
4.75%, 01/14/2050 4,807,000 4,560,689
Dominican RepublicInternational Bond(Dominican Republic),5.30%, 01/21/2041(b) 2,320,000 2,372,223
Egypt Government InternationalBond (Egypt), 3.88%, 02/16/2026(b) 3,583,000 3,520,075
5.88%, 02/16/2031(b)(c) 2,762,000 2,735,537
7.50%, 02/16/2061(b) 3,739,000 3,558,070
Ghana GovernmentInternational Bond (Ghana),7.75%, 04/07/2029(b) 3,282,000 3,323,455
Morocco GovernmentInternational Bond(Morocco), 2.38%, 12/15/2027(b) 2,089,000 2,068,047
4.00%, 12/15/2050(b) 1,625,000 1,515,880
Oman GovernmentInternational Bond (Oman), 4.88%, 02/01/2025(b) 995,000 1,045,054
6.25%, 01/25/2031(b) 1,140,000 1,246,120
7.00%, 01/25/2051(b) 1,215,000 1,270,619
Perusahaan Penerbit SBSNIndonesia III (Indonesia),3.55%, 06/09/2051(b) 3,149,000 3,234,779
Turkey GovernmentInternational Bond (Turkey),4.75%, 01/26/2026 4,475,000 4,473,134
49,798,287
Specialized Consumer Services–0.02% Carriage Services, Inc., 4.25%,
05/15/2029(b) 105,000 105,295
Terminix Co. LLC (The), 7.45%,08/15/2027 463,000 554,607
659,902
Specialized Finance–0.31% Mitsubishi HC Capital, Inc.
(Japan), 3.64%,04/13/2025(b)(c) 5,927,000 6,415,214
National Rural UtilitiesCooperative Finance Corp.,2.40%, 03/15/2030 2,421,000 2,508,352
8,923,566
PrincipalAmount Value
Specialized REITs–0.84% American Tower Corp.,
2.70%, 04/15/2031(c) $ 6,214,000 $ 6,450,944
3.10%, 06/15/2050 4,779,000 4,753,050
Crown Castle International Corp.,2.50%, 07/15/2031 5,059,000 5,137,365
Equinix, Inc., 3.20%, 11/18/2029 120,000 129,207
Extra Space Storage L.P., 2.55%,06/01/2031 2,338,000 2,377,372
SBA Communications Corp., 4.88%, 09/01/2024 507,000 515,239
3.88%, 02/15/2027 255,000 265,335
3.13%, 02/01/2029(b) 4,949,000 4,868,678
24,497,190
Specialty Chemicals–0.51% Braskem Idesa S.A.P.I. (Mexico),
7.45%, 11/15/2029(b) 3,457,000 3,667,929
Rayonier A.M. Products, Inc.,7.63%, 01/15/2026(b) 726,000 766,837
Sasol Financing USA LLC(South Africa), 4.38%, 09/18/2026 4,049,000 4,186,970
5.50%, 03/18/2031 5,790,000 6,130,336
14,752,072
Steel–0.06% Steel Dynamics, Inc., 3.25%,
01/15/2031 42,000 45,635
SunCoke Energy, Inc., 4.88%,06/30/2029(b) 1,804,000 1,829,454
1,875,089
Systems Software–0.79% Camelot Finance S.A., 4.50%,
11/01/2026(b) 1,229,000 1,284,059
Crowdstrike Holdings, Inc.,3.00%, 02/15/2029 2,891,000 2,918,898
Oracle Corp., 3.60%, 04/01/2050 11,262,000 11,769,360
3.85%, 04/01/2060 4,355,000 4,690,757
VMware, Inc., 2.20%, 08/15/2031 2,430,000 2,415,973
23,079,047
Technology Distributors–0.08% Avnet, Inc., 4.63%, 04/15/2026 2,079,000 2,333,087
Technology Hardware, Storage & Peripherals–0.49% Apple, Inc.,
2.65%, 05/11/2050 4,304,000 4,271,671
2.80%, 02/08/2061 9,665,000 9,675,860
Western Digital Corp., 4.75%,02/15/2026(c) 310,000 347,020
14,294,551
Textiles–0.01% Eagle Intermediate Global
Holding B.V./Ruyi US FinanceLLC (China), 7.50%,05/01/2025(b) 214,000 199,287
Thrifts & Mortgage Finance–0.02% NMI Holdings, Inc., 7.38%,
06/01/2025(b) 444,000 502,830
ˆ200F9cJwp#&z=SRGTŠ200F9cJwp#&z=SRGT
209435 EDG 18INVESCOCORPORATE BOND
29-Oct-2021 06:24 ESTHTMLAN
Donnelley Financial LSWsahoa1apNone
5*ESS 0C
VDI-W10-DPF-27821.7.8.0
Page 1 of 1
See accompanying Notes to Financial Statements which are an integral part of the financial statements.
18 Invesco Corporate Bond Fund
PrincipalAmount Value
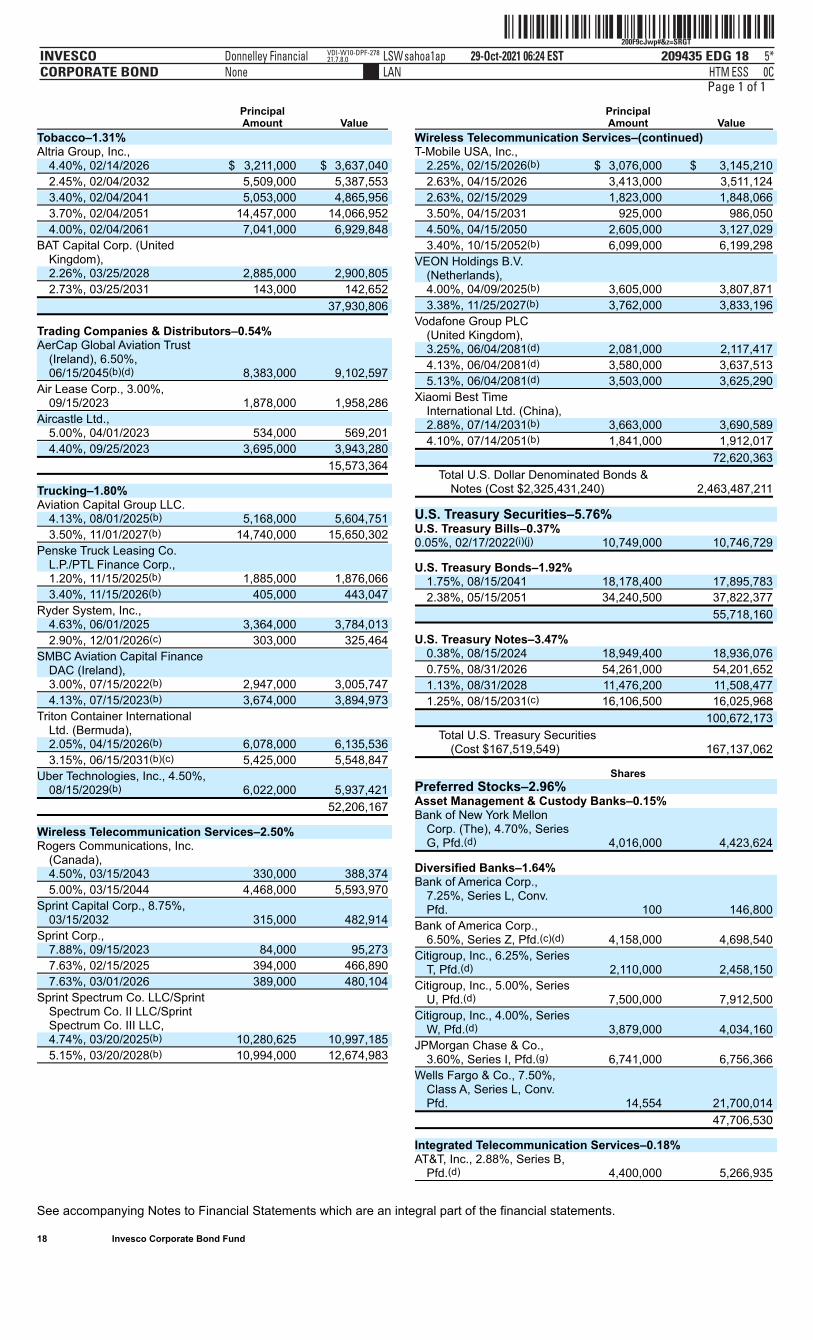
Tobacco–1.31% Altria Group, Inc.,
4.40%, 02/14/2026 $ 3,211,000 $ 3,637,040
2.45%, 02/04/2032 5,509,000 5,387,553
3.40%, 02/04/2041 5,053,000 4,865,956
3.70%, 02/04/2051 14,457,000 14,066,952
4.00%, 02/04/2061 7,041,000 6,929,848
BAT Capital Corp. (UnitedKingdom), 2.26%, 03/25/2028 2,885,000 2,900,805
2.73%, 03/25/2031 143,000 142,652
37,930,806
Trading Companies & Distributors–0.54% AerCap Global Aviation Trust
(Ireland), 6.50%,06/15/2045(b)(d) 8,383,000 9,102,597
Air Lease Corp., 3.00%,09/15/2023 1,878,000 1,958,286
Aircastle Ltd., 5.00%, 04/01/2023 534,000 569,201
4.40%, 09/25/2023 3,695,000 3,943,280
15,573,364
Trucking–1.80% Aviation Capital Group LLC.
4.13%, 08/01/2025(b) 5,168,000 5,604,751
3.50%, 11/01/2027(b) 14,740,000 15,650,302
Penske Truck Leasing Co.L.P./PTL Finance Corp., 1.20%, 11/15/2025(b) 1,885,000 1,876,066
3.40%, 11/15/2026(b) 405,000 443,047
Ryder System, Inc., 4.63%, 06/01/2025 3,364,000 3,784,013
2.90%, 12/01/2026(c) 303,000 325,464
SMBC Aviation Capital FinanceDAC (Ireland), 3.00%, 07/15/2022(b) 2,947,000 3,005,747
4.13%, 07/15/2023(b) 3,674,000 3,894,973
Triton Container InternationalLtd. (Bermuda), 2.05%, 04/15/2026(b) 6,078,000 6,135,536
3.15%, 06/15/2031(b)(c) 5,425,000 5,548,847
Uber Technologies, Inc., 4.50%,08/15/2029(b) 6,022,000 5,937,421
52,206,167
Wireless Telecommunication Services–2.50% Rogers Communications, Inc.
(Canada), 4.50%, 03/15/2043 330,000 388,374
5.00%, 03/15/2044 4,468,000 5,593,970
Sprint Capital Corp., 8.75%,03/15/2032 315,000 482,914
Sprint Corp., 7.88%, 09/15/2023 84,000 95,273
7.63%, 02/15/2025 394,000 466,890
7.63%, 03/01/2026 389,000 480,104
Sprint Spectrum Co. LLC/SprintSpectrum Co. II LLC/SprintSpectrum Co. III LLC, 4.74%, 03/20/2025(b) 10,280,625 10,997,185
5.15%, 03/20/2028(b) 10,994,000 12,674,983
PrincipalAmount Value
Wireless Telecommunication Services–(continued) T-Mobile USA, Inc.,
2.25%, 02/15/2026(b) $ 3,076,000 $ 3,145,210
2.63%, 04/15/2026 3,413,000 3,511,124
2.63%, 02/15/2029 1,823,000 1,848,066
3.50%, 04/15/2031 925,000 986,050
4.50%, 04/15/2050 2,605,000 3,127,029
3.40%, 10/15/2052(b) 6,099,000 6,199,298
VEON Holdings B.V.(Netherlands), 4.00%, 04/09/2025(b) 3,605,000 3,807,871
3.38%, 11/25/2027(b) 3,762,000 3,833,196
Vodafone Group PLC(United Kingdom), 3.25%, 06/04/2081(d) 2,081,000 2,117,417
4.13%, 06/04/2081(d) 3,580,000 3,637,513
5.13%, 06/04/2081(d) 3,503,000 3,625,290
Xiaomi Best TimeInternational Ltd. (China), 2.88%, 07/14/2031(b) 3,663,000 3,690,589
4.10%, 07/14/2051(b) 1,841,000 1,912,017
72,620,363
Total U.S. Dollar Denominated Bonds &Notes (Cost $2,325,431,240)
2,463,487,211
U.S. Treasury Securities–5.76% U.S. Treasury Bills–0.37% 0.05%, 02/17/2022(i)(j) 10,749,000 10,746,729
U.S. Treasury Bonds–1.92% 1.75%, 08/15/2041 18,178,400 17,895,783
2.38%, 05/15/2051 34,240,500 37,822,377
55,718,160
U.S. Treasury Notes–3.47% 0.38%, 08/15/2024 18,949,400 18,936,076
0.75%, 08/31/2026 54,261,000 54,201,652
1.13%, 08/31/2028 11,476,200 11,508,477
1.25%, 08/15/2031(c) 16,106,500 16,025,968
100,672,173
Total U.S. Treasury Securities(Cost $167,519,549)
167,137,062
Shares Preferred Stocks–2.96% Asset Management & Custody Banks–0.15% Bank of New York Mellon
Corp. (The), 4.70%, SeriesG, Pfd.(d) 4,016,000 4,423,624
Diversified Banks–1.64% Bank of America Corp.,
7.25%, Series L, Conv.Pfd. 100 146,800
Bank of America Corp.,6.50%, Series Z, Pfd.(c)(d) 4,158,000 4,698,540
Citigroup, Inc., 6.25%, SeriesT, Pfd.(d) 2,110,000 2,458,150
Citigroup, Inc., 5.00%, SeriesU, Pfd.(d) 7,500,000 7,912,500
Citigroup, Inc., 4.00%, SeriesW, Pfd.(d) 3,879,000 4,034,160
JPMorgan Chase & Co.,3.60%, Series I, Pfd.(g) 6,741,000 6,756,366
Wells Fargo & Co., 7.50%,Class A, Series L, Conv.Pfd. 14,554 21,700,014
47,706,530
Integrated Telecommunication Services–0.18% AT&T, Inc., 2.88%, Series B,
Pfd.(d) 4,400,000 5,266,935
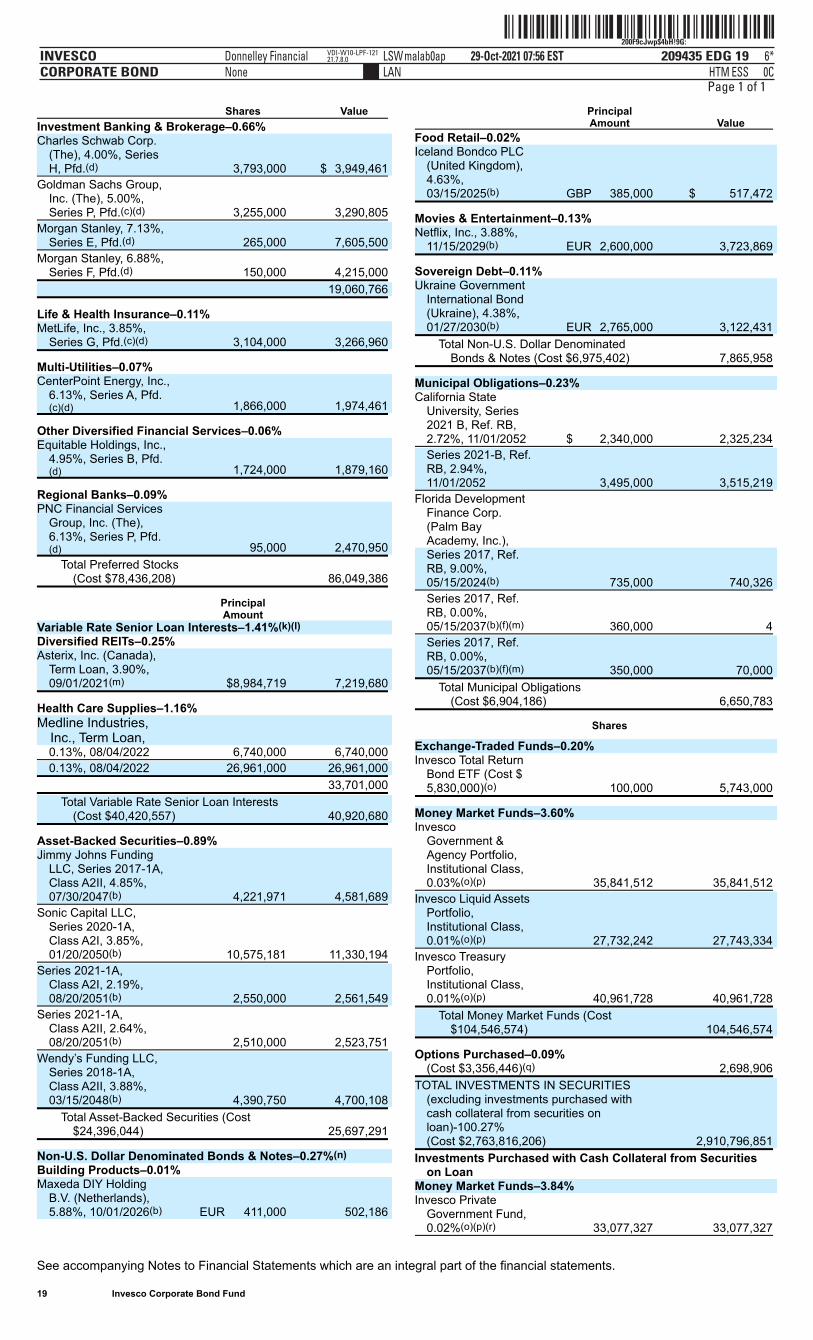
ˆ200F9cJwp$4bH!9G:Š200F9cJwp$4bH!9G:
209435 EDG 19INVESCOCORPORATE BOND
29-Oct-2021 07:56 ESTHTMLAN
Donnelley Financial LSWmalab0apNone
6*ESS 0C
VDI-W10-LPF-12121.7.8.0
Page 1 of 1
See accompanying Notes to Financial Statements which are an integral part of the financial statements.
19 Invesco Corporate Bond Fund
Shares Value
Investment Banking & Brokerage–0.66% Charles Schwab Corp.
(The), 4.00%, SeriesH, Pfd.(d) 3,793,000 $ 3,949,461
Goldman Sachs Group,Inc. (The), 5.00%,Series P, Pfd.(c)(d) 3,255,000 3,290,805
Morgan Stanley, 7.13%,Series E, Pfd.(d) 265,000 7,605,500
Morgan Stanley, 6.88%,Series F, Pfd.(d) 150,000 4,215,000
19,060,766
Life & Health Insurance–0.11% MetLife, Inc., 3.85%,
Series G, Pfd.(c)(d) 3,104,000 3,266,960
Multi-Utilities–0.07% CenterPoint Energy, Inc.,
6.13%, Series A, Pfd.(c)(d) 1,866,000 1,974,461
Other Diversified Financial Services–0.06% Equitable Holdings, Inc.,
4.95%, Series B, Pfd.(d) 1,724,000 1,879,160
Regional Banks–0.09% PNC Financial Services
Group, Inc. (The),6.13%, Series P, Pfd.(d) 95,000 2,470,950
Total Preferred Stocks(Cost $78,436,208)
86,049,386
PrincipalAmount
Variable Rate Senior Loan Interests–1.41%(k)(l) Diversified REITs–0.25% Asterix, Inc. (Canada),
Term Loan, 3.90%,09/01/2021(m) $8,984,719 7,219,680
Health Care Supplies–1.16% Medline Industries,
Inc., Term Loan, 0.13%, 08/04/2022 6,740,000 6,740,000
0.13%, 08/04/2022 26,961,000 26,961,000
33,701,000
Total Variable Rate Senior Loan Interests(Cost $40,420,557)
40,920,680
Asset-Backed Securities–0.89% Jimmy Johns Funding
LLC, Series 2017-1A,Class A2II, 4.85%,07/30/2047(b) 4,221,971 4,581,689
Sonic Capital LLC,Series 2020-1A,Class A2I, 3.85%,01/20/2050(b) 10,575,181 11,330,194
Series 2021-1A,Class A2I, 2.19%,08/20/2051(b) 2,550,000 2,561,549
Series 2021-1A,Class A2II, 2.64%,08/20/2051(b) 2,510,000 2,523,751
Wendy’s Funding LLC,Series 2018-1A,Class A2II, 3.88%,03/15/2048(b) 4,390,750 4,700,108
Total Asset-Backed Securities (Cost$24,396,044)
25,697,291
Non-U.S. Dollar Denominated Bonds & Notes–0.27%(n) Building Products–0.01% Maxeda DIY Holding
B.V. (Netherlands),5.88%, 10/01/2026(b) EUR 411,000 502,186
PrincipalAmount Value
Food Retail–0.02% Iceland Bondco PLC
(United Kingdom),4.63%,03/15/2025(b) GBP 385,000 $ 517,472
Movies & Entertainment–0.13% Netflix, Inc., 3.88%,
11/15/2029(b) EUR 2,600,000 3,723,869
Sovereign Debt–0.11% Ukraine Government
International Bond(Ukraine), 4.38%,01/27/2030(b) EUR 2,765,000 3,122,431
Total Non-U.S. Dollar DenominatedBonds & Notes (Cost $6,975,402)
7,865,958
Municipal Obligations–0.23% California State
University, Series2021 B, Ref. RB,2.72%, 11/01/2052 $ 2,340,000 2,325,234
Series 2021-B, Ref.RB, 2.94%,11/01/2052 3,495,000 3,515,219
Florida DevelopmentFinance Corp.(Palm BayAcademy, Inc.), Series 2017, Ref.RB, 9.00%,05/15/2024(b) 735,000 740,326
Series 2017, Ref.RB, 0.00%,05/15/2037(b)(f)(m) 360,000 4
Series 2017, Ref.RB, 0.00%,05/15/2037(b)(f)(m) 350,000 70,000
Total Municipal Obligations(Cost $6,904,186)
6,650,783
Shares
Exchange-Traded Funds–0.20% Invesco Total Return
Bond ETF (Cost $5,830,000)(o) 100,000 5,743,000
Money Market Funds–3.60% Invesco
Government &Agency Portfolio,Institutional Class,0.03%(o)(p) 35,841,512 35,841,512
Invesco Liquid AssetsPortfolio,Institutional Class,0.01%(o)(p) 27,732,242 27,743,334
Invesco TreasuryPortfolio,Institutional Class,0.01%(o)(p) 40,961,728 40,961,728
Total Money Market Funds (Cost$104,546,574)
104,546,574
Options Purchased–0.09%(Cost $3,356,446)(q)
2,698,906
TOTAL INVESTMENTS IN SECURITIES(excluding investments purchased withcash collateral from securities onloan)-100.27%(Cost $2,763,816,206)
2,910,796,851
Investments Purchased with Cash Collateral from Securitieson Loan
Money Market Funds–3.84% Invesco Private
Government Fund,0.02%(o)(p)(r) 33,077,327 33,077,327
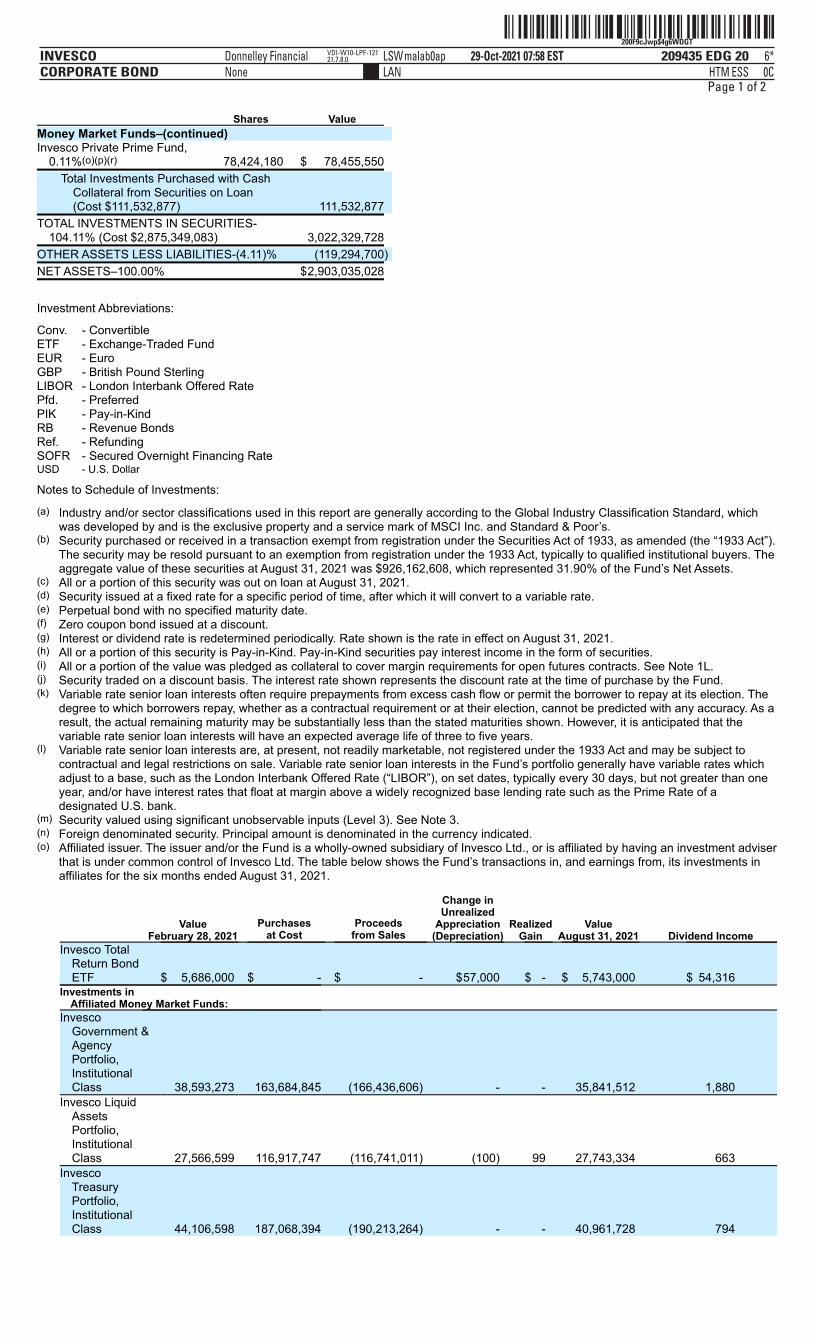
ˆ200F9cJwp$4g6WDGTŠ200F9cJwp$4g6WDGT
209435 EDG 20INVESCOCORPORATE BOND
29-Oct-2021 07:58 ESTHTMLAN
Donnelley Financial LSWmalab0apNone
6*ESS 0C
VDI-W10-LPF-12121.7.8.0
Page 1 of 2
Investment Abbreviations:
Conv. - ConvertibleETF - Exchange-Traded FundEUR - EuroGBP - British Pound SterlingLIBOR - London Interbank Offered RatePfd. - PreferredPIK - Pay-in-KindRB - Revenue BondsRef. - RefundingSOFR - Secured Overnight Financing RateUSD - U.S. Dollar
Notes to Schedule of Investments:
(a) Industry and/or sector classifications used in this report are generally according to the Global Industry Classification Standard, whichwas developed by and is the exclusive property and a service mark of MSCI Inc. and Standard & Poor’s.
(b) Security purchased or received in a transaction exempt from registration under the Securities Act of 1933, as amended (the “1933 Act”).The security may be resold pursuant to an exemption from registration under the 1933 Act, typically to qualified institutional buyers. Theaggregate value of these securities at August 31, 2021 was $926,162,608, which represented 31.90% of the Fund’s Net Assets.
(c) All or a portion of this security was out on loan at August 31, 2021.(d) Security issued at a fixed rate for a specific period of time, after which it will convert to a variable rate.(e) Perpetual bond with no specified maturity date.(f) Zero coupon bond issued at a discount.(g) Interest or dividend rate is redetermined periodically. Rate shown is the rate in effect on August 31, 2021.(h) All or a portion of this security is Pay-in-Kind. Pay-in-Kind securities pay interest income in the form of securities.(i) All or a portion of the value was pledged as collateral to cover margin requirements for open futures contracts. See Note 1L.(j) Security traded on a discount basis. The interest rate shown represents the discount rate at the time of purchase by the Fund.(k) Variable rate senior loan interests often require prepayments from excess cash flow or permit the borrower to repay at its election. The
degree to which borrowers repay, whether as a contractual requirement or at their election, cannot be predicted with any accuracy. As aresult, the actual remaining maturity may be substantially less than the stated maturities shown. However, it is anticipated that thevariable rate senior loan interests will have an expected average life of three to five years.
(l) Variable rate senior loan interests are, at present, not readily marketable, not registered under the 1933 Act and may be subject tocontractual and legal restrictions on sale. Variable rate senior loan interests in the Fund’s portfolio generally have variable rates whichadjust to a base, such as the London Interbank Offered Rate (“LIBOR”), on set dates, typically every 30 days, but not greater than oneyear, and/or have interest rates that float at margin above a widely recognized base lending rate such as the Prime Rate of adesignated U.S. bank.
(m) Security valued using significant unobservable inputs (Level 3). See Note 3.(n) Foreign denominated security. Principal amount is denominated in the currency indicated.(o) Affiliated issuer. The issuer and/or the Fund is a wholly-owned subsidiary of Invesco Ltd., or is affiliated by having an investment adviser
that is under common control of Invesco Ltd. The table below shows the Fund’s transactions in, and earnings from, its investments inaffiliates for the six months ended August 31, 2021.
Value
February 28, 2021 Purchases
at Cost Proceeds
from Sales
Change inUnrealized
Appreciation(Depreciation)
RealizedGain
ValueAugust 31, 2021 Dividend Income
Invesco TotalReturn BondETF $ 5,686,000 $ - $ - $57,000 $ - $ 5,743,000 $ 54,316
Investments inAffiliated Money Market Funds:
InvescoGovernment &AgencyPortfolio,InstitutionalClass 38,593,273 163,684,845 (166,436,606) - - 35,841,512 1,880
Invesco LiquidAssetsPortfolio,InstitutionalClass 27,566,599 116,917,747 (116,741,011) (100) 99 27,743,334 663
InvescoTreasuryPortfolio,InstitutionalClass 44,106,598 187,068,394 (190,213,264) - - 40,961,728 794
Shares Value
Money Market Funds–(continued) Invesco Private Prime Fund,
0.11%(o)(p)(r) 78,424,180 $ 78,455,550
Total Investments Purchased with CashCollateral from Securities on Loan(Cost $111,532,877)
111,532,877
TOTAL INVESTMENTS IN SECURITIES-104.11% (Cost $2,875,349,083)
3,022,329,728
OTHER ASSETS LESS LIABILITIES-(4.11)% (119,294,700)
NET ASSETS–100.00% $2,903,035,028

ˆ200F9cJwp$4g6WDGTŠ200F9cJwp$4g6WDGT
209435 EDG 20INVESCOCORPORATE BOND
29-Oct-2021 07:58 ESTHTMLAN
Donnelley Financial LSWmalab0apNone
6*ESS 0C
VDI-W10-LPF-12121.7.8.0
ˆ200F9cJwp$4g6WDGTŠ200F9cJwp$4g6WDGT
209435 EDG 20INVESCOCORPORATE BOND
29-Oct-2021 07:58 ESTHTMLAN
Donnelley Financial LSWmalab0apNone
6*ESS 0C
VDI-W10-LPF-12121.7.8.0
Page 2 of 2Investments
Purchasedwith CashCollateralfromSecuritieson Loan:
Invesco PrivateGovernmentFund 2,748,998 116,625,008 (86,296,679) - - 33,077,327 1,455*
Invesco PrivatePrime Fund 4,123,497 218,247,195 (143,915,142) - - 78,455,550 21,220*
Total $122,824,965 $802,543,189 $(703,602,702) $56,900 $99 $221,822,451 $ 80,328
See accompanying Notes to Financial Statements which are an integral part of the financial statements.
20 Invesco Corporate Bond Fund
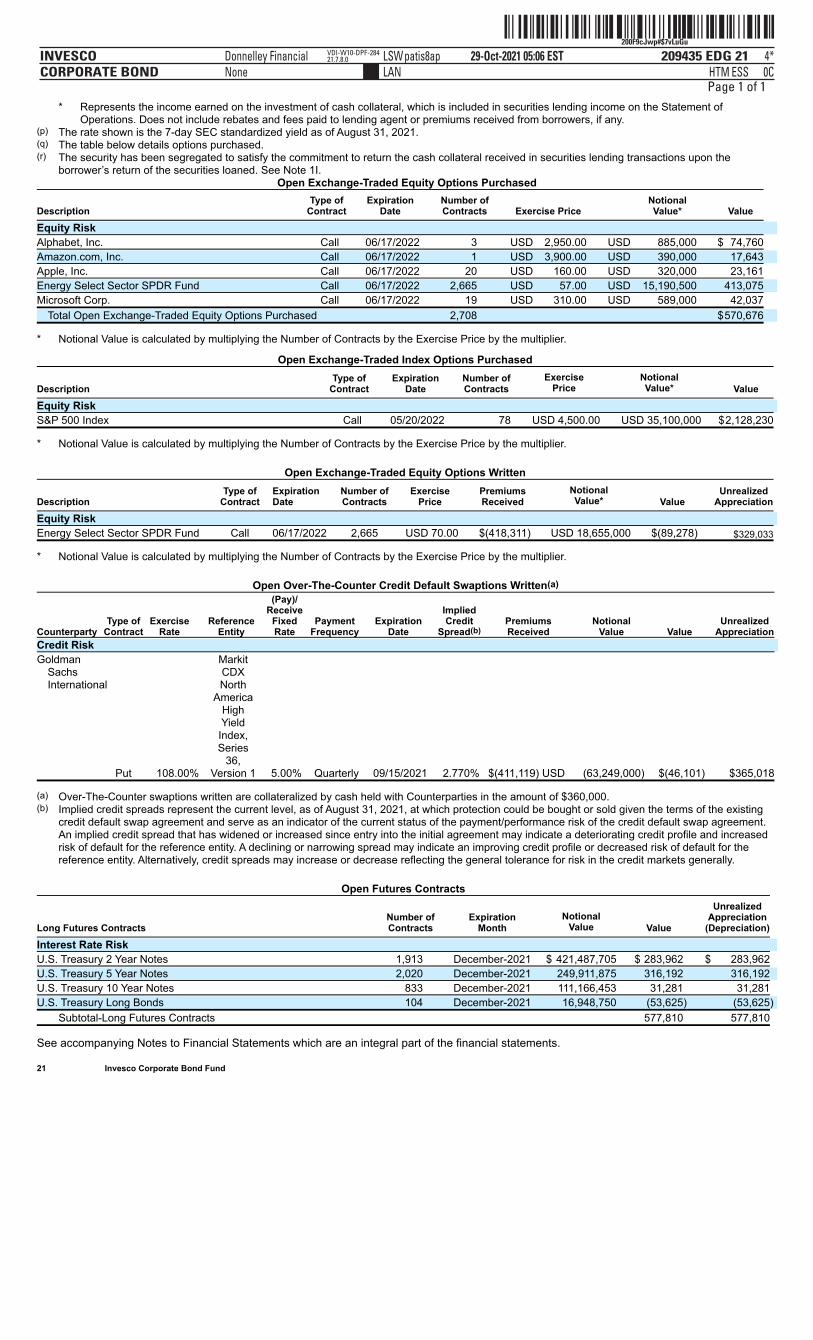
ˆ200F9cJwp#$7vLuGuŠ200F9cJwp#$7vLuGu
209435 EDG 21INVESCOCORPORATE BOND
29-Oct-2021 05:06 ESTHTMLAN
Donnelley Financial LSWpatis8apNone
4*ESS 0C
VDI-W10-DPF-28421.7.8.0
Page 1 of 1
* Represents the income earned on the investment of cash collateral, which is included in securities lending income on the Statement ofOperations. Does not include rebates and fees paid to lending agent or premiums received from borrowers, if any.
(p) The rate shown is the 7-day SEC standardized yield as of August 31, 2021.(q) The table below details options purchased.(r) The security has been segregated to satisfy the commitment to return the cash collateral received in securities lending transactions upon the
borrower’s return of the securities loaned. See Note 1I.Open Exchange-Traded Equity Options Purchased
Description Type of
Contract Expiration
Date Number ofContracts Exercise Price
NotionalValue* Value
Equity Risk
Alphabet, Inc. Call 06/17/2022 3 USD 2,950.00 USD 885,000 $ 74,760
Amazon.com, Inc. Call 06/17/2022 1 USD 3,900.00 USD 390,000 17,643
Apple, Inc. Call 06/17/2022 20 USD 160.00 USD 320,000 23,161
Energy Select Sector SPDR Fund Call 06/17/2022 2,665 USD 57.00 USD 15,190,500 413,075
Microsoft Corp. Call 06/17/2022 19 USD 310.00 USD 589,000 42,037
Total Open Exchange-Traded Equity Options Purchased 2,708 $570,676
* Notional Value is calculated by multiplying the Number of Contracts by the Exercise Price by the multiplier.
Open Exchange-Traded Index Options Purchased
Description Type of
Contract Expiration
Date Number ofContracts
ExercisePrice
NotionalValue* Value
Equity Risk
S&P 500 Index Call 05/20/2022 78 USD 4,500.00 USD 35,100,000 $2,128,230
* Notional Value is calculated by multiplying the Number of Contracts by the Exercise Price by the multiplier.
Open Exchange-Traded Equity Options Written
Description Type of
Contract ExpirationDate
Number ofContracts
ExercisePrice
PremiumsReceived
NotionalValue* Value
UnrealizedAppreciation
Equity Risk
Energy Select Sector SPDR Fund Call 06/17/2022 2,665 USD 70.00 $(418,311) USD 18,655,000 $(89,278) $329,033
* Notional Value is calculated by multiplying the Number of Contracts by the Exercise Price by the multiplier.
Open Over-The-Counter Credit Default Swaptions Written(a)
Counterparty Type of
Contract Exercise
Rate Reference
Entity
(Pay)/Receive
FixedRate
PaymentFrequency
ExpirationDate
ImpliedCredit
Spread(b) PremiumsReceived
NotionalValue Value
UnrealizedAppreciation
Credit Risk
GoldmanSachsInternational
Put 108.00%
MarkitCDXNorth
AmericaHighYieldIndex,Series
36,Version 1
5.00% Quarterly 09/15/2021 2.770% $(411,119) USD (63,249,000) $(46,101) $365,018
(a) Over-The-Counter swaptions written are collateralized by cash held with Counterparties in the amount of $360,000.(b) Implied credit spreads represent the current level, as of August 31, 2021, at which protection could be bought or sold given the terms of the existing
credit default swap agreement and serve as an indicator of the current status of the payment/performance risk of the credit default swap agreement.An implied credit spread that has widened or increased since entry into the initial agreement may indicate a deteriorating credit profile and increasedrisk of default for the reference entity. A declining or narrowing spread may indicate an improving credit profile or decreased risk of default for thereference entity. Alternatively, credit spreads may increase or decrease reflecting the general tolerance for risk in the credit markets generally.
Open Futures Contracts
Long Futures Contracts Number ofContracts
ExpirationMonth
NotionalValue Value
UnrealizedAppreciation
(Depreciation)
Interest Rate Risk
U.S. Treasury 2 Year Notes 1,913 December-2021 $ 421,487,705 $ 283,962 $ 283,962
U.S. Treasury 5 Year Notes 2,020 December-2021 249,911,875 316,192 316,192
U.S. Treasury 10 Year Notes 833 December-2021 111,166,453 31,281 31,281
U.S. Treasury Long Bonds 104 December-2021 16,948,750 (53,625) (53,625)
Subtotal-Long Futures Contracts 577,810 577,810
See accompanying Notes to Financial Statements which are an integral part of the financial statements.
21 Invesco Corporate Bond Fund
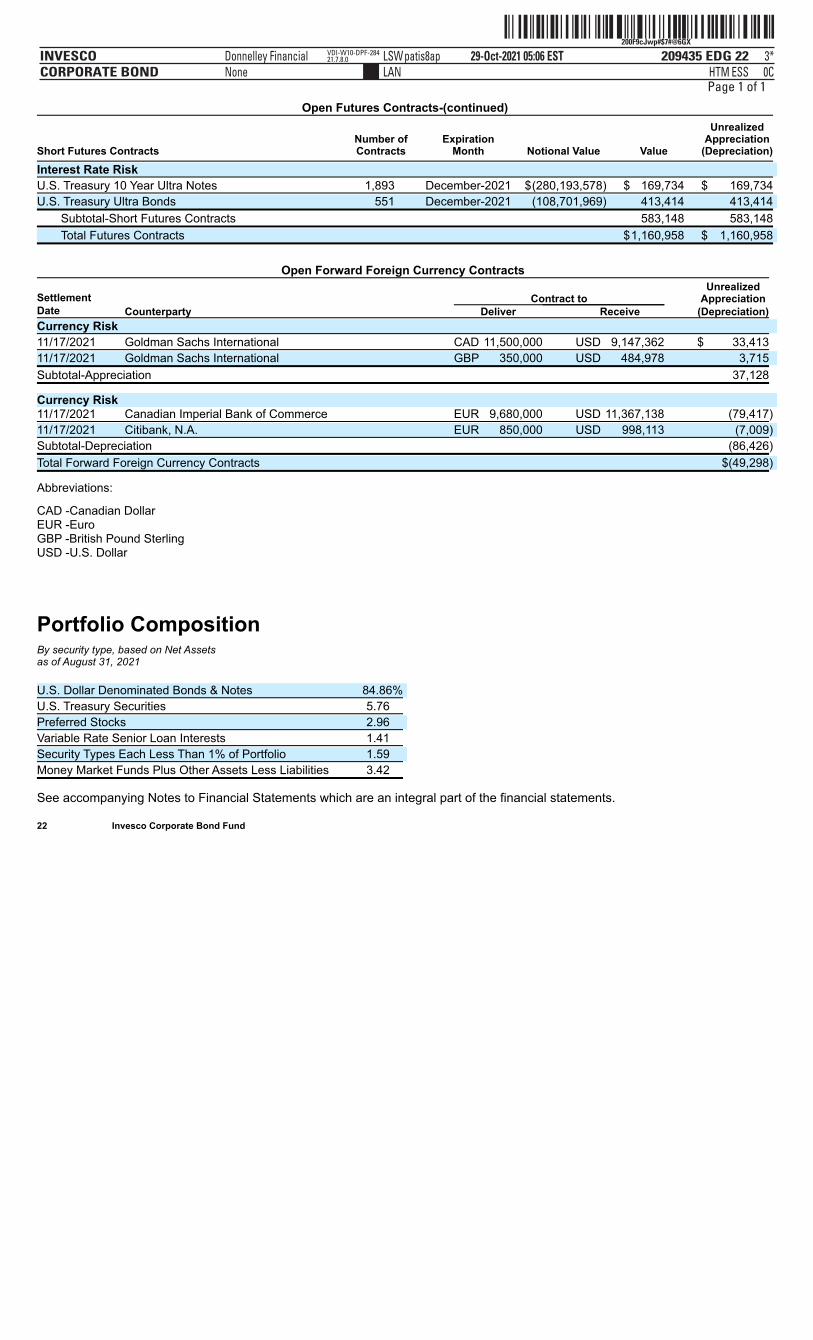
ˆ200F9cJwp#$7#@6GXŠ200F9cJwp#$7#@6GX
209435 EDG 22INVESCOCORPORATE BOND
29-Oct-2021 05:06 ESTHTMLAN
Donnelley Financial LSWpatis8apNone
3*ESS 0C
VDI-W10-DPF-28421.7.8.0
Page 1 of 1Open Futures Contracts-(continued)
Short Futures Contracts Number ofContracts
ExpirationMonth Notional Value Value
UnrealizedAppreciation
(Depreciation)
Interest Rate Risk
U.S. Treasury 10 Year Ultra Notes 1,893 December-2021 $(280,193,578) $ 169,734 $ 169,734
U.S. Treasury Ultra Bonds 551 December-2021 (108,701,969) 413,414 413,414
Subtotal-Short Futures Contracts 583,148 583,148
Total Futures Contracts $1,160,958 $ 1,160,958
Open Forward Foreign Currency Contracts
Settlement
Contract to
UnrealizedAppreciation
Date Counterparty Deliver Receive (Depreciation)
Currency Risk
11/17/2021 Goldman Sachs International CAD 11,500,000 USD 9,147,362 $ 33,413
11/17/2021 Goldman Sachs International GBP 350,000 USD 484,978 3,715
Subtotal-Appreciation 37,128
Currency Risk 11/17/2021 Canadian Imperial Bank of Commerce EUR 9,680,000 USD 11,367,138 (79,417)
11/17/2021 Citibank, N.A. EUR 850,000 USD 998,113 (7,009)
Subtotal-Depreciation (86,426)
Total Forward Foreign Currency Contracts $(49,298)
Abbreviations:
CAD -Canadian DollarEUR -EuroGBP -British Pound SterlingUSD -U.S. Dollar
Portfolio CompositionBy security type, based on Net Assetsas of August 31, 2021 U.S. Dollar Denominated Bonds & Notes 84.86%
U.S. Treasury Securities 5.76
Preferred Stocks 2.96
Variable Rate Senior Loan Interests 1.41
Security Types Each Less Than 1% of Portfolio 1.59
Money Market Funds Plus Other Assets Less Liabilities 3.42
See accompanying Notes to Financial Statements which are an integral part of the financial statements.
22 Invesco Corporate Bond Fund
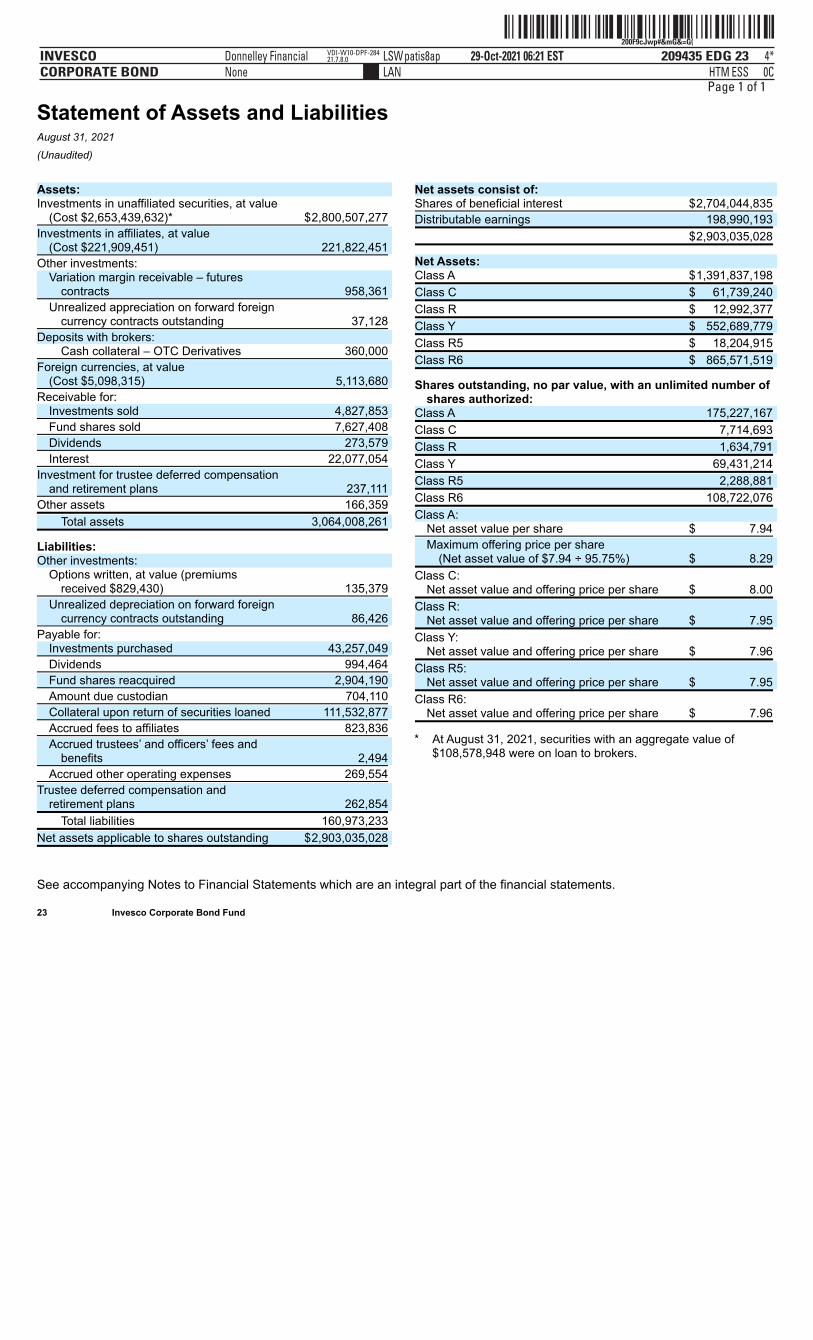
ˆ200F9cJwp#&mG&=G(Š200F9cJwp#&mG&=G(
209435 EDG 23INVESCOCORPORATE BOND
29-Oct-2021 06:21 ESTHTMLAN
Donnelley Financial LSWpatis8apNone
4*ESS 0C
VDI-W10-DPF-28421.7.8.0
Page 1 of 1
Statement of Assets and LiabilitiesAugust 31, 2021
(Unaudited)
See accompanying Notes to Financial Statements which are an integral part of the financial statements.
23 Invesco Corporate Bond Fund
Assets: Investments in unaffiliated securities, at value
(Cost $2,653,439,632)* $2,800,507,277
Investments in affiliates, at value(Cost $221,909,451) 221,822,451
Other investments: Variation margin receivable – futures
contracts 958,361
Unrealized appreciation on forward foreigncurrency contracts outstanding 37,128
Deposits with brokers: Cash collateral – OTC Derivatives 360,000
Foreign currencies, at value(Cost $5,098,315) 5,113,680
Receivable for: Investments sold 4,827,853
Fund shares sold 7,627,408
Dividends 273,579
Interest 22,077,054
Investment for trustee deferred compensationand retirement plans 237,111
Other assets 166,359
Total assets 3,064,008,261
Liabilities: Other investments:
Options written, at value (premiumsreceived $829,430) 135,379
Unrealized depreciation on forward foreigncurrency contracts outstanding 86,426
Payable for: Investments purchased 43,257,049
Dividends 994,464
Fund shares reacquired 2,904,190
Amount due custodian 704,110
Collateral upon return of securities loaned 111,532,877
Accrued fees to affiliates 823,836
Accrued trustees’ and officers’ fees andbenefits 2,494
Accrued other operating expenses 269,554
Trustee deferred compensation andretirement plans 262,854
Total liabilities 160,973,233
Net assets applicable to shares outstanding $2,903,035,028
Net assets consist of: Shares of beneficial interest $2,704,044,835
Distributable earnings 198,990,193
$2,903,035,028
Net Assets: Class A $1,391,837,198
Class C $ 61,739,240
Class R $ 12,992,377
Class Y $ 552,689,779
Class R5 $ 18,204,915
Class R6 $ 865,571,519
Shares outstanding, no par value, with an unlimited number ofshares authorized:
Class A 175,227,167
Class C 7,714,693
Class R 1,634,791
Class Y 69,431,214
Class R5 2,288,881
Class R6 108,722,076
Class A: Net asset value per share $ 7.94
Maximum offering price per share(Net asset value of $7.94 ÷ 95.75%) $ 8.29
Class C:Net asset value and offering price per share $ 8.00
Class R:Net asset value and offering price per share $ 7.95
Class Y:Net asset value and offering price per share $ 7.96
Class R5:Net asset value and offering price per share $ 7.95
Class R6:Net asset value and offering price per share $ 7.96
* At August 31, 2021, securities with an aggregate value of$108,578,948 were on loan to brokers.
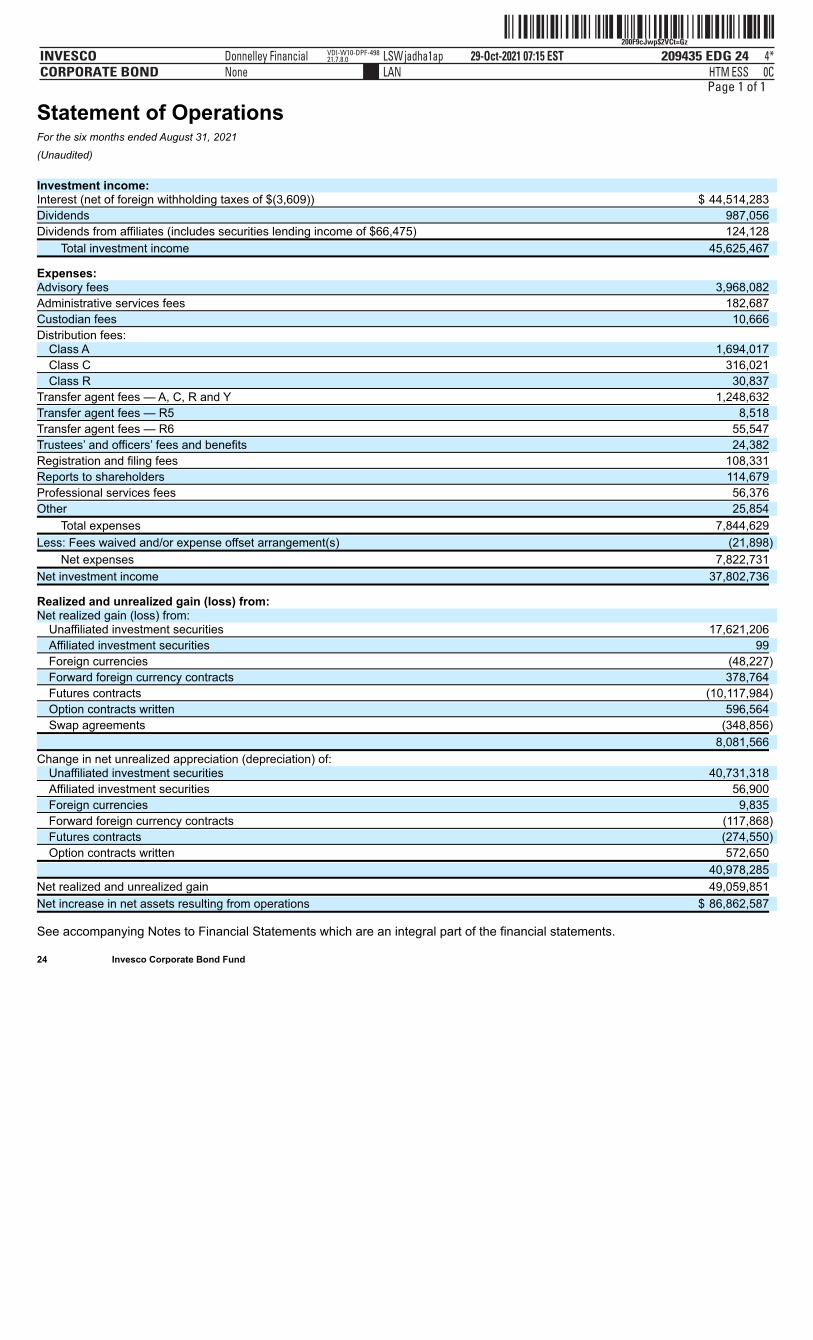
ˆ200F9cJwp$2VCt=GzŠ200F9cJwp$2VCt=Gz
209435 EDG 24INVESCOCORPORATE BOND
29-Oct-2021 07:15 ESTHTMLAN
Donnelley Financial LSWjadha1apNone
4*ESS 0C
VDI-W10-DPF-49821.7.8.0
Page 1 of 1
Statement of OperationsFor the six months ended August 31, 2021
(Unaudited) Investment income: Interest (net of foreign withholding taxes of $(3,609)) $ 44,514,283
Dividends 987,056
Dividends from affiliates (includes securities lending income of $66,475) 124,128
Total investment income 45,625,467
Expenses: Advisory fees 3,968,082
Administrative services fees 182,687
Custodian fees 10,666
Distribution fees: Class A 1,694,017
Class C 316,021
Class R 30,837
Transfer agent fees — A, C, R and Y 1,248,632
Transfer agent fees — R5 8,518
Transfer agent fees — R6 55,547
Trustees’ and officers’ fees and benefits 24,382
Registration and filing fees 108,331
Reports to shareholders 114,679
Professional services fees 56,376
Other 25,854
Total expenses 7,844,629
Less: Fees waived and/or expense offset arrangement(s) (21,898)
Net expenses 7,822,731
Net investment income 37,802,736
Realized and unrealized gain (loss) from: Net realized gain (loss) from:
Unaffiliated investment securities 17,621,206
Affiliated investment securities 99
Foreign currencies (48,227)
Forward foreign currency contracts 378,764
Futures contracts (10,117,984)
Option contracts written 596,564
Swap agreements (348,856)
8,081,566
Change in net unrealized appreciation (depreciation) of: Unaffiliated investment securities 40,731,318
Affiliated investment securities 56,900
Foreign currencies 9,835
Forward foreign currency contracts (117,868)
Futures contracts (274,550)
Option contracts written 572,650
40,978,285
Net realized and unrealized gain 49,059,851
Net increase in net assets resulting from operations $ 86,862,587
See accompanying Notes to Financial Statements which are an integral part of the financial statements.
24 Invesco Corporate Bond Fund
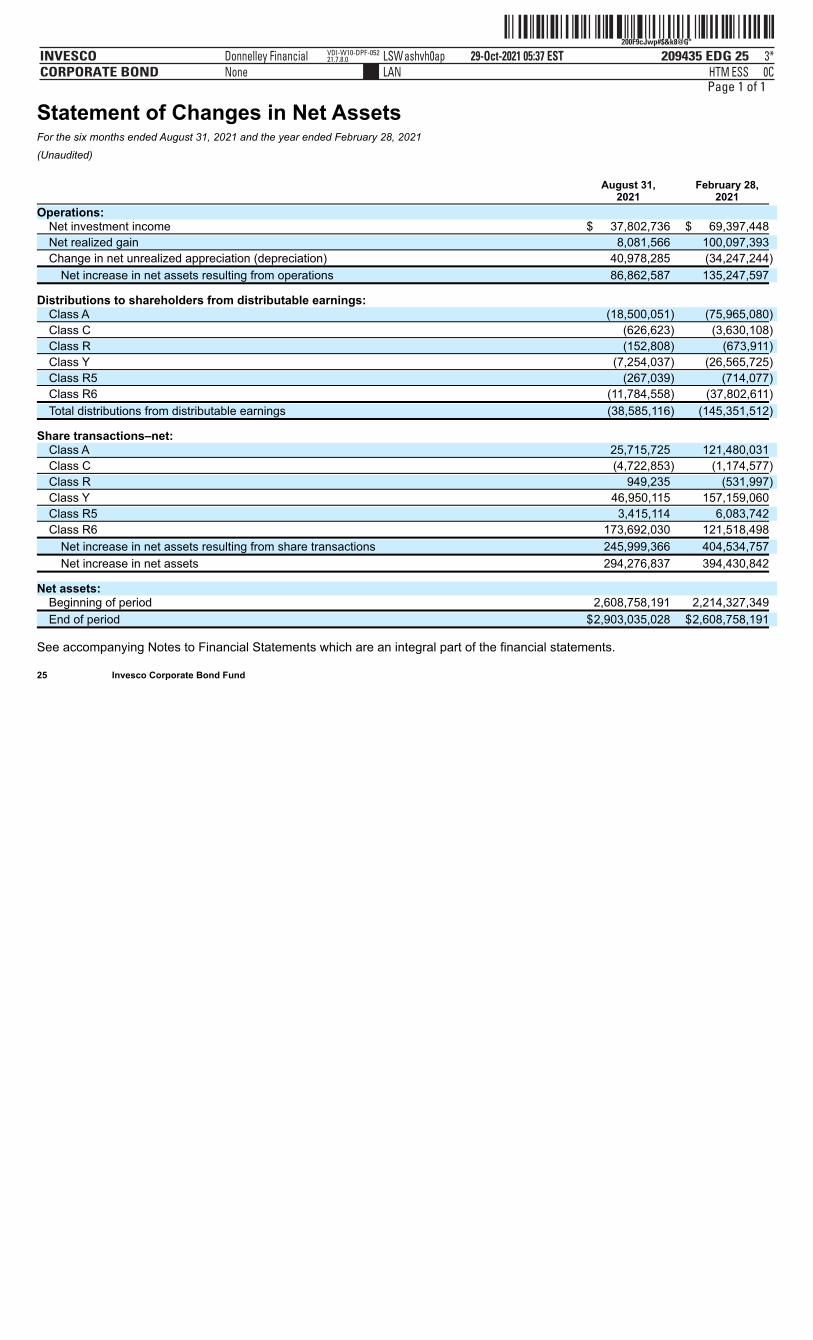
ˆ200F9cJwp#$&k8@G"Š200F9cJwp#$&k8@G"
209435 EDG 25INVESCOCORPORATE BOND
29-Oct-2021 05:37 ESTHTMLAN
Donnelley Financial LSWashvh0apNone
3*ESS 0C
VDI-W10-DPF-05221.7.8.0
Page 1 of 1
Statement of Changes in Net AssetsFor the six months ended August 31, 2021 and the year ended February 28, 2021
(Unaudited)
August 31,
2021 February 28,
2021
Operations: Net investment income $ 37,802,736 $ 69,397,448
Net realized gain 8,081,566 100,097,393
Change in net unrealized appreciation (depreciation) 40,978,285 (34,247,244)
Net increase in net assets resulting from operations 86,862,587 135,247,597
Distributions to shareholders from distributable earnings: Class A (18,500,051) (75,965,080)
Class C (626,623) (3,630,108)
Class R (152,808) (673,911)
Class Y (7,254,037) (26,565,725)
Class R5 (267,039) (714,077)
Class R6 (11,784,558) (37,802,611)
Total distributions from distributable earnings (38,585,116) (145,351,512)
Share transactions–net: Class A 25,715,725 121,480,031
Class C (4,722,853) (1,174,577)
Class R 949,235 (531,997)
Class Y 46,950,115 157,159,060
Class R5 3,415,114 6,083,742
Class R6 173,692,030 121,518,498
Net increase in net assets resulting from share transactions 245,999,366 404,534,757
Net increase in net assets 294,276,837 394,430,842
Net assets: Beginning of period 2,608,758,191 2,214,327,349
End of period $2,903,035,028 $2,608,758,191
See accompanying Notes to Financial Statements which are an integral part of the financial statements.
25 Invesco Corporate Bond Fund

ˆ200F9cJwp$2kLcLGBŠ200F9cJwp$2kLcLGB
209435 EDG 26INVESCOCORPORATE BOND
29-Oct-2021 07:21 ESTHTMLAN
Donnelley Financial LSWjadha1apNone
5*ESS 0C
VDI-W10-DPF-49821.7.8.0
Page 1 of 1Financial Highlights(Unaudited)
The following schedule presents financial highlights for a share of the Fund outstanding throughout the periods indicated.
Net assetvalue,
beginningof period
Netinvestmentincome(a)
Net gains(losses)
on securities(both
realized andunrealized)
Total frominvestmentoperations
Dividendsfrom net
investmentincome
Distributionsfrom netrealized
gains Total
distributions
Net assetvalue, endof period
Totalreturn (b)
Net assets,end of period
(000’s omitted)
Ratio ofexpensesto averagenet assets
with fee waiversand/or
expensesabsorbed
Ratio ofexpenses
to average netassets without
fee waiversand/or
expensesabsorbed
Ratio of netinvestment
incometo averagenet assets
Portfolioturnover (c)
Class A Six months ended 08/31/21 $7.80 $0.11 $ 0.14 $0.25 $ (0.11) $ – $ (0.11) $7.94 3.20% $1,391,837 0.71%(d) 0.71%(d) 2.67%(d) 72%Year ended 02/28/21 7.80 0.22 0.25 0.47 (0.24) (0.23) (0.47) 7.80 6.14 1,342,071 0.74 0.74 2.87 182Year ended 02/29/20 7.02 0.25 0.80 1.05 (0.27) – (0.27) 7.80 15.20 1,224,248 0.80 0.80 3.30 192Year ended 02/28/19 7.20 0.28 (0.17) 0.11 (0.29) (0.00) (0.29) 7.02 1.65 968,160 0.83 0.83 4.00 145Year ended 02/28/18 7.31 0.26 (0.06) 0.20 (0.27) (0.04) (0.31) 7.20 2.68 1,001,173 0.85 0.85 3.58 180Year ended 02/28/17 6.89 0.26 0.42 0.68 (0.26) – (0.26) 7.31 9.97 948,305 0.90 0.90 3.60 212Class C Six months ended 08/31/21 7.86 0.08 0.14 0.22 (0.08) – (0.08) 8.00 2.80 61,739 1.46(d) 1.46(d) 1.92(d) 72Year ended 02/28/21 7.87 0.17 0.24 0.41 (0.19) (0.23) (0.42) 7.86 5.23 65,404 1.49 1.49 2.12 182Year ended 02/29/20 7.08 0.19 0.82 1.01 (0.22) – (0.22) 7.87 14.43 66,662 1.55 1.55 2.55 192Year ended 02/28/19 7.26 0.23 (0.17) 0.06 (0.24) (0.00) (0.24) 7.08 0.91(e) 37,280 1.53(e) 1.53(e) 3.30(e) 145Year ended 02/28/18 7.36 0.21 (0.06) 0.15 (0.21) (0.04) (0.25) 7.26 2.07(e) 82,939 1.58(e) 1.58(e) 2.85(e) 180Year ended 02/28/17 6.92 0.21 0.42 0.63 (0.19) – (0.19) 7.36 9.17 85,127 1.65 1.65 2.85 212Class R Six months ended 08/31/21 7.81 0.10 0.14 0.24 (0.10) – (0.10) 7.95 3.07 12,992 0.96(d) 0.96(d) 2.42(d) 72Year ended 02/28/21 7.81 0.20 0.25 0.45 (0.22) (0.23) (0.45) 7.81 5.87 11,819 0.99 0.99 2.62 182Year ended 02/29/20 7.02 0.23 0.81 1.04 (0.25) – (0.25) 7.81 15.06 12,435 1.05 1.05 3.05 192Year ended 02/28/19 7.21 0.26 (0.17) 0.09 (0.28) (0.00) (0.28) 7.02 1.30 6,889 1.08 1.08 3.75 145Year ended 02/28/18 7.31 0.25 (0.06) 0.19 (0.25) (0.04) (0.29) 7.21 2.57 7,196 1.10 1.10 3.33 180Year ended 02/28/17 6.89 0.24 0.42 0.66 (0.24) – (0.24) 7.31 9.70 6,742 1.15 1.15 3.35 212Class Y Six months ended 08/31/21 7.82 0.12 0.14 0.26 (0.12) – (0.12) 7.96 3.32 552,690 0.46(d) 0.46(d) 2.92(d) 72Year ended 02/28/21 7.82 0.24 0.25 0.49 (0.26) (0.23) (0.49) 7.82 6.40 497,643 0.49 0.49 3.12 182Year ended 02/29/20 7.03 0.27 0.81 1.08 (0.29) – (0.29) 7.82 15.62 343,580 0.55 0.55 3.55 192Year ended 02/28/19 7.22 0.30 (0.18) 0.12 (0.31) (0.00) (0.31) 7.03 1.76 86,657 0.58 0.58 4.25 145Year ended 02/28/18 7.32 0.28 (0.05) 0.23 (0.29) (0.04) (0.33) 7.22 3.08 87,895 0.60 0.60 3.83 180Year ended 02/28/17 6.90 0.28 0.42 0.70 (0.28) – (0.28) 7.32 10.23 235,464 0.65 0.65 3.85 212Class R5 Six months ended 08/31/21 7.81 0.12 0.14 0.26 (0.12) – (0.12) 7.95 3.35 18,205 0.43(d) 0.43(d) 2.95(d) 72Year ended 02/28/21 7.81 0.25 0.24 0.49 (0.26) (0.23) (0.49) 7.81 6.45 14,418 0.44 0.44 3.17 182Year ended 02/29/20 7.03 0.27 0.80 1.07 (0.29) – (0.29) 7.81 15.55 8,537 0.49 0.49 3.61 192Year ended 02/28/19 7.21 0.30 (0.17) 0.13 (0.31) (0.00) (0.31) 7.03 2.00 6,841 0.49 0.49 4.34 145Year ended 02/28/18 7.31 0.29 (0.06) 0.23 (0.29) (0.04) (0.33) 7.21 3.16 3,829 0.53 0.53 3.90 180Year ended 02/28/17 6.89 0.29 0.42 0.71 (0.29) – (0.29) 7.31 10.34 5,222 0.56 0.56 3.94 212Class R6 Six months ended 08/31/21 7.82 0.12 0.14 0.26 (0.12) – (0.12) 7.96 3.39 865,572 0.35(d) 0.35(d) 3.03(d) 72Year ended 02/28/21 7.82 0.25 0.25 0.50 (0.27) (0.23) (0.50) 7.82 6.54 677,403 0.36 0.36 3.25 182Year ended 02/29/20 7.04 0.28 0.80 1.08 (0.30) – (0.30) 7.82 15.62 558,866 0.41 0.41 3.69 192Year ended 02/28/19 7.22 0.31 (0.17) 0.14 (0.32) (0.00) (0.32) 7.04 2.01 388,221 0.43 0.43 4.40 145Year ended 02/28/18 7.32 0.30 (0.06) 0.24 (0.30) (0.04) (0.34) 7.22 3.25 413,844 0.44 0.44 3.99 180Year ended 02/28/17 6.90 0.29 0.42 0.71 (0.29) – (0.29) 7.32 10.43 29,232 0.47 0.47 4.03 212
(a) Calculated using average shares outstanding.(b) Includes adjustments in accordance with accounting principles generally accepted in the United States of America and as such, the net asset value for financial reporting purposes and the returns based upon those net asset values may differ from the net asset value and returns for shareholder
transactions. Does not include sales charges and is not annualized for periods less than one year, if applicable.(c) Portfolio turnover is calculated at the fund level and is not annualized for periods less than one year, if applicable.(d) Annualized.(e) The total return, ratio of expenses to average net assets and ratio of net investment income (loss) to average net assets reflect actual 12b-1 fees of 0.95% and 0.98% for the years ended February 28, 2019 and 2018, respectively.
See accompanying Notes to Financial Statements which are an integral part of the financial statements.
26 Invesco Corporate Bond Fund
ˆ200F9cJwp$04Bf#o*Š200F9cJwp$04Bf#o*
209435 EDG 27INVESCOCORPORATE BOND
29-Oct-2021 06:27 ESTHTMLAN
Donnelley Financial LSWpatis8apNone
3*ESS 0C
VDI-W10-DPF-28421.7.8.0
Page 1 of 2
Notes to Financial StatementsAugust 31, 2021(Unaudited)
NOTE 1–Significant Accounting Policies
Invesco Corporate Bond Fund (the “Fund”), is a series portfolio of AIM Investment Securities Funds (Invesco Investment Securities Funds)(the “Trust”). The Trust is organized as a Delaware statutory trust and is registered under the Investment Company Act of 1940, asamended (the “1940 Act”), as an open-end series management investment company authorized to issue an unlimited number of shares ofbeneficial interest. Information presented in these financial statements pertains only to the Fund. Matters affecting the Fund or each classwill be voted on exclusively by the shareholders of the Fund or each class.
The Fund’s primary investment objective is to seek to provide current income with preservation of capital. Capital appreciation is asecondary objective that is sought only when consistent with the Fund’s primary investment objective.
The Fund currently consists of six different classes of shares: Class A, Class C, Class R, Class Y, Class R5 and Class R6. Class Yshares are available only to certain investors. Class A shares are sold with a front-end sales charge unless certain waiver criteria are met.Under certain circumstances, load waived shares may be subject to contingent deferred sales charges (“CDSC”). Class C shares are soldwith a CDSC. Class R, Class Y, Class R5 and Class R6 shares are sold at net asset value. Class C shares held for eight years afterpurchase are eligible for automatic conversion into Class A shares of the same Fund (the “Conversion Feature”). The automatic conversionpursuant to the Conversion Feature will generally occur at the end of the month following the eighth anniversary after a purchase of Class Cshares.
The Fund is an investment company and accordingly follows the investment company accounting and reporting guidance in accordancewith Financial Accounting Standards Board Accounting Standards Codification Topic 946, Financial Services – Investment Companies.
The following is a summary of the significant accounting policies followed by the Fund in the preparation of its financial statements.A. Security Valuations – Securities, including restricted securities, are valued according to the following policy.
Debt obligations (including convertible securities) and unlisted equities are fair valued using an evaluated quote provided by anindependent pricing service. Evaluated quotes provided by the pricing service may be determined without exclusive reliance on quotedprices, and may reflect appropriate factors such as institution-size trading in similar groups of securities, developments related tospecific securities, dividend rate (for unlisted equities), yield (for debt obligations), quality, type of issue, coupon rate (for debtobligations), maturity (for debt obligations), individual trading characteristics and other market data. Pricing services generally valuedebt obligations assuming orderly transactions of institutional round lot size, but a fund may hold or transact in the same securities insmaller, odd lot sizes. Odd lots often trade at lower prices than institutional round lots. Debt obligations are subject to interest rate andcredit risks. In addition, all debt obligations involve some risk of default with respect to interest and/or principal payments.
Variable rate senior loan interests are fair valued using quotes provided by an independent pricing service. Quotes provided by thepricing service may reflect appropriate factors such as ratings, tranche type, industry, company performance, spread, individual tradingcharacteristics, institution-size trading in similar groups of securities and other market data.
A security listed or traded on an exchange (except convertible securities) is valued at its last sales price or official closing price as ofthe close of the customary trading session on the exchange where the security is principally traded, or lacking any sales or officialclosing price on a particular day, the security may be valued at the closing bid price on that day. Securities traded in theover-the-counter market are valued based on prices furnished by independent pricing services or market makers. When such securitiesare valued by an independent pricing service they may be considered fair valued. Futures contracts are valued at the final settlementprice set by an exchange on which they are principally traded. Listed options are valued at the mean between the last bid and askedprices from the exchange on which they are principally traded. Options not listed on an exchange are valued by an independent sourceat the mean between the last bid and asked prices. For purposes of determining net asset value (“NAV”) per share, futures and optioncontracts generally are valued 15 minutes after the close of the customary trading session of the New York Stock Exchange (“NYSE”).
Investments in open-end and closed-end registered investment companies that do not trade on an exchange are valued at theend-of-day net asset value per share. Investments in open-end and closed-end registered investment companies that trade on anexchange are valued at the last sales price or official closing price as of the close of the customary trading session on the exchangewhere the security is principally traded.
Swap agreements are fair valued using an evaluated quote, if available, provided by an independent pricing service. Evaluatedquotes provided by the pricing service are valued based on a model which may include end-of-day net present values, spreads, ratings,industry, company performance and returns of referenced assets. Centrally cleared swap agreements are valued at the daily settlementprice determined by the relevant exchange or clearinghouse.
Foreign securities’ (including foreign exchange contracts) prices are converted into U.S. dollar amounts using the applicableexchange rates as of the close of the NYSE. If market quotations are available and reliable for foreign exchange-traded equitysecurities, the securities will be valued at the market quotations. Because trading hours for certain foreign securities end before theclose of the NYSE, closing market quotations may become unreliable. If between the time trading ends on a particular security and theclose of the customary trading session on the NYSE, events occur that the investment adviser determines are significant and make theclosing price unreliable, the Fund may fair value the security. If the event is likely to have affected the closing price of the security, thesecurity will be valued at fair value in good faith using procedures approved by the Board of Trustees. Adjustments to closing prices toreflect fair value may also be based on a screening process of an independent pricing service to indicate the degree of certainty, basedon historical data, that the closing price in the principal market where a foreign security trades is not the current value as of the close ofthe NYSE. Foreign securities’ prices meeting the approved degree of certainty that the price is not reflective of current value will bepriced at the indication of fair value from the independent pricing service. Multiple factors may be considered by the independent pricingservice in determining adjustments to reflect fair value and may include information relating to sector indices, American DepositaryReceipts and domestic and foreign index futures. Foreign securities may have additional risks including exchange rate changes,potential for sharply devalued currencies and high inflation, political and economic upheaval, the relative lack of issuer information,relatively low market liquidity and the potential lack of strict financial and accounting controls and standards.
Securities for which market prices are not provided by any of the above methods may be valued based upon quotes furnished byindependent sources. The last bid price may be used to value equity securities. The mean between the last bid and asked prices isused to value debt obligations, including corporate loans.
Securities for which market quotations are not readily available or became unreliable are valued at fair value as determined in goodfaith by or under the supervision of the Trust’s officers following procedures approved by the Board of Trustees. Issuer specific events,market trends, bid/asked quotes of brokers and information providers and other market data may be reviewed in the course of making agood faith determination of a security’s fair value.
The Fund may invest in securities that are subject to interest rate risk, meaning the risk that the prices will generally fall as interestrates rise and, conversely, the prices will generally rise as interest rates fall. Specific securities differ in their sensitivity to changes ininterest rates depending on their individual characteristics. Changes in interest rates may result in increased market volatility, whichmay affect the value and/or liquidity of certain Fund investments.
Valuations change in response to many factors including the historical and prospective earnings of the issuer, the value of theissuer’s assets, general market conditions which are not specifically related to the particular issuer, such as real or perceived adverseeconomic conditions, changes in the general outlook for revenues or corporate earnings, changes in interest or currency rates, regionalor global instability, natural or environmental disasters, widespread disease or other public health issues, war, acts of terrorism oradverse investor sentiment generally and market liquidity. Because of the inherent uncertainties of valuation, the values reflected in thefinancial statements may materially differ from the value received upon actual sale of those investments.
B. Securities Transactions and Investment Income – Securities transactions are accounted for on a trade date basis. Realized gains orlosses on sales are

ˆ200F9cJwp$04Bf#o*Š200F9cJwp$04Bf#o*
209435 EDG 27INVESCOCORPORATE BOND
29-Oct-2021 06:27 ESTHTMLAN
Donnelley Financial LSWpatis8apNone
3*ESS 0C
VDI-W10-DPF-28421.7.8.0
ˆ200F9cJwp$04Bf#o*Š200F9cJwp$04Bf#o*
209435 EDG 27INVESCOCORPORATE BOND
29-Oct-2021 06:27 ESTHTMLAN
Donnelley Financial LSWpatis8apNone
3*ESS 0C
VDI-W10-DPF-28421.7.8.0
Page 2 of 2 27 Invesco Corporate Bond Fund
ˆ200F9cJwp#$m=PMGbŠ200F9cJwp#$m=PMGb
209435 EDG 28INVESCOCORPORATE BOND
29-Oct-2021 05:25 ESTHTMLAN
Donnelley Financial LSWpatis8apNone
3*ESS 0C
VDI-W10-DPF-28421.7.8.0
Page 1 of 1
computed on the basis of specific identification of the securities sold. Interest income (net of withholding tax, if any) is recorded on anaccrual basis from settlement date and includes coupon interest and amortization of premium and accretion of discount on debtsecurities as applicable. Pay-in-kind interest income and non-cash dividend income received in the form of securities in-lieu of cash arerecorded at the fair value of the securities received. Paydown gains and losses on mortgage and asset-backed securities are recordedas adjustments to interest income. Dividend income (net of withholding tax, if any) is recorded on the ex-dividend date.
The Fund may periodically participate in litigation related to Fund investments. As such, the Fund may receive proceeds fromlitigation settlements. Any proceeds received are included in the Statement of Operations as realized gain (loss) for investments nolonger held and as unrealized gain (loss) for investments still held.
Brokerage commissions and mark ups are considered transaction costs and are recorded as an increase to the cost basis ofsecurities purchased and/or a reduction of proceeds on a sale of securities. Such transaction costs are included in the determination ofnet realized and unrealized gain (loss) from investment securities reported in the Statement of Operations and the Statement ofChanges in Net Assets and the net realized and unrealized gains (losses) on securities per share in the Financial Highlights.Transaction costs are included in the calculation of the Fund’s net asset value and, accordingly, they reduce the Fund’s total returns.These transaction costs are not considered operating expenses and are not reflected in net investment income reported in theStatement of Operations and the Statement of Changes in Net Assets, or the net investment income per share and the ratios ofexpenses and net investment income reported in the Financial Highlights, nor are they limited by any expense limitation arrangementsbetween the Fund and the investment adviser.
The Fund allocates realized and unrealized capital gains and losses to a class based on the relative net assets of each class. TheFund allocates income to a class based on the relative value of the settled shares of each class.
C. Country Determination – For the purposes of making investment selection decisions and presentation in the Schedule of Investments,the investment adviser may determine the country in which an issuer is located and/or credit risk exposure based on various factors.These factors include the laws of the country under which the issuer is organized, where the issuer maintains a principal office, thecountry in which the issuer derives 50% or more of its total revenues and the country that has the primary market for the issuer’ssecurities, as well as other criteria. Among the other criteria that may be evaluated for making this determination are the country inwhich the issuer maintains 50% or more of its assets, the type of security, financial guarantees and enhancements, the nature of thecollateral and the sponsor organization. Country of issuer and/or credit risk exposure has been determined to be the United States ofAmerica, unless otherwise noted.
D. Distributions – Distributions from net investment income, if any, are declared daily and paid monthly. Distributions from net realizedcapital gain, if any, are generally declared and paid annually and recorded on the ex-dividend date. The Fund may elect to treat aportion of the proceeds from redemptions as distributions for federal income tax purposes.
E. Federal Income Taxes – The Fund intends to comply with the requirements of Subchapter M of the Internal Revenue Code of 1986, asamended (the “Internal Revenue Code”), necessary to qualify as a regulated investment company and to distribute substantially all ofthe Fund’s taxable earnings to shareholders. As such, the Fund will not be subject to federal income taxes on otherwise taxable income(including net realized capital gain) that is distributed to shareholders. Therefore, no provision for federal income taxes is recorded inthe financial statements.
The Fund recognizes the tax benefits of uncertain tax positions only when the position is more likely than not to be sustained.Management has analyzed the Fund’s uncertain tax positions and concluded that no liability for unrecognized tax benefits should berecorded related to uncertain tax positions. Management is not aware of any tax positions for which it is reasonably possible that thetotal amounts of unrecognized tax benefits will change materially in the next 12 months.
The Fund files tax returns in the U.S. Federal jurisdiction and certain other jurisdictions. Generally, the Fund is subject toexaminations by such taxing authorities for up to three years after the filing of the return for the tax period.
F. Expenses – Fees provided for under the Rule 12b-1 plan of a particular class of the Fund are charged to the operations of such class.Transfer agency fees and expenses and other shareholder recordkeeping fees and expenses attributable to Class R5 and Class R6 areallocated based on relative net assets of Class R5 and Class R6. Sub-accounting fees attributable to Class R5 are charged to theoperations of the class. Transfer agency fees and expenses and other shareholder recordkeeping fees and expenses relating to allother classes are allocated among those classes based on relative net assets. All other expenses are allocated among the classesbased on relative net assets.
G. Accounting Estimates – The preparation of financial statements in conformity with accounting principles generally accepted in theUnited States of America (“GAAP”) requires management to make estimates and assumptions that affect the reported amounts ofassets and liabilities at the date of the financial statements and the reported amounts of revenues and expenses during the reportingperiod including estimates and assumptions related to taxation. Actual results could differ from those estimates by a significant amount.In addition, the Fund monitors for material events or transactions that may occur or become known after the period-end date and beforethe date the financial statements are released to print.
H. Indemnifications – Under the Trust’s organizational documents, each Trustee, officer, employee or other agent of the Trust isindemnified against certain liabilities that may arise out of the performance of their duties to the Fund. Additionally, in the normal courseof business, the Fund enters into contracts, including the Fund’s servicing agreements, that contain a variety of indemnification clauses.The Fund’s maximum exposure under these arrangements is unknown as this would involve future claims that may be made againstthe Fund that have not yet occurred. The risk of material loss as a result of such indemnification claims is considered remote.
I. Securities Lending – The Fund may lend portfolio securities having a market value up to one-third of the Fund’s total assets. Suchloans are secured by collateral equal to no less than the market value of the loaned securities determined daily by the securities lendingprovider. Such collateral will be cash or debt securities issued or guaranteed by the U.S. Government or any of its sponsored agencies.Cash collateral received in connection with these loans is invested in short-term money market instruments or affiliated money marketfunds and is shown as such on the Schedule of Investments. The Fund bears the risk of loss with respect to the investment ofcollateral. It is the Fund’s policy to obtain additional collateral from or return excess collateral to the borrower by the end of the nextbusiness day, following the valuation date of the securities loaned. Therefore, the value of the collateral held may be temporarily lessthan the value of the securities on loan. When loaning securities, the Fund retains certain benefits of owning the securities, includingthe economic equivalent of dividends or interest generated by the security. Lending securities entails a risk of loss to the Fund if, and tothe extent that, the market value of the securities loaned were to increase and the borrower did not increase the collateral accordingly,and the borrower failed to return the securities. The securities loaned are subject to termination at the option of the borrower or theFund. Upon termination, the borrower will return to the Fund the securities loaned and the Fund will return the collateral. Upon thefailure of the borrower to return the securities, collateral may be liquidated and the securities may be purchased on the open market toreplace the loaned securities. The Fund could experience delays and costs in gaining access to the collateral and the securities maylose value during the delay which could result in potential losses to the Fund. Some of these losses may be indemnified by the lendingagent. The Fund bears the risk of any deficiency in the amount of the collateral available for return to the borrower due to any loss onthe collateral invested. Dividends received on cash collateral investments for securities lending transactions, which are net ofcompensation to counterparties, are included in Dividends from affiliates on the Statement of Operations. The aggregate value ofsecurities out on loan, if any, is shown as a footnote on the Statement of Assets and Liabilities.
J. Foreign Currency Translations – Foreign currency is valued at the close of the NYSE based on quotations posted by banks andmajor currency dealers. Portfolio securities and other assets and liabilities denominated in foreign currencies are translated into U.S.dollar amounts at the date of valuation. Purchases and sales of portfolio securities (net of foreign taxes withheld on disposition) andincome items denominated in foreign currencies are translated into U.S. dollar amounts on the respective dates of such transactions.The Fund does not separately account for the portion of the results of operations resulting from changes in foreign exchange rates oninvestments and the fluctuations arising from changes in market prices of securities held. The combined results of changes in foreign
28 Invesco Corporate Bond Fund
ˆ200F9cJwp#$mf3aoÀŠ200F9cJwp#$mf3ao
209435 EDG 29INVESCOCORPORATE BOND
29-Oct-2021 05:25 ESTHTMLAN
Donnelley Financial LSWpatis8apNone
4*ESS 0C
VDI-W10-DPF-28421.7.8.0
Page 1 of 2exchange rates and the fluctuation of market prices on investments (net of estimated foreign tax withholding) are included with the netrealized and unrealized gain or loss from investments in the Statement of Operations. Reported net realized foreign currency gains orlosses arise from (1) sales of foreign currencies, (2) currency gains or losses realized between the trade and settlement dates onsecurities transactions, and (3) the difference between the amounts of dividends, interest, and foreign withholding taxes recorded onthe Fund’s books and the U.S. dollar equivalent of the amounts actually received or paid. Net unrealized foreign currency gains andlosses arise from changes in the fair values of assets and liabilities, other than investments in securities at fiscal period end, resultingfrom changes in exchange rates.
The Fund may invest in foreign securities, which may be subject to foreign taxes on income, gains on investments or currencyrepatriation, a portion of which may be recoverable. Foreign taxes, if any, are recorded based on the tax regulations and rates that existin the foreign markets in which the Fund invests and are shown in the Statement of Operations.
K. Forward Foreign Currency Contracts – The Fund may engage in foreign currency transactions either on a spot (i.e. for promptdelivery and settlement) basis, or through forward foreign currency contracts, to manage or minimize currency or exchange rate risk.
The Fund may also enter into forward foreign currency contracts for the purchase or sale of a security denominated in a foreigncurrency in order to “lock in” the U.S. dollar price of that security, or the Fund may also enter into forward foreign currency contracts thatdo not provide for physical settlement of the two currencies, but instead are settled by a single cash payment calculated as thedifference between the agreed upon exchange rate and the spot rate at settlement based upon an agreed upon notional amount(non-deliverable forwards). The Fund will set aside liquid assets in an amount equal to the daily mark-to-market obligation for forwardforeign currency contracts.
A forward foreign currency contract is an obligation between two parties (“Counterparties”) to purchase or sell a specific currency foran agreed-upon price at a future date. The use of forward foreign currency contracts does not eliminate fluctuations in the price of theunderlying securities the Fund owns or intends to acquire but establishes a rate of exchange in advance. Fluctuations in the value ofthese contracts are measured by the difference in the contract date and reporting date exchange rates and are recorded as unrealizedappreciation (depreciation) until the contracts are closed. When the contracts are closed, realized gains (losses) are recorded. Realizedand unrealized gains (losses) on the contracts are included in the Statement of Operations. The primary risks associated with forwardforeign currency contracts include failure of the Counterparty to meet the terms of the contract and the value of the foreign currencychanging unfavorably. These risks may be in excess of the amounts reflected in the Statement of Assets and Liabilities.
L. Futures Contracts – The Fund may enter into futures contracts to manage exposure to interest rate, equity and market pricemovements and/or currency risks. A futures contract is an agreement between Counterparties to purchase or sell a specified underlyingsecurity, currency or commodity (or delivery of a cash settlement price, in the case of an index future) for a fixed price at a future date.The Fund currently invests only in exchange-traded futures and they are standardized as to maturity date and underlying financialinstrument. Initial margin deposits required upon entering into futures contracts are satisfied by the segregation of specific securities orcash as collateral at the futures commission merchant (broker). During the period the futures contracts are open, changes in the valueof the contracts are recognized as unrealized gains or losses by recalculating the value of the contracts on a daily basis. Subsequent orvariation margin payments are received or made depending upon whether unrealized gains or losses are incurred. These amounts arereflected as receivables or payables on the Statement of Assets and Liabilities. When the contracts are closed or expire, the Fundrecognizes a realized gain or loss equal to the difference between the proceeds from, or cost of, the closing transaction and the Fund’sbasis in the contract. The net realized gain (loss) and the change in unrealized gain (loss) on futures contracts held during the period isincluded on the Statement of Operations. The primary risks associated with futures contracts are market risk and the absence of aliquid secondary market. If the Fund were unable to liquidate a futures contract and/or enter into an offsetting closing transaction, theFund would continue to be subject to market risk with respect to the value of the contracts and continue to be required to maintain themargin deposits on the futures contracts. Futures contracts have minimal Counterparty risk since the exchange’s clearinghouse, asCounterparty to all exchange-traded futures, guarantees the futures against default. Risks may exceed amounts recognized in theStatement of Assets and Liabilities.
M. Call Options Purchased and Written – The Fund may write covered call options and/or buy call options. A covered call option givesthe purchaser of such option the right to buy, and the writer the obligation to sell, the underlying security or foreign currency at thestated exercise price during the option period. Options written by the Fund normally will have expiration dates between three and ninemonths from the date written. The exercise price of a call option may be below, equal to, or above the current market value of theunderlying security at the time the option is written.
When the Fund writes a covered call option, an amount equal to the premium received by the Fund is recorded as an asset and anequivalent liability in the Statement of Assets and Liabilities. The amount of the liability is subsequently “marked-to-market” to reflect thecurrent market value of the option written. If a written covered call option expires on the stipulated expiration date, or if the Fund entersinto a closing purchase transaction, the Fund realizes a gain (or a loss if the closing purchase transaction exceeds the premiumreceived when the option was written) without regard to any unrealized gain or loss on the underlying security, and the liability related tosuch option is extinguished. If a written covered call option is exercised, the Fund realizes a gain or a loss from the sale of theunderlying security and the proceeds of the sale are increased by the premium originally received. Realized and unrealized gains andlosses on call options written are included in the Statement of Operations as Net realized gain (loss) from and Change in net unrealizedappreciation (depreciation) of Option contracts written. A risk in writing a covered call option is that the Fund gives up the opportunity forprofit if the market price of the security increases and the option is exercised.
When the Fund buys a call option, an amount equal to the premium paid by the Fund is recorded as an investment on the Statementof Assets and Liabilities. The amount of the investment is subsequently “marked-to-market” to reflect the current value of the optionpurchased. Realized and unrealized gains and losses on call options purchased are included in the Statement of Operations as Netrealized gain (loss) from and Change in net unrealized appreciation (depreciation) of Investment securities. A risk in buying an option isthat the Fund pays a premium whether or not the option is exercised. In addition, there can be no assurance that a liquid secondarymarket will exist for any option purchased.
N. Swap Agreements – The Fund may enter into various swap transactions, including interest rate, total return, index, currency and creditdefault swap contracts (“CDS”) for investment purposes or to manage interest rate, currency or credit risk. Such transactions areagreements between Counterparties. A swap agreement may be negotiated bilaterally and traded over-the-counter (“OTC”) betweentwo parties (“uncleared/ OTC”) or, in some instances, must be transacted through a future commission merchant (“FCM”) and clearedthrough a clearinghouse that serves as a central Counterparty (“centrally cleared swap”). These agreements may contain among otherconditions, events of default and termination events, and various covenants and representations such as provisions that require theFund to maintain a pre-determined level of net assets, and/ or provide limits regarding the decline of the Fund’s NAV over specificperiods of time. If the Fund were to trigger such provisions and have open derivative positions at that time, the Counterparty may beable to terminate such agreement and request immediate payment in an amount equal to the net liability positions, if any.
Interest rate, total return, index, and currency swap agreements are two-party contracts entered into primarily to exchange thereturns (or differentials in rates of returns) earned or realized on particular predetermined investments or instruments. The gross returnsto be exchanged or “swapped” between the parties are calculated with respect to a notional amount, i.e., the return on or increase invalue of a particular dollar amount invested at a particular interest rate or return of an underlying asset, in a particular foreign currency,or in a “basket” of securities representing a particular index.
In a centrally cleared swap, the Fund’s ultimate Counterparty is a central clearinghouse. The Fund initially will enter into centrallycleared swaps through an executing broker. When a fund enters into a centrally cleared swap, it must deliver to the centralCounterparty (via the FCM) an amount referred to as “initial margin.” Initial margin requirements are determined by the centralCounterparty, but an FCM may require additional initial margin above the amount required by the central Counterparty. Initial margindeposits required upon entering into centrally cleared swaps are satisfied by cash or securities as collateral at the FCM. Securitiesdeposited as initial margin are designated on the Schedule of Investments and cash deposited is recorded on the Statement of Assetsand Liabilities. During the term of a cleared swap agreement, a “variation margin” amount may be required to be paid by the Fund ormay be received by the Fund, based on the

ˆ200F9cJwp#$mf3aoÀŠ200F9cJwp#$mf3ao
209435 EDG 29INVESCOCORPORATE BOND
29-Oct-2021 05:25 ESTHTMLAN
Donnelley Financial LSWpatis8apNone
4*ESS 0C
VDI-W10-DPF-28421.7.8.0
ˆ200F9cJwp#$mf3aoÀŠ200F9cJwp#$mf3ao
209435 EDG 29INVESCOCORPORATE BOND
29-Oct-2021 05:25 ESTHTMLAN
Donnelley Financial LSWpatis8apNone
4*ESS 0C
VDI-W10-DPF-28421.7.8.0
Page 2 of 2 29 Invesco Corporate Bond Fund
ˆ200F9cJwp#nhJkjGSŠ200F9cJwp#nhJkjGS
209435 EDG 30INVESCOCORPORATE BOND
28-Oct-2021 18:49 ESTHTMLAN
Donnelley Financial LSWdeoln0apNone
2*ESS 0C
VDI-W10-LPF-23021.7.8.0
Page 1 of 1daily change in price of the underlying reference instrument subject to the swap agreement and is recorded as a receivable or payablefor variation margin in the Statement of Assets and Liabilities until the centrally cleared swap is terminated at which time a realized gainor loss is recorded.
A CDS is an agreement between Counterparties to exchange the credit risk of an issuer. A buyer of a CDS is said to buy protectionby paying a fixed payment over the life of the agreement and in some situations an upfront payment to the seller of the CDS. If adefined credit event occurs (such as payment default or bankruptcy), the Fund as a protection buyer would cease paying its fixedpayment, the Fund would deliver eligible bonds issued by the reference entity to the seller, and the seller would pay the full notionalvalue, or the “par value”, of the referenced obligation to the Fund. A seller of a CDS is said to sell protection and thus would receive afixed payment over the life of the agreement and an upfront payment, if applicable. If a credit event occurs, the Fund as a protectionseller would cease to receive the fixed payment stream, the Fund would pay the buyer “par value” or the full notional value of thereferenced obligation, and the Fund would receive the eligible bonds issued by the reference entity. In turn, these bonds may be sold inorder to realize a recovery value. Alternatively, the seller of the CDS and its Counterparty may agree to net the notional amount and themarket value of the bonds and make a cash payment equal to the difference to the buyer of protection. If no credit event occurs, theFund receives the fixed payment over the life of the agreement. As the seller, the Fund would effectively add leverage to its portfoliobecause, in addition to its total net assets, the Fund would be subject to investment exposure on the notional amount of the CDS. Inconnection with these agreements, cash and securities may be identified as collateral in accordance with the terms of the respectiveswap agreements to provide assets of value and recourse in the event of default under the swap agreement or bankruptcy/insolvencyof a party to the swap agreement. If a Counterparty becomes bankrupt or otherwise fails to perform its obligations due to financialdifficulties, the Fund may experience significant delays in obtaining any recovery in a bankruptcy or other reorganization proceeding.The Fund may obtain only limited recovery or may obtain no recovery in such circumstances. The Fund’s maximum risk of loss fromCounterparty risk, either as the protection seller or as the protection buyer, is the value of the contract. The risk may be mitigated byhaving a master netting arrangement between the Fund and the Counterparty and by the designation of collateral by the Counterpartyto cover the Fund’s exposure to the Counterparty.
Implied credit spreads represent the current level at which protection could be bought or sold given the terms of the existing CDScontract and serve as an indicator of the current status of the payment/performance risk of the CDS. An implied spread that haswidened or increased since entry into the initial contract may indicate a deteriorating credit profile and increased risk of default for thereference entity. A declining or narrowing spread may indicate an improving credit profile or decreased risk of default for the referenceentity. Alternatively, credit spreads may increase or decrease reflecting the general tolerance for risk in the credit markets.
An interest rate swap is an agreement between Counterparties pursuant to which the parties exchange a floating rate payment for afixed rate payment based on a specified notional amount.
Changes in the value of centrally cleared and OTC swap agreements are recognized as unrealized gains (losses) in the Statementof Operations by “marking to market” on a daily basis to reflect the value of the swap agreement at the end of each trading day.Payments received or paid at the beginning of the agreement are reflected as such on the Statement of Assets and Liabilities and maybe referred to as upfront payments. The Fund accrues for the fixed payment stream and amortizes upfront payments, if any, on swapagreements on a daily basis with the net amount, recorded as a component of realized gain (loss) on the Statement of Operations. Aliquidation payment received or made at the termination of a swap agreement is recorded as realized gain (loss) on the Statement ofOperations. The Fund segregates cash or liquid securities having a value at least equal to the amount of the potential obligation of aFund under any swap transaction. Cash held as collateral is recorded as deposits with brokers on the Statement of Assets andLiabilities. Entering into these agreements involves, to varying degrees, lack of liquidity and elements of credit, market, andCounterparty risk in excess of amounts recognized on the Statement of Assets and Liabilities. Such risks involve the possibility that aswap is difficult to sell or liquidate; the Counterparty does not honor its obligations under the agreement and unfavorable interest ratesand market fluctuations. It is possible that developments in the swaps market, including potential government regulation, couldadversely affect the Fund’s ability to terminate existing swap agreements or to realize amounts to be received under such agreements.Additionally, an International Swaps and Derivatives Association Master Agreement (“ISDA Master Agreement”) includes credit relatedcontingent features which allow Counterparties to OTC derivatives to terminate derivative contracts prior to maturity in the event that,for example, the Fund’s net assets decline by a stated percentage or the Fund fails to meet the terms of its ISDA Master Agreement,which would cause the Fund to accelerate payment of any net liability owed to the Counterparty. A short position in a security posesmore risk than holding the same security long. As there is no limit on how much the price of the security can increase, the Fund’sexposure is unlimited.
Notional amounts of each individual credit default swap agreement outstanding as of August 31, 2021 for which the Fund is the sellerof protection are disclosed in the open swap agreements table. These potential amounts would be partially offset by any recoveryvalues of the respective referenced obligations, upfront payments received upon entering into the agreement, or net amounts receivedfrom the settlement of buy protection credit default swap agreements entered into by the Fund for the same referenced entity or entities.
O. LIBOR Risk - The Fund may invest in financial instruments that utilize LIBOR as the reference or benchmark rate for variable interestrate calculations. On July 27, 2017, the head of the United Kingdom’s Financial Conduct Authority announced a desire to phase out theuse of LIBOR by the end of 2021. Although many LIBOR rates will be phased out at the end of 2021 as originally intended, a selectionof widely used USD LIBOR rates will continue to be published until June 2023 in order to assist with the transition. There remainsuncertainty regarding the effect of the LIBOR transition process and therefore any impact of a transition away from LIBOR on the Fundor the instruments in which the Fund invests cannot yet be determined. There is no assurance that the composition or characteristics ofany alternative reference rate will be similar to or produce the same value or economic equivalence as LIBOR or that instruments usingan alternative rate will have the same volume or liquidity. Any such effects of the transition away from LIBOR and the adoption ofalternative reference rates could result in losses to the Fund.
P. Leverage Risk – Leverage exists when the Fund can lose more than it originally invests because it purchases or sells an instrument orenters into a transaction without investing an amount equal to the full economic exposure of the instrument or transaction.
Q. Collateral – To the extent the Fund has designated or segregated a security as collateral and that security is subsequently sold, it is theFund’s practice to replace such collateral no later than the next business day.
R. Other Risks - Active trading of portfolio securities may result in added expenses, a lower return and increased tax liability.The current low interest rate environment was created in part by the Federal Reserve Board (FRB) and certain foreign central banks
keeping the federal funds and equivalent foreign rates near historical lows. Increases in the federal funds and equivalent foreign ratesmay expose fixed income markets to heightened volatility and reduced liquidity for certain fixed income investments, particularly thosewith longer maturities. In addition, decreases in fixed income dealer market-making capacity may also potentially lead to heightenedvolatility and reduced liquidity in the fixed income markets. As a result, the value of the Fund’s investments and share price maydecline. Changes in central bank policies could also result in higher than normal shareholder redemptions, which could potentiallyincrease portfolio turnover and the Fund’s transaction costs.
S. COVID-19 Risk - The COVID-19 strain of coronavirus has resulted in instances of market closures and dislocations, extreme volatility,liquidity constraints and increased trading costs. Efforts to contain its spread have resulted in travel restrictions, disruptions ofhealthcare systems, business operations and supply chains, layoffs, lower consumer demand, and defaults, among other significanteconomic impacts that have disrupted global economic activity across many industries. Such economic impacts may exacerbate otherpre-existing political, social and economic risks locally or globally.
The ongoing effects of COVID-19 are unpredictable and may result in significant and prolonged effects on the Fund’s performance. 30 Invesco Corporate Bond Fund
ˆ200F9cJwp#$n22%ofŠ200F9cJwp#$n22%of
209435 EDG 31INVESCOCORPORATE BOND
29-Oct-2021 05:25 ESTHTMLAN
Donnelley Financial LSWpatis8apNone
4*ESS 0C
VDI-W10-DPF-28421.7.8.0
Page 1 of 1NOTE 2–Advisory Fees and Other Fees Paid to Affiliates
The Trust has entered into a master investment advisory agreement with Invesco Advisers, Inc. (the “Adviser” or “Invesco”). Under theterms of the investment advisory agreement, the Fund accrues daily and pays monthly an advisory fee to the Adviser based on the annualrate of the Fund’s average daily net assets as follows:
Average Daily Net Assets Rate
First $ 500 million 0.420%
Next $750 million 0.350%
Over $1.25 billion 0.220%
For the six months ended August 31, 2021, the effective advisory fee rate incurred by the Fund was 0.29%.Under the terms of a master sub-advisory agreement between the Adviser and each of Invesco Asset Management Deutschland GmbH,
Invesco Asset Management Limited, Invesco Asset Management (Japan) Limited, Invesco Hong Kong Limited, Invesco Senior SecuredManagement, Inc. and Invesco Canada Ltd. (collectively, the “Affiliated Sub-Advisers”) the Adviser, not the Fund, will pay 40% of the feespaid to the Adviser to any such Affiliated Sub-Adviser(s) that provide(s) discretionary investment management services to the Fund basedon the percentage of assets allocated to such Affiliated Sub-Adviser(s).
The Adviser has contractually agreed, through at least June 30, 2022, to waive advisory fees and/or reimburse expenses of all shares tothe extent necessary to limit total annual fund operating expenses after fee waiver and/or expense reimbursement (excluding certain itemsdiscussed below) of Class A, Class C, Class R, Class Y, Class R5 and Class R6 shares to 1.50%, 2.25%, 1.75%, 1.25%, 1.25% and 1.25%,respectively, of the Fund’s average daily net assets (the “expense limits”). In determining the Adviser’s obligation to waive advisory feesand/or reimburse expenses, the following expenses are not taken into account, and could cause the total annual fund operating expensesafter fee waiver and/or reimbursement to exceed the numbers reflected above: (1) interest; (2) taxes; (3) dividend expense on short sales;(4) extraordinary or non-routine items, including litigation expenses; and (5) expenses that the Fund has incurred but did not actually paybecause of an expense offset arrangement. Unless Invesco continues the fee waiver agreement, it will terminate on June 30, 2022. Duringits term, the fee waiver agreement cannot be terminated or amended to increase the expense limits or reduce the advisory fee waiverswithout approval of the Board of Trustees. The Adviser did not waive fees and/or reimburse expenses during the period under this expenselimit.
Further, the Adviser has contractually agreed, through at least June 30, 2023, to waive the advisory fee payable by the Fund in anamount equal to 100% of the net advisory fees the Adviser receives from the affiliated money market funds on investments by the Fund ofuninvested cash (excluding investments of cash collateral from securities lending) in such affiliated money market funds.
For the six months ended August 31, 2021, the Adviser waived advisory fees of $20,258.The Trust has entered into a master administrative services agreement with Invesco pursuant to which the Fund has agreed to pay
Invesco for certain administrative costs incurred in providing accounting services to the Fund. For the six months ended August 31, 2021,expenses incurred under the agreement are shown in the Statement of Operations as Administrative services fees. Invesco has enteredinto a sub-administration agreement whereby State Street Bank and Trust Company (“SSB”) serves as fund accountant and providescertain administrative services to the Fund. Pursuant to a custody agreement with the Trust on behalf of the Fund, SSB also serves as theFund’s custodian.
The Trust has entered into a transfer agency and service agreement with Invesco Investment Services, Inc. (“IIS”) pursuant to which theFund has agreed to pay IIS a fee for providing transfer agency and shareholder services to the Fund and reimburse IIS for certain expensesincurred by IIS in the course of providing such services. IIS may make payments to intermediaries that provide omnibus account services,sub-accounting services and/or networking services. All fees payable by IIS to intermediaries that provide omnibus account services orsub-accounting services are charged back to the Fund, subject to certain limitations approved by the Trust’s Board of Trustees. For the sixmonths ended August 31, 2021, expenses incurred under the agreement are shown in the Statement of Operations as Transfer agent fees.
Shares of the Fund are distributed by Invesco Distributors, Inc. (“IDI”). The Fund has adopted a distribution plan pursuant to Rule 12b-1under the 1940 Act, and a service plan (collectively, the “Plans”) for Class A, Class C and Class R shares. The Fund, pursuant to the Plans,pays IDI compensation at the annual rate of 0.50% of the Fund’s average daily net assets of Class R shares. The Fund, pursuant to thePlans, reimburses IDI for its allocated share of expenses incurred for the period, up to a maximum annual rate of 25% of the Fund’saverage daily net assets of Class A shares and up to a maximum annual rate of 1.00% of the Fund’s average daily net assets of Class Cshares. The fees are accrued daily and paid monthly. Of the Plan payments, up to 0.25% of the average daily net assets of each class ofshares may be paid to furnish continuing personal shareholder services to customers who purchase and own shares of such classes. Anyamounts not paid as a service fee under the Plan would constitute an asset-based sales charge. Rules of the Financial Industry RegulatoryAuthority (“FINRA”) impose a cap on the total sales charges, including asset-based sales charges, that may be paid by any class of sharesof the Fund.
For the six months ended August 31, 2021, expenses incurred under these agreements are shown in the Statement of Operations asDistribution fees.
Front-end sales commissions and CDSC (collectively, the “sales charges”) are not recorded as expenses of the Fund. Front-end salescommissions are deducted from proceeds from the sales of Fund shares prior to investment in Class A shares of the Fund. CDSC arededucted from redemption proceeds prior to remittance to the shareholder. During the six months ended August 31, 2021, IDI advised theFund that IDI retained $94,534 in front-end sales commissions from the sale of Class A shares and $8,568 and $2,862 from Class A andClass C shares, respectively, for CDSC imposed upon redemptions by shareholders.
Certain officers and trustees of the Trust are officers and directors of the Adviser, IIS and/or IDI.
NOTE 3–Additional Valuation Information
GAAP defines fair value as the price that would be received to sell an asset or paid to transfer a liability in an orderly transaction betweenmarket participants at the measurement date, under current market conditions. GAAP establishes a hierarchy that prioritizes the inputs tovaluation methods, giving the highest priority to readily available unadjusted quoted prices in an active market for identical assets (Level 1)and the lowest priority to significant unobservable inputs (Level 3), generally when market prices are not readily available or are unreliable.Based on the valuation inputs, the securities or other investments are tiered into one of three levels. Changes in valuation methods mayresult in transfers in or out of an investment’s assigned level:
Level 1 – Prices are determined using quoted prices in an active market for identical assets.Level 2 –
Prices are determined using other significant observable inputs. Observable inputs are inputs that other market participantsmay use in pricing a security. These may include quoted prices for similar securities, interest rates, prepayment speeds, creditrisk, yield curves, loss severities, default rates, discount rates, volatilities and others.
Level 3 –
Prices are determined using significant unobservable inputs. In situations where quoted prices or observable inputs areunavailable (for example, when there is little or no market activity for an investment at the end of the period), unobservableinputs may be used. Unobservable inputs reflect the Fund’s own assumptions about the factors market participants would usein determining fair value of the securities or instruments and would be based on the best available information.
31 Invesco Corporate Bond Fund
ˆ200F9cJwp$0GHk8G]Š200F9cJwp$0GHk8G]
209435 EDG 32INVESCOCORPORATE BOND
29-Oct-2021 06:31 ESTHTMLAN
Donnelley Financial LSWmalab0apNone
3*ESS 0C
VDI-W10-LPF-12121.7.8.0
Page 1 of 1The following is a summary of the tiered valuation input levels, as of August 31, 2021. The level assigned to the securities valuations may
not be an indication of the risk or liquidity associated with investing in those securities. Because of the inherent uncertainties of valuation,the values reflected in the financial statements may materially differ from the value received upon actual sale of those investments. Level 1 Level 2 Level 3 Total
Investments in Securities
U.S. Dollar Denominated Bonds & Notes $ – $2,463,487,211 $ – $2,463,487,211
U.S. Treasury Securities – 167,137,062 – 167,137,062
Preferred Stocks 36,138,264 49,911,122 – 86,049,386
Variable Rate Senior Loan Interests – 33,701,000 7,219,680 40,920,680
Asset-Backed Securities – 25,697,291 – 25,697,291
Non-U.S. Dollar Denominated Bonds & Notes – 7,865,958 – 7,865,958
Municipal Obligations – 6,580,779 70,004 6,650,783
Exchange-Traded Funds 5,743,000 – – 5,743,000
Money Market Funds 104,546,574 111,532,877 – 216,079,451
Options Purchased 2,698,906 – – 2,698,906
Total Investments in Securities 149,126,744 2,865,913,300 7,289,684 3,022,329,728
Other Investments - Assets*
Futures Contracts 1,214,583 – – 1,214,583
Forward Foreign Currency Contracts – 37,128 – 37,128
1,214,583 37,128 – 1,251,711
Other Investments - Liabilities*
Futures Contracts (53,625) – – (53,625)
Forward Foreign Currency Contracts – (86,426) – (86,426)
Options Written (89,278) (46,101) – (135,379)
(142,903) (132,527) – (275,430)
Total Other Investments 1,071,680 (95,399) – 976,281
Total Investments $150,198,424 $2,865,817,901 $7,289,684 $3,023,306,009
* Futures contracts and forward foreign currency contracts are valued at unrealized appreciation (depreciation). Options written areshown at value.
NOTE 4–Derivative InvestmentsThe Fund may enter into an ISDA Master Agreement under which a fund may trade OTC derivatives. An OTC transaction entered intounder an ISDA Master Agreement typically involves a collateral posting arrangement, payment netting provisions and close-out nettingprovisions. These netting provisions allow for reduction of credit risk through netting of contractual obligations. The enforceability of thenetting provisions of the ISDA Master Agreement depends on the governing law of the ISDA Master Agreement, among other factors.
For financial reporting purposes, the Fund does not offset OTC derivative assets or liabilities that are subject to ISDA Master Agreementsin the Statement of Assets and Liabilities.
Value of Derivative Investments at Period-End
The table below summarizes the value of the Fund’s derivative investments, detailed by primary risk exposure, held as of August 31, 2021:
Value
Derivative Assets Credit
Risk Currency
Risk EquityRisk
InterestRate Risk Total
Unrealized appreciation on futures contracts -Exchange-Traded(a) $ - $ - $ - $ 1,214,583 $ 1,214,583
Unrealized appreciation on forward foreigncurrency contracts outstanding - 37,128 - - 37,128
Options purchased, at value - Exchange-Traded(b) - - 2,698,906 - 2,698,906
Total Derivative Assets - 37,128 2,698,906 1,214,583 3,950,617
Derivatives not subject to master nettingagreements - - (2,698,906) (1,214,583) (3,913,489)
Total Derivative Assets subject to masternetting agreements $ - $ 37,128 $ - $ - $ 37,128
Value
Derivative Liabilities Credit
Risk Currency
Risk EquityRisk
InterestRate Risk Total
Unrealized depreciation on futures contracts - Exchange-Traded(a) $ - $ - $ - $ (53,625) $ (53,625)
Unrealized depreciation on forward foreign currencycontracts outstanding - (86,426) - - (86,426)
Options written, at value - Exchange-Traded - - (89,278) - (89,278) Options written, at value - OTC (46,101) - - - (46,101)
Total Derivative Liabilities (46,101) (86,426) (89,278) (53,625) (275,430)
Derivatives not subject to master netting agreements - - 89,278 53,625 142,903
Total Derivative Liabilities subject to master nettingagreements $ (46,101) $ (86,426) $ - $ - $(132,527)
32 Invesco Corporate Bond Fund
ˆ200F9cJwp$1LcB2oOŠ200F9cJwp$1LcB2oO
209435 EDG 33INVESCOCORPORATE BOND
29-Oct-2021 06:53 ESTHTMLAN
Donnelley Financial LSWmalab0apNone
3*ESS 0C
VDI-W10-LPF-12121.7.8.0
Page 1 of 1(a) The daily variation margin receivable (payable) at period-end is recorded in the Statement of Assets and Liabilities.(b) Options purchased, at value as reported in the Schedule of Investments.
Offsetting Assets and Liabilities
The table below reflects the Fund’s exposure to Counterparties subject to either an ISDA Master Agreement or other agreement for OTCderivative transactions as of August 31, 2021.
FinancialDerivative
Assets Financial Derivative Liabilities Collateral
(Received)/Pledged
Counterparty Forward Foreign
Currency Contracts
ForwardForeign
CurrencyContracts
OptionsWritten
TotalLiabilities
Net Value ofDerivatives Non-Cash Cash
NetAmount
Canadian Imperial Bank ofCommerce $ – $(79,417) $ – $ (79,417) $(79,417) $– $ – $(79,417)
Citibank, N.A. – (7,009) – (7,009) (7,009) – – (7,009)
Goldman SachsInternational 37,128 – (46,101) (46,101) (8,973) – 8,973 –
Total $37,128 $(86,426) $(46,101) $(132,527) $(95,399) $– $8,973 $(86,426)
Effect of Derivative Investments for the six months ended August 31, 2021
The table below summarizes the gains (losses) on derivative investments, detailed by primary risk exposure, recognized in earnings duringthe period:
Location of Gain (Loss) onStatement of Operations
CreditRisk
CurrencyRisk
EquityRisk
InterestRate Risk Total
Realized Gain (Loss): Forward foreign currency contracts $ - $ 378,764 $ - $ - $ 378,764
Futures contracts - - - (10,117,984) (10,117,984)
Options purchased(a) - - 2,766,782 - 2,766,782
Options written - - 264,406 332,158 596,564
Swap agreements (348,856) - - - (348,856)
Change in Net Unrealized Appreciation (Depreciation): Forward foreign currency contracts - (117,868) - - (117,868)
Futures contracts - - - (274,550) (274,550)
Options purchased(a) - - 848,237 - 848,237
Options written 365,018 - 207,632 - 572,650
Total $ 16,162 $ 260,896 $4,087,057 $(10,060,376) $ (5,696,261)
(a) Options purchased are included in the net realized gain (loss) from investment securities and the change in net unrealized appreciation(depreciation) on investment securities.
The table below summarizes the average notional value of derivatives held during the period.
ForwardForeign Currency
Contracts Futures
Contracts
EquityOptions
Purchased
IndexOptions
Purchased
EquityOptionsWritten
SwaptionsWritten
SwapAgreements
Average notional value $ 22,191,672 $1,219,481,820 $29,964,875 $35,372,500 $34,509,500 $58,850,500 $57,132,104
Average Contracts – – 5,571 83 5,530 – –
NOTE 5–Expense Offset Arrangement(s)
The expense offset arrangement is comprised of transfer agency credits which result from balances in demand deposit accounts used bythe transfer agent for clearing shareholder transactions. For the six months ended August 31, 2021, the Fund received credits from thisarrangement, which resulted in the reduction of the Fund’s total expenses of $1,640.
NOTE 6–Trustees’ and Officers’ Fees and Benefits
Trustees’ and Officers’ Fees and Benefits include amounts accrued by the Fund to pay remuneration to certain Trustees and Officers of theFund. Trustees have the option to defer compensation payable by the Fund, and Trustees’ and Officers’ Fees and Benefits also includeamounts accrued by the Fund to fund such deferred compensation amounts. Those Trustees who defer compensation have the option toselect various Invesco Funds in which their deferral accounts shall be deemed to be invested. Finally, certain current Trustees were eligibleto participate in a retirement plan that provided for benefits to be paid upon retirement to Trustees over a period of time based on thenumber of years of service. The Fund may have certain former Trustees who also participate in a retirement plan and receive benefits undersuch plan. Trustees’ and Officers’ Fees and Benefits include amounts accrued by the Fund to fund such retirement benefits. Obligationsunder the deferred compensation and retirement plans represent unsecured claims against the general assets of the Fund. 33 Invesco Corporate Bond Fund
ˆ200F9cJwp$3D4NronŠ200F9cJwp$3D4Nron
209435 EDG 34INVESCOCORPORATE BOND
29-Oct-2021 07:28 ESTHTMLAN
Donnelley Financial LSWjadha1apNone
5*ESS 0C
VDI-W10-DPF-49821.7.8.0
Page 1 of 1NOTE 7–Cash Balances
The Fund is permitted to temporarily carry a negative or overdrawn balance in its account with SSB, the custodian bank. Such balances, ifany at period-end, are shown in the Statement of Assets and Liabilities under the payable caption Amount due custodian. To compensatethe custodian bank for such overdrafts, the overdrawn Fund may either (1) leave funds as a compensating balance in the account so thecustodian bank can be compensated by earning the additional interest; or (2) compensate by paying the custodian bank at a rate agreedupon by the custodian bank and Invesco, not to exceed the contractually agreed upon rate. The Fund may not purchase additionalsecurities when any borrowings from banks or broker-dealers exceed 5% of the Fund’s total assets, or when any borrowings from anInvesco Fund are outstanding.
NOTE 8–Tax Information
The amount and character of income and gains to be distributed are determined in accordance with income tax regulations, which maydiffer from GAAP.Reclassifications are made to the Fund’s capital accounts to reflect income and gains available for distribution (or available capital losscarryforward) under income tax regulations. The tax character of distributions paid during the year and the tax components of net assets willbe reported at the Fund’s fiscal year-end.
Capital loss carryforward is calculated and reported as of a specific date. Results of transactions and other activity after that date mayaffect the amount of capital loss carryforward actually available for the Fund to utilize. The ability to utilize capital loss carryforwards in thefuture may be limited under the Internal Revenue Code and related regulations based on the results of future transactions.
The Fund did not have a capital loss carryforward as of February 28, 2021.
NOTE 9–Investment Transactions
The aggregate amount of investment securities (other than short-term securities, U.S. Government obligations and money market funds, ifany) purchased and sold by the Fund during the six months ended August 31, 2021 was $1,067,291,924 and $915,152,482, respectively.Cost of investments, including any derivatives, on a tax basis includes the adjustments for financial reporting purposes as of the mostrecently completed federal income tax reporting period-end.
Unrealized Appreciation (Depreciation) of Investments on a Tax Basis
Aggregate unrealized appreciation of investments $155,126,759
Aggregate unrealized (depreciation) of investments (11,272,192)
Net unrealized appreciation of investments $143,854,567
Cost of investments for tax purposes is $2,879,451,442.
NOTE 10-Share Information
Summary of Share Activity
Six months endedAugust 31, 2021(a)
Year endedFebruary 28, 2021
Shares Amount Shares Amount
Sold: Class A 15,499,096 $121,362,655 42,426,949 $329,987,090
Class C 611,974 4,828,851 3,264,279 25,393,841
Class R 337,835 2,644,078 773,452 5,957,853
Class Y 24,199,875 189,914,501 57,457,299 442,795,202
Class R5 713,539 5,526,662 1,104,999 8,728,618
Class R6 31,118,277 244,014,508 27,744,665 216,580,860
Issued as reinvestment of dividends: Class A 2,032,039 15,929,446 8,590,964 67,200,792
Class C 60,639 478,825 373,451 2,949,384
Class R 19,419 152,345 85,384 667,766
Class Y 653,701 5,141,639 2,560,753 20,141,227
Class R5 33,902 266,215 90,723 712,329
Class R6 1,371,836 10,789,538 4,509,781 35,354,372
Automatic conversion of Class C shares to Class A shares: Class A 270,936 2,119,114 1,357,383 10,710,890
Class C (268,918) (2,119,114) (1,345,849) (10,710,890)
34 Invesco Corporate Bond Fund
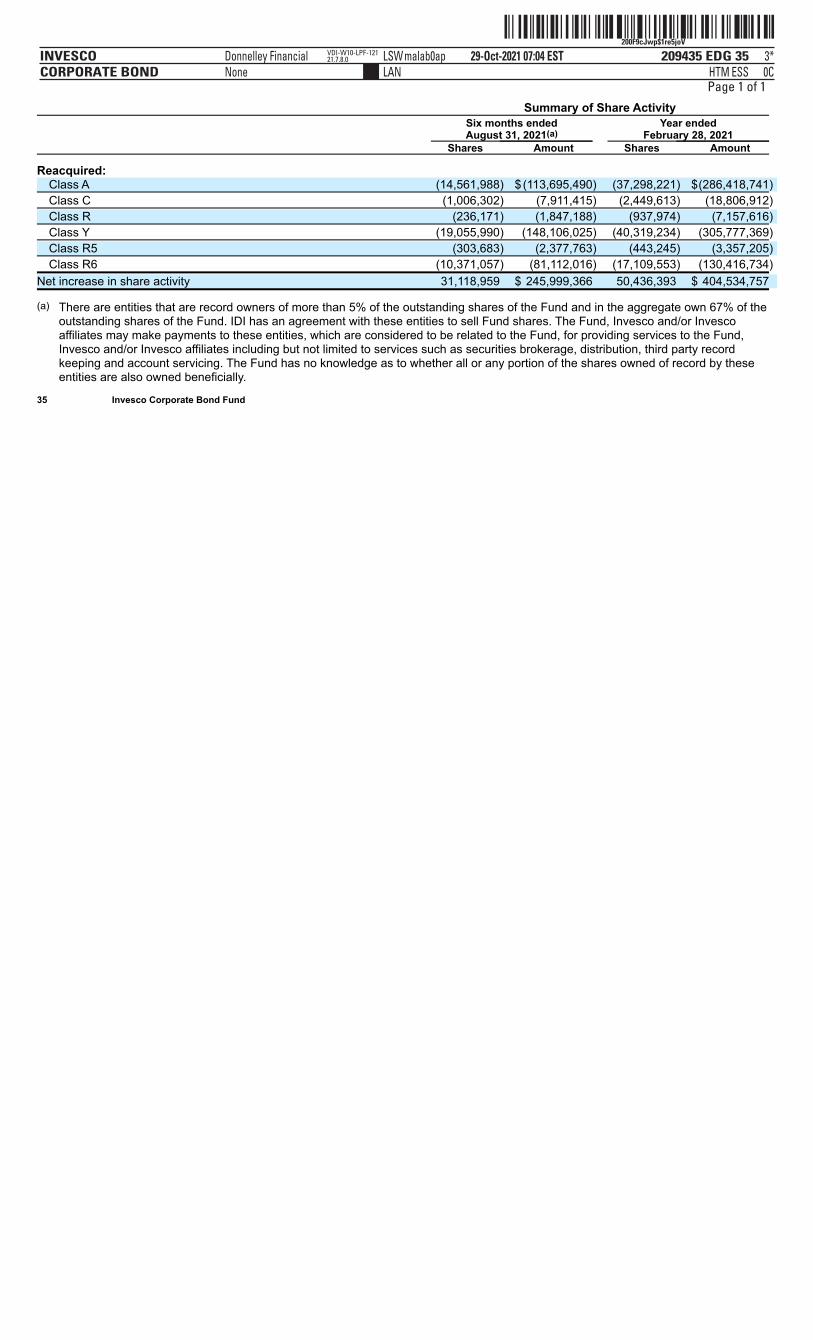
ˆ200F9cJwp$1re5joVŠ200F9cJwp$1re5joV
209435 EDG 35INVESCOCORPORATE BOND
29-Oct-2021 07:04 ESTHTMLAN
Donnelley Financial LSWmalab0apNone
3*ESS 0C
VDI-W10-LPF-12121.7.8.0
Page 1 of 1 Summary of Share Activity
Six months endedAugust 31, 2021(a)
Year endedFebruary 28, 2021
Shares Amount Shares Amount
Reacquired: Class A (14,561,988) $ (113,695,490) (37,298,221) $(286,418,741)
Class C (1,006,302) (7,911,415) (2,449,613) (18,806,912)
Class R (236,171) (1,847,188) (937,974) (7,157,616)
Class Y (19,055,990) (148,106,025) (40,319,234) (305,777,369)
Class R5 (303,683) (2,377,763) (443,245) (3,357,205)
Class R6 (10,371,057) (81,112,016) (17,109,553) (130,416,734)
Net increase in share activity 31,118,959 $ 245,999,366 50,436,393 $ 404,534,757
(a) There are entities that are record owners of more than 5% of the outstanding shares of the Fund and in the aggregate own 67% of theoutstanding shares of the Fund. IDI has an agreement with these entities to sell Fund shares. The Fund, Invesco and/or Invescoaffiliates may make payments to these entities, which are considered to be related to the Fund, for providing services to the Fund,Invesco and/or Invesco affiliates including but not limited to services such as securities brokerage, distribution, third party recordkeeping and account servicing. The Fund has no knowledge as to whether all or any portion of the shares owned of record by theseentities are also owned beneficially.
35 Invesco Corporate Bond Fund
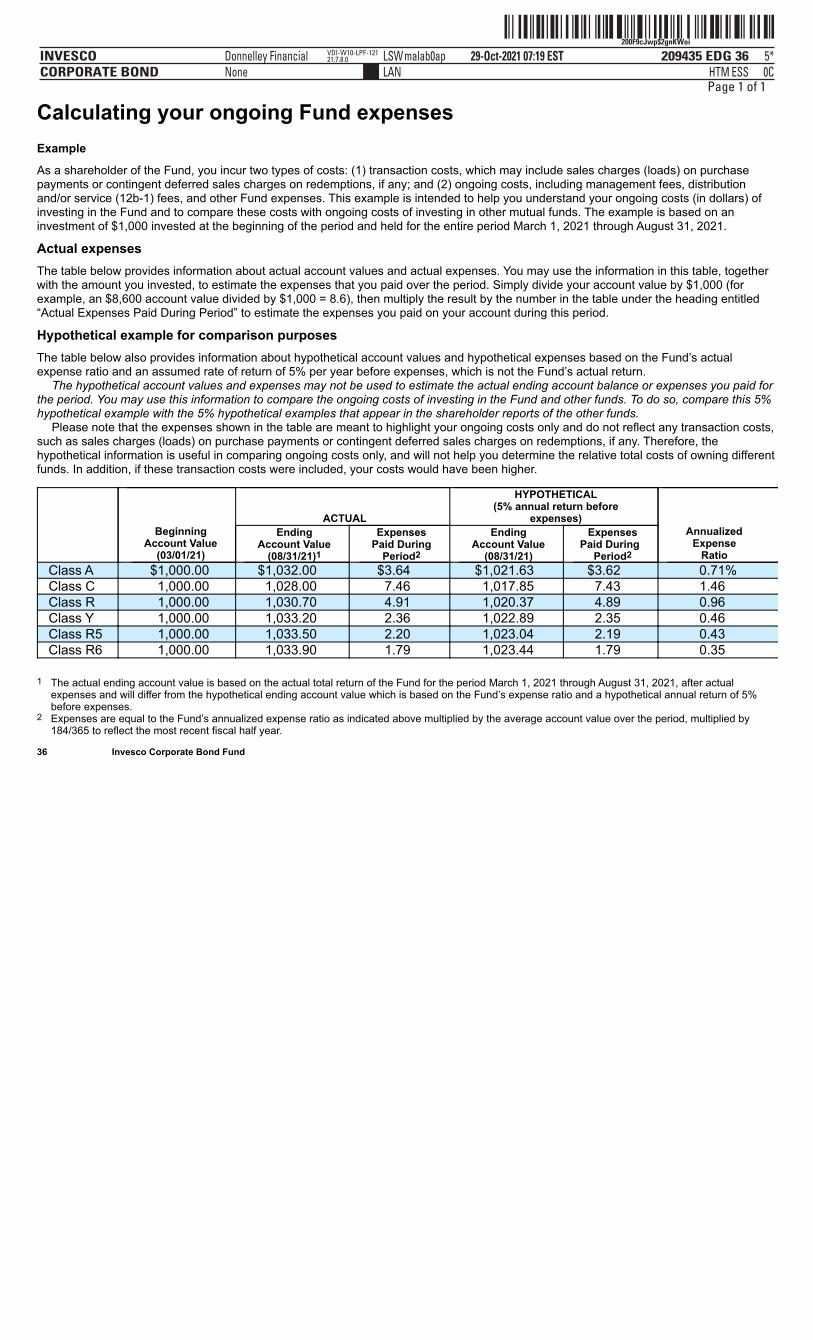
ˆ200F9cJwp$2gnKWoiŠ200F9cJwp$2gnKWoi
209435 EDG 36INVESCOCORPORATE BOND
29-Oct-2021 07:19 ESTHTMLAN
Donnelley Financial LSWmalab0apNone
5*ESS 0C
VDI-W10-LPF-12121.7.8.0
Page 1 of 1
Calculating your ongoing Fund expensesExample
As a shareholder of the Fund, you incur two types of costs: (1) transaction costs, which may include sales charges (loads) on purchasepayments or contingent deferred sales charges on redemptions, if any; and (2) ongoing costs, including management fees, distributionand/or service (12b-1) fees, and other Fund expenses. This example is intended to help you understand your ongoing costs (in dollars) ofinvesting in the Fund and to compare these costs with ongoing costs of investing in other mutual funds. The example is based on aninvestment of $1,000 invested at the beginning of the period and held for the entire period March 1, 2021 through August 31, 2021.
Actual expensesThe table below provides information about actual account values and actual expenses. You may use the information in this table, togetherwith the amount you invested, to estimate the expenses that you paid over the period. Simply divide your account value by $1,000 (forexample, an $8,600 account value divided by $1,000 = 8.6), then multiply the result by the number in the table under the heading entitled“Actual Expenses Paid During Period” to estimate the expenses you paid on your account during this period.
Hypothetical example for comparison purposesThe table below also provides information about hypothetical account values and hypothetical expenses based on the Fund’s actualexpense ratio and an assumed rate of return of 5% per year before expenses, which is not the Fund’s actual return.
The hypothetical account values and expenses may not be used to estimate the actual ending account balance or expenses you paid forthe period. You may use this information to compare the ongoing costs of investing in the Fund and other funds. To do so, compare this 5%hypothetical example with the 5% hypothetical examples that appear in the shareholder reports of the other funds.
Please note that the expenses shown in the table are meant to highlight your ongoing costs only and do not reflect any transaction costs,such as sales charges (loads) on purchase payments or contingent deferred sales charges on redemptions, if any. Therefore, thehypothetical information is useful in comparing ongoing costs only, and will not help you determine the relative total costs of owning differentfunds. In addition, if these transaction costs were included, your costs would have been higher.
Beginning Account Value
(03/01/21)
ACTUAL
HYPOTHETICAL(5% annual return before
expenses)
Annualized Expense
Ratio
Ending Account Value
(08/31/21)1
Expenses Paid During
Period2
Ending Account Value
(08/31/21)
Expenses Paid During
Period2
Class A $1,000.00 $1,032.00 $3.64 $1,021.63 $3.62 0.71% Class C 1,000.00 1,028.00 7.46 1,017.85 7.43 1.46 Class R 1,000.00 1,030.70 4.91 1,020.37 4.89 0.96 Class Y 1,000.00 1,033.20 2.36 1,022.89 2.35 0.46 Class R5 1,000.00 1,033.50 2.20 1,023.04 2.19 0.43 Class R6 1,000.00 1,033.90 1.79 1,023.44 1.79 0.35
1 The actual ending account value is based on the actual total return of the Fund for the period March 1, 2021 through August 31, 2021, after actual
expenses and will differ from the hypothetical ending account value which is based on the Fund’s expense ratio and a hypothetical annual return of 5%before expenses.
2 Expenses are equal to the Fund’s annualized expense ratio as indicated above multiplied by the average account value over the period, multiplied by184/365 to reflect the most recent fiscal half year.
36 Invesco Corporate Bond Fund
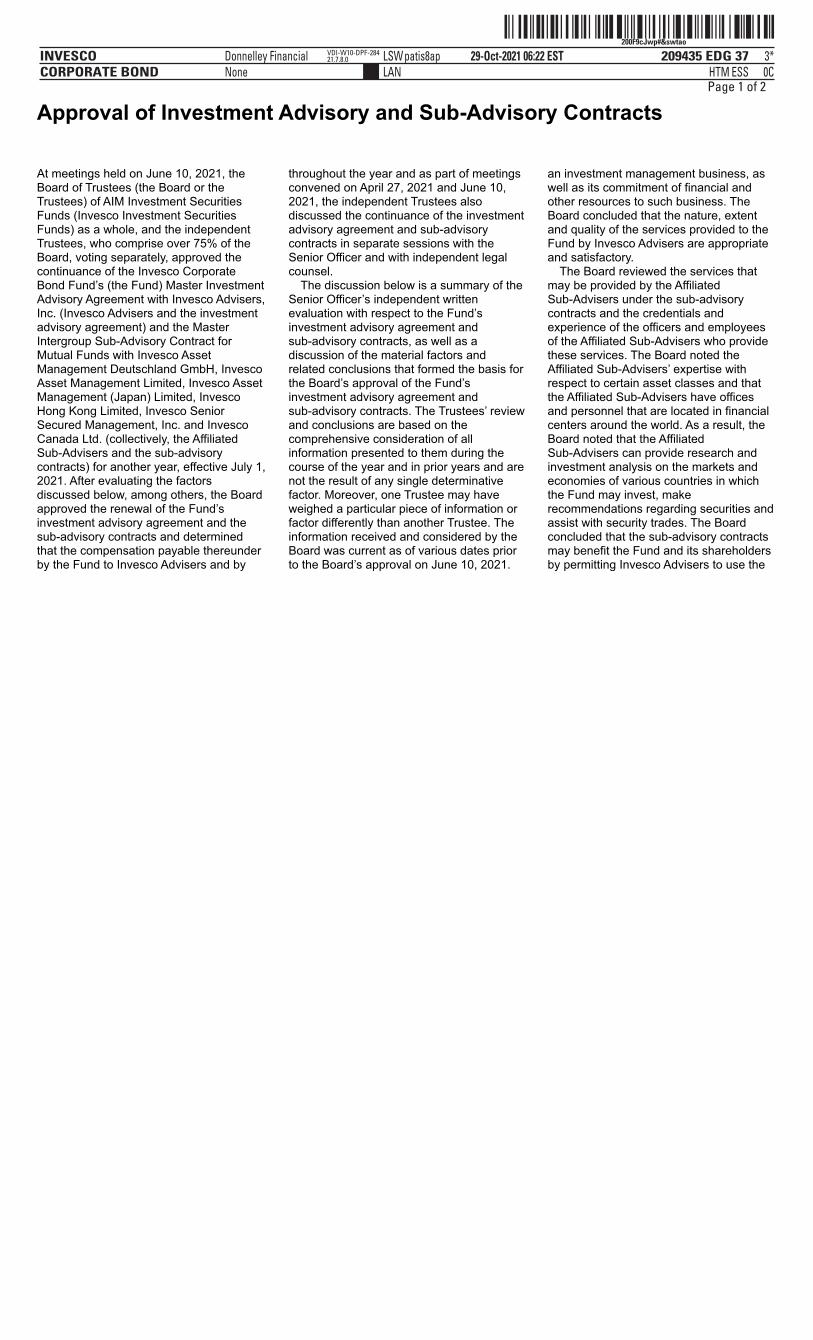
ˆ200F9cJwp#&swtao‹Š200F9cJwp#&swtao
209435 EDG 37INVESCOCORPORATE BOND
29-Oct-2021 06:22 ESTHTMLAN
Donnelley Financial LSWpatis8apNone
3*ESS 0C
VDI-W10-DPF-28421.7.8.0
Page 1 of 2
Approval of Investment Advisory and Sub-Advisory Contracts At meetings held on June 10, 2021, theBoard of Trustees (the Board or theTrustees) of AIM Investment SecuritiesFunds (Invesco Investment SecuritiesFunds) as a whole, and the independentTrustees, who comprise over 75% of theBoard, voting separately, approved thecontinuance of the Invesco CorporateBond Fund’s (the Fund) Master InvestmentAdvisory Agreement with Invesco Advisers,Inc. (Invesco Advisers and the investmentadvisory agreement) and the MasterIntergroup Sub-Advisory Contract forMutual Funds with Invesco AssetManagement Deutschland GmbH, InvescoAsset Management Limited, Invesco AssetManagement (Japan) Limited, InvescoHong Kong Limited, Invesco SeniorSecured Management, Inc. and InvescoCanada Ltd. (collectively, the AffiliatedSub-Advisers and the sub-advisorycontracts) for another year, effective July 1,2021. After evaluating the factorsdiscussed below, among others, the Boardapproved the renewal of the Fund’sinvestment advisory agreement and thesub-advisory contracts and determinedthat the compensation payable thereunderby the Fund to Invesco Advisers and by
throughout the year and as part of meetingsconvened on April 27, 2021 and June 10,2021, the independent Trustees alsodiscussed the continuance of the investmentadvisory agreement and sub-advisorycontracts in separate sessions with theSenior Officer and with independent legalcounsel.
The discussion below is a summary of theSenior Officer’s independent writtenevaluation with respect to the Fund’sinvestment advisory agreement andsub-advisory contracts, as well as adiscussion of the material factors andrelated conclusions that formed the basis forthe Board’s approval of the Fund’sinvestment advisory agreement andsub-advisory contracts. The Trustees’ reviewand conclusions are based on thecomprehensive consideration of allinformation presented to them during thecourse of the year and in prior years and arenot the result of any single determinativefactor. Moreover, one Trustee may haveweighed a particular piece of information orfactor differently than another Trustee. Theinformation received and considered by theBoard was current as of various dates priorto the Board’s approval on June 10, 2021.
an investment management business, aswell as its commitment of financial andother resources to such business. TheBoard concluded that the nature, extentand quality of the services provided to theFund by Invesco Advisers are appropriateand satisfactory.
The Board reviewed the services thatmay be provided by the AffiliatedSub-Advisers under the sub-advisorycontracts and the credentials andexperience of the officers and employeesof the Affiliated Sub-Advisers who providethese services. The Board noted theAffiliated Sub-Advisers’ expertise withrespect to certain asset classes and thatthe Affiliated Sub-Advisers have officesand personnel that are located in financialcenters around the world. As a result, theBoard noted that the AffiliatedSub-Advisers can provide research andinvestment analysis on the markets andeconomies of various countries in whichthe Fund may invest, makerecommendations regarding securities andassist with security trades. The Boardconcluded that the sub-advisory contractsmay benefit the Fund and its shareholdersby permitting Invesco Advisers to use the
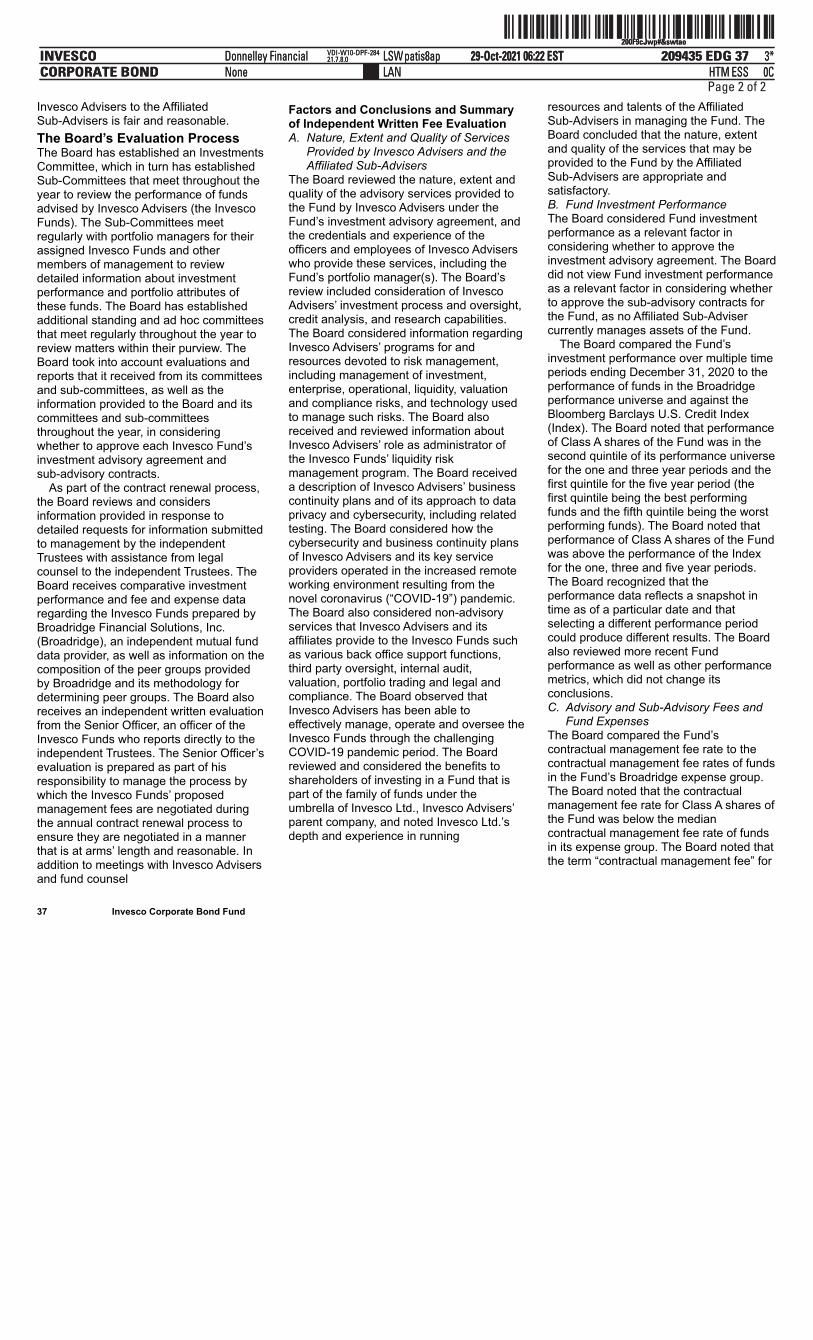
ˆ200F9cJwp#&swtao‹Š200F9cJwp#&swtao
209435 EDG 37INVESCOCORPORATE BOND
29-Oct-2021 06:22 ESTHTMLAN
Donnelley Financial LSWpatis8apNone
3*ESS 0C
VDI-W10-DPF-28421.7.8.0
ˆ200F9cJwp#&swtao‹Š200F9cJwp#&swtao
209435 EDG 37INVESCOCORPORATE BOND
29-Oct-2021 06:22 ESTHTMLAN
Donnelley Financial LSWpatis8apNone
3*ESS 0C
VDI-W10-DPF-28421.7.8.0
Page 2 of 2
37 Invesco Corporate Bond Fund
Invesco Advisers to the AffiliatedSub-Advisers is fair and reasonable.The Board’s Evaluation ProcessThe Board has established an InvestmentsCommittee, which in turn has establishedSub-Committees that meet throughout theyear to review the performance of fundsadvised by Invesco Advisers (the InvescoFunds). The Sub-Committees meetregularly with portfolio managers for theirassigned Invesco Funds and othermembers of management to reviewdetailed information about investmentperformance and portfolio attributes ofthese funds. The Board has establishedadditional standing and ad hoc committeesthat meet regularly throughout the year toreview matters within their purview. TheBoard took into account evaluations andreports that it received from its committeesand sub-committees, as well as theinformation provided to the Board and itscommittees and sub-committeesthroughout the year, in consideringwhether to approve each Invesco Fund’sinvestment advisory agreement andsub-advisory contracts.
As part of the contract renewal process,the Board reviews and considersinformation provided in response todetailed requests for information submittedto management by the independentTrustees with assistance from legalcounsel to the independent Trustees. TheBoard receives comparative investmentperformance and fee and expense dataregarding the Invesco Funds prepared byBroadridge Financial Solutions, Inc.(Broadridge), an independent mutual funddata provider, as well as information on thecomposition of the peer groups providedby Broadridge and its methodology fordetermining peer groups. The Board alsoreceives an independent written evaluationfrom the Senior Officer, an officer of theInvesco Funds who reports directly to theindependent Trustees. The Senior Officer’sevaluation is prepared as part of hisresponsibility to manage the process bywhich the Invesco Funds’ proposedmanagement fees are negotiated duringthe annual contract renewal process toensure they are negotiated in a mannerthat is at arms’ length and reasonable. Inaddition to meetings with Invesco Advisersand fund counsel
Factors and Conclusions and Summaryof Independent Written Fee EvaluationA. Nature, Extent and Quality of Services
Provided by Invesco Advisers and theAffiliated Sub-Advisers
The Board reviewed the nature, extent andquality of the advisory services provided tothe Fund by Invesco Advisers under theFund’s investment advisory agreement, andthe credentials and experience of theofficers and employees of Invesco Adviserswho provide these services, including theFund’s portfolio manager(s). The Board’sreview included consideration of InvescoAdvisers’ investment process and oversight,credit analysis, and research capabilities.The Board considered information regardingInvesco Advisers’ programs for andresources devoted to risk management,including management of investment,enterprise, operational, liquidity, valuationand compliance risks, and technology usedto manage such risks. The Board alsoreceived and reviewed information aboutInvesco Advisers’ role as administrator ofthe Invesco Funds’ liquidity riskmanagement program. The Board receiveda description of Invesco Advisers’ businesscontinuity plans and of its approach to dataprivacy and cybersecurity, including relatedtesting. The Board considered how thecybersecurity and business continuity plansof Invesco Advisers and its key serviceproviders operated in the increased remoteworking environment resulting from thenovel coronavirus (“COVID-19”) pandemic.The Board also considered non-advisoryservices that Invesco Advisers and itsaffiliates provide to the Invesco Funds suchas various back office support functions,third party oversight, internal audit,valuation, portfolio trading and legal andcompliance. The Board observed thatInvesco Advisers has been able toeffectively manage, operate and oversee theInvesco Funds through the challengingCOVID-19 pandemic period. The Boardreviewed and considered the benefits toshareholders of investing in a Fund that ispart of the family of funds under theumbrella of Invesco Ltd., Invesco Advisers’parent company, and noted Invesco Ltd.’sdepth and experience in running
resources and talents of the AffiliatedSub-Advisers in managing the Fund. TheBoard concluded that the nature, extentand quality of the services that may beprovided to the Fund by the AffiliatedSub-Advisers are appropriate andsatisfactory.B. Fund Investment PerformanceThe Board considered Fund investmentperformance as a relevant factor inconsidering whether to approve theinvestment advisory agreement. The Boarddid not view Fund investment performanceas a relevant factor in considering whetherto approve the sub-advisory contracts forthe Fund, as no Affiliated Sub-Advisercurrently manages assets of the Fund.
The Board compared the Fund’sinvestment performance over multiple timeperiods ending December 31, 2020 to theperformance of funds in the Broadridgeperformance universe and against theBloomberg Barclays U.S. Credit Index(Index). The Board noted that performanceof Class A shares of the Fund was in thesecond quintile of its performance universefor the one and three year periods and thefirst quintile for the five year period (thefirst quintile being the best performingfunds and the fifth quintile being the worstperforming funds). The Board noted thatperformance of Class A shares of the Fundwas above the performance of the Indexfor the one, three and five year periods.The Board recognized that theperformance data reflects a snapshot intime as of a particular date and thatselecting a different performance periodcould produce different results. The Boardalso reviewed more recent Fundperformance as well as other performancemetrics, which did not change itsconclusions.C. Advisory and Sub-Advisory Fees and
Fund ExpensesThe Board compared the Fund’scontractual management fee rate to thecontractual management fee rates of fundsin the Fund’s Broadridge expense group.The Board noted that the contractualmanagement fee rate for Class A shares ofthe Fund was below the mediancontractual management fee rate of fundsin its expense group. The Board noted thatthe term “contractual management fee” for
ˆ200F9cJwp#nvkM1G~Š200F9cJwp#nvkM1G~
209435 EDG 38INVESCOCORPORATE BOND
28-Oct-2021 19:06 ESTHTMLAN
Donnelley Financial LSWtambg0apNone
2*ESS 0C
VDI-W10-LPF-49921.7.8.0
Page 1 of 2
funds in the expense group may includeboth advisory and certain non-portfoliomanagement administrative services fees,but that Broadridge is not able to provideinformation on a fund by fund basis as towhat is included. The Board also reviewedthe methodology used by Broadridge incalculating expense group information,which includes using each fund’scontractual management fee schedule(including any applicable breakpoints) asreported in the most recent prospectus orstatement of additional information foreach fund in the expense group. TheBoard also considered comparativeinformation regarding the Fund’s totalexpense ratio and its various components.
The Board noted that Invesco Advisershas contractually agreed to waive feesand/or limit expenses of the Fund for theterm disclosed in the Fund’s registrationstatement in an amount necessary to limittotal annual operating expenses to aspecified percentage of average daily netassets for each class of the Fund.
The Board noted that Invesco Advisersand the Affiliated Sub-Advisers do notmanage other similarly managed mutualfunds or client accounts.
The Board also considered the servicesthat may be provided by the AffiliatedSub-Advisers pursuant to the sub-advisorycontracts, as well as the fees payable byInvesco Advisers to the AffiliatedSub-Advisers pursuant to the sub-advisorycontracts.D. Economies of Scale and BreakpointsThe Board considered the extent to whichthere may be economies of scale in theprovision of advisory services to the Fundand the Invesco Funds, and the extent towhich such economies of scale are sharedwith the Fund and the Invesco Funds. TheBoard considered that the Fund benefitsfrom economies of scale throughcontractual breakpoints in the Fund’sadvisory fee schedule, which generallyoperate to reduce the Fund’s expense ratioas it grows in size. The Board requestedand received additional information fromInvesco Advisers regarding the levels ofthe Fund’s breakpoints in light of currentassets. The Board noted that the Fund alsoshares in economies of scale throughInvesco Advisers’ ability to negotiate lowerfee arrangements with third party serviceproviders. The Board noted that the Fundmay also benefit from economies of scalethrough initial fee setting, fee waivers andexpense reimbursements, as well asInvesco Advisers’ investment in itsbusiness, including investments inbusiness infrastructure, technology andcybersecurity.E. Profitability and Financial ResourcesThe Board reviewed information fromInvesco Advisers concerning the costs ofthe advisory and other services thatInvesco Advisers and its affiliates provideto the Fund and the Invesco Funds and theprofitability of Invesco Advisers and itsaffiliates in providing these services in theaggregate and on an individualFund-by-Fund basis. The Boardconsidered the methodology used forcalculating profitability and noted that suchmethodology had recently been reviewedand enhanced. The Board noted thatInvesco Advisers continues to operate at anet profit from services Invesco Advisersand its affiliates provide to the InvescoFunds in the aggregate and to most Fundsindividually. The Board did not deem thelevel of profits realized by Invesco Advisersand its affiliates from providing suchservices to be excessive, given the nature,
Invesco Advisers is financially sound andhas the resources necessary to perform itsobligations under the investment advisoryagreement, and provided representationsindicating that the Affiliated Sub-Advisersare financially sound and have theresources necessary to perform theirobligations under the sub-advisorycontracts.F. Collateral Benefits to Invesco Advisers
and its AffiliatesThe Board considered various other benefitsreceived by Invesco Advisers and itsaffiliates from the relationship with the Fund,including the fees received for providingadministrative, transfer agency anddistribution services to the Fund. The Boardreceived comparative information regardingfees charged for these services, includinginformation provided by Broadridge andother independent sources. The Boardreviewed the performance of InvescoAdvisers and its affiliates in providing theseservices and the organizational structureemployed to provide these services. TheBoard noted that these services areprovided to the Fund pursuant to writtencontracts that are reviewed and subject toapproval on an annual basis by the Boardbased on its determination that the servicesare required for the operation of the Fund.
The Board considered the benefitsrealized by Invesco Advisers and theAffiliated Sub-Advisers as a result ofportfolio brokerage transactions executedthrough “soft dollar” arrangements. InvescoAdvisers noted that the Fund does notexecute brokerage transactions through“soft dollar” arrangements to any significantdegree.
The Board considered that the Fund’suninvested cash and cash collateral fromany securities lending arrangements may beinvested in registered money market fundsor, with regard to securities lending cashcollateral, unregistered funds that complywith Rule 2a-7 (collectively referred to as“affiliated money market funds”) advised byInvesco Advisers. The Board consideredinformation regarding the returns of theaffiliated money market funds relative tocomparable overnight investments, as wellas the fees paid by the affiliated moneymarket funds to Invesco Advisers and itsaffiliates. In this regard, the Board noted thatInvesco Advisers receives advisory feesfrom these affiliated money market fundsattributable to the Fund’s investments. TheBoard also noted that Invesco Advisers hascontractually agreed to waive throughvarying periods an amount equal to 100% ofthe net advisory fee Invesco Advisersreceives from the affiliated money marketfunds with respect to the Fund’s investmentin the affiliated money market funds ofuninvested cash, but not cash collateral. TheBoard concluded that the advisory feespayable to Invesco Advisers from the Fund’sinvestment of cash collateral from anysecurities lending arrangements in theaffiliated money market funds are forservices that are not duplicative of servicesprovided by Invesco Advisers to the Fund.
The Board also received informationabout commissions that an affiliated brokermay receive for executing certain trades forthe Fund. Invesco Advisers and the AffiliatedSub-Advisers advised the Board of thebenefits to the Fund of executing tradesthrough the affiliated broker and that suchtrades were executed in compliance withrules under the federal securities laws andconsistent with best execution obligations.

ˆ200F9cJwp#nvkM1G~Š200F9cJwp#nvkM1G~
209435 EDG 38INVESCOCORPORATE BOND
28-Oct-2021 19:06 ESTHTMLAN
Donnelley Financial LSWtambg0apNone
2*ESS 0C
VDI-W10-LPF-49921.7.8.0
ˆ200F9cJwp#nvkM1G~Š200F9cJwp#nvkM1G~
209435 EDG 38INVESCOCORPORATE BOND
28-Oct-2021 19:06 ESTHTMLAN
Donnelley Financial LSWtambg0apNone
2*ESS 0C
VDI-W10-LPF-49921.7.8.0
Page 2 of 2
38 Invesco Corporate Bond Fund
extent and quality of the services provided.The Board noted that Invesco Advisersprovided information demonstrating that

ˆ200F9cJwp#nvmfaGYŠ200F9cJwp#nvmfaGY
209435 EDG 39INVESCOCORPORATE BOND
28-Oct-2021 19:06 ESTHTMLAN
Donnelley Financial LSWtambg0apNone
2*ESS 0C
VDI-W10-LPF-49921.7.8.0
Page 1 of 1
(This page intentionally left blank)
ˆ200F9cJwp$4RY!ko#Š200F9cJwp$4RY!ko#
209435 EDG 40INVESCOCORPORATE BOND
29-Oct-2021 07:52 ESTHTMLAN
Donnelley Financial LSWmapaa0apNone
3*ESS 0C
VDI-W10-DPF-37821.7.8.0
sp40sp40a
Page 1 of 1
Go paperless with eDeliveryVisit invesco.com/edelivery to enjoy the convenience and security of anytime electronic access to your investmentdocuments.With eDelivery, you can elect to have any or all of the following materials delivered straight to your inbox to download, saveand print from your own computer:
∎ Fund reports and prospectuses∎ Quarterly statements∎ Daily confirmations∎ Tax forms
Invesco mailing informationSend general correspondence to Invesco Investment Services, Inc., P.O. Box 219078, Kansas City, MO 64121-9078.
Important notice regarding delivery of security holder documentsTo reduce Fund expenses, only one copy of most shareholder documents may be mailed to shareholders with multipleaccounts at the same address (Householding). Mailing of your shareholder documents may be householded indefinitelyunless you instruct us otherwise. If you do not want the mailing of these documents to be combined with those for othermembers of your household, please contact Invesco Investment Services, Inc. at 800 959 4246 or contact your financialinstitution. We will begin sending you individual copies for each account within 30 days after receiving your request.
Fund holdings and proxy voting informationThe Fund provides a complete list of its portfolio holdings four times each fiscal year, at the end of each fiscal quarter. For thesecond and fourth quarters, the list appears, respectively, in the Fund’s semiannual and annual reports to shareholders. Forthe first and third quarters, the Fund files the list with the Securities and Exchange Commission (SEC) as an exhibit to itsreports on Form N-PORT. The most recent list of portfolio holdings is available at invesco.com/completeqtrholdings.Shareholders can also look up the Fund’s Form N-PORT filings on the SEC website, sec.gov. The SEC file numbers for theFund are shown below.
A description of the policies and procedures that the Fund uses to determine how to vote proxies relating to portfoliosecurities is available without charge, upon request, from our Client Services department at 800 959 4246, or at invesco.com/corporate/about-us/esg. The information is also available on the SEC website, sec.gov.
Information regarding how the Fund voted proxies related to its portfolio securities during the most recent 12-month periodended June 30 is available at invesco.com/proxysearch. This information is also available on the SEC website, sec.gov.
Invesco Advisers, Inc. is an investment adviser; it provides investment advisory services to individual and institutionalclients and does not sell securities. Invesco Distributors, Inc. is the US distributor for Invesco Ltd.’s retail mutual funds,exchange-traded funds and institutional money market funds. Both are wholly owned, indirect subsidiaries of Invesco Ltd.
SEC file number(s): 811-05686 and 033-39519 Invesco Distributors, Inc. VK-CBD-SAR-1
ˆ200FBT43DrDtPQ!ouŠ200FBT43DrDtPQ!ou
215753 EDG 1INVESCOGLOBAL REAL ESTATE
29-Oct-2021 07:58 ESTHTMDTF
Donnelley Financial LSWraths1apNone
9*ESS 0C
VDI-W10-LPF-11621.7.8.0
dsp001a
Page 1 of 1
Semiannual Report to Shareholders
August 31, 2021
Invesco Global Real Estate Fund
Nasdaq: A: AGREX ∎ C: CGREX ∎ R: RGREX ∎ Y: ARGYX ∎ R5: IGREX ∎ R6: FGREX
2 Fund Performance4 Liquidity Risk Management Program5 Schedule of Investments8 Financial Statements11 Financial Highlights12 Notes to Financial Statements18 Fund Expenses19 Approval of Investment Advisory and Sub-Advisory Contracts
For the most current month-end Fund performance and commentary, please visit invesco.com/performance.Unless otherwise noted, all data provided by Invesco.This report must be accompanied or preceded by a currently effective Fund prospectus, which contains more complete information, includingsales charges and expenses. Investors should read it carefully before investing. NOT FDIC INSURED | MAY LOSE VALUE | NO BANK GUARANTEE
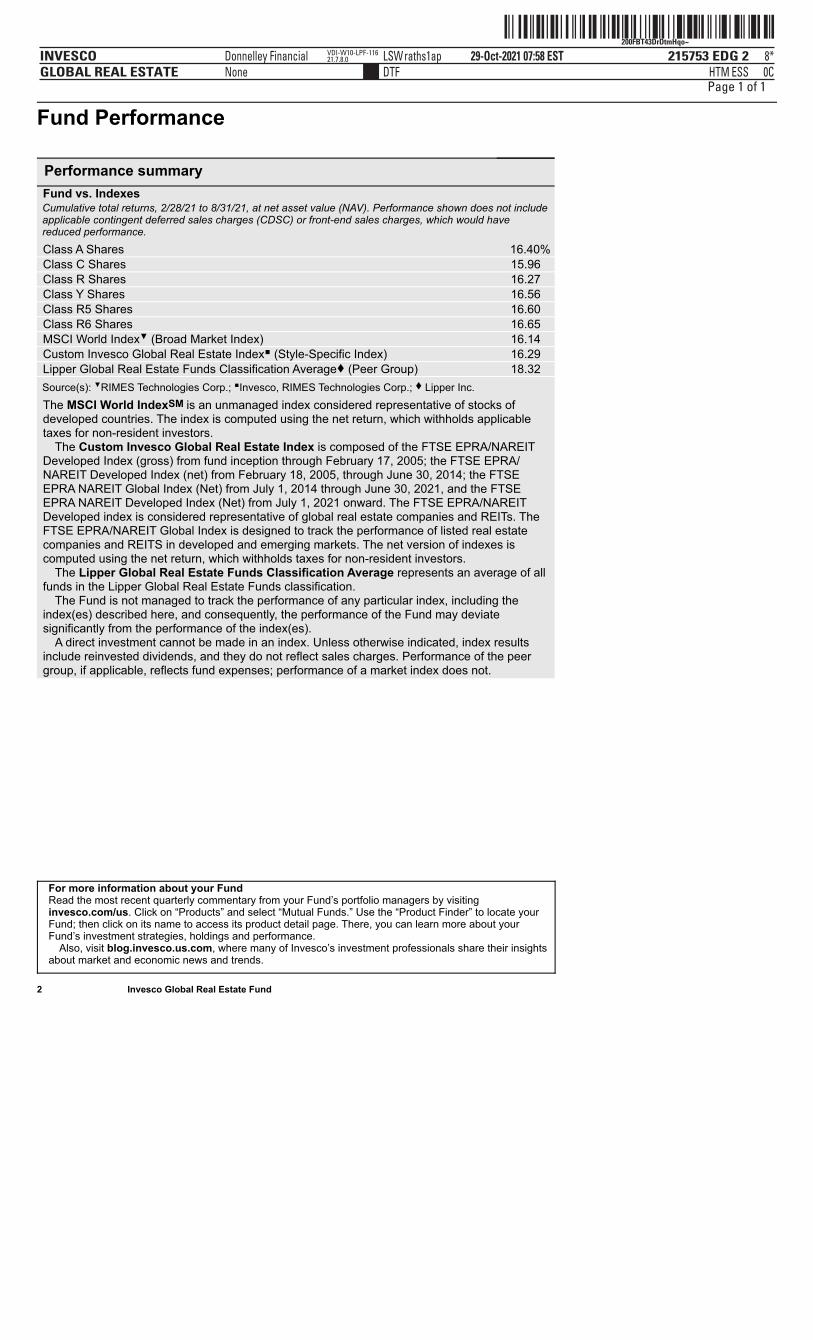
ˆ200FBT43DrDtmHqo~Š200FBT43DrDtmHqo~
215753 EDG 2INVESCOGLOBAL REAL ESTATE
29-Oct-2021 07:58 ESTHTMDTF
Donnelley Financial LSWraths1apNone
8*ESS 0C
VDI-W10-LPF-11621.7.8.0
Page 1 of 1 Fund Performance
Performance summary Fund vs. Indexes Cumulative total returns, 2/28/21 to 8/31/21, at net asset value (NAV). Performance shown does not includeapplicable contingent deferred sales charges (CDSC) or front-end sales charges, which would havereduced performance.
Class A Shares 16.40% Class C Shares 15.96 Class R Shares 16.27 Class Y Shares 16.56 Class R5 Shares 16.60 Class R6 Shares 16.65 MSCI World Index▼ (Broad Market Index) 16.14 Custom Invesco Global Real Estate Index∎ (Style-Specific Index) 16.29 Lipper Global Real Estate Funds Classification Average (Peer Group) 18.32 Source(s): ▼RIMES Technologies Corp.; ∎Invesco, RIMES Technologies Corp.; Lipper Inc. The MSCI World IndexSM is an unmanaged index considered representative of stocks ofdeveloped countries. The index is computed using the net return, which withholds applicabletaxes for non-resident investors.
The Custom Invesco Global Real Estate Index is composed of the FTSE EPRA/NAREITDeveloped Index (gross) from fund inception through February 17, 2005; the FTSE EPRA/NAREIT Developed Index (net) from February 18, 2005, through June 30, 2014; the FTSEEPRA NAREIT Global Index (Net) from July 1, 2014 through June 30, 2021, and the FTSEEPRA NAREIT Developed Index (Net) from July 1, 2021 onward. The FTSE EPRA/NAREITDeveloped index is considered representative of global real estate companies and REITs. TheFTSE EPRA/NAREIT Global Index is designed to track the performance of listed real estatecompanies and REITS in developed and emerging markets. The net version of indexes iscomputed using the net return, which withholds taxes for non-resident investors.
The Lipper Global Real Estate Funds Classification Average represents an average of allfunds in the Lipper Global Real Estate Funds classification.
The Fund is not managed to track the performance of any particular index, including theindex(es) described here, and consequently, the performance of the Fund may deviatesignificantly from the performance of the index(es).
A direct investment cannot be made in an index. Unless otherwise indicated, index resultsinclude reinvested dividends, and they do not reflect sales charges. Performance of the peergroup, if applicable, reflects fund expenses; performance of a market index does not.
For more information about your FundRead the most recent quarterly commentary from your Fund’s portfolio managers by visitinginvesco.com/us. Click on “Products” and select “Mutual Funds.” Use the “Product Finder” to locate yourFund; then click on its name to access its product detail page. There, you can learn more about yourFund’s investment strategies, holdings and performance.
Also, visit blog.invesco.us.com, where many of Invesco’s investment professionals share their insightsabout market and economic news and trends.
2 Invesco Global Real Estate Fund
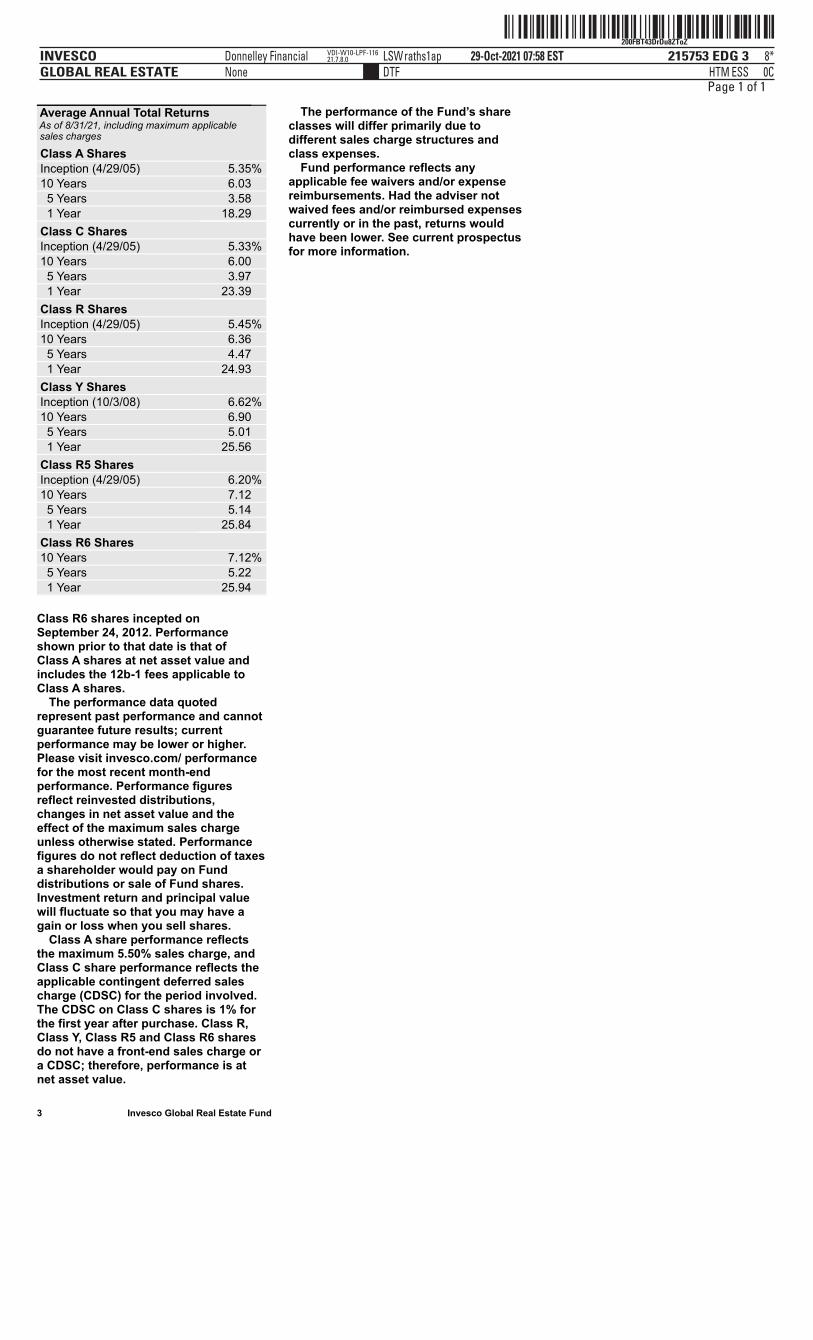
ˆ200FBT43DrDu8ZToZŠ200FBT43DrDu8ZToZ
215753 EDG 3INVESCOGLOBAL REAL ESTATE
29-Oct-2021 07:58 ESTHTMDTF
Donnelley Financial LSWraths1apNone
8*ESS 0C
VDI-W10-LPF-11621.7.8.0
Page 1 of 1
3 Invesco Global Real Estate Fund
Average Annual Total Returns As of 8/31/21, including maximum applicable sales charges
Class A Shares Inception (4/29/05) 5.35% 10 Years 6.03 5 Years 3.58 1 Year 18.29 Class C Shares Inception (4/29/05) 5.33% 10 Years 6.00 5 Years 3.97 1 Year 23.39 Class R Shares Inception (4/29/05) 5.45% 10 Years 6.36 5 Years 4.47 1 Year 24.93 Class Y Shares Inception (10/3/08) 6.62% 10 Years 6.90 5 Years 5.01 1 Year 25.56 Class R5 Shares Inception (4/29/05) 6.20% 10 Years 7.12 5 Years 5.14 1 Year 25.84 Class R6 Shares 10 Years 7.12% 5 Years 5.22 1 Year 25.94
Class R6 shares incepted onSeptember 24, 2012. Performanceshown prior to that date is that ofClass A shares at net asset value andincludes the 12b-1 fees applicable toClass A shares.
The performance data quotedrepresent past performance and cannotguarantee future results; currentperformance may be lower or higher.Please visit invesco.com/ performancefor the most recent month-endperformance. Performance figuresreflect reinvested distributions,changes in net asset value and theeffect of the maximum sales chargeunless otherwise stated. Performancefigures do not reflect deduction of taxesa shareholder would pay on Funddistributions or sale of Fund shares.Investment return and principal valuewill fluctuate so that you may have again or loss when you sell shares.
Class A share performance reflectsthe maximum 5.50% sales charge, andClass C share performance reflects theapplicable contingent deferred salescharge (CDSC) for the period involved.The CDSC on Class C shares is 1% forthe first year after purchase. Class R,Class Y, Class R5 and Class R6 sharesdo not have a front-end sales charge ora CDSC; therefore, performance is atnet asset value.
The performance of the Fund’s shareclasses will differ primarily due todifferent sales charge structures andclass expenses.
Fund performance reflects anyapplicable fee waivers and/or expensereimbursements. Had the adviser notwaived fees and/or reimbursed expensescurrently or in the past, returns wouldhave been lower. See current prospectusfor more information.
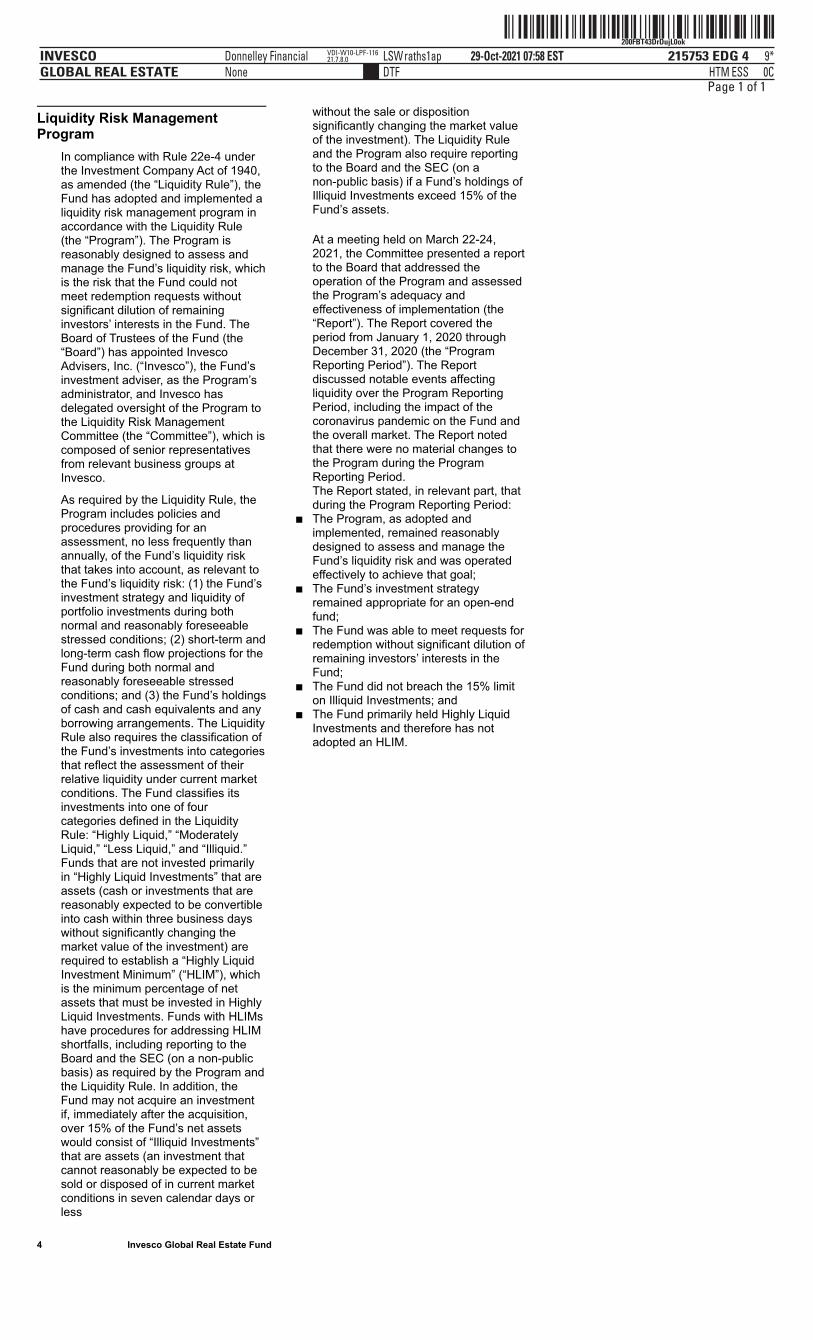
ˆ200FBT43DrDujL0okŠ200FBT43DrDujL0ok
215753 EDG 4INVESCOGLOBAL REAL ESTATE
29-Oct-2021 07:58 ESTHTMDTF
Donnelley Financial LSWraths1apNone
9*ESS 0C
VDI-W10-LPF-11621.7.8.0
Page 1 of 1
4 Invesco Global Real Estate Fund
Liquidity Risk ManagementProgram
In compliance with Rule 22e-4 underthe Investment Company Act of 1940,as amended (the “Liquidity Rule”), theFund has adopted and implemented aliquidity risk management program inaccordance with the Liquidity Rule(the “Program”). The Program isreasonably designed to assess andmanage the Fund’s liquidity risk, whichis the risk that the Fund could notmeet redemption requests withoutsignificant dilution of remaininginvestors’ interests in the Fund. TheBoard of Trustees of the Fund (the“Board”) has appointed InvescoAdvisers, Inc. (“Invesco”), the Fund’sinvestment adviser, as the Program’sadministrator, and Invesco hasdelegated oversight of the Program tothe Liquidity Risk ManagementCommittee (the “Committee”), which iscomposed of senior representativesfrom relevant business groups atInvesco.
As required by the Liquidity Rule, theProgram includes policies andprocedures providing for anassessment, no less frequently thanannually, of the Fund’s liquidity riskthat takes into account, as relevant tothe Fund’s liquidity risk: (1) the Fund’sinvestment strategy and liquidity ofportfolio investments during bothnormal and reasonably foreseeablestressed conditions; (2) short-term andlong-term cash flow projections for theFund during both normal andreasonably foreseeable stressedconditions; and (3) the Fund’s holdingsof cash and cash equivalents and anyborrowing arrangements. The LiquidityRule also requires the classification ofthe Fund’s investments into categoriesthat reflect the assessment of theirrelative liquidity under current marketconditions. The Fund classifies itsinvestments into one of fourcategories defined in the LiquidityRule: “Highly Liquid,” “ModeratelyLiquid,” “Less Liquid,” and “Illiquid.”Funds that are not invested primarilyin “Highly Liquid Investments” that areassets (cash or investments that arereasonably expected to be convertibleinto cash within three business dayswithout significantly changing themarket value of the investment) arerequired to establish a “Highly LiquidInvestment Minimum” (“HLIM”), whichis the minimum percentage of netassets that must be invested in HighlyLiquid Investments. Funds with HLIMshave procedures for addressing HLIMshortfalls, including reporting to theBoard and the SEC (on a non-publicbasis) as required by the Program andthe Liquidity Rule. In addition, theFund may not acquire an investmentif, immediately after the acquisition,over 15% of the Fund’s net assetswould consist of “Illiquid Investments”that are assets (an investment thatcannot reasonably be expected to besold or disposed of in current marketconditions in seven calendar days orless
without the sale or dispositionsignificantly changing the market valueof the investment). The Liquidity Ruleand the Program also require reportingto the Board and the SEC (on anon-public basis) if a Fund’s holdings ofIlliquid Investments exceed 15% of theFund’s assets.
At a meeting held on March 22-24,2021, the Committee presented a reportto the Board that addressed theoperation of the Program and assessedthe Program’s adequacy andeffectiveness of implementation (the“Report”). The Report covered theperiod from January 1, 2020 throughDecember 31, 2020 (the “ProgramReporting Period”). The Reportdiscussed notable events affectingliquidity over the Program ReportingPeriod, including the impact of thecoronavirus pandemic on the Fund andthe overall market. The Report notedthat there were no material changes tothe Program during the ProgramReporting Period.
The Report stated, in relevant part, thatduring the Program Reporting Period:
∎ The Program, as adopted andimplemented, remained reasonablydesigned to assess and manage theFund’s liquidity risk and was operatedeffectively to achieve that goal;
∎ The Fund’s investment strategy
remained appropriate for an open-endfund;
∎ The Fund was able to meet requests forredemption without significant dilution ofremaining investors’ interests in theFund;
∎ The Fund did not breach the 15% limiton Illiquid Investments; and
∎ The Fund primarily held Highly Liquid
Investments and therefore has notadopted an HLIM.
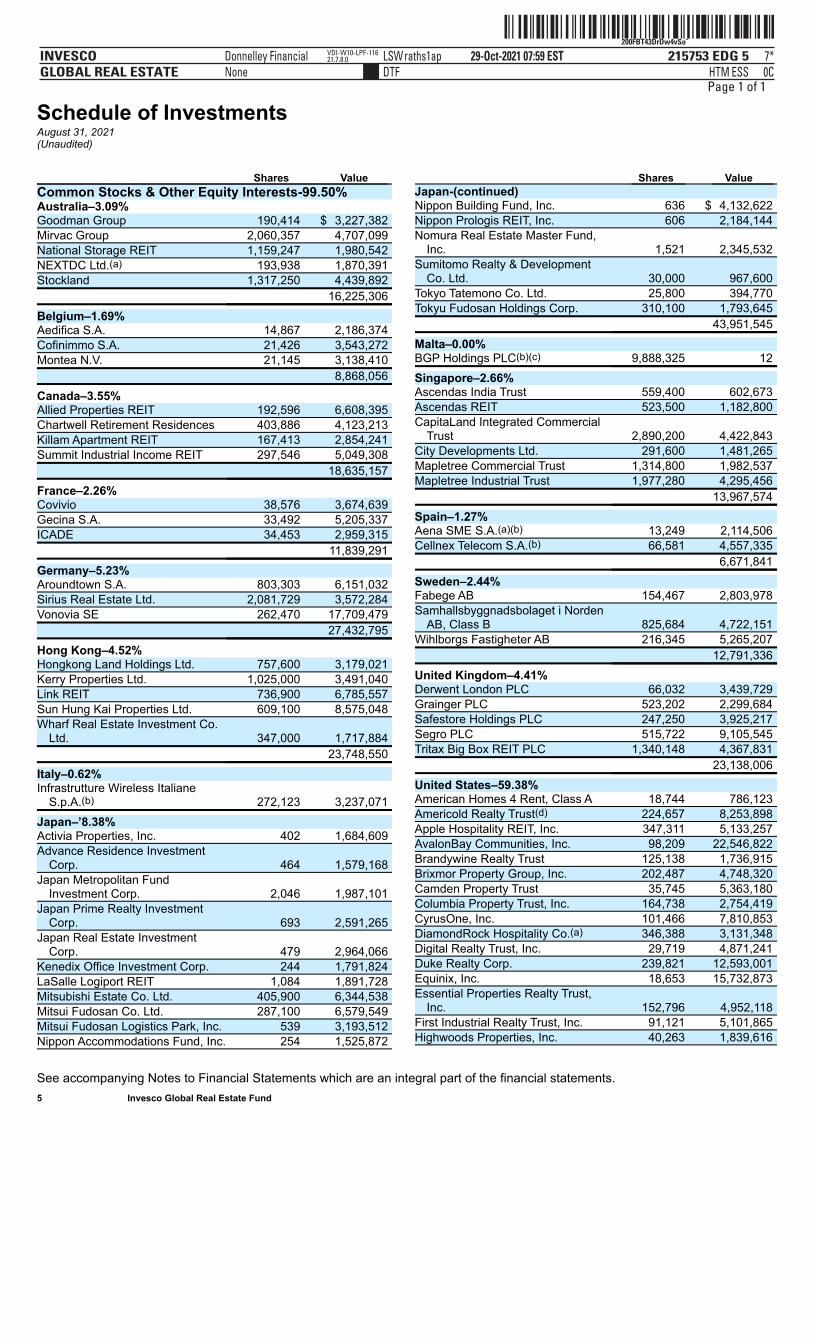
ˆ200FBT43DrDw4vSoÆŠ200FBT43DrDw4vSo˘
215753 EDG 5INVESCOGLOBAL REAL ESTATE
29-Oct-2021 07:59 ESTHTMDTF
Donnelley Financial LSWraths1apNone
7*ESS 0C
VDI-W10-LPF-11621.7.8.0
Page 1 of 1
Schedule of InvestmentsAugust 31, 2021(Unaudited)
See accompanying Notes to Financial Statements which are an integral part of the financial statements.5 Invesco Global Real Estate Fund
Shares Value Common Stocks & Other Equity Interests-99.50% Australia–3.09% Goodman Group 190,414 $ 3,227,382 Mirvac Group 2,060,357 4,707,099 National Storage REIT 1,159,247 1,980,542 NEXTDC Ltd.(a) 193,938 1,870,391 Stockland 1,317,250 4,439,892 16,225,306 Belgium–1.69% Aedifica S.A. 14,867 2,186,374 Cofinimmo S.A. 21,426 3,543,272 Montea N.V. 21,145 3,138,410 8,868,056 Canada–3.55% Allied Properties REIT 192,596 6,608,395 Chartwell Retirement Residences 403,886 4,123,213 Killam Apartment REIT 167,413 2,854,241 Summit Industrial Income REIT 297,546 5,049,308 18,635,157 France–2.26% Covivio 38,576 3,674,639 Gecina S.A. 33,492 5,205,337 ICADE 34,453 2,959,315 11,839,291 Germany–5.23% Aroundtown S.A. 803,303 6,151,032 Sirius Real Estate Ltd. 2,081,729 3,572,284 Vonovia SE 262,470 17,709,479 27,432,795 Hong Kong–4.52% Hongkong Land Holdings Ltd. 757,600 3,179,021 Kerry Properties Ltd. 1,025,000 3,491,040 Link REIT 736,900 6,785,557 Sun Hung Kai Properties Ltd. 609,100 8,575,048 Wharf Real Estate Investment Co.
Ltd. 347,000 1,717,884 23,748,550 Italy–0.62% Infrastrutture Wireless Italiane
S.p.A.(b) 272,123 3,237,071 Japan–’8.38% Activia Properties, Inc. 402 1,684,609 Advance Residence Investment
Corp. 464 1,579,168 Japan Metropolitan Fund
Investment Corp. 2,046 1,987,101 Japan Prime Realty Investment
Corp. 693 2,591,265 Japan Real Estate Investment
Corp. 479 2,964,066 Kenedix Office Investment Corp. 244 1,791,824 LaSalle Logiport REIT 1,084 1,891,728 Mitsubishi Estate Co. Ltd. 405,900 6,344,538 Mitsui Fudosan Co. Ltd. 287,100 6,579,549 Mitsui Fudosan Logistics Park, Inc. 539 3,193,512 Nippon Accommodations Fund, Inc. 254 1,525,872
Shares Value Japan-(continued) Nippon Building Fund, Inc. 636 $ 4,132,622 Nippon Prologis REIT, Inc. 606 2,184,144 Nomura Real Estate Master Fund,
Inc. 1,521 2,345,532 Sumitomo Realty & Development
Co. Ltd. 30,000 967,600 Tokyo Tatemono Co. Ltd. 25,800 394,770 Tokyu Fudosan Holdings Corp. 310,100 1,793,645 43,951,545 Malta–0.00% BGP Holdings PLC(b)(c) 9,888,325 12 Singapore–2.66% Ascendas India Trust 559,400 602,673 Ascendas REIT 523,500 1,182,800 CapitaLand Integrated Commercial
Trust 2,890,200 4,422,843 City Developments Ltd. 291,600 1,481,265 Mapletree Commercial Trust 1,314,800 1,982,537 Mapletree Industrial Trust 1,977,280 4,295,456 13,967,574 Spain–1.27% Aena SME S.A.(a)(b) 13,249 2,114,506 Cellnex Telecom S.A.(b) 66,581 4,557,335 6,671,841 Sweden–2.44% Fabege AB 154,467 2,803,978 Samhallsbyggnadsbolaget i Norden
AB, Class B 825,684 4,722,151 Wihlborgs Fastigheter AB 216,345 5,265,207 12,791,336 United Kingdom–4.41% Derwent London PLC 66,032 3,439,729 Grainger PLC 523,202 2,299,684 Safestore Holdings PLC 247,250 3,925,217 Segro PLC 515,722 9,105,545 Tritax Big Box REIT PLC 1,340,148 4,367,831 23,138,006 United States–59.38% American Homes 4 Rent, Class A 18,744 786,123 Americold Realty Trust(d) 224,657 8,253,898 Apple Hospitality REIT, Inc. 347,311 5,133,257 AvalonBay Communities, Inc. 98,209 22,546,822 Brandywine Realty Trust 125,138 1,736,915 Brixmor Property Group, Inc. 202,487 4,748,320 Camden Property Trust 35,745 5,363,180 Columbia Property Trust, Inc. 164,738 2,754,419 CyrusOne, Inc. 101,466 7,810,853 DiamondRock Hospitality Co.(a) 346,388 3,131,348 Digital Realty Trust, Inc. 29,719 4,871,241 Duke Realty Corp. 239,821 12,593,001 Equinix, Inc. 18,653 15,732,873 Essential Properties Realty Trust,
Inc. 152,796 4,952,118 First Industrial Realty Trust, Inc. 91,121 5,101,865 Highwoods Properties, Inc. 40,263 1,839,616
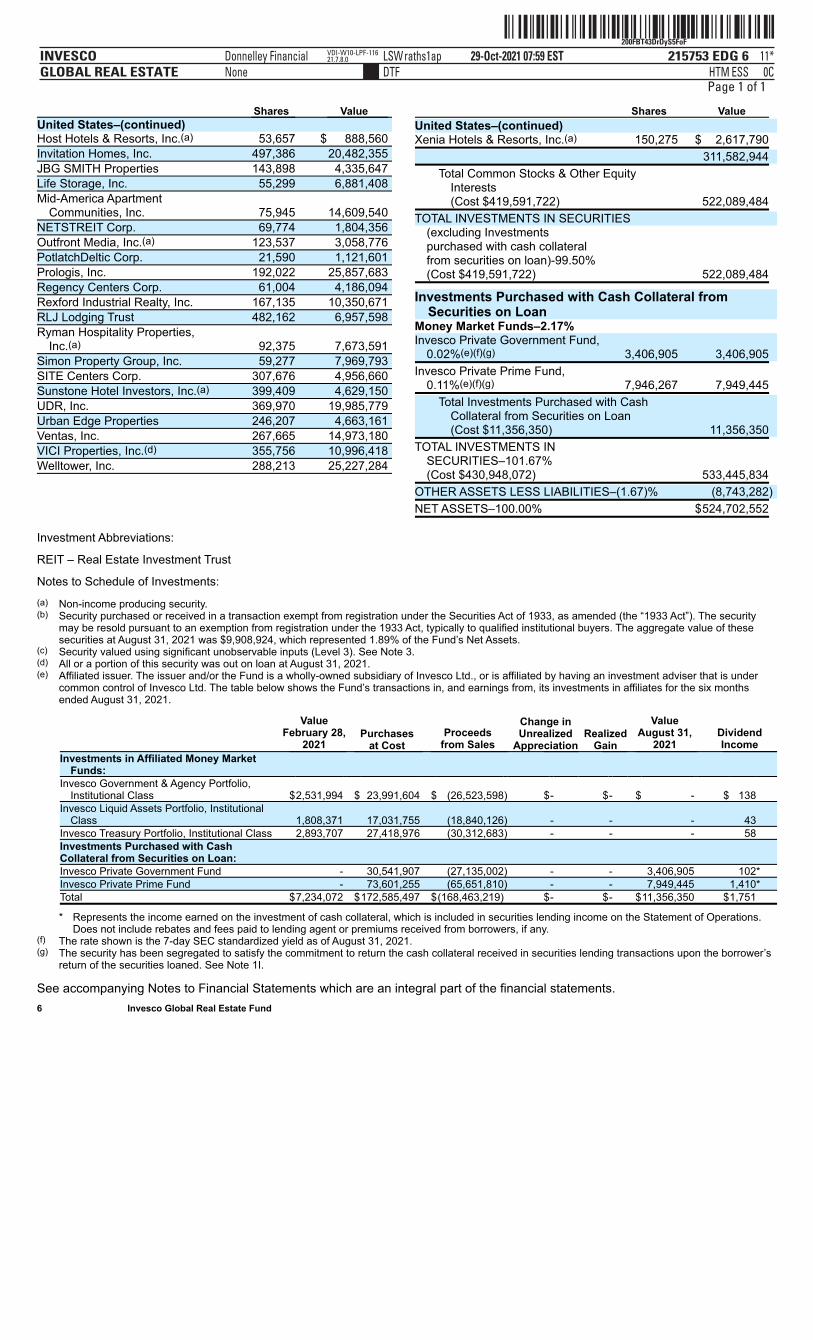
ˆ200FBT43DrDyS5FoFŠ200FBT43DrDyS5FoF
215753 EDG 6INVESCOGLOBAL REAL ESTATE
29-Oct-2021 07:59 ESTHTMDTF
Donnelley Financial LSWraths1apNone
11*ESS 0C
VDI-W10-LPF-11621.7.8.0
Page 1 of 1
Investment Abbreviations:
REIT – Real Estate Investment Trust
Notes to Schedule of Investments:
(a) Non-income producing security.(b) Security purchased or received in a transaction exempt from registration under the Securities Act of 1933, as amended (the “1933 Act”). The security
may be resold pursuant to an exemption from registration under the 1933 Act, typically to qualified institutional buyers. The aggregate value of thesesecurities at August 31, 2021 was $9,908,924, which represented 1.89% of the Fund’s Net Assets.
(c) Security valued using significant unobservable inputs (Level 3). See Note 3.(d) All or a portion of this security was out on loan at August 31, 2021.(e) Affiliated issuer. The issuer and/or the Fund is a wholly-owned subsidiary of Invesco Ltd., or is affiliated by having an investment adviser that is under
common control of Invesco Ltd. The table below shows the Fund’s transactions in, and earnings from, its investments in affiliates for the six monthsended August 31, 2021.
ValueFebruary 28,
2021 Purchases
at Cost Proceeds
from Sales
Change inUnrealized
Appreciation Realized
Gain
ValueAugust 31,
2021 DividendIncome
Investments in Affiliated Money MarketFunds:
Invesco Government & Agency Portfolio,Institutional Class $2,531,994 $ 23,991,604 $ (26,523,598) $- $- $ - $ 138
Invesco Liquid Assets Portfolio, InstitutionalClass 1,808,371 17,031,755 (18,840,126) - - - 43
Invesco Treasury Portfolio, Institutional Class 2,893,707 27,418,976 (30,312,683) - - - 58Investments Purchased with CashCollateral from Securities on Loan: Invesco Private Government Fund - 30,541,907 (27,135,002) - - 3,406,905 102*Invesco Private Prime Fund - 73,601,255 (65,651,810) - - 7,949,445 1,410*Total $7,234,072 $172,585,497 $(168,463,219) $- $- $11,356,350 $1,751
* Represents the income earned on the investment of cash collateral, which is included in securities lending income on the Statement of Operations.Does not include rebates and fees paid to lending agent or premiums received from borrowers, if any.
(f) The rate shown is the 7-day SEC standardized yield as of August 31, 2021.(g) The security has been segregated to satisfy the commitment to return the cash collateral received in securities lending transactions upon the borrower’s
return of the securities loaned. See Note 1I.
See accompanying Notes to Financial Statements which are an integral part of the financial statements.6 Invesco Global Real Estate Fund
Shares Value United States–(continued) Host Hotels & Resorts, Inc.(a) 53,657 $ 888,560 Invitation Homes, Inc. 497,386 20,482,355 JBG SMITH Properties 143,898 4,335,647 Life Storage, Inc. 55,299 6,881,408 Mid-America Apartment
Communities, Inc. 75,945 14,609,540 NETSTREIT Corp. 69,774 1,804,356 Outfront Media, Inc.(a) 123,537 3,058,776 PotlatchDeltic Corp. 21,590 1,121,601 Prologis, Inc. 192,022 25,857,683 Regency Centers Corp. 61,004 4,186,094 Rexford Industrial Realty, Inc. 167,135 10,350,671 RLJ Lodging Trust 482,162 6,957,598 Ryman Hospitality Properties,
Inc.(a) 92,375 7,673,591 Simon Property Group, Inc. 59,277 7,969,793 SITE Centers Corp. 307,676 4,956,660 Sunstone Hotel Investors, Inc.(a) 399,409 4,629,150 UDR, Inc. 369,970 19,985,779 Urban Edge Properties 246,207 4,663,161 Ventas, Inc. 267,665 14,973,180 VICI Properties, Inc.(d) 355,756 10,996,418 Welltower, Inc. 288,213 25,227,284
Shares Value
United States–(continued) Xenia Hotels & Resorts, Inc.(a) 150,275 $ 2,617,790
311,582,944
Total Common Stocks & Other EquityInterests(Cost $419,591,722)
522,089,484
TOTAL INVESTMENTS IN SECURITIES (excluding Investmentspurchased with cash collateralfrom securities on loan)-99.50%(Cost $419,591,722) 522,089,484
Investments Purchased with Cash Collateral fromSecurities on Loan
Money Market Funds–2.17% Invesco Private Government Fund,
0.02%(e)(f)(g) 3,406,905 3,406,905
Invesco Private Prime Fund,0.11%(e)(f)(g) 7,946,267 7,949,445
Total Investments Purchased with CashCollateral from Securities on Loan(Cost $11,356,350)
11,356,350
TOTAL INVESTMENTS INSECURITIES–101.67%(Cost $430,948,072)
533,445,834
OTHER ASSETS LESS LIABILITIES–(1.67)% (8,743,282)
NET ASSETS–100.00% $524,702,552

ˆ200FBT43DrDycqto9Š200FBT43DrDycqto9
215753 EDG 7INVESCOGLOBAL REAL ESTATE
29-Oct-2021 07:59 ESTHTMDTF
Donnelley Financial LSWraths1apNone
7*ESS 0C
VDI-W10-LPF-11621.7.8.0
Page 1 of 1
See accompanying Notes to Financial Statements which are an integral part of the financial statements.7 Invesco Global Real Estate Fund
Portfolio CompositionBy country, based on Net Assetsas of August 31, 2021 United States 59.38% Japan 8.38 Germany 5.23 Hong Kong 4.52 United Kingdom 4.41 Canada 3.55 Australia 3.09 Singapore 2.66 Sweden 2.44 France 2.26 Countries each less than 2% of portfolio 3.58 Money Market Funds Plus Other Assets Less
Liabilities 0.50
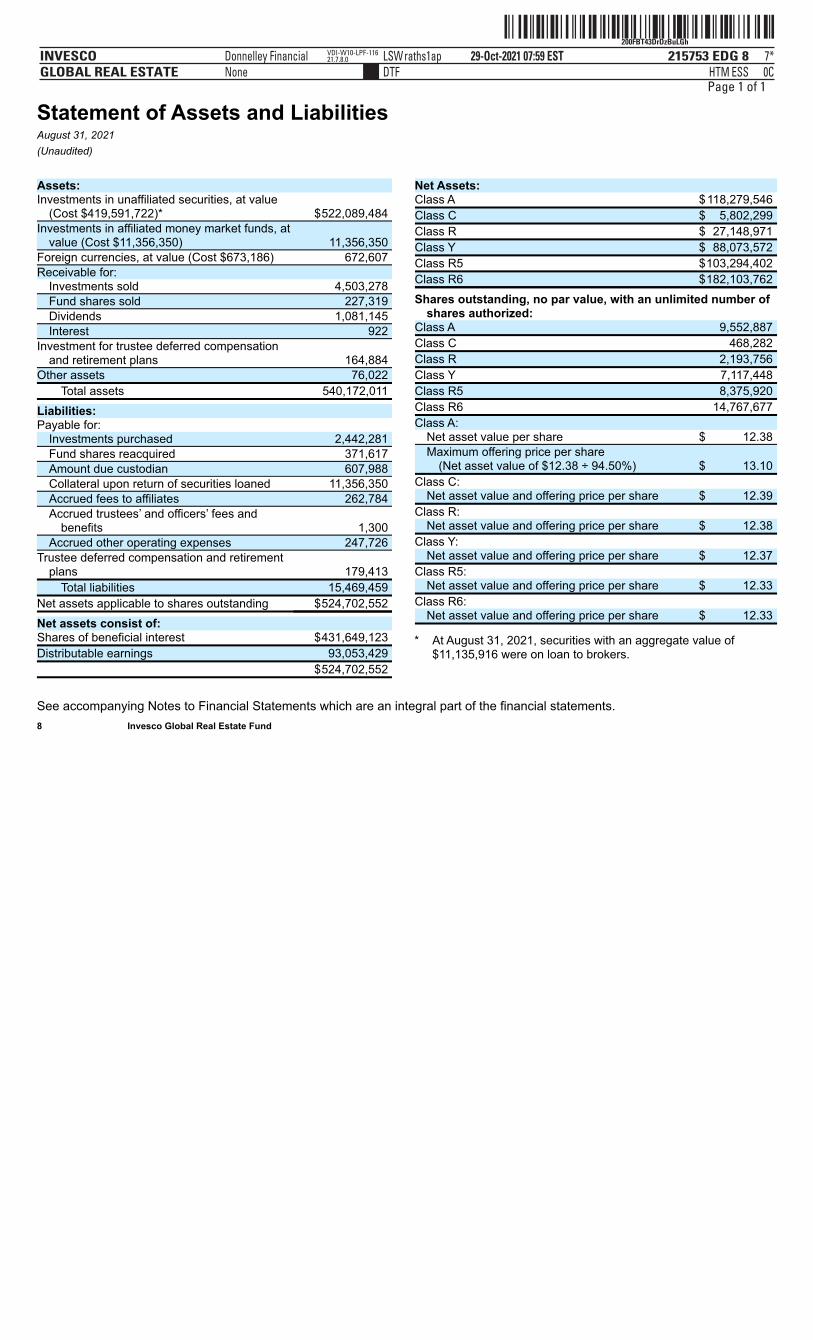
ˆ200FBT43DrDzBuLGhŠ200FBT43DrDzBuLGh
215753 EDG 8INVESCOGLOBAL REAL ESTATE
29-Oct-2021 07:59 ESTHTMDTF
Donnelley Financial LSWraths1apNone
7*ESS 0C
VDI-W10-LPF-11621.7.8.0
Page 1 of 1
Statement of Assets and LiabilitiesAugust 31, 2021(Unaudited)
See accompanying Notes to Financial Statements which are an integral part of the financial statements.8 Invesco Global Real Estate Fund
Assets: Investments in unaffiliated securities, at value
(Cost $419,591,722)* $522,089,484 Investments in affiliated money market funds, at
value (Cost $11,356,350) 11,356,350 Foreign currencies, at value (Cost $673,186) 672,607 Receivable for:
Investments sold 4,503,278 Fund shares sold 227,319 Dividends 1,081,145 Interest 922
Investment for trustee deferred compensationand retirement plans 164,884
Other assets 76,022 Total assets 540,172,011
Liabilities: Payable for:
Investments purchased 2,442,281 Fund shares reacquired 371,617 Amount due custodian 607,988 Collateral upon return of securities loaned 11,356,350 Accrued fees to affiliates 262,784 Accrued trustees’ and officers’ fees and
benefits 1,300 Accrued other operating expenses 247,726
Trustee deferred compensation and retirementplans 179,413
Total liabilities 15,469,459 Net assets applicable to shares outstanding $524,702,552 Net assets consist of: Shares of beneficial interest $431,649,123 Distributable earnings 93,053,429 $524,702,552
Net Assets: Class A $118,279,546 Class C $ 5,802,299 Class R $ 27,148,971 Class Y $ 88,073,572 Class R5 $103,294,402 Class R6 $182,103,762 Shares outstanding, no par value, with an unlimited number of
shares authorized:
Class A 9,552,887 Class C 468,282 Class R 2,193,756 Class Y 7,117,448 Class R5 8,375,920 Class R6 14,767,677 Class A:
Net asset value per share $ 12.38 Maximum offering price per share
(Net asset value of $12.38 ÷ 94.50%) $ 13.10 Class C:
Net asset value and offering price per share $ 12.39 Class R:
Net asset value and offering price per share $ 12.38 Class Y:
Net asset value and offering price per share $ 12.37 Class R5:
Net asset value and offering price per share $ 12.33 Class R6:
Net asset value and offering price per share $ 12.33
* At August 31, 2021, securities with an aggregate value of$11,135,916 were on loan to brokers.
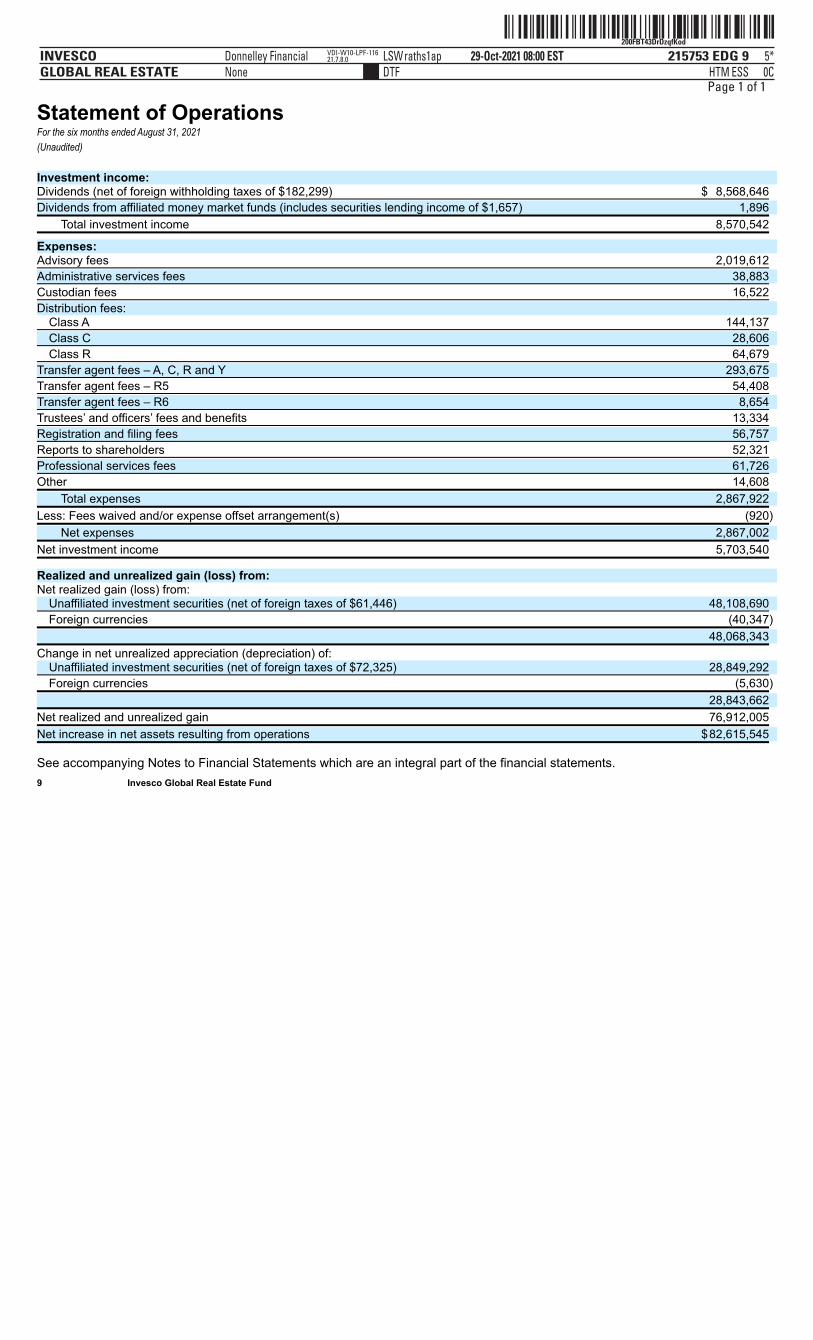
ˆ200FBT43DrDzqfKodŠ200FBT43DrDzqfKod
215753 EDG 9INVESCOGLOBAL REAL ESTATE
29-Oct-2021 08:00 ESTHTMDTF
Donnelley Financial LSWraths1apNone
5*ESS 0C
VDI-W10-LPF-11621.7.8.0
Page 1 of 1
Statement of OperationsFor the six months ended August 31, 2021(Unaudited) Investment income: Dividends (net of foreign withholding taxes of $182,299) $ 8,568,646
Dividends from affiliated money market funds (includes securities lending income of $1,657) 1,896
Total investment income 8,570,542
Expenses: Advisory fees 2,019,612
Administrative services fees 38,883
Custodian fees 16,522
Distribution fees: Class A 144,137
Class C 28,606
Class R 64,679
Transfer agent fees – A, C, R and Y 293,675
Transfer agent fees – R5 54,408
Transfer agent fees – R6 8,654
Trustees’ and officers’ fees and benefits 13,334
Registration and filing fees 56,757
Reports to shareholders 52,321
Professional services fees 61,726
Other 14,608
Total expenses 2,867,922
Less: Fees waived and/or expense offset arrangement(s) (920)
Net expenses 2,867,002
Net investment income 5,703,540
Realized and unrealized gain (loss) from: Net realized gain (loss) from:
Unaffiliated investment securities (net of foreign taxes of $61,446) 48,108,690
Foreign currencies (40,347)
48,068,343
Change in net unrealized appreciation (depreciation) of: Unaffiliated investment securities (net of foreign taxes of $72,325) 28,849,292
Foreign currencies (5,630)
28,843,662
Net realized and unrealized gain 76,912,005
Net increase in net assets resulting from operations $82,615,545
See accompanying Notes to Financial Statements which are an integral part of the financial statements.9 Invesco Global Real Estate Fund
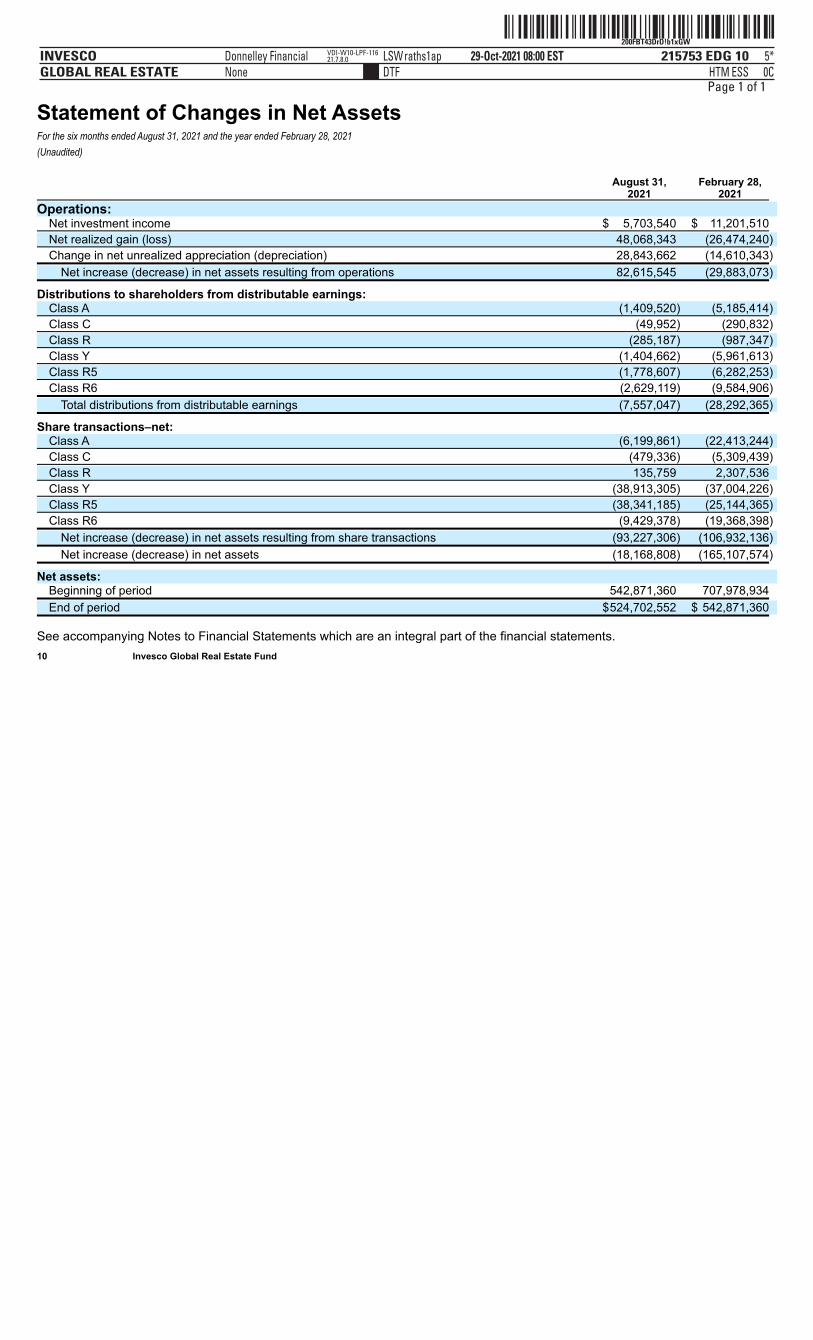
ˆ200FBT43DrD!b1xGWŠ200FBT43DrD!b1xGW
215753 EDG 10INVESCOGLOBAL REAL ESTATE
29-Oct-2021 08:00 ESTHTMDTF
Donnelley Financial LSWraths1apNone
5*ESS 0C
VDI-W10-LPF-11621.7.8.0
Page 1 of 1
Statement of Changes in Net AssetsFor the six months ended August 31, 2021 and the year ended February 28, 2021(Unaudited) August 31, February 28, 2021 2021
Operations: Net investment income $ 5,703,540 $ 11,201,510
Net realized gain (loss) 48,068,343 (26,474,240)
Change in net unrealized appreciation (depreciation) 28,843,662 (14,610,343)
Net increase (decrease) in net assets resulting from operations 82,615,545 (29,883,073)
Distributions to shareholders from distributable earnings: Class A (1,409,520) (5,185,414)
Class C (49,952) (290,832)
Class R (285,187) (987,347)
Class Y (1,404,662) (5,961,613)
Class R5 (1,778,607) (6,282,253)
Class R6 (2,629,119) (9,584,906)
Total distributions from distributable earnings (7,557,047) (28,292,365)
Share transactions–net: Class A (6,199,861) (22,413,244)
Class C (479,336) (5,309,439)
Class R 135,759 2,307,536
Class Y (38,913,305) (37,004,226)
Class R5 (38,341,185) (25,144,365)
Class R6 (9,429,378) (19,368,398)
Net increase (decrease) in net assets resulting from share transactions (93,227,306) (106,932,136)
Net increase (decrease) in net assets (18,168,808) (165,107,574)
Net assets: Beginning of period 542,871,360 707,978,934
End of period $524,702,552 $ 542,871,360
See accompanying Notes to Financial Statements which are an integral part of the financial statements.10 Invesco Global Real Estate Fund
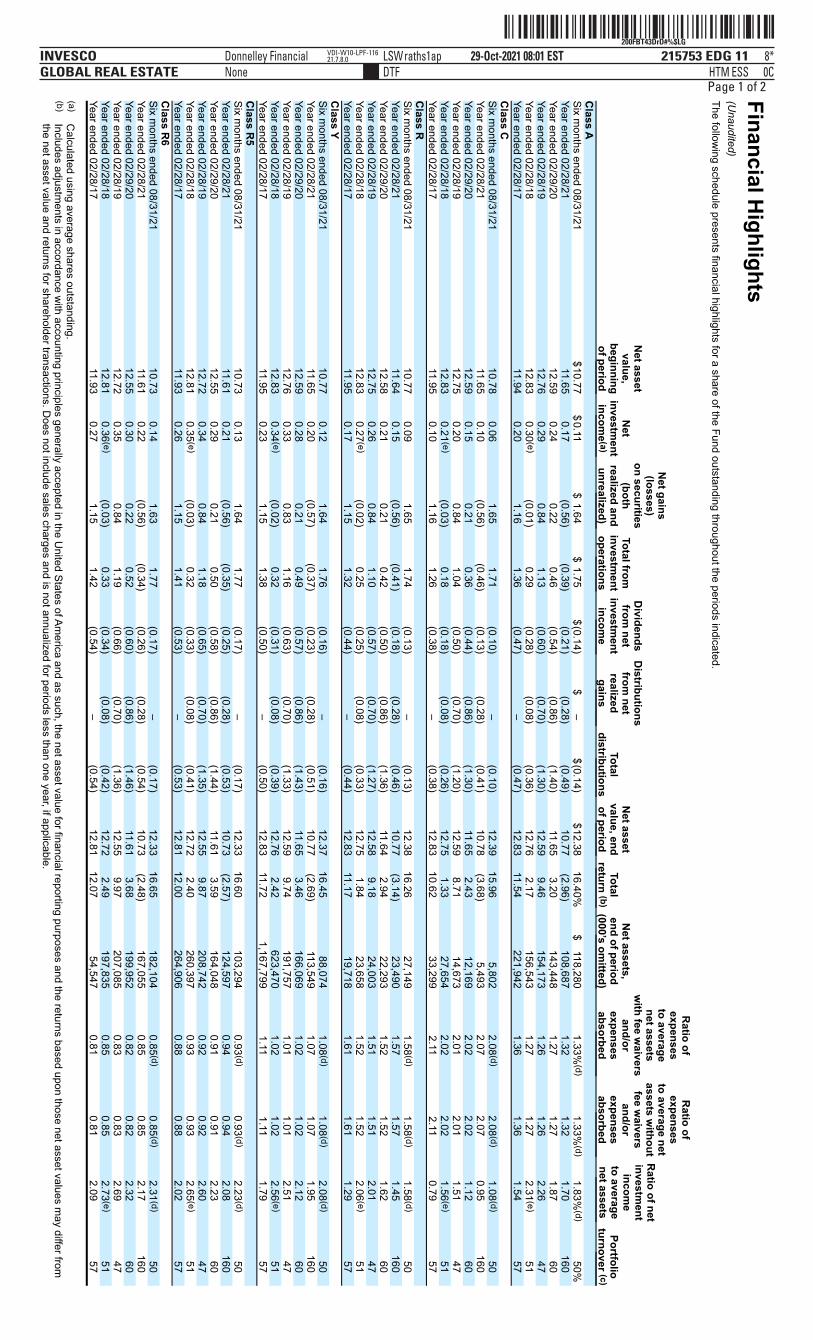
ˆ200FBT43DrD#%$LG‹Š200FBT43DrD#%$LG
215753 EDG 11INVESCOGLOBAL REAL ESTATE
29-Oct-2021 08:01 ESTHTMDTF
Donnelley Financial LSWraths1apNone
8*ESS 0C
VDI-W10-LPF-11621.7.8.0
Page 1 of 2Financial Highlights
(Unaudited)
The following schedule presents financial highlights for a share of the Fund outstanding throughout the periods indicated.
Net assetvalue,
beginningof period
Net
investment
income (a)
Net gains
(losses)on securities
(bothrealized andunrealized)
Total frominvestm
entoperations
Dividends
from net
investment
income
Distributionsfrom
netrealized
gains
Totaldistributions
Net asset
value, endof period
Total
return (b)
Net assets,
end of period(000’s om
itted)
Ratio of
expensesto averagenet assets
with fee w
aiversand/or
expensesabsorbed
Ratio of
expensesto average netassets w
ithoutfee w
aiversand/or
expensesabsorbed
Ratio of net
investment
income
to averagenet assets
Portfolio
turnover (c)C
lass A
Six m
onths ended 08/31/21
$10.77 $0.11
$
1.64
$1.75
$(0.14)
$–
$(0.14)
$12.38 16.40%
$
118,280 1.33%
(d) 1.33%
(d) 1.83%
(d)
50%Year ended 02/28/21
11.65
0.17
(0.56) (0.39)
(0.21) (0.28)
(0.49)
10.77 (2.96)
108,687
1.32
1.32
1.70
160Year ended 02/29/20
12.59
0.24
0.22
0.46
(0.54) (0.86)
(1.40)
11.65 3.20
143,448 1.27
1.27
1.87
60Year ended 02/28/19
12.76
0.29
0.84
1.13
(0.60) (0.70)
(1.30)
12.59 9.46
154,173 1.26
1.26
2.26
47Year ended 02/28/18
12.83
0.30 (e) (0.01)
0.29
(0.28)
(0.08) (0.36)
12.76
2.17
156,543
1.27
1.27
2.31 (e)
51
Year ended 02/28/17
11.94 0.20
1.16
1.36
(0.47)
–
(0.47)
12.83 11.54
221,942 1.36
1.36
1.54
57C
lass C
Six m
onths ended 08/31/21
10.78 0.06
1.65
1.71
(0.10)
–
(0.10)
12.39 15.96
5,802 2.08 (d)
2.08 (d)
1.08 (d)
50Year ended 02/28/21
11.65
0.10
(0.56) (0.46)
(0.13) (0.28)
(0.41)
10.78 (3.68)
5,493
2.07
2.07
0.95
160Year ended 02/29/20
12.59
0.15
0.21
0.36
(0.44) (0.86)
(1.30)
11.65 2.43
12,169 2.02
2.02
1.12
60Year ended 02/28/19
12.75
0.20
0.84
1.04
(0.50) (0.70)
(1.20)
12.59 8.71
14,673 2.01
2.01
1.51
47Year ended 02/28/18
12.83
0.21 (e) (0.03)
0.18
(0.18)
(0.08) (0.26)
12.75
1.33
27,654
2.02
2.02
1.56 (e)
51
Year ended 02/28/17
11.95 0.10
1.16
1.26
(0.38)
–
(0.38)
12.83 10.62
33,299 2.11
2.11
0.79
57C
lass R
Six m
onths ended 08/31/21
10.77 0.09
1.65
1.74
(0.13)
–
(0.13)
12.38 16.26
27,149 1.58 (d)
1.58 (d)
1.58 (d)
50Year ended 02/28/21
11.64
0.15
(0.56) (0.41)
(0.18) (0.28)
(0.46)
10.77 (3.14)
23,490
1.57
1.57
1.45
160Year ended 02/29/20
12.58
0.21
0.21
0.42
(0.50) (0.86)
(1.36)
11.64 2.94
22,293 1.52
1.52
1.62
60Year ended 02/28/19
12.75
0.26
0.84
1.10
(0.57) (0.70)
(1.27)
12.58 9.18
24,003 1.51
1.51
2.01
47Year ended 02/28/18
12.83
0.27 (e) (0.02)
0.25
(0.25)
(0.08) (0.33)
12.75
1.84
23,658
1.52
1.52
2.06 (e)
51
Year ended 02/28/17
11.95 0.17
1.15
1.32
(0.44)
–
(0.44)
12.83 11.17
19,718 1.61
1.61
1.29
57C
lass Y
Six m
onths ended 08/31/21
10.77 0.12
1.64
1.76
(0.16)
–
(0.16)
12.37 16.45
88,074 1.08 (d)
1.08 (d)
2.08 (d)
50Year ended 02/28/21
11.65
0.20
(0.57) (0.37)
(0.23) (0.28)
(0.51)
10.77 (2.69)
113,549
1.07
1.07
1.95
160Year ended 02/29/20
12.59
0.28
0.21
0.49
(0.57) (0.86)
(1.43)
11.65 3.46
166,069 1.02
1.02
2.12
60Year ended 02/28/19
12.76
0.33
0.83
1.16
(0.63) (0.70)
(1.33)
12.59 9.74
191,757 1.01
1.01
2.51
47Year ended 02/28/18
12.83
0.34 (e) (0.02)
0.32
(0.31)
(0.08) (0.39)
12.76
2.42
623,470
1.02
1.02
2.56 (e)
51
Year ended 02/28/17
11.95 0.23
1.15
1.38
(0.50)
–
(0.50)
12.83 11.72
1,167,799
1.11
1.11
1.79
57
Class R
5
Six m
onths ended 08/31/21
10.73 0.13
1.64
1.77
(0.17)
–
(0.17)
12.33 16.60
103,294 0.93 (d)
0.93 (d)
2.23 (d)
50Year ended 02/28/21
11.61
0.21
(0.56) (0.35)
(0.25) (0.28)
(0.53)
10.73 (2.57)
124,597
0.94
0.94
2.08
160Year ended 02/29/20
12.55
0.29
0.21
0.50
(0.58) (0.86)
(1.44)
11.61 3.59
164,048 0.91
0.91
2.23
60Year ended 02/28/19
12.72
0.34
0.84
1.18
(0.65) (0.70)
(1.35)
12.55 9.87
208,742 0.92
0.92
2.60
47Year ended 02/28/18
12.81
0.35 (e) (0.03)
0.32
(0.33)
(0.08) (0.41)
12.72
2.40
260,397
0.93
0.93
2.65 (e)
51
Year ended 02/28/17
11.93 0.26
1.15
1.41
(0.53)
–
(0.53)
12.81 12.00
264,906 0.88
0.88
2.02
57C
lass R6
Six months ended 08/31/21
10.73
0.14
1.63
1.77
(0.17)
–
(0.17)
12.33 16.65
182,104
0.85 (d)
0.85 (d)
2.31 (d)
50
Year ended 02/28/21
11.61 0.22
(0.56)
(0.34) (0.26)
(0.28) (0.54)
10.73 (2.48)
167,055 0.85
0.85
2.17
160
Year ended 02/29/20
12.55 0.30
0.22
0.52
(0.60)
(0.86) (1.46)
11.61
3.68
199,952
0.82
0.82
2.32
60
Year ended 02/28/19
12.72 0.35
0.84
1.19
(0.66)
(0.70) (1.36)
12.55
9.97
207,085
0.83
0.83
2.69
47
Year ended 02/28/18
12.81 0.36 (e)
(0.03)
0.33
(0.34) (0.08)
(0.42)
12.72 2.49
197,835 0.85
0.85
2.73 (e)
51Year ended 02/28/17
11.93
0.27
1.15
1.42
(0.54)
–
(0.54)
12.81 12.07
54,547
0.81
0.81
2.09
57
(a) C
alculated using average shares outstanding.(b)
Includes adjustments in accordance w
ith accounting principles generally accepted in the United States of Am
erica and as such, the net asset value for financial reporting purposes and the returns based upon those net asset values may differ from
the net asset value and returns for shareholder transactions. Does not include sales charges and is not annualized for periods less than one year, if applicable.

ˆ200FBT43DrD#%$LG‹Š200FBT43DrD#%$LG
215753 EDG 11INVESCOGLOBAL REAL ESTATE
29-Oct-2021 08:01 ESTHTMDTF
Donnelley Financial LSWraths1apNone
8*ESS 0C
VDI-W10-LPF-11621.7.8.0
ˆ200FBT43DrD#%$LG‹Š200FBT43DrD#%$LG
215753 EDG 11INVESCOGLOBAL REAL ESTATE
29-Oct-2021 08:01 ESTHTMDTF
Donnelley Financial LSWraths1apNone
8*ESS 0C
VDI-W10-LPF-11621.7.8.0
Page 2 of 2
(c) Portfolio turnover is calculated at the fund level and is not annualized for periods less than one year, if applicable.
(d) Annualized.
(e) N
et investment incom
e per share and the ratio of net investment incom
e to average net assets includes significant dividends received during the year ended February 28, 2018. Net investm
ent income per share and the ratio of net investm
entincom
e to average net assets excluding the significant dividends are $0.25 and 1.92%, $0.16 and 1.17%
, $0.22 and 1.67%, $0.29 and 2.17%
, $0.30 and 2.26%, $0.31 and 2.34%
for Class A, C
lass C, C
lass R, C
lass Y, Class R
5 and Class R
6shares, respectively.
See accompanying N
otes to Financial Statements w
hich are an integral part of the financial statements.
11 Invesco Global R
eal Estate Fund
ˆ200FBT43DrD$YZVGFŠ200FBT43DrD$YZVGF
215753 EDG 12INVESCOGLOBAL REAL ESTATE
29-Oct-2021 08:01 ESTHTMDTF
Donnelley Financial LSWraths1apNone
6*ESS 0C
VDI-W10-LPF-11621.7.8.0
Page 1 of 1
Notes to Financial StatementsAugust 31, 2021(Unaudited)
NOTE 1—Significant Accounting Policies
Invesco Global Real Estate Fund (the “Fund”), is a series portfolio of AIM Investment Securities Funds (Invesco Investment SecuritiesFunds) (the “Trust”). The Trust is organized as a Delaware statutory trust and is registered under the Investment Company Act of 1940, asamended (the “1940 Act”), as an open-end series management investment company authorized to issue an unlimited number of shares ofbeneficial interest. Information presented in these financial statements pertains only to the Fund. Matters affecting the Fund or each classwill be voted on exclusively by the shareholders of the Fund or each class.
The Fund’s investment objective is total return through growth of capital and current income.The Fund currently consists of six different classes of shares: Class A, Class C, Class R, Class Y, Class R5 and Class R6. Class Y
shares are available only to certain investors. Class A shares are sold with a front-end sales charge unless certain waiver criteria are met.Under certain circumstances, load waived shares may be subject to contingent deferred sales charges (“CDSC”). Class C shares are soldwith a CDSC. Class R, Class Y, Class R5 and Class R6 shares are sold at net asset value. Class C shares held for eight years afterpurchase are eligible for automatic conversion into Class A shares of the same Fund (the “Conversion Feature”). The automatic conversionpursuant to the Conversion Feature will generally occur at the end of the month following the eighth anniversary after a purchase of Class Cshares.
The Fund is an investment company and accordingly follows the investment company accounting and reporting guidance in accordancewith Financial Accounting Standards Board Accounting Standards Codification Topic 946, Financial Services – Investment Companies.
The following is a summary of the significant accounting policies followed by the Fund in the preparation of its financial statements.A. Security Valuations – Securities, including restricted securities, are valued according to the following policy.
A security listed or traded on an exchange (except convertible securities) is valued at its last sales price or official closing price as ofthe close of the customary trading session on the exchange where the security is principally traded, or lacking any sales or officialclosing price on a particular day, the security may be valued at the closing bid price on that day. Securities traded in theover-the-counter market are valued based on prices furnished by independent pricing services or market makers. When such securitiesare valued by an independent pricing service they may be considered fair valued. Futures contracts are valued at the final settlementprice set by an exchange on which they are principally traded. Listed options are valued at the mean between the last bid and askedprices from the exchange on which they are principally traded. Options not listed on an exchange are valued by an independent sourceat the mean between the last bid and asked prices. For purposes of determining net asset value (“NAV”) per share, futures and optioncontracts generally are valued 15 minutes after the close of the customary trading session of the New York Stock Exchange (“NYSE”).
Investments in open-end and closed-end registered investment companies that do not trade on an exchange are valued at theend-of-day net asset value per share. Investments in open-end and closed-end registered investment companies that trade on anexchange are valued at the last sales price or official closing price as of the close of the customary trading session on the exchangewhere the security is principally traded.
Debt obligations (including convertible securities) and unlisted equities are fair valued using an evaluated quote provided by anindependent pricing service. Evaluated quotes provided by the pricing service may be determined without exclusive reliance on quotedprices, and may reflect appropriate factors such as institution-size trading in similar groups of securities, developments related tospecific securities, dividend rate (for unlisted equities), yield (for debt obligations), quality, type of issue, coupon rate (for debtobligations), maturity (for debt obligations), individual trading characteristics and other market data. Pricing services generally valuedebt obligations assuming orderly transactions of institutional round lot size, but a fund may hold or transact in the same securities insmaller, odd lot sizes. Odd lots often trade at lower prices than institutional round lots. Debt obligations are subject to interest rate andcredit risks. In addition, all debt obligations involve some risk of default with respect to interest and/or principal payments.
Foreign securities’ (including foreign exchange contracts) prices are converted into U.S. dollar amounts using the applicableexchange rates as of the close of the NYSE. If market quotations are available and reliable for foreign exchange-traded equitysecurities, the securities will be valued at the market quotations. Because trading hours for certain foreign securities end before theclose of the NYSE, closing market quotations may become unreliable. If between the time trading ends on a particular security and theclose of the customary trading session on the NYSE, events occur that the investment adviser determines are significant and make theclosing price unreliable, the Fund may fair value the security. If the event is likely to have affected the closing price of the security, thesecurity will be valued at fair value in good faith using procedures approved by the Board of Trustees. Adjustments to closing prices toreflect fair value may also be based on a screening process of an independent pricing service to indicate the degree of certainty, basedon historical data, that the closing price in the principal market where a foreign security trades is not the current value as of the close ofthe NYSE. Foreign securities’ prices meeting the approved degree of certainty that the price is not reflective of current value will bepriced at the indication of fair value from the independent pricing service. Multiple factors may be considered by the independent pricingservice in determining adjustments to reflect fair value and may include information relating to sector indices, American DepositaryReceipts and domestic and foreign index futures. Foreign securities may have additional risks including exchange rate changes,potential for sharply devalued currencies and high inflation, political and economic upheaval, the relative lack of issuer information,relatively low market liquidity and the potential lack of strict financial and accounting controls and standards.
Securities for which market prices are not provided by any of the above methods may be valued based upon quotes furnished byindependent sources. The last bid price may be used to value equity securities. The mean between the last bid and asked prices isused to value debt obligations, including corporate loans.
Securities for which market quotations are not readily available or became unreliable are valued at fair value as determined in goodfaith by or under the supervision of the Trust’s officers following procedures approved by the Board of Trustees. Issuer specific events,market trends, bid/asked quotes of brokers and information providers and other market data may be reviewed in the course of making agood faith determination of a security’s fair value.
The Fund may invest in securities that are subject to interest rate risk, meaning the risk that the prices will generally fall as interestrates rise and, conversely, the prices will generally rise as interest rates fall. Specific securities differ in their sensitivity to changes ininterest rates depending on their individual characteristics. Changes in interest rates may result in increased market volatility, whichmay affect the value and/or liquidity of certain Fund investments.
Valuations change in response to many factors including the historical and prospective earnings of the issuer, the value of theissuer’s assets, general market conditions which are not specifically related to the particular issuer, such as real or perceived adverseeconomic conditions, changes in the general outlook for revenues or corporate earnings, changes in interest or currency rates, regionalor global instability, natural or environmental disasters, widespread disease or other public health issues, war, acts of terrorism oradverse investor sentiment generally and market liquidity. Because of the inherent uncertainties of valuation, the values reflected in thefinancial statements may materially differ from the value received upon actual sale of those investments.
B. Securities Transactions and Investment Income – Securities transactions are accounted for on a trade date basis. Realized gains orlosses on sales are computed on the basis of specific identification of the securities sold. Interest income (net of withholding tax, if any)is recorded on an accrual basis from settlement date and includes coupon interest and amortization of premium and accretion ofdiscount on debt securities as applicable. Dividend income (net of withholding tax, if any) is recorded on the ex-dividend date.
The Fund may periodically participate in litigation related to Fund investments. As such, the Fund may receive proceeds fromlitigation settlements. Any proceeds received are included in the Statement of Operations as realized gain (loss) for investments nolonger held and as unrealized gain (loss) for investments still held.
12 Invesco Global Real Estate Fund
ˆ200FBT43DrD$n7So$Š200FBT43DrD$n7So$
215753 EDG 13INVESCOGLOBAL REAL ESTATE
29-Oct-2021 08:01 ESTHTMDTF
Donnelley Financial LSWraths1apNone
7*ESS 0C
VDI-W10-LPF-11621.7.8.0
Page 1 of 2Brokerage commissions and mark ups are considered transaction costs and are recorded as an increase to the cost basis of
securities purchased and/or a reduction of proceeds on a sale of securities. Such transaction costs are included in the determination ofnet realized and unrealized gain (loss) from investment securities reported in the Statement of Operations and the Statement ofChanges in Net Assets and the net realized and unrealized gains (losses) on securities per share in the Financial Highlights.Transaction costs are included in the calculation of the Fund’s net asset value and, accordingly, they reduce the Fund’s total returns.These transaction costs are not considered operating expenses and are not reflected in net investment income reported in theStatement of Operations and the Statement of Changes in Net Assets, or the net investment income per share and the ratios ofexpenses and net investment income reported in the Financial Highlights, nor are they limited by any expense limitation arrangementsbetween the Fund and the investment adviser.
The Fund allocates income and realized and unrealized capital gains and losses to a class based on the relative net assets of eachclass.
The Fund recharacterizes distributions received from REIT investments based on information provided by the REIT into the followingcategories: ordinary income, long-term and short-term capital gains, and return of capital. If information is not available on a timelybasis from the REIT, the recharacterization will be based on available information which may include the previous year’s allocation. Ifnew or additional information becomes available from the REIT at a later date, a recharacterization will be made in the following year.The Fund records as dividend income the amount recharacterized as ordinary income and as realized gain the amount recharacterizedas capital gain in the Statement of Operations, and the amount recharacterized as return of capital as a reduction of the cost of therelated investment. These recharacterizations are reflected in the accompanying financial statements.
C. Country Determination – For the purposes of making investment selection decisions and presentation in the Schedule of Investments,the investment adviser may determine the country in which an issuer is located and/or credit risk exposure based on various factors.These factors include the laws of the country under which the issuer is organized, where the issuer maintains a principal office, thecountry in which the issuer derives 50% or more of its total revenues and the country that has the primary market for the issuer’ssecurities, as well as other criteria. Among the other criteria that may be evaluated for making this determination are the country inwhich the issuer maintains 50% or more of its assets, the type of security, financial guarantees and enhancements, the nature of thecollateral and the sponsor organization. Country of issuer and/or credit risk exposure has been determined to be the United States ofAmerica, unless otherwise noted.
D. Distributions – Distributions from net investment income, if any, are declared and paid quarterly and are recorded on the ex-dividenddate. Distributions from net realized capital gain, if any, are generally declared and paid annually and recorded on the ex-dividend date.The Fund may elect to treat a portion of the proceeds from redemptions as distributions for federal income tax purposes.
E. Federal Income Taxes – The Fund intends to comply with the requirements of Subchapter M of the Internal Revenue Code of 1986, asamended (the “Internal Revenue Code”), necessary to qualify as a regulated investment company and to distribute substantially all ofthe Fund’s taxable earnings to shareholders. As such, the Fund will not be subject to federal income taxes on otherwise taxable income(including net realized capital gain) that is distributed to shareholders. Therefore, no provision for federal income taxes is recorded inthe financial statements.
The Fund recognizes the tax benefits of uncertain tax positions only when the position is more likely than not to be sustained.Management has analyzed the Fund’s uncertain tax positions and concluded that no liability for unrecognized tax benefits should berecorded related to uncertain tax positions. Management is not aware of any tax positions for which it is reasonably possible that thetotal amounts of unrecognized tax benefits will change materially in the next 12 months.
The Fund files tax returns in the U.S. Federal jurisdiction and certain other jurisdictions. Generally, the Fund is subject toexaminations by such taxing authorities for up to three years after the filing of the return for the tax period.
F. Expenses – Fees provided for under the Rule 12b-1 plan of a particular class of the Fund are charged to the operations of such class.Transfer agency fees and expenses and other shareholder recordkeeping fees and expenses attributable to Class R5 and Class R6 areallocated based on relative net assets of Class R5 and Class R6. Sub-accounting fees attributable to Class R5 are charged to theoperations of the class. Transfer agency fees and expenses and other shareholder recordkeeping fees and expenses relating to allother classes are allocated among those classes based on relative net assets. All other expenses are allocated among the classesbased on relative net assets.
G. Accounting Estimates – The preparation of financial statements in conformity with accounting principles generally accepted in theUnited States of America (“GAAP”) requires management to make estimates and assumptions that affect the reported amounts ofassets and liabilities at the date of the financial statements and the reported amounts of revenues and expenses during the reportingperiod including estimates and assumptions related to taxation. Actual results could differ from those estimates by a significant amount.In addition, the Fund monitors for material events or transactions that may occur or become known after the period-end date and beforethe date the financial statements are released to print.
H. Indemnifications – Under the Trust’s organizational documents, each Trustee, officer, employee or other agent of the Trust isindemnified against certain liabilities that may arise out of the performance of their duties to the Fund. Additionally, in the normal courseof business, the Fund enters into contracts, including the Fund’s servicing agreements, that contain a variety of indemnification clauses.The Fund’s maximum exposure under these arrangements is unknown as this would involve future claims that may be made againstthe Fund that have not yet occurred. The risk of material loss as a result of such indemnification claims is considered remote.
I. Securities Lending – The Fund may lend portfolio securities having a market value up to one-third of the Fund’s total assets. Suchloans are secured by collateral equal to no less than the market value of the loaned securities determined daily by the securities lendingprovider. Such collateral will be cash or debt securities issued or guaranteed by the U.S. Government or any of its sponsored agencies.Cash collateral received in connection with these loans is invested in short-term money market instruments or affiliated money marketfunds and is shown as such on the Schedule of Investments. The Fund bears the risk of loss with respect to the investment ofcollateral. It is the Fund’s policy to obtain additional collateral from or return excess collateral to the borrower by the end of the nextbusiness day, following the valuation date of the securities loaned. Therefore, the value of the collateral held may be temporarily lessthan the value of the securities on loan. When loaning securities, the Fund retains certain benefits of owning the securities, includingthe economic equivalent of dividends or interest generated by the security. Lending securities entails a risk of loss to the Fund if, and tothe extent that, the market value of the securities loaned were to increase and the borrower did not increase the collateral accordingly,and the borrower failed to return the securities. The securities loaned are subject to termination at the option of the borrower or theFund. Upon termination, the borrower will return to the Fund the securities loaned and the Fund will return the collateral. Upon thefailure of the borrower to return the securities, collateral may be liquidated and the securities may be purchased on the open market toreplace the loaned securities. The Fund could experience delays and costs in gaining access to the collateral and the securities maylose value during the delay which could result in potential losses to the Fund. Some of these losses may be indemnified by the lendingagent. The Fund bears the risk of any deficiency in the amount of the collateral available for return to the borrower due to any loss onthe collateral invested. Dividends received on cash collateral investments for securities lending transactions, which are net ofcompensation to counterparties, are included in Dividends from affiliates on the Statement of Operations. The aggregate value ofsecurities out on loan, if any, is shown as a footnote on the Statement of Assets and Liabilities.
J. Foreign Currency Translations – Foreign currency is valued at the close of the NYSE based on quotations posted by banks andmajor currency dealers. Portfolio securities and other assets and liabilities denominated in foreign currencies are translated into U.S.dollar amounts at the date of valuation. Purchases and sales of portfolio securities (net of foreign taxes withheld on disposition) andincome items denominated in foreign currencies are translated into U.S. dollar amounts on the respective dates of such transactions.The Fund does not separately account for the portion of the results of operations resulting from changes in foreign exchange rates oninvestments and the fluctuations arising from changes in market prices of securities held. The combined results of changes in foreignexchange rates and the fluctuation of market prices on investments (net of estimated foreign tax withholding) are included with the netrealized and unrealized gain or loss from investments in the Statement of Operations. Reported net realized foreign currency gains orlosses arise from (1) sales of foreign currencies, (2) currency gains or losses realized between the trade and settlement dates onsecurities transactions, and (3) the difference between the amounts of dividends,

ˆ200FBT43DrD$n7So$Š200FBT43DrD$n7So$
215753 EDG 13INVESCOGLOBAL REAL ESTATE
29-Oct-2021 08:01 ESTHTMDTF
Donnelley Financial LSWraths1apNone
7*ESS 0C
VDI-W10-LPF-11621.7.8.0
ˆ200FBT43DrD$n7So$Š200FBT43DrD$n7So$
215753 EDG 13INVESCOGLOBAL REAL ESTATE
29-Oct-2021 08:01 ESTHTMDTF
Donnelley Financial LSWraths1apNone
7*ESS 0C
VDI-W10-LPF-11621.7.8.0
Page 2 of 2 13 Invesco Global Real Estate Fund
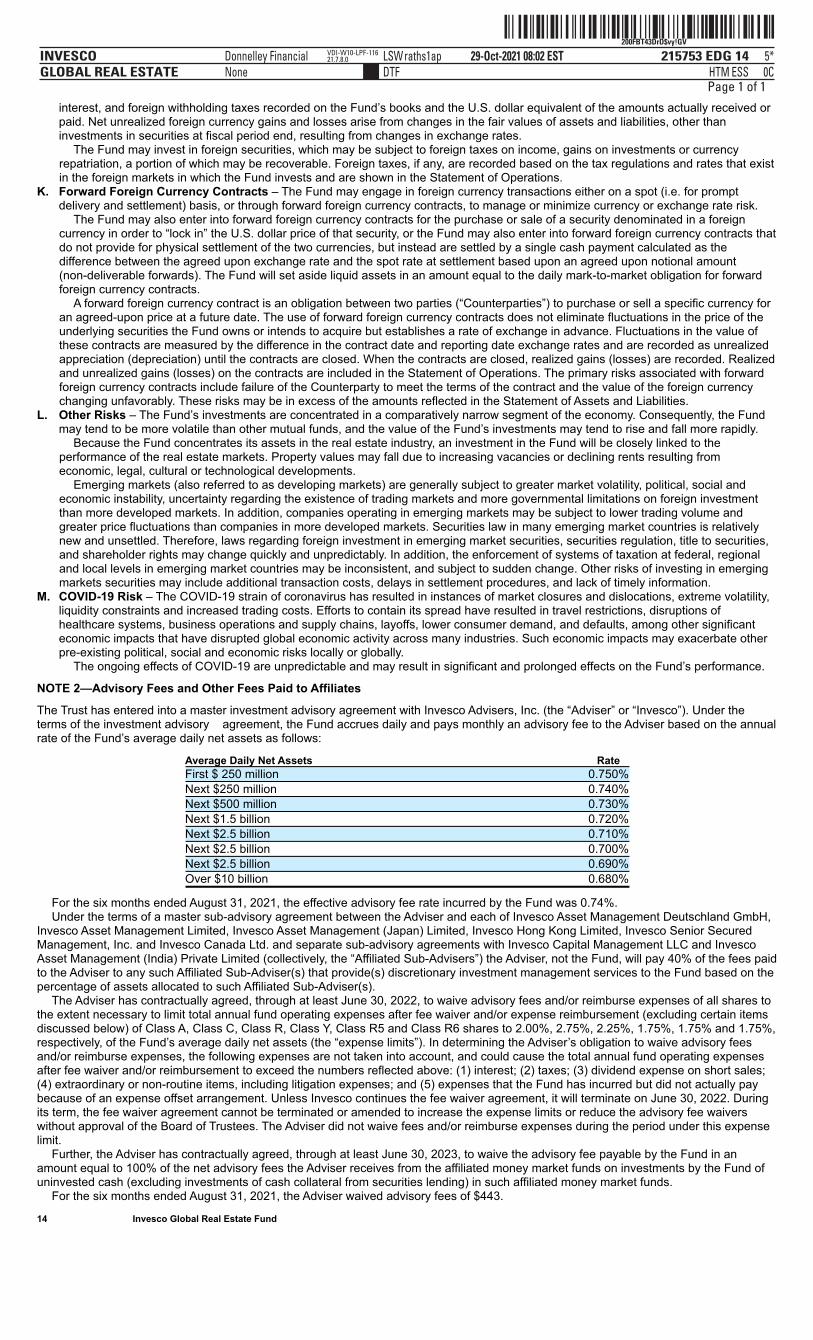
ˆ200FBT43DrD$vy!GVŠ200FBT43DrD$vy!GV
215753 EDG 14INVESCOGLOBAL REAL ESTATE
29-Oct-2021 08:02 ESTHTMDTF
Donnelley Financial LSWraths1apNone
5*ESS 0C
VDI-W10-LPF-11621.7.8.0
Page 1 of 1
interest, and foreign withholding taxes recorded on the Fund’s books and the U.S. dollar equivalent of the amounts actually received orpaid. Net unrealized foreign currency gains and losses arise from changes in the fair values of assets and liabilities, other thaninvestments in securities at fiscal period end, resulting from changes in exchange rates.
The Fund may invest in foreign securities, which may be subject to foreign taxes on income, gains on investments or currencyrepatriation, a portion of which may be recoverable. Foreign taxes, if any, are recorded based on the tax regulations and rates that existin the foreign markets in which the Fund invests and are shown in the Statement of Operations.
K. Forward Foreign Currency Contracts – The Fund may engage in foreign currency transactions either on a spot (i.e. for promptdelivery and settlement) basis, or through forward foreign currency contracts, to manage or minimize currency or exchange rate risk.
The Fund may also enter into forward foreign currency contracts for the purchase or sale of a security denominated in a foreigncurrency in order to “lock in” the U.S. dollar price of that security, or the Fund may also enter into forward foreign currency contracts thatdo not provide for physical settlement of the two currencies, but instead are settled by a single cash payment calculated as thedifference between the agreed upon exchange rate and the spot rate at settlement based upon an agreed upon notional amount(non-deliverable forwards). The Fund will set aside liquid assets in an amount equal to the daily mark-to-market obligation for forwardforeign currency contracts.
A forward foreign currency contract is an obligation between two parties (“Counterparties”) to purchase or sell a specific currency foran agreed-upon price at a future date. The use of forward foreign currency contracts does not eliminate fluctuations in the price of theunderlying securities the Fund owns or intends to acquire but establishes a rate of exchange in advance. Fluctuations in the value ofthese contracts are measured by the difference in the contract date and reporting date exchange rates and are recorded as unrealizedappreciation (depreciation) until the contracts are closed. When the contracts are closed, realized gains (losses) are recorded. Realizedand unrealized gains (losses) on the contracts are included in the Statement of Operations. The primary risks associated with forwardforeign currency contracts include failure of the Counterparty to meet the terms of the contract and the value of the foreign currencychanging unfavorably. These risks may be in excess of the amounts reflected in the Statement of Assets and Liabilities.
L. Other Risks – The Fund’s investments are concentrated in a comparatively narrow segment of the economy. Consequently, the Fundmay tend to be more volatile than other mutual funds, and the value of the Fund’s investments may tend to rise and fall more rapidly.
Because the Fund concentrates its assets in the real estate industry, an investment in the Fund will be closely linked to theperformance of the real estate markets. Property values may fall due to increasing vacancies or declining rents resulting fromeconomic, legal, cultural or technological developments.
Emerging markets (also referred to as developing markets) are generally subject to greater market volatility, political, social andeconomic instability, uncertainty regarding the existence of trading markets and more governmental limitations on foreign investmentthan more developed markets. In addition, companies operating in emerging markets may be subject to lower trading volume andgreater price fluctuations than companies in more developed markets. Securities law in many emerging market countries is relativelynew and unsettled. Therefore, laws regarding foreign investment in emerging market securities, securities regulation, title to securities,and shareholder rights may change quickly and unpredictably. In addition, the enforcement of systems of taxation at federal, regionaland local levels in emerging market countries may be inconsistent, and subject to sudden change. Other risks of investing in emergingmarkets securities may include additional transaction costs, delays in settlement procedures, and lack of timely information.
M. COVID-19 Risk – The COVID-19 strain of coronavirus has resulted in instances of market closures and dislocations, extreme volatility,liquidity constraints and increased trading costs. Efforts to contain its spread have resulted in travel restrictions, disruptions ofhealthcare systems, business operations and supply chains, layoffs, lower consumer demand, and defaults, among other significanteconomic impacts that have disrupted global economic activity across many industries. Such economic impacts may exacerbate otherpre-existing political, social and economic risks locally or globally.
The ongoing effects of COVID-19 are unpredictable and may result in significant and prolonged effects on the Fund’s performance.
NOTE 2—Advisory Fees and Other Fees Paid to Affiliates
The Trust has entered into a master investment advisory agreement with Invesco Advisers, Inc. (the “Adviser” or “Invesco”). Under theterms of the investment advisory agreement, the Fund accrues daily and pays monthly an advisory fee to the Adviser based on the annualrate of the Fund’s average daily net assets as follows:
Average Daily Net Assets RateFirst $ 250 million 0.750%Next $250 million 0.740%Next $500 million 0.730%Next $1.5 billion 0.720%Next $2.5 billion 0.710%Next $2.5 billion 0.700%Next $2.5 billion 0.690%Over $10 billion 0.680%
For the six months ended August 31, 2021, the effective advisory fee rate incurred by the Fund was 0.74%.Under the terms of a master sub-advisory agreement between the Adviser and each of Invesco Asset Management Deutschland GmbH,
Invesco Asset Management Limited, Invesco Asset Management (Japan) Limited, Invesco Hong Kong Limited, Invesco Senior SecuredManagement, Inc. and Invesco Canada Ltd. and separate sub-advisory agreements with Invesco Capital Management LLC and InvescoAsset Management (India) Private Limited (collectively, the “Affiliated Sub-Advisers”) the Adviser, not the Fund, will pay 40% of the fees paidto the Adviser to any such Affiliated Sub-Adviser(s) that provide(s) discretionary investment management services to the Fund based on thepercentage of assets allocated to such Affiliated Sub-Adviser(s).
The Adviser has contractually agreed, through at least June 30, 2022, to waive advisory fees and/or reimburse expenses of all shares tothe extent necessary to limit total annual fund operating expenses after fee waiver and/or expense reimbursement (excluding certain itemsdiscussed below) of Class A, Class C, Class R, Class Y, Class R5 and Class R6 shares to 2.00%, 2.75%, 2.25%, 1.75%, 1.75% and 1.75%,respectively, of the Fund’s average daily net assets (the “expense limits”). In determining the Adviser’s obligation to waive advisory feesand/or reimburse expenses, the following expenses are not taken into account, and could cause the total annual fund operating expensesafter fee waiver and/or reimbursement to exceed the numbers reflected above: (1) interest; (2) taxes; (3) dividend expense on short sales;(4) extraordinary or non-routine items, including litigation expenses; and (5) expenses that the Fund has incurred but did not actually paybecause of an expense offset arrangement. Unless Invesco continues the fee waiver agreement, it will terminate on June 30, 2022. Duringits term, the fee waiver agreement cannot be terminated or amended to increase the expense limits or reduce the advisory fee waiverswithout approval of the Board of Trustees. The Adviser did not waive fees and/or reimburse expenses during the period under this expenselimit.
Further, the Adviser has contractually agreed, through at least June 30, 2023, to waive the advisory fee payable by the Fund in anamount equal to 100% of the net advisory fees the Adviser receives from the affiliated money market funds on investments by the Fund ofuninvested cash (excluding investments of cash collateral from securities lending) in such affiliated money market funds.
For the six months ended August 31, 2021, the Adviser waived advisory fees of $443. 14 Invesco Global Real Estate Fund
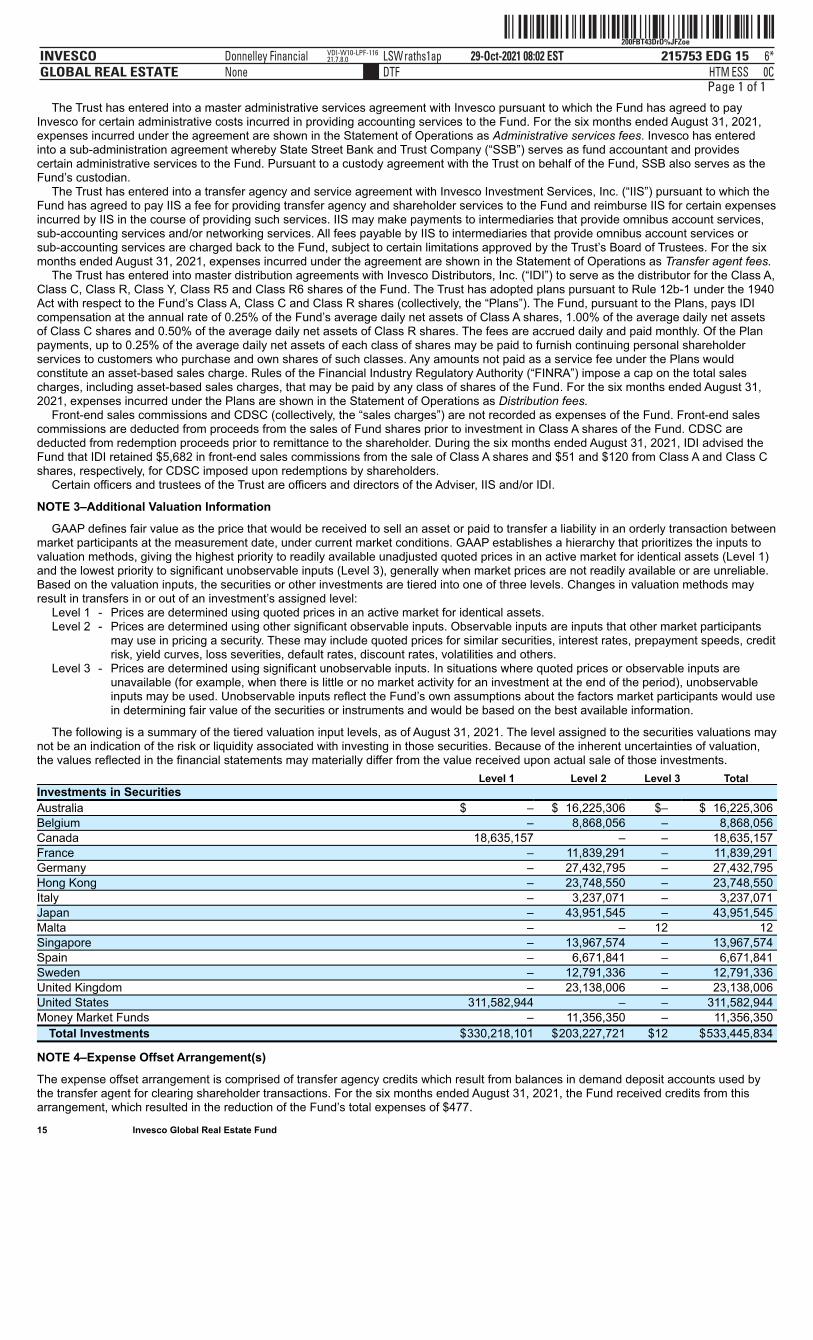
ˆ200FBT43DrD%JFZoeŠ200FBT43DrD%JFZoe
215753 EDG 15INVESCOGLOBAL REAL ESTATE
29-Oct-2021 08:02 ESTHTMDTF
Donnelley Financial LSWraths1apNone
6*ESS 0C
VDI-W10-LPF-11621.7.8.0
Page 1 of 1The Trust has entered into a master administrative services agreement with Invesco pursuant to which the Fund has agreed to pay
Invesco for certain administrative costs incurred in providing accounting services to the Fund. For the six months ended August 31, 2021,expenses incurred under the agreement are shown in the Statement of Operations as Administrative services fees. Invesco has enteredinto a sub-administration agreement whereby State Street Bank and Trust Company (“SSB”) serves as fund accountant and providescertain administrative services to the Fund. Pursuant to a custody agreement with the Trust on behalf of the Fund, SSB also serves as theFund’s custodian.
The Trust has entered into a transfer agency and service agreement with Invesco Investment Services, Inc. (“IIS”) pursuant to which theFund has agreed to pay IIS a fee for providing transfer agency and shareholder services to the Fund and reimburse IIS for certain expensesincurred by IIS in the course of providing such services. IIS may make payments to intermediaries that provide omnibus account services,sub-accounting services and/or networking services. All fees payable by IIS to intermediaries that provide omnibus account services orsub-accounting services are charged back to the Fund, subject to certain limitations approved by the Trust’s Board of Trustees. For the sixmonths ended August 31, 2021, expenses incurred under the agreement are shown in the Statement of Operations as Transfer agent fees.
The Trust has entered into master distribution agreements with Invesco Distributors, Inc. (“IDI”) to serve as the distributor for the Class A,Class C, Class R, Class Y, Class R5 and Class R6 shares of the Fund. The Trust has adopted plans pursuant to Rule 12b-1 under the 1940Act with respect to the Fund’s Class A, Class C and Class R shares (collectively, the “Plans”). The Fund, pursuant to the Plans, pays IDIcompensation at the annual rate of 0.25% of the Fund’s average daily net assets of Class A shares, 1.00% of the average daily net assetsof Class C shares and 0.50% of the average daily net assets of Class R shares. The fees are accrued daily and paid monthly. Of the Planpayments, up to 0.25% of the average daily net assets of each class of shares may be paid to furnish continuing personal shareholderservices to customers who purchase and own shares of such classes. Any amounts not paid as a service fee under the Plans wouldconstitute an asset-based sales charge. Rules of the Financial Industry Regulatory Authority (“FINRA”) impose a cap on the total salescharges, including asset-based sales charges, that may be paid by any class of shares of the Fund. For the six months ended August 31,2021, expenses incurred under the Plans are shown in the Statement of Operations as Distribution fees.
Front-end sales commissions and CDSC (collectively, the “sales charges”) are not recorded as expenses of the Fund. Front-end salescommissions are deducted from proceeds from the sales of Fund shares prior to investment in Class A shares of the Fund. CDSC arededucted from redemption proceeds prior to remittance to the shareholder. During the six months ended August 31, 2021, IDI advised theFund that IDI retained $5,682 in front-end sales commissions from the sale of Class A shares and $51 and $120 from Class A and Class Cshares, respectively, for CDSC imposed upon redemptions by shareholders.
Certain officers and trustees of the Trust are officers and directors of the Adviser, IIS and/or IDI.
NOTE 3–Additional Valuation Information
GAAP defines fair value as the price that would be received to sell an asset or paid to transfer a liability in an orderly transaction betweenmarket participants at the measurement date, under current market conditions. GAAP establishes a hierarchy that prioritizes the inputs tovaluation methods, giving the highest priority to readily available unadjusted quoted prices in an active market for identical assets (Level 1)and the lowest priority to significant unobservable inputs (Level 3), generally when market prices are not readily available or are unreliable.Based on the valuation inputs, the securities or other investments are tiered into one of three levels. Changes in valuation methods mayresult in transfers in or out of an investment’s assigned level:
Level 1 - Prices are determined using quoted prices in an active market for identical assets.Level 2
-
Prices are determined using other significant observable inputs. Observable inputs are inputs that other market participantsmay use in pricing a security. These may include quoted prices for similar securities, interest rates, prepayment speeds, creditrisk, yield curves, loss severities, default rates, discount rates, volatilities and others.
Level 3
-
Prices are determined using significant unobservable inputs. In situations where quoted prices or observable inputs areunavailable (for example, when there is little or no market activity for an investment at the end of the period), unobservableinputs may be used. Unobservable inputs reflect the Fund’s own assumptions about the factors market participants would usein determining fair value of the securities or instruments and would be based on the best available information.
The following is a summary of the tiered valuation input levels, as of August 31, 2021. The level assigned to the securities valuations maynot be an indication of the risk or liquidity associated with investing in those securities. Because of the inherent uncertainties of valuation,the values reflected in the financial statements may materially differ from the value received upon actual sale of those investments.
Level 1 Level 2 Level 3 Total Investments in Securities Australia $ – $ 16,225,306 $– $ 16,225,306 Belgium – 8,868,056 – 8,868,056 Canada 18,635,157 – – 18,635,157 France – 11,839,291 – 11,839,291 Germany – 27,432,795 – 27,432,795 Hong Kong – 23,748,550 – 23,748,550 Italy – 3,237,071 – 3,237,071 Japan – 43,951,545 – 43,951,545 Malta – – 12 12 Singapore – 13,967,574 – 13,967,574 Spain – 6,671,841 – 6,671,841 Sweden – 12,791,336 – 12,791,336 United Kingdom – 23,138,006 – 23,138,006 United States 311,582,944 – – 311,582,944 Money Market Funds – 11,356,350 – 11,356,350
Total Investments $330,218,101 $203,227,721 $12 $533,445,834
NOTE 4–Expense Offset Arrangement(s)
The expense offset arrangement is comprised of transfer agency credits which result from balances in demand deposit accounts used bythe transfer agent for clearing shareholder transactions. For the six months ended August 31, 2021, the Fund received credits from thisarrangement, which resulted in the reduction of the Fund’s total expenses of $477. 15 Invesco Global Real Estate Fund
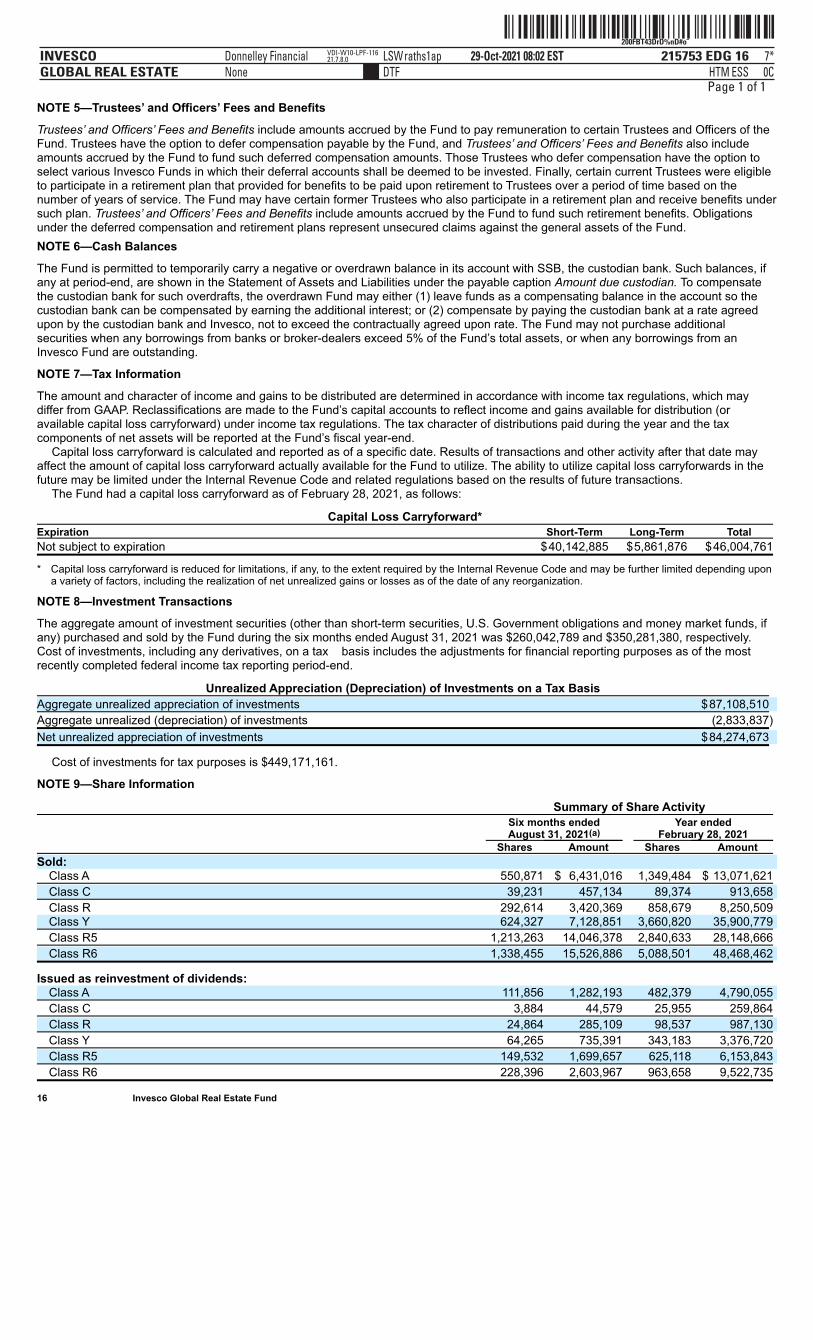
ˆ200FBT43DrD%nD#oÄŠ200FBT43DrD%nD#o˜
215753 EDG 16INVESCOGLOBAL REAL ESTATE
29-Oct-2021 08:02 ESTHTMDTF
Donnelley Financial LSWraths1apNone
7*ESS 0C
VDI-W10-LPF-11621.7.8.0
Page 1 of 1NOTE 5—Trustees’ and Officers’ Fees and Benefits
Trustees’ and Officers’ Fees and Benefits include amounts accrued by the Fund to pay remuneration to certain Trustees and Officers of theFund. Trustees have the option to defer compensation payable by the Fund, and Trustees’ and Officers’ Fees and Benefits also includeamounts accrued by the Fund to fund such deferred compensation amounts. Those Trustees who defer compensation have the option toselect various Invesco Funds in which their deferral accounts shall be deemed to be invested. Finally, certain current Trustees were eligibleto participate in a retirement plan that provided for benefits to be paid upon retirement to Trustees over a period of time based on thenumber of years of service. The Fund may have certain former Trustees who also participate in a retirement plan and receive benefits undersuch plan. Trustees’ and Officers’ Fees and Benefits include amounts accrued by the Fund to fund such retirement benefits. Obligationsunder the deferred compensation and retirement plans represent unsecured claims against the general assets of the Fund.NOTE 6—Cash Balances
The Fund is permitted to temporarily carry a negative or overdrawn balance in its account with SSB, the custodian bank. Such balances, ifany at period-end, are shown in the Statement of Assets and Liabilities under the payable caption Amount due custodian. To compensatethe custodian bank for such overdrafts, the overdrawn Fund may either (1) leave funds as a compensating balance in the account so thecustodian bank can be compensated by earning the additional interest; or (2) compensate by paying the custodian bank at a rate agreedupon by the custodian bank and Invesco, not to exceed the contractually agreed upon rate. The Fund may not purchase additionalsecurities when any borrowings from banks or broker-dealers exceed 5% of the Fund’s total assets, or when any borrowings from anInvesco Fund are outstanding.
NOTE 7—Tax Information
The amount and character of income and gains to be distributed are determined in accordance with income tax regulations, which maydiffer from GAAP. Reclassifications are made to the Fund’s capital accounts to reflect income and gains available for distribution (oravailable capital loss carryforward) under income tax regulations. The tax character of distributions paid during the year and the taxcomponents of net assets will be reported at the Fund’s fiscal year-end.
Capital loss carryforward is calculated and reported as of a specific date. Results of transactions and other activity after that date mayaffect the amount of capital loss carryforward actually available for the Fund to utilize. The ability to utilize capital loss carryforwards in thefuture may be limited under the Internal Revenue Code and related regulations based on the results of future transactions.
The Fund had a capital loss carryforward as of February 28, 2021, as follows:
Capital Loss Carryforward*
Expiration Short-Term Long-Term Total
Not subject to expiration $40,142,885 $5,861,876 $46,004,761
* Capital loss carryforward is reduced for limitations, if any, to the extent required by the Internal Revenue Code and may be further limited depending upona variety of factors, including the realization of net unrealized gains or losses as of the date of any reorganization.
NOTE 8—Investment Transactions
The aggregate amount of investment securities (other than short-term securities, U.S. Government obligations and money market funds, ifany) purchased and sold by the Fund during the six months ended August 31, 2021 was $260,042,789 and $350,281,380, respectively.Cost of investments, including any derivatives, on a tax basis includes the adjustments for financial reporting purposes as of the mostrecently completed federal income tax reporting period-end.
Unrealized Appreciation (Depreciation) of Investments on a Tax Basis
Aggregate unrealized appreciation of investments $87,108,510
Aggregate unrealized (depreciation) of investments (2,833,837)
Net unrealized appreciation of investments $84,274,673
Cost of investments for tax purposes is $449,171,161.
NOTE 9—Share Information
Summary of Share Activity
Six months ended Year ended August 31, 2021(a) February 28, 2021 Shares Amount Shares Amount
Sold: Class A 550,871 $ 6,431,016 1,349,484 $ 13,071,621
Class C 39,231 457,134 89,374 913,658
Class R 292,614 3,420,369 858,679 8,250,509 Class Y 624,327 7,128,851 3,660,820 35,900,779
Class R5 1,213,263 14,046,378 2,840,633 28,148,666
Class R6 1,338,455 15,526,886 5,088,501 48,468,462
Issued as reinvestment of dividends: Class A 111,856 1,282,193 482,379 4,790,055
Class C 3,884 44,579 25,955 259,864
Class R 24,864 285,109 98,537 987,130
Class Y 64,265 735,391 343,183 3,376,720
Class R5 149,532 1,699,657 625,118 6,153,843
Class R6 228,396 2,603,967 963,658 9,522,735
16 Invesco Global Real Estate Fund
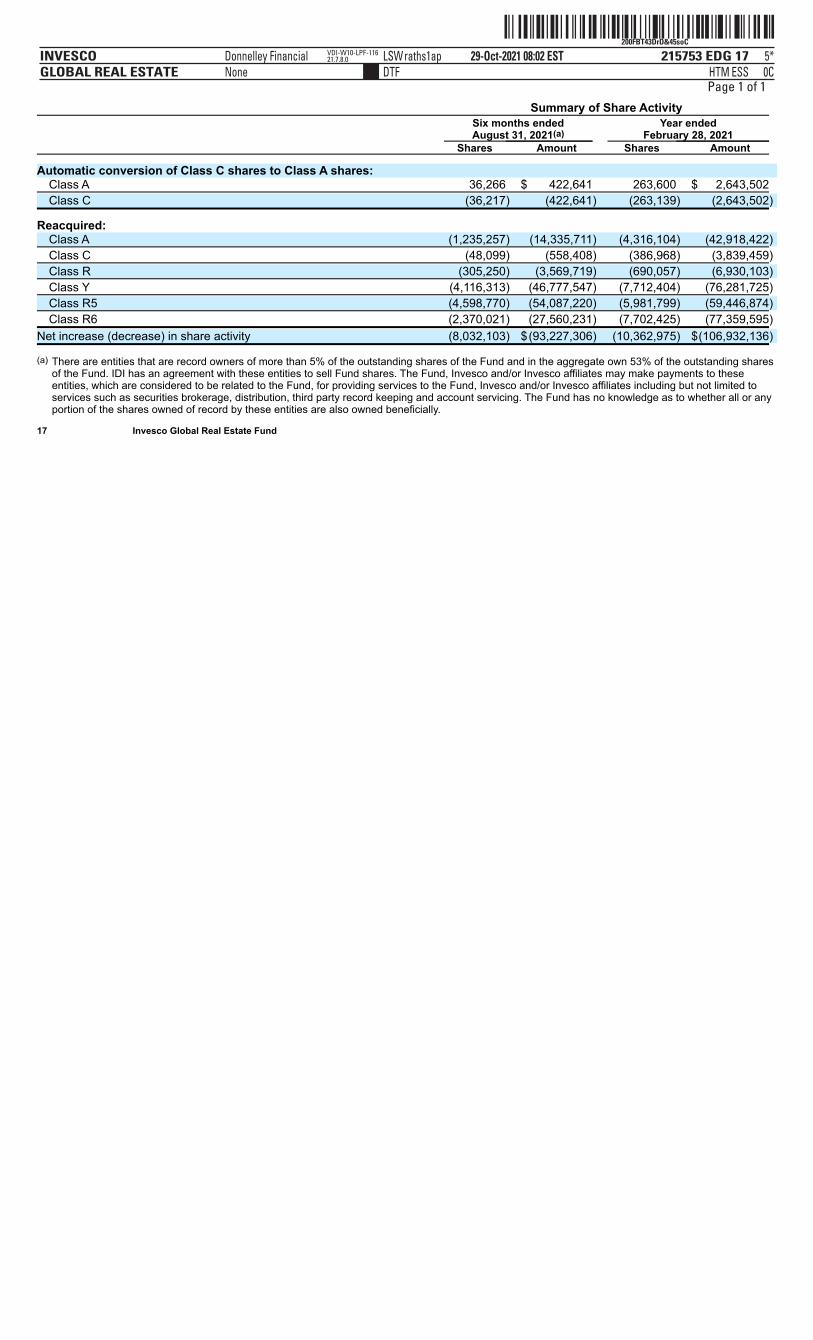
ˆ200FBT43DrD&45soCŠ200FBT43DrD&45soC
215753 EDG 17INVESCOGLOBAL REAL ESTATE
29-Oct-2021 08:02 ESTHTMDTF
Donnelley Financial LSWraths1apNone
5*ESS 0C
VDI-W10-LPF-11621.7.8.0
Page 1 of 1 Summary of Share Activity
Six months ended Year ended August 31, 2021(a) February 28, 2021 Shares Amount Shares Amount
Automatic conversion of Class C shares to Class A shares: Class A 36,266 $ 422,641 263,600 $ 2,643,502
Class C (36,217) (422,641) (263,139) (2,643,502)
Reacquired: Class A (1,235,257) (14,335,711) (4,316,104) (42,918,422)
Class C (48,099) (558,408) (386,968) (3,839,459)
Class R (305,250) (3,569,719) (690,057) (6,930,103)
Class Y (4,116,313) (46,777,547) (7,712,404) (76,281,725)
Class R5 (4,598,770) (54,087,220) (5,981,799) (59,446,874)
Class R6 (2,370,021) (27,560,231) (7,702,425) (77,359,595)
Net increase (decrease) in share activity (8,032,103) $(93,227,306) (10,362,975) $(106,932,136)
(a) There are entities that are record owners of more than 5% of the outstanding shares of the Fund and in the aggregate own 53% of the outstanding sharesof the Fund. IDI has an agreement with these entities to sell Fund shares. The Fund, Invesco and/or Invesco affiliates may make payments to theseentities, which are considered to be related to the Fund, for providing services to the Fund, Invesco and/or Invesco affiliates including but not limited toservices such as securities brokerage, distribution, third party record keeping and account servicing. The Fund has no knowledge as to whether all or anyportion of the shares owned of record by these entities are also owned beneficially.
17 Invesco Global Real Estate Fund
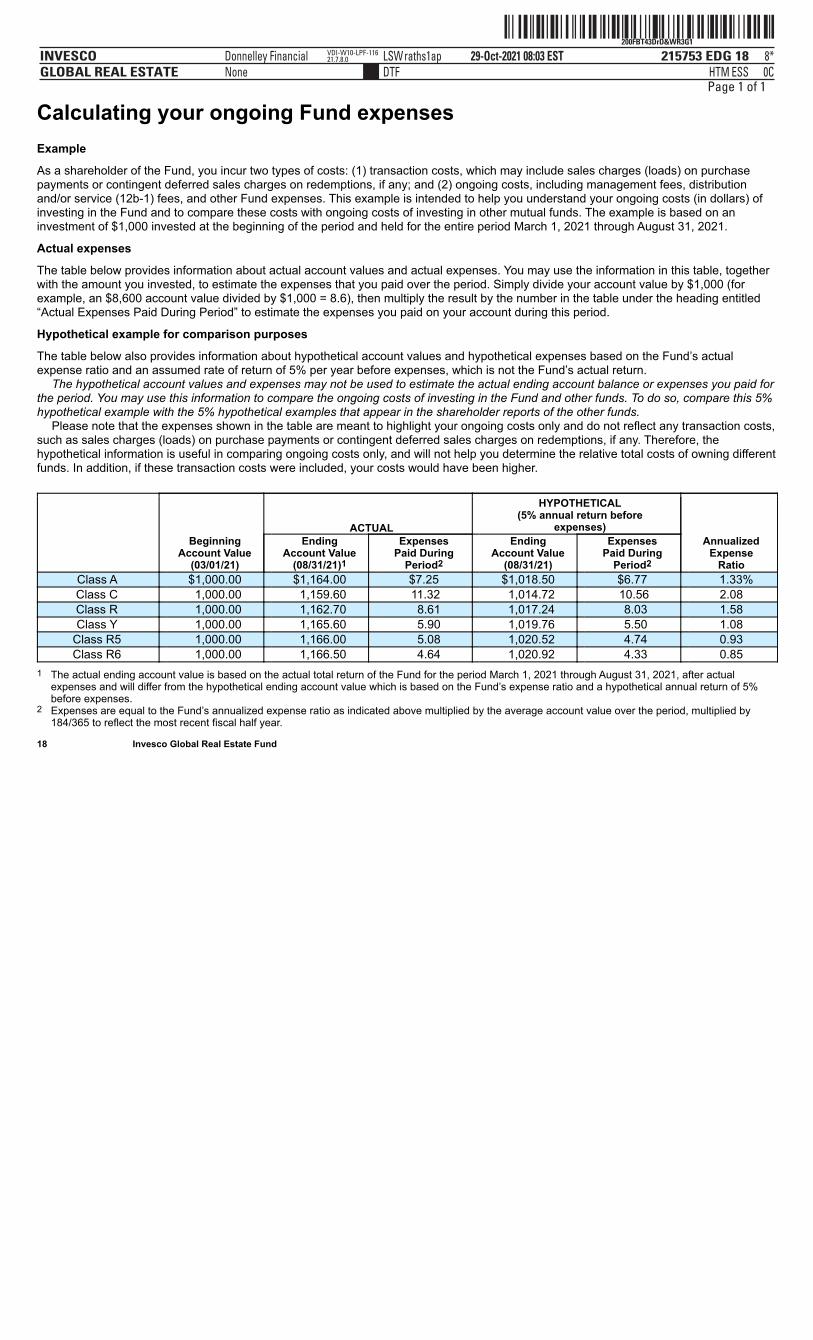
ˆ200FBT43DrD&WR3G1Š200FBT43DrD&WR3G1
215753 EDG 18INVESCOGLOBAL REAL ESTATE
29-Oct-2021 08:03 ESTHTMDTF
Donnelley Financial LSWraths1apNone
8*ESS 0C
VDI-W10-LPF-11621.7.8.0
Page 1 of 1
Calculating your ongoing Fund expensesExample
As a shareholder of the Fund, you incur two types of costs: (1) transaction costs, which may include sales charges (loads) on purchasepayments or contingent deferred sales charges on redemptions, if any; and (2) ongoing costs, including management fees, distributionand/or service (12b-1) fees, and other Fund expenses. This example is intended to help you understand your ongoing costs (in dollars) ofinvesting in the Fund and to compare these costs with ongoing costs of investing in other mutual funds. The example is based on aninvestment of $1,000 invested at the beginning of the period and held for the entire period March 1, 2021 through August 31, 2021.
Actual expenses
The table below provides information about actual account values and actual expenses. You may use the information in this table, togetherwith the amount you invested, to estimate the expenses that you paid over the period. Simply divide your account value by $1,000 (forexample, an $8,600 account value divided by $1,000 = 8.6), then multiply the result by the number in the table under the heading entitled“Actual Expenses Paid During Period” to estimate the expenses you paid on your account during this period.
Hypothetical example for comparison purposes
The table below also provides information about hypothetical account values and hypothetical expenses based on the Fund’s actualexpense ratio and an assumed rate of return of 5% per year before expenses, which is not the Fund’s actual return.
The hypothetical account values and expenses may not be used to estimate the actual ending account balance or expenses you paid forthe period. You may use this information to compare the ongoing costs of investing in the Fund and other funds. To do so, compare this 5%hypothetical example with the 5% hypothetical examples that appear in the shareholder reports of the other funds.
Please note that the expenses shown in the table are meant to highlight your ongoing costs only and do not reflect any transaction costs,such as sales charges (loads) on purchase payments or contingent deferred sales charges on redemptions, if any. Therefore, thehypothetical information is useful in comparing ongoing costs only, and will not help you determine the relative total costs of owning differentfunds. In addition, if these transaction costs were included, your costs would have been higher.
Beginning Account Value
(03/01/21)
ACTUAL
HYPOTHETICAL(5% annual return before
expenses)
Annualized Expense
Ratio
Ending Account Value
(08/31/21)1
Expenses Paid During
Period2
Ending Account Value
(08/31/21)
Expenses Paid During
Period2
Class A $1,000.00 $1,164.00 $7.25 $1,018.50 $6.77 1.33%Class C 1,000.00 1,159.60 11.32 1,014.72 10.56 2.08Class R 1,000.00 1,162.70 8.61 1,017.24 8.03 1.58Class Y 1,000.00 1,165.60 5.90 1,019.76 5.50 1.08
Class R5 1,000.00 1,166.00 5.08 1,020.52 4.74 0.93Class R6 1,000.00 1,166.50 4.64 1,020.92 4.33 0.85
1 The actual ending account value is based on the actual total return of the Fund for the period March 1, 2021 through August 31, 2021, after actualexpenses and will differ from the hypothetical ending account value which is based on the Fund’s expense ratio and a hypothetical annual return of 5%before expenses.
2 Expenses are equal to the Fund’s annualized expense ratio as indicated above multiplied by the average account value over the period, multiplied by184/365 to reflect the most recent fiscal half year.
18 Invesco Global Real Estate Fund
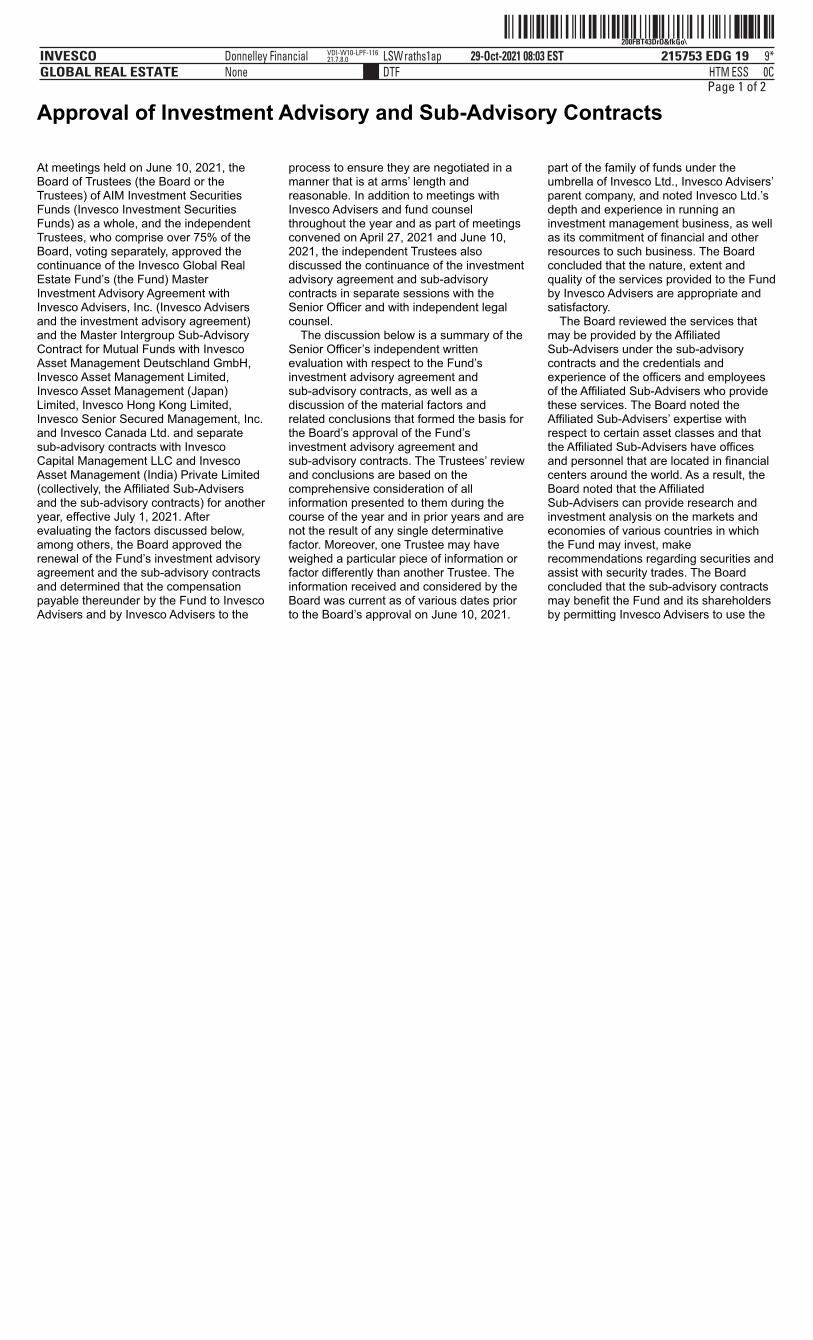
ˆ200FBT43DrD&fkGo\Š200FBT43DrD&fkGo\
215753 EDG 19INVESCOGLOBAL REAL ESTATE
29-Oct-2021 08:03 ESTHTMDTF
Donnelley Financial LSWraths1apNone
9*ESS 0C
VDI-W10-LPF-11621.7.8.0
Page 1 of 2
Approval of Investment Advisory and Sub-Advisory Contracts
At meetings held on June 10, 2021, theBoard of Trustees (the Board or theTrustees) of AIM Investment SecuritiesFunds (Invesco Investment SecuritiesFunds) as a whole, and the independentTrustees, who comprise over 75% of theBoard, voting separately, approved thecontinuance of the Invesco Global RealEstate Fund’s (the Fund) MasterInvestment Advisory Agreement withInvesco Advisers, Inc. (Invesco Advisersand the investment advisory agreement)and the Master Intergroup Sub-AdvisoryContract for Mutual Funds with InvescoAsset Management Deutschland GmbH,Invesco Asset Management Limited,Invesco Asset Management (Japan)Limited, Invesco Hong Kong Limited,Invesco Senior Secured Management, Inc.and Invesco Canada Ltd. and separatesub-advisory contracts with InvescoCapital Management LLC and InvescoAsset Management (India) Private Limited(collectively, the Affiliated Sub-Advisersand the sub-advisory contracts) for anotheryear, effective July 1, 2021. Afterevaluating the factors discussed below,among others, the Board approved therenewal of the Fund’s investment advisoryagreement and the sub-advisory contractsand determined that the compensationpayable thereunder by the Fund to InvescoAdvisers and by Invesco Advisers to the
process to ensure they are negotiated in amanner that is at arms’ length andreasonable. In addition to meetings withInvesco Advisers and fund counselthroughout the year and as part of meetingsconvened on April 27, 2021 and June 10,2021, the independent Trustees alsodiscussed the continuance of the investmentadvisory agreement and sub-advisorycontracts in separate sessions with theSenior Officer and with independent legalcounsel.
The discussion below is a summary of theSenior Officer’s independent writtenevaluation with respect to the Fund’sinvestment advisory agreement andsub-advisory contracts, as well as adiscussion of the material factors andrelated conclusions that formed the basis forthe Board’s approval of the Fund’sinvestment advisory agreement andsub-advisory contracts. The Trustees’ reviewand conclusions are based on thecomprehensive consideration of allinformation presented to them during thecourse of the year and in prior years and arenot the result of any single determinativefactor. Moreover, one Trustee may haveweighed a particular piece of information orfactor differently than another Trustee. Theinformation received and considered by theBoard was current as of various dates priorto the Board’s approval on June 10, 2021.
part of the family of funds under theumbrella of Invesco Ltd., Invesco Advisers’parent company, and noted Invesco Ltd.’sdepth and experience in running aninvestment management business, as wellas its commitment of financial and otherresources to such business. The Boardconcluded that the nature, extent andquality of the services provided to the Fundby Invesco Advisers are appropriate andsatisfactory.
The Board reviewed the services thatmay be provided by the AffiliatedSub-Advisers under the sub-advisorycontracts and the credentials andexperience of the officers and employeesof the Affiliated Sub-Advisers who providethese services. The Board noted theAffiliated Sub-Advisers’ expertise withrespect to certain asset classes and thatthe Affiliated Sub-Advisers have officesand personnel that are located in financialcenters around the world. As a result, theBoard noted that the AffiliatedSub-Advisers can provide research andinvestment analysis on the markets andeconomies of various countries in whichthe Fund may invest, makerecommendations regarding securities andassist with security trades. The Boardconcluded that the sub-advisory contractsmay benefit the Fund and its shareholdersby permitting Invesco Advisers to use the
ˆ200FBT43DrD&fkGo\Š200FBT43DrD&fkGo\
215753 EDG 19INVESCOGLOBAL REAL ESTATE
29-Oct-2021 08:03 ESTHTMDTF
Donnelley Financial LSWraths1apNone
9*ESS 0C
VDI-W10-LPF-11621.7.8.0
ˆ200FBT43DrD&fkGo\Š200FBT43DrD&fkGo\
215753 EDG 19INVESCOGLOBAL REAL ESTATE
29-Oct-2021 08:03 ESTHTMDTF
Donnelley Financial LSWraths1apNone
9*ESS 0C
VDI-W10-LPF-11621.7.8.0
Page 2 of 2
19 Invesco Global Real Estate Fund
Affiliated Sub-Advisers is fair andreasonable.The Board’s Evaluation ProcessThe Board has established an InvestmentsCommittee, which in turn has establishedSub-Committees that meet throughout theyear to review the performance of fundsadvised by Invesco Advisers (the InvescoFunds). The Sub-Committees meetregularly with portfolio managers for theirassigned Invesco Funds and othermembers of management to reviewdetailed information about investmentperformance and portfolio attributes ofthese funds. The Board has establishedadditional standing and ad hoc committeesthat meet regularly throughout the year toreview matters within their purview. TheBoard took into account evaluations andreports that it received from its committeesand sub-committees, as well as theinformation provided to the Board and itscommittees and sub-committeesthroughout the year, in consideringwhether to approve each Invesco Fund’sinvestment advisory agreement andsub-advisory contracts.
As part of the contract renewal process,the Board reviews and considersinformation provided in response todetailed requests for information submittedto management by the independentTrustees with assistance from legalcounsel to the independent Trustees. TheBoard receives comparative investmentperformance and fee and expense dataregarding the Invesco Funds prepared byBroadridge Financial Solutions, Inc.(Broadridge), an independent mutual funddata provider, as well as information on thecomposition of the peer groups providedby Broadridge and its methodology fordetermining peer groups. The Board alsoreceives an independent written evaluationfrom the Senior Officer, an officer of theInvesco Funds who reports directly to theindependent Trustees. The Senior Officer’sevaluation is prepared as part of hisresponsibility to manage the process bywhich the Invesco Funds’ proposedmanagement fees are negotiated duringthe annual contract renewal
Factors and Conclusions and Summaryof Independent Written Fee EvaluationA. Nature, Extent and Quality of Services
Provided by Invesco Advisers and theAffiliated Sub-Advisers
The Board reviewed the nature, extent andquality of the advisory services provided tothe Fund by Invesco Advisers under theFund’s investment advisory agreement, andthe credentials and experience of theofficers and employees of Invesco Adviserswho provide these services, including theFund’s portfolio manager(s). The Board’sreview included consideration of InvescoAdvisers’ investment process and oversight,credit analysis, and research capabilities.The Board considered information regardingInvesco Advisers’ programs for andresources devoted to risk management,including management of investment,enterprise, operational, liquidity, valuationand compliance risks, and technology usedto manage such risks. The Board alsoreceived and reviewed information aboutInvesco Advisers’ role as administrator ofthe Invesco Funds’ liquidity riskmanagement program. The Board receiveda description of Invesco Advisers’ businesscontinuity plans and of its approach to dataprivacy and cybersecurity, including relatedtesting. The Board considered how thecybersecurity and business continuity plansof Invesco Advisers and its key serviceproviders operated in the increased remoteworking environment resulting from thenovel coronavirus (“COVID-19”) pandemic.The Board also considered non-advisoryservices that Invesco Advisers and itsaffiliates provide to the Invesco Funds, suchas various back office support functions,third party oversight, internal audit,valuation, portfolio trading and legal andcompliance. The Board observed thatInvesco Advisers has been able toeffectively manage, operate and oversee theInvesco Funds through the challengingCOVID-19 pandemic period. The Boardreviewed and considered the benefits toshareholders of investing in a Fund that is
resources and talents of the AffiliatedSub-Advisers in managing the Fund. TheBoard concluded that the nature, extentand quality of the services that may beprovided to the Fund by the AffiliatedSub-Advisers are appropriate andsatisfactory.B. Fund Investment PerformanceThe Board considered Fund investmentperformance as a relevant factor inconsidering whether to approve theinvestment advisory agreement as well asthe sub-advisory contracts for the Fund, asInvesco Asset Management Limitedcurrently manages assets of the Fund.
The Board compared the Fund’sinvestment performance over multiple timeperiods ending December 31, 2020 to theperformance of funds in the Broadridgeperformance universe and against theCustom Invesco Global Real Estate Index(Index). The Board noted that performanceof Class A shares of the Fund was in thefifth quintile of its performance universe forthe one, three and five year periods (thefirst quintile being the best performingfunds and the fifth quintile being the worstperforming funds). The Board noted thatperformance of Class A shares of the Fundwas below the performance of the Indexfor the one, three and five year periods.The Board noted that stock selection in theU.S. and the Fund’s exposure to U.S.issuers operating in industries significantlyaffected by the COVID-19 pandemicnegatively impacted the Fund’s relativeperformance. The Board recognized thatthe performance data reflects a snapshotin time as of a particular date and thatselecting a different performance periodcould produce different results. The Boardalso reviewed more recent Fundperformance as well as other performancemetrics, which did not change itsconclusions.C. Advisory and Sub-Advisory Fees and Fund
ExpensesThe Board compared the Fund’scontractual management fee rate to thecontractual management fee rates of fundsin the Fund’s Broadridge expense
ˆ200FBT43DrD&u!souŠ200FBT43DrD&u!sou
215753 EDG 20INVESCOGLOBAL REAL ESTATE
29-Oct-2021 08:03 ESTHTMDTF
Donnelley Financial LSWraths1apNone
7*ESS 0C
VDI-W10-LPF-11621.7.8.0
Page 1 of 2
group. The Board noted that thecontractual management fee rate forClass A shares of the Fund was below themedian contractual management fee rateof funds in its expense group. The Boardnoted that the term “contractualmanagement fee” for funds in the expensegroup may include both advisory andcertain non-portfolio managementadministrative services fees, but thatBroadridge is not able to provideinformation on a fund by fund basis as towhat is included. The Board also reviewedthe methodology used by Broadridge incalculating expense group information,which includes using each fund’scontractual management fee schedule(including any applicable breakpoints) asreported in the most recent prospectus orstatement of additional information foreach fund in the expense group. TheBoard also considered comparativeinformation regarding the Fund’s totalexpense ratio and its various components.
The Board noted that Invesco Advisershas contractually agreed to waive feesand/or limit expenses of the Fund for theterm disclosed in the Fund’s registrationstatement in an amount necessary to limittotal annual operating expenses to aspecified percentage of average daily netassets for each class of the Fund.
The Board also considered the feescharged by Invesco Advisers and itsaffiliates to other client accounts that aresimilarly managed. Invesco Advisersreviewed with the Board differences in thescope of services it provides to the InvescoFunds relative to that provided by InvescoAdvisers and its affiliates to certain othertypes of client accounts, including, amongothers: management of cash flows as aresult of redemptions and purchases;necessary infrastructure such as officers,office space, technology, legal anddistribution; oversight of service providers;costs and business risks associated withlaunching new funds and sponsoring andmaintaining the product line; andcompliance with federal and state laws andregulations. Invesco Advisers also advisedthe Board that many of the similarlymanaged client accounts have all-inclusivefee structures, which are not easilyun-bundled.
The Board also compared the Fund’seffective advisory fee rate (defined for thispurpose as the advisory fee rate afteradvisory fee waivers and before otherexpense limitations/waivers) to theeffective advisory fee rates of othersimilarly managed third-party mutual fundsadvised or sub-advised by InvescoAdvisers and its affiliates, based on assetbalances as of December 31, 2020.
The Board also considered the servicesthat may be provided by the AffiliatedSub-Advisers pursuant to the sub-advisorycontracts, as well as the fees payable by
reduce the Fund’s expense ratio as it growsin size. The Board noted that the Fund alsoshares in economies of scale throughInvesco Advisers’ ability to negotiate lowerfee arrangements with third party serviceproviders. The Board noted that the Fundmay also benefit from economies of scalethrough initial fee setting, fee waivers andexpense reimbursements, as well asInvesco Advisers’ investment in its business,including investments in businessinfrastructure, technology and cybersecurity.E. Profitability and Financial ResourcesThe Board reviewed information fromInvesco Advisers concerning the costs of theadvisory and other services that InvescoAdvisers and its affiliates provide to theFund and the Invesco Funds and theprofitability of Invesco Advisers and itsaffiliates in providing these services in theaggregate and on an individualFund-by-Fund basis. The Board consideredthe methodology used for calculatingprofitability and noted that suchmethodology had recently been reviewedand enhanced. The Board noted thatInvesco Advisers continues to operate at anet profit from services Invesco Advisersand its affiliates provide to the InvescoFunds in the aggregate and to most Fundsindividually. The Board did not deem thelevel of profits realized by Invesco Advisersand its affiliates from providing suchservices to be excessive, given the nature,extent and quality of the services provided.The Board noted that Invesco Advisersprovided information demonstrating thatInvesco Advisers is financially sound andhas the resources necessary to perform itsobligations under the investment advisoryagreement, and provided representationsindicating that the Affiliated Sub-Advisersare financially sound and have theresources necessary to perform theirobligations under the sub-advisorycontracts.F. Collateral Benefits to Invesco Advisers and its
AffiliatesThe Board considered various other benefitsreceived by Invesco Advisers and itsaffiliates from the relationship with the Fund,including the fees received for providingadministrative, transfer agency anddistribution services to the Fund. The Boardreceived comparative information regardingfees charged for these services, includinginformation provided by Broadridge andother independent sources. The Boardreviewed the performance of InvescoAdvisers and its affiliates in providing theseservices and the organizational structureemployed to provide these services. TheBoard noted that these services areprovided to the Fund pursuant to writtencontracts that are reviewed and subject toapproval on an annual basis by the Boardbased on its determination that the servicesare required for the operation of the Fund.
The Board considered the benefitsrealized by Invesco Advisers and the
The Board considered that the Fund’suninvested cash and cash collateral fromany securities lending arrangements maybe invested in registered money marketfunds or, with regard to securities lendingcash collateral, unregistered funds thatcomply with Rule 2a-7 (collectively referredto as “affiliated money market funds”)advised by Invesco Advisers. The Boardconsidered information regarding thereturns of the affiliated money marketfunds relative to comparable overnightinvestments, as well as the fees paid bythe affiliated money market funds toInvesco Advisers and its affiliates. In thisregard, the Board noted that InvescoAdvisers receives advisory fees from theseaffiliated money market funds attributableto the Fund’s investments. The Board alsonoted that Invesco Advisers hascontractually agreed to waive throughvarying periods an amount equal to 100%of the net advisory fee Invesco Advisersreceives from the affiliated money marketfunds with respect to the Fund’sinvestment in the affiliated money marketfunds of uninvested cash, but not cashcollateral. The Board concluded that theadvisory fees payable to Invesco Advisersfrom the Fund’s investment of cashcollateral from any securities lendingarrangements in the affiliated moneymarket funds are for services that are notduplicative of services provided by InvescoAdvisers to the Fund.
The Board also received informationabout commissions that an affiliated brokermay receive for executing certain tradesfor the Fund. Invesco Advisers and theAffiliated Sub-Advisers advised the Boardof the benefits to the Fund of executingtrades through the affiliated broker and thatsuch trades were executed in compliancewith rules under the federal securities lawsand consistent with best executionobligations.

ˆ200FBT43DrD&u!souŠ200FBT43DrD&u!sou
215753 EDG 20INVESCOGLOBAL REAL ESTATE
29-Oct-2021 08:03 ESTHTMDTF
Donnelley Financial LSWraths1apNone
7*ESS 0C
VDI-W10-LPF-11621.7.8.0
ˆ200FBT43DrD&u!souŠ200FBT43DrD&u!sou
215753 EDG 20INVESCOGLOBAL REAL ESTATE
29-Oct-2021 08:03 ESTHTMDTF
Donnelley Financial LSWraths1apNone
7*ESS 0C
VDI-W10-LPF-11621.7.8.0
Page 2 of 2
20 Invesco Global Real Estate Fund
Invesco Advisers to the AffiliatedSub-Advisers pursuant to the sub-advisorycontracts. The Board noted that InvescoAdvisers retains overall responsibility for,and provides services to, sub-advisedInvesco Funds, including oversight of theAffiliated Sub-Advisers as well as theadditional services described herein otherthan day-to-day portfolio management.D. Economies of Scale and BreakpointsThe Board considered the extent to whichthere may be economies of scale in theprovision of advisory services to the Fundand the Invesco Funds, and the extent towhich such economies of scale are sharedwith the Fund and the Invesco Funds. TheBoard considered that the Fund benefitsfrom economies of scale throughcontractual breakpoints in the Fund’sadvisory fee schedule, which generallyoperate to
realized by Invesco Advisers and theAffiliated Sub-Advisers as a result ofportfolio brokerage transactions executedthrough “soft dollar” arrangements. TheBoard noted that soft dollar arrangementsmay result in the Fund bearing costs topurchase research that may be used byInvesco Advisers or the AffiliatedSub-Advisers with other clients and mayreduce Invesco Advisers’ or the AffiliatedSub-Advisers’ expenses. The Board alsoconsidered that it receives from InvescoAdvisers periodic reports that include arepresentation to the effect that thesearrangements are consistent with regulatoryrequirements. The Board did not deem thesoft dollar arrangements to beinappropriate.

ˆ200FBT43DrD&wXXoŠ200FBT43DrD&wXXo´
215753 EDG 21INVESCOGLOBAL REAL ESTATE
29-Oct-2021 08:03 ESTHTMDTF
Donnelley Financial LSWraths1apNone
6*ESS 0C
VDI-W10-LPF-11621.7.8.0
Page 1 of 1
(This page intentionally left blank)

ˆ200FBT43DrD&!Jfo}Š200FBT43DrD&!Jfo}
215753 EDG 22INVESCOGLOBAL REAL ESTATE
29-Oct-2021 08:03 ESTHTMDTF
Donnelley Financial LSWraths1apNone
6*ESS 0C
VDI-W10-LPF-11621.7.8.0
Page 1 of 1
(This page intentionally left blank)

ˆ200FBT43DrD&&%tGBŠ200FBT43DrD&&%tGB
215753 EDG 23INVESCOGLOBAL REAL ESTATE
29-Oct-2021 08:03 ESTHTMDTF
Donnelley Financial LSWraths1apNone
6*ESS 0C
VDI-W10-LPF-11621.7.8.0
Page 1 of 1
(This page intentionally left blank)
ˆ200FBT43DrF0HHRGsŠ200FBT43DrF0HHRGs
215753 EDG 24INVESCOGLOBAL REAL ESTATE
29-Oct-2021 08:03 ESTHTMDTF
Donnelley Financial LSWraths1apNone
6*ESS 0C
VDI-W10-LPF-11621.7.8.0
dsp001adsp024
Page 1 of 1
Go paperless with eDeliveryVisit invesco.com/edelivery to enjoy the convenience and security of anytime electronic access to your investmentdocuments.With eDelivery, you can elect to have any or all of the following materials delivered straight to your inbox to download, saveand print from your own computer:
∎ Fund reports and prospectuses∎ Quarterly statements∎ Daily confirmations∎ Tax forms Invesco mailing informationSend general correspondence to Invesco Investment Services, Inc., P.O. Box 219078, Kansas City, MO 64121-9078. Important notice regarding delivery of security holder documentsTo reduce Fund expenses, only one copy of most shareholder documents may be mailed to shareholders with multipleaccounts at the same address (Householding). Mailing of your shareholder documents may be householded indefinitelyunless you instruct us otherwise. If you do not want the mailing of these documents to be combined with those for othermembers of your household, please contact Invesco Investment Services, Inc. at 800 959 4246 or contact your financialinstitution. We will begin sending you individual copies for each account within 30 days after receiving your request. Fund holdings and proxy voting informationThe Fund provides a complete list of its portfolio holdings four times each fiscal year, at the end of each fiscal quarter. For thesecond and fourth quarters, the list appears, respectively, in the Fund’s semiannual and annual reports to shareholders. Forthe first and third quarters, the Fund files the list with the Securities and Exchange Commission (SEC) as an exhibit to itsreports on Form N-PORT. The most recent list of portfolio holdings is available at invesco.com/completeqtrholdings.Shareholders can also look up the Fund’s Form N-PORT filings on the SEC website, sec.gov. The SEC file numbers for theFund are shown below.
A description of the policies and procedures that the Fund uses to determine how to vote proxies relating to portfoliosecurities is available without charge, upon request, from our Client Services department at 800 959 4246, or at invesco.com/corporate/about-us/esg. The information is also available on the SEC website, sec.gov.
Information regarding how the Fund voted proxies related to its portfolio securities during the most recent 12-month periodended June 30 is available at invesco.com/proxysearch. This information is also available on the SEC website, sec.gov.
Invesco Advisers, Inc. is an investment adviser; it provides investment advisory services to individual and institutionalclients and does not sell securities. Invesco Distributors, Inc. is the US distributor for Invesco Ltd.’s retail mutual funds,exchange-traded funds and institutional money market funds. Both are wholly owned, indirect subsidiaries of Invesco Ltd.
SEC file number(s): 811-05686 and 033-39519 Invesco Distributors, Inc. GRE-SAR-1
ˆ200F4hpToRBsuiwsDŠ200F4hpToRBsuiwsD
173173 EDG 1INVESCOGOVERNMENT MONEY MAR
29-Oct-2021 11:30 ESTHTMDTF
Donnelley Financial ADG pf_rendNone
7*ESS 0C
ADGP64RS2921.10.7.0
g59v84
Page 1 of 1
Semiannual Report to Shareholders August 31, 2021
Invesco Government Money Market FundNasdaq: Invesco Cash Reserve: AIMXX ∎ A: ADAXX ∎ AX: ACZXX ∎ C: ACNXX ∎ CX: ACXXX∎ R: AIRXX ∎ Y: AIYXX ∎ Investor: INAXX ∎ R6: INVXX
2 Fund Information3 Schedule of Investments7 Financial Statements10 Financial Highlights11 Notes to Financial Statements16 Fund Expenses17 Approval of Investment Advisory and Sub-Advisory Contracts
For the most current month-end Fund performance and commentary, please visit invesco.com/performance.Unless otherwise noted, all data provided by Invesco.This report must be accompanied or preceded by a currently effective Fund prospectus, which contains more completeinformation, including sales charges and expenses. Investors should read it carefully before investing.
NOT FDIC INSURED | MAY LOSE VALUE | NO BANK GUARANTEE

ˆ200F4hpToRBswBas*Š200F4hpToRBswBas*
173173 EDG 2INVESCOGOVERNMENT MONEY MAR
29-Oct-2021 11:30 ESTHTMDTF
Donnelley Financial ADG pf_rendNone
6*ESS 0C
ADGP64RS2921.10.7.0
Page 1 of 1
Fund InformationYou could lose money by investing in the Fund. Although the Fund seeks to preserve your investment at $1.00 per share, it
cannot guarantee it will do so. An investment in the Fund is not insured or guaranteed by the Federal Deposit InsuranceCorporation or any other government agency. The Fund’s sponsor has no legal obligation to provide financial support to theFund, and you should not expect that the sponsor will provide financial support to the Fund at any time.
The Fund is subject to certain other risks. Please see the current prospectus for more information regarding the risksassociated with an investment in the Fund.
Team managed by Invesco Advisers, Inc. 2 Invesco Government Money Market Fund
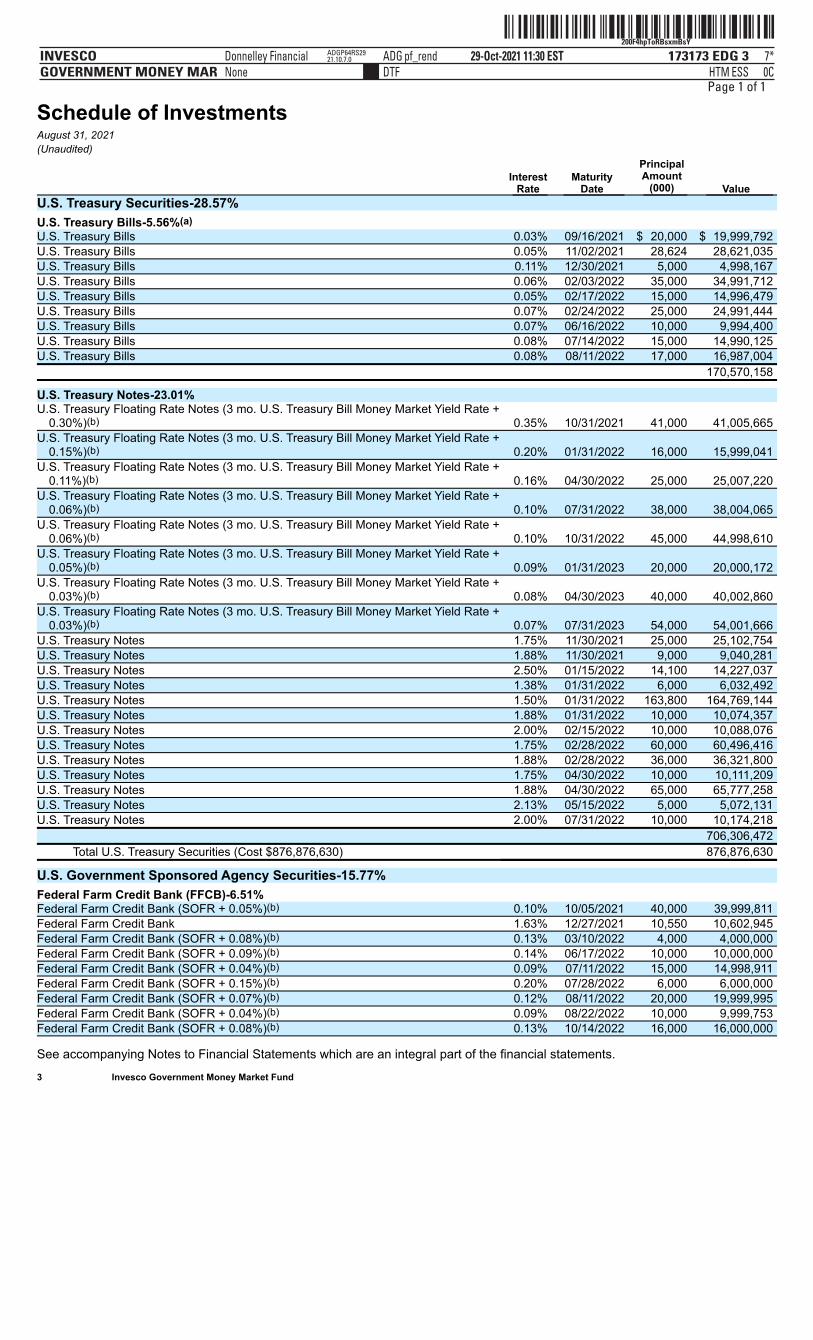
ˆ200F4hpToRBsxmBsYŠ200F4hpToRBsxmBsY
173173 EDG 3INVESCOGOVERNMENT MONEY MAR
29-Oct-2021 11:30 ESTHTMDTF
Donnelley Financial ADG pf_rendNone
7*ESS 0C
ADGP64RS2921.10.7.0
Page 1 of 1
Schedule of InvestmentsAugust 31, 2021(Unaudited)
Interest
Rate Maturity
Date
PrincipalAmount
(000) Value U.S. Treasury Securities-28.57% U.S. Treasury Bills-5.56%(a) U.S. Treasury Bills 0.03% 09/16/2021 $ 20,000 $ 19,999,792 U.S. Treasury Bills 0.05% 11/02/2021 28,624 28,621,035 U.S. Treasury Bills 0.11% 12/30/2021 5,000 4,998,167 U.S. Treasury Bills 0.06% 02/03/2022 35,000 34,991,712 U.S. Treasury Bills 0.05% 02/17/2022 15,000 14,996,479 U.S. Treasury Bills 0.07% 02/24/2022 25,000 24,991,444 U.S. Treasury Bills 0.07% 06/16/2022 10,000 9,994,400 U.S. Treasury Bills 0.08% 07/14/2022 15,000 14,990,125 U.S. Treasury Bills 0.08% 08/11/2022 17,000 16,987,004 170,570,158
U.S. Treasury Notes-23.01% U.S. Treasury Floating Rate Notes (3 mo. U.S. Treasury Bill Money Market Yield Rate +
0.30%)(b) 0.35% 10/31/2021 41,000 41,005,665 U.S. Treasury Floating Rate Notes (3 mo. U.S. Treasury Bill Money Market Yield Rate +
0.15%)(b) 0.20% 01/31/2022 16,000 15,999,041 U.S. Treasury Floating Rate Notes (3 mo. U.S. Treasury Bill Money Market Yield Rate +
0.11%)(b) 0.16% 04/30/2022 25,000 25,007,220 U.S. Treasury Floating Rate Notes (3 mo. U.S. Treasury Bill Money Market Yield Rate +
0.06%)(b) 0.10% 07/31/2022 38,000 38,004,065 U.S. Treasury Floating Rate Notes (3 mo. U.S. Treasury Bill Money Market Yield Rate +
0.06%)(b) 0.10% 10/31/2022 45,000 44,998,610 U.S. Treasury Floating Rate Notes (3 mo. U.S. Treasury Bill Money Market Yield Rate +
0.05%)(b) 0.09% 01/31/2023 20,000 20,000,172 U.S. Treasury Floating Rate Notes (3 mo. U.S. Treasury Bill Money Market Yield Rate +
0.03%)(b) 0.08% 04/30/2023 40,000 40,002,860 U.S. Treasury Floating Rate Notes (3 mo. U.S. Treasury Bill Money Market Yield Rate +
0.03%)(b) 0.07% 07/31/2023 54,000 54,001,666 U.S. Treasury Notes 1.75% 11/30/2021 25,000 25,102,754 U.S. Treasury Notes 1.88% 11/30/2021 9,000 9,040,281 U.S. Treasury Notes 2.50% 01/15/2022 14,100 14,227,037 U.S. Treasury Notes 1.38% 01/31/2022 6,000 6,032,492 U.S. Treasury Notes 1.50% 01/31/2022 163,800 164,769,144 U.S. Treasury Notes 1.88% 01/31/2022 10,000 10,074,357 U.S. Treasury Notes 2.00% 02/15/2022 10,000 10,088,076 U.S. Treasury Notes 1.75% 02/28/2022 60,000 60,496,416 U.S. Treasury Notes 1.88% 02/28/2022 36,000 36,321,800 U.S. Treasury Notes 1.75% 04/30/2022 10,000 10,111,209 U.S. Treasury Notes 1.88% 04/30/2022 65,000 65,777,258 U.S. Treasury Notes 2.13% 05/15/2022 5,000 5,072,131 U.S. Treasury Notes 2.00% 07/31/2022 10,000 10,174,218 706,306,472
Total U.S. Treasury Securities (Cost $876,876,630) 876,876,630
U.S. Government Sponsored Agency Securities-15.77% Federal Farm Credit Bank (FFCB)-6.51% Federal Farm Credit Bank (SOFR + 0.05%)(b) 0.10% 10/05/2021 40,000 39,999,811 Federal Farm Credit Bank 1.63% 12/27/2021 10,550 10,602,945 Federal Farm Credit Bank (SOFR + 0.08%)(b) 0.13% 03/10/2022 4,000 4,000,000 Federal Farm Credit Bank (SOFR + 0.09%)(b) 0.14% 06/17/2022 10,000 10,000,000 Federal Farm Credit Bank (SOFR + 0.04%)(b) 0.09% 07/11/2022 15,000 14,998,911 Federal Farm Credit Bank (SOFR + 0.15%)(b) 0.20% 07/28/2022 6,000 6,000,000 Federal Farm Credit Bank (SOFR + 0.07%)(b) 0.12% 08/11/2022 20,000 19,999,995 Federal Farm Credit Bank (SOFR + 0.04%)(b) 0.09% 08/22/2022 10,000 9,999,753 Federal Farm Credit Bank (SOFR + 0.08%)(b) 0.13% 10/14/2022 16,000 16,000,000
See accompanying Notes to Financial Statements which are an integral part of the financial statements. 3 Invesco Government Money Market Fund
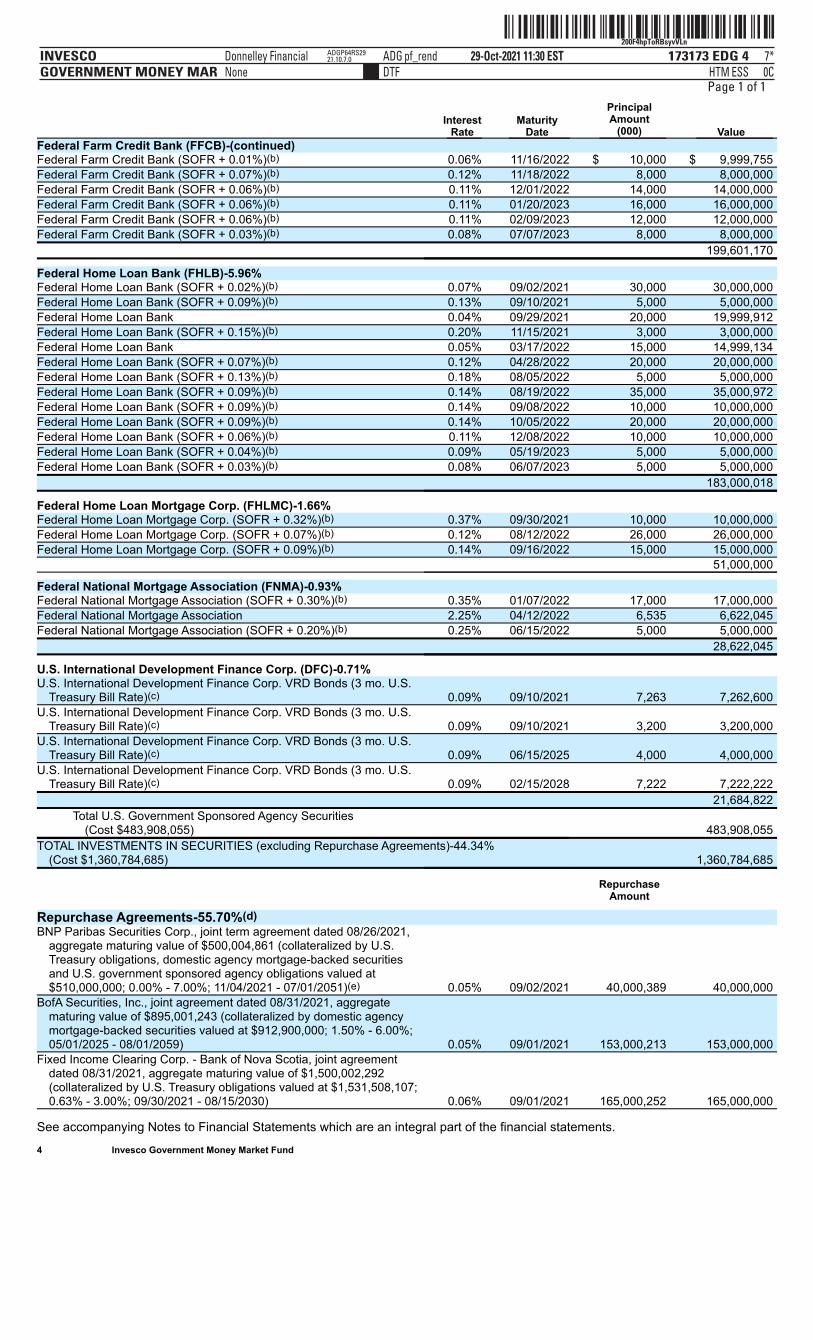
ˆ200F4hpToRBsyvVLnŠ200F4hpToRBsyvVLn
173173 EDG 4INVESCOGOVERNMENT MONEY MAR
29-Oct-2021 11:30 ESTHTMDTF
Donnelley Financial ADG pf_rendNone
7*ESS 0C
ADGP64RS2921.10.7.0
Page 1 of 1
Interest
Rate Maturity
Date
PrincipalAmount
(000) Value Federal Farm Credit Bank (FFCB)-(continued) Federal Farm Credit Bank (SOFR + 0.01%)(b) 0.06% 11/16/2022 $ 10,000 $ 9,999,755 Federal Farm Credit Bank (SOFR + 0.07%)(b) 0.12% 11/18/2022 8,000 8,000,000 Federal Farm Credit Bank (SOFR + 0.06%)(b) 0.11% 12/01/2022 14,000 14,000,000 Federal Farm Credit Bank (SOFR + 0.06%)(b) 0.11% 01/20/2023 16,000 16,000,000 Federal Farm Credit Bank (SOFR + 0.06%)(b) 0.11% 02/09/2023 12,000 12,000,000 Federal Farm Credit Bank (SOFR + 0.03%)(b) 0.08% 07/07/2023 8,000 8,000,000 199,601,170
Federal Home Loan Bank (FHLB)-5.96% Federal Home Loan Bank (SOFR + 0.02%)(b) 0.07% 09/02/2021 30,000 30,000,000 Federal Home Loan Bank (SOFR + 0.09%)(b) 0.13% 09/10/2021 5,000 5,000,000 Federal Home Loan Bank 0.04% 09/29/2021 20,000 19,999,912 Federal Home Loan Bank (SOFR + 0.15%)(b) 0.20% 11/15/2021 3,000 3,000,000 Federal Home Loan Bank 0.05% 03/17/2022 15,000 14,999,134 Federal Home Loan Bank (SOFR + 0.07%)(b) 0.12% 04/28/2022 20,000 20,000,000 Federal Home Loan Bank (SOFR + 0.13%)(b) 0.18% 08/05/2022 5,000 5,000,000 Federal Home Loan Bank (SOFR + 0.09%)(b) 0.14% 08/19/2022 35,000 35,000,972 Federal Home Loan Bank (SOFR + 0.09%)(b) 0.14% 09/08/2022 10,000 10,000,000 Federal Home Loan Bank (SOFR + 0.09%)(b) 0.14% 10/05/2022 20,000 20,000,000 Federal Home Loan Bank (SOFR + 0.06%)(b) 0.11% 12/08/2022 10,000 10,000,000 Federal Home Loan Bank (SOFR + 0.04%)(b) 0.09% 05/19/2023 5,000 5,000,000 Federal Home Loan Bank (SOFR + 0.03%)(b) 0.08% 06/07/2023 5,000 5,000,000 183,000,018
Federal Home Loan Mortgage Corp. (FHLMC)-1.66% Federal Home Loan Mortgage Corp. (SOFR + 0.32%)(b) 0.37% 09/30/2021 10,000 10,000,000 Federal Home Loan Mortgage Corp. (SOFR + 0.07%)(b) 0.12% 08/12/2022 26,000 26,000,000 Federal Home Loan Mortgage Corp. (SOFR + 0.09%)(b) 0.14% 09/16/2022 15,000 15,000,000 51,000,000
Federal National Mortgage Association (FNMA)-0.93% Federal National Mortgage Association (SOFR + 0.30%)(b) 0.35% 01/07/2022 17,000 17,000,000 Federal National Mortgage Association 2.25% 04/12/2022 6,535 6,622,045 Federal National Mortgage Association (SOFR + 0.20%)(b) 0.25% 06/15/2022 5,000 5,000,000 28,622,045
U.S. International Development Finance Corp. (DFC)-0.71% U.S. International Development Finance Corp. VRD Bonds (3 mo. U.S.
Treasury Bill Rate)(c) 0.09% 09/10/2021 7,263 7,262,600 U.S. International Development Finance Corp. VRD Bonds (3 mo. U.S.
Treasury Bill Rate)(c) 0.09% 09/10/2021 3,200 3,200,000 U.S. International Development Finance Corp. VRD Bonds (3 mo. U.S.
Treasury Bill Rate)(c) 0.09% 06/15/2025 4,000 4,000,000 U.S. International Development Finance Corp. VRD Bonds (3 mo. U.S.
Treasury Bill Rate)(c) 0.09% 02/15/2028 7,222 7,222,222 21,684,822
Total U.S. Government Sponsored Agency Securities(Cost $483,908,055) 483,908,055
TOTAL INVESTMENTS IN SECURITIES (excluding Repurchase Agreements)-44.34%(Cost $1,360,784,685)
1,360,784,685
Repurchase
Amount
Repurchase Agreements-55.70%(d) BNP Paribas Securities Corp., joint term agreement dated 08/26/2021,
aggregate maturing value of $500,004,861 (collateralized by U.S.Treasury obligations, domestic agency mortgage-backed securitiesand U.S. government sponsored agency obligations valued at$510,000,000; 0.00% - 7.00%; 11/04/2021 - 07/01/2051)(e) 0.05% 09/02/2021 40,000,389 40,000,000
BofA Securities, Inc., joint agreement dated 08/31/2021, aggregatematuring value of $895,001,243 (collateralized by domestic agencymortgage-backed securities valued at $912,900,000; 1.50% - 6.00%;05/01/2025 - 08/01/2059) 0.05% 09/01/2021 153,000,213 153,000,000
Fixed Income Clearing Corp. - Bank of Nova Scotia, joint agreementdated 08/31/2021, aggregate maturing value of $1,500,002,292(collateralized by U.S. Treasury obligations valued at $1,531,508,107;0.63% - 3.00%; 09/30/2021 - 08/15/2030) 0.06% 09/01/2021 165,000,252 165,000,000
See accompanying Notes to Financial Statements which are an integral part of the financial statements. 4 Invesco Government Money Market Fund
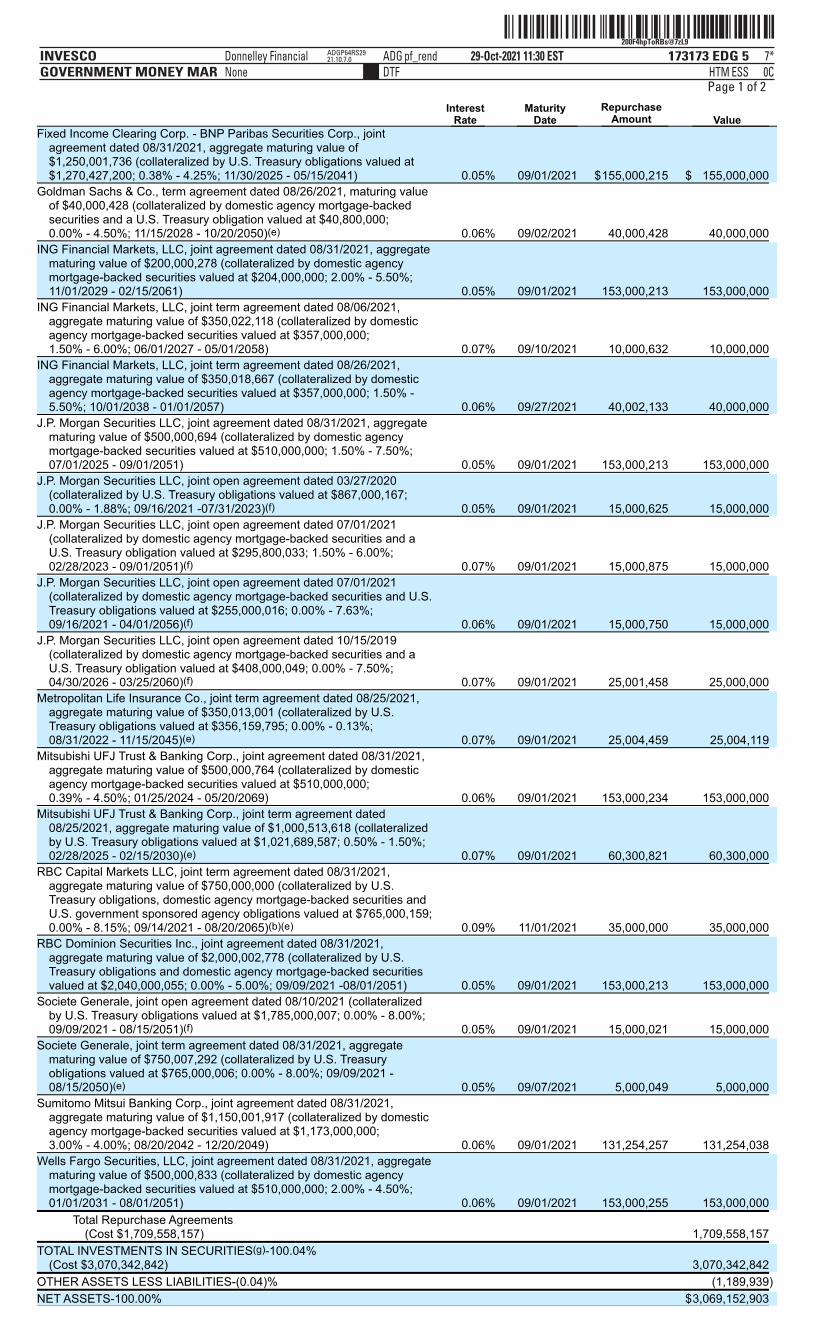
ˆ200F4hpToRBs@7zL9Š200F4hpToRBs@7zL9
173173 EDG 5INVESCOGOVERNMENT MONEY MAR
29-Oct-2021 11:30 ESTHTMDTF
Donnelley Financial ADG pf_rendNone
7*ESS 0C
ADGP64RS2921.10.7.0
Page 1 of 2
Interest
Rate Maturity
Date Repurchase
Amount Value Fixed Income Clearing Corp. - BNP Paribas Securities Corp., joint
agreement dated 08/31/2021, aggregate maturing value of$1,250,001,736 (collateralized by U.S. Treasury obligations valued at$1,270,427,200; 0.38% - 4.25%; 11/30/2025 - 05/15/2041) 0.05% 09/01/2021 $155,000,215 $ 155,000,000
Goldman Sachs & Co., term agreement dated 08/26/2021, maturing valueof $40,000,428 (collateralized by domestic agency mortgage-backedsecurities and a U.S. Treasury obligation valued at $40,800,000;0.00% - 4.50%; 11/15/2028 - 10/20/2050)(e) 0.06% 09/02/2021 40,000,428 40,000,000
ING Financial Markets, LLC, joint agreement dated 08/31/2021, aggregatematuring value of $200,000,278 (collateralized by domestic agencymortgage-backed securities valued at $204,000,000; 2.00% - 5.50%;11/01/2029 - 02/15/2061) 0.05% 09/01/2021 153,000,213 153,000,000
ING Financial Markets, LLC, joint term agreement dated 08/06/2021,aggregate maturing value of $350,022,118 (collateralized by domesticagency mortgage-backed securities valued at $357,000,000;1.50% - 6.00%; 06/01/2027 - 05/01/2058) 0.07% 09/10/2021 10,000,632 10,000,000
ING Financial Markets, LLC, joint term agreement dated 08/26/2021,aggregate maturing value of $350,018,667 (collateralized by domesticagency mortgage-backed securities valued at $357,000,000; 1.50% -5.50%; 10/01/2038 - 01/01/2057) 0.06% 09/27/2021 40,002,133 40,000,000
J.P. Morgan Securities LLC, joint agreement dated 08/31/2021, aggregatematuring value of $500,000,694 (collateralized by domestic agencymortgage-backed securities valued at $510,000,000; 1.50% - 7.50%;07/01/2025 - 09/01/2051) 0.05% 09/01/2021 153,000,213 153,000,000
J.P. Morgan Securities LLC, joint open agreement dated 03/27/2020(collateralized by U.S. Treasury obligations valued at $867,000,167;0.00% - 1.88%; 09/16/2021 -07/31/2023)(f) 0.05% 09/01/2021 15,000,625 15,000,000
J.P. Morgan Securities LLC, joint open agreement dated 07/01/2021(collateralized by domestic agency mortgage-backed securities and aU.S. Treasury obligation valued at $295,800,033; 1.50% - 6.00%;02/28/2023 - 09/01/2051)(f) 0.07% 09/01/2021 15,000,875 15,000,000
J.P. Morgan Securities LLC, joint open agreement dated 07/01/2021(collateralized by domestic agency mortgage-backed securities and U.S.Treasury obligations valued at $255,000,016; 0.00% - 7.63%;09/16/2021 - 04/01/2056)(f) 0.06% 09/01/2021 15,000,750 15,000,000
J.P. Morgan Securities LLC, joint open agreement dated 10/15/2019(collateralized by domestic agency mortgage-backed securities and aU.S. Treasury obligation valued at $408,000,049; 0.00% - 7.50%;04/30/2026 - 03/25/2060)(f) 0.07% 09/01/2021 25,001,458 25,000,000
Metropolitan Life Insurance Co., joint term agreement dated 08/25/2021,aggregate maturing value of $350,013,001 (collateralized by U.S.Treasury obligations valued at $356,159,795; 0.00% - 0.13%;08/31/2022 - 11/15/2045)(e) 0.07% 09/01/2021 25,004,459 25,004,119
Mitsubishi UFJ Trust & Banking Corp., joint agreement dated 08/31/2021,aggregate maturing value of $500,000,764 (collateralized by domesticagency mortgage-backed securities valued at $510,000,000;0.39% - 4.50%; 01/25/2024 - 05/20/2069) 0.06% 09/01/2021 153,000,234 153,000,000
Mitsubishi UFJ Trust & Banking Corp., joint term agreement dated08/25/2021, aggregate maturing value of $1,000,513,618 (collateralizedby U.S. Treasury obligations valued at $1,021,689,587; 0.50% - 1.50%;02/28/2025 - 02/15/2030)(e) 0.07% 09/01/2021 60,300,821 60,300,000
RBC Capital Markets LLC, joint term agreement dated 08/31/2021,aggregate maturing value of $750,000,000 (collateralized by U.S.Treasury obligations, domestic agency mortgage-backed securities andU.S. government sponsored agency obligations valued at $765,000,159;0.00% - 8.15%; 09/14/2021 - 08/20/2065)(b)(e) 0.09% 11/01/2021 35,000,000 35,000,000
RBC Dominion Securities Inc., joint agreement dated 08/31/2021,aggregate maturing value of $2,000,002,778 (collateralized by U.S.Treasury obligations and domestic agency mortgage-backed securitiesvalued at $2,040,000,055; 0.00% - 5.00%; 09/09/2021 -08/01/2051) 0.05% 09/01/2021 153,000,213 153,000,000
Societe Generale, joint open agreement dated 08/10/2021 (collateralizedby U.S. Treasury obligations valued at $1,785,000,007; 0.00% - 8.00%;09/09/2021 - 08/15/2051)(f) 0.05% 09/01/2021 15,000,021 15,000,000
Societe Generale, joint term agreement dated 08/31/2021, aggregatematuring value of $750,007,292 (collateralized by U.S. Treasuryobligations valued at $765,000,006; 0.00% - 8.00%; 09/09/2021 -08/15/2050)(e) 0.05% 09/07/2021 5,000,049 5,000,000
Sumitomo Mitsui Banking Corp., joint agreement dated 08/31/2021,aggregate maturing value of $1,150,001,917 (collateralized by domesticagency mortgage-backed securities valued at $1,173,000,000;3.00% - 4.00%; 08/20/2042 - 12/20/2049) 0.06% 09/01/2021 131,254,257 131,254,038
Wells Fargo Securities, LLC, joint agreement dated 08/31/2021, aggregatematuring value of $500,000,833 (collateralized by domestic agencymortgage-backed securities valued at $510,000,000; 2.00% - 4.50%;01/01/2031 - 08/01/2051) 0.06% 09/01/2021 153,000,255 153,000,000
Total Repurchase Agreements(Cost $1,709,558,157) 1,709,558,157
TOTAL INVESTMENTS IN SECURITIES(g)-100.04%(Cost $3,070,342,842) 3,070,342,842
OTHER ASSETS LESS LIABILITIES-(0.04)% (1,189,939)
NET ASSETS-100.00% $3,069,152,903

ˆ200F4hpToRBs@7zL9Š200F4hpToRBs@7zL9
173173 EDG 5INVESCOGOVERNMENT MONEY MAR
29-Oct-2021 11:30 ESTHTMDTF
Donnelley Financial ADG pf_rendNone
7*ESS 0C
ADGP64RS2921.10.7.0
ˆ200F4hpToRBs@7zL9Š200F4hpToRBs@7zL9
173173 EDG 5INVESCOGOVERNMENT MONEY MAR
29-Oct-2021 11:30 ESTHTMDTF
Donnelley Financial ADG pf_rendNone
7*ESS 0C
ADGP64RS2921.10.7.0
Page 2 of 2
See accompanying Notes to Financial Statements which are an integral part of the financial statements. 5 Invesco Government Money Market Fund
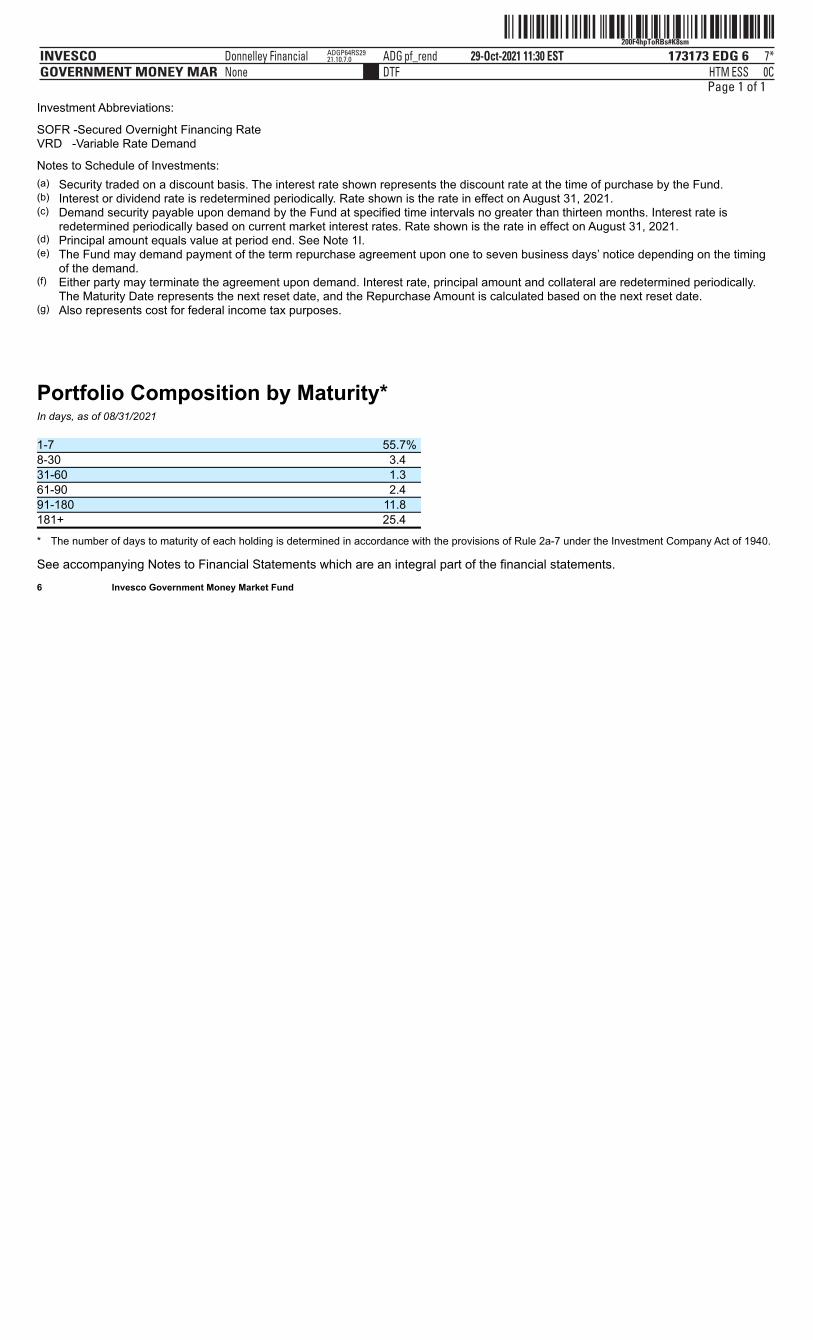
ˆ200F4hpToRBs#K8smŠ200F4hpToRBs#K8sm
173173 EDG 6INVESCOGOVERNMENT MONEY MAR
29-Oct-2021 11:30 ESTHTMDTF
Donnelley Financial ADG pf_rendNone
7*ESS 0C
ADGP64RS2921.10.7.0
Page 1 of 1Investment Abbreviations:
SOFR -Secured Overnight Financing RateVRD -Variable Rate Demand
Notes to Schedule of Investments:
(a) Security traded on a discount basis. The interest rate shown represents the discount rate at the time of purchase by the Fund.(b) Interest or dividend rate is redetermined periodically. Rate shown is the rate in effect on August 31, 2021.(c) Demand security payable upon demand by the Fund at specified time intervals no greater than thirteen months. Interest rate is
redetermined periodically based on current market interest rates. Rate shown is the rate in effect on August 31, 2021.(d) Principal amount equals value at period end. See Note 1I.(e) The Fund may demand payment of the term repurchase agreement upon one to seven business days’ notice depending on the timing
of the demand.(f) Either party may terminate the agreement upon demand. Interest rate, principal amount and collateral are redetermined periodically.
The Maturity Date represents the next reset date, and the Repurchase Amount is calculated based on the next reset date.(g) Also represents cost for federal income tax purposes.
Portfolio Composition by Maturity*In days, as of 08/31/2021 1-7 55.7% 8-30 3.4 31-60 1.3 61-90 2.4 91-180 11.8 181+ 25.4
* The number of days to maturity of each holding is determined in accordance with the provisions of Rule 2a-7 under the Investment Company Act of 1940.
See accompanying Notes to Financial Statements which are an integral part of the financial statements. 6 Invesco Government Money Market Fund
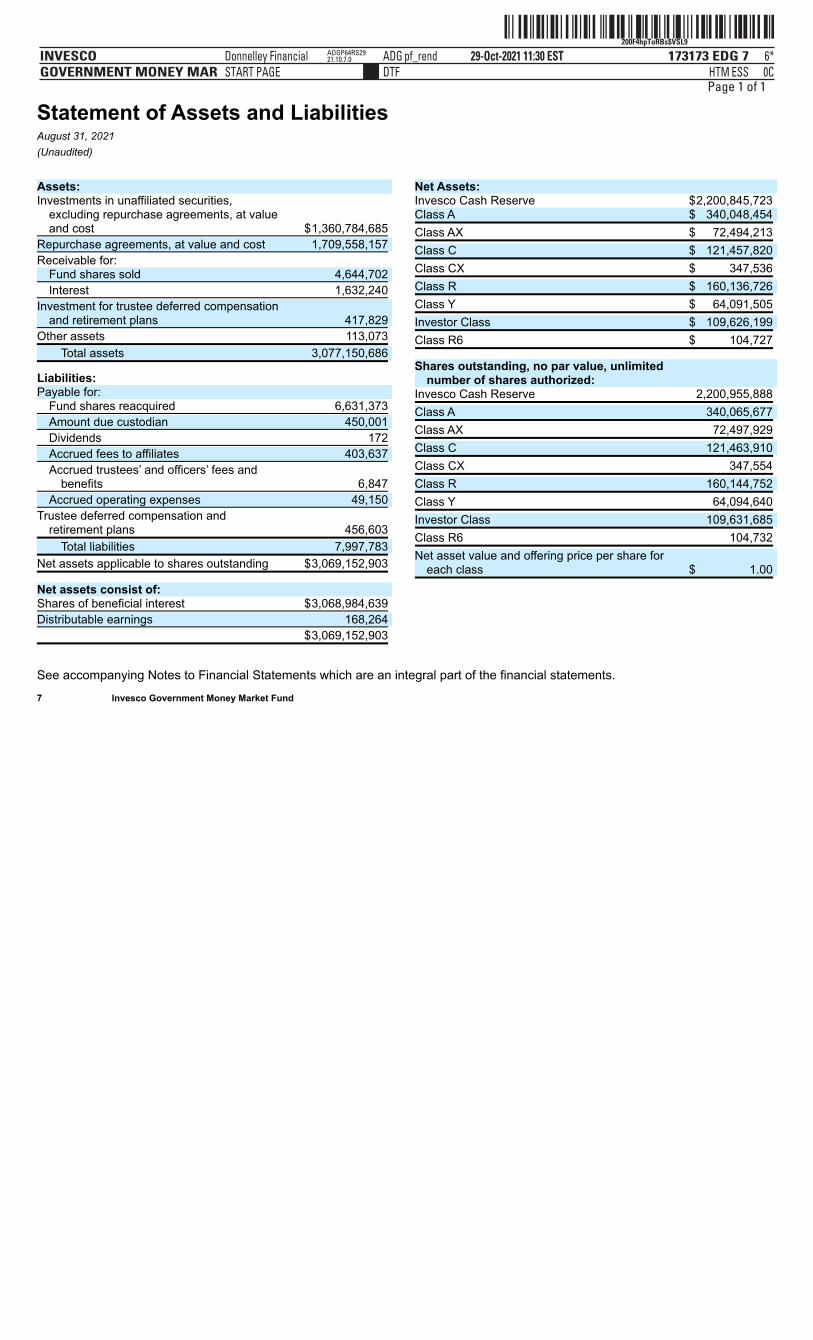
ˆ200F4hpToRBs$VSL9Š200F4hpToRBs$VSL9
173173 EDG 7INVESCOGOVERNMENT MONEY MAR
29-Oct-2021 11:30 ESTHTMDTF
Donnelley Financial ADG pf_rendSTART PAGE
6*ESS 0C
ADGP64RS2921.10.7.0
Page 1 of 1
Statement of Assets and LiabilitiesAugust 31, 2021(Unaudited)
See accompanying Notes to Financial Statements which are an integral part of the financial statements. 7 Invesco Government Money Market Fund
Assets: Investments in unaffiliated securities,
excluding repurchase agreements, at valueand cost $1,360,784,685
Repurchase agreements, at value and cost 1,709,558,157
Receivable for: Fund shares sold 4,644,702
Interest 1,632,240
Investment for trustee deferred compensationand retirement plans 417,829
Other assets 113,073
Total assets 3,077,150,686
Liabilities: Payable for:
Fund shares reacquired 6,631,373
Amount due custodian 450,001
Dividends 172
Accrued fees to affiliates 403,637
Accrued trustees’ and officers’ fees andbenefits 6,847
Accrued operating expenses 49,150
Trustee deferred compensation andretirement plans 456,603
Total liabilities 7,997,783
Net assets applicable to shares outstanding $3,069,152,903
Net assets consist of: Shares of beneficial interest $3,068,984,639
Distributable earnings 168,264
$3,069,152,903
Net Assets: Invesco Cash Reserve $2,200,845,723 Class A $ 340,048,454
Class AX $ 72,494,213
Class C $ 121,457,820
Class CX $ 347,536
Class R $ 160,136,726
Class Y $ 64,091,505
Investor Class $ 109,626,199
Class R6 $ 104,727
Shares outstanding, no par value, unlimitednumber of shares authorized:
Invesco Cash Reserve 2,200,955,888
Class A 340,065,677
Class AX 72,497,929
Class C 121,463,910
Class CX 347,554
Class R 160,144,752
Class Y 64,094,640
Investor Class 109,631,685
Class R6 104,732
Net asset value and offering price per share foreach class $ 1.00
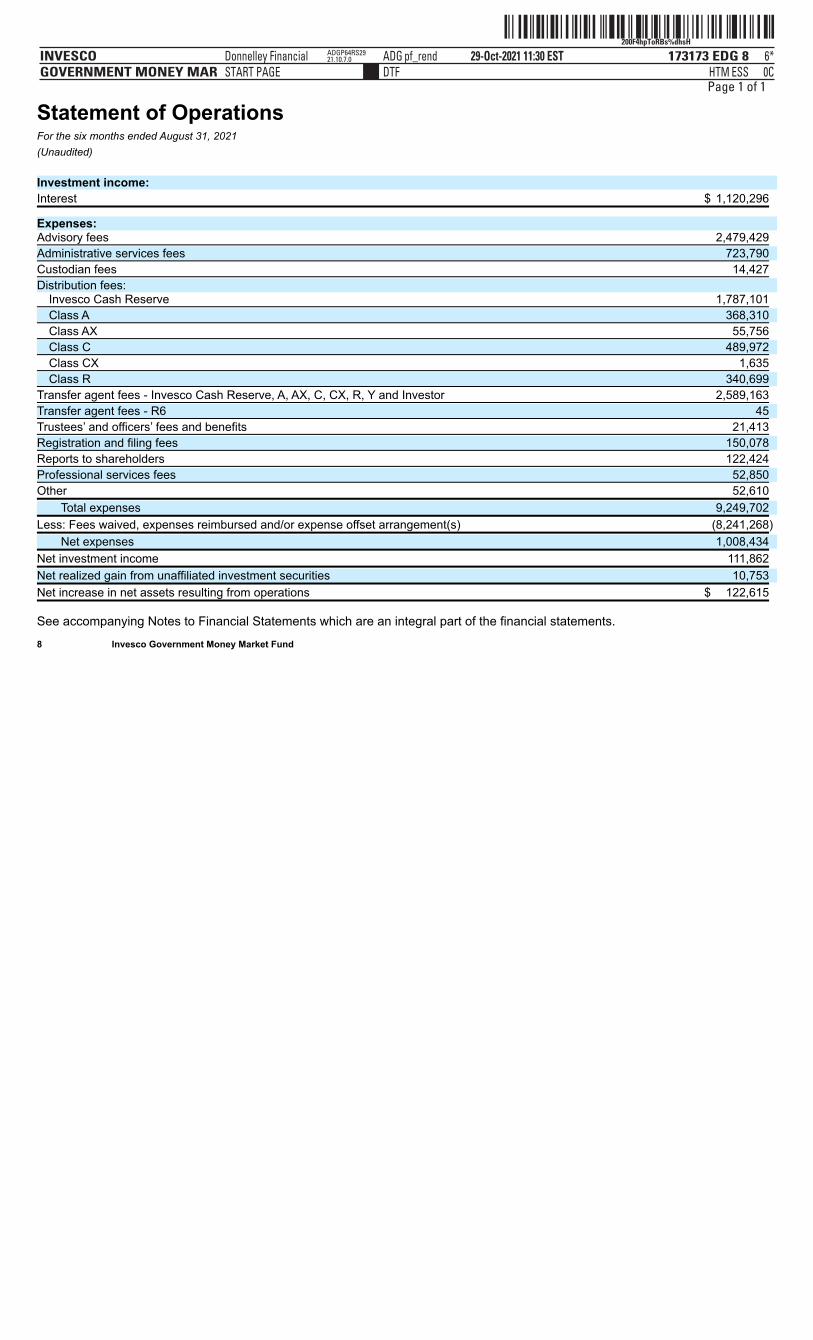
ˆ200F4hpToRBs%dhsHŠ200F4hpToRBs%dhsH
173173 EDG 8INVESCOGOVERNMENT MONEY MAR
29-Oct-2021 11:30 ESTHTMDTF
Donnelley Financial ADG pf_rendSTART PAGE
6*ESS 0C
ADGP64RS2921.10.7.0
Page 1 of 1
Statement of OperationsFor the six months ended August 31, 2021(Unaudited) Investment income: Interest $ 1,120,296
Expenses: Advisory fees 2,479,429
Administrative services fees 723,790
Custodian fees 14,427
Distribution fees: Invesco Cash Reserve 1,787,101
Class A 368,310
Class AX 55,756
Class C 489,972
Class CX 1,635
Class R 340,699
Transfer agent fees - Invesco Cash Reserve, A, AX, C, CX, R, Y and Investor 2,589,163
Transfer agent fees - R6 45
Trustees’ and officers’ fees and benefits 21,413
Registration and filing fees 150,078
Reports to shareholders 122,424
Professional services fees 52,850
Other 52,610
Total expenses 9,249,702
Less: Fees waived, expenses reimbursed and/or expense offset arrangement(s) (8,241,268)
Net expenses 1,008,434
Net investment income 111,862
Net realized gain from unaffiliated investment securities 10,753
Net increase in net assets resulting from operations $ 122,615
See accompanying Notes to Financial Statements which are an integral part of the financial statements. 8 Invesco Government Money Market Fund
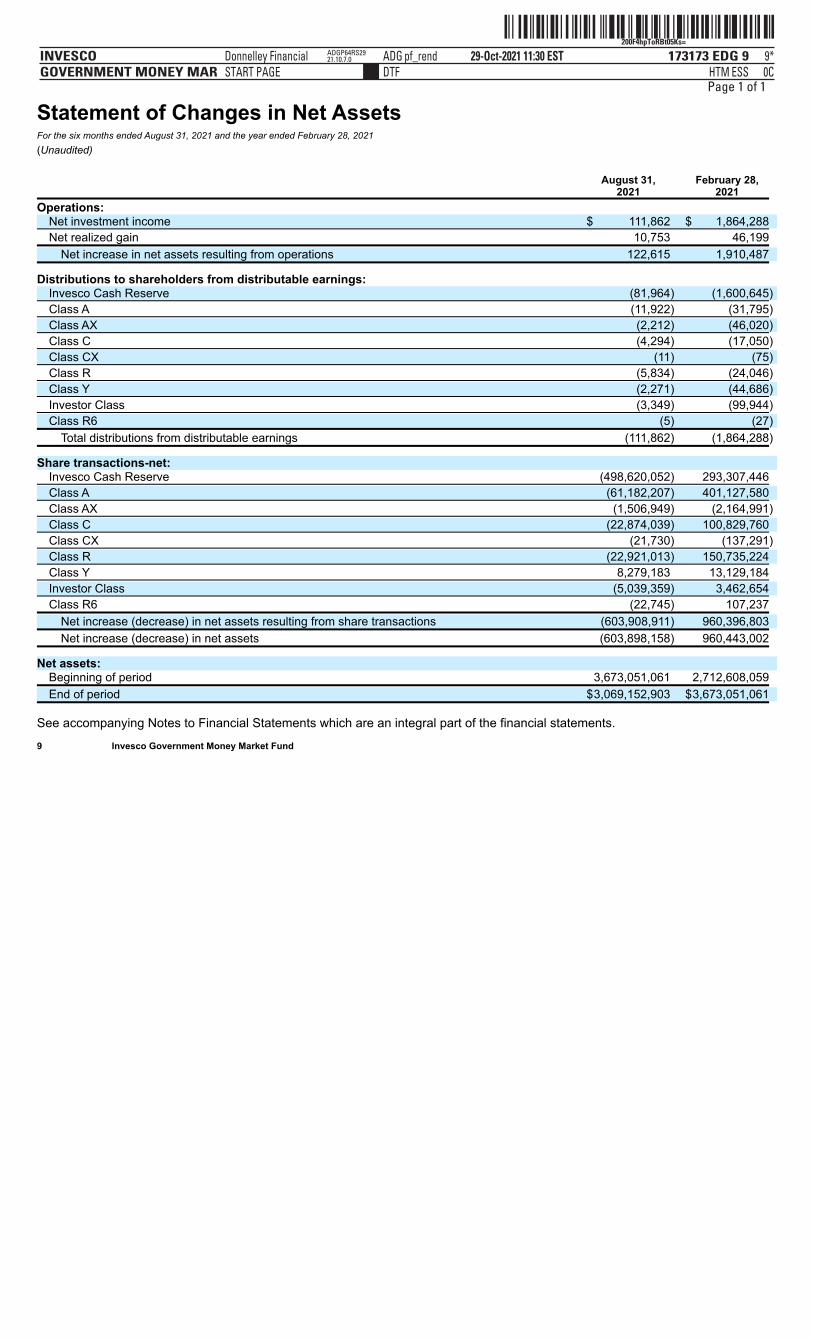
ˆ200F4hpToRBt05Ks=Š200F4hpToRBt05Ks=
173173 EDG 9INVESCOGOVERNMENT MONEY MAR
29-Oct-2021 11:30 ESTHTMDTF
Donnelley Financial ADG pf_rendSTART PAGE
9*ESS 0C
ADGP64RS2921.10.7.0
Page 1 of 1
Statement of Changes in Net AssetsFor the six months ended August 31, 2021 and the year ended February 28, 2021(Unaudited) August 31, February 28, 2021 2021
Operations: Net investment income $ 111,862 $ 1,864,288
Net realized gain 10,753 46,199
Net increase in net assets resulting from operations 122,615 1,910,487
Distributions to shareholders from distributable earnings: Invesco Cash Reserve (81,964) (1,600,645)
Class A (11,922) (31,795)
Class AX (2,212) (46,020)
Class C (4,294) (17,050)
Class CX (11) (75)
Class R (5,834) (24,046)
Class Y (2,271) (44,686)
Investor Class (3,349) (99,944)
Class R6 (5) (27)
Total distributions from distributable earnings (111,862) (1,864,288)
Share transactions-net: Invesco Cash Reserve (498,620,052) 293,307,446
Class A (61,182,207) 401,127,580
Class AX (1,506,949) (2,164,991)
Class C (22,874,039) 100,829,760
Class CX (21,730) (137,291)
Class R (22,921,013) 150,735,224
Class Y 8,279,183 13,129,184
Investor Class (5,039,359) 3,462,654
Class R6 (22,745) 107,237
Net increase (decrease) in net assets resulting from share transactions (603,908,911) 960,396,803
Net increase (decrease) in net assets (603,898,158) 960,443,002
Net assets: Beginning of period 3,673,051,061 2,712,608,059
End of period $3,069,152,903 $3,673,051,061
See accompanying Notes to Financial Statements which are an integral part of the financial statements. 9 Invesco Government Money Market Fund
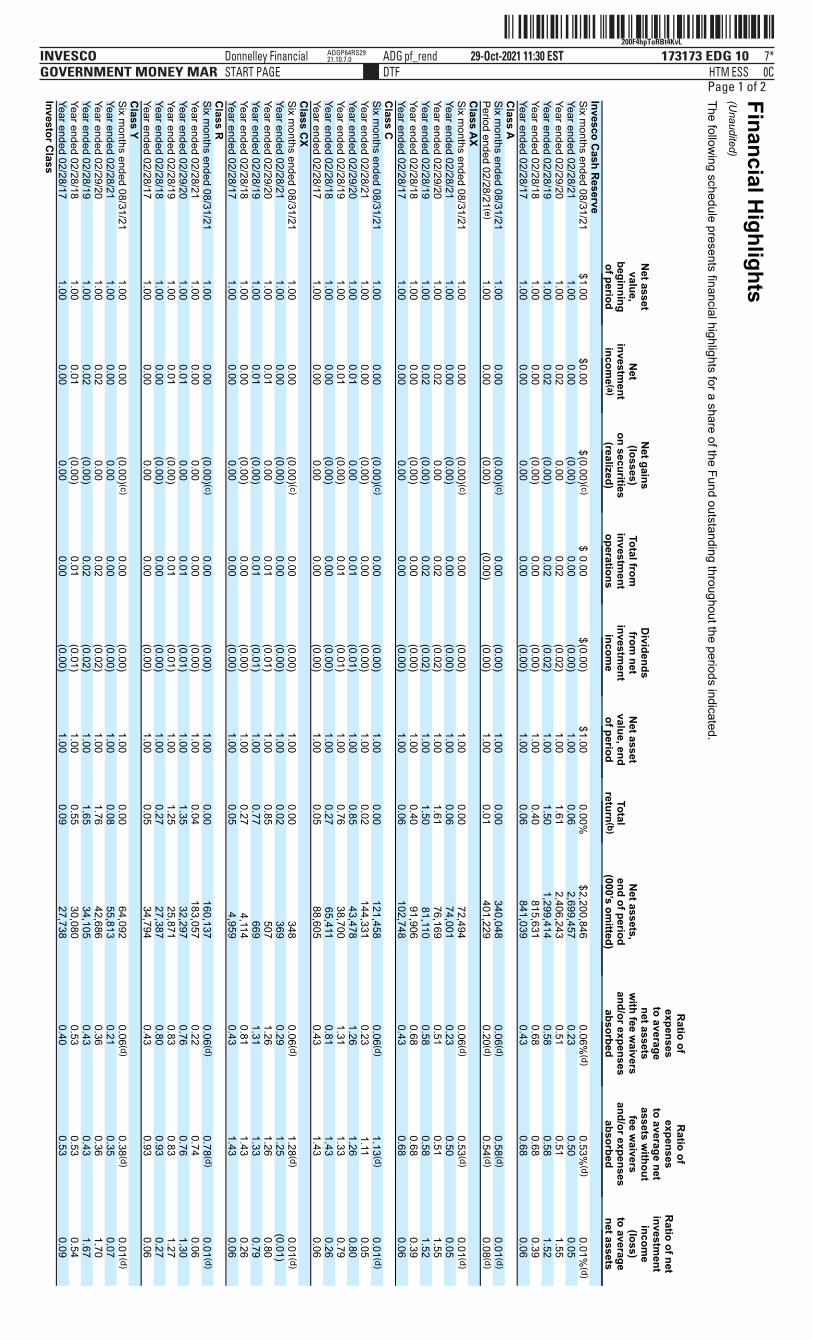
ˆ200F4hpToRBt4KvLÉŠ200F4hpToRBt4KvL
173173 EDG 10INVESCOGOVERNMENT MONEY MAR
29-Oct-2021 11:30 ESTHTMDTF
Donnelley Financial ADG pf_rendSTART PAGE
7*ESS 0C
ADGP64RS2921.10.7.0
Page 1 of 2Financial Highlights
(Unaudited)
The following schedule presents financial highlights for a share of the Fund outstanding throughout the periods indicated.
Net assetvalue,
beginningof period
Net
investment
income (a)
Net gains
(losses)on securities
(realized)
Total frominvestm
entoperations
Dividends
from net
investment
income
Net asset
value, endof period
Total
return(b)
Net assets,
end of period(000’s om
itted)
Ratio of
expensesto averagenet assets
with fee w
aiversand/or expenses
absorbed
Ratio of
expensesto average netassets w
ithoutfee w
aiversand/or expenses
absorbed
Ratio of net
investment
income
(loss)to averagenet assets
Invesco Cash R
eserve
Six months ended 08/31/21
$1.00
$0.00
$(0.00) (c)
$
0.00
$(0.00)
$1.00
0.00%
$2,200,846
0.06%(d)
0.53%
(d)
0.01%(d)
Year ended 02/28/21
1.00
0.00
(0.00)
0.00
(0.00)
1.00
0.06
2,699,457
0.23
0.50
0.05
Year ended 02/29/20
1.00
0.02
0.00
0.02
(0.02)
1.00
1.61
2,406,243
0.51
0.51
1.55Year ended 02/28/19
1.00
0.02
(0.00)
0.02
(0.02)
1.00
1.50
1,299,414
0.58
0.58
1.52Year ended 02/28/18
1.00
0.00
(0.00)
0.00
(0.00)
1.00
0.40
815,631
0.68
0.68
0.39
Year ended 02/28/17
1.00
0.00
0.00
0.00
(0.00)
1.00
0.06
841,039
0.43
0.68
0.06
Class A
Six m
onths ended 08/31/21
1.00
0.00
(0.00) (c)
0.00
(0.00)
1.00
0.00
340,048
0.06 (d)
0.58 (d)
0.01 (d) Period ended 02/28/21 (e)
1.00
0.00
(0.00)
(0.00)
(0.00)
1.00
0.01
401,229
0.20 (d)
0.54 (d)
0.08 (d) C
lass AX
Six m
onths ended 08/31/21
1.00
0.00
(0.00) (c)
0.00
(0.00)
1.00
0.00
72,494
0.06 (d)
0.53 (d)
0.01 (d) Year ended 02/28/21
1.00
0.00
(0.00)
0.00
(0.00)
1.00
0.06
74,001
0.23
0.50
0.05
Year ended 02/29/20
1.00
0.02
0.00
0.02
(0.02)
1.00
1.61
76,169
0.51
0.51
1.55
Year ended 02/28/19
1.00
0.02
(0.00)
0.02
(0.02)
1.00
1.50
81,110
0.58
0.58
1.52Year ended 02/28/18
1.00
0.00
(0.00)
0.00
(0.00)
1.00
0.40
91,906
0.68
0.68
0.39
Year ended 02/28/17
1.00
0.00
0.00
0.00
(0.00)
1.00
0.06
102,748
0.43
0.68
0.06
Class C
Six m
onths ended 08/31/21
1.00
0.00
(0.00) (c)
0.00
(0.00)
1.00
0.00
121,458
0.06 (d)
1.13 (d)
0.01 (d) Year ended 02/28/21
1.00
0.00
(0.00)
0.00
(0.00)
1.00
0.02
144,331
0.23
1.11
0.05
Year ended 02/29/20
1.00
0.01
0.00
0.01
(0.01)
1.00
0.85
43,478
1.26
1.26
0.80
Year ended 02/28/19
1.00
0.01
(0.00)
0.01
(0.01)
1.00
0.76
38,700
1.31
1.33
0.79Year ended 02/28/18
1.00
0.00
(0.00)
0.00
(0.00)
1.00
0.27
65,411
0.81
1.43
0.26
Year ended 02/28/17
1.00
0.00
0.00
0.00
(0.00)
1.00
0.05
88,605
0.43
1.43
0.06
Class C
X
Six months ended 08/31/21
1.00
0.00
(0.00) (c)
0.00
(0.00)
1.00
0.00
348
0.06 (d)
1.28 (d)
0.01 (d)
Year ended 02/28/21
1.00
0.00
(0.00)
0.00
(0.00)
1.00
0.02
369
0.29
1.25
(0.01)Year ended 02/29/20
1.00
0.01
0.00
0.01
(0.01)
1.00
0.85
507
1.26
1.26
0.80Year ended 02/28/19
1.00
0.01
(0.00)
0.01
(0.01)
1.00
0.77
669
1.31
1.33
0.79
Year ended 02/28/18
1.00
0.00
(0.00)
0.00
(0.00)
1.00
0.27
4,114
0.81
1.43
0.26Year ended 02/28/17
1.00
0.00
0.00
0.00
(0.00)
1.00
0.05
4,959
0.43
1.43
0.06C
lass R
Six months ended 08/31/21
1.00
0.00
(0.00) (c)
0.00
(0.00)
1.00
0.00
160,137
0.06 (d)
0.78 (d)
0.01 (d)
Year ended 02/28/21
1.00
0.00
0.00
0.00
(0.00)
1.00
0.04
183,057
0.22
0.74
0.06
Year ended 02/29/20
1.00
0.01
0.00
0.01
(0.01)
1.00
1.35
32,297
0.76
0.76
1.30
Year ended 02/28/19
1.00
0.01
(0.00)
0.01
(0.01)
1.00
1.25
25,871
0.83
0.83
1.27Year ended 02/28/18
1.00
0.00
(0.00)
0.00
(0.00)
1.00
0.27
27,387
0.80
0.93
0.27
Year ended 02/28/17
1.00
0.00
0.00
0.00
(0.00)
1.00
0.05
34,794
0.43
0.93
0.06
Class Y
Six m
onths ended 08/31/21
1.00
0.00
(0.00) (c)
0.00
(0.00)
1.00
0.00
64,092
0.06 (d)
0.38 (d)
0.01 (d) Year ended 02/28/21
1.00
0.00
0.00
0.00
(0.00)
1.00
0.08
55,813
0.21
0.35
0.07Year ended 02/29/20
1.00
0.02
0.00
0.02
(0.02)
1.00
1.76
42,686
0.36
0.36
1.70Year ended 02/28/19
1.00
0.02
(0.00)
0.02
(0.02)
1.00
1.65
34,105
0.43
0.43
1.67
Year ended 02/28/18
1.00
0.01
(0.00)
0.01
(0.01)
1.00
0.55
30,080
0.53
0.53
0.54Year ended 02/28/17
1.00
0.00
0.00
0.00
(0.00)
1.00
0.09
27,738
0.40
0.53
0.09Investor C
lass
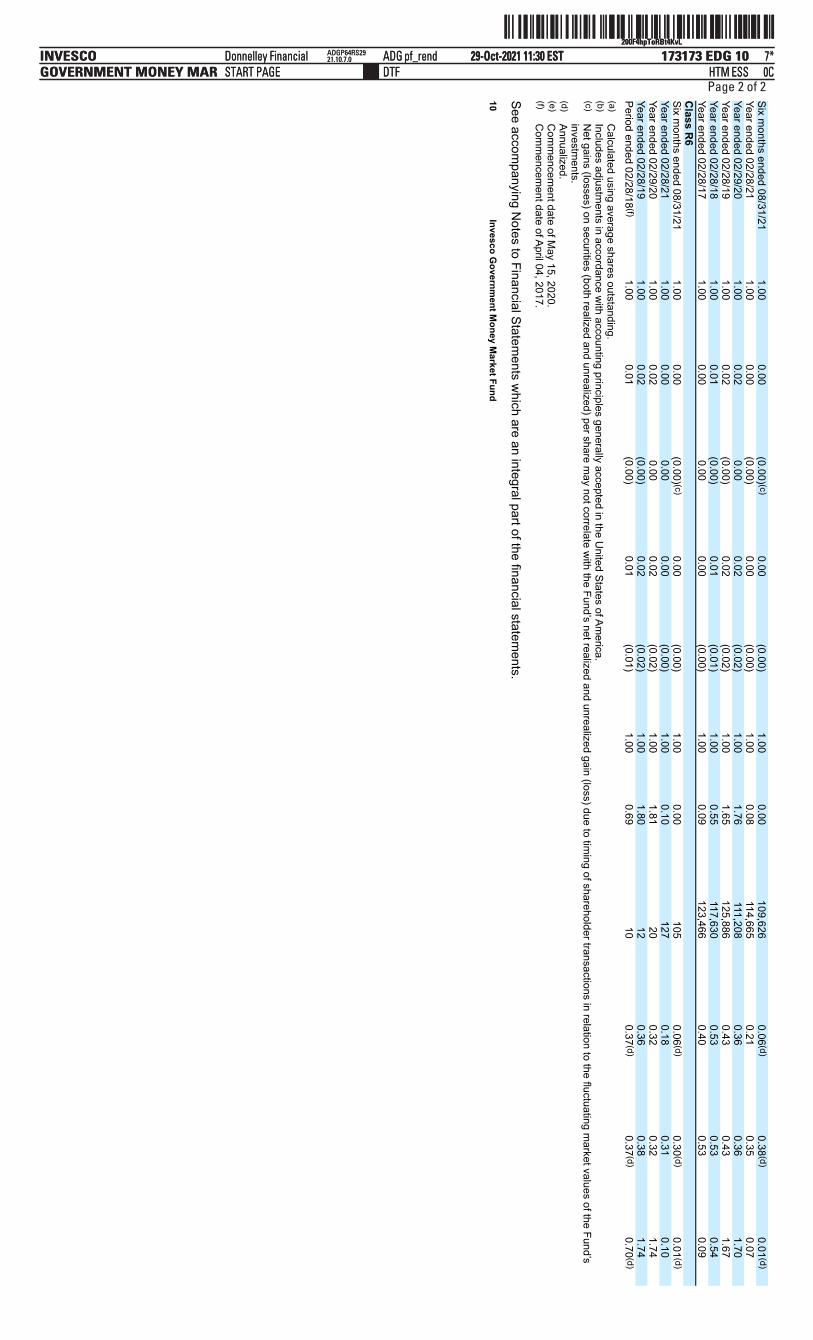
ˆ200F4hpToRBt4KvLÉŠ200F4hpToRBt4KvL
173173 EDG 10INVESCOGOVERNMENT MONEY MAR
29-Oct-2021 11:30 ESTHTMDTF
Donnelley Financial ADG pf_rendSTART PAGE
7*ESS 0C
ADGP64RS2921.10.7.0
ˆ200F4hpToRBt4KvLÉŠ200F4hpToRBt4KvL
173173 EDG 10INVESCOGOVERNMENT MONEY MAR
29-Oct-2021 11:30 ESTHTMDTF
Donnelley Financial ADG pf_rendSTART PAGE
7*ESS 0C
ADGP64RS2921.10.7.0
Page 2 of 2
Six months ended 08/31/21
1.00
0.00
(0.00) (c)
0.00
(0.00)
1.00
0.00
109,626
0.06 (d)
0.38 (d)
0.01 (d)
Year ended 02/28/21
1.00
0.00
(0.00)
0.00
(0.00)
1.00
0.08
114,665
0.21
0.35
0.07Year ended 02/29/20
1.00
0.02
0.00
0.02
(0.02)
1.00
1.76
111,208
0.36
0.36
1.70Year ended 02/28/19
1.00
0.02
(0.00)
0.02
(0.02)
1.00
1.65
125,886
0.43
0.43
1.67
Year ended 02/28/18
1.00
0.01
(0.00)
0.01
(0.01)
1.00
0.55
117,630
0.53
0.53
0.54Year ended 02/28/17
1.00
0.00
0.00
0.00
(0.00)
1.00
0.09
123,466
0.40
0.53
0.09C
lass R6
Six m
onths ended 08/31/21
1.00
0.00
(0.00) (c)
0.00
(0.00)
1.00
0.00
105
0.06 (d)
0.30 (d)
0.01 (d) Year ended 02/28/21
1.00
0.00
0.00
0.00
(0.00)
1.00
0.10
127
0.18
0.31
0.10Year ended 02/29/20
1.00
0.02
0.00
0.02
(0.02)
1.00
1.81
20
0.32
0.32
1.74Year ended 02/28/19
1.00
0.02
(0.00)
0.02
(0.02)
1.00
1.80
12
0.36
0.38
1.74
Period ended 02/28/18 (f)
1.00
0.01
(0.00)
0.01
(0.01)
1.00
0.69
10
0.37 (d)
0.37 (d)
0.70 (d) (a)
Calculated using average shares outstanding.
(b) Includes adjustm
ents in accordance with accounting principles generally accepted in the U
nited States of America.
(c) N
et gains (losses) on securities (both realized and unrealized) per share may not correlate w
ith the Fund’s net realized and unrealized gain (loss) due to timing of shareholder transactions in relation to the fluctuating m
arket values of the Fund’sinvestm
ents.(d)
Annualized.(e)
Com
mencem
ent date of May 15, 2020.
(f)C
omm
encement date of April 04, 2017.
See accompanying N
otes to Financial Statements w
hich are an integral part of the financial statements.
10
Invesco Governm
ent Money M
arket Fund
ˆ200F4hpToRBt6CzsqŠ200F4hpToRBt6Czsq
173173 EDG 11INVESCOGOVERNMENT MONEY MAR
29-Oct-2021 11:30 ESTHTMDTF
Donnelley Financial ADG pf_rendSTART PAGE
6*ESS 0C
ADGP64RS2921.10.7.0
Page 1 of 1
Notes to Financial StatementsAugust 31, 2021(Unaudited)
NOTE 1–Significant Accounting Policies
Invesco Government Money Market Fund (the “Fund”), is a series portfolio of AIM Investment Securities Funds (Invesco InvestmentSecurities Funds) (the “Trust”). The Trust is a Delaware statutory trust registered under the Investment Company Act of 1940, as amended(the “1940 Act”), as an open-end series management investment company authorized to issue an unlimited number of shares of beneficialinterest. Information presented in these financial statements pertains only to the Fund. Matters affecting the Fund or each class will bevoted on exclusively by the shareholders of the Fund or each class.
The Fund’s investment objective is to provide current income consistent with preservation of capital and liquidity.The Fund currently consists of nine different classes of shares: Invesco Cash Reserve, Class A , Class AX, Class C, Class CX, Class R,
Class Y, Investor Class and Class R6. Class A, Class AX and Class CX shares are closed to new investors. Class Y and InvestorClass shares are available only to certain investors. Class C and Class CX shares are sold with a contingent deferred sales charges(“CDSC”). Invesco Cash Reserve, Class A, Class AX, Class R, Class Y, Investor Class and Class R6 shares are sold at net asset value.Class C shares held for eight years after purchase are eligible for automatic conversion into Invesco Cash Reserve shares of the sameFund (the “Conversion Feature”). The automatic conversion pursuant to the Conversion Feature will generally occur at the end of the monthfollowing the eighth anniversary after a purchase of Class C shares.
The Fund is an investment company and accordingly follows the investment company accounting and reporting guidance in accordancewith Financial Accounting Standards Board Accounting Standards Codification Topic 946, Financial Services – Investment Companies.
The Fund is a “government money market fund” as defined in Rule 2a-7 under the 1940 Act and seeks to maintain a stable or constantNAV of $1.00 per share using an amortized cost method of valuation. “Government money market funds” are required to invest at least99.5% of their total assets in cash, Government Securities (as defined in the 1940 Act), and/ or repurchase agreements collateralized fullyby cash or Government Securities. The Board of Trustees has elected not to subject the Fund to the liquidity fee and redemption gaterequirement at this time, as permitted by Rule 2a-7.
The following is a summary of the significant accounting policies followed by the Fund in the preparation of its financial statements.A. Security Valuations - The Fund’s securities are recorded on the basis of amortized cost which approximates value as permitted by
Rule 2a-7 under the 1940 Act. This method values a security at its cost on the date of purchase and, thereafter, assumes a constantamortization to maturity of any premiums or accretion of any discounts.
Because of the inherent uncertainties of valuation, the values reflected in the financial statements may materially differ from thevalue received upon actual sale of those investments.
The Fund may invest in securities that are subject to interest rate risk, meaning the risk that the prices will generally fall as interestrates rise and, conversely, the prices will generally rise as interest rates fall. Specific securities differ in their sensitivity to changes ininterest rates depending on their individual characteristics. Changes in interest rates may result in increased market volatility, whichmay affect the value and/or liquidity of certain Fund investments.
B. Securities Transactions and Investment Income - Securities transactions are accounted for on a trade date basis. Realized gains orlosses on sales are computed on the basis of specific identification of the securities sold. Interest income (net of withholding tax, if any)is recorded on the accrual basis from settlement date and includes coupon interest and amortization of premium and accretion ofdiscount on debt securities as applicable.
The Fund may periodically participate in litigation related to Fund investments. As such, the Fund may receive proceeds fromlitigation settlements. Any proceeds received are included in the Statement of Operations as realized gain (loss) for investments nolonger held and as unrealized gain (loss) for investments still held.
Brokerage commissions and mark ups are considered transaction costs and are recorded as an increase to the cost basis ofsecurities purchased and/or a reduction of proceeds on a sale of securities. Such transaction costs are included in the determination ofnet realized gain (loss) from investment securities reported in the Statement of Operations and the Statement of Changes in Net Assetsand the net realized gains (losses) on securities per share in the Financial Highlights. Transaction costs are included in the calculationof the Fund’s net asset value and, accordingly, they reduce the Fund’s total returns. These transaction costs are not consideredoperating expenses and are not reflected in net investment income reported in the Statement of Operations and the Statement ofChanges in Net Assets, or the net investment income per share and the ratios of expenses and net investment income reported in theFinancial Highlights, nor are they limited by any expense limitation arrangements between the Fund and the investment adviser.
The Fund allocates realized capital gains and losses to a class based on the relative net assets of each class. The Fund allocatesincome to a class based on the relative value of the settled shares of each class.
C. Country Determination - For the purposes of making investment selection decisions and presentation in the Schedule of Investments,the investment adviser may determine the country in which an issuer is located and/or credit risk exposure based on various factors.These factors include the laws of the country under which the issuer is organized, where the issuer maintains a principal office, thecountry in which the issuer derives 50% or more of its total revenues and the country that has the primary market for the issuer’ssecurities, as well as other criteria. Among the other criteria that may be evaluated for making this determination are the country inwhich the issuer maintains 50% or more of its assets, the type of security, financial guarantees and enhancements, the nature of thecollateral and the sponsor organization. Country of issuer and/or credit risk exposure has been determined to be the United States ofAmerica, unless otherwise noted.
D. Distributions - Distributions from net investment income, if any, are declared daily and paid monthly. Distributions from net realizedcapital gain, if any, are generally declared and paid annually and recorded on the ex-dividend date.
E. Federal Income Taxes - The Fund intends to comply with the requirements of Subchapter M of the Internal Revenue Code of 1986, asamended (the “Internal Revenue Code”), necessary to qualify as a regulated investment company and to distribute substantially all ofthe Fund’s taxable earnings to shareholders. As such, the Fund will not be subject to federal income taxes on otherwise taxable income(including net realized capital gain) that is distributed to shareholders. Therefore, no provision for federal income taxes is recorded inthe financial statements.
The Fund recognizes the tax benefits of uncertain tax positions only when the position is more likely than not to be sustained.Management has analyzed the Fund’s uncertain tax positions and concluded that no liability for unrecognized tax benefits should berecorded related to uncertain tax positions. Management is not aware of any tax positions for which it is reasonably possible that thetotal amounts of unrecognized tax benefits will change materially in the next 12 months.
The Fund files tax returns in the U.S. Federal jurisdiction and certain other jurisdictions. Generally, the Fund is subject toexaminations by such taxing authorities for up to three years after the filing of the return for the tax period.
F. Expenses - Fees provided for under the Rule 12b-1 plan of a particular class of the Fund are charged to the operations of such class.Transfer agency fees and expenses and other shareholder recordkeeping fees and expenses attributable to Class R6 are charged tosuch class. Transfer agency fees and expenses and other shareholder recordkeeping fees and expenses relating to all other classesare allocated among those classes based on relative net assets. All other expenses are allocated among the classes based on relativenet assets.
G. Accounting Estimates - The preparation of financial statements in conformity with accounting principles generally accepted in theUnited States of America (“GAAP”) requires management to make estimates and assumptions that affect the reported amounts ofassets and liabilities at the date of the financial statements and the reported amounts of revenues and expenses during the reportingperiod including estimates and assumptions related to taxation. Actual
11 Invesco Government Money Market Fund
ˆ200F4hpToRBt7P9L0Š200F4hpToRBt7P9L0
173173 EDG 12INVESCOGOVERNMENT MONEY MAR
29-Oct-2021 11:30 ESTHTMDTF
Donnelley Financial ADG pf_rendNone
6*ESS 0C
ADGP64RS2921.10.7.0
Page 1 of 1
results could differ from those estimates by a significant amount. In addition, the Fund monitors for material events or transactions thatmay occur or become known after the period-end date and before the date the financial statements are released to print.
H. Indemnifications - Under the Trust’s organizational documents, each Trustee, officer, employee or other agent of the Trust isindemnified against certain liabilities that may arise out of the performance of their duties to the Fund. Additionally, in the normal courseof business, the Fund enters into contracts, including the Fund’s servicing agreements, that contain a variety of indemnification clauses.The Fund’s maximum exposure under these arrangements is unknown as this would involve future claims that may be made againstthe Fund that have not yet occurred. The risk of material loss as a result of such indemnification claims is considered remote.
I. Repurchase Agreements - The Fund may enter into repurchase agreements. Collateral on repurchase agreements, including theFund’s pro-rata interest in joint repurchase agreements, is taken into possession by the Fund upon entering into the repurchaseagreement. Collateral consisting of U.S. Government Securities and U.S. Government Sponsored Agency Securities is marked tomarket daily to ensure its market value is at least 102% of the sales price of the repurchase agreement. The investments in somerepurchase agreements, pursuant to procedures approved by the Board of Trustees, are through participation with other mutual funds,private accounts and certain non-registered investment companies managed by the investment adviser or its affiliates (“Jointrepurchase agreements”). The principal amount of the repurchase agreement is equal to the value at period-end. If the seller of arepurchase agreement fails to repurchase the security in accordance with the terms of the agreement, the Fund might incur expensesin enforcing its rights, and could experience losses, including a decline in the value of the collateral and loss of income.
J. Other Risks - Investments in obligations issued by agencies and instrumentalities of the U.S. Government may vary in the level ofsupport they receive from the government. The government may choose not to provide financial support to government sponsoredagencies or instrumentalities if it is not legally obligated to do so. In this case, if the issuer defaulted, the Fund may not be able torecover its investment in such issuer from the U.S. Government.
K. COVID-19 Risk - The COVID-19 strain of coronavirus has resulted in instances of market closures and dislocations, extreme volatility,liquidity constraints and increased trading costs. Efforts to contain its spread have resulted in travel restrictions, disruptions ofhealthcare systems, business operations and supply chains, layoffs, lower consumer demand, and defaults, among other significanteconomic impacts that have disrupted global economic activity across many industries. Such economic impacts may exacerbate otherpre-existing political, social and economic risks locally or globally.
The ongoing effects of COVID-19 are unpredictable and may result in significant and prolonged effects on the Fund’s performance.
NOTE 2–Advisory Fees and Other Fees Paid to Affiliates
The Trust has entered into a master investment advisory agreement with Invesco Advisers, Inc. (the “Adviser” or “Invesco”). Under theterms of the investment advisory agreement, the Fund accrues daily and pays monthly an advisory fee to the Adviser based on the annualrate of 0.15% of the Fund’s average daily net assets.
Under the terms of a master sub-advisory agreement between the Adviser and each of Invesco Asset Management Deutschland GmbH,Invesco Asset Management Limited, Invesco Asset Management (Japan) Limited, Invesco Hong Kong Limited, Invesco Senior SecuredManagement, Inc. and Invesco Canada Ltd. (collectively, the “Affiliated Sub-Advisers”) the Adviser, not the Fund, will pay 40% of the feespaid to the Adviser to any such Affiliated Sub-Adviser(s) that provide(s) discretionary investment management services to the Fund basedon the percentage of assets allocated to such Affiliated Sub-Adviser(s).
Effective July 1, 2021, the Adviser has contractually agreed, through at least, June 30, 2022, to waive advisory fees and/or reimburseexpenses to the extent necessary to limit total annual operating expenses after fee waivers and/or expense reimbursements (excludingcertain items discussed below) of Invesco Cash Reserve, Class A, Class AX, Class C, Class CX, Class R, Class Y, Investor Class andClass R6 shares to 1.40%, 1.45%, 1.40%, 2.00%, 2.15%, 1.65%, 1.25%, 1.25% and 1.25%, respectively, of the Fund’s average daily netassets (the “expense limits”). Prior to July 1, 2021, the Adviser had contractually agreed to waive advisory fees and/or reimburse expensesto the extent necessary to limit total annual operating expenses after fee waivers and/or expense reimbursements of Invesco CashReserve, Class A, Class AX, Class C, Class CX, Class R, Class Y, Investor Class and Class R6 shares to 1.40%, 1.25%, 1.40%, 1.25%,2.15%, 1.25%, 1.25%, 1.25% and 1.25%, respectively, of the Fund’s average daily net assets. In determining the Adviser’s obligation towaive advisory fees and/or reimburse expenses, the following expenses are not taken into account, and could cause the total annualoperating expenses after fee waivers and/or expense reimbursements to exceed the numbers reflected above: (1) interest; (2) taxes;(3) dividend expense on short sales; (4) extraordinary or non-routine items, including litigation expenses; and (5) expenses that the Fundhas incurred but did not actually pay because of an expense offset arrangement. Unless Invesco continues the fee waiver agreement, it willterminate on June 30, 2022. During its term, the fee waiver agreement cannot be terminated or amended to increase the expense limits orreduce the advisory fee waiver without approval of the Board of Trustees. The Adviser did not waive fees and/or reimburse expenses duringthe period under these expense limits.
Further, Invesco and/or Invesco Distributors, Inc. (“IDI”) voluntarily waived fees and/or reimbursed expenses in order to increase theFund’s yield. Voluntary fee waivers and/or reimbursements may be modified or discontinued at any time upon consultation with the Board ofTrustees without further notice to investors.
For the six months ended August 31, 2021, Invesco voluntarily waived advisory fees of $2,479,429, reimbursed Fund level expenses of$129,155 and reimbursed class level expenses of $3,866,335, $405,999, $113,979, $259,092, $1,920, $ 243,769, $51,795, $88,370 and$45 for Invesco Cash Reserve, Class A, Class AX, Class C, Class CX, Class R, Class Y, Investor Class and Class R6 shares, respectively,in order to increase the yield.
The Trust has entered into a master administrative services agreement with Invesco pursuant to which the Fund has agreed to payInvesco for certain administrative costs incurred in providing accounting services to the Fund. For the six months ended August 31, 2021,expenses incurred under the agreement are shown in the Statement of Operations as Administrative services fees. Also, Invesco hasentered into a sub-administration agreement whereby The Bank of New York Mellon (“BNY Mellon”) serves as custodian and fundaccountant and provides certain administrative services to the Fund.
The Trust has entered into a transfer agency and service agreement with Invesco Investment Services, Inc. (“IIS”) pursuant to which theFund has agreed to pay IIS a fee for providing transfer agency and shareholder services to the Fund and reimburse IIS for certain expensesincurred by IIS in the course of providing such services. IIS may make payments to intermediaries that provide omnibus account services,sub-accounting services and/or networking services. All fees payable by IIS to intermediaries that provide omnibus account services orsub-accounting services are charged back to the Fund, subject to certain limitations approved by the Trust’s Board of Trustees. For the sixmonths ended August 31, 2021, expenses incurred under the agreement are shown in the Statement of Operations as Transfer agent fees.
The Trust has entered into master distribution agreements with IDI to serve as the distributor for the Invesco Cash Reserve, Class A,Class AX, Class C, Class CX, Class R, Class Y, Investor Class and Class R6 shares of the Fund. The Trust has adopted plans pursuant toRule 12b-1 under the 1940 Act with respect to the Fund’s Invesco Cash Reserve, Class A, Class AX, Class C, Class CX and Class Rshares (collectively, the “Plans”). The Fund, pursuant to the Plans, pays IDI compensation at the annual rate of 0.15% of the Fund’saverage daily net assets of Invesco Cash Reserve shares, 0.75% of the Fund’s average daily net assets of Class C shares and 0.40% ofthe Fund’s average daily net assets of Class R shares. The Fund, pursuant to the Plans, reimburses IDI for its allocated share of expensesincurred for the period, up to a maximum annual rate of 0.20% of the Fund’s average daily net assets of Class A shares, up to a maximumannual rate of 0.15% of the Fund’s average daily net assets of Class AX shares and up to a maximum annual rate of 0.90% of the averagedaily net assets of Class CX shares. The fees are accrued daily and paid monthly. Of the Plan payments, up to 0.25% of the average dailynet assets of each class of shares may be paid to furnish continuing personal shareholder services to customers who purchase and ownshares of such classes. Any amounts not paid as a service fee under the Plans would constitute an asset-based sales charge. Rules of theFinancial Industry Regulatory Authority (“FINRA”) impose a cap on the total sales charges, including asset-based sales charges, that maybe paid by any class of shares of the Fund. Effective May 15, 2020, IDI contractually agreed, through at least June 30, 2021, to limit 12b-1fees to 0.00% of average daily net assets for Class A, Class C and Class R shares. Expenses before fee waivers under this agreement areshown as Distribution fees in the Statement of Operations For the the six 12 Invesco Government Money Market Fund
ˆ200F4hpToRBtB02s8Š200F4hpToRBtB02s8
173173 EDG 13INVESCOGOVERNMENT MONEY MAR
29-Oct-2021 11:30 ESTHTMDTF
Donnelley Financial ADG pf_rendNone
6*ESS 0C
ADGP64RS2921.10.7.0
Page 1 of 1months ended August 31, 2021, expenses incurred after combined contractual waivers and voluntary yield waivers and reimbursementswere $0, $0, $0, $0, $0 and $0 for Invesco Cash Reserve, Class A, Class AX, Class C, Class CX, and Class R shares, respectively.
CDSC are not recorded as expenses of the Fund. CDSC are deducted from redemption proceeds prior to remittance to the shareholder.During the six months ended August 31, 2021, IDI advised the Fund that IDI retained $886, $277, $7,683 and $0 from Invesco CashReserve, Class A, Class C and Class CX shares, respectively, for CDSC imposed on redemptions by shareholders.
Certain officers and trustees of the Trust are officers and directors of the Adviser, IIS and/or IDI.
NOTE 3–Additional Valuation Information
GAAP defines fair value as the price that would be received to sell an asset or paid to transfer a liability in an orderly transaction betweenmarket participants at the measurement date, under current market conditions. GAAP establishes a hierarchy that prioritizes the inputs tovaluation methods, giving the highest priority to readily available unadjusted quoted prices in an active market for identical assets (Level 1)and the lowest priority to significant unobservable inputs (Level 3), generally when market prices are not readily available or are unreliable.Based on the valuation inputs, the securities or other investments are tiered into one of three levels. Changes in valuation methods mayresult in transfers in or out of an investment’s assigned level: Level 1 - Prices are determined using quoted prices in an active market for identical assets. Level 2 -
Prices are determined using other significant observable inputs. Observable inputs are inputs that other market participantsmay use in pricing a security. These may include quoted prices for similar securities, interest rates, prepayment speeds, creditrisk, yield curves, loss severities, default rates, discount rates, volatilities and others.
Level 3 -
Prices are determined using significant unobservable inputs. In situations where quoted prices or observable inputs areunavailable (for example, when there is little or no market activity for an investment at the end of the period), unobservableinputs may be used. Unobservable inputs reflect the Fund’s own assumptions about the factors market participants would usein determining fair value of the securities or instruments and would be based on the best available information.
As of August 31, 2021, all of the securities in this Fund were valued based on Level 2 inputs (see the Schedule of Investments forsecurity categories). The level assigned to the securities valuations may not be an indication of the risk or liquidity associated with investingin those securities. Because of the inherent uncertainties of valuation, the values reflected in the financial statements may materially differfrom the value received upon actual sale of those investments.
NOTE 4–Expense Offset Arrangement(s)
The expense offset arrangement is comprised of transfer agency credits which result from balances in demand deposit accounts used bythe transfer agent for clearing shareholder transactions. For the six months ended August 31, 2021, the Fund received credits from thisarrangement, which resulted in the reduction of the Fund’s total expenses of $70.
NOTE 5–Trustees’ and Officers’ Fees and Benefits
Trustees’ and Officers’ Fees and Benefits include amounts accrued by the Fund to pay remuneration to certain Trustees and Officers of theFund. Trustees have the option to defer compensation payable by the Fund, and Trustees’ and Officers’ Fees and Benefits also includeamounts accrued by the Fund to fund such deferred compensation amounts. Those Trustees who defer compensation have the option toselect various Invesco Funds in which their deferral accounts shall be deemed to be invested. Finally, certain current Trustees were eligibleto participate in a retirement plan that provided for benefits to be paid upon retirement to Trustees over a period of time based on thenumber of years of service. The Fund may have certain former Trustees who also participate in a retirement plan and receive benefits undersuch plan. Trustees’ and Officers’ Fees and Benefits include amounts accrued by the Fund to fund such retirement benefits. Obligationsunder the deferred compensation and retirement plans represent unsecured claims against the general assets of the Fund.
NOTE 6–Cash Balances
The Fund is permitted to temporarily carry a negative or overdrawn balance in its account with BNY Mellon, the custodian bank. Suchbalances, if any at period-end, are shown in the Statement of Assets and Liabilities under the payable caption Amount due custodian. Tocompensate the custodian bank for such overdrafts, the overdrawn Fund may either (1) leave funds as a compensating balance in theaccount so the custodian bank can be compensated by earning the additional interest; or (2) compensate by paying the custodian bank at arate agreed upon by the custodian bank and Invesco, not to exceed the contractually agreed upon rate.
NOTE 7–Tax Information
The amount and character of income and gains to be distributed are determined in accordance with income tax regulations, which maydiffer from GAAP. Reclassifications are made to the Fund’s capital accounts to reflect income and gains available for distribution (oravailable capital loss carryforward) under income tax regulations. The tax character of distributions paid during the year and the taxcomponents of net assets will be reported at the Fund’s fiscal year-end.
Capital loss carryforward is calculated and reported as of a specific date. Results of transactions and other activity after that date mayaffect the amount of capital loss carryforward actually available for the Fund to utilize. The ability to utilize capital loss carryforwards in thefuture may be limited under the Internal Revenue Code and related regulations based on the results of future transactions.
The Fund did not have any capital loss carryforward as of February 28, 2021. 13 Invesco Government Money Market Fund
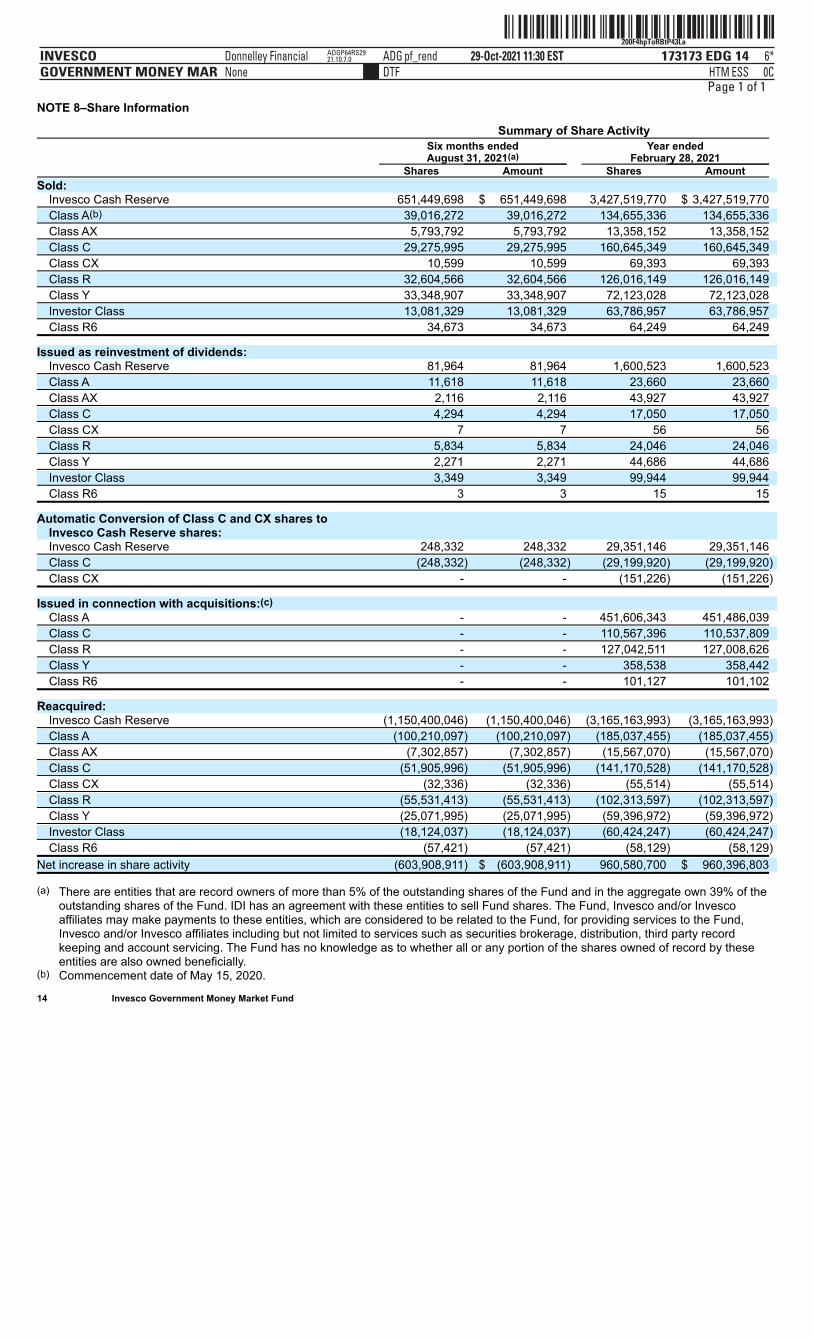
ˆ200F4hpToRBtP43LaŠ200F4hpToRBtP43La
173173 EDG 14INVESCOGOVERNMENT MONEY MAR
29-Oct-2021 11:30 ESTHTMDTF
Donnelley Financial ADG pf_rendNone
6*ESS 0C
ADGP64RS2921.10.7.0
Page 1 of 1NOTE 8–Share Information
Summary of Share Activity
Six months endedAugust 31, 2021(a)
Year endedFebruary 28, 2021
Shares Amount Shares Amount
Sold: Invesco Cash Reserve 651,449,698 $ 651,449,698 3,427,519,770 $ 3,427,519,770
Class A(b) 39,016,272 39,016,272 134,655,336 134,655,336
Class AX 5,793,792 5,793,792 13,358,152 13,358,152
Class C 29,275,995 29,275,995 160,645,349 160,645,349
Class CX 10,599 10,599 69,393 69,393
Class R 32,604,566 32,604,566 126,016,149 126,016,149
Class Y 33,348,907 33,348,907 72,123,028 72,123,028
Investor Class 13,081,329 13,081,329 63,786,957 63,786,957
Class R6 34,673 34,673 64,249 64,249
Issued as reinvestment of dividends: Invesco Cash Reserve 81,964 81,964 1,600,523 1,600,523
Class A 11,618 11,618 23,660 23,660
Class AX 2,116 2,116 43,927 43,927
Class C 4,294 4,294 17,050 17,050
Class CX 7 7 56 56
Class R 5,834 5,834 24,046 24,046
Class Y 2,271 2,271 44,686 44,686
Investor Class 3,349 3,349 99,944 99,944
Class R6 3 3 15 15
Automatic Conversion of Class C and CX shares toInvesco Cash Reserve shares: Invesco Cash Reserve 248,332 248,332 29,351,146 29,351,146
Class C (248,332) (248,332) (29,199,920) (29,199,920)
Class CX - - (151,226) (151,226)
Issued in connection with acquisitions:(c) Class A - - 451,606,343 451,486,039
Class C - - 110,567,396 110,537,809
Class R - - 127,042,511 127,008,626
Class Y - - 358,538 358,442
Class R6 - - 101,127 101,102
Reacquired: Invesco Cash Reserve (1,150,400,046) (1,150,400,046) (3,165,163,993) (3,165,163,993)
Class A (100,210,097) (100,210,097) (185,037,455) (185,037,455)
Class AX (7,302,857) (7,302,857) (15,567,070) (15,567,070)
Class C (51,905,996) (51,905,996) (141,170,528) (141,170,528)
Class CX (32,336) (32,336) (55,514) (55,514)
Class R (55,531,413) (55,531,413) (102,313,597) (102,313,597)
Class Y (25,071,995) (25,071,995) (59,396,972) (59,396,972)
Investor Class (18,124,037) (18,124,037) (60,424,247) (60,424,247)
Class R6 (57,421) (57,421) (58,129) (58,129)
Net increase in share activity (603,908,911) $ (603,908,911) 960,580,700 $ 960,396,803
(a) There are entities that are record owners of more than 5% of the outstanding shares of the Fund and in the aggregate own 39% of theoutstanding shares of the Fund. IDI has an agreement with these entities to sell Fund shares. The Fund, Invesco and/or Invescoaffiliates may make payments to these entities, which are considered to be related to the Fund, for providing services to the Fund,Invesco and/or Invesco affiliates including but not limited to services such as securities brokerage, distribution, third party recordkeeping and account servicing. The Fund has no knowledge as to whether all or any portion of the shares owned of record by theseentities are also owned beneficially.
(b) Commencement date of May 15, 2020. 14 Invesco Government Money Market Fund

ˆ200F4hpToRBt=pjLIŠ200F4hpToRBt=pjLI
173173 EDG 15INVESCOGOVERNMENT MONEY MAR
29-Oct-2021 11:30 ESTHTMDTF
Donnelley Financial ADG pf_rendNone
6*ESS 0C
ADGP64RS2921.10.7.0
Page 1 of 1(c) After the close of business on May 15, 2020, the Fund acquired all the net assets of Invesco Oppenheimer Government Cash Reserves
Fund (the “Target Fund”) pursuant to a plan of reorganization approved by the Board of Trustees of the Fund on February 14, 2020. Thereorganization was executed in order to reduce overlap and increase efficiencies in the Adviser’s product line. The acquisition wasaccomplished by a tax-free exchange of 689,675,915 shares of the Fund for 689,675,915 shares outstanding of the Target Fund as ofthe close of business on May 15, 2020. Shares of the Target Fund were exchanged for the like class of shares of the Fund, based onthe relative net asset value of the Target Fund to the net asset value of the Fund on the close of business, May 15, 2020. The TargetFund’s net assets as of the close of business on May 15, 2020 of $689,492,018, including $0 of unrealized appreciation (depreciation),were combined with those of the Fund. The net assets of the Fund immediately before the acquisition were $3,297,363,876 and$3,986,855,894 immediately after the acquisition.
The pro forma results of operations for the year ended February 28, 2021 assuming the reorganization had been completed onMarch 1, 2020, the beginning of the annual reporting period are as follows:
Net investment income $2,070,178
Net realized gain from investment securities 55,136
Net increase in net assets resulting from operations $2,125,314
As the combined investment portfolios have been managed as a single integrated portfolio since the acquisition was completed, it isnot practicable to separate the amounts of revenue and earnings of the Target Fund that has been included in the Fund’s Statement ofOperations since May 16, 2020.
15 Invesco Government Money Market Fund
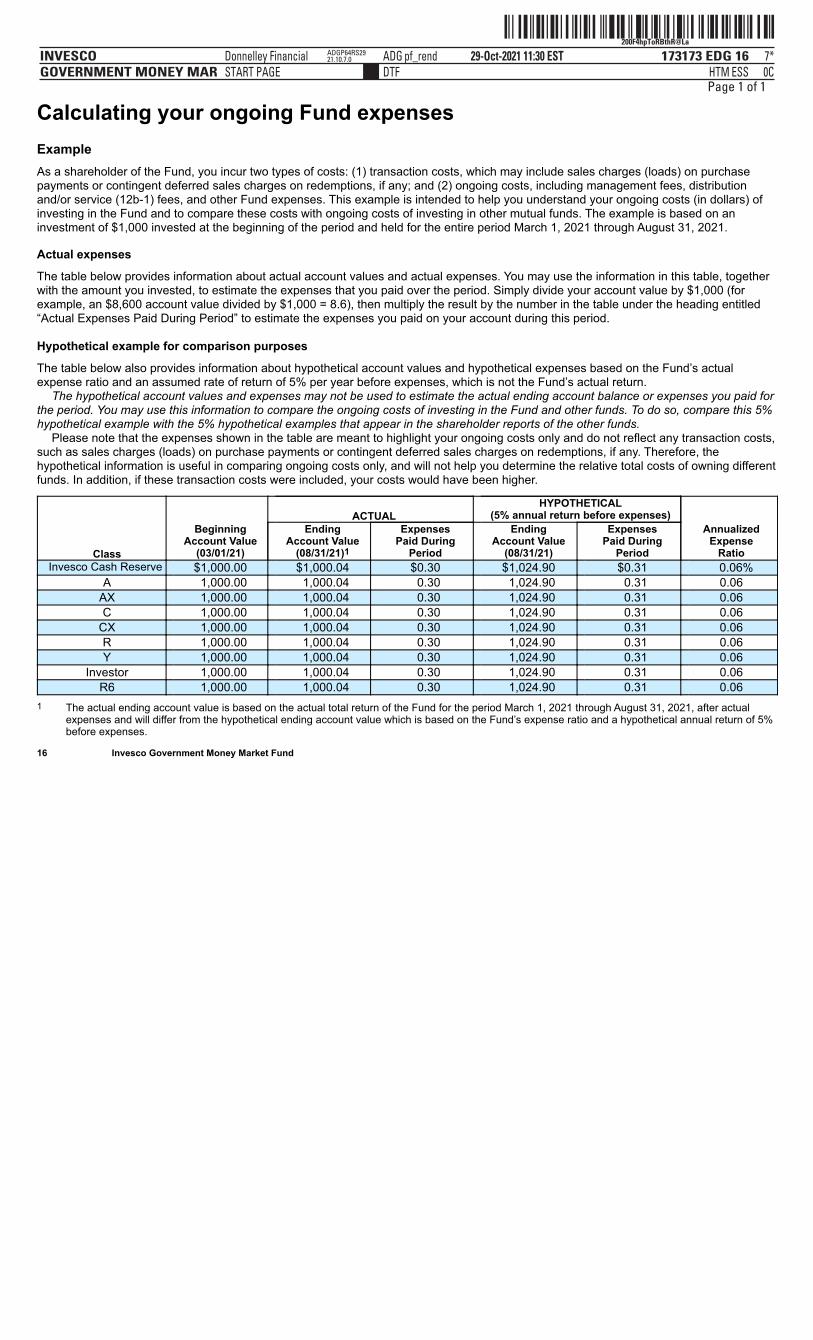
ˆ200F4hpToRBthR@LaŠ200F4hpToRBthR@La
173173 EDG 16INVESCOGOVERNMENT MONEY MAR
29-Oct-2021 11:30 ESTHTMDTF
Donnelley Financial ADG pf_rendSTART PAGE
7*ESS 0C
ADGP64RS2921.10.7.0
Page 1 of 1
Calculating your ongoing Fund expensesExampleAs a shareholder of the Fund, you incur two types of costs: (1) transaction costs, which may include sales charges (loads) on purchasepayments or contingent deferred sales charges on redemptions, if any; and (2) ongoing costs, including management fees, distributionand/or service (12b-1) fees, and other Fund expenses. This example is intended to help you understand your ongoing costs (in dollars) ofinvesting in the Fund and to compare these costs with ongoing costs of investing in other mutual funds. The example is based on aninvestment of $1,000 invested at the beginning of the period and held for the entire period March 1, 2021 through August 31, 2021.
Actual expenses
The table below provides information about actual account values and actual expenses. You may use the information in this table, togetherwith the amount you invested, to estimate the expenses that you paid over the period. Simply divide your account value by $1,000 (forexample, an $8,600 account value divided by $1,000 = 8.6), then multiply the result by the number in the table under the heading entitled“Actual Expenses Paid During Period” to estimate the expenses you paid on your account during this period.
Hypothetical example for comparison purposes
The table below also provides information about hypothetical account values and hypothetical expenses based on the Fund’s actualexpense ratio and an assumed rate of return of 5% per year before expenses, which is not the Fund’s actual return.
The hypothetical account values and expenses may not be used to estimate the actual ending account balance or expenses you paid forthe period. You may use this information to compare the ongoing costs of investing in the Fund and other funds. To do so, compare this 5%hypothetical example with the 5% hypothetical examples that appear in the shareholder reports of the other funds.
Please note that the expenses shown in the table are meant to highlight your ongoing costs only and do not reflect any transaction costs,such as sales charges (loads) on purchase payments or contingent deferred sales charges on redemptions, if any. Therefore, thehypothetical information is useful in comparing ongoing costs only, and will not help you determine the relative total costs of owning differentfunds. In addition, if these transaction costs were included, your costs would have been higher.
Class
BeginningAccount Value
(03/01/21)
ACTUAL HYPOTHETICAL
(5% annual return before expenses)
AnnualizedExpense
Ratio
EndingAccount Value
(08/31/21)1
ExpensesPaid During
Period
EndingAccount Value
(08/31/21)
ExpensesPaid During
PeriodInvesco Cash Reserve $1,000.00 $1,000.04 $0.30 $1,024.90 $0.31 0.06%
A 1,000.00 1,000.04 0.30 1,024.90 0.31 0.06AX 1,000.00 1,000.04 0.30 1,024.90 0.31 0.06C 1,000.00 1,000.04 0.30 1,024.90 0.31 0.06
CX 1,000.00 1,000.04 0.30 1,024.90 0.31 0.06R 1,000.00 1,000.04 0.30 1,024.90 0.31 0.06Y 1,000.00 1,000.04 0.30 1,024.90 0.31 0.06
Investor 1,000.00 1,000.04 0.30 1,024.90 0.31 0.06R6 1,000.00 1,000.04 0.30 1,024.90 0.31 0.06
1 The actual ending account value is based on the actual total return of the Fund for the period March 1, 2021 through August 31, 2021, after actualexpenses and will differ from the hypothetical ending account value which is based on the Fund’s expense ratio and a hypothetical annual return of 5%before expenses.
16 Invesco Government Money Market Fund
ˆ200F4hpToRBt$yQs{Š200F4hpToRBt$yQs{
173173 EDG 17INVESCOGOVERNMENT MONEY MAR
29-Oct-2021 11:31 ESTHTMDTF
Donnelley Financial ADG pf_rendNone
7*ESS 0C
ADGP64RS2921.10.7.0
Page 1 of 1
Approval of Investment Advisory and Sub-Advisory Contracts
17 Invesco Government Money Market Fund
At meetings held on June 10, 2021, theBoard of Trustees (the Board or the Trustees)of AIM Investment Securities Funds (InvescoInvestment Securities Funds) as a whole, andthe independent Trustees, who comprise over75% of the Board, voting separately,approved the continuance of the InvescoGovernment Money Market Fund’s (the Fund)Master Investment Advisory Agreement withInvesco Advisers, Inc. (Invesco Advisers andthe investment advisory agreement) and theMaster Intergroup Sub-Advisory Contract forMutual Funds with Invesco AssetManagement Deutschland GmbH, InvescoAsset Management Limited, Invesco AssetManagement (Japan) Limited, Invesco HongKong Limited, Invesco Senior SecuredManagement, Inc. and Invesco Canada Ltd.(collectively, the Affiliated Sub-Advisers andthe sub-advisory contracts) for another year,effective July 1, 2021. After evaluating thefactors discussed below, among others, theBoard approved the renewal of the Fund’sinvestment advisory agreement and thesub-advisory contracts and determined thatthe compensation payable thereunder by theFund to Invesco Advisers and by InvescoAdvisers to the Affiliated Sub-Advisers is fairand reasonable.The Board’s Evaluation ProcessThe Board has established an InvestmentsCommittee, which in turn has establishedSub-Committees that meet throughout theyear to review the performance of fundsadvised by Invesco Advisers (the InvescoFunds). The Sub-Committees meet regularlywith portfolio managers for their assignedInvesco Funds and other members ofmanagement to review detailed informationabout investment performance and portfolioattributes of these funds. The Board hasestablished additional standing and ad hoccommittees that meet regularly throughoutthe year to review matters within theirpurview. The Board took into accountevaluations and reports that it received fromits committees and sub-committees, as wellas the information provided to the Board andits committees and sub-committeesthroughout the year, in considering whether toapprove each Invesco Fund’s investmentadvisory agreement and sub-advisorycontracts.
As part of the contract renewal process,the Board reviews and considers informationprovided in response to detailed requests forinformation submitted to management by theindependent Trustees with assistance fromlegal counsel to the independent Trustees.The Board receives comparative investmentperformance and fee and expense dataregarding the Invesco Funds prepared byBroadridge Financial Solutions, Inc.(Broadridge), an independent mutual funddata provider, as well as information on thecomposition of the peer groups provided byBroadridge and its methodology fordetermining peer groups. The Board alsoreceives an independent written evaluationfrom the Senior Officer, an officer of theInvesco Funds who reports directly to theindependent Trustees. The Senior Officer’sevaluation is prepared as part of hisresponsibility to manage the process bywhich the Invesco Funds’ proposedmanagement fees are negotiated during theannual contract renewal process to ensurethey are negotiated in a manner that is atarms’ length and reasonable. In addition tomeetings with Invesco Advisers and fundcounsel
throughout the year and as part of meetingsconvened on April 27, 2021 and June 10,2021, the independent Trustees also discussedthe continuance of the investment advisoryagreement and sub-advisory contracts inseparate sessions with the Senior Officer andwith independent legal counsel.
The discussion below is a summary of theSenior Officer’s independent written evaluationwith respect to the Fund’s investment advisoryagreement and sub-advisory contracts, as wellas a discussion of the material factors andrelated conclusions that formed the basis forthe Board’s approval of the Fund’s investmentadvisory agreement and sub-advisorycontracts. The Trustees’ review andconclusions are based on the comprehensiveconsideration of all information presented tothem during the course of the year and in prioryears and are not the result of any singledeterminative factor. Moreover, one Trusteemay have weighed a particular piece ofinformation or factor differently than anotherTrustee. The information received andconsidered by the Board was current as ofvarious dates prior to the Board’s approval onJune 10, 2021.Factors and Conclusions and Summary ofIndependent Written Fee EvaluationA. Nature, Extent and Quality of Services
Provided by Invesco Advisers and theAffiliated Sub-Advisers
The Board reviewed the nature, extent andquality of the advisory services provided to theFund by Invesco Advisers under the Fund’sinvestment advisory agreement, and thecredentials and experience of the officers andemployees of Invesco Advisers who providethese services, including the Fund’s portfoliomanager(s). The Board’s review includedconsideration of Invesco Advisers’ investmentprocess and oversight, credit analysis, andresearch capabilities. The Board consideredinformation regarding Invesco Advisers’programs for and resources devoted to riskmanagement, including management ofinvestment, enterprise, operational, liquidity,valuation and compliance risks, and technologyused to manage such risks. The Boardreceived a description of Invesco Advisers’business continuity plans and of its approachto data privacy and cybersecurity, includingrelated testing. The Board considered how thecybersecurity and business continuity plans ofInvesco Advisers and its key service providersoperated in the increased remote workingenvironment resulting from the novelcoronavirus (“COVID-19”) pandemic.The Boardalso considered non-advisory services thatInvesco Advisers and its affiliates provide tothe Invesco Funds such as various back officesupport functions, third party oversight, internalaudit, valuation, portfolio trading and legal andcompliance. The Board observed that InvescoAdvisers has been able to effectively manage,operate and oversee the Invesco Fundsthrough the challenging COVID-19 pandemicperiod. The Board reviewed and consideredthe benefits to shareholders of investing in aFund that is part of the family of funds underthe umbrella of Invesco Ltd., Invesco Advisers’parent company, and noted Invesco Ltd.’sdepth and experience in running an investmentmanagement business, as well as itscommitment of financial and other resources tosuch business. The Board concluded that thenature,
extent and quality of the services provided tothe Fund by Invesco Advisers are appropriateand satisfactory.
The Board reviewed the services that maybe provided by the Affiliated Sub-Advisersunder the sub-advisory contracts and thecredentials and experience of the officers andemployees of the Affiliated Sub-Advisers whoprovide these services. The Board noted theAffiliated Sub-Advisers’ expertise with respectto certain asset classes and that the AffiliatedSub-Advisers have offices and personnel thatare located in financial centers around theworld. As a result, the Board noted that theAffiliated Sub-Advisers can provide researchand investment analysis on the markets andeconomies of various countries in which theFund may invest, make recommendationsregarding securities and assist with securitytrades. The Board concluded that thesub-advisory contracts may benefit the Fundand its shareholders by permitting InvescoAdvisers to use the resources and talents ofthe Affiliated Sub-Advisers in managing theFund. The Board concluded that the nature,extent and quality of the services that may beprovided to the Fund by the AffiliatedSub-Advisers are appropriate andsatisfactory.B. Fund Investment PerformanceThe Board considered Fund investmentperformance as a relevant factor inconsidering whether to approve theinvestment advisory agreement. The Boarddid not view Fund investment performance asa relevant factor in considering whether toapprove the sub-advisory contracts for theFund, as no Affiliated Sub-Adviser currentlymanages assets of the Fund.
The Board compared the Fund’sinvestment performance over multiple timeperiods ending December 31, 2020 to theperformance of funds in the Broadridgeperformance universe and against the U.S. 3Month Treasury Bill Index (Index). The Boardnoted that performance of Cash Reserveshares of the Fund was in the second quintileof its performance universe for the one yearperiod and the third quintile for the three andfive year periods (the first quintile being thebest performing funds and the fifth quintilebeing the worst performing funds). The Boardnoted that performance of Cash Reserveshares of the Fund was below theperformance of the Index for the one, threeand five year periods. The Board recognizedthat the performance data reflects a snapshotin time as of a particular date and thatselecting a different performance period couldproduce different results. The Board alsoreviewed more recent Fund performance aswell as other performance metrics, which didnot change its conclusions.C. Advisory and Sub-Advisory Fees and Fund
ExpensesThe Board compared the Fund’s contractualmanagement fee rate to the contractualmanagement fee rates of funds in the Fund’sBroadridge expense group. The Board notedthat the contractual management fee rate forCash Reserve shares of the Fund wasreasonably comparable to the mediancontractual management fee rate of funds inits expense group. The Board noted that theterm “contractual management fee” for fundsin the expense group may include bothadvisory and certain non-portfoliomanagement administrative services fees,but that Broadridge is not able to provide
ˆ200F4hpToRBu1N5LdŠ200F4hpToRBu1N5Ld
173173 EDG 18INVESCOGOVERNMENT MONEY MAR
29-Oct-2021 11:31 ESTHTMDTF
Donnelley Financial ADG pf_rendNone
5*ESS 0C
ADGP64RS2921.10.7.0
Page 1 of 1
18 Invesco Government Money Market Fund
information on a fund by fund basis as towhat is included. The Board also reviewedthe methodology used by Broadridge incalculating expense group information, whichincludes using each fund’s contractualmanagement fee schedule (including anyapplicable breakpoints) as reported in themost recent prospectus or statement ofadditional information for each fund in theexpense group. The Board also consideredcomparative information regarding the Fund’stotal expense ratio and its variouscomponents. The Board noted that theFund’s total expense ratio was in the fifthquintile of its expense group and discussedwith management reasons for such relativetotal expenses. The Board also noted that theFund’s total expense ratio is as of the fiscalyear end of February 28, 2020 and does notreflect additional voluntary waivers tomaintain a positive yield subsequent to suchdate.
The Board noted that Invesco Advisers hascontractually agreed to waive fees and/or limitexpenses of the Fund for the term disclosedin the Fund’s registration statement in anamount necessary to limit total annualoperating expenses to a specified percentageof average daily net assets for each class ofthe Fund.
The Board also considered the feescharged by Invesco Advisers and its affiliatesto other client accounts that are similarlymanaged. Invesco Advisers reviewed with theBoard differences in the scope of services itprovides to the Invesco Funds relative to thatprovided by Invesco Advisers and its affiliatesto certain other types of client accounts,including, among others: management ofcash flows as a result of redemptions andpurchases; necessary infrastructure such asofficers, office space, technology, legal anddistribution; oversight of service providers;costs and business risks associated withlaunching new funds and sponsoring andmaintaining the product line; and compliancewith federal and state laws and regulations.Invesco Advisers also advised the Board thatmany of the similarly managed clientaccounts have all-inclusive fee structures,which are not easily un-bundled.
The Board also considered the servicesthat may be provided by the AffiliatedSub-Advisers pursuant to the sub-advisorycontracts, as well as the fees payable byInvesco Advisers to the AffiliatedSub-Advisers pursuant to the sub-advisorycontracts.D. Economies of Scale and BreakpointsThe Board considered the extent to whichthere may be economies of scale in theprovision of advisory services to the Fundand the Invesco Funds, and the extent towhich such economies of scale are sharedwith the Fund and the Invesco Funds. TheBoard noted that the Fund does not benefitfrom economies of scale through contractualbreakpoints, but does share in economies ofscale through Invesco Advisers’ ability tonegotiate lower fee arrangements with thirdparty service providers. The Board noted thatthe Fund may also benefit from economies ofscale through initial fee setting, fee waiversand expense reimbursements, as well asInvesco Advisers’ investment in its business,including investments in businessinfrastructure, technology and cybersecurity.E. Profitability and Financial ResourcesThe Board reviewed information from InvescoAdvisers concerning the costs of the advisoryand other services that Invesco Advisers andits affiliates provide to the Fund and theInvesco Funds and the profitability of InvescoAdvisers and its affiliates in providing theseservices in the aggregate and on an
individual Fund-by-Fund basis. The Boardconsidered the methodology used forcalculating profitability and noted that suchmethodology had recently been reviewed andenhanced. The Board noted that InvescoAdvisers continues to operate at a net profitfrom services Invesco Advisers and its affiliatesprovide to the Invesco Funds in the aggregateand to most Funds individually. The Board didnot deem the level of profits realized byInvesco Advisers and its affiliates fromproviding such services to be excessive, giventhe nature, extent and quality of the servicesprovided. The Board noted that InvescoAdvisers provided information demonstratingthat Invesco Advisers is financially sound andhas the resources necessary to perform itsobligations under the investment advisoryagreement, and provided representationsindicating that the Affiliated Sub-Advisers arefinancially sound and have the resourcesnecessary to perform their obligations underthe sub-advisory contracts.F. Collateral Benefits to Invesco Advisers and its
AffiliatesThe Board considered various other benefitsreceived by Invesco Advisers and its affiliatesfrom the relationship with the Fund, includingthe fees received for providing administrative,transfer agency and distribution services to theFund. The Board received comparativeinformation regarding fees charged for theseservices, including information provided byBroadridge and other independent sources.The Board reviewed the performance ofInvesco Advisers and its affiliates in providingthese services and the organizational structureemployed to provide these services. The Boardnoted that these services are provided to theFund pursuant to written contracts that arereviewed and subject to approval on an annualbasis by the Board based on its determinationthat the services are required for the operationof the Fund.

ˆ200F4hpToRBu3%%sÁŠ200F4hpToRBu3%%s`
173173 EDG 19INVESCOGOVERNMENT MONEY MAR
29-Oct-2021 11:31 ESTHTMDTF
Donnelley Financial ADG pf_rendNone
4*ESS 0C
ADGP64RS2921.10.7.0
Page 1 of 1
(This page intentionally left blank)
ˆ200F4hpToRBu6jyLÀŠ200F4hpToRBu6jyL
173173 EDG 20INVESCOGOVERNMENT MONEY MAR
29-Oct-2021 11:31 ESTHTMDTF
Donnelley Financial ADG pf_rendNone
5*ESS 0C
ADGP64RS2921.10.7.0
dsp-20g59v84
Page 1 of 1
Go paperless with eDeliveryVisit invesco.com/edelivery to enjoy the convenience and security of anytime electronic access to your investmentdocuments.With eDelivery, you can elect to have any or all of the following materials delivered straight to your inbox to download, saveand print from your own computer:∎ Fund reports and prospectuses∎ Quarterly statements∎ Daily confirmations∎ Tax forms Invesco mailing informationSend general correspondence to Invesco Investment Services, Inc., P.O. Box 219078, Kansas City, MO 64121-9078. Important notice regarding delivery of security holder documentsTo reduce Fund expenses, only one copy of most shareholder documents may be mailed to shareholders with multipleaccounts at the same address (Householding). Mailing of your shareholder documents may be householded indefinitelyunless you instruct us otherwise. If you do not want the mailing of these documents to be combined with those for othermembers of your household, please contact Invesco Investment Services, Inc. at 800 959 4246 or contact your financialinstitution. We will begin sending you individual copies for each account within 30 days after receiving your request. Fund holdings and proxy voting informationThe Fund provides a complete list of its portfolio holdings in various monthly and quarterly regulatory filings. The Fund files acomplete schedule of portfolio holdings with the Securities and Exchange Commission (SEC) monthly on Form N-MFP. Forthe second and fourth quarters, the list appears, respectively, in the Fund’s semiannual and annual reports to shareholders.The most recent list of portfolio holdings is available at invesco.com/us. Shareholders can also look up the Fund’s FormN-MFP filings on the SEC website, sec.gov. The SEC file numbers for the Fund are shown below.
A description of the policies and procedures that the Fund uses to determine how to vote proxies relating to portfoliosecurities is available without charge, upon request, from our Client Services department at 800 959 4246, or at invesco.com/corporate/about-us/esg. The information is also available on the SEC website, sec.gov.
Information regarding how the Fund voted proxies related to its portfolio securities during the most recent 12-month periodended June 30 is available at invesco.com/proxysearch. This information is also available on the SEC website, sec.gov.
Invesco Advisers, Inc. is an investment adviser; it provides investment advisory services to individual and institutionalclients and does not sell securities. Invesco Distributors, Inc. is the US distributor for Invesco Ltd.’s retail mutual funds,exchange-traded funds and institutional money market funds. Both are wholly owned, indirect subsidiaries of Invesco Ltd.
SEC file number(s): 811-05686 and 033-39519 Invesco Distributors, Inc. GMKT-SAR-1
ˆ200D#JZ!e!i0KCmG6Š200D#JZ!e!i0KCmG6
111462 EDG 1INVESCOHIGH YIELD
29-Oct-2021 19:23 ESTHTMLAN
Donnelley Financial LSWhamem0apNone
6*ESS 0C
VDI-W10-LPF-15321.7.8.0
page01
Page 1 of 1
Semiannual Report to Shareholders August 31, 2021
Invesco High Yield FundNasdaq:A: AMHYX ∎ C: AHYCX ∎ Y: AHHYX ∎ Investor: HYINX ∎ R5: AHIYX ∎ R6: HYIFX
2 Fund Performance4 Liquidity Risk Management Program5 Schedule of Investments13 Financial Statements16 Financial Highlights17 Notes to Financial Statements24 Fund Expenses25 Approval of Investment Advisory and Sub-Advisory Contracts
For the most current month-end Fund performance and commentary, please visit invesco.com/performance.Unless otherwise noted, all data provided by Invesco.This report must be accompanied or preceded by a currently effective Fund prospectus, which contains more complete information, includingsales charges and expenses. Investors should read it carefully before investing.
NOT FDIC INSURED | MAY LOSE VALUE | NO BANK GUARANTEE
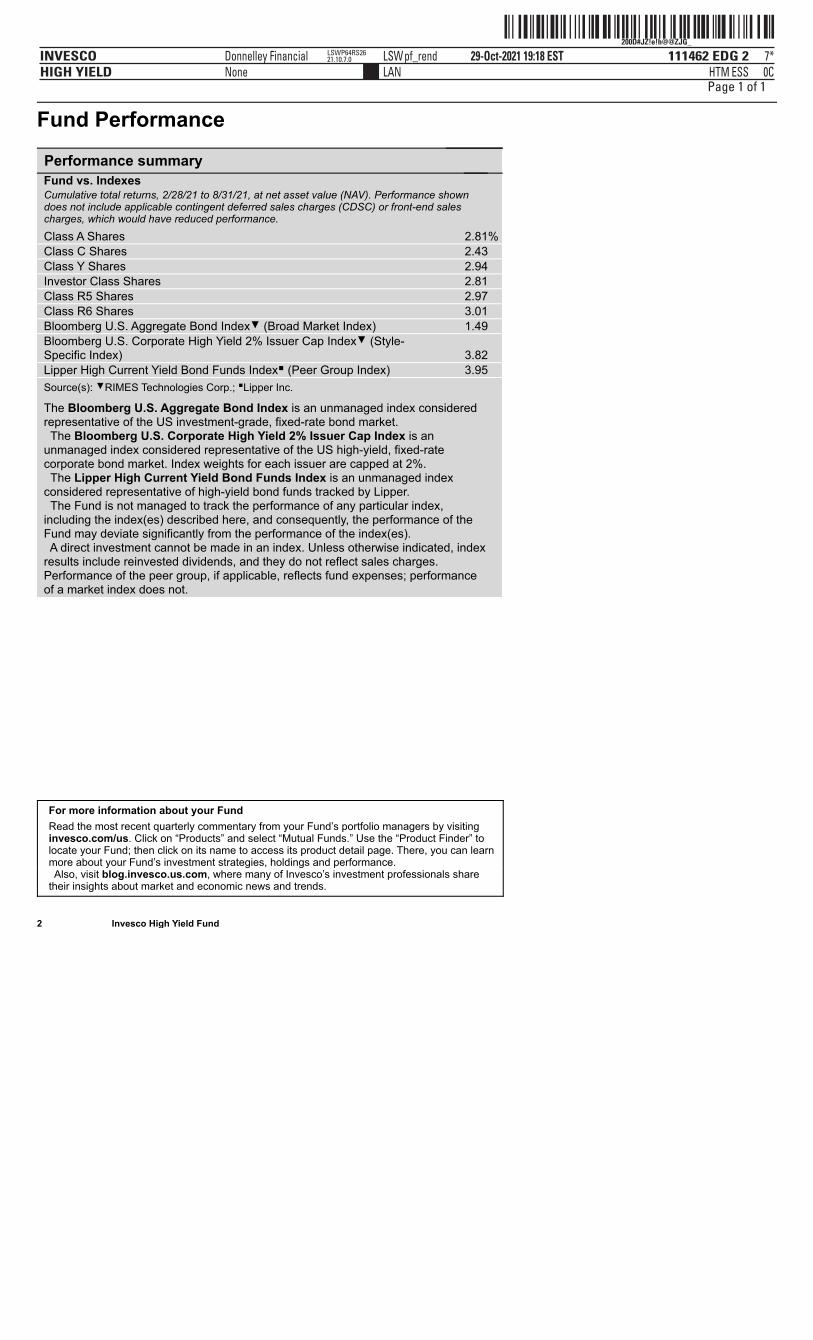
ˆ200D#JZ!e!h@@ZJG_Š200D#JZ!e!h@@ZJG_
111462 EDG 2INVESCOHIGH YIELD
29-Oct-2021 19:18 ESTHTMLAN
Donnelley Financial LSWpf_rendNone
7*ESS 0C
LSWP64RS2621.10.7.0
Page 1 of 1
Fund Performance
2 Invesco High Yield Fund
Performance summary
Fund vs. Indexes Cumulative total returns, 2/28/21 to 8/31/21, at net asset value (NAV). Performance showndoes not include applicable contingent deferred sales charges (CDSC) or front-end salescharges, which would have reduced performance.
Class A Shares 2.81% Class C Shares 2.43 Class Y Shares 2.94 Investor Class Shares 2.81 Class R5 Shares 2.97 Class R6 Shares 3.01 Bloomberg U.S. Aggregate Bond Index▼ (Broad Market Index) 1.49 Bloomberg U.S. Corporate High Yield 2% Issuer Cap Index▼ (Style-Specific Index) 3.82 Lipper High Current Yield Bond Funds Index∎ (Peer Group Index) 3.95 Source(s): ▼RIMES Technologies Corp.; ∎Lipper Inc. The Bloomberg U.S. Aggregate Bond Index is an unmanaged index consideredrepresentative of the US investment-grade, fixed-rate bond market. The Bloomberg U.S. Corporate High Yield 2% Issuer Cap Index is anunmanaged index considered representative of the US high-yield, fixed-ratecorporate bond market. Index weights for each issuer are capped at 2%. The Lipper High Current Yield Bond Funds Index is an unmanaged indexconsidered representative of high-yield bond funds tracked by Lipper. The Fund is not managed to track the performance of any particular index,including the index(es) described here, and consequently, the performance of theFund may deviate significantly from the performance of the index(es). A direct investment cannot be made in an index. Unless otherwise indicated, indexresults include reinvested dividends, and they do not reflect sales charges.Performance of the peer group, if applicable, reflects fund expenses; performanceof a market index does not.
For more information about your Fund
Read the most recent quarterly commentary from your Fund’s portfolio managers by visitinginvesco.com/us. Click on “Products” and select “Mutual Funds.” Use the “Product Finder” tolocate your Fund; then click on its name to access its product detail page. There, you can learnmore about your Fund’s investment strategies, holdings and performance. Also, visit blog.invesco.us.com, where many of Invesco’s investment professionals sharetheir insights about market and economic news and trends.
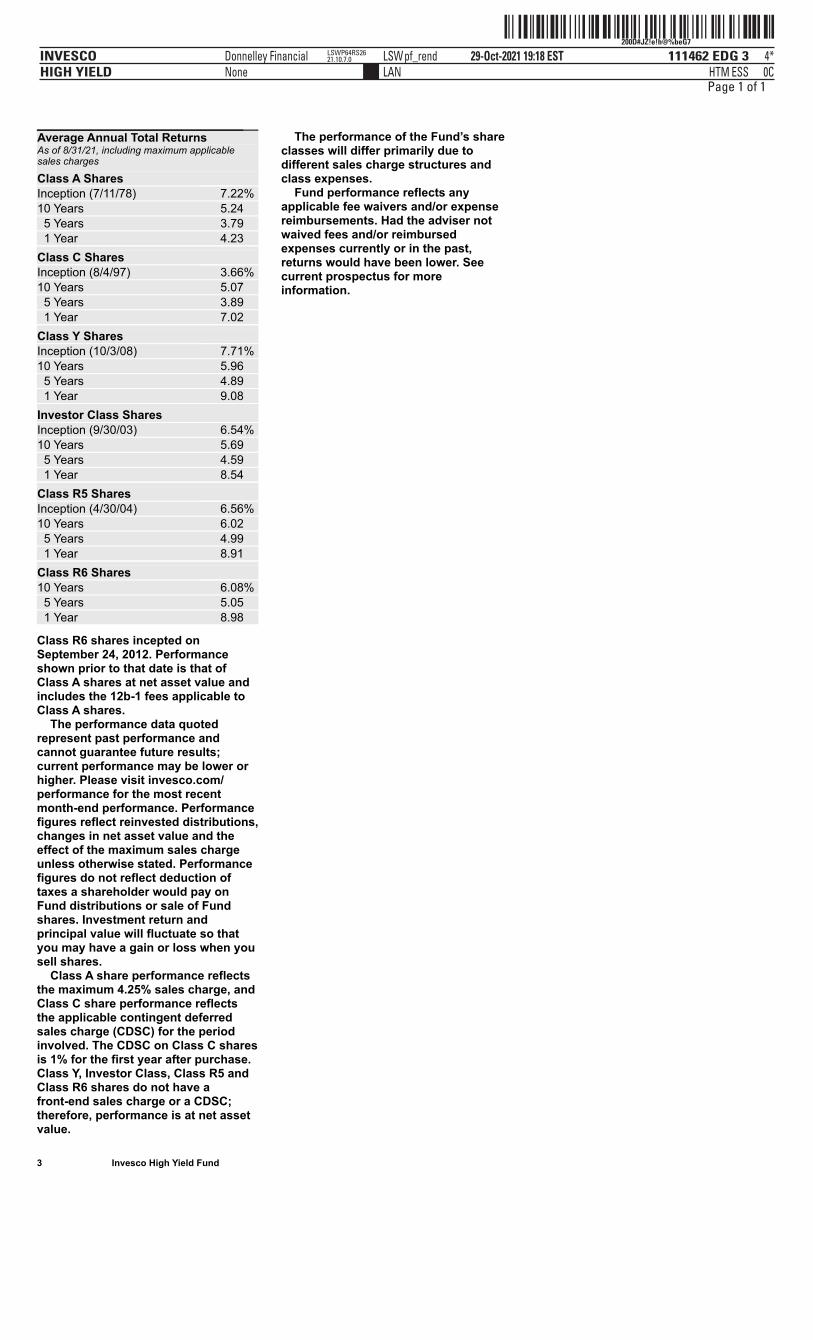
ˆ200D#JZ!e!h@%beG7Š200D#JZ!e!h@%beG7
111462 EDG 3INVESCOHIGH YIELD
29-Oct-2021 19:18 ESTHTMLAN
Donnelley Financial LSWpf_rendNone
4*ESS 0C
LSWP64RS2621.10.7.0
Page 1 of 1
3 Invesco High Yield Fund
Average Annual Total Returns As of 8/31/21, including maximum applicablesales charges
Class A Shares Inception (7/11/78) 7.22% 10 Years 5.24 5 Years 3.79 1 Year 4.23 Class C Shares Inception (8/4/97) 3.66% 10 Years 5.07 5 Years 3.89 1 Year 7.02 Class Y Shares Inception (10/3/08) 7.71% 10 Years 5.96 5 Years 4.89 1 Year 9.08 Investor Class Shares Inception (9/30/03) 6.54% 10 Years 5.69 5 Years 4.59 1 Year 8.54 Class R5 Shares Inception (4/30/04) 6.56% 10 Years 6.02 5 Years 4.99 1 Year 8.91 Class R6 Shares 10 Years 6.08% 5 Years 5.05 1 Year 8.98
Class R6 shares incepted onSeptember 24, 2012. Performanceshown prior to that date is that ofClass A shares at net asset value andincludes the 12b-1 fees applicable toClass A shares. The performance data quotedrepresent past performance andcannot guarantee future results;current performance may be lower orhigher. Please visit invesco.com/performance for the most recentmonth-end performance. Performancefigures reflect reinvested distributions,changes in net asset value and theeffect of the maximum sales chargeunless otherwise stated. Performancefigures do not reflect deduction oftaxes a shareholder would pay onFund distributions or sale of Fundshares. Investment return andprincipal value will fluctuate so thatyou may have a gain or loss when yousell shares. Class A share performance reflectsthe maximum 4.25% sales charge, andClass C share performance reflectsthe applicable contingent deferredsales charge (CDSC) for the periodinvolved. The CDSC on Class C sharesis 1% for the first year after purchase.Class Y, Investor Class, Class R5 andClass R6 shares do not have afront-end sales charge or a CDSC;therefore, performance is at net assetvalue.
The performance of the Fund’s shareclasses will differ primarily due todifferent sales charge structures andclass expenses. Fund performance reflects anyapplicable fee waivers and/or expensereimbursements. Had the adviser notwaived fees and/or reimbursedexpenses currently or in the past,returns would have been lower. Seecurrent prospectus for moreinformation.
ˆ200D#JZ!e!h@&ktoÈŠ200D#JZ!e!h@&kto¨
111462 EDG 4INVESCOHIGH YIELD
29-Oct-2021 19:18 ESTHTMLAN
Donnelley Financial LSWpf_rendNone
4*ESS 0C
LSWP64RS2621.10.7.0
Page 1 of 1
4 Invesco High Yield Fund
Liquidity Risk Management Program
In compliance with Rule 22e-4 under theInvestment Company Act of 1940, asamended (the “Liquidity Rule”), the Fundhas adopted and implemented a liquidityrisk management program in accordancewith the Liquidity Rule (the “Program”).The Program is reasonably designed toassess and manage the Fund’s liquidityrisk, which is the risk that the Fund couldnot meet redemption requests withoutsignificant dilution of remaining investors’interests in the Fund. The Board ofTrustees of the Fund (the “Board”) hasappointed Invesco Advisers, Inc.(“Invesco”), the Fund’s investmentadviser, as the Program’s administrator,and Invesco has delegated oversight ofthe Program to the Liquidity RiskManagement Committee (the“Committee”), which is composed ofsenior representatives from relevantbusiness groups at Invesco.
As required by the Liquidity Rule, theProgram includes policies andprocedures providing for an assessment,no less frequently than annually, of theFund’s liquidity risk that takes intoaccount, as relevant to the Fund’sliquidity risk: (1) the Fund’s investmentstrategy and liquidity of portfolioinvestments during both normal andreasonably foreseeable stressedconditions; (2) short-term and long-termcash flow projections for the Fund duringboth normal and reasonably foreseeablestressed conditions; and (3) the Fund’sholdings of cash and cash equivalentsand any borrowing arrangements. TheLiquidity Rule also requires theclassification of the Fund’s investmentsinto categories that reflect theassessment of their relative liquidityunder current market conditions. TheFund classifies its investments into oneof four categories defined in the LiquidityRule: “Highly Liquid,” “ModeratelyLiquid,” “Less Liquid,” and “Illiquid.”Funds that are not invested primarily in“Highly Liquid Investments” that areassets (cash or investments that arereasonably expected to be convertibleinto cash within three business dayswithout significantly changing the marketvalue of the investment) are required toestablish a “Highly Liquid InvestmentMinimum” (“HLIM”), which is theminimum percentage of net assets thatmust be invested in Highly LiquidInvestments. Funds with HLIMs haveprocedures for addressing HLIMshortfalls, including reporting to theBoard and the SEC (on a non-publicbasis) as required by the Program andthe Liquidity Rule. In addition, the Fundmay not acquire an investment if,immediately after the acquisition, over15% of the Fund’s net assets wouldconsist of “Illiquid Investments” that areassets (an investment that cannotreasonably be expected to be sold ordisposed of in current market conditionsin seven calendar days or less
without the sale or dispositionsignificantly changing the marketvalue of the investment). TheLiquidity Rule and the Program alsorequire reporting to the Board andthe SEC (on a non-public basis) if aFund’s holdings of IlliquidInvestments exceed 15% of theFund’s assets.
At a meeting held on March 22-24,2021, the Committee presented areport to the Board that addressedthe operation of the Program andassessed the Program’s adequacyand effectiveness of implementation(the “Report”). The Report coveredthe period from January 1, 2020through December 31, 2020 (the“Program Reporting Period”). TheReport discussed notable eventsaffecting liquidity over the ProgramReporting Period, including theimpact of the coronavirus pandemicon the Fund and the overall market.The Report noted that there were nomaterial changes to the Programduring the Program ReportingPeriod.
The Report stated, in relevant part,that during the Program ReportingPeriod:
∎ The Program, as adopted andimplemented, remained reasonablydesigned to assess and managethe Fund’s liquidity risk and wasoperated effectively to achieve thatgoal;
∎ The Fund’s investment strategyremained appropriate for anopen-end fund;
∎ The Fund was able to meetrequests for redemption withoutsignificant dilution of remaininginvestors’ interests in the Fund;
∎ The Fund did not breach the 15%limit on Illiquid Investments; and
∎ The Fund primarily held HighlyLiquid Investments and thereforehas not adopted an HLIM.
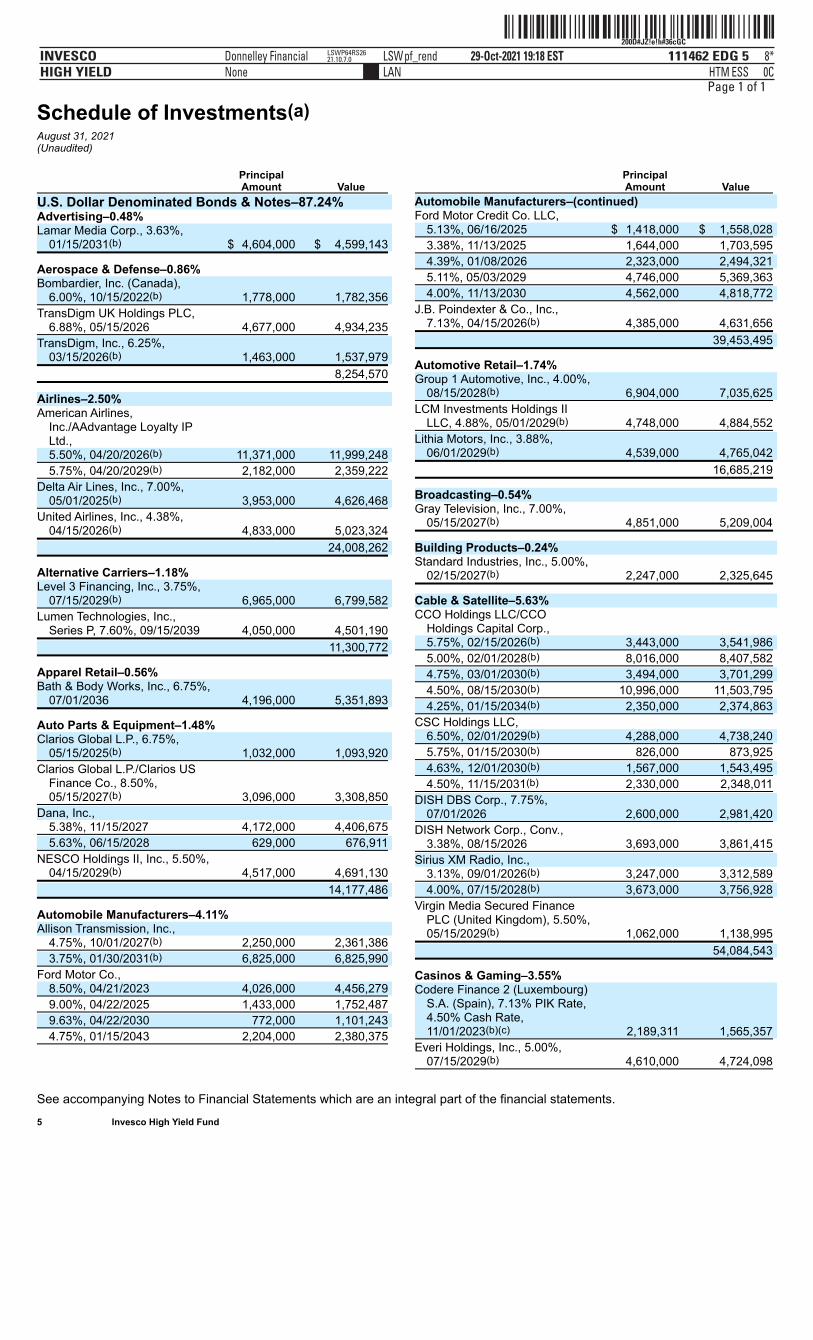
ˆ200D#JZ!e!h#36cGCŠ200D#JZ!e!h#36cGC
111462 EDG 5INVESCOHIGH YIELD
29-Oct-2021 19:18 ESTHTMLAN
Donnelley Financial LSWpf_rendNone
8*ESS 0C
LSWP64RS2621.10.7.0
Page 1 of 1
Schedule of Investments(a)August 31, 2021(Unaudited)
See accompanying Notes to Financial Statements which are an integral part of the financial statements. 5 Invesco High Yield Fund
Principal Amount Value
U.S. Dollar Denominated Bonds & Notes–87.24% Advertising–0.48% Lamar Media Corp., 3.63%,
01/15/2031(b) $ 4,604,000 $ 4,599,143
Aerospace & Defense–0.86% Bombardier, Inc. (Canada),
6.00%, 10/15/2022(b) 1,778,000 1,782,356
TransDigm UK Holdings PLC,6.88%, 05/15/2026 4,677,000 4,934,235
TransDigm, Inc., 6.25%,03/15/2026(b) 1,463,000 1,537,979
8,254,570
Airlines–2.50% American Airlines,
Inc./AAdvantage Loyalty IPLtd., 5.50%, 04/20/2026(b) 11,371,000 11,999,248
5.75%, 04/20/2029(b) 2,182,000 2,359,222
Delta Air Lines, Inc., 7.00%,05/01/2025(b) 3,953,000 4,626,468
United Airlines, Inc., 4.38%,04/15/2026(b) 4,833,000 5,023,324
24,008,262
Alternative Carriers–1.18% Level 3 Financing, Inc., 3.75%,
07/15/2029(b) 6,965,000 6,799,582
Lumen Technologies, Inc.,Series P, 7.60%, 09/15/2039 4,050,000 4,501,190
11,300,772
Apparel Retail–0.56% Bath & Body Works, Inc., 6.75%,
07/01/2036 4,196,000 5,351,893
Auto Parts & Equipment–1.48% Clarios Global L.P., 6.75%,
05/15/2025(b) 1,032,000 1,093,920
Clarios Global L.P./Clarios USFinance Co., 8.50%,05/15/2027(b) 3,096,000 3,308,850
Dana, Inc., 5.38%, 11/15/2027 4,172,000 4,406,675
5.63%, 06/15/2028 629,000 676,911
NESCO Holdings II, Inc., 5.50%,04/15/2029(b) 4,517,000 4,691,130
14,177,486
Automobile Manufacturers–4.11% Allison Transmission, Inc.,
4.75%, 10/01/2027(b) 2,250,000 2,361,386
3.75%, 01/30/2031(b) 6,825,000 6,825,990
Ford Motor Co., 8.50%, 04/21/2023 4,026,000 4,456,279
9.00%, 04/22/2025 1,433,000 1,752,487
9.63%, 04/22/2030 772,000 1,101,243
4.75%, 01/15/2043 2,204,000 2,380,375
Principal Amount Value
Automobile Manufacturers–(continued) Ford Motor Credit Co. LLC,
5.13%, 06/16/2025 $ 1,418,000 $ 1,558,028
3.38%, 11/13/2025 1,644,000 1,703,595
4.39%, 01/08/2026 2,323,000 2,494,321
5.11%, 05/03/2029 4,746,000 5,369,363
4.00%, 11/13/2030 4,562,000 4,818,772
J.B. Poindexter & Co., Inc.,7.13%, 04/15/2026(b) 4,385,000 4,631,656
39,453,495
Automotive Retail–1.74% Group 1 Automotive, Inc., 4.00%,
08/15/2028(b) 6,904,000 7,035,625
LCM Investments Holdings IILLC, 4.88%, 05/01/2029(b) 4,748,000 4,884,552
Lithia Motors, Inc., 3.88%,06/01/2029(b) 4,539,000 4,765,042
16,685,219
Broadcasting–0.54% Gray Television, Inc., 7.00%,
05/15/2027(b) 4,851,000 5,209,004
Building Products–0.24% Standard Industries, Inc., 5.00%,
02/15/2027(b) 2,247,000 2,325,645
Cable & Satellite–5.63% CCO Holdings LLC/CCO
Holdings Capital Corp., 5.75%, 02/15/2026(b) 3,443,000 3,541,986
5.00%, 02/01/2028(b) 8,016,000 8,407,582
4.75%, 03/01/2030(b) 3,494,000 3,701,299
4.50%, 08/15/2030(b) 10,996,000 11,503,795
4.25%, 01/15/2034(b) 2,350,000 2,374,863
CSC Holdings LLC, 6.50%, 02/01/2029(b) 4,288,000 4,738,240
5.75%, 01/15/2030(b) 826,000 873,925
4.63%, 12/01/2030(b) 1,567,000 1,543,495
4.50%, 11/15/2031(b) 2,330,000 2,348,011
DISH DBS Corp., 7.75%,07/01/2026 2,600,000 2,981,420
DISH Network Corp., Conv.,3.38%, 08/15/2026 3,693,000 3,861,415
Sirius XM Radio, Inc., 3.13%, 09/01/2026(b) 3,247,000 3,312,589
4.00%, 07/15/2028(b) 3,673,000 3,756,928
Virgin Media Secured FinancePLC (United Kingdom), 5.50%,05/15/2029(b) 1,062,000 1,138,995
54,084,543
Casinos & Gaming–3.55% Codere Finance 2 (Luxembourg)
S.A. (Spain), 7.13% PIK Rate,4.50% Cash Rate,11/01/2023(b)(c) 2,189,311 1,565,357
Everi Holdings, Inc., 5.00%,07/15/2029(b) 4,610,000 4,724,098
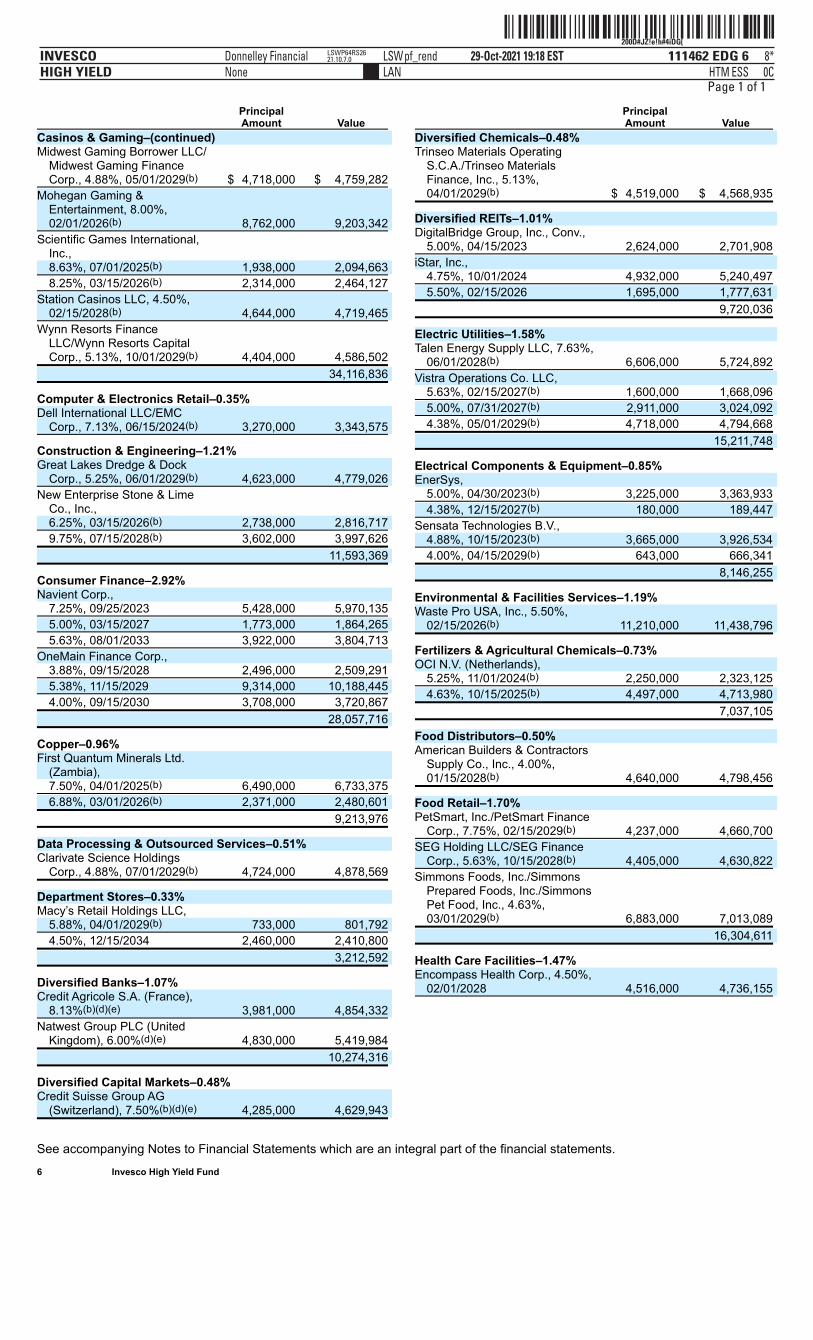
ˆ200D#JZ!e!h#4iDG{Š200D#JZ!e!h#4iDG{
111462 EDG 6INVESCOHIGH YIELD
29-Oct-2021 19:18 ESTHTMLAN
Donnelley Financial LSWpf_rendNone
8*ESS 0C
LSWP64RS2621.10.7.0
Page 1 of 1
See accompanying Notes to Financial Statements which are an integral part of the financial statements. 6 Invesco High Yield Fund
Principal Amount Value
Casinos & Gaming–(continued) Midwest Gaming Borrower LLC/
Midwest Gaming FinanceCorp., 4.88%, 05/01/2029(b) $ 4,718,000 $ 4,759,282
Mohegan Gaming &Entertainment, 8.00%,02/01/2026(b) 8,762,000 9,203,342
Scientific Games International,Inc., 8.63%, 07/01/2025(b) 1,938,000 2,094,663
8.25%, 03/15/2026(b) 2,314,000 2,464,127
Station Casinos LLC, 4.50%,02/15/2028(b) 4,644,000 4,719,465
Wynn Resorts FinanceLLC/Wynn Resorts CapitalCorp., 5.13%, 10/01/2029(b) 4,404,000 4,586,502
34,116,836
Computer & Electronics Retail–0.35% Dell International LLC/EMC
Corp., 7.13%, 06/15/2024(b) 3,270,000 3,343,575
Construction & Engineering–1.21% Great Lakes Dredge & Dock
Corp., 5.25%, 06/01/2029(b) 4,623,000 4,779,026
New Enterprise Stone & LimeCo., Inc., 6.25%, 03/15/2026(b) 2,738,000 2,816,717
9.75%, 07/15/2028(b) 3,602,000 3,997,626
11,593,369
Consumer Finance–2.92% Navient Corp.,
7.25%, 09/25/2023 5,428,000 5,970,135
5.00%, 03/15/2027 1,773,000 1,864,265
5.63%, 08/01/2033 3,922,000 3,804,713
OneMain Finance Corp., 3.88%, 09/15/2028 2,496,000 2,509,291
5.38%, 11/15/2029 9,314,000 10,188,445
4.00%, 09/15/2030 3,708,000 3,720,867
28,057,716
Copper–0.96% First Quantum Minerals Ltd.
(Zambia), 7.50%, 04/01/2025(b) 6,490,000 6,733,375
6.88%, 03/01/2026(b) 2,371,000 2,480,601
9,213,976
Data Processing & Outsourced Services–0.51% Clarivate Science Holdings
Corp., 4.88%, 07/01/2029(b) 4,724,000 4,878,569
Department Stores–0.33% Macy’s Retail Holdings LLC,
5.88%, 04/01/2029(b) 733,000 801,792
4.50%, 12/15/2034 2,460,000 2,410,800
3,212,592
Diversified Banks–1.07% Credit Agricole S.A. (France),
8.13%(b)(d)(e) 3,981,000 4,854,332
Natwest Group PLC (UnitedKingdom), 6.00%(d)(e) 4,830,000 5,419,984
10,274,316
Diversified Capital Markets–0.48% Credit Suisse Group AG
(Switzerland), 7.50%(b)(d)(e) 4,285,000 4,629,943
Principal Amount Value
Diversified Chemicals–0.48% Trinseo Materials Operating
S.C.A./Trinseo MaterialsFinance, Inc., 5.13%,04/01/2029(b) $ 4,519,000 $ 4,568,935
Diversified REITs–1.01% DigitalBridge Group, Inc., Conv.,
5.00%, 04/15/2023 2,624,000 2,701,908
iStar, Inc., 4.75%, 10/01/2024 4,932,000 5,240,497
5.50%, 02/15/2026 1,695,000 1,777,631
9,720,036
Electric Utilities–1.58% Talen Energy Supply LLC, 7.63%,
06/01/2028(b) 6,606,000 5,724,892
Vistra Operations Co. LLC, 5.63%, 02/15/2027(b) 1,600,000 1,668,096
5.00%, 07/31/2027(b) 2,911,000 3,024,092
4.38%, 05/01/2029(b) 4,718,000 4,794,668
15,211,748
Electrical Components & Equipment–0.85% EnerSys,
5.00%, 04/30/2023(b) 3,225,000 3,363,933
4.38%, 12/15/2027(b) 180,000 189,447
Sensata Technologies B.V., 4.88%, 10/15/2023(b) 3,665,000 3,926,534
4.00%, 04/15/2029(b) 643,000 666,341
8,146,255
Environmental & Facilities Services–1.19% Waste Pro USA, Inc., 5.50%,
02/15/2026(b) 11,210,000 11,438,796
Fertilizers & Agricultural Chemicals–0.73% OCI N.V. (Netherlands),
5.25%, 11/01/2024(b) 2,250,000 2,323,125
4.63%, 10/15/2025(b) 4,497,000 4,713,980
7,037,105
Food Distributors–0.50% American Builders & Contractors
Supply Co., Inc., 4.00%,01/15/2028(b) 4,640,000 4,798,456
Food Retail–1.70% PetSmart, Inc./PetSmart Finance
Corp., 7.75%, 02/15/2029(b) 4,237,000 4,660,700
SEG Holding LLC/SEG FinanceCorp., 5.63%, 10/15/2028(b) 4,405,000 4,630,822
Simmons Foods, Inc./SimmonsPrepared Foods, Inc./SimmonsPet Food, Inc., 4.63%,03/01/2029(b) 6,883,000 7,013,089
16,304,611
Health Care Facilities–1.47% Encompass Health Corp., 4.50%,
02/01/2028 4,516,000 4,736,155
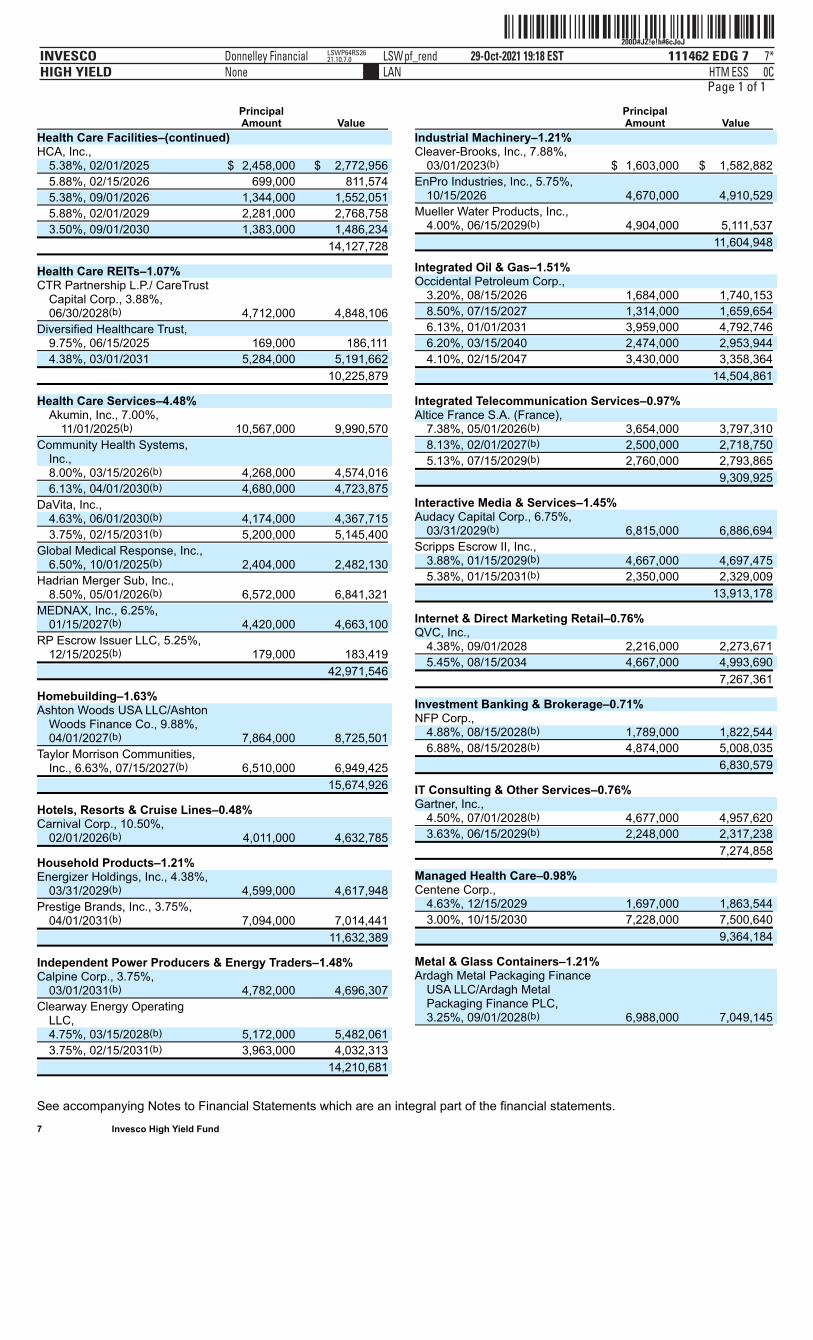
ˆ200D#JZ!e!h#6cJoJŠ200D#JZ!e!h#6cJoJ
111462 EDG 7INVESCOHIGH YIELD
29-Oct-2021 19:18 ESTHTMLAN
Donnelley Financial LSWpf_rendNone
7*ESS 0C
LSWP64RS2621.10.7.0
Page 1 of 1
See accompanying Notes to Financial Statements which are an integral part of the financial statements. 7 Invesco High Yield Fund
Principal Amount Value
Health Care Facilities–(continued) HCA, Inc.,
5.38%, 02/01/2025 $ 2,458,000 $ 2,772,956
5.88%, 02/15/2026 699,000 811,574
5.38%, 09/01/2026 1,344,000 1,552,051
5.88%, 02/01/2029 2,281,000 2,768,758
3.50%, 09/01/2030 1,383,000 1,486,234
14,127,728
Health Care REITs–1.07% CTR Partnership L.P./ CareTrust
Capital Corp., 3.88%,06/30/2028(b) 4,712,000 4,848,106
Diversified Healthcare Trust, 9.75%, 06/15/2025 169,000 186,111
4.38%, 03/01/2031 5,284,000 5,191,662
10,225,879
Health Care Services–4.48% Akumin, Inc., 7.00%,
11/01/2025(b) 10,567,000 9,990,570
Community Health Systems,Inc., 8.00%, 03/15/2026(b) 4,268,000 4,574,016
6.13%, 04/01/2030(b) 4,680,000 4,723,875
DaVita, Inc., 4.63%, 06/01/2030(b) 4,174,000 4,367,715
3.75%, 02/15/2031(b) 5,200,000 5,145,400
Global Medical Response, Inc.,6.50%, 10/01/2025(b) 2,404,000 2,482,130
Hadrian Merger Sub, Inc.,8.50%, 05/01/2026(b) 6,572,000 6,841,321
MEDNAX, Inc., 6.25%,01/15/2027(b) 4,420,000 4,663,100
RP Escrow Issuer LLC, 5.25%,12/15/2025(b) 179,000 183,419
42,971,546
Homebuilding–1.63% Ashton Woods USA LLC/Ashton
Woods Finance Co., 9.88%,04/01/2027(b) 7,864,000 8,725,501
Taylor Morrison Communities,Inc., 6.63%, 07/15/2027(b) 6,510,000 6,949,425
15,674,926
Hotels, Resorts & Cruise Lines–0.48% Carnival Corp., 10.50%,
02/01/2026(b) 4,011,000 4,632,785
Household Products–1.21% Energizer Holdings, Inc., 4.38%,
03/31/2029(b) 4,599,000 4,617,948
Prestige Brands, Inc., 3.75%,04/01/2031(b) 7,094,000 7,014,441
11,632,389
Independent Power Producers & Energy Traders–1.48% Calpine Corp., 3.75%,
03/01/2031(b) 4,782,000 4,696,307
Clearway Energy OperatingLLC, 4.75%, 03/15/2028(b) 5,172,000 5,482,061
3.75%, 02/15/2031(b) 3,963,000 4,032,313
14,210,681
Principal Amount Value
Industrial Machinery–1.21% Cleaver-Brooks, Inc., 7.88%,
03/01/2023(b) $ 1,603,000 $ 1,582,882
EnPro Industries, Inc., 5.75%,10/15/2026 4,670,000 4,910,529
Mueller Water Products, Inc.,4.00%, 06/15/2029(b) 4,904,000 5,111,537
11,604,948
Integrated Oil & Gas–1.51% Occidental Petroleum Corp.,
3.20%, 08/15/2026 1,684,000 1,740,153
8.50%, 07/15/2027 1,314,000 1,659,654
6.13%, 01/01/2031 3,959,000 4,792,746
6.20%, 03/15/2040 2,474,000 2,953,944
4.10%, 02/15/2047 3,430,000 3,358,364
14,504,861
Integrated Telecommunication Services–0.97% Altice France S.A. (France),
7.38%, 05/01/2026(b) 3,654,000 3,797,310
8.13%, 02/01/2027(b) 2,500,000 2,718,750
5.13%, 07/15/2029(b) 2,760,000 2,793,865
9,309,925
Interactive Media & Services–1.45% Audacy Capital Corp., 6.75%,
03/31/2029(b) 6,815,000 6,886,694
Scripps Escrow II, Inc., 3.88%, 01/15/2029(b) 4,667,000 4,697,475
5.38%, 01/15/2031(b) 2,350,000 2,329,009
13,913,178
Internet & Direct Marketing Retail–0.76% QVC, Inc.,
4.38%, 09/01/2028 2,216,000 2,273,671
5.45%, 08/15/2034 4,667,000 4,993,690
7,267,361
Investment Banking & Brokerage–0.71% NFP Corp.,
4.88%, 08/15/2028(b) 1,789,000 1,822,544
6.88%, 08/15/2028(b) 4,874,000 5,008,035
6,830,579
IT Consulting & Other Services–0.76% Gartner, Inc.,
4.50%, 07/01/2028(b) 4,677,000 4,957,620
3.63%, 06/15/2029(b) 2,248,000 2,317,238
7,274,858
Managed Health Care–0.98% Centene Corp.,
4.63%, 12/15/2029 1,697,000 1,863,544
3.00%, 10/15/2030 7,228,000 7,500,640
9,364,184
Metal & Glass Containers–1.21% Ardagh Metal Packaging Finance
USA LLC/Ardagh MetalPackaging Finance PLC,3.25%, 09/01/2028(b) 6,988,000 7,049,145
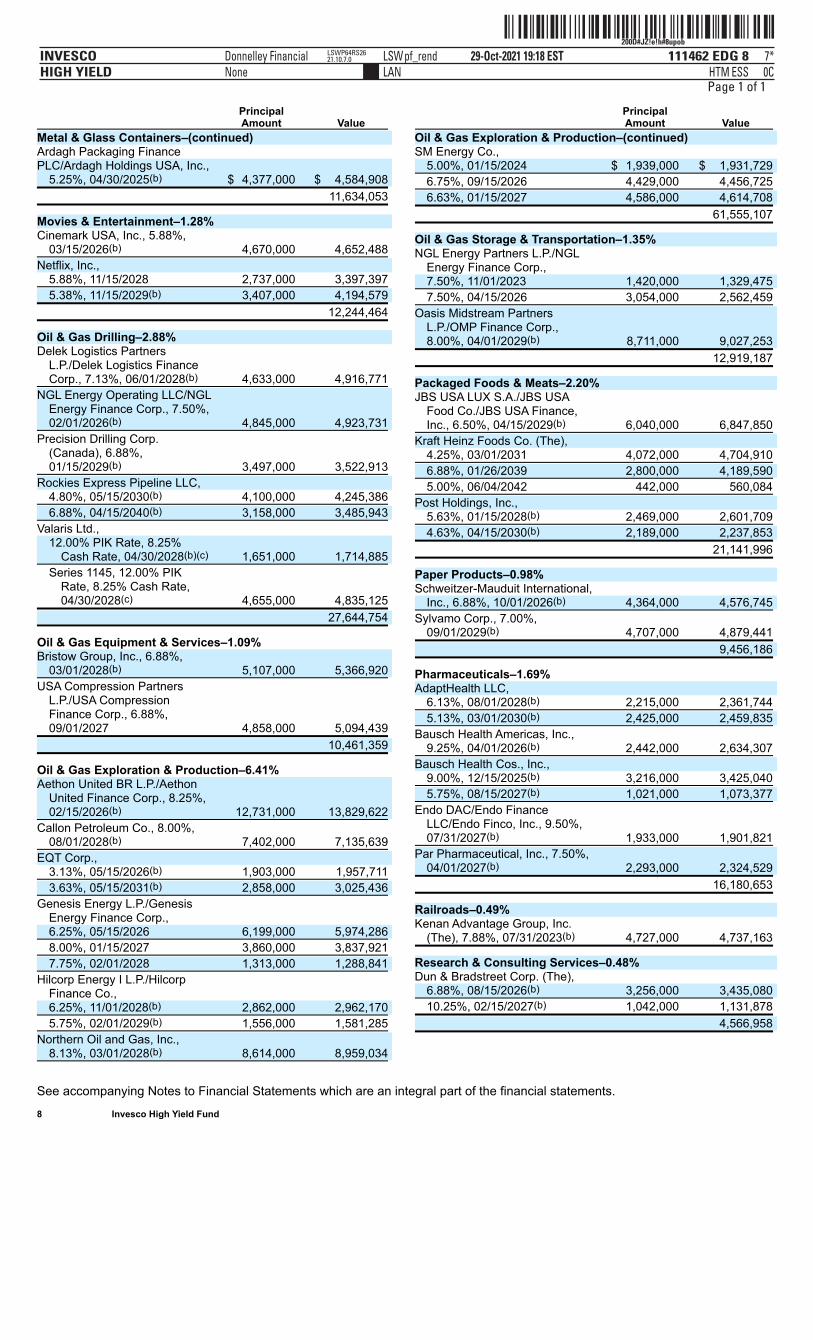
ˆ200D#JZ!e!h#8upobŠ200D#JZ!e!h#8upob
111462 EDG 8INVESCOHIGH YIELD
29-Oct-2021 19:18 ESTHTMLAN
Donnelley Financial LSWpf_rendNone
7*ESS 0C
LSWP64RS2621.10.7.0
Page 1 of 1
See accompanying Notes to Financial Statements which are an integral part of the financial statements. 8 Invesco High Yield Fund
Principal Amount Value
Metal & Glass Containers–(continued) Ardagh Packaging Finance PLC/Ardagh Holdings USA, Inc.,
5.25%, 04/30/2025(b) $ 4,377,000 $ 4,584,908
11,634,053
Movies & Entertainment–1.28% Cinemark USA, Inc., 5.88%,
03/15/2026(b) 4,670,000 4,652,488
Netflix, Inc., 5.88%, 11/15/2028 2,737,000 3,397,397
5.38%, 11/15/2029(b) 3,407,000 4,194,579
12,244,464
Oil & Gas Drilling–2.88% Delek Logistics Partners
L.P./Delek Logistics FinanceCorp., 7.13%, 06/01/2028(b) 4,633,000 4,916,771
NGL Energy Operating LLC/NGLEnergy Finance Corp., 7.50%,02/01/2026(b) 4,845,000 4,923,731
Precision Drilling Corp.(Canada), 6.88%,01/15/2029(b) 3,497,000 3,522,913
Rockies Express Pipeline LLC, 4.80%, 05/15/2030(b) 4,100,000 4,245,386
6.88%, 04/15/2040(b) 3,158,000 3,485,943
Valaris Ltd., 12.00% PIK Rate, 8.25%
Cash Rate, 04/30/2028(b)(c) 1,651,000 1,714,885
Series 1145, 12.00% PIKRate, 8.25% Cash Rate,04/30/2028(c) 4,655,000 4,835,125
27,644,754
Oil & Gas Equipment & Services–1.09% Bristow Group, Inc., 6.88%,
03/01/2028(b) 5,107,000 5,366,920
USA Compression PartnersL.P./USA CompressionFinance Corp., 6.88%,09/01/2027 4,858,000 5,094,439
10,461,359
Oil & Gas Exploration & Production–6.41% Aethon United BR L.P./Aethon
United Finance Corp., 8.25%,02/15/2026(b) 12,731,000 13,829,622
Callon Petroleum Co., 8.00%,08/01/2028(b) 7,402,000 7,135,639
EQT Corp., 3.13%, 05/15/2026(b) 1,903,000 1,957,711
3.63%, 05/15/2031(b) 2,858,000 3,025,436
Genesis Energy L.P./GenesisEnergy Finance Corp., 6.25%, 05/15/2026 6,199,000 5,974,286
8.00%, 01/15/2027 3,860,000 3,837,921
7.75%, 02/01/2028 1,313,000 1,288,841
Hilcorp Energy I L.P./HilcorpFinance Co., 6.25%, 11/01/2028(b) 2,862,000 2,962,170
5.75%, 02/01/2029(b) 1,556,000 1,581,285
Northern Oil and Gas, Inc.,8.13%, 03/01/2028(b) 8,614,000 8,959,034
Principal Amount Value
Oil & Gas Exploration & Production–(continued) SM Energy Co.,
5.00%, 01/15/2024 $ 1,939,000 $ 1,931,729
6.75%, 09/15/2026 4,429,000 4,456,725
6.63%, 01/15/2027 4,586,000 4,614,708
61,555,107
Oil & Gas Storage & Transportation–1.35% NGL Energy Partners L.P./NGL
Energy Finance Corp., 7.50%, 11/01/2023 1,420,000 1,329,475
7.50%, 04/15/2026 3,054,000 2,562,459
Oasis Midstream PartnersL.P./OMP Finance Corp.,8.00%, 04/01/2029(b) 8,711,000 9,027,253
12,919,187
Packaged Foods & Meats–2.20% JBS USA LUX S.A./JBS USA
Food Co./JBS USA Finance,Inc., 6.50%, 04/15/2029(b) 6,040,000 6,847,850
Kraft Heinz Foods Co. (The), 4.25%, 03/01/2031 4,072,000 4,704,910
6.88%, 01/26/2039 2,800,000 4,189,590
5.00%, 06/04/2042 442,000 560,084
Post Holdings, Inc., 5.63%, 01/15/2028(b) 2,469,000 2,601,709
4.63%, 04/15/2030(b) 2,189,000 2,237,853
21,141,996
Paper Products–0.98% Schweitzer-Mauduit International,
Inc., 6.88%, 10/01/2026(b) 4,364,000 4,576,745
Sylvamo Corp., 7.00%,09/01/2029(b) 4,707,000 4,879,441
9,456,186
Pharmaceuticals–1.69% AdaptHealth LLC,
6.13%, 08/01/2028(b) 2,215,000 2,361,744
5.13%, 03/01/2030(b) 2,425,000 2,459,835
Bausch Health Americas, Inc.,9.25%, 04/01/2026(b) 2,442,000 2,634,307
Bausch Health Cos., Inc., 9.00%, 12/15/2025(b) 3,216,000 3,425,040
5.75%, 08/15/2027(b) 1,021,000 1,073,377
Endo DAC/Endo FinanceLLC/Endo Finco, Inc., 9.50%,07/31/2027(b) 1,933,000 1,901,821
Par Pharmaceutical, Inc., 7.50%,04/01/2027(b) 2,293,000 2,324,529
16,180,653
Railroads–0.49% Kenan Advantage Group, Inc.
(The), 7.88%, 07/31/2023(b) 4,727,000 4,737,163
Research & Consulting Services–0.48% Dun & Bradstreet Corp. (The),
6.88%, 08/15/2026(b) 3,256,000 3,435,080
10.25%, 02/15/2027(b) 1,042,000 1,131,878
4,566,958
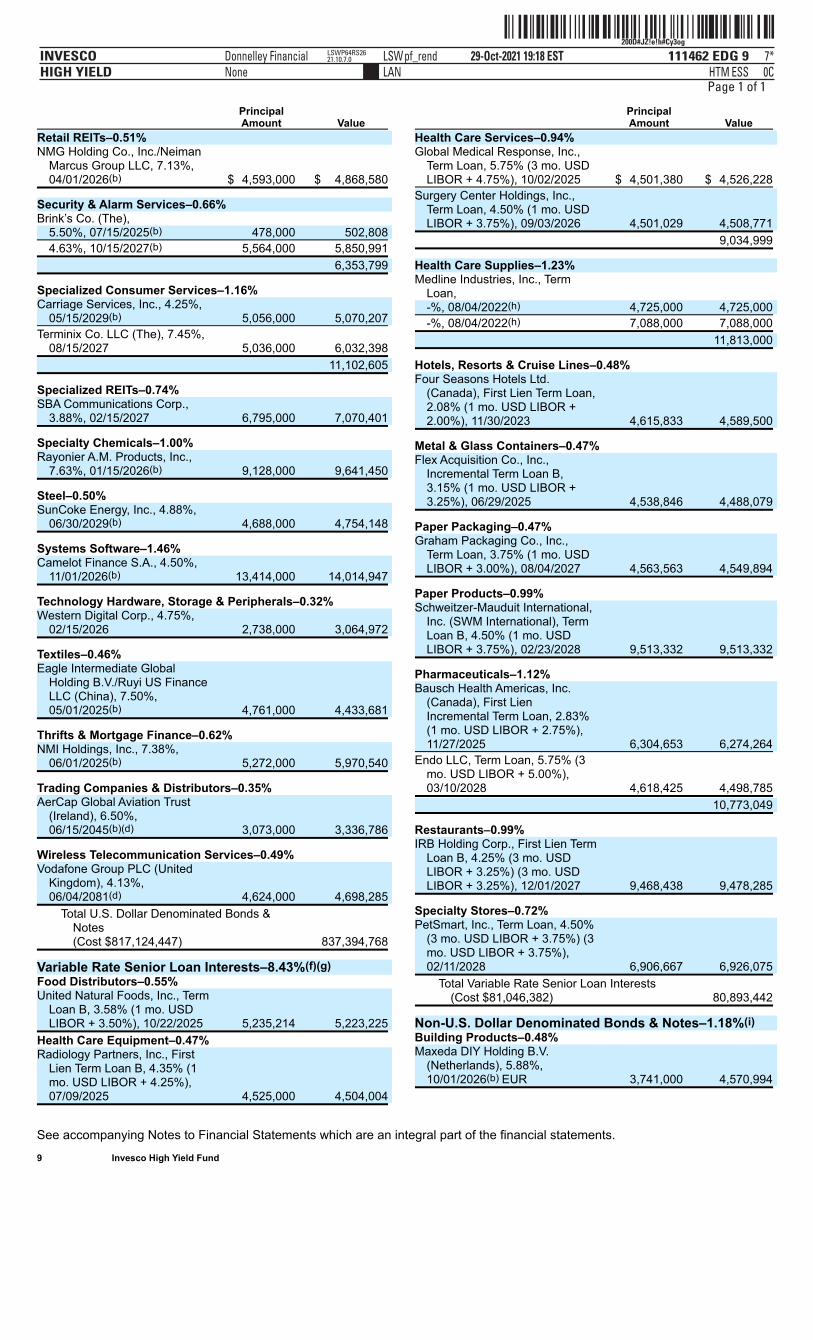
ˆ200D#JZ!e!h#Cy3ogŠ200D#JZ!e!h#Cy3og
111462 EDG 9INVESCOHIGH YIELD
29-Oct-2021 19:18 ESTHTMLAN
Donnelley Financial LSWpf_rendNone
7*ESS 0C
LSWP64RS2621.10.7.0
Page 1 of 1
See accompanying Notes to Financial Statements which are an integral part of the financial statements. 9 Invesco High Yield Fund
Principal Amount Value
Retail REITs–0.51% NMG Holding Co., Inc./Neiman
Marcus Group LLC, 7.13%,04/01/2026(b) $ 4,593,000 $ 4,868,580
Security & Alarm Services–0.66% Brink’s Co. (The),
5.50%, 07/15/2025(b) 478,000 502,808
4.63%, 10/15/2027(b) 5,564,000 5,850,991
6,353,799
Specialized Consumer Services–1.16% Carriage Services, Inc., 4.25%,
05/15/2029(b) 5,056,000 5,070,207
Terminix Co. LLC (The), 7.45%,08/15/2027 5,036,000 6,032,398
11,102,605
Specialized REITs–0.74% SBA Communications Corp.,
3.88%, 02/15/2027 6,795,000 7,070,401
Specialty Chemicals–1.00% Rayonier A.M. Products, Inc.,
7.63%, 01/15/2026(b) 9,128,000 9,641,450
Steel–0.50% SunCoke Energy, Inc., 4.88%,
06/30/2029(b) 4,688,000 4,754,148
Systems Software–1.46% Camelot Finance S.A., 4.50%,
11/01/2026(b) 13,414,000 14,014,947
Technology Hardware, Storage & Peripherals–0.32% Western Digital Corp., 4.75%,
02/15/2026 2,738,000 3,064,972
Textiles–0.46% Eagle Intermediate Global
Holding B.V./Ruyi US FinanceLLC (China), 7.50%,05/01/2025(b) 4,761,000 4,433,681
Thrifts & Mortgage Finance–0.62% NMI Holdings, Inc., 7.38%,
06/01/2025(b) 5,272,000 5,970,540
Trading Companies & Distributors–0.35% AerCap Global Aviation Trust
(Ireland), 6.50%,06/15/2045(b)(d) 3,073,000 3,336,786
Wireless Telecommunication Services–0.49% Vodafone Group PLC (United
Kingdom), 4.13%,06/04/2081(d) 4,624,000 4,698,285
Total U.S. Dollar Denominated Bonds &Notes(Cost $817,124,447)
837,394,768
Variable Rate Senior Loan Interests–8.43%(f)(g) Food Distributors–0.55% United Natural Foods, Inc., Term
Loan B, 3.58% (1 mo. USDLIBOR + 3.50%), 10/22/2025 5,235,214 5,223,225
Health Care Equipment–0.47% Radiology Partners, Inc., First
Lien Term Loan B, 4.35% (1mo. USD LIBOR + 4.25%),07/09/2025 4,525,000 4,504,004
Principal Amount Value
Health Care Services–0.94% Global Medical Response, Inc.,
Term Loan, 5.75% (3 mo. USDLIBOR + 4.75%), 10/02/2025 $ 4,501,380 $ 4,526,228
Surgery Center Holdings, Inc.,Term Loan, 4.50% (1 mo. USDLIBOR + 3.75%), 09/03/2026 4,501,029 4,508,771
9,034,999
Health Care Supplies–1.23% Medline Industries, Inc., Term
Loan, -%, 08/04/2022(h) 4,725,000 4,725,000
-%, 08/04/2022(h) 7,088,000 7,088,000
11,813,000
Hotels, Resorts & Cruise Lines–0.48% Four Seasons Hotels Ltd.
(Canada), First Lien Term Loan,2.08% (1 mo. USD LIBOR +2.00%), 11/30/2023 4,615,833 4,589,500
Metal & Glass Containers–0.47% Flex Acquisition Co., Inc.,
Incremental Term Loan B,3.15% (1 mo. USD LIBOR +3.25%), 06/29/2025 4,538,846 4,488,079
Paper Packaging–0.47% Graham Packaging Co., Inc.,
Term Loan, 3.75% (1 mo. USDLIBOR + 3.00%), 08/04/2027 4,563,563 4,549,894
Paper Products–0.99% Schweitzer-Mauduit International,
Inc. (SWM International), TermLoan B, 4.50% (1 mo. USDLIBOR + 3.75%), 02/23/2028 9,513,332 9,513,332
Pharmaceuticals–1.12% Bausch Health Americas, Inc.
(Canada), First LienIncremental Term Loan, 2.83%(1 mo. USD LIBOR + 2.75%),11/27/2025 6,304,653 6,274,264
Endo LLC, Term Loan, 5.75% (3mo. USD LIBOR + 5.00%),03/10/2028 4,618,425 4,498,785
10,773,049
Restaurants–0.99% IRB Holding Corp., First Lien Term
Loan B, 4.25% (3 mo. USDLIBOR + 3.25%) (3 mo. USDLIBOR + 3.25%), 12/01/2027 9,468,438 9,478,285
Specialty Stores–0.72% PetSmart, Inc., Term Loan, 4.50%
(3 mo. USD LIBOR + 3.75%) (3mo. USD LIBOR + 3.75%),02/11/2028 6,906,667 6,926,075
Total Variable Rate Senior Loan Interests(Cost $81,046,382)
80,893,442
Non-U.S. Dollar Denominated Bonds & Notes–1.18%(i) Building Products–0.48% Maxeda DIY Holding B.V.
(Netherlands), 5.88%,10/01/2026(b) EUR 3,741,000 4,570,994
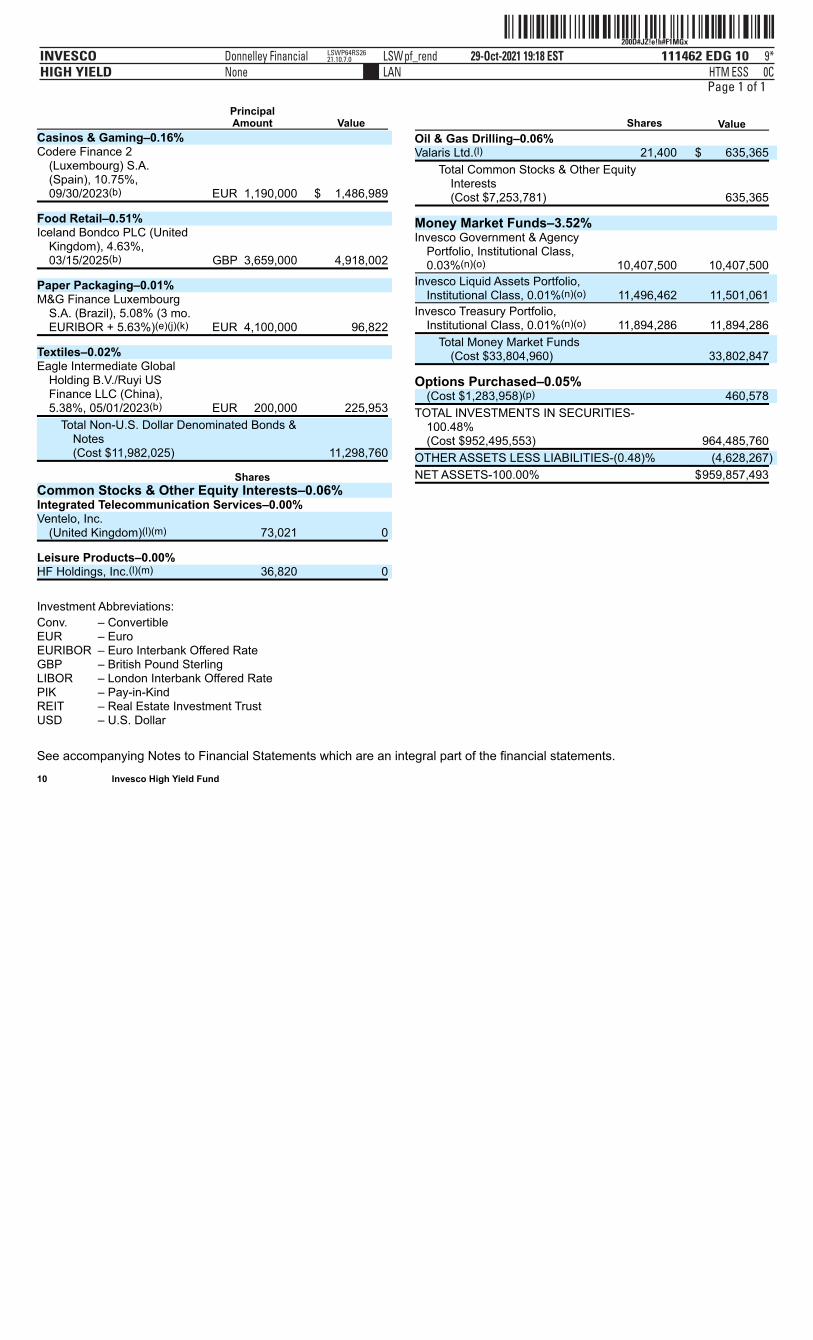
ˆ200D#JZ!e!h#F1MGxŠ200D#JZ!e!h#F1MGx
111462 EDG 10INVESCOHIGH YIELD
29-Oct-2021 19:18 ESTHTMLAN
Donnelley Financial LSWpf_rendNone
9*ESS 0C
LSWP64RS2621.10.7.0
Page 1 of 1
See accompanying Notes to Financial Statements which are an integral part of the financial statements. 10 Invesco High Yield Fund
Principal Amount Value
Casinos & Gaming–0.16% Codere Finance 2
(Luxembourg) S.A.(Spain), 10.75%,09/30/2023(b) EUR 1,190,000 $ 1,486,989
Food Retail–0.51% Iceland Bondco PLC (United
Kingdom), 4.63%,03/15/2025(b) GBP 3,659,000 4,918,002
Paper Packaging–0.01% M&G Finance Luxembourg
S.A. (Brazil), 5.08% (3 mo.EURIBOR + 5.63%)(e)(j)(k) EUR 4,100,000 96,822
Textiles–0.02% Eagle Intermediate Global
Holding B.V./Ruyi USFinance LLC (China),5.38%, 05/01/2023(b) EUR 200,000 225,953
Total Non-U.S. Dollar Denominated Bonds &Notes(Cost $11,982,025)
11,298,760
Shares Common Stocks & Other Equity Interests–0.06% Integrated Telecommunication Services–0.00% Ventelo, Inc.
(United Kingdom)(l)(m) 73,021 0
Leisure Products–0.00% HF Holdings, Inc.(l)(m) 36,820 0
Investment Abbreviations:Conv. – ConvertibleEUR – EuroEURIBOR – Euro Interbank Offered RateGBP – British Pound SterlingLIBOR – London Interbank Offered RatePIK – Pay-in-KindREIT – Real Estate Investment TrustUSD – U.S. Dollar
Shares Value
Oil & Gas Drilling–0.06% Valaris Ltd.(l) 21,400 $ 635,365
Total Common Stocks & Other EquityInterests(Cost $7,253,781)
635,365
Money Market Funds–3.52% Invesco Government & Agency
Portfolio, Institutional Class,0.03%(n)(o) 10,407,500 10,407,500
Invesco Liquid Assets Portfolio,Institutional Class, 0.01%(n)(o) 11,496,462 11,501,061
Invesco Treasury Portfolio,Institutional Class, 0.01%(n)(o) 11,894,286 11,894,286
Total Money Market Funds(Cost $33,804,960)
33,802,847
Options Purchased–0.05% (Cost $1,283,958)(p) 460,578
TOTAL INVESTMENTS IN SECURITIES-100.48%(Cost $952,495,553)
964,485,760
OTHER ASSETS LESS LIABILITIES-(0.48)% (4,628,267)
NET ASSETS-100.00% $959,857,493
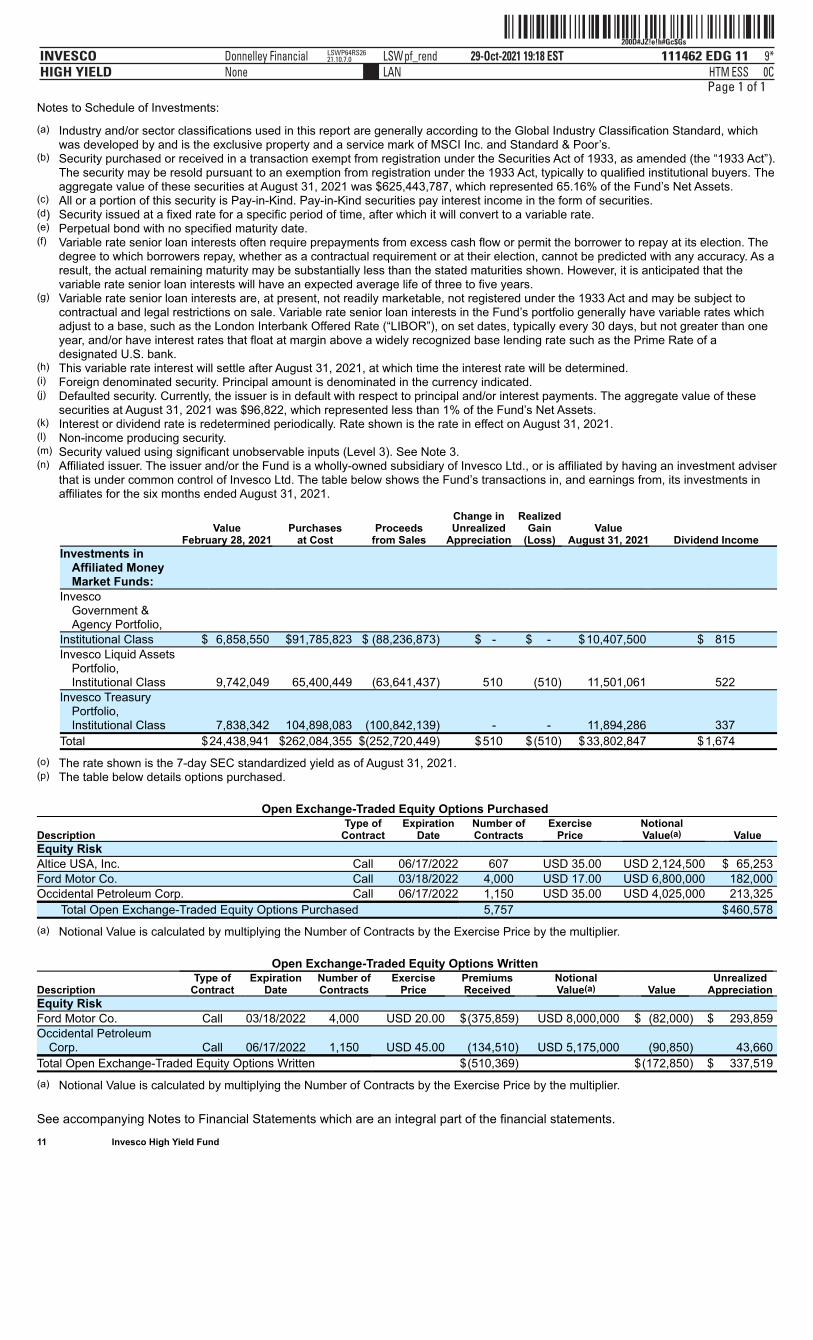
ˆ200D#JZ!e!h#Gc$GsŠ200D#JZ!e!h#Gc$Gs
111462 EDG 11INVESCOHIGH YIELD
29-Oct-2021 19:18 ESTHTMLAN
Donnelley Financial LSWpf_rendNone
9*ESS 0C
LSWP64RS2621.10.7.0
Page 1 of 1Notes to Schedule of Investments:
(a) Industry and/or sector classifications used in this report are generally according to the Global Industry Classification Standard, whichwas developed by and is the exclusive property and a service mark of MSCI Inc. and Standard & Poor’s.
(b) Security purchased or received in a transaction exempt from registration under the Securities Act of 1933, as amended (the “1933 Act”).The security may be resold pursuant to an exemption from registration under the 1933 Act, typically to qualified institutional buyers. Theaggregate value of these securities at August 31, 2021 was $625,443,787, which represented 65.16% of the Fund’s Net Assets.
(c) All or a portion of this security is Pay-in-Kind. Pay-in-Kind securities pay interest income in the form of securities.(d) Security issued at a fixed rate for a specific period of time, after which it will convert to a variable rate.(e) Perpetual bond with no specified maturity date.(f) Variable rate senior loan interests often require prepayments from excess cash flow or permit the borrower to repay at its election. The
degree to which borrowers repay, whether as a contractual requirement or at their election, cannot be predicted with any accuracy. As aresult, the actual remaining maturity may be substantially less than the stated maturities shown. However, it is anticipated that thevariable rate senior loan interests will have an expected average life of three to five years.
(g) Variable rate senior loan interests are, at present, not readily marketable, not registered under the 1933 Act and may be subject tocontractual and legal restrictions on sale. Variable rate senior loan interests in the Fund’s portfolio generally have variable rates whichadjust to a base, such as the London Interbank Offered Rate (“LIBOR”), on set dates, typically every 30 days, but not greater than oneyear, and/or have interest rates that float at margin above a widely recognized base lending rate such as the Prime Rate of adesignated U.S. bank.
(h) This variable rate interest will settle after August 31, 2021, at which time the interest rate will be determined.(i) Foreign denominated security. Principal amount is denominated in the currency indicated.(j) Defaulted security. Currently, the issuer is in default with respect to principal and/or interest payments. The aggregate value of these
securities at August 31, 2021 was $96,822, which represented less than 1% of the Fund’s Net Assets.(k) Interest or dividend rate is redetermined periodically. Rate shown is the rate in effect on August 31, 2021.(l) Non-income producing security.(m) Security valued using significant unobservable inputs (Level 3). See Note 3.(n) Affiliated issuer. The issuer and/or the Fund is a wholly-owned subsidiary of Invesco Ltd., or is affiliated by having an investment adviser
that is under common control of Invesco Ltd. The table below shows the Fund’s transactions in, and earnings from, its investments inaffiliates for the six months ended August 31, 2021.
Value
February 28, 2021 Purchases
at Cost Proceeds
from Sales
Change inUnrealized
Appreciation
RealizedGain
(Loss) Value
August 31, 2021 Dividend IncomeInvestments in
Affiliated MoneyMarket Funds:
InvescoGovernment &Agency Portfolio,
Institutional Class $ 6,858,550 $91,785,823 $ (88,236,873) $ - $ - $10,407,500 $ 815Invesco Liquid Assets
Portfolio,Institutional Class 9,742,049 65,400,449 (63,641,437) 510 (510) 11,501,061 522
Invesco TreasuryPortfolio,Institutional Class 7,838,342 104,898,083 (100,842,139) - - 11,894,286 337
Total $24,438,941 $262,084,355 $(252,720,449) $510 $(510) $33,802,847 $1,674
(o) The rate shown is the 7-day SEC standardized yield as of August 31, 2021.(p) The table below details options purchased.
Open Exchange-Traded Equity Options Purchased
Description Type of
Contract Expiration
Date Number ofContracts
ExercisePrice
NotionalValue(a) Value
Equity Risk Altice USA, Inc. Call 06/17/2022 607 USD 35.00 USD 2,124,500 $ 65,253 Ford Motor Co. Call 03/18/2022 4,000 USD 17.00 USD 6,800,000 182,000 Occidental Petroleum Corp. Call 06/17/2022 1,150 USD 35.00 USD 4,025,000 213,325
Total Open Exchange-Traded Equity Options Purchased 5,757 $460,578
(a) Notional Value is calculated by multiplying the Number of Contracts by the Exercise Price by the multiplier.
Open Exchange-Traded Equity Options Written
Description Type of
Contract Expiration
Date Number ofContracts
ExercisePrice
PremiumsReceived
NotionalValue(a) Value
UnrealizedAppreciation
Equity Risk Ford Motor Co. Call 03/18/2022 4,000 USD 20.00 $(375,859) USD 8,000,000 $ (82,000) $ 293,859 Occidental Petroleum
Corp. Call 06/17/2022 1,150 USD 45.00 (134,510) USD 5,175,000 (90,850) 43,660 Total Open Exchange-Traded Equity Options Written $(510,369) $(172,850) $ 337,519
(a) Notional Value is calculated by multiplying the Number of Contracts by the Exercise Price by the multiplier.
See accompanying Notes to Financial Statements which are an integral part of the financial statements. 11 Invesco High Yield Fund
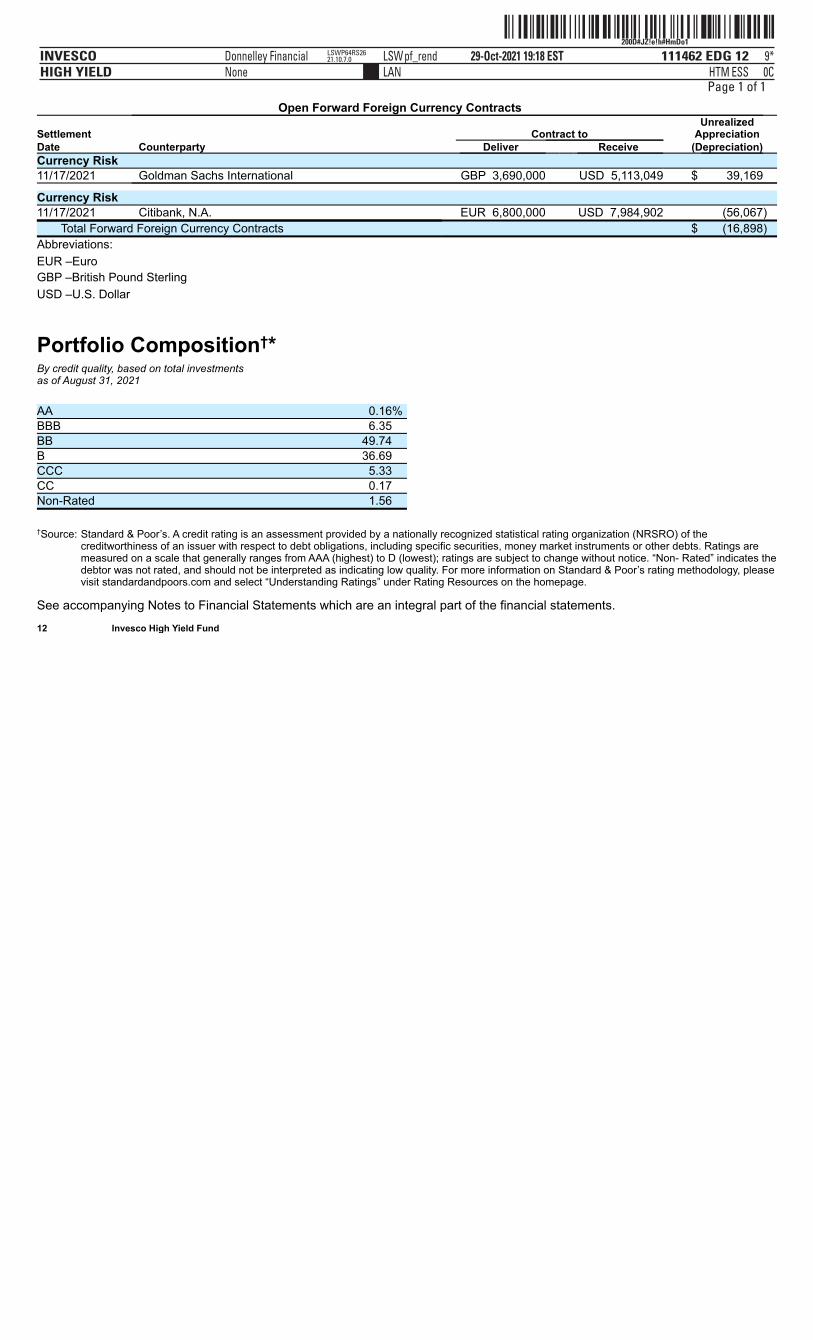
ˆ200D#JZ!e!h#HmDo1Š200D#JZ!e!h#HmDo1
111462 EDG 12INVESCOHIGH YIELD
29-Oct-2021 19:18 ESTHTMLAN
Donnelley Financial LSWpf_rendNone
9*ESS 0C
LSWP64RS2621.10.7.0
Page 1 of 1Open Forward Foreign Currency Contracts
Settlement Contract to Unrealized
Appreciation Date Counterparty Deliver Receive (Depreciation) Currency Risk 11/17/2021 Goldman Sachs International GBP 3,690,000 USD 5,113,049 $ 39,169
Currency Risk 11/17/2021 Citibank, N.A. EUR 6,800,000 USD 7,984,902 (56,067)
Total Forward Foreign Currency Contracts $ (16,898) Abbreviations:EUR –EuroGBP –British Pound SterlingUSD –U.S. Dollar
Portfolio Composition†*By credit quality, based on total investmentsas of August 31, 2021 AA 0.16% BBB 6.35 BB 49.74 B 36.69 CCC 5.33 CC 0.17 Non-Rated 1.56 †Source: Standard & Poor’s. A credit rating is an assessment provided by a nationally recognized statistical rating organization (NRSRO) of the
creditworthiness of an issuer with respect to debt obligations, including specific securities, money market instruments or other debts. Ratings aremeasured on a scale that generally ranges from AAA (highest) to D (lowest); ratings are subject to change without notice. “Non- Rated” indicates thedebtor was not rated, and should not be interpreted as indicating low quality. For more information on Standard & Poor’s rating methodology, pleasevisit standardandpoors.com and select “Understanding Ratings” under Rating Resources on the homepage.
See accompanying Notes to Financial Statements which are an integral part of the financial statements. 12 Invesco High Yield Fund
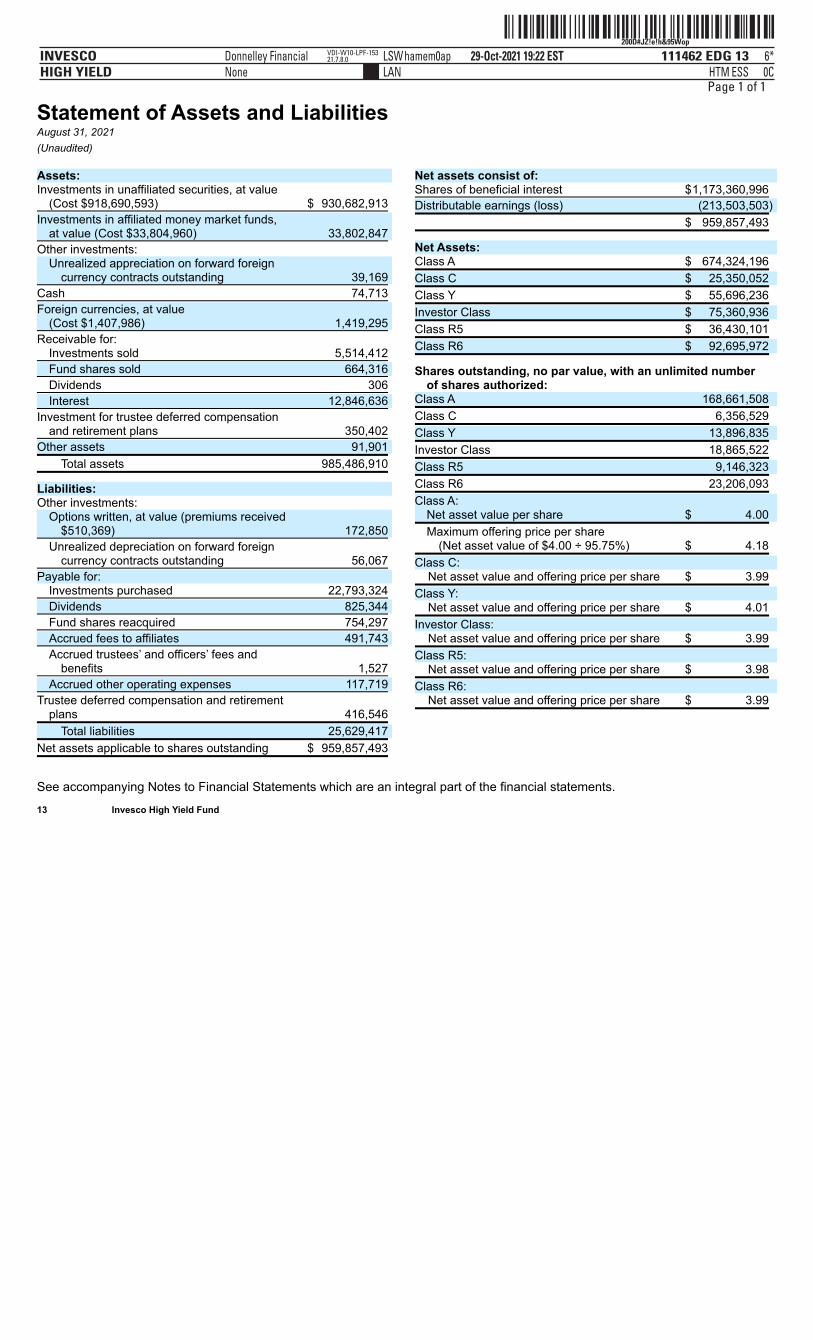
ˆ200D#JZ!e!h&95WopŠ200D#JZ!e!h&95Wop
111462 EDG 13INVESCOHIGH YIELD
29-Oct-2021 19:22 ESTHTMLAN
Donnelley Financial LSWhamem0apNone
6*ESS 0C
VDI-W10-LPF-15321.7.8.0
Page 1 of 1
Statement of Assets and LiabilitiesAugust 31, 2021(Unaudited)
See accompanying Notes to Financial Statements which are an integral part of the financial statements. 13 Invesco High Yield Fund
Assets: Investments in unaffiliated securities, at value
(Cost $918,690,593) $ 930,682,913
Investments in affiliated money market funds,at value (Cost $33,804,960) 33,802,847
Other investments: Unrealized appreciation on forward foreign
currency contracts outstanding 39,169
Cash 74,713
Foreign currencies, at value(Cost $1,407,986) 1,419,295
Receivable for:Investments sold 5,514,412
Fund shares sold 664,316
Dividends 306
Interest 12,846,636
Investment for trustee deferred compensationand retirement plans 350,402
Other assets 91,901
Total assets 985,486,910
Liabilities: Other investments:
Options written, at value (premiums received$510,369) 172,850
Unrealized depreciation on forward foreigncurrency contracts outstanding 56,067
Payable for: Investments purchased 22,793,324
Dividends 825,344
Fund shares reacquired 754,297
Accrued fees to affiliates 491,743
Accrued trustees’ and officers’ fees andbenefits 1,527
Accrued other operating expenses 117,719
Trustee deferred compensation and retirementplans 416,546
Total liabilities 25,629,417
Net assets applicable to shares outstanding $ 959,857,493
Net assets consist of: Shares of beneficial interest $1,173,360,996
Distributable earnings (loss) (213,503,503)
$ 959,857,493
Net Assets: Class A $ 674,324,196
Class C $ 25,350,052
Class Y $ 55,696,236
Investor Class $ 75,360,936
Class R5 $ 36,430,101
Class R6 $ 92,695,972
Shares outstanding, no par value, with an unlimited numberof shares authorized:
Class A 168,661,508
Class C 6,356,529
Class Y 13,896,835
Investor Class 18,865,522
Class R5 9,146,323
Class R6 23,206,093
Class A:Net asset value per share $ 4.00
Maximum offering price per share(Net asset value of $4.00 ÷ 95.75%) $ 4.18
Class C: Net asset value and offering price per share $ 3.99
Class Y: Net asset value and offering price per share $ 4.01
Investor Class: Net asset value and offering price per share $ 3.99
Class R5: Net asset value and offering price per share $ 3.98
Class R6: Net asset value and offering price per share $ 3.99
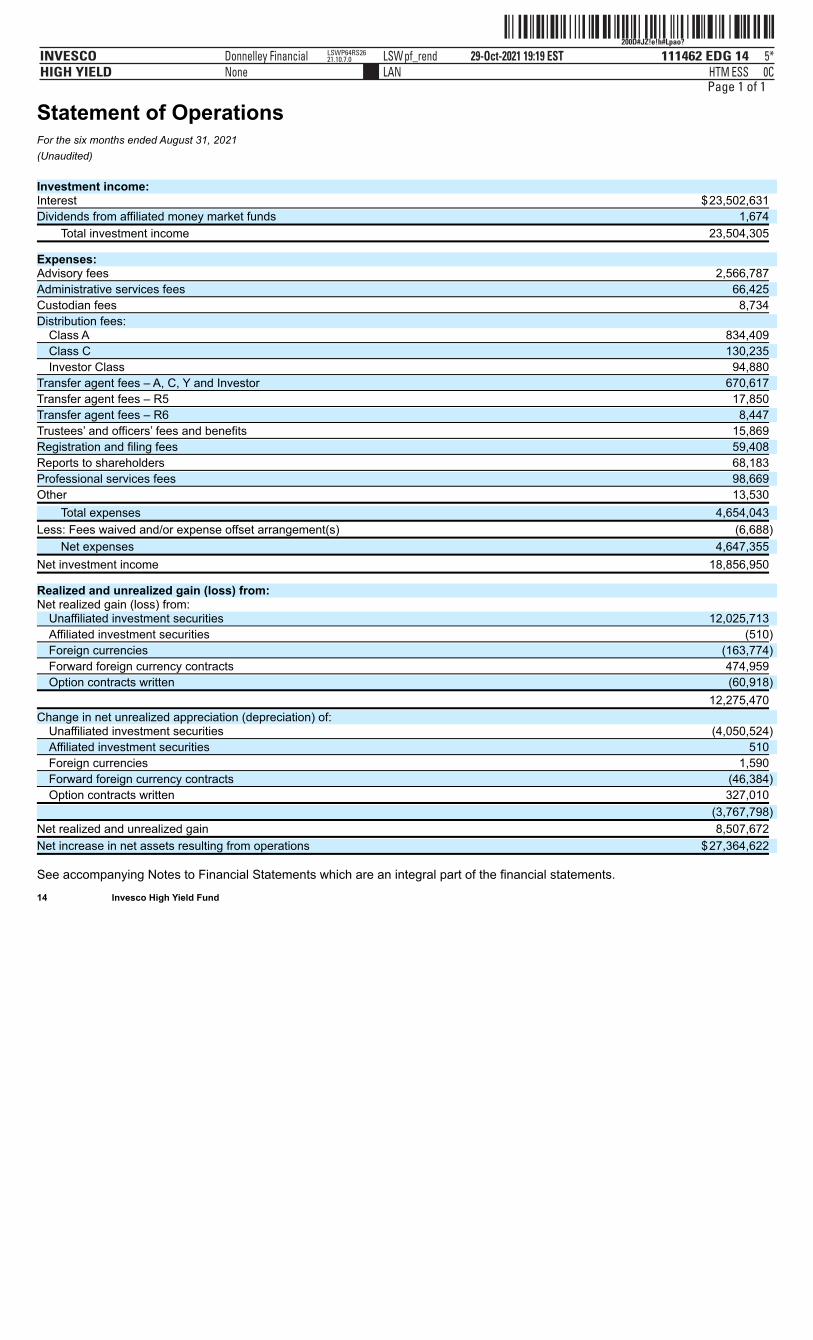
ˆ200D#JZ!e!h#Lpao?Š200D#JZ!e!h#Lpao?
111462 EDG 14INVESCOHIGH YIELD
29-Oct-2021 19:19 ESTHTMLAN
Donnelley Financial LSWpf_rendNone
5*ESS 0C
LSWP64RS2621.10.7.0
Page 1 of 1
Statement of OperationsFor the six months ended August 31, 2021(Unaudited) Investment income: Interest $23,502,631
Dividends from affiliated money market funds 1,674
Total investment income 23,504,305
Expenses: Advisory fees 2,566,787
Administrative services fees 66,425
Custodian fees 8,734
Distribution fees: Class A 834,409
Class C 130,235
Investor Class 94,880
Transfer agent fees – A, C, Y and Investor 670,617
Transfer agent fees – R5 17,850
Transfer agent fees – R6 8,447
Trustees’ and officers’ fees and benefits 15,869
Registration and filing fees 59,408
Reports to shareholders 68,183
Professional services fees 98,669
Other 13,530
Total expenses 4,654,043
Less: Fees waived and/or expense offset arrangement(s) (6,688)
Net expenses 4,647,355
Net investment income 18,856,950
Realized and unrealized gain (loss) from: Net realized gain (loss) from:
Unaffiliated investment securities 12,025,713
Affiliated investment securities (510)
Foreign currencies (163,774)
Forward foreign currency contracts 474,959
Option contracts written (60,918)
12,275,470
Change in net unrealized appreciation (depreciation) of: Unaffiliated investment securities (4,050,524)
Affiliated investment securities 510
Foreign currencies 1,590
Forward foreign currency contracts (46,384)
Option contracts written 327,010
(3,767,798)
Net realized and unrealized gain 8,507,672
Net increase in net assets resulting from operations $27,364,622
See accompanying Notes to Financial Statements which are an integral part of the financial statements. 14 Invesco High Yield Fund
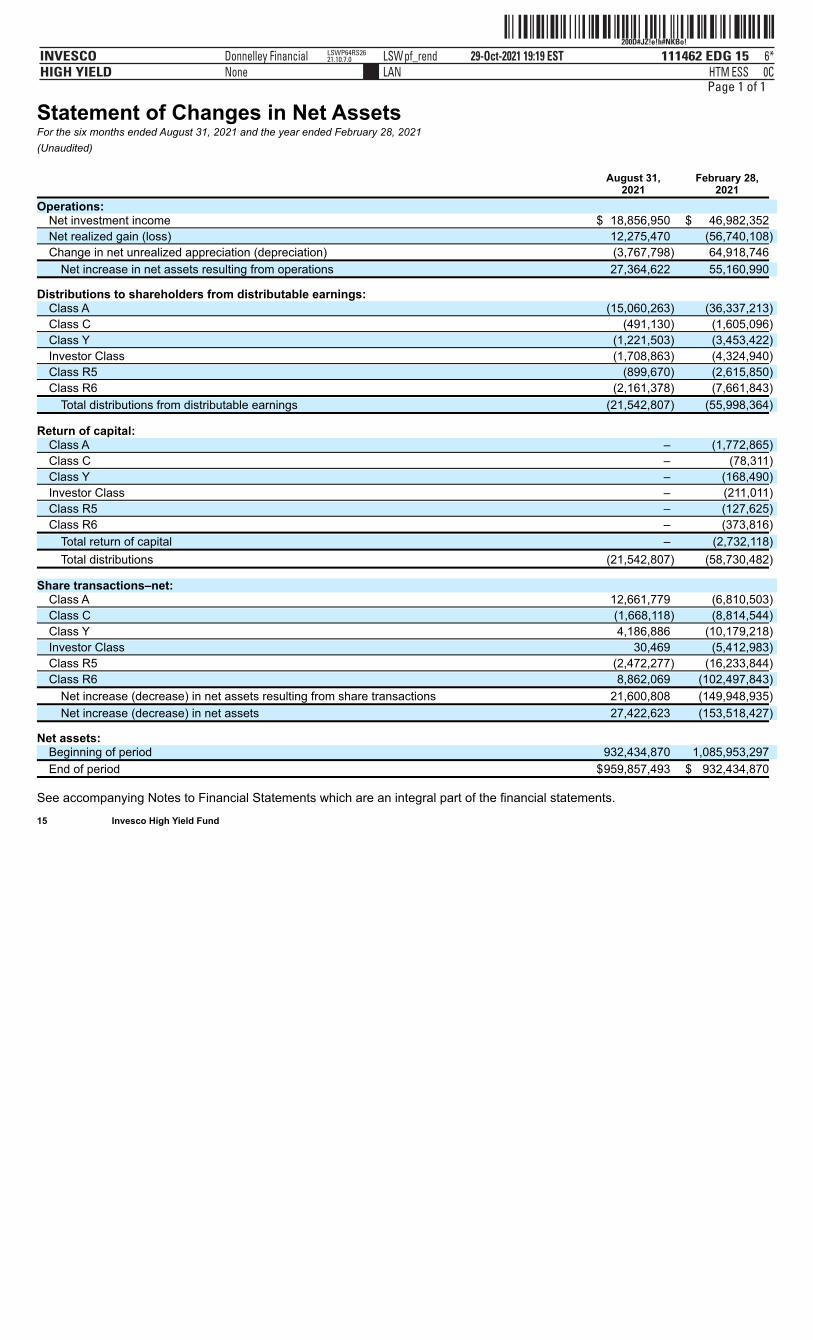
ˆ200D#JZ!e!h#NKBo!Š200D#JZ!e!h#NKBo!
111462 EDG 15INVESCOHIGH YIELD
29-Oct-2021 19:19 ESTHTMLAN
Donnelley Financial LSWpf_rendNone
6*ESS 0C
LSWP64RS2621.10.7.0
Page 1 of 1
Statement of Changes in Net AssetsFor the six months ended August 31, 2021 and the year ended February 28, 2021(Unaudited)
August 31,
2021 February 28,
2021
Operations: Net investment income $ 18,856,950 $ 46,982,352
Net realized gain (loss) 12,275,470 (56,740,108)
Change in net unrealized appreciation (depreciation) (3,767,798) 64,918,746
Net increase in net assets resulting from operations 27,364,622 55,160,990
Distributions to shareholders from distributable earnings: Class A (15,060,263) (36,337,213)
Class C (491,130) (1,605,096)
Class Y (1,221,503) (3,453,422)
Investor Class (1,708,863) (4,324,940)
Class R5 (899,670) (2,615,850)
Class R6 (2,161,378) (7,661,843)
Total distributions from distributable earnings (21,542,807) (55,998,364)
Return of capital: Class A – (1,772,865)
Class C – (78,311)
Class Y – (168,490)
Investor Class – (211,011)
Class R5 – (127,625)
Class R6 – (373,816)
Total return of capital – (2,732,118)
Total distributions (21,542,807) (58,730,482)
Share transactions–net: Class A 12,661,779 (6,810,503)
Class C (1,668,118) (8,814,544)
Class Y 4,186,886 (10,179,218)
Investor Class 30,469 (5,412,983)
Class R5 (2,472,277) (16,233,844)
Class R6 8,862,069 (102,497,843)
Net increase (decrease) in net assets resulting from share transactions 21,600,808 (149,948,935)
Net increase (decrease) in net assets 27,422,623 (153,518,427)
Net assets: Beginning of period 932,434,870 1,085,953,297
End of period $959,857,493 $ 932,434,870
See accompanying Notes to Financial Statements which are an integral part of the financial statements. 15 Invesco High Yield Fund
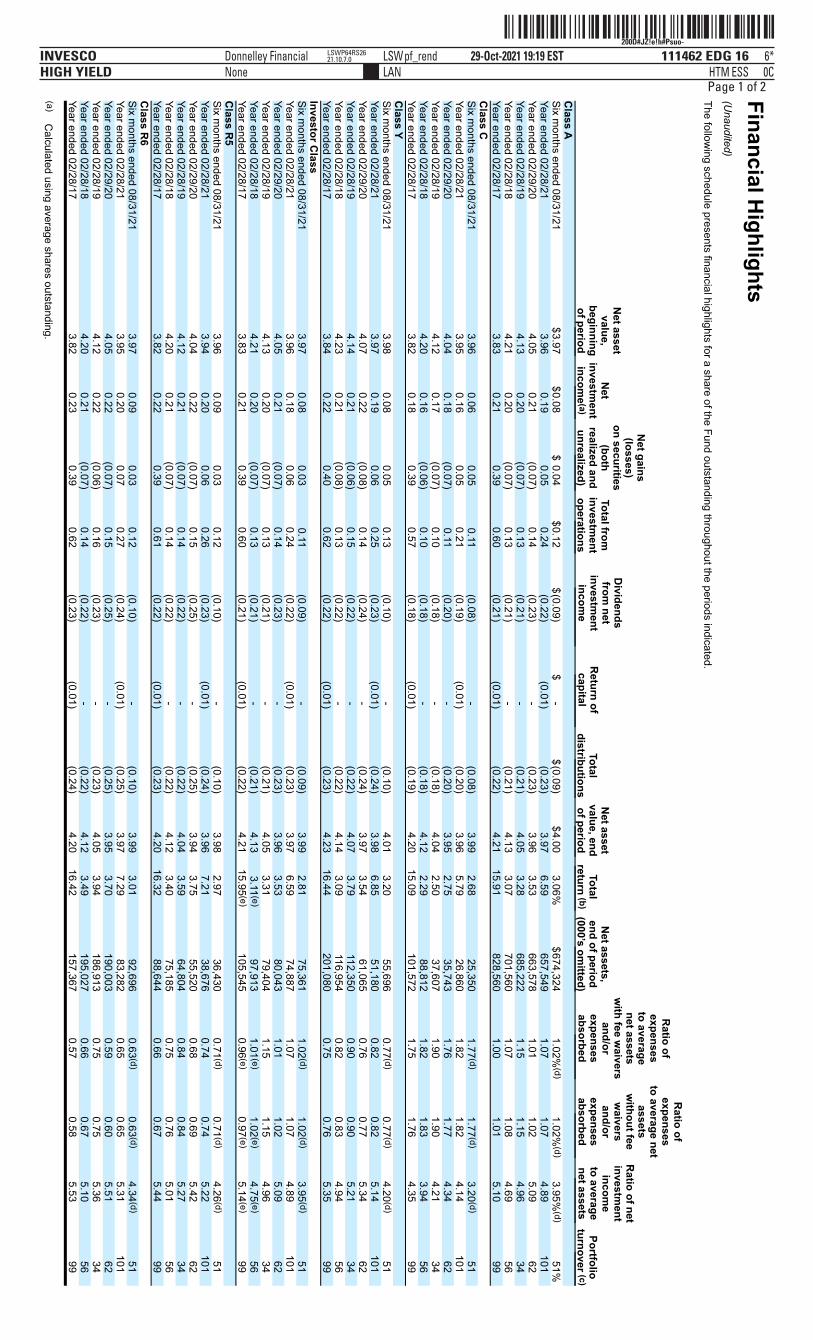
ˆ200D#JZ!e!h#Psuo-Š200D#JZ!e!h#Psuo-
111462 EDG 16INVESCOHIGH YIELD
29-Oct-2021 19:19 ESTHTMLAN
Donnelley Financial LSWpf_rendNone
6*ESS 0C
LSWP64RS2621.10.7.0
Page 1 of 2Financial Highlights
(Unaudited)
The following schedule presents financial highlights for a share of the Fund outstanding throughout the periods indicated.
Net assetvalue,
beginningof period
Net
investment
income (a)
Net gains
(losses)on securities
(bothrealized andunrealized)
Total frominvestm
entoperations
Dividends
from net
investment
income
R
eturn ofcapital
Total
distributions
Net asset
value, endof period
Total
return (b)
Net assets,
end of period(000’s om
itted)
Ratio of
expensesto averagenet assets
with fee w
aiversand/or
expensesabsorbed
Ratio of
expensesto average net
assetsw
ithout feew
aiversand/or
expensesabsorbed
Ratio of net
investment
income
to averagenet assets
Portfolio
turnover (c)C
lass A
Six m
onths ended 08/31/21
$3.97
$0.08
$0.04
$0.12
$(0.09)
$
-
$(0.09)
$4.00
3.06%
$674,324 1.02%
(d) 1.02%
(d) 3.95%
(d)
51%Year ended 02/28/21
3.96
0.19
0.05
0.24
(0.22)
(0.01)
(0.23)
3.97
6.59
657,549 1.07
1.07
4.89
101
Year ended 02/29/20
4.05
0.21
(0.07) 0.14
(0.23)
-
(0.23)
3.96
3.53
663,578 1.01
1.02
5.09
62Year ended 02/28/19
4.13
0.20
(0.07)
0.13
(0.21)
-
(0.21)
4.05
3.28
685,222
1.15
1.15
4.96
34
Year ended 02/28/18
4.21
0.20
(0.07) 0.13
(0.21)
-
(0.21)
4.13
3.07
701,560 1.07
1.08
4.69
56Year ended 02/28/17
3.83
0.21
0.39
0.60
(0.21)
(0.01)
(0.22)
4.21 15.91
828,560
1.00
1.01
5.10
99
Class C
Six months ended 08/31/21
3.96
0.06
0.05
0.11
(0.08)
-
(0.08)
3.99
2.68
25,350 1.77 (d)
1.77 (d)
3.20 (d)
51Year ended 02/28/21
3.95
0.16
0.05
0.21
(0.19)
(0.01)
(0.20)
3.96
5.79
26,860
1.82
1.82
4.14
101Year ended 02/29/20
4.04
0.18
(0.07)
0.11
(0.20)
-
(0.20)
3.95
2.75
35,743 1.76
1.77
4.34
62Year ended 02/28/19
4.12
0.17
(0.07)
0.10
(0.18)
-
(0.18)
4.04
2.50
37,607 1.90
1.90
4.21
34Year ended 02/28/18
4.20
0.16
(0.06)
0.10
(0.18)
-
(0.18)
4.12
2.29
88,812 1.82
1.83
3.94
56Year ended 02/28/17
3.82
0.18
0.39
0.57
(0.18)
(0.01)
(0.19)
4.20 15.09
101,572
1.75
1.76
4.35
99
Class Y
Six months ended 08/31/21
3.98
0.08
0.05
0.13
(0.10)
-
(0.10)
4.01
3.20
55,696 0.77 (d)
0.77 (d)
4.20 (d)
51Year ended 02/28/21
3.97
0.19
0.06
0.25
(0.23)
(0.01)
(0.24)
3.98
6.85
51,180
0.82
0.82
5.14
101Year ended 02/29/20
4.07
0.22
(0.08)
0.14
(0.24)
-
(0.24)
3.97
3.54
61,065 0.76
0.77
5.34
62Year ended 02/28/19
4.14
0.21
(0.06)
0.15
(0.22)
-
(0.22)
4.07
3.79
112,350
0.90
0.90
5.21
34
Year ended 02/28/18
4.23
0.21
(0.08) 0.13
(0.22)
-
(0.22)
4.14
3.09
116,954 0.82
0.83
4.94
56Year ended 02/28/17
3.84
0.22
0.40
0.62
(0.22)
(0.01)
(0.23)
4.23 16.44
201,080
0.75
0.76
5.35
99
Investor Class
Six months ended 08/31/21
3.97
0.08
0.03
0.11
(0.09)
-
(0.09)
3.99
2.81
75,361 1.02 (d)
1.02 (d)
3.95 (d)
51Year ended 02/28/21
3.96
0.18
0.06
0.24
(0.22)
(0.01)
(0.23)
3.97
6.59
74,887
1.07
1.07
4.89
101Year ended 02/29/20
4.05
0.21
(0.07)
0.14
(0.23)
-
(0.23)
3.96
3.53
80,043 1.01
1.02
5.09
62Year ended 02/28/19
4.13
0.20
(0.07)
0.13
(0.21)
-
(0.21)
4.05
3.31
79,404 1.15
1.15
4.96
34Year ended 02/28/18
4.21
0.20
(0.07)
0.13
(0.21)
-
(0.21)
4.13
3.11 (e)
97,913
1.01 (e)
1.02 (e)
4.75 (e)
56
Year ended 02/28/17
3.83
0.21
0.39
0.60
(0.21)
(0.01)
(0.22)
4.21
15.95 (e) 105,545
0.96 (e)
0.97 (e)
5.14 (e)
99
Class R
5
Six m
onths ended 08/31/21
3.96
0.09
0.03
0.12
(0.10)
-
(0.10)
3.98
2.97
36,430
0.71 (d)
0.71 (d)
4.26 (d)
51
Year ended 02/28/21
3.94
0.20
0.06
0.26
(0.23)
(0.01)
(0.24)
3.96
7.21
38,676 0.74
0.74
5.22
101
Year ended 02/29/20
4.04
0.22
(0.07) 0.15
(0.25)
-
(0.25)
3.94
3.75
55,520
0.68
0.69
5.42
62
Year ended 02/28/19
4.12
0.21
(0.07) 0.14
(0.22)
-
(0.22)
4.04
3.59
64,804
0.84
0.84
5.27
34
Year ended 02/28/18
4.20
0.21
(0.07) 0.14
(0.22)
-
(0.22)
4.12
3.40
75,185
0.75
0.76
5.01
56
Year ended 02/28/17
3.82
0.22
0.39
0.61
(0.22)
(0.01)
(0.23)
4.20
16.32
88,644
0.66
0.67
5.44
99
Class R
6
Six m
onths ended 08/31/21
3.97
0.09
0.03
0.12
(0.10)
-
(0.10)
3.99
3.01
92,696
0.63 (d)
0.63 (d)
4.34 (d)
51
Year ended 02/28/21
3.95
0.20
0.07
0.27
(0.24)
(0.01)
(0.25)
3.97
7.29
83,282 0.65
0.65
5.31
101
Year ended 02/29/20
4.05
0.22
(0.07) 0.15
(0.25)
-
(0.25)
3.95
3.70
190,003 0.59
0.60
5.51
62Year ended 02/28/19
4.12
0.22
(0.06)
0.16
(0.23)
-
(0.23)
4.05
3.94
186,913
0.75
0.75
5.36
34
Year ended 02/28/18
4.20
0.21
(0.07) 0.14
(0.22)
-
(0.22)
4.12
3.49
195,027 0.66
0.67
5.10
56Year ended 02/28/17
3.82
0.23
0.39
0.62
(0.23)
(0.01)
(0.24)
4.20 16.42
157,367
0.57
0.58
5.53
99
(a) C
alculated using average shares outstanding.

ˆ200D#JZ!e!h#Psuo-Š200D#JZ!e!h#Psuo-
111462 EDG 16INVESCOHIGH YIELD
29-Oct-2021 19:19 ESTHTMLAN
Donnelley Financial LSWpf_rendNone
6*ESS 0C
LSWP64RS2621.10.7.0
ˆ200D#JZ!e!h#Psuo-Š200D#JZ!e!h#Psuo-
111462 EDG 16INVESCOHIGH YIELD
29-Oct-2021 19:19 ESTHTMLAN
Donnelley Financial LSWpf_rendNone
6*ESS 0C
LSWP64RS2621.10.7.0
Page 2 of 2
(b) Includes adjustm
ents in accordance with accounting principles generally accepted in the U
nited States of America and as such, the net asset value for financial reporting purposes and the returns based upon those net asset values m
ay differ fromthe net asset value and returns for shareholder transactions. D
oes not include sales charges and is not annualized for periods less than one year, if applicable.(c)
Portfolio turnover is calculated at the fund level and is not annualized for periods less than one year, if applicable.(d)
Annualized.(e)
The total return, ratio of expenses to average net assets and ratio of net investment incom
e to average net assets reflect actual 12b-1 fees of 0.19% and 0.21%
for the years ended February 28, 2018 and 2017, respectively. See accom
panying Notes to Financial Statem
ents which are an integral part of the financial statem
ents. 16
Invesco H
igh Yield Fund

ˆ200D#JZ!e!h#Q#4GhŠ200D#JZ!e!h#Q#4Gh
111462 EDG 17INVESCOHIGH YIELD
29-Oct-2021 19:19 ESTHTMLAN
Donnelley Financial LSWpf_rendNone
6*ESS 0C
LSWP64RS2621.10.7.0
Page 1 of 2
Notes to Financial StatementsAugust 31, 2021(Unaudited)
NOTE 1–Significant Accounting Policies
Invesco High Yield Fund (the “Fund”), is a series portfolio of AIM Investment Securities Funds (Invesco Investment Securities Funds) (the“Trust”). The Trust is organized as a Delaware statutory trust and is registered under the Investment Company Act of 1940, as amended(the “1940 Act”), as an open-end series management investment company authorized to issue an unlimited number of shares of beneficialinterest. Information presented in these financial statements pertains only to the Fund. Matters affecting the Fund or each class will bevoted on exclusively by the shareholders of the Fund or each class.
The Fund’s investment objective is total return through growth of capital and current income.The Fund currently consists of six different classes of shares: Class A, Class C, Class Y, Investor Class, Class R5 and Class R6. Class Y
and Investor Class shares are available only to certain investors. Class A shares are sold with a front-end sales charge unless certainwaiver criteria are met and under certain circumstances load waived shares may be subject to contingent deferred sales charges (“CDSC”).Class C shares are sold with a CDSC. Class Y, Investor Class, Class R5 and Class R6 shares are sold at net asset value. Class C sharesheld for eight years after purchase are eligible for automatic conversion into Class A shares of the same Fund (the “Conversion Feature”).The automatic conversion pursuant to the Conversion Feature will generally occur at the end of the month following the eighth anniversaryafter a purchase of Class C shares.
The Fund is an investment company and accordingly follows the investment company accounting and reporting guidance in accordancewith Financial Accounting Standards Board Accounting Standards Codification Topic 946, Financial Services – Investment Companies.
The following is a summary of the significant accounting policies followed by the Fund in the preparation of its financial statements.A. Security Valuations - Securities, including restricted securities, are valued according to the following policy.
Debt obligations (including convertible securities) and unlisted equities are fair valued using an evaluated quote provided by anindependent pricing service. Evaluated quotes provided by the pricing service may be determined without exclusive reliance on quotedprices, and may reflect appropriate factors such as institution-size trading in similar groups of securities, developments related tospecific securities, dividend rate (for unlisted equities), yield (for debt obligations), quality, type of issue, coupon rate (for debtobligations), maturity (for debt obligations), individual trading characteristics and other market data. Pricing services generally valuedebt obligations assuming orderly transactions of institutional round lot size, but a fund may hold or transact in the same securities insmaller, odd lot sizes. Odd lots often trade at lower prices than institutional round lots. Debt obligations are subject to interest rate andcredit risks. In addition, all debt obligations involve some risk of default with respect to interest and/or principal payments.
Variable rate senior loan interests are fair valued using quotes provided by an independent pricing service. Quotes provided by thepricing service may reflect appropriate factors such as ratings, tranche type, industry, company performance, spread, individual tradingcharacteristics, institution-size trading in similar groups of securities and other market data.
A security listed or traded on an exchange (except convertible securities) is valued at its last sales price or official closing price as ofthe close of the customary trading session on the exchange where the security is principally traded, or lacking any sales or officialclosing price on a particular day, the security may be valued at the closing bid price on that day. Securities traded in theover-the-counter market are valued based on prices furnished by independent pricing services or market makers. When such securitiesare valued by an independent pricing service they may be considered fair valued. Futures contracts are valued at the final settlementprice set by an exchange on which they are principally traded. Listed options are valued at the mean between the last bid and askedprices from the exchange on which they are principally traded. Options not listed on an exchange are valued by an independent sourceat the mean between the last bid and asked prices. For purposes of determining net asset value (“NAV”) per share, futures and optioncontracts generally are valued 15 minutes after the close of the customary trading session of the New York Stock Exchange (“NYSE”).
Investments in open-end and closed-end registered investment companies that do not trade on an exchange are valued at theend-of-day net asset value per share. Investments in open-end and closed-end registered investment companies that trade on anexchange are valued at the last sales price or official closing price as of the close of the customary trading session on the exchangewhere the security is principally traded.
Swap agreements are fair valued using an evaluated quote, if available, provided by an independent pricing service. Evaluatedquotes provided by the pricing service are valued based on a model which may include end-of-day net present values, spreads, ratings,industry, company performance and returns of referenced assets. Centrally cleared swap agreements are valued at the daily settlementprice determined by the relevant exchange or clearinghouse.
Foreign securities’ (including foreign exchange contracts) prices are converted into U.S. dollar amounts using the applicableexchange rates as of the close of the NYSE. If market quotations are available and reliable for foreign exchange-traded equitysecurities, the securities will be valued at the market quotations. Because trading hours for certain foreign securities end before theclose of the NYSE, closing market quotations may become unreliable. If between the time trading ends on a particular security and theclose of the customary trading session on the NYSE, events occur that the investment adviser determines are significant and make theclosing price unreliable, the Fund may fair value the security. If the event is likely to have affected the closing price of the security, thesecurity will be valued at fair value in good faith using procedures approved by the Board of Trustees. Adjustments to closing prices toreflect fair value may also be based on a screening process of an independent pricing service to indicate the degree of certainty, basedon historical data, that the closing price in the principal market where a foreign security trades is not the current value as of the close ofthe NYSE. Foreign securities’ prices meeting the approved degree of certainty that the price is not reflective of current value will bepriced at the indication of fair value from the independent pricing service. Multiple factors may be considered by the independent pricingservice in determining adjustments to reflect fair value and may include information relating to sector indices, American DepositaryReceipts and domestic and foreign index futures. Foreign securities may have additional risks including exchange rate changes,potential for sharply devalued currencies and high inflation, political and economic upheaval, the relative lack of issuer information,relatively low market liquidity and the potential lack of strict financial and accounting controls and standards.
Securities for which market prices are not provided by any of the above methods may be valued based upon quotes furnished byindependent sources. The last bid price may be used to value equity securities. The mean between the last bid and asked prices isused to value debt obligations, including corporate loans.
Securities for which market quotations are not readily available or became unreliable are valued at fair value as determined in goodfaith by or under the supervision of the Trust’s officers following procedures approved by the Board of Trustees. Issuer specific events,market trends, bid/asked quotes of brokers and information providers and other market data may be reviewed in the course of making agood faith determination of a security’s fair value.
The Fund may invest in securities that are subject to interest rate risk, meaning the risk that the prices will generally fall as interestrates rise and, conversely, the prices will generally rise as interest rates fall. Specific securities differ in their sensitivity to changes ininterest rates depending on their individual characteristics. Changes in interest rates may result in increased market volatility, whichmay affect the value and/or liquidity of certain Fund investments.
Valuations change in response to many factors including the historical and prospective earnings of the issuer, the value of theissuer’s assets, general market conditions which are not specifically related to the particular issuer, such as real or perceived adverseeconomic conditions, changes in the general outlook for revenues or corporate earnings, changes in interest or currency rates, regionalor global instability, natural or environmental disasters, widespread disease or other public health issues, war, acts of terrorism oradverse investor sentiment generally and market liquidity. Because of the inherent uncertainties of valuation, the values reflected in thefinancial statements may materially differ from the value received upon actual sale of those investments.
B. Securities Transactions and Investment Income - Securities transactions are accounted for on a trade date basis. Realized gains orlosses on sales are

ˆ200D#JZ!e!h#Q#4GhŠ200D#JZ!e!h#Q#4Gh
111462 EDG 17INVESCOHIGH YIELD
29-Oct-2021 19:19 ESTHTMLAN
Donnelley Financial LSWpf_rendNone
6*ESS 0C
LSWP64RS2621.10.7.0
ˆ200D#JZ!e!h#Q#4GhŠ200D#JZ!e!h#Q#4Gh
111462 EDG 17INVESCOHIGH YIELD
29-Oct-2021 19:19 ESTHTMLAN
Donnelley Financial LSWpf_rendNone
6*ESS 0C
LSWP64RS2621.10.7.0
Page 2 of 217 Invesco High Yield Fund
ˆ200D#JZ!e!h#TGdGÇŠ200D#JZ!e!h#TGdG˙
111462 EDG 18INVESCOHIGH YIELD
29-Oct-2021 19:19 ESTHTMLAN
Donnelley Financial LSWpf_rendNone
5*ESS 0C
LSWP64RS2621.10.7.0
Page 1 of 1computed on the basis of specific identification of the securities sold. Interest income (net of withholding tax, if any) is recorded on anaccrual basis from settlement date and includes coupon interest and amortization of premium and accretion of discount on debtsecurities as applicable. Pay-in-kind interest income and non-cash dividend income received in the form of securities in-lieu of cash arerecorded at the fair value of the securities received. Paydown gains and losses on mortgage and asset-backed securities are recordedas adjustments to interest income. Dividend income (net of withholding tax, if any) is recorded on the ex-dividend date.
The Fund may periodically participate in litigation related to Fund investments. As such, the Fund may receive proceeds fromlitigation settlements. Any proceeds received are included in the Statement of Operations as realized gain (loss) for investments nolonger held and as unrealized gain (loss) for investments still held.
Brokerage commissions and mark ups are considered transaction costs and are recorded as an increase to the cost basis ofsecurities purchased and/or a reduction of proceeds on a sale of securities. Such transaction costs are included in the determination ofnet realized and unrealized gain (loss) from investment securities reported in the Statement of Operations and the Statement ofChanges in Net Assets and the net realized and unrealized gains (losses) on securities per share in the Financial Highlights.Transaction costs are included in the calculation of the Fund’s net asset value and, accordingly, they reduce the Fund’s total returns.These transaction costs are not considered operating expenses and are not reflected in net investment income reported in theStatement of Operations and the Statement of Changes in Net Assets, or the net investment income per share and the ratios ofexpenses and net investment income reported in the Financial Highlights, nor are they limited by any expense limitation arrangementsbetween the Fund and the investment adviser.
The Fund allocates realized and unrealized capital gains and losses to a class based on the relative net assets of each class. TheFund allocates income to a class based on the relative value of the settled shares of each class.
C. Country Determination – For the purposes of making investment selection decisions and presentation in the Schedule of Investments,the investment adviser may determine the country in which an issuer is located and/or credit risk exposure based on various factors.These factors include the laws of the country under which the issuer is organized, where the issuer maintains a principal office, thecountry in which the issuer derives 50% or more of its total revenues and the country that has the primary market for the issuer’ssecurities, as well as other criteria. Among the other criteria that may be evaluated for making this determination are the country inwhich the issuer maintains 50% or more of its assets, the type of security, financial guarantees and enhancements, the nature of thecollateral and the sponsor organization. Country of issuer and/or credit risk exposure has been determined to be the United States ofAmerica, unless otherwise noted.
D. Distributions – Distributions from net investment income, if any, are declared daily and paid monthly. Distributions from net realizedcapital gain, if any, are generally declared and paid annually and recorded on the ex-dividend date. The Fund may elect to treat aportion of the proceeds from redemptions as distributions for federal income tax purposes.
E. Federal Income Taxes – The Fund intends to comply with the requirements of Subchapter M of the Internal Revenue Code of 1986, asamended (the “Internal Revenue Code”), necessary to qualify as a regulated investment company and to distribute substantially all ofthe Fund’s taxable earnings to shareholders. As such, the Fund will not be subject to federal income taxes on otherwise taxable income(including net realized capital gain) that is distributed to shareholders. Therefore, no provision for federal income taxes is recorded inthe financial statements.
The Fund recognizes the tax benefits of uncertain tax positions only when the position is more likely than not to be sustained.Management has analyzed the Fund’s uncertain tax positions and concluded that no liability for unrecognized tax benefits should berecorded related to uncertain tax positions. Management is not aware of any tax positions for which it is reasonably possible that thetotal amounts of unrecognized tax benefits will change materially in the next 12 months.
The Fund files tax returns in the U.S. Federal jurisdiction and certain other jurisdictions. Generally, the Fund is subject toexaminations by such taxing authorities for up to three years after the filing of the return for the tax period.
F. Expenses – Fees provided for under the Rule 12b-1 plan of a particular class of the Fund are charged to the operations of such class.Transfer agency fees and expenses and other shareholder recordkeeping fees and expenses attributable to Class R5 and Class R6 areallocated based on relative net assets of Class R5 and Class R6. Sub-accounting fees attributable to Class R5 are charged to theoperations of the class. Transfer agency fees and expenses and other shareholder recordkeeping fees and expenses relating to allother classes are allocated among those classes based on relative net assets. All other expenses are allocated among the classesbased on relative net assets.
G. Accounting Estimates – The preparation of financial statements in conformity with accounting principles generally accepted in theUnited States of America (“GAAP”) requires management to make estimates and assumptions that affect the reported amounts ofassets and liabilities at the date of the financial statements and the reported amounts of revenues and expenses during the reportingperiod including estimates and assumptions related to taxation. Actual results could differ from those estimates by a significant amount.In addition, the Fund monitors for material events or transactions that may occur or become known after the period-end date and beforethe date the financial statements are released to print.
H. Indemnifications – Under the Trust’s organizational documents, each Trustee, officer, employee or other agent of the Trust isindemnified against certain liabilities that may arise out of the performance of their duties to the Fund. Additionally, in the normal courseof business, the Fund enters into contracts, including the Fund’s servicing agreements, that contain a variety of indemnification clauses.The Fund’s maximum exposure under these arrangements is unknown as this would involve future claims that may be made againstthe Fund that have not yet occurred. The risk of material loss as a result of such indemnification claims is considered remote.
I. Foreign Currency Translations –Foreign currency is valued at the close of the NYSE based on quotations posted by banks and majorcurrency dealers. Portfolio securities and other assets and liabilities denominated in foreign currencies are translated into U.S. dollaramounts at the date of valuation. Purchases and sales of portfolio securities (net of foreign taxes withheld on disposition) and incomeitems denominated in foreign currencies are translated into U.S. dollar amounts on the respective dates of such transactions. The Funddoes not separately account for the portion of the results of operations resulting from changes in foreign exchange rates on investmentsand the fluctuations arising from changes in market prices of securities held. The combined results of changes in foreign exchangerates and the fluctuation of market prices on investments (net of estimated foreign tax withholding) are included with the net realizedand unrealized gain or loss from investments in the Statement of Operations. Reported net realized foreign currency gains or lossesarise from (1) sales of foreign currencies, (2) currency gains or losses realized between the trade and settlement dates on securitiestransactions, and (3) the difference between the amounts of dividends, interest, and foreign withholding taxes recorded on the Fund’sbooks and the U.S. dollar equivalent of the amounts actually received or paid. Net unrealized foreign currency gains and losses arisefrom changes in the fair values of assets and liabilities, other than investments in securities at fiscal period end, resulting from changesin exchange rates.
The Fund may invest in foreign securities, which may be subject to foreign taxes on income, gains on investments or currencyrepatriation, a portion of which may be recoverable. Foreign taxes, if any, are recorded based on the tax regulations and rates that existin the foreign markets in which the Fund invests and are shown in the Statement of Operations.
J. Forward Foreign Currency Contracts –The Fund may engage in foreign currency transactions either on a spot (i.e. for promptdelivery and settlement) basis, or through forward foreign currency contracts, to manage or minimize currency or exchange rate risk.
The Fund may also enter into forward foreign currency contracts for the purchase or sale of a security denominated in a foreigncurrency in order to “lock in” the U.S. dollar price of that security, or the Fund may also enter into forward foreign currency contracts thatdo not provide for physical settlement of the two currencies, but instead are settled by a single cash payment calculated as thedifference between the agreed upon exchange rate and the spot rate at settlement based upon an agreed upon notional amount(non-deliverable forwards). The Fund will set aside liquid assets in an amount equal to the daily mark-to-market obligation for forwardforeign currency contracts.
18 Invesco High Yield Fund
ˆ200D#JZ!e!h#YW6o=Š200D#JZ!e!h#YW6o=
111462 EDG 19INVESCOHIGH YIELD
29-Oct-2021 19:19 ESTHTMLAN
Donnelley Financial LSWpf_rendNone
5*ESS 0C
LSWP64RS2621.10.7.0
Page 1 of 1A forward foreign currency contract is an obligation between two parties (“Counterparties”) to purchase or sell a specific currency for
an agreed-upon price at a future date. The use of forward foreign currency contracts does not eliminate fluctuations in the price of theunderlying securities the Fund owns or intends to acquire but establishes a rate of exchange in advance. Fluctuations in the value ofthese contracts are measured by the difference in the contract date and reporting date exchange rates and are recorded as unrealizedappreciation (depreciation) until the contracts are closed. When the contracts are closed, realized gains (losses) are recorded. Realizedand unrealized gains (losses) on the contracts are included in the Statement of Operations. The primary risks associated with forwardforeign currency contracts include failure of the Counterparty to meet the terms of the contract and the value of the foreign currencychanging unfavorably. These risks may be in excess of the amounts reflected in the Statement of Assets and Liabilities.
K. Call Options Purchased and Written – The Fund may write call options and/or buy call options. A covered call option gives thepurchaser of such option the right to buy, and the writer the obligation to sell, the underlying security or foreign currency at the statedexercise price during the option period. An uncovered call option exists without the ownership of the underlying security. Options writtenby the Fund normally will have expiration dates between three and nine months from the date written. The exercise price of a call optionmay be below, equal to, or above the current market value of the underlying security at the time the option is written.
Additionally, the Fund may enter into an option on a swap agreement, also called a “swaption”. A swaption is an option that gives thebuyer the right, but not the obligation, to enter into a swap on a future date in exchange for paying a market-based premium. A receiverswaption gives the owner the right to receive the total return of a specified asset, reference rate or index. Swaptions also includeoptions that allow an existing swap to be terminated or extended by one of the Counterparties.
When the Fund writes a covered call option, an amount equal to the premium received by the Fund is recorded as an asset and anequivalent liability in the Statement of Assets and Liabilities. The amount of the liability is subsequently “marked-to-market” to reflect thecurrent market value of the option written. If a written covered call option expires on the stipulated expiration date, or if the Fund entersinto a closing purchase transaction, the Fund realizes a gain (or a loss if the closing purchase transaction exceeds the premiumreceived when the option was written) without regard to any unrealized gain or loss on the underlying security, and the liability related tosuch option is extinguished. If a written covered call option is exercised, the Fund realizes a gain or a loss from the sale of theunderlying security and the proceeds of the sale are increased by the premium originally received. Realized and unrealized gains andlosses on call options written are included in the Statement of Operations as Net realized gain (loss) from and Change in net unrealizedappreciation (depreciation) of Option contracts written. A risk in writing a covered call option is that the Fund gives up the opportunity forprofit if the market price of the security increases and the option is exercised. The risk in writing an uncovered call option is that theFund may incur significant losses if the value of the written security exceeds the exercise price of the option.
When the Fund buys a call option, an amount equal to the premium paid by the Fund is recorded as an investment on the Statementof Assets and Liabilities. The amount of the investment is subsequently “marked-to-market” to reflect the current value of the optionpurchased. Realized and unrealized gains and losses on call options purchased are included in the Statement of Operations as Netrealized gain (loss) from and Change in net unrealized appreciation (depreciation) of Investment securities. A risk in buying an option isthat the Fund pays a premium whether or not the option is exercised. In addition, there can be no assurance that a liquid secondarymarket will exist for any option purchased.
L. Put Options Purchased and Written – The Fund may purchase and write put options including options on securities indexes, orforeign currency and/or futures contracts. By purchasing a put option, the Fund obtains the right (but not the obligation) to sell theoption’s underlying instrument at a fixed strike price. In return for this right, the Fund pays an option premium. The option’s underlyinginstrument may be a security, securities index, or a futures contract.
Additionally, the Fund may enter into an option on a swap agreement, also called a “swaption”. A swaption is an option that gives thebuyer the right, but not the obligation, to enter into a swap on a future date in exchange for paying a market-based premium. A receiverswaption gives the owner the right to receive the total return of a specified asset, reference rate or index. Swaptions also includeoptions that allow an existing swap to be terminated or extended by one of the Counterparties.
Put options may be used by the Fund to hedge securities it owns by locking in a minimum price at which the Fund can sell. If securityprices fall, the put option could be exercised to offset all or a portion of the Fund’s resulting losses. At the same time, because themaximum the Fund has at risk is the cost of the option, purchasing put options does not eliminate the potential for the Fund to profitfrom an increase in the value of the underlying portfolio securities. The Fund may write put options to earn additional income in the formof option premiums if it expects the price of the underlying instrument to remain stable or rise during the option period so that the optionwill not be exercised. The risk in this strategy is that the price of the underlying securities may decline by an amount greater than thepremium received. Put options written are reported as a liability in the Statement of Assets and Liabilities. Realized and unrealizedgains and losses on put options purchased and put options written are included in the Statement of Operations as Net realized gain(loss) from and Change in net unrealized appreciation (depreciation) of Investment securities and Option contracts written, respectively.A risk in buying an option is that the Fund pays a premium whether or not the option is exercised. In addition, there can be noassurance that a liquid secondary market will exist for any option purchased.
M. Bank Loan Risk – Although the resale, or secondary market for floating rate loans has grown substantially over the past decade, bothin overall size and number of market participants, there is no organized exchange or board of trade on which floating rate loans aretraded. Instead, the secondary market for floating rate loans is a private, unregulated interdealer or interbank resale market. Such amarket may therefore be subject to irregular trading activity, wide bid/ask spreads, and extended trade settlement periods, which mayimpair the Fund’s ability to sell bank loans within its desired time frame or at an acceptable price and its ability to accurately valueexisting and prospective investments. Extended trade settlement periods may result in cash not being immediately available to theFund. As a result, the Fund may have to sell other investments or engage in borrowing transactions to raise cash to meet itsobligations. Similar to other asset classes, bank loan funds may be exposed to counterparty credit risk, or the risk than an entity withwhich the Fund has unsettled or open transactions may fail to or be unable to perform on its commitments. The Fund seeks to managecounterparty credit risk by entering into transactions only with counterparties that it believes have the financial resources to honor theirobligations and by monitoring the financial stability of those counterparties.
N. LIBOR Risk – The Fund may invest in financial instruments that utilize LIBOR as the reference or benchmark rate for variable interestrate calculations. On July 27, 2017, the head of the United Kingdom’s Financial Conduct Authority announced a desire to phase out theuse of LIBOR by the end of 2021. Although many LIBOR rates will be phased out at the end of 2021 as originally intended, a selectionof widely used USD LIBOR rates will continue to be published until June 2023 in order to assist with the transition. There remainsuncertainty regarding the effect of the LIBOR transition process and therefore any impact of a transition away from LIBOR on the Fundor the instruments in which the Fund invests cannot yet be determined. There is no assurance that the composition or characteristics ofany alternative reference rate will be similar to or produce the same value or economic equivalence as LIBOR or that instruments usingan alternative rate will have the same volume or liquidity. Any such effects of the transition away from LIBOR and the adoption ofalternative reference rates could result in losses to the Fund.
O. Leverage Risk – Leverage exists when the Fund can lose more than it originally invests because it purchases or sells an instrument orenters into a transaction without investing an amount equal to the full economic exposure of the instrument or transaction.
P. Other Risks – Active trading of portfolio securities may result in added expenses, a lower return and increased tax liability.The current low interest rate environment was created in part by the Federal Reserve Board (FRB) and certain foreign central banks
keeping the federal funds and equivalent foreign rates near historical lows. Increases in the federal funds and equivalent foreign ratesmay expose fixed income markets to heightened volatility and reduced liquidity for certain fixed income investments, particularly thosewith longer maturities. In addition, decreases in fixed income dealer market-making capacity may also potentially lead to heightenedvolatility and reduced liquidity in the fixed income markets. As a result, the value of the Fund’s investments and share price maydecline. Changes in central bank policies could also result in higher than normal shareholder redemptions, which could potentiallyincrease portfolio turnover and the Fund’s transaction costs.
19 Invesco High Yield Fund
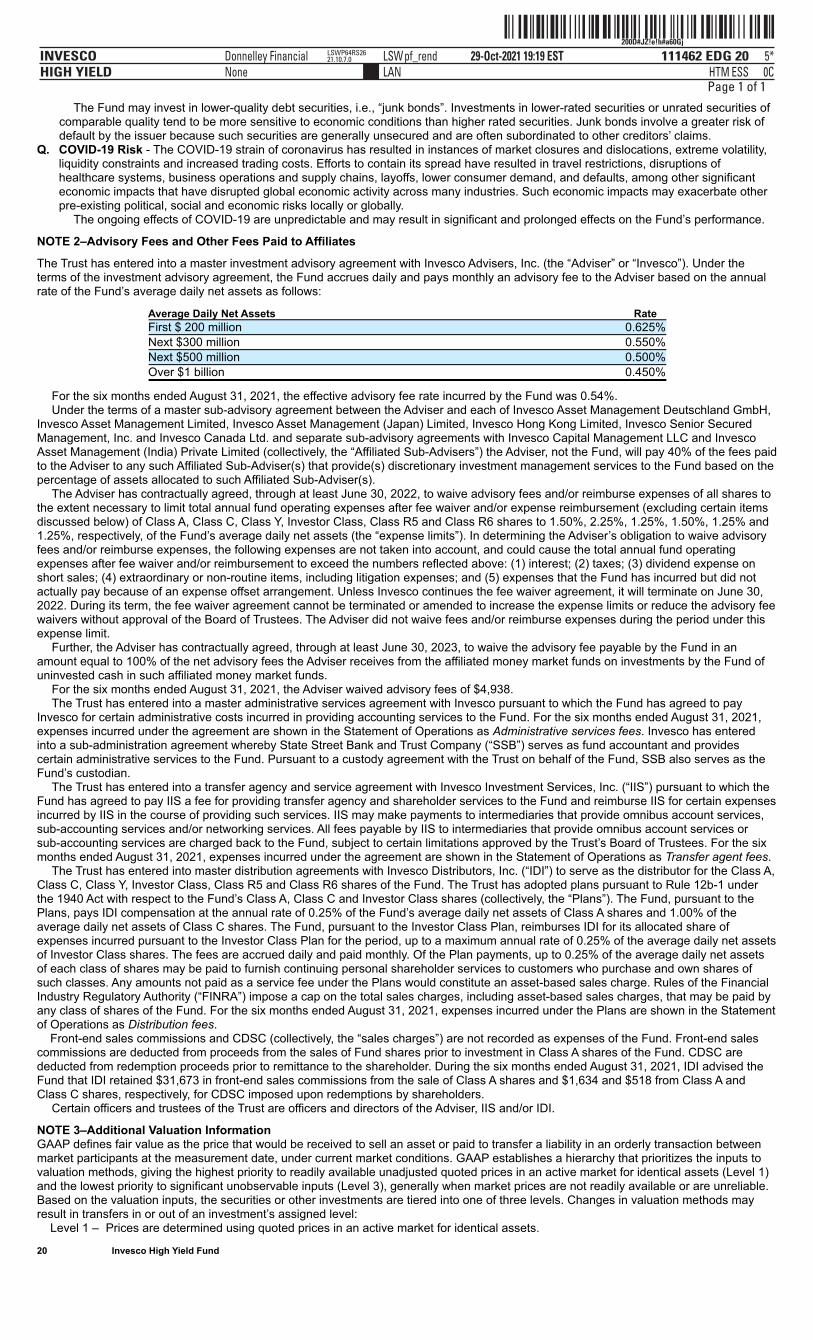
ˆ200D#JZ!e!h#a60GjŠ200D#JZ!e!h#a60Gj
111462 EDG 20INVESCOHIGH YIELD
29-Oct-2021 19:19 ESTHTMLAN
Donnelley Financial LSWpf_rendNone
5*ESS 0C
LSWP64RS2621.10.7.0
Page 1 of 1The Fund may invest in lower-quality debt securities, i.e., “junk bonds”. Investments in lower-rated securities or unrated securities of
comparable quality tend to be more sensitive to economic conditions than higher rated securities. Junk bonds involve a greater risk ofdefault by the issuer because such securities are generally unsecured and are often subordinated to other creditors’ claims.
Q. COVID-19 Risk - The COVID-19 strain of coronavirus has resulted in instances of market closures and dislocations, extreme volatility,liquidity constraints and increased trading costs. Efforts to contain its spread have resulted in travel restrictions, disruptions ofhealthcare systems, business operations and supply chains, layoffs, lower consumer demand, and defaults, among other significanteconomic impacts that have disrupted global economic activity across many industries. Such economic impacts may exacerbate otherpre-existing political, social and economic risks locally or globally.
The ongoing effects of COVID-19 are unpredictable and may result in significant and prolonged effects on the Fund’s performance.
NOTE 2–Advisory Fees and Other Fees Paid to Affiliates
The Trust has entered into a master investment advisory agreement with Invesco Advisers, Inc. (the “Adviser” or “Invesco”). Under theterms of the investment advisory agreement, the Fund accrues daily and pays monthly an advisory fee to the Adviser based on the annualrate of the Fund’s average daily net assets as follows:
Average Daily Net Assets RateFirst $ 200 million 0.625%Next $300 million 0.550%Next $500 million 0.500%Over $1 billion 0.450%
For the six months ended August 31, 2021, the effective advisory fee rate incurred by the Fund was 0.54%.Under the terms of a master sub-advisory agreement between the Adviser and each of Invesco Asset Management Deutschland GmbH,
Invesco Asset Management Limited, Invesco Asset Management (Japan) Limited, Invesco Hong Kong Limited, Invesco Senior SecuredManagement, Inc. and Invesco Canada Ltd. and separate sub-advisory agreements with Invesco Capital Management LLC and InvescoAsset Management (India) Private Limited (collectively, the “Affiliated Sub-Advisers”) the Adviser, not the Fund, will pay 40% of the fees paidto the Adviser to any such Affiliated Sub-Adviser(s) that provide(s) discretionary investment management services to the Fund based on thepercentage of assets allocated to such Affiliated Sub-Adviser(s).
The Adviser has contractually agreed, through at least June 30, 2022, to waive advisory fees and/or reimburse expenses of all shares tothe extent necessary to limit total annual fund operating expenses after fee waiver and/or expense reimbursement (excluding certain itemsdiscussed below) of Class A, Class C, Class Y, Investor Class, Class R5 and Class R6 shares to 1.50%, 2.25%, 1.25%, 1.50%, 1.25% and1.25%, respectively, of the Fund’s average daily net assets (the “expense limits”). In determining the Adviser’s obligation to waive advisoryfees and/or reimburse expenses, the following expenses are not taken into account, and could cause the total annual fund operatingexpenses after fee waiver and/or reimbursement to exceed the numbers reflected above: (1) interest; (2) taxes; (3) dividend expense onshort sales; (4) extraordinary or non-routine items, including litigation expenses; and (5) expenses that the Fund has incurred but did notactually pay because of an expense offset arrangement. Unless Invesco continues the fee waiver agreement, it will terminate on June 30,2022. During its term, the fee waiver agreement cannot be terminated or amended to increase the expense limits or reduce the advisory feewaivers without approval of the Board of Trustees. The Adviser did not waive fees and/or reimburse expenses during the period under thisexpense limit.
Further, the Adviser has contractually agreed, through at least June 30, 2023, to waive the advisory fee payable by the Fund in anamount equal to 100% of the net advisory fees the Adviser receives from the affiliated money market funds on investments by the Fund ofuninvested cash in such affiliated money market funds.
For the six months ended August 31, 2021, the Adviser waived advisory fees of $4,938.The Trust has entered into a master administrative services agreement with Invesco pursuant to which the Fund has agreed to pay
Invesco for certain administrative costs incurred in providing accounting services to the Fund. For the six months ended August 31, 2021,expenses incurred under the agreement are shown in the Statement of Operations as Administrative services fees. Invesco has enteredinto a sub-administration agreement whereby State Street Bank and Trust Company (“SSB”) serves as fund accountant and providescertain administrative services to the Fund. Pursuant to a custody agreement with the Trust on behalf of the Fund, SSB also serves as theFund’s custodian.
The Trust has entered into a transfer agency and service agreement with Invesco Investment Services, Inc. (“IIS”) pursuant to which theFund has agreed to pay IIS a fee for providing transfer agency and shareholder services to the Fund and reimburse IIS for certain expensesincurred by IIS in the course of providing such services. IIS may make payments to intermediaries that provide omnibus account services,sub-accounting services and/or networking services. All fees payable by IIS to intermediaries that provide omnibus account services orsub-accounting services are charged back to the Fund, subject to certain limitations approved by the Trust’s Board of Trustees. For the sixmonths ended August 31, 2021, expenses incurred under the agreement are shown in the Statement of Operations as Transfer agent fees.
The Trust has entered into master distribution agreements with Invesco Distributors, Inc. (“IDI”) to serve as the distributor for the Class A,Class C, Class Y, Investor Class, Class R5 and Class R6 shares of the Fund. The Trust has adopted plans pursuant to Rule 12b-1 underthe 1940 Act with respect to the Fund’s Class A, Class C and Investor Class shares (collectively, the “Plans”). The Fund, pursuant to thePlans, pays IDI compensation at the annual rate of 0.25% of the Fund’s average daily net assets of Class A shares and 1.00% of theaverage daily net assets of Class C shares. The Fund, pursuant to the Investor Class Plan, reimburses IDI for its allocated share ofexpenses incurred pursuant to the Investor Class Plan for the period, up to a maximum annual rate of 0.25% of the average daily net assetsof Investor Class shares. The fees are accrued daily and paid monthly. Of the Plan payments, up to 0.25% of the average daily net assetsof each class of shares may be paid to furnish continuing personal shareholder services to customers who purchase and own shares ofsuch classes. Any amounts not paid as a service fee under the Plans would constitute an asset-based sales charge. Rules of the FinancialIndustry Regulatory Authority (“FINRA”) impose a cap on the total sales charges, including asset-based sales charges, that may be paid byany class of shares of the Fund. For the six months ended August 31, 2021, expenses incurred under the Plans are shown in the Statementof Operations as Distribution fees. Front-end sales commissions and CDSC (collectively, the “sales charges”) are not recorded as expenses of the Fund. Front-end salescommissions are deducted from proceeds from the sales of Fund shares prior to investment in Class A shares of the Fund. CDSC arededucted from redemption proceeds prior to remittance to the shareholder. During the six months ended August 31, 2021, IDI advised theFund that IDI retained $31,673 in front-end sales commissions from the sale of Class A shares and $1,634 and $518 from Class A andClass C shares, respectively, for CDSC imposed upon redemptions by shareholders.
Certain officers and trustees of the Trust are officers and directors of the Adviser, IIS and/or IDI.
NOTE 3–Additional Valuation InformationGAAP defines fair value as the price that would be received to sell an asset or paid to transfer a liability in an orderly transaction betweenmarket participants at the measurement date, under current market conditions. GAAP establishes a hierarchy that prioritizes the inputs tovaluation methods, giving the highest priority to readily available unadjusted quoted prices in an active market for identical assets (Level 1)and the lowest priority to significant unobservable inputs (Level 3), generally when market prices are not readily available or are unreliable.Based on the valuation inputs, the securities or other investments are tiered into one of three levels. Changes in valuation methods mayresult in transfers in or out of an investment’s assigned level: Level 1 – Prices are determined using quoted prices in an active market for identical assets. 20 Invesco High Yield Fund
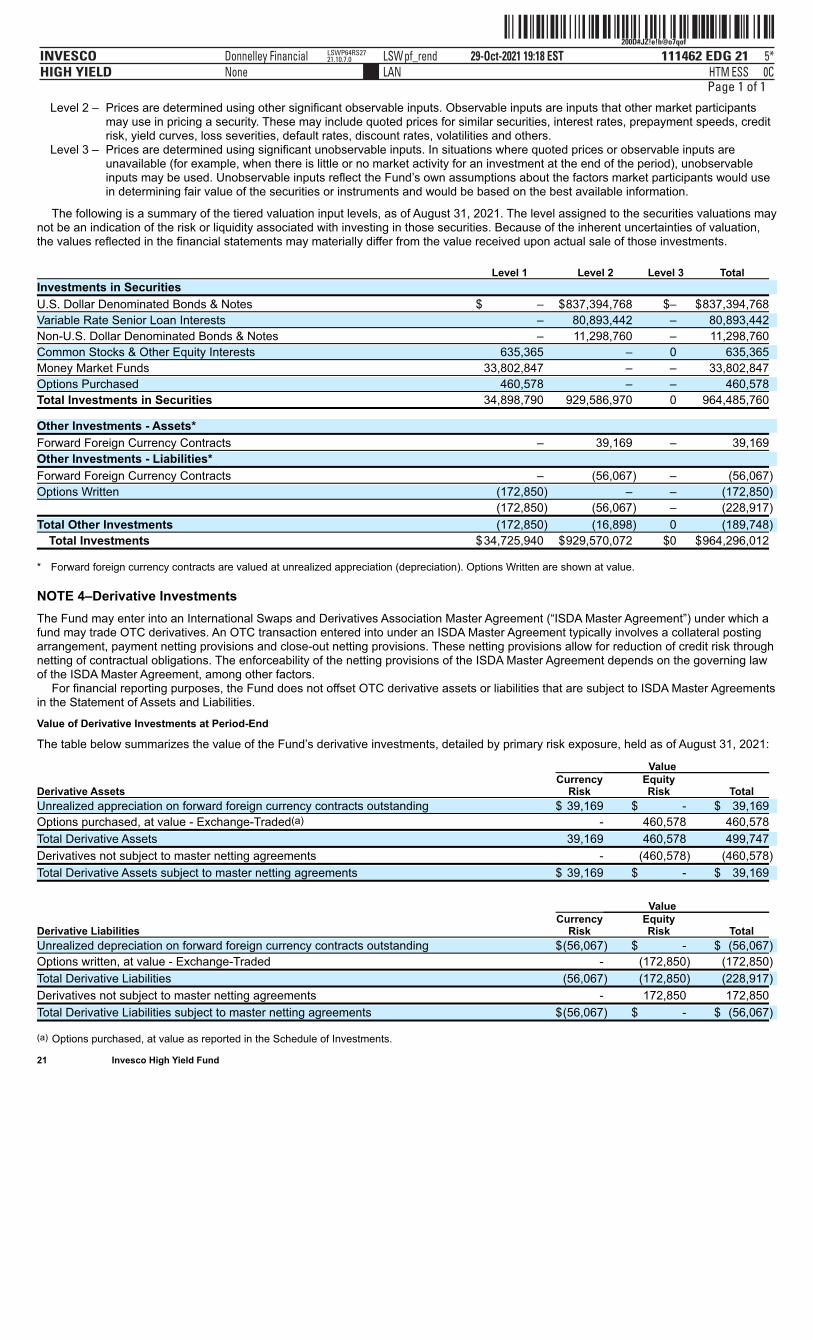
ˆ200D#JZ!e!h@o7qofŠ200D#JZ!e!h@o7qof
111462 EDG 21INVESCOHIGH YIELD
29-Oct-2021 19:18 ESTHTMLAN
Donnelley Financial LSWpf_rendNone
5*ESS 0C
LSWP64RS2721.10.7.0
Page 1 of 1 Level 2 –
Prices are determined using other significant observable inputs. Observable inputs are inputs that other market participantsmay use in pricing a security. These may include quoted prices for similar securities, interest rates, prepayment speeds, creditrisk, yield curves, loss severities, default rates, discount rates, volatilities and others.
Level 3 –
Prices are determined using significant unobservable inputs. In situations where quoted prices or observable inputs areunavailable (for example, when there is little or no market activity for an investment at the end of the period), unobservableinputs may be used. Unobservable inputs reflect the Fund’s own assumptions about the factors market participants would usein determining fair value of the securities or instruments and would be based on the best available information.
The following is a summary of the tiered valuation input levels, as of August 31, 2021. The level assigned to the securities valuations maynot be an indication of the risk or liquidity associated with investing in those securities. Because of the inherent uncertainties of valuation,the values reflected in the financial statements may materially differ from the value received upon actual sale of those investments. Level 1 Level 2 Level 3 Total
Investments in Securities
U.S. Dollar Denominated Bonds & Notes $ – $837,394,768 $– $837,394,768
Variable Rate Senior Loan Interests – 80,893,442 – 80,893,442
Non-U.S. Dollar Denominated Bonds & Notes – 11,298,760 – 11,298,760
Common Stocks & Other Equity Interests 635,365 – 0 635,365
Money Market Funds 33,802,847 – – 33,802,847
Options Purchased 460,578 – – 460,578
Total Investments in Securities 34,898,790 929,586,970 0 964,485,760
Other Investments - Assets*
Forward Foreign Currency Contracts – 39,169 – 39,169
Other Investments - Liabilities*
Forward Foreign Currency Contracts – (56,067) – (56,067)
Options Written (172,850) – – (172,850)
(172,850) (56,067) – (228,917)
Total Other Investments (172,850) (16,898) 0 (189,748)
Total Investments $34,725,940 $929,570,072 $0 $964,296,012
* Forward foreign currency contracts are valued at unrealized appreciation (depreciation). Options Written are shown at value.
NOTE 4–Derivative InvestmentsThe Fund may enter into an International Swaps and Derivatives Association Master Agreement (“ISDA Master Agreement”) under which afund may trade OTC derivatives. An OTC transaction entered into under an ISDA Master Agreement typically involves a collateral postingarrangement, payment netting provisions and close-out netting provisions. These netting provisions allow for reduction of credit risk throughnetting of contractual obligations. The enforceability of the netting provisions of the ISDA Master Agreement depends on the governing lawof the ISDA Master Agreement, among other factors.
For financial reporting purposes, the Fund does not offset OTC derivative assets or liabilities that are subject to ISDA Master Agreementsin the Statement of Assets and Liabilities.
Value of Derivative Investments at Period-End
The table below summarizes the value of the Fund’s derivative investments, detailed by primary risk exposure, held as of August 31, 2021:
Value
Derivative Assets Currency
Risk EquityRisk Total
Unrealized appreciation on forward foreign currency contracts outstanding $ 39,169 $ - $ 39,169
Options purchased, at value - Exchange-Traded(a) - 460,578 460,578
Total Derivative Assets 39,169 460,578 499,747
Derivatives not subject to master netting agreements - (460,578) (460,578)
Total Derivative Assets subject to master netting agreements $ 39,169 $ - $ 39,169
Value
Derivative Liabilities Currency
Risk EquityRisk Total
Unrealized depreciation on forward foreign currency contracts outstanding $(56,067) $ - $ (56,067)
Options written, at value - Exchange-Traded - (172,850) (172,850)
Total Derivative Liabilities (56,067) (172,850) (228,917)
Derivatives not subject to master netting agreements - 172,850 172,850
Total Derivative Liabilities subject to master netting agreements $(56,067) $ - $ (56,067)
(a) Options purchased, at value as reported in the Schedule of Investments. 21 Invesco High Yield Fund
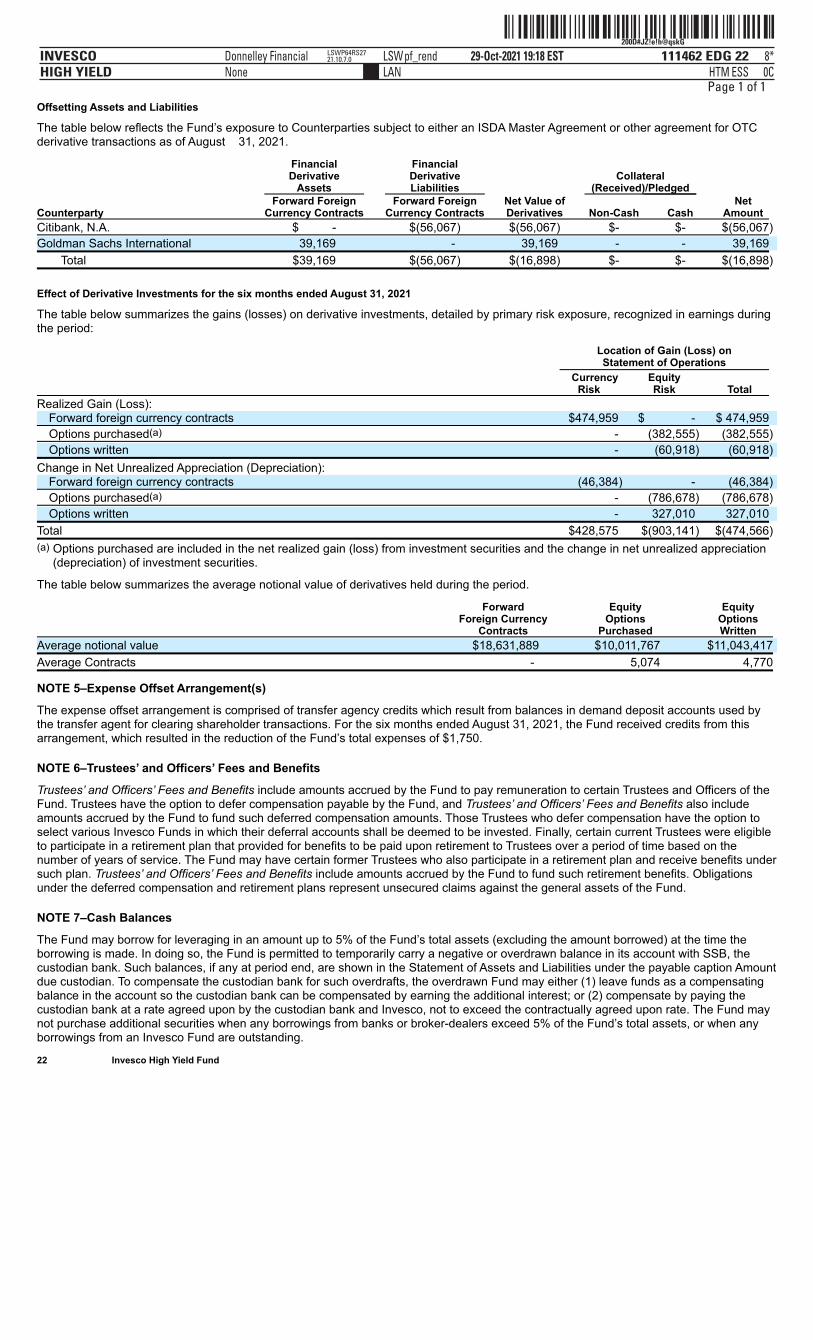
ˆ200D#JZ!e!h@qskGÀŠ200D#JZ!e!h@qskG
111462 EDG 22INVESCOHIGH YIELD
29-Oct-2021 19:18 ESTHTMLAN
Donnelley Financial LSWpf_rendNone
8*ESS 0C
LSWP64RS2721.10.7.0
Page 1 of 1Offsetting Assets and Liabilities
The table below reflects the Fund’s exposure to Counterparties subject to either an ISDA Master Agreement or other agreement for OTCderivative transactions as of August 31, 2021.
Financial Financial Derivative Derivative Collateral Assets Liabilities (Received)/Pledged Forward Foreign Forward Foreign Net Value of Net Counterparty Currency Contracts Currency Contracts Derivatives Non-Cash Cash Amount
Citibank, N.A. $ - $(56,067) $(56,067) $- $- $(56,067)
Goldman Sachs International 39,169 - 39,169 - - 39,169
Total $39,169 $(56,067) $(16,898) $- $- $(16,898)
Effect of Derivative Investments for the six months ended August 31, 2021
The table below summarizes the gains (losses) on derivative investments, detailed by primary risk exposure, recognized in earnings duringthe period:
Location of Gain (Loss) onStatement of Operations
Currency
Risk EquityRisk Total
Realized Gain (Loss): Forward foreign currency contracts $474,959 $ - $ 474,959
Options purchased(a) - (382,555) (382,555)
Options written - (60,918) (60,918)
Change in Net Unrealized Appreciation (Depreciation): Forward foreign currency contracts (46,384) - (46,384)
Options purchased(a) - (786,678) (786,678)
Options written - 327,010 327,010
Total $428,575 $(903,141) $(474,566)
(a) Options purchased are included in the net realized gain (loss) from investment securities and the change in net unrealized appreciation(depreciation) of investment securities.
The table below summarizes the average notional value of derivatives held during the period.
Forward Equity Equity Foreign Currency Options Options Contracts Purchased Written
Average notional value $18,631,889 $10,011,767 $11,043,417
Average Contracts - 5,074 4,770
NOTE 5–Expense Offset Arrangement(s)
The expense offset arrangement is comprised of transfer agency credits which result from balances in demand deposit accounts used bythe transfer agent for clearing shareholder transactions. For the six months ended August 31, 2021, the Fund received credits from thisarrangement, which resulted in the reduction of the Fund’s total expenses of $1,750.
NOTE 6–Trustees’ and Officers’ Fees and Benefits
Trustees’ and Officers’ Fees and Benefits include amounts accrued by the Fund to pay remuneration to certain Trustees and Officers of theFund. Trustees have the option to defer compensation payable by the Fund, and Trustees’ and Officers’ Fees and Benefits also includeamounts accrued by the Fund to fund such deferred compensation amounts. Those Trustees who defer compensation have the option toselect various Invesco Funds in which their deferral accounts shall be deemed to be invested. Finally, certain current Trustees were eligibleto participate in a retirement plan that provided for benefits to be paid upon retirement to Trustees over a period of time based on thenumber of years of service. The Fund may have certain former Trustees who also participate in a retirement plan and receive benefits undersuch plan. Trustees’ and Officers’ Fees and Benefits include amounts accrued by the Fund to fund such retirement benefits. Obligationsunder the deferred compensation and retirement plans represent unsecured claims against the general assets of the Fund.
NOTE 7–Cash Balances
The Fund may borrow for leveraging in an amount up to 5% of the Fund’s total assets (excluding the amount borrowed) at the time theborrowing is made. In doing so, the Fund is permitted to temporarily carry a negative or overdrawn balance in its account with SSB, thecustodian bank. Such balances, if any at period end, are shown in the Statement of Assets and Liabilities under the payable caption Amountdue custodian. To compensate the custodian bank for such overdrafts, the overdrawn Fund may either (1) leave funds as a compensatingbalance in the account so the custodian bank can be compensated by earning the additional interest; or (2) compensate by paying thecustodian bank at a rate agreed upon by the custodian bank and Invesco, not to exceed the contractually agreed upon rate. The Fund maynot purchase additional securities when any borrowings from banks or broker-dealers exceed 5% of the Fund’s total assets, or when anyborrowings from an Invesco Fund are outstanding. 22 Invesco High Yield Fund
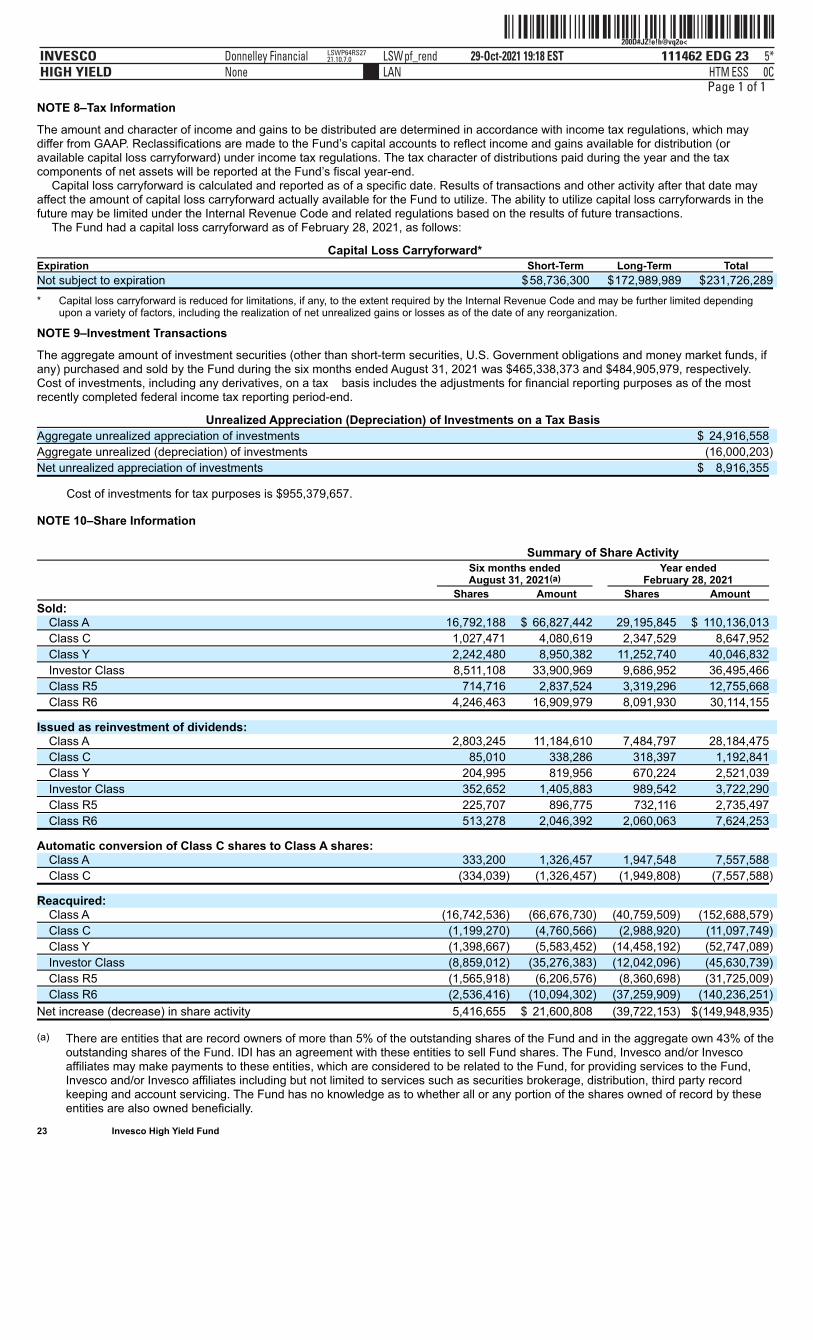
ˆ200D#JZ!e!h@vq2o<Š200D#JZ!e!h@vq2o<
111462 EDG 23INVESCOHIGH YIELD
29-Oct-2021 19:18 ESTHTMLAN
Donnelley Financial LSWpf_rendNone
5*ESS 0C
LSWP64RS2721.10.7.0
Page 1 of 1NOTE 8–Tax Information
The amount and character of income and gains to be distributed are determined in accordance with income tax regulations, which maydiffer from GAAP. Reclassifications are made to the Fund’s capital accounts to reflect income and gains available for distribution (oravailable capital loss carryforward) under income tax regulations. The tax character of distributions paid during the year and the taxcomponents of net assets will be reported at the Fund’s fiscal year-end.
Capital loss carryforward is calculated and reported as of a specific date. Results of transactions and other activity after that date mayaffect the amount of capital loss carryforward actually available for the Fund to utilize. The ability to utilize capital loss carryforwards in thefuture may be limited under the Internal Revenue Code and related regulations based on the results of future transactions.
The Fund had a capital loss carryforward as of February 28, 2021, as follows:
Capital Loss Carryforward*
Expiration Short-Term Long-Term Total
Not subject to expiration $58,736,300 $172,989,989 $231,726,289
* Capital loss carryforward is reduced for limitations, if any, to the extent required by the Internal Revenue Code and may be further limited dependingupon a variety of factors, including the realization of net unrealized gains or losses as of the date of any reorganization.
NOTE 9–Investment Transactions
The aggregate amount of investment securities (other than short-term securities, U.S. Government obligations and money market funds, ifany) purchased and sold by the Fund during the six months ended August 31, 2021 was $465,338,373 and $484,905,979, respectively.Cost of investments, including any derivatives, on a tax basis includes the adjustments for financial reporting purposes as of the mostrecently completed federal income tax reporting period-end.
Unrealized Appreciation (Depreciation) of Investments on a Tax Basis
Aggregate unrealized appreciation of investments $ 24,916,558
Aggregate unrealized (depreciation) of investments (16,000,203)
Net unrealized appreciation of investments $ 8,916,355
Cost of investments for tax purposes is $955,379,657.
NOTE 10–Share Information Summary of Share Activity
Six months ended Year ended August 31, 2021(a) February 28, 2021
Shares Amount Shares Amount
Sold: Class A 16,792,188 $ 66,827,442 29,195,845 $ 110,136,013
Class C 1,027,471 4,080,619 2,347,529 8,647,952
Class Y 2,242,480 8,950,382 11,252,740 40,046,832
Investor Class 8,511,108 33,900,969 9,686,952 36,495,466
Class R5 714,716 2,837,524 3,319,296 12,755,668
Class R6 4,246,463 16,909,979 8,091,930 30,114,155
Issued as reinvestment of dividends: Class A 2,803,245 11,184,610 7,484,797 28,184,475
Class C 85,010 338,286 318,397 1,192,841
Class Y 204,995 819,956 670,224 2,521,039
Investor Class 352,652 1,405,883 989,542 3,722,290
Class R5 225,707 896,775 732,116 2,735,497
Class R6 513,278 2,046,392 2,060,063 7,624,253
Automatic conversion of Class C shares to Class A shares: Class A 333,200 1,326,457 1,947,548 7,557,588
Class C (334,039) (1,326,457) (1,949,808) (7,557,588)
Reacquired: Class A (16,742,536) (66,676,730) (40,759,509) (152,688,579)
Class C (1,199,270) (4,760,566) (2,988,920) (11,097,749)
Class Y (1,398,667) (5,583,452) (14,458,192) (52,747,089)
Investor Class (8,859,012) (35,276,383) (12,042,096) (45,630,739)
Class R5 (1,565,918) (6,206,576) (8,360,698) (31,725,009)
Class R6 (2,536,416) (10,094,302) (37,259,909) (140,236,251)
Net increase (decrease) in share activity 5,416,655 $ 21,600,808 (39,722,153) $(149,948,935)
(a) There are entities that are record owners of more than 5% of the outstanding shares of the Fund and in the aggregate own 43% of theoutstanding shares of the Fund. IDI has an agreement with these entities to sell Fund shares. The Fund, Invesco and/or Invescoaffiliates may make payments to these entities, which are considered to be related to the Fund, for providing services to the Fund,Invesco and/or Invesco affiliates including but not limited to services such as securities brokerage, distribution, third party recordkeeping and account servicing. The Fund has no knowledge as to whether all or any portion of the shares owned of record by theseentities are also owned beneficially.
23 Invesco High Yield Fund
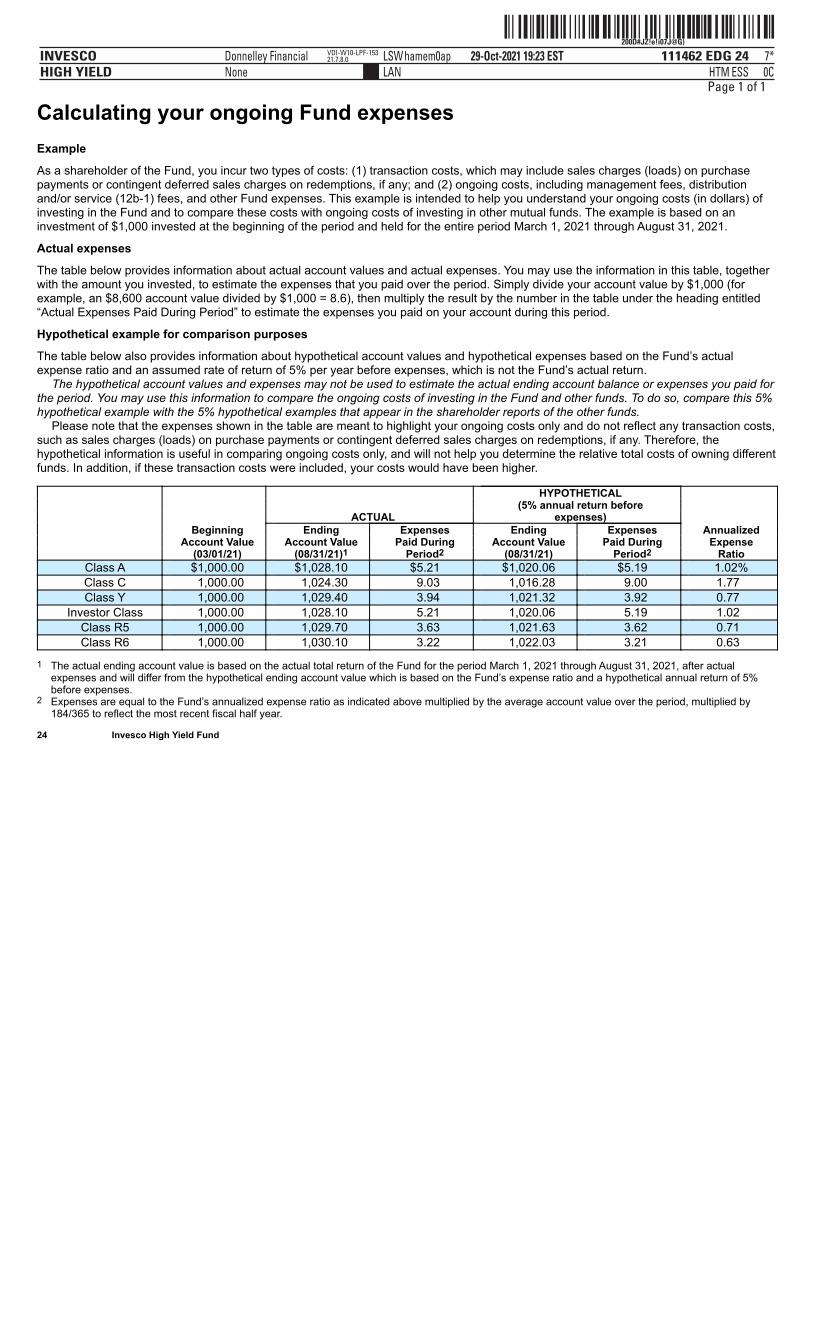
ˆ200D#JZ!e!i07J@G)Š200D#JZ!e!i07J@G)
111462 EDG 24INVESCOHIGH YIELD
29-Oct-2021 19:23 ESTHTMLAN
Donnelley Financial LSWhamem0apNone
7*ESS 0C
VDI-W10-LPF-15321.7.8.0
Page 1 of 1
Calculating your ongoing Fund expensesExample
As a shareholder of the Fund, you incur two types of costs: (1) transaction costs, which may include sales charges (loads) on purchasepayments or contingent deferred sales charges on redemptions, if any; and (2) ongoing costs, including management fees, distributionand/or service (12b-1) fees, and other Fund expenses. This example is intended to help you understand your ongoing costs (in dollars) ofinvesting in the Fund and to compare these costs with ongoing costs of investing in other mutual funds. The example is based on aninvestment of $1,000 invested at the beginning of the period and held for the entire period March 1, 2021 through August 31, 2021.
Actual expenses
The table below provides information about actual account values and actual expenses. You may use the information in this table, togetherwith the amount you invested, to estimate the expenses that you paid over the period. Simply divide your account value by $1,000 (forexample, an $8,600 account value divided by $1,000 = 8.6), then multiply the result by the number in the table under the heading entitled“Actual Expenses Paid During Period” to estimate the expenses you paid on your account during this period.
Hypothetical example for comparison purposes
The table below also provides information about hypothetical account values and hypothetical expenses based on the Fund’s actualexpense ratio and an assumed rate of return of 5% per year before expenses, which is not the Fund’s actual return.
The hypothetical account values and expenses may not be used to estimate the actual ending account balance or expenses you paid forthe period. You may use this information to compare the ongoing costs of investing in the Fund and other funds. To do so, compare this 5%hypothetical example with the 5% hypothetical examples that appear in the shareholder reports of the other funds.
Please note that the expenses shown in the table are meant to highlight your ongoing costs only and do not reflect any transaction costs,such as sales charges (loads) on purchase payments or contingent deferred sales charges on redemptions, if any. Therefore, thehypothetical information is useful in comparing ongoing costs only, and will not help you determine the relative total costs of owning differentfunds. In addition, if these transaction costs were included, your costs would have been higher.
HYPOTHETICAL (5% annual return before ACTUAL expenses) Beginning Ending Expenses Ending Expenses Annualized Account Value Account Value Paid During Account Value Paid During Expense (03/01/21) (08/31/21)1 Period2 (08/31/21) Period2 Ratio
Class A $1,000.00 $1,028.10 $5.21 $1,020.06 $5.19 1.02%Class C 1,000.00 1,024.30 9.03 1,016.28 9.00 1.77 Class Y 1,000.00 1,029.40 3.94 1,021.32 3.92 0.77
Investor Class 1,000.00 1,028.10 5.21 1,020.06 5.19 1.02 Class R5 1,000.00 1,029.70 3.63 1,021.63 3.62 0.71 Class R6 1,000.00 1,030.10 3.22 1,022.03 3.21 0.63
1 The actual ending account value is based on the actual total return of the Fund for the period March 1, 2021 through August 31, 2021, after actualexpenses and will differ from the hypothetical ending account value which is based on the Fund’s expense ratio and a hypothetical annual return of 5%before expenses.
2 Expenses are equal to the Fund’s annualized expense ratio as indicated above multiplied by the average account value over the period, multiplied by184/365 to reflect the most recent fiscal half year.
24 Invesco High Yield Fund
ˆ200D#JZ!e!h@!P0ooŠ200D#JZ!e!h@!P0oo
111462 EDG 25INVESCOHIGH YIELD
29-Oct-2021 19:18 ESTHTMLAN
Donnelley Financial LSWpf_rendNone
6*ESS 0C
LSWP64RS2721.10.7.0
Page 1 of 2
Approval of Investment Advisory and Sub-Advisory Contracts
At meetings held on June 10, 2021, theBoard of Trustees (the Board or theTrustees) of AIM Investment SecuritiesFunds (Invesco Investment SecuritiesFunds) as a whole, and the independentTrustees, who comprise over 75% of theBoard, voting separately, approved thecontinuance of the Invesco High YieldFund’s (the Fund) Master InvestmentAdvisory Agreement with Invesco Advisers,Inc. (Invesco Advisers and the investmentadvisory agreement) and the MasterIntergroup Sub-Advisory Contract forMutual Funds with Invesco AssetManagement Deutschland GmbH, InvescoAsset Management Limited, Invesco AssetManagement (Japan) Limited, InvescoHong Kong Limited, Invesco SeniorSecured Management, Inc. and InvescoCanada Ltd. and separate sub-advisorycontracts with Invesco CapitalManagement LLC and Invesco AssetManagement (India) Private Limited(collectively, the Affiliated Sub-Advisersand the sub-advisory contracts) for anotheryear, effective July 1, 2021. Afterevaluating the factors discussed below,among others, the Board approved therenewal of the Fund’s investment advisoryagreement and the sub-advisory contractsand determined that the compensationpayable thereunder by the Fund to InvescoAdvisers and by Invesco Advisers to the
process to ensure they are negotiated in amanner that is at arms’ length andreasonable. In addition to meetings withInvesco Advisers and fund counselthroughout the year and as part of meetingsconvened on April 27, 2021 and June 10,2021, the independent Trustees alsodiscussed the continuance of the investmentadvisory agreement and sub-advisorycontracts in separate sessions with theSenior Officer and with independent legalcounsel.
The discussion below is a summary of theSenior Officer’s independent writtenevaluation with respect to the Fund’sinvestment advisory agreement andsub-advisory contracts, as well as adiscussion of the material factors andrelated conclusions that formed the basis forthe Board’s approval of the Fund’sinvestment advisory agreement andsub-advisory contracts. The Trustees’ reviewand conclusions are based on thecomprehensive consideration of allinformation presented to them during thecourse of the year and in prior years and arenot the result of any single determinativefactor. Moreover, one Trustee may haveweighed a particular piece of information orfactor differently than another Trustee. Theinformation received and considered by theBoard was current as of various dates priorto the Board’s approval on June 10, 2021.
part of the family of funds under theumbrella of Invesco Ltd., Invesco Advisers’parent company, and noted Invesco Ltd.’sdepth and experience in running aninvestment management business, as wellas its commitment of financial and otherresources to such business. The Boardconcluded that the nature, extent andquality of the services provided to the Fundby Invesco Advisers are appropriate andsatisfactory.
The Board reviewed the services thatmay be provided by the AffiliatedSub-Advisers under the sub-advisorycontracts and the credentials andexperience of the officers and employeesof the Affiliated Sub-Advisers who providethese services. The Board noted theAffiliated Sub-Advisers’ expertise withrespect to certain asset classes and thatthe Affiliated Sub-Advisers have officesand personnel that are located in financialcenters around the world. As a result, theBoard noted that the AffiliatedSub-Advisers can provide research andinvestment analysis on the markets andeconomies of various countries in whichthe Fund may invest, makerecommendations regarding securities andassist with security trades. The Boardconcluded that the sub-advisory contractsmay benefit the Fund and its shareholdersby permitting Invesco Advisers to use the

ˆ200D#JZ!e!h@!P0ooŠ200D#JZ!e!h@!P0oo
111462 EDG 25INVESCOHIGH YIELD
29-Oct-2021 19:18 ESTHTMLAN
Donnelley Financial LSWpf_rendNone
6*ESS 0C
LSWP64RS2721.10.7.0
ˆ200D#JZ!e!h@!P0ooŠ200D#JZ!e!h@!P0oo
111462 EDG 25INVESCOHIGH YIELD
29-Oct-2021 19:18 ESTHTMLAN
Donnelley Financial LSWpf_rendNone
6*ESS 0C
LSWP64RS2721.10.7.0
Page 2 of 2
25 Invesco High Yield Fund
Affiliated Sub-Advisers is fair andreasonable.The Board’s Evaluation ProcessThe Board has established an InvestmentsCommittee, which in turn has establishedSub-Committees that meet throughout theyear to review the performance of fundsadvised by Invesco Advisers (the InvescoFunds). The Sub-Committees meetregularly with portfolio managers for theirassigned Invesco Funds and othermembers of management to reviewdetailed information about investmentperformance and portfolio attributes ofthese funds. The Board has establishedadditional standing and ad hoc committeesthat meet regularly throughout the year toreview matters within their purview. TheBoard took into account evaluations andreports that it received from its committeesand sub-committees, as well as theinformation provided to the Board and itscommittees and sub-committeesthroughout the year, in consideringwhether to approve each Invesco Fund’sinvestment advisory agreement andsub-advisory contracts.
As part of the contract renewal process,the Board reviews and considersinformation provided in response todetailed requests for information submittedto management by the independentTrustees with assistance from legalcounsel to the independent Trustees. TheBoard receives comparative investmentperformance and fee and expense dataregarding the Invesco Funds prepared byBroadridge Financial Solutions, Inc.(Broadridge), an independent mutual funddata provider, as well as information on thecomposition of the peer groups providedby Broadridge and its methodology fordetermining peer groups. The Board alsoreceives an independent written evaluationfrom the Senior Officer, an officer of theInvesco Funds who reports directly to theindependent Trustees. The Senior Officer’sevaluation is prepared as part of hisresponsibility to manage the process bywhich the Invesco Funds’ proposedmanagement fees are negotiated duringthe annual contract renewal
Factors and Conclusions and Summaryof Independent Written Fee EvaluationA. Nature, Extent and Quality of Services
Provided by Invesco Advisers and theAffiliated Sub-Advisers
The Board reviewed the nature, extent andquality of the advisory services provided tothe Fund by Invesco Advisers under theFund’s investment advisory agreement, andthe credentials and experience of theofficers and employees of Invesco Adviserswho provide these services, including theFund’s portfolio manager(s). The Board’sreview included consideration of InvescoAdvisers’ investment process and oversight,credit analysis, and research capabilities.The Board considered information regardingInvesco Advisers’ programs for andresources devoted to risk management,including management of investment,enterprise, operational, liquidity, valuationand compliance risks, and technology usedto manage such risks. The Board alsoreceived and reviewed information aboutInvesco Advisers’ role as administrator ofthe Invesco Funds’ liquidity riskmanagement program. The Board receiveda description of Invesco Advisers’ businesscontinuity plans and of its approach to dataprivacy and cybersecurity, including relatedtesting. The Board considered how thecybersecurity and business continuity plansof Invesco Advisers and its key serviceproviders operated in the increased remoteworking environment resulting from thenovel coronavirus (“COVID-19”) pandemic.The Board also considered non-advisoryservices that Invesco Advisers and itsaffiliates provide to the Invesco Funds suchas various back office support functions,third party oversight, internal audit,valuation, portfolio trading and legal andcompliance. The Board observed thatInvesco Advisers has been able toeffectively manage, operate and oversee theInvesco Funds through the challengingCOVID-19 pandemic period. The Boardreviewed and considered the benefits toshareholders of investing in a Fund that is
resources and talents of the AffiliatedSub-Advisers in managing the Fund. TheBoard concluded that the nature, extentand quality of the services that may beprovided to the Fund by the AffiliatedSub-Advisers are appropriate andsatisfactory.B. Fund Investment PerformanceThe Board did not view Fund investmentperformance as a relevant factor inconsidering whether to approve thesub-advisory contracts for the Fund, as noAffiliated Sub-Adviser currently managesassets of the Fund.
The Board compared the Fund’sinvestment performance over multiple timeperiods ending December 31, 2020 to theperformance of funds in the Broadridgeperformance universe and against theBloomberg Barclays U.S. Corporate HighYield 2% Issuer Cap Index (Index). TheBoard noted that performance of Class Ashares of the Fund was in the fifth quintileof its performance universe for the one,three and five year periods (the firstquintile being the best performing fundsand the fifth quintile being the worstperforming funds). The Board noted thatperformance of Class A shares of the Fundwas below the performance of the Indexfor the one, three and five year periods.The Board noted that the Fund’s securityselection in certain industries and sectorsand exposure to longer duration credits, aswell as unsuccessful credit hedges,negatively impacted Fund performance.The Board recognized that theperformance data reflects a snapshot intime as of a particular date and thatselecting a different performance periodcould produce different results. The Boardalso reviewed more recent Fundperformance as well as other performancemetrics, which did not change itsconclusions.C. Advisory and Sub-Advisory Fees andFund ExpensesThe Board compared the Fund’scontractual management fee rate to thecontractual management fee rates of fundsin the Fund’s Broadridge expense
ˆ200D#JZ!e!h@$SNoÊ200D#JZ!e!h@$SNoˆ
111462 EDG 26INVESCOHIGH YIELD
29-Oct-2021 19:18 ESTHTMLAN
Donnelley Financial LSWpf_rendNone
4*ESS 0C
LSWP64RS2721.10.7.0
Page 1 of 2
group. The Board noted that thecontractual management fee rate forClass A shares of the Fund wasreasonably comparable to the mediancontractual management fee rate of fundsin its expense group. The Board noted thatthe term “contractual management fee” forfunds in the expense group may includeboth advisory and certain non-portfoliomanagement administrative services fees,but that Broadridge is not able to provideinformation on a fund by fund basis as towhat is included. The Board also reviewedthe methodology used by Broadridge incalculating expense group information,which includes using each fund’scontractual management fee schedule(including any applicable breakpoints) asreported in the most recent prospectus orstatement of additional information foreach fund in the expense group. TheBoard also considered comparativeinformation regarding the Fund’s totalexpense ratio and its various components.The Board noted that the Fund’s totalexpense ratio was in the fourth quintile ofits expense group and discussed withmanagement reasons for such relativetotal expenses.
The Board noted that Invesco Advisershas contractually agreed to waive feesand/or limit expenses of the Fund for theterm disclosed in the Fund’s registrationstatement in an amount necessary to limittotal annual operating expenses to aspecified percentage of average daily netassets for each class of the Fund.
The Board also considered the feescharged by Invesco Advisers and itsaffiliates to other client accounts that aresimilarly managed. Invesco Advisersreviewed with the Board differences in thescope of services it provides to the InvescoFunds relative to that provided by InvescoAdvisers and its affiliates to certain othertypes of client accounts, including, amongothers: management of cash flows as aresult of redemptions and purchases;necessary infrastructure such as officers,office space, technology, legal anddistribution; oversight of service providers;costs and business risks associated withlaunching new funds and sponsoring andmaintaining the product line; andcompliance with federal and state laws andregulations. Invesco Advisers also advisedthe Board that many of the similarlymanaged client accounts have all-inclusivefee structures, which are not easily
business infrastructure, technology andcybersecurity.E. Profitability and Financial ResourcesThe Board reviewed information fromInvesco Advisers concerning the costs of theadvisory and other services that InvescoAdvisers and its affiliates provide to theFund and the Invesco Funds and theprofitability of Invesco Advisers and itsaffiliates in providing these services in theaggregate and on an individualFund-by-Fund basis. The Board consideredthe methodology used for calculatingprofitability and noted that suchmethodology had recently been reviewedand enhanced. The Board noted thatInvesco Advisers continues to operate at anet profit from services Invesco Advisersand its affiliates provide to the InvescoFunds in the aggregate and to most Fundsindividually. The Board did not deem thelevel of profits realized by Invesco Advisersand its affiliates from providing suchservices to be excessive, given the nature,extent and quality of the services provided.The Board noted that Invesco Advisersprovided information demonstrating thatInvesco Advisers is financially sound andhas the resources necessary to perform itsobligations under the investment advisoryagreement, and provided representationsindicating that the Affiliated Sub-Advisersare financially sound and have theresources necessary to perform theirobligations under the sub-advisorycontracts.F. Collateral Benefits to Invesco Advisers and its
AffiliatesThe Board considered various other benefitsreceived by Invesco Advisers and itsaffiliates from the relationship with the Fund,including the fees received for providingadministrative, transfer agency anddistribution services to the Fund. The Boardreceived comparative information regardingfees charged for these services, includinginformation provided by Broadridge andother independent sources. The Boardreviewed the performance of InvescoAdvisers and its affiliates in providing theseservices and the organizational structureemployed to provide these services. TheBoard noted that these services areprovided to the Fund pursuant to writtencontracts that are reviewed and subject toapproval on an annual basis by the Boardbased on its determination that the servicesare required for the operation of the Fund.
The Board considered the benefitsrealized by Invesco Advisers and the
equal to 100% of the net advisory feeInvesco Advisers receives from theaffiliated money market funds with respectto the Fund’s investment in the affiliatedmoney market funds of uninvested cash,but not cash collateral. The Boardconcluded that the advisory fees payableto Invesco Advisers from the Fund’sinvestment of cash collateral from anysecurities lending arrangements in theaffiliated money market funds are forservices that are not duplicative of servicesprovided by Invesco Advisers to the Fund.
The Board also received informationabout commissions that an affiliated brokermay receive for executing certain tradesfor the Fund. Invesco Advisers and theAffiliated Sub-Advisers advised the Boardof the benefits to the Fund of executingtrades through the affiliated broker and thatsuch trades were executed in compliancewith rules under the federal securities lawsand consistent with best executionobligations.

ˆ200D#JZ!e!h@$SNoÊ200D#JZ!e!h@$SNoˆ
111462 EDG 26INVESCOHIGH YIELD
29-Oct-2021 19:18 ESTHTMLAN
Donnelley Financial LSWpf_rendNone
4*ESS 0C
LSWP64RS2721.10.7.0
ˆ200D#JZ!e!h@$SNoÊ200D#JZ!e!h@$SNoˆ
111462 EDG 26INVESCOHIGH YIELD
29-Oct-2021 19:18 ESTHTMLAN
Donnelley Financial LSWpf_rendNone
4*ESS 0C
LSWP64RS2721.10.7.0
Page 2 of 2
26 Invesco High Yield Fund
un-bundled.The Board also considered the services
that may be provided by the AffiliatedSub-Advisers pursuant to the sub-advisorycontracts, as well as the fees payable byInvesco Advisers to the AffiliatedSub-Advisers pursuant to the sub-advisorycontracts.D. Economies of Scale and BreakpointsThe Board considered the extent to whichthere may be economies of scale in theprovision of advisory services to the Fundand the Invesco Funds, and the extent towhich such economies of scale are sharedwith the Fund and the Invesco Funds. TheBoard considered that the Fund benefitsfrom economies of scale throughcontractual breakpoints in the Fund’sadvisory fee schedule, which generallyoperate to reduce the Fund’s expense ratioas it grows in size. The Board noted thatthe Fund also shares in economies ofscale through Invesco Advisers’ ability tonegotiate lower fee arrangements withthird party service providers. The Boardnoted that the Fund may also benefit fromeconomies of scale through initial feesetting, fee waivers and expensereimbursements, as well as InvescoAdvisers’ investment in its business,including investments in
realized by Invesco Advisers and theAffiliated Sub-Advisers as a result ofportfolio brokerage transactions executedthrough “soft dollar” arrangements. InvescoAdvisers noted that the Fund does notexecute brokerage transactions through“soft dollar” arrangements to any significantdegree.
The Board considered that the Fund’suninvested cash and cash collateral fromany securities lending arrangements may beinvested in registered money market fundsor, with regard to securities lending cashcollateral, unregistered funds that complywith Rule 2a-7 (collectively referred to as“affiliated money market funds”) advised byInvesco Advisers. The Board consideredinformation regarding the returns of theaffiliated money market funds relative tocomparable overnight investments, as wellas the fees paid by the affiliated moneymarket funds to Invesco Advisers and itsaffiliates. In this regard, the Board noted thatInvesco Advisers receives advisory feesfrom these affiliated money market fundsattributable to the Fund’s investments. TheBoard also noted that Invesco Advisers hascontractually agreed to waive throughvarying periods an amount

ˆ200D#JZ!e!h#0u3GWŠ200D#JZ!e!h#0u3GW
111462 EDG 27INVESCOHIGH YIELD
29-Oct-2021 19:18 ESTHTMLAN
Donnelley Financial LSWpf_rendNone
4*ESS 0C
LSWP64RS2721.10.7.0
Page 1 of 1
(This page intentionally left blank)
ˆ200D#JZ!e!h#1$LoTŠ200D#JZ!e!h#1$LoT
111462 EDG 28INVESCOHIGH YIELD
29-Oct-2021 19:18 ESTHTMLAN
Donnelley Financial LSWpf_rendNone
6*ESS 0C
LSWP64RS2721.10.7.0
page01page28
Page 1 of 1
Go paperless with eDeliveryVisit invesco.com/edelivery to enjoy the convenience and security of anytime electronic access to your investmentdocuments.With eDelivery, you can elect to have any or all of the following materials delivered straight to your inbox to download, saveand print from your own computer:
∎ Fund reports and prospectuses∎ Quarterly statements∎ Daily confirmations∎ Tax forms Invesco mailing informationSend general correspondence to Invesco Investment Services, Inc., P.O. Box 219078, Kansas City, MO 64121-9078. Important notice regarding delivery of security holder documentsTo reduce Fund expenses, only one copy of most shareholder documents may be mailed to shareholders with multipleaccounts at the same address (Householding). Mailing of your shareholder documents may be householded indefinitelyunless you instruct us otherwise. If you do not want the mailing of these documents to be combined with those for othermembers of your household, please contact Invesco Investment Services, Inc. at 800 959 4246 or contact your financialinstitution. We will begin sending you individual copies for each account within 30 days after receiving your request. Fund holdings and proxy voting informationThe Fund provides a complete list of its portfolio holdings four times each fiscal year, at the end of each fiscal quarter. For thesecond and fourth quarters, the list appears, respectively, in the Fund’s semiannual and annual reports to shareholders. Forthe first and third quarters, the Fund files the list with the Securities and Exchange Commission (SEC) as an exhibit to itsreports on Form N-PORT. The most recent list of portfolio holdings is available at invesco.com/completeqtrholdings.Shareholders can also look up the Fund’s Form N-PORT filings on the SEC website, sec.gov. The SEC file numbers for theFund are shown below.
A description of the policies and procedures that the Fund uses to determine how to vote proxies relating to portfoliosecurities is available without charge, upon request, from our Client Services department at 800 959 4246, or at invesco.com/corporate/about-us/esg. The information is also available on the SEC website, sec.gov.
Information regarding how the Fund voted proxies related to its portfolio securities during the most recent 12-month periodended June 30 is available at invesco.com/proxysearch. This information is also available on the SEC website, sec.gov.
Invesco Advisers, Inc. is an investment adviser; it provides investment advisory services to individual and institutionalclients and does not sell securities. Invesco Distributors, Inc. is the US distributor for Invesco Ltd.’s retail mutual funds,exchange-traded funds and institutional money market funds. Both are wholly owned, indirect subsidiaries of Invesco Ltd.
SEC file number(s): 811-05686 and 033-39519 Invesco Distributors, Inc. HYI-SAR-1
ˆ200F9gPqaG&X2rpo@Š200F9gPqaG&X2rpo@
209905 EDG 1INVESCOHIGH YIELD BOND FACT
30-Oct-2021 03:09 ESTHTMDTF
Donnelley Financial LSWpf_rendNone
7*ESS 0C
FWPLAN-PFRS5221.10.7.0
dsp001a
Page 1 of 1
Semiannual Report to Shareholders
August 31, 2021
Invesco High Yield Bond Factor Fund Nasdaq: A: OGYAX ∎ C: OGYCX ∎ R: OGYNX ∎ Y: OGYYX ∎ R5: GBHYX ∎ R6: OGYIX
2 Fund Performance4 Liquidity Risk Management Program5 Schedule of Investments13 Financial Statements16 Financial Highlights17 Notes to Financial Statements24 Fund Expenses25 Approval of Investment Advisory and Sub-Advisory Contracts
For the most current month-end Fund performance and commentary, please visit invesco.com/performance.Unless otherwise noted, all data provided by Invesco.This report must be accompanied or preceded by a currently effective Fund prospectus, which contains more complete information, includingsales charges and expenses. Investors should read it carefully before investing.
NOT FDIC INSURED | MAY LOSE VALUE | NO BANK GUARANTEE
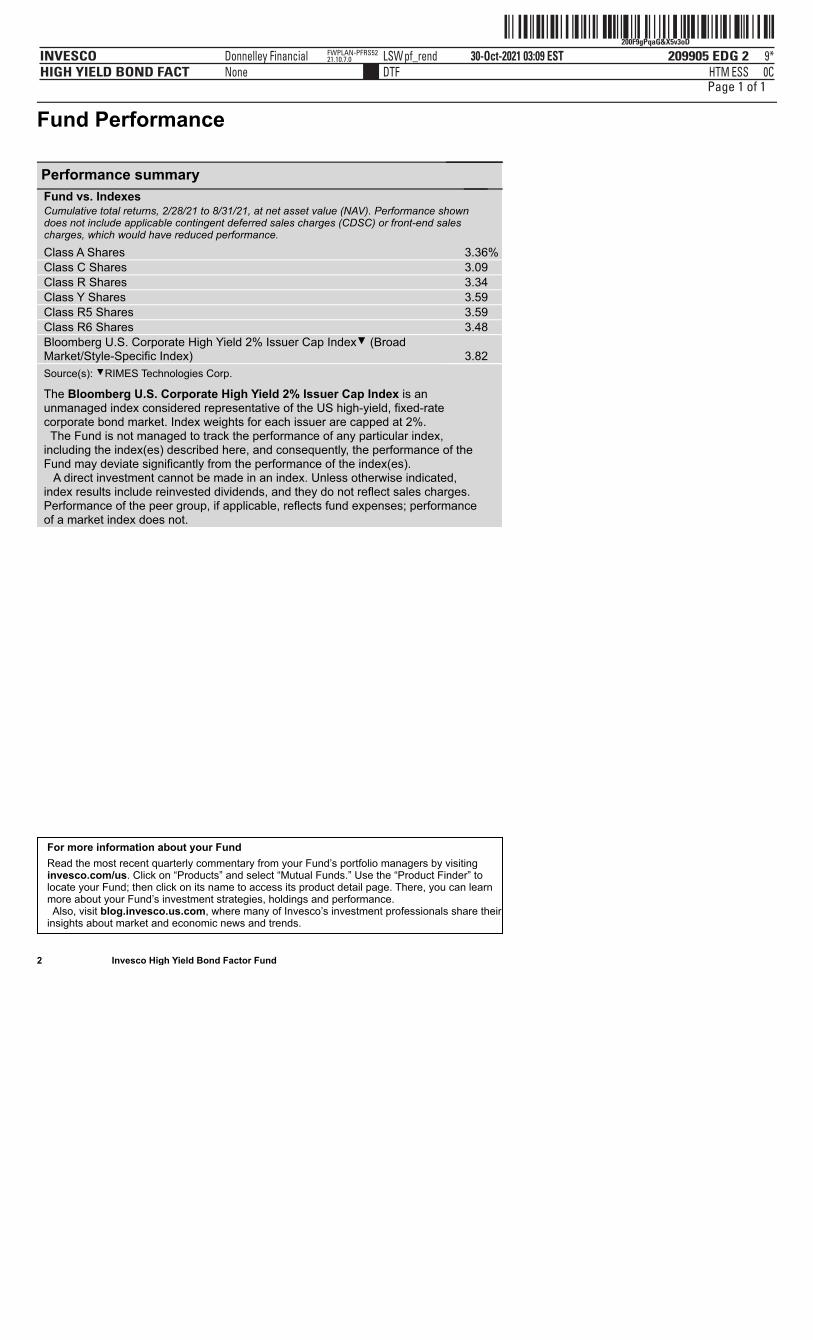
ˆ200F9gPqaG&X5v3oDŠ200F9gPqaG&X5v3oD
209905 EDG 2INVESCOHIGH YIELD BOND FACT
30-Oct-2021 03:09 ESTHTMDTF
Donnelley Financial LSWpf_rendNone
9*ESS 0C
FWPLAN-PFRS5221.10.7.0
Page 1 of 1
Fund Performance
2 Invesco High Yield Bond Factor Fund
Performance summary
Fund vs. Indexes Cumulative total returns, 2/28/21 to 8/31/21, at net asset value (NAV). Performance showndoes not include applicable contingent deferred sales charges (CDSC) or front-end salescharges, which would have reduced performance.
Class A Shares 3.36% Class C Shares 3.09 Class R Shares 3.34 Class Y Shares 3.59 Class R5 Shares 3.59 Class R6 Shares 3.48 Bloomberg U.S. Corporate High Yield 2% Issuer Cap Index▼ (BroadMarket/Style-Specific Index) 3.82 Source(s): ▼RIMES Technologies Corp. The Bloomberg U.S. Corporate High Yield 2% Issuer Cap Index is anunmanaged index considered representative of the US high-yield, fixed-ratecorporate bond market. Index weights for each issuer are capped at 2%. The Fund is not managed to track the performance of any particular index,including the index(es) described here, and consequently, the performance of theFund may deviate significantly from the performance of the index(es). A direct investment cannot be made in an index. Unless otherwise indicated,index results include reinvested dividends, and they do not reflect sales charges.Performance of the peer group, if applicable, reflects fund expenses; performanceof a market index does not.
For more information about your FundRead the most recent quarterly commentary from your Fund’s portfolio managers by visitinginvesco.com/us. Click on “Products” and select “Mutual Funds.” Use the “Product Finder” tolocate your Fund; then click on its name to access its product detail page. There, you can learnmore about your Fund’s investment strategies, holdings and performance. Also, visit blog.invesco.us.com, where many of Invesco’s investment professionals share theirinsights about market and economic news and trends.
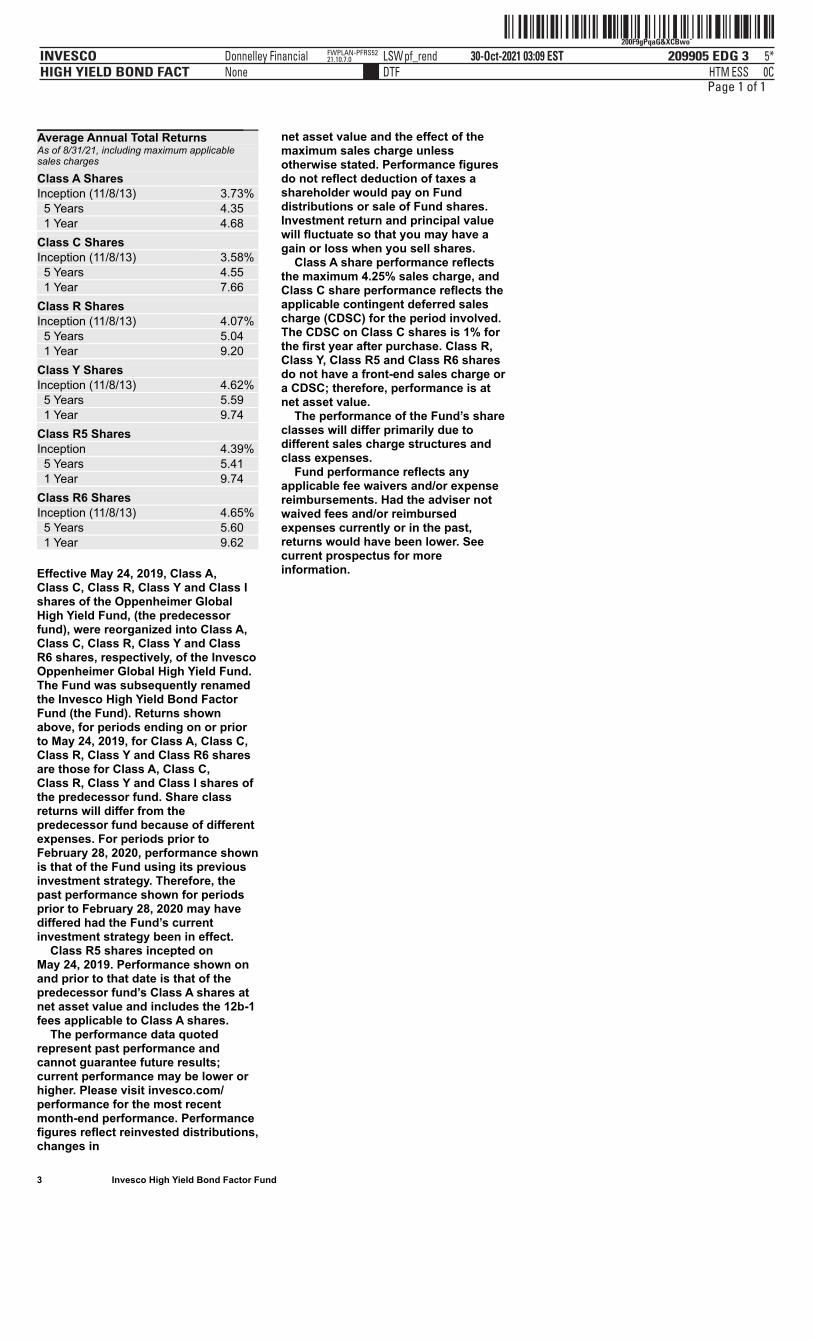
ˆ200F9gPqaG&XCBwoÆŠ200F9gPqaG&XCBwo˘
209905 EDG 3INVESCOHIGH YIELD BOND FACT
30-Oct-2021 03:09 ESTHTMDTF
Donnelley Financial LSWpf_rendNone
5*ESS 0C
FWPLAN-PFRS5221.10.7.0
Page 1 of 1
3 Invesco High Yield Bond Factor Fund
Average Annual Total Returns As of 8/31/21, including maximum applicablesales charges
Class A Shares Inception (11/8/13) 3.73% 5 Years 4.35 1 Year 4.68 Class C Shares Inception (11/8/13) 3.58% 5 Years 4.55 1 Year 7.66 Class R Shares Inception (11/8/13) 4.07% 5 Years 5.04 1 Year 9.20 Class Y Shares Inception (11/8/13) 4.62% 5 Years 5.59 1 Year 9.74 Class R5 Shares Inception 4.39% 5 Years 5.41 1 Year 9.74 Class R6 Shares Inception (11/8/13) 4.65% 5 Years 5.60 1 Year 9.62
Effective May 24, 2019, Class A,Class C, Class R, Class Y and Class Ishares of the Oppenheimer GlobalHigh Yield Fund, (the predecessorfund), were reorganized into Class A,Class C, Class R, Class Y and ClassR6 shares, respectively, of the InvescoOppenheimer Global High Yield Fund.The Fund was subsequently renamedthe Invesco High Yield Bond FactorFund (the Fund). Returns shownabove, for periods ending on or priorto May 24, 2019, for Class A, Class C,Class R, Class Y and Class R6 sharesare those for Class A, Class C,Class R, Class Y and Class I shares ofthe predecessor fund. Share classreturns will differ from thepredecessor fund because of differentexpenses. For periods prior toFebruary 28, 2020, performance shownis that of the Fund using its previousinvestment strategy. Therefore, thepast performance shown for periodsprior to February 28, 2020 may havediffered had the Fund’s currentinvestment strategy been in effect. Class R5 shares incepted onMay 24, 2019. Performance shown onand prior to that date is that of thepredecessor fund’s Class A shares atnet asset value and includes the 12b-1fees applicable to Class A shares. The performance data quotedrepresent past performance andcannot guarantee future results;current performance may be lower orhigher. Please visit invesco.com/performance for the most recentmonth-end performance. Performancefigures reflect reinvested distributions,changes in
net asset value and the effect of themaximum sales charge unlessotherwise stated. Performance figuresdo not reflect deduction of taxes ashareholder would pay on Funddistributions or sale of Fund shares.Investment return and principal valuewill fluctuate so that you may have again or loss when you sell shares. Class A share performance reflectsthe maximum 4.25% sales charge, andClass C share performance reflects theapplicable contingent deferred salescharge (CDSC) for the period involved.The CDSC on Class C shares is 1% forthe first year after purchase. Class R,Class Y, Class R5 and Class R6 sharesdo not have a front-end sales charge ora CDSC; therefore, performance is atnet asset value. The performance of the Fund’s shareclasses will differ primarily due todifferent sales charge structures andclass expenses. Fund performance reflects anyapplicable fee waivers and/or expensereimbursements. Had the adviser notwaived fees and/or reimbursedexpenses currently or in the past,returns would have been lower. Seecurrent prospectus for moreinformation.
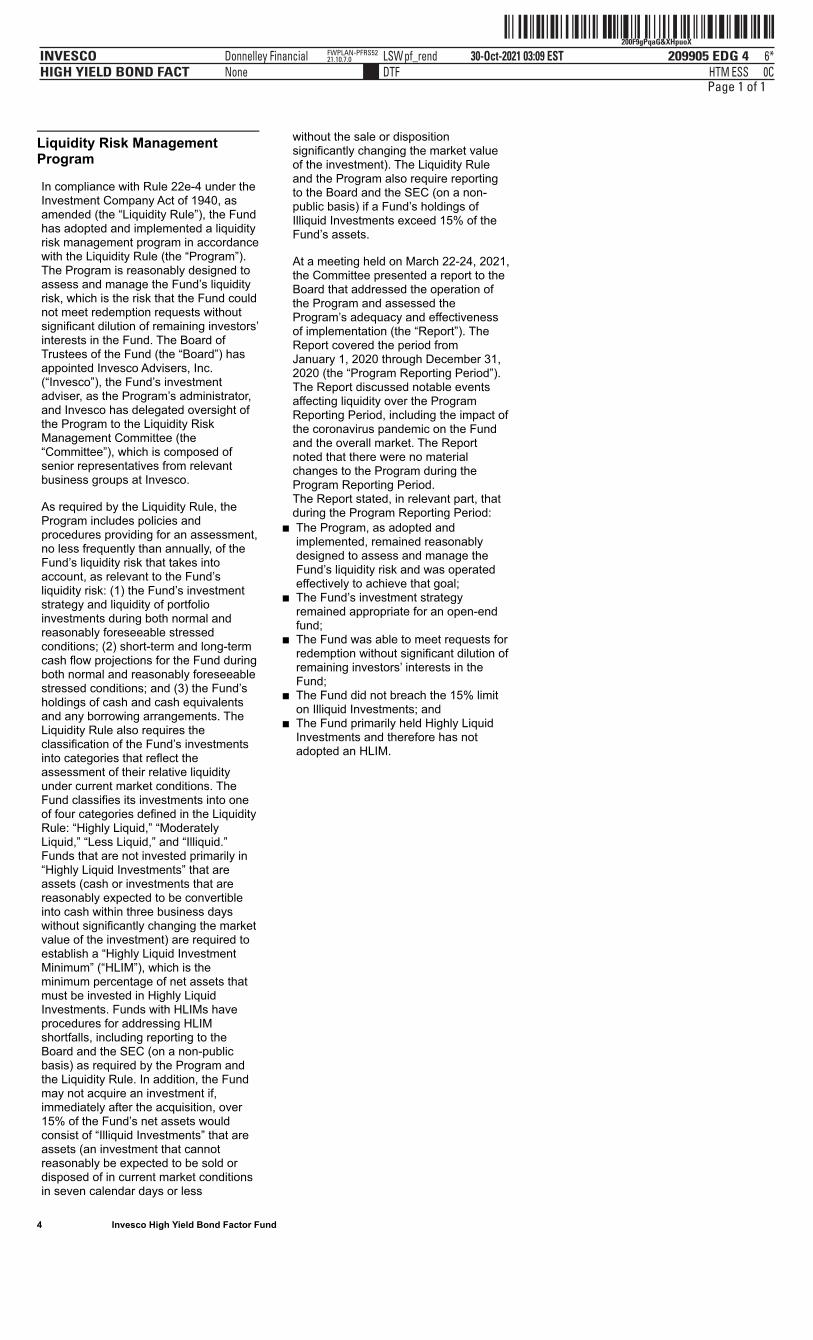
ˆ200F9gPqaG&XHpuoXŠ200F9gPqaG&XHpuoX
209905 EDG 4INVESCOHIGH YIELD BOND FACT
30-Oct-2021 03:09 ESTHTMDTF
Donnelley Financial LSWpf_rendNone
6*ESS 0C
FWPLAN-PFRS5221.10.7.0
Page 1 of 1
4 Invesco High Yield Bond Factor Fund
Liquidity Risk ManagementProgram
In compliance with Rule 22e-4 under theInvestment Company Act of 1940, asamended (the “Liquidity Rule”), the Fundhas adopted and implemented a liquidityrisk management program in accordancewith the Liquidity Rule (the “Program”).The Program is reasonably designed toassess and manage the Fund’s liquidityrisk, which is the risk that the Fund couldnot meet redemption requests withoutsignificant dilution of remaining investors’interests in the Fund. The Board ofTrustees of the Fund (the “Board”) hasappointed Invesco Advisers, Inc.(“Invesco”), the Fund’s investmentadviser, as the Program’s administrator,and Invesco has delegated oversight ofthe Program to the Liquidity RiskManagement Committee (the“Committee”), which is composed ofsenior representatives from relevantbusiness groups at Invesco.
As required by the Liquidity Rule, theProgram includes policies andprocedures providing for an assessment,no less frequently than annually, of theFund’s liquidity risk that takes intoaccount, as relevant to the Fund’sliquidity risk: (1) the Fund’s investmentstrategy and liquidity of portfolioinvestments during both normal andreasonably foreseeable stressedconditions; (2) short-term and long-termcash flow projections for the Fund duringboth normal and reasonably foreseeablestressed conditions; and (3) the Fund’sholdings of cash and cash equivalentsand any borrowing arrangements. TheLiquidity Rule also requires theclassification of the Fund’s investmentsinto categories that reflect theassessment of their relative liquidityunder current market conditions. TheFund classifies its investments into oneof four categories defined in the LiquidityRule: “Highly Liquid,” “ModeratelyLiquid,” “Less Liquid,” and “Illiquid.”Funds that are not invested primarily in“Highly Liquid Investments” that areassets (cash or investments that arereasonably expected to be convertibleinto cash within three business dayswithout significantly changing the marketvalue of the investment) are required toestablish a “Highly Liquid InvestmentMinimum” (“HLIM”), which is theminimum percentage of net assets thatmust be invested in Highly LiquidInvestments. Funds with HLIMs haveprocedures for addressing HLIMshortfalls, including reporting to theBoard and the SEC (on a non-publicbasis) as required by the Program andthe Liquidity Rule. In addition, the Fundmay not acquire an investment if,immediately after the acquisition, over15% of the Fund’s net assets wouldconsist of “Illiquid Investments” that areassets (an investment that cannotreasonably be expected to be sold ordisposed of in current market conditionsin seven calendar days or less
without the sale or dispositionsignificantly changing the market valueof the investment). The Liquidity Ruleand the Program also require reportingto the Board and the SEC (on a non-public basis) if a Fund’s holdings ofIlliquid Investments exceed 15% of theFund’s assets.
At a meeting held on March 22-24, 2021,the Committee presented a report to theBoard that addressed the operation ofthe Program and assessed theProgram’s adequacy and effectivenessof implementation (the “Report”). TheReport covered the period fromJanuary 1, 2020 through December 31,2020 (the “Program Reporting Period”).The Report discussed notable eventsaffecting liquidity over the ProgramReporting Period, including the impact ofthe coronavirus pandemic on the Fundand the overall market. The Reportnoted that there were no materialchanges to the Program during theProgram Reporting Period.The Report stated, in relevant part, thatduring the Program Reporting Period:
∎ The Program, as adopted andimplemented, remained reasonablydesigned to assess and manage theFund’s liquidity risk and was operatedeffectively to achieve that goal;
∎ The Fund’s investment strategyremained appropriate for an open-endfund;
∎ The Fund was able to meet requests forredemption without significant dilution ofremaining investors’ interests in theFund;
∎ The Fund did not breach the 15% limiton Illiquid Investments; and
∎ The Fund primarily held Highly LiquidInvestments and therefore has notadopted an HLIM.
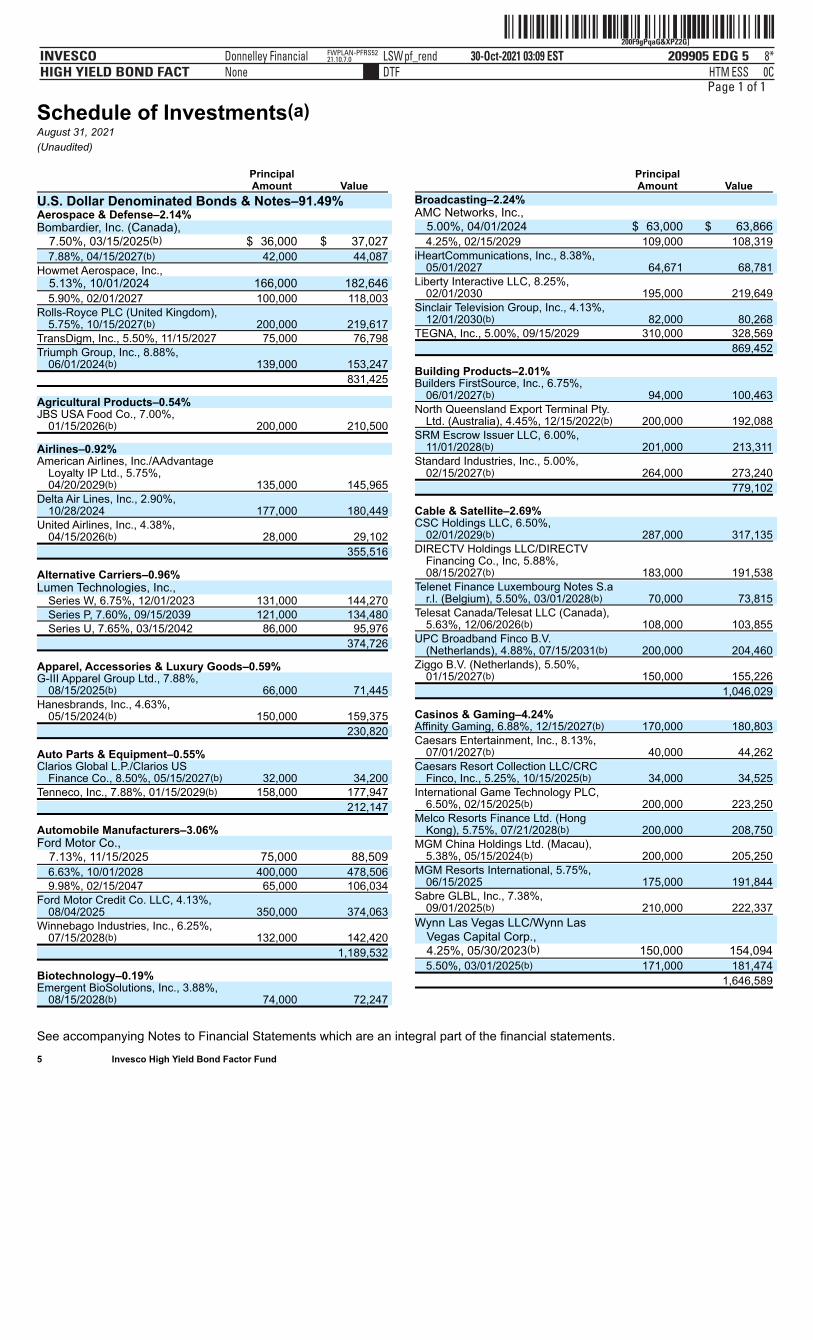
ˆ200F9gPqaG&XPZ2G]Š200F9gPqaG&XPZ2G]
209905 EDG 5INVESCOHIGH YIELD BOND FACT
30-Oct-2021 03:09 ESTHTMDTF
Donnelley Financial LSWpf_rendNone
8*ESS 0C
FWPLAN-PFRS5221.10.7.0
Page 1 of 1
Schedule of Investments(a)August 31, 2021(Unaudited)
See accompanying Notes to Financial Statements which are an integral part of the financial statements. 5 Invesco High Yield Bond Factor Fund
Principal Amount Value
U.S. Dollar Denominated Bonds & Notes–91.49% Aerospace & Defense–2.14% Bombardier, Inc. (Canada),
7.50%, 03/15/2025(b) $ 36,000 $ 37,027
7.88%, 04/15/2027(b) 42,000 44,087
Howmet Aerospace, Inc., 5.13%, 10/01/2024 166,000 182,646
5.90%, 02/01/2027 100,000 118,003
Rolls-Royce PLC (United Kingdom),5.75%, 10/15/2027(b) 200,000 219,617
TransDigm, Inc., 5.50%, 11/15/2027 75,000 76,798
Triumph Group, Inc., 8.88%,06/01/2024(b) 139,000 153,247
831,425
Agricultural Products–0.54% JBS USA Food Co., 7.00%,
01/15/2026(b) 200,000 210,500
Airlines–0.92% American Airlines, Inc./AAdvantage
Loyalty IP Ltd., 5.75%,04/20/2029(b) 135,000 145,965
Delta Air Lines, Inc., 2.90%,10/28/2024 177,000 180,449
United Airlines, Inc., 4.38%,04/15/2026(b) 28,000 29,102
355,516
Alternative Carriers–0.96% Lumen Technologies, Inc.,
Series W, 6.75%, 12/01/2023 131,000 144,270
Series P, 7.60%, 09/15/2039 121,000 134,480
Series U, 7.65%, 03/15/2042 86,000 95,976
374,726
Apparel, Accessories & Luxury Goods–0.59% G-III Apparel Group Ltd., 7.88%,
08/15/2025(b) 66,000 71,445
Hanesbrands, Inc., 4.63%,05/15/2024(b) 150,000 159,375
230,820
Auto Parts & Equipment–0.55% Clarios Global L.P./Clarios US
Finance Co., 8.50%, 05/15/2027(b) 32,000 34,200
Tenneco, Inc., 7.88%, 01/15/2029(b) 158,000 177,947
212,147
Automobile Manufacturers–3.06% Ford Motor Co.,
7.13%, 11/15/2025 75,000 88,509
6.63%, 10/01/2028 400,000 478,506
9.98%, 02/15/2047 65,000 106,034
Ford Motor Credit Co. LLC, 4.13%,08/04/2025 350,000 374,063
Winnebago Industries, Inc., 6.25%,07/15/2028(b) 132,000 142,420
1,189,532
Biotechnology–0.19% Emergent BioSolutions, Inc., 3.88%,
08/15/2028(b) 74,000 72,247
Principal Amount Value
Broadcasting–2.24% AMC Networks, Inc.,
5.00%, 04/01/2024 $ 63,000 $ 63,866
4.25%, 02/15/2029 109,000 108,319
iHeartCommunications, Inc., 8.38%,05/01/2027 64,671 68,781
Liberty Interactive LLC, 8.25%,02/01/2030 195,000 219,649
Sinclair Television Group, Inc., 4.13%,12/01/2030(b) 82,000 80,268
TEGNA, Inc., 5.00%, 09/15/2029 310,000 328,569
869,452
Building Products–2.01% Builders FirstSource, Inc., 6.75%,
06/01/2027(b) 94,000 100,463
North Queensland Export Terminal Pty.Ltd. (Australia), 4.45%, 12/15/2022(b) 200,000 192,088
SRM Escrow Issuer LLC, 6.00%,11/01/2028(b) 201,000 213,311
Standard Industries, Inc., 5.00%,02/15/2027(b) 264,000 273,240
779,102
Cable & Satellite–2.69% CSC Holdings LLC, 6.50%,
02/01/2029(b) 287,000 317,135
DIRECTV Holdings LLC/DIRECTVFinancing Co., Inc, 5.88%,08/15/2027(b) 183,000 191,538
Telenet Finance Luxembourg Notes S.ar.l. (Belgium), 5.50%, 03/01/2028(b) 70,000 73,815
Telesat Canada/Telesat LLC (Canada),5.63%, 12/06/2026(b) 108,000 103,855
UPC Broadband Finco B.V.(Netherlands), 4.88%, 07/15/2031(b) 200,000 204,460
Ziggo B.V. (Netherlands), 5.50%,01/15/2027(b) 150,000 155,226
1,046,029
Casinos & Gaming–4.24% Affinity Gaming, 6.88%, 12/15/2027(b) 170,000 180,803
Caesars Entertainment, Inc., 8.13%,07/01/2027(b) 40,000 44,262
Caesars Resort Collection LLC/CRCFinco, Inc., 5.25%, 10/15/2025(b) 34,000 34,525
International Game Technology PLC,6.50%, 02/15/2025(b) 200,000 223,250
Melco Resorts Finance Ltd. (HongKong), 5.75%, 07/21/2028(b) 200,000 208,750
MGM China Holdings Ltd. (Macau),5.38%, 05/15/2024(b) 200,000 205,250
MGM Resorts International, 5.75%,06/15/2025 175,000 191,844
Sabre GLBL, Inc., 7.38%,09/01/2025(b) 210,000 222,337
Wynn Las Vegas LLC/Wynn LasVegas Capital Corp., 4.25%, 05/30/2023(b) 150,000 154,094
5.50%, 03/01/2025(b) 171,000 181,474
1,646,589
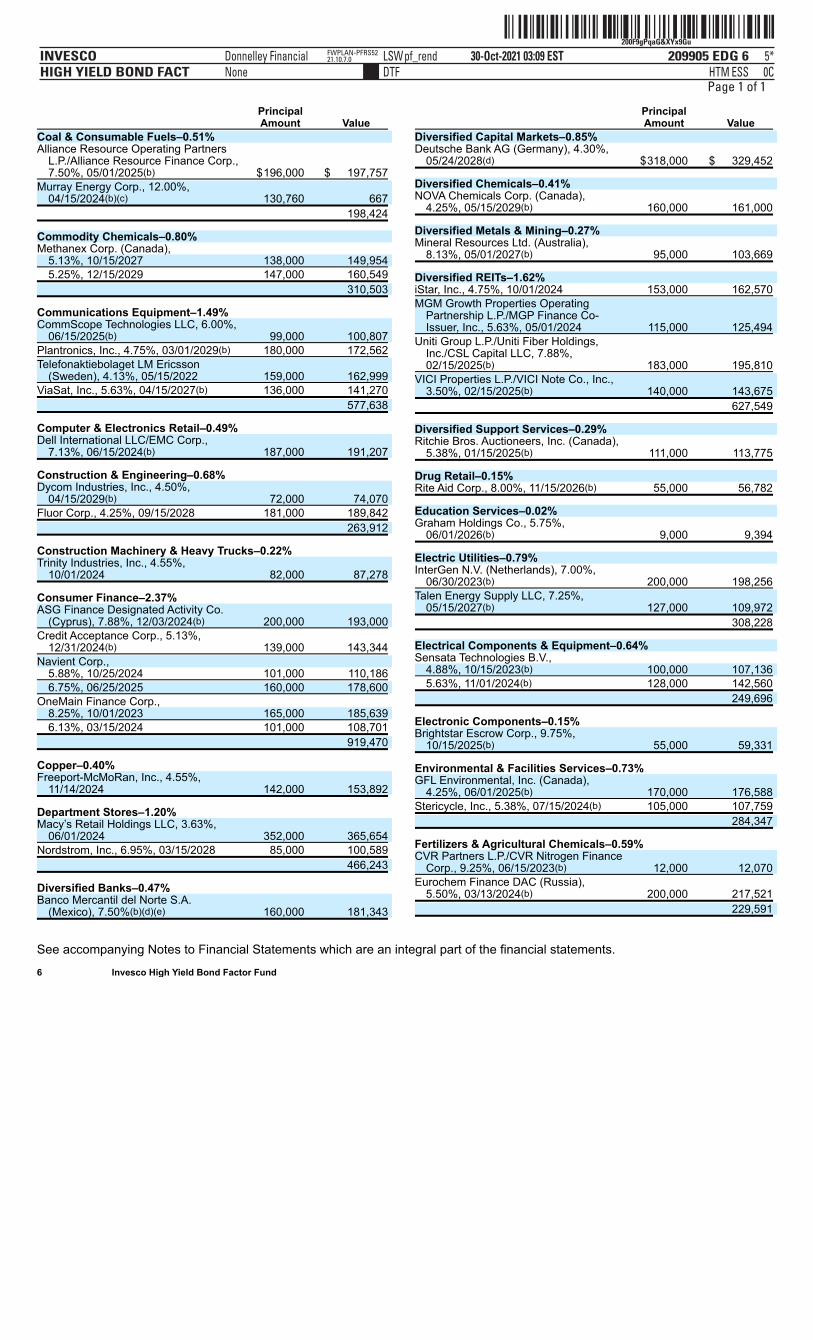
ˆ200F9gPqaG&XYx9GuŠ200F9gPqaG&XYx9Gu
209905 EDG 6INVESCOHIGH YIELD BOND FACT
30-Oct-2021 03:09 ESTHTMDTF
Donnelley Financial LSWpf_rendNone
5*ESS 0C
FWPLAN-PFRS5221.10.7.0
Page 1 of 1
See accompanying Notes to Financial Statements which are an integral part of the financial statements. 6 Invesco High Yield Bond Factor Fund
Principal Amount Value
Coal & Consumable Fuels–0.51% Alliance Resource Operating Partners
L.P./Alliance Resource Finance Corp.,7.50%, 05/01/2025(b) $196,000 $ 197,757
Murray Energy Corp., 12.00%,04/15/2024(b)(c) 130,760 667
198,424
Commodity Chemicals–0.80% Methanex Corp. (Canada),
5.13%, 10/15/2027 138,000 149,954
5.25%, 12/15/2029 147,000 160,549
310,503
Communications Equipment–1.49% CommScope Technologies LLC, 6.00%,
06/15/2025(b) 99,000 100,807
Plantronics, Inc., 4.75%, 03/01/2029(b) 180,000 172,562
Telefonaktiebolaget LM Ericsson(Sweden), 4.13%, 05/15/2022 159,000 162,999
ViaSat, Inc., 5.63%, 04/15/2027(b) 136,000 141,270
577,638
Computer & Electronics Retail–0.49% Dell International LLC/EMC Corp.,
7.13%, 06/15/2024(b) 187,000 191,207
Construction & Engineering–0.68% Dycom Industries, Inc., 4.50%,
04/15/2029(b) 72,000 74,070
Fluor Corp., 4.25%, 09/15/2028 181,000 189,842
263,912
Construction Machinery & Heavy Trucks–0.22% Trinity Industries, Inc., 4.55%,
10/01/2024 82,000 87,278
Consumer Finance–2.37% ASG Finance Designated Activity Co.
(Cyprus), 7.88%, 12/03/2024(b) 200,000 193,000
Credit Acceptance Corp., 5.13%,12/31/2024(b) 139,000 143,344
Navient Corp., 5.88%, 10/25/2024 101,000 110,186
6.75%, 06/25/2025 160,000 178,600
OneMain Finance Corp., 8.25%, 10/01/2023 165,000 185,639
6.13%, 03/15/2024 101,000 108,701
919,470
Copper–0.40% Freeport-McMoRan, Inc., 4.55%,
11/14/2024 142,000 153,892
Department Stores–1.20% Macy’s Retail Holdings LLC, 3.63%,
06/01/2024 352,000 365,654
Nordstrom, Inc., 6.95%, 03/15/2028 85,000 100,589
466,243
Diversified Banks–0.47% Banco Mercantil del Norte S.A.
(Mexico), 7.50%(b)(d)(e) 160,000 181,343
Principal Amount Value
Diversified Capital Markets–0.85% Deutsche Bank AG (Germany), 4.30%,
05/24/2028(d) $318,000 $ 329,452
Diversified Chemicals–0.41% NOVA Chemicals Corp. (Canada),
4.25%, 05/15/2029(b) 160,000 161,000
Diversified Metals & Mining–0.27% Mineral Resources Ltd. (Australia),
8.13%, 05/01/2027(b) 95,000 103,669
Diversified REITs–1.62% iStar, Inc., 4.75%, 10/01/2024 153,000 162,570
MGM Growth Properties OperatingPartnership L.P./MGP Finance Co-Issuer, Inc., 5.63%, 05/01/2024 115,000 125,494
Uniti Group L.P./Uniti Fiber Holdings,Inc./CSL Capital LLC, 7.88%,02/15/2025(b) 183,000 195,810
VICI Properties L.P./VICI Note Co., Inc.,3.50%, 02/15/2025(b) 140,000 143,675
627,549
Diversified Support Services–0.29% Ritchie Bros. Auctioneers, Inc. (Canada),
5.38%, 01/15/2025(b) 111,000 113,775
Drug Retail–0.15% Rite Aid Corp., 8.00%, 11/15/2026(b) 55,000 56,782
Education Services–0.02% Graham Holdings Co., 5.75%,
06/01/2026(b) 9,000 9,394
Electric Utilities–0.79% InterGen N.V. (Netherlands), 7.00%,
06/30/2023(b) 200,000 198,256
Talen Energy Supply LLC, 7.25%,05/15/2027(b) 127,000 109,972
308,228
Electrical Components & Equipment–0.64% Sensata Technologies B.V.,
4.88%, 10/15/2023(b) 100,000 107,136
5.63%, 11/01/2024(b) 128,000 142,560
249,696
Electronic Components–0.15% Brightstar Escrow Corp., 9.75%,
10/15/2025(b) 55,000 59,331
Environmental & Facilities Services–0.73% GFL Environmental, Inc. (Canada),
4.25%, 06/01/2025(b) 170,000 176,588
Stericycle, Inc., 5.38%, 07/15/2024(b) 105,000 107,759
284,347
Fertilizers & Agricultural Chemicals–0.59% CVR Partners L.P./CVR Nitrogen Finance
Corp., 9.25%, 06/15/2023(b) 12,000 12,070
Eurochem Finance DAC (Russia),5.50%, 03/13/2024(b) 200,000 217,521
229,591
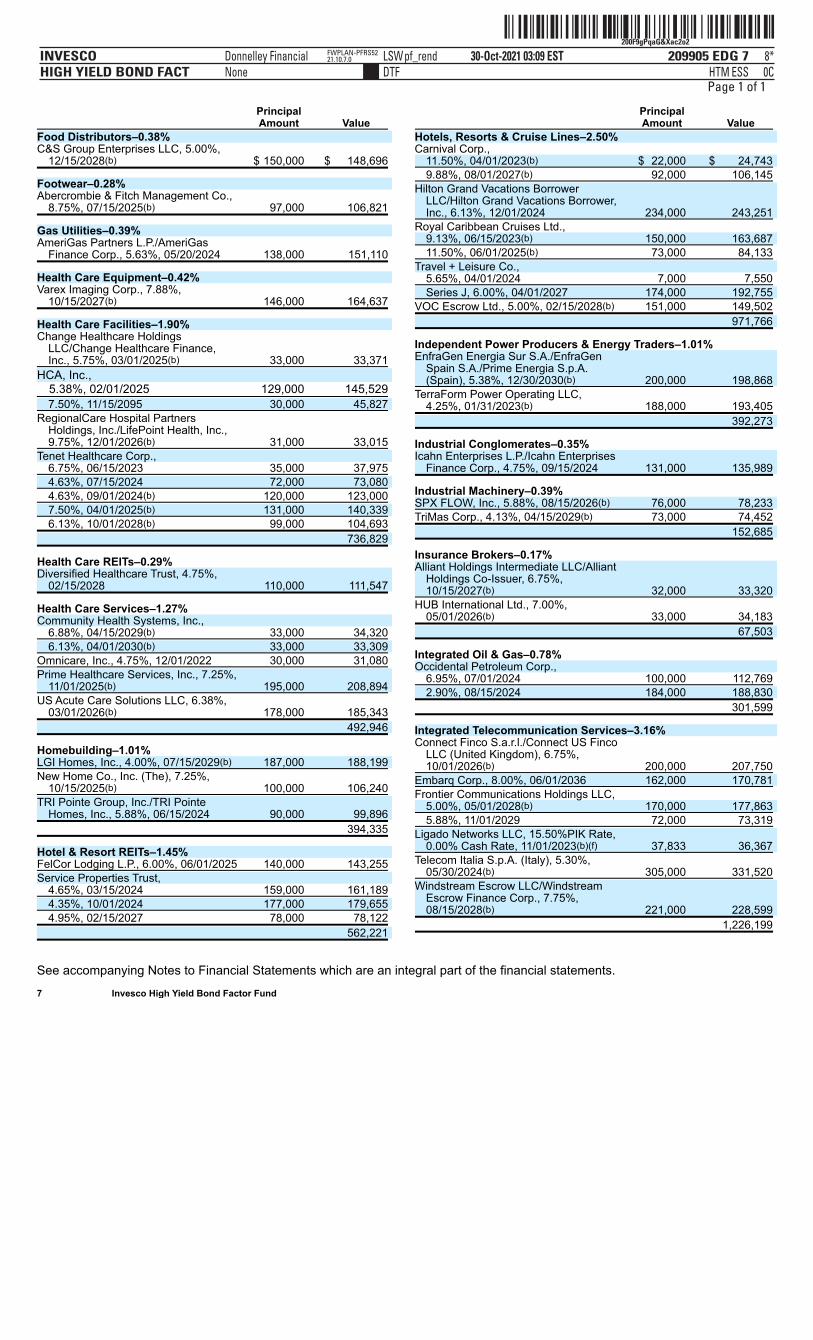
ˆ200F9gPqaG&Xac2o2Š200F9gPqaG&Xac2o2
209905 EDG 7INVESCOHIGH YIELD BOND FACT
30-Oct-2021 03:09 ESTHTMDTF
Donnelley Financial LSWpf_rendNone
8*ESS 0C
FWPLAN-PFRS5221.10.7.0
Page 1 of 1
See accompanying Notes to Financial Statements which are an integral part of the financial statements. 7 Invesco High Yield Bond Factor Fund
Principal Amount Value
Food Distributors–0.38% C&S Group Enterprises LLC, 5.00%,
12/15/2028(b) $ 150,000 $ 148,696
Footwear–0.28% Abercrombie & Fitch Management Co.,
8.75%, 07/15/2025(b) 97,000 106,821
Gas Utilities–0.39% AmeriGas Partners L.P./AmeriGas
Finance Corp., 5.63%, 05/20/2024 138,000 151,110
Health Care Equipment–0.42% Varex Imaging Corp., 7.88%,
10/15/2027(b) 146,000 164,637
Health Care Facilities–1.90% Change Healthcare Holdings
LLC/Change Healthcare Finance,Inc., 5.75%, 03/01/2025(b) 33,000 33,371
HCA, Inc., 5.38%, 02/01/2025 129,000 145,529
7.50%, 11/15/2095 30,000 45,827
RegionalCare Hospital PartnersHoldings, Inc./LifePoint Health, Inc.,9.75%, 12/01/2026(b) 31,000 33,015
Tenet Healthcare Corp., 6.75%, 06/15/2023 35,000 37,975
4.63%, 07/15/2024 72,000 73,080
4.63%, 09/01/2024(b) 120,000 123,000
7.50%, 04/01/2025(b) 131,000 140,339
6.13%, 10/01/2028(b) 99,000 104,693
736,829
Health Care REITs–0.29% Diversified Healthcare Trust, 4.75%,
02/15/2028 110,000 111,547
Health Care Services–1.27% Community Health Systems, Inc.,
6.88%, 04/15/2029(b) 33,000 34,320
6.13%, 04/01/2030(b) 33,000 33,309
Omnicare, Inc., 4.75%, 12/01/2022 30,000 31,080
Prime Healthcare Services, Inc., 7.25%,11/01/2025(b) 195,000 208,894
US Acute Care Solutions LLC, 6.38%,03/01/2026(b) 178,000 185,343
492,946
Homebuilding–1.01% LGI Homes, Inc., 4.00%, 07/15/2029(b) 187,000 188,199
New Home Co., Inc. (The), 7.25%,10/15/2025(b) 100,000 106,240
TRI Pointe Group, Inc./TRI PointeHomes, Inc., 5.88%, 06/15/2024 90,000 99,896
394,335
Hotel & Resort REITs–1.45% FelCor Lodging L.P., 6.00%, 06/01/2025 140,000 143,255
Service Properties Trust, 4.65%, 03/15/2024 159,000 161,189
4.35%, 10/01/2024 177,000 179,655
4.95%, 02/15/2027 78,000 78,122
562,221
Principal Amount Value
Hotels, Resorts & Cruise Lines–2.50% Carnival Corp.,
11.50%, 04/01/2023(b) $ 22,000 $ 24,743
9.88%, 08/01/2027(b) 92,000 106,145
Hilton Grand Vacations BorrowerLLC/Hilton Grand Vacations Borrower,Inc., 6.13%, 12/01/2024 234,000 243,251
Royal Caribbean Cruises Ltd., 9.13%, 06/15/2023(b) 150,000 163,687
11.50%, 06/01/2025(b) 73,000 84,133
Travel + Leisure Co., 5.65%, 04/01/2024 7,000 7,550
Series J, 6.00%, 04/01/2027 174,000 192,755
VOC Escrow Ltd., 5.00%, 02/15/2028(b) 151,000 149,502
971,766
Independent Power Producers & Energy Traders–1.01% EnfraGen Energia Sur S.A./EnfraGen
Spain S.A./Prime Energia S.p.A.(Spain), 5.38%, 12/30/2030(b) 200,000 198,868
TerraForm Power Operating LLC,4.25%, 01/31/2023(b) 188,000 193,405
392,273
Industrial Conglomerates–0.35% Icahn Enterprises L.P./Icahn Enterprises
Finance Corp., 4.75%, 09/15/2024 131,000 135,989
Industrial Machinery–0.39% SPX FLOW, Inc., 5.88%, 08/15/2026(b) 76,000 78,233
TriMas Corp., 4.13%, 04/15/2029(b) 73,000 74,452
152,685
Insurance Brokers–0.17% Alliant Holdings Intermediate LLC/Alliant
Holdings Co-Issuer, 6.75%,10/15/2027(b) 32,000 33,320
HUB International Ltd., 7.00%,05/01/2026(b) 33,000 34,183
67,503
Integrated Oil & Gas–0.78% Occidental Petroleum Corp.,
6.95%, 07/01/2024 100,000 112,769
2.90%, 08/15/2024 184,000 188,830
301,599
Integrated Telecommunication Services–3.16% Connect Finco S.a.r.l./Connect US Finco
LLC (United Kingdom), 6.75%,10/01/2026(b) 200,000 207,750
Embarq Corp., 8.00%, 06/01/2036 162,000 170,781
Frontier Communications Holdings LLC, 5.00%, 05/01/2028(b) 170,000 177,863
5.88%, 11/01/2029 72,000 73,319
Ligado Networks LLC, 15.50%PIK Rate,0.00% Cash Rate, 11/01/2023(b)(f) 37,833 36,367
Telecom Italia S.p.A. (Italy), 5.30%,05/30/2024(b) 305,000 331,520
Windstream Escrow LLC/WindstreamEscrow Finance Corp., 7.75%,08/15/2028(b) 221,000 228,599
1,226,199
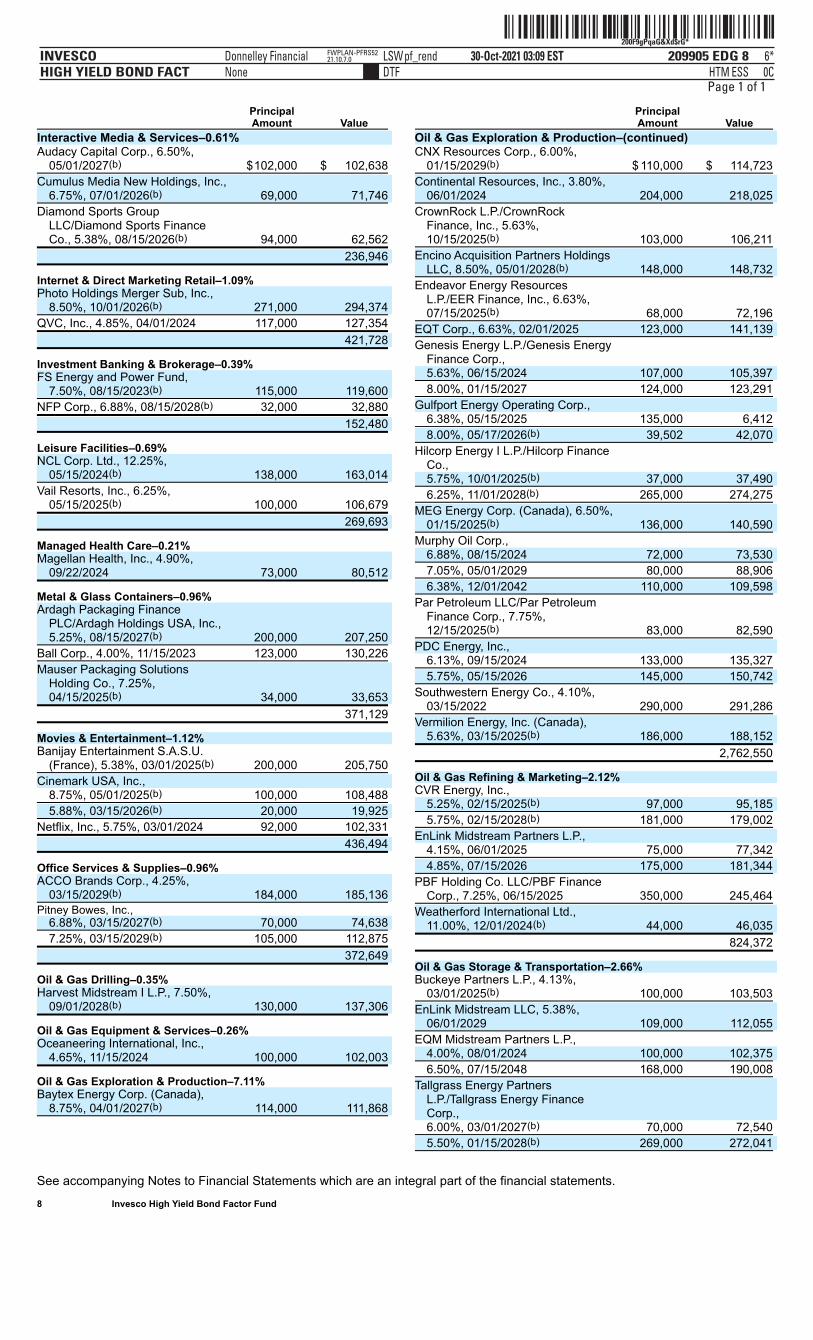
ˆ200F9gPqaG&Xd$rG*Š200F9gPqaG&Xd$rG*
209905 EDG 8INVESCOHIGH YIELD BOND FACT
30-Oct-2021 03:09 ESTHTMDTF
Donnelley Financial LSWpf_rendNone
6*ESS 0C
FWPLAN-PFRS5221.10.7.0
Page 1 of 1
See accompanying Notes to Financial Statements which are an integral part of the financial statements. 8 Invesco High Yield Bond Factor Fund
Principal Amount Value
Interactive Media & Services–0.61% Audacy Capital Corp., 6.50%,
05/01/2027(b) $102,000 $ 102,638
Cumulus Media New Holdings, Inc.,6.75%, 07/01/2026(b) 69,000 71,746
Diamond Sports GroupLLC/Diamond Sports FinanceCo., 5.38%, 08/15/2026(b) 94,000 62,562
236,946
Internet & Direct Marketing Retail–1.09% Photo Holdings Merger Sub, Inc.,
8.50%, 10/01/2026(b) 271,000 294,374
QVC, Inc., 4.85%, 04/01/2024 117,000 127,354
421,728
Investment Banking & Brokerage–0.39% FS Energy and Power Fund,
7.50%, 08/15/2023(b) 115,000 119,600
NFP Corp., 6.88%, 08/15/2028(b) 32,000 32,880
152,480
Leisure Facilities–0.69% NCL Corp. Ltd., 12.25%,
05/15/2024(b) 138,000 163,014
Vail Resorts, Inc., 6.25%,05/15/2025(b) 100,000 106,679
269,693
Managed Health Care–0.21% Magellan Health, Inc., 4.90%,
09/22/2024 73,000 80,512
Metal & Glass Containers–0.96% Ardagh Packaging Finance
PLC/Ardagh Holdings USA, Inc.,5.25%, 08/15/2027(b) 200,000 207,250
Ball Corp., 4.00%, 11/15/2023 123,000 130,226
Mauser Packaging SolutionsHolding Co., 7.25%,04/15/2025(b) 34,000 33,653
371,129
Movies & Entertainment–1.12% Banijay Entertainment S.A.S.U.
(France), 5.38%, 03/01/2025(b) 200,000 205,750
Cinemark USA, Inc., 8.75%, 05/01/2025(b) 100,000 108,488
5.88%, 03/15/2026(b) 20,000 19,925
Netflix, Inc., 5.75%, 03/01/2024 92,000 102,331
436,494
Office Services & Supplies–0.96% ACCO Brands Corp., 4.25%,
03/15/2029(b) 184,000 185,136
Pitney Bowes, Inc., 6.88%, 03/15/2027(b) 70,000 74,638
7.25%, 03/15/2029(b) 105,000 112,875
372,649
Oil & Gas Drilling–0.35% Harvest Midstream I L.P., 7.50%,
09/01/2028(b) 130,000 137,306
Oil & Gas Equipment & Services–0.26% Oceaneering International, Inc.,
4.65%, 11/15/2024 100,000 102,003
Oil & Gas Exploration & Production–7.11% Baytex Energy Corp. (Canada),
8.75%, 04/01/2027(b) 114,000 111,868
Principal Amount Value
Oil & Gas Exploration & Production–(continued) CNX Resources Corp., 6.00%,
01/15/2029(b) $ 110,000 $ 114,723
Continental Resources, Inc., 3.80%,06/01/2024 204,000 218,025
CrownRock L.P./CrownRockFinance, Inc., 5.63%,10/15/2025(b) 103,000 106,211
Encino Acquisition Partners HoldingsLLC, 8.50%, 05/01/2028(b) 148,000 148,732
Endeavor Energy ResourcesL.P./EER Finance, Inc., 6.63%,07/15/2025(b) 68,000 72,196
EQT Corp., 6.63%, 02/01/2025 123,000 141,139
Genesis Energy L.P./Genesis EnergyFinance Corp., 5.63%, 06/15/2024 107,000 105,397
8.00%, 01/15/2027 124,000 123,291
Gulfport Energy Operating Corp., 6.38%, 05/15/2025 135,000 6,412
8.00%, 05/17/2026(b) 39,502 42,070
Hilcorp Energy I L.P./Hilcorp FinanceCo., 5.75%, 10/01/2025(b) 37,000 37,490
6.25%, 11/01/2028(b) 265,000 274,275
MEG Energy Corp. (Canada), 6.50%,01/15/2025(b) 136,000 140,590
Murphy Oil Corp., 6.88%, 08/15/2024 72,000 73,530
7.05%, 05/01/2029 80,000 88,906
6.38%, 12/01/2042 110,000 109,598
Par Petroleum LLC/Par PetroleumFinance Corp., 7.75%,12/15/2025(b) 83,000 82,590
PDC Energy, Inc., 6.13%, 09/15/2024 133,000 135,327
5.75%, 05/15/2026 145,000 150,742
Southwestern Energy Co., 4.10%,03/15/2022 290,000 291,286
Vermilion Energy, Inc. (Canada),5.63%, 03/15/2025(b) 186,000 188,152
2,762,550
Oil & Gas Refining & Marketing–2.12% CVR Energy, Inc.,
5.25%, 02/15/2025(b) 97,000 95,185
5.75%, 02/15/2028(b) 181,000 179,002
EnLink Midstream Partners L.P., 4.15%, 06/01/2025 75,000 77,342
4.85%, 07/15/2026 175,000 181,344
PBF Holding Co. LLC/PBF FinanceCorp., 7.25%, 06/15/2025 350,000 245,464
Weatherford International Ltd.,11.00%, 12/01/2024(b) 44,000 46,035
824,372
Oil & Gas Storage & Transportation–2.66% Buckeye Partners L.P., 4.13%,
03/01/2025(b) 100,000 103,503
EnLink Midstream LLC, 5.38%,06/01/2029 109,000 112,055
EQM Midstream Partners L.P., 4.00%, 08/01/2024 100,000 102,375
6.50%, 07/15/2048 168,000 190,008
Tallgrass Energy PartnersL.P./Tallgrass Energy FinanceCorp., 6.00%, 03/01/2027(b) 70,000 72,540
5.50%, 01/15/2028(b) 269,000 272,041
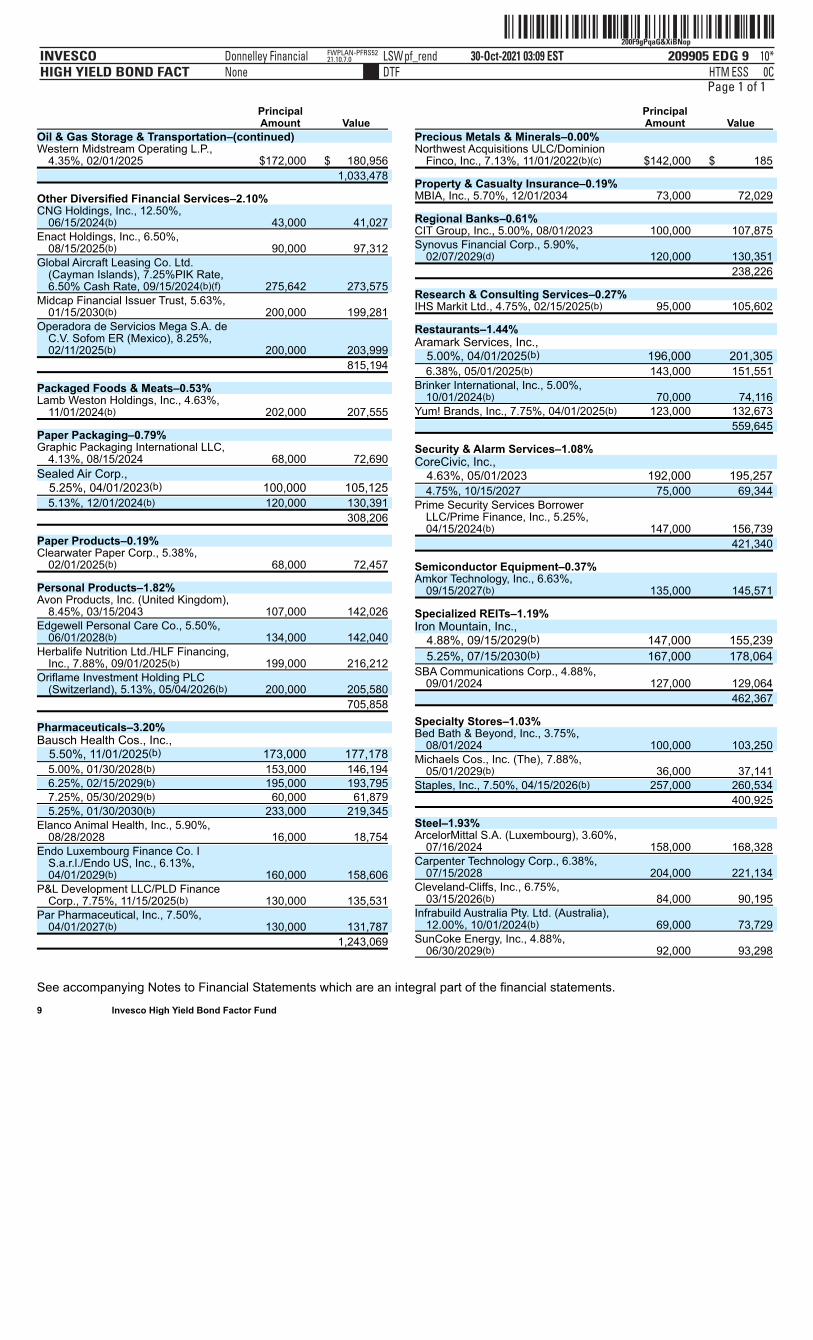
ˆ200F9gPqaG&XiBNopŠ200F9gPqaG&XiBNop
209905 EDG 9INVESCOHIGH YIELD BOND FACT
30-Oct-2021 03:09 ESTHTMDTF
Donnelley Financial LSWpf_rendNone
10*ESS 0C
FWPLAN-PFRS5221.10.7.0
Page 1 of 1
See accompanying Notes to Financial Statements which are an integral part of the financial statements. 9 Invesco High Yield Bond Factor Fund
Principal Amount Value
Oil & Gas Storage & Transportation–(continued) Western Midstream Operating L.P.,
4.35%, 02/01/2025 $172,000 $ 180,956
1,033,478
Other Diversified Financial Services–2.10% CNG Holdings, Inc., 12.50%,
06/15/2024(b) 43,000 41,027
Enact Holdings, Inc., 6.50%,08/15/2025(b) 90,000 97,312
Global Aircraft Leasing Co. Ltd.(Cayman Islands), 7.25%PIK Rate,6.50% Cash Rate, 09/15/2024(b)(f) 275,642 273,575
Midcap Financial Issuer Trust, 5.63%,01/15/2030(b) 200,000 199,281
Operadora de Servicios Mega S.A. deC.V. Sofom ER (Mexico), 8.25%,02/11/2025(b) 200,000 203,999
815,194
Packaged Foods & Meats–0.53% Lamb Weston Holdings, Inc., 4.63%,
11/01/2024(b) 202,000 207,555
Paper Packaging–0.79% Graphic Packaging International LLC,
4.13%, 08/15/2024 68,000 72,690
Sealed Air Corp., 5.25%, 04/01/2023(b) 100,000 105,125
5.13%, 12/01/2024(b) 120,000 130,391
308,206
Paper Products–0.19% Clearwater Paper Corp., 5.38%,
02/01/2025(b) 68,000 72,457
Personal Products–1.82% Avon Products, Inc. (United Kingdom),
8.45%, 03/15/2043 107,000 142,026
Edgewell Personal Care Co., 5.50%,06/01/2028(b) 134,000 142,040
Herbalife Nutrition Ltd./HLF Financing,Inc., 7.88%, 09/01/2025(b) 199,000 216,212
Oriflame Investment Holding PLC(Switzerland), 5.13%, 05/04/2026(b) 200,000 205,580
705,858
Pharmaceuticals–3.20% Bausch Health Cos., Inc.,
5.50%, 11/01/2025(b) 173,000 177,178
5.00%, 01/30/2028(b) 153,000 146,194
6.25%, 02/15/2029(b) 195,000 193,795
7.25%, 05/30/2029(b) 60,000 61,879
5.25%, 01/30/2030(b) 233,000 219,345
Elanco Animal Health, Inc., 5.90%,08/28/2028 16,000 18,754
Endo Luxembourg Finance Co. IS.a.r.l./Endo US, Inc., 6.13%,04/01/2029(b) 160,000 158,606
P&L Development LLC/PLD FinanceCorp., 7.75%, 11/15/2025(b) 130,000 135,531
Par Pharmaceutical, Inc., 7.50%,04/01/2027(b) 130,000 131,787
1,243,069
Principal Amount Value
Precious Metals & Minerals–0.00% Northwest Acquisitions ULC/Dominion
Finco, Inc., 7.13%, 11/01/2022(b)(c) $142,000 $ 185
Property & Casualty Insurance–0.19% MBIA, Inc., 5.70%, 12/01/2034 73,000 72,029
Regional Banks–0.61% CIT Group, Inc., 5.00%, 08/01/2023 100,000 107,875
Synovus Financial Corp., 5.90%,02/07/2029(d) 120,000 130,351
238,226
Research & Consulting Services–0.27% IHS Markit Ltd., 4.75%, 02/15/2025(b) 95,000 105,602
Restaurants–1.44% Aramark Services, Inc.,
5.00%, 04/01/2025(b) 196,000 201,305
6.38%, 05/01/2025(b) 143,000 151,551
Brinker International, Inc., 5.00%,10/01/2024(b) 70,000 74,116
Yum! Brands, Inc., 7.75%, 04/01/2025(b) 123,000 132,673
559,645
Security & Alarm Services–1.08% CoreCivic, Inc.,
4.63%, 05/01/2023 192,000 195,257
4.75%, 10/15/2027 75,000 69,344
Prime Security Services BorrowerLLC/Prime Finance, Inc., 5.25%,04/15/2024(b) 147,000 156,739
421,340
Semiconductor Equipment–0.37% Amkor Technology, Inc., 6.63%,
09/15/2027(b) 135,000 145,571
Specialized REITs–1.19% Iron Mountain, Inc.,
4.88%, 09/15/2029(b) 147,000 155,239
5.25%, 07/15/2030(b) 167,000 178,064
SBA Communications Corp., 4.88%,09/01/2024 127,000 129,064
462,367
Specialty Stores–1.03% Bed Bath & Beyond, Inc., 3.75%,
08/01/2024 100,000 103,250
Michaels Cos., Inc. (The), 7.88%,05/01/2029(b) 36,000 37,141
Staples, Inc., 7.50%, 04/15/2026(b) 257,000 260,534
400,925
Steel–1.93% ArcelorMittal S.A. (Luxembourg), 3.60%,
07/16/2024 158,000 168,328
Carpenter Technology Corp., 6.38%,07/15/2028 204,000 221,134
Cleveland-Cliffs, Inc., 6.75%,03/15/2026(b) 84,000 90,195
Infrabuild Australia Pty. Ltd. (Australia),12.00%, 10/01/2024(b) 69,000 73,729
SunCoke Energy, Inc., 4.88%,06/30/2029(b) 92,000 93,298
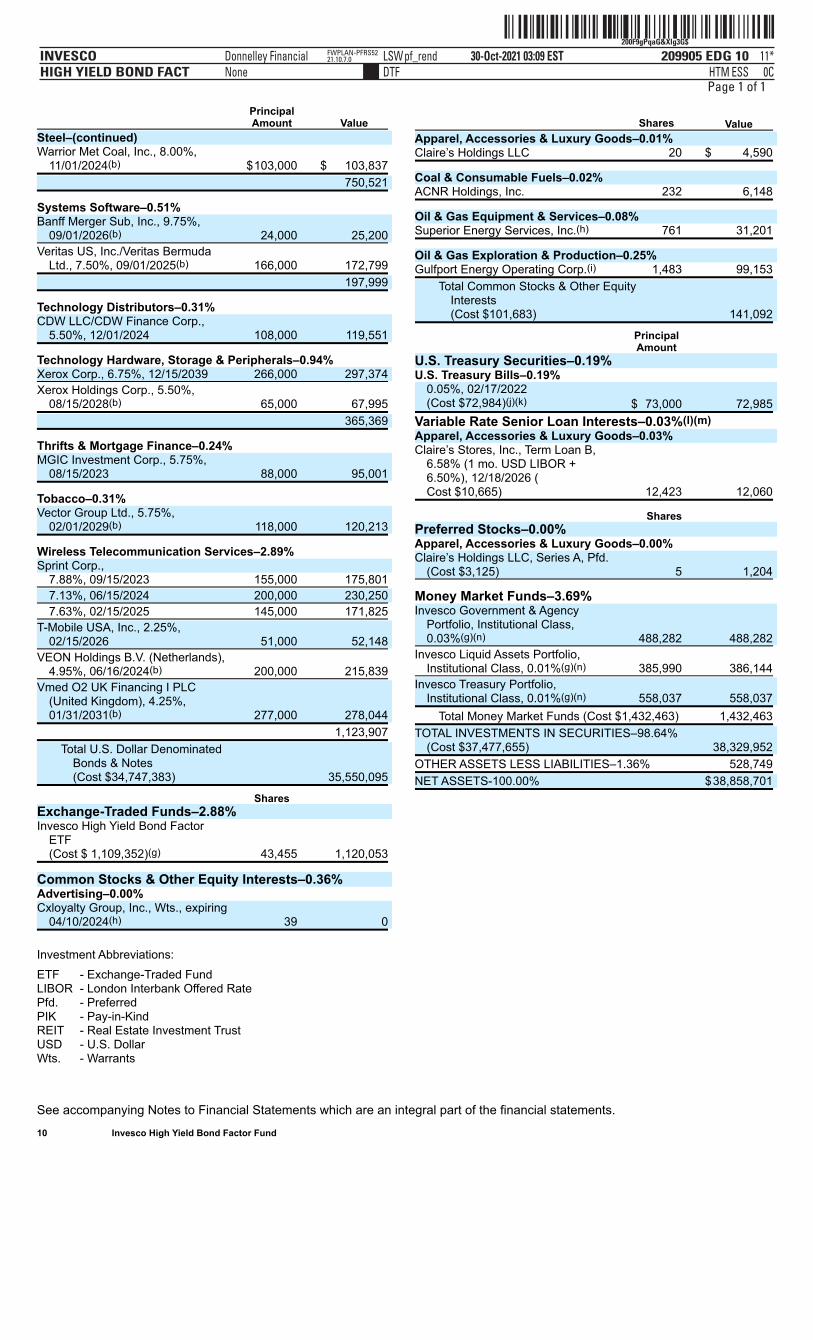
ˆ200F9gPqaG&Xlg3G$Š200F9gPqaG&Xlg3G$
209905 EDG 10INVESCOHIGH YIELD BOND FACT
30-Oct-2021 03:09 ESTHTMDTF
Donnelley Financial LSWpf_rendNone
11*ESS 0C
FWPLAN-PFRS5221.10.7.0
Page 1 of 1
Investment Abbreviations:
ETF - Exchange-Traded FundLIBOR - London Interbank Offered RatePfd. - PreferredPIK - Pay-in-KindREIT - Real Estate Investment TrustUSD - U.S. DollarWts. - Warrants
See accompanying Notes to Financial Statements which are an integral part of the financial statements. 10 Invesco High Yield Bond Factor Fund
Principal Amount Value
Steel–(continued) Warrior Met Coal, Inc., 8.00%,
11/01/2024(b) $103,000 $ 103,837
750,521
Systems Software–0.51% Banff Merger Sub, Inc., 9.75%,
09/01/2026(b) 24,000 25,200
Veritas US, Inc./Veritas BermudaLtd., 7.50%, 09/01/2025(b) 166,000 172,799
197,999
Technology Distributors–0.31% CDW LLC/CDW Finance Corp.,
5.50%, 12/01/2024 108,000 119,551
Technology Hardware, Storage & Peripherals–0.94% Xerox Corp., 6.75%, 12/15/2039 266,000 297,374
Xerox Holdings Corp., 5.50%,08/15/2028(b) 65,000 67,995
365,369
Thrifts & Mortgage Finance–0.24% MGIC Investment Corp., 5.75%,
08/15/2023 88,000 95,001
Tobacco–0.31% Vector Group Ltd., 5.75%,
02/01/2029(b) 118,000 120,213
Wireless Telecommunication Services–2.89% Sprint Corp.,
7.88%, 09/15/2023 155,000 175,801
7.13%, 06/15/2024 200,000 230,250
7.63%, 02/15/2025 145,000 171,825
T-Mobile USA, Inc., 2.25%,02/15/2026 51,000 52,148
VEON Holdings B.V. (Netherlands),4.95%, 06/16/2024(b) 200,000 215,839
Vmed O2 UK Financing I PLC(United Kingdom), 4.25%,01/31/2031(b) 277,000 278,044
1,123,907
Total U.S. Dollar DenominatedBonds & Notes(Cost $34,747,383) 35,550,095
Shares Exchange-Traded Funds–2.88% Invesco High Yield Bond Factor
ETF(Cost $ 1,109,352)(g) 43,455 1,120,053
Common Stocks & Other Equity Interests–0.36% Advertising–0.00% Cxloyalty Group, Inc., Wts., expiring
04/10/2024(h) 39 0
Shares Value
Apparel, Accessories & Luxury Goods–0.01% Claire’s Holdings LLC 20 $ 4,590
Coal & Consumable Fuels–0.02% ACNR Holdings, Inc. 232 6,148
Oil & Gas Equipment & Services–0.08% Superior Energy Services, Inc.(h) 761 31,201
Oil & Gas Exploration & Production–0.25% Gulfport Energy Operating Corp.(i) 1,483 99,153
Total Common Stocks & Other EquityInterests(Cost $101,683)
141,092
PrincipalAmount
U.S. Treasury Securities–0.19% U.S. Treasury Bills–0.19%
0.05%, 02/17/2022(Cost $72,984)(j)(k) $ 73,000 72,985
Variable Rate Senior Loan Interests–0.03%(l)(m) Apparel, Accessories & Luxury Goods–0.03% Claire’s Stores, Inc., Term Loan B,
6.58% (1 mo. USD LIBOR +6.50%), 12/18/2026 (Cost $10,665) 12,423 12,060
Shares Preferred Stocks–0.00% Apparel, Accessories & Luxury Goods–0.00% Claire’s Holdings LLC, Series A, Pfd.
(Cost $3,125) 5 1,204
Money Market Funds–3.69% Invesco Government & Agency
Portfolio, Institutional Class,0.03%(g)(n) 488,282 488,282
Invesco Liquid Assets Portfolio,Institutional Class, 0.01%(g)(n) 385,990 386,144
Invesco Treasury Portfolio,Institutional Class, 0.01%(g)(n) 558,037 558,037
Total Money Market Funds (Cost $1,432,463) 1,432,463
TOTAL INVESTMENTS IN SECURITIES–98.64%(Cost $37,477,655)
38,329,952
OTHER ASSETS LESS LIABILITIES–1.36% 528,749
NET ASSETS-100.00% $38,858,701
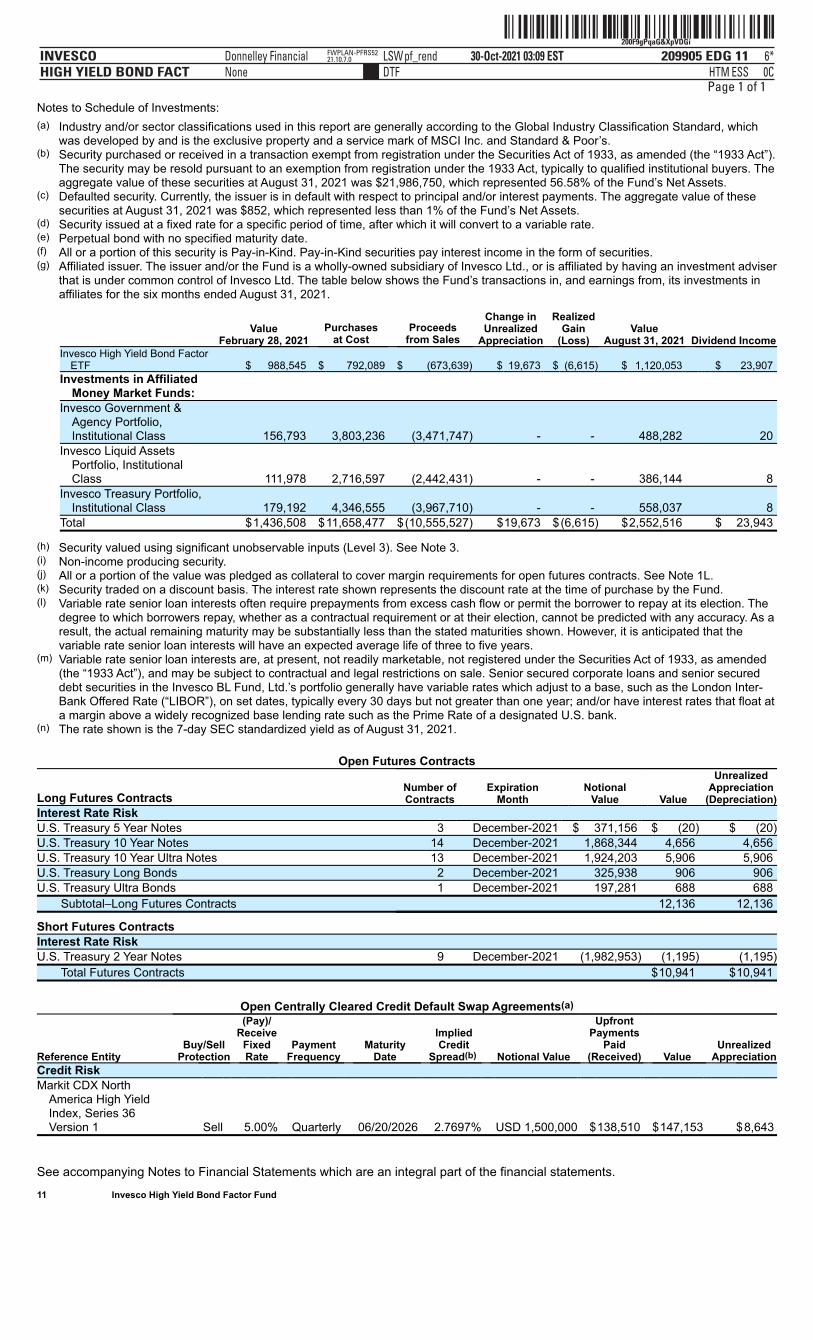
ˆ200F9gPqaG&XpVDGiŠ200F9gPqaG&XpVDGi
209905 EDG 11INVESCOHIGH YIELD BOND FACT
30-Oct-2021 03:09 ESTHTMDTF
Donnelley Financial LSWpf_rendNone
6*ESS 0C
FWPLAN-PFRS5221.10.7.0
Page 1 of 1Notes to Schedule of Investments:
(a) Industry and/or sector classifications used in this report are generally according to the Global Industry Classification Standard, whichwas developed by and is the exclusive property and a service mark of MSCI Inc. and Standard & Poor’s.
(b) Security purchased or received in a transaction exempt from registration under the Securities Act of 1933, as amended (the “1933 Act”).The security may be resold pursuant to an exemption from registration under the 1933 Act, typically to qualified institutional buyers. Theaggregate value of these securities at August 31, 2021 was $21,986,750, which represented 56.58% of the Fund’s Net Assets.
(c) Defaulted security. Currently, the issuer is in default with respect to principal and/or interest payments. The aggregate value of thesesecurities at August 31, 2021 was $852, which represented less than 1% of the Fund’s Net Assets.
(d) Security issued at a fixed rate for a specific period of time, after which it will convert to a variable rate.(e) Perpetual bond with no specified maturity date.(f) All or a portion of this security is Pay-in-Kind. Pay-in-Kind securities pay interest income in the form of securities.(g) Affiliated issuer. The issuer and/or the Fund is a wholly-owned subsidiary of Invesco Ltd., or is affiliated by having an investment adviser
that is under common control of Invesco Ltd. The table below shows the Fund’s transactions in, and earnings from, its investments inaffiliates for the six months ended August 31, 2021.
Value
February 28, 2021 Purchases
at Cost Proceeds
from Sales
Change inUnrealized
Appreciation
RealizedGain
(Loss) Value
August 31, 2021 Dividend IncomeInvesco High Yield Bond Factor
ETF $ 988,545 $ 792,089 $ (673,639) $ 19,673 $ (6,615) $ 1,120,053 $ 23,907Investments in Affiliated
Money Market Funds: Invesco Government &
Agency Portfolio,Institutional Class 156,793 3,803,236 (3,471,747) - - 488,282 20
Invesco Liquid AssetsPortfolio, InstitutionalClass 111,978 2,716,597 (2,442,431) - - 386,144 8
Invesco Treasury Portfolio,Institutional Class 179,192 4,346,555 (3,967,710) - - 558,037 8
Total $1,436,508 $11,658,477 $(10,555,527) $19,673 $(6,615) $2,552,516 $ 23,943
(h) Security valued using significant unobservable inputs (Level 3). See Note 3.(i) Non-income producing security.(j) All or a portion of the value was pledged as collateral to cover margin requirements for open futures contracts. See Note 1L.(k) Security traded on a discount basis. The interest rate shown represents the discount rate at the time of purchase by the Fund.(l) Variable rate senior loan interests often require prepayments from excess cash flow or permit the borrower to repay at its election. The
degree to which borrowers repay, whether as a contractual requirement or at their election, cannot be predicted with any accuracy. As aresult, the actual remaining maturity may be substantially less than the stated maturities shown. However, it is anticipated that thevariable rate senior loan interests will have an expected average life of three to five years.
(m) Variable rate senior loan interests are, at present, not readily marketable, not registered under the Securities Act of 1933, as amended(the “1933 Act”), and may be subject to contractual and legal restrictions on sale. Senior secured corporate loans and senior secureddebt securities in the Invesco BL Fund, Ltd.’s portfolio generally have variable rates which adjust to a base, such as the London Inter-Bank Offered Rate (“LIBOR”), on set dates, typically every 30 days but not greater than one year; and/or have interest rates that float ata margin above a widely recognized base lending rate such as the Prime Rate of a designated U.S. bank.
(n) The rate shown is the 7-day SEC standardized yield as of August 31, 2021.
Open Futures Contracts
Long Futures Contracts Number ofContracts
ExpirationMonth
NotionalValue Value
UnrealizedAppreciation
(Depreciation)Interest Rate Risk U.S. Treasury 5 Year Notes 3 December-2021 $ 371,156 $ (20) $ (20)U.S. Treasury 10 Year Notes 14 December-2021 1,868,344 4,656 4,656U.S. Treasury 10 Year Ultra Notes 13 December-2021 1,924,203 5,906 5,906U.S. Treasury Long Bonds 2 December-2021 325,938 906 906U.S. Treasury Ultra Bonds 1 December-2021 197,281 688 688
Subtotal–Long Futures Contracts 12,136 12,136
Short Futures Contracts Interest Rate Risk U.S. Treasury 2 Year Notes 9 December-2021 (1,982,953) (1,195) (1,195)
Total Futures Contracts $10,941 $10,941
Open Centrally Cleared Credit Default Swap Agreements(a)
Reference Entity Buy/Sell
Protection
(Pay)/Receive
FixedRate
PaymentFrequency
MaturityDate
ImpliedCredit
Spread(b) Notional Value
UpfrontPayments
Paid(Received) Value
UnrealizedAppreciation
Credit Risk Markit CDX North
America High YieldIndex, Series 36Version 1 Sell 5.00% Quarterly 06/20/2026 2.7697% USD 1,500,000 $138,510 $147,153 $8,643
See accompanying Notes to Financial Statements which are an integral part of the financial statements. 11 Invesco High Yield Bond Factor Fund
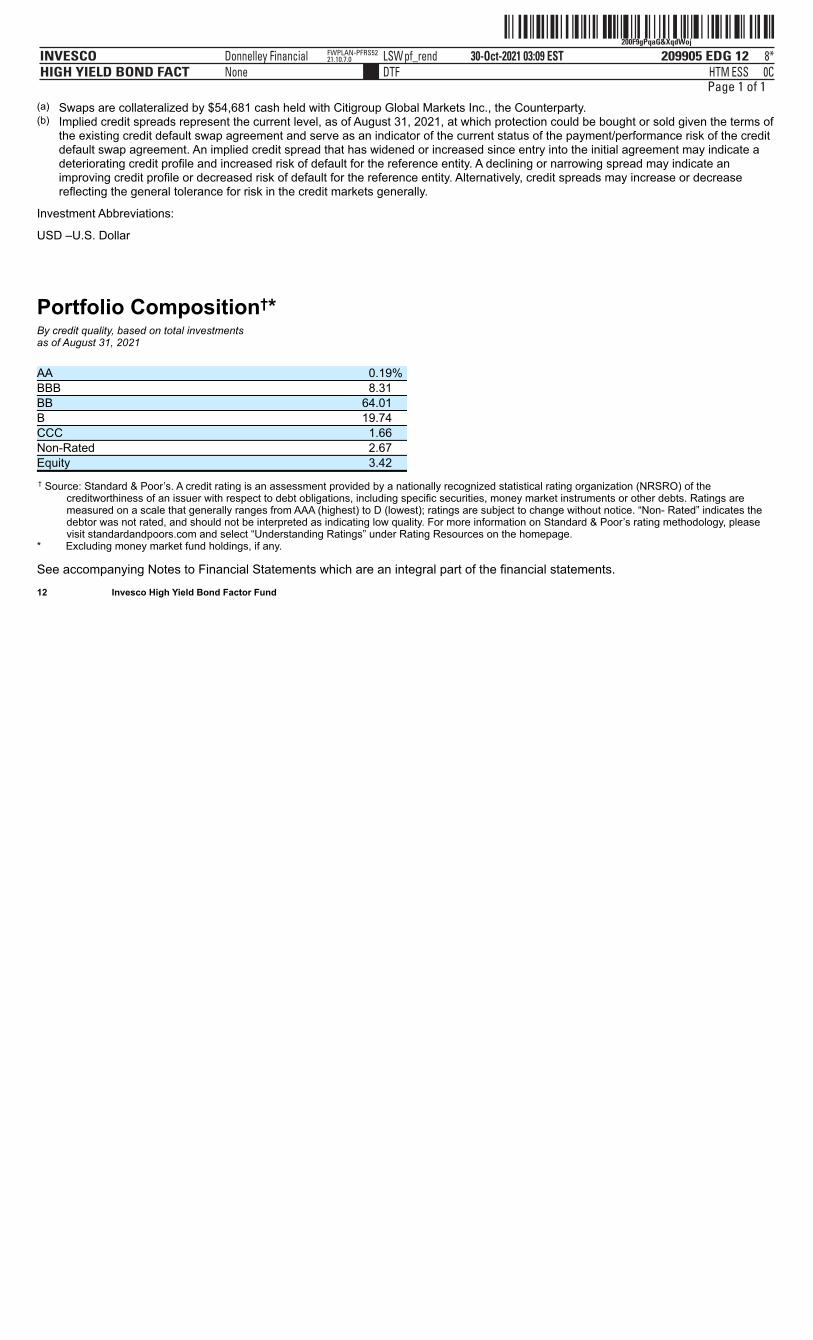
ˆ200F9gPqaG&XqdWojŠ200F9gPqaG&XqdWoj
209905 EDG 12INVESCOHIGH YIELD BOND FACT
30-Oct-2021 03:09 ESTHTMDTF
Donnelley Financial LSWpf_rendNone
8*ESS 0C
FWPLAN-PFRS5221.10.7.0
Page 1 of 1(a) Swaps are collateralized by $54,681 cash held with Citigroup Global Markets Inc., the Counterparty.(b) Implied credit spreads represent the current level, as of August 31, 2021, at which protection could be bought or sold given the terms of
the existing credit default swap agreement and serve as an indicator of the current status of the payment/performance risk of the creditdefault swap agreement. An implied credit spread that has widened or increased since entry into the initial agreement may indicate adeteriorating credit profile and increased risk of default for the reference entity. A declining or narrowing spread may indicate animproving credit profile or decreased risk of default for the reference entity. Alternatively, credit spreads may increase or decreasereflecting the general tolerance for risk in the credit markets generally.
Investment Abbreviations:
USD –U.S. Dollar
Portfolio Composition†*By credit quality, based on total investmentsas of August 31, 2021 AA 0.19% BBB 8.31 BB 64.01 B 19.74 CCC 1.66 Non-Rated 2.67 Equity 3.42 † Source: Standard & Poor’s. A credit rating is an assessment provided by a nationally recognized statistical rating organization (NRSRO) of the
creditworthiness of an issuer with respect to debt obligations, including specific securities, money market instruments or other debts. Ratings aremeasured on a scale that generally ranges from AAA (highest) to D (lowest); ratings are subject to change without notice. “Non- Rated” indicates thedebtor was not rated, and should not be interpreted as indicating low quality. For more information on Standard & Poor’s rating methodology, pleasevisit standardandpoors.com and select “Understanding Ratings” under Rating Resources on the homepage.
* Excluding money market fund holdings, if any.
See accompanying Notes to Financial Statements which are an integral part of the financial statements. 12 Invesco High Yield Bond Factor Fund
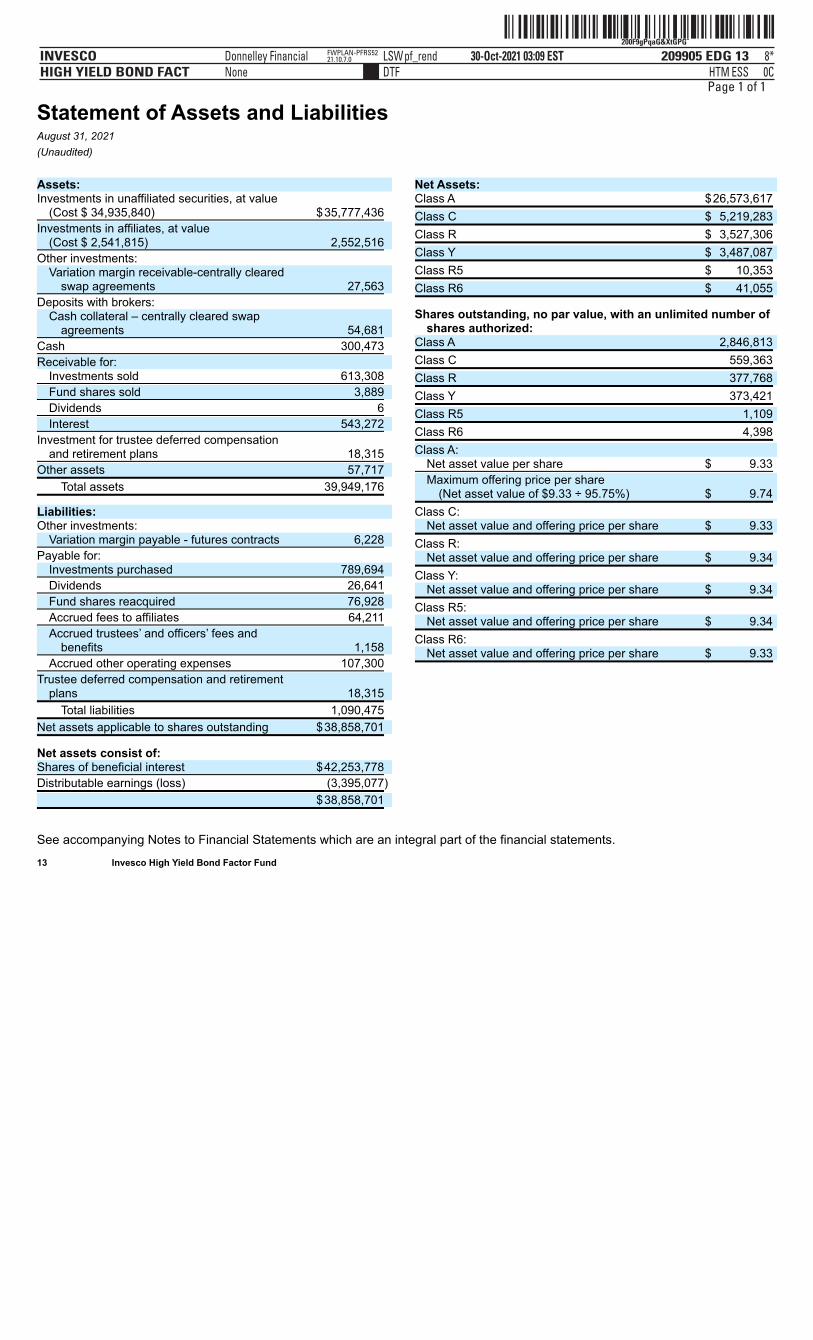
ˆ200F9gPqaG&XtGPGÊ200F9gPqaG&XtGPGˆ
209905 EDG 13INVESCOHIGH YIELD BOND FACT
30-Oct-2021 03:09 ESTHTMDTF
Donnelley Financial LSWpf_rendNone
8*ESS 0C
FWPLAN-PFRS5221.10.7.0
Page 1 of 1
Statement of Assets and LiabilitiesAugust 31, 2021(Unaudited)
See accompanying Notes to Financial Statements which are an integral part of the financial statements. 13 Invesco High Yield Bond Factor Fund
Assets: Investments in unaffiliated securities, at value
(Cost $ 34,935,840) $35,777,436
Investments in affiliates, at value(Cost $ 2,541,815) 2,552,516
Other investments: Variation margin receivable-centrally cleared
swap agreements 27,563
Deposits with brokers: Cash collateral – centrally cleared swap
agreements 54,681
Cash 300,473
Receivable for: Investments sold 613,308
Fund shares sold 3,889
Dividends 6
Interest 543,272
Investment for trustee deferred compensationand retirement plans 18,315
Other assets 57,717
Total assets 39,949,176
Liabilities: Other investments:
Variation margin payable - futures contracts 6,228
Payable for: Investments purchased 789,694
Dividends 26,641
Fund shares reacquired 76,928
Accrued fees to affiliates 64,211
Accrued trustees’ and officers’ fees andbenefits 1,158
Accrued other operating expenses 107,300
Trustee deferred compensation and retirementplans 18,315
Total liabilities 1,090,475
Net assets applicable to shares outstanding $38,858,701
Net assets consist of: Shares of beneficial interest $42,253,778
Distributable earnings (loss) (3,395,077)
$38,858,701
Net Assets: Class A $26,573,617
Class C $ 5,219,283
Class R $ 3,527,306
Class Y $ 3,487,087
Class R5 $ 10,353
Class R6 $ 41,055
Shares outstanding, no par value, with an unlimited number ofshares authorized:
Class A 2,846,813
Class C 559,363
Class R 377,768
Class Y 373,421
Class R5 1,109
Class R6 4,398
Class A: Net asset value per share $ 9.33
Maximum offering price per share(Net asset value of $9.33 ÷ 95.75%) $ 9.74
Class C: Net asset value and offering price per share $ 9.33
Class R: Net asset value and offering price per share $ 9.34
Class Y: Net asset value and offering price per share $ 9.34
Class R5: Net asset value and offering price per share $ 9.34
Class R6: Net asset value and offering price per share $ 9.33
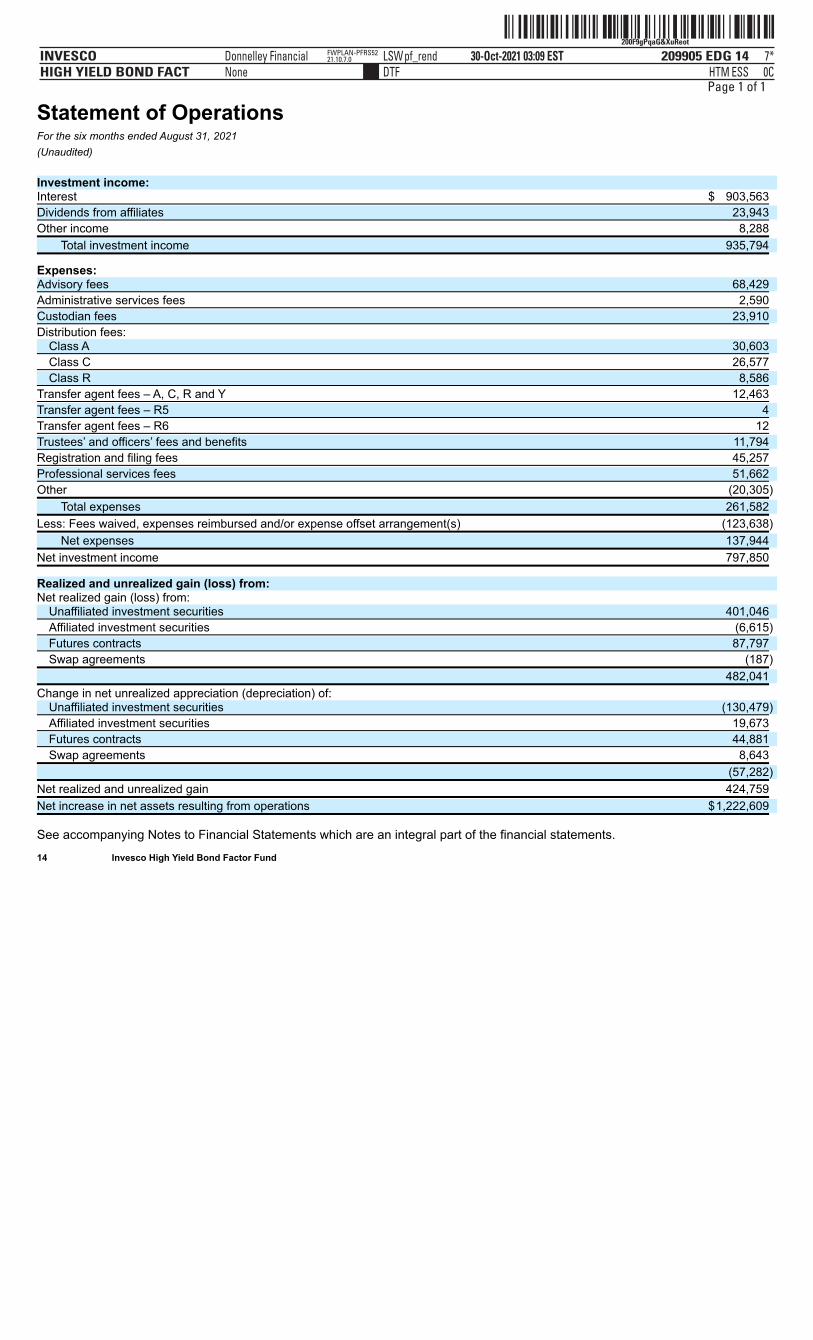
ˆ200F9gPqaG&XuReotŠ200F9gPqaG&XuReot
209905 EDG 14INVESCOHIGH YIELD BOND FACT
30-Oct-2021 03:09 ESTHTMDTF
Donnelley Financial LSWpf_rendNone
7*ESS 0C
FWPLAN-PFRS5221.10.7.0
Page 1 of 1
Statement of OperationsFor the six months ended August 31, 2021(Unaudited) Investment income: Interest $ 903,563
Dividends from affiliates 23,943
Other income 8,288
Total investment income 935,794
Expenses: Advisory fees 68,429
Administrative services fees 2,590
Custodian fees 23,910
Distribution fees: Class A 30,603
Class C 26,577
Class R 8,586
Transfer agent fees – A, C, R and Y 12,463
Transfer agent fees – R5 4
Transfer agent fees – R6 12
Trustees’ and officers’ fees and benefits 11,794
Registration and filing fees 45,257
Professional services fees 51,662
Other (20,305)
Total expenses 261,582
Less: Fees waived, expenses reimbursed and/or expense offset arrangement(s) (123,638)
Net expenses 137,944
Net investment income 797,850
Realized and unrealized gain (loss) from: Net realized gain (loss) from:
Unaffiliated investment securities 401,046
Affiliated investment securities (6,615)
Futures contracts 87,797
Swap agreements (187)
482,041
Change in net unrealized appreciation (depreciation) of: Unaffiliated investment securities (130,479)
Affiliated investment securities 19,673
Futures contracts 44,881
Swap agreements 8,643
(57,282)
Net realized and unrealized gain 424,759
Net increase in net assets resulting from operations $1,222,609
See accompanying Notes to Financial Statements which are an integral part of the financial statements. 14 Invesco High Yield Bond Factor Fund
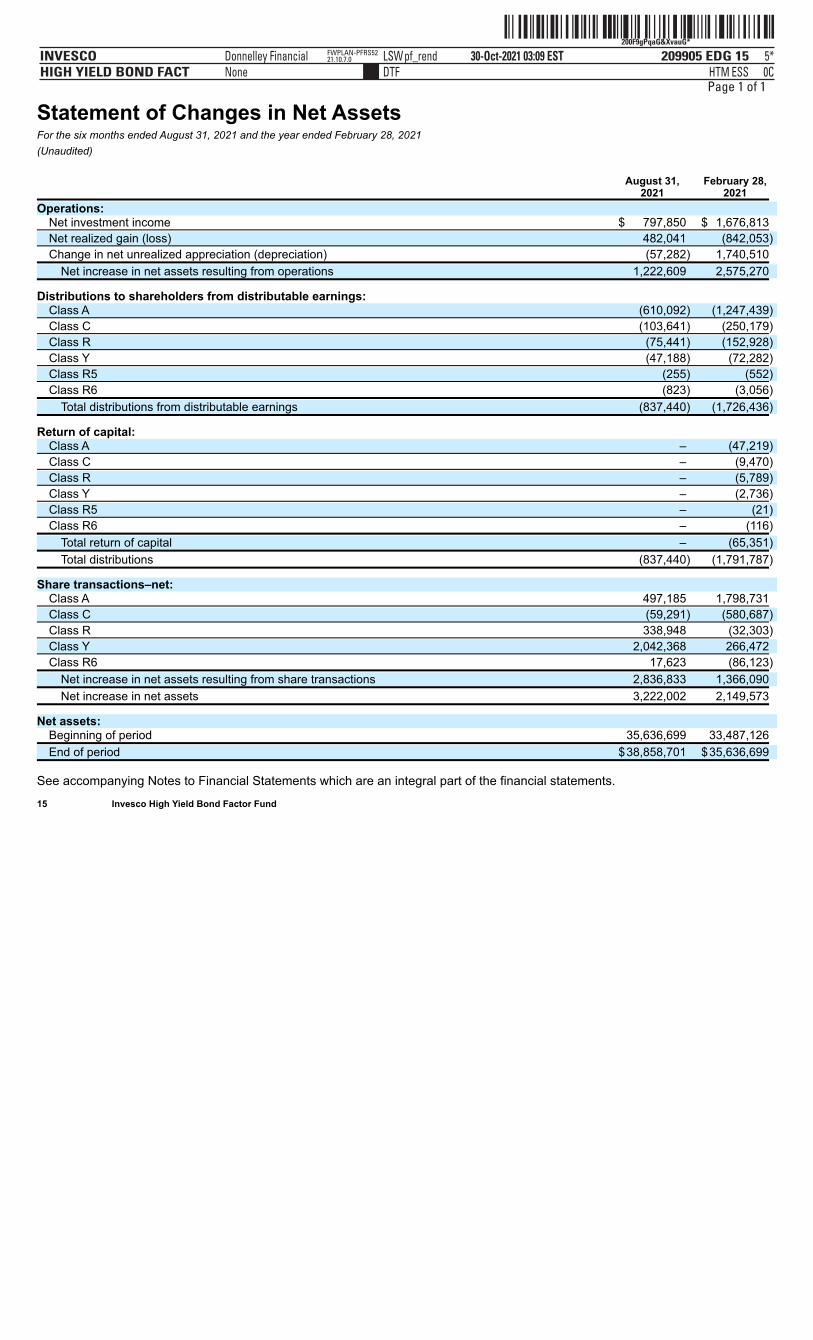
ˆ200F9gPqaG&XvauG*Š200F9gPqaG&XvauG*
209905 EDG 15INVESCOHIGH YIELD BOND FACT
30-Oct-2021 03:09 ESTHTMDTF
Donnelley Financial LSWpf_rendNone
5*ESS 0C
FWPLAN-PFRS5221.10.7.0
Page 1 of 1
Statement of Changes in Net AssetsFor the six months ended August 31, 2021 and the year ended February 28, 2021(Unaudited) August 31, February 28, 2021 2021
Operations: Net investment income $ 797,850 $ 1,676,813
Net realized gain (loss) 482,041 (842,053)
Change in net unrealized appreciation (depreciation) (57,282) 1,740,510
Net increase in net assets resulting from operations 1,222,609 2,575,270
Distributions to shareholders from distributable earnings: Class A (610,092) (1,247,439)
Class C (103,641) (250,179)
Class R (75,441) (152,928)
Class Y (47,188) (72,282)
Class R5 (255) (552)
Class R6 (823) (3,056)
Total distributions from distributable earnings (837,440) (1,726,436)
Return of capital: Class A – (47,219)
Class C – (9,470)
Class R – (5,789)
Class Y – (2,736)
Class R5 – (21)
Class R6 – (116)
Total return of capital – (65,351)
Total distributions (837,440) (1,791,787)
Share transactions–net: Class A 497,185 1,798,731
Class C (59,291) (580,687)
Class R 338,948 (32,303)
Class Y 2,042,368 266,472
Class R6 17,623 (86,123)
Net increase in net assets resulting from share transactions 2,836,833 1,366,090
Net increase in net assets 3,222,002 2,149,573
Net assets: Beginning of period 35,636,699 33,487,126
End of period $38,858,701 $35,636,699
See accompanying Notes to Financial Statements which are an integral part of the financial statements. 15 Invesco High Yield Bond Factor Fund
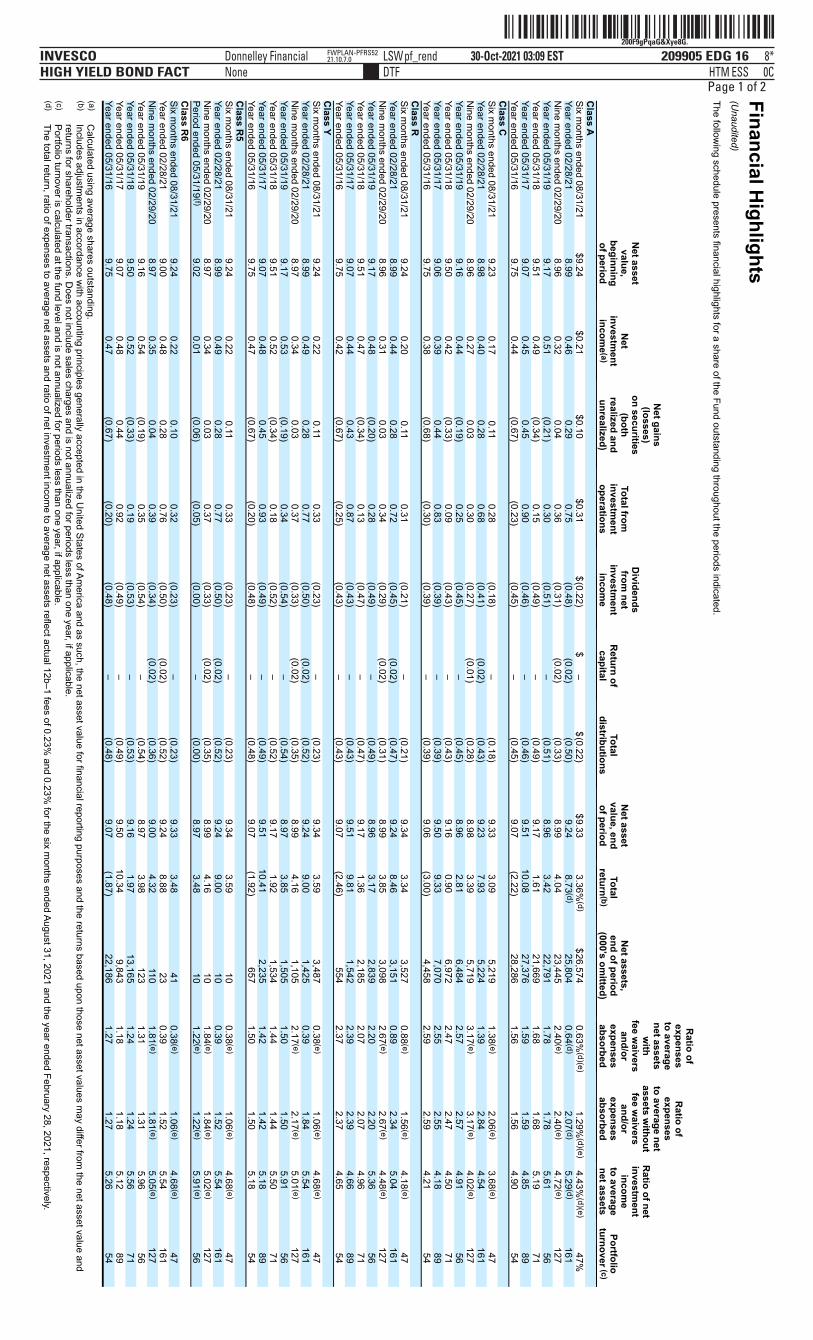
ˆ200F9gPqaG&Xye8G.Š200F9gPqaG&Xye8G.
209905 EDG 16INVESCOHIGH YIELD BOND FACT
30-Oct-2021 03:09 ESTHTMDTF
Donnelley Financial LSWpf_rendNone
8*ESS 0C
FWPLAN-PFRS5221.10.7.0
Page 1 of 2Financial Highlights
(Unaudited)
The following schedule presents financial highlights for a share of the Fund outstanding throughout the periods indicated.
Net assetvalue,
beginningof period
Net
investment
income (a)
Net gains
(losses)on securities
(bothrealized andunrealized)
Total frominvestm
entoperations
Dividends
from net
investment
income
R
eturn ofcapital
Total
distributions
Net asset
value, endof period
Total
return(b)
Net assets,
end of period(000’s om
itted)
Ratio of
expensesto averagenet assets
with
fee waivers
and/orexpensesabsorbed
Ratio of
expensesto average netassets w
ithoutfee w
aiversand/or
expensesabsorbed
Ratio of net
investment
income
to averagenet assets
Portfolio
turnover (c)C
lass A
Six m
onths ended 08/31/21
$9.24
$0.21
$0.10
$0.31
$(0.22)
$–
$(0.22)
$9.33
3.36%
(d) $26,574
0.63%(d)(e)
1.29%(d)(e)
4.43%(d)(e)
47%
Year ended 02/28/21
8.99
0.46
0.29
0.75
(0.48)
(0.02)
(0.50)
9.24
8.73 (d)
25,804 0.64 (d)
2.07 (d)
5.29 (d)
161N
ine months ended 02/29/20
8.96
0.32
0.04
0.36
(0.31)
(0.02)
(0.33)
8.99
4.04
23,445 2.40 (e)
2.40 (e)
4.72 (e)
127Year ended 05/31/19
9.17
0.51
(0.21)
0.30
(0.51)
–
(0.51)
8.96
3.42
22,791
1.78
1.78 5.61
56Year ended 05/31/18
9.51
0.49
(0.34)
0.15
(0.49)
–
(0.49)
9.17
1.61
21,669
1.68
1.68 5.19
71Year ended 05/31/17
9.07
0.45
0.45
0.90
(0.46)
–
(0.46)
9.51 10.08
27,376
1.59
1.59 4.85
89Year ended 05/31/16
9.75
0.44
(0.67)
(0.23)
(0.45)
–
(0.45)
9.07 (2.22)
28,286
1.56
1.56 4.90
54C
lass C
Six m
onths ended 08/31/21
9.23
0.17
0.11
0.28
(0.18)
–
(0.18)
9.33
3.09
5,219 1.38 (e)
2.06 (e)
3.68 (e)
47
Year ended 02/28/21
8.98
0.40
0.28
0.68
(0.41)
(0.02)
(0.43)
9.23
7.93
5,224
1.39
2.84 4.54
161
Nine m
onths ended 02/29/20
8.96
0.27
0.03
0.30
(0.27)
(0.01)
(0.28)
8.98
3.39
5,719 3.17 (e)
3.17 (e)
4.02 (e)
127Year ended 05/31/19
9.16
0.44
(0.19)
0.25
(0.45)
–
(0.45)
8.96
2.81
6,484 2.57
2.57
4.91
56
Year ended 05/31/18
9.50
0.42
(0.33)
0.09
(0.43)
–
(0.43)
9.16
0.90
6,972
2.47
2.47 4.50
71Year ended 05/31/17
9.06
0.39
0.44
0.83
(0.39)
–
(0.39)
9.50
9.33
7,070
2.55
2.55 4.18
89Year ended 05/31/16
9.75
0.38
(0.68)
(0.30)
(0.39)
–
(0.39)
9.06 (3.00)
4,458 2.59
2.59
4.21
54
Class R
Six months ended 08/31/21
9.24
0.20
0.11
0.31
(0.21)
–
(0.21)
9.34
3.34
3,527
0.88 (e)
1.56 (e) 4.18 (e)
47Year ended 02/28/21
8.99
0.44
0.28
0.72
(0.45)
(0.02)
(0.47)
9.24
8.46
3,151 0.89
2.34
5.04
161N
ine months ended 02/29/20
8.96
0.31
0.03
0.34
(0.29)
(0.02)
(0.31)
8.99
3.85
3,098
2.67 (e)
2.67 (e) 4.48 (e)
127
Year ended 05/31/19
9.17
0.48
(0.20)
0.28
(0.49)
–
(0.49)
8.96
3.17
2,839
2.20
2.20 5.36
56Year ended 05/31/18
9.51
0.47
(0.34)
0.13
(0.47)
–
(0.47)
9.17
1.36
2,185 2.07
2.07
4.96
71
Year ended 05/31/17
9.07
0.44
0.43
0.87
(0.43)
–
(0.43)
9.51
9.81
1,542 2.39
2.39
4.66
89
Year ended 05/31/16
9.75
0.42
(0.67)
(0.25)
(0.43)
–
(0.43)
9.07
(2.46)
554
2.37
2.37 4.65
54C
lass Y
Six m
onths ended 08/31/21
9.24
0.22
0.11
0.33
(0.23)
–
(0.23)
9.34
3.59
3,487 0.38 (e)
1.06 (e)
4.68 (e)
47
Year ended 02/28/21
8.99
0.49
0.28
0.77
(0.50)
(0.02)
(0.52)
9.24
9.00
1,425
0.39
1.84 5.54
161
Nine m
onths ended 02/29/20
8.97
0.34
0.03
0.37
(0.33)
(0.02)
(0.35)
8.99
4.16
1,105 2.17 (e)
2.17 (e)
5.01 (e)
127Year ended 05/31/19
9.17
0.53
(0.19)
0.34
(0.54)
–
(0.54)
8.97
3.85
1,505 1.50
1.50
5.91
56
Year ended 05/31/18
9.51
0.52
(0.34)
0.18
(0.52)
–
(0.52)
9.17
1.92
1,534
1.44
1.44 5.50
71Year ended 05/31/17
9.07
0.48
0.45
0.93
(0.49)
–
(0.49)
9.51 10.41
2,235 1.42
1.42
5.18
89
Year ended 05/31/16
9.75
0.47
(0.67)
(0.20)
(0.48)
–
(0.48)
9.07
(1.92)
657
1.50
1.50 5.18
54C
lass R5
Six months ended 08/31/21
9.24
0.22
0.11
0.33
(0.23)
–
(0.23)
9.34
3.59
10
0.38 (e)
1.06 (e) 4.68 (e)
47Year ended 02/28/21
8.99
0.49
0.28
0.77
(0.50)
(0.02)
(0.52)
9.24
9.00
10 0.39
1.52
5.54
161N
ine months ended 02/29/20
8.97
0.34
0.03
0.37
(0.33)
(0.02)
(0.35)
8.99
4.16
10
1.84 (e)
1.84 (e) 5.02 (e)
127
Period ended 05/31/19 (f)
9.02
0.01
(0.06)
(0.05)
(0.00)
–
(0.00)
8.97
3.48
10 1.22 (e)
1.22 (e)
5.91 (e)
56
Class R
6
Six m
onths ended 08/31/21
9.24
0.22
0.10
0.32
(0.23)
–
(0.23)
9.33
3.48
41 0.38 (e)
1.06 (e)
4.68 (e)
47
Year ended 02/28/21
9.00
0.48
0.28
0.76
(0.50)
(0.02)
(0.52)
9.24
8.88
23
0.39
1.52 5.54
161
Nine m
onths ended 02/29/20
8.97
0.35
0.04
0.39
(0.34)
(0.02)
(0.36)
9.00
4.32
110 1.81 (e)
1.81 (e)
5.05 (e)
127Year ended 05/31/19
9.16
0.54
(0.19)
0.35
(0.54)
–
(0.54)
8.97
3.98
123 1.31
1.31
5.96
56
Year ended 05/31/18
9.50
0.52
(0.33)
0.19
(0.53)
–
(0.53)
9.16
1.97
13,165 1.24
1.24
5.56
71
Year ended 05/31/17
9.07
0.48
0.44
0.92
(0.49)
–
(0.49)
9.50
10.34
9,843
1.18
1.18 5.12
89Year ended 05/31/16
9.75
0.47
(0.67)
(0.20)
(0.48)
–
(0.48)
9.07 (1.87)
22,186
1.27
1.27 5.26
54 (a)
Calculated using average shares outstanding.
(b) Includes adjustm
ents in accordance with accounting principles generally accepted in the U
nited States of America and as such, the net asset value for financial reporting purposes and the returns based upon those net asset values m
ay differ from the net asset value and
returns for shareholder transactions. Does not include sales charges and is not annualized for periods less than one year, if applicable.
(c) Portfolio turnover is calculated at the fund level and is not annualized for periods less than one year, if applicable.
(d) The total return, ratio of expenses to average net assets and ratio of net investm
ent income to average net assets reflect actual 12b–1 fees of 0.23%
and 0.23% for the six m
onths ended August 31, 2021 and the year ended February 28, 2021, respectively.

ˆ200F9gPqaG&Xye8G.Š200F9gPqaG&Xye8G.
209905 EDG 16INVESCOHIGH YIELD BOND FACT
30-Oct-2021 03:09 ESTHTMDTF
Donnelley Financial LSWpf_rendNone
8*ESS 0C
FWPLAN-PFRS5221.10.7.0
ˆ200F9gPqaG&Xye8G.Š200F9gPqaG&Xye8G.
209905 EDG 16INVESCOHIGH YIELD BOND FACT
30-Oct-2021 03:09 ESTHTMDTF
Donnelley Financial LSWpf_rendNone
8*ESS 0C
FWPLAN-PFRS5221.10.7.0
Page 2 of 2
(e) Annualized.
(f) C
omm
encement date after the close of business on M
ay 24, 2019. See accom
panying Notes to Financial Statem
ents which are an integral part of the financial statem
ents. 16
Invesco H
igh Yield Bond Factor Fund
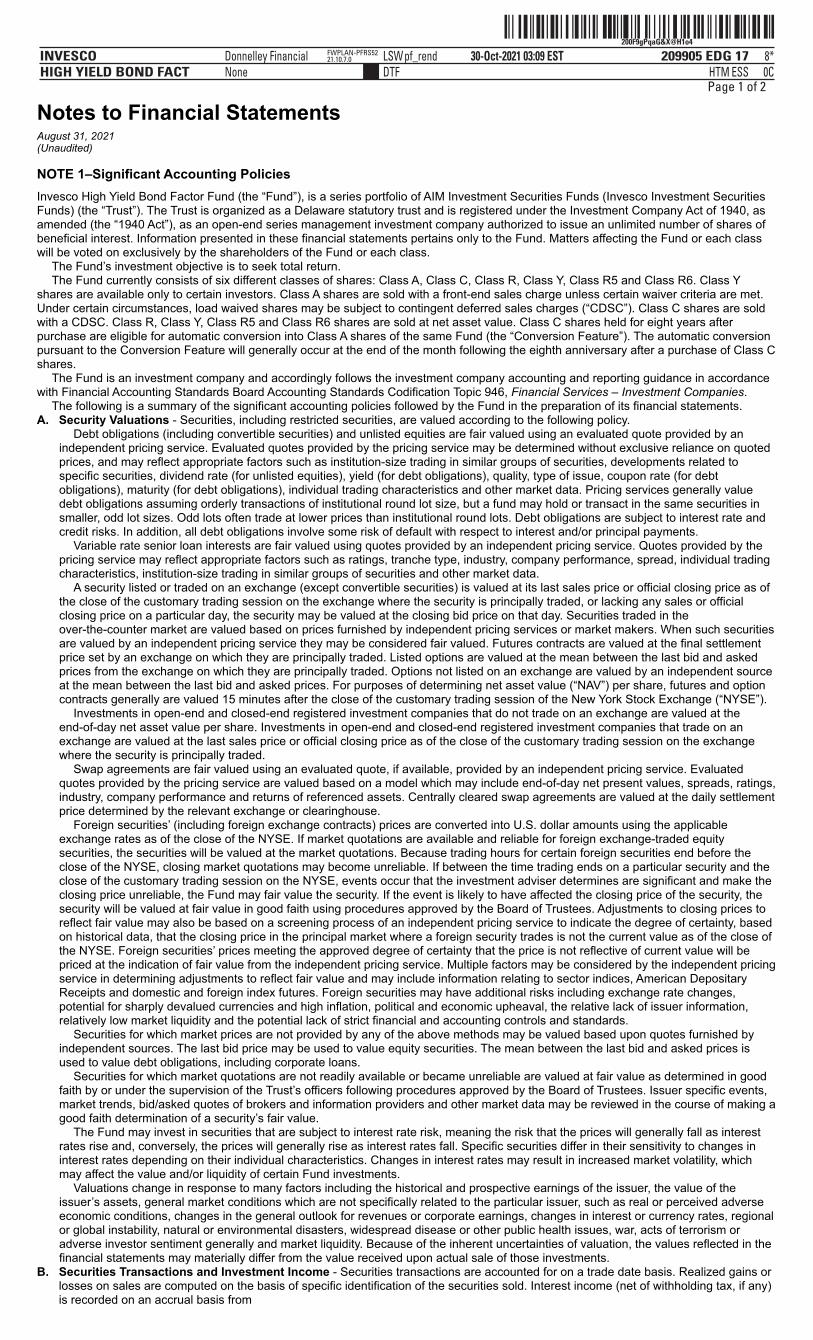
ˆ200F9gPqaG&X@H1o4Š200F9gPqaG&X@H1o4
209905 EDG 17INVESCOHIGH YIELD BOND FACT
30-Oct-2021 03:09 ESTHTMDTF
Donnelley Financial LSWpf_rendNone
8*ESS 0C
FWPLAN-PFRS5221.10.7.0
Page 1 of 2
Notes to Financial StatementsAugust 31, 2021(Unaudited)
NOTE 1–Significant Accounting PoliciesInvesco High Yield Bond Factor Fund (the “Fund”), is a series portfolio of AIM Investment Securities Funds (Invesco Investment SecuritiesFunds) (the “Trust”). The Trust is organized as a Delaware statutory trust and is registered under the Investment Company Act of 1940, asamended (the “1940 Act”), as an open-end series management investment company authorized to issue an unlimited number of shares ofbeneficial interest. Information presented in these financial statements pertains only to the Fund. Matters affecting the Fund or each classwill be voted on exclusively by the shareholders of the Fund or each class.
The Fund’s investment objective is to seek total return.The Fund currently consists of six different classes of shares: Class A, Class C, Class R, Class Y, Class R5 and Class R6. Class Y
shares are available only to certain investors. Class A shares are sold with a front-end sales charge unless certain waiver criteria are met.Under certain circumstances, load waived shares may be subject to contingent deferred sales charges (“CDSC”). Class C shares are soldwith a CDSC. Class R, Class Y, Class R5 and Class R6 shares are sold at net asset value. Class C shares held for eight years afterpurchase are eligible for automatic conversion into Class A shares of the same Fund (the “Conversion Feature”). The automatic conversionpursuant to the Conversion Feature will generally occur at the end of the month following the eighth anniversary after a purchase of Class Cshares.
The Fund is an investment company and accordingly follows the investment company accounting and reporting guidance in accordancewith Financial Accounting Standards Board Accounting Standards Codification Topic 946, Financial Services – Investment Companies.
The following is a summary of the significant accounting policies followed by the Fund in the preparation of its financial statements.A. Security Valuations - Securities, including restricted securities, are valued according to the following policy.
Debt obligations (including convertible securities) and unlisted equities are fair valued using an evaluated quote provided by anindependent pricing service. Evaluated quotes provided by the pricing service may be determined without exclusive reliance on quotedprices, and may reflect appropriate factors such as institution-size trading in similar groups of securities, developments related tospecific securities, dividend rate (for unlisted equities), yield (for debt obligations), quality, type of issue, coupon rate (for debtobligations), maturity (for debt obligations), individual trading characteristics and other market data. Pricing services generally valuedebt obligations assuming orderly transactions of institutional round lot size, but a fund may hold or transact in the same securities insmaller, odd lot sizes. Odd lots often trade at lower prices than institutional round lots. Debt obligations are subject to interest rate andcredit risks. In addition, all debt obligations involve some risk of default with respect to interest and/or principal payments.
Variable rate senior loan interests are fair valued using quotes provided by an independent pricing service. Quotes provided by thepricing service may reflect appropriate factors such as ratings, tranche type, industry, company performance, spread, individual tradingcharacteristics, institution-size trading in similar groups of securities and other market data.
A security listed or traded on an exchange (except convertible securities) is valued at its last sales price or official closing price as ofthe close of the customary trading session on the exchange where the security is principally traded, or lacking any sales or officialclosing price on a particular day, the security may be valued at the closing bid price on that day. Securities traded in theover-the-counter market are valued based on prices furnished by independent pricing services or market makers. When such securitiesare valued by an independent pricing service they may be considered fair valued. Futures contracts are valued at the final settlementprice set by an exchange on which they are principally traded. Listed options are valued at the mean between the last bid and askedprices from the exchange on which they are principally traded. Options not listed on an exchange are valued by an independent sourceat the mean between the last bid and asked prices. For purposes of determining net asset value (“NAV”) per share, futures and optioncontracts generally are valued 15 minutes after the close of the customary trading session of the New York Stock Exchange (“NYSE”).
Investments in open-end and closed-end registered investment companies that do not trade on an exchange are valued at theend-of-day net asset value per share. Investments in open-end and closed-end registered investment companies that trade on anexchange are valued at the last sales price or official closing price as of the close of the customary trading session on the exchangewhere the security is principally traded.
Swap agreements are fair valued using an evaluated quote, if available, provided by an independent pricing service. Evaluatedquotes provided by the pricing service are valued based on a model which may include end-of-day net present values, spreads, ratings,industry, company performance and returns of referenced assets. Centrally cleared swap agreements are valued at the daily settlementprice determined by the relevant exchange or clearinghouse.
Foreign securities’ (including foreign exchange contracts) prices are converted into U.S. dollar amounts using the applicableexchange rates as of the close of the NYSE. If market quotations are available and reliable for foreign exchange-traded equitysecurities, the securities will be valued at the market quotations. Because trading hours for certain foreign securities end before theclose of the NYSE, closing market quotations may become unreliable. If between the time trading ends on a particular security and theclose of the customary trading session on the NYSE, events occur that the investment adviser determines are significant and make theclosing price unreliable, the Fund may fair value the security. If the event is likely to have affected the closing price of the security, thesecurity will be valued at fair value in good faith using procedures approved by the Board of Trustees. Adjustments to closing prices toreflect fair value may also be based on a screening process of an independent pricing service to indicate the degree of certainty, basedon historical data, that the closing price in the principal market where a foreign security trades is not the current value as of the close ofthe NYSE. Foreign securities’ prices meeting the approved degree of certainty that the price is not reflective of current value will bepriced at the indication of fair value from the independent pricing service. Multiple factors may be considered by the independent pricingservice in determining adjustments to reflect fair value and may include information relating to sector indices, American DepositaryReceipts and domestic and foreign index futures. Foreign securities may have additional risks including exchange rate changes,potential for sharply devalued currencies and high inflation, political and economic upheaval, the relative lack of issuer information,relatively low market liquidity and the potential lack of strict financial and accounting controls and standards.
Securities for which market prices are not provided by any of the above methods may be valued based upon quotes furnished byindependent sources. The last bid price may be used to value equity securities. The mean between the last bid and asked prices isused to value debt obligations, including corporate loans.
Securities for which market quotations are not readily available or became unreliable are valued at fair value as determined in goodfaith by or under the supervision of the Trust’s officers following procedures approved by the Board of Trustees. Issuer specific events,market trends, bid/asked quotes of brokers and information providers and other market data may be reviewed in the course of making agood faith determination of a security’s fair value.
The Fund may invest in securities that are subject to interest rate risk, meaning the risk that the prices will generally fall as interestrates rise and, conversely, the prices will generally rise as interest rates fall. Specific securities differ in their sensitivity to changes ininterest rates depending on their individual characteristics. Changes in interest rates may result in increased market volatility, whichmay affect the value and/or liquidity of certain Fund investments.
Valuations change in response to many factors including the historical and prospective earnings of the issuer, the value of theissuer’s assets, general market conditions which are not specifically related to the particular issuer, such as real or perceived adverseeconomic conditions, changes in the general outlook for revenues or corporate earnings, changes in interest or currency rates, regionalor global instability, natural or environmental disasters, widespread disease or other public health issues, war, acts of terrorism oradverse investor sentiment generally and market liquidity. Because of the inherent uncertainties of valuation, the values reflected in thefinancial statements may materially differ from the value received upon actual sale of those investments.
B. Securities Transactions and Investment Income - Securities transactions are accounted for on a trade date basis. Realized gains orlosses on sales are computed on the basis of specific identification of the securities sold. Interest income (net of withholding tax, if any)is recorded on an accrual basis from

ˆ200F9gPqaG&X@H1o4Š200F9gPqaG&X@H1o4
209905 EDG 17INVESCOHIGH YIELD BOND FACT
30-Oct-2021 03:09 ESTHTMDTF
Donnelley Financial LSWpf_rendNone
8*ESS 0C
FWPLAN-PFRS5221.10.7.0
ˆ200F9gPqaG&X@H1o4Š200F9gPqaG&X@H1o4
209905 EDG 17INVESCOHIGH YIELD BOND FACT
30-Oct-2021 03:09 ESTHTMDTF
Donnelley Financial LSWpf_rendNone
8*ESS 0C
FWPLAN-PFRS5221.10.7.0
Page 2 of 2 17 Invesco High Yield Bond Factor Fund
ˆ200F9gPqaG&X#SKG^Š200F9gPqaG&X#SKG^
209905 EDG 18INVESCOHIGH YIELD BOND FACT
30-Oct-2021 03:09 ESTHTMDTF
Donnelley Financial LSWpf_rendNone
6*ESS 0C
FWPLAN-PFRS5221.10.7.0
Page 1 of 1
settlement date and includes coupon interest and amortization of premium and accretion of discount on debt securities as applicable.Pay-in-kind interest income and non-cash dividend income received in the form of securities in-lieu of cash are recorded at the fairvalue of the securities received. Paydown gains and losses on mortgage and asset-backed securities are recorded as adjustments tointerest income. Dividend income (net of withholding tax, if any) is recorded on the ex-dividend date.
The Fund may periodically participate in litigation related to Fund investments. As such, the Fund may receive proceeds fromlitigation settlements. Any proceeds received are included in the Statement of Operations as realized gain (loss) for investments nolonger held and as unrealized gain (loss) for investments still held.
Brokerage commissions and mark ups are considered transaction costs and are recorded as an increase to the cost basis ofsecurities purchased and/or a reduction of proceeds on a sale of securities. Such transaction costs are included in the determination ofnet realized and unrealized gain (loss) from investment securities reported in the Statement of Operations and the Statement ofChanges in Net Assets and the net realized and unrealized gains (losses) on securities per share in the Financial Highlights.Transaction costs are included in the calculation of the Fund’s net asset value and, accordingly, they reduce the Fund’s total returns.These transaction costs are not considered operating expenses and are not reflected in net investment income reported in theStatement of Operations and the Statement of Changes in Net Assets, or the net investment income per share and the ratios ofexpenses and net investment income reported in the Financial Highlights, nor are they limited by any expense limitation arrangementsbetween the Fund and the investment adviser.
The Fund allocates realized and unrealized capital gains and losses to a class based on the relative net assets of each class. TheFund allocates income to a class based on the relative value of the settled shares of each class.
C. Country Determination - For the purposes of making investment selection decisions and presentation in the Schedule of Investments,the investment adviser may determine the country in which an issuer is located and/or credit risk exposure based on various factors.These factors include the laws of the country under which the issuer is organized, where the issuer maintains a principal office, thecountry in which the issuer derives 50% or more of its total revenues and the country that has the primary market for the issuer’ssecurities, as well as other criteria. Among the other criteria that may be evaluated for making this determination are the country inwhich the issuer maintains 50% or more of its assets, the type of security, financial guarantees and enhancements, the nature of thecollateral and the sponsor organization. Country of issuer and/or credit risk exposure has been determined to be the United States ofAmerica, unless otherwise noted.
D. Distributions - Distributions from net investment income, if any, are declared daily and paid monthly. Distributions from net realizedcapital gain, if any, are generally declared and paid annually and recorded on the ex-dividend date. The Fund may elect to treat aportion of the proceeds from redemptions as distributions for federal income tax purposes.
E. Federal Income Taxes - The Fund intends to comply with the requirements of Subchapter M of the Internal Revenue Code of 1986, asamended (the “Internal Revenue Code”), necessary to qualify as a regulated investment company and to distribute substantially all ofthe Fund’s taxable earnings to shareholders. As such, the Fund will not be subject to federal income taxes on otherwise taxable income(including net realized capital gain) that is distributed to shareholders. Therefore, no provision for federal income taxes is recorded inthe financial statements.
The Fund recognizes the tax benefits of uncertain tax positions only when the position is more likely than not to be sustained.Management has analyzed the Fund’s uncertain tax positions and concluded that no liability for unrecognized tax benefits should berecorded related to uncertain tax positions. Management is not aware of any tax positions for which it is reasonably possible that thetotal amounts of unrecognized tax benefits will change materially in the next 12 months.
The Fund files tax returns in the U.S. Federal jurisdiction and certain other jurisdictions. Generally, the Fund is subject toexaminations by such taxing authorities for up to three years after the filing of the return for the tax period.
F. Expenses - Fees provided for under the Rule 12b-1 plan of a particular class of the Fund are charged to the operations of such class.Transfer agency fees and expenses and other shareholder recordkeeping fees and expenses attributable to Class R5 and Class R6 areallocated based on relative net assets of Class R5 and Class R6. Sub-accounting fees attributable to Class R5 are charged to theoperations of the class. Transfer agency fees and expenses and other shareholder recordkeeping fees and expenses relating to allother classes are allocated among those classes based on relative net assets. All other expenses are allocated among the classesbased on relative net assets.
G. Accounting Estimates - The preparation of financial statements in conformity with accounting principles generally accepted in theUnited States of America (“GAAP”) requires management to make estimates and assumptions that affect the reported amounts ofassets and liabilities at the date of the financial statements and the reported amounts of revenues and expenses during the reportingperiod including estimates and assumptions related to taxation. Actual results could differ from those estimates by a significant amount.In addition, the Fund monitors for material events or transactions that may occur or become known after the period-end date and beforethe date the financial statements are released to print.
H. Indemnifications - Under the Trust’s organizational documents, each Trustee, officer, employee or other agent of the Trust isindemnified against certain liabilities that may arise out of the performance of their duties to the Fund. Additionally, in the normal courseof business, the Fund enters into contracts, including the Fund’s servicing agreements, that contain a variety of indemnification clauses.The Fund’s maximum exposure under these arrangements is unknown as this would involve future claims that may be made againstthe Fund that have not yet occurred. The risk of material loss as a result of such indemnification claims is considered remote.
I. Securities Purchased on a When-Issued and Delayed Delivery Basis - The Fund may purchase and sell interests in corporateloans and corporate debt securities and other portfolio securities on a when-issued and delayed delivery basis, with payment anddelivery scheduled for a future date. No income accrues to the Fund on such interests or securities in connection with such transactionsprior to the date the Fund actually takes delivery of such interests or securities. These transactions are subject to market fluctuationsand are subject to the risk that the value at delivery may be more or less than the trade date purchase price. Although the Fund willgenerally purchase these securities with the intention of acquiring such securities, they may sell such securities prior to the settlementdate.
J. Foreign Currency Translations - Foreign currency is valued at the close of the NYSE based on quotations posted by banks and majorcurrency dealers. Portfolio securities and other assets and liabilities denominated in foreign currencies are translated into U.S. dollaramounts at the date of valuation. Purchases and sales of portfolio securities (net of foreign taxes withheld on disposition) and incomeitems denominated in foreign currencies are translated into U.S. dollar amounts on the respective dates of such transactions. The Funddoes not separately account for the portion of the results of operations resulting from changes in foreign exchange rates on investmentsand the fluctuations arising from changes in market prices of securities held. The combined results of changes in foreign exchangerates and the fluctuation of market prices on investments (net of estimated foreign tax withholding) are included with the net realizedand unrealized gain or loss from investments in the Statement of Operations. Reported net realized foreign currency gains or lossesarise from (1) sales of foreign currencies, (2) currency gains or losses realized between the trade and settlement dates on securitiestransactions, and (3) the difference between the amounts of dividends, interest, and foreign withholding taxes recorded on the Fund’sbooks and the U.S. dollar equivalent of the amounts actually received or paid. Net unrealized foreign currency gains and losses arisefrom changes in the fair values of assets and liabilities, other than investments in securities at fiscal period end, resulting from changesin exchange rates.
The Fund may invest in foreign securities, which may be subject to foreign taxes on income, gains on investments or currencyrepatriation, a portion of which may be recoverable. Foreign taxes, if any, are recorded based on the tax regulations and rates that existin the foreign markets in which the Fund invests and are shown in the Statement of Operations.
18 Invesco High Yield Bond Factor Fund
ˆ200F9gPqaG&X&3BoWŠ200F9gPqaG&X&3BoW
209905 EDG 19INVESCOHIGH YIELD BOND FACT
30-Oct-2021 03:09 ESTHTMDTF
Donnelley Financial LSWpf_rendNone
4*ESS 0C
FWPLAN-PFRS5221.10.7.0
Page 1 of 1K. Forward Foreign Currency Contracts - The Fund may engage in foreign currency transactions either on a spot (i.e. for prompt
delivery and settlement) basis, or through forward foreign currency contracts, to manage or minimize currency or exchange rate risk.The Fund may also enter into forward foreign currency contracts for the purchase or sale of a security denominated in a foreign
currency in order to “lock in” the U.S. dollar price of that security, or the Fund may also enter into forward foreign currency contracts thatdo not provide for physical settlement of the two currencies, but instead are settled by a single cash payment calculated as thedifference between the agreed upon exchange rate and the spot rate at settlement based upon an agreed upon notional amount(non-deliverable forwards). The Fund will set aside liquid assets in an amount equal to the daily mark-to-market obligation for forwardforeign currency contracts.
A forward foreign currency contract is an obligation between two parties (“Counterparties”) to purchase or sell a specific currency foran agreed-upon price at a future date. The use of forward foreign currency contracts does not eliminate fluctuations in the price of theunderlying securities the Fund owns or intends to acquire but establishes a rate of exchange in advance. Fluctuations in the value ofthese contracts are measured by the difference in the contract date and reporting date exchange rates and are recorded as unrealizedappreciation (depreciation) until the contracts are closed. When the contracts are closed, realized gains (losses) are recorded. Realizedand unrealized gains (losses) on the contracts are included in the Statement of Operations. The primary risks associated with forwardforeign currency contracts include failure of the Counterparty to meet the terms of the contract and the value of the foreign currencychanging unfavorably. These risks may be in excess of the amounts reflected in the Statement of Assets and Liabilities.
L. Futures Contracts - The Fund may enter into futures contracts to manage exposure to interest rate, equity and market pricemovements and/or currency risks. A futures contract is an agreement between Counterparties to purchase or sell a specified underlyingsecurity, currency or commodity (or delivery of a cash settlement price, in the case of an index future) for a fixed price at a future date.The Fund currently invests only in exchange-traded futures and they are standardized as to maturity date and underlying financialinstrument. Initial margin deposits required upon entering into futures contracts are satisfied by the segregation of specific securities orcash as collateral at the futures commission merchant (broker). During the period the futures contracts are open, changes in the valueof the contracts are recognized as unrealized gains or losses by recalculating the value of the contracts on a daily basis. Subsequent orvariation margin payments are received or made depending upon whether unrealized gains or losses are incurred. These amounts arereflected as receivables or payables on the Statement of Assets and Liabilities. When the contracts are closed or expire, the Fundrecognizes a realized gain or loss equal to the difference between the proceeds from, or cost of, the closing transaction and the Fund’sbasis in the contract. The net realized gain (loss) and the change in unrealized gain (loss) on futures contracts held during the period isincluded on the Statement of Operations. The primary risks associated with futures contracts are market risk and the absence of aliquid secondary market. If the Fund were unable to liquidate a futures contract and/or enter into an offsetting closing transaction, theFund would continue to be subject to market risk with respect to the value of the contracts and continue to be required to maintain themargin deposits on the futures contracts. Futures contracts have minimal Counterparty risk since the exchange’s clearinghouse, asCounterparty to all exchange-traded futures, guarantees the futures against default. Risks may exceed amounts recognized in theStatement of Assets and Liabilities.
M. Swap Agreements - The Fund may enter into various swap transactions, including interest rate, total return, index, currency and creditdefault swap contracts (“CDS”) for investment purposes or to manage interest rate, currency or credit risk. Such transactions areagreements between Counterparties. A swap agreement may be negotiated bilaterally and traded over-the-counter (“OTC”) betweentwo parties (“uncleared/ OTC”) or, in some instances, must be transacted through a future commission merchant (“FCM”) and clearedthrough a clearinghouse that serves as a central Counterparty (“centrally cleared swap”). These agreements may contain among otherconditions, events of default and termination events, and various covenants and representations such as provisions that require theFund to maintain a pre-determined level of net assets, and/ or provide limits regarding the decline of the Fund’s NAV over specificperiods of time. If the Fund were to trigger such provisions and have open derivative positions at that time, the Counterparty may beable to terminate such agreement and request immediate payment in an amount equal to the net liability positions, if any.
Interest rate, total return, index, and currency swap agreements are two-party contracts entered into primarily to exchange thereturns (or differentials in rates of returns) earned or realized on particular predetermined investments or instruments. The gross returnsto be exchanged or “swapped” between the parties are calculated with respect to a notional amount, i.e., the return on or increase invalue of a particular dollar amount invested at a particular interest rate or return of an underlying asset, in a particular foreign currency,or in a “basket” of securities representing a particular index.
In a centrally cleared swap, the Fund’s ultimate Counterparty is a central clearinghouse. The Fund initially will enter into centrallycleared swaps through an executing broker. When a fund enters into a centrally cleared swap, it must deliver to the centralCounterparty (via the FCM) an amount referred to as “initial margin.” Initial margin requirements are determined by the centralCounterparty, but an FCM may require additional initial margin above the amount required by the central Counterparty. Initial margindeposits required upon entering into centrally cleared swaps are satisfied by cash or securities as collateral at the FCM. Securitiesdeposited as initial margin are designated on the Schedule of Investments and cash deposited is recorded on the Statement of Assetsand Liabilities. During the term of a cleared swap agreement, a “variation margin” amount may be required to be paid by the Fund ormay be received by the Fund, based on the daily change in price of the underlying reference instrument subject to the swap agreementand is recorded as a receivable or payable for variation margin in the Statement of Assets and Liabilities until the centrally cleared swapis terminated at which time a realized gain or loss is recorded.
A CDS is an agreement between Counterparties to exchange the credit risk of an issuer. A buyer of a CDS is said to buy protectionby paying a fixed payment over the life of the agreement and in some situations an upfront payment to the seller of the CDS. If adefined credit event occurs (such as payment default or bankruptcy), the Fund as a protection buyer would cease paying its fixedpayment, the Fund would deliver eligible bonds issued by the reference entity to the seller, and the seller would pay the full notionalvalue, or the “par value”, of the referenced obligation to the Fund. A seller of a CDS is said to sell protection and thus would receive afixed payment over the life of the agreement and an upfront payment, if applicable. If a credit event occurs, the Fund as a protectionseller would cease to receive the fixed payment stream, the Fund would pay the buyer “par value” or the full notional value of thereferenced obligation, and the Fund would receive the eligible bonds issued by the reference entity. In turn, these bonds may be sold inorder to realize a recovery value. Alternatively, the seller of the CDS and its Counterparty may agree to net the notional amount and themarket value of the bonds and make a cash payment equal to the difference to the buyer of protection. If no credit event occurs, theFund receives the fixed payment over the life of the agreement. As the seller, the Fund would effectively add leverage to its portfoliobecause, in addition to its total net assets, the Fund would be subject to investment exposure on the notional amount of the CDS. Inconnection with these agreements, cash and securities may be identified as collateral in accordance with the terms of the respectiveswap agreements to provide assets of value and recourse in the event of default under the swap agreement or bankruptcy/insolvencyof a party to the swap agreement. If a Counterparty becomes bankrupt or otherwise fails to perform its obligations due to financialdifficulties, the Fund may experience significant delays in obtaining any recovery in a bankruptcy or other reorganization proceeding.The Fund may obtain only limited recovery or may obtain no recovery in such circumstances. The Fund’s maximum risk of loss fromCounterparty risk, either as the protection seller or as the protection buyer, is the value of the contract. The risk may be mitigated byhaving a master netting arrangement between the Fund and the Counterparty and by the designation of collateral by the Counterpartyto cover the Fund’s exposure to the Counterparty.
Implied credit spreads represent the current level at which protection could be bought or sold given the terms of the existing CDScontract and serve as an indicator of the current status of the payment/performance risk of the CDS. An implied spread that haswidened or increased since entry into the initial contract may indicate a deteriorating credit profile and increased risk of default for thereference entity. A declining or narrowing spread may indicate an improving credit profile or decreased risk of default for the referenceentity. Alternatively, credit spreads may increase or decrease reflecting the general tolerance for risk in the credit markets.
An interest rate swap is an agreement between Counterparties pursuant to which the parties exchange a floating rate payment for afixed rate payment based on a specified notional amount.
19 Invesco High Yield Bond Factor Fund
ˆ200F9gPqaG&Y0DVGÊ200F9gPqaG&Y0DVGˆ
209905 EDG 20INVESCOHIGH YIELD BOND FACT
30-Oct-2021 03:09 ESTHTMDTF
Donnelley Financial LSWpf_rendNone
8*ESS 0C
FWPLAN-PFRS5221.10.7.0
Page 1 of 1Changes in the value of centrally cleared and OTC swap agreements are recognized as unrealized gains (losses) in the Statement
of Operations by “marking to market” on a daily basis to reflect the value of the swap agreement at the end of each trading day.Payments received or paid at the beginning of the agreement are reflected as such on the Statement of Assets and Liabilities and maybe referred to as upfront payments. The Fund accrues for the fixed payment stream and amortizes upfront payments, if any, on swapagreements on a daily basis with the net amount, recorded as a component of realized gain (loss) on the Statement of Operations. Aliquidation payment received or made at the termination of a swap agreement is recorded as realized gain (loss) on the Statement ofOperations. The Fund segregates cash or liquid securities having a value at least equal to the amount of the potential obligation of aFund under any swap transaction. Cash held as collateral is recorded as deposits with brokers on the Statement of Assets andLiabilities. Entering into these agreements involves, to varying degrees, lack of liquidity and elements of credit, market, andCounterparty risk in excess of amounts recognized on the Statement of Assets and Liabilities. Such risks involve the possibility that aswap is difficult to sell or liquidate; the Counterparty does not honor its obligations under the agreement and unfavorable interest ratesand market fluctuations. It is possible that developments in the swaps market, including potential government regulation, couldadversely affect the Fund’s ability to terminate existing swap agreements or to realize amounts to be received under such agreements.Additionally, an International Swaps and Derivatives Association Master Agreement (“ISDA Master Agreement”) includes credit relatedcontingent features which allow Counterparties to OTC derivatives to terminate derivative contracts prior to maturity in the event that,for example, the Fund’s net assets decline by a stated percentage or the Fund fails to meet the terms of its ISDA Master Agreement,which would cause the Fund to accelerate payment of any net liability owed to the Counterparty. A short position in a security posesmore risk than holding the same security long. As there is no limit on how much the price of the security can increase, the Fund’sexposure is unlimited.
Notional amounts of each individual credit default swap agreement outstanding as of August 31, 2021 for which the Fund is the sellerof protection are disclosed in the open swap agreements table. These potential amounts would be partially offset by any recoveryvalues of the respective referenced obligations, upfront payments received upon entering into the agreement, or net amounts receivedfrom the settlement of buy protection credit default swap agreements entered into by the Fund for the same referenced entity or entities.
N. Leverage Risk - Leverage exists when the Fund can lose more than it originally invests because it purchases or sells an instrument orenters into a transaction without investing an amount equal to the full economic exposure of the instrument or transaction.
O. Collateral - To the extent the Fund has designated or segregated a security as collateral and that security is subsequently sold, it is theFund’s practice to replace such collateral no later than the next business day.
P. Other Risks - The Fund may invest in lower-quality debt securities, i.e., “junk bonds”. Investments in lower-rated securities or unratedsecurities of comparable quality tend to be more sensitive to economic conditions than higher rated securities. Junk bonds involve agreater risk of default by the issuer because such securities are generally unsecured and are often subordinated to other creditors’claims.
Active trading of portfolio securities may result in added expenses, a lower return and increased tax liability.Q. COVID-19 Risk - The COVID-19 strain of coronavirus has resulted in instances of market closures and dislocations, extreme volatility,
liquidity constraints and increased trading costs. Efforts to contain its spread have resulted in travel restrictions, disruptions ofhealthcare systems, business operations and supply chains, layoffs, lower consumer demand, and defaults, among other significanteconomic impacts that have disrupted global economic activity across many industries. Such economic impacts may exacerbate otherpre-existing political, social and economic risks locally or globally.
The ongoing effects of COVID-19 are unpredictable and may result in significant and prolonged effects on the Fund’s performance.
NOTE 2–Advisory Fees and Other Fees Paid to Affiliates
The Trust has entered into a master investment advisory agreement with Invesco Advisers, Inc. (the “Adviser” or “Invesco”). Under theterms of the investment advisory agreement, the Fund accrues daily and pays monthly an advisory fee to the Adviser based on the annualrate of the Fund’s average daily net assets as follows:
Average Daily Net Assets RateFirst $2 billion 0.370%Over $2 billion 0.350%
For the six months ended August 31, 2021, the effective advisory fee rate incurred by the Fund was 0.37%.Under the terms of a master sub-advisory agreement between the Adviser and each of Invesco Asset Management Deutschland GmbH,
Invesco Asset Management Limited, Invesco Asset Management (Japan) Limited, Invesco Hong Kong Limited, Invesco Senior SecuredManagement, Inc. and Invesco Canada Ltd. and separate sub-advisory agreements with Invesco Capital Management LLC and InvescoAsset Management (India) Private Limited (collectively, the “Affiliated Sub-Advisers”) the Adviser, not the Fund, will pay 40% of the fees paidto the Adviser to any such Affiliated Sub-Adviser(s) that provide(s) discretionary investment management services to the Fund based on thepercentage of assets allocated to such Affiliated Sub-Adviser(s). Invesco has also entered into a sub-advisory agreement withOppenheimerFunds, Inc. to provide discretionary management services to the Fund.
The Adviser has contractually agreed, through at least June 30, 2022, to waive advisory fees and/or reimburse expenses of all shares tothe extent necessary to limit total annual fund operating expenses after fee waiver and/or expense reimbursement (excluding certain itemsdiscussed below) of Class A, Class C, Class R, Class Y, Class R5 and Class R6 shares to 0.64%, 1.39%, 0.89%, 0.39%, 0.39% and 0.39%,respectively, of the Fund’s average daily net assets (the “expense limits”). In determining the Adviser’s obligation to waive advisory feesand/or reimburse expenses, the following expenses are not taken into account, and could cause the total annual fund operating expensesafter fee waiver and/or reimbursement to exceed the numbers reflected above: (1) interest; (2) taxes; (3) dividend expense on short sales;(4) extraordinary or non-routine items, including litigation expenses; and (5) expenses that the Fund has incurred but did not actually paybecause of an expense offset arrangement. Unless Invesco continues the fee waiver agreement, it will terminate on June 30, 2022. Duringits term, the fee waiver agreement cannot be terminated or amended to increase the expense limits or reduce the advisory fee waiverswithout approval of the Board of Trustees.
The Adviser has contractually agreed, through at least June 30, 2023, to waive the advisory fee payable by the Fund in an amount equalto 100% of the net advisory fees the Adviser receives from the affiliated money market funds on investments by the Fund of uninvestedcash in such affiliated money market funds.
For the six months ended August 31, 2021, the Adviser waived advisory fees of $68,429, reimbursed fund level expenses of $42,560 andreimbursed class level expenses of $8,858, $1,793, $1,159, $654, $4 and $12 of Class A, Class C, Class R, Class Y, Class R5 andClass R6 shares, respectively.
The Trust has entered into a master administrative services agreement with Invesco pursuant to which the Fund has agreed to payInvesco for certain administrative costs incurred in providing accounting services to the Fund. For the six months ended August 31, 2021,expenses incurred under the agreement are shown in the Statement of Operations as Administrative services fees. Invesco has enteredinto a sub-administration agreement whereby State Street Bank and Trust Company (“SSB”) serves as fund accountant and providescertain administrative services to the Fund. Pursuant to a custody agreement with the Trust on behalf of the Fund, SSB also serves as theFund’s custodian.
The Trust has entered into a transfer agency and service agreement with Invesco Investment Services, Inc. (“IIS”) pursuant to which theFund has agreed to pay IIS a fee for providing transfer agency and shareholder services to the Fund and reimburse IIS for certain expensesincurred by IIS in the course of providing such services. IIS may make payments to intermediaries that provide omnibus account services,sub-accounting services and/or networking services. All fees payable by IIS to intermediaries that provide omnibus account services orsub-accounting services are charged back to the Fund, subject to certain limitations approved by the Trust’s Board of Trustees. For the sixmonths ended August 31, 2021, expenses incurred under the agreement are shown in the Statement of Operations as Transfer agent fees. 20 Invesco High Yield Bond Factor Fund
ˆ200F9gPqaG&W%fDG?Š200F9gPqaG&W%fDG?
209905 EDG 21INVESCOHIGH YIELD BOND FACT
30-Oct-2021 03:09 ESTHTMDTF
Donnelley Financial LSWpf_rendNone
8*ESS 0C
LSWP64RS2421.10.7.0
Page 1 of 1The Trust has entered into master distribution agreements with Invesco Distributors, Inc. (“IDI”) to serve as the distributor for the Class A,
Class C, Class R, Class Y, Class R5 and Class R6 shares of the Fund. The Trust has adopted plans pursuant to Rule 12b-1 under the 1940Act with respect to the Fund’s Class A, Class C and Class R shares (collectively, the “Plans”). The Fund, pursuant to the Class A Plan,reimburses IDI for its allocated share of expenses incurred for the period, up to a maximum annual rate of 0.25% of the average daily netassets of Class A shares. The Fund pursuant to the Class C and Class R Plan, pays IDI compensation at the annual rate of 1.00% of theaverage daily net assets of Class C shares and 0.50% of the average daily net assets of Class R shares. The fees are accrued daily andpaid monthly. Of the Plan payments, up to 0.25% of the average daily net assets of each class of shares may be paid to furnish continuingpersonal shareholder services to customers who purchase and own shares of such classes. Any amounts not paid as a service fee underthe Plans would constitute an asset-based sales charge. Rules of the Financial Industry Regulatory Authority (“FINRA”) impose a cap onthe total sales charges, including asset-based sales charges, that may be paid by any class of shares of the Fund. For the six monthsended August 31, 2021, expenses incurred under the Plans are shown in the Statement of Operations as Distribution fees.
Front-end sales commissions and CDSC (collectively, the “sales charges”) are not recorded as expenses of the Fund. Front-end salescommissions are deducted from proceeds from the sales of Fund shares prior to investment in Class A shares of the Fund. CDSC arededucted from redemption proceeds prior to remittance to the shareholder. During the six months ended August 31, 2021, IDI advised theFund that IDI retained $4,318 in front-end sales commissions from the sale of Class A shares and $0 and $24 from Class A and Class Cshares, respectively, for CDSC imposed upon redemptions by shareholders.
Certain officers and trustees of the Trust are officers and directors of the Adviser, IIS and/or IDI.
NOTE 3–Additional Valuation Information
GAAP defines fair value as the price that would be received to sell an asset or paid to transfer a liability in an orderly transaction betweenmarket participants at the measurement date, under current market conditions. GAAP establishes a hierarchy that prioritizes the inputs tovaluation methods, giving the highest priority to readily available unadjusted quoted prices in an active market for identical assets (Level 1)and the lowest priority to significant unobservable inputs (Level 3), generally when market prices are not readily available or are unreliable.Based on the valuation inputs, the securities or other investments are tiered into one of three levels. Changes in valuation methods mayresult in transfers in or out of an investment’s assigned level: Level 1 - Prices are determined using quoted prices in an active market for identical assets. Level 2 -
Prices are determined using other significant observable inputs. Observable inputs are inputs that other market participantsmay use in pricing a security. These may include quoted prices for similar securities, interest rates, prepayment speeds, creditrisk, yield curves, loss severities, default rates, discount rates, volatilities and others.
Level 3 -
Prices are determined using significant unobservable inputs. In situations where quoted prices or observable inputs areunavailable (for example, when there is little or no market activity for an investment at the end of the period), unobservableinputs may be used. Unobservable inputs reflect the Fund’s own assumptions about the factors market participants would usein determining fair value of the securities or instruments and would be based on the best available information.
The following is a summary of the tiered valuation input levels, as of August 31, 2021. The level assigned to the securities valuations maynot be an indication of the risk or liquidity associated with investing in those securities. Because of the inherent uncertainties of valuation,the values reflected in the financial statements may materially differ from the value received upon actual sale of those investments.
Level 1 Level 2 Level 3 Total
Investments in Securities
U.S. Dollar Denominated Bonds & Notes $ – $35,550,095 $ – $35,550,095
Exchange-Traded Funds 1,120,053 – – 1,120,053
Common Stocks & Other Equity Interests 99,153 10,738 31,201 141,092
U.S. Treasury Securities – 72,985 – 72,985
Variable Rate Senior Loan Interests – 12,060 – 12,060
Preferred Stocks – 1,204 – 1,204
Money Market Funds 1,432,463 – – 1,432,463
Total Investments in Securities 2,651,669 35,647,082 31,201 38,329,952
Other Investments - Assets*
Futures Contracts 12,156 – – 12,156
Swap Agreements – 8,643 – 8,643
12,156 8,643 – 20,799
Other Investments - Liabilities*
Futures Contracts (1,215) – – (1,215)
Total Other Investments 10,941 8,643 – 19,584
Total Investments $2,662,610 $35,655,725 $31,201 $38,349,536
* Unrealized appreciation (depreciation).
NOTE 4–Derivative Investments
The Fund may enter into an International Swaps and Derivatives Association Master Agreement (“ISDA Master Agreement”) under which afund may trade OTC derivatives. An OTC transaction entered into under an ISDA Master Agreement typically involves a collateral postingarrangement, payment netting provisions and close-out netting provisions. These netting provisions allow for reduction of credit risk throughnetting of contractual obligations. The enforceability of the netting provisions of the ISDA Master Agreement depends on the governing lawof the ISDA Master Agreement, among other factors.
For financial reporting purposes, the Fund does not offset OTC derivative assets or liabilities that are subject to ISDA Master Agreementsin the Statement of Assets and Liabilities. 21 Invesco High Yield Bond Factor Fund
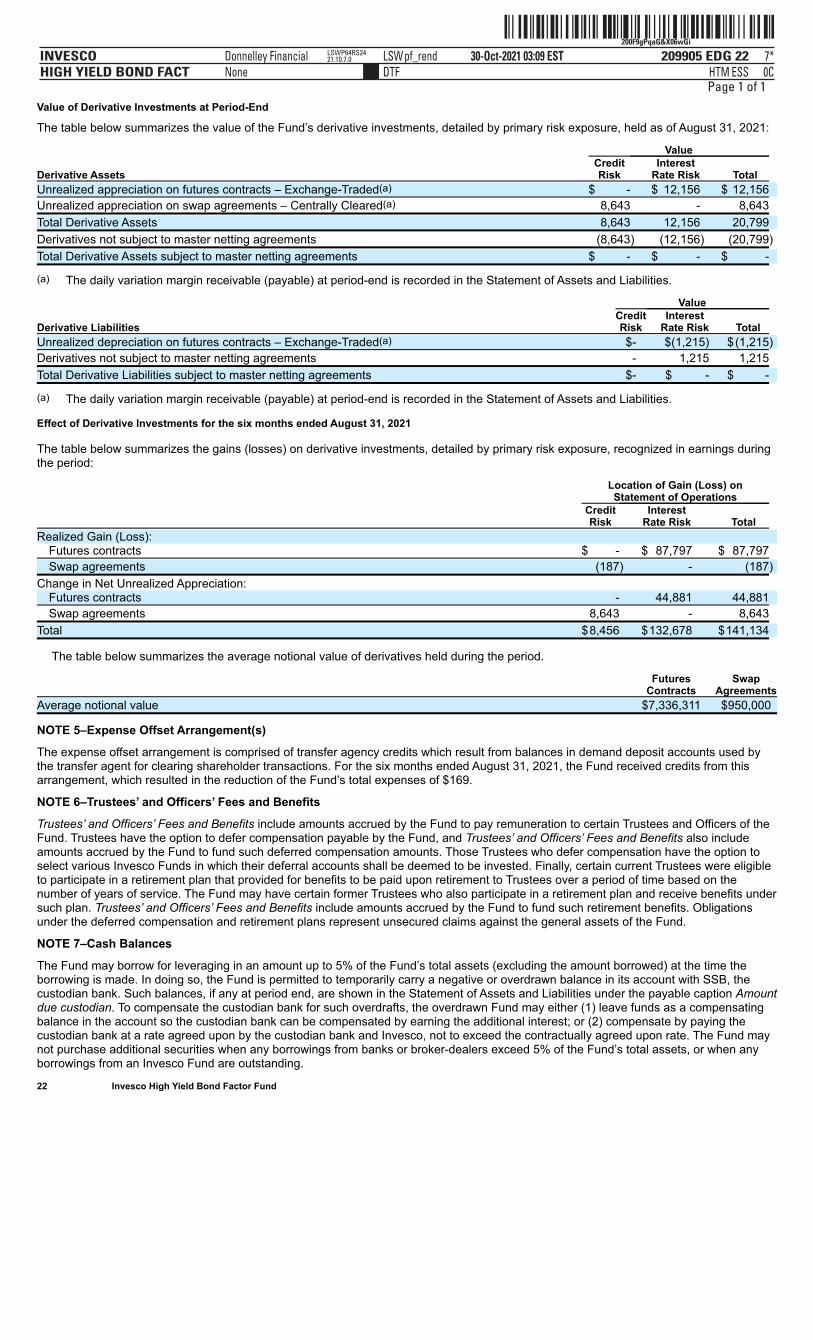
ˆ200F9gPqaG&X06wGiŠ200F9gPqaG&X06wGi
209905 EDG 22INVESCOHIGH YIELD BOND FACT
30-Oct-2021 03:09 ESTHTMDTF
Donnelley Financial LSWpf_rendNone
7*ESS 0C
LSWP64RS2421.10.7.0
Page 1 of 1Value of Derivative Investments at Period-End
The table below summarizes the value of the Fund’s derivative investments, detailed by primary risk exposure, held as of August 31, 2021:
Value
Derivative Assets CreditRisk
InterestRate Risk Total
Unrealized appreciation on futures contracts – Exchange-Traded(a) $ - $ 12,156 $ 12,156
Unrealized appreciation on swap agreements – Centrally Cleared(a) 8,643 - 8,643
Total Derivative Assets 8,643 12,156 20,799
Derivatives not subject to master netting agreements (8,643) (12,156) (20,799)
Total Derivative Assets subject to master netting agreements $ - $ - $ -
(a) The daily variation margin receivable (payable) at period-end is recorded in the Statement of Assets and Liabilities.
Value
Derivative Liabilities CreditRisk
InterestRate Risk Total
Unrealized depreciation on futures contracts – Exchange-Traded(a) $- $(1,215) $(1,215)
Derivatives not subject to master netting agreements - 1,215 1,215
Total Derivative Liabilities subject to master netting agreements $- $ - $ -
(a) The daily variation margin receivable (payable) at period-end is recorded in the Statement of Assets and Liabilities.
Effect of Derivative Investments for the six months ended August 31, 2021
The table below summarizes the gains (losses) on derivative investments, detailed by primary risk exposure, recognized in earnings duringthe period:
Location of Gain (Loss) onStatement of Operations
Credit Interest Risk Rate Risk Total
Realized Gain (Loss): Futures contracts $ - $ 87,797 $ 87,797
Swap agreements (187) - (187)
Change in Net Unrealized Appreciation: Futures contracts - 44,881 44,881
Swap agreements 8,643 - 8,643
Total $8,456 $132,678 $141,134
The table below summarizes the average notional value of derivatives held during the period.
Futures Swap Contracts Agreements
Average notional value $7,336,311 $950,000
NOTE 5–Expense Offset Arrangement(s)
The expense offset arrangement is comprised of transfer agency credits which result from balances in demand deposit accounts used bythe transfer agent for clearing shareholder transactions. For the six months ended August 31, 2021, the Fund received credits from thisarrangement, which resulted in the reduction of the Fund’s total expenses of $169.
NOTE 6–Trustees’ and Officers’ Fees and Benefits
Trustees’ and Officers’ Fees and Benefits include amounts accrued by the Fund to pay remuneration to certain Trustees and Officers of theFund. Trustees have the option to defer compensation payable by the Fund, and Trustees’ and Officers’ Fees and Benefits also includeamounts accrued by the Fund to fund such deferred compensation amounts. Those Trustees who defer compensation have the option toselect various Invesco Funds in which their deferral accounts shall be deemed to be invested. Finally, certain current Trustees were eligibleto participate in a retirement plan that provided for benefits to be paid upon retirement to Trustees over a period of time based on thenumber of years of service. The Fund may have certain former Trustees who also participate in a retirement plan and receive benefits undersuch plan. Trustees’ and Officers’ Fees and Benefits include amounts accrued by the Fund to fund such retirement benefits. Obligationsunder the deferred compensation and retirement plans represent unsecured claims against the general assets of the Fund.
NOTE 7–Cash Balances
The Fund may borrow for leveraging in an amount up to 5% of the Fund’s total assets (excluding the amount borrowed) at the time theborrowing is made. In doing so, the Fund is permitted to temporarily carry a negative or overdrawn balance in its account with SSB, thecustodian bank. Such balances, if any at period end, are shown in the Statement of Assets and Liabilities under the payable caption Amountdue custodian. To compensate the custodian bank for such overdrafts, the overdrawn Fund may either (1) leave funds as a compensatingbalance in the account so the custodian bank can be compensated by earning the additional interest; or (2) compensate by paying thecustodian bank at a rate agreed upon by the custodian bank and Invesco, not to exceed the contractually agreed upon rate. The Fund maynot purchase additional securities when any borrowings from banks or broker-dealers exceed 5% of the Fund’s total assets, or when anyborrowings from an Invesco Fund are outstanding. 22 Invesco High Yield Bond Factor Fund
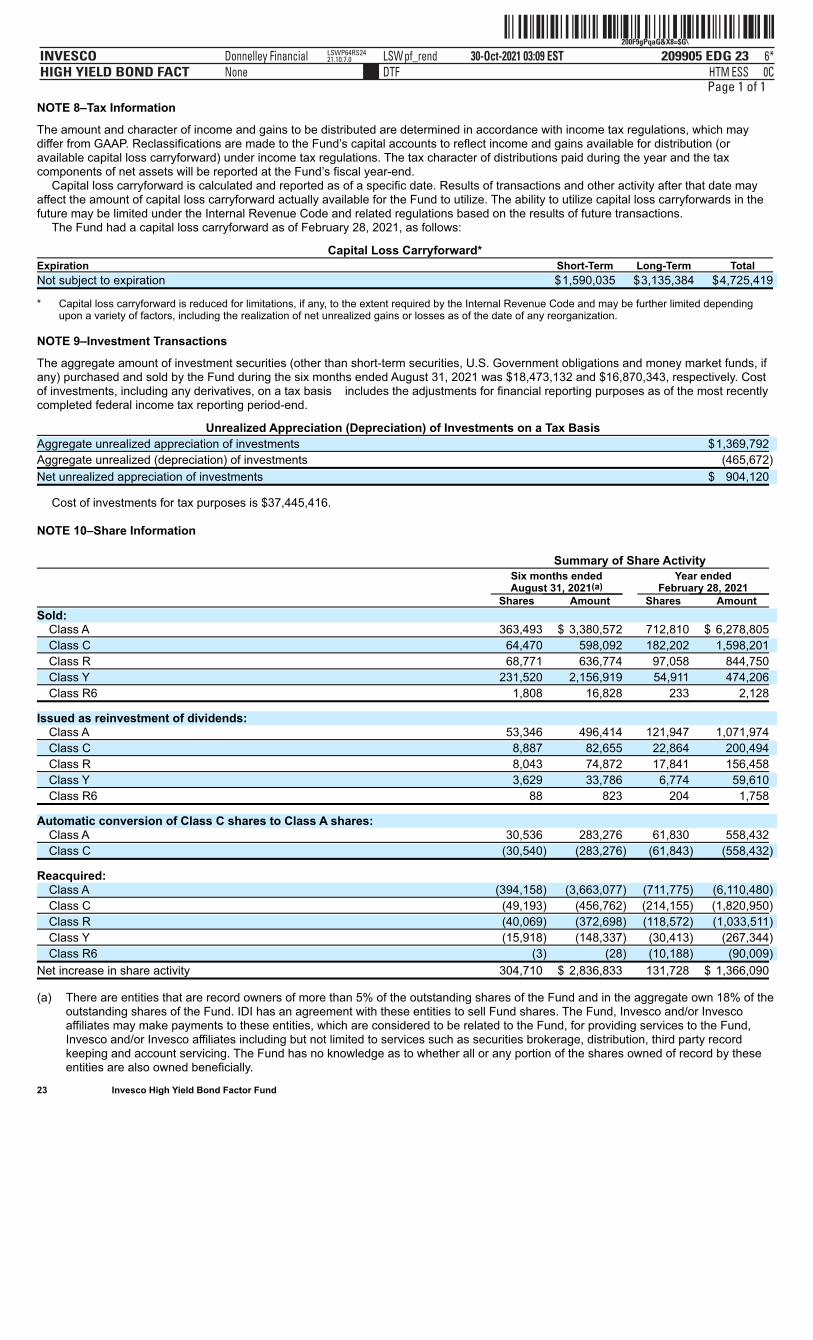
ˆ200F9gPqaG&X8=$G\Š200F9gPqaG&X8=$G\
209905 EDG 23INVESCOHIGH YIELD BOND FACT
30-Oct-2021 03:09 ESTHTMDTF
Donnelley Financial LSWpf_rendNone
6*ESS 0C
LSWP64RS2421.10.7.0
Page 1 of 1NOTE 8–Tax Information
The amount and character of income and gains to be distributed are determined in accordance with income tax regulations, which maydiffer from GAAP. Reclassifications are made to the Fund’s capital accounts to reflect income and gains available for distribution (oravailable capital loss carryforward) under income tax regulations. The tax character of distributions paid during the year and the taxcomponents of net assets will be reported at the Fund’s fiscal year-end.
Capital loss carryforward is calculated and reported as of a specific date. Results of transactions and other activity after that date mayaffect the amount of capital loss carryforward actually available for the Fund to utilize. The ability to utilize capital loss carryforwards in thefuture may be limited under the Internal Revenue Code and related regulations based on the results of future transactions.
The Fund had a capital loss carryforward as of February 28, 2021, as follows:
Capital Loss Carryforward*
Expiration Short-Term Long-Term Total
Not subject to expiration $1,590,035 $3,135,384 $4,725,419
* Capital loss carryforward is reduced for limitations, if any, to the extent required by the Internal Revenue Code and may be further limited dependingupon a variety of factors, including the realization of net unrealized gains or losses as of the date of any reorganization.
NOTE 9–Investment Transactions
The aggregate amount of investment securities (other than short-term securities, U.S. Government obligations and money market funds, ifany) purchased and sold by the Fund during the six months ended August 31, 2021 was $18,473,132 and $16,870,343, respectively. Costof investments, including any derivatives, on a tax basis includes the adjustments for financial reporting purposes as of the most recentlycompleted federal income tax reporting period-end.
Unrealized Appreciation (Depreciation) of Investments on a Tax Basis
Aggregate unrealized appreciation of investments $1,369,792
Aggregate unrealized (depreciation) of investments (465,672)
Net unrealized appreciation of investments $ 904,120
Cost of investments for tax purposes is $37,445,416.
NOTE 10–Share Information Summary of Share Activity
Six months ended Year ended August 31, 2021(a) February 28, 2021 Shares Amount Shares Amount
Sold: Class A 363,493 $ 3,380,572 712,810 $ 6,278,805
Class C 64,470 598,092 182,202 1,598,201
Class R 68,771 636,774 97,058 844,750
Class Y 231,520 2,156,919 54,911 474,206
Class R6 1,808 16,828 233 2,128
Issued as reinvestment of dividends: Class A 53,346 496,414 121,947 1,071,974
Class C 8,887 82,655 22,864 200,494
Class R 8,043 74,872 17,841 156,458
Class Y 3,629 33,786 6,774 59,610
Class R6 88 823 204 1,758
Automatic conversion of Class C shares to Class A shares: Class A 30,536 283,276 61,830 558,432
Class C (30,540) (283,276) (61,843) (558,432)
Reacquired: Class A (394,158) (3,663,077) (711,775) (6,110,480)
Class C (49,193) (456,762) (214,155) (1,820,950)
Class R (40,069) (372,698) (118,572) (1,033,511)
Class Y (15,918) (148,337) (30,413) (267,344)
Class R6 (3) (28) (10,188) (90,009)
Net increase in share activity 304,710 $ 2,836,833 131,728 $ 1,366,090
(a) There are entities that are record owners of more than 5% of the outstanding shares of the Fund and in the aggregate own 18% of theoutstanding shares of the Fund. IDI has an agreement with these entities to sell Fund shares. The Fund, Invesco and/or Invescoaffiliates may make payments to these entities, which are considered to be related to the Fund, for providing services to the Fund,Invesco and/or Invesco affiliates including but not limited to services such as securities brokerage, distribution, third party recordkeeping and account servicing. The Fund has no knowledge as to whether all or any portion of the shares owned of record by theseentities are also owned beneficially.
23 Invesco High Yield Bond Factor Fund
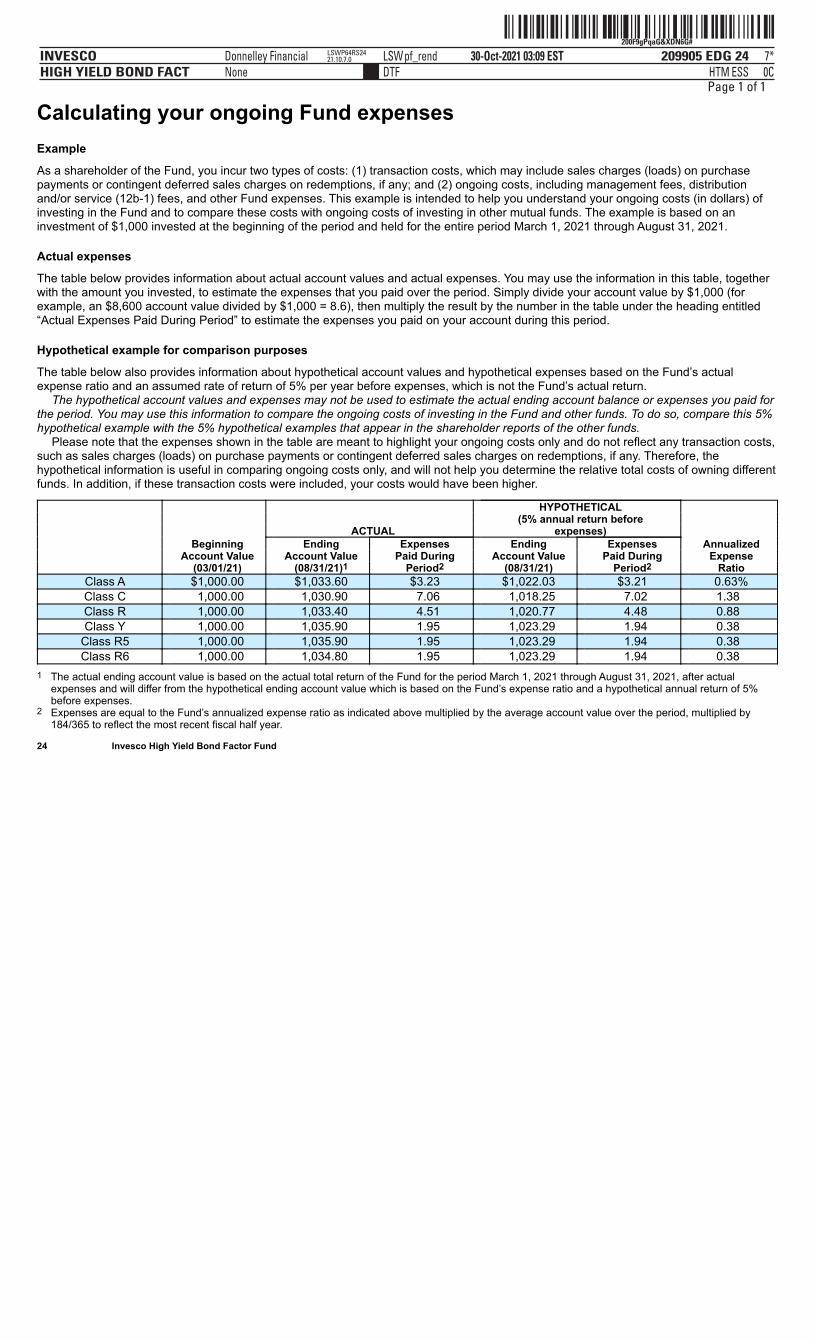
ˆ200F9gPqaG&XDN6G#Š200F9gPqaG&XDN6G#
209905 EDG 24INVESCOHIGH YIELD BOND FACT
30-Oct-2021 03:09 ESTHTMDTF
Donnelley Financial LSWpf_rendNone
7*ESS 0C
LSWP64RS2421.10.7.0
Page 1 of 1
Calculating your ongoing Fund expensesExample
As a shareholder of the Fund, you incur two types of costs: (1) transaction costs, which may include sales charges (loads) on purchasepayments or contingent deferred sales charges on redemptions, if any; and (2) ongoing costs, including management fees, distributionand/or service (12b-1) fees, and other Fund expenses. This example is intended to help you understand your ongoing costs (in dollars) ofinvesting in the Fund and to compare these costs with ongoing costs of investing in other mutual funds. The example is based on aninvestment of $1,000 invested at the beginning of the period and held for the entire period March 1, 2021 through August 31, 2021.
Actual expenses
The table below provides information about actual account values and actual expenses. You may use the information in this table, togetherwith the amount you invested, to estimate the expenses that you paid over the period. Simply divide your account value by $1,000 (forexample, an $8,600 account value divided by $1,000 = 8.6), then multiply the result by the number in the table under the heading entitled“Actual Expenses Paid During Period” to estimate the expenses you paid on your account during this period.
Hypothetical example for comparison purposes
The table below also provides information about hypothetical account values and hypothetical expenses based on the Fund’s actualexpense ratio and an assumed rate of return of 5% per year before expenses, which is not the Fund’s actual return.
The hypothetical account values and expenses may not be used to estimate the actual ending account balance or expenses you paid forthe period. You may use this information to compare the ongoing costs of investing in the Fund and other funds. To do so, compare this 5%hypothetical example with the 5% hypothetical examples that appear in the shareholder reports of the other funds.
Please note that the expenses shown in the table are meant to highlight your ongoing costs only and do not reflect any transaction costs,such as sales charges (loads) on purchase payments or contingent deferred sales charges on redemptions, if any. Therefore, thehypothetical information is useful in comparing ongoing costs only, and will not help you determine the relative total costs of owning differentfunds. In addition, if these transaction costs were included, your costs would have been higher.
HYPOTHETICAL (5% annual return before ACTUAL expenses) Beginning Ending Expenses Ending Expenses Annualized Account Value Account Value Paid During Account Value Paid During Expense (03/01/21) (08/31/21)1 Period2 (08/31/21) Period2 Ratio
Class A $1,000.00 $1,033.60 $3.23 $1,022.03 $3.21 0.63%Class C 1,000.00 1,030.90 7.06 1,018.25 7.02 1.38 Class R 1,000.00 1,033.40 4.51 1,020.77 4.48 0.88 Class Y 1,000.00 1,035.90 1.95 1,023.29 1.94 0.38
Class R5 1,000.00 1,035.90 1.95 1,023.29 1.94 0.38 Class R6 1,000.00 1,034.80 1.95 1,023.29 1.94 0.38
1 The actual ending account value is based on the actual total return of the Fund for the period March 1, 2021 through August 31, 2021, after actualexpenses and will differ from the hypothetical ending account value which is based on the Fund’s expense ratio and a hypothetical annual return of 5%before expenses.
2 Expenses are equal to the Fund’s annualized expense ratio as indicated above multiplied by the average account value over the period, multiplied by184/365 to reflect the most recent fiscal half year.
24 Invesco High Yield Bond Factor Fund
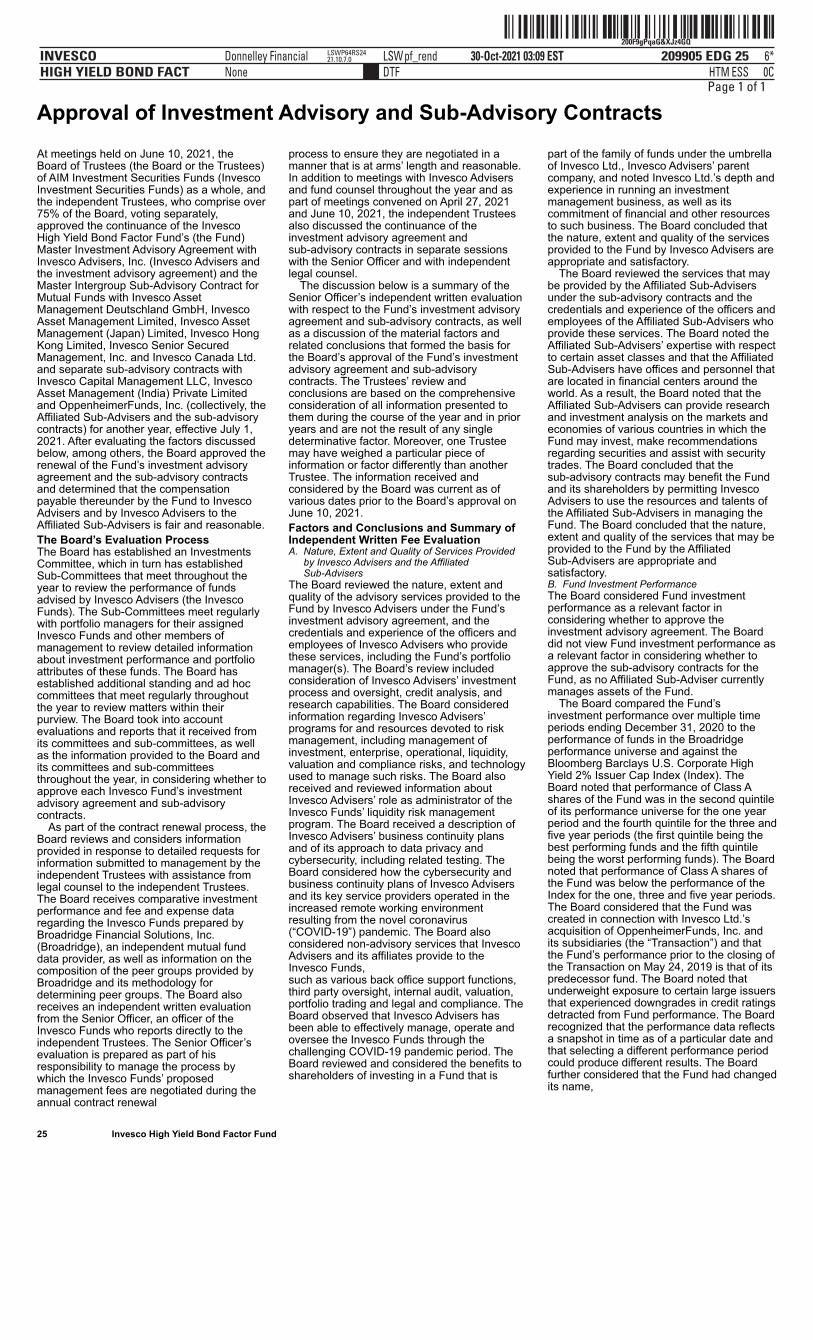
ˆ200F9gPqaG&XJz4GQŠ200F9gPqaG&XJz4GQ
209905 EDG 25INVESCOHIGH YIELD BOND FACT
30-Oct-2021 03:09 ESTHTMDTF
Donnelley Financial LSWpf_rendNone
6*ESS 0C
LSWP64RS2421.10.7.0
Page 1 of 1
Approval of Investment Advisory and Sub-Advisory Contracts
25 Invesco High Yield Bond Factor Fund
At meetings held on June 10, 2021, theBoard of Trustees (the Board or the Trustees)of AIM Investment Securities Funds (InvescoInvestment Securities Funds) as a whole, andthe independent Trustees, who comprise over75% of the Board, voting separately,approved the continuance of the InvescoHigh Yield Bond Factor Fund’s (the Fund)Master Investment Advisory Agreement withInvesco Advisers, Inc. (Invesco Advisers andthe investment advisory agreement) and theMaster Intergroup Sub-Advisory Contract forMutual Funds with Invesco AssetManagement Deutschland GmbH, InvescoAsset Management Limited, Invesco AssetManagement (Japan) Limited, Invesco HongKong Limited, Invesco Senior SecuredManagement, Inc. and Invesco Canada Ltd.and separate sub-advisory contracts withInvesco Capital Management LLC, InvescoAsset Management (India) Private Limitedand OppenheimerFunds, Inc. (collectively, theAffiliated Sub-Advisers and the sub-advisorycontracts) for another year, effective July 1,2021. After evaluating the factors discussedbelow, among others, the Board approved therenewal of the Fund’s investment advisoryagreement and the sub-advisory contractsand determined that the compensationpayable thereunder by the Fund to InvescoAdvisers and by Invesco Advisers to theAffiliated Sub-Advisers is fair and reasonable.The Board’s Evaluation ProcessThe Board has established an InvestmentsCommittee, which in turn has establishedSub-Committees that meet throughout theyear to review the performance of fundsadvised by Invesco Advisers (the InvescoFunds). The Sub-Committees meet regularlywith portfolio managers for their assignedInvesco Funds and other members ofmanagement to review detailed informationabout investment performance and portfolioattributes of these funds. The Board hasestablished additional standing and ad hoccommittees that meet regularly throughoutthe year to review matters within theirpurview. The Board took into accountevaluations and reports that it received fromits committees and sub-committees, as wellas the information provided to the Board andits committees and sub-committeesthroughout the year, in considering whether toapprove each Invesco Fund’s investmentadvisory agreement and sub-advisorycontracts.
As part of the contract renewal process, theBoard reviews and considers informationprovided in response to detailed requests forinformation submitted to management by theindependent Trustees with assistance fromlegal counsel to the independent Trustees.The Board receives comparative investmentperformance and fee and expense dataregarding the Invesco Funds prepared byBroadridge Financial Solutions, Inc.(Broadridge), an independent mutual funddata provider, as well as information on thecomposition of the peer groups provided byBroadridge and its methodology fordetermining peer groups. The Board alsoreceives an independent written evaluationfrom the Senior Officer, an officer of theInvesco Funds who reports directly to theindependent Trustees. The Senior Officer’sevaluation is prepared as part of hisresponsibility to manage the process bywhich the Invesco Funds’ proposedmanagement fees are negotiated during theannual contract renewal
process to ensure they are negotiated in amanner that is at arms’ length and reasonable.In addition to meetings with Invesco Advisersand fund counsel throughout the year and aspart of meetings convened on April 27, 2021and June 10, 2021, the independent Trusteesalso discussed the continuance of theinvestment advisory agreement andsub-advisory contracts in separate sessionswith the Senior Officer and with independentlegal counsel.
The discussion below is a summary of theSenior Officer’s independent written evaluationwith respect to the Fund’s investment advisoryagreement and sub-advisory contracts, as wellas a discussion of the material factors andrelated conclusions that formed the basis forthe Board’s approval of the Fund’s investmentadvisory agreement and sub-advisorycontracts. The Trustees’ review andconclusions are based on the comprehensiveconsideration of all information presented tothem during the course of the year and in prioryears and are not the result of any singledeterminative factor. Moreover, one Trusteemay have weighed a particular piece ofinformation or factor differently than anotherTrustee. The information received andconsidered by the Board was current as ofvarious dates prior to the Board’s approval onJune 10, 2021.Factors and Conclusions and Summary ofIndependent Written Fee EvaluationA. Nature, Extent and Quality of Services Provided
by Invesco Advisers and the AffiliatedSub-Advisers
The Board reviewed the nature, extent andquality of the advisory services provided to theFund by Invesco Advisers under the Fund’sinvestment advisory agreement, and thecredentials and experience of the officers andemployees of Invesco Advisers who providethese services, including the Fund’s portfoliomanager(s). The Board’s review includedconsideration of Invesco Advisers’ investmentprocess and oversight, credit analysis, andresearch capabilities. The Board consideredinformation regarding Invesco Advisers’programs for and resources devoted to riskmanagement, including management ofinvestment, enterprise, operational, liquidity,valuation and compliance risks, and technologyused to manage such risks. The Board alsoreceived and reviewed information aboutInvesco Advisers’ role as administrator of theInvesco Funds’ liquidity risk managementprogram. The Board received a description ofInvesco Advisers’ business continuity plansand of its approach to data privacy andcybersecurity, including related testing. TheBoard considered how the cybersecurity andbusiness continuity plans of Invesco Advisersand its key service providers operated in theincreased remote working environmentresulting from the novel coronavirus(“COVID-19”) pandemic. The Board alsoconsidered non-advisory services that InvescoAdvisers and its affiliates provide to theInvesco Funds,such as various back office support functions,third party oversight, internal audit, valuation,portfolio trading and legal and compliance. TheBoard observed that Invesco Advisers hasbeen able to effectively manage, operate andoversee the Invesco Funds through thechallenging COVID-19 pandemic period. TheBoard reviewed and considered the benefits toshareholders of investing in a Fund that is
part of the family of funds under the umbrellaof Invesco Ltd., Invesco Advisers’ parentcompany, and noted Invesco Ltd.’s depth andexperience in running an investmentmanagement business, as well as itscommitment of financial and other resourcesto such business. The Board concluded thatthe nature, extent and quality of the servicesprovided to the Fund by Invesco Advisers areappropriate and satisfactory.
The Board reviewed the services that maybe provided by the Affiliated Sub-Advisersunder the sub-advisory contracts and thecredentials and experience of the officers andemployees of the Affiliated Sub-Advisers whoprovide these services. The Board noted theAffiliated Sub-Advisers’ expertise with respectto certain asset classes and that the AffiliatedSub-Advisers have offices and personnel thatare located in financial centers around theworld. As a result, the Board noted that theAffiliated Sub-Advisers can provide researchand investment analysis on the markets andeconomies of various countries in which theFund may invest, make recommendationsregarding securities and assist with securitytrades. The Board concluded that thesub-advisory contracts may benefit the Fundand its shareholders by permitting InvescoAdvisers to use the resources and talents ofthe Affiliated Sub-Advisers in managing theFund. The Board concluded that the nature,extent and quality of the services that may beprovided to the Fund by the AffiliatedSub-Advisers are appropriate andsatisfactory.B. Fund Investment PerformanceThe Board considered Fund investmentperformance as a relevant factor inconsidering whether to approve theinvestment advisory agreement. The Boarddid not view Fund investment performance asa relevant factor in considering whether toapprove the sub-advisory contracts for theFund, as no Affiliated Sub-Adviser currentlymanages assets of the Fund.
The Board compared the Fund’sinvestment performance over multiple timeperiods ending December 31, 2020 to theperformance of funds in the Broadridgeperformance universe and against theBloomberg Barclays U.S. Corporate HighYield 2% Issuer Cap Index (Index). TheBoard noted that performance of Class Ashares of the Fund was in the second quintileof its performance universe for the one yearperiod and the fourth quintile for the three andfive year periods (the first quintile being thebest performing funds and the fifth quintilebeing the worst performing funds). The Boardnoted that performance of Class A shares ofthe Fund was below the performance of theIndex for the one, three and five year periods.The Board considered that the Fund wascreated in connection with Invesco Ltd.’sacquisition of OppenheimerFunds, Inc. andits subsidiaries (the “Transaction”) and thatthe Fund’s performance prior to the closing ofthe Transaction on May 24, 2019 is that of itspredecessor fund. The Board noted thatunderweight exposure to certain large issuersthat experienced downgrades in credit ratingsdetracted from Fund performance. The Boardrecognized that the performance data reflectsa snapshot in time as of a particular date andthat selecting a different performance periodcould produce different results. The Boardfurther considered that the Fund had changedits name,
ˆ200F9gPqaG&XMCdGFŠ200F9gPqaG&XMCdGF
209905 EDG 26INVESCOHIGH YIELD BOND FACT
30-Oct-2021 03:09 ESTHTMDTF
Donnelley Financial LSWpf_rendNone
5*ESS 0C
LSWP64RS2421.10.7.0
Page 1 of 1
26 Invesco High Yield Bond Factor Fund
investment strategy and index against whichfuture performance will be compared onFebruary 28, 2020 in connection with itsrepositioning as a factor-based fund, and thatperformance results prior to such datereflected that of the Fund’s former strategy.As a result, the Board did not considerperformance of the Fund prior to such date tobe particularly relevant. The Boardconsidered information provided regardingthe more recent performance of the Fundutilizing the new strategy as well as othermetrics, which did not change its conclusions.C. Advisory and Sub-Advisory Fees and Fund
ExpensesThe Board compared the Fund’s contractualmanagement fee rate to the contractualmanagement fee rates of funds in the Fund’sBroadridge expense group. The Board notedthat the contractual management fee rate forClass A shares of the Fund was below themedian contractual management fee rate offunds in its expense group. The Board notedthat the Fund’s contractual management feeschedule was reduced at certain breakpointlevels effective in 2020 in connection with itsrepositioning as a factor-based fund. TheBoard noted that the term “contractualmanagement fee” for funds in the expensegroup may include both advisory and certainnon-portfolio management administrativeservices fees, but that Broadridge is not ableto provide information on a fund by fund basisas to what is included. The Board alsoreviewed the methodology used byBroadridge in calculating expense groupinformation, which includes using each fund’scontractual management fee schedule(including any applicable breakpoints) asreported in the most recent prospectus orstatement of additional information for eachfund in the expense group. The Board alsoconsidered comparative informationregarding the Fund’s total expense ratio andits various components.
The Board noted that Invesco Advisers hascontractually agreed to waive fees and/or limitexpenses of the Fund for the term disclosedin the Fund’s registration statement in anamount necessary to limit total annualoperating expenses to a specified percentageof average daily net assets for each class ofthe Fund.
The Board noted that Invesco Advisers andthe Affiliated Sub-Advisers do not manageother similarly managed mutual funds orclient accounts.
The Board also considered the servicesthat may be provided by the AffiliatedSub-Advisers pursuant to the sub-advisorycontracts, as well as the fees payable byInvesco Advisers to the AffiliatedSub-Advisers pursuant to the sub-advisorycontracts.D. Economies of Scale and BreakpointsThe Board considered the extent to whichthere may be economies of scale in theprovision of advisory services to the Fundand the Invesco Funds, and the extent towhich such economies of scale are sharedwith the Fund and the Invesco Funds. TheBoard considered that the Fund may benefitfrom economies of scale through contractualbreakpoints in the Fund’s advisory feeschedule, which generally operate to reducethe Fund’s expense ratio as it grows in size.The Board noted that the Fund also shares ineconomies of scale through Invesco Advisers’ability to negotiate lower fee arrangementswith third party service providers. The Boardnoted that the Fund may also benefit fromeconomies of scale through initial fee setting,fee waivers and expense reimbursements, aswell as Invesco Advisers’ investment in itsbusiness, including investments in
business infrastructure, technology andcybersecurity.E. Profitability and Financial ResourcesThe Board reviewed information from InvescoAdvisers concerning the costs of the advisoryand other services that Invesco Advisers andits affiliates provide to the Fund and theInvesco Funds and the profitability of InvescoAdvisers and its affiliates in providing theseservices in the aggregate and on an individualFund-by-Fund basis. The Board considered themethodology used for calculating profitabilityand noted that such methodology had recentlybeen reviewed and enhanced. The Boardnoted that Invesco Advisers continues tooperate at a net profit from services InvescoAdvisers and its affiliates provide to theInvesco Funds in the aggregate and to mostFunds individually. The Board did not deem thelevel of profits realized by Invesco Advisersand its affiliates from providing such services tobe excessive, given the nature, extent andquality of the services provided. The Boardnoted that Invesco Advisers providedinformation demonstrating that InvescoAdvisers is financially sound and has theresources necessary to perform its obligationsunder the investment advisory agreement, andprovided representations indicating that theAffiliated Sub-Advisers are financially soundand have the resources necessary to performtheir obligations under the sub-advisorycontracts.F. Collateral Benefits to Invesco Advisers and its
AffiliatesThe Board considered various other benefitsreceived by Invesco Advisers and its affiliatesfrom the relationship with the Fund, includingthe fees received for providing administrative,transfer agency and distribution services to theFund. The Board received comparativeinformation regarding fees charged for theseservices, including information provided byBroadridge and other independent sources.The Board reviewed the performance ofInvesco Advisers and its affiliates in providingthese services and the organizational structureemployed to provide these services. The Boardnoted that these services are provided to theFund pursuant to written contracts that arereviewed and subject to approval on an annualbasis by the Board based on its determinationthat the services are required for the operationof the Fund.
The Board considered the benefits realizedby Invesco Advisers and the AffiliatedSub-Advisers as a result of portfolio brokeragetransactions executed through “soft dollar”arrangements. Invesco Advisers noted that theFund does not execute brokerage transactionsthrough “soft dollar” arrangements to anysignificant degree.
The Board considered that the Fund’suninvested cash and cash collateral from anysecurities lending arrangements may beinvested in registered money market funds or,with regard to securities lending cashcollateral, unregistered funds that comply withRule 2a-7 (collectively referred to as “affiliatedmoney market funds”) advised by InvescoAdvisers. The Board considered informationregarding the returns of the affiliated moneymarket funds relative to comparable overnightinvestments, as well as the fees paid by theaffiliated money market funds to InvescoAdvisers and its affiliates. In this regard, theBoard noted that Invesco Advisers receivesadvisory fees from these affiliated moneymarket funds attributable to the Fund’sinvestments. The Board also noted thatInvesco Advisers has contractually agreed towaive through varying periods an amount
equal to 100% of the net advisory fee InvescoAdvisers receives from the affiliated moneymarket funds with respect to the Fund’sinvestment in the affiliated money marketfunds of uninvested cash, but not cashcollateral. The Board concluded that theadvisory fees payable to Invesco Advisersfrom the Fund’s investment of cash collateralfrom any securities lending arrangements inthe affiliated money market funds are forservices that are not duplicative of servicesprovided by Invesco Advisers to the Fund.
The Board also received information aboutcommissions that an affiliated broker mayreceive for executing certain trades for theFund. Invesco Advisers and the AffiliatedSub-Advisers advised the Board of thebenefits to the Fund of executing tradesthrough the affiliated broker and that suchtrades were executed in compliance withrules under the federal securities laws andconsistent with best execution obligations.

ˆ200F9gPqaG&XQhKoQŠ200F9gPqaG&XQhKoQ
209905 EDG 27INVESCOHIGH YIELD BOND FACT
30-Oct-2021 03:09 ESTHTMDTF
Donnelley Financial LSWpf_rendNone
3*ESS 0C
LSWP64RS2421.10.7.0
Page 1 of 1
(This page intentionally left blank)
ˆ200F9gPqaG&XWDHo}Š200F9gPqaG&XWDHo}
209905 EDG 28INVESCOHIGH YIELD BOND FACT
30-Oct-2021 03:09 ESTHTMDTF
Donnelley Financial LSWpf_rendNone
4*ESS 0C
LSWP64RS2421.10.7.0
dsp001adsp028a
Page 1 of 1
Go paperless with eDeliveryVisit invesco.com/edelivery to enjoy the convenience and security of anytime electronic access to your investmentdocuments.With eDelivery, you can elect to have any or all of the following materials delivered straight to your inbox to download, saveand print from your own computer:
∎ Fund reports and prospectuses∎ Quarterly statements∎ Daily confirmations∎ Tax forms Invesco mailing informationSend general correspondence to Invesco Investment Services, Inc., P.O. Box 219078, Kansas City, MO 64121-9078. Important notice regarding delivery of security holder documentsTo reduce Fund expenses, only one copy of most shareholder documents may be mailed to shareholders with multipleaccounts at the same address (Householding). Mailing of your shareholder documents may be householded indefinitelyunless you instruct us otherwise. If you do not want the mailing of these documents to be combined with those for othermembers of your household, please contact Invesco Investment Services, Inc. at 800 959 4246 or contact your financialinstitution. We will begin sending you individual copies for each account within 30 days after receiving your request. Fund holdings and proxy voting informationThe Fund provides a complete list of its portfolio holdings four times each fiscal year, at the end of each fiscal quarter. For thesecond and fourth quarters, the list appears, respectively, in the Fund’s semiannual and annual reports to shareholders. Forthe first and third quarters, the Fund files the list with the Securities and Exchange Commission (SEC) as an exhibit to itsreports on Form N-PORT. The most recent list of portfolio holdings is available at invesco.com/completeqtrholdings.Shareholders can also look up the Fund’s Form N-PORT filings on the SEC website, sec.gov. The SEC file numbers for theFund are shown below.
A description of the policies and procedures that the Fund uses to determine how to vote proxies relating to portfoliosecurities is available without charge, upon request, from our Client Services department at 800 959 4246, or at invesco.com/corporate/about-us/esg. The information is also available on the SEC website, sec.gov.
Information regarding how the Fund voted proxies related to its portfolio securities during the most recent 12-month periodended June 30 is available at invesco.com/proxysearch. This information is also available on the SEC website, sec.gov.
Invesco Advisers, Inc. is an investment adviser; it provides investment advisory services to individual and institutionalclients and does not sell securities. Invesco Distributors, Inc. is the US distributor for Invesco Ltd.’s retail mutual funds,exchange-traded funds and institutional money market funds. Both are wholly owned, indirect subsidiaries of Invesco Ltd.
SEC file number(s): 811-05686 and 033-39519 Invesco Distributors, Inc. O-GLHY-SAR-1
ˆ200F1$as8GpJa#&oMŠ200F1$as8GpJa#&oM
153547 EDG 1INVESCOINCOME
30-Oct-2021 14:35 ESTHTMDTF
Donnelley Financial LSWpf_rendNone
7*ESS 0C
LSWP64RS2321.10.7.0
dsp001a
Page 1 of 1
Semiannual Report to Shareholders August 31, 2021
Invesco Income Fund
Nasdaq:A: AGOVX ∎ C: AGVCX ∎ R: AGVRX ∎ Y: AGVYX ∎ Investor: AGIVX ∎ R5: AGOIX ∎ R6: AGVSX
2 Fund Performance4 Liquidity Risk Management Program5 Schedule of Investments11 Financial Statements14 Financial Highlights15 Notes to Financial Statements24 Fund Expenses25 Approval of Investment Advisory and Sub-Advisory Contracts
For the most current month-end Fund performance and commentary, please visit invesco.com/performance.Unless otherwise noted, all data provided by Invesco.This report must be accompanied or preceded by a currently effective Fund prospectus, which contains more complete information, includingsales charges and expenses. Investors should read it carefully before investing. NOT FDIC INSURED | MAY LOSE VALUE | NO BANK GUARANTEE
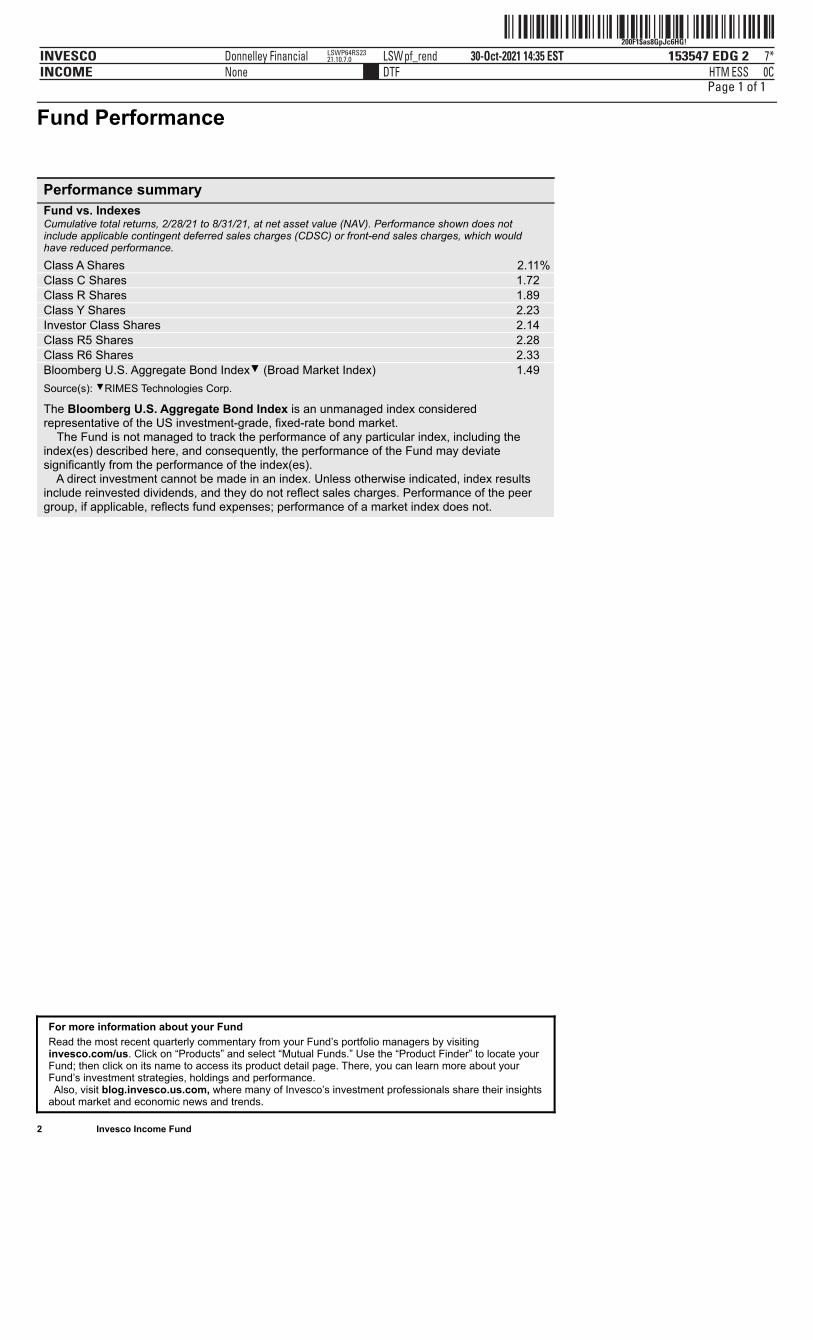
ˆ200F1$as8GpJc6HG!Š200F1$as8GpJc6HG!
153547 EDG 2INVESCOINCOME
30-Oct-2021 14:35 ESTHTMDTF
Donnelley Financial LSWpf_rendNone
7*ESS 0C
LSWP64RS2321.10.7.0
Page 1 of 1 Fund Performance
Performance summary Fund vs. Indexes Cumulative total returns, 2/28/21 to 8/31/21, at net asset value (NAV). Performance shown does notinclude applicable contingent deferred sales charges (CDSC) or front-end sales charges, which wouldhave reduced performance.
Class A Shares 2.11% Class C Shares 1.72 Class R Shares 1.89 Class Y Shares 2.23 Investor Class Shares 2.14 Class R5 Shares 2.28 Class R6 Shares 2.33 Bloomberg U.S. Aggregate Bond Index▼ (Broad Market Index) 1.49 Source(s): ▼RIMES Technologies Corp.
The Bloomberg U.S. Aggregate Bond Index is an unmanaged index consideredrepresentative of the US investment-grade, fixed-rate bond market. The Fund is not managed to track the performance of any particular index, including theindex(es) described here, and consequently, the performance of the Fund may deviatesignificantly from the performance of the index(es).
A direct investment cannot be made in an index. Unless otherwise indicated, index resultsinclude reinvested dividends, and they do not reflect sales charges. Performance of the peergroup, if applicable, reflects fund expenses; performance of a market index does not.
For more information about your Fund
Read the most recent quarterly commentary from your Fund’s portfolio managers by visitinginvesco.com/us. Click on “Products” and select “Mutual Funds.” Use the “Product Finder” to locate yourFund; then click on its name to access its product detail page. There, you can learn more about yourFund’s investment strategies, holdings and performance. Also, visit blog.invesco.us.com, where many of Invesco’s investment professionals share their insightsabout market and economic news and trends.
2 Invesco Income Fund
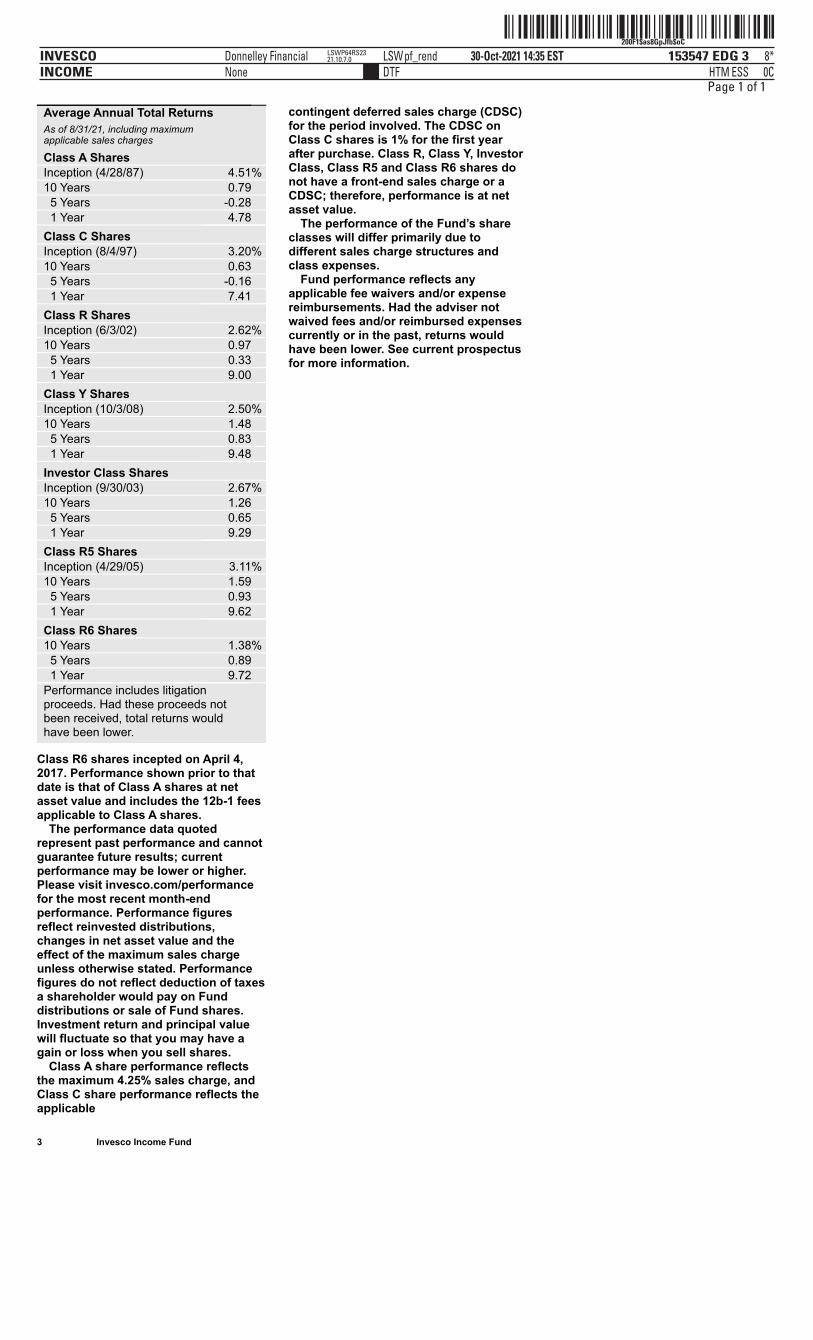
ˆ200F1$as8GpJfb$oCŠ200F1$as8GpJfb$oC
153547 EDG 3INVESCOINCOME
30-Oct-2021 14:35 ESTHTMDTF
Donnelley Financial LSWpf_rendNone
8*ESS 0C
LSWP64RS2321.10.7.0
Page 1 of 1
3 Invesco Income Fund
Average Annual Total Returns
As of 8/31/21, including maximumapplicable sales charges
Class A Shares Inception (4/28/87) 4.51% 10 Years 0.79 5 Years -0.28 1 Year 4.78 Class C Shares Inception (8/4/97) 3.20% 10 Years 0.63 5 Years -0.16 1 Year 7.41 Class R Shares Inception (6/3/02) 2.62% 10 Years 0.97 5 Years 0.33 1 Year 9.00 Class Y Shares Inception (10/3/08) 2.50% 10 Years 1.48 5 Years 0.83 1 Year 9.48 Investor Class Shares Inception (9/30/03) 2.67% 10 Years 1.26 5 Years 0.65 1 Year 9.29 Class R5 Shares Inception (4/29/05) 3.11% 10 Years 1.59 5 Years 0.93 1 Year 9.62 Class R6 Shares 10 Years 1.38% 5 Years 0.89 1 Year 9.72 Performance includes litigationproceeds. Had these proceeds notbeen received, total returns wouldhave been lower.
Class R6 shares incepted on April 4,2017. Performance shown prior to thatdate is that of Class A shares at netasset value and includes the 12b-1 feesapplicable to Class A shares.
The performance data quotedrepresent past performance and cannotguarantee future results; currentperformance may be lower or higher.Please visit invesco.com/performancefor the most recent month-endperformance. Performance figuresreflect reinvested distributions,changes in net asset value and theeffect of the maximum sales chargeunless otherwise stated. Performancefigures do not reflect deduction of taxesa shareholder would pay on Funddistributions or sale of Fund shares.Investment return and principal valuewill fluctuate so that you may have again or loss when you sell shares.
Class A share performance reflectsthe maximum 4.25% sales charge, andClass C share performance reflects theapplicable
contingent deferred sales charge (CDSC)for the period involved. The CDSC onClass C shares is 1% for the first yearafter purchase. Class R, Class Y, InvestorClass, Class R5 and Class R6 shares donot have a front-end sales charge or aCDSC; therefore, performance is at netasset value.
The performance of the Fund’s shareclasses will differ primarily due todifferent sales charge structures andclass expenses.
Fund performance reflects anyapplicable fee waivers and/or expensereimbursements. Had the adviser notwaived fees and/or reimbursed expensescurrently or in the past, returns wouldhave been lower. See current prospectusfor more information.
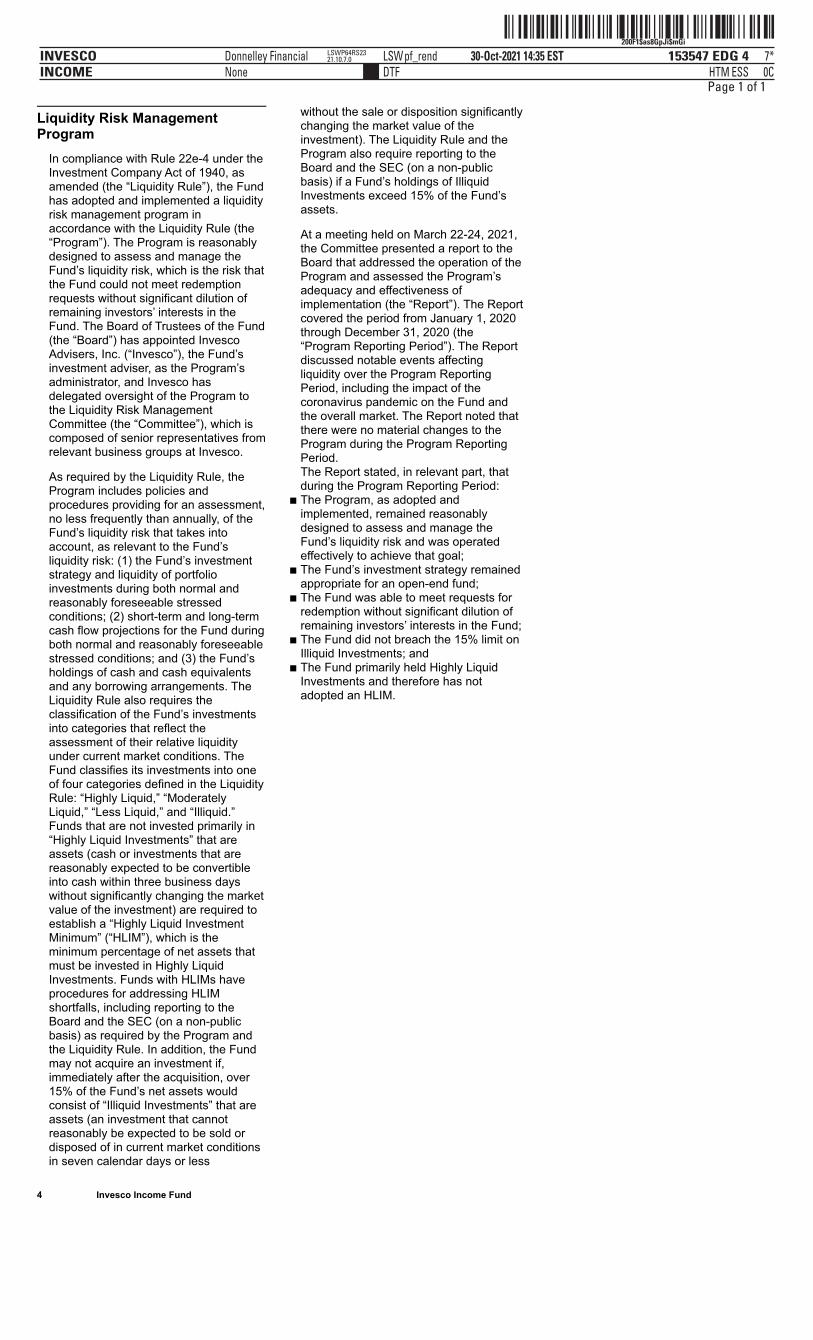
ˆ200F1$as8GpJi$mGiŠ200F1$as8GpJi$mGi
153547 EDG 4INVESCOINCOME
30-Oct-2021 14:35 ESTHTMDTF
Donnelley Financial LSWpf_rendNone
7*ESS 0C
LSWP64RS2321.10.7.0
Page 1 of 1
4 Invesco Income Fund
Liquidity Risk ManagementProgram
In compliance with Rule 22e-4 under theInvestment Company Act of 1940, asamended (the “Liquidity Rule”), the Fundhas adopted and implemented a liquidityrisk management program inaccordance with the Liquidity Rule (the“Program”). The Program is reasonablydesigned to assess and manage theFund’s liquidity risk, which is the risk thatthe Fund could not meet redemptionrequests without significant dilution ofremaining investors’ interests in theFund. The Board of Trustees of the Fund(the “Board”) has appointed InvescoAdvisers, Inc. (“Invesco”), the Fund’sinvestment adviser, as the Program’sadministrator, and Invesco hasdelegated oversight of the Program tothe Liquidity Risk ManagementCommittee (the “Committee”), which iscomposed of senior representatives fromrelevant business groups at Invesco.
As required by the Liquidity Rule, theProgram includes policies andprocedures providing for an assessment,no less frequently than annually, of theFund’s liquidity risk that takes intoaccount, as relevant to the Fund’sliquidity risk: (1) the Fund’s investmentstrategy and liquidity of portfolioinvestments during both normal andreasonably foreseeable stressedconditions; (2) short-term and long-termcash flow projections for the Fund duringboth normal and reasonably foreseeablestressed conditions; and (3) the Fund’sholdings of cash and cash equivalentsand any borrowing arrangements. TheLiquidity Rule also requires theclassification of the Fund’s investmentsinto categories that reflect theassessment of their relative liquidityunder current market conditions. TheFund classifies its investments into oneof four categories defined in the LiquidityRule: “Highly Liquid,” “ModeratelyLiquid,” “Less Liquid,” and “Illiquid.”Funds that are not invested primarily in“Highly Liquid Investments” that areassets (cash or investments that arereasonably expected to be convertibleinto cash within three business dayswithout significantly changing the marketvalue of the investment) are required toestablish a “Highly Liquid InvestmentMinimum” (“HLIM”), which is theminimum percentage of net assets thatmust be invested in Highly LiquidInvestments. Funds with HLIMs haveprocedures for addressing HLIMshortfalls, including reporting to theBoard and the SEC (on a non-publicbasis) as required by the Program andthe Liquidity Rule. In addition, the Fundmay not acquire an investment if,immediately after the acquisition, over15% of the Fund’s net assets wouldconsist of “Illiquid Investments” that areassets (an investment that cannotreasonably be expected to be sold ordisposed of in current market conditionsin seven calendar days or less
without the sale or disposition significantlychanging the market value of theinvestment). The Liquidity Rule and theProgram also require reporting to theBoard and the SEC (on a non-publicbasis) if a Fund’s holdings of IlliquidInvestments exceed 15% of the Fund’sassets.
At a meeting held on March 22-24, 2021,the Committee presented a report to theBoard that addressed the operation of theProgram and assessed the Program’sadequacy and effectiveness ofimplementation (the “Report”). The Reportcovered the period from January 1, 2020through December 31, 2020 (the“Program Reporting Period”). The Reportdiscussed notable events affectingliquidity over the Program ReportingPeriod, including the impact of thecoronavirus pandemic on the Fund andthe overall market. The Report noted thatthere were no material changes to theProgram during the Program ReportingPeriod.The Report stated, in relevant part, thatduring the Program Reporting Period:
∎ The Program, as adopted andimplemented, remained reasonablydesigned to assess and manage theFund’s liquidity risk and was operatedeffectively to achieve that goal;
∎ The Fund’s investment strategy remainedappropriate for an open-end fund;
∎ The Fund was able to meet requests forredemption without significant dilution ofremaining investors’ interests in the Fund;
∎ The Fund did not breach the 15% limit onIlliquid Investments; and
∎ The Fund primarily held Highly LiquidInvestments and therefore has notadopted an HLIM.
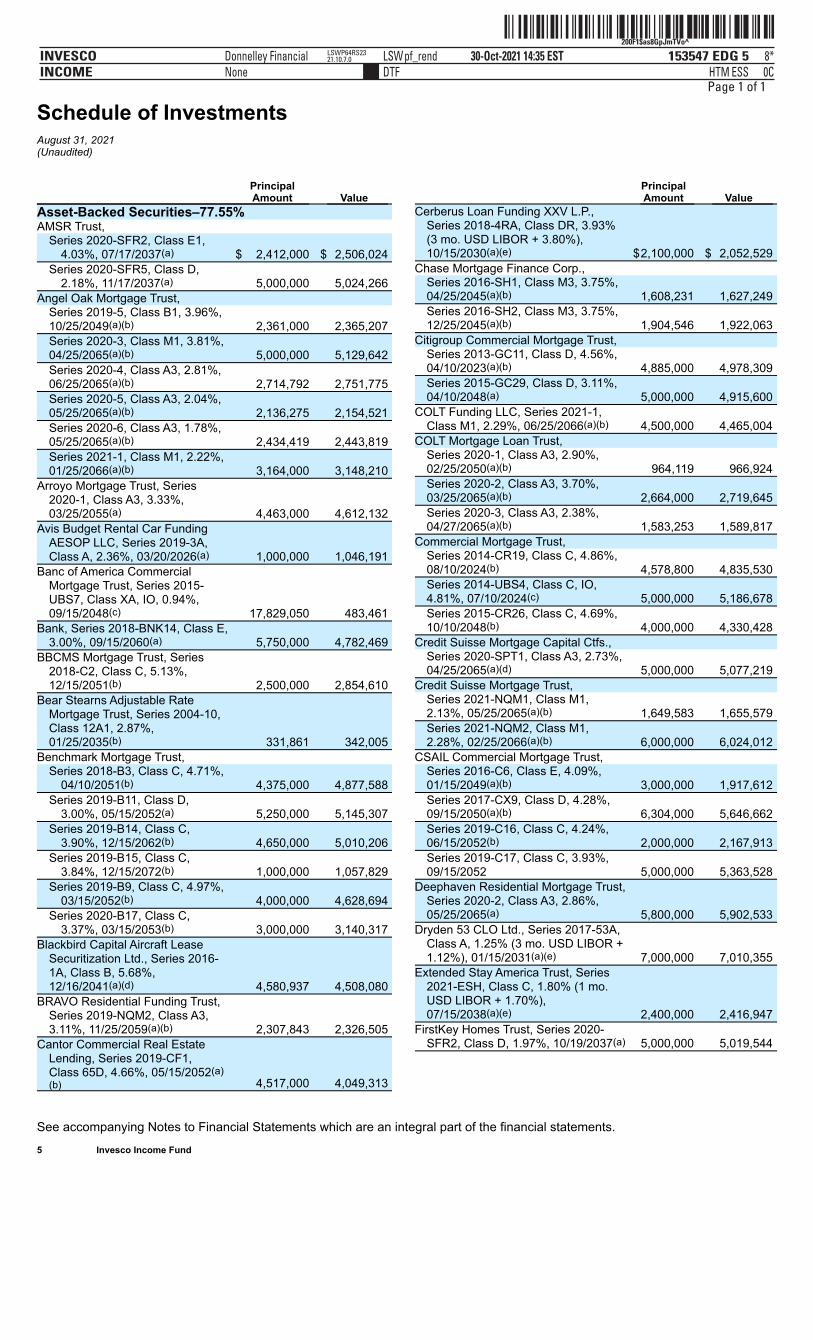
ˆ200F1$as8GpJmTVo^Š200F1$as8GpJmTVo^
153547 EDG 5INVESCOINCOME
30-Oct-2021 14:35 ESTHTMDTF
Donnelley Financial LSWpf_rendNone
8*ESS 0C
LSWP64RS2321.10.7.0
Page 1 of 1
Schedule of InvestmentsAugust 31, 2021(Unaudited)
See accompanying Notes to Financial Statements which are an integral part of the financial statements. 5 Invesco Income Fund
Principal Amount Value Asset-Backed Securities–77.55% AMSR Trust,
Series 2020-SFR2, Class E1,4.03%, 07/17/2037(a) $ 2,412,000 $ 2,506,024
Series 2020-SFR5, Class D,2.18%, 11/17/2037(a) 5,000,000 5,024,266
Angel Oak Mortgage Trust, Series 2019-5, Class B1, 3.96%,10/25/2049(a)(b) 2,361,000 2,365,207 Series 2020-3, Class M1, 3.81%,04/25/2065(a)(b) 5,000,000 5,129,642 Series 2020-4, Class A3, 2.81%,06/25/2065(a)(b) 2,714,792 2,751,775 Series 2020-5, Class A3, 2.04%,05/25/2065(a)(b) 2,136,275 2,154,521 Series 2020-6, Class A3, 1.78%,05/25/2065(a)(b) 2,434,419 2,443,819 Series 2021-1, Class M1, 2.22%,01/25/2066(a)(b) 3,164,000 3,148,210
Arroyo Mortgage Trust, Series2020-1, Class A3, 3.33%,03/25/2055(a) 4,463,000 4,612,132
Avis Budget Rental Car FundingAESOP LLC, Series 2019-3A,Class A, 2.36%, 03/20/2026(a) 1,000,000 1,046,191
Banc of America CommercialMortgage Trust, Series 2015-UBS7, Class XA, IO, 0.94%,09/15/2048(c) 17,829,050 483,461
Bank, Series 2018-BNK14, Class E,3.00%, 09/15/2060(a) 5,750,000 4,782,469
BBCMS Mortgage Trust, Series2018-C2, Class C, 5.13%,12/15/2051(b) 2,500,000 2,854,610
Bear Stearns Adjustable RateMortgage Trust, Series 2004-10,Class 12A1, 2.87%,01/25/2035(b) 331,861 342,005
Benchmark Mortgage Trust, Series 2018-B3, Class C, 4.71%,
04/10/2051(b) 4,375,000 4,877,588 Series 2019-B11, Class D,
3.00%, 05/15/2052(a) 5,250,000 5,145,307 Series 2019-B14, Class C,
3.90%, 12/15/2062(b) 4,650,000 5,010,206 Series 2019-B15, Class C,
3.84%, 12/15/2072(b) 1,000,000 1,057,829 Series 2019-B9, Class C, 4.97%,
03/15/2052(b) 4,000,000 4,628,694 Series 2020-B17, Class C,
3.37%, 03/15/2053(b) 3,000,000 3,140,317 Blackbird Capital Aircraft Lease
Securitization Ltd., Series 2016-1A, Class B, 5.68%,12/16/2041(a)(d) 4,580,937 4,508,080
BRAVO Residential Funding Trust,Series 2019-NQM2, Class A3,3.11%, 11/25/2059(a)(b) 2,307,843 2,326,505
Cantor Commercial Real EstateLending, Series 2019-CF1,Class 65D, 4.66%, 05/15/2052(a)(b) 4,517,000 4,049,313
Principal Amount Value Cerberus Loan Funding XXV L.P.,
Series 2018-4RA, Class DR, 3.93%(3 mo. USD LIBOR + 3.80%),10/15/2030(a)(e) $2,100,000 $ 2,052,529
Chase Mortgage Finance Corp., Series 2016-SH1, Class M3, 3.75%,04/25/2045(a)(b) 1,608,231 1,627,249 Series 2016-SH2, Class M3, 3.75%,12/25/2045(a)(b) 1,904,546 1,922,063
Citigroup Commercial Mortgage Trust, Series 2013-GC11, Class D, 4.56%,04/10/2023(a)(b) 4,885,000 4,978,309 Series 2015-GC29, Class D, 3.11%,04/10/2048(a) 5,000,000 4,915,600
COLT Funding LLC, Series 2021-1,Class M1, 2.29%, 06/25/2066(a)(b) 4,500,000 4,465,004
COLT Mortgage Loan Trust, Series 2020-1, Class A3, 2.90%,02/25/2050(a)(b) 964,119 966,924 Series 2020-2, Class A3, 3.70%,03/25/2065(a)(b) 2,664,000 2,719,645 Series 2020-3, Class A3, 2.38%,04/27/2065(a)(b) 1,583,253 1,589,817
Commercial Mortgage Trust, Series 2014-CR19, Class C, 4.86%,08/10/2024(b) 4,578,800 4,835,530 Series 2014-UBS4, Class C, IO,4.81%, 07/10/2024(c) 5,000,000 5,186,678 Series 2015-CR26, Class C, 4.69%,10/10/2048(b) 4,000,000 4,330,428
Credit Suisse Mortgage Capital Ctfs., Series 2020-SPT1, Class A3, 2.73%,04/25/2065(a)(d) 5,000,000 5,077,219
Credit Suisse Mortgage Trust, Series 2021-NQM1, Class M1,2.13%, 05/25/2065(a)(b) 1,649,583 1,655,579 Series 2021-NQM2, Class M1,2.28%, 02/25/2066(a)(b) 6,000,000 6,024,012
CSAIL Commercial Mortgage Trust, Series 2016-C6, Class E, 4.09%,01/15/2049(a)(b) 3,000,000 1,917,612 Series 2017-CX9, Class D, 4.28%,09/15/2050(a)(b) 6,304,000 5,646,662 Series 2019-C16, Class C, 4.24%,06/15/2052(b) 2,000,000 2,167,913 Series 2019-C17, Class C, 3.93%,09/15/2052 5,000,000 5,363,528
Deephaven Residential Mortgage Trust,Series 2020-2, Class A3, 2.86%,05/25/2065(a) 5,800,000 5,902,533
Dryden 53 CLO Ltd., Series 2017-53A,Class A, 1.25% (3 mo. USD LIBOR +1.12%), 01/15/2031(a)(e) 7,000,000 7,010,355
Extended Stay America Trust, Series2021-ESH, Class C, 1.80% (1 mo.USD LIBOR + 1.70%),07/15/2038(a)(e) 2,400,000 2,416,947
FirstKey Homes Trust, Series 2020-SFR2, Class D, 1.97%, 10/19/2037(a) 5,000,000 5,019,544
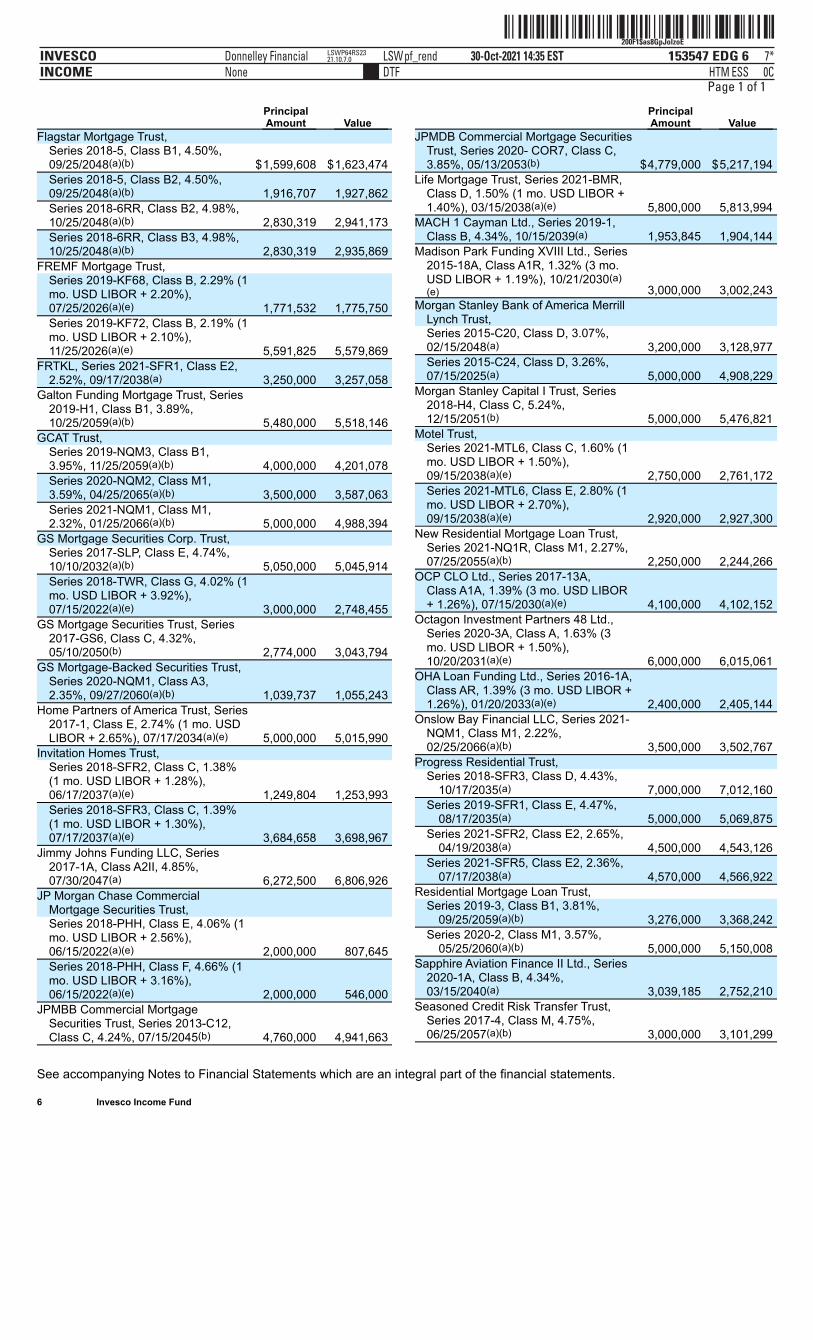
ˆ200F1$as8GpJolzoEŠ200F1$as8GpJolzoE
153547 EDG 6INVESCOINCOME
30-Oct-2021 14:35 ESTHTMDTF
Donnelley Financial LSWpf_rendNone
7*ESS 0C
LSWP64RS2321.10.7.0
Page 1 of 1
See accompanying Notes to Financial Statements which are an integral part of the financial statements.
6 Invesco Income Fund
Principal Amount Value Flagstar Mortgage Trust,
Series 2018-5, Class B1, 4.50%,09/25/2048(a)(b) $1,599,608 $1,623,474 Series 2018-5, Class B2, 4.50%,09/25/2048(a)(b) 1,916,707 1,927,862 Series 2018-6RR, Class B2, 4.98%,10/25/2048(a)(b) 2,830,319 2,941,173 Series 2018-6RR, Class B3, 4.98%,10/25/2048(a)(b) 2,830,319 2,935,869
FREMF Mortgage Trust, Series 2019-KF68, Class B, 2.29% (1mo. USD LIBOR + 2.20%),07/25/2026(a)(e) 1,771,532 1,775,750 Series 2019-KF72, Class B, 2.19% (1mo. USD LIBOR + 2.10%),11/25/2026(a)(e) 5,591,825 5,579,869
FRTKL, Series 2021-SFR1, Class E2,2.52%, 09/17/2038(a) 3,250,000 3,257,058
Galton Funding Mortgage Trust, Series2019-H1, Class B1, 3.89%,10/25/2059(a)(b) 5,480,000 5,518,146
GCAT Trust, Series 2019-NQM3, Class B1,3.95%, 11/25/2059(a)(b) 4,000,000 4,201,078 Series 2020-NQM2, Class M1,3.59%, 04/25/2065(a)(b) 3,500,000 3,587,063 Series 2021-NQM1, Class M1,2.32%, 01/25/2066(a)(b) 5,000,000 4,988,394
GS Mortgage Securities Corp. Trust, Series 2017-SLP, Class E, 4.74%,10/10/2032(a)(b) 5,050,000 5,045,914 Series 2018-TWR, Class G, 4.02% (1mo. USD LIBOR + 3.92%),07/15/2022(a)(e) 3,000,000 2,748,455
GS Mortgage Securities Trust, Series2017-GS6, Class C, 4.32%,05/10/2050(b) 2,774,000 3,043,794
GS Mortgage-Backed Securities Trust,Series 2020-NQM1, Class A3,2.35%, 09/27/2060(a)(b) 1,039,737 1,055,243
Home Partners of America Trust, Series2017-1, Class E, 2.74% (1 mo. USDLIBOR + 2.65%), 07/17/2034(a)(e) 5,000,000 5,015,990
Invitation Homes Trust, Series 2018-SFR2, Class C, 1.38%(1 mo. USD LIBOR + 1.28%),06/17/2037(a)(e) 1,249,804 1,253,993 Series 2018-SFR3, Class C, 1.39%(1 mo. USD LIBOR + 1.30%),07/17/2037(a)(e) 3,684,658 3,698,967
Jimmy Johns Funding LLC, Series2017-1A, Class A2II, 4.85%,07/30/2047(a) 6,272,500 6,806,926
JP Morgan Chase CommercialMortgage Securities Trust, Series 2018-PHH, Class E, 4.06% (1mo. USD LIBOR + 2.56%),06/15/2022(a)(e) 2,000,000 807,645 Series 2018-PHH, Class F, 4.66% (1mo. USD LIBOR + 3.16%),06/15/2022(a)(e) 2,000,000 546,000
JPMBB Commercial MortgageSecurities Trust, Series 2013-C12,Class C, 4.24%, 07/15/2045(b) 4,760,000 4,941,663
Principal Amount Value JPMDB Commercial Mortgage Securities
Trust, Series 2020- COR7, Class C,3.85%, 05/13/2053(b) $4,779,000 $5,217,194
Life Mortgage Trust, Series 2021-BMR,Class D, 1.50% (1 mo. USD LIBOR +1.40%), 03/15/2038(a)(e) 5,800,000 5,813,994
MACH 1 Cayman Ltd., Series 2019-1,Class B, 4.34%, 10/15/2039(a) 1,953,845 1,904,144
Madison Park Funding XVIII Ltd., Series2015-18A, Class A1R, 1.32% (3 mo.USD LIBOR + 1.19%), 10/21/2030(a)(e) 3,000,000 3,002,243
Morgan Stanley Bank of America MerrillLynch Trust, Series 2015-C20, Class D, 3.07%,02/15/2048(a) 3,200,000 3,128,977 Series 2015-C24, Class D, 3.26%,07/15/2025(a) 5,000,000 4,908,229
Morgan Stanley Capital I Trust, Series2018-H4, Class C, 5.24%,12/15/2051(b) 5,000,000 5,476,821
Motel Trust, Series 2021-MTL6, Class C, 1.60% (1mo. USD LIBOR + 1.50%),09/15/2038(a)(e) 2,750,000 2,761,172 Series 2021-MTL6, Class E, 2.80% (1mo. USD LIBOR + 2.70%),09/15/2038(a)(e) 2,920,000 2,927,300
New Residential Mortgage Loan Trust,Series 2021-NQ1R, Class M1, 2.27%,07/25/2055(a)(b) 2,250,000 2,244,266
OCP CLO Ltd., Series 2017-13A,Class A1A, 1.39% (3 mo. USD LIBOR+ 1.26%), 07/15/2030(a)(e) 4,100,000 4,102,152
Octagon Investment Partners 48 Ltd.,Series 2020-3A, Class A, 1.63% (3mo. USD LIBOR + 1.50%),10/20/2031(a)(e) 6,000,000 6,015,061
OHA Loan Funding Ltd., Series 2016-1A,Class AR, 1.39% (3 mo. USD LIBOR +1.26%), 01/20/2033(a)(e) 2,400,000 2,405,144
Onslow Bay Financial LLC, Series 2021-NQM1, Class M1, 2.22%,02/25/2066(a)(b) 3,500,000 3,502,767
Progress Residential Trust, Series 2018-SFR3, Class D, 4.43%,
10/17/2035(a) 7,000,000 7,012,160 Series 2019-SFR1, Class E, 4.47%,
08/17/2035(a) 5,000,000 5,069,875 Series 2021-SFR2, Class E2, 2.65%,
04/19/2038(a) 4,500,000 4,543,126 Series 2021-SFR5, Class E2, 2.36%,
07/17/2038(a) 4,570,000 4,566,922 Residential Mortgage Loan Trust,
Series 2019-3, Class B1, 3.81%,09/25/2059(a)(b) 3,276,000 3,368,242
Series 2020-2, Class M1, 3.57%,05/25/2060(a)(b) 5,000,000 5,150,008
Sapphire Aviation Finance II Ltd., Series2020-1A, Class B, 4.34%,03/15/2040(a) 3,039,185 2,752,210
Seasoned Credit Risk Transfer Trust,Series 2017-4, Class M, 4.75%,06/25/2057(a)(b) 3,000,000 3,101,299
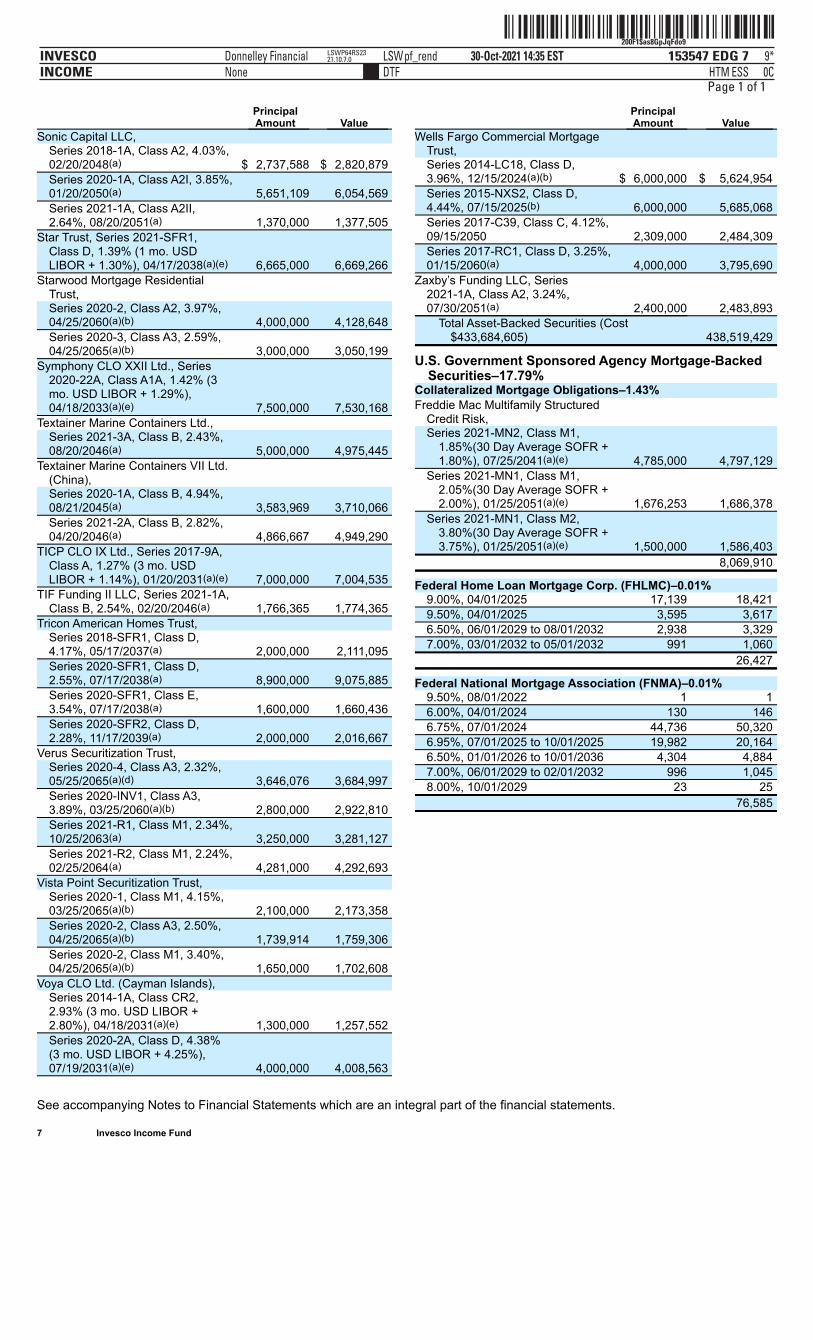
ˆ200F1$as8GpJqFdo9Š200F1$as8GpJqFdo9
153547 EDG 7INVESCOINCOME
30-Oct-2021 14:35 ESTHTMDTF
Donnelley Financial LSWpf_rendNone
9*ESS 0C
LSWP64RS2321.10.7.0
Page 1 of 1
See accompanying Notes to Financial Statements which are an integral part of the financial statements.
7 Invesco Income Fund
Principal Amount Value Sonic Capital LLC,
Series 2018-1A, Class A2, 4.03%,02/20/2048(a) $ 2,737,588 $ 2,820,879 Series 2020-1A, Class A2I, 3.85%,01/20/2050(a) 5,651,109 6,054,569 Series 2021-1A, Class A2II,2.64%, 08/20/2051(a) 1,370,000 1,377,505
Star Trust, Series 2021-SFR1,Class D, 1.39% (1 mo. USDLIBOR + 1.30%), 04/17/2038(a)(e) 6,665,000 6,669,266
Starwood Mortgage ResidentialTrust, Series 2020-2, Class A2, 3.97%,04/25/2060(a)(b) 4,000,000 4,128,648 Series 2020-3, Class A3, 2.59%,04/25/2065(a)(b) 3,000,000 3,050,199
Symphony CLO XXII Ltd., Series2020-22A, Class A1A, 1.42% (3mo. USD LIBOR + 1.29%),04/18/2033(a)(e) 7,500,000 7,530,168
Textainer Marine Containers Ltd., Series 2021-3A, Class B, 2.43%,08/20/2046(a) 5,000,000 4,975,445
Textainer Marine Containers VII Ltd.(China), Series 2020-1A, Class B, 4.94%,08/21/2045(a) 3,583,969 3,710,066 Series 2021-2A, Class B, 2.82%,04/20/2046(a) 4,866,667 4,949,290
TICP CLO IX Ltd., Series 2017-9A,Class A, 1.27% (3 mo. USDLIBOR + 1.14%), 01/20/2031(a)(e) 7,000,000 7,004,535
TIF Funding II LLC, Series 2021-1A,Class B, 2.54%, 02/20/2046(a) 1,766,365 1,774,365
Tricon American Homes Trust, Series 2018-SFR1, Class D,4.17%, 05/17/2037(a) 2,000,000 2,111,095 Series 2020-SFR1, Class D,2.55%, 07/17/2038(a) 8,900,000 9,075,885 Series 2020-SFR1, Class E,3.54%, 07/17/2038(a) 1,600,000 1,660,436 Series 2020-SFR2, Class D,2.28%, 11/17/2039(a) 2,000,000 2,016,667
Verus Securitization Trust, Series 2020-4, Class A3, 2.32%,05/25/2065(a)(d) 3,646,076 3,684,997 Series 2020-INV1, Class A3,3.89%, 03/25/2060(a)(b) 2,800,000 2,922,810 Series 2021-R1, Class M1, 2.34%,10/25/2063(a) 3,250,000 3,281,127 Series 2021-R2, Class M1, 2.24%,02/25/2064(a) 4,281,000 4,292,693
Vista Point Securitization Trust, Series 2020-1, Class M1, 4.15%,03/25/2065(a)(b) 2,100,000 2,173,358 Series 2020-2, Class A3, 2.50%,04/25/2065(a)(b) 1,739,914 1,759,306 Series 2020-2, Class M1, 3.40%,04/25/2065(a)(b) 1,650,000 1,702,608
Voya CLO Ltd. (Cayman Islands), Series 2014-1A, Class CR2,2.93% (3 mo. USD LIBOR +2.80%), 04/18/2031(a)(e) 1,300,000 1,257,552 Series 2020-2A, Class D, 4.38%(3 mo. USD LIBOR + 4.25%),07/19/2031(a)(e) 4,000,000 4,008,563
Principal Amount Value Wells Fargo Commercial Mortgage
Trust, Series 2014-LC18, Class D,3.96%, 12/15/2024(a)(b) $ 6,000,000 $ 5,624,954 Series 2015-NXS2, Class D,4.44%, 07/15/2025(b) 6,000,000 5,685,068 Series 2017-C39, Class C, 4.12%,09/15/2050 2,309,000 2,484,309 Series 2017-RC1, Class D, 3.25%,01/15/2060(a) 4,000,000 3,795,690
Zaxby’s Funding LLC, Series2021-1A, Class A2, 3.24%,07/30/2051(a) 2,400,000 2,483,893
Total Asset-Backed Securities (Cost$433,684,605)
438,519,429
U.S. Government Sponsored Agency Mortgage-BackedSecurities–17.79%
Collateralized Mortgage Obligations–1.43% Freddie Mac Multifamily Structured
Credit Risk, Series 2021-MN2, Class M1,
1.85%(30 Day Average SOFR +1.80%), 07/25/2041(a)(e) 4,785,000 4,797,129
Series 2021-MN1, Class M1,2.05%(30 Day Average SOFR +2.00%), 01/25/2051(a)(e) 1,676,253 1,686,378
Series 2021-MN1, Class M2,3.80%(30 Day Average SOFR +3.75%), 01/25/2051(a)(e) 1,500,000 1,586,403
8,069,910
Federal Home Loan Mortgage Corp. (FHLMC)–0.01% 9.00%, 04/01/2025 17,139 18,421 9.50%, 04/01/2025 3,595 3,617 6.50%, 06/01/2029 to 08/01/2032 2,938 3,329 7.00%, 03/01/2032 to 05/01/2032 991 1,060
26,427
Federal National Mortgage Association (FNMA)–0.01% 9.50%, 08/01/2022 1 1 6.00%, 04/01/2024 130 146 6.75%, 07/01/2024 44,736 50,320 6.95%, 07/01/2025 to 10/01/2025 19,982 20,164 6.50%, 01/01/2026 to 10/01/2036 4,304 4,884 7.00%, 06/01/2029 to 02/01/2032 996 1,045 8.00%, 10/01/2029 23 25
76,585
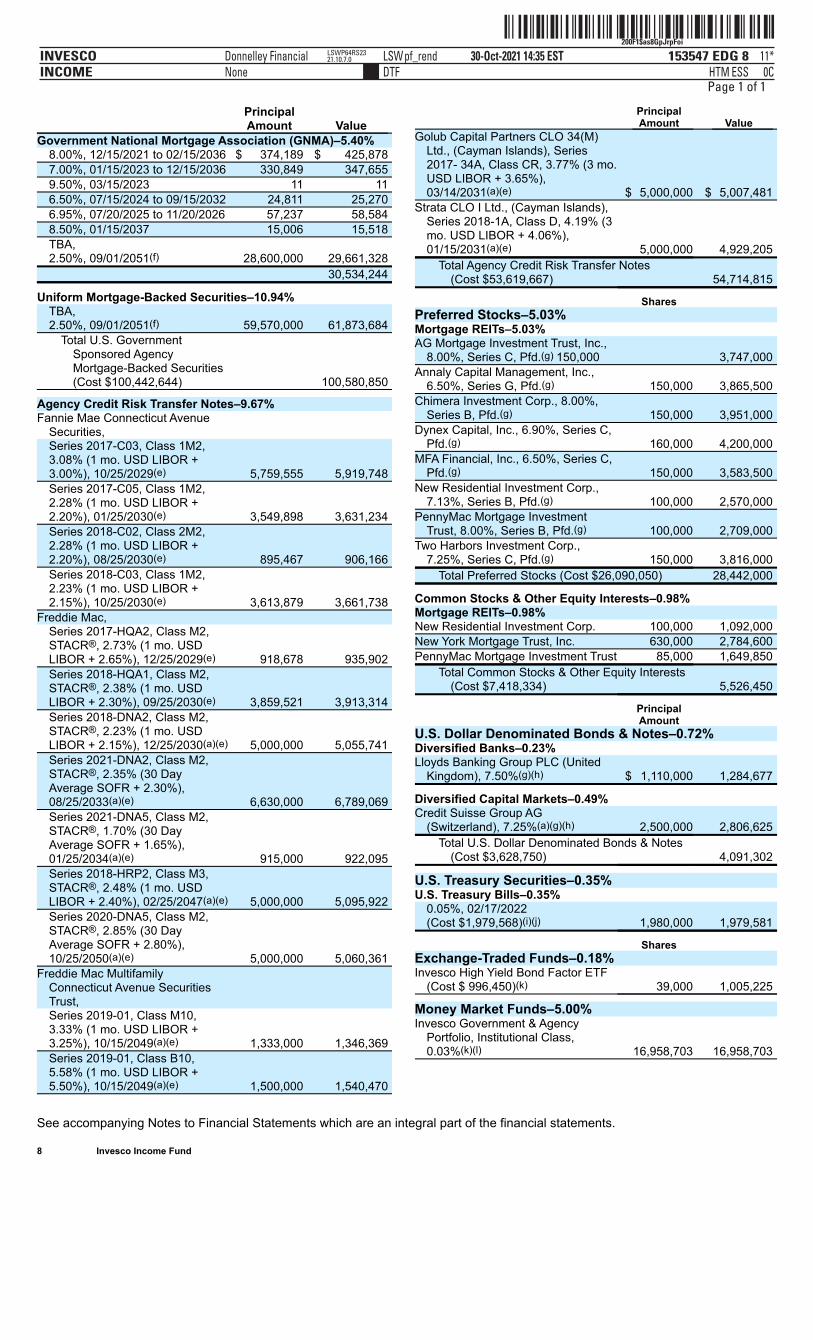
ˆ200F1$as8GpJrpFoiŠ200F1$as8GpJrpFoi
153547 EDG 8INVESCOINCOME
30-Oct-2021 14:35 ESTHTMDTF
Donnelley Financial LSWpf_rendNone
11*ESS 0C
LSWP64RS2321.10.7.0
Page 1 of 1
See accompanying Notes to Financial Statements which are an integral part of the financial statements.
8 Invesco Income Fund
Principal Amount Value Government National Mortgage Association (GNMA)–5.40%
8.00%, 12/15/2021 to 02/15/2036 $ 374,189 $ 425,878 7.00%, 01/15/2023 to 12/15/2036 330,849 347,655 9.50%, 03/15/2023 11 11 6.50%, 07/15/2024 to 09/15/2032 24,811 25,270 6.95%, 07/20/2025 to 11/20/2026 57,237 58,584 8.50%, 01/15/2037 15,006 15,518 TBA,2.50%, 09/01/2051(f) 28,600,000 29,661,328
30,534,244
Uniform Mortgage-Backed Securities–10.94% TBA,2.50%, 09/01/2051(f) 59,570,000 61,873,684
Total U.S. GovernmentSponsored AgencyMortgage-Backed Securities(Cost $100,442,644) 100,580,850
Agency Credit Risk Transfer Notes–9.67% Fannie Mae Connecticut Avenue
Securities, Series 2017-C03, Class 1M2,3.08% (1 mo. USD LIBOR +3.00%), 10/25/2029(e) 5,759,555 5,919,748 Series 2017-C05, Class 1M2,2.28% (1 mo. USD LIBOR +2.20%), 01/25/2030(e) 3,549,898 3,631,234 Series 2018-C02, Class 2M2,2.28% (1 mo. USD LIBOR +2.20%), 08/25/2030(e) 895,467 906,166 Series 2018-C03, Class 1M2,2.23% (1 mo. USD LIBOR +2.15%), 10/25/2030(e) 3,613,879 3,661,738
Freddie Mac, Series 2017-HQA2, Class M2,STACR®, 2.73% (1 mo. USDLIBOR + 2.65%), 12/25/2029(e) 918,678 935,902 Series 2018-HQA1, Class M2,STACR®, 2.38% (1 mo. USDLIBOR + 2.30%), 09/25/2030(e) 3,859,521 3,913,314 Series 2018-DNA2, Class M2,STACR®, 2.23% (1 mo. USDLIBOR + 2.15%), 12/25/2030(a)(e) 5,000,000 5,055,741 Series 2021-DNA2, Class M2,STACR®, 2.35% (30 DayAverage SOFR + 2.30%),08/25/2033(a)(e) 6,630,000 6,789,069 Series 2021-DNA5, Class M2,STACR®, 1.70% (30 DayAverage SOFR + 1.65%),01/25/2034(a)(e) 915,000 922,095 Series 2018-HRP2, Class M3,STACR®, 2.48% (1 mo. USDLIBOR + 2.40%), 02/25/2047(a)(e) 5,000,000 5,095,922 Series 2020-DNA5, Class M2,STACR®, 2.85% (30 DayAverage SOFR + 2.80%),10/25/2050(a)(e) 5,000,000 5,060,361
Freddie Mac MultifamilyConnecticut Avenue SecuritiesTrust, Series 2019-01, Class M10,3.33% (1 mo. USD LIBOR +3.25%), 10/15/2049(a)(e) 1,333,000 1,346,369 Series 2019-01, Class B10,5.58% (1 mo. USD LIBOR +5.50%), 10/15/2049(a)(e) 1,500,000 1,540,470
Principal Amount Value Golub Capital Partners CLO 34(M)
Ltd., (Cayman Islands), Series2017- 34A, Class CR, 3.77% (3 mo.USD LIBOR + 3.65%),03/14/2031(a)(e) $ 5,000,000 $ 5,007,481
Strata CLO I Ltd., (Cayman Islands),Series 2018-1A, Class D, 4.19% (3mo. USD LIBOR + 4.06%),01/15/2031(a)(e) 5,000,000 4,929,205
Total Agency Credit Risk Transfer Notes(Cost $53,619,667)
54,714,815
Shares Preferred Stocks–5.03% Mortgage REITs–5.03% AG Mortgage Investment Trust, Inc.,
8.00%, Series C, Pfd.(g) 150,000 3,747,000 Annaly Capital Management, Inc.,
6.50%, Series G, Pfd.(g) 150,000 3,865,500 Chimera Investment Corp., 8.00%,
Series B, Pfd.(g) 150,000 3,951,000 Dynex Capital, Inc., 6.90%, Series C,
Pfd.(g) 160,000 4,200,000 MFA Financial, Inc., 6.50%, Series C,
Pfd.(g) 150,000 3,583,500 New Residential Investment Corp.,
7.13%, Series B, Pfd.(g) 100,000 2,570,000 PennyMac Mortgage Investment
Trust, 8.00%, Series B, Pfd.(g) 100,000 2,709,000 Two Harbors Investment Corp.,
7.25%, Series C, Pfd.(g) 150,000 3,816,000 Total Preferred Stocks (Cost $26,090,050) 28,442,000
Common Stocks & Other Equity Interests–0.98% Mortgage REITs–0.98% New Residential Investment Corp. 100,000 1,092,000 New York Mortgage Trust, Inc. 630,000 2,784,600 PennyMac Mortgage Investment Trust 85,000 1,649,850
Total Common Stocks & Other Equity Interests(Cost $7,418,334)
5,526,450
Principal Amount U.S. Dollar Denominated Bonds & Notes–0.72% Diversified Banks–0.23% Lloyds Banking Group PLC (United
Kingdom), 7.50%(g)(h) $ 1,110,000 1,284,677
Diversified Capital Markets–0.49% Credit Suisse Group AG
(Switzerland), 7.25%(a)(g)(h) 2,500,000 2,806,625 Total U.S. Dollar Denominated Bonds & Notes
(Cost $3,628,750) 4,091,302
U.S. Treasury Securities–0.35% U.S. Treasury Bills–0.35%
0.05%, 02/17/2022(Cost $1,979,568)(i)(j) 1,980,000 1,979,581
Shares Exchange-Traded Funds–0.18% Invesco High Yield Bond Factor ETF
(Cost $ 996,450)(k) 39,000 1,005,225
Money Market Funds–5.00% Invesco Government & Agency
Portfolio, Institutional Class,0.03%(k)(l) 16,958,703 16,958,703
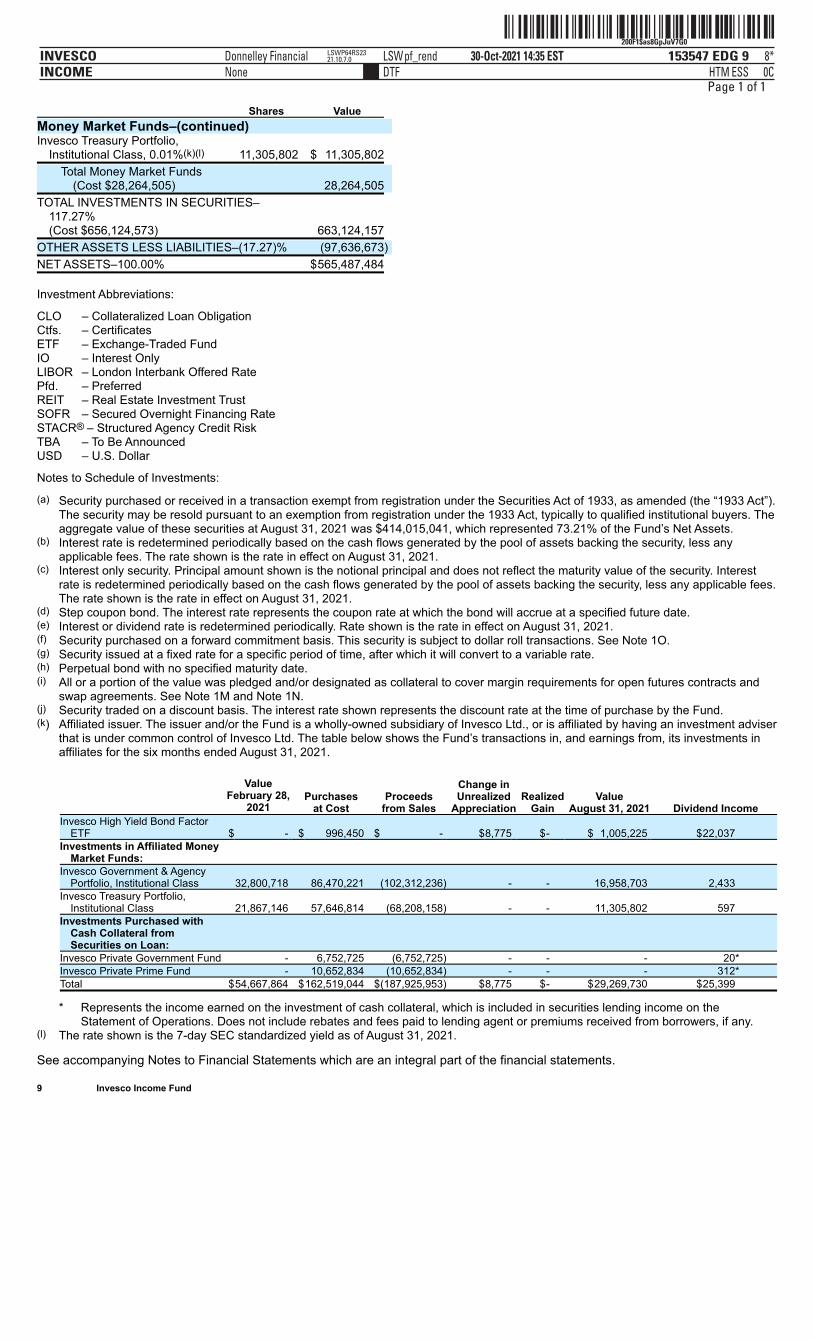
ˆ200F1$as8GpJuV7G0Š200F1$as8GpJuV7G0
153547 EDG 9INVESCOINCOME
30-Oct-2021 14:35 ESTHTMDTF
Donnelley Financial LSWpf_rendNone
8*ESS 0C
LSWP64RS2321.10.7.0
Page 1 of 1
Investment Abbreviations:
CLO – Collateralized Loan ObligationCtfs. – CertificatesETF – Exchange-Traded FundIO – Interest OnlyLIBOR – London Interbank Offered RatePfd. – PreferredREIT – Real Estate Investment TrustSOFR – Secured Overnight Financing RateSTACR® – Structured Agency Credit RiskTBA – To Be AnnouncedUSD – U.S. Dollar
Notes to Schedule of Investments:
(a) Security purchased or received in a transaction exempt from registration under the Securities Act of 1933, as amended (the “1933 Act”).The security may be resold pursuant to an exemption from registration under the 1933 Act, typically to qualified institutional buyers. Theaggregate value of these securities at August 31, 2021 was $414,015,041, which represented 73.21% of the Fund’s Net Assets.
(b) Interest rate is redetermined periodically based on the cash flows generated by the pool of assets backing the security, less anyapplicable fees. The rate shown is the rate in effect on August 31, 2021.
(c) Interest only security. Principal amount shown is the notional principal and does not reflect the maturity value of the security. Interestrate is redetermined periodically based on the cash flows generated by the pool of assets backing the security, less any applicable fees.The rate shown is the rate in effect on August 31, 2021.
(d) Step coupon bond. The interest rate represents the coupon rate at which the bond will accrue at a specified future date.(e) Interest or dividend rate is redetermined periodically. Rate shown is the rate in effect on August 31, 2021.(f) Security purchased on a forward commitment basis. This security is subject to dollar roll transactions. See Note 1O.(g) Security issued at a fixed rate for a specific period of time, after which it will convert to a variable rate.(h) Perpetual bond with no specified maturity date.(i) All or a portion of the value was pledged and/or designated as collateral to cover margin requirements for open futures contracts and
swap agreements. See Note 1M and Note 1N.(j) Security traded on a discount basis. The interest rate shown represents the discount rate at the time of purchase by the Fund.(k) Affiliated issuer. The issuer and/or the Fund is a wholly-owned subsidiary of Invesco Ltd., or is affiliated by having an investment adviser
that is under common control of Invesco Ltd. The table below shows the Fund’s transactions in, and earnings from, its investments inaffiliates for the six months ended August 31, 2021.
ValueFebruary 28,
2021 Purchases
at Cost Proceeds
from Sales
Change inUnrealized
Appreciation Realized
Gain Value
August 31, 2021 Dividend IncomeInvesco High Yield Bond Factor
ETF $ - $ 996,450 $ - $8,775 $- $ 1,005,225 $22,037Investments in Affiliated Money
Market Funds: Invesco Government & Agency
Portfolio, Institutional Class 32,800,718 86,470,221 (102,312,236) - - 16,958,703 2,433Invesco Treasury Portfolio,
Institutional Class 21,867,146 57,646,814 (68,208,158) - - 11,305,802 597Investments Purchased with
Cash Collateral fromSecurities on Loan:
Invesco Private Government Fund - 6,752,725 (6,752,725) - - - 20*Invesco Private Prime Fund - 10,652,834 (10,652,834) - - - 312*Total $54,667,864 $162,519,044 $(187,925,953) $8,775 $- $29,269,730 $25,399
* Represents the income earned on the investment of cash collateral, which is included in securities lending income on theStatement of Operations. Does not include rebates and fees paid to lending agent or premiums received from borrowers, if any.
(l) The rate shown is the 7-day SEC standardized yield as of August 31, 2021.
See accompanying Notes to Financial Statements which are an integral part of the financial statements.
9 Invesco Income Fund
Shares Value
Money Market Funds–(continued) Invesco Treasury Portfolio,
Institutional Class, 0.01%(k)(l) 11,305,802 $ 11,305,802
Total Money Market Funds(Cost $28,264,505)
28,264,505
TOTAL INVESTMENTS IN SECURITIES–117.27%(Cost $656,124,573)
663,124,157
OTHER ASSETS LESS LIABILITIES–(17.27)% (97,636,673)
NET ASSETS–100.00% $565,487,484
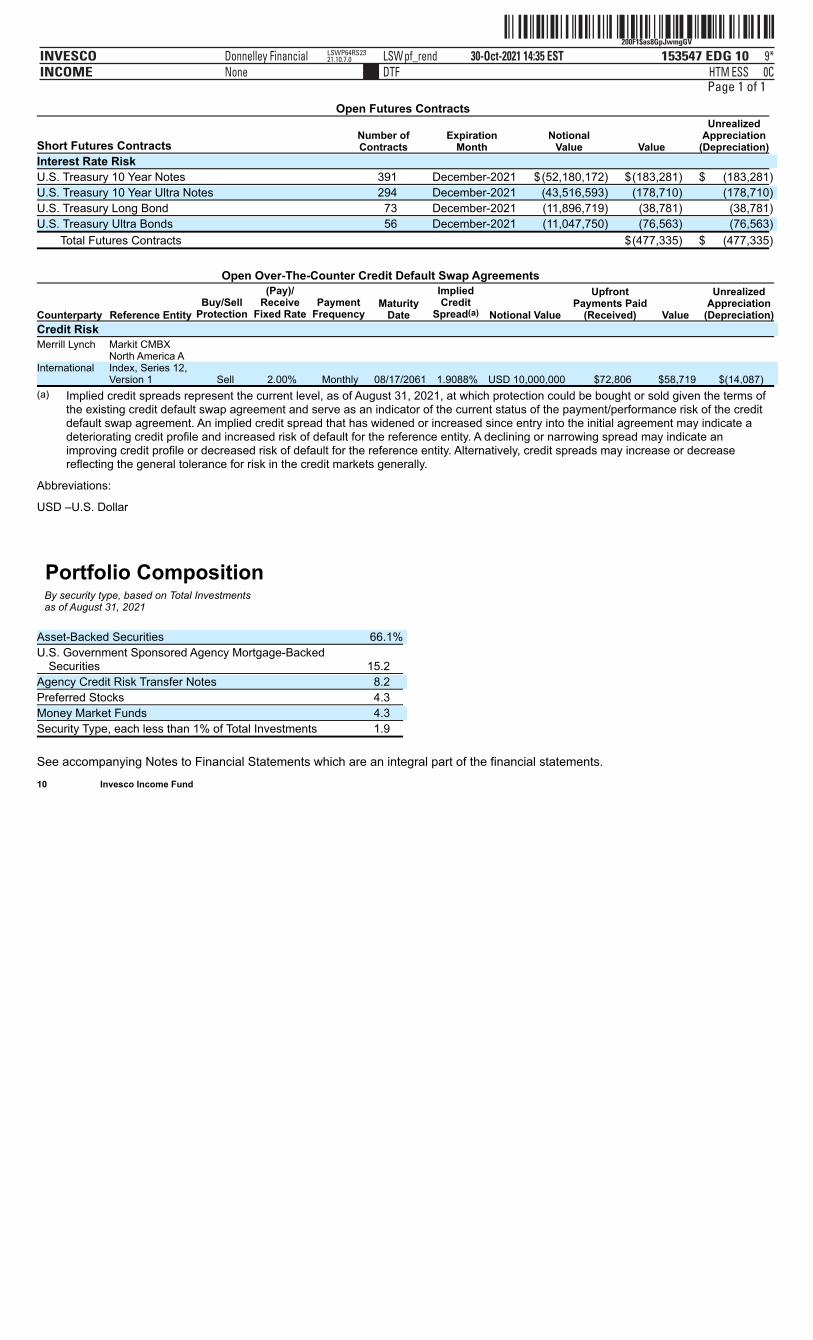
ˆ200F1$as8GpJwmgGVŠ200F1$as8GpJwmgGV
153547 EDG 10INVESCOINCOME
30-Oct-2021 14:35 ESTHTMDTF
Donnelley Financial LSWpf_rendNone
9*ESS 0C
LSWP64RS2321.10.7.0
Page 1 of 1
Open Futures Contracts
Short Futures Contracts Number ofContracts
ExpirationMonth
NotionalValue Value
UnrealizedAppreciation
(Depreciation)
Interest Rate Risk
U.S. Treasury 10 Year Notes 391 December-2021 $(52,180,172) $(183,281) $ (183,281)
U.S. Treasury 10 Year Ultra Notes 294 December-2021 (43,516,593) (178,710) (178,710)
U.S. Treasury Long Bond 73 December-2021 (11,896,719) (38,781) (38,781)
U.S. Treasury Ultra Bonds 56 December-2021 (11,047,750) (76,563) (76,563)
Total Futures Contracts $(477,335) $ (477,335)
Open Over-The-Counter Credit Default Swap Agreements
Counterparty Reference Entity Buy/Sell
Protection
(Pay)/Receive
Fixed Rate Payment
Frequency Maturity
Date
ImpliedCredit
Spread(a) Notional Value
UpfrontPayments Paid
(Received) Value
UnrealizedAppreciation
(Depreciation)
Credit Risk
Merrill Lynch
Markit CMBXNorth America A
International
Index, Series 12,Version 1 Sell 2.00% Monthly 08/17/2061 1.9088% USD 10,000,000 $72,806 $58,719 $(14,087)
(a) Implied credit spreads represent the current level, as of August 31, 2021, at which protection could be bought or sold given the terms ofthe existing credit default swap agreement and serve as an indicator of the current status of the payment/performance risk of the creditdefault swap agreement. An implied credit spread that has widened or increased since entry into the initial agreement may indicate adeteriorating credit profile and increased risk of default for the reference entity. A declining or narrowing spread may indicate animproving credit profile or decreased risk of default for the reference entity. Alternatively, credit spreads may increase or decreasereflecting the general tolerance for risk in the credit markets generally.
Abbreviations:
USD –U.S. Dollar
Portfolio CompositionBy security type, based on Total Investmentsas of August 31, 2021
Asset-Backed Securities 66.1%
U.S. Government Sponsored Agency Mortgage-BackedSecurities 15.2
Agency Credit Risk Transfer Notes 8.2
Preferred Stocks 4.3
Money Market Funds 4.3
Security Type, each less than 1% of Total Investments 1.9
See accompanying Notes to Financial Statements which are an integral part of the financial statements. 10 Invesco Income Fund
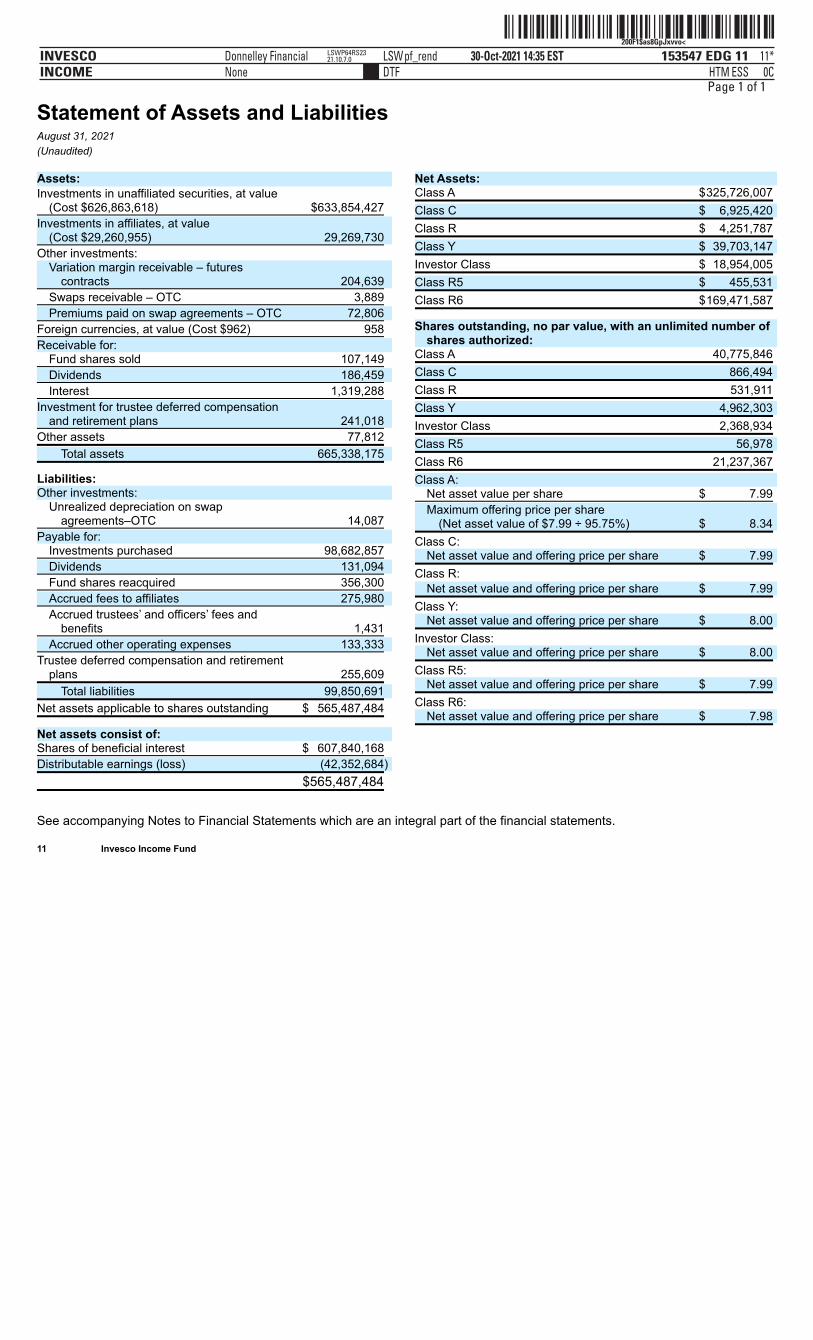
ˆ200F1$as8GpJxvvo<Š200F1$as8GpJxvvo<
153547 EDG 11INVESCOINCOME
30-Oct-2021 14:35 ESTHTMDTF
Donnelley Financial LSWpf_rendNone
11*ESS 0C
LSWP64RS2321.10.7.0
Page 1 of 1
Statement of Assets and LiabilitiesAugust 31, 2021(Unaudited)
See accompanying Notes to Financial Statements which are an integral part of the financial statements.
11 Invesco Income Fund
Assets: Investments in unaffiliated securities, at value
(Cost $626,863,618) $633,854,427
Investments in affiliates, at value(Cost $29,260,955) 29,269,730
Other investments: Variation margin receivable – futures
contracts 204,639
Swaps receivable – OTC 3,889
Premiums paid on swap agreements – OTC 72,806
Foreign currencies, at value (Cost $962) 958
Receivable for: Fund shares sold 107,149
Dividends 186,459
Interest 1,319,288
Investment for trustee deferred compensationand retirement plans 241,018
Other assets 77,812
Total assets 665,338,175
Liabilities: Other investments:
Unrealized depreciation on swapagreements–OTC 14,087
Payable for: Investments purchased 98,682,857
Dividends 131,094
Fund shares reacquired 356,300
Accrued fees to affiliates 275,980
Accrued trustees’ and officers’ fees andbenefits 1,431
Accrued other operating expenses 133,333
Trustee deferred compensation and retirementplans 255,609
Total liabilities 99,850,691
Net assets applicable to shares outstanding $ 565,487,484
Net assets consist of: Shares of beneficial interest $ 607,840,168
Distributable earnings (loss) (42,352,684)
$565,487,484
Net Assets: Class A $325,726,007
Class C $ 6,925,420
Class R $ 4,251,787
Class Y $ 39,703,147
Investor Class $ 18,954,005
Class R5 $ 455,531
Class R6 $169,471,587
Shares outstanding, no par value, with an unlimited number ofshares authorized:
Class A 40,775,846
Class C 866,494
Class R 531,911
Class Y 4,962,303
Investor Class 2,368,934
Class R5 56,978
Class R6 21,237,367
Class A: Net asset value per share $ 7.99
Maximum offering price per share(Net asset value of $7.99 ÷ 95.75%) $ 8.34
Class C: Net asset value and offering price per share $ 7.99
Class R: Net asset value and offering price per share $ 7.99
Class Y: Net asset value and offering price per share $ 8.00
Investor Class: Net asset value and offering price per share $ 8.00
Class R5: Net asset value and offering price per share $ 7.99
Class R6: Net asset value and offering price per share $ 7.98
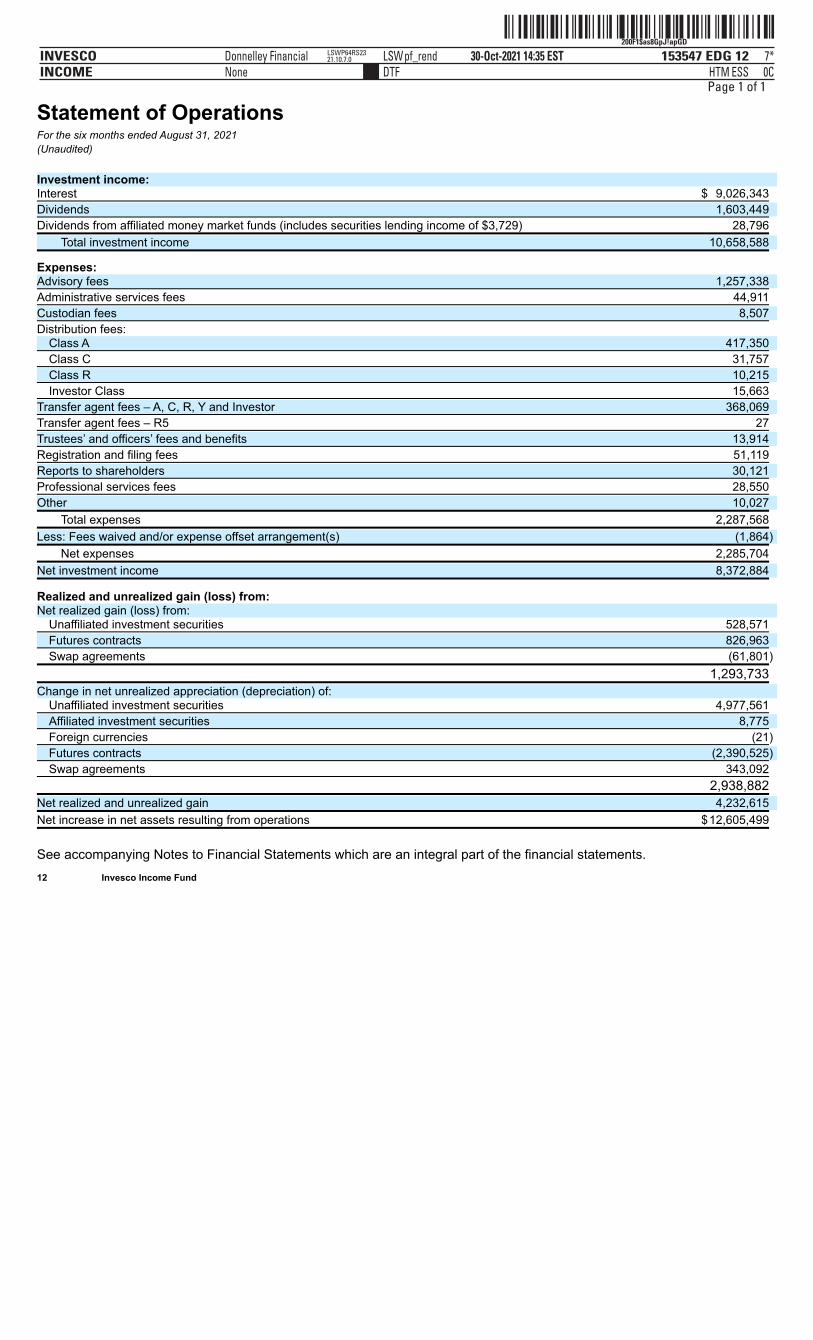
ˆ200F1$as8GpJ!apGDŠ200F1$as8GpJ!apGD
153547 EDG 12INVESCOINCOME
30-Oct-2021 14:35 ESTHTMDTF
Donnelley Financial LSWpf_rendNone
7*ESS 0C
LSWP64RS2321.10.7.0
Page 1 of 1
Statement of OperationsFor the six months ended August 31, 2021(Unaudited) Investment income: Interest $ 9,026,343
Dividends 1,603,449
Dividends from affiliated money market funds (includes securities lending income of $3,729) 28,796
Total investment income 10,658,588
Expenses: Advisory fees 1,257,338
Administrative services fees 44,911
Custodian fees 8,507
Distribution fees: Class A 417,350
Class C 31,757
Class R 10,215
Investor Class 15,663
Transfer agent fees – A, C, R, Y and Investor 368,069
Transfer agent fees – R5 27
Trustees’ and officers’ fees and benefits 13,914
Registration and filing fees 51,119
Reports to shareholders 30,121
Professional services fees 28,550
Other 10,027
Total expenses 2,287,568
Less: Fees waived and/or expense offset arrangement(s) (1,864)
Net expenses 2,285,704
Net investment income 8,372,884
Realized and unrealized gain (loss) from: Net realized gain (loss) from:
Unaffiliated investment securities 528,571
Futures contracts 826,963
Swap agreements (61,801)
1,293,733
Change in net unrealized appreciation (depreciation) of: Unaffiliated investment securities 4,977,561
Affiliated investment securities 8,775
Foreign currencies (21)
Futures contracts (2,390,525)
Swap agreements 343,092
2,938,882
Net realized and unrealized gain 4,232,615
Net increase in net assets resulting from operations $12,605,499
See accompanying Notes to Financial Statements which are an integral part of the financial statements. 12 Invesco Income Fund
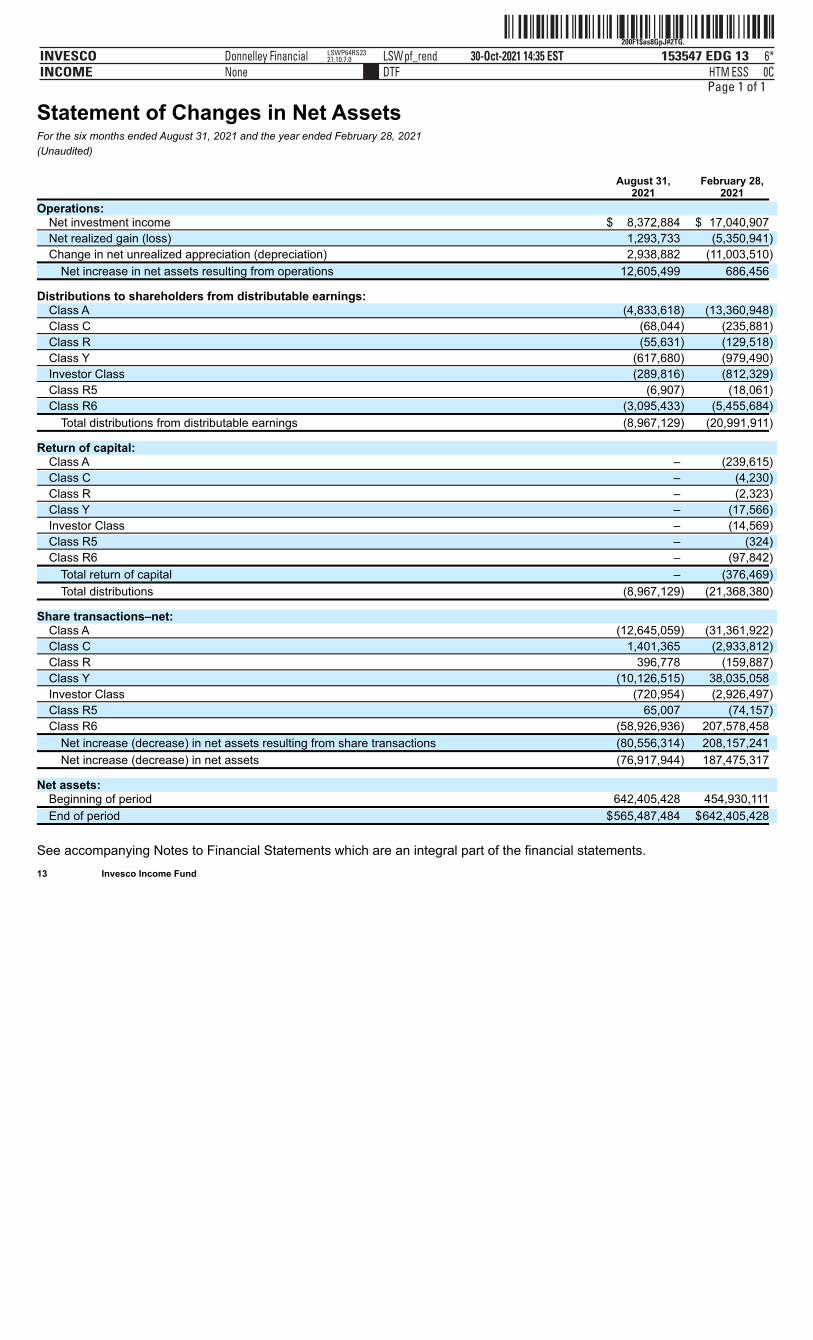
ˆ200F1$as8GpJ#2TG.Š200F1$as8GpJ#2TG.
153547 EDG 13INVESCOINCOME
30-Oct-2021 14:35 ESTHTMDTF
Donnelley Financial LSWpf_rendNone
6*ESS 0C
LSWP64RS2321.10.7.0
Page 1 of 1
Statement of Changes in Net AssetsFor the six months ended August 31, 2021 and the year ended February 28, 2021(Unaudited) August 31, February 28, 2021 2021
Operations: Net investment income $ 8,372,884 $ 17,040,907
Net realized gain (loss) 1,293,733 (5,350,941)
Change in net unrealized appreciation (depreciation) 2,938,882 (11,003,510)
Net increase in net assets resulting from operations 12,605,499 686,456
Distributions to shareholders from distributable earnings: Class A (4,833,618) (13,360,948)
Class C (68,044) (235,881)
Class R (55,631) (129,518)
Class Y (617,680) (979,490)
Investor Class (289,816) (812,329)
Class R5 (6,907) (18,061)
Class R6 (3,095,433) (5,455,684)
Total distributions from distributable earnings (8,967,129) (20,991,911)
Return of capital: Class A – (239,615)
Class C – (4,230)
Class R – (2,323)
Class Y – (17,566)
Investor Class – (14,569)
Class R5 – (324)
Class R6 – (97,842)
Total return of capital – (376,469)
Total distributions (8,967,129) (21,368,380)
Share transactions–net: Class A (12,645,059) (31,361,922)
Class C 1,401,365 (2,933,812)
Class R 396,778 (159,887)
Class Y (10,126,515) 38,035,058
Investor Class (720,954) (2,926,497)
Class R5 65,007 (74,157)
Class R6 (58,926,936) 207,578,458
Net increase (decrease) in net assets resulting from share transactions (80,556,314) 208,157,241
Net increase (decrease) in net assets (76,917,944) 187,475,317
Net assets: Beginning of period 642,405,428 454,930,111
End of period $565,487,484 $642,405,428
See accompanying Notes to Financial Statements which are an integral part of the financial statements. 13 Invesco Income Fund
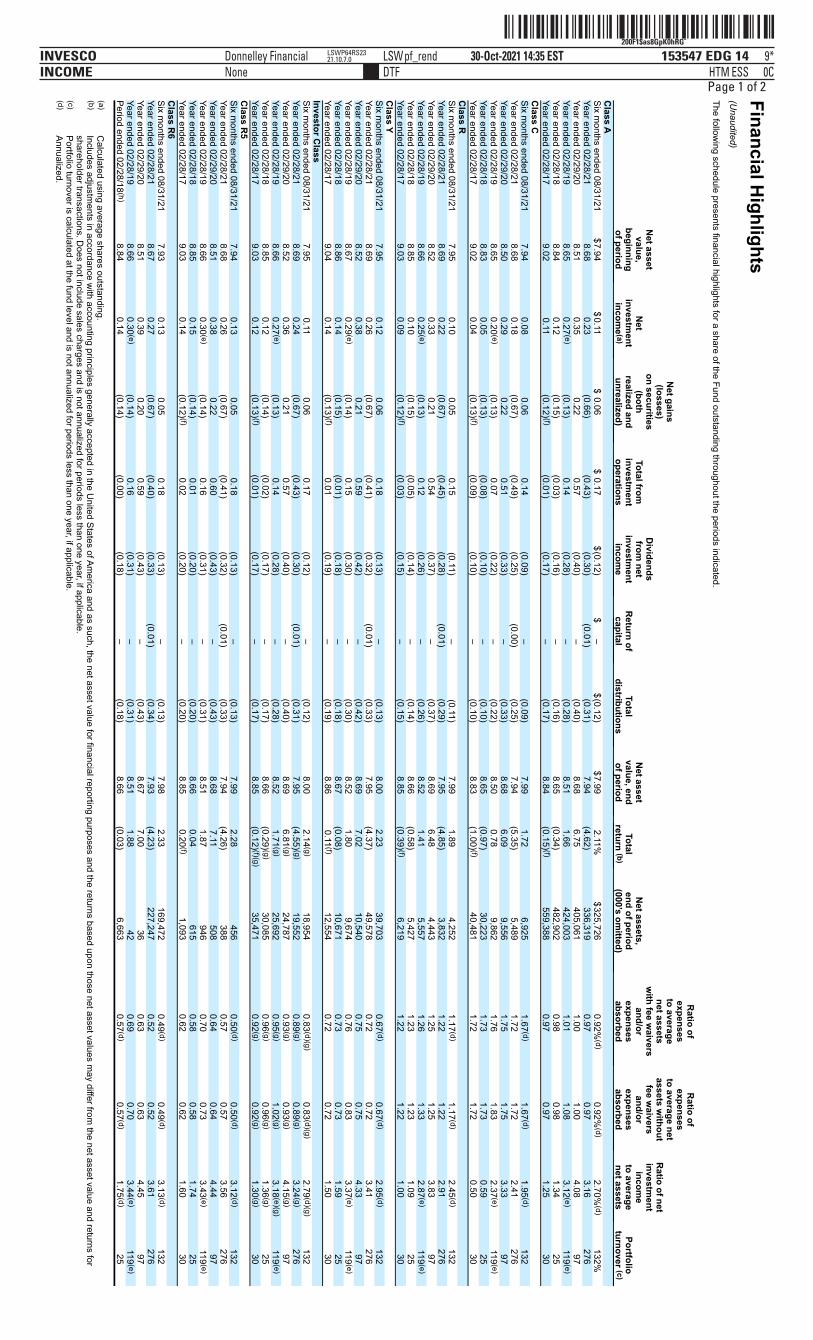
ˆ200F1$as8GpK0hRGÅŠ200F1$as8GpK0hRG¯
153547 EDG 14INVESCOINCOME
30-Oct-2021 14:35 ESTHTMDTF
Donnelley Financial LSWpf_rendNone
9*ESS 0C
LSWP64RS2321.10.7.0
Page 1 of 2Financial Highlights
(Unaudited)
The following schedule presents financial highlights for a share of the Fund outstanding throughout the periods indicated.
Ratio of
R
atio of
expenses
expenses
Net gains
to average
to average net
(losses)
net assets
assets without
R
atio of net
Net asset
on securities
D
ividends
w
ith fee waivers
fee w
aivers
investment
value,
N
et
(both
Total from
from net
N
et asset
N
et assets,
and/or
and/or
income
beginning
investm
ent
realized and
investment
investm
ent
Return of
Total
value, end
Total
end of period
expenses
expenses
to average
Portfolio
of period
income (a)
unrealized)
operations
incom
e
capital
distributions
of period
return (b)
(000’s omitted)
absorbed
absorbed
net assets
turnover (c)
Class A
Six months ended 08/31/21
$7.94
$0.11
$0.06
$
0.17
$(0.12)
$–
$(0.12)
$7.99
2.11%
$325,726
0.92%
(d)
0.92%(d)
2.70%
(d)
132%Year ended 02/28/21
8.68
0.23
(0.66)
(0.43)
(0.30)
(0.01)
(0.31)
7.94
(4.62)
336,319
0.97
0.97
3.16
276Year ended 02/29/20
8.51
0.35
0.22
0.57
(0.40)
–
(0.40)
8.68 6.75
405,061
1.00
1.00
4.08
97Year ended 02/28/19
8.65
0.27 (e)
(0.13)
0.14
(0.28)
–
(0.28)
8.51
1.66
424,003
1.01
1.08
3.12 (e)
119 (e) Year ended 02/28/18
8.84
0.12
(0.15)
(0.03)
(0.16)
–
(0.16)
8.65 (0.34)
482,902
0.98
0.98
1.34
25Year ended 02/28/17
9.02
0.11
(0.12) (f)
(0.01)
(0.17)
–
(0.17)
8.84 (0.15) (f)
559,388
0.97
0.97
1.25
30C
lass C
Six m
onths ended 08/31/21 7.94
0.08
0.06
0.14
(0.09)
–
(0.09)
7.99 1.72
6,925
1.67 (d)
1.67 (d)
1.95 (d)
132Year ended 02/28/21
8.68
0.18
(0.67)
(0.49)
(0.25)
(0.00)
(0.25)
7.94
(5.35)
5,489
1.72
1.72
2.41
276
Year ended 02/29/20
8.50
0.29
0.22
0.51
(0.33)
–
(0.33)
8.68
6.09
9,556
1.75
1.75
3.33
97Year ended 02/28/19
8.65
0.20 (e)
(0.13)
0.07
(0.22)
–
(0.22)
8.50
0.78
9,862
1.76
1.83
2.37 (e)
119 (e)
Year ended 02/28/18
8.83
0.05
(0.13)
(0.08)
(0.10)
–
(0.10)
8.65
(0.97)
30,223
1.73
1.73
0.59
25Year ended 02/28/17
9.02
0.04
(0.13) (f)
(0.09)
(0.10)
–
(0.10)
8.83 (1.00) (f)
40,481
1.72
1.72
0.50
30
Class R
Six months ended 08/31/21
7.95
0.10
0.05
0.15
(0.11)
–
(0.11)
7.99
1.89
4,252
1.17 (d)
1.17 (d)
2.45 (d)
132
Year ended 02/28/21
8.69
0.22
(0.67)
(0.45)
(0.28)
(0.01)
(0.29)
7.95 (4.85)
3,832
1.22
1.22
2.91
276Year ended 02/29/20
8.52
0.33
0.21
0.54
(0.37)
–
(0.37)
8.69 6.48
4,443
1.25
1.25
3.83
97
Year ended 02/28/19
8.66
0.25 (e)
(0.13)
0.12
(0.26)
–
(0.26)
8.52 1.41
5,557
1.26
1.33
2.87 (e)
119 (e) Year ended 02/28/18
8.85
0.10
(0.15)
(0.05)
(0.14)
–
(0.14)
8.66 (0.58)
5,427
1.23
1.23
1.09
25
Year ended 02/28/17
9.03
0.09
(0.12) (f)
(0.03)
(0.15)
–
(0.15)
8.85
(0.39) (f)
6,219
1.22
1.22
1.00
30C
lass Y
Six m
onths ended 08/31/21 7.95
0.12
0.06
0.18
(0.13)
–
(0.13)
8.00 2.23
39,703
0.67 (d)
0.67 (d)
2.95 (d)
132Year ended 02/28/21
8.69
0.26
(0.67)
(0.41)
(0.32)
(0.01)
(0.33)
7.95
(4.37)
49,578
0.72
0.72
3.41
276
Year ended 02/29/20
8.52
0.38
0.21
0.59
(0.42)
–
(0.42)
8.69
7.02
10,540
0.75
0.75
4.33
97Year ended 02/28/19
8.67
0.29 (e)
(0.14)
0.15
(0.30)
–
(0.30)
8.52
1.80
9,674
0.76
0.83
3.37 (e)
119 (e)
Year ended 02/28/18
8.86
0.14
(0.15)
(0.01)
(0.18)
–
(0.18)
8.67
(0.08)
10,671
0.73
0.73
1.59
25Year ended 02/28/17
9.04
0.14
(0.13) (f)
0.01
(0.19)
–
(0.19)
8.86
0.11 (f)
12,554
0.72
0.72
1.50
30
Investor Class
Six months ended 08/31/21
7.95
0.11
0.06
0.17
(0.12)
–
(0.12)
8.00
2.14 (g)
18,954
0.83 (d)(g)
0.83 (d)(g)
2.79 (d)(g)
132Year ended 02/28/21
8.69
0.24
(0.67)
(0.43)
(0.30)
(0.01)
(0.31)
7.95
(4.55) (g)
19,552
0.89 (g)
0.89 (g)
3.24 (g)
276
Year ended 02/29/20
8.52
0.36
0.21
0.57
(0.40)
–
(0.40)
8.69
6.81 (g)
24,787
0.93 (g)
0.93 (g)
4.15 (g)
97Year ended 02/28/19
8.66
0.27 (e)
(0.13)
0.14
(0.28)
–
(0.28)
8.52
1.71 (g)
25,692
0.95 (g)
1.02 (g)
3.18 (e)(g)
119 (e) Year ended 02/28/18
8.85
0.12
(0.14)
(0.02)
(0.17)
–
(0.17)
8.66 (0.29) (g)
30,085
0.96 (g)
0.96 (g)
1.36 (g)
25
Year ended 02/28/17
9.03
0.12
(0.13) (f)
(0.01)
(0.17)
–
(0.17)
8.85
(0.12) (f)(g)
35,471
0.92 (g)
0.92 (g)
1.30 (g)
30
Class R
5
Six m
onths ended 08/31/21 7.94
0.13
0.05
0.18
(0.13)
–
(0.13)
7.99 2.28
456
0.50 (d)
0.50 (d)
3.12 (d)
132Year ended 02/28/21
8.68
0.26
(0.67)
(0.41)
(0.32)
(0.01)
(0.33)
7.94
(4.26)
388
0.57
0.57
3.56
276
Year ended 02/29/20
8.51
0.38
0.22
0.60
(0.43)
–
(0.43)
8.68
7.11
508
0.64
0.64
4.44
97
Year ended 02/28/19
8.66
0.30 (e)
(0.14)
0.16
(0.31)
–
(0.31)
8.51 1.87
946
0.70
0.73
3.43 (e)
119 (e) Year ended 02/28/18
8.85
0.15
(0.14)
0.01
(0.20)
–
(0.20)
8.66
0.04
615
0.58
0.58
1.74
25Year ended 02/28/17
9.03
0.14
(0.12) (f)
0.02
(0.20)
–
(0.20)
8.85
0.20 (f)
1,093
0.62
0.62
1.60
30C
lass R6
Six months ended 08/31/21
7.93
0.13
0.05
0.18
(0.13)
–
(0.13)
7.98
2.33
169,472
0.49 (d)
0.49 (d)
3.13 (d)
132Year ended 02/28/21
8.67
0.27
(0.67)
(0.40)
(0.33)
(0.01)
(0.34)
7.93
(4.23)
227,247
0.52
0.52
3.61
276Year ended 02/29/20
8.51
0.39
0.20
0.59
(0.43)
–
(0.43)
8.67 7.00
36
0.63
0.63
4.45
97
Year ended 02/28/19
8.66
0.30 (e)
(0.14)
0.16
(0.31)
–
(0.31)
8.51 1.88
42
0.69
0.70
3.44 (e)
119 (e) Period ended 02/28/18 (h)
8.84
0.14
(0.14)
(0.00)
(0.18)
–
(0.18)
8.66 (0.03)
6,663
0.57 (d)
0.57 (d)
1.75 (d)
25
(a) C
alculated using average shares outstanding.(b)
Includes adjustments in accordance w
ith accounting principles generally accepted in the United States of Am
erica and as such, the net asset value for financial reporting purposes and the returns based upon those net asset values may differ from
the net asset value and returns forshareholder transactions. D
oes not include sales charges and is not annualized for periods less than one year, if applicable.(c)
Portfolio turnover is calculated at the fund level and is not annualized for periods less than one year, if applicable.(d)
Annualized.

ˆ200F1$as8GpK0hRGÅŠ200F1$as8GpK0hRG¯
153547 EDG 14INVESCOINCOME
30-Oct-2021 14:35 ESTHTMDTF
Donnelley Financial LSWpf_rendNone
9*ESS 0C
LSWP64RS2321.10.7.0
ˆ200F1$as8GpK0hRGÅŠ200F1$as8GpK0hRG¯
153547 EDG 14INVESCOINCOME
30-Oct-2021 14:35 ESTHTMDTF
Donnelley Financial LSWpf_rendNone
9*ESS 0C
LSWP64RS2321.10.7.0
Page 2 of 2
(e) Effective July 26, 2018, the Fund m
odified certain investment policies utilized in achieving its investm
ent objective throughout the period. The Fund’s net investment incom
e and portfolio turnover have increased significantly due to the realignment of the Fund’s portfolio of investm
ents asa result of these changes.
(f) Includes litigation proceeds received during the period. H
ad the litigation proceeds not been received, Net gains (losses) on securities (both realized and unrealized) per share w
ould have been $(0.17), $(0.18), $(0.17), $(0.18), $(0.18) and $(0.17) for Class A, C
lass C, C
lass R, C
lass Y,Investor C
lass and Class R
5 shares, respectively and total returns would have been low
er.(g)
The total return, ratio of expenses to average net assets and ratio of net investment incom
e to average net assets reflect actual 12b-1 fees of 0.16%, 0.17%
, 0.19%, 0.19%
, 0.23% and 0.21%
for the six months ended August 31, 2021 and years ended February 28, 2021, February 29,
2020, February 28, 2019, February 28, 2018 and February 28, 2017, respectively.(h)
Com
mencem
ent date of April 4, 2017.
See accompanying N
otes to Financial Statements w
hich are an integral part of the financial statements.
14 Invesco Income Fund
ˆ200F1$as8GpK2zwG#Š200F1$as8GpK2zwG#
153547 EDG 15INVESCOINCOME
30-Oct-2021 14:35 ESTHTMDTF
Donnelley Financial LSWpf_rendNone
7*ESS 0C
LSWP64RS2321.10.7.0
Page 1 of 2
Notes to Financial StatementsAugust 31, 2021(Unaudited)
NOTE 1–Significant Accounting PoliciesInvesco Income Fund (the “Fund”), is a series portfolio of AIM Investment Securities Funds (Invesco Investment Securities Funds) (the“Trust”). The Trust is organized as a Delaware statutory trust and is registered under the Investment Company Act of 1940, as amended(the “1940 Act”), as an open-end series management investment company authorized to issue an unlimited number of shares of beneficialinterest. Information presented in these financial statements pertains only to the Fund. Matters affecting the Fund or each class will bevoted on exclusively by the shareholders of the Fund or each class.
The Fund’s investment objective is current income, and secondarily, capital appreciation.The Fund currently consists of seven different classes of shares: Class A, Class C, Class R, Class Y, Investor Class, Class R5 and
Class R6. Class Y and Investor Class shares are available only to certain investors. Class A shares are sold with a front-end sales chargeunless certain waiver criteria are met. Under certain circumstances, load waived shares may be subject to contingent deferred salescharges (“CDSC”). Class C shares are sold with a CDSC. Class R, Class Y, Investor Class, Class R5 and Class R6 shares are sold at netasset value. Class C shares held for eight years after purchase are eligible for automatic conversion into Class A shares of the same Fund(the “Conversion Feature”). The automatic conversion pursuant to the Conversion Feature will generally occur at the end of the monthfollowing the eighth anniversary after a purchase of Class C shares.
The Fund is an investment company and accordingly follows the investment company accounting and reporting guidance in accordancewith Financial Accounting Standards Board Accounting Standards Codification Topic 946, Financial Services – Investment Companies.
The following is a summary of the significant accounting policies followed by the Fund in the preparation of its financial statements.A. Security Valuations – Securities, including restricted securities, are valued according to the following policy.
Debt obligations (including convertible securities) and unlisted equities are fair valued using an evaluated quote provided by anindependent pricing service. Evaluated quotes provided by the pricing service may be determined without exclusive reliance on quotedprices, and may reflect appropriate factors such as institution-size trading in similar groups of securities, developments related tospecific securities, dividend rate (for unlisted equities), yield (for debt obligations), quality, type of issue, coupon rate (for debtobligations), maturity (for debt obligations), individual trading characteristics and other market data. Pricing services generally valuedebt obligations assuming orderly transactions of institutional round lot size, but a fund may hold or transact in the same securities insmaller, odd lot sizes. Odd lots often trade at lower prices than institutional round lots. Debt obligations are subject to interest rate andcredit risks. In addition, all debt obligations involve some risk of default with respect to interest and/or principal payments.
A security listed or traded on an exchange (except convertible securities) is valued at its last sales price or official closing price as ofthe close of the customary trading session on the exchange where the security is principally traded, or lacking any sales or officialclosing price on a particular day, the security may be valued at the closing bid price on that day. Securities traded in theover-the-counter market are valued based on prices furnished by independent pricing services or market makers. When such securitiesare valued by an independent pricing service they may be considered fair valued. Futures contracts are valued at the final settlementprice set by an exchange on which they are principally traded. Listed options are valued at the mean between the last bid and askedprices from the exchange on which they are principally traded. Options not listed on an exchange are valued by an independent sourceat the mean between the last bid and asked prices. For purposes of determining net asset value (“NAV”) per share, futures and optioncontracts generally are valued 15 minutes after the close of the customary trading session of the New York Stock Exchange (“NYSE”).
Investments in open-end and closed-end registered investment companies that do not trade on an exchange are valued at theend-of-day net asset value per share. Investments in open-end and closed-end registered investment companies that trade on anexchange are valued at the last sales price or official closing price as of the close of the customary trading session on the exchangewhere the security is principally traded.
Swap agreements are fair valued using an evaluated quote, if available, provided by an independent pricing service. Evaluatedquotes provided by the pricing service are valued based on a model which may include end-of-day net present values, spreads, ratings,industry, company performance and returns of referenced assets. Centrally cleared swap agreements are valued at the daily settlementprice determined by the relevant exchange or clearinghouse.
Foreign securities’ (including foreign exchange contracts) prices are converted into U.S. dollar amounts using the applicableexchange rates as of the close of the NYSE. If market quotations are available and reliable for foreign exchange-traded equitysecurities, the securities will be valued at the market quotations. Because trading hours for certain foreign securities end before theclose of the NYSE, closing market quotations may become unreliable. If between the time trading ends on a particular security and theclose of the customary trading session on the NYSE, events occur that the investment adviser determines are significant and make theclosing price unreliable, the Fund may fair value the security. If the event is likely to have affected the closing price of the security, thesecurity will be valued at fair value in good faith using procedures approved by the Board of Trustees. Adjustments to closing prices toreflect fair value may also be based on a screening process of an independent pricing service to indicate the degree of certainty, basedon historical data, that the closing price in the principal market where a foreign security trades is not the current value as of the close ofthe NYSE. Foreign securities’ prices meeting the approved degree of certainty that the price is not reflective of current value will bepriced at the indication of fair value from the independent pricing service. Multiple factors may be considered by the independent pricingservice in determining adjustments to reflect fair value and may include information relating to sector indices, American DepositaryReceipts and domestic and foreign index futures. Foreign securities may have additional risks including exchange rate changes,potential for sharply devalued currencies and high inflation, political and economic upheaval, the relative lack of issuer information,relatively low market liquidity and the potential lack of strict financial and accounting controls and standards.
Securities for which market prices are not provided by any of the above methods may be valued based upon quotes furnished byindependent sources. The last bid price may be used to value equity securities. The mean between the last bid and asked prices isused to value debt obligations, including corporate loans.
Securities for which market quotations are not readily available or became unreliable are valued at fair value as determined in goodfaith by or under the supervision of the Trust’s officers following procedures approved by the Board of Trustees. Issuer specific events,market trends, bid/asked quotes of brokers and information providers and other market data may be reviewed in the course of making agood faith determination of a security’s fair value.
The Fund may invest in securities that are subject to interest rate risk, meaning the risk that the prices will generally fall as interestrates rise and, conversely, the prices will generally rise as interest rates fall. Specific securities differ in their sensitivity to changes ininterest rates depending on their individual characteristics. Changes in interest rates may result in increased market volatility, whichmay affect the value and/or liquidity of certain Fund investments.
Valuations change in response to many factors including the historical and prospective earnings of the issuer, the value of theissuer’s assets, general market conditions which are not specifically related to the particular issuer, such as real or perceived adverseeconomic conditions, changes in the general outlook for revenues or corporate earnings, changes in interest or currency rates, regionalor global instability, natural or environmental disasters, widespread disease or other public health issues, war, acts of terrorism oradverse investor sentiment generally and market liquidity. Because of the inherent uncertainties of valuation, the values reflected in thefinancial statements may materially differ from the value received upon actual sale of those investments.
B. Securities Transactions and Investment Income – Securities transactions are accounted for on a trade date basis. Realized gains orlosses on sales are computed on the basis of specific identification of the securities sold. Interest income (net of withholding tax, if any)is recorded on an accrual basis from settlement date and includes coupon interest and amortization of premium and accretion ofdiscount on debt securities as applicable. Pay-in-kind interest income and non-cash dividend income received in the form of securitiesin-lieu of cash are recorded at the fair value of the securities received. Paydown gains and losses

ˆ200F1$as8GpK2zwG#Š200F1$as8GpK2zwG#
153547 EDG 15INVESCOINCOME
30-Oct-2021 14:35 ESTHTMDTF
Donnelley Financial LSWpf_rendNone
7*ESS 0C
LSWP64RS2321.10.7.0
ˆ200F1$as8GpK2zwG#Š200F1$as8GpK2zwG#
153547 EDG 15INVESCOINCOME
30-Oct-2021 14:35 ESTHTMDTF
Donnelley Financial LSWpf_rendNone
7*ESS 0C
LSWP64RS2321.10.7.0
Page 2 of 215 Invesco Income Fund
ˆ200F1$as8GpK5epomŠ200F1$as8GpK5epom
153547 EDG 16INVESCOINCOME
30-Oct-2021 14:35 ESTHTMDTF
Donnelley Financial LSWpf_rendNone
6*ESS 0C
LSWP64RS2321.10.7.0
Page 1 of 2
on mortgage and asset-backed securities are recorded as adjustments to interest income. Dividend income (net of withholding tax, ifany) is recorded on the ex-dividend date.
The Fund may periodically participate in litigation related to Fund investments. As such, the Fund may receive proceeds fromlitigation settlements. Any proceeds received are included in the Statement of Operations as realized gain (loss) for investments nolonger held and as unrealized gain (loss) for investments still held.
Brokerage commissions and mark ups are considered transaction costs and are recorded as an increase to the cost basis ofsecurities purchased and/or a reduction of proceeds on a sale of securities. Such transaction costs are included in the determination ofnet realized and unrealized gain (loss) from investment securities reported in the Statement of Operations and the Statement ofChanges in Net Assets and the net realized and unrealized gains (losses) on securities per share in the Financial Highlights.Transaction costs are included in the calculation of the Fund’s net asset value and, accordingly, they reduce the Fund’s total returns.These transaction costs are not considered operating expenses and are not reflected in net investment income reported in theStatement of Operations and the Statement of Changes in Net Assets, or the net investment income per share and the ratios ofexpenses and net investment income reported in the Financial Highlights, nor are they limited by any expense limitation arrangementsbetween the Fund and the investment adviser.
The Fund allocates income and realized and unrealized capital gains and losses to a class based on the relative net assets of eachclass.
The Fund recharacterizes distributions received from REIT investments based on information provided by the REIT into the followingcategories: ordinary income, long-term and short-term capital gains, and return of capital. If information is not available on a timelybasis from the REIT, the recharacterization will be based on available information which may include the previous year’s allocation. Ifnew or additional information becomes available from the REIT at a later date, a recharacterization will be made in the following year.The Fund records as dividend income the amount recharacterized as ordinary income and as realized gain the amount recharacterizedas capital gain in the Statement of Operations, and the amount recharacterized as return of capital as a reduction of the cost of therelated investment. These recharacterizations are reflected in the accompanying financial statements.
C. Country Determination – For the purposes of making investment selection decisions and presentation in the Schedule of Investments,the investment adviser may determine the country in which an issuer is located and/or credit risk exposure based on various factors.These factors include the laws of the country under which the issuer is organized, where the issuer maintains a principal office, thecountry in which the issuer derives 50% or more of its total revenues and the country that has the primary market for the issuer’ssecurities, as well as other criteria. Among the other criteria that may be evaluated for making this determination are the country inwhich the issuer maintains 50% or more of its assets, the type of security, financial guarantees and enhancements, the nature of thecollateral and the sponsor organization. Country of issuer and/or credit risk exposure has been determined to be the United States ofAmerica, unless otherwise noted.
D. Distributions – Distributions from net investment income, if any, are declared daily and paid monthly. Distributions from net realizedcapital gain, if any, are generally declared and paid annually and recorded on the ex-dividend date. The Fund may elect to treat aportion of the proceeds from redemptions as distributions for federal income tax purposes.
E. Federal Income Taxes – The Fund intends to comply with the requirements of Subchapter M of the Internal Revenue Code of 1986, asamended (the “Internal Revenue Code”), necessary to qualify as a regulated investment company and to distribute substantially all ofthe Fund’s taxable earnings to shareholders. As such, the Fund will not be subject to federal income taxes on otherwise taxable income(including net realized capital gain) that is distributed to shareholders. Therefore, no provision for federal income taxes is recorded inthe financial statements.
The Fund recognizes the tax benefits of uncertain tax positions only when the position is more likely than not to be sustained.Management has analyzed the Fund’s uncertain tax positions and concluded that no liability for unrecognized tax benefits should berecorded related to uncertain tax positions. Management is not aware of any tax positions for which it is reasonably possible that thetotal amounts of unrecognized tax benefits will change materially in the next 12 months.
The Fund files tax returns in the U.S. Federal jurisdiction and certain other jurisdictions. Generally, the Fund is subject toexaminations by such taxing authorities for up to three years after the filing of the return for the tax period.
F. Expenses – Fees provided for under the Rule 12b-1 plan of a particular class of the Fund are charged to the operations of such class.Transfer agency fees and expenses and other shareholder recordkeeping fees and expenses attributable to Class R5 and Class R6 areallocated based on relative net assets of Class R5 and Class R6. Sub-accounting fees attributable to Class R5 are charged to theoperations of the class. Transfer agency fees and expenses and other shareholder recordkeeping fees and expenses relating to allother classes are allocated among those classes based on relative net assets. All other expenses are allocated among the classesbased on relative net assets.
G. Accounting Estimates – The preparation of financial statements in conformity with accounting principles generally accepted in theUnited States of America (“GAAP”) requires management to make estimates and assumptions that affect the reported amounts ofassets and liabilities at the date of the financial statements and the reported amounts of revenues and expenses during the reportingperiod including estimates and assumptions related to taxation. Actual results could differ from those estimates by a significant amount.In addition, the Fund monitors for material events or transactions that may occur or become known after the period-end date and beforethe date the financial statements are released to print.
H. Indemnifications – Under the Trust’s organizational documents, each Trustee, officer, employee or other agent of the Trust isindemnified against certain liabilities that may arise out of the performance of their duties to the Fund. Additionally, in the normal courseof business, the Fund enters into contracts, including the Fund’s servicing agreements, that contain a variety of indemnification clauses.The Fund’s maximum exposure under these arrangements is unknown as this would involve future claims that may be made againstthe Fund that have not yet occurred. The risk of material loss as a result of such indemnification claims is considered remote.
I. Commercial Mortgage-Backed Securities – The Fund may invest in both single and multi-issuer Commercial Mortgage-BackedSecurities (“CMBS”). This includes both investment grade and non-investment grade CMBS as well as other non-rated CMBS. A CMBSis a type of mortgage-backed security that is secured by one or more mortgage loans on interests in commercial real estate property.CMBS differ from conventional debt securities because principal is paid back over the life of the security rather than at maturity.Investments in CMBS are subject to the various risks which relate to the pool of underlying assets in which the CMBS represents aninterest. Securities backed by commercial real estate assets are subject to securities market risks as well as risks similar to those ofdirect ownership of commercial real estate loans. Risks include the ability of a borrower to meet its obligations on the loan which couldlead to default or foreclosure of the property. Such actions may impact the amount of proceeds ultimately derived from the loan, and thetiming of receipt of such proceeds.
Management estimates future expected cash flows at the time of purchase based on the anticipated repayment dates on the CMBS.Subsequent changes in expected cash flow projection may result in a prospective change in the timing or character of incomerecognized on these securities, or the amortized cost of these securities. The Fund amortizes premiums and/or accretes discountsbased on the projected cash flows. Realized and unrealized gains and losses on CMBS are included in the Statement of Operations asNet realized gain (loss) from unaffiliated investment securities and Change in net unrealized appreciation (depreciation)of unaffiliatedinvestment securities, respectively.
J. Securities Lending – The Fund may lend portfolio securities having a market value up to one-third of the Fund’s total assets. Suchloans are secured by collateral equal to no less than the market value of the loaned securities determined daily by the securities lendingprovider. Such collateral will be cash or debt securities issued or guaranteed by the U.S. Government or any of its sponsored agencies.Cash collateral received in connection with these loans is invested in short-term money market instruments or affiliated money marketfunds and is shown as such on the Schedule of Investments. The Fund bears the risk of loss with respect to the investment ofcollateral. It is the Fund’s policy to obtain additional collateral from or return excess collateral to the borrower by the end of the nextbusiness day, following the valuation date of the securities loaned. Therefore, the value of the collateral held may be temporarily lessthan the value of the securities on loan. When loaning securities, the Fund retains certain benefits of owning the securities, includingthe economic equivalent of dividends or interest

ˆ200F1$as8GpK5epomŠ200F1$as8GpK5epom
153547 EDG 16INVESCOINCOME
30-Oct-2021 14:35 ESTHTMDTF
Donnelley Financial LSWpf_rendNone
6*ESS 0C
LSWP64RS2321.10.7.0
ˆ200F1$as8GpK5epomŠ200F1$as8GpK5epom
153547 EDG 16INVESCOINCOME
30-Oct-2021 14:35 ESTHTMDTF
Donnelley Financial LSWpf_rendNone
6*ESS 0C
LSWP64RS2321.10.7.0
Page 2 of 2 16 Invesco Income Fund
ˆ200F1$as8GpK6n&G+Š200F1$as8GpK6n&G+
153547 EDG 17INVESCOINCOME
30-Oct-2021 14:35 ESTHTMDTF
Donnelley Financial LSWpf_rendNone
5*ESS 0C
LSWP64RS2321.10.7.0
Page 1 of 1
generated by the security. Lending securities entails a risk of loss to the Fund if, and to the extent that, the market value of thesecurities loaned were to increase and the borrower did not increase the collateral accordingly, and the borrower failed to return thesecurities. The securities loaned are subject to termination at the option of the borrower or the Fund. Upon termination, the borrower willreturn to the Fund the securities loaned and the Fund will return the collateral. Upon the failure of the borrower to return the securities,collateral may be liquidated and the securities may be purchased on the open market to replace the loaned securities. The Fund couldexperience delays and costs in gaining access to the collateral and the securities may lose value during the delay which could result inpotential losses to the Fund. Some of these losses may be indemnified by the lending agent. The Fund bears the risk of any deficiencyin the amount of the collateral available for return to the borrower due to any loss on the collateral invested. Dividends received on cashcollateral investments for securities lending transactions, which are net of compensation to counterparties, are included in Dividendsfrom affiliated money market funds on the Statement of Operations. The aggregate value of securities out on loan, if any, is shown as afootnote on the Statement of Assets and Liabilities.
K. Foreign Currency Translations – Foreign currency is valued at the close of the NYSE based on quotations posted by banks andmajor currency dealers. Portfolio securities and other assets and liabilities denominated in foreign currencies are translated into U.S.dollar amounts at the date of valuation. Purchases and sales of portfolio securities (net of foreign taxes withheld on disposition) andincome items denominated in foreign currencies are translated into U.S. dollar amounts on the respective dates of such transactions.The Fund does not separately account for the portion of the results of operations resulting from changes in foreign exchange rates oninvestments and the fluctuations arising from changes in market prices of securities held. The combined results of changes in foreignexchange rates and the fluctuation of market prices on investments (net of estimated foreign tax withholding) are included with the netrealized and unrealized gain or loss from investments in the Statement of Operations. Reported net realized foreign currency gains orlosses arise from (1) sales of foreign currencies, (2) currency gains or losses realized between the trade and settlement dates onsecurities transactions, and (3) the difference between the amounts of dividends, interest, and foreign withholding taxes recorded onthe Fund’s books and the U.S. dollar equivalent of the amounts actually received or paid. Net unrealized foreign currency gains andlosses arise from changes in the fair values of assets and liabilities, other than investments in securities at fiscal period end, resultingfrom changes in exchange rates.
The Fund may invest in foreign securities, which may be subject to foreign taxes on income, gains on investments or currencyrepatriation, a portion of which may be recoverable. Foreign taxes, if any, are recorded based on the tax regulations and rates that existin the foreign markets in which the Fund invests and are shown in the Statement of Operations.
L. Forward Foreign Currency Contracts – The Fund may engage in foreign currency transactions either on a spot (i.e. for promptdelivery and settlement) basis, or through forward foreign currency contracts, to manage or minimize currency or exchange rate risk.
The Fund may also enter into forward foreign currency contracts for the purchase or sale of a security denominated in a foreigncurrency in order to “lock in” the U.S. dollar price of that security, or the Fund may also enter into forward foreign currency contracts thatdo not provide for physical settlement of the two currencies, but instead are settled by a single cash payment calculated as thedifference between the agreed upon exchange rate and the spot rate at settlement based upon an agreed upon notional amount(non-deliverable forwards). The Fund will set aside liquid assets in an amount equal to the daily mark-to-market obligation for forwardforeign currency contracts.
A forward foreign currency contract is an obligation between two parties (“Counterparties”) to purchase or sell a specific currency foran agreed-upon price at a future date. The use of forward foreign currency contracts does not eliminate fluctuations in the price of theunderlying securities the Fund owns or intends to acquire but establishes a rate of exchange in advance. Fluctuations in the value ofthese contracts are measured by the difference in the contract date and reporting date exchange rates and are recorded as unrealizedappreciation (depreciation) until the contracts are closed. When the contracts are closed, realized gains (losses) are recorded. Realizedand unrealized gains (losses) on the contracts are included in the Statement of Operations. The primary risks associated with forwardforeign currency contracts include failure of the Counterparty to meet the terms of the contract and the value of the foreign currencychanging unfavorably. These risks may be in excess of the amounts reflected in the Statement of Assets and Liabilities.
M. Futures Contracts – The Fund may enter into futures contracts to manage exposure to interest rate, equity and market pricemovements and/or currency risks. A futures contract is an agreement between Counterparties to purchase or sell a specified underlyingsecurity, currency or commodity (or delivery of a cash settlement price, in the case of an index future) for a fixed price at a future date.The Fund currently invests only in exchange-traded futures and they are standardized as to maturity date and underlying financialinstrument. Initial margin deposits required upon entering into futures contracts are satisfied by the segregation of specific securities orcash as collateral at the futures commission merchant (broker). During the period the futures contracts are open, changes in the valueof the contracts are recognized as unrealized gains or losses by recalculating the value of the contracts on a daily basis. Subsequent orvariation margin payments are received or made depending upon whether unrealized gains or losses are incurred. These amounts arereflected as receivables or payables on the Statement of Assets and Liabilities. When the contracts are closed or expire, the Fundrecognizes a realized gain or loss equal to the difference between the proceeds from, or cost of, the closing transaction and the Fund’sbasis in the contract. The net realized gain (loss) and the change in unrealized gain (loss) on futures contracts held during the period isincluded on the Statement of Operations. The primary risks associated with futures contracts are market risk and the absence of aliquid secondary market. If the Fund were unable to liquidate a futures contract and/or enter into an offsetting closing transaction, theFund would continue to be subject to market risk with respect to the value of the contracts and continue to be required to maintain themargin deposits on the futures contracts. Futures contracts have minimal Counterparty risk since the exchange’s clearinghouse, asCounterparty to all exchange-traded futures, guarantees the futures against default. Risks may exceed amounts recognized in theStatement of Assets and Liabilities.
N. Swap Agreements – The Fund may enter into various swap transactions, including interest rate, total return, index, currency and creditdefault swap contracts (“CDS”) for investment purposes or to manage interest rate, currency or credit risk. Such transactions areagreements between Counterparties. A swap agreement may be negotiated bilaterally and traded over-the-counter (“OTC”) betweentwo parties (“uncleared/ OTC”) or, in some instances, must be transacted through a future commission merchant (“FCM”) and clearedthrough a clearinghouse that serves as a central Counterparty (“centrally cleared swap”). These agreements may contain among otherconditions, events of default and termination events, and various covenants and representations such as provisions that require theFund to maintain a pre-determined level of net assets, and/ or provide limits regarding the decline of the Fund’s NAV over specificperiods of time. If the Fund were to trigger such provisions and have open derivative positions at that time, the Counterparty may beable to terminate such agreement and request immediate payment in an amount equal to the net liability positions, if any.
Interest rate, total return, index, and currency swap agreements are two-party contracts entered into primarily to exchange thereturns (or differentials in rates of returns) earned or realized on particular predetermined investments or instruments. The gross returnsto be exchanged or “swapped” between the parties are calculated with respect to a notional amount, i.e., the return on or increase invalue of a particular dollar amount invested at a particular interest rate or return of an underlying asset, in a particular foreign currency,or in a “basket” of securities representing a particular index.
In a centrally cleared swap, the Fund’s ultimate Counterparty is a central clearinghouse. The Fund initially will enter into centrallycleared swaps through an executing broker. When a fund enters into a centrally cleared swap, it must deliver to the centralCounterparty (via the FCM) an amount referred to as “initial margin.” Initial margin requirements are determined by the centralCounterparty, but an FCM may require additional initial margin above the amount required by the central Counterparty. Initial margindeposits required upon entering into centrally cleared swaps are satisfied by cash or securities as collateral at the FCM. Securitiesdeposited as initial margin are designated on the Schedule of Investments and cash deposited is recorded on the Statement of Assetsand Liabilities. During the term of a cleared swap agreement, a “variation margin” amount may be required to be paid by the Fund ormay be received by the Fund, based on the daily change in price of the underlying reference instrument subject to the swap agreementand is recorded as a receivable or payable for variation margin in the Statement of Assets and Liabilities until the centrally cleared swapis terminated at which time a realized gain or loss is recorded.
17 Invesco Income Fund
ˆ200F1$as8GpK7xGo_Š200F1$as8GpK7xGo_
153547 EDG 18INVESCOINCOME
30-Oct-2021 14:35 ESTHTMDTF
Donnelley Financial LSWpf_rendNone
5*ESS 0C
LSWP64RS2321.10.7.0
Page 1 of 2A CDS is an agreement between Counterparties to exchange the credit risk of an issuer. A buyer of a CDS is said to buy protection
by paying a fixed payment over the life of the agreement and in some situations an upfront payment to the seller of the CDS. If adefined credit event occurs (such as payment default or bankruptcy), the Fund as a protection buyer would cease paying its fixedpayment, the Fund would deliver eligible bonds issued by the reference entity to the seller, and the seller would pay the full notionalvalue, or the “par value”, of the referenced obligation to the Fund. A seller of a CDS is said to sell protection and thus would receive afixed payment over the life of the agreement and an upfront payment, if applicable. If a credit event occurs, the Fund as a protectionseller would cease to receive the fixed payment stream, the Fund would pay the buyer “par value” or the full notional value of thereferenced obligation, and the Fund would receive the eligible bonds issued by the reference entity. In turn, these bonds may be sold inorder to realize a recovery value. Alternatively, the seller of the CDS and its Counterparty may agree to net the notional amount and themarket value of the bonds and make a cash payment equal to the difference to the buyer of protection. If no credit event occurs, theFund receives the fixed payment over the life of the agreement. As the seller, the Fund would effectively add leverage to its portfoliobecause, in addition to its total net assets, the Fund would be subject to investment exposure on the notional amount of the CDS. Inconnection with these agreements, cash and securities may be identified as collateral in accordance with the terms of the respectiveswap agreements to provide assets of value and recourse in the event of default under the swap agreement or bankruptcy/insolvencyof a party to the swap agreement. If a Counterparty becomes bankrupt or otherwise fails to perform its obligations due to financialdifficulties, the Fund may experience significant delays in obtaining any recovery in a bankruptcy or other reorganization proceeding.The Fund may obtain only limited recovery or may obtain no recovery in such circumstances. The Fund’s maximum risk of loss fromCounterparty risk, either as the protection seller or as the protection buyer, is the value of the contract. The risk may be mitigated byhaving a master netting arrangement between the Fund and the Counterparty and by the designation of collateral by the Counterpartyto cover the Fund’s exposure to the Counterparty.
Implied credit spreads represent the current level at which protection could be bought or sold given the terms of the existing CDScontract and serve as an indicator of the current status of the payment/performance risk of the CDS. An implied spread that haswidened or increased since entry into the initial contract may indicate a deteriorating credit profile and increased risk of default for thereference entity. A declining or narrowing spread may indicate an improving credit profile or decreased risk of default for the referenceentity. Alternatively, credit spreads may increase or decrease reflecting the general tolerance for risk in the credit markets.
An interest rate swap is an agreement between Counterparties pursuant to which the parties exchange a floating rate payment for afixed rate payment based on a specified notional amount.
Changes in the value of centrally cleared and OTC swap agreements are recognized as unrealized gains (losses) in the Statementof Operations by “marking to market” on a daily basis to reflect the value of the swap agreement at the end of each trading day.Payments received or paid at the beginning of the agreement are reflected as such on the Statement of Assets and Liabilities and maybe referred to as upfront payments. The Fund accrues for the fixed payment stream and amortizes upfront payments, if any, on swapagreements on a daily basis with the net amount, recorded as a component of realized gain (loss) on the Statement of Operations. Aliquidation payment received or made at the termination of a swap agreement is recorded as realized gain (loss) on the Statement ofOperations. The Fund segregates cash or liquid securities having a value at least equal to the amount of the potential obligation of aFund under any swap transaction. Cash held as collateral is recorded as deposits with brokers on the Statement of Assets andLiabilities. Entering into these agreements involves, to varying degrees, lack of liquidity and elements of credit, market, andCounterparty risk in excess of amounts recognized on the Statement of Assets and Liabilities. Such risks involve the possibility that aswap is difficult to sell or liquidate; the Counterparty does not honor its obligations under the agreement and unfavorable interest ratesand market fluctuations. It is possible that developments in the swaps market, including potential government regulation, couldadversely affect the Fund’s ability to terminate existing swap agreements or to realize amounts to be received under such agreements.Additionally, an International Swaps and Derivatives Association Master Agreement (“ISDA Master Agreement”) includes credit relatedcontingent features which allow Counterparties to OTC derivatives to terminate derivative contracts prior to maturity in the event that,for example, the Fund’s net assets decline by a stated percentage or the Fund fails to meet the terms of its ISDA Master Agreement,which would cause the Fund to accelerate payment of any net liability owed to the Counterparty. A short position in a security posesmore risk than holding the same security long. As there is no limit on how much the price of the security can increase, the Fund’sexposure is unlimited.
Notional amounts of each individual credit default swap agreement outstanding as of August 31, 2021 for which the Fund is the sellerof protection are disclosed in the open swap agreements table. These potential amounts would be partially offset by any recoveryvalues of the respective referenced obligations, upfront payments received upon entering into the agreement, or net amounts receivedfrom the settlement of buy protection credit default swap agreements entered into by the Fund for the same referenced entity or entities.
O. Dollar Rolls and Forward Commitment Transactions – The Fund may enter into dollar roll transactions to enhance the Fund’sperformance. The Fund executes its dollar roll transactions in the to be announced (“TBA”) market whereby the Fund makes a forwardcommitment to purchase a security and, instead of accepting delivery, the position is offset by the sale of the security with asimultaneous agreement to repurchase at a future date.
The Fund accounts for dollar roll transactions as purchases and sales and realizes gains and losses on these transactions. Thesetransactions increase the Fund’s portfolio turnover rate. The Fund will segregate liquid assets in an amount equal to its dollar rollcommitments.
Dollar roll transactions involve the risk that a Counterparty to the transaction may fail to complete the transaction. If this occurs, theFund may lose the opportunity to purchase or sell the security at the agreed upon price. Dollar roll transactions also involve the risk thatthe value of the securities retained by the Fund may decline below the price of the securities that the Fund has sold but is obligated topurchase under the agreement. Dollar roll transactions covered in this manner are not treated as senior securities for purposes of aFund’s fundamental investment limitation on senior securities and borrowings.
P. LIBOR Risk – The Fund may invest in financial instruments that utilize LIBOR as the reference or benchmark rate for variable interestrate calculations. On July 27, 2017, the head of the United Kingdom’s Financial Conduct Authority announced a desire to phase out theuse of LIBOR by the end of 2021. Although many LIBOR rates will be phased out at the end of 2021 as originally intended, a selectionof widely used USD LIBOR rates will continue to be published until June 2023 in order to assist with the transition. There remainsuncertainty regarding the effect of the LIBOR transition process and therefore any impact of a transition away from LIBOR on the Fundor the instruments in which the Fund invests cannot yet be determined. There is no assurance that the composition or characteristics ofany alternative reference rate will be similar to or produce the same value or economic equivalence as LIBOR or that instruments usingan alternative rate will have the same volume or liquidity. Any such effects of the transition away from LIBOR and the adoption ofalternative reference rates could result in losses to the Fund.
Q. Collateral – To the extent the Fund has designated or segregated a security as collateral and that security is subsequently sold, it is theFund’s practice to replace such collateral no later than the next business day. This practice does not apply to securities pledged ascollateral for securities lending transactions.
R. Other Risks – The Fund may invest in obligations issued by agencies and instrumentalities of the U.S. Government that may vary inthe level of support they receive from the government. The government may choose not to provide financial support to governmentsponsored agencies or instrumentalities if it is not legally obligated to do so. In this case, if the issuer defaulted, the Fund may not beable to recover its investment in such issuer from the U.S. Government. Many securities purchased by the Fund are not guaranteed bythe U.S. Government.
The current low interest rate environment was created in part by the Federal Reserve Board (FRB) and certain foreign central bankskeeping the federal funds and equivalent foreign rates near historical lows. Increases in the federal funds and equivalent foreign ratesmay expose fixed income markets to heightened volatility and reduced liquidity for certain fixed income investments, particularly thosewith longer maturities. In addition, decreases in fixed income dealer market-making capacity may also potentially lead to heightenedvolatility and reduced liquidity in the fixed income markets. As a result, the value of the Fund’s investments and share price maydecline. Changes in central bank policies could also result in higher than normal shareholder redemptions, which could potentiallyincrease portfolio turnover and the Fund’s transaction costs.

ˆ200F1$as8GpK7xGo_Š200F1$as8GpK7xGo_
153547 EDG 18INVESCOINCOME
30-Oct-2021 14:35 ESTHTMDTF
Donnelley Financial LSWpf_rendNone
5*ESS 0C
LSWP64RS2321.10.7.0
ˆ200F1$as8GpK7xGo_Š200F1$as8GpK7xGo_
153547 EDG 18INVESCOINCOME
30-Oct-2021 14:35 ESTHTMDTF
Donnelley Financial LSWpf_rendNone
5*ESS 0C
LSWP64RS2321.10.7.0
Page 2 of 2 18 Invesco Income Fund
ˆ200F1$as8GpKB9no,Š200F1$as8GpKB9no,
153547 EDG 19INVESCOINCOME
30-Oct-2021 14:35 ESTHTMDTF
Donnelley Financial LSWpf_rendNone
6*ESS 0C
LSWP64RS2321.10.7.0
Page 1 of 1CLOs are subject to the risks of substantial losses due to actual defaults by underlying borrowers, which will be greater during
periods of economic or financial stress. CLOs may also lose value due to collateral defaults and disappearance of subordinatetranches, market anticipation of defaults, and investor aversion to CLO securities as a class. The risks of CLOs will be greater if theFund invests in CLOs that hold loans of uncreditworthy borrowers or if the Fund holds subordinate tranches of the CLO that absorbslosses from the defaults before senior tranches. In addition, CLOs are subject to interest rate risk and credit risk.
The market values of convertible securities are affected by market interest rates, the risk of actual issuer default on interest orprincipal payments and the value of the underlying common stock into which the convertible security may be converted. Additionally, aconvertible security is subject to the same types of market and issuer risks as apply to the underlying common stock. In addition, certainconvertible securities are subject to involuntary conversions and may undergo principal write-downs upon the occurrence of certaintriggering events, and, as a result, are subject to an increased risk of loss. Convertible securities may be rated below investment grade.
Emerging markets (also referred to as developing markets) are generally subject to greater market volatility, political, social andeconomic instability, uncertainty regarding the existence of trading markets and more governmental limitations on foreign investmentthan more developed markets. In addition, companies operating in emerging markets may be subject to lower trading volume andgreater price fluctuations than companies in more developed markets. Securities law in many emerging market countries is relativelynew and unsettled. Therefore, laws regarding foreign investment in emerging market securities, securities regulation, title to securities,and shareholder rights may change quickly and unpredictably. In addition, the enforcement of systems of taxation at federal, regionaland local levels in emerging market countries may be inconsistent, and subject to sudden change. Other risks of investing in emergingmarkets securities may include additional transaction costs, delays in settlement procedures, and lack of timely information.
The Fund may invest in lower-quality debt securities, i.e., “junk bonds”. Investments in lower-rated securities or unrated securities ofcomparable quality tend to be more sensitive to economic conditions than higher rated securities. Junk bonds involve a greater risk ofdefault by the issuer because such securities are generally unsecured and are often subordinated to other creditors’ claims.
Mortgage- and asset-backed securities, including collateralized debt obligations and collateralized mortgage obligations, are subjectto prepayment or call risk, which is the risk that a borrower’s payments may be received earlier or later than expected due to changes inprepayment rates on underlying loans. This could result in the Fund reinvesting these early payments at lower interest rates, therebyreducing the Fund’s income. Mortgage- and asset-backed securities also are subject to extension risk, which is the risk that anunexpected rise in interest rates could reduce the rate of prepayments, causing the price of the mortgage- and asset-backed securitiesand the Fund’s share price to fall. An unexpectedly high rate of defaults on the mortgages held by a mortgage pool may adversely affectthe value of mortgage-backed securities and could result in losses to the Fund. Privately-issued mortgage-backed securities and asset-backed securities may be less liquid than other types of securities and the Fund may be unable to sell these securities at the time orprice it desires.
The risk of a municipal obligation generally depends on the financial and credit status of the issuer. Constitutional amendments,legislative enactments, executive orders, administrative regulations, voter initiatives, and the issuer’s regional economic conditions mayaffect the municipal security’s value, interest payments, repayment of principal and the Fund’s ability to sell the security. Failure of amunicipal security issuer to comply with applicable tax requirements may make income paid thereon taxable, resulting in a decline inthe security’s value. In addition, there could be changes in applicable tax laws or tax treatments that reduce or eliminate the currentfederal income tax exemption on municipal securities or otherwise adversely affect the current federal or state tax status of municipalsecurities.
Preferred securities are subject to issuer-specific and market risks applicable generally to equity securities. Preferred securities alsomay be subordinated to bonds or other debt instruments, subjecting them to a greater risk of non-payment, may be less liquid thanmany other securities, such as common stocks, and generally offer no voting rights with respect to the issuer.
The Fund’s investments are concentrated in a comparatively narrow segment of the economy. Consequently, the Fund may tend tobe more volatile than other mutual funds, and the value of the Fund’s investments may tend to rise and fall more rapidly.
Because the Fund concentrates its assets in the real estate industry, an investment in the Fund will be closely linked to theperformance of the real estate markets. Property values may fall due to increasing vacancies or declining rents resulting fromeconomic, legal, cultural or technological developments.
Active trading of portfolio securities may result in added expenses, a lower return and increased tax liability.S. COVID-19 Risk – The COVID-19 strain of coronavirus has resulted in instances of market closures and dislocations, extreme volatility,
liquidity constraints and increased trading costs. Efforts to contain its spread have resulted in travel restrictions, disruptions ofhealthcare systems, business operations and supply chains, layoffs, lower consumer demand, and defaults, among other significanteconomic impacts that have disrupted global economic activity across many industries. Such economic impacts may exacerbate otherpre-existing political, social and economic risks locally or globally.
The ongoing effects of COVID-19 are unpredictable and may result in significant and prolonged effects on the Fund’s performance.
NOTE 2–Advisory Fees and Other Fees Paid to Affiliates
The Trust has entered into a master investment advisory agreement with Invesco Advisers, Inc. (the “Adviser” or “Invesco”). Under theterms of the investment advisory agreement, the Fund accrues daily and pays monthly an advisory fee to the Adviser based on the annualrate of the Fund’s average daily net assets as follows:
Average Daily Net Assets Rate
First $200 million 0.500%
Next $300 million 0.400%
Next $500 million 0.350%
Next $19.5 billion 0.300%
Over $20.5 billion 0.240%
For the six months ended August 31, 2021, the effective advisory fee rate incurred by the Fund was 0.43%.Under the terms of a master sub-advisory agreement between the Adviser and each of Invesco Asset Management Deutschland GmbH,
Invesco Asset Management Limited, Invesco Asset Management (Japan) Limited, Invesco Hong Kong Limited, Invesco Senior SecuredManagement, Inc. and Invesco Canada Ltd. (collectively, the “Affiliated Sub-Advisers”) the Adviser, not the Fund, will pay 40% of the feespaid to the Adviser to any such Affiliated Sub-Adviser(s) that provide(s) discretionary investment management services to the Fund basedon the percentage of assets allocated to such Affiliated Sub-Adviser(s).
The Adviser has contractually agreed, through at least June 30, 2022, to waive advisory fees and/or reimburse expenses of all shares tothe extent necessary to limit total annual fund operating expenses after fee waiver and/or expense reimbursement (excluding certain itemsdiscussed below) of Class A, Class C, Class R, Class Y, Investor Class, Class R5 and Class R6 shares to 1.50%, 2.25%, 1.75%, 1.25%,1.50%, 1.25% and 1.25%, respectively, of the Fund’s average daily net assets (the “expense limits”). In determining the Adviser’s obligationto waive advisory fees and/or reimburse expenses, the following expenses are not taken into account, and could cause the total annualfund operating expenses after fee waiver and/or reimbursement to exceed the numbers reflected above: (1) interest; (2) taxes; (3) dividendexpense on short sales; (4) extraordinary or non-routine items, including litigation expenses; and (5) expenses that the Fund has incurredbut did not actually pay because of an expense offset arrangement. Unless Invesco continues the fee waiver agreement, it will terminate onJune 30, 2022. During its term, the fee waiver agreement cannot be terminated or amended to increase the expense limits or reduce theadvisory fee waivers without approval of the Board of Trustees. The Adviser did not waive fees and/or reimburse expenses during theperiod under these expense limits. 19 Invesco Income Fund
ˆ200F1$as8GpKClRo*Š200F1$as8GpKClRo*
153547 EDG 20INVESCOINCOME
30-Oct-2021 14:35 ESTHTMDTF
Donnelley Financial LSWpf_rendNone
5*ESS 0C
LSWP64RS2321.10.7.0
Page 1 of 1Further, the Adviser has contractually agreed, through at least June 30, 2023, to waive the advisory fee payable by the Fund in an
amount equal to 100% of the net advisory fees the Adviser receives from the affiliated money market funds on investments by the Fund ofuninvested cash (excluding investments of cash collateral from securities lending) in such affiliated money market funds.
For the six months ended August 31, 2021, the Adviser waived advisory fees of $247.The Trust has entered into a master administrative services agreement with Invesco pursuant to which the Fund has agreed to pay
Invesco for certain administrative costs incurred in providing accounting services to the Fund. For the six months ended August 31, 2021,expenses incurred under the agreement are shown in the Statement of Operations as Administrative services fees. Invesco has enteredinto a sub-administration agreement whereby State Street Bank and Trust Company (“SSB”) serves as fund accountant and providescertain administrative services to the Fund. Pursuant to a custody agreement with the Trust on behalf of the Fund, SSB also serves as theFund’s custodian.
The Trust has entered into a transfer agency and service agreement with Invesco Investment Services, Inc. (“IIS”) pursuant to which theFund has agreed to pay IIS a fee for providing transfer agency and shareholder services to the Fund and reimburse IIS for certain expensesincurred by IIS in the course of providing such services. IIS may make payments to intermediaries that provide omnibus account services,sub-accounting services and/or networking services. All fees payable by IIS to intermediaries that provide omnibus account services orsub-accounting services are charged back to the Fund, subject to certain limitations approved by the Trust’s Board of Trustees. For the sixmonths ended August 31, 2021, expenses incurred under the agreement are shown in the Statement of Operations as Transfer agent fees.
The Trust has entered into master distribution agreements with Invesco Distributors, Inc. (“IDI”) to serve as the distributor for the Class A,Class C, Class R, Class Y, Investor Class, Class R5 and Class R6 shares of the Fund. The Trust has adopted plans pursuant to Rule 12b-1under the 1940 Act with respect to the Fund’s Class A, Class C, Class R and Investor Class shares (collectively, the “Plans”). The Fund,pursuant to the Plans, pays IDI compensation at the annual rate of 0.25% of the Fund’s average daily net assets of Class A shares, 1.00%of the average daily net assets of Class C shares and 0.50% of the average daily net assets of Class R shares. The Fund, pursuant to theInvestor Class Plan, reimburses IDI for its allocated share of expenses incurred pursuant to the Investor Class Plan for the period, up to amaximum annual rate of 0.25% of the average daily net assets of Investor Class shares. The fees are accrued daily and paid monthly. Ofthe Plan payments, up to 0.25% of the average daily net assets of each class of shares may be paid to furnish continuing personalshareholder services to customers who purchase and own shares of such classes. Any amounts not paid as a service fee under the Planswould constitute an asset-based sales charge. Rules of the Financial Industry Regulatory Authority (“FINRA”) impose a cap on the totalsales charges, including asset-based sales charges, that may be paid by any class of shares of the Fund. For the six months endedAugust 31, 2021, expenses incurred under the Plans are shown in the Statement of Operations as Distribution fees.
Front-end sales commissions and CDSC (collectively, the “sales charges”) are not recorded as expenses of the Fund. Front-end salescommissions are deducted from proceeds from the sales of Fund shares prior to investment in Class A shares of the Fund. CDSC arededucted from redemption proceeds prior to remittance to the shareholder. During the six months ended August 31, 2021, IDI advised theFund that IDI retained $7,557 in front-end sales commissions from the sale of Class A shares and $207 and $386 from Class A and Class Cshares, respectively, for CDSC imposed upon redemptions by shareholders.
Certain officers and trustees of the Trust are officers and directors of the Adviser, IIS and/or IDI.
NOTE 3–Additional Valuation Information
GAAP defines fair value as the price that would be received to sell an asset or paid to transfer a liability in an orderly transaction betweenmarket participants at the measurement date, under current market conditions. GAAP establishes a hierarchy that prioritizes the inputs tovaluation methods, giving the highest priority to readily available unadjusted quoted prices in an active market for identical assets (Level 1)and the lowest priority to significant unobservable inputs (Level 3), generally when market prices are not readily available or are unreliable.Based on the valuation inputs, the securities or other investments are tiered into one of three levels. Changes in valuation methods mayresult in transfers in or out of an investment’s assigned level: Level 1 – Prices are determined using quoted prices in an active market for identical assets. Level 2 –
Prices are determined using other significant observable inputs. Observable inputs are inputs that other market participantsmay use in pricing a security. These may include quoted prices for similar securities, interest rates, prepayment speeds, creditrisk, yield curves, loss severities, default rates, discount rates, volatilities and others.
Level 3 –
Prices are determined using significant unobservable inputs. In situations where quoted prices or observable inputs areunavailable (for example, when there is little or no market activity for an investment at the end of the period), unobservableinputs may be used. Unobservable inputs reflect the Fund’s own assumptions about the factors market participants would usein determining fair value of the securities or instruments and would be based on the best available information.
The following is a summary of the tiered valuation input levels, as of August 31, 2021. The level assigned to the securities valuations maynot be an indication of the risk or liquidity associated with investing in those securities. Because of the inherent uncertainties of valuation,the values reflected in the financial statements may materially differ from the value received upon actual sale of those investments.
Level 1 Level 2 Level 3 Total
Investments in Securities
Asset-Backed Securities $ – $438,519,429 $– $438,519,429
U.S. Government Sponsored Agency Mortgage-Backed Securities – 100,580,850 – 100,580,850
Agency Credit Risk Transfer Notes – 54,714,815 – 54,714,815
Preferred Stocks 28,442,000 – – 28,442,000
Common Stocks & Other Equity Interests 5,526,450 – – 5,526,450
U.S. Dollar Denominated Bonds & Notes – 4,091,302 – 4,091,302
U.S. Treasury Securities – 1,979,581 – 1,979,581
Exchange-Traded Funds 1,005,225 – – 1,005,225
Money Market Funds 28,264,505 – – 28,264,505
Total Investments in Securities 63,238,180 599,885,977 – 663,124,157
Other Investments - Liabilities*
Futures Contracts (477,335) – – (477,335)
Swap Agreements – (14,087) – (14,087)
Total Other Investments (477,335) (14,087) – (491,422)
Total Investments $62,760,845 $599,871,890 $– $662,632,735
* Unrealized appreciation (depreciation). 20 Invesco Income Fund
ˆ200F1$as8GpJWGsGÁŠ200F1$as8GpJWGsG`
153547 EDG 21INVESCOINCOME
30-Oct-2021 14:35 ESTHTMDTF
Donnelley Financial LSWpf_rendNone
7*ESS 0C
LSWP64RS0621.10.7.0
Page 1 of 1NOTE4–Derivative Investments
The Fund may enter into an ISDA Master Agreement under which a fund may trade OTC derivatives. An OTC transaction entered intounder an ISDA Master Agreement typically involves a collateral posting arrangement, payment netting provisions and close-out nettingprovisions. These netting provisions allow for reduction of credit risk through netting of contractual obligations. The enforceability of thenetting provisions of the ISDA Master Agreement depends on the governing law of the ISDA Master Agreement, among other factors.
For financial reporting purposes, the Fund does not offset OTC derivative assets or liabilities that are subject to ISDA Master Agreementsin the Statement of Assets and Liabilities.
Value of Derivative Investments at Period-End
The table below summarizes the value of the Fund’s derivative investments, detailed by primary risk exposure, held as of August 31, 2021:
Value
Credit Interest Derivative Liabilities Risk Rate Risk Total
Unrealized depreciation on futures contracts – Exchange-Traded(a) $ - $(477,335) $(477,335)
Unrealized depreciation on swap agreements – OTC (14,087) - (14,087)
Total Derivative Liabilities (14,087) (477,335) (491,422)
Derivatives not subject to master netting agreements - 477,335 477,335
Total Derivative Liabilities subject to master netting agreements $(14,087) $ - $ (14,087)
(a) The daily variation margin receivable (payable) at period-end is recorded in the Statement of Assets and Liabilities.
Offsetting Assets and Liabilities
The table below reflects the Fund’s exposure to Counterparties subject to either an ISDA Master Agreement or other agreement for OTCderivative transactions as of August 31, 2021.
FinancialDerivative
Assets
FinancialDerivativeLiabilities
Collateral(Received)/Pledged
Counterparty Swap
Agreement Swap
Agreement Net Value ofDerivatives Non-Cash Cash
NetAmount
Merrill Lynch International $76,695 $(14,087) $62,608 $– $– $62,608
Effect of Derivative Investments for the six months ended August 31, 2021
The table below summarizes the gains (losses) on derivative investments, detailed by primary risk exposure, recognized in earnings duringthe period:
Location of Gain (Loss) onStatement of Operations
CreditRisk
InterestRate Risk Total
Realized Gain (Loss): Futures contracts $ - $ 826,963 $ 826,963
Swap agreements (61,801) - (61,801)
Change in Net Unrealized Appreciation (Depreciation): Futures contracts - (2,390,525) (2,390,525)
Swap agreements 343,092 - 343,092
Total $281,291 $(1,563,562) $(1,282,271)
The table below summarizes the average notional value of derivatives held during the period. Futures Swap Contracts Agreements
Average notional value $119,746,883 $21,666,667
NOTE 5–Expense Offset Arrangement(s)
The expense offset arrangement is comprised of transfer agency credits which result from balances in demand deposit accounts used bythe transfer agent for clearing shareholder transactions. For the six months ended August 31, 2021, the Fund received credits from thisarrangement, which resulted in the reduction of the Fund’s total expenses of $1,617.
NOTE 6–Trustees’ and Officers’ Fees and Benefits
Trustees’ and Officers’ Fees and Benefits include amounts accrued by the Fund to pay remuneration to certain Trustees and Officers of theFund. Trustees have the option to defer compensation payable by the Fund, and Trustees’ and Officers’ Fees and Benefits also includeamounts accrued by the Fund to fund such deferred compensation amounts. Those Trustees who defer compensation have the option toselect various Invesco Funds in which their deferral accounts shall be deemed to be invested. Finally, certain current Trustees were eligibleto participate in a retirement plan that provided for benefits to be paid upon retirement to Trustees over a period of time based on thenumber of years of service. The Fund may have certain former Trustees who also participate in a retirement plan and receive benefits under 21 Invesco Income Fund
ˆ200F1$as8GpJXS1oLŠ200F1$as8GpJXS1oL
153547 EDG 22INVESCOINCOME
30-Oct-2021 14:35 ESTHTMDTF
Donnelley Financial LSWpf_rendNone
6*ESS 0C
LSWP64RS0621.10.7.0
Page 1 of 1such plan. Trustees’ and Officers’ Fees and Benefits include amounts accrued by the Fund to fund such retirement benefits. Obligationsunder the deferred compensation and retirement plans represent unsecured claims against the general assets of the Fund.
NOTE 7–Cash Balances
The Fund may borrow for leveraging in an amount up to 5% of the Fund’s total assets (excluding the amount borrowed) at the time theborrowing is made. In doing so, the Fund is permitted to temporarily carry a negative or overdrawn balance in its account with SSB, thecustodian bank. Such balances, if any at period end, are shown in the Statement of Assets and Liabilities under the payable caption Amountdue custodian. To compensate the custodian bank for such overdrafts, the overdrawn Fund may either (1) leave funds as a compensatingbalance in the account so the custodian bank can be compensated by earning the additional interest; or (2) compensate by paying thecustodian bank at a rate agreed upon by the custodian bank and Invesco, not to exceed the contractually agreed upon rate. The Fund maynot purchase additional securities when any borrowings from banks or broker-dealers exceed 5% of the Fund’s total assets, or when anyborrowings from an Invesco Fund are outstanding.
NOTE 8–Tax Information
The amount and character of income and gains to be distributed are determined in accordance with income tax regulations, which maydiffer from GAAP.
Reclassifications are made to the Fund’s capital accounts to reflect income and gains available for distribution (or available capital losscarryforward) under income tax regulations. The tax character of distributions paid during the year and the tax components of net assets willbe reported at the Fund’s fiscal year-end.
Capital loss carryforward is calculated and reported as of a specific date. Results of transactions and other activity after that date mayaffect the amount of capital loss carryforward actually available for the Fund to utilize. The ability to utilize capital loss carryforwards in thefuture may be limited under the Internal Revenue Code and related regulations based on the results of future transactions.
The Fund had a capital loss carryforward as of February 28, 2021, as follows:
Capital Loss Carryforward*
Expiration Short-Term Long-Term Total
Not subject to expiration $14,724,415 $32,686,721 $47,411,136
* Capital loss carryforward is reduced for limitations, if any, to the extent required by the Internal Revenue Code and may be further limited dependingupon a variety of factors, including the realization of net unrealized gains or losses as of the date of any reorganization.
NOTE 9–Investment Transactions
The aggregate amount of investment securities (other than short-term securities, U.S. Government obligations and money market funds, ifany) purchased and sold by the Fund during the six months ended August 31, 2021 was $77,180,590 and $126,262,031, respectively. Costof investments, including any derivatives, on a tax basis includes the adjustments for financial reporting purposes as of the most recentlycompleted federal income tax reporting period-end.
Unrealized Appreciation (Depreciation) of Investments on a Tax Basis
Aggregate unrealized appreciation of investments $11,969,725
Aggregate unrealized (depreciation) of investments (7,443,333)
Net unrealized appreciation of investments $ 4,526,392
Cost of investments for tax purposes is $ 658,106,343.
NOTE 10–Share Information
Summary of Share Activity
Six months ended Year ended August 31, 2021(a) February 28, 2021 Shares Amount Shares Amount
Sold: Class A 1,062,417 $ 8,473,039 2,226,448 $ 16,564,185
Class C 305,272 2,436,383 320,565 2,429,814
Class R 81,828 653,103 174,836 1,301,117
Class Y 683,334 5,464,708 5,982,713 45,144,577
Investor Class 136,402 1,087,614 259,252 1,966,461
Class R5 8,289 66,193 18,795 137,686
Class R6 1,099,268 8,742,275 29,040,117 210,551,966
Issued as reinvestment of dividends: Class A 527,999 4,214,741 1,607,668 11,729,640
Class C 7,574 60,489 27,388 198,770
Class R 6,960 55,588 17,923 130,650
Class Y 51,271 409,977 79,902 600,249
Investor Class 33,976 271,612 108,678 793,219
Class R5 845 6,747 2,466 17,939
Class R6 388,218 3,095,293 725,842 5,553,111
Automatic conversion of Class C shares to Class A shares: Class A 38,847 309,954 234,191 1,778,837
Class C (38,843) (309,954) (234,132) (1,778,837)
22 Invesco Income Fund
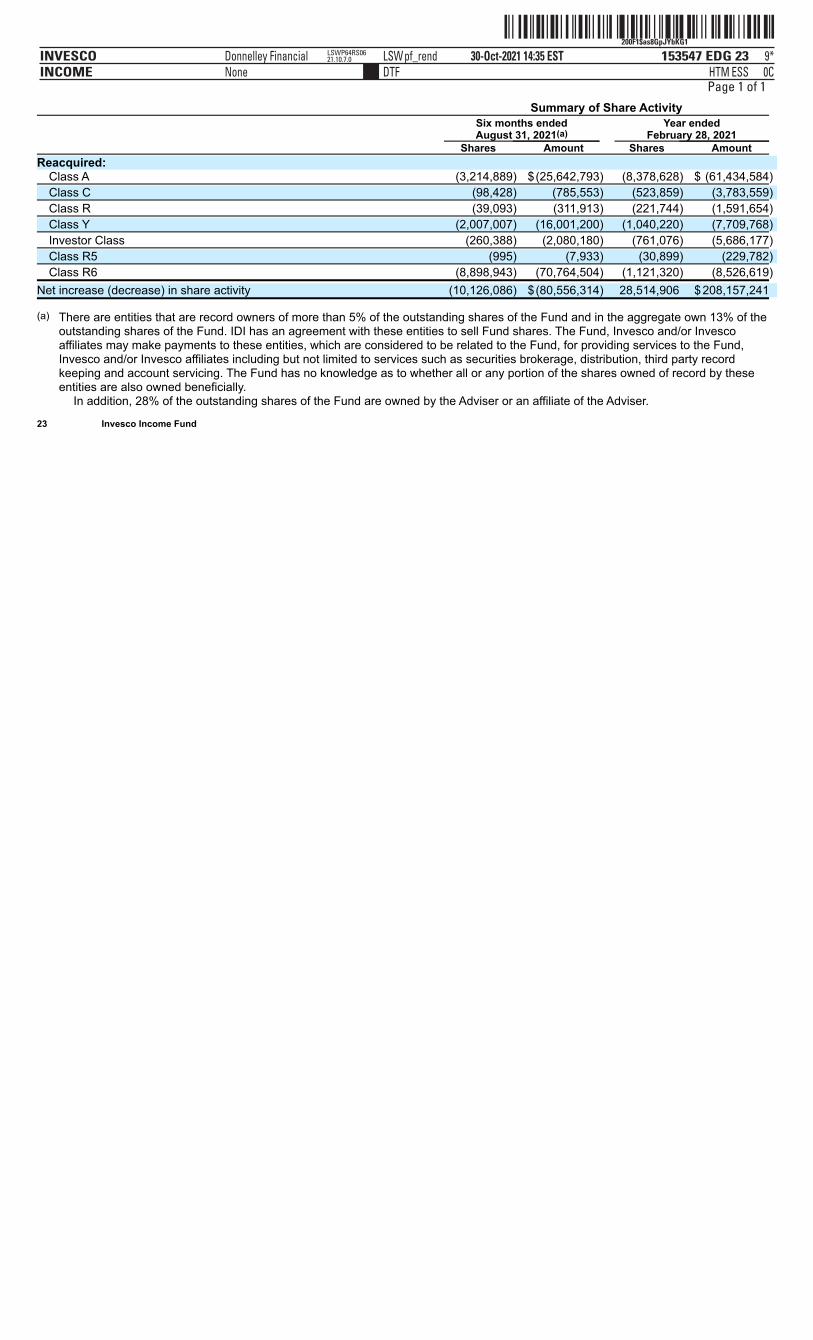
ˆ200F1$as8GpJYbKG1Š200F1$as8GpJYbKG1
153547 EDG 23INVESCOINCOME
30-Oct-2021 14:35 ESTHTMDTF
Donnelley Financial LSWpf_rendNone
9*ESS 0C
LSWP64RS0621.10.7.0
Page 1 of 1
Summary of Share Activity
Six months ended Year ended August 31, 2021(a) February 28, 2021 Shares Amount Shares Amount
Reacquired: Class A (3,214,889) $(25,642,793) (8,378,628) $ (61,434,584)
Class C (98,428) (785,553) (523,859) (3,783,559)
Class R (39,093) (311,913) (221,744) (1,591,654)
Class Y (2,007,007) (16,001,200) (1,040,220) (7,709,768)
Investor Class (260,388) (2,080,180) (761,076) (5,686,177)
Class R5 (995) (7,933) (30,899) (229,782)
Class R6 (8,898,943) (70,764,504) (1,121,320) (8,526,619)
Net increase (decrease) in share activity (10,126,086) $(80,556,314) 28,514,906 $208,157,241
(a) There are entities that are record owners of more than 5% of the outstanding shares of the Fund and in the aggregate own 13% of theoutstanding shares of the Fund. IDI has an agreement with these entities to sell Fund shares. The Fund, Invesco and/or Invescoaffiliates may make payments to these entities, which are considered to be related to the Fund, for providing services to the Fund,Invesco and/or Invesco affiliates including but not limited to services such as securities brokerage, distribution, third party recordkeeping and account servicing. The Fund has no knowledge as to whether all or any portion of the shares owned of record by theseentities are also owned beneficially.
In addition, 28% of the outstanding shares of the Fund are owned by the Adviser or an affiliate of the Adviser. 23 Invesco Income Fund
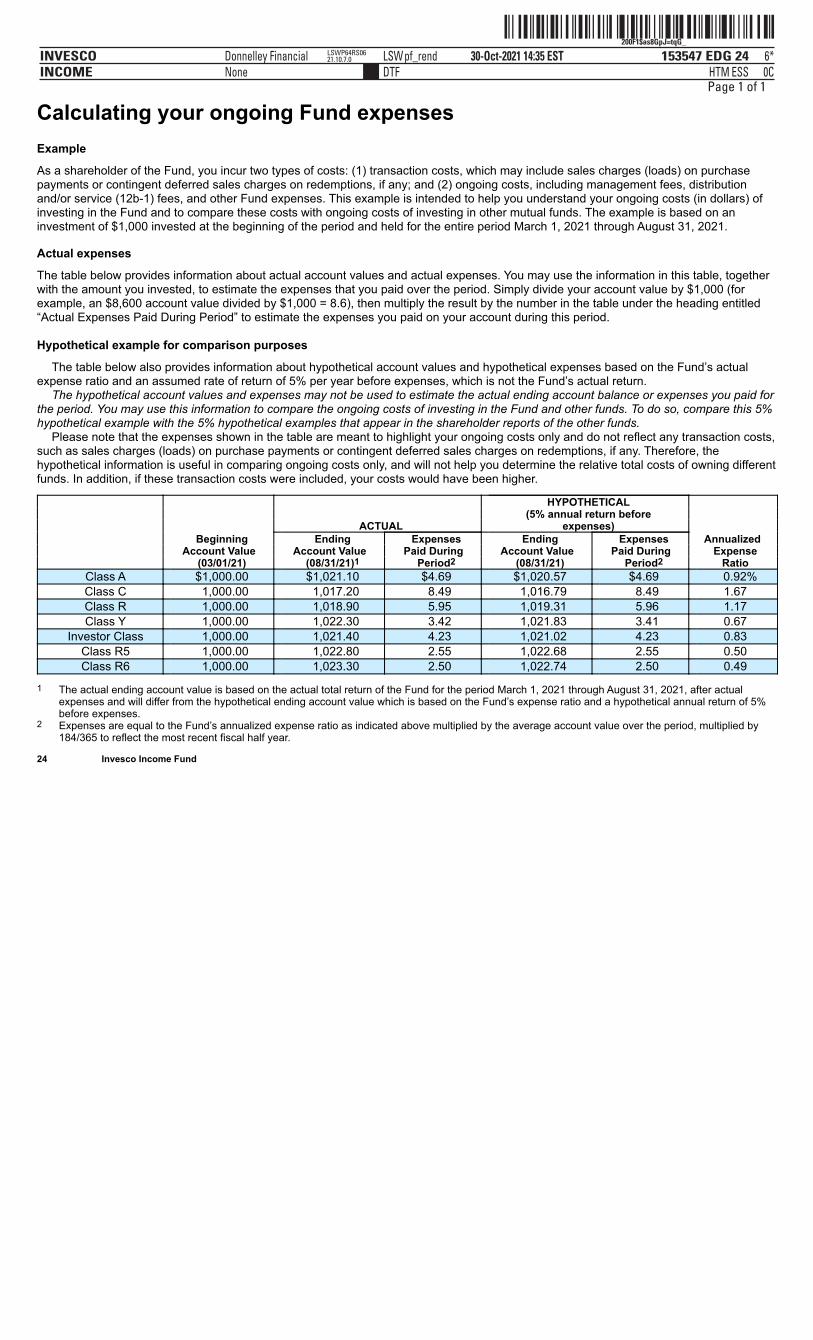
ˆ200F1$as8GpJ=tqG_Š200F1$as8GpJ=tqG_
153547 EDG 24INVESCOINCOME
30-Oct-2021 14:35 ESTHTMDTF
Donnelley Financial LSWpf_rendNone
6*ESS 0C
LSWP64RS0621.10.7.0
Page 1 of 1
Calculating your ongoing Fund expensesExample
As a shareholder of the Fund, you incur two types of costs: (1) transaction costs, which may include sales charges (loads) on purchasepayments or contingent deferred sales charges on redemptions, if any; and (2) ongoing costs, including management fees, distributionand/or service (12b-1) fees, and other Fund expenses. This example is intended to help you understand your ongoing costs (in dollars) ofinvesting in the Fund and to compare these costs with ongoing costs of investing in other mutual funds. The example is based on aninvestment of $1,000 invested at the beginning of the period and held for the entire period March 1, 2021 through August 31, 2021.
Actual expenses
The table below provides information about actual account values and actual expenses. You may use the information in this table, togetherwith the amount you invested, to estimate the expenses that you paid over the period. Simply divide your account value by $1,000 (forexample, an $8,600 account value divided by $1,000 = 8.6), then multiply the result by the number in the table under the heading entitled“Actual Expenses Paid During Period” to estimate the expenses you paid on your account during this period.
Hypothetical example for comparison purposes
The table below also provides information about hypothetical account values and hypothetical expenses based on the Fund’s actualexpense ratio and an assumed rate of return of 5% per year before expenses, which is not the Fund’s actual return.
The hypothetical account values and expenses may not be used to estimate the actual ending account balance or expenses you paid forthe period. You may use this information to compare the ongoing costs of investing in the Fund and other funds. To do so, compare this 5%hypothetical example with the 5% hypothetical examples that appear in the shareholder reports of the other funds.
Please note that the expenses shown in the table are meant to highlight your ongoing costs only and do not reflect any transaction costs,such as sales charges (loads) on purchase payments or contingent deferred sales charges on redemptions, if any. Therefore, thehypothetical information is useful in comparing ongoing costs only, and will not help you determine the relative total costs of owning differentfunds. In addition, if these transaction costs were included, your costs would have been higher.
HYPOTHETICAL (5% annual return before ACTUAL expenses) Beginning Ending Expenses Ending Expenses Annualized Account Value Account Value Paid During Account Value Paid During Expense (03/01/21) (08/31/21)1 Period2 (08/31/21) Period2 Ratio
Class A $1,000.00 $1,021.10 $4.69 $1,020.57 $4.69 0.92%Class C 1,000.00 1,017.20 8.49 1,016.79 8.49 1.67Class R 1,000.00 1,018.90 5.95 1,019.31 5.96 1.17Class Y 1,000.00 1,022.30 3.42 1,021.83 3.41 0.67
Investor Class 1,000.00 1,021.40 4.23 1,021.02 4.23 0.83Class R5 1,000.00 1,022.80 2.55 1,022.68 2.55 0.50Class R6 1,000.00 1,023.30 2.50 1,022.74 2.50 0.49
1 The actual ending account value is based on the actual total return of the Fund for the period March 1, 2021 through August 31, 2021, after actualexpenses and will differ from the hypothetical ending account value which is based on the Fund’s expense ratio and a hypothetical annual return of 5%before expenses.
2 Expenses are equal to the Fund’s annualized expense ratio as indicated above multiplied by the average account value over the period, multiplied by184/365 to reflect the most recent fiscal half year.
24 Invesco Income Fund
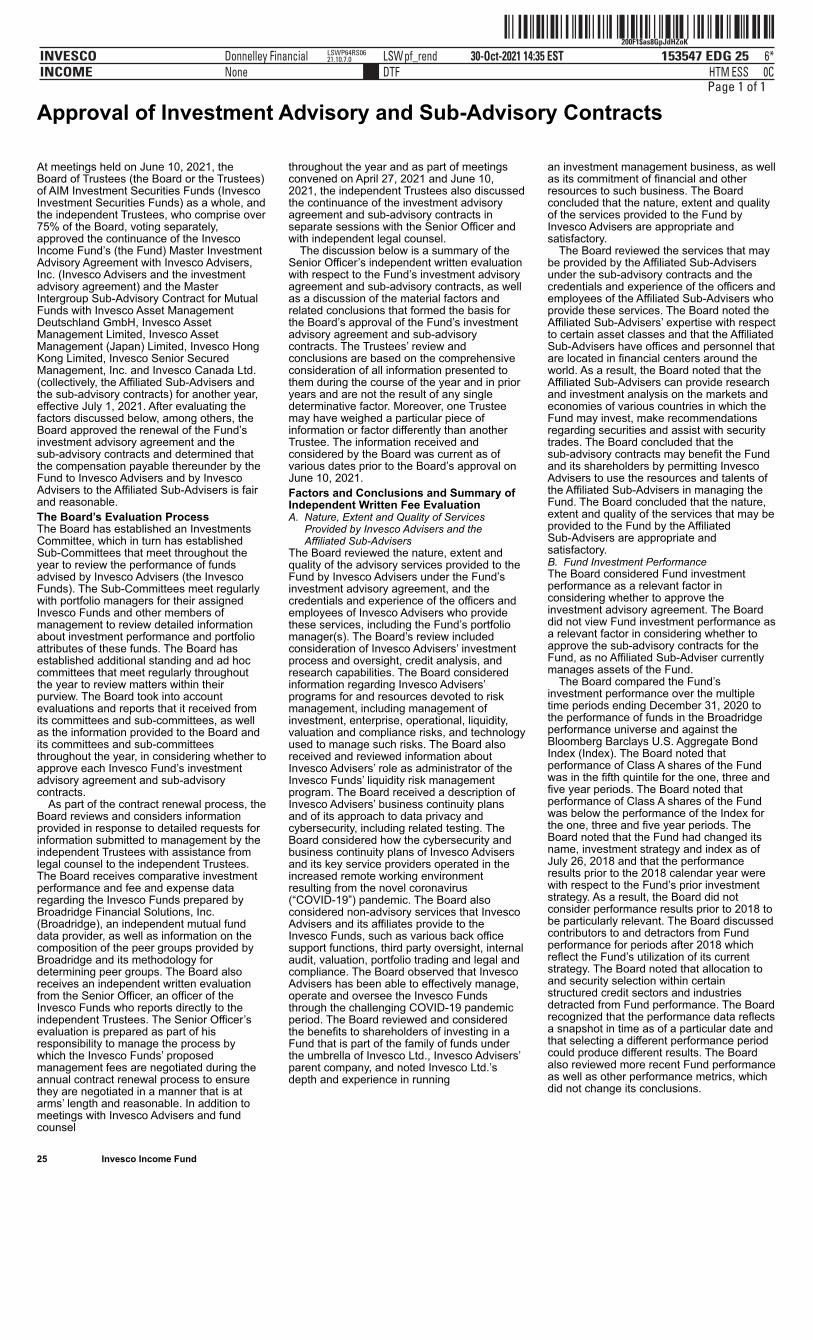
ˆ200F1$as8GpJdHZoKŠ200F1$as8GpJdHZoK
153547 EDG 25INVESCOINCOME
30-Oct-2021 14:35 ESTHTMDTF
Donnelley Financial LSWpf_rendNone
6*ESS 0C
LSWP64RS0621.10.7.0
Page 1 of 1
Approval of Investment Advisory and Sub-Advisory Contracts
25 Invesco Income Fund
At meetings held on June 10, 2021, theBoard of Trustees (the Board or the Trustees)of AIM Investment Securities Funds (InvescoInvestment Securities Funds) as a whole, andthe independent Trustees, who comprise over75% of the Board, voting separately,approved the continuance of the InvescoIncome Fund’s (the Fund) Master InvestmentAdvisory Agreement with Invesco Advisers,Inc. (Invesco Advisers and the investmentadvisory agreement) and the MasterIntergroup Sub-Advisory Contract for MutualFunds with Invesco Asset ManagementDeutschland GmbH, Invesco AssetManagement Limited, Invesco AssetManagement (Japan) Limited, Invesco HongKong Limited, Invesco Senior SecuredManagement, Inc. and Invesco Canada Ltd.(collectively, the Affiliated Sub-Advisers andthe sub-advisory contracts) for another year,effective July 1, 2021. After evaluating thefactors discussed below, among others, theBoard approved the renewal of the Fund’sinvestment advisory agreement and thesub-advisory contracts and determined thatthe compensation payable thereunder by theFund to Invesco Advisers and by InvescoAdvisers to the Affiliated Sub-Advisers is fairand reasonable.The Board’s Evaluation ProcessThe Board has established an InvestmentsCommittee, which in turn has establishedSub-Committees that meet throughout theyear to review the performance of fundsadvised by Invesco Advisers (the InvescoFunds). The Sub-Committees meet regularlywith portfolio managers for their assignedInvesco Funds and other members ofmanagement to review detailed informationabout investment performance and portfolioattributes of these funds. The Board hasestablished additional standing and ad hoccommittees that meet regularly throughoutthe year to review matters within theirpurview. The Board took into accountevaluations and reports that it received fromits committees and sub-committees, as wellas the information provided to the Board andits committees and sub-committeesthroughout the year, in considering whether toapprove each Invesco Fund’s investmentadvisory agreement and sub-advisorycontracts.
As part of the contract renewal process, theBoard reviews and considers informationprovided in response to detailed requests forinformation submitted to management by theindependent Trustees with assistance fromlegal counsel to the independent Trustees.The Board receives comparative investmentperformance and fee and expense dataregarding the Invesco Funds prepared byBroadridge Financial Solutions, Inc.(Broadridge), an independent mutual funddata provider, as well as information on thecomposition of the peer groups provided byBroadridge and its methodology fordetermining peer groups. The Board alsoreceives an independent written evaluationfrom the Senior Officer, an officer of theInvesco Funds who reports directly to theindependent Trustees. The Senior Officer’sevaluation is prepared as part of hisresponsibility to manage the process bywhich the Invesco Funds’ proposedmanagement fees are negotiated during theannual contract renewal process to ensurethey are negotiated in a manner that is atarms’ length and reasonable. In addition tomeetings with Invesco Advisers and fundcounsel
throughout the year and as part of meetingsconvened on April 27, 2021 and June 10,2021, the independent Trustees also discussedthe continuance of the investment advisoryagreement and sub-advisory contracts inseparate sessions with the Senior Officer andwith independent legal counsel.
The discussion below is a summary of theSenior Officer’s independent written evaluationwith respect to the Fund’s investment advisoryagreement and sub-advisory contracts, as wellas a discussion of the material factors andrelated conclusions that formed the basis forthe Board’s approval of the Fund’s investmentadvisory agreement and sub-advisorycontracts. The Trustees’ review andconclusions are based on the comprehensiveconsideration of all information presented tothem during the course of the year and in prioryears and are not the result of any singledeterminative factor. Moreover, one Trusteemay have weighed a particular piece ofinformation or factor differently than anotherTrustee. The information received andconsidered by the Board was current as ofvarious dates prior to the Board’s approval onJune 10, 2021.Factors and Conclusions and Summary ofIndependent Written Fee EvaluationA. Nature, Extent and Quality of Services
Provided by Invesco Advisers and theAffiliated Sub-Advisers
The Board reviewed the nature, extent andquality of the advisory services provided to theFund by Invesco Advisers under the Fund’sinvestment advisory agreement, and thecredentials and experience of the officers andemployees of Invesco Advisers who providethese services, including the Fund’s portfoliomanager(s). The Board’s review includedconsideration of Invesco Advisers’ investmentprocess and oversight, credit analysis, andresearch capabilities. The Board consideredinformation regarding Invesco Advisers’programs for and resources devoted to riskmanagement, including management ofinvestment, enterprise, operational, liquidity,valuation and compliance risks, and technologyused to manage such risks. The Board alsoreceived and reviewed information aboutInvesco Advisers’ role as administrator of theInvesco Funds’ liquidity risk managementprogram. The Board received a description ofInvesco Advisers’ business continuity plansand of its approach to data privacy andcybersecurity, including related testing. TheBoard considered how the cybersecurity andbusiness continuity plans of Invesco Advisersand its key service providers operated in theincreased remote working environmentresulting from the novel coronavirus(“COVID-19”) pandemic. The Board alsoconsidered non-advisory services that InvescoAdvisers and its affiliates provide to theInvesco Funds, such as various back officesupport functions, third party oversight, internalaudit, valuation, portfolio trading and legal andcompliance. The Board observed that InvescoAdvisers has been able to effectively manage,operate and oversee the Invesco Fundsthrough the challenging COVID-19 pandemicperiod. The Board reviewed and consideredthe benefits to shareholders of investing in aFund that is part of the family of funds underthe umbrella of Invesco Ltd., Invesco Advisers’parent company, and noted Invesco Ltd.’sdepth and experience in running
an investment management business, as wellas its commitment of financial and otherresources to such business. The Boardconcluded that the nature, extent and qualityof the services provided to the Fund byInvesco Advisers are appropriate andsatisfactory.
The Board reviewed the services that maybe provided by the Affiliated Sub-Advisersunder the sub-advisory contracts and thecredentials and experience of the officers andemployees of the Affiliated Sub-Advisers whoprovide these services. The Board noted theAffiliated Sub-Advisers’ expertise with respectto certain asset classes and that the AffiliatedSub-Advisers have offices and personnel thatare located in financial centers around theworld. As a result, the Board noted that theAffiliated Sub-Advisers can provide researchand investment analysis on the markets andeconomies of various countries in which theFund may invest, make recommendationsregarding securities and assist with securitytrades. The Board concluded that thesub-advisory contracts may benefit the Fundand its shareholders by permitting InvescoAdvisers to use the resources and talents ofthe Affiliated Sub-Advisers in managing theFund. The Board concluded that the nature,extent and quality of the services that may beprovided to the Fund by the AffiliatedSub-Advisers are appropriate andsatisfactory.B. Fund Investment PerformanceThe Board considered Fund investmentperformance as a relevant factor inconsidering whether to approve theinvestment advisory agreement. The Boarddid not view Fund investment performance asa relevant factor in considering whether toapprove the sub-advisory contracts for theFund, as no Affiliated Sub-Adviser currentlymanages assets of the Fund.
The Board compared the Fund’sinvestment performance over the multipletime periods ending December 31, 2020 tothe performance of funds in the Broadridgeperformance universe and against theBloomberg Barclays U.S. Aggregate BondIndex (Index). The Board noted thatperformance of Class A shares of the Fundwas in the fifth quintile for the one, three andfive year periods. The Board noted thatperformance of Class A shares of the Fundwas below the performance of the Index forthe one, three and five year periods. TheBoard noted that the Fund had changed itsname, investment strategy and index as ofJuly 26, 2018 and that the performanceresults prior to the 2018 calendar year werewith respect to the Fund’s prior investmentstrategy. As a result, the Board did notconsider performance results prior to 2018 tobe particularly relevant. The Board discussedcontributors to and detractors from Fundperformance for periods after 2018 whichreflect the Fund’s utilization of its currentstrategy. The Board noted that allocation toand security selection within certainstructured credit sectors and industriesdetracted from Fund performance. The Boardrecognized that the performance data reflectsa snapshot in time as of a particular date andthat selecting a different performance periodcould produce different results. The Boardalso reviewed more recent Fund performanceas well as other performance metrics, whichdid not change its conclusions.
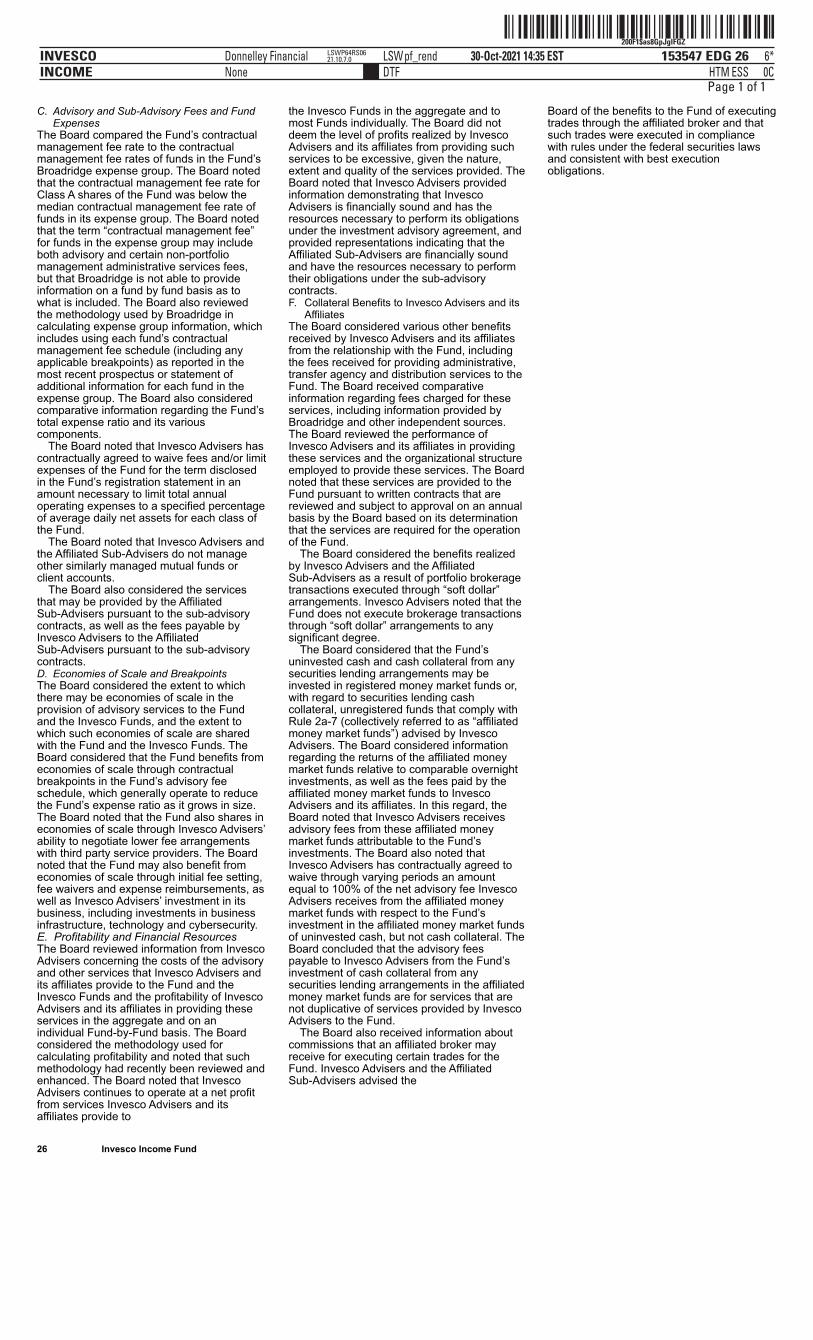
ˆ200F1$as8GpJglFGZŠ200F1$as8GpJglFGZ
153547 EDG 26INVESCOINCOME
30-Oct-2021 14:35 ESTHTMDTF
Donnelley Financial LSWpf_rendNone
6*ESS 0C
LSWP64RS0621.10.7.0
Page 1 of 1
26 Invesco Income Fund
C. Advisory and Sub-Advisory Fees and FundExpenses
The Board compared the Fund’s contractualmanagement fee rate to the contractualmanagement fee rates of funds in the Fund’sBroadridge expense group. The Board notedthat the contractual management fee rate forClass A shares of the Fund was below themedian contractual management fee rate offunds in its expense group. The Board notedthat the term “contractual management fee”for funds in the expense group may includeboth advisory and certain non-portfoliomanagement administrative services fees,but that Broadridge is not able to provideinformation on a fund by fund basis as towhat is included. The Board also reviewedthe methodology used by Broadridge incalculating expense group information, whichincludes using each fund’s contractualmanagement fee schedule (including anyapplicable breakpoints) as reported in themost recent prospectus or statement ofadditional information for each fund in theexpense group. The Board also consideredcomparative information regarding the Fund’stotal expense ratio and its variouscomponents.
The Board noted that Invesco Advisers hascontractually agreed to waive fees and/or limitexpenses of the Fund for the term disclosedin the Fund’s registration statement in anamount necessary to limit total annualoperating expenses to a specified percentageof average daily net assets for each class ofthe Fund.
The Board noted that Invesco Advisers andthe Affiliated Sub-Advisers do not manageother similarly managed mutual funds orclient accounts.
The Board also considered the servicesthat may be provided by the AffiliatedSub-Advisers pursuant to the sub-advisorycontracts, as well as the fees payable byInvesco Advisers to the AffiliatedSub-Advisers pursuant to the sub-advisorycontracts.D. Economies of Scale and BreakpointsThe Board considered the extent to whichthere may be economies of scale in theprovision of advisory services to the Fundand the Invesco Funds, and the extent towhich such economies of scale are sharedwith the Fund and the Invesco Funds. TheBoard considered that the Fund benefits fromeconomies of scale through contractualbreakpoints in the Fund’s advisory feeschedule, which generally operate to reducethe Fund’s expense ratio as it grows in size.The Board noted that the Fund also shares ineconomies of scale through Invesco Advisers’ability to negotiate lower fee arrangementswith third party service providers. The Boardnoted that the Fund may also benefit fromeconomies of scale through initial fee setting,fee waivers and expense reimbursements, aswell as Invesco Advisers’ investment in itsbusiness, including investments in businessinfrastructure, technology and cybersecurity.E. Profitability and Financial ResourcesThe Board reviewed information from InvescoAdvisers concerning the costs of the advisoryand other services that Invesco Advisers andits affiliates provide to the Fund and theInvesco Funds and the profitability of InvescoAdvisers and its affiliates in providing theseservices in the aggregate and on anindividual Fund-by-Fund basis. The Boardconsidered the methodology used forcalculating profitability and noted that suchmethodology had recently been reviewed andenhanced. The Board noted that InvescoAdvisers continues to operate at a net profitfrom services Invesco Advisers and itsaffiliates provide to
the Invesco Funds in the aggregate and tomost Funds individually. The Board did notdeem the level of profits realized by InvescoAdvisers and its affiliates from providing suchservices to be excessive, given the nature,extent and quality of the services provided. TheBoard noted that Invesco Advisers providedinformation demonstrating that InvescoAdvisers is financially sound and has theresources necessary to perform its obligationsunder the investment advisory agreement, andprovided representations indicating that theAffiliated Sub-Advisers are financially soundand have the resources necessary to performtheir obligations under the sub-advisorycontracts.F. Collateral Benefits to Invesco Advisers and its
AffiliatesThe Board considered various other benefitsreceived by Invesco Advisers and its affiliatesfrom the relationship with the Fund, includingthe fees received for providing administrative,transfer agency and distribution services to theFund. The Board received comparativeinformation regarding fees charged for theseservices, including information provided byBroadridge and other independent sources.The Board reviewed the performance ofInvesco Advisers and its affiliates in providingthese services and the organizational structureemployed to provide these services. The Boardnoted that these services are provided to theFund pursuant to written contracts that arereviewed and subject to approval on an annualbasis by the Board based on its determinationthat the services are required for the operationof the Fund.
The Board considered the benefits realizedby Invesco Advisers and the AffiliatedSub-Advisers as a result of portfolio brokeragetransactions executed through “soft dollar”arrangements. Invesco Advisers noted that theFund does not execute brokerage transactionsthrough “soft dollar” arrangements to anysignificant degree.
The Board considered that the Fund’suninvested cash and cash collateral from anysecurities lending arrangements may beinvested in registered money market funds or,with regard to securities lending cashcollateral, unregistered funds that comply withRule 2a-7 (collectively referred to as “affiliatedmoney market funds”) advised by InvescoAdvisers. The Board considered informationregarding the returns of the affiliated moneymarket funds relative to comparable overnightinvestments, as well as the fees paid by theaffiliated money market funds to InvescoAdvisers and its affiliates. In this regard, theBoard noted that Invesco Advisers receivesadvisory fees from these affiliated moneymarket funds attributable to the Fund’sinvestments. The Board also noted thatInvesco Advisers has contractually agreed towaive through varying periods an amountequal to 100% of the net advisory fee InvescoAdvisers receives from the affiliated moneymarket funds with respect to the Fund’sinvestment in the affiliated money market fundsof uninvested cash, but not cash collateral. TheBoard concluded that the advisory feespayable to Invesco Advisers from the Fund’sinvestment of cash collateral from anysecurities lending arrangements in the affiliatedmoney market funds are for services that arenot duplicative of services provided by InvescoAdvisers to the Fund.
The Board also received information aboutcommissions that an affiliated broker mayreceive for executing certain trades for theFund. Invesco Advisers and the AffiliatedSub-Advisers advised the
Board of the benefits to the Fund of executingtrades through the affiliated broker and thatsuch trades were executed in compliancewith rules under the federal securities lawsand consistent with best executionobligations.

ˆ200F1$as8GpJhuXomŠ200F1$as8GpJhuXom
153547 EDG 27INVESCOINCOME
30-Oct-2021 14:35 ESTHTMDTF
Donnelley Financial LSWpf_rendNone
5*ESS 0C
LSWP64RS0621.10.7.0
Page 1 of 1
(This page intentionally left blank)
ˆ200F1$as8GpJkxqo2Š200F1$as8GpJkxqo2
153547 EDG 28INVESCOINCOME
30-Oct-2021 14:35 ESTHTMDTF
Donnelley Financial LSWpf_rendNone
6*ESS 0C
LSWP64RS0621.10.7.0
dsp001adsp28a
Page 1 of 1
Go paperless with eDeliveryVisit invesco.com/edelivery to enjoy the convenience and security of anytime electronic access to your investmentdocuments.
With eDelivery, you can elect to have any or all of the following materials delivered straight to your inbox to download, saveand print from your own computer:
∎ Fund reports and prospectuses∎ Quarterly statements∎ Daily confirmations∎ Tax forms Invesco mailing informationSend general correspondence to Invesco Investment Services, Inc., P.O. Box 219078, Kansas City, MO 64121-9078. Important notice regarding delivery of security holder documentsTo reduce Fund expenses, only one copy of most shareholder documents may be mailed to shareholders with multipleaccounts at the same address (Householding). Mailing of your shareholder documents may be householded indefinitelyunless you instruct us otherwise. If you do not want the mailing of these documents to be combined with those for othermembers of your household, please contact Invesco Investment Services, Inc. at 800 959 4246 or contact your financialinstitution. We will begin sending you individual copies for each account within 30 days after receiving your request. Fund holdings and proxy voting informationThe Fund provides a complete list of its portfolio holdings four times each fiscal year, at the end of each fiscal quarter. For thesecond and fourth quarters, the list appears, respectively, in the Fund’s semiannual and annual reports to shareholders. Forthe first and third quarters, the Fund files the list with the Securities and Exchange Commission (SEC) as an exhibit to itsreports on Form N-PORT. The most recent list of portfolio holdings is available at invesco.com/completeqtrholdings.Shareholders can also look up the Fund’s Form N-PORT filings on the SEC website, sec.gov. The SEC file numbers for theFund are shown below.
A description of the policies and procedures that the Fund uses to determine how to vote proxies relating to portfoliosecurities is available without charge, upon request, from our Client Services department at 800 959 4246, or at invesco.com/corporate/about-us/esg. The information is also available on the SEC website, sec.gov.
Information regarding how the Fund voted proxies related to its portfolio securities during the most recent 12-month periodended June 30 is available at invesco.com/proxysearch. This information is also available on the SEC website, sec.gov.
Invesco Advisers, Inc. is an investment adviser; it provides investment advisory services to individual and institutionalclients and does not sell securities. Invesco Distributors, Inc. is the US distributor for Invesco Ltd.’s retail mutual funds,exchange-traded funds and institutional money market funds. Both are wholly owned, indirect subsidiaries of Invesco Ltd.
SEC file number(s): 811-05686 and 033-39519 Invesco Distributors, Inc. INC-SAR-1
ˆ200F9gQxdnDyBVfGZŠ200F9gQxdnDyBVfGZ
209907 EDG 1INVESCOINTERMEDIATE BOND FA
29-Oct-2021 20:28 ESTHTMDTF
Donnelley Financial LSWtiwaa0apNone
7*ESS 0C
VDI-W10-LPF-00821.7.8.0
dsp0001
Page 1 of 1
Semiannual Report to Shareholders August 31, 2021
Invesco Intermediate Bond Factor Fund Nasdaq: A: OFIAX ∎ C: OFICX ∎ R: OFINX ∎ Y: OFIYX ∎ R5: IOTEX ∎ R6: OFIIX
2 Fund Performance4 Liquidity Risk Management Program5 Schedule of Investments14 Financial Statements17 Financial Highlights18 Notes to Financial Statements25 Fund Expenses26 Approval of Investment Advisory and Sub-Advisory Contracts
For the most current month-end Fund performance and commentary, please visit invesco.com/performance.Unless otherwise noted, all data provided by Invesco.This report must be accompanied or preceded by a currently effective Fund prospectus, which contains more complete information, includingsales charges and expenses. Investors should read it carefully before investing.
NOT FDIC INSURED | MAY LOSE VALUE | NO BANK GUARANTEE
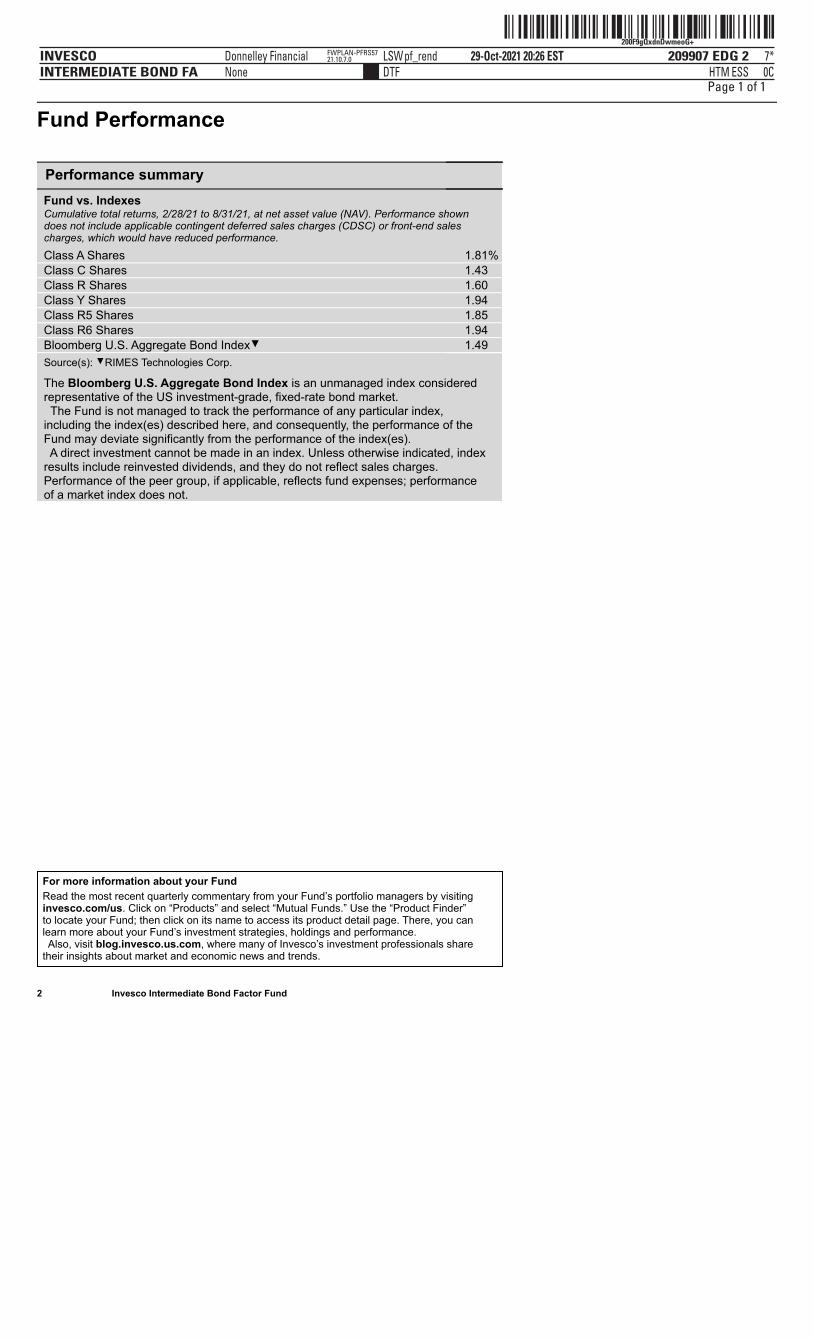
ˆ200F9gQxdnDwmeoG+Š200F9gQxdnDwmeoG+
209907 EDG 2INVESCOINTERMEDIATE BOND FA
29-Oct-2021 20:26 ESTHTMDTF
Donnelley Financial LSWpf_rendNone
7*ESS 0C
FWPLAN-PFRS5721.10.7.0
Page 1 of 1
Fund Performance
2 Invesco Intermediate Bond Factor Fund
Performance summary
Fund vs. Indexes Cumulative total returns, 2/28/21 to 8/31/21, at net asset value (NAV). Performance showndoes not include applicable contingent deferred sales charges (CDSC) or front-end salescharges, which would have reduced performance.
Class A Shares 1.81% Class C Shares 1.43 Class R Shares 1.60 Class Y Shares 1.94 Class R5 Shares 1.85 Class R6 Shares 1.94 Bloomberg U.S. Aggregate Bond Index▼ 1.49 Source(s): ▼RIMES Technologies Corp. The Bloomberg U.S. Aggregate Bond Index is an unmanaged index consideredrepresentative of the US investment-grade, fixed-rate bond market.
The Fund is not managed to track the performance of any particular index,including the index(es) described here, and consequently, the performance of theFund may deviate significantly from the performance of the index(es).
A direct investment cannot be made in an index. Unless otherwise indicated, indexresults include reinvested dividends, and they do not reflect sales charges.Performance of the peer group, if applicable, reflects fund expenses; performanceof a market index does not.
For more information about your Fund
Read the most recent quarterly commentary from your Fund’s portfolio managers by visitinginvesco.com/us. Click on “Products” and select “Mutual Funds.” Use the “Product Finder”to locate your Fund; then click on its name to access its product detail page. There, you canlearn more about your Fund’s investment strategies, holdings and performance. Also, visit blog.invesco.us.com, where many of Invesco’s investment professionals sharetheir insights about market and economic news and trends.
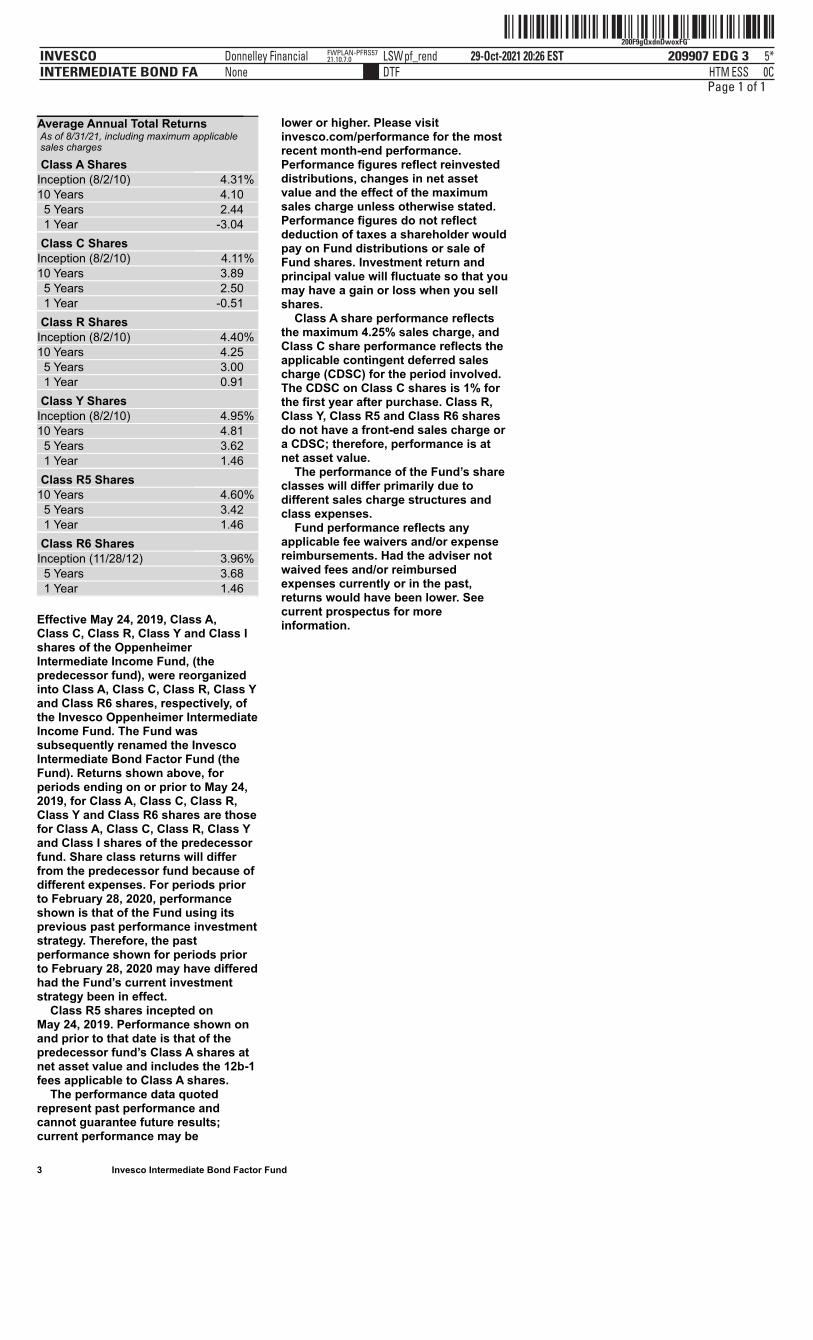
ˆ200F9gQxdnDwoxFGÈŠ200F9gQxdnDwoxFG¨
209907 EDG 3INVESCOINTERMEDIATE BOND FA
29-Oct-2021 20:26 ESTHTMDTF
Donnelley Financial LSWpf_rendNone
5*ESS 0C
FWPLAN-PFRS5721.10.7.0
Page 1 of 1
3 Invesco Intermediate Bond Factor Fund
Average Annual Total Returns As of 8/31/21, including maximum applicablesales charges
Class A Shares Inception (8/2/10) 4.31% 10 Years 4.10 5 Years 2.44 1 Year -3.04 Class C Shares
Inception (8/2/10) 4.11% 10 Years 3.89 5 Years 2.50 1 Year -0.51 Class R Shares
Inception (8/2/10) 4.40% 10 Years 4.25 5 Years 3.00 1 Year 0.91 Class Y Shares
Inception (8/2/10) 4.95% 10 Years 4.81 5 Years 3.62 1 Year 1.46 Class R5 Shares
10 Years 4.60% 5 Years 3.42 1 Year 1.46 Class R6 Shares
Inception (11/28/12) 3.96% 5 Years 3.68 1 Year 1.46
Effective May 24, 2019, Class A,Class C, Class R, Class Y and Class Ishares of the OppenheimerIntermediate Income Fund, (thepredecessor fund), were reorganizedinto Class A, Class C, Class R, Class Yand Class R6 shares, respectively, ofthe Invesco Oppenheimer IntermediateIncome Fund. The Fund wassubsequently renamed the InvescoIntermediate Bond Factor Fund (theFund). Returns shown above, forperiods ending on or prior to May 24,2019, for Class A, Class C, Class R,Class Y and Class R6 shares are thosefor Class A, Class C, Class R, Class Yand Class I shares of the predecessorfund. Share class returns will differfrom the predecessor fund because ofdifferent expenses. For periods priorto February 28, 2020, performanceshown is that of the Fund using itsprevious past performance investmentstrategy. Therefore, the pastperformance shown for periods priorto February 28, 2020 may have differedhad the Fund’s current investmentstrategy been in effect. Class R5 shares incepted onMay 24, 2019. Performance shown onand prior to that date is that of thepredecessor fund’s Class A shares atnet asset value and includes the 12b-1fees applicable to Class A shares. The performance data quotedrepresent past performance andcannot guarantee future results;current performance may be
lower or higher. Please visitinvesco.com/performance for the mostrecent month-end performance.Performance figures reflect reinvesteddistributions, changes in net assetvalue and the effect of the maximumsales charge unless otherwise stated.Performance figures do not reflectdeduction of taxes a shareholder wouldpay on Fund distributions or sale ofFund shares. Investment return andprincipal value will fluctuate so that youmay have a gain or loss when you sellshares. Class A share performance reflectsthe maximum 4.25% sales charge, andClass C share performance reflects theapplicable contingent deferred salescharge (CDSC) for the period involved.The CDSC on Class C shares is 1% forthe first year after purchase. Class R,Class Y, Class R5 and Class R6 sharesdo not have a front-end sales charge ora CDSC; therefore, performance is atnet asset value. The performance of the Fund’s shareclasses will differ primarily due todifferent sales charge structures andclass expenses. Fund performance reflects anyapplicable fee waivers and/or expensereimbursements. Had the adviser notwaived fees and/or reimbursedexpenses currently or in the past,returns would have been lower. Seecurrent prospectus for moreinformation.
ˆ200F9gQxdnDwr!bG^Š200F9gQxdnDwr!bG^
209907 EDG 4INVESCOINTERMEDIATE BOND FA
29-Oct-2021 20:26 ESTHTMDTF
Donnelley Financial LSWpf_rendNone
6*ESS 0C
FWPLAN-PFRS5721.10.7.0
Page 1 of 1
4 Invesco Intermediate Bond Factor Fund
Liquidity Risk Management Program
In compliance with Rule 22e-4 under theInvestment Company Act of 1940, asamended (the “Liquidity Rule”), the Fundhas adopted and implemented a liquidityrisk management program inaccordance with the Liquidity Rule (the“Program”). The Program is reasonablydesigned to assess and manage theFund’s liquidity risk, which is the risk thatthe Fund could not meet redemptionrequests without significant dilution ofremaining investors’ interests in theFund. The Board of Trustees of the Fund(the “Board”) has appointed InvescoAdvisers, Inc. (“Invesco”), the Fund’sinvestment adviser, as the Program’sadministrator, and Invesco hasdelegated oversight of the Program tothe Liquidity Risk ManagementCommittee (the “Committee”), which iscomposed of senior representatives fromrelevant business groups at Invesco.
As required by the Liquidity Rule, theProgram includes policies andprocedures providing for an assessment,no less frequently than annually, of theFund’s liquidity risk that takes intoaccount, as relevant to the Fund’sliquidity risk: (1) the Fund’s investmentstrategy and liquidity of portfolioinvestments during both normal andreasonably foreseeable stressedconditions; (2) short-term and long-termcash flow projections for the Fund duringboth normal and reasonably foreseeablestressed conditions; and (3) the Fund’sholdings of cash and cash equivalentsand any borrowing arrangements. TheLiquidity Rule also requires theclassification of the Fund’s investmentsinto categories that reflect theassessment of their relative liquidityunder current market conditions. TheFund classifies its investments into oneof four categories defined in the LiquidityRule: “Highly Liquid,” “ModeratelyLiquid,” “Less Liquid,” and “Illiquid.”Funds that are not invested primarily in“Highly Liquid Investments” that areassets (cash or investments that arereasonably expected to be convertibleinto cash within three business dayswithout significantly changing the marketvalue of the investment) are required toestablish a “Highly Liquid InvestmentMinimum” (“HLIM”), which is theminimum percentage of net assets thatmust be invested in Highly LiquidInvestments. Funds with HLIMs haveprocedures for addressing HLIMshortfalls, including reporting to theBoard and the SEC (on a non-publicbasis) as required by the Program andthe Liquidity Rule. In addition, the Fundmay not acquire an investment if,immediately after the acquisition, over15% of the Fund’s net assets wouldconsist of “Illiquid Investments” that areassets (an investment that cannotreasonably be expected to be sold ordisposed of in current market conditionsin seven calendar days or less
without the sale or disposition significantlychanging the market value of theinvestment). The Liquidity Rule and theProgram also require reporting to theBoard and the SEC (on a non-publicbasis) if a Fund’s holdings of IlliquidInvestments exceed 15% of the Fund’sassets.
At a meeting held on March 22-24, 2021,the Committee presented a report to theBoard that addressed the operation of theProgram and assessed the Program’sadequacy and effectiveness ofimplementation (the “Report”). The Reportcovered the period from January 1, 2020through December 31, 2020 (the“Program Reporting Period”). The Reportdiscussed notable events affectingliquidity over the Program ReportingPeriod, including the impact of thecoronavirus pandemic on the Fund andthe overall market. The Report noted thatthere were no material changes to theProgram during the Program ReportingPeriod.The Report stated, in relevant part, thatduring the Program Reporting Period:
∎ The Program, as adopted andimplemented, remained reasonablydesigned to assess and manage theFund’s liquidity risk and was operatedeffectively to achieve that goal;
∎ The Fund’s investment strategy remainedappropriate for an open-end fund;
∎ The Fund was able to meet requests forredemption without significant dilution ofremaining investors’ interests in the Fund;
∎ The Fund did not breach the 15% limit onIlliquid Investments; and
∎ The Fund primarily held Highly LiquidInvestments and therefore has notadopted an HLIM.
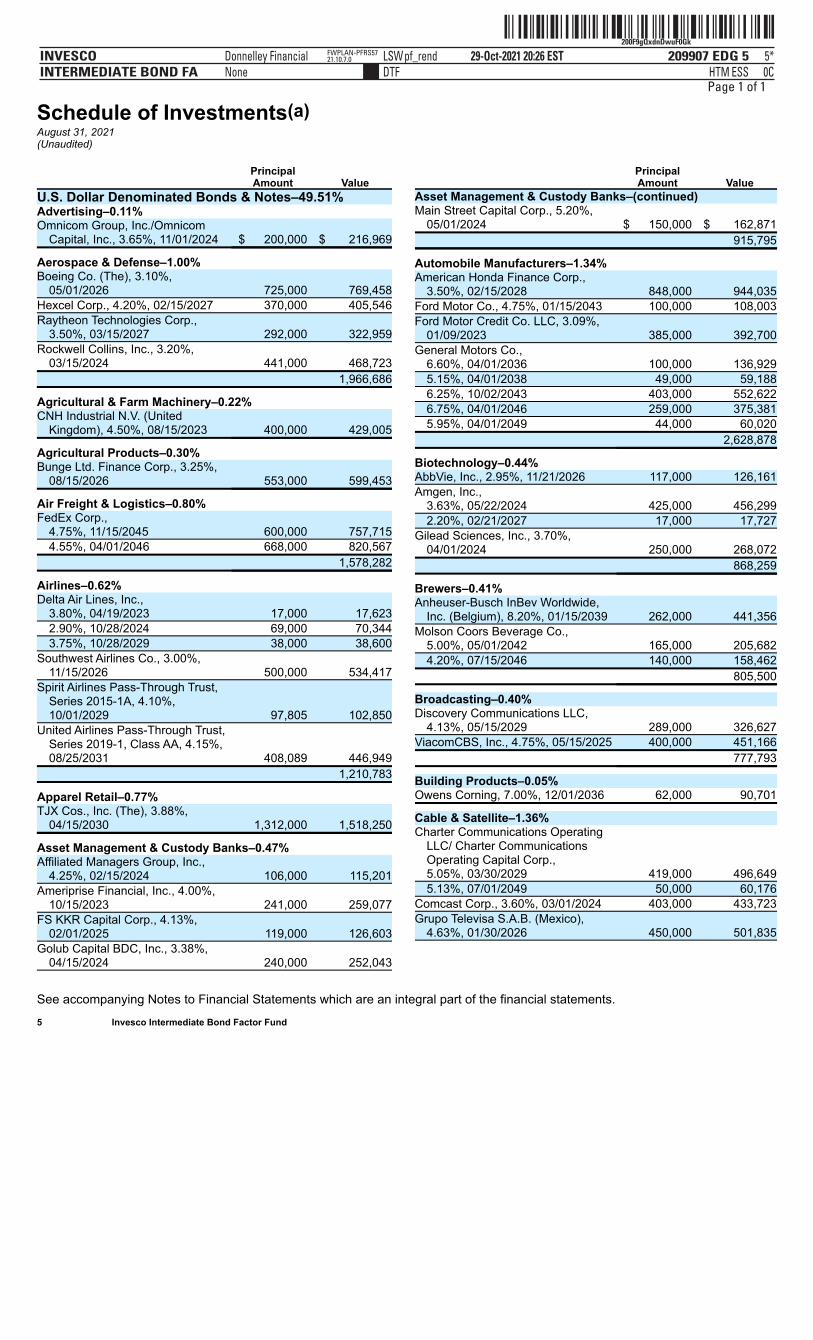
ˆ200F9gQxdnDwuF0GkŠ200F9gQxdnDwuF0Gk
209907 EDG 5INVESCOINTERMEDIATE BOND FA
29-Oct-2021 20:26 ESTHTMDTF
Donnelley Financial LSWpf_rendNone
5*ESS 0C
FWPLAN-PFRS5721.10.7.0
Page 1 of 1
Schedule of Investments(a)August 31, 2021(Unaudited)
See accompanying Notes to Financial Statements which are an integral part of the financial statements. 5 Invesco Intermediate Bond Factor Fund
Principal
Amount ValueU.S. Dollar Denominated Bonds & Notes–49.51%Advertising–0.11% Omnicom Group, Inc./Omnicom
Capital, Inc., 3.65%, 11/01/2024 $ 200,000 $ 216,969
Aerospace & Defense–1.00% Boeing Co. (The), 3.10%,
05/01/2026 725,000 769,458Hexcel Corp., 4.20%, 02/15/2027 370,000 405,546Raytheon Technologies Corp.,
3.50%, 03/15/2027 292,000 322,959Rockwell Collins, Inc., 3.20%,
03/15/2024 441,000 468,723 1,966,686
Agricultural & Farm Machinery–0.22% CNH Industrial N.V. (United
Kingdom), 4.50%, 08/15/2023 400,000 429,005
Agricultural Products–0.30% Bunge Ltd. Finance Corp., 3.25%,
08/15/2026 553,000 599,453
Air Freight & Logistics–0.80% FedEx Corp.,
4.75%, 11/15/2045 600,000 757,7154.55%, 04/01/2046 668,000 820,567
1,578,282
Airlines–0.62% Delta Air Lines, Inc.,
3.80%, 04/19/2023 17,000 17,6232.90%, 10/28/2024 69,000 70,3443.75%, 10/28/2029 38,000 38,600
Southwest Airlines Co., 3.00%,11/15/2026 500,000 534,417
Spirit Airlines Pass-Through Trust,Series 2015-1A, 4.10%,10/01/2029 97,805 102,850
United Airlines Pass-Through Trust,Series 2019-1, Class AA, 4.15%,08/25/2031 408,089 446,949
1,210,783
Apparel Retail–0.77% TJX Cos., Inc. (The), 3.88%,
04/15/2030 1,312,000 1,518,250
Asset Management & Custody Banks–0.47% Affiliated Managers Group, Inc.,
4.25%, 02/15/2024 106,000 115,201Ameriprise Financial, Inc., 4.00%,
10/15/2023 241,000 259,077FS KKR Capital Corp., 4.13%,
02/01/2025 119,000 126,603Golub Capital BDC, Inc., 3.38%,
04/15/2024 240,000 252,043
Principal
Amount ValueAsset Management & Custody Banks–(continued)Main Street Capital Corp., 5.20%,
05/01/2024 $ 150,000 $ 162,871 915,795
Automobile Manufacturers–1.34% American Honda Finance Corp.,
3.50%, 02/15/2028 848,000 944,035Ford Motor Co., 4.75%, 01/15/2043 100,000 108,003Ford Motor Credit Co. LLC, 3.09%,
01/09/2023 385,000 392,700General Motors Co.,
6.60%, 04/01/2036 100,000 136,9295.15%, 04/01/2038 49,000 59,1886.25%, 10/02/2043 403,000 552,6226.75%, 04/01/2046 259,000 375,3815.95%, 04/01/2049 44,000 60,020
2,628,878
Biotechnology–0.44% AbbVie, Inc., 2.95%, 11/21/2026 117,000 126,161Amgen, Inc.,
3.63%, 05/22/2024 425,000 456,2992.20%, 02/21/2027 17,000 17,727
Gilead Sciences, Inc., 3.70%,04/01/2024 250,000 268,072
868,259
Brewers–0.41% Anheuser-Busch InBev Worldwide,
Inc. (Belgium), 8.20%, 01/15/2039 262,000 441,356Molson Coors Beverage Co.,
5.00%, 05/01/2042 165,000 205,6824.20%, 07/15/2046 140,000 158,462
805,500
Broadcasting–0.40% Discovery Communications LLC,
4.13%, 05/15/2029 289,000 326,627ViacomCBS, Inc., 4.75%, 05/15/2025 400,000 451,166 777,793
Building Products–0.05% Owens Corning, 7.00%, 12/01/2036 62,000 90,701
Cable & Satellite–1.36% Charter Communications Operating
LLC/ Charter CommunicationsOperating Capital Corp.,5.05%, 03/30/2029 419,000 496,6495.13%, 07/01/2049 50,000 60,176
Comcast Corp., 3.60%, 03/01/2024 403,000 433,723Grupo Televisa S.A.B. (Mexico),
4.63%, 01/30/2026 450,000 501,835
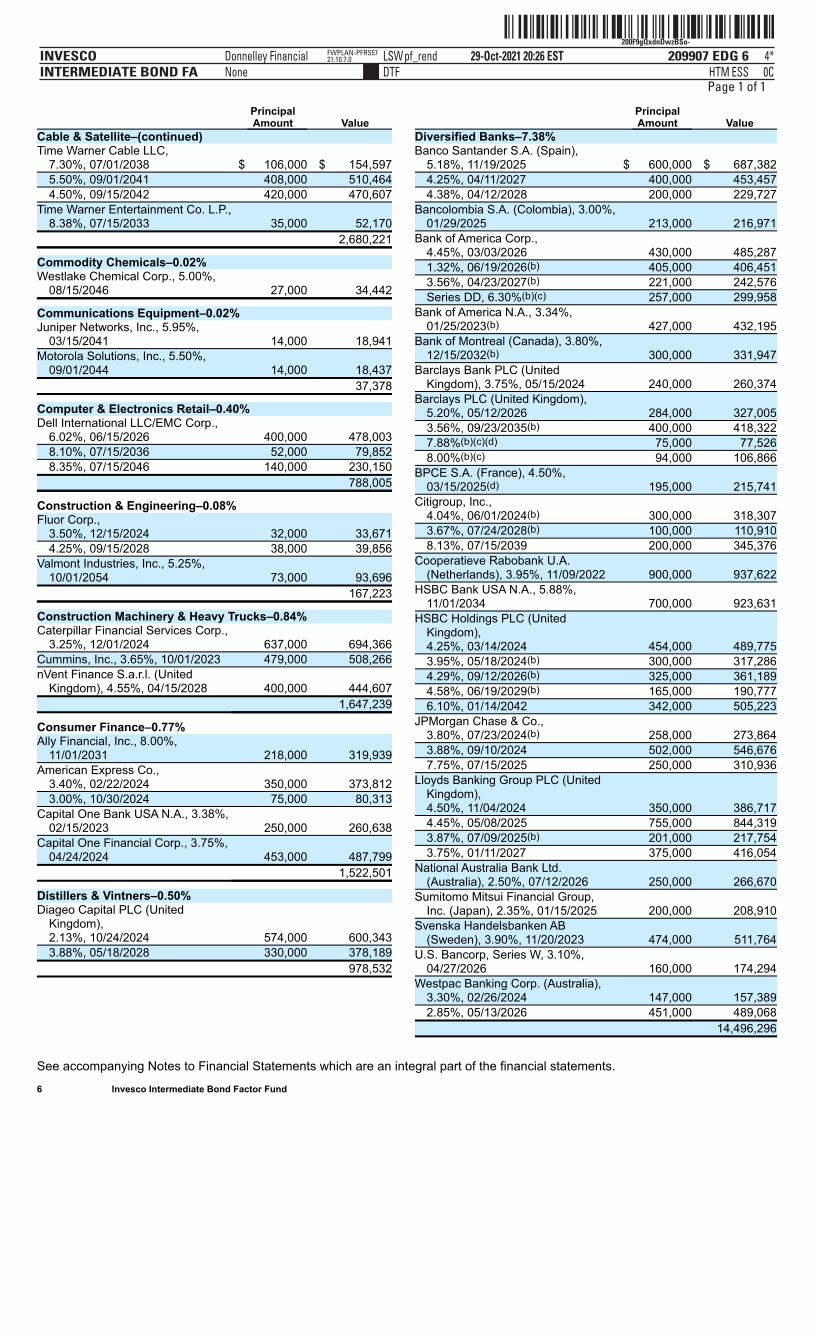
ˆ200F9gQxdnDwzBSo-Š200F9gQxdnDwzBSo-
209907 EDG 6INVESCOINTERMEDIATE BOND FA
29-Oct-2021 20:26 ESTHTMDTF
Donnelley Financial LSWpf_rendNone
4*ESS 0C
FWPLAN-PFRS5721.10.7.0
Page 1 of 1
See accompanying Notes to Financial Statements which are an integral part of the financial statements. 6 Invesco Intermediate Bond Factor Fund
Principal
Amount ValueCable & Satellite–(continued) Time Warner Cable LLC,
7.30%, 07/01/2038 $ 106,000 $ 154,5975.50%, 09/01/2041 408,000 510,4644.50%, 09/15/2042 420,000 470,607
Time Warner Entertainment Co. L.P.,8.38%, 07/15/2033 35,000 52,170
2,680,221
Commodity Chemicals–0.02%Westlake Chemical Corp., 5.00%,
08/15/2046 27,000 34,442
Communications Equipment–0.02%Juniper Networks, Inc., 5.95%,
03/15/2041 14,000 18,941Motorola Solutions, Inc., 5.50%,
09/01/2044 14,000 18,437 37,378
Computer & Electronics Retail–0.40% Dell International LLC/EMC Corp.,
6.02%, 06/15/2026 400,000 478,0038.10%, 07/15/2036 52,000 79,8528.35%, 07/15/2046 140,000 230,150
788,005
Construction & Engineering–0.08%Fluor Corp.,
3.50%, 12/15/2024 32,000 33,6714.25%, 09/15/2028 38,000 39,856
Valmont Industries, Inc., 5.25%,10/01/2054 73,000 93,696
167,223
Construction Machinery & Heavy Trucks–0.84% Caterpillar Financial Services Corp.,
3.25%, 12/01/2024 637,000 694,366Cummins, Inc., 3.65%, 10/01/2023 479,000 508,266nVent Finance S.a.r.l. (United
Kingdom), 4.55%, 04/15/2028 400,000 444,607 1,647,239
Consumer Finance–0.77% Ally Financial, Inc., 8.00%,
11/01/2031 218,000 319,939American Express Co.,
3.40%, 02/22/2024 350,000 373,8123.00%, 10/30/2024 75,000 80,313
Capital One Bank USA N.A., 3.38%,02/15/2023 250,000 260,638
Capital One Financial Corp., 3.75%,04/24/2024 453,000 487,799
1,522,501
Distillers & Vintners–0.50% Diageo Capital PLC (United
Kingdom),2.13%, 10/24/2024 574,000 600,3433.88%, 05/18/2028 330,000 378,189
978,532
Principal
Amount ValueDiversified Banks–7.38% Banco Santander S.A. (Spain),
5.18%, 11/19/2025 $ 600,000 $ 687,3824.25%, 04/11/2027 400,000 453,4574.38%, 04/12/2028 200,000 229,727
Bancolombia S.A. (Colombia), 3.00%,01/29/2025 213,000 216,971
Bank of America Corp.,4.45%, 03/03/2026 430,000 485,2871.32%, 06/19/2026(b) 405,000 406,4513.56%, 04/23/2027(b) 221,000 242,576Series DD, 6.30%(b)(c) 257,000 299,958
Bank of America N.A., 3.34%,01/25/2023(b) 427,000 432,195
Bank of Montreal (Canada), 3.80%,12/15/2032(b) 300,000 331,947
Barclays Bank PLC (UnitedKingdom), 3.75%, 05/15/2024 240,000 260,374
Barclays PLC (United Kingdom),5.20%, 05/12/2026 284,000 327,0053.56%, 09/23/2035(b) 400,000 418,3227.88%(b)(c)(d) 75,000 77,5268.00%(b)(c) 94,000 106,866
BPCE S.A. (France), 4.50%,03/15/2025(d) 195,000 215,741
Citigroup, Inc.,4.04%, 06/01/2024(b) 300,000 318,3073.67%, 07/24/2028(b) 100,000 110,9108.13%, 07/15/2039 200,000 345,376
Cooperatieve Rabobank U.A.(Netherlands), 3.95%, 11/09/2022 900,000 937,622
HSBC Bank USA N.A., 5.88%,11/01/2034 700,000 923,631
HSBC Holdings PLC (UnitedKingdom),4.25%, 03/14/2024 454,000 489,7753.95%, 05/18/2024(b) 300,000 317,2864.29%, 09/12/2026(b) 325,000 361,1894.58%, 06/19/2029(b) 165,000 190,7776.10%, 01/14/2042 342,000 505,223
JPMorgan Chase & Co.,3.80%, 07/23/2024(b) 258,000 273,8643.88%, 09/10/2024 502,000 546,6767.75%, 07/15/2025 250,000 310,936
Lloyds Banking Group PLC (UnitedKingdom),4.50%, 11/04/2024 350,000 386,7174.45%, 05/08/2025 755,000 844,3193.87%, 07/09/2025(b) 201,000 217,7543.75%, 01/11/2027 375,000 416,054
National Australia Bank Ltd.(Australia), 2.50%, 07/12/2026 250,000 266,670
Sumitomo Mitsui Financial Group,Inc. (Japan), 2.35%, 01/15/2025 200,000 208,910
Svenska Handelsbanken AB(Sweden), 3.90%, 11/20/2023 474,000 511,764
U.S. Bancorp, Series W, 3.10%,04/27/2026 160,000 174,294
Westpac Banking Corp. (Australia),3.30%, 02/26/2024 147,000 157,3892.85%, 05/13/2026 451,000 489,068
14,496,296
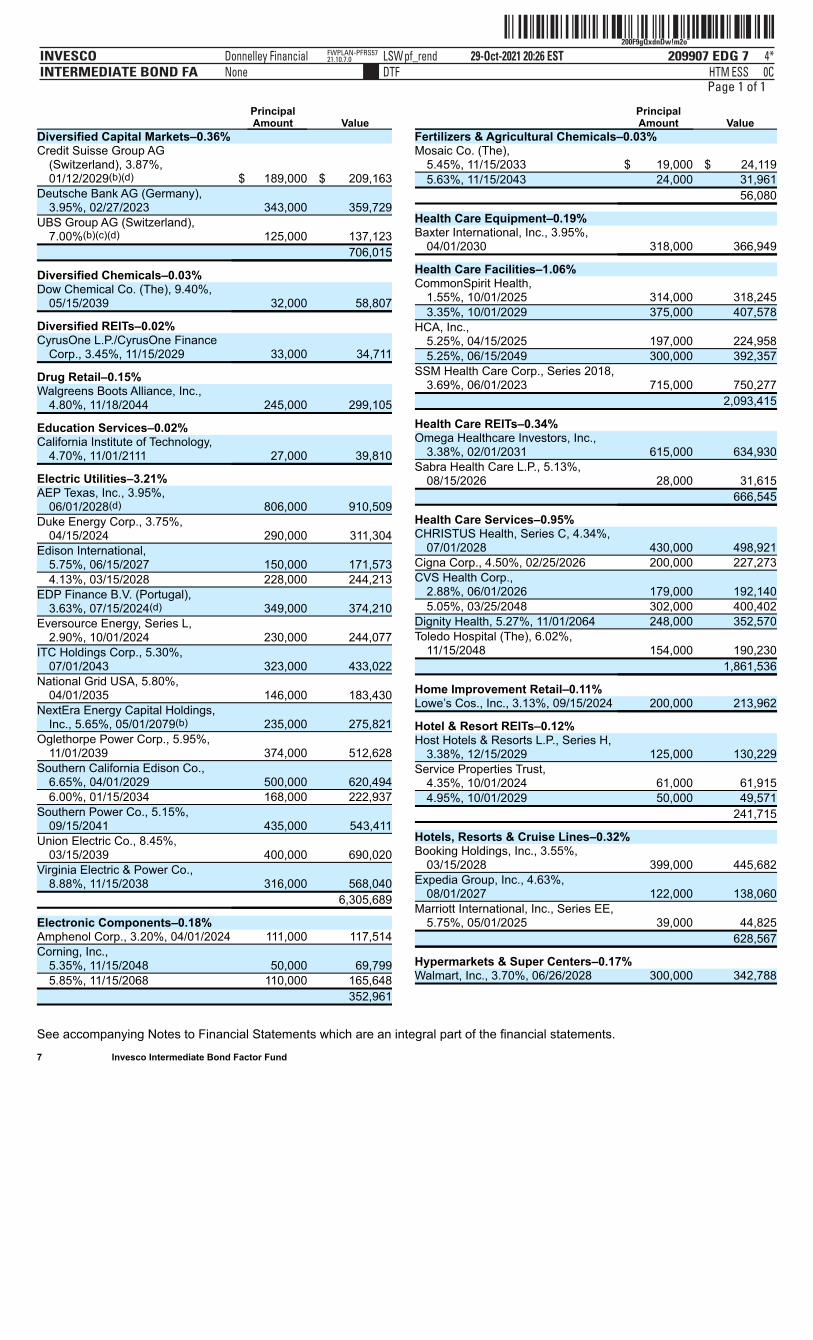
ˆ200F9gQxdnDw!m2oÄŠ200F9gQxdnDw!m2o˜
209907 EDG 7INVESCOINTERMEDIATE BOND FA
29-Oct-2021 20:26 ESTHTMDTF
Donnelley Financial LSWpf_rendNone
4*ESS 0C
FWPLAN-PFRS5721.10.7.0
Page 1 of 1
See accompanying Notes to Financial Statements which are an integral part of the financial statements. 7 Invesco Intermediate Bond Factor Fund
Principal
Amount ValueDiversified Capital Markets–0.36% Credit Suisse Group AG
(Switzerland), 3.87%,01/12/2029(b)(d) $ 189,000 $ 209,163
Deutsche Bank AG (Germany),3.95%, 02/27/2023 343,000 359,729
UBS Group AG (Switzerland),7.00%(b)(c)(d) 125,000 137,123
706,015
Diversified Chemicals–0.03% Dow Chemical Co. (The), 9.40%,
05/15/2039 32,000 58,807
Diversified REITs–0.02% CyrusOne L.P./CyrusOne Finance
Corp., 3.45%, 11/15/2029 33,000 34,711
Drug Retail–0.15% Walgreens Boots Alliance, Inc.,
4.80%, 11/18/2044 245,000 299,105
Education Services–0.02% California Institute of Technology,
4.70%, 11/01/2111 27,000 39,810
Electric Utilities–3.21% AEP Texas, Inc., 3.95%,
06/01/2028(d) 806,000 910,509Duke Energy Corp., 3.75%,
04/15/2024 290,000 311,304Edison International,
5.75%, 06/15/2027 150,000 171,5734.13%, 03/15/2028 228,000 244,213
EDP Finance B.V. (Portugal),3.63%, 07/15/2024(d) 349,000 374,210
Eversource Energy, Series L,2.90%, 10/01/2024 230,000 244,077
ITC Holdings Corp., 5.30%,07/01/2043 323,000 433,022
National Grid USA, 5.80%,04/01/2035 146,000 183,430
NextEra Energy Capital Holdings,Inc., 5.65%, 05/01/2079(b) 235,000 275,821
Oglethorpe Power Corp., 5.95%,11/01/2039 374,000 512,628
Southern California Edison Co.,6.65%, 04/01/2029 500,000 620,4946.00%, 01/15/2034 168,000 222,937
Southern Power Co., 5.15%,09/15/2041 435,000 543,411
Union Electric Co., 8.45%,03/15/2039 400,000 690,020
Virginia Electric & Power Co.,8.88%, 11/15/2038 316,000 568,040
6,305,689
Electronic Components–0.18% Amphenol Corp., 3.20%, 04/01/2024 111,000 117,514Corning, Inc.,
5.35%, 11/15/2048 50,000 69,7995.85%, 11/15/2068 110,000 165,648
352,961
Principal
Amount ValueFertilizers & Agricultural Chemicals–0.03% Mosaic Co. (The),
5.45%, 11/15/2033 $ 19,000 $ 24,1195.63%, 11/15/2043 24,000 31,961
56,080
Health Care Equipment–0.19% Baxter International, Inc., 3.95%,
04/01/2030 318,000 366,949
Health Care Facilities–1.06% CommonSpirit Health,
1.55%, 10/01/2025 314,000 318,2453.35%, 10/01/2029 375,000 407,578
HCA, Inc.,5.25%, 04/15/2025 197,000 224,9585.25%, 06/15/2049 300,000 392,357
SSM Health Care Corp., Series 2018,3.69%, 06/01/2023 715,000 750,277
2,093,415
Health Care REITs–0.34% Omega Healthcare Investors, Inc.,
3.38%, 02/01/2031 615,000 634,930Sabra Health Care L.P., 5.13%,
08/15/2026 28,000 31,615 666,545
Health Care Services–0.95% CHRISTUS Health, Series C, 4.34%,
07/01/2028 430,000 498,921Cigna Corp., 4.50%, 02/25/2026 200,000 227,273CVS Health Corp.,
2.88%, 06/01/2026 179,000 192,1405.05%, 03/25/2048 302,000 400,402
Dignity Health, 5.27%, 11/01/2064 248,000 352,570Toledo Hospital (The), 6.02%,
11/15/2048 154,000 190,230 1,861,536
Home Improvement Retail–0.11% Lowe’s Cos., Inc., 3.13%, 09/15/2024 200,000 213,962
Hotel & Resort REITs–0.12% Host Hotels & Resorts L.P., Series H,
3.38%, 12/15/2029 125,000 130,229Service Properties Trust,
4.35%, 10/01/2024 61,000 61,9154.95%, 10/01/2029 50,000 49,571
241,715
Hotels, Resorts & Cruise Lines–0.32% Booking Holdings, Inc., 3.55%,
03/15/2028 399,000 445,682Expedia Group, Inc., 4.63%,
08/01/2027 122,000 138,060Marriott International, Inc., Series EE,
5.75%, 05/01/2025 39,000 44,825 628,567
Hypermarkets & Super Centers–0.17% Walmart, Inc., 3.70%, 06/26/2028 300,000 342,788
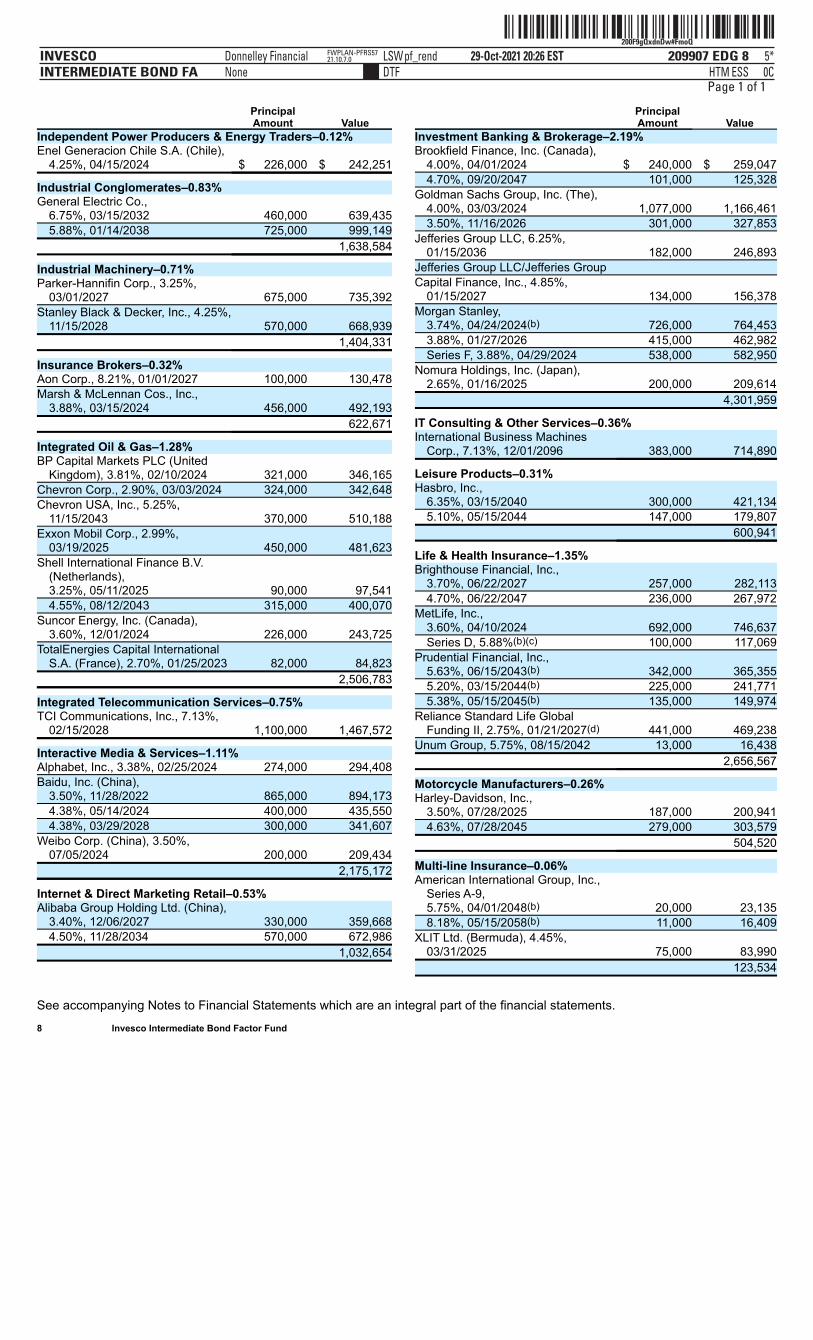
ˆ200F9gQxdnDw#FmoQŠ200F9gQxdnDw#FmoQ
209907 EDG 8INVESCOINTERMEDIATE BOND FA
29-Oct-2021 20:26 ESTHTMDTF
Donnelley Financial LSWpf_rendNone
5*ESS 0C
FWPLAN-PFRS5721.10.7.0
Page 1 of 1
See accompanying Notes to Financial Statements which are an integral part of the financial statements. 8 Invesco Intermediate Bond Factor Fund
Principal
Amount ValueIndependent Power Producers & Energy Traders–0.12%Enel Generacion Chile S.A. (Chile),
4.25%, 04/15/2024 $ 226,000 $ 242,251
Industrial Conglomerates–0.83% General Electric Co.,
6.75%, 03/15/2032 460,000 639,4355.88%, 01/14/2038 725,000 999,149
1,638,584
Industrial Machinery–0.71% Parker-Hannifin Corp., 3.25%,
03/01/2027 675,000 735,392Stanley Black & Decker, Inc., 4.25%,
11/15/2028 570,000 668,939 1,404,331
Insurance Brokers–0.32% Aon Corp., 8.21%, 01/01/2027 100,000 130,478Marsh & McLennan Cos., Inc.,
3.88%, 03/15/2024 456,000 492,193 622,671
Integrated Oil & Gas–1.28% BP Capital Markets PLC (United
Kingdom), 3.81%, 02/10/2024 321,000 346,165Chevron Corp., 2.90%, 03/03/2024 324,000 342,648Chevron USA, Inc., 5.25%,
11/15/2043 370,000 510,188Exxon Mobil Corp., 2.99%,
03/19/2025 450,000 481,623Shell International Finance B.V.
(Netherlands),3.25%, 05/11/2025 90,000 97,5414.55%, 08/12/2043 315,000 400,070
Suncor Energy, Inc. (Canada),3.60%, 12/01/2024 226,000 243,725
TotalEnergies Capital InternationalS.A. (France), 2.70%, 01/25/2023 82,000 84,823
2,506,783
Integrated Telecommunication Services–0.75% TCI Communications, Inc., 7.13%,
02/15/2028 1,100,000 1,467,572
Interactive Media & Services–1.11% Alphabet, Inc., 3.38%, 02/25/2024 274,000 294,408Baidu, Inc. (China),
3.50%, 11/28/2022 865,000 894,1734.38%, 05/14/2024 400,000 435,5504.38%, 03/29/2028 300,000 341,607
Weibo Corp. (China), 3.50%,07/05/2024 200,000 209,434
2,175,172
Internet & Direct Marketing Retail–0.53% Alibaba Group Holding Ltd. (China),
3.40%, 12/06/2027 330,000 359,6684.50%, 11/28/2034 570,000 672,986
1,032,654
Principal
Amount ValueInvestment Banking & Brokerage–2.19% Brookfield Finance, Inc. (Canada),
4.00%, 04/01/2024 $ 240,000 $ 259,0474.70%, 09/20/2047 101,000 125,328
Goldman Sachs Group, Inc. (The),4.00%, 03/03/2024 1,077,000 1,166,4613.50%, 11/16/2026 301,000 327,853
Jefferies Group LLC, 6.25%,01/15/2036 182,000 246,893
Jefferies Group LLC/Jefferies Group Capital Finance, Inc., 4.85%,
01/15/2027 134,000 156,378Morgan Stanley,
3.74%, 04/24/2024(b) 726,000 764,4533.88%, 01/27/2026 415,000 462,982Series F, 3.88%, 04/29/2024 538,000 582,950
Nomura Holdings, Inc. (Japan),2.65%, 01/16/2025 200,000 209,614
4,301,959
IT Consulting & Other Services–0.36% International Business Machines
Corp., 7.13%, 12/01/2096 383,000 714,890
Leisure Products–0.31% Hasbro, Inc.,
6.35%, 03/15/2040 300,000 421,1345.10%, 05/15/2044 147,000 179,807
600,941
Life & Health Insurance–1.35% Brighthouse Financial, Inc.,
3.70%, 06/22/2027 257,000 282,1134.70%, 06/22/2047 236,000 267,972
MetLife, Inc.,3.60%, 04/10/2024 692,000 746,637Series D, 5.88%(b)(c) 100,000 117,069
Prudential Financial, Inc.,5.63%, 06/15/2043(b) 342,000 365,3555.20%, 03/15/2044(b) 225,000 241,7715.38%, 05/15/2045(b) 135,000 149,974
Reliance Standard Life GlobalFunding II, 2.75%, 01/21/2027(d) 441,000 469,238
Unum Group, 5.75%, 08/15/2042 13,000 16,438 2,656,567
Motorcycle Manufacturers–0.26% Harley-Davidson, Inc.,
3.50%, 07/28/2025 187,000 200,9414.63%, 07/28/2045 279,000 303,579
504,520
Multi-line Insurance–0.06% American International Group, Inc.,
Series A-9,5.75%, 04/01/2048(b) 20,000 23,1358.18%, 05/15/2058(b) 11,000 16,409
XLIT Ltd. (Bermuda), 4.45%,03/31/2025 75,000 83,990
123,534
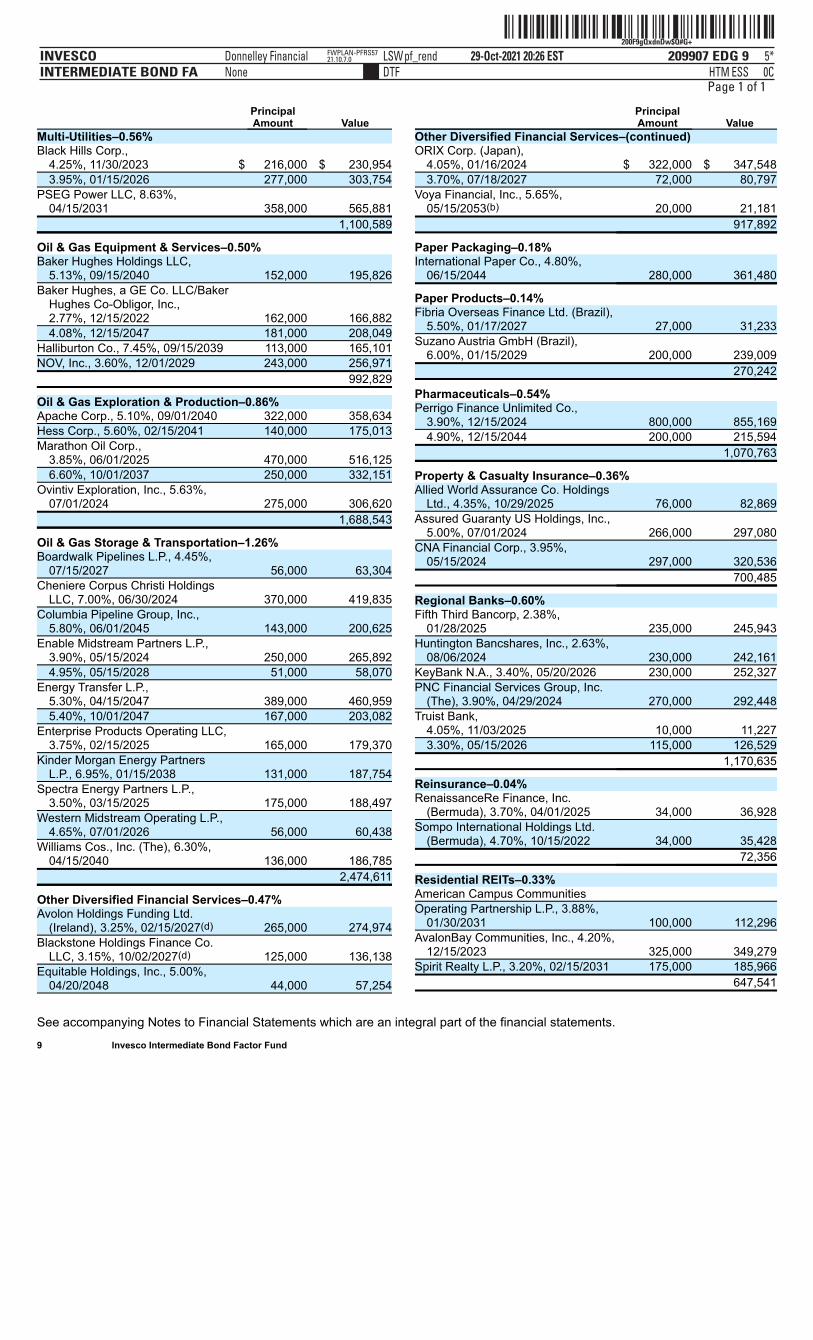
ˆ200F9gQxdnDw$Q#G+Š200F9gQxdnDw$Q#G+
209907 EDG 9INVESCOINTERMEDIATE BOND FA
29-Oct-2021 20:26 ESTHTMDTF
Donnelley Financial LSWpf_rendNone
5*ESS 0C
FWPLAN-PFRS5721.10.7.0
Page 1 of 1
See accompanying Notes to Financial Statements which are an integral part of the financial statements. 9 Invesco Intermediate Bond Factor Fund
Principal
Amount ValueMulti-Utilities–0.56% Black Hills Corp.,
4.25%, 11/30/2023 $ 216,000 $ 230,9543.95%, 01/15/2026 277,000 303,754
PSEG Power LLC, 8.63%,04/15/2031 358,000 565,881
1,100,589
Oil & Gas Equipment & Services–0.50% Baker Hughes Holdings LLC,
5.13%, 09/15/2040 152,000 195,826Baker Hughes, a GE Co. LLC/Baker
Hughes Co-Obligor, Inc.,2.77%, 12/15/2022 162,000 166,8824.08%, 12/15/2047 181,000 208,049
Halliburton Co., 7.45%, 09/15/2039 113,000 165,101NOV, Inc., 3.60%, 12/01/2029 243,000 256,971 992,829
Oil & Gas Exploration & Production–0.86% Apache Corp., 5.10%, 09/01/2040 322,000 358,634Hess Corp., 5.60%, 02/15/2041 140,000 175,013Marathon Oil Corp.,
3.85%, 06/01/2025 470,000 516,1256.60%, 10/01/2037 250,000 332,151
Ovintiv Exploration, Inc., 5.63%,07/01/2024 275,000 306,620
1,688,543
Oil & Gas Storage & Transportation–1.26% Boardwalk Pipelines L.P., 4.45%,
07/15/2027 56,000 63,304Cheniere Corpus Christi Holdings
LLC, 7.00%, 06/30/2024 370,000 419,835Columbia Pipeline Group, Inc.,
5.80%, 06/01/2045 143,000 200,625Enable Midstream Partners L.P.,
3.90%, 05/15/2024 250,000 265,8924.95%, 05/15/2028 51,000 58,070
Energy Transfer L.P.,5.30%, 04/15/2047 389,000 460,9595.40%, 10/01/2047 167,000 203,082
Enterprise Products Operating LLC,3.75%, 02/15/2025 165,000 179,370
Kinder Morgan Energy PartnersL.P., 6.95%, 01/15/2038 131,000 187,754
Spectra Energy Partners L.P.,3.50%, 03/15/2025 175,000 188,497
Western Midstream Operating L.P.,4.65%, 07/01/2026 56,000 60,438
Williams Cos., Inc. (The), 6.30%,04/15/2040 136,000 186,785
2,474,611
Other Diversified Financial Services–0.47% Avolon Holdings Funding Ltd.
(Ireland), 3.25%, 02/15/2027(d) 265,000 274,974Blackstone Holdings Finance Co.
LLC, 3.15%, 10/02/2027(d) 125,000 136,138Equitable Holdings, Inc., 5.00%,
04/20/2048 44,000 57,254
Principal
Amount ValueOther Diversified Financial Services–(continued) ORIX Corp. (Japan),
4.05%, 01/16/2024 $ 322,000 $ 347,5483.70%, 07/18/2027 72,000 80,797
Voya Financial, Inc., 5.65%,05/15/2053(b) 20,000 21,181
917,892
Paper Packaging–0.18% International Paper Co., 4.80%,
06/15/2044 280,000 361,480
Paper Products–0.14% Fibria Overseas Finance Ltd. (Brazil),
5.50%, 01/17/2027 27,000 31,233Suzano Austria GmbH (Brazil),
6.00%, 01/15/2029 200,000 239,009 270,242
Pharmaceuticals–0.54% Perrigo Finance Unlimited Co.,
3.90%, 12/15/2024 800,000 855,1694.90%, 12/15/2044 200,000 215,594
1,070,763
Property & Casualty Insurance–0.36% Allied World Assurance Co. Holdings
Ltd., 4.35%, 10/29/2025 76,000 82,869Assured Guaranty US Holdings, Inc.,
5.00%, 07/01/2024 266,000 297,080CNA Financial Corp., 3.95%,
05/15/2024 297,000 320,536 700,485
Regional Banks–0.60% Fifth Third Bancorp, 2.38%,
01/28/2025 235,000 245,943Huntington Bancshares, Inc., 2.63%,
08/06/2024 230,000 242,161KeyBank N.A., 3.40%, 05/20/2026 230,000 252,327PNC Financial Services Group, Inc.
(The), 3.90%, 04/29/2024 270,000 292,448Truist Bank,
4.05%, 11/03/2025 10,000 11,2273.30%, 05/15/2026 115,000 126,529
1,170,635
Reinsurance–0.04% RenaissanceRe Finance, Inc.
(Bermuda), 3.70%, 04/01/2025 34,000 36,928Sompo International Holdings Ltd.
(Bermuda), 4.70%, 10/15/2022 34,000 35,428 72,356
Residential REITs–0.33% American Campus Communities Operating Partnership L.P., 3.88%,
01/30/2031 100,000 112,296AvalonBay Communities, Inc., 4.20%,
12/15/2023 325,000 349,279Spirit Realty L.P., 3.20%, 02/15/2031 175,000 185,966 647,541
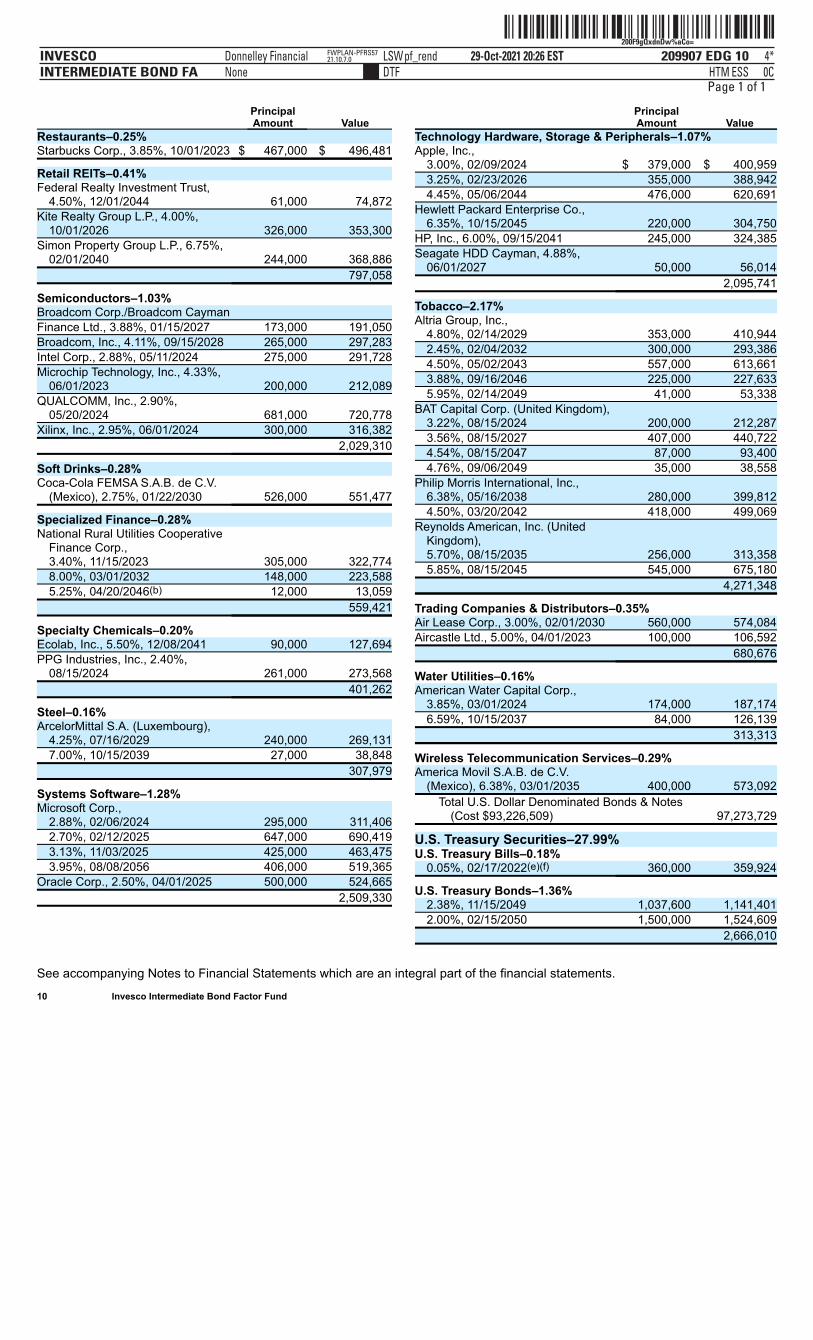
ˆ200F9gQxdnDw%aCo=Š200F9gQxdnDw%aCo=
209907 EDG 10INVESCOINTERMEDIATE BOND FA
29-Oct-2021 20:26 ESTHTMDTF
Donnelley Financial LSWpf_rendNone
4*ESS 0C
FWPLAN-PFRS5721.10.7.0
Page 1 of 1
See accompanying Notes to Financial Statements which are an integral part of the financial statements. 10 Invesco Intermediate Bond Factor Fund
Principal
Amount ValueRestaurants–0.25% Starbucks Corp., 3.85%, 10/01/2023 $ 467,000 $ 496,481
Retail REITs–0.41% Federal Realty Investment Trust,
4.50%, 12/01/2044 61,000 74,872Kite Realty Group L.P., 4.00%,
10/01/2026 326,000 353,300Simon Property Group L.P., 6.75%,
02/01/2040 244,000 368,886 797,058
Semiconductors–1.03% Broadcom Corp./Broadcom Cayman Finance Ltd., 3.88%, 01/15/2027 173,000 191,050Broadcom, Inc., 4.11%, 09/15/2028 265,000 297,283Intel Corp., 2.88%, 05/11/2024 275,000 291,728Microchip Technology, Inc., 4.33%,
06/01/2023 200,000 212,089QUALCOMM, Inc., 2.90%,
05/20/2024 681,000 720,778Xilinx, Inc., 2.95%, 06/01/2024 300,000 316,382 2,029,310
Soft Drinks–0.28% Coca-Cola FEMSA S.A.B. de C.V.
(Mexico), 2.75%, 01/22/2030 526,000 551,477
Specialized Finance–0.28% National Rural Utilities Cooperative
Finance Corp.,3.40%, 11/15/2023 305,000 322,7748.00%, 03/01/2032 148,000 223,5885.25%, 04/20/2046(b) 12,000 13,059
559,421
Specialty Chemicals–0.20% Ecolab, Inc., 5.50%, 12/08/2041 90,000 127,694PPG Industries, Inc., 2.40%,
08/15/2024 261,000 273,568 401,262
Steel–0.16% ArcelorMittal S.A. (Luxembourg),
4.25%, 07/16/2029 240,000 269,1317.00%, 10/15/2039 27,000 38,848
307,979
Systems Software–1.28% Microsoft Corp.,
2.88%, 02/06/2024 295,000 311,4062.70%, 02/12/2025 647,000 690,4193.13%, 11/03/2025 425,000 463,4753.95%, 08/08/2056 406,000 519,365
Oracle Corp., 2.50%, 04/01/2025 500,000 524,665 2,509,330
Principal
Amount ValueTechnology Hardware, Storage & Peripherals–1.07%Apple, Inc.,
3.00%, 02/09/2024 $ 379,000 $ 400,9593.25%, 02/23/2026 355,000 388,9424.45%, 05/06/2044 476,000 620,691
Hewlett Packard Enterprise Co.,6.35%, 10/15/2045 220,000 304,750
HP, Inc., 6.00%, 09/15/2041 245,000 324,385Seagate HDD Cayman, 4.88%,
06/01/2027 50,000 56,014 2,095,741
Tobacco–2.17% Altria Group, Inc.,
4.80%, 02/14/2029 353,000 410,9442.45%, 02/04/2032 300,000 293,3864.50%, 05/02/2043 557,000 613,6613.88%, 09/16/2046 225,000 227,6335.95%, 02/14/2049 41,000 53,338
BAT Capital Corp. (United Kingdom),3.22%, 08/15/2024 200,000 212,2873.56%, 08/15/2027 407,000 440,7224.54%, 08/15/2047 87,000 93,4004.76%, 09/06/2049 35,000 38,558
Philip Morris International, Inc.,6.38%, 05/16/2038 280,000 399,8124.50%, 03/20/2042 418,000 499,069
Reynolds American, Inc. (UnitedKingdom),5.70%, 08/15/2035 256,000 313,3585.85%, 08/15/2045 545,000 675,180
4,271,348
Trading Companies & Distributors–0.35% Air Lease Corp., 3.00%, 02/01/2030 560,000 574,084Aircastle Ltd., 5.00%, 04/01/2023 100,000 106,592 680,676
Water Utilities–0.16% American Water Capital Corp.,
3.85%, 03/01/2024 174,000 187,1746.59%, 10/15/2037 84,000 126,139
313,313
Wireless Telecommunication Services–0.29% America Movil S.A.B. de C.V.
(Mexico), 6.38%, 03/01/2035 400,000 573,092Total U.S. Dollar Denominated Bonds & Notes
(Cost $93,226,509) 97,273,729
U.S. Treasury Securities–27.99% U.S. Treasury Bills–0.18%
0.05%, 02/17/2022(e)(f) 360,000 359,924
U.S. Treasury Bonds–1.36% 2.38%, 11/15/2049 1,037,600 1,141,4012.00%, 02/15/2050 1,500,000 1,524,609
2,666,010
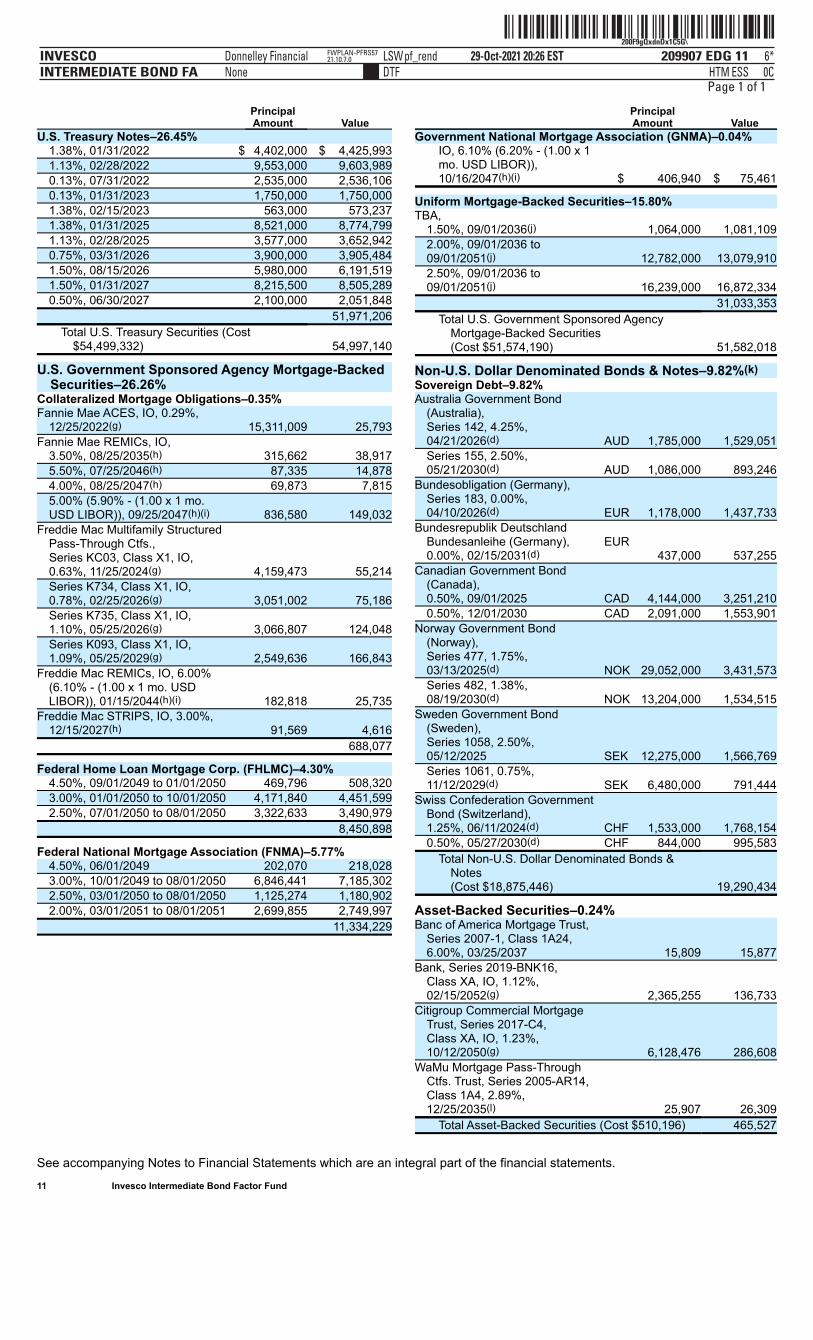
ˆ200F9gQxdnDx1C5G\Š200F9gQxdnDx1C5G\
209907 EDG 11INVESCOINTERMEDIATE BOND FA
29-Oct-2021 20:26 ESTHTMDTF
Donnelley Financial LSWpf_rendNone
6*ESS 0C
FWPLAN-PFRS5721.10.7.0
Page 1 of 1
See accompanying Notes to Financial Statements which are an integral part of the financial statements. 11 Invesco Intermediate Bond Factor Fund
Principal
Amount ValueU.S. Treasury Notes–26.45%
1.38%, 01/31/2022 $ 4,402,000 $ 4,425,9931.13%, 02/28/2022 9,553,000 9,603,9890.13%, 07/31/2022 2,535,000 2,536,1060.13%, 01/31/2023 1,750,000 1,750,0001.38%, 02/15/2023 563,000 573,2371.38%, 01/31/2025 8,521,000 8,774,7991.13%, 02/28/2025 3,577,000 3,652,9420.75%, 03/31/2026 3,900,000 3,905,4841.50%, 08/15/2026 5,980,000 6,191,5191.50%, 01/31/2027 8,215,500 8,505,2890.50%, 06/30/2027 2,100,000 2,051,848
51,971,206Total U.S. Treasury Securities (Cost
$54,499,332) 54,997,140
U.S. Government Sponsored Agency Mortgage-BackedSecurities–26.26%
Collateralized Mortgage Obligations–0.35% Fannie Mae ACES, IO, 0.29%,
12/25/2022(g) 15,311,009 25,793Fannie Mae REMICs, IO,
3.50%, 08/25/2035(h) 315,662 38,9175.50%, 07/25/2046(h) 87,335 14,8784.00%, 08/25/2047(h) 69,873 7,8155.00% (5.90% - (1.00 x 1 mo.USD LIBOR)), 09/25/2047(h)(i) 836,580 149,032
Freddie Mac Multifamily StructuredPass-Through Ctfs.,Series KC03, Class X1, IO,0.63%, 11/25/2024(g) 4,159,473 55,214Series K734, Class X1, IO,0.78%, 02/25/2026(g) 3,051,002 75,186Series K735, Class X1, IO,1.10%, 05/25/2026(g) 3,066,807 124,048Series K093, Class X1, IO,1.09%, 05/25/2029(g) 2,549,636 166,843
Freddie Mac REMICs, IO, 6.00%(6.10% - (1.00 x 1 mo. USDLIBOR)), 01/15/2044(h)(i) 182,818 25,735
Freddie Mac STRIPS, IO, 3.00%,12/15/2027(h) 91,569 4,616
688,077
Federal Home Loan Mortgage Corp. (FHLMC)–4.30%4.50%, 09/01/2049 to 01/01/2050 469,796 508,3203.00%, 01/01/2050 to 10/01/2050 4,171,840 4,451,5992.50%, 07/01/2050 to 08/01/2050 3,322,633 3,490,979
8,450,898
Federal National Mortgage Association (FNMA)–5.77%4.50%, 06/01/2049 202,070 218,0283.00%, 10/01/2049 to 08/01/2050 6,846,441 7,185,3022.50%, 03/01/2050 to 08/01/2050 1,125,274 1,180,9022.00%, 03/01/2051 to 08/01/2051 2,699,855 2,749,997
11,334,229
Principal
Amount ValueGovernment National Mortgage Association (GNMA)–0.04%
IO, 6.10% (6.20% - (1.00 x 1mo. USD LIBOR)),10/16/2047(h)(i) $ 406,940 $ 75,461
Uniform Mortgage-Backed Securities–15.80% TBA,
1.50%, 09/01/2036(j) 1,064,000 1,081,1092.00%, 09/01/2036 to09/01/2051(j) 12,782,000 13,079,9102.50%, 09/01/2036 to09/01/2051(j) 16,239,000 16,872,334
31,033,353Total U.S. Government Sponsored Agency
Mortgage-Backed Securities(Cost $51,574,190)
51,582,018
Non-U.S. Dollar Denominated Bonds & Notes–9.82%(k)Sovereign Debt–9.82% Australia Government Bond
(Australia),Series 142, 4.25%,04/21/2026(d) AUD 1,785,000 1,529,051Series 155, 2.50%,05/21/2030(d) AUD 1,086,000 893,246
Bundesobligation (Germany),Series 183, 0.00%,04/10/2026(d) EUR 1,178,000 1,437,733
Bundesrepublik DeutschlandBundesanleihe (Germany),0.00%, 02/15/2031(d)
EUR 437,000 537,255
Canadian Government Bond(Canada),0.50%, 09/01/2025 CAD 4,144,000 3,251,2100.50%, 12/01/2030 CAD 2,091,000 1,553,901
Norway Government Bond(Norway),Series 477, 1.75%,03/13/2025(d) NOK 29,052,000 3,431,573Series 482, 1.38%,08/19/2030(d) NOK 13,204,000 1,534,515
Sweden Government Bond(Sweden),Series 1058, 2.50%,05/12/2025 SEK 12,275,000 1,566,769Series 1061, 0.75%,11/12/2029(d) SEK 6,480,000 791,444
Swiss Confederation GovernmentBond (Switzerland),1.25%, 06/11/2024(d) CHF 1,533,000 1,768,1540.50%, 05/27/2030(d) CHF 844,000 995,583
Total Non-U.S. Dollar Denominated Bonds &Notes(Cost $18,875,446)
19,290,434
Asset-Backed Securities–0.24% Banc of America Mortgage Trust,
Series 2007-1, Class 1A24,6.00%, 03/25/2037 15,809 15,877
Bank, Series 2019-BNK16,Class XA, IO, 1.12%,02/15/2052(g) 2,365,255 136,733
Citigroup Commercial MortgageTrust, Series 2017-C4,Class XA, IO, 1.23%,10/12/2050(g) 6,128,476 286,608
WaMu Mortgage Pass-ThroughCtfs. Trust, Series 2005-AR14,Class 1A4, 2.89%,12/25/2035(l) 25,907 26,309
Total Asset-Backed Securities (Cost $510,196) 465,527
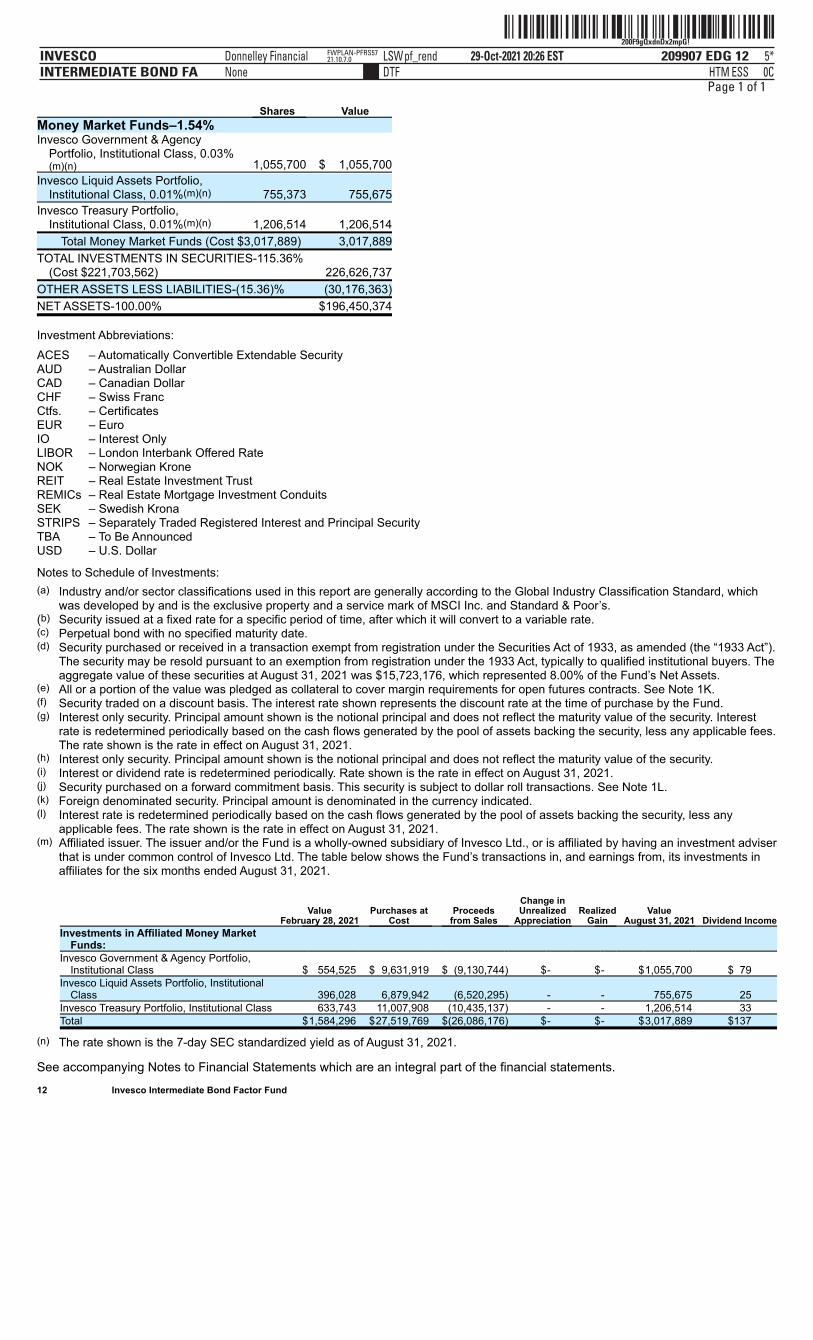
ˆ200F9gQxdnDx2mpG!Š200F9gQxdnDx2mpG!
209907 EDG 12INVESCOINTERMEDIATE BOND FA
29-Oct-2021 20:26 ESTHTMDTF
Donnelley Financial LSWpf_rendNone
5*ESS 0C
FWPLAN-PFRS5721.10.7.0
Page 1 of 1
Investment Abbreviations:
ACES – Automatically Convertible Extendable SecurityAUD – Australian DollarCAD – Canadian DollarCHF – Swiss FrancCtfs. – CertificatesEUR – EuroIO – Interest OnlyLIBOR – London Interbank Offered RateNOK – Norwegian KroneREIT – Real Estate Investment TrustREMICs – Real Estate Mortgage Investment ConduitsSEK – Swedish KronaSTRIPS – Separately Traded Registered Interest and Principal SecurityTBA – To Be AnnouncedUSD – U.S. Dollar
Notes to Schedule of Investments:
(a) Industry and/or sector classifications used in this report are generally according to the Global Industry Classification Standard, whichwas developed by and is the exclusive property and a service mark of MSCI Inc. and Standard & Poor’s.
(b) Security issued at a fixed rate for a specific period of time, after which it will convert to a variable rate.(c) Perpetual bond with no specified maturity date.(d) Security purchased or received in a transaction exempt from registration under the Securities Act of 1933, as amended (the “1933 Act”).
The security may be resold pursuant to an exemption from registration under the 1933 Act, typically to qualified institutional buyers. Theaggregate value of these securities at August 31, 2021 was $15,723,176, which represented 8.00% of the Fund’s Net Assets.
(e) All or a portion of the value was pledged as collateral to cover margin requirements for open futures contracts. See Note 1K.(f) Security traded on a discount basis. The interest rate shown represents the discount rate at the time of purchase by the Fund.(g) Interest only security. Principal amount shown is the notional principal and does not reflect the maturity value of the security. Interest
rate is redetermined periodically based on the cash flows generated by the pool of assets backing the security, less any applicable fees.The rate shown is the rate in effect on August 31, 2021.
(h) Interest only security. Principal amount shown is the notional principal and does not reflect the maturity value of the security.(i) Interest or dividend rate is redetermined periodically. Rate shown is the rate in effect on August 31, 2021.(j) Security purchased on a forward commitment basis. This security is subject to dollar roll transactions. See Note 1L.(k) Foreign denominated security. Principal amount is denominated in the currency indicated.(l) Interest rate is redetermined periodically based on the cash flows generated by the pool of assets backing the security, less any
applicable fees. The rate shown is the rate in effect on August 31, 2021.(m) Affiliated issuer. The issuer and/or the Fund is a wholly-owned subsidiary of Invesco Ltd., or is affiliated by having an investment adviser
that is under common control of Invesco Ltd. The table below shows the Fund’s transactions in, and earnings from, its investments inaffiliates for the six months ended August 31, 2021.
Value
February 28, 2021 Purchases at
Cost Proceeds
from Sales
Change inUnrealized
Appreciation Realized
Gain Value
August 31, 2021 Dividend IncomeInvestments in Affiliated Money Market
Funds: Invesco Government & Agency Portfolio,
Institutional Class $ 554,525 $ 9,631,919 $ (9,130,744) $- $- $1,055,700 $ 79Invesco Liquid Assets Portfolio, Institutional
Class 396,028 6,879,942 (6,520,295) - - 755,675 25Invesco Treasury Portfolio, Institutional Class 633,743 11,007,908 (10,435,137) - - 1,206,514 33Total $1,584,296 $27,519,769 $(26,086,176) $- $- $3,017,889 $137
(n) The rate shown is the 7-day SEC standardized yield as of August 31, 2021.
See accompanying Notes to Financial Statements which are an integral part of the financial statements. 12 Invesco Intermediate Bond Factor Fund
Shares ValueMoney Market Funds–1.54% Invesco Government & Agency
Portfolio, Institutional Class, 0.03%(m)(n) 1,055,700 $ 1,055,700
Invesco Liquid Assets Portfolio,Institutional Class, 0.01%(m)(n) 755,373 755,675
Invesco Treasury Portfolio,Institutional Class, 0.01%(m)(n) 1,206,514 1,206,514
Total Money Market Funds (Cost $3,017,889) 3,017,889
TOTAL INVESTMENTS IN SECURITIES-115.36%(Cost $221,703,562)
226,626,737
OTHER ASSETS LESS LIABILITIES-(15.36)% (30,176,363)
NET ASSETS-100.00% $196,450,374
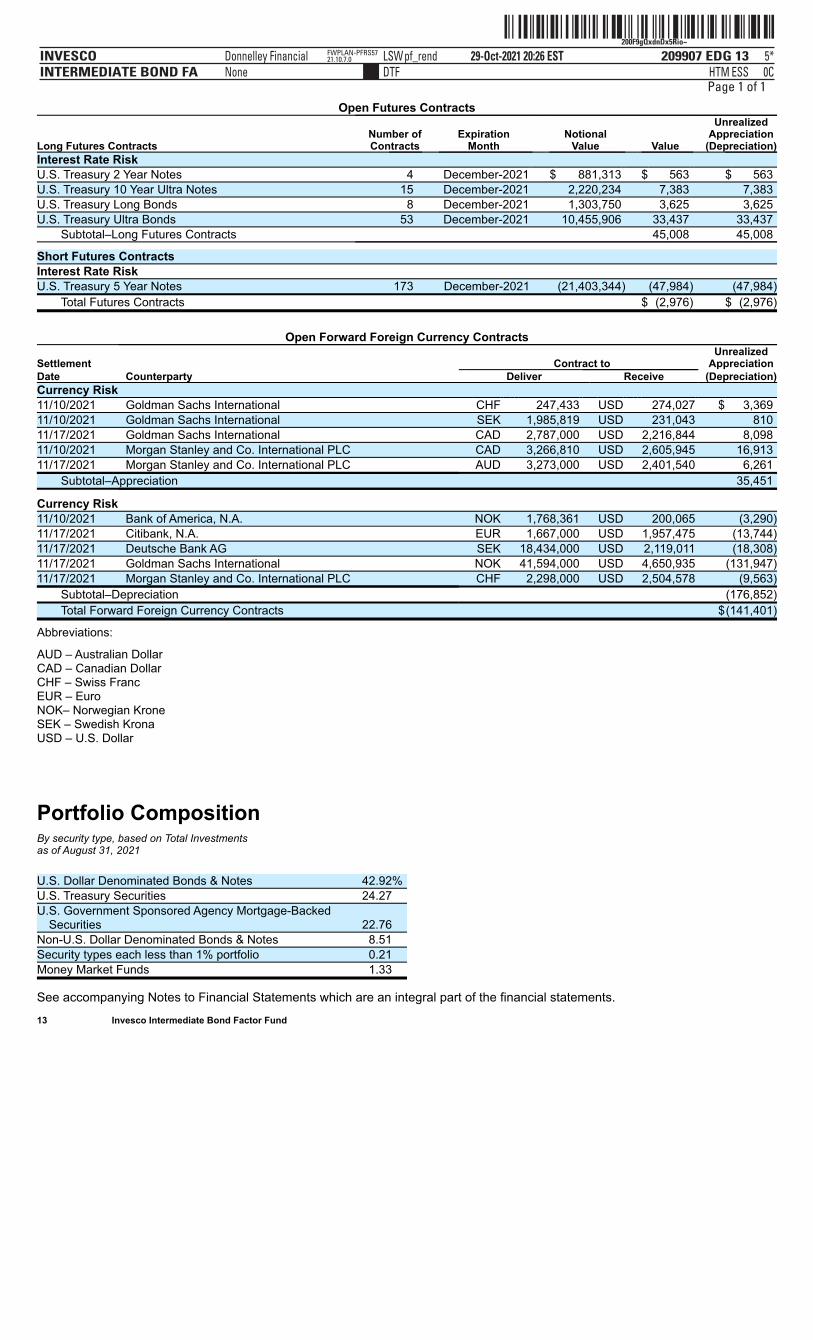
ˆ200F9gQxdnDx5Rio~Š200F9gQxdnDx5Rio~
209907 EDG 13INVESCOINTERMEDIATE BOND FA
29-Oct-2021 20:26 ESTHTMDTF
Donnelley Financial LSWpf_rendNone
5*ESS 0C
FWPLAN-PFRS5721.10.7.0
Page 1 of 1Open Futures Contracts
Long Futures Contracts Number ofContracts
ExpirationMonth
NotionalValue Value
UnrealizedAppreciation
(Depreciation)Interest Rate Risk U.S. Treasury 2 Year Notes 4 December-2021 $ 881,313 $ 563 $ 563U.S. Treasury 10 Year Ultra Notes 15 December-2021 2,220,234 7,383 7,383 U.S. Treasury Long Bonds 8 December-2021 1,303,750 3,625 3,625 U.S. Treasury Ultra Bonds 53 December-2021 10,455,906 33,437 33,437
Subtotal–Long Futures Contracts 45,008 45,008
Short Futures Contracts Interest Rate Risk U.S. Treasury 5 Year Notes 173 December-2021 (21,403,344) (47,984) (47,984)
Total Futures Contracts $ (2,976) $ (2,976)
Open Forward Foreign Currency Contracts
Settlement Contract to Unrealized
AppreciationDate Counterparty Deliver Receive (Depreciation)Currency Risk 11/10/2021 Goldman Sachs International CHF 247,433 USD 274,027 $ 3,36911/10/2021 Goldman Sachs International SEK 1,985,819 USD 231,043 81011/17/2021 Goldman Sachs International CAD 2,787,000 USD 2,216,844 8,09811/10/2021 Morgan Stanley and Co. International PLC CAD 3,266,810 USD 2,605,945 16,91311/17/2021 Morgan Stanley and Co. International PLC AUD 3,273,000 USD 2,401,540 6,261
Subtotal–Appreciation 35,451
Currency Risk 11/10/2021 Bank of America, N.A. NOK 1,768,361 USD 200,065 (3,290)11/17/2021 Citibank, N.A. EUR 1,667,000 USD 1,957,475 (13,744)11/17/2021 Deutsche Bank AG SEK 18,434,000 USD 2,119,011 (18,308)11/17/2021 Goldman Sachs International NOK 41,594,000 USD 4,650,935 (131,947)11/17/2021 Morgan Stanley and Co. International PLC CHF 2,298,000 USD 2,504,578 (9,563)
Subtotal–Depreciation (176,852)Total Forward Foreign Currency Contracts $(141,401)
Abbreviations:
AUD – Australian DollarCAD – Canadian DollarCHF – Swiss FrancEUR – EuroNOK– Norwegian KroneSEK – Swedish KronaUSD – U.S. Dollar
Portfolio CompositionBy security type, based on Total Investmentsas of August 31, 2021 U.S. Dollar Denominated Bonds & Notes 42.92% U.S. Treasury Securities 24.27 U.S. Government Sponsored Agency Mortgage-Backed
Securities 22.76 Non-U.S. Dollar Denominated Bonds & Notes 8.51 Security types each less than 1% portfolio 0.21 Money Market Funds 1.33
See accompanying Notes to Financial Statements which are an integral part of the financial statements. 13 Invesco Intermediate Bond Factor Fund
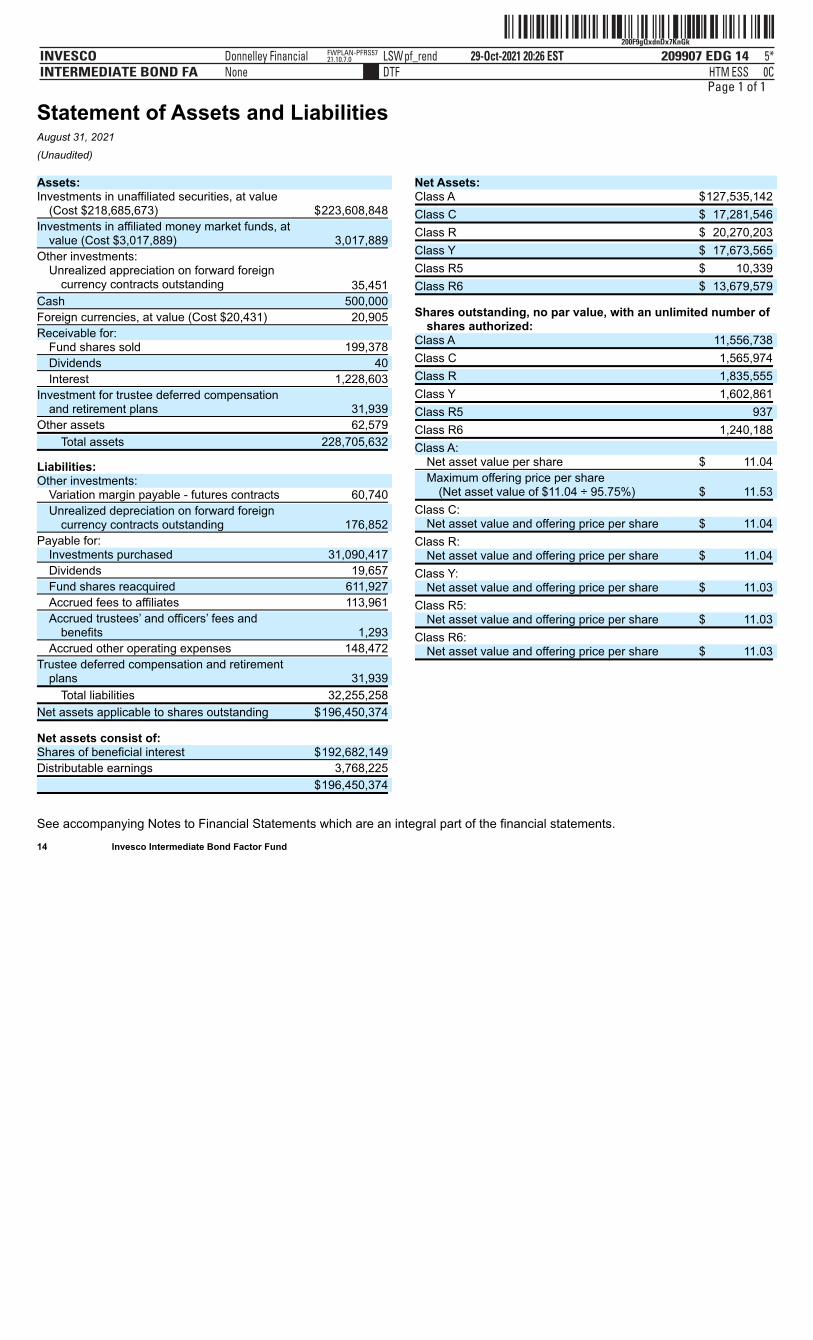
ˆ200F9gQxdnDx7KnGkŠ200F9gQxdnDx7KnGk
209907 EDG 14INVESCOINTERMEDIATE BOND FA
29-Oct-2021 20:26 ESTHTMDTF
Donnelley Financial LSWpf_rendNone
5*ESS 0C
FWPLAN-PFRS5721.10.7.0
Page 1 of 1
Statement of Assets and LiabilitiesAugust 31, 2021
(Unaudited)
See accompanying Notes to Financial Statements which are an integral part of the financial statements. 14 Invesco Intermediate Bond Factor Fund
Assets: Investments in unaffiliated securities, at value
(Cost $218,685,673) $223,608,848
Investments in affiliated money market funds, atvalue (Cost $3,017,889) 3,017,889
Other investments:Unrealized appreciation on forward foreign
currency contracts outstanding 35,451
Cash 500,000
Foreign currencies, at value (Cost $20,431) 20,905
Receivable for: Fund shares sold 199,378
Dividends 40
Interest 1,228,603
Investment for trustee deferred compensationand retirement plans 31,939
Other assets 62,579
Total assets 228,705,632
Liabilities: Other investments:
Variation margin payable - futures contracts 60,740
Unrealized depreciation on forward foreigncurrency contracts outstanding 176,852
Payable for: Investments purchased 31,090,417
Dividends 19,657
Fund shares reacquired 611,927
Accrued fees to affiliates 113,961
Accrued trustees’ and officers’ fees andbenefits 1,293
Accrued other operating expenses 148,472
Trustee deferred compensation and retirementplans 31,939
Total liabilities 32,255,258
Net assets applicable to shares outstanding $196,450,374
Net assets consist of: Shares of beneficial interest $192,682,149
Distributable earnings 3,768,225
$196,450,374
Net Assets: Class A $127,535,142
Class C $ 17,281,546
Class R $ 20,270,203
Class Y $ 17,673,565
Class R5 $ 10,339
Class R6 $ 13,679,579
Shares outstanding, no par value, with an unlimited number ofshares authorized:
Class A 11,556,738
Class C 1,565,974
Class R 1,835,555
Class Y 1,602,861
Class R5 937
Class R6 1,240,188
Class A: Net asset value per share $ 11.04
Maximum offering price per share(Net asset value of $11.04 ÷ 95.75%) $ 11.53
Class C: Net asset value and offering price per share $ 11.04
Class R: Net asset value and offering price per share $ 11.04
Class Y: Net asset value and offering price per share $ 11.03
Class R5: Net asset value and offering price per share $ 11.03
Class R6: Net asset value and offering price per share $ 11.03
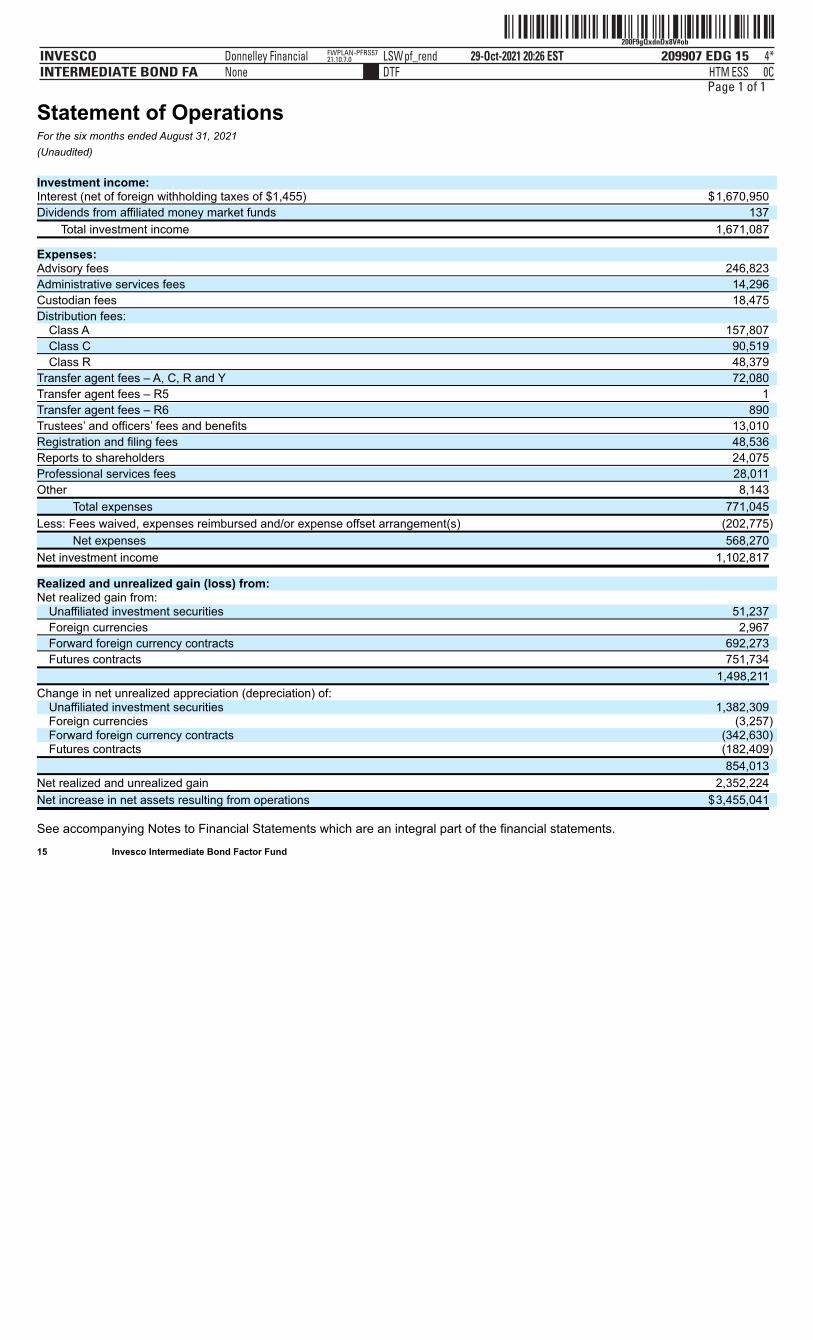
ˆ200F9gQxdnDx8V#obŠ200F9gQxdnDx8V#ob
209907 EDG 15INVESCOINTERMEDIATE BOND FA
29-Oct-2021 20:26 ESTHTMDTF
Donnelley Financial LSWpf_rendNone
4*ESS 0C
FWPLAN-PFRS5721.10.7.0
Page 1 of 1
Statement of OperationsFor the six months ended August 31, 2021(Unaudited) Investment income: Interest (net of foreign withholding taxes of $1,455) $1,670,950
Dividends from affiliated money market funds 137
Total investment income 1,671,087
Expenses: Advisory fees 246,823
Administrative services fees 14,296
Custodian fees 18,475
Distribution fees: Class A 157,807
Class C 90,519
Class R 48,379
Transfer agent fees – A, C, R and Y 72,080
Transfer agent fees – R5 1
Transfer agent fees – R6 890
Trustees’ and officers’ fees and benefits 13,010
Registration and filing fees 48,536
Reports to shareholders 24,075
Professional services fees 28,011
Other 8,143
Total expenses 771,045
Less: Fees waived, expenses reimbursed and/or expense offset arrangement(s) (202,775)
Net expenses 568,270
Net investment income 1,102,817
Realized and unrealized gain (loss) from: Net realized gain from:
Unaffiliated investment securities 51,237
Foreign currencies 2,967
Forward foreign currency contracts 692,273
Futures contracts 751,734
1,498,211
Change in net unrealized appreciation (depreciation) of: Unaffiliated investment securities 1,382,309 Foreign currencies (3,257) Forward foreign currency contracts (342,630) Futures contracts (182,409)
854,013
Net realized and unrealized gain 2,352,224
Net increase in net assets resulting from operations $3,455,041
See accompanying Notes to Financial Statements which are an integral part of the financial statements. 15 Invesco Intermediate Bond Factor Fund
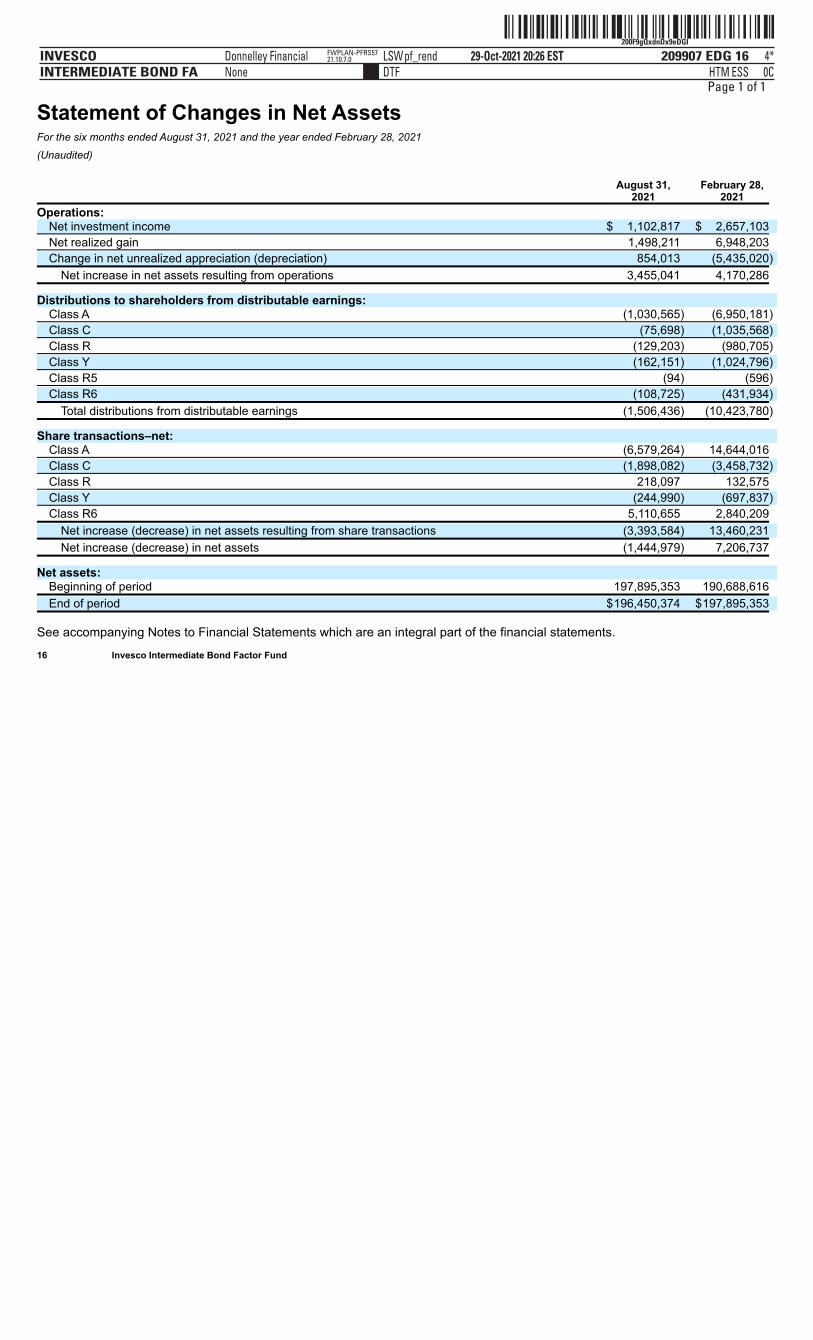
ˆ200F9gQxdnDx9eDGIŠ200F9gQxdnDx9eDGI
209907 EDG 16INVESCOINTERMEDIATE BOND FA
29-Oct-2021 20:26 ESTHTMDTF
Donnelley Financial LSWpf_rendNone
4*ESS 0C
FWPLAN-PFRS5721.10.7.0
Page 1 of 1
Statement of Changes in Net AssetsFor the six months ended August 31, 2021 and the year ended February 28, 2021
(Unaudited) August 31, February 28, 2021 2021
Operations: Net investment income $ 1,102,817 $ 2,657,103
Net realized gain 1,498,211 6,948,203
Change in net unrealized appreciation (depreciation) 854,013 (5,435,020)
Net increase in net assets resulting from operations 3,455,041 4,170,286
Distributions to shareholders from distributable earnings: Class A (1,030,565) (6,950,181)
Class C (75,698) (1,035,568)
Class R (129,203) (980,705)
Class Y (162,151) (1,024,796)
Class R5 (94) (596)
Class R6 (108,725) (431,934)
Total distributions from distributable earnings (1,506,436) (10,423,780)
Share transactions–net: Class A (6,579,264) 14,644,016
Class C (1,898,082) (3,458,732)
Class R 218,097 132,575
Class Y (244,990) (697,837)
Class R6 5,110,655 2,840,209
Net increase (decrease) in net assets resulting from share transactions (3,393,584) 13,460,231
Net increase (decrease) in net assets (1,444,979) 7,206,737
Net assets: Beginning of period 197,895,353 190,688,616
End of period $196,450,374 $197,895,353
See accompanying Notes to Financial Statements which are an integral part of the financial statements. 16 Invesco Intermediate Bond Factor Fund
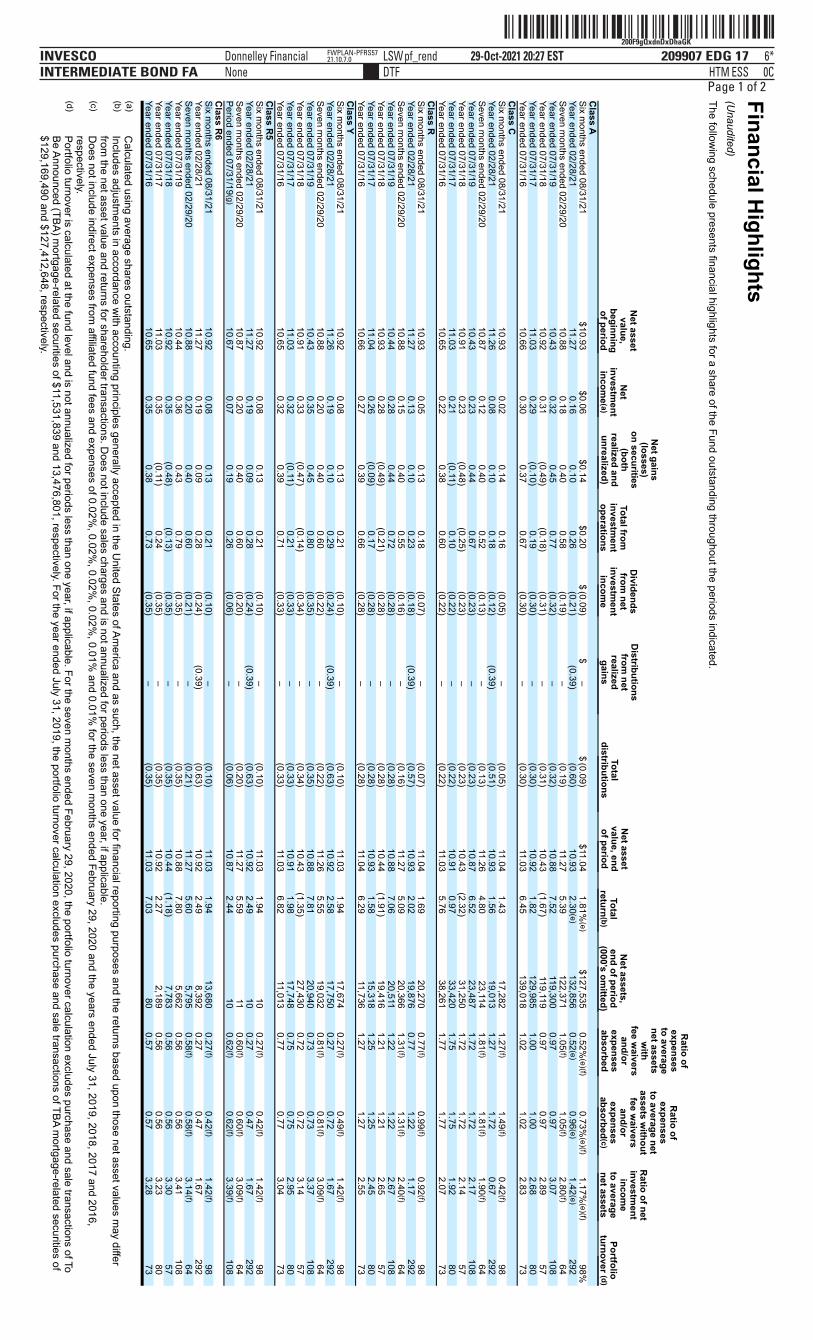
ˆ200F9gQxdnDxDhaGKŠ200F9gQxdnDxDhaGK
209907 EDG 17INVESCOINTERMEDIATE BOND FA
29-Oct-2021 20:27 ESTHTMDTF
Donnelley Financial LSWpf_rendNone
6*ESS 0C
FWPLAN-PFRS5721.10.7.0
Page 1 of 2Financial Highlights
(Unaudited)
The following schedule presents financial highlights for a share of the Fund outstanding throughout the periods indicated.
Net assetvalue,
beginningof period
Net
investment
income (a)
Net gains
(losses)on securities
(bothrealized andunrealized)
Total frominvestm
entoperations
Dividends
from net
investment
income
Distributionsfrom
netrealizedgains
Total
distributions
Net asset
value, endof period
Total
return(b)
Net assets,
end of period(000’s om
itted)
Ratio of
expensesto averagenet assets
with
fee waivers
and/orexpensesabsorbed
Ratio of
expensesto average netassets w
ithoutfee w
aiversand/or
expensesabsorbed
(c)
Ratio of net
investment
income
to averagenet assets
Portfolio
turnover (d)C
lass A
Six m
onths ended 08/31/21
$10.93
$0.06
$0.14
$0.20
$
(0.09)
$–
$(0.09)
$11.04
1.81%(e)
$127,535
0.52%(e)(f)
0.73%
(e)(f) 1.17%
(e)(f)
98%
Year ended 02/28/21
11.27
0.16
0.10
0.26
(0.21)
(0.39)
(0.60)
10.93
2.30 (e)
132,856
0.52 (e)
0.96 (e)
1.42 (e)
292
Seven months ended 02/29/20
10.88
0.18
0.40
0.58
(0.19)
–
(0.19)
11.27
5.39
122,371
1.05 (f)
1.05 (f)
2.80 (f)
64
Year ended 07/31/19
10.43
0.32
0.45
0.77
(0.32)
–
(0.32)
10.88
7.52
119,300
0.97
0.97
3.07
108
Year ended 07/31/18
10.92
0.31
(0.49)
(0.18)
(0.31)
–
(0.31)
10.43
(1.67)
119,119
0.97
0.97
2.89
57
Year ended 07/31/17
11.03
0.29
(0.10)
0.19
(0.30)
–
(0.30)
10.92
1.82
129,985
1.00
1.00
2.68
80Year ended 07/31/16
10.66
0.30
0.37
0.67
(0.30)
–
(0.30)
11.03
6.45
139,018
1.02
1.02
2.83
73
Class C
Six months ended 08/31/21
10.93
0.02
0.14
0.16
(0.05)
–
(0.05)
11.04
1.43
17,282
1.27 (f)
1.49 (f)
0.42 (f)
98
Year ended 02/28/21
11.26
0.08
0.10
0.18
(0.12)
(0.39)
(0.51)
10.93
1.56
19,013
1.27
1.72
0.67
292
Seven months ended 02/29/20
10.87
0.12
0.40
0.52
(0.13)
–
(0.13)
11.26
4.80
23,114
1.81 (f)
1.81 (f)
1.90 (f)
64
Year ended 07/31/19
10.43
0.23
0.44
0.67
(0.23)
–
(0.23)
10.87
6.52
23,487
1.72
1.72
2.17
108
Year ended 07/31/18
10.91
0.23
(0.48)
(0.25)
(0.23)
–
(0.23)
10.43
(2.32)
31,250
1.72
1.72
2.14
57
Year ended 07/31/17
11.03
0.21
(0.11)
0.10
(0.22)
–
(0.22)
10.91
0.97
33,420
1.75
1.75
1.92
80
Year ended 07/31/16
10.65
0.22
0.38
0.60
(0.22)
–
(0.22)
11.03
5.76
38,261
1.77
1.77
2.07
73C
lass R
Six m
onths ended 08/31/21
10.93
0.05
0.13
0.18
(0.07)
–
(0.07)
11.04
1.69
20,270
0.77 (f)
0.99 (f)
0.92 (f)
98Year ended 02/28/21
11.27
0.13
0.10
0.23
(0.18)
(0.39)
(0.57)
10.93
2.02
19,876
0.77
1.22
1.17
292Seven m
onths ended 02/29/20
10.88
0.15
0.40
0.55
(0.16)
–
(0.16)
11.27
5.09
20,366
1.31 (f)
1.31 (f)
2.40 (f)
64Year ended 07/31/19
10.44
0.28
0.44
0.72
(0.28)
–
(0.28)
10.88
7.06
20,511
1.22
1.22
2.67
108Year ended 07/31/18
10.93
0.28
(0.49)
(0.21)
(0.28)
–
(0.28)
10.44 (1.91)
19,416
1.21
1.21
2.65
57Year ended 07/31/17
11.04
0.26
(0.09)
0.17
(0.28)
–
(0.28)
10.93
1.58
15,318
1.25
1.25
2.45
80
Year ended 07/31/16
10.66
0.27
0.39
0.66
(0.28)
–
(0.28)
11.04
6.29
11,736
1.27
1.27
2.55
73C
lass Y
Six m
onths ended 08/31/21
10.92
0.08
0.13
0.21
(0.10)
–
(0.10)
11.03
1.94
17,674
0.27 (f)
0.49 (f)
1.42 (f)
98Year ended 02/28/21
11.26
0.19
0.10
0.29
(0.24)
(0.39)
(0.63)
10.92
2.58
17,750
0.27
0.72
1.67
292Seven m
onths ended 02/29/20
10.88
0.20
0.40
0.60
(0.22)
–
(0.22)
11.26
5.55
19,032
0.81 (f)
0.81 (f)
3.09 (f)
64Year ended 07/31/19
10.43
0.35
0.45
0.80
(0.35)
–
(0.35)
10.88
7.81
20,940
0.73
0.73
3.37
108Year ended 07/31/18
10.91
0.33
(0.47)
(0.14)
(0.34)
–
(0.34)
10.43 (1.35)
27,430
0.72
0.72
3.14
57Year ended 07/31/17
11.03
0.32
(0.11)
0.21
(0.33)
–
(0.33)
10.91
1.98
17,748
0.75
0.75
2.95
80Year ended 07/31/16
10.65
0.32
0.39
0.71
(0.33)
–
(0.33)
11.03
6.82
11,013
0.77
0.77
3.04
73
Class R
5
Six m
onths ended 08/31/21
10.92
0.08
0.13
0.21
(0.10)
–
(0.10)
11.03
1.94
10
0.27 (f)
0.42 (f)
1.42 (f)
98Year ended 02/28/21
11.27
0.19
0.09
0.28
(0.24)
(0.39)
(0.63)
10.92
2.49
10
0.27
0.47
1.67
292Seven m
onths ended 02/29/20
10.87
0.20
0.40
0.60
(0.20)
–
(0.20)
11.27
5.59
11
0.60 (f)
0.60 (f)
3.09 (f)
64Period ended 07/31/19 (g)
10.67
0.07
0.19
0.26
(0.06)
–
(0.06)
10.87
2.44
10
0.62 (f)
0.62 (f)
3.39 (f)
108C
lass R6
Six months ended 08/31/21
10.92
0.08
0.13
0.21
(0.10)
–
(0.10)
11.03
1.94
13,680
0.27 (f)
0.42 (f)
1.42 (f)
98
Year ended 02/28/21
11.27
0.19
0.09
0.28
(0.24)
(0.39)
(0.63)
10.92
2.49
8,392
0.27
0.47
1.67
292
Seven months ended 02/29/20
10.88
0.20
0.40
0.60
(0.21)
–
(0.21)
11.27
5.60
5,795
0.58 (f)
0.58 (f)
3.14 (f)
64
Year ended 07/31/19
10.44
0.36
0.43
0.79
(0.35)
–
(0.35)
10.88
7.80
5,662
0.56
0.56
3.41
108
Year ended 07/31/18
10.92
0.35
(0.48)
(0.13)
(0.35)
–
(0.35)
10.44
(1.18)
7,783
0.56
0.56
3.30
57
Year ended 07/31/17
11.03
0.35
(0.11)
0.24
(0.35)
–
(0.35)
10.92
2.27
2,189
0.56
0.56
3.23
80
Year ended 07/31/16
10.65
0.35
0.38
0.73
(0.35)
–
(0.35)
11.03
7.03
80
0.57
0.57
3.28
73 (a)
Calculated using average shares outstanding.
(b)Includes adjustm
ents in accordance with accounting principles generally accepted in the U
nited States of America and as such, the net asset value for financial reporting purposes and the returns based upon those net asset values m
ay differfrom
the net asset value and returns for shareholder transactions. Does not include sales charges and is not annualized for periods less than one year, if applicable.
(c)D
oes not include indirect expenses from affiliated fund fees and expenses of 0.02%
, 0.02%, 0.02%
, 0.02%, 0.01%
and 0.01% for the seven m
onths ended February 29, 2020 and the years ended July 31, 2019, 2018, 2017 and 2016,respectively.
(d)Portfolio turnover is calculated at the fund level and is not annualized for periods less than one year, if applicable. For the seven m
onths ended February 29, 2020, the portfolio turnover calculation excludes purchase and sale transactions of ToBe Announced (TBA) m
ortgage-related securities of $11,531,839 and 13,476,801, respectively. For the year ended July 31, 2019, the portfolio turnover calculation excludes purchase and sale transactions of TBA mortgage-related securities of
$129,169,490 and $127,412,648, respectively.

ˆ200F9gQxdnDxDhaGKŠ200F9gQxdnDxDhaGK
209907 EDG 17INVESCOINTERMEDIATE BOND FA
29-Oct-2021 20:27 ESTHTMDTF
Donnelley Financial LSWpf_rendNone
6*ESS 0C
FWPLAN-PFRS5721.10.7.0
ˆ200F9gQxdnDxDhaGKŠ200F9gQxdnDxDhaGK
209907 EDG 17INVESCOINTERMEDIATE BOND FA
29-Oct-2021 20:27 ESTHTMDTF
Donnelley Financial LSWpf_rendNone
6*ESS 0C
FWPLAN-PFRS5721.10.7.0
Page 2 of 2
(e)The total return, ratio of expenses to average net assets and ratio of net investm
ent income to average net assets reflect actual 12b-1 fees of 0.24%
for the six months ended August 31, 2021 and the year ended February 28, 2021, respectively.
(f)Annualized.
(g)C
omm
encement date after the close of business on M
ay 24, 2019. See accom
panying Notes to Financial Statem
ents which are an integral part of the financial statem
ents. 17
Invesco Interm
ediate Bond Factor Fund
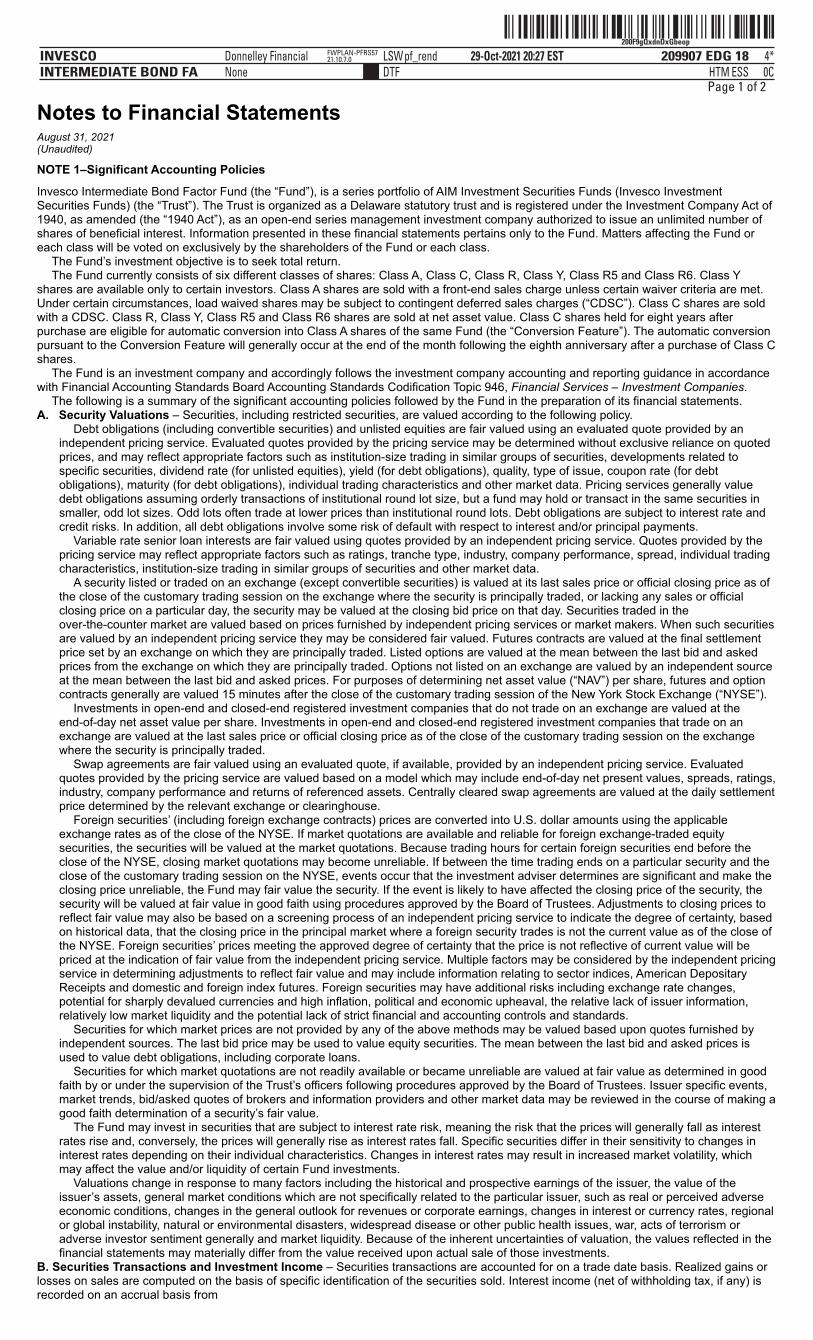
ˆ200F9gQxdnDxGbeopŠ200F9gQxdnDxGbeop
209907 EDG 18INVESCOINTERMEDIATE BOND FA
29-Oct-2021 20:27 ESTHTMDTF
Donnelley Financial LSWpf_rendNone
4*ESS 0C
FWPLAN-PFRS5721.10.7.0
Page 1 of 2
Notes to Financial StatementsAugust 31, 2021(Unaudited)
NOTE 1–Significant Accounting Policies
Invesco Intermediate Bond Factor Fund (the “Fund”), is a series portfolio of AIM Investment Securities Funds (Invesco InvestmentSecurities Funds) (the “Trust”). The Trust is organized as a Delaware statutory trust and is registered under the Investment Company Act of1940, as amended (the “1940 Act”), as an open-end series management investment company authorized to issue an unlimited number ofshares of beneficial interest. Information presented in these financial statements pertains only to the Fund. Matters affecting the Fund oreach class will be voted on exclusively by the shareholders of the Fund or each class.
The Fund’s investment objective is to seek total return.The Fund currently consists of six different classes of shares: Class A, Class C, Class R, Class Y, Class R5 and Class R6. Class Y
shares are available only to certain investors. Class A shares are sold with a front-end sales charge unless certain waiver criteria are met.Under certain circumstances, load waived shares may be subject to contingent deferred sales charges (“CDSC”). Class C shares are soldwith a CDSC. Class R, Class Y, Class R5 and Class R6 shares are sold at net asset value. Class C shares held for eight years afterpurchase are eligible for automatic conversion into Class A shares of the same Fund (the “Conversion Feature”). The automatic conversionpursuant to the Conversion Feature will generally occur at the end of the month following the eighth anniversary after a purchase of Class Cshares.
The Fund is an investment company and accordingly follows the investment company accounting and reporting guidance in accordancewith Financial Accounting Standards Board Accounting Standards Codification Topic 946, Financial Services – Investment Companies.
The following is a summary of the significant accounting policies followed by the Fund in the preparation of its financial statements.A. Security Valuations – Securities, including restricted securities, are valued according to the following policy.
Debt obligations (including convertible securities) and unlisted equities are fair valued using an evaluated quote provided by anindependent pricing service. Evaluated quotes provided by the pricing service may be determined without exclusive reliance on quotedprices, and may reflect appropriate factors such as institution-size trading in similar groups of securities, developments related tospecific securities, dividend rate (for unlisted equities), yield (for debt obligations), quality, type of issue, coupon rate (for debtobligations), maturity (for debt obligations), individual trading characteristics and other market data. Pricing services generally valuedebt obligations assuming orderly transactions of institutional round lot size, but a fund may hold or transact in the same securities insmaller, odd lot sizes. Odd lots often trade at lower prices than institutional round lots. Debt obligations are subject to interest rate andcredit risks. In addition, all debt obligations involve some risk of default with respect to interest and/or principal payments.
Variable rate senior loan interests are fair valued using quotes provided by an independent pricing service. Quotes provided by thepricing service may reflect appropriate factors such as ratings, tranche type, industry, company performance, spread, individual tradingcharacteristics, institution-size trading in similar groups of securities and other market data.
A security listed or traded on an exchange (except convertible securities) is valued at its last sales price or official closing price as ofthe close of the customary trading session on the exchange where the security is principally traded, or lacking any sales or officialclosing price on a particular day, the security may be valued at the closing bid price on that day. Securities traded in theover-the-counter market are valued based on prices furnished by independent pricing services or market makers. When such securitiesare valued by an independent pricing service they may be considered fair valued. Futures contracts are valued at the final settlementprice set by an exchange on which they are principally traded. Listed options are valued at the mean between the last bid and askedprices from the exchange on which they are principally traded. Options not listed on an exchange are valued by an independent sourceat the mean between the last bid and asked prices. For purposes of determining net asset value (“NAV”) per share, futures and optioncontracts generally are valued 15 minutes after the close of the customary trading session of the New York Stock Exchange (“NYSE”).
Investments in open-end and closed-end registered investment companies that do not trade on an exchange are valued at theend-of-day net asset value per share. Investments in open-end and closed-end registered investment companies that trade on anexchange are valued at the last sales price or official closing price as of the close of the customary trading session on the exchangewhere the security is principally traded.
Swap agreements are fair valued using an evaluated quote, if available, provided by an independent pricing service. Evaluatedquotes provided by the pricing service are valued based on a model which may include end-of-day net present values, spreads, ratings,industry, company performance and returns of referenced assets. Centrally cleared swap agreements are valued at the daily settlementprice determined by the relevant exchange or clearinghouse.
Foreign securities’ (including foreign exchange contracts) prices are converted into U.S. dollar amounts using the applicableexchange rates as of the close of the NYSE. If market quotations are available and reliable for foreign exchange-traded equitysecurities, the securities will be valued at the market quotations. Because trading hours for certain foreign securities end before theclose of the NYSE, closing market quotations may become unreliable. If between the time trading ends on a particular security and theclose of the customary trading session on the NYSE, events occur that the investment adviser determines are significant and make theclosing price unreliable, the Fund may fair value the security. If the event is likely to have affected the closing price of the security, thesecurity will be valued at fair value in good faith using procedures approved by the Board of Trustees. Adjustments to closing prices toreflect fair value may also be based on a screening process of an independent pricing service to indicate the degree of certainty, basedon historical data, that the closing price in the principal market where a foreign security trades is not the current value as of the close ofthe NYSE. Foreign securities’ prices meeting the approved degree of certainty that the price is not reflective of current value will bepriced at the indication of fair value from the independent pricing service. Multiple factors may be considered by the independent pricingservice in determining adjustments to reflect fair value and may include information relating to sector indices, American DepositaryReceipts and domestic and foreign index futures. Foreign securities may have additional risks including exchange rate changes,potential for sharply devalued currencies and high inflation, political and economic upheaval, the relative lack of issuer information,relatively low market liquidity and the potential lack of strict financial and accounting controls and standards.
Securities for which market prices are not provided by any of the above methods may be valued based upon quotes furnished byindependent sources. The last bid price may be used to value equity securities. The mean between the last bid and asked prices isused to value debt obligations, including corporate loans.
Securities for which market quotations are not readily available or became unreliable are valued at fair value as determined in goodfaith by or under the supervision of the Trust’s officers following procedures approved by the Board of Trustees. Issuer specific events,market trends, bid/asked quotes of brokers and information providers and other market data may be reviewed in the course of making agood faith determination of a security’s fair value.
The Fund may invest in securities that are subject to interest rate risk, meaning the risk that the prices will generally fall as interestrates rise and, conversely, the prices will generally rise as interest rates fall. Specific securities differ in their sensitivity to changes ininterest rates depending on their individual characteristics. Changes in interest rates may result in increased market volatility, whichmay affect the value and/or liquidity of certain Fund investments.
Valuations change in response to many factors including the historical and prospective earnings of the issuer, the value of theissuer’s assets, general market conditions which are not specifically related to the particular issuer, such as real or perceived adverseeconomic conditions, changes in the general outlook for revenues or corporate earnings, changes in interest or currency rates, regionalor global instability, natural or environmental disasters, widespread disease or other public health issues, war, acts of terrorism oradverse investor sentiment generally and market liquidity. Because of the inherent uncertainties of valuation, the values reflected in thefinancial statements may materially differ from the value received upon actual sale of those investments.
B. Securities Transactions and Investment Income – Securities transactions are accounted for on a trade date basis. Realized gains orlosses on sales are computed on the basis of specific identification of the securities sold. Interest income (net of withholding tax, if any) isrecorded on an accrual basis from

ˆ200F9gQxdnDxGbeopŠ200F9gQxdnDxGbeop
209907 EDG 18INVESCOINTERMEDIATE BOND FA
29-Oct-2021 20:27 ESTHTMDTF
Donnelley Financial LSWpf_rendNone
4*ESS 0C
FWPLAN-PFRS5721.10.7.0
ˆ200F9gQxdnDxGbeopŠ200F9gQxdnDxGbeop
209907 EDG 18INVESCOINTERMEDIATE BOND FA
29-Oct-2021 20:27 ESTHTMDTF
Donnelley Financial LSWpf_rendNone
4*ESS 0C
FWPLAN-PFRS5721.10.7.0
Page 2 of 2 18 Invesco Intermediate Bond Factor Fund
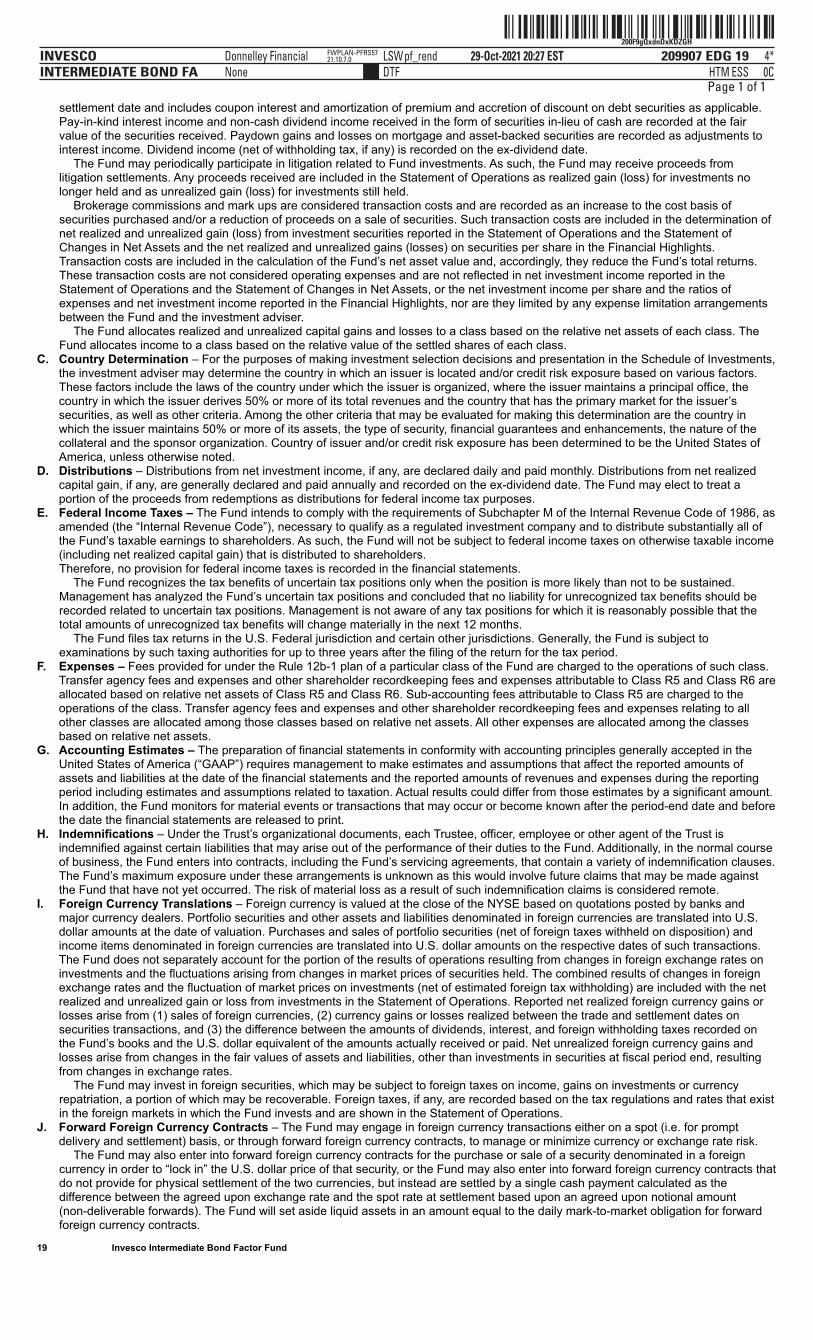
ˆ200F9gQxdnDxKDZGHŠ200F9gQxdnDxKDZGH
209907 EDG 19INVESCOINTERMEDIATE BOND FA
29-Oct-2021 20:27 ESTHTMDTF
Donnelley Financial LSWpf_rendNone
4*ESS 0C
FWPLAN-PFRS5721.10.7.0
Page 1 of 1settlement date and includes coupon interest and amortization of premium and accretion of discount on debt securities as applicable.Pay-in-kind interest income and non-cash dividend income received in the form of securities in-lieu of cash are recorded at the fairvalue of the securities received. Paydown gains and losses on mortgage and asset-backed securities are recorded as adjustments tointerest income. Dividend income (net of withholding tax, if any) is recorded on the ex-dividend date.
The Fund may periodically participate in litigation related to Fund investments. As such, the Fund may receive proceeds fromlitigation settlements. Any proceeds received are included in the Statement of Operations as realized gain (loss) for investments nolonger held and as unrealized gain (loss) for investments still held.
Brokerage commissions and mark ups are considered transaction costs and are recorded as an increase to the cost basis ofsecurities purchased and/or a reduction of proceeds on a sale of securities. Such transaction costs are included in the determination ofnet realized and unrealized gain (loss) from investment securities reported in the Statement of Operations and the Statement ofChanges in Net Assets and the net realized and unrealized gains (losses) on securities per share in the Financial Highlights.Transaction costs are included in the calculation of the Fund’s net asset value and, accordingly, they reduce the Fund’s total returns.These transaction costs are not considered operating expenses and are not reflected in net investment income reported in theStatement of Operations and the Statement of Changes in Net Assets, or the net investment income per share and the ratios ofexpenses and net investment income reported in the Financial Highlights, nor are they limited by any expense limitation arrangementsbetween the Fund and the investment adviser.
The Fund allocates realized and unrealized capital gains and losses to a class based on the relative net assets of each class. TheFund allocates income to a class based on the relative value of the settled shares of each class.
C. Country Determination – For the purposes of making investment selection decisions and presentation in the Schedule of Investments,the investment adviser may determine the country in which an issuer is located and/or credit risk exposure based on various factors.These factors include the laws of the country under which the issuer is organized, where the issuer maintains a principal office, thecountry in which the issuer derives 50% or more of its total revenues and the country that has the primary market for the issuer’ssecurities, as well as other criteria. Among the other criteria that may be evaluated for making this determination are the country inwhich the issuer maintains 50% or more of its assets, the type of security, financial guarantees and enhancements, the nature of thecollateral and the sponsor organization. Country of issuer and/or credit risk exposure has been determined to be the United States ofAmerica, unless otherwise noted.
D. Distributions – Distributions from net investment income, if any, are declared daily and paid monthly. Distributions from net realizedcapital gain, if any, are generally declared and paid annually and recorded on the ex-dividend date. The Fund may elect to treat aportion of the proceeds from redemptions as distributions for federal income tax purposes.
E. Federal Income Taxes – The Fund intends to comply with the requirements of Subchapter M of the Internal Revenue Code of 1986, asamended (the “Internal Revenue Code”), necessary to qualify as a regulated investment company and to distribute substantially all ofthe Fund’s taxable earnings to shareholders. As such, the Fund will not be subject to federal income taxes on otherwise taxable income(including net realized capital gain) that is distributed to shareholders.Therefore, no provision for federal income taxes is recorded in the financial statements.
The Fund recognizes the tax benefits of uncertain tax positions only when the position is more likely than not to be sustained.Management has analyzed the Fund’s uncertain tax positions and concluded that no liability for unrecognized tax benefits should berecorded related to uncertain tax positions. Management is not aware of any tax positions for which it is reasonably possible that thetotal amounts of unrecognized tax benefits will change materially in the next 12 months.
The Fund files tax returns in the U.S. Federal jurisdiction and certain other jurisdictions. Generally, the Fund is subject toexaminations by such taxing authorities for up to three years after the filing of the return for the tax period.
F. Expenses – Fees provided for under the Rule 12b-1 plan of a particular class of the Fund are charged to the operations of such class.Transfer agency fees and expenses and other shareholder recordkeeping fees and expenses attributable to Class R5 and Class R6 areallocated based on relative net assets of Class R5 and Class R6. Sub-accounting fees attributable to Class R5 are charged to theoperations of the class. Transfer agency fees and expenses and other shareholder recordkeeping fees and expenses relating to allother classes are allocated among those classes based on relative net assets. All other expenses are allocated among the classesbased on relative net assets.
G. Accounting Estimates – The preparation of financial statements in conformity with accounting principles generally accepted in theUnited States of America (“GAAP”) requires management to make estimates and assumptions that affect the reported amounts ofassets and liabilities at the date of the financial statements and the reported amounts of revenues and expenses during the reportingperiod including estimates and assumptions related to taxation. Actual results could differ from those estimates by a significant amount.In addition, the Fund monitors for material events or transactions that may occur or become known after the period-end date and beforethe date the financial statements are released to print.
H. Indemnifications – Under the Trust’s organizational documents, each Trustee, officer, employee or other agent of the Trust isindemnified against certain liabilities that may arise out of the performance of their duties to the Fund. Additionally, in the normal courseof business, the Fund enters into contracts, including the Fund’s servicing agreements, that contain a variety of indemnification clauses.The Fund’s maximum exposure under these arrangements is unknown as this would involve future claims that may be made againstthe Fund that have not yet occurred. The risk of material loss as a result of such indemnification claims is considered remote.
I. Foreign Currency Translations – Foreign currency is valued at the close of the NYSE based on quotations posted by banks andmajor currency dealers. Portfolio securities and other assets and liabilities denominated in foreign currencies are translated into U.S.dollar amounts at the date of valuation. Purchases and sales of portfolio securities (net of foreign taxes withheld on disposition) andincome items denominated in foreign currencies are translated into U.S. dollar amounts on the respective dates of such transactions.The Fund does not separately account for the portion of the results of operations resulting from changes in foreign exchange rates oninvestments and the fluctuations arising from changes in market prices of securities held. The combined results of changes in foreignexchange rates and the fluctuation of market prices on investments (net of estimated foreign tax withholding) are included with the netrealized and unrealized gain or loss from investments in the Statement of Operations. Reported net realized foreign currency gains orlosses arise from (1) sales of foreign currencies, (2) currency gains or losses realized between the trade and settlement dates onsecurities transactions, and (3) the difference between the amounts of dividends, interest, and foreign withholding taxes recorded onthe Fund’s books and the U.S. dollar equivalent of the amounts actually received or paid. Net unrealized foreign currency gains andlosses arise from changes in the fair values of assets and liabilities, other than investments in securities at fiscal period end, resultingfrom changes in exchange rates.
The Fund may invest in foreign securities, which may be subject to foreign taxes on income, gains on investments or currencyrepatriation, a portion of which may be recoverable. Foreign taxes, if any, are recorded based on the tax regulations and rates that existin the foreign markets in which the Fund invests and are shown in the Statement of Operations.
J. Forward Foreign Currency Contracts – The Fund may engage in foreign currency transactions either on a spot (i.e. for promptdelivery and settlement) basis, or through forward foreign currency contracts, to manage or minimize currency or exchange rate risk.
The Fund may also enter into forward foreign currency contracts for the purchase or sale of a security denominated in a foreigncurrency in order to “lock in” the U.S. dollar price of that security, or the Fund may also enter into forward foreign currency contracts thatdo not provide for physical settlement of the two currencies, but instead are settled by a single cash payment calculated as thedifference between the agreed upon exchange rate and the spot rate at settlement based upon an agreed upon notional amount(non-deliverable forwards). The Fund will set aside liquid assets in an amount equal to the daily mark-to-market obligation for forwardforeign currency contracts.
19 Invesco Intermediate Bond Factor Fund
ˆ200F9gQxdnDxQ!lo7Š200F9gQxdnDxQ!lo7
209907 EDG 20INVESCOINTERMEDIATE BOND FA
29-Oct-2021 20:27 ESTHTMDTF
Donnelley Financial LSWpf_rendNone
5*ESS 0C
FWPLAN-PFRS5721.10.7.0
Page 1 of 2A forward foreign currency contract is an obligation between two parties (“Counterparties”) to purchase or sell a specific currency for
an agreed-upon price at a future date. The use of forward foreign currency contracts does not eliminate fluctuations in the price of theunderlying securities the Fund owns or intends to acquire but establishes a rate of exchange in advance. Fluctuations in the value ofthese contracts are measured by the difference in the contract date and reporting date exchange rates and are recorded as unrealizedappreciation (depreciation) until the contracts are closed. When the contracts are closed, realized gains (losses) are recorded. Realizedand unrealized gains (losses) on the contracts are included in the Statement of Operations. The primary risks associated with forwardforeign currency contracts include failure of the Counterparty to meet the terms of the contract and the value of the foreign currencychanging unfavorably. These risks may be in excess of the amounts reflected in the Statement of Assets and Liabilities.
K. Futures Contracts – The Fund may enter into futures contracts to manage exposure to interest rate, equity and market pricemovements and/or currency risks. A futures contract is an agreement between two parties (“Counterparties”) to purchase or sell aspecified underlying security, currency or commodity (or delivery of a cash settlement price, in the case of an index future) for a fixedprice at a future date. The Fund currently invests only in exchange-traded futures and they are standardized as to maturity date andunderlying financial instrument. Initial margin deposits required upon entering into futures contracts are satisfied by the segregation ofspecific securities or cash as collateral at the futures commission merchant (broker). During the period the futures contracts are open,changes in the value of the contracts are recognized as unrealized gains or losses by recalculating the value of the contracts on a dailybasis. Subsequent or variation margin payments are received or made depending upon whether unrealized gains or losses areincurred. These amounts are reflected as receivables or payables on the Statement of Assets and Liabilities. When the contracts areclosed or expire, the Fund recognizes a realized gain or loss equal to the difference between the proceeds from, or cost of, the closingtransaction and the Fund’s basis in the contract. The net realized gain (loss) and the change in unrealized gain (loss) on futurescontracts held during the period is included on the Statement of Operations. The primary risks associated with futures contracts aremarket risk and the absence of a liquid secondary market. If the Fund were unable to liquidate a futures contract and/or enter into anoffsetting closing transaction, the Fund would continue to be subject to market risk with respect to the value of the contracts andcontinue to be required to maintain the margin deposits on the futures contracts. Futures contracts have minimal Counterparty risksince the exchange’s clearinghouse, as Counterparty to all exchange-traded futures, guarantees the futures against default. Risks mayexceed amounts recognized in the Statement of Assets and Liabilities.
L. Dollar Rolls and Forward Commitment Transactions - The Fund may enter into dollar roll transactions to enhance the Fund’sperformance. The Fund executes its dollar roll transactions in the to be announced (“TBA”) market whereby the Fund makes a forwardcommitment to purchase a security and, instead of accepting delivery, the position is offset by the sale of the security with asimultaneous agreement to repurchase at a future date.
The Fund accounts for dollar roll transactions as purchases and sales and realizes gains and losses on these transactions. Thesetransactions increase the Fund’s portfolio turnover rate. The Fund will segregate liquid assets in an amount equal to its dollar rollcommitments.
Dollar roll transactions involve the risk that a Counterparty to the transaction may fail to complete the transaction. If this occurs, theFund may lose the opportunity to purchase or sell the security at the agreed upon price. Dollar roll transactions also involve the risk thatthe value of the securities retained by the Fund may decline below the price of the securities that the Fund has sold but is obligated topurchase under the agreement. Dollar roll transactions covered in this manner are not treated as senior securities for purposes of aFund’s fundamental investment limitation on borrowings.
M. LIBOR Risk - The Fund may invest in financial instruments that utilize LIBOR as the reference or benchmark rate for variable interestrate calculations. On July 27, 2017, the head of the United Kingdom’s Financial Conduct Authority announced a desire to phase out theuse of LIBOR by the end of 2021. Although many LIBOR rates will be phased out at the end of 2021 as originally intended, a selectionof widely used USD LIBOR rates will continue to be published until June 2023 in order to assist with the transition. There remainsuncertainty regarding the effect of the LIBOR transition process and therefore any impact of a transition away from LIBOR on the Fundor the instruments in which the Fund invests cannot yet be determined. There is no assurance that the composition or characteristics ofany alternative reference rate will be similar to or produce the same value or economic equivalence as LIBOR or that instruments usingan alternative rate will have the same volume or liquidity. Any such effects of the transition away from LIBOR and the adoption ofalternative reference rates could result in losses to the Fund.
N. Leverage Risk – Leverage exists when the Fund can lose more than it originally invests because it purchases or sells an instrument orenters into a transaction without investing an amount equal to the full economic exposure of the instrument or transaction.
O. Collateral – To the extent the Fund has designated or segregated a security as collateral and that security is subsequently sold, it is theFund’s practice to replace such collateral no later than the next business day.
P. Other Risks - The current low interest rate environment was created in part by the Federal Reserve Board (FRB) and certain foreigncentral banks keeping the federal funds and equivalent foreign rates near historical lows. Increases in the federal funds and equivalentforeign rates may expose fixed income markets to heightened volatility and reduced liquidity for certain fixed income investments,particularly those with longer maturities. In addition, decreases in fixed income dealer market-making capacity may also potentially leadto heightened volatility and reduced liquidity in the fixed income markets. As a result, the value of the Fund’s investments and shareprice may decline. Changes in central bank policies could also result in higher than normal shareholder redemptions, which couldpotentially increase portfolio turnover and the Fund’s transaction costs.
Q. COVID-19 Risk - The COVID-19 strain of coronavirus has resulted in instances of market closures and dislocations, extreme volatility,liquidity constraints and increased trading costs. Efforts to contain its spread have resulted in travel restrictions, disruptions ofhealthcare systems, business operations and supply chains, layoffs, lower consumer demand, and defaults, among other significanteconomic impacts that have disrupted global economic activity across many industries. Such economic impacts may exacerbate otherpre-existing political, social and economic risks locally or globally.
The ongoing effects of COVID-19 are unpredictable and may result in significant and prolonged effects on the Fund’s performance.
NOTE 2–Advisory Fees and Other Fees Paid to Affiliates
The Trust has entered into a master investment advisory agreement with Invesco Advisers, Inc. (the “Adviser” or “Invesco”). Under theterms of the investment advisory agreement, the Fund accrues daily and pays monthly an advisory fee to the Adviser based on the annualrate of the Fund’s average daily net assets as follows:
Average Daily Net Assets* RateUp to First $2 billion 0.250%Over $2 billion 0.230%
* The advisory fee paid by the Fund shall be reduced by any amounts paid by the Fund under the administrative services agreement withthe Adviser.
For the six months ended August 31, 2021, the effective advisory fee rate incurred by the Fund was 0.25% .Under the terms of a master sub-advisory agreement between the Adviser and each of Invesco Asset Management Deutschland GmbH,
Invesco Asset Management Limited, Invesco Asset Management (Japan) Limited, Invesco Hong Kong Limited, Invesco Senior SecuredManagement, Inc. and Invesco Canada Ltd. (collectively, the “Affiliated Sub-Advisers”) the Adviser, not the Fund, will pay 40% of the feespaid to the Adviser to any such Affiliated Sub-Adviser(s) that provide(s) discretionary investment management services to the Fund basedon the percentage of assets allocated to such Affiliated Sub-Adviser(s).
The Adviser has contractually agreed, through at least June 30, 2022, to waive advisory fees and/or reimburse expenses of all shares tothe extent necessary to limit total annual fund operating expenses after fee waiver and/or expense reimbursement (excluding certain itemsdiscussed below) of Class A, Class C, Class R, Class Y, Class R5 and Class R6 shares to 0.52%, 1.27%, 0.77%, 0.27%, 0.27% and 0.27%,respectively, of the Fund’s average daily net assets (the “expense

ˆ200F9gQxdnDxQ!lo7Š200F9gQxdnDxQ!lo7
209907 EDG 20INVESCOINTERMEDIATE BOND FA
29-Oct-2021 20:27 ESTHTMDTF
Donnelley Financial LSWpf_rendNone
5*ESS 0C
FWPLAN-PFRS5721.10.7.0
ˆ200F9gQxdnDxQ!lo7Š200F9gQxdnDxQ!lo7
209907 EDG 20INVESCOINTERMEDIATE BOND FA
29-Oct-2021 20:27 ESTHTMDTF
Donnelley Financial LSWpf_rendNone
5*ESS 0C
FWPLAN-PFRS5721.10.7.0
Page 2 of 2 20 Invesco Intermediate Bond Factor Fund
ˆ200F9gQxdnDwdVsGUŠ200F9gQxdnDwdVsGU
209907 EDG 21INVESCOINTERMEDIATE BOND FA
29-Oct-2021 20:26 ESTHTMDTF
Donnelley Financial LSWpf_rendNone
5*ESS 0C
FWPLAN-PFRS6021.10.7.0
Page 1 of 1limits”). In determining the Adviser’s obligation to waive advisory fees and/or reimburse expenses, the following expenses are not taken intoaccount, and could cause the total annual fund operating expenses after fee waiver and/or reimbursement to exceed the numbers reflectedabove: (1) interest; (2) taxes; (3) dividend expense on short sales; (4) extraordinary or non-routine items, including litigation expenses; and(5) expenses that the Fund has incurred but did not actually pay because of an expense offset arrangement. Unless Invesco continues thefee waiver agreement, it will terminate on June 30, 2022. During its term, the fee waiver agreement cannot be terminated or amended toincrease the expense limits or reduce the advisory fee waivers without approval of the Board of Trustees. To the extent that the annualizedexpense ratio does not exceed the expense limits, the Adviser will retain its ability to be reimbursed for such fee waivers or reimbursementsprior to the end of each fiscal year.
The Adviser has contractually agreed, through at least June 30, 2023, to waive the advisory fee payable by the Fund in an amount equalto 100% of the net advisory fees the Adviser receives from the affiliated money market funds on investments by the Fund of uninvestedcash in such affiliated money market funds.
For the six months ended August 31, 2021, the Adviser waived advisory fees of $129,326 and reimbursed class level expenses of$50,889, $6,814, $7,386, $6,991, $1 and $890 of Class A, Class C, Class R, Class Y, Class R5 and Class R6 shares, respectively.
The Trust has entered into a master administrative services agreement with Invesco pursuant to which the Fund has agreed to payInvesco for certain administrative costs incurred in providing accounting services to the Fund. For the six months ended August 31, 2021,expenses incurred under the agreement are shown in the Statement of Operations as Administrative services fees. Invesco has enteredinto a sub-administration agreement whereby State Street Bank and Trust Company (“SSB”) serves as fund accountant and providescertain administrative services to the Fund. Pursuant to a custody agreement with the Trust on behalf of the Fund, SSB also serves as theFund’s custodian.
The Trust has entered into a transfer agency and service agreement with Invesco Investment Services, Inc. (“IIS”) pursuant to which theFund has agreed to pay IIS a fee for providing transfer agency and shareholder services to the Fund and reimburse IIS for certain expensesincurred by IIS in the course of providing such services. IIS may make payments to intermediaries that provide omnibus account services,sub-accounting services and/or networking services. All fees payable by IIS to intermediaries that provide omnibus account services orsub-accounting services are charged back to the Fund, subject to certain limitations approved by the Trust’s Board of Trustees. For the sixmonths ended August 31, 2021, expenses incurred under the agreement are shown in the Statement of Operations as Transfer agent fees.
The Trust has entered into master distribution agreements with Invesco Distributors, Inc. (“IDI”) to serve as the distributor for the Class A,Class C, Class R, Class Y, Class R5 and Class R6 shares of the Fund. The Trust has adopted plans pursuant to Rule 12b-1 under the 1940Act with respect to the Fund’s Class A, Class C and Class R shares (collectively, the “Plans”). The Fund, pursuant to the Class A Plan,reimburses IDI for its allocated share of expenses incurred for the period, up to a maximum annual rate of 0.25% of the average daily netassets of Class A shares. The Fund pursuant to the Class C and Class R Plan, pays IDI compensation at the annual rate of 1.00% of theaverage daily net assets of Class C shares and 0.50% of the average daily net assets of Class R shares. The fees are accrued daily andpaid monthly. Of the Plan payments, up to 0.25% of the average daily net assets of each class of shares may be paid to furnish continuingpersonal shareholder services to customers who purchase and own shares of such classes. Any amounts not paid as a service fee underthe Plans would constitute an asset-based sales charge. Rules of the Financial Industry Regulatory Authority (“FINRA”) impose a cap onthe total sales charges, including asset-based sales charges, that may be paid by any class of shares of the Fund. For the six monthsended August 31, 2021, expenses incurred under the Plans are shown in the Statement of Operations as Distribution fees.
Front-end sales commissions and CDSC (collectively, the “sales charges”) are not recorded as expenses of the Fund. Front-end salescommissions are deducted from proceeds from the sales of Fund shares prior to investment in Class A shares of the Fund. CDSC arededucted from redemption proceeds prior to remittance to the shareholder. During the six months ended August 31, 2021, IDI advised theFund that IDI retained $8,113 in front-end sales commissions from the sale of Class A shares and $1,290 and $1,135 from Class A andClass C shares, respectively, for CDSC imposed upon redemptions by shareholders.
Certain officers and trustees of the Trust are officers and directors of the Adviser, IIS and/or IDI.
NOTE 3–Additional Valuation Information
GAAP defines fair value as the price that would be received to sell an asset or paid to transfer a liability in an orderly transaction betweenmarket participants at the measurement date, under current market conditions. GAAP establishes a hierarchy that prioritizes the inputs tovaluation methods, giving the highest priority to readily available unadjusted quoted prices in an active market for identical assets (Level 1)and the lowest priority to significant unobservable inputs (Level 3), generally when market prices are not readily available or are unreliable.Based on the valuation inputs, the securities or other investments are tiered into one of three levels. Changes in valuation methods mayresult in transfers in or out of an investment’s assigned level:
Level 1 - Prices are determined using quoted prices in an active market for identical assets.Level 2 -
Prices are determined using other significant observable inputs. Observable inputs are inputs that other market participantsmay use in pricing a security. These may include quoted prices for similar securities, interest rates, prepayment speeds, creditrisk, yield curves, loss severities, default rates, discount rates, volatilities and others.
Level 3 -
Prices are determined using significant unobservable inputs. In situations where quoted prices or observable inputs areunavailable (for example, when there is little or no market activity for an investment at the end of the period), unobservableinputs may be used. Unobservable inputs reflect the Fund’s own assumptions about the factors market participants would usein determining fair value of the securities or instruments and would be based on the best available information.
The following is a summary of the tiered valuation input levels, as of August 31, 2021. The level assigned to the securities valuations maynot be an indication of the risk or liquidity associated with investing in those securities. Because of the inherent uncertainties of valuation,the values reflected in the financial statements may materially differ from the value received upon actual sale of those investments.
Level 1 Level 2 Level 3 TotalInvestments in Securities U.S. Dollar Denominated Bonds & Notes $ – $ 97,273,729 $– $ 97,273,729U.S. Treasury Securities – 54,997,140 – 54,997,140U.S. Government Sponsored Agency Mortgage-Backed Securities – 51,582,018 – 51,582,018Non-U.S. Dollar Denominated Bonds & Notes – 19,290,434 – 19,290,434Asset-Backed Securities – 465,527 – 465,527Money Market Funds 3,017,889 – – 3,017,889Total Investments in Securities 3,017,889 223,608,848 – 226,626,737Other Investments - Assets* Futures Contracts 45,008 – – 45,008Forward Foreign Currency Contracts – 35,451 – 35,451 45,008 35,451 – 80,459 21 Invesco Intermediate Bond Factor Fund
ˆ200F9gQxdnDwee1o=Š200F9gQxdnDwee1o=
209907 EDG 22INVESCOINTERMEDIATE BOND FA
29-Oct-2021 20:26 ESTHTMDTF
Donnelley Financial LSWpf_rendNone
6*ESS 0C
FWPLAN-PFRS6021.10.7.0
Page 1 of 1 Level 1 Level 2 Level 3 Total Other Investments - Liabilities*
Futures Contracts $ (47,984) $ – $– $ (47,984)
Forward Foreign Currency Contracts – (176,852) – (176,852)
(47,984) (176,852) – (224,836)
Total Other Investments (2,976) (141,401) – (144,377)
Total Investments $3,014,913 $223,467,447 $– $226,482,360
* Forward foreign currency contracts and futures contracts are valued at unrealized appreciation (depreciation).
NOTE 4–Derivative Investments
The Fund may enter into an International Swaps and Derivatives Association Master Agreement (“ISDA Master Agreement”) under which afund may trade OTC derivatives. An OTC transaction entered into under an ISDA Master Agreement typically involves a collateral postingarrangement, payment netting provisions and close-out netting provisions. These netting provisions allow for reduction of credit risk throughnetting of contractual obligations. The enforceability of the netting provisions of the ISDA Master Agreement depends on the governing lawof the ISDA Master Agreement, among other factors.
For financial reporting purposes, the Fund does not offset OTC derivative assets or liabilities that are subject to ISDA Master Agreementsin the Statement of Assets and Liabilities.
Value of Derivative Investments at Period-End
The table below summarizes the value of the Fund’s derivative investments, detailed by primary risk exposure, held as of August 31, 2021:
Value Currency Interest Derivative Assets Risk Rate Risk Total
Unrealized appreciation on futures contracts – Exchange-Traded(a) $ - $ 45,008 $ 45,008
Unrealized appreciation on forward foreign currency contracts outstanding 35,451 - 35,451
Total Derivative Assets 35,451 45,008 80,459
Derivatives not subject to master netting agreements - (45,008) (45,008)
Total Derivative Assets subject to master netting agreements $ 35,451 $ - $ 35,451
Value Currency Interest Derivative Liabilities Risk Rate Risk Total
Unrealized depreciation on futures contracts – Exchange-Traded(a) $ - $ (47,984) $ (47,984)
Unrealized depreciation on forward foreign currency contracts outstanding (176,852) - (176,852)
Total Derivative Liabilities (176,852) (47,984) (224,836)
Derivatives not subject to master netting agreements - 47,984 47,984
Total Derivative Liabilities subject to master netting agreements $(176,852) $ - $(176,852)
(a) The daily variation margin receivable (payable) at period-end is recorded in the Statement of Assets and Liabilities.
Offsetting Assets and Liabilities
The table below reflects the Fund’s exposure to Counterparties subject to either an ISDA Master Agreement or other agreement for OTCderivative transactions as of August 31, 2021.
FinancialDerivative
Assets Financial Derivative
Liabilities Collateral
(Received)/Pledged
Counterparty Forward Foreign
Currency Contracts Forward Foreign
Currency Contracts Net Value ofDerivatives Non-Cash Cash
NetAmount
Bank of America, N.A. $ – $ (3,290) $ (3,290) $– $– $ (3,290)
Citibank, N.A. – (13,744) (13,744) – – (13,744)
Deutsche Bank AG – (18,308) (18,308) – – (18,308)
Goldman Sachs International 12,277 (131,947) (119,670) – – (119,670)
Morgan Stanley and Co.International PLC 23,174 (9,563) 13,611 – – 13,611
Total $35,451 $(176,852) $ (141,401) $– $– $(141,401)
22 Invesco Intermediate Bond Factor Fund
ˆ200F9gQxdnDwjzuoeŠ200F9gQxdnDwjzuoe
209907 EDG 23INVESCOINTERMEDIATE BOND FA
29-Oct-2021 20:26 ESTHTMDTF
Donnelley Financial LSWpf_rendNone
4*ESS 0C
FWPLAN-PFRS6021.10.7.0
Page 1 of 1Effect of Derivative Investments for the six months ended August 31, 2021
The table below summarizes the gains (losses) on derivative investments, detailed by primary risk exposure, recognized in earnings duringthe period:
Location of Gain (Loss) onStatement of Operations
Currency
Risk Interest
Rate Risk Total
Realized Gain: Forward foreign currency contracts $ 692,273 $ - $ 692,273
Futures contracts - 751,734 751,734
Change in Net Unrealized Appreciation (Depreciation): Forward foreign currency contracts (342,630) - (342,630)
Futures contracts - (182,409) (182,409)
Total $ 349,643 $ 569,325 $ 918,968
The table below summarizes the average notional value of derivatives held during the period.
Forward Foreign Currency Futures Contracts ContractsAverage notional value $ 23,514,474 $41,599,294
NOTE 5–Expense Offset Arrangement(s)
The expense offset arrangement is comprised of transfer agency credits which result from balances in demand deposit accounts used bythe transfer agent for clearing shareholder transactions. For the six months ended August 31, 2021, the Fund received credits from thisarrangement, which resulted in the reduction of the Fund’s total expenses of $478.
NOTE 6–Trustees’ and Officers’ Fees and Benefits
Trustees’ and Officers’ Fees and Benefits include amounts accrued by the Fund to pay remuneration to certain Trustees and Officers of theFund. Trustees have the option to defer compensation payable by the Fund, and Trustees’ and Officers’ Fees and Benefits also includeamounts accrued by the Fund to fund such deferred compensation amounts. Those Trustees who defer compensation have the option toselect various Invesco Funds in which their deferral accounts shall be deemed to be invested. Finally, certain current Trustees were eligibleto participate in a retirement plan that provided for benefits to be paid upon retirement to Trustees over a period of time based on thenumber of years of service. The Fund may have certain former Trustees who also participate in a retirement plan and receive benefits undersuch plan. Trustees’ and Officers’ Fees and Benefits include amounts accrued by the Fund to fund such retirement benefits. Obligationsunder the deferred compensation and retirement plans represent unsecured claims against the general assets of the Fund.
NOTE 7–Cash Balances
The Fund is permitted to temporarily carry a negative or overdrawn balance in its account with SSB, the custodian bank. Such balances, ifany at period-end, are shown in the Statement of Assets and Liabilities under the payable caption Amount due custodian. To compensatethe custodian bank for such overdrafts, the overdrawn Fund may either (1) leave funds as a compensating balance in the account so thecustodian bank can be compensated by earning the additional interest; or (2) compensate by paying the custodian bank at a rate agreedupon by the custodian bank and Invesco, not to exceed the contractually agreed upon rate. The Fund may not purchase additionalsecurities when any borrowings from banks or broker-dealers exceed 5% of the Fund’s total assets, or when any borrowings from anInvesco Fund are outstanding.
NOTE 8–Tax Information
The amount and character of income and gains to be distributed are determined in accordance with income tax regulations, which maydiffer from GAAP. Reclassifications are made to the Fund’s capital accounts to reflect income and gains available for distribution (oravailable capital loss carryforward) under income tax regulations. The tax character of distributions paid during the year and the taxcomponents of net assets will be reported at the Fund’s fiscal year-end.
Capital loss carryforward is calculated and reported as of a specific date. Results of transactions and other activity after that date mayaffect the amount of capital loss carryforward actually available for the Fund to utilize. The ability to utilize capital loss carryforwards in thefuture may be limited under the Internal Revenue Code and related regulations based on the results of future transactions.
The Fund did not have a capital loss carryforward as of February 28, 2021.
NOTE 9–Investment Transactions
The aggregate amount of investment securities (other than short-term securities, U.S. Government obligations and money market funds, ifany) purchased and sold by the Fund during the six months ended August 31, 2021 was $20,963,182 and $19,981,836, respectively. Costof investments, including any derivatives, on a tax basis includes the adjustments for financial reporting purposes as of the most recentlycompleted federal income tax reporting period-end.
Unrealized Appreciation (Depreciation) of Investments on a Tax Basis
Aggregate unrealized appreciation of investments $4,269,532
Aggregate unrealized (depreciation) of investments (929,261)
Net unrealized appreciation of investments $3,340,271
Cost of investments for tax purposes is $223,142,089. 23 Invesco Intermediate Bond Factor Fund
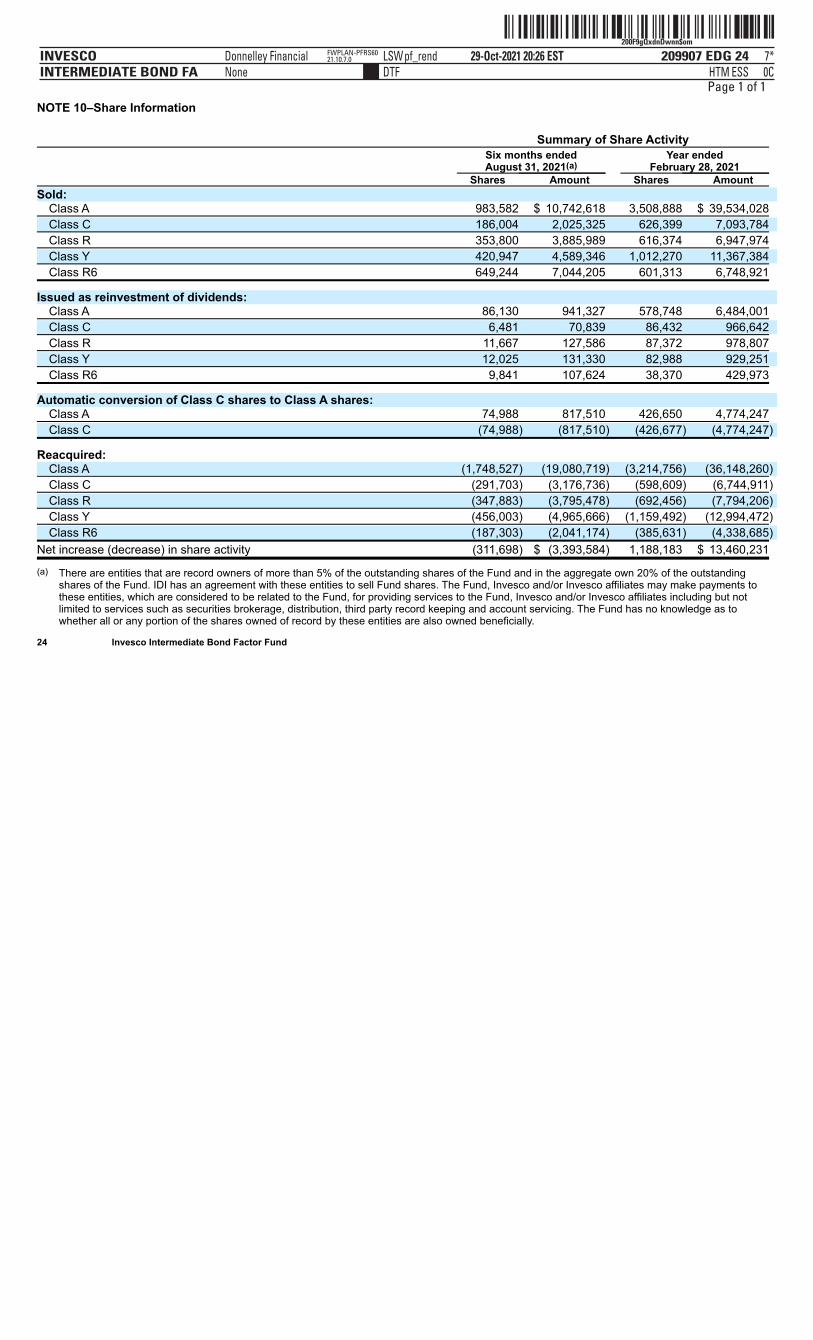
ˆ200F9gQxdnDwnn$omŠ200F9gQxdnDwnn$om
209907 EDG 24INVESCOINTERMEDIATE BOND FA
29-Oct-2021 20:26 ESTHTMDTF
Donnelley Financial LSWpf_rendNone
7*ESS 0C
FWPLAN-PFRS6021.10.7.0
Page 1 of 1NOTE 10–Share Information Summary of Share Activity
Six months ended Year ended August 31, 2021(a) February 28, 2021 Shares Amount Shares Amount
Sold: Class A 983,582 $ 10,742,618 3,508,888 $ 39,534,028
Class C 186,004 2,025,325 626,399 7,093,784
Class R 353,800 3,885,989 616,374 6,947,974
Class Y 420,947 4,589,346 1,012,270 11,367,384
Class R6 649,244 7,044,205 601,313 6,748,921
Issued as reinvestment of dividends: Class A 86,130 941,327 578,748 6,484,001
Class C 6,481 70,839 86,432 966,642
Class R 11,667 127,586 87,372 978,807
Class Y 12,025 131,330 82,988 929,251
Class R6 9,841 107,624 38,370 429,973
Automatic conversion of Class C shares to Class A shares: Class A 74,988 817,510 426,650 4,774,247
Class C (74,988) (817,510) (426,677) (4,774,247)
Reacquired: Class A (1,748,527) (19,080,719) (3,214,756) (36,148,260)
Class C (291,703) (3,176,736) (598,609) (6,744,911)
Class R (347,883) (3,795,478) (692,456) (7,794,206)
Class Y (456,003) (4,965,666) (1,159,492) (12,994,472)
Class R6 (187,303) (2,041,174) (385,631) (4,338,685)
Net increase (decrease) in share activity (311,698) $ (3,393,584) 1,188,183 $ 13,460,231
(a) There are entities that are record owners of more than 5% of the outstanding shares of the Fund and in the aggregate own 20% of the outstandingshares of the Fund. IDI has an agreement with these entities to sell Fund shares. The Fund, Invesco and/or Invesco affiliates may make payments tothese entities, which are considered to be related to the Fund, for providing services to the Fund, Invesco and/or Invesco affiliates including but notlimited to services such as securities brokerage, distribution, third party record keeping and account servicing. The Fund has no knowledge as towhether all or any portion of the shares owned of record by these entities are also owned beneficially.
24 Invesco Intermediate Bond Factor Fund
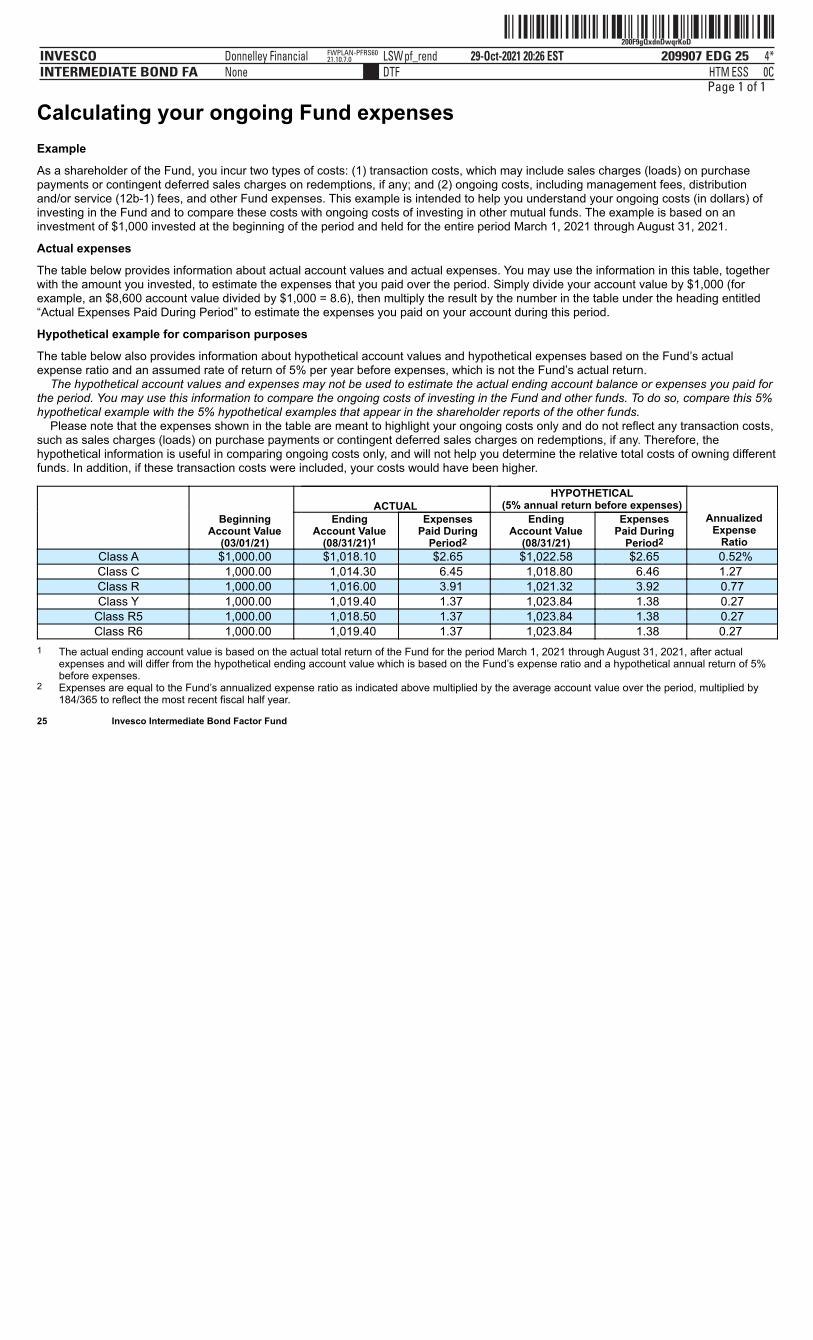
ˆ200F9gQxdnDwqrKoDŠ200F9gQxdnDwqrKoD
209907 EDG 25INVESCOINTERMEDIATE BOND FA
29-Oct-2021 20:26 ESTHTMDTF
Donnelley Financial LSWpf_rendNone
4*ESS 0C
FWPLAN-PFRS6021.10.7.0
Page 1 of 1
Calculating your ongoing Fund expensesExample
As a shareholder of the Fund, you incur two types of costs: (1) transaction costs, which may include sales charges (loads) on purchasepayments or contingent deferred sales charges on redemptions, if any; and (2) ongoing costs, including management fees, distributionand/or service (12b-1) fees, and other Fund expenses. This example is intended to help you understand your ongoing costs (in dollars) ofinvesting in the Fund and to compare these costs with ongoing costs of investing in other mutual funds. The example is based on aninvestment of $1,000 invested at the beginning of the period and held for the entire period March 1, 2021 through August 31, 2021.
Actual expenses
The table below provides information about actual account values and actual expenses. You may use the information in this table, togetherwith the amount you invested, to estimate the expenses that you paid over the period. Simply divide your account value by $1,000 (forexample, an $8,600 account value divided by $1,000 = 8.6), then multiply the result by the number in the table under the heading entitled“Actual Expenses Paid During Period” to estimate the expenses you paid on your account during this period.
Hypothetical example for comparison purposes
The table below also provides information about hypothetical account values and hypothetical expenses based on the Fund’s actualexpense ratio and an assumed rate of return of 5% per year before expenses, which is not the Fund’s actual return. The hypothetical account values and expenses may not be used to estimate the actual ending account balance or expenses you paid forthe period. You may use this information to compare the ongoing costs of investing in the Fund and other funds. To do so, compare this 5%hypothetical example with the 5% hypothetical examples that appear in the shareholder reports of the other funds. Please note that the expenses shown in the table are meant to highlight your ongoing costs only and do not reflect any transaction costs,such as sales charges (loads) on purchase payments or contingent deferred sales charges on redemptions, if any. Therefore, thehypothetical information is useful in comparing ongoing costs only, and will not help you determine the relative total costs of owning differentfunds. In addition, if these transaction costs were included, your costs would have been higher.
ACTUAL HYPOTHETICAL
(5% annual return before expenses)
Beginning Account Value
(03/01/21)
Ending Account Value
(08/31/21)1
Expenses Paid During
Period2
Ending Account Value
(08/31/21)
Expenses Paid During
Period2
Annualized Expense
RatioClass A $1,000.00 $1,018.10 $2.65 $1,022.58 $2.65 0.52%Class C 1,000.00 1,014.30 6.45 1,018.80 6.46 1.27 Class R 1,000.00 1,016.00 3.91 1,021.32 3.92 0.77 Class Y 1,000.00 1,019.40 1.37 1,023.84 1.38 0.27
Class R5 1,000.00 1,018.50 1.37 1,023.84 1.38 0.27 Class R6 1,000.00 1,019.40 1.37 1,023.84 1.38 0.27
1 The actual ending account value is based on the actual total return of the Fund for the period March 1, 2021 through August 31, 2021, after actualexpenses and will differ from the hypothetical ending account value which is based on the Fund’s expense ratio and a hypothetical annual return of 5%before expenses.
2 Expenses are equal to the Fund’s annualized expense ratio as indicated above multiplied by the average account value over the period, multiplied by184/365 to reflect the most recent fiscal half year.
25 Invesco Intermediate Bond Factor Fund
ˆ200F9gQxdnDwt3qohŠ200F9gQxdnDwt3qoh
209907 EDG 26INVESCOINTERMEDIATE BOND FA
29-Oct-2021 20:26 ESTHTMDTF
Donnelley Financial LSWpf_rendNone
5*ESS 0C
FWPLAN-PFRS6021.10.7.0
Page 1 of 2
Approval of Investment Advisory and Sub-Advisory Contracts At meetings held on June 10, 2021, theBoard of Trustees (the Board or theTrustees) of AIM Investment SecuritiesFunds (Invesco Investment SecuritiesFunds) as a whole, and the independentTrustees, who comprise over 75% of theBoard, voting separately, approved thecontinuance of the Invesco IntermediateBond Factor Fund’s (the Fund) MasterInvestment Advisory Agreement withInvesco Advisers, Inc. (Invesco Advisersand the investment advisory agreement)and the Master Intergroup Sub-AdvisoryContract for Mutual Funds with InvescoAsset Management Deutschland GmbH,Invesco Asset Management Limited,Invesco Asset Management (Japan)Limited, Invesco Hong Kong Limited,Invesco Senior Secured Management, Inc.and Invesco Canada Ltd. and separatesub-advisory contracts with InvescoCapital Management LLC, Invesco AssetManagement (India) Private Limited andOppenheimerFunds, Inc. (collectively, theAffiliated Sub-Advisers and thesub-advisory contracts) for another year,effective July 1, 2021. After evaluating thefactors discussed below, among others,the Board approved the renewal of theFund’s investment advisory agreement andthe sub-advisory contracts and determinedthat the compensation payable thereunderby the Fund to Invesco Advisers and by
process to ensure they are negotiated in amanner that is at arms’ length andreasonable. In addition to meetings withInvesco Advisers and fund counselthroughout the year and as part of meetingsconvened on April 27, 2021 and June 10,2021, the independent Trustees alsodiscussed the continuance of the investmentadvisory agreement and sub-advisorycontracts in separate sessions with theSenior Officer and with independent legalcounsel.
The discussion below is a summary of theSenior Officer’s independent writtenevaluation with respect to the Fund’sinvestment advisory agreement andsub-advisory contracts, as well as adiscussion of the material factors andrelated conclusions that formed the basis forthe Board’s approval of the Fund’sinvestment advisory agreement andsub-advisory contracts. The Trustees’ reviewand conclusions are based on thecomprehensive consideration of allinformation presented to them during thecourse of the year and in prior years and arenot the result of any single determinativefactor. Moreover, one Trustee may haveweighed a particular piece of information orfactor differently than another Trustee. Theinformation received and considered by theBoard was current as of various dates priorto the Board’s approval on June 10, 2021.
part of the family of funds under theumbrella of Invesco Ltd., Invesco Advisers’parent company, and noted Invesco Ltd.’sdepth and experience in running aninvestment management business, as wellas its commitment of financial and otherresources to such business. The Boardconcluded that the nature, extent andquality of the services provided to the Fundby Invesco Advisers are appropriate andsatisfactory.
The Board reviewed the services thatmay be provided by the AffiliatedSub-Advisers under the sub-advisorycontracts and the credentials andexperience of the officers and employeesof the Affiliated Sub-Advisers who providethese services. The Board noted theAffiliated Sub-Advisers’ expertise withrespect to certain asset classes and thatthe Affiliated Sub-Advisers have officesand personnel that are located in financialcenters around the world. As a result, theBoard noted that the AffiliatedSub-Advisers can provide research andinvestment analysis on the markets andeconomies of various countries in whichthe Fund may invest, makerecommendations regarding securities andassist with security trades. The Boardconcluded that the sub-advisory contractsmay benefit the Fund and its shareholdersby permitting Invesco Advisers to use the
ˆ200F9gQxdnDwt3qohŠ200F9gQxdnDwt3qoh
209907 EDG 26INVESCOINTERMEDIATE BOND FA
29-Oct-2021 20:26 ESTHTMDTF
Donnelley Financial LSWpf_rendNone
5*ESS 0C
FWPLAN-PFRS6021.10.7.0
ˆ200F9gQxdnDwt3qohŠ200F9gQxdnDwt3qoh
209907 EDG 26INVESCOINTERMEDIATE BOND FA
29-Oct-2021 20:26 ESTHTMDTF
Donnelley Financial LSWpf_rendNone
5*ESS 0C
FWPLAN-PFRS6021.10.7.0
Page 2 of 2
26 Invesco Intermediate Bond Factor Fund
Invesco Advisers to the AffiliatedSub-Advisers is fair and reasonable.The Board’s Evaluation ProcessThe Board has established an InvestmentsCommittee, which in turn has establishedSub-Committees that meet throughout theyear to review the performance of fundsadvised by Invesco Advisers (the InvescoFunds). The Sub-Committees meetregularly with portfolio managers for theirassigned Invesco Funds and othermembers of management to reviewdetailed information about investmentperformance and portfolio attributes ofthese funds. The Board has establishedadditional standing and ad hoc committeesthat meet regularly throughout the year toreview matters within their purview. TheBoard took into account evaluations andreports that it received from its committeesand sub-committees, as well as theinformation provided to the Board and itscommittees and sub-committeesthroughout the year, in consideringwhether to approve each Invesco Fund’sinvestment advisory agreement andsub-advisory contracts.
As part of the contract renewal process,the Board reviews and considersinformation provided in response todetailed requests for information submittedto management by the independentTrustees with assistance from legalcounsel to the independent Trustees. TheBoard receives comparative investmentperformance and fee and expense dataregarding the Invesco Funds prepared byBroadridge Financial Solutions, Inc.(Broadridge), an independent mutual funddata provider, as well as information on thecomposition of the peer groups providedby Broadridge and its methodology fordetermining peer groups. The Board alsoreceives an independent written evaluationfrom the Senior Officer, an officer of theInvesco Funds who reports directly to theindependent Trustees. The Senior Officer’sevaluation is prepared as part of hisresponsibility to manage the process bywhich the Invesco Funds’ proposedmanagement fees are negotiated duringthe annual contract renewal
Factors and Conclusions and Summaryof Independent Written Fee EvaluationA. Nature, Extent and Quality of Services
Provided by Invesco Advisers and theAffiliated Sub-Advisers
The Board reviewed the nature, extent andquality of the advisory services provided tothe Fund by Invesco Advisers under theFund’s investment advisory agreement, andthe credentials and experience of theofficers and employees of Invesco Adviserswho provide these services, including theFund’s portfolio manager(s). The Board’sreview included consideration of InvescoAdvisers’ investment process and oversight,credit analysis, and research capabilities.The Board considered information regardingInvesco Advisers’ programs for andresources devoted to risk management,including management of investment,enterprise, operational, liquidity, valuationand compliance risks, and technology usedto manage such risks. The Board alsoreceived and reviewed information aboutInvesco Advisers’ role as administrator ofthe Invesco Funds’ liquidity riskmanagement program. The Board receiveda description of Invesco Advisers’ businesscontinuity plans and of its approach to dataprivacy and cybersecurity, including relatedtesting. The Board considered how thecybersecurity and business continuity plansof Invesco Advisers and its key serviceproviders operated in the increased remoteworking environment resulting from thenovel coronavirus (“COVID-19”) pandemic.The Board also considered non-advisoryservices that Invesco Advisers and itsaffiliates provide to the Invesco Funds, suchas various back office support functions,third party oversight, internal audit,valuation, portfolio trading and legal andcompliance. The Board observed thatInvesco Advisers has been able toeffectively manage, operate and oversee theInvesco Funds through the challengingCOVID-19 pandemic period. The Boardreviewed and considered the benefits toshareholders of investing in a Fund that is
resources and talents of the AffiliatedSub-Advisers in managing the Fund. TheBoard concluded that the nature, extentand quality of the services that may beprovided to the Fund by the AffiliatedSub-Advisers are appropriate andsatisfactory.B. Fund Investment PerformanceThe Board considered Fund investmentperformance as a relevant factor inconsidering whether to approve theinvestment advisory agreement. The Boarddid not view Fund investment performanceas a relevant factor in considering whetherto approve the sub-advisory contracts forthe Fund, as no Affiliated Sub-Advisercurrently manages assets of the Fund.
The Board compared the Fund’sinvestment performance over multiple timeperiods ending December 31, 2020 to theperformance of funds in the Broadridgeperformance universe and against theBloomberg Barclays U.S. Aggregate BondIndex (Index). The Board noted thatperformance of Class A shares of the Fundwas in the fourth quintile of its performanceuniverse for the one year period, the fifthquintile for the three year period and thesecond quintile for the five year period (thefirst quintile being the best performingfunds and the fifth quintile being the worstperforming funds). The Board noted thatperformance of Class A shares of the Fundwas reasonably comparable to theperformance of the Index for the one yearperiod, below the performance of the Indexfor the three year period and above theperformance of the Index for the five yearperiod. The Board considered that theFund was created in connection withInvesco Ltd.’s acquisition ofOppenheimerFunds, Inc. and itssubsidiaries (the “Transaction”) and thatthe Fund’s performance prior to the closingof the Transaction on May 24, 2019 is thatof its predecessor fund. The Board notedthat the Fund’s exposure to bonds withcertain factor characteristics detractedfrom performance. The Board recognizedthat the performance data reflects asnapshot in time as of a particular date andthat selecting a different performanceperiod could
ˆ200F9gQxdnDwvokG"Š200F9gQxdnDwvokG"
209907 EDG 27INVESCOINTERMEDIATE BOND FA
29-Oct-2021 20:26 ESTHTMDTF
Donnelley Financial LSWpf_rendNone
3*ESS 0C
FWPLAN-PFRS6021.10.7.0
Page 1 of 2
produce different results. The Board furtherconsidered that the Fund had changed itsname, investment strategy and portfoliomanagement team on February 28, 2020in connection with its repositioning as afactor-based fund, and that performanceresults prior to such date reflected that ofthe Fund’s former strategy. As a result, theBoard did not consider performance of theFund prior to such date to be particularlyrelevant. The Board also reviewed morerecent Fund performance as well as othermetrics, which did not change itsconclusions.C. Advisory and Sub-Advisory Fees and Fund
ExpensesThe Board compared the Fund’scontractual management fee rate to thecontractual management fee rates of fundsin the Fund’s Broadridge expense group.The Board noted that the contractualmanagement fee rate for Class A shares ofthe Fund was below the mediancontractual management fee rate of fundsin its expense group. The Board noted thatthe Fund’s contractual management feeschedule was reduced at certainbreakpoint levels effective in 2020 inconnection with its repositioning as afactor-based fund. The Board noted thatthe term “contractual management fee” forfunds in the expense group may includeboth advisory and certain non-portfoliomanagement administrative services fees,but that Broadridge is not able to provideinformation on a fund by fund basis as towhat is included. The Board also reviewedthe methodology used by Broadridge incalculating expense group information,which includes using each fund’scontractual management fee schedule(including any applicable breakpoints) asreported in the most recent prospectus orstatement of additional information foreach fund in the expense group. TheBoard also considered comparativeinformation regarding the Fund’s totalexpense ratio and its various components.
The Board noted that Invesco Advisershas contractually agreed to waive feesand/or limit expenses of the Fund for theterm disclosed in the Fund’s registrationstatement in an amount necessary to limittotal annual operating expenses to aspecified percentage of average daily netassets for each class of the Fund.
The Board noted that Invesco Advisersand the Affiliated Sub-Advisers do notmanage other similarly managed mutualfunds or client accounts.
The Board also considered the servicesthat may be provided by the AffiliatedSub-Advisers pursuant to the sub-advisorycontracts, as well as the fees payable byInvesco Advisers to the AffiliatedSub-Advisers pursuant to the sub-advisorycontracts.D. Economies of Scale and BreakpointsThe Board considered the extent to whichthere may be economies of scale in theprovision of advisory services to the Fundand the Invesco Funds, and the extent towhich such economies of scale are sharedwith the Fund and the Invesco Funds. TheBoard considered that the Fund maybenefit from economies of scale throughcontractual breakpoints in the Fund’sadvisory fee schedule, which generallyoperate to reduce the Fund’s expense ratioas it grows in size. The Board noted thatthe Fund also shares in economies ofscale through Invesco Advisers’ ability tonegotiate lower fee arrangements withthird party service providers. The Boardnoted that the Fund may also benefit fromeconomies of scale through initial fee
business infrastructure, technology andcybersecurity.E. Profitability and Financial ResourcesThe Board reviewed information fromInvesco Advisers concerning the costs of theadvisory and other services that InvescoAdvisers and its affiliates provide to theFund and the Invesco Funds and theprofitability of Invesco Advisers and itsaffiliates in providing these services in theaggregate and on an individualFund-by-Fund basis. The Board consideredthe methodology used for calculatingprofitability and noted that suchmethodology had recently been reviewedand enhanced. The Board noted thatInvesco Advisers continues to operate at anet profit from services Invesco Advisersand its affiliates provide to the InvescoFunds in the aggregate and to most Fundsindividually. The Board did not deem thelevel of profits realized by Invesco Advisersand its affiliates from providing suchservices to be excessive, given the nature,extent and quality of the services provided.The Board noted that Invesco Advisersprovided information demonstrating thatInvesco Advisers is financially sound andhas the resources necessary to perform itsobligations under the investment advisoryagreement, and provided representationsindicating that the Affiliated Sub-Advisersare financially sound and have theresources necessary to perform theirobligations under the sub-advisorycontracts.F. Collateral Benefits to Invesco Advisers and its
AffiliatesThe Board considered various other benefitsreceived by Invesco Advisers and itsaffiliates from the relationship with the Fund,including the fees received for providingadministrative, transfer agency anddistribution services to the Fund. The Boardreceived comparative information regardingfees charged for these services, includinginformation provided by Broadridge andother independent sources. The Boardreviewed the performance of InvescoAdvisers and its affiliates in providing theseservices and the organizational structureemployed to provide these services. TheBoard noted that these services areprovided to the Fund pursuant to writtencontracts that are reviewed and subject toapproval on an annual basis by the Boardbased on its determination that the servicesare required for the operation of the Fund.
The Board considered the benefitsrealized by Invesco Advisers and theAffiliated Sub-Advisers as a result ofportfolio brokerage transactions executedthrough “soft dollar” arrangements. InvescoAdvisers noted that the Fund does notexecute brokerage transactions through“soft dollar” arrangements to any significantdegree.
The Board considered that the Fund’suninvested cash and cash collateral fromany securities lending arrangements may beinvested in registered money market fundsor, with regard to securities lending cashcollateral, unregistered funds that complywith Rule 2a-7 (collectively referred to as“affiliated money market funds”) advised byInvesco Advisers. The Board consideredinformation regarding the returns of theaffiliated money market funds relative tocomparable overnight investments, as wellas the fees paid by the affiliated moneymarket funds to Invesco Advisers and itsaffiliates. In this regard, the Board noted thatInvesco Advisers receives advisory feesfrom these affiliated money market fundsattributable to the Fund’s investments. TheBoard also noted that Invesco Advisers has
equal to 100% of the net advisory feeInvesco Advisers receives from theaffiliated money market funds with respectto the Fund’s investment in the affiliatedmoney market funds of uninvested cash,but not cash collateral. The Boardconcluded that the advisory fees payableto Invesco Advisers from the Fund’sinvestment of cash collateral from anysecurities lending arrangements in theaffiliated money market funds are forservices that are not duplicative of servicesprovided by Invesco Advisers to the Fund.
The Board also received informationabout commissions that an affiliated brokermay receive for executing certain tradesfor the Fund. Invesco Advisers and theAffiliated Sub-Advisers advised the Boardof the benefits to the Fund of executingtrades through the affiliated broker and thatsuch trades were executed in compliancewith rules under the federal securities lawsand consistent with best executionobligations.

ˆ200F9gQxdnDwvokG"Š200F9gQxdnDwvokG"
209907 EDG 27INVESCOINTERMEDIATE BOND FA
29-Oct-2021 20:26 ESTHTMDTF
Donnelley Financial LSWpf_rendNone
3*ESS 0C
FWPLAN-PFRS6021.10.7.0
ˆ200F9gQxdnDwvokG"Š200F9gQxdnDwvokG"
209907 EDG 27INVESCOINTERMEDIATE BOND FA
29-Oct-2021 20:26 ESTHTMDTF
Donnelley Financial LSWpf_rendNone
3*ESS 0C
FWPLAN-PFRS6021.10.7.0
Page 2 of 2
27 Invesco Intermediate Bond Factor Fund
setting, fee waivers and expensereimbursements, as well as InvescoAdvisers’ investment in its business,including investments in
contractually agreed to waive throughvarying periods an amount
ˆ200F9gQxdnDwxioo:Š200F9gQxdnDwxioo:
209907 EDG 28INVESCOINTERMEDIATE BOND FA
29-Oct-2021 20:26 ESTHTMDTF
Donnelley Financial LSWpf_rendNone
4*ESS 0C
FWPLAN-PFRS6021.10.7.0
dsp0001dsp00032
Page 1 of 1
Go paperless with eDeliveryVisit invesco.com/edelivery to enjoy the convenience and security of anytime electronic access to your investmentdocuments.With eDelivery, you can elect to have any or all of the following materials delivered straight to your inbox to download, saveand print from your own computer:∎ Fund reports and prospectuses∎ Quarterly statements∎ Daily confirmations∎ Tax forms Invesco mailing informationSend general correspondence to Invesco Investment Services, Inc., P.O. Box 219078, Kansas City, MO 64121-9078. Important notice regarding delivery of security holder documentsTo reduce Fund expenses, only one copy of most shareholder documents may be mailed to shareholders with multipleaccounts at the same address (Householding). Mailing of your shareholder documents may be householded indefinitelyunless you instruct us otherwise. If you do not want the mailing of these documents to be combined with those for othermembers of your household, please contact Invesco Investment Services, Inc. at 800 959 4246 or contact your financialinstitution. We will begin sending you individual copies for each account within 30 days after receiving your request.
Fund holdings and proxy voting informationThe Fund provides a complete list of its portfolio holdings four times each fiscal year, at the end of each fiscal quarter. For thesecond and fourth quarters, the list appears, respectively, in the Fund’s semiannual and annual reports to shareholders. Forthe first and third quarters, the Fund files the list with the Securities and Exchange Commission (SEC) as an exhibit to itsreports on Form N-PORT. The most recent list of portfolio holdings is available at invesco.com/completeqtrholdings.Shareholders can also look up the Fund’s Form N-PORT filings on the SEC website, sec.gov. The SEC file numbers for theFund are shown below.
A description of the policies and procedures that the Fund uses to determine how to vote proxies relating to portfoliosecurities is available without charge, upon request, from our Client Services department at 800 959 4246, or at invesco.com/corporate/about-us/esg. The information is also available on the SEC website, sec.gov.
Information regarding how the Fund voted proxies related to its portfolio securities during the most recent 12-month periodended June 30 is available at invesco.com/proxysearch. This information is also available on the SEC website, sec.gov.
Invesco Advisers, Inc. is an investment adviser; it provides investment advisory services to individual and institutionalclients and does not sell securities. Invesco Distributors, Inc. is the US distributor for Invesco Ltd.’s retail mutual funds,exchange-traded funds and institutional money market funds. Both are wholly owned, indirect subsidiaries of Invesco Ltd.
SEC file number(s): 811-05686 and 033-39519 Invesco Distributors, Inc. O-INTI-SAR-1

ˆ200F9gax2$8HwZyoAŠ200F9gax2$8HwZyoA
209925 EDG 1INVESCOREAL ESTATE
28-Oct-2021 08:28 ESTHTMLAN
Donnelley Financial LSWjenak0apNone
9*ESS 0C
VDI-W10-DPF-23021.7.8.0
dsp1
Page 1 of 1
Semiannual Report to Shareholders August 31, 2021
Invesco Real Estate FundNasdaq:A: IARAX ∎ C: IARCX ∎ R: IARRX ∎ Y: IARYX ∎ Investor: REINX ∎ R5: IARIX ∎ R6: IARFX
2 Fund Performance4 Liquidity Risk Management Program5 Schedule of Investments8 Financial Statements11 Financial Highlights12 Notes to Financial Statements18 Fund Expenses19 Approval of Investment Advisory and Sub-Advisory Contracts
For the most current month-end Fund performance and commentary, please visit invesco.com/performance.
Unless otherwise noted, all data provided by Invesco.
This report must be accompanied or preceded by a currently effective Fund prospectus, which contains more complete information, includingsales charges and expenses. Investors should read it carefully before investing.
NOT FDIC INSURED | MAY LOSE VALUE | NO BANK GUARANTEE
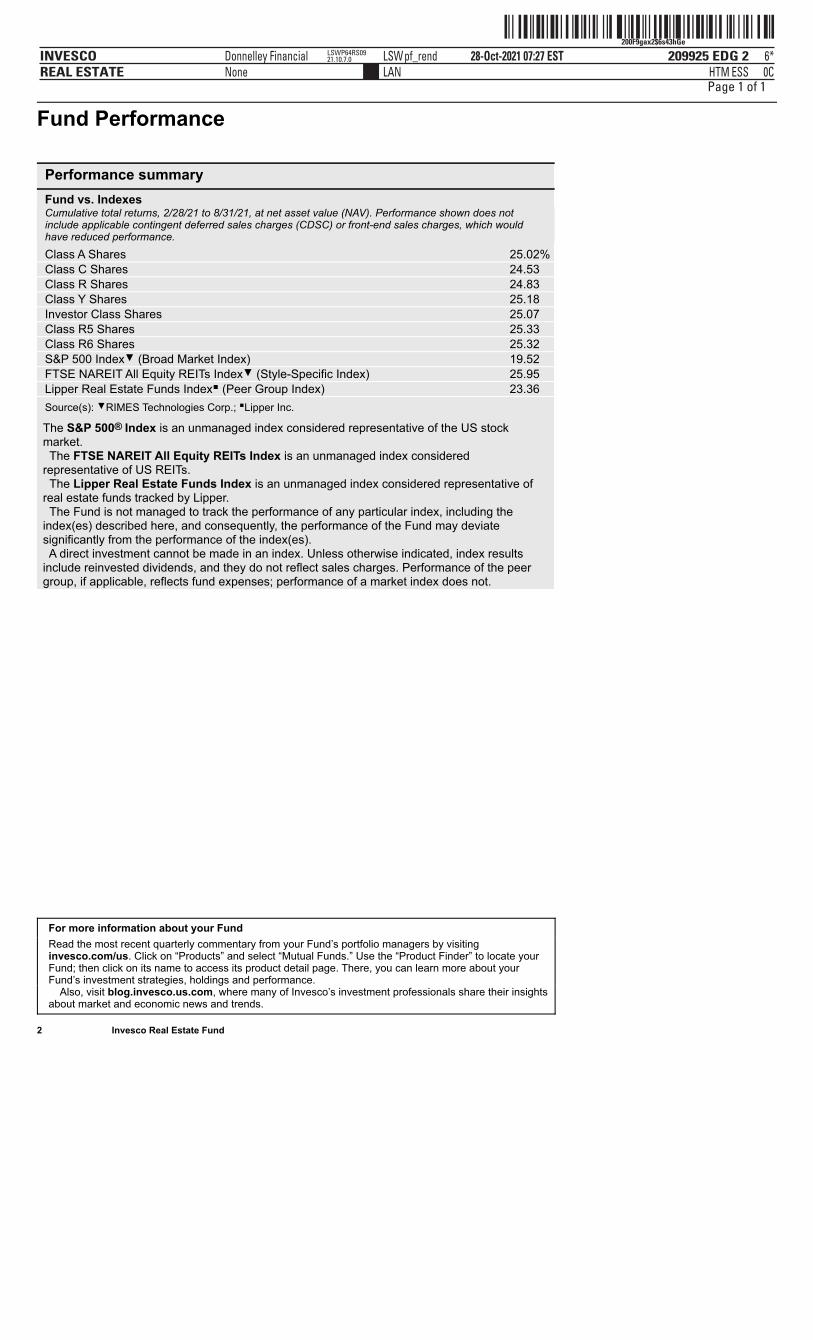
ˆ200F9gax2$6s43hGeŠ200F9gax2$6s43hGe
209925 EDG 2INVESCOREAL ESTATE
28-Oct-2021 07:27 ESTHTMLAN
Donnelley Financial LSWpf_rendNone
6*ESS 0C
LSWP64RS0921.10.7.0
Page 1 of 1
Fund Performance
Performance summary
Fund vs. Indexes Cumulative total returns, 2/28/21 to 8/31/21, at net asset value (NAV). Performance shown does notinclude applicable contingent deferred sales charges (CDSC) or front-end sales charges, which wouldhave reduced performance.
Class A Shares 25.02% Class C Shares 24.53 Class R Shares 24.83 Class Y Shares 25.18 Investor Class Shares 25.07 Class R5 Shares 25.33 Class R6 Shares 25.32 S&P 500 Index▼ (Broad Market Index) 19.52 FTSE NAREIT All Equity REITs Index▼ (Style-Specific Index) 25.95 Lipper Real Estate Funds Index∎ (Peer Group Index) 23.36 Source(s): ▼RIMES Technologies Corp.; ∎Lipper Inc.
The S&P 500® Index is an unmanaged index considered representative of the US stockmarket. The FTSE NAREIT All Equity REITs Index is an unmanaged index consideredrepresentative of US REITs. The Lipper Real Estate Funds Index is an unmanaged index considered representative ofreal estate funds tracked by Lipper. The Fund is not managed to track the performance of any particular index, including theindex(es) described here, and consequently, the performance of the Fund may deviatesignificantly from the performance of the index(es). A direct investment cannot be made in an index. Unless otherwise indicated, index resultsinclude reinvested dividends, and they do not reflect sales charges. Performance of the peergroup, if applicable, reflects fund expenses; performance of a market index does not.
For more information about your Fund
Read the most recent quarterly commentary from your Fund’s portfolio managers by visitinginvesco.com/us. Click on “Products” and select “Mutual Funds.” Use the “Product Finder” to locate yourFund; then click on its name to access its product detail page. There, you can learn more about yourFund’s investment strategies, holdings and performance. Also, visit blog.invesco.us.com, where many of Invesco’s investment professionals share their insightsabout market and economic news and trends.
2 Invesco Real Estate Fund
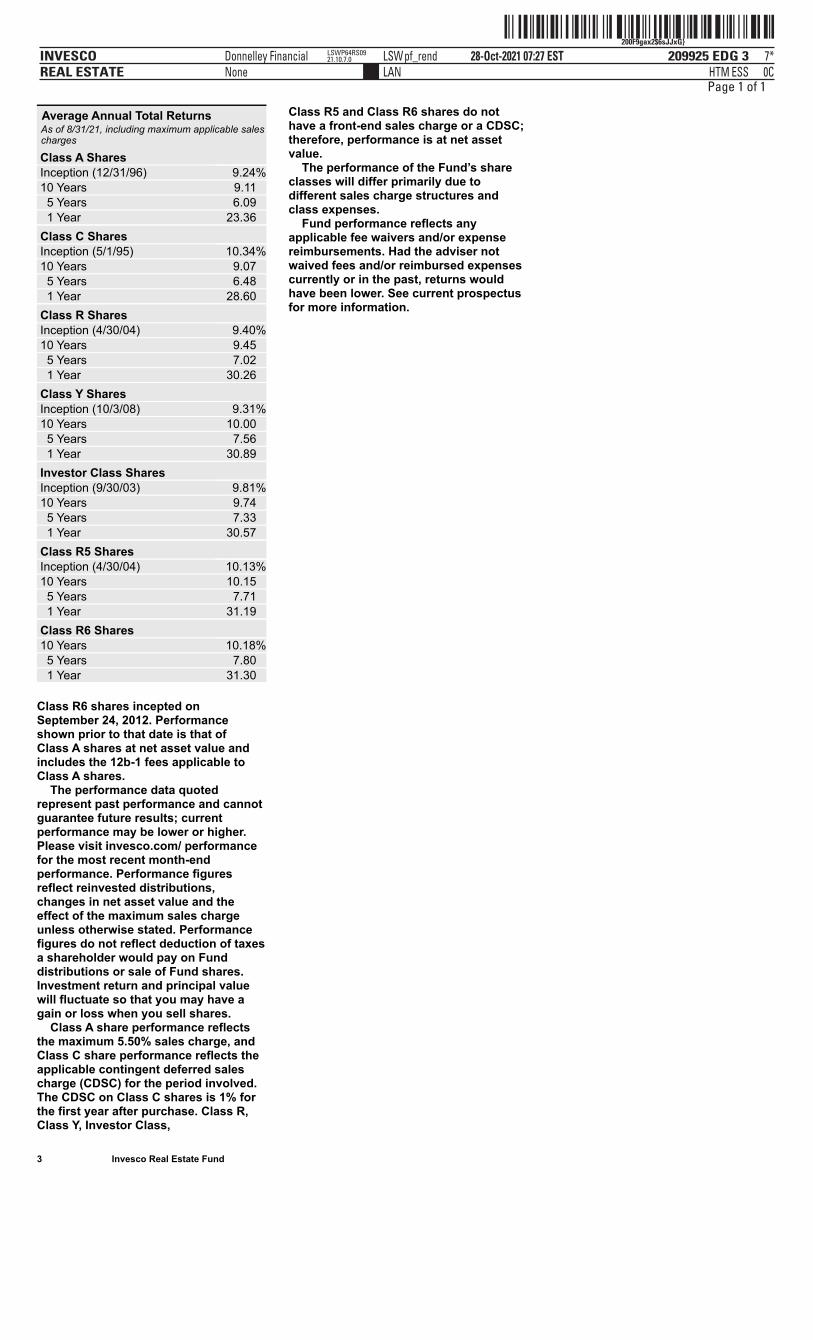
ˆ200F9gax2$6sJJxG}Š200F9gax2$6sJJxG}
209925 EDG 3INVESCOREAL ESTATE
28-Oct-2021 07:27 ESTHTMLAN
Donnelley Financial LSWpf_rendNone
7*ESS 0C
LSWP64RS0921.10.7.0
Page 1 of 1
3 Invesco Real Estate Fund
Average Annual Total ReturnsAs of 8/31/21, including maximum applicable salescharges
Class A Shares Inception (12/31/96) 9.24% 10 Years 9.11 5 Years 6.09 1 Year 23.36 Class C Shares Inception (5/1/95) 10.34% 10 Years 9.07 5 Years 6.48 1 Year 28.60 Class R Shares Inception (4/30/04) 9.40% 10 Years 9.45 5 Years 7.02 1 Year 30.26 Class Y Shares Inception (10/3/08) 9.31% 10 Years 10.00 5 Years 7.56 1 Year 30.89 Investor Class Shares Inception (9/30/03) 9.81% 10 Years 9.74 5 Years 7.33 1 Year 30.57 Class R5 Shares Inception (4/30/04) 10.13% 10 Years 10.15 5 Years 7.71 1 Year 31.19 Class R6 Shares 10 Years 10.18% 5 Years 7.80 1 Year 31.30
Class R6 shares incepted onSeptember 24, 2012. Performanceshown prior to that date is that ofClass A shares at net asset value andincludes the 12b-1 fees applicable toClass A shares. The performance data quotedrepresent past performance and cannotguarantee future results; currentperformance may be lower or higher.Please visit invesco.com/ performancefor the most recent month-endperformance. Performance figuresreflect reinvested distributions,changes in net asset value and theeffect of the maximum sales chargeunless otherwise stated. Performancefigures do not reflect deduction of taxesa shareholder would pay on Funddistributions or sale of Fund shares.Investment return and principal valuewill fluctuate so that you may have again or loss when you sell shares. Class A share performance reflectsthe maximum 5.50% sales charge, andClass C share performance reflects theapplicable contingent deferred salescharge (CDSC) for the period involved.The CDSC on Class C shares is 1% forthe first year after purchase. Class R,Class Y, Investor Class,
Class R5 and Class R6 shares do nothave a front-end sales charge or a CDSC;therefore, performance is at net assetvalue. The performance of the Fund’s shareclasses will differ primarily due todifferent sales charge structures andclass expenses. Fund performance reflects anyapplicable fee waivers and/or expensereimbursements. Had the adviser notwaived fees and/or reimbursed expensescurrently or in the past, returns wouldhave been lower. See current prospectusfor more information.
ˆ200F9gax2$6sXwborŠ200F9gax2$6sXwbor
209925 EDG 4INVESCOREAL ESTATE
28-Oct-2021 07:27 ESTHTMLAN
Donnelley Financial LSWpf_rendNone
8*ESS 0C
LSWP64RS0921.10.7.0
Page 1 of 1
4 Invesco Real Estate Fund
Liquidity Risk Management Program
In compliance with Rule 22e-4 underthe Investment Company Act of 1940,as amended (the “Liquidity Rule”), theFund has adopted and implemented aliquidity risk management program inaccordance with the Liquidity Rule(the “Program”). The Program isreasonably designed to assess andmanage the Fund’s liquidity risk, whichis the risk that the Fund could notmeet redemption requests withoutsignificant dilution of remaininginvestors’ interests in the Fund. TheBoard of Trustees of the Fund (the“Board”) has appointed InvescoAdvisers, Inc. (“Invesco”), the Fund’sinvestment adviser, as the Program’sadministrator, and Invesco hasdelegated oversight of the Program tothe Liquidity Risk ManagementCommittee (the “Committee”), which iscomposed of senior representativesfrom relevant business groups atInvesco.
As required by the Liquidity Rule, theProgram includes policies andprocedures providing for anassessment, no less frequently thanannually, of the Fund’s liquidity riskthat takes into account, as relevant tothe Fund’s liquidity risk: (1) the Fund’sinvestment strategy and liquidity ofportfolio investments during bothnormal and reasonably foreseeablestressed conditions; (2) short-term andlong-term cash flow projections for theFund during both normal andreasonably foreseeable stressedconditions; and (3) the Fund’s holdingsof cash and cash equivalents and anyborrowing arrangements. The LiquidityRule also requires the classification ofthe Fund’s investments into categoriesthat reflect the assessment of theirrelative liquidity under current marketconditions. The Fund classifies itsinvestments into one of fourcategories defined in the LiquidityRule: “Highly Liquid,” “ModeratelyLiquid,” “Less Liquid,” and “Illiquid.”Funds that are not invested primarilyin “Highly Liquid Investments” that areassets (cash or investments that arereasonably expected to be convertibleinto cash within three business dayswithout significantly changing themarket value of the investment) arerequired to establish a “Highly LiquidInvestment Minimum” (“HLIM”), whichis the minimum percentage of netassets that must be invested in HighlyLiquid Investments. Funds with HLIMshave procedures for addressing HLIMshortfalls, including reporting to theBoard and the SEC (on a non-publicbasis) as required by the Program andthe Liquidity Rule. In addition, theFund may not acquire an investmentif, immediately after the acquisition,over 15% of the Fund’s net assetswould consist of “Illiquid Investments”that are assets (an investment thatcannot reasonably be expected to besold or disposed of in current marketconditions in seven calendar days orless
without the sale or dispositionsignificantly changing the market valueof the investment). The Liquidity Ruleand the Program also require reportingto the Board and the SEC (on anon-public basis) if a Fund’s holdings ofIlliquid Investments exceed 15% of theFund’s assets.
At a meeting held on March 22-24,2021, the Committee presented a reportto the Board that addressed theoperation of the Program and assessedthe Program’s adequacy andeffectiveness of implementation (the“Report”). The Report covered theperiod from January 1, 2020 throughDecember 31, 2020 (the “ProgramReporting Period”). The Reportdiscussed notable events affectingliquidity over the Program ReportingPeriod, including the impact of thecoronavirus pandemic on the Fund andthe overall market. The Report notedthat there were no material changes tothe Program during the ProgramReporting Period.The Report stated, in relevant part, thatduring the Program Reporting Period:
∎ The Program, as adopted andimplemented, remained reasonablydesigned to assess and manage theFund’s liquidity risk and was operatedeffectively to achieve that goal;
∎ The Fund’s investment strategy
remained appropriate for an open-endfund;
∎ The Fund was able to meet requestsfor redemption without significantdilution of remaining investors’ interestsin the Fund;
∎ The Fund did not breach the 15% limiton Illiquid Investments; and
∎ The Fund primarily held Highly Liquid
Investments and therefore has notadopted an HLIM.
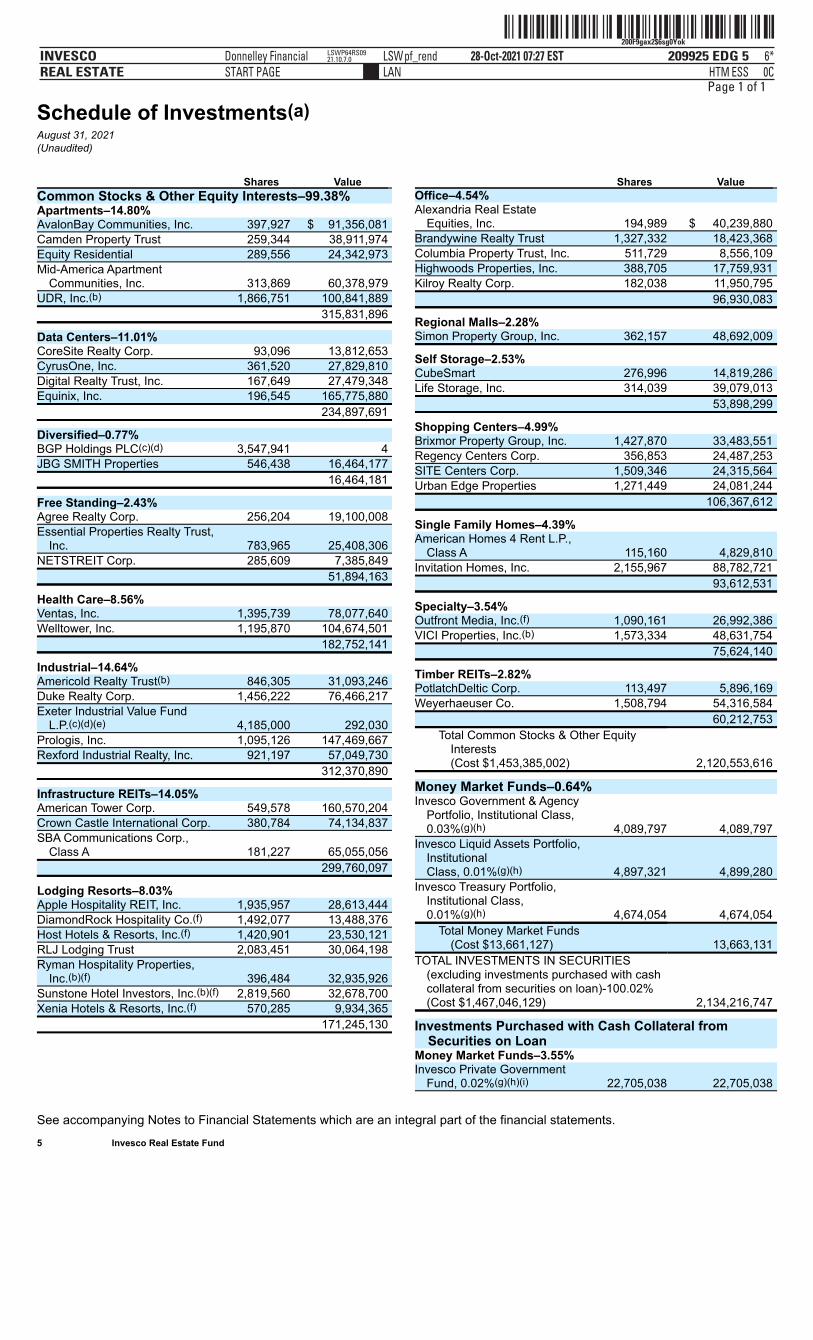
ˆ200F9gax2$6sg0YokŠ200F9gax2$6sg0Yok
209925 EDG 5INVESCOREAL ESTATE
28-Oct-2021 07:27 ESTHTMLAN
Donnelley Financial LSWpf_rendSTART PAGE
6*ESS 0C
LSWP64RS0921.10.7.0
Page 1 of 1
Schedule of Investments(a)August 31, 2021(Unaudited)
See accompanying Notes to Financial Statements which are an integral part of the financial statements. 5 Invesco Real Estate Fund
Shares Value Common Stocks & Other Equity Interests–99.38% Apartments–14.80% AvalonBay Communities, Inc. 397,927 $ 91,356,081 Camden Property Trust 259,344 38,911,974 Equity Residential 289,556 24,342,973 Mid-America Apartment
Communities, Inc. 313,869 60,378,979 UDR, Inc.(b) 1,866,751 100,841,889 315,831,896
Data Centers–11.01% CoreSite Realty Corp. 93,096 13,812,653 CyrusOne, Inc. 361,520 27,829,810 Digital Realty Trust, Inc. 167,649 27,479,348 Equinix, Inc. 196,545 165,775,880 234,897,691
Diversified–0.77% BGP Holdings PLC(c)(d) 3,547,941 4 JBG SMITH Properties 546,438 16,464,177 16,464,181
Free Standing–2.43% Agree Realty Corp. 256,204 19,100,008 Essential Properties Realty Trust,
Inc. 783,965 25,408,306 NETSTREIT Corp. 285,609 7,385,849 51,894,163
Health Care–8.56% Ventas, Inc. 1,395,739 78,077,640 Welltower, Inc. 1,195,870 104,674,501 182,752,141
Industrial–14.64% Americold Realty Trust(b) 846,305 31,093,246 Duke Realty Corp. 1,456,222 76,466,217 Exeter Industrial Value Fund
L.P.(c)(d)(e) 4,185,000 292,030 Prologis, Inc. 1,095,126 147,469,667 Rexford Industrial Realty, Inc. 921,197 57,049,730 312,370,890
Infrastructure REITs–14.05% American Tower Corp. 549,578 160,570,204 Crown Castle International Corp. 380,784 74,134,837 SBA Communications Corp.,
Class A 181,227 65,055,056 299,760,097
Lodging Resorts–8.03% Apple Hospitality REIT, Inc. 1,935,957 28,613,444 DiamondRock Hospitality Co.(f) 1,492,077 13,488,376 Host Hotels & Resorts, Inc.(f) 1,420,901 23,530,121 RLJ Lodging Trust 2,083,451 30,064,198 Ryman Hospitality Properties,
Inc.(b)(f) 396,484 32,935,926 Sunstone Hotel Investors, Inc.(b)(f) 2,819,560 32,678,700 Xenia Hotels & Resorts, Inc.(f) 570,285 9,934,365 171,245,130
Shares Value Office–4.54% Alexandria Real Estate
Equities, Inc. 194,989 $ 40,239,880 Brandywine Realty Trust 1,327,332 18,423,368 Columbia Property Trust, Inc. 511,729 8,556,109 Highwoods Properties, Inc. 388,705 17,759,931 Kilroy Realty Corp. 182,038 11,950,795 96,930,083
Regional Malls–2.28% Simon Property Group, Inc. 362,157 48,692,009
Self Storage–2.53% CubeSmart 276,996 14,819,286 Life Storage, Inc. 314,039 39,079,013 53,898,299
Shopping Centers–4.99% Brixmor Property Group, Inc. 1,427,870 33,483,551 Regency Centers Corp. 356,853 24,487,253 SITE Centers Corp. 1,509,346 24,315,564 Urban Edge Properties 1,271,449 24,081,244 106,367,612
Single Family Homes–4.39% American Homes 4 Rent L.P.,
Class A 115,160 4,829,810 Invitation Homes, Inc. 2,155,967 88,782,721 93,612,531
Specialty–3.54% Outfront Media, Inc.(f) 1,090,161 26,992,386 VICI Properties, Inc.(b) 1,573,334 48,631,754 75,624,140
Timber REITs–2.82% PotlatchDeltic Corp. 113,497 5,896,169 Weyerhaeuser Co. 1,508,794 54,316,584 60,212,753
Total Common Stocks & Other EquityInterests(Cost $1,453,385,002)
2,120,553,616
Money Market Funds–0.64% Invesco Government & Agency
Portfolio, Institutional Class,0.03%(g)(h) 4,089,797 4,089,797
Invesco Liquid Assets Portfolio,InstitutionalClass, 0.01%(g)(h) 4,897,321 4,899,280
Invesco Treasury Portfolio,Institutional Class,0.01%(g)(h) 4,674,054 4,674,054
Total Money Market Funds(Cost $13,661,127)
13,663,131
TOTAL INVESTMENTS IN SECURITIES(excluding investments purchased with cashcollateral from securities on loan)-100.02%(Cost $1,467,046,129)
2,134,216,747
Investments Purchased with Cash Collateral fromSecurities on Loan
Money Market Funds–3.55% Invesco Private Government
Fund, 0.02%(g)(h)(i) 22,705,038 22,705,038
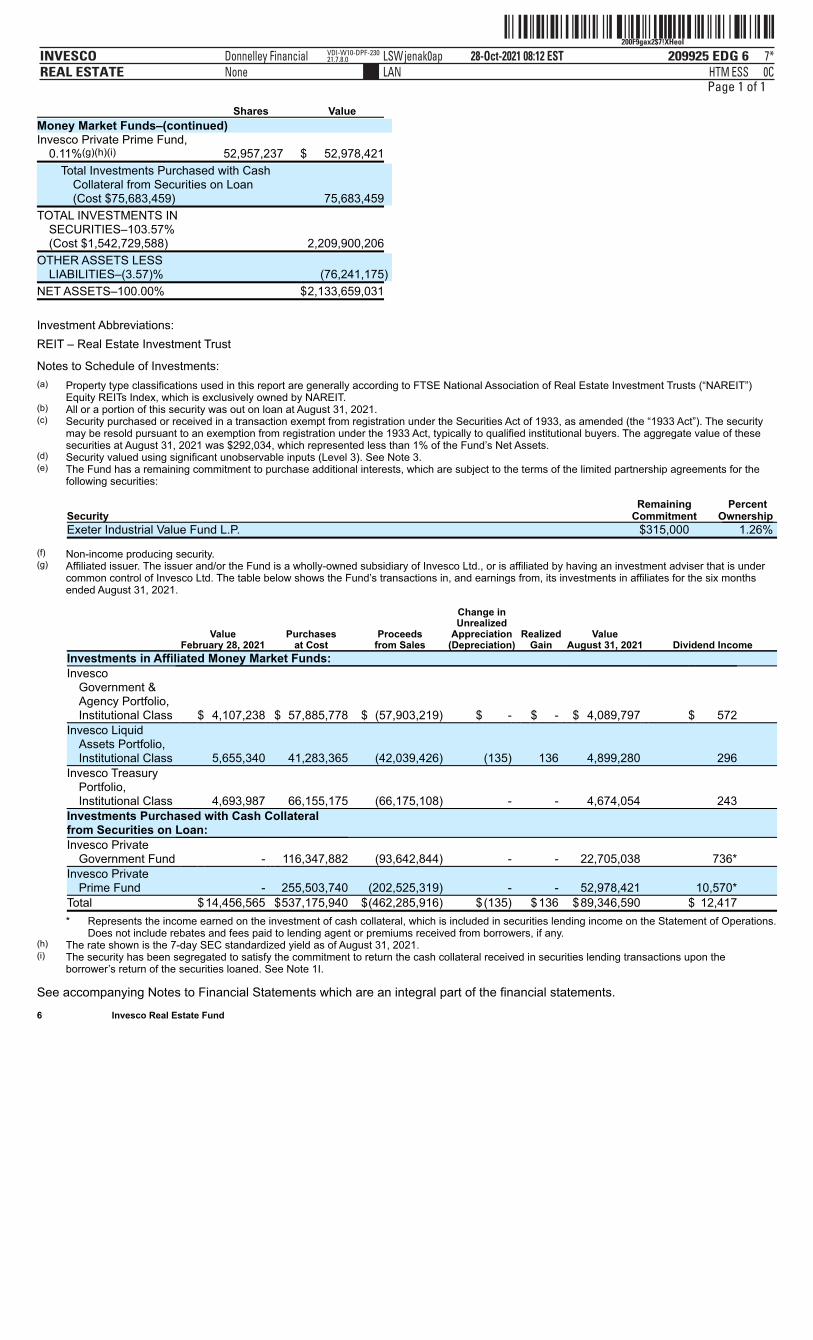
ˆ200F9gax2$7!XHeoIŠ200F9gax2$7!XHeoI
209925 EDG 6INVESCOREAL ESTATE
28-Oct-2021 08:12 ESTHTMLAN
Donnelley Financial LSWjenak0apNone
7*ESS 0C
VDI-W10-DPF-23021.7.8.0
Page 1 of 1
Investment Abbreviations:REIT – Real Estate Investment Trust
Notes to Schedule of Investments:
(a) Property type classifications used in this report are generally according to FTSE National Association of Real Estate Investment Trusts (“NAREIT”)Equity REITs Index, which is exclusively owned by NAREIT.
(b) All or a portion of this security was out on loan at August 31, 2021.(c) Security purchased or received in a transaction exempt from registration under the Securities Act of 1933, as amended (the “1933 Act”). The security
may be resold pursuant to an exemption from registration under the 1933 Act, typically to qualified institutional buyers. The aggregate value of thesesecurities at August 31, 2021 was $292,034, which represented less than 1% of the Fund’s Net Assets.
(d) Security valued using significant unobservable inputs (Level 3). See Note 3.(e) The Fund has a remaining commitment to purchase additional interests, which are subject to the terms of the limited partnership agreements for the
following securities:
Security Remaining
Commitment Percent
Ownership Exeter Industrial Value Fund L.P. $315,000 1.26%
(f) Non-income producing security.(g) Affiliated issuer. The issuer and/or the Fund is a wholly-owned subsidiary of Invesco Ltd., or is affiliated by having an investment adviser that is under
common control of Invesco Ltd. The table below shows the Fund’s transactions in, and earnings from, its investments in affiliates for the six monthsended August 31, 2021.
Value
February 28, 2021 Purchases
at Cost Proceeds
from Sales
Change inUnrealized
Appreciation(Depreciation)
RealizedGain
ValueAugust 31, 2021 Dividend Income
Investments in Affiliated Money Market Funds: Invesco
Government &Agency Portfolio,Institutional Class $ 4,107,238 $ 57,885,778 $ (57,903,219) $ - $ - $ 4,089,797 $ 572
Invesco LiquidAssets Portfolio,Institutional Class 5,655,340 41,283,365 (42,039,426) (135) 136 4,899,280 296
Invesco TreasuryPortfolio,Institutional Class 4,693,987 66,155,175 (66,175,108) - - 4,674,054 243
Investments Purchased with Cash Collateralfrom Securities on Loan:
Invesco PrivateGovernment Fund - 116,347,882 (93,642,844) - - 22,705,038 736*
Invesco PrivatePrime Fund - 255,503,740 (202,525,319) - - 52,978,421 10,570*
Total $14,456,565 $537,175,940 $(462,285,916) $(135) $136 $89,346,590 $ 12,417
* Represents the income earned on the investment of cash collateral, which is included in securities lending income on the Statement of Operations.Does not include rebates and fees paid to lending agent or premiums received from borrowers, if any.
(h) The rate shown is the 7-day SEC standardized yield as of August 31, 2021.(i) The security has been segregated to satisfy the commitment to return the cash collateral received in securities lending transactions upon the
borrower’s return of the securities loaned. See Note 1I.
See accompanying Notes to Financial Statements which are an integral part of the financial statements. 6 Invesco Real Estate Fund
Shares Value
Money Market Funds–(continued) Invesco Private Prime Fund,
0.11%(g)(h)(i) 52,957,237 $ 52,978,421
Total Investments Purchased with CashCollateral from Securities on Loan(Cost $75,683,459)
75,683,459
TOTAL INVESTMENTS INSECURITIES–103.57%(Cost $1,542,729,588)
2,209,900,206
OTHER ASSETS LESSLIABILITIES–(3.57)% (76,241,175)
NET ASSETS–100.00% $2,133,659,031

ˆ200F9gax2$6syNPooŠ200F9gax2$6syNPoo
209925 EDG 7INVESCOREAL ESTATE
28-Oct-2021 07:27 ESTHTMLAN
Donnelley Financial LSWpf_rendSTART PAGE
7*ESS 0C
LSWP64RS0921.10.7.0
Page 1 of 1
Portfolio CompositionBy property type, based on total net assetsas of August 31, 2021 Apartments 14.80% Industrial 14.64 Infrastructure REITs 14.05 Data Centers 11.01 Health Care 8.56 Lodging Resorts 8.03 Shopping Centers 4.99 Office 4.54 Single Family Homes 4.39 Specialty 3.54 Timber REITs 2.82 Self Storage 2.53 Free Standing 2.43 Regional Malls 2.28 Diversified 0.77 Money Market Funds Plus Other Assets Less Liabilities 0.62
See accompanying Notes to Financial Statements which are an integral part of the financial statements. 7 Invesco Real Estate Fund
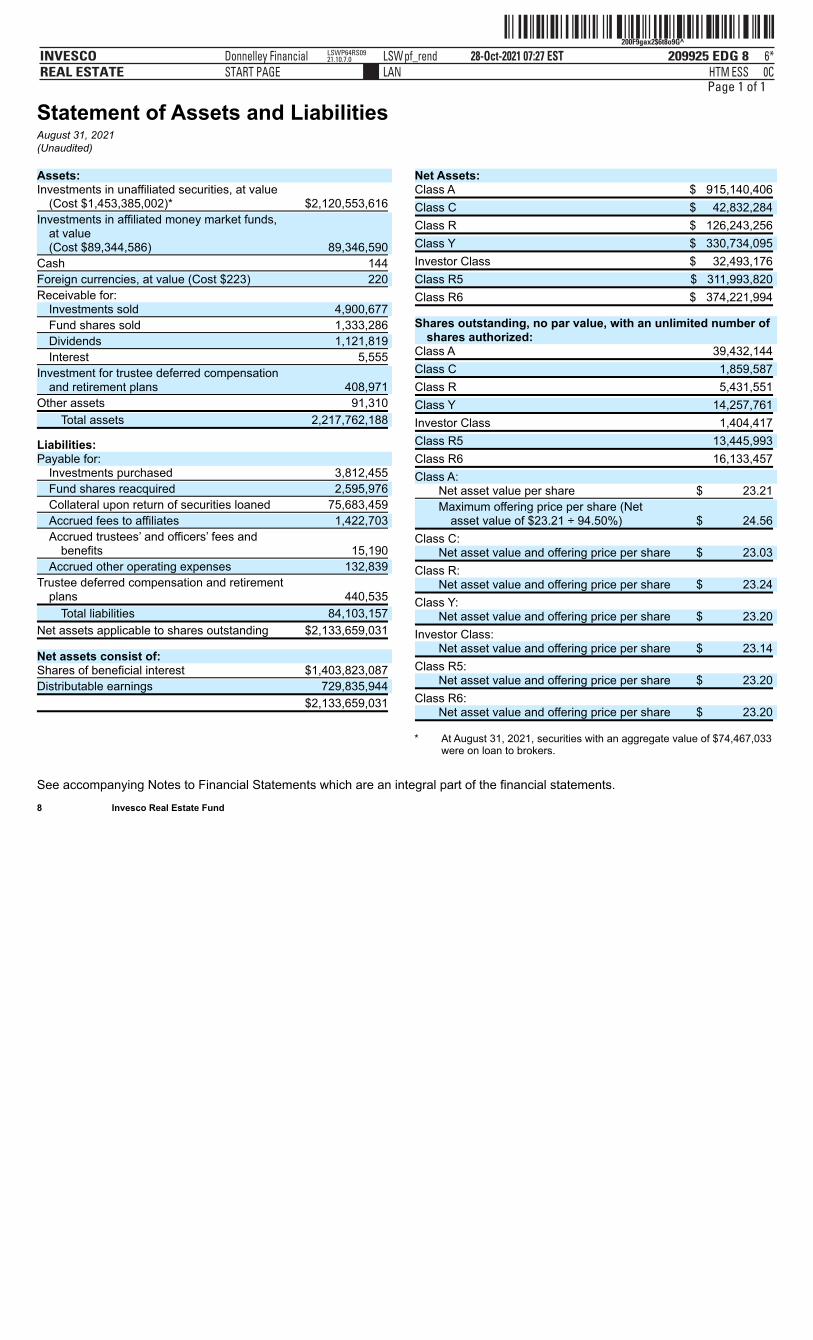
ˆ200F9gax2$6t8o9G^Š200F9gax2$6t8o9G^
209925 EDG 8INVESCOREAL ESTATE
28-Oct-2021 07:27 ESTHTMLAN
Donnelley Financial LSWpf_rendSTART PAGE
6*ESS 0C
LSWP64RS0921.10.7.0
Page 1 of 1
Statement of Assets and LiabilitiesAugust 31, 2021(Unaudited)
See accompanying Notes to Financial Statements which are an integral part of the financial statements. 8 Invesco Real Estate Fund
Assets: Investments in unaffiliated securities, at value
(Cost $1,453,385,002)* $2,120,553,616
Investments in affiliated money market funds,at value(Cost $89,344,586) 89,346,590
Cash 144
Foreign currencies, at value (Cost $223) 220
Receivable for: Investments sold 4,900,677
Fund shares sold 1,333,286
Dividends 1,121,819
Interest 5,555
Investment for trustee deferred compensationand retirement plans 408,971
Other assets 91,310
Total assets 2,217,762,188
Liabilities: Payable for:
Investments purchased 3,812,455
Fund shares reacquired 2,595,976
Collateral upon return of securities loaned 75,683,459
Accrued fees to affiliates 1,422,703
Accrued trustees’ and officers’ fees andbenefits 15,190
Accrued other operating expenses 132,839
Trustee deferred compensation and retirementplans 440,535
Total liabilities 84,103,157
Net assets applicable to shares outstanding $2,133,659,031
Net assets consist of: Shares of beneficial interest $1,403,823,087
Distributable earnings 729,835,944
$2,133,659,031
Net Assets: Class A $ 915,140,406
Class C $ 42,832,284
Class R $ 126,243,256
Class Y $ 330,734,095
Investor Class $ 32,493,176
Class R5 $ 311,993,820
Class R6 $ 374,221,994
Shares outstanding, no par value, with an unlimited number ofshares authorized:
Class A 39,432,144
Class C 1,859,587
Class R 5,431,551
Class Y 14,257,761
Investor Class 1,404,417
Class R5 13,445,993
Class R6 16,133,457
Class A: Net asset value per share $ 23.21
Maximum offering price per share (Netasset value of $23.21 ÷ 94.50%) $ 24.56
Class C: Net asset value and offering price per share $ 23.03
Class R: Net asset value and offering price per share $ 23.24
Class Y: Net asset value and offering price per share $ 23.20
Investor Class: Net asset value and offering price per share $ 23.14
Class R5: Net asset value and offering price per share $ 23.20
Class R6: Net asset value and offering price per share $ 23.20
* At August 31, 2021, securities with an aggregate value of $74,467,033were on loan to brokers.
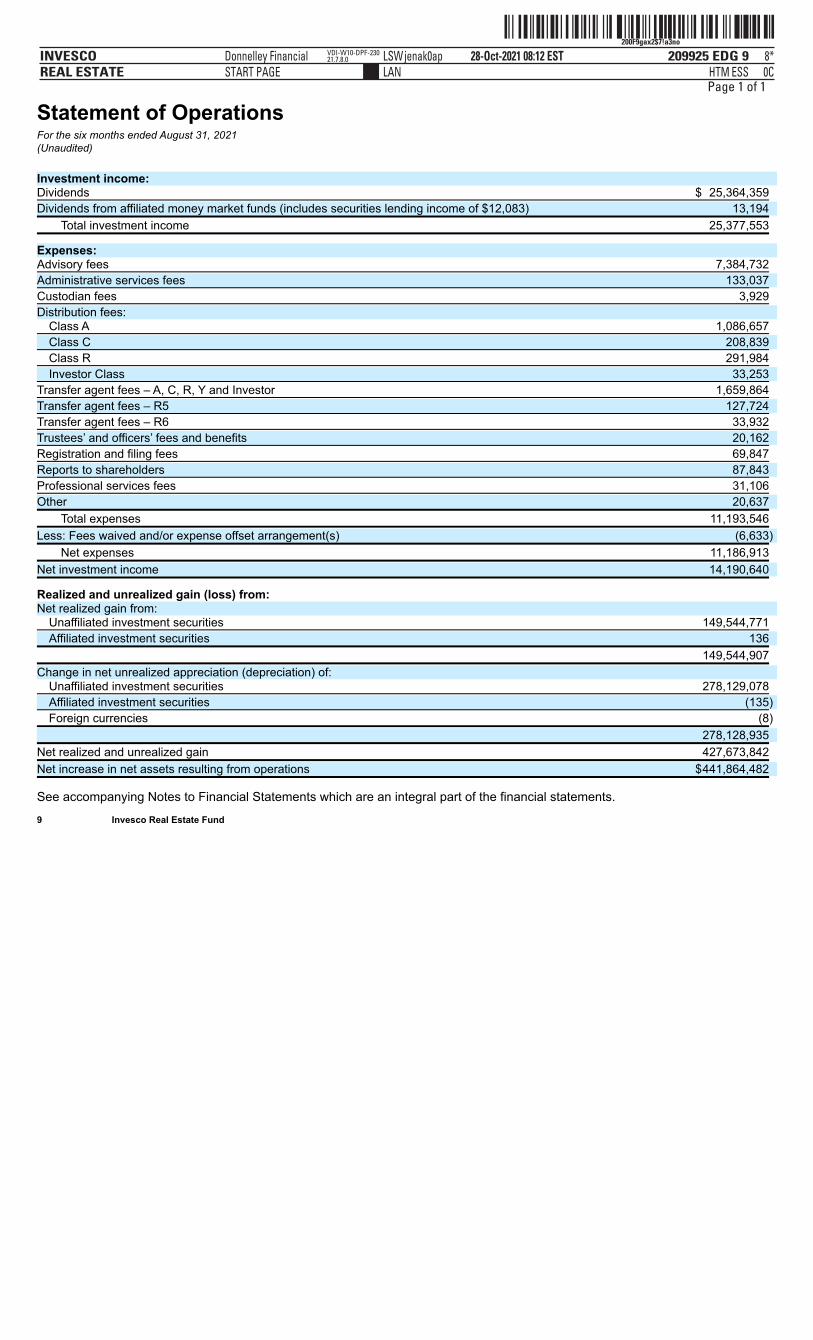
ˆ200F9gax2$7!a3no†Š200F9gax2$7!a3no
209925 EDG 9INVESCOREAL ESTATE
28-Oct-2021 08:12 ESTHTMLAN
Donnelley Financial LSWjenak0apSTART PAGE
8*ESS 0C
VDI-W10-DPF-23021.7.8.0
Page 1 of 1
Statement of OperationsFor the six months ended August 31, 2021(Unaudited) Investment income: Dividends $ 25,364,359
Dividends from affiliated money market funds (includes securities lending income of $12,083) 13,194
Total investment income 25,377,553
Expenses: Advisory fees 7,384,732
Administrative services fees 133,037
Custodian fees 3,929
Distribution fees: Class A 1,086,657
Class C 208,839
Class R 291,984
Investor Class 33,253
Transfer agent fees – A, C, R, Y and Investor 1,659,864
Transfer agent fees – R5 127,724
Transfer agent fees – R6 33,932
Trustees’ and officers’ fees and benefits 20,162
Registration and filing fees 69,847
Reports to shareholders 87,843
Professional services fees 31,106
Other 20,637
Total expenses 11,193,546
Less: Fees waived and/or expense offset arrangement(s) (6,633)
Net expenses 11,186,913
Net investment income 14,190,640
Realized and unrealized gain (loss) from: Net realized gain from:
Unaffiliated investment securities 149,544,771
Affiliated investment securities 136
149,544,907
Change in net unrealized appreciation (depreciation) of: Unaffiliated investment securities 278,129,078
Affiliated investment securities (135)
Foreign currencies (8)
278,128,935
Net realized and unrealized gain 427,673,842
Net increase in net assets resulting from operations $441,864,482
See accompanying Notes to Financial Statements which are an integral part of the financial statements. 9 Invesco Real Estate Fund
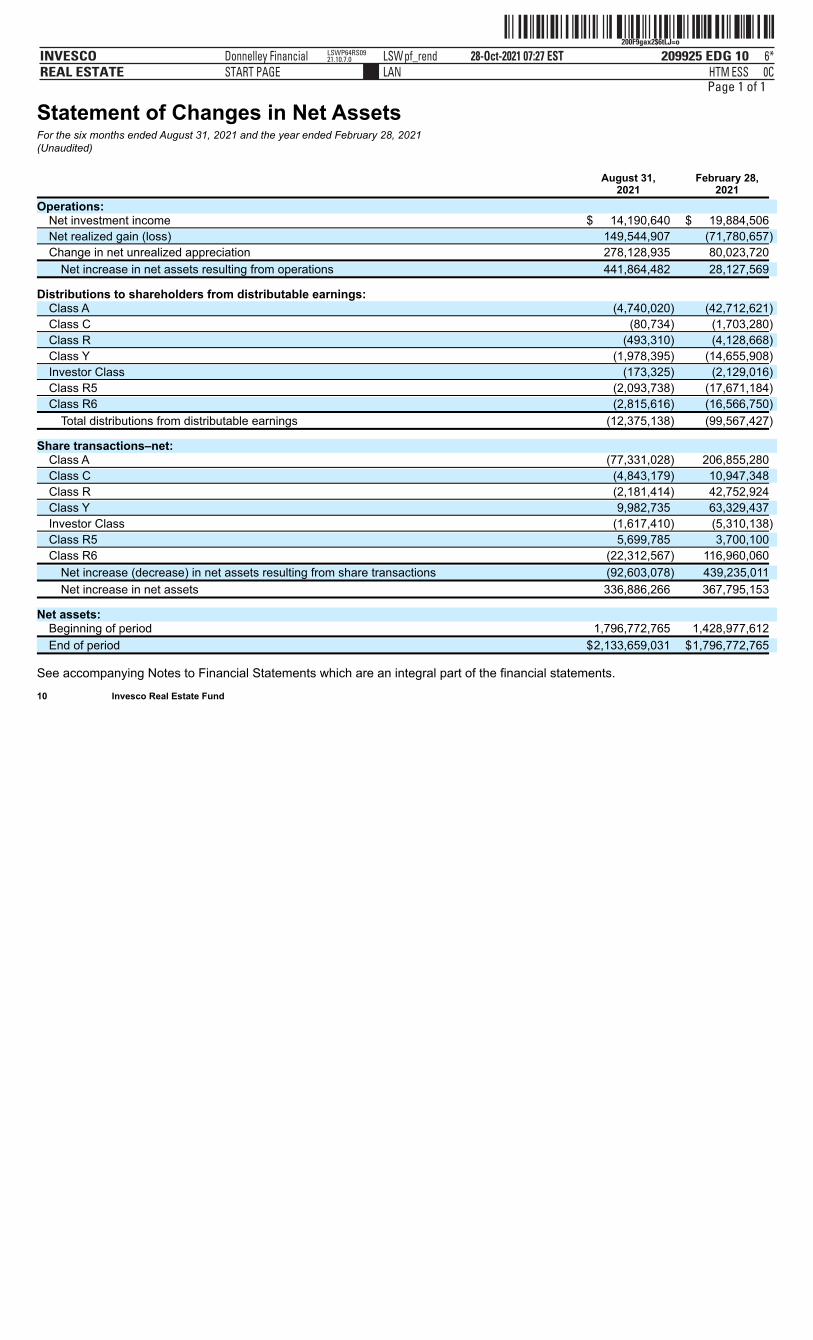
ˆ200F9gax2$6tLJ=o‹Š200F9gax2$6tLJ=o
209925 EDG 10INVESCOREAL ESTATE
28-Oct-2021 07:27 ESTHTMLAN
Donnelley Financial LSWpf_rendSTART PAGE
6*ESS 0C
LSWP64RS0921.10.7.0
Page 1 of 1
Statement of Changes in Net AssetsFor the six months ended August 31, 2021 and the year ended February 28, 2021(Unaudited)
August 31,
2021 February 28,
2021
Operations: Net investment income $ 14,190,640 $ 19,884,506
Net realized gain (loss) 149,544,907 (71,780,657)
Change in net unrealized appreciation 278,128,935 80,023,720
Net increase in net assets resulting from operations 441,864,482 28,127,569
Distributions to shareholders from distributable earnings: Class A (4,740,020) (42,712,621)
Class C (80,734) (1,703,280)
Class R (493,310) (4,128,668)
Class Y (1,978,395) (14,655,908)
Investor Class (173,325) (2,129,016)
Class R5 (2,093,738) (17,671,184)
Class R6 (2,815,616) (16,566,750)
Total distributions from distributable earnings (12,375,138) (99,567,427)
Share transactions–net: Class A (77,331,028) 206,855,280
Class C (4,843,179) 10,947,348
Class R (2,181,414) 42,752,924
Class Y 9,982,735 63,329,437
Investor Class (1,617,410) (5,310,138)
Class R5 5,699,785 3,700,100
Class R6 (22,312,567) 116,960,060
Net increase (decrease) in net assets resulting from share transactions (92,603,078) 439,235,011
Net increase in net assets 336,886,266 367,795,153
Net assets: Beginning of period 1,796,772,765 1,428,977,612
End of period $2,133,659,031 $1,796,772,765
See accompanying Notes to Financial Statements which are an integral part of the financial statements. 10 Invesco Real Estate Fund
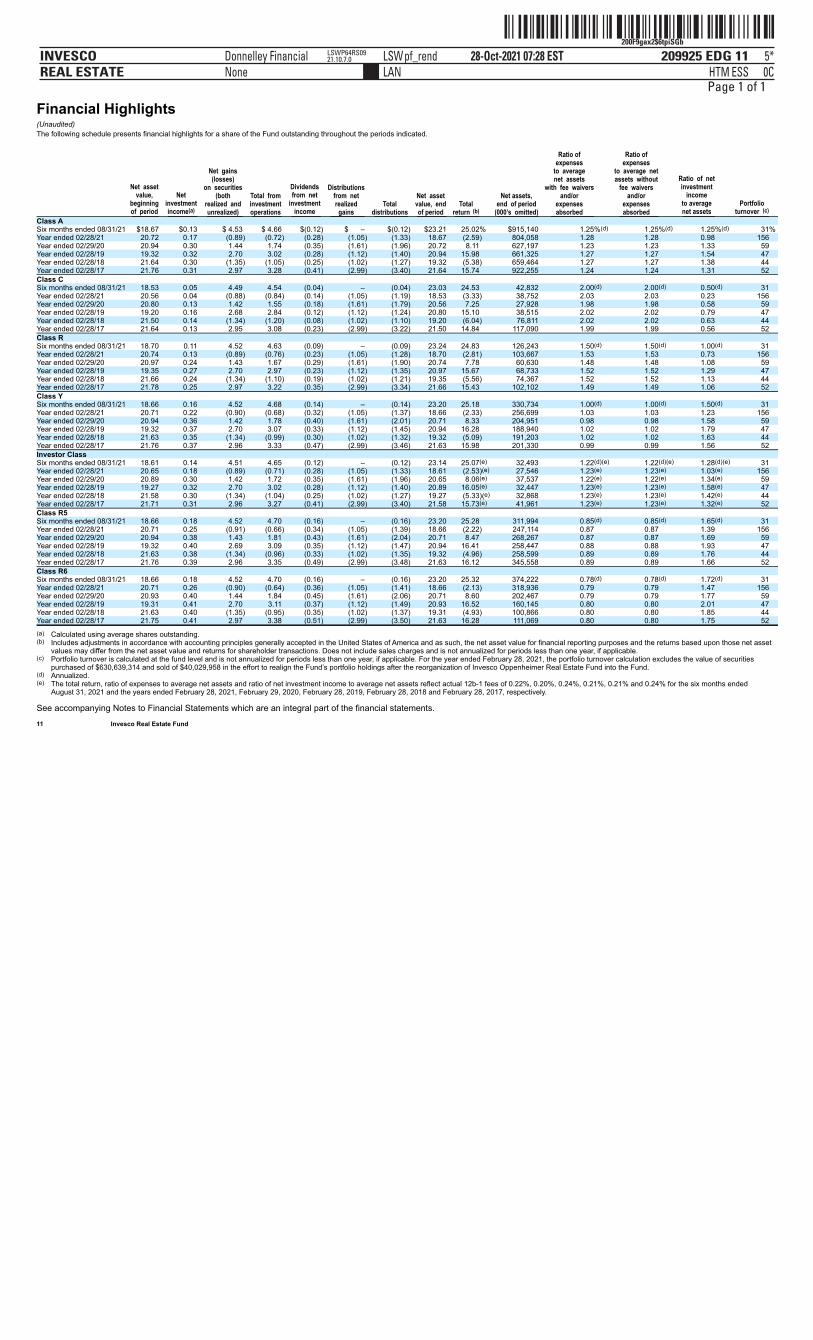
ˆ200F9gax2$6tpiSGbŠ200F9gax2$6tpiSGb
209925 EDG 11INVESCOREAL ESTATE
28-Oct-2021 07:28 ESTHTMLAN
Donnelley Financial LSWpf_rendNone
5*ESS 0C
LSWP64RS0921.10.7.0
Page 1 of 1
Financial Highlights(Unaudited)The following schedule presents financial highlights for a share of the Fund outstanding throughout the periods indicated.
Net�assetvalue,
beginningof�period
Netinvestmentincome(a)
Net�gains(losses)
on�securities(both
realized�andunrealized)
Total�frominvestmentoperations
Dividendsfrom�net
investmentincome
Distributionsfrom�netrealizedgains
Totaldistributions
Net�assetvalue,�endof period
Totalreturn�(b)
Net assets,end�of period
(000’s�omitted)
Ratio ofexpenses
to�averagenet�assets
with�fee�waiversand/or
expensesabsorbed
Ratio ofexpenses
to�average�netassets�without
fee�waiversand/or
expensesabsorbed
Ratio�of�netinvestment
incometo averagenet assets
Portfolioturnover�(c)
Class A Six months ended 08/31/21 $18.67 $0.13 $ 4.53 $ 4.66 $(0.12) $ – $(0.12) $23.21 25.02% $915,140 1.25%(d) 1.25%(d) 1.25%(d) 31% Year ended 02/28/21 20.72 0.17 (0.89) (0.72) (0.28) (1.05) (1.33) 18.67 (2.59) 804,058 1.28 1.28 0.98 156 Year ended 02/29/20 20.94 0.30 1.44 1.74 (0.35) (1.61) (1.96) 20.72 8.11 627,197 1.23 1.23 1.33 59 Year ended 02/28/19 19.32 0.32 2.70 3.02 (0.28) (1.12) (1.40) 20.94 15.98 661,325 1.27 1.27 1.54 47 Year ended 02/28/18 21.64 0.30 (1.35) (1.05) (0.25) (1.02) (1.27) 19.32 (5.38) 659,464 1.27 1.27 1.38 44 Year ended 02/28/17 21.76 0.31 2.97 3.28 (0.41) (2.99) (3.40) 21.64 15.74 922,255 1.24 1.24 1.31 52 Class C Six months ended 08/31/21 18.53 0.05 4.49 4.54 (0.04) – (0.04) 23.03 24.53 42,832 2.00(d) 2.00(d) 0.50(d) 31 Year ended 02/28/21 20.56 0.04 (0.88) (0.84) (0.14) (1.05) (1.19) 18.53 (3.33) 38,752 2.03 2.03 0.23 156 Year ended 02/29/20 20.80 0.13 1.42 1.55 (0.18) (1.61) (1.79) 20.56 7.25 27,928 1.98 1.98 0.58 59 Year ended 02/28/19 19.20 0.16 2.68 2.84 (0.12) (1.12) (1.24) 20.80 15.10 38,515 2.02 2.02 0.79 47 Year ended 02/28/18 21.50 0.14 (1.34) (1.20) (0.08) (1.02) (1.10) 19.20 (6.04) 76,811 2.02 2.02 0.63 44 Year ended 02/28/17 21.64 0.13 2.95 3.08 (0.23) (2.99) (3.22) 21.50 14.84 117,090 1.99 1.99 0.56 52 Class R Six months ended 08/31/21 18.70 0.11 4.52 4.63 (0.09) – (0.09) 23.24 24.83 126,243 1.50(d) 1.50(d) 1.00(d) 31 Year ended 02/28/21 20.74 0.13 (0.89) (0.76) (0.23) (1.05) (1.28) 18.70 (2.81) 103,667 1.53 1.53 0.73 156 Year ended 02/29/20 20.97 0.24 1.43 1.67 (0.29) (1.61) (1.90) 20.74 7.78 60,630 1.48 1.48 1.08 59 Year ended 02/28/19 19.35 0.27 2.70 2.97 (0.23) (1.12) (1.35) 20.97 15.67 68,733 1.52 1.52 1.29 47 Year ended 02/28/18 21.66 0.24 (1.34) (1.10) (0.19) (1.02) (1.21) 19.35 (5.56) 74,367 1.52 1.52 1.13 44 Year ended 02/28/17 21.78 0.25 2.97 3.22 (0.35) (2.99) (3.34) 21.66 15.43 102,102 1.49 1.49 1.06 52 Class Y Six months ended 08/31/21 18.66 0.16 4.52 4.68 (0.14) – (0.14) 23.20 25.18 330,734 1.00(d) 1.00(d) 1.50(d) 31 Year ended 02/28/21 20.71 0.22 (0.90) (0.68) (0.32) (1.05) (1.37) 18.66 (2.33) 256,699 1.03 1.03 1.23 156 Year ended 02/29/20 20.94 0.36 1.42 1.78 (0.40) (1.61) (2.01) 20.71 8.33 204,951 0.98 0.98 1.58 59 Year ended 02/28/19 19.32 0.37 2.70 3.07 (0.33) (1.12) (1.45) 20.94 16.28 188,940 1.02 1.02 1.79 47 Year ended 02/28/18 21.63 0.35 (1.34) (0.99) (0.30) (1.02) (1.32) 19.32 (5.09) 191,203 1.02 1.02 1.63 44 Year ended 02/28/17 21.76 0.37 2.96 3.33 (0.47) (2.99) (3.46) 21.63 15.98 201,330 0.99 0.99 1.56 52 Investor Class Six months ended 08/31/21 18.61 0.14 4.51 4.65 (0.12) – (0.12) 23.14 25.07(e) 32,493 1.22(d)(e) 1.22(d)(e) 1.28(d)(e) 31 Year ended 02/28/21 20.65 0.18 (0.89) (0.71) (0.28) (1.05) (1.33) 18.61 (2.53)(e) 27,546 1.23(e) 1.23(e) 1.03(e) 156 Year ended 02/29/20 20.89 0.30 1.42 1.72 (0.35) (1.61) (1.96) 20.65 8.06(e) 37,537 1.22(e) 1.22(e) 1.34(e) 59 Year ended 02/28/19 19.27 0.32 2.70 3.02 (0.28) (1.12) (1.40) 20.89 16.05(e) 32,447 1.23(e) 1.23(e) 1.58(e) 47 Year ended 02/28/18 21.58 0.30 (1.34) (1.04) (0.25) (1.02) (1.27) 19.27 (5.33)(e) 32,868 1.23(e) 1.23(e) 1.42(e) 44 Year ended 02/28/17 21.71 0.31 2.96 3.27 (0.41) (2.99) (3.40) 21.58 15.73(e) 41,961 1.23(e) 1.23(e) 1.32(e) 52 Class R5 Six months ended 08/31/21 18.66 0.18 4.52 4.70 (0.16) – (0.16) 23.20 25.28 311,994 0.85(d) 0.85(d) 1.65(d) 31 Year ended 02/28/21 20.71 0.25 (0.91) (0.66) (0.34) (1.05) (1.39) 18.66 (2.22) 247,114 0.87 0.87 1.39 156 Year ended 02/29/20 20.94 0.38 1.43 1.81 (0.43) (1.61) (2.04) 20.71 8.47 268,267 0.87 0.87 1.69 59 Year ended 02/28/19 19.32 0.40 2.69 3.09 (0.35) (1.12) (1.47) 20.94 16.41 258,447 0.88 0.88 1.93 47 Year ended 02/28/18 21.63 0.38 (1.34) (0.96) (0.33) (1.02) (1.35) 19.32 (4.96) 258,599 0.89 0.89 1.76 44 Year ended 02/28/17 21.76 0.39 2.96 3.35 (0.49) (2.99) (3.48) 21.63 16.12 345,558 0.89 0.89 1.66 52 Class R6 Six months ended 08/31/21 18.66 0.18 4.52 4.70 (0.16) – (0.16) 23.20 25.32 374,222 0.78(d) 0.78(d) 1.72(d) 31 Year ended 02/28/21 20.71 0.26 (0.90) (0.64) (0.36) (1.05) (1.41) 18.66 (2.13) 318,936 0.79 0.79 1.47 156 Year ended 02/29/20 20.93 0.40 1.44 1.84 (0.45) (1.61) (2.06) 20.71 8.60 202,467 0.79 0.79 1.77 59 Year ended 02/28/19 19.31 0.41 2.70 3.11 (0.37) (1.12) (1.49) 20.93 16.52 160,145 0.80 0.80 2.01 47 Year ended 02/28/18 21.63 0.40 (1.35) (0.95) (0.35) (1.02) (1.37) 19.31 (4.93) 100,866 0.80 0.80 1.85 44 Year ended 02/28/17 21.75 0.41 2.97 3.38 (0.51) (2.99) (3.50) 21.63 16.28 111,069 0.80 0.80 1.75 52
(a) Calculated using average shares outstanding.(b) Includes adjustments in accordance with accounting principles generally accepted in the United States of America and as such, the net asset value for financial reporting purposes and the returns based upon those net asset
values may differ from the net asset value and returns for shareholder transactions. Does not include sales charges and is not annualized for periods less than one year, if applicable.(c) Portfolio turnover is calculated at the fund level and is not annualized for periods less than one year, if applicable. For the year ended February 28, 2021, the portfolio turnover calculation excludes the value of securities
purchased of $630,639,314 and sold of $40,029,958 in the effort to realign the Fund’s portfolio holdings after the reorganization of Invesco Oppenheimer Real Estate Fund into the Fund.(d) Annualized.(e) The total return, ratio of expenses to average net assets and ratio of net investment income to average net assets reflect actual 12b-1 fees of 0.22%, 0.20%, 0.24%, 0.21%, 0.21% and 0.24% for the six months ended
August 31, 2021 and the years ended February 28, 2021, February 29, 2020, February 28, 2019, February 28, 2018 and February 28, 2017, respectively.
See accompanying Notes to Financial Statements which are an integral part of the financial statements. 11 Invesco Real Estate Fund
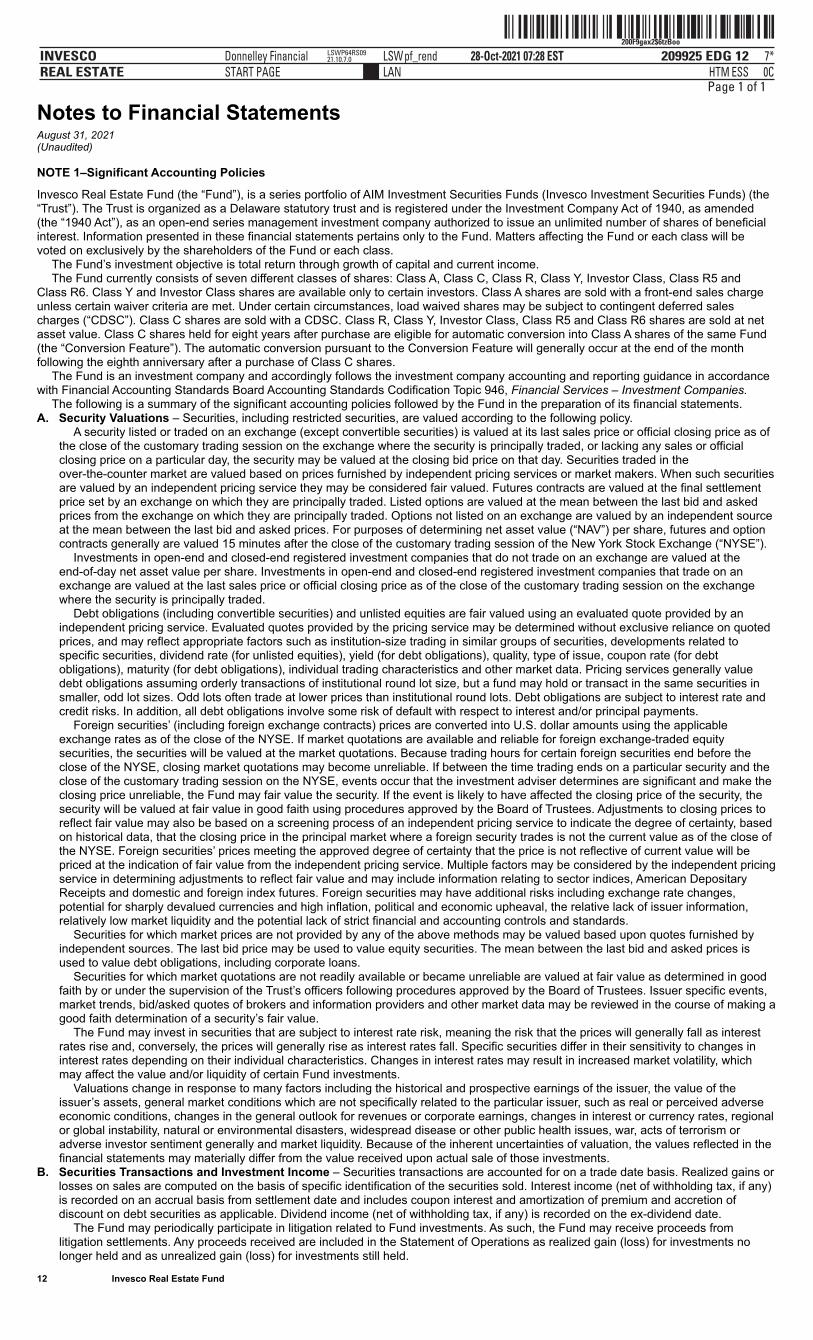
ˆ200F9gax2$6tzBoo‹Š200F9gax2$6tzBoo
209925 EDG 12INVESCOREAL ESTATE
28-Oct-2021 07:28 ESTHTMLAN
Donnelley Financial LSWpf_rendSTART PAGE
7*ESS 0C
LSWP64RS0921.10.7.0
Page 1 of 1
Notes to Financial StatementsAugust 31, 2021(Unaudited)
NOTE 1–Significant Accounting Policies
Invesco Real Estate Fund (the “Fund”), is a series portfolio of AIM Investment Securities Funds (Invesco Investment Securities Funds) (the“Trust”). The Trust is organized as a Delaware statutory trust and is registered under the Investment Company Act of 1940, as amended(the “1940 Act”), as an open-end series management investment company authorized to issue an unlimited number of shares of beneficialinterest. Information presented in these financial statements pertains only to the Fund. Matters affecting the Fund or each class will bevoted on exclusively by the shareholders of the Fund or each class.
The Fund’s investment objective is total return through growth of capital and current income.The Fund currently consists of seven different classes of shares: Class A, Class C, Class R, Class Y, Investor Class, Class R5 and
Class R6. Class Y and Investor Class shares are available only to certain investors. Class A shares are sold with a front-end sales chargeunless certain waiver criteria are met. Under certain circumstances, load waived shares may be subject to contingent deferred salescharges (“CDSC”). Class C shares are sold with a CDSC. Class R, Class Y, Investor Class, Class R5 and Class R6 shares are sold at netasset value. Class C shares held for eight years after purchase are eligible for automatic conversion into Class A shares of the same Fund(the “Conversion Feature”). The automatic conversion pursuant to the Conversion Feature will generally occur at the end of the monthfollowing the eighth anniversary after a purchase of Class C shares.
The Fund is an investment company and accordingly follows the investment company accounting and reporting guidance in accordancewith Financial Accounting Standards Board Accounting Standards Codification Topic 946, Financial Services – Investment Companies.
The following is a summary of the significant accounting policies followed by the Fund in the preparation of its financial statements.A. Security Valuations – Securities, including restricted securities, are valued according to the following policy.
A security listed or traded on an exchange (except convertible securities) is valued at its last sales price or official closing price as ofthe close of the customary trading session on the exchange where the security is principally traded, or lacking any sales or officialclosing price on a particular day, the security may be valued at the closing bid price on that day. Securities traded in theover-the-counter market are valued based on prices furnished by independent pricing services or market makers. When such securitiesare valued by an independent pricing service they may be considered fair valued. Futures contracts are valued at the final settlementprice set by an exchange on which they are principally traded. Listed options are valued at the mean between the last bid and askedprices from the exchange on which they are principally traded. Options not listed on an exchange are valued by an independent sourceat the mean between the last bid and asked prices. For purposes of determining net asset value (“NAV”) per share, futures and optioncontracts generally are valued 15 minutes after the close of the customary trading session of the New York Stock Exchange (“NYSE”).
Investments in open-end and closed-end registered investment companies that do not trade on an exchange are valued at theend-of-day net asset value per share. Investments in open-end and closed-end registered investment companies that trade on anexchange are valued at the last sales price or official closing price as of the close of the customary trading session on the exchangewhere the security is principally traded.
Debt obligations (including convertible securities) and unlisted equities are fair valued using an evaluated quote provided by anindependent pricing service. Evaluated quotes provided by the pricing service may be determined without exclusive reliance on quotedprices, and may reflect appropriate factors such as institution-size trading in similar groups of securities, developments related tospecific securities, dividend rate (for unlisted equities), yield (for debt obligations), quality, type of issue, coupon rate (for debtobligations), maturity (for debt obligations), individual trading characteristics and other market data. Pricing services generally valuedebt obligations assuming orderly transactions of institutional round lot size, but a fund may hold or transact in the same securities insmaller, odd lot sizes. Odd lots often trade at lower prices than institutional round lots. Debt obligations are subject to interest rate andcredit risks. In addition, all debt obligations involve some risk of default with respect to interest and/or principal payments.
Foreign securities’ (including foreign exchange contracts) prices are converted into U.S. dollar amounts using the applicableexchange rates as of the close of the NYSE. If market quotations are available and reliable for foreign exchange-traded equitysecurities, the securities will be valued at the market quotations. Because trading hours for certain foreign securities end before theclose of the NYSE, closing market quotations may become unreliable. If between the time trading ends on a particular security and theclose of the customary trading session on the NYSE, events occur that the investment adviser determines are significant and make theclosing price unreliable, the Fund may fair value the security. If the event is likely to have affected the closing price of the security, thesecurity will be valued at fair value in good faith using procedures approved by the Board of Trustees. Adjustments to closing prices toreflect fair value may also be based on a screening process of an independent pricing service to indicate the degree of certainty, basedon historical data, that the closing price in the principal market where a foreign security trades is not the current value as of the close ofthe NYSE. Foreign securities’ prices meeting the approved degree of certainty that the price is not reflective of current value will bepriced at the indication of fair value from the independent pricing service. Multiple factors may be considered by the independent pricingservice in determining adjustments to reflect fair value and may include information relating to sector indices, American DepositaryReceipts and domestic and foreign index futures. Foreign securities may have additional risks including exchange rate changes,potential for sharply devalued currencies and high inflation, political and economic upheaval, the relative lack of issuer information,relatively low market liquidity and the potential lack of strict financial and accounting controls and standards.
Securities for which market prices are not provided by any of the above methods may be valued based upon quotes furnished byindependent sources. The last bid price may be used to value equity securities. The mean between the last bid and asked prices isused to value debt obligations, including corporate loans.
Securities for which market quotations are not readily available or became unreliable are valued at fair value as determined in goodfaith by or under the supervision of the Trust’s officers following procedures approved by the Board of Trustees. Issuer specific events,market trends, bid/asked quotes of brokers and information providers and other market data may be reviewed in the course of making agood faith determination of a security’s fair value.
The Fund may invest in securities that are subject to interest rate risk, meaning the risk that the prices will generally fall as interestrates rise and, conversely, the prices will generally rise as interest rates fall. Specific securities differ in their sensitivity to changes ininterest rates depending on their individual characteristics. Changes in interest rates may result in increased market volatility, whichmay affect the value and/or liquidity of certain Fund investments.
Valuations change in response to many factors including the historical and prospective earnings of the issuer, the value of theissuer’s assets, general market conditions which are not specifically related to the particular issuer, such as real or perceived adverseeconomic conditions, changes in the general outlook for revenues or corporate earnings, changes in interest or currency rates, regionalor global instability, natural or environmental disasters, widespread disease or other public health issues, war, acts of terrorism oradverse investor sentiment generally and market liquidity. Because of the inherent uncertainties of valuation, the values reflected in thefinancial statements may materially differ from the value received upon actual sale of those investments.
B. Securities Transactions and Investment Income – Securities transactions are accounted for on a trade date basis. Realized gains orlosses on sales are computed on the basis of specific identification of the securities sold. Interest income (net of withholding tax, if any)is recorded on an accrual basis from settlement date and includes coupon interest and amortization of premium and accretion ofdiscount on debt securities as applicable. Dividend income (net of withholding tax, if any) is recorded on the ex-dividend date.
The Fund may periodically participate in litigation related to Fund investments. As such, the Fund may receive proceeds fromlitigation settlements. Any proceeds received are included in the Statement of Operations as realized gain (loss) for investments nolonger held and as unrealized gain (loss) for investments still held.
12 Invesco Real Estate Fund
ˆ200F9gax2$7@06=ogŠ200F9gax2$7@06=og
209925 EDG 13INVESCOREAL ESTATE
28-Oct-2021 08:13 ESTHTMLAN
Donnelley Financial LSWjenak0apNone
6*ESS 0C
VDI-W10-DPF-23021.7.8.0
Page 1 of 2Brokerage commissions and mark ups are considered transaction costs and are recorded as an increase to the cost basis of
securities purchased and/or a reduction of proceeds on a sale of securities. Such transaction costs are included in the determination ofnet realized and unrealized gain (loss) from investment securities reported in the Statement of Operations and the Statement ofChanges in Net Assets and the net realized and unrealized gains (losses) on securities per share in the Financial Highlights.Transaction costs are included in the calculation of the Fund’s net asset value and, accordingly, they reduce the Fund’s total returns.These transaction costs are not considered operating expenses and are not reflected in net investment income reported in theStatement of Operations and the Statement of Changes in Net Assets, or the net investment income per share and the ratios ofexpenses and net investment income reported in the Financial Highlights, nor are they limited by any expense limitation arrangementsbetween the Fund and the investment adviser.
The Fund allocates income and realized and unrealized capital gains and losses to a class based on the relative net assets of eachclass.
The Fund recharacterizes distributions received from REIT investments based on information provided by the REIT into the followingcategories: ordinary income, long-term and short-term capital gains, and return of capital. If information is not available on a timelybasis from the REIT, the recharacterization will be based on available information which may include the previous year’s allocation. Ifnew or additional information becomes available from the REIT at a later date, a recharacterization will be made in the following year.The Fund records as dividend income the amount recharacterized as ordinary income and as realized gain the amount recharacterizedas capital gain in the Statement of Operations, and the amount recharacterized as return of capital as a reduction of the cost of therelated investment. These recharacterizations are reflected in the accompanying financial statements.
C. Country Determination – For the purposes of making investment selection decisions and presentation in the Schedule of Investments,the investment adviser may determine the country in which an issuer is located and/or credit risk exposure based on various factors.These factors include the laws of the country under which the issuer is organized, where the issuer maintains a principal office, thecountry in which the issuer derives 50% or more of its total revenues and the country that has the primary market for the issuer’ssecurities, as well as other criteria. Among the other criteria that may be evaluated for making this determination are the country inwhich the issuer maintains 50% or more of its assets, the type of security, financial guarantees and enhancements, the nature of thecollateral and the sponsor organization. Country of issuer and/or credit risk exposure has been determined to be the United States ofAmerica, unless otherwise noted.
D. Distributions – Distributions from net investment income, if any, are declared and paid quarterly and are recorded on the ex-dividenddate. Distributions from net realized capital gain, if any, are generally declared and paid annually and recorded on the ex-dividend date.The Fund may elect to treat a portion of the proceeds from redemptions as distributions for federal income tax purposes.
E. Federal Income Taxes – The Fund intends to comply with the requirements of Subchapter M of the Internal Revenue Code of 1986, asamended (the “Internal Revenue Code”), necessary to qualify as a regulated investment company and to distribute substantially all ofthe Fund’s taxable earnings to shareholders. As such, the Fund will not be subject to federal income taxes on otherwise taxable income(including net realized capital gain) that is distributed to shareholders. Therefore, no provision for federal income taxes is recorded inthe financial statements.
The Fund recognizes the tax benefits of uncertain tax positions only when the position is more likely than not to be sustained.Management has analyzed the Fund’s uncertain tax positions and concluded that no liability for unrecognized tax benefits should berecorded related to uncertain tax positions. Management is not aware of any tax positions for which it is reasonably possible that thetotal amounts of unrecognized tax benefits will change materially in the next 12 months.
The Fund files tax returns in the U.S. Federal jurisdiction and certain other jurisdictions. Generally, the Fund is subject toexaminations by such taxing authorities for up to three years after the filing of the return for the tax period.
F. Expenses – Fees provided for under the Rule 12b-1 plan of a particular class of the Fund are charged to the operations of such class.Transfer agency fees and expenses and other shareholder recordkeeping fees and expenses attributable to Class R5 and Class R6 areallocated based on relative net assets of Class R5 and Class R6. Sub-accounting fees attributable to Class R5 are charged to theoperations of the class. Transfer agency fees and expenses and other shareholder recordkeeping fees and expenses relating to allother classes are allocated among those classes based on relative net assets. All other expenses are allocated among the classesbased on relative net assets.
G. Accounting Estimates – The preparation of financial statements in conformity with accounting principles generally accepted in theUnited States of America (“GAAP”) requires management to make estimates and assumptions that affect the reported amounts ofassets and liabilities at the date of the financial statements and the reported amounts of revenues and expenses during the reportingperiod including estimates and assumptions related to taxation. Actual results could differ from those estimates by a significant amount.In addition, the Fund monitors for material events or transactions that may occur or become known after the period-end date and beforethe date the financial statements are released to print.
H. Indemnifications – Under the Trust’s organizational documents, each Trustee, officer, employee or other agent of the Trust isindemnified against certain liabilities that may arise out of the performance of their duties to the Fund. Additionally, in the normal courseof business, the Fund enters into contracts, including the Fund’s servicing agreements, that contain a variety of indemnification clauses.The Fund’s maximum exposure under these arrangements is unknown as this would involve future claims that may be made againstthe Fund that have not yet occurred. The risk of material loss as a result of such indemnification claims is considered remote.
I. Securities Lending – The Fund may lend portfolio securities having a market value up to one-third of the Fund’s total assets. Suchloans are secured by collateral equal to no less than the market value of the loaned securities determined daily by the securities lendingprovider. Such collateral will be cash or debt securities issued or guaranteed by the U.S. Government or any of its sponsored agencies.Cash collateral received in connection with these loans is invested in short-term money market instruments or affiliated money marketfunds and is shown as such on the Schedule of Investments. The Fund bears the risk of loss with respect to the investment ofcollateral. It is the Fund’s policy to obtain additional collateral from or return excess collateral to the borrower by the end of the nextbusiness day, following the valuation date of the securities loaned. Therefore, the value of the collateral held may be temporarily lessthan the value of the securities on loan. When loaning securities, the Fund retains certain benefits of owning the securities, includingthe economic equivalent of dividends or interest generated by the security. Lending securities entails a risk of loss to the Fund if, and tothe extent that, the market value of the securities loaned were to increase and the borrower did not increase the collateral accordingly,and the borrower failed to return the securities. The securities loaned are subject to termination at the option of the borrower or theFund. Upon termination, the borrower will return to the Fund the securities loaned and the Fund will return the collateral. Upon thefailure of the borrower to return the securities, collateral may be liquidated and the securities may be purchased on the open market toreplace the loaned securities. The Fund could experience delays and costs in gaining access to the collateral and the securities maylose value during the delay which could result in potential losses to the Fund. Some of these losses may be indemnified by the lendingagent. The Fund bears the risk of any deficiency in the amount of the collateral available for return to the borrower due to any loss onthe collateral invested. Dividends received on cash collateral investments for securities lending transactions, which are net ofcompensation to counterparties, are included in Dividends from affiliated money market funds on the Statement of Operations. Theaggregate value of securities out on loan, if any, is shown as a footnote on the Statement of Assets and Liabilities.
J. Foreign Currency Translations – Foreign currency is valued at the close of the NYSE based on quotations posted by banks andmajor currency dealers. Portfolio securities and other assets and liabilities denominated in foreign currencies are translated into U.S.dollar amounts at the date of valuation. Purchases and sales of portfolio securities (net of foreign taxes withheld on disposition) andincome items denominated in foreign currencies are translated into U.S. dollar amounts on the respective dates of such transactions.The Fund does not separately account for the portion of the results of operations resulting from changes in foreign exchange rates oninvestments and the fluctuations arising from changes in market prices of securities held. The combined results of changes in foreignexchange rates and the fluctuation of market prices on investments (net of estimated foreign tax withholding) are included with the netrealized and unrealized gain or loss from investments in the Statement of Operations. Reported net realized foreign currency gains orlosses arise from (1) sales of foreign currencies, (2) currency gains or losses realized between the trade and settlement dates onsecurities transactions, and (3) the difference between the amounts of dividends,

ˆ200F9gax2$7@06=ogŠ200F9gax2$7@06=og
209925 EDG 13INVESCOREAL ESTATE
28-Oct-2021 08:13 ESTHTMLAN
Donnelley Financial LSWjenak0apNone
6*ESS 0C
VDI-W10-DPF-23021.7.8.0
ˆ200F9gax2$7@06=ogŠ200F9gax2$7@06=og
209925 EDG 13INVESCOREAL ESTATE
28-Oct-2021 08:13 ESTHTMLAN
Donnelley Financial LSWjenak0apNone
6*ESS 0C
VDI-W10-DPF-23021.7.8.0
Page 2 of 2 13 Invesco Real Estate Fund
ˆ200F9gax2$6u7kYoÊ200F9gax2$6u7kYoˆ
209925 EDG 14INVESCOREAL ESTATE
28-Oct-2021 07:28 ESTHTMLAN
Donnelley Financial LSWpf_rendNone
7*ESS 0C
LSWP64RS0921.10.7.0
Page 1 of 1interest, and foreign withholding taxes recorded on the Fund’s books and the U.S. dollar equivalent of the amounts actually received orpaid. Net unrealized foreign currency gains and losses arise from changes in the fair values of assets and liabilities, other thaninvestments in securities at fiscal period end, resulting from changes in exchange rates.
The Fund may invest in foreign securities, which may be subject to foreign taxes on income, gains on investments or currencyrepatriation, a portion of which may be recoverable. Foreign taxes, if any, are recorded based on the tax regulations and rates that existin the foreign markets in which the Fund invests and are shown in the Statement of Operations.
K. Forward Foreign Currency Contracts – The Fund may engage in foreign currency transactions either on a spot (i.e. for promptdelivery and settlement) basis, or through forward foreign currency contracts, to manage or minimize currency or exchange rate risk.
The Fund may also enter into forward foreign currency contracts for the purchase or sale of a security denominated in a foreigncurrency in order to “lock in” the U.S. dollar price of that security, or the Fund may also enter into forward foreign currency contracts thatdo not provide for physical settlement of the two currencies, but instead are settled by a single cash payment calculated as thedifference between the agreed upon exchange rate and the spot rate at settlement based upon an agreed upon notional amount(non-deliverable forwards). The Fund will set aside liquid assets in an amount equal to the daily mark-to-market obligation for forwardforeign currency contracts.
A forward foreign currency contract is an obligation between two parties (“Counterparties”) to purchase or sell a specific currency foran agreed-upon price at a future date. The use of forward foreign currency contracts does not eliminate fluctuations in the price of theunderlying securities the Fund owns or intends to acquire but establishes a rate of exchange in advance. Fluctuations in the value ofthese contracts are measured by the difference in the contract date and reporting date exchange rates and are recorded as unrealizedappreciation (depreciation) until the contracts are closed. When the contracts are closed, realized gains (losses) are recorded. Realizedand unrealized gains (losses) on the contracts are included in the Statement of Operations. The primary risks associated with forwardforeign currency contracts include failure of the Counterparty to meet the terms of the contract and the value of the foreign currencychanging unfavorably. These risks may be in excess of the amounts reflected in the Statement of Assets and Liabilities.
L. Other Risks – The Fund’s investments are concentrated in a comparatively narrow segment of the economy. Consequently, the Fundmay tend to be more volatile than other mutual funds, and the value of the Fund’s investments may tend to rise and fall more rapidly.
Because the Fund concentrates its assets in the real estate industry, an investment in the Fund will be closely linked to theperformance of the real estate markets. Property values may fall due to increasing vacancies or declining rents resulting fromeconomic, legal, cultural or technological developments.
Emerging markets (also referred to as developing markets) are generally subject to greater market volatility, political, social andeconomic instability, uncertainty regarding the existence of trading markets and more governmental limitations on foreign investmentthan more developed markets. In addition, companies operating in emerging markets may be subject to lower trading volume andgreater price fluctuations than companies in more developed markets. Securities law in many emerging market countries is relativelynew and unsettled. Therefore, laws regarding foreign investment in emerging market securities, securities regulation, title to securities,and shareholder rights may change quickly and unpredictably. In addition, the enforcement of systems of taxation at federal, regionaland local levels in emerging market countries may be inconsistent, and subject to sudden change. Other risks of investing in emergingmarkets securities may include additional transaction costs, delays in settlement procedures, and lack of timely information.
M. COVID-19 Risk – The COVID-19 strain of coronavirus has resulted in instances of market closures and dislocations, extreme volatility,liquidity constraints and increased trading costs. Efforts to contain its spread have resulted in travel restrictions, disruptions ofhealthcare systems, business operations and supply chains, layoffs, lower consumer demand, and defaults, among other significanteconomic impacts that have disrupted global economic activity across many industries. Such economic impacts may exacerbate otherpre-existing political, social and economic risks locally or globally.
The ongoing effects of COVID-19 are unpredictable and may result in significant and prolonged effects on the Fund’s performance.
NOTE 2–Advisory Fees and Other Fees Paid to Affiliates
The Trust has entered into a master investment advisory agreement with Invesco Advisers, Inc. (the “Adviser” or “Invesco”). Under theterms of the investment advisory agreement, the Fund accrues daily and pays monthly an advisory fee to the Adviser based on the annualrate of the Fund’s average daily net assets as follows:
Average Daily Net Assets Rate First $ 250 million 0.750% Next $250 million 0.740% Next $500 million 0.730% Next $1.5 billion 0.720% Next $2.5 billion 0.710% Next $2.5 billion 0.700% Next $2.5 billion 0.690% Over $10 billion 0.680%
For the six months ended August 31, 2021, the effective advisory fee rate incurred by the Fund was 0.73%.Under the terms of a master sub-advisory agreement between the Adviser and each of Invesco Asset Management Deutschland GmbH,
Invesco Asset Management Limited, Invesco Asset Management (Japan) Limited, Invesco Hong Kong Limited, Invesco Senior SecuredManagement, Inc. and Invesco Canada Ltd. (collectively, the “Affiliated Sub-Advisers”) the Adviser, not the Fund, will pay 40% of the feespaid to the Adviser to any such Affiliated Sub-Adviser(s) that provide(s) discretionary investment management services to the Fund basedon the percentage of assets allocated to such Affiliated Sub-Adviser(s).
Effective June 1, 2021, the Adviser has contractually agreed, through at least June 30, 2022, to waive advisory fees and/or reimburseexpenses to the extent necessary to limit total annual fund operating expenses after fee waiver and/or expense reimbursement (excludingcertain items discussed below) of Class A, Class C, Class R, Class Y, Investor Class, Class R5 and Class R6 to 2.00%, 2.75%, 2.25%,1.75%, 2.00%, 1.75% and 1.75%, respectively, of the Fund’s average daily net assets (the “expense limits”). Prior to June 1, 2021, theAdviser had contractually agreed to waive advisory fees and/or reimburse expenses of all shares to the extent necessary to limit totalannual fund operating expenses after fee waiver and/or expense reimbursement (excluding certain items discussed below) of Class A,Class C, Class R, Class Y, Class R5 and Class R6 shares to 1.34%, 2.09%, 1.59%, 1.09%, 1.34%, 0.97% and 0.92%, respectively, of theFund’s average daily net assets. In determining the Adviser’s obligation to waive advisory fees and/or reimburse expenses, the followingexpenses are not taken into account, and could cause the total annual fund operating expenses after fee waiver and/or reimbursement toexceed the numbers reflected above: (1) interest; (2) taxes; (3) dividend expense on short sales; (4) extraordinary or non-routine items,including litigation expenses; and (5) expenses that the Fund has incurred but did not actually pay because of an expense offsetarrangement. Unless Invesco continues the fee waiver agreement, it will terminate on June 30, 2022. During its term, the fee waiveragreement cannot be terminated or amended to increase the expense limits or reduce the advisory fee waivers without approval of theBoard of Trustees. The Adviser did not waive fees and/or reimburse expenses during the period under these expense limits.
Further, the Adviser has contractually agreed, through at least June 30, 2023, to waive the advisory fee payable by the Fund in anamount equal to 100% of the net advisory fees the Adviser receives from the affiliated money market funds on investments by the Fund ofuninvested cash (excluding investments of cash collateral from securities lending) in such affiliated money market funds. 14 Invesco Real Estate Fund
ˆ200F9gax2$7%CtgoRŠ200F9gax2$7%CtgoR
209925 EDG 15INVESCOREAL ESTATE
28-Oct-2021 08:16 ESTHTMLAN
Donnelley Financial LSWjenak0apNone
7*ESS 0C
VDI-W10-DPF-23021.7.8.0
Page 1 of 1For the six months ended August 31, 2021, the Adviser waived advisory fees of $2,832.The Trust has entered into a master administrative services agreement with Invesco pursuant to which the Fund has agreed to pay
Invesco for certain administrative costs incurred in providing accounting services to the Fund. For the six months ended August 31, 2021,expenses incurred under the agreement are shown in the Statement of Operations as Administrative services fees. Invesco has enteredinto a sub-administration agreement whereby State Street Bank and Trust Company (“SSB”) serves as fund accountant and providescertain administrative services to the Fund. Pursuant to a custody agreement with the Trust on behalf of the Fund, SSB also serves as theFund’s custodian.
The Trust has entered into a transfer agency and service agreement with Invesco Investment Services, Inc. (“IIS”) pursuant to which theFund has agreed to pay IIS a fee for providing transfer agency and shareholder services to the Fund and reimburse IIS for certain expensesincurred by IIS in the course of providing such services. IIS may make payments to intermediaries that provide omnibus account services,sub-accounting services and/or networking services. All fees payable by IIS to intermediaries that provide omnibus account services orsub-accounting services are charged back to the Fund, subject to certain limitations approved by the Trust’s Board of Trustees. For the sixmonths ended August 31, 2021, expenses incurred under the agreement are shown in the Statement of Operations as Transfer agent fees.
The Trust has entered into master distribution agreements with Invesco Distributors, Inc. (“IDI”) to serve as the distributor for the Class A,Class C, Class R, Investor Class, Class R5 and Class R6 shares of the Fund. The Trust has adopted plans pursuant to Rule 12b-1 underthe 1940 Act with respect to the Fund’s Class A, Class C, Class R and Investor Class shares (collectively, the “Plans”). The Fund, pursuantto the Plans, reimburses IDI for its allocated share of expenses incurred for the period, up to a maximum annual rate of 0.25% of theaverage daily net assets of Class A shares and up to a maximum annual rate of 0.25% of the average daily net assets of InvestorClass shares. The Fund pursuant to the Class C Plan and Class R Plan, pays IDI compensation at the annual rate of 1.00% of the averagedaily net assets of Class C shares and at the annual rate of 0.50% of the average daily net assets of Class R shares, respectively. The feesare accrued daily and paid monthly. Of the Plan payments, up to 0.25% of the average daily net assets of each class of shares may be paidto furnish continuing personal shareholder services to customers who purchase and own shares of such classes. Any amounts not paid asa service fee under the Plans would constitute an asset-based sales charge. Rules of the Financial Industry Regulatory Authority (“FINRA”)impose a cap on the total sales charges, including asset-based sales charges, that may be paid by any class of shares of the Fund. For thesix months ended August 31, 2021, expenses incurred under the Plans are shown in the Statement of Operations as Distribution fees.
Front-end sales commissions and CDSC (collectively, the “sales charges”) are not recorded as expenses of the Fund. Front-end salescommissions are deducted from proceeds from the sales of Fund shares prior to investment in Class A shares of the Fund. CDSC arededucted from redemption proceeds prior to remittance to the shareholder. During the six months ended August 31, 2021, IDI advised theFund that IDI retained $37,795 in front-end sales commissions from the sale of Class A shares and $1,459 and $596 from Class A andClass C shares, respectively, for CDSC imposed upon redemptions by shareholders.
Certain officers and trustees of the Trust are officers and directors of the Adviser, IIS and/or IDI.
NOTE 3–Additional Valuation Information
GAAP defines fair value as the price that would be received to sell an asset or paid to transfer a liability in an orderly transaction betweenmarket participants at the measurement date, under current market conditions. GAAP establishes a hierarchy that prioritizes the inputs tovaluation methods, giving the highest priority to readily available unadjusted quoted prices in an active market for identical assets (Level 1)and the lowest priority to significant unobservable inputs (Level 3), generally when market prices are not readily available or are unreliable.Based on the valuation inputs, the securities or other investments are tiered into one of three levels. Changes in valuation methods mayresult in transfers in or out of an investment’s assigned level:
Level 1 - Prices are determined using quoted prices in an active market for identical assets. Level 2 -
Prices are determined using other significant observable inputs. Observable inputs are inputs that other market participantsmay use in pricing a security. These may include quoted prices for similar securities, interest rates, prepayment speeds, creditrisk, yield curves, loss severities, default rates, discount rates, volatilities and others.
Level 3 -
Prices are determined using significant unobservable inputs. In situations where quoted prices or observable inputs areunavailable (for example, when there is little or no market activity for an investment at the end of the period), unobservableinputs may be used. Unobservable inputs reflect the Fund’s own assumptions about the factors market participants would usein determining fair value of the securities or instruments and would be based on the best available information.
The following is a summary of the tiered valuation input levels, as of August 31, 2021. The level assigned to the securities valuations maynot be an indication of the risk or liquidity associated with investing in those securities. Because of the inherent uncertainties of valuation,the values reflected in the financial statements may materially differ from the value received upon actual sale of those investments.
Level 1 Level 2 Level 3 Total Investments in Securities Common Stocks & Other Equity Interests $2,120,261,582 $ – $292,034 $2,120,553,616 Money Market Funds 13,663,131 75,683,459 – 89,346,590
Total Investments $2,133,924,713 $75,683,459 $292,034 $2,209,900,206
NOTE 4–Expense Offset Arrangement(s)
The expense offset arrangement is comprised of transfer agency credits which result from balances in demand deposit accounts used bythe transfer agent for clearing shareholder transactions. For the six months ended August 31, 2021, the Fund received credits from thisarrangement, which resulted in the reduction of the Fund’s total expenses of $3,801.
NOTE 5–Trustees’ and Officers’ Fees and Benefits
Trustees’ and Officers’ Fees and Benefits include amounts accrued by the Fund to pay remuneration to certain Trustees and Officers of theFund. Trustees have the option to defer compensation payable by the Fund, and Trustees’ and Officers’ Fees and Benefits also includeamounts accrued by the Fund to fund such deferred compensation amounts. Those Trustees who defer compensation have the option toselect various Invesco Funds in which their deferral accounts shall be deemed to be invested. Finally, certain current Trustees were eligibleto participate in a retirement plan that provided for benefits to be paid upon retirement to Trustees over a period of time based on thenumber of years of service. The Fund may have certain former Trustees who also participate in a retirement plan and receive benefits undersuch plan. Trustees’ and Officers’ Fees and Benefits include amounts accrued by the Fund to fund such retirement benefits. Obligationsunder the deferred compensation and retirement plans represent unsecured claims against the general assets of the Fund. 15 Invesco Real Estate Fund
ˆ200F9gax2$82oxcGJŠ200F9gax2$82oxcGJ
209925 EDG 16INVESCOREAL ESTATE
28-Oct-2021 08:19 ESTHTMLAN
Donnelley Financial LSWjenak0apNone
7*ESS 0C
VDI-W10-DPF-23021.7.8.0
Page 1 of 1NOTE 6–Cash Balances
The Fund is permitted to temporarily carry a negative or overdrawn balance in its account with SSB, the custodian bank. Such balances, ifany at period-end, are shown in the Statement of Assets and Liabilities under the payable caption Amount due custodian. To compensatethe custodian bank for such overdrafts, the overdrawn Fund may either (1) leave funds as a compensating balance in the account so thecustodian bank can be compensated by earning the additional interest; or (2) compensate by paying the custodian bank at a rate agreedupon by the custodian bank and Invesco, not to exceed the contractually agreed upon rate. The Fund may not purchase additionalsecurities when any borrowings from banks or broker-dealers exceed 5% of the Fund’s total assets, or when any borrowings from anInvesco Fund are outstanding.
NOTE 7–Tax Information
The amount and character of income and gains to be distributed are determined in accordance with income tax regulations, which maydiffer from GAAP. Reclassifications are made to the Fund’s capital accounts to reflect income and gains available for distribution (oravailable capital loss carryforward) under income tax regulations. The tax character of distributions paid during the year and the taxcomponents of net assets will be reported at the Fund’s fiscal year-end.
Capital loss carryforward is calculated and reported as of a specific date. Results of transactions and other activity after that date mayaffect the amount of capital loss carryforward actually available for the Fund to utilize. The ability to utilize capital loss carryforwards in thefuture may be limited under the Internal Revenue Code and related regulations based on the results of future transactions.
The Fund had a capital loss carryforward as of February 28, 2021, as follows:
Capital Loss Carryforward*
Expiration Short-Term Long-Term Total
Not subject to expiration $57,754,864 $– $57,754,864
* Capital loss carryforward is reduced for limitations, if any, to the extent required by the Internal Revenue Code and may be further limited dependingupon a variety of factors, including the realization of net unrealized gains or losses as of the date of any reorganization.
NOTE 8–Investment Transactions
The aggregate amount of investment securities (other than short-term securities, U.S. Government obligations and money market funds, ifany) purchased and sold by the Fund during the six months ended August 31, 2021 was $602,668,161 and $696,572,050, respectively.Cost of investments, including any derivatives, on a tax basis includes the adjustments for financial reporting purposes as of the mostrecently completed federal income tax reporting period-end.
Unrealized Appreciation (Depreciation) of Investments on a Tax Basis
Aggregate unrealized appreciation of investments $642,982,100
Aggregate unrealized (depreciation) of investments (6,426,414)
Net unrealized appreciation of investments $636,555,686
Cost of investments for tax purposes is $1,573,344,520.
NOTE 9–Share Information
Summary of Share Activity
Six months endedAugust 31, 2021(a)
Year endedFebruary 28, 2021
Shares Amount Shares Amount
Sold: Class A 2,246,906 $ 47,879,612 7,132,556 $ 126,165,784
Class C 136,001 2,858,365 345,281 6,138,107
Class R 589,359 12,677,411 786,892 13,901,916
Class Y 3,141,777 66,062,658 5,073,488 89,768,751
Investor Class 90,077 1,890,366 182,728 3,236,680
Class R5 2,581,363 56,376,780 3,854,748 68,248,825
Class R6 2,375,837 50,297,224 5,151,156 90,476,088
Issued as reinvestment of dividends: Class A 218,058 4,475,358 2,438,552 40,639,632
Class C 3,766 75,777 95,609 1,581,329
Class R 23,987 492,857 246,385 4,127,368
Class Y 62,543 1,286,777 616,551 10,289,152
Investor Class 8,165 167,187 124,462 2,055,082
Class R5 101,645 2,092,974 1,063,534 17,633,674
Class R6 134,616 2,767,496 975,532 16,324,034
Automatic conversion of Class C shares to Class A shares: Class A 157,101 3,352,128 818,497 14,428,058
Class C (158,172) (3,352,128) (823,871) (14,428,058)
16 Invesco Real Estate Fund
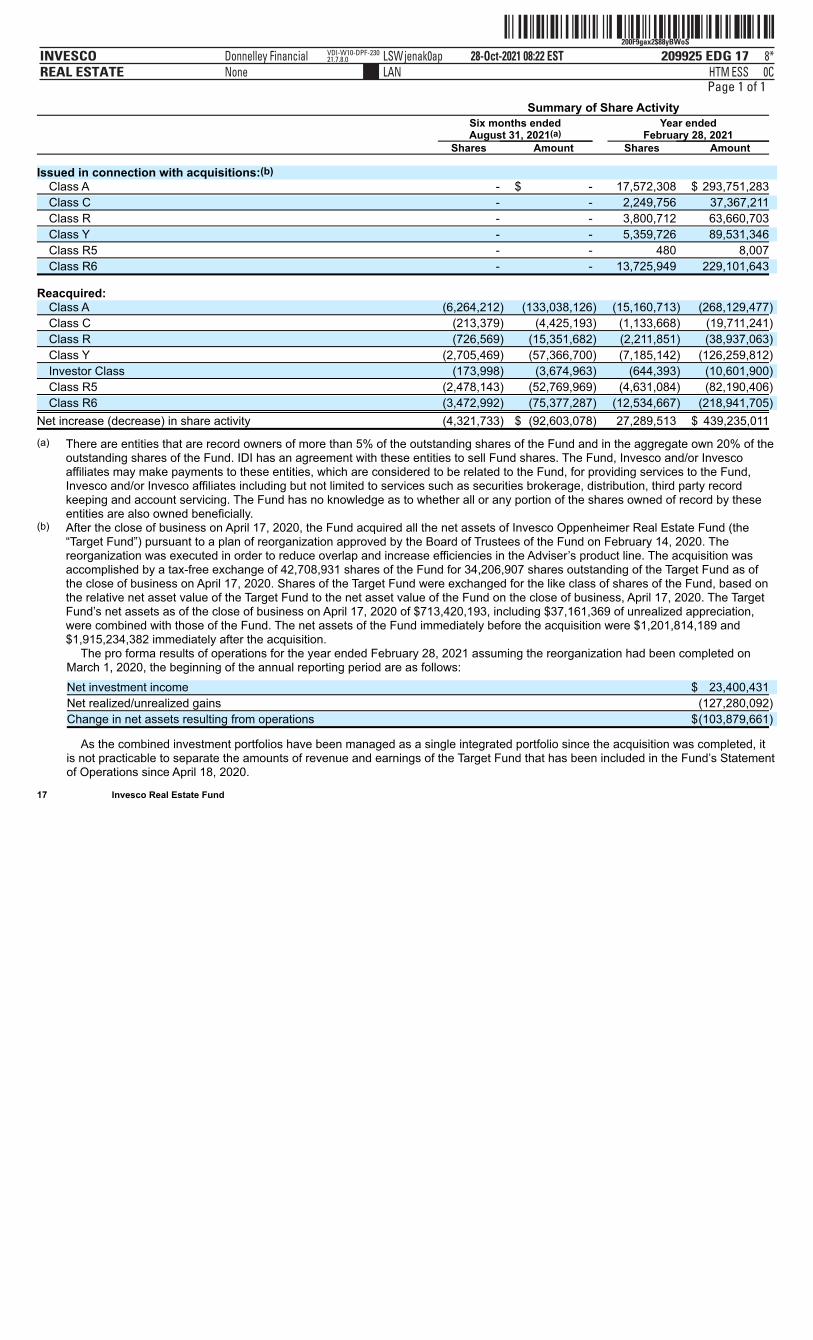
ˆ200F9gax2$88yBWoSŠ200F9gax2$88yBWoS
209925 EDG 17INVESCOREAL ESTATE
28-Oct-2021 08:22 ESTHTMLAN
Donnelley Financial LSWjenak0apNone
8*ESS 0C
VDI-W10-DPF-23021.7.8.0
Page 1 of 1 Summary of Share Activity
Six months endedAugust 31, 2021(a)
Year endedFebruary 28, 2021
Shares Amount Shares Amount
Issued in connection with acquisitions:(b) Class A - $ - 17,572,308 $ 293,751,283
Class C - - 2,249,756 37,367,211
Class R - - 3,800,712 63,660,703
Class Y - - 5,359,726 89,531,346
Class R5 - - 480 8,007
Class R6 - - 13,725,949 229,101,643
Reacquired: Class A (6,264,212) (133,038,126) (15,160,713) (268,129,477)
Class C (213,379) (4,425,193) (1,133,668) (19,711,241)
Class R (726,569) (15,351,682) (2,211,851) (38,937,063)
Class Y (2,705,469) (57,366,700) (7,185,142) (126,259,812)
Investor Class (173,998) (3,674,963) (644,393) (10,601,900)
Class R5 (2,478,143) (52,769,969) (4,631,084) (82,190,406)
Class R6 (3,472,992) (75,377,287) (12,534,667) (218,941,705)
Net increase (decrease) in share activity (4,321,733) $ (92,603,078) 27,289,513 $ 439,235,011
(a) There are entities that are record owners of more than 5% of the outstanding shares of the Fund and in the aggregate own 20% of theoutstanding shares of the Fund. IDI has an agreement with these entities to sell Fund shares. The Fund, Invesco and/or Invescoaffiliates may make payments to these entities, which are considered to be related to the Fund, for providing services to the Fund,Invesco and/or Invesco affiliates including but not limited to services such as securities brokerage, distribution, third party recordkeeping and account servicing. The Fund has no knowledge as to whether all or any portion of the shares owned of record by theseentities are also owned beneficially.
(b) After the close of business on April 17, 2020, the Fund acquired all the net assets of Invesco Oppenheimer Real Estate Fund (the“Target Fund”) pursuant to a plan of reorganization approved by the Board of Trustees of the Fund on February 14, 2020. Thereorganization was executed in order to reduce overlap and increase efficiencies in the Adviser’s product line. The acquisition wasaccomplished by a tax-free exchange of 42,708,931 shares of the Fund for 34,206,907 shares outstanding of the Target Fund as ofthe close of business on April 17, 2020. Shares of the Target Fund were exchanged for the like class of shares of the Fund, based onthe relative net asset value of the Target Fund to the net asset value of the Fund on the close of business, April 17, 2020. The TargetFund’s net assets as of the close of business on April 17, 2020 of $713,420,193, including $37,161,369 of unrealized appreciation,were combined with those of the Fund. The net assets of the Fund immediately before the acquisition were $1,201,814,189 and$1,915,234,382 immediately after the acquisition.
The pro forma results of operations for the year ended February 28, 2021 assuming the reorganization had been completed onMarch 1, 2020, the beginning of the annual reporting period are as follows:
Net investment income $ 23,400,431
Net realized/unrealized gains (127,280,092)
Change in net assets resulting from operations $(103,879,661)
As the combined investment portfolios have been managed as a single integrated portfolio since the acquisition was completed, itis not practicable to separate the amounts of revenue and earnings of the Target Fund that has been included in the Fund’s Statementof Operations since April 18, 2020.
17 Invesco Real Estate Fund
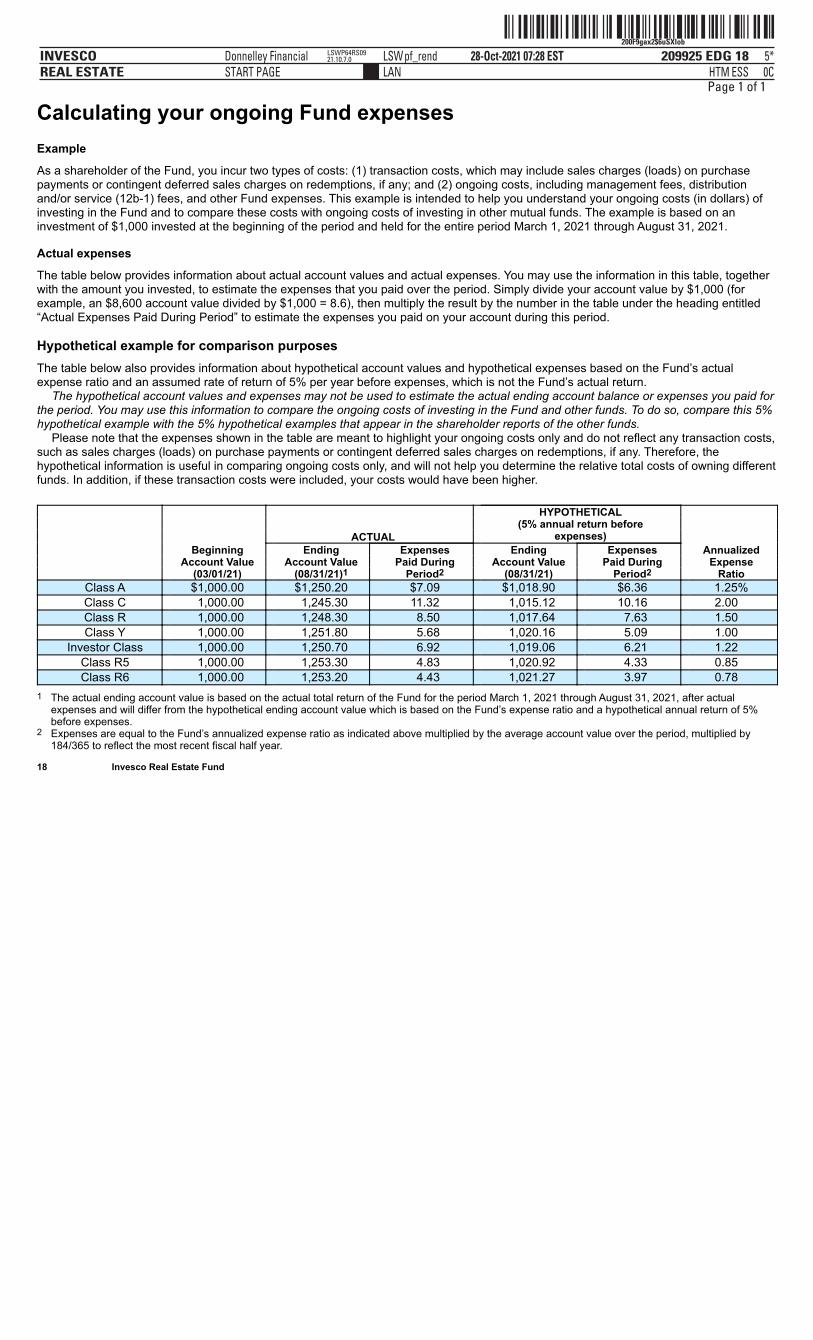
ˆ200F9gax2$6uSXlobŠ200F9gax2$6uSXlob
209925 EDG 18INVESCOREAL ESTATE
28-Oct-2021 07:28 ESTHTMLAN
Donnelley Financial LSWpf_rendSTART PAGE
5*ESS 0C
LSWP64RS0921.10.7.0
Page 1 of 1
Calculating your ongoing Fund expensesExample
As a shareholder of the Fund, you incur two types of costs: (1) transaction costs, which may include sales charges (loads) on purchasepayments or contingent deferred sales charges on redemptions, if any; and (2) ongoing costs, including management fees, distributionand/or service (12b-1) fees, and other Fund expenses. This example is intended to help you understand your ongoing costs (in dollars) ofinvesting in the Fund and to compare these costs with ongoing costs of investing in other mutual funds. The example is based on aninvestment of $1,000 invested at the beginning of the period and held for the entire period March 1, 2021 through August 31, 2021.
Actual expenses
The table below provides information about actual account values and actual expenses. You may use the information in this table, togetherwith the amount you invested, to estimate the expenses that you paid over the period. Simply divide your account value by $1,000 (forexample, an $8,600 account value divided by $1,000 = 8.6), then multiply the result by the number in the table under the heading entitled“Actual Expenses Paid During Period” to estimate the expenses you paid on your account during this period.
Hypothetical example for comparison purposesThe table below also provides information about hypothetical account values and hypothetical expenses based on the Fund’s actualexpense ratio and an assumed rate of return of 5% per year before expenses, which is not the Fund’s actual return.
The hypothetical account values and expenses may not be used to estimate the actual ending account balance or expenses you paid forthe period. You may use this information to compare the ongoing costs of investing in the Fund and other funds. To do so, compare this 5%hypothetical example with the 5% hypothetical examples that appear in the shareholder reports of the other funds.
Please note that the expenses shown in the table are meant to highlight your ongoing costs only and do not reflect any transaction costs,such as sales charges (loads) on purchase payments or contingent deferred sales charges on redemptions, if any. Therefore, thehypothetical information is useful in comparing ongoing costs only, and will not help you determine the relative total costs of owning differentfunds. In addition, if these transaction costs were included, your costs would have been higher.
HYPOTHETICAL (5% annual return before ACTUAL expenses) Beginning Ending Expenses Ending Expenses Annualized Account Value Account Value Paid During Account Value Paid During Expense (03/01/21) (08/31/21)1 Period2 (08/31/21) Period2 Ratio
Class A $1,000.00 $1,250.20 $7.09 $1,018.90 $6.36 1.25%Class C 1,000.00 1,245.30 11.32 1,015.12 10.16 2.00 Class R 1,000.00 1,248.30 8.50 1,017.64 7.63 1.50 Class Y 1,000.00 1,251.80 5.68 1,020.16 5.09 1.00
Investor Class 1,000.00 1,250.70 6.92 1,019.06 6.21 1.22 Class R5 1,000.00 1,253.30 4.83 1,020.92 4.33 0.85 Class R6 1,000.00 1,253.20 4.43 1,021.27 3.97 0.78
1 The actual ending account value is based on the actual total return of the Fund for the period March 1, 2021 through August 31, 2021, after actualexpenses and will differ from the hypothetical ending account value which is based on the Fund’s expense ratio and a hypothetical annual return of 5%before expenses.
2 Expenses are equal to the Fund’s annualized expense ratio as indicated above multiplied by the average account value over the period, multiplied by184/365 to reflect the most recent fiscal half year.
18 Invesco Real Estate Fund
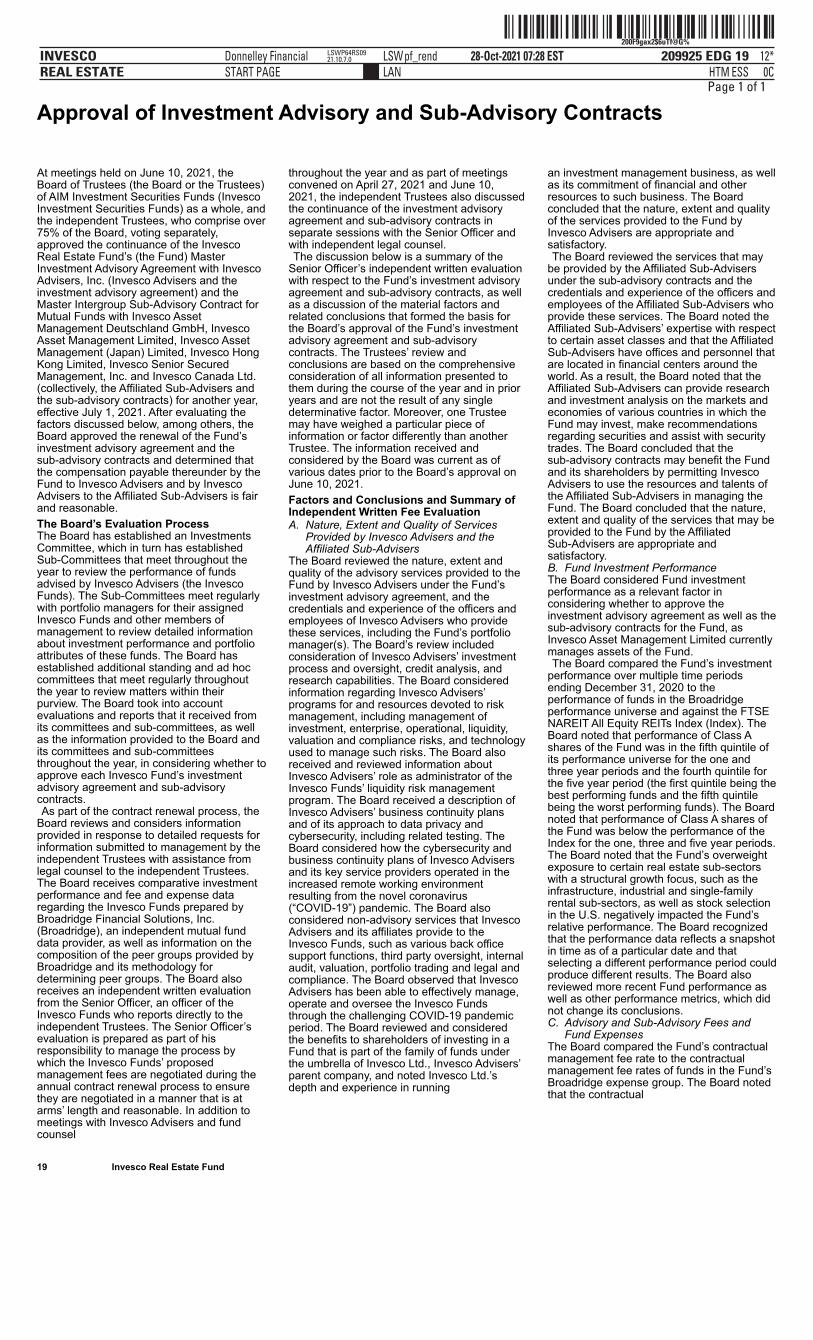
ˆ200F9gax2$6uTf@G%Š200F9gax2$6uTf@G%
209925 EDG 19INVESCOREAL ESTATE
28-Oct-2021 07:28 ESTHTMLAN
Donnelley Financial LSWpf_rendSTART PAGE
12*ESS 0C
LSWP64RS0921.10.7.0
Page 1 of 1
Approval of Investment Advisory and Sub-Advisory Contracts
19 Invesco Real Estate Fund
At meetings held on June 10, 2021, theBoard of Trustees (the Board or the Trustees)of AIM Investment Securities Funds (InvescoInvestment Securities Funds) as a whole, andthe independent Trustees, who comprise over75% of the Board, voting separately,approved the continuance of the InvescoReal Estate Fund’s (the Fund) MasterInvestment Advisory Agreement with InvescoAdvisers, Inc. (Invesco Advisers and theinvestment advisory agreement) and theMaster Intergroup Sub-Advisory Contract forMutual Funds with Invesco AssetManagement Deutschland GmbH, InvescoAsset Management Limited, Invesco AssetManagement (Japan) Limited, Invesco HongKong Limited, Invesco Senior SecuredManagement, Inc. and Invesco Canada Ltd.(collectively, the Affiliated Sub-Advisers andthe sub-advisory contracts) for another year,effective July 1, 2021. After evaluating thefactors discussed below, among others, theBoard approved the renewal of the Fund’sinvestment advisory agreement and thesub-advisory contracts and determined thatthe compensation payable thereunder by theFund to Invesco Advisers and by InvescoAdvisers to the Affiliated Sub-Advisers is fairand reasonable.The Board’s Evaluation ProcessThe Board has established an InvestmentsCommittee, which in turn has establishedSub-Committees that meet throughout theyear to review the performance of fundsadvised by Invesco Advisers (the InvescoFunds). The Sub-Committees meet regularlywith portfolio managers for their assignedInvesco Funds and other members ofmanagement to review detailed informationabout investment performance and portfolioattributes of these funds. The Board hasestablished additional standing and ad hoccommittees that meet regularly throughoutthe year to review matters within theirpurview. The Board took into accountevaluations and reports that it received fromits committees and sub-committees, as wellas the information provided to the Board andits committees and sub-committeesthroughout the year, in considering whether toapprove each Invesco Fund’s investmentadvisory agreement and sub-advisorycontracts.As part of the contract renewal process, the
Board reviews and considers informationprovided in response to detailed requests forinformation submitted to management by theindependent Trustees with assistance fromlegal counsel to the independent Trustees.The Board receives comparative investmentperformance and fee and expense dataregarding the Invesco Funds prepared byBroadridge Financial Solutions, Inc.(Broadridge), an independent mutual funddata provider, as well as information on thecomposition of the peer groups provided byBroadridge and its methodology fordetermining peer groups. The Board alsoreceives an independent written evaluationfrom the Senior Officer, an officer of theInvesco Funds who reports directly to theindependent Trustees. The Senior Officer’sevaluation is prepared as part of hisresponsibility to manage the process bywhich the Invesco Funds’ proposedmanagement fees are negotiated during theannual contract renewal process to ensurethey are negotiated in a manner that is atarms’ length and reasonable. In addition tomeetings with Invesco Advisers and fundcounsel
throughout the year and as part of meetingsconvened on April 27, 2021 and June 10,2021, the independent Trustees also discussedthe continuance of the investment advisoryagreement and sub-advisory contracts inseparate sessions with the Senior Officer andwith independent legal counsel.The discussion below is a summary of the
Senior Officer’s independent written evaluationwith respect to the Fund’s investment advisoryagreement and sub-advisory contracts, as wellas a discussion of the material factors andrelated conclusions that formed the basis forthe Board’s approval of the Fund’s investmentadvisory agreement and sub-advisorycontracts. The Trustees’ review andconclusions are based on the comprehensiveconsideration of all information presented tothem during the course of the year and in prioryears and are not the result of any singledeterminative factor. Moreover, one Trusteemay have weighed a particular piece ofinformation or factor differently than anotherTrustee. The information received andconsidered by the Board was current as ofvarious dates prior to the Board’s approval onJune 10, 2021.Factors and Conclusions and Summary ofIndependent Written Fee Evaluation
A. Nature, Extent and Quality of ServicesProvided by Invesco Advisers and theAffiliated Sub-Advisers
The Board reviewed the nature, extent andquality of the advisory services provided to theFund by Invesco Advisers under the Fund’sinvestment advisory agreement, and thecredentials and experience of the officers andemployees of Invesco Advisers who providethese services, including the Fund’s portfoliomanager(s). The Board’s review includedconsideration of Invesco Advisers’ investmentprocess and oversight, credit analysis, andresearch capabilities. The Board consideredinformation regarding Invesco Advisers’programs for and resources devoted to riskmanagement, including management ofinvestment, enterprise, operational, liquidity,valuation and compliance risks, and technologyused to manage such risks. The Board alsoreceived and reviewed information aboutInvesco Advisers’ role as administrator of theInvesco Funds’ liquidity risk managementprogram. The Board received a description ofInvesco Advisers’ business continuity plansand of its approach to data privacy andcybersecurity, including related testing. TheBoard considered how the cybersecurity andbusiness continuity plans of Invesco Advisersand its key service providers operated in theincreased remote working environmentresulting from the novel coronavirus(“COVID-19”) pandemic. The Board alsoconsidered non-advisory services that InvescoAdvisers and its affiliates provide to theInvesco Funds, such as various back officesupport functions, third party oversight, internalaudit, valuation, portfolio trading and legal andcompliance. The Board observed that InvescoAdvisers has been able to effectively manage,operate and oversee the Invesco Fundsthrough the challenging COVID-19 pandemicperiod. The Board reviewed and consideredthe benefits to shareholders of investing in aFund that is part of the family of funds underthe umbrella of Invesco Ltd., Invesco Advisers’parent company, and noted Invesco Ltd.’sdepth and experience in running
an investment management business, as wellas its commitment of financial and otherresources to such business. The Boardconcluded that the nature, extent and qualityof the services provided to the Fund byInvesco Advisers are appropriate andsatisfactory.The Board reviewed the services that may
be provided by the Affiliated Sub-Advisersunder the sub-advisory contracts and thecredentials and experience of the officers andemployees of the Affiliated Sub-Advisers whoprovide these services. The Board noted theAffiliated Sub-Advisers’ expertise with respectto certain asset classes and that the AffiliatedSub-Advisers have offices and personnel thatare located in financial centers around theworld. As a result, the Board noted that theAffiliated Sub-Advisers can provide researchand investment analysis on the markets andeconomies of various countries in which theFund may invest, make recommendationsregarding securities and assist with securitytrades. The Board concluded that thesub-advisory contracts may benefit the Fundand its shareholders by permitting InvescoAdvisers to use the resources and talents ofthe Affiliated Sub-Advisers in managing theFund. The Board concluded that the nature,extent and quality of the services that may beprovided to the Fund by the AffiliatedSub-Advisers are appropriate andsatisfactory.B. Fund Investment PerformanceThe Board considered Fund investmentperformance as a relevant factor inconsidering whether to approve theinvestment advisory agreement as well as thesub-advisory contracts for the Fund, asInvesco Asset Management Limited currentlymanages assets of the Fund.The Board compared the Fund’s investment
performance over multiple time periodsending December 31, 2020 to theperformance of funds in the Broadridgeperformance universe and against the FTSENAREIT All Equity REITs Index (Index). TheBoard noted that performance of Class Ashares of the Fund was in the fifth quintile ofits performance universe for the one andthree year periods and the fourth quintile forthe five year period (the first quintile being thebest performing funds and the fifth quintilebeing the worst performing funds). The Boardnoted that performance of Class A shares ofthe Fund was below the performance of theIndex for the one, three and five year periods.The Board noted that the Fund’s overweightexposure to certain real estate sub-sectorswith a structural growth focus, such as theinfrastructure, industrial and single-familyrental sub-sectors, as well as stock selectionin the U.S. negatively impacted the Fund’srelative performance. The Board recognizedthat the performance data reflects a snapshotin time as of a particular date and thatselecting a different performance period couldproduce different results. The Board alsoreviewed more recent Fund performance aswell as other performance metrics, which didnot change its conclusions.C. Advisory and Sub-Advisory Fees and
Fund ExpensesThe Board compared the Fund’s contractualmanagement fee rate to the contractualmanagement fee rates of funds in the Fund’sBroadridge expense group. The Board notedthat the contractual
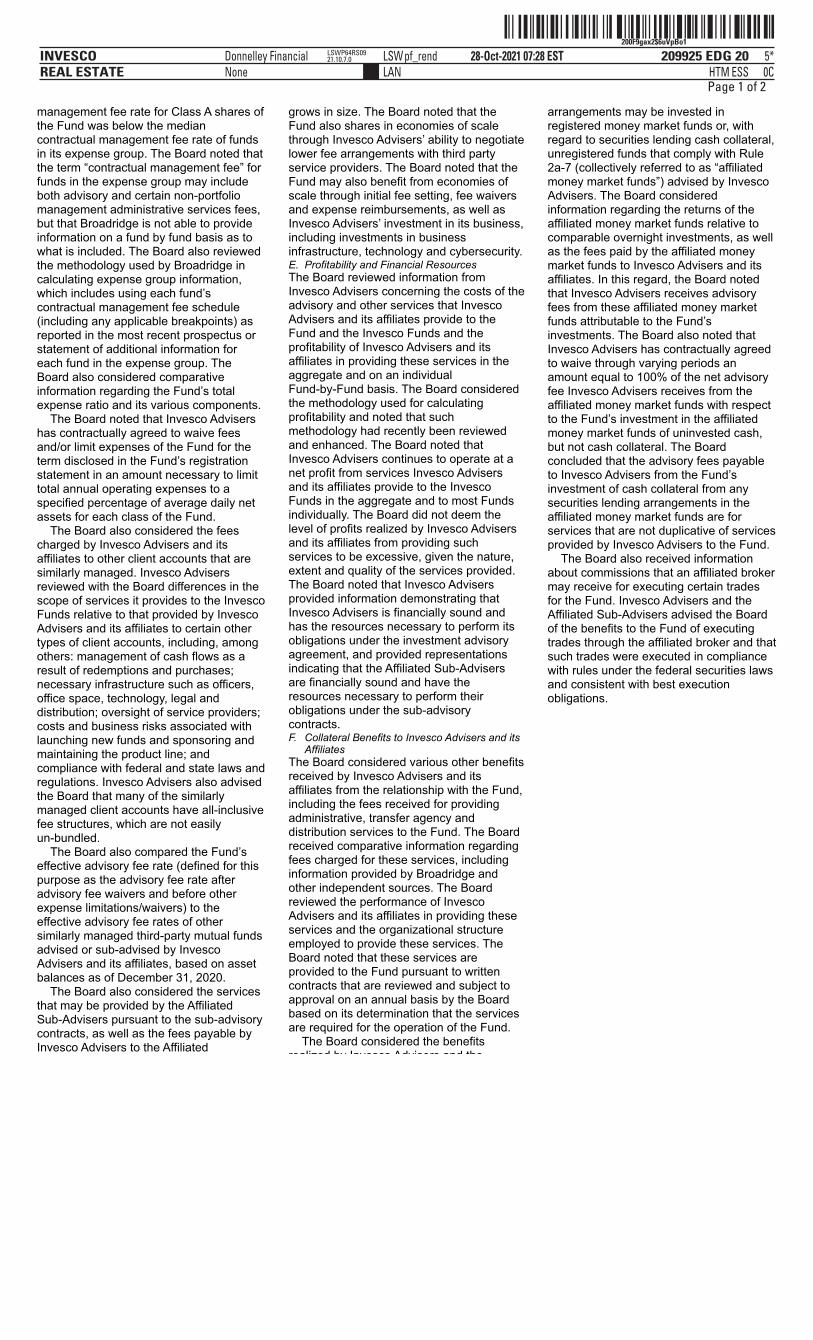
ˆ200F9gax2$6uVpBo1Š200F9gax2$6uVpBo1
209925 EDG 20INVESCOREAL ESTATE
28-Oct-2021 07:28 ESTHTMLAN
Donnelley Financial LSWpf_rendNone
5*ESS 0C
LSWP64RS0921.10.7.0
Page 1 of 2
management fee rate for Class A shares ofthe Fund was below the mediancontractual management fee rate of fundsin its expense group. The Board noted thatthe term “contractual management fee” forfunds in the expense group may includeboth advisory and certain non-portfoliomanagement administrative services fees,but that Broadridge is not able to provideinformation on a fund by fund basis as towhat is included. The Board also reviewedthe methodology used by Broadridge incalculating expense group information,which includes using each fund’scontractual management fee schedule(including any applicable breakpoints) asreported in the most recent prospectus orstatement of additional information foreach fund in the expense group. TheBoard also considered comparativeinformation regarding the Fund’s totalexpense ratio and its various components.
The Board noted that Invesco Advisershas contractually agreed to waive feesand/or limit expenses of the Fund for theterm disclosed in the Fund’s registrationstatement in an amount necessary to limittotal annual operating expenses to aspecified percentage of average daily netassets for each class of the Fund.
The Board also considered the feescharged by Invesco Advisers and itsaffiliates to other client accounts that aresimilarly managed. Invesco Advisersreviewed with the Board differences in thescope of services it provides to the InvescoFunds relative to that provided by InvescoAdvisers and its affiliates to certain othertypes of client accounts, including, amongothers: management of cash flows as aresult of redemptions and purchases;necessary infrastructure such as officers,office space, technology, legal anddistribution; oversight of service providers;costs and business risks associated withlaunching new funds and sponsoring andmaintaining the product line; andcompliance with federal and state laws andregulations. Invesco Advisers also advisedthe Board that many of the similarlymanaged client accounts have all-inclusivefee structures, which are not easilyun-bundled.
The Board also compared the Fund’seffective advisory fee rate (defined for thispurpose as the advisory fee rate afteradvisory fee waivers and before otherexpense limitations/waivers) to theeffective advisory fee rates of othersimilarly managed third-party mutual fundsadvised or sub-advised by InvescoAdvisers and its affiliates, based on assetbalances as of December 31, 2020.
The Board also considered the servicesthat may be provided by the AffiliatedSub-Advisers pursuant to the sub-advisorycontracts, as well as the fees payable byInvesco Advisers to the Affiliated
grows in size. The Board noted that theFund also shares in economies of scalethrough Invesco Advisers’ ability to negotiatelower fee arrangements with third partyservice providers. The Board noted that theFund may also benefit from economies ofscale through initial fee setting, fee waiversand expense reimbursements, as well asInvesco Advisers’ investment in its business,including investments in businessinfrastructure, technology and cybersecurity.E. Profitability and Financial ResourcesThe Board reviewed information fromInvesco Advisers concerning the costs of theadvisory and other services that InvescoAdvisers and its affiliates provide to theFund and the Invesco Funds and theprofitability of Invesco Advisers and itsaffiliates in providing these services in theaggregate and on an individualFund-by-Fund basis. The Board consideredthe methodology used for calculatingprofitability and noted that suchmethodology had recently been reviewedand enhanced. The Board noted thatInvesco Advisers continues to operate at anet profit from services Invesco Advisersand its affiliates provide to the InvescoFunds in the aggregate and to most Fundsindividually. The Board did not deem thelevel of profits realized by Invesco Advisersand its affiliates from providing suchservices to be excessive, given the nature,extent and quality of the services provided.The Board noted that Invesco Advisersprovided information demonstrating thatInvesco Advisers is financially sound andhas the resources necessary to perform itsobligations under the investment advisoryagreement, and provided representationsindicating that the Affiliated Sub-Advisersare financially sound and have theresources necessary to perform theirobligations under the sub-advisorycontracts.F. Collateral Benefits to Invesco Advisers and its
AffiliatesThe Board considered various other benefitsreceived by Invesco Advisers and itsaffiliates from the relationship with the Fund,including the fees received for providingadministrative, transfer agency anddistribution services to the Fund. The Boardreceived comparative information regardingfees charged for these services, includinginformation provided by Broadridge andother independent sources. The Boardreviewed the performance of InvescoAdvisers and its affiliates in providing theseservices and the organizational structureemployed to provide these services. TheBoard noted that these services areprovided to the Fund pursuant to writtencontracts that are reviewed and subject toapproval on an annual basis by the Boardbased on its determination that the servicesare required for the operation of the Fund.
The Board considered the benefitsrealized by Invesco Advisers and the
arrangements may be invested inregistered money market funds or, withregard to securities lending cash collateral,unregistered funds that comply with Rule2a-7 (collectively referred to as “affiliatedmoney market funds”) advised by InvescoAdvisers. The Board consideredinformation regarding the returns of theaffiliated money market funds relative tocomparable overnight investments, as wellas the fees paid by the affiliated moneymarket funds to Invesco Advisers and itsaffiliates. In this regard, the Board notedthat Invesco Advisers receives advisoryfees from these affiliated money marketfunds attributable to the Fund’sinvestments. The Board also noted thatInvesco Advisers has contractually agreedto waive through varying periods anamount equal to 100% of the net advisoryfee Invesco Advisers receives from theaffiliated money market funds with respectto the Fund’s investment in the affiliatedmoney market funds of uninvested cash,but not cash collateral. The Boardconcluded that the advisory fees payableto Invesco Advisers from the Fund’sinvestment of cash collateral from anysecurities lending arrangements in theaffiliated money market funds are forservices that are not duplicative of servicesprovided by Invesco Advisers to the Fund.
The Board also received informationabout commissions that an affiliated brokermay receive for executing certain tradesfor the Fund. Invesco Advisers and theAffiliated Sub-Advisers advised the Boardof the benefits to the Fund of executingtrades through the affiliated broker and thatsuch trades were executed in compliancewith rules under the federal securities lawsand consistent with best executionobligations.

ˆ200F9gax2$6uVpBo1Š200F9gax2$6uVpBo1
209925 EDG 20INVESCOREAL ESTATE
28-Oct-2021 07:28 ESTHTMLAN
Donnelley Financial LSWpf_rendNone
5*ESS 0C
LSWP64RS0921.10.7.0
ˆ200F9gax2$6uVpBo1Š200F9gax2$6uVpBo1
209925 EDG 20INVESCOREAL ESTATE
28-Oct-2021 07:28 ESTHTMLAN
Donnelley Financial LSWpf_rendNone
5*ESS 0C
LSWP64RS0921.10.7.0
Page 2 of 2
20 Invesco Real Estate Fund
Sub-Advisers pursuant to the sub-advisorycontracts. The Board noted that InvescoAdvisers retains overall responsibility for,and provides services to, sub-advisedInvesco Funds, including oversight of theAffiliated Sub-Advisers as well as theadditional services described herein otherthan day-to-day portfolio management.D. Economies of Scale and Breakpoints
The Board considered the extent towhich there may be economies of scale inthe provision of advisory services to theFund and the Invesco Funds, and theextent to which such economies of scaleare shared with the Fund and the InvescoFunds. The Board considered that theFund benefits from economies of scalethrough contractual breakpoints in theFund’s advisory fee schedule, whichgenerally operate to reduce the Fund’sexpense ratio as it
realized by Invesco Advisers and theAffiliated Sub-Advisers as a result ofportfolio brokerage transactions executedthrough “soft dollar” arrangements. TheBoard noted that soft dollar arrangementsmay result in the Fund bearing costs topurchase research that may be used byInvesco Advisers or the AffiliatedSub-Advisers with other clients and mayreduce Invesco Advisers’ or the AffiliatedSub-Advisers’ expenses. The Board alsoconsidered that it receives from InvescoAdvisers periodic reports that include arepresentation to the effect that thesearrangements are consistent with regulatoryrequirements. The Board did not deem thesoft dollar arrangements to be inappropriate.
The Board considered that the Fund’suninvested cash and cash collateral fromany securities lending

ˆ200F9gax2$6sakko_Š200F9gax2$6sakko_
209925 EDG 21INVESCOREAL ESTATE
28-Oct-2021 07:27 ESTHTMLAN
Donnelley Financial LSWpf_rendNone
4*ESS 0C
LSWP64RS3621.10.7.0
Page 1 of 1
(This page intentionally left blank)

ˆ200F9gax2$6scepGZŠ200F9gax2$6scepGZ
209925 EDG 22INVESCOREAL ESTATE
28-Oct-2021 07:27 ESTHTMLAN
Donnelley Financial LSWpf_rendNone
4*ESS 0C
LSWP64RS3621.10.7.0
Page 1 of 1
(This page intentionally left blank)

ˆ200F9gax2$6sh9nGÊ200F9gax2$6sh9nGˆ
209925 EDG 23INVESCOREAL ESTATE
28-Oct-2021 07:27 ESTHTMLAN
Donnelley Financial LSWpf_rendNone
4*ESS 0C
LSWP64RS3621.10.7.0
Page 1 of 1
(This page intentionally left blank)
ˆ200F9gax2$6skF1G3Š200F9gax2$6skF1G3
209925 EDG 24INVESCOREAL ESTATE
28-Oct-2021 07:27 ESTHTMLAN
Donnelley Financial LSWpf_rendNone
6*ESS 0C
LSWP64RS3621.10.7.0
dsp24dsp24a
Page 1 of 1
Go paperless with eDeliveryVisit invesco.com/edelivery to enjoy the convenience and security of anytime electronic access to your investmentdocuments. With eDelivery, you can elect to have any or all of the following materials delivered straight to your inbox todownload, save and print from your own computer:∎ Fund reports and prospectuses∎ Quarterly statements∎ Daily confirmations∎ Tax forms Invesco mailing informationSend general correspondence to Invesco Investment Services, Inc., P.O. Box 219078, Kansas City, MO 64121-9078. Important notice regarding delivery of security holder documentsTo reduce Fund expenses, only one copy of most shareholder documents may be mailed to shareholders with multipleaccounts at the same address (Householding). Mailing of your shareholder documents may be householded indefinitelyunless you instruct us otherwise. If you do not want the mailing of these documents to be combined with those for othermembers of your household, please contact Invesco Investment Services, Inc. at 800 959 4246 or contact your financialinstitution. We will begin sending you individual copies for each account within 30 days after receiving your request. Fund holdings and proxy voting informationThe Fund provides a complete list of its portfolio holdings four times each fiscal year, at the end of each fiscal quarter. For thesecond and fourth quarters, the list appears, respectively, in the Fund’s semiannual and annual reports to shareholders. Forthe first and third quarters, the Fund files the list with the Securities and Exchange Commission (SEC) as an exhibit to itsreports on Form N-PORT. The most recent list of portfolio holdings is available at invesco.com/completeqtrholdings.Shareholders can also look up the Fund’s Form N-PORT filings on the SEC website, sec.gov. The SEC file numbers for theFund are shown below.
A description of the policies and procedures that the Fund uses to determine how to vote proxies relating to portfoliosecurities is available without charge, upon request, from our Client Services department at 800 959 4246, or at invesco.com/corporate/about-us/esg. The information is also available on the SEC website, sec.gov.
Information regarding how the Fund voted proxies related to its portfolio securities during the most recent 12-month periodended June 30 is available at invesco.com/proxysearch. This information is also available on the SEC website, sec.gov.
Invesco Advisers, Inc. is an investment adviser; it provides investment advisory services to individual and institutionalclients and does not sell securities. Invesco Distributors, Inc. is the US distributor for Invesco Ltd.’s retail mutual funds,exchange-traded funds and institutional money market funds. Both are wholly owned, indirect subsidiaries of Invesco Ltd.
SEC file number(s): 811-05686 and 033-39519 Invesco Distributors, Inc. REA-SAR-1
ˆ200F9gb%6WXDkLVofŠ200F9gb%6WXDkLVof
209927 EDG 1INVESCOSHORT DURATION INFLA
28-Oct-2021 08:48 ESTHTMDTF
Donnelley Financial LSWkumaacapNone
8*ESS 0C
VDI-W10-DPF-28621.7.8.0
dsp1
Page 1 of 1
Semiannual Report to Shareholders August 31, 2021
Invesco Short Duration Inflation Protected Fund Nasdaq:A: LMTAX ∎ A2: SHTIX ∎ Y: LMTYX ∎ R5: ALMIX ∎ R6: SDPSX
2 Fund Performance4 Liquidity Risk Management Program5 Schedule of Investments7 Financial Statements10 Financial Highlights11 Notes to Financial Statements15 Fund Expenses16 Approval of Investment Advisory and Sub-Advisory Contracts
For the most current month-end Fund performance and commentary, please visit invesco.com/performance.Unless otherwise noted, all data provided by Invesco.This report must be accompanied or preceded by a currently effective Fund prospectus, which contains more complete information, includingsales charges and expenses. Investors should read it carefully before investing.
NOT FDIC INSURED | MAY LOSE VALUE | NO BANK GUARANTEE
ˆ200F9gb%6WXDno9GGŠ200F9gb%6WXDno9GG
209927 EDG 2INVESCOSHORT DURATION INFLA
28-Oct-2021 08:49 ESTHTMDTF
Donnelley Financial LSWkumaacapNone
8*ESS 0C
VDI-W10-DPF-28621.7.8.0
Page 1 of 1
Fund Performance
Performance summary
Fund vs. Indexes Cumulative total returns, 2/28/21 to 8/31/21, at net asset value (NAV). Performance shown does not includeapplicable contingent deferred sales charges (CDSC) or front-end sales charges, which would havereduced performance.
Class A Shares 3.45% Class A2 Shares 3.50 Class Y Shares 3.58 Class R5 Shares 3.67 Class R6 Shares 3.59 ICE BofA 1-5 Year US Inflation-Linked Treasury Index▼ (Broad Market/Style-SpecificIndex) 3.97 Lipper Inflation Protected Bond Funds Index∎ (Peer Group Index) 5.10 Source(s): ▼RIMES Technologies Corp.; ∎Lipper Inc.
The ICE BofA 1-5 Year US Inflation-Linked Treasury Index is composed of US Treasury Inflation-Protected Securities with maturities between one and five years. The Lipper Inflation Protected Bond Funds Index is an unmanaged index consideredrepresentative of inflation protected bond funds tracked by Lipper. The Fund is not managed to track the performance of any particular index, including theindex(es) described here, and consequently, the performance of the Fund may deviatesignificantly from the performance of the index(es).
A direct investment cannot be made in an index. Unless otherwise indicated, index resultsinclude reinvested dividends, and they do not reflect sales charges. Performance of the peergroup, if applicable, reflects fund expenses; performance of a market index does not.
For more information about your Fund
Read the most recent quarterly commentary from your Fund’s portfolio managers by visitinginvesco.com/us. Click on “Products” and select “Mutual Funds.” Use the “Product Finder” to locate yourFund; then click on its name to access its product detail page. There, you can learn more about yourFund’s investment strategies, holdings and performance. Also, visit blog.invesco.us.com, where many of Invesco’s investment professionals share their insightsabout market and economic news and trends.
2 Invesco Short Duration Inflation Protected Fund
ˆ200F9gb%6WXDsM7G*Š200F9gb%6WXDsM7G*
209927 EDG 3INVESCOSHORT DURATION INFLA
28-Oct-2021 08:49 ESTHTMDTF
Donnelley Financial LSWkumaacapNone
7*ESS 0C
VDI-W10-DPF-28621.7.8.0
Page 1 of 1
3 Invesco Short Duration Inflation Protected Fund
Average Annual Total Returns As of 8/31/21, including maximum applicablesales charges
Class A Shares Inception (10/31/02) 1.69% 10 Years 1.30 5 Years 2.28 1 Year 2.48 Class A2 Shares Inception (12/15/87) 3.80% 10 Years 1.53 5 Years 2.70 1 Year 4.20 Class Y Shares Inception (10/3/08) 1.64% 10 Years 1.73 5 Years 3.07 1 Year 5.42 Class R5 Shares Inception (7/13/87) 4.04% 10 Years 1.74 5 Years 3.07 1 Year 5.42 Class R6 Shares 10 Years 1.73% 5 Years 3.11 1 Year 5.46
Class R6 shares incepted onDecember 31, 2015. Performance shownprior to that date is that of Class A2shares at net asset value and includesthe 12b-1 fees applicable to Class A2shares. The performance data quotedrepresent past performance and cannotguarantee future results; currentperformance may be lower or higher.Please visit invesco.com/performancefor the most recent month-endperformance. Performance figuresreflect reinvested distributions,changes in net asset value and theeffect of the maximum sales chargeunless otherwise stated. Performancefigures do not reflect deduction of taxesa shareholder would pay on Funddistributions or sale of Fund shares.Investment return and principal valuewill fluctuate so that you may have again or loss when you sell shares. Class A share performance reflectsthe maximum 2.50% sales charge.Class A2 share performance reflects themaximum 1.00% sales charge. Class Y,Class R5 and Class R6 shares do nothave a front-end sales charge or aCDSC; therefore, performance is at netasset value. The performance of the Fund’s shareclasses will differ primarily due todifferent sales charge structures andclass expenses. Fund performance reflects anyapplicable fee waivers and/or expensereimbursements. Had the adviser notwaived fees and/or reimbursedexpenses currently or in the past,returns would have been lower. Seecurrent prospectus for moreinformation.
ˆ200F9gb%6WXF6zZGwŠ200F9gb%6WXF6zZGw
209927 EDG 4INVESCOSHORT DURATION INFLA
28-Oct-2021 08:49 ESTHTMDTF
Donnelley Financial LSWkumaacapNone
8*ESS 0C
VDI-W10-DPF-28621.7.8.0
Page 1 of 1
4 Invesco Short Duration Inflation Protected Fund
Liquidity Risk ManagementProgram
In compliance with Rule 22e-4 under theInvestment Company Act of 1940, asamended (the “Liquidity Rule”), the Fundhas adopted and implemented a liquidityrisk management program inaccordance with the Liquidity Rule (the“Program”). The Program is reasonablydesigned to assess and manage theFund’s liquidity risk, which is the risk thatthe Fund could not meet redemptionrequests without significant dilution ofremaining investors’ interests in theFund. The Board of Trustees of the Fund(the “Board”) has appointed InvescoAdvisers, Inc. (“Invesco”), the Fund’sinvestment adviser, as the Program’sadministrator, and Invesco hasdelegated oversight of the Program tothe Liquidity Risk ManagementCommittee (the “Committee”), which iscomposed of senior representatives fromrelevant business groups at Invesco.
As required by the Liquidity Rule, theProgram includes policies andprocedures providing for an assessment,no less frequently than annually, of theFund’s liquidity risk that takes intoaccount, as relevant to the Fund’sliquidity risk: (1) the Fund’s investmentstrategy and liquidity of portfolioinvestments during both normal andreasonably foreseeable stressedconditions; (2) short-term and long-termcash flow projections for the Fund duringboth normal and reasonably foreseeablestressed conditions; and (3) the Fund’sholdings of cash and cash equivalentsand any borrowing arrangements. TheLiquidity Rule also requires theclassification of the Fund’s investmentsinto categories that reflect theassessment of their relative liquidityunder current market conditions. TheFund classifies its investments into oneof four categories defined in the LiquidityRule: “Highly Liquid,” “ModeratelyLiquid,” “Less Liquid,” and “Illiquid.”Funds that are not invested primarily in“Highly Liquid Investments” that areassets (cash or investments that arereasonably expected to be convertibleinto cash within three business dayswithout significantly changing the marketvalue of the investment) are required toestablish a “Highly Liquid InvestmentMinimum” (“HLIM”), which is theminimum percentage of net assets thatmust be invested in Highly LiquidInvestments. Funds with HLIMs haveprocedures for addressing HLIMshortfalls, including reporting to theBoard and the SEC (on a non-publicbasis) as required by the Program andthe Liquidity Rule. In addition, the Fundmay not acquire an investment if,immediately after the acquisition, over15% of the Fund’s net assets wouldconsist of “Illiquid Investments” that areassets (an investment that cannotreasonably be expected to be sold ordisposed of in current market conditionsin seven calendar days or less
without the sale or disposition significantlychanging the market value of theinvestment). The Liquidity Rule and theProgram also require reporting to theBoard and the SEC (on a non-publicbasis) if a Fund’s holdings of IlliquidInvestments exceed 15% of the Fund’sassets.
At a meeting held on March 22-24, 2021,the Committee presented a report to theBoard that addressed the operation of theProgram and assessed the Program’sadequacy and effectiveness ofimplementation (the “Report”). The Reportcovered the period from January 1, 2020through December 31, 2020 (the“Program Reporting Period”). The Reportdiscussed notable events affectingliquidity over the Program ReportingPeriod, including the impact of thecoronavirus pandemic on the Fund andthe overall market. The Report noted thatthere were no material changes to theProgram during the Program ReportingPeriod.The Report stated, in relevant part, thatduring the Program Reporting Period:
∎ The Program, as adopted andimplemented, remained reasonablydesigned to assess and manage theFund’s liquidity risk and was operatedeffectively to achieve that goal;
∎ The Fund’s investment strategy remainedappropriate for an open-end fund;
∎ The Fund was able to meet requests forredemption without significant dilution ofremaining investors’ interests in the Fund;
∎ The Fund did not breach the 15% limit onIlliquid Investments; and
∎ The Fund primarily held Highly LiquidInvestments and therefore has notadopted an HLIM.
ˆ200F9gb%6WXFXJkG)Š200F9gb%6WXFXJkG)
209927 EDG 5INVESCOSHORT DURATION INFLA
28-Oct-2021 08:49 ESTHTMDTF
Donnelley Financial LSWkumaacapNone
10*ESS 0C
VDI-W10-DPF-28621.7.8.0
Page 1 of 1
Schedule of InvestmentsAugust 31, 2021(Unaudited)
Interest
Rate Maturity
Date
PrincipalAmount
(000) Value
U.S. Treasury Securities–99.87% U.S. Treasury Inflation – Indexed Notes–99.87%(a) U.S. Treasury Inflation - Indexed Notes 0.13% 01/15/2023 $ 38,385 $ 39,826,513
U.S. Treasury Inflation - Indexed Notes 0.62% 04/15/2023 40,927 42,996,795
U.S. Treasury Inflation - Indexed Notes 0.37% 07/15/2023 38,061 40,236,689
U.S. Treasury Inflation - Indexed Notes 0.62% 01/15/2024 38,155 40,882,723
U.S. Treasury Inflation - Indexed Notes 0.50% 04/15/2024 27,585 29,596,598
U.S. Treasury Inflation - Indexed Notes 0.13% 07/15/2024 37,345 40,081,417
U.S. Treasury Inflation - Indexed Notes 0.13% 10/15/2024 29,636 31,857,998
U.S. Treasury Inflation - Indexed Notes 0.25 - 2.37% 01/15/2025 69,729 77,841,031
U.S. Treasury Inflation - Indexed Notes 0.13% 04/15/2025 29,791 32,160,963
U.S. Treasury Inflation - Indexed Notes 0.37% 07/15/2025 37,462 41,161,248
U.S. Treasury Inflation - Indexed Notes 0.13% 10/15/2025 28,516 31,120,806
U.S. Treasury Inflation - Indexed Notes 0.62 - 2.00% 01/15/2026 60,699 69,001,842
U.S. Treasury Inflation - Indexed Notes 0.13% 04/15/2026 33,427 36,534,821
U.S. Treasury Inflation - Indexed Notes 0.13% 07/15/2026 33,201 36,586,594
Total U.S. Treasury Securities (Cost $567,014,879) 589,886,038
Shares
Money Market Funds–0.09% Invesco Government & Agency Portfolio, Institutional Class, 0.03%(b)(c) 187,137 187,137
Invesco Liquid Assets Portfolio, Institutional Class, 0.01%(b)(c) 133,601 133,655
Invesco Treasury Portfolio, Institutional Class, 0.01%(b)(c) 213,870 213,870
Total Money Market Funds (Cost $534,662) 534,662
TOTAL INVESTMENTS IN SECURITIES–99.96% (Cost $567,549,541) 590,420,700
OTHER ASSETS LESS LIABILITIES–0.04% 215,540
NET ASSETS–100.00% $590,636,240
Notes to Schedule of Investments:
(a) Principal amount of security and interest payments are adjusted for inflation. See Note 1H.(b) Affiliated issuer. The issuer and/or the Fund is a wholly-owned subsidiary of Invesco Ltd., or is affiliated by having an investment adviser
that is under common control of Invesco Ltd. The table below shows the Fund’s transactions in, and earnings from, its investments inaffiliates for the six months ended August 31, 2021.
Change in Value Purchases Proceeds Unrealized Realized Value February 28, 2021 at Cost from Sales Appreciation Gain August 31, 2021 Dividend Income
Investmentsin AffiliatedMoneyMarketFunds:
InvescoGovernment &AgencyPortfolio,InstitutionalClass $198,866 $15,066,812 $(15,078,541) $- $- $187,137 $32
Invesco LiquidAssetsPortfolio,InstitutionalClass 142,011 10,583,559 (10,591,915) - - 133,655 10
InvescoTreasuryPortfolio,InstitutionalClass 227,275 17,219,214 (17,232,619) - - 213,870 14
Total $568,152 $42,869,585 $(42,903,075) $- $- $534,662 $56
(c) The rate shown is the 7-day SEC standardized yield as of August 31, 2021.
See accompanying Notes to Financial Statements which are an integral part of the financial statements.
5 Invesco Short Duration Inflation Protected Fund

ˆ200F9gb%6WXFgdvoBŠ200F9gb%6WXFgdvoB
209927 EDG 6INVESCOSHORT DURATION INFLA
28-Oct-2021 08:49 ESTHTMDTF
Donnelley Financial LSWkumaacapNone
6*ESS 0C
VDI-W10-DPF-28621.7.8.0
Page 1 of 1
Portfolio CompositionBy U.S. Treasury Securitiesas of August 31, 2021
See accompanying Notes to Financial Statements which are an integral part of the financial statements.
6 Invesco Short Duration Inflation Protected Fund
Coupon % of TotalMaturity Date Rate Net Assets1/15/2023 0.13% 6.74%4/15/2023 0.62 7.287/15/2023 0.37 6.811/15/2024 0.62 6.924/15/2024 0.50 5.017/15/2024 0.13 6.7910/15/2024 0.13 5.391/15/2025 2.37 6.331/15/2025 0.25 6.854/15/2025 0.13 5.457/15/2025 0.37 6.9710/15/2025 0.13 5.271/15/2026 0.62 7.351/15/2026 2.00 4.334/15/2026 0.13 6.197/15/2026 0.13 6.19Other Assets Less Liabilities 0.13
ˆ200F9gb%6WXFkR%o]Š200F9gb%6WXFkR%o]
209927 EDG 7INVESCOSHORT DURATION INFLA
28-Oct-2021 08:49 ESTHTMDTF
Donnelley Financial LSWkumaacapNone
7*ESS 0C
VDI-W10-DPF-28621.7.8.0
Page 1 of 1
Statement of Assets and LiabilitiesAugust 31, 2021(Unaudited)
See accompanying Notes to Financial Statements which are an integral part of the financial statements.
7 Invesco Short Duration Inflation Protected Fund
Assets: Investments in unaffiliated securities, at value
(Cost $567,014,879) $589,886,038
Investments in affiliated money market funds, atvalue(Cost $534,662) 534,662
Receivable for: Fund shares sold 465,945
Dividends 4
Interest 493,675
Investment for trustee deferred compensationand retirement plans 105,152
Other assets 64,340
Total assets 591,549,816
Liabilities: Payable for:
Fund shares reacquired 604,919
Accrued fees to affiliates 57,159
Accrued trustees’ and officers’ fees andbenefits 1,277
Accrued other operating expenses 135,369
Trustee deferred compensation and retirementplans 114,852
Total liabilities 913,576
Net assets applicable to shares outstanding $590,636,240
Net assets consist of: Shares of beneficial interest $569,160,369
Distributable earnings 21,475,871
$590,636,240
Net Assets: Class A $104,359,330
Class A2 $ 14,912,441
Class Y $ 50,281,149
Class R5 $ 15,029,028
Class R6 $406,054,292
Shares outstanding, no par value, with an unlimited number ofshares authorized:
Class A 9,355,389
Class A2 1,335,343
Class Y 4,500,932
Class R5 1,345,807
Class R6 36,358,753
Class A: Net asset value per share $ 11.15
Maximum offering price per share(Net asset value of $11.15 ÷ 97.50%) $ 11.44
Class A2: Net asset value per share $ 11.17
Maximum offering price per share(Net asset value of $11.17 ÷ 99.00%) $ 11.28
Class Y: Net asset value and offering price per share $ 11.17
Class R5: Net asset value and offering price per share $ 11.17
Class R6: Net asset value and offering price per share $ 11.17
ˆ200F9gb%6WXFpPRG>Š200F9gb%6WXFpPRG>
209927 EDG 8INVESCOSHORT DURATION INFLA
28-Oct-2021 08:49 ESTHTMDTF
Donnelley Financial LSWkumaacapNone
7*ESS 0C
VDI-W10-DPF-28621.7.8.0
Page 1 of 1
Statement of OperationsFor the six months ended August 31, 2021(Unaudited) Investment income: Treasury Inflation-Protected Securities inflation adjustments $20,683,019
Dividends from affiliated money market funds 56
Total investment income 20,683,075
Expenses: Advisory fees 558,642
Administrative services fees 38,216
Custodian fees 1,260
Distribution fees:
Class A 112,991
Class A2 11,754
Transfer agent fees – A, A2, and Y 81,357
Transfer agent fees – R5 2,330
Transfer agent fees – R6 4,311
Trustees’ and officers’ fees and benefits 13,125
Registration and filing fees 49,097
Licensing fees 36,639
Reports to shareholders 17,110
Professional services fees 19,561
Other 8,642
Total expenses 955,035
Less: Fees waived, expenses reimbursed and/or expense offset arrangement(s) (53,915)
Net expenses 901,120
Net investment income 19,781,955
Realized and unrealized gain (loss) from: Net realized gain from unaffiliated investment securities 2,109,548
Change in net unrealized appreciation (depreciation) of unaffiliated investment securities (2,127,587)
Net realized and unrealized gain (loss) (18,039)
Net increase in net assets resulting from operations $19,763,916
See accompanying Notes to Financial Statements which are an integral part of the financial statements.
8 Invesco Short Duration Inflation Protected Fund
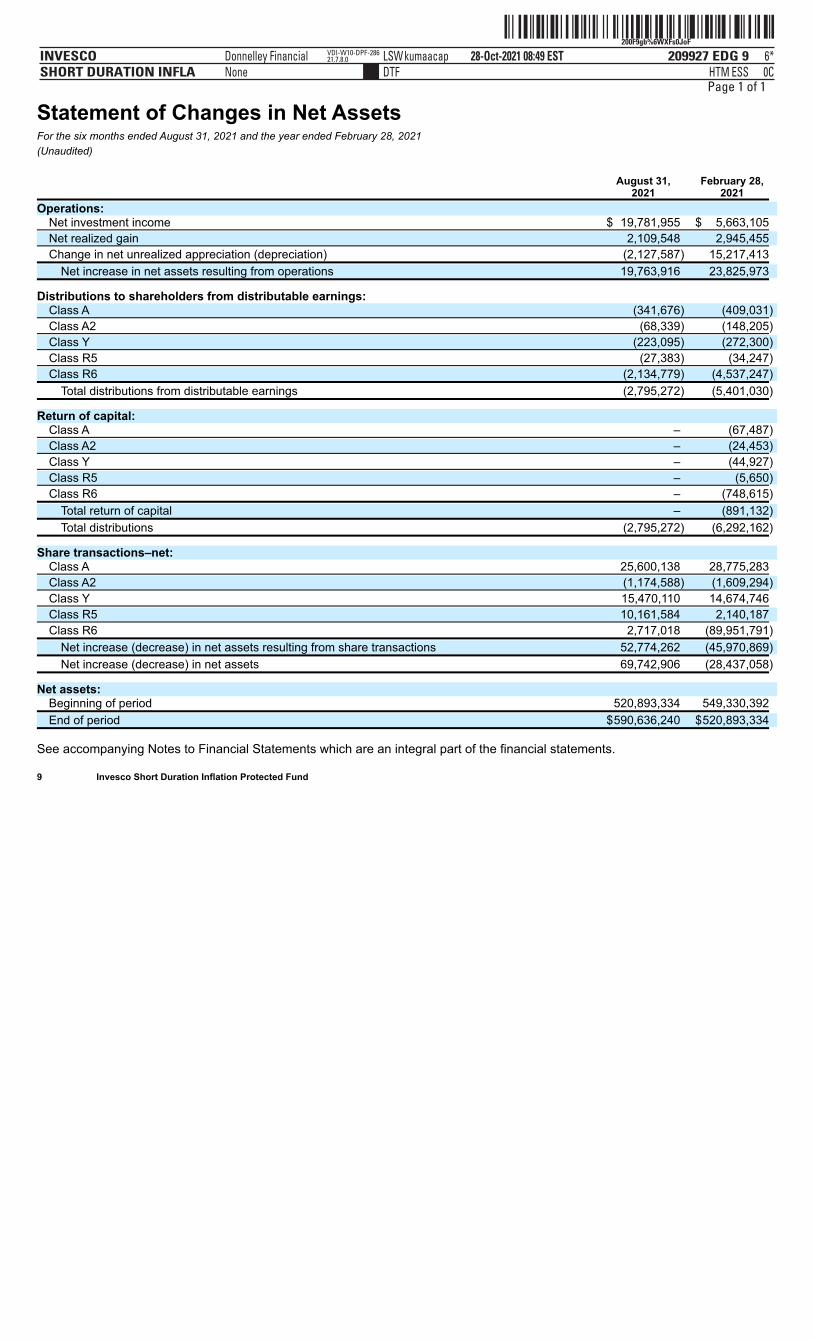
ˆ200F9gb%6WXFs0JoFŠ200F9gb%6WXFs0JoF
209927 EDG 9INVESCOSHORT DURATION INFLA
28-Oct-2021 08:49 ESTHTMDTF
Donnelley Financial LSWkumaacapNone
6*ESS 0C
VDI-W10-DPF-28621.7.8.0
Page 1 of 1
Statement of Changes in Net AssetsFor the six months ended August 31, 2021 and the year ended February 28, 2021(Unaudited) August 31, February 28, 2021 2021
Operations: Net investment income $ 19,781,955 $ 5,663,105
Net realized gain 2,109,548 2,945,455
Change in net unrealized appreciation (depreciation) (2,127,587) 15,217,413
Net increase in net assets resulting from operations 19,763,916 23,825,973
Distributions to shareholders from distributable earnings: Class A (341,676) (409,031)
Class A2 (68,339) (148,205)
Class Y (223,095) (272,300)
Class R5 (27,383) (34,247)
Class R6 (2,134,779) (4,537,247)
Total distributions from distributable earnings (2,795,272) (5,401,030)
Return of capital: Class A – (67,487)
Class A2 – (24,453)
Class Y – (44,927)
Class R5 – (5,650)
Class R6 – (748,615)
Total return of capital – (891,132)
Total distributions (2,795,272) (6,292,162)
Share transactions–net: Class A 25,600,138 28,775,283
Class A2 (1,174,588) (1,609,294)
Class Y 15,470,110 14,674,746
Class R5 10,161,584 2,140,187
Class R6 2,717,018 (89,951,791)
Net increase (decrease) in net assets resulting from share transactions 52,774,262 (45,970,869)
Net increase (decrease) in net assets 69,742,906 (28,437,058)
Net assets: Beginning of period 520,893,334 549,330,392
End of period $590,636,240 $520,893,334
See accompanying Notes to Financial Statements which are an integral part of the financial statements.
9 Invesco Short Duration Inflation Protected Fund
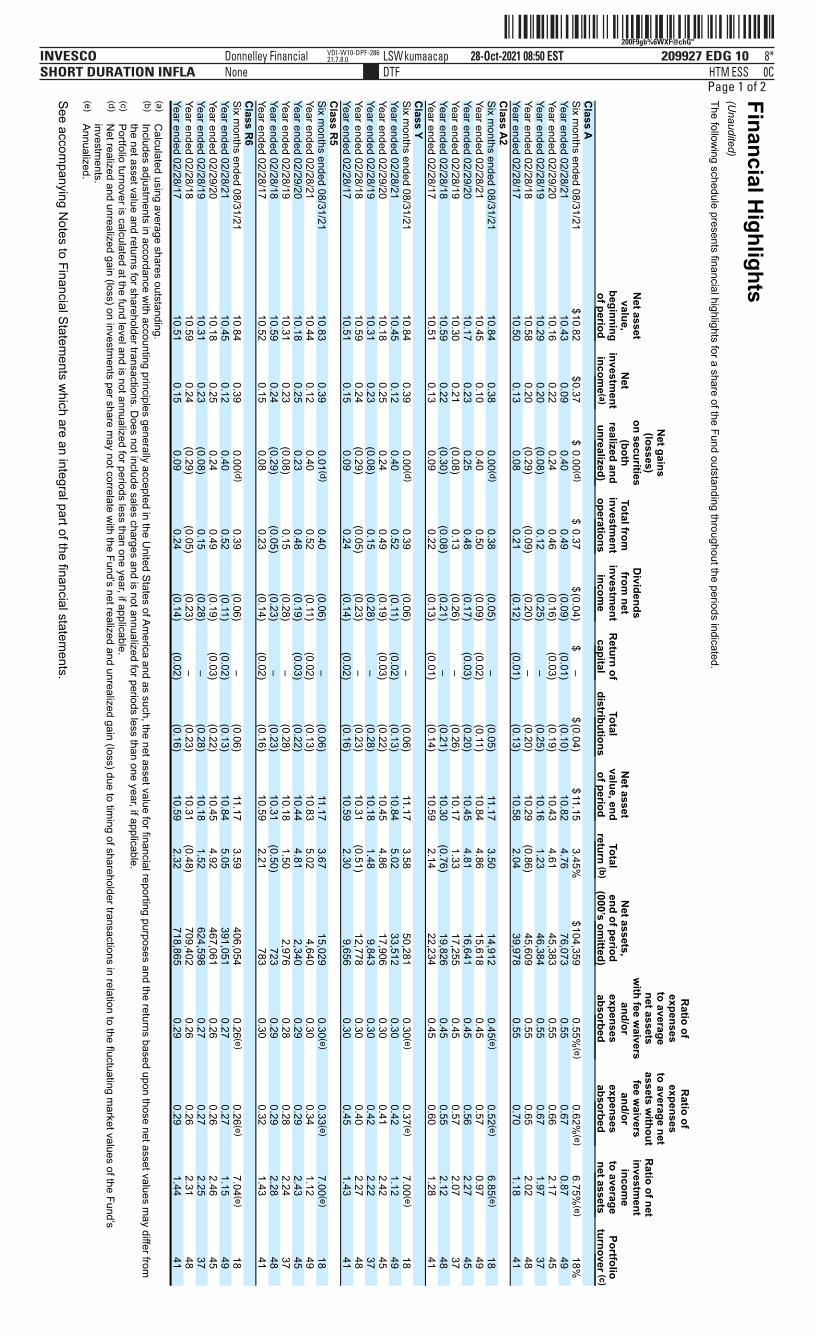
ˆ200F9gb%6WXF@chG"Š200F9gb%6WXF@chG"
209927 EDG 10INVESCOSHORT DURATION INFLA
28-Oct-2021 08:50 ESTHTMDTF
Donnelley Financial LSWkumaacapNone
8*ESS 0C
VDI-W10-DPF-28621.7.8.0
Page 1 of 2Financial Highlights
(Unaudited)
The following schedule presents financial highlights for a share of the Fund outstanding throughout the periods indicated.
Net assetvalue,
beginningof period
Net
investment
income (a)
Net gains
(losses)on securities
(bothrealized andunrealized)
Total frominvestm
entoperations
Dividends
from net
investment
income
R
eturn ofcapital
Total
distributions
Net asset
value, endof period
Total
return (b)
Net assets,
end of period(000’s om
itted)
Ratio of
expensesto averagenet assets
with fee w
aiversand/or
expensesabsorbed
Ratio of
expensesto average netassets w
ithoutfee w
aiversand/or
expensesabsorbed
Ratio of net
investment
income
to averagenet assets
Portfolio
turnover (c)C
lass A
Six m
onths ended 08/31/21
$10.82
$0.37
$0.00 (d)
$
0.37
$(0.04)
$
–
$(0.04)
$11.15
3.45%
$104,359
0.55%
(e)
0.62%(e)
6.75%
(e)
18%Year ended 02/28/21
10.43
0.09
0.40
0.49
(0.09)
(0.01)
(0.10)
10.82
4.76
76,073
0.55
0.67
0.87
49
Year ended 02/29/20
10.16
0.22
0.24
0.46
(0.16)
(0.03)
(0.19)
10.43
4.61
45,383
0.55
0.66
2.17
45Year ended 02/28/19
10.29
0.20
(0.08)
0.12
(0.25)
–
(0.25)
10.16
1.23
46,384
0.55
0.67
1.97
37Year ended 02/28/18
10.58
0.20
(0.29)
(0.09)
(0.20)
–
(0.20)
10.29
(0.86)
45,609
0.55
0.65
2.02
48Year ended 02/28/17
10.50
0.13
0.08
0.21
(0.12)
(0.01)
(0.13)
10.58
2.04
39,978
0.55
0.70
1.18
41
Class A
2
Six m
onths ended 08/31/21
10.84
0.38
0.00 (d)
0.38
(0.05)
–
(0.05)
11.17
3.50
14,912
0.45 (e)
0.52 (e)
6.85 (e)
18
Year ended 02/28/21
10.45
0.10
0.40
0.50
(0.09)
(0.02)
(0.11)
10.84
4.86
15,618
0.45
0.57
0.97
49
Year ended 02/29/20
10.17
0.23
0.25
0.48
(0.17)
(0.03)
(0.20)
10.45
4.81
16,641
0.45
0.56
2.27
45Year ended 02/28/19
10.30
0.21
(0.08)
0.13
(0.26)
–
(0.26)
10.17
1.33
17,255
0.45
0.57
2.07
37Year ended 02/28/18
10.59
0.22
(0.30)
(0.08)
(0.21)
–
(0.21)
10.30
(0.76)
19,826
0.45
0.55
2.12
48Year ended 02/28/17
10.51
0.13
0.09
0.22
(0.13)
(0.01)
(0.14)
10.59
2.14
22,234
0.45
0.60
1.28
41
Class Y
Six months ended 08/31/21
10.84
0.39
0.00 (d)
0.39
(0.06)
–
(0.06)
11.17
3.58
50,281
0.30 (e)
0.37 (e)
7.00 (e)
18Year ended 02/28/21
10.45
0.12
0.40
0.52
(0.11)
(0.02)
(0.13)
10.84
5.02
33,512
0.30
0.42
1.12
49Year ended 02/29/20
10.18
0.25
0.24
0.49
(0.19)
(0.03)
(0.22)
10.45
4.86
17,906
0.30
0.41
2.42
45
Year ended 02/28/19
10.31
0.23
(0.08)
0.15
(0.28)
–
(0.28)
10.18
1.48
9,843
0.30
0.42
2.22
37
Year ended 02/28/18
10.59
0.24
(0.29)
(0.05)
(0.23)
–
(0.23)
10.31
(0.51)
12,778
0.30
0.40
2.27
48
Year ended 02/28/17
10.51
0.15
0.09
0.24
(0.14)
(0.02)
(0.16)
10.59
2.30
9,656
0.30
0.45
1.43
41C
lass R5
Six months ended 08/31/21
10.83
0.39
0.01 (d)
0.40
(0.06)
–
(0.06)
11.17
3.67
15,029
0.30 (e)
0.33 (e)
7.00 (e)
18Year ended 02/28/21
10.44
0.12
0.40
0.52
(0.11)
(0.02)
(0.13)
10.83
5.02
4,640
0.30
0.34
1.12
49Year ended 02/29/20
10.18
0.25
0.23
0.48
(0.19)
(0.03)
(0.22)
10.44
4.81
2,340
0.29
0.29
2.43
45
Year ended 02/28/19
10.31
0.23
(0.08)
0.15
(0.28)
–
(0.28)
10.18
1.50
2,976
0.28
0.28
2.24
37
Year ended 02/28/18
10.59
0.24
(0.29)
(0.05)
(0.23)
–
(0.23)
10.31
(0.50)
723
0.29
0.29
2.28
48
Year ended 02/28/17
10.52
0.15
0.08
0.23
(0.14)
(0.02)
(0.16)
10.59
2.21
783
0.30
0.32
1.43
41C
lass R6
Six months ended 08/31/21
10.84
0.39
0.00 (d)
0.39
(0.06)
–
(0.06)
11.17
3.59
406,054
0.26 (e)
0.26 (e)
7.04 (e)
18
Year ended 02/28/21
10.45
0.12
0.40
0.52
(0.11)
(0.02)
(0.13)
10.84
5.05
391,051
0.27
0.27
1.15
49Year ended 02/29/20
10.18
0.25
0.24
0.49
(0.19)
(0.03)
(0.22)
10.45
4.92
467,061
0.26
0.26
2.46
45Year ended 02/28/19
10.31
0.23
(0.08)
0.15
(0.28)
–
(0.28)
10.18
1.52
624,598
0.27
0.27
2.25
37
Year ended 02/28/18
10.59
0.24
(0.29)
(0.05)
(0.23)
–
(0.23)
10.31
(0.48)
709,402
0.26
0.26
2.31
48Year ended 02/28/17
10.51
0.15
0.09
0.24
(0.14)
(0.02)
(0.16)
10.59
2.32
718,865
0.29
0.29
1.44
41 (a)
Calculated using average shares outstanding.
(b) Includes adjustm
ents in accordance with accounting principles generally accepted in the U
nited States of America and as such, the net asset value for financial reporting purposes and the returns based upon those net asset values m
ay differ fromthe net asset value and returns for shareholder transactions. D
oes not include sales charges and is not annualized for periods less than one year, if applicable.(c)
Portfolio turnover is calculated at the fund level and is not annualized for periods less than one year, if applicable.(d)
Net realized and unrealized gain (loss) on investm
ents per share may not correlate w
ith the Fund’s net realized and unrealized gain (loss) due to timing of shareholder transactions in relation to the fluctuating m
arket values of the Fund’sinvestm
ents.(e)
Annualized. See accom
panying Notes to Financial Statem
ents which are an integral part of the financial statem
ents.

ˆ200F9gb%6WXF@chG"Š200F9gb%6WXF@chG"
209927 EDG 10INVESCOSHORT DURATION INFLA
28-Oct-2021 08:50 ESTHTMDTF
Donnelley Financial LSWkumaacapNone
8*ESS 0C
VDI-W10-DPF-28621.7.8.0
ˆ200F9gb%6WXF@chG"Š200F9gb%6WXF@chG"
209927 EDG 10INVESCOSHORT DURATION INFLA
28-Oct-2021 08:50 ESTHTMDTF
Donnelley Financial LSWkumaacapNone
8*ESS 0C
VDI-W10-DPF-28621.7.8.0
Page 2 of 2
10 Invesco Short Duration Inflation Protected Fund
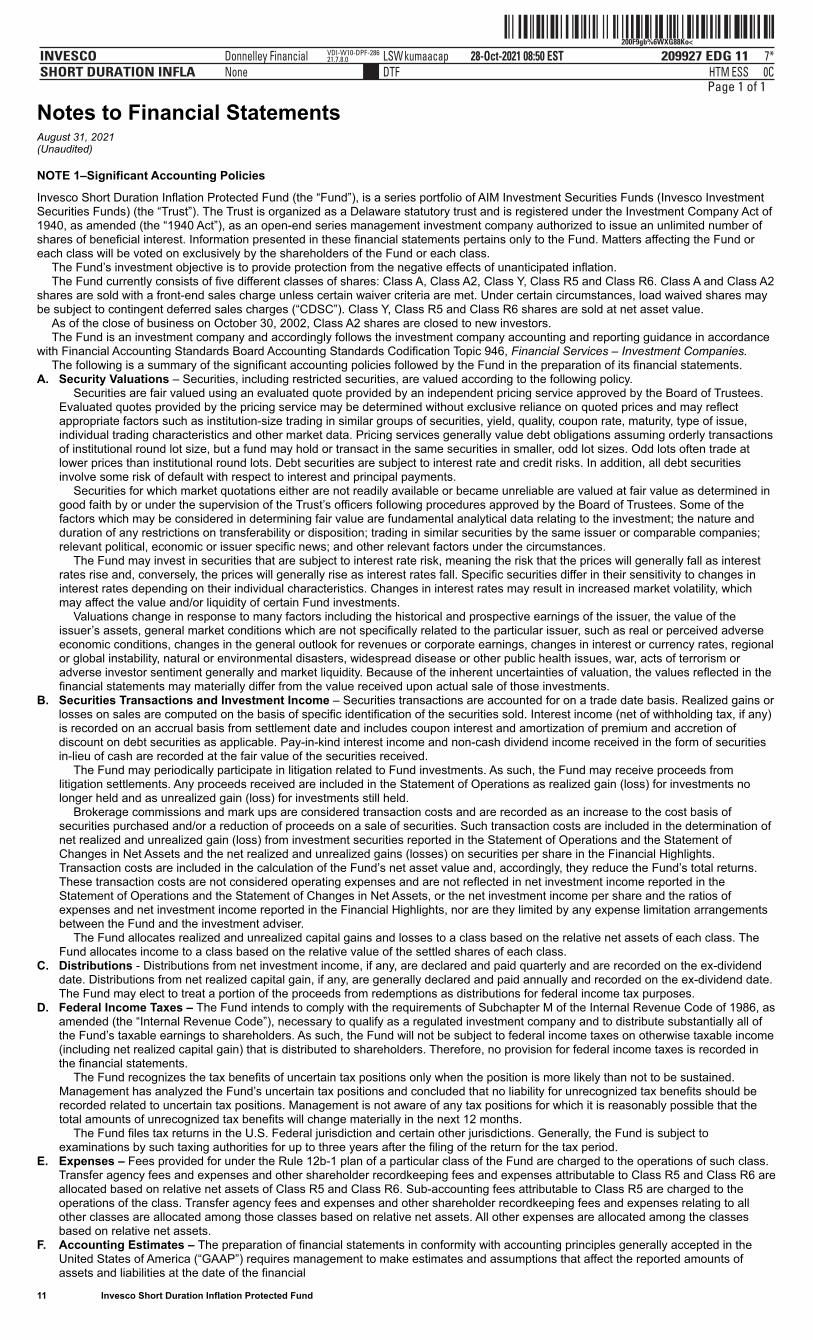
ˆ200F9gb%6WXG88Ko<Š200F9gb%6WXG88Ko<
209927 EDG 11INVESCOSHORT DURATION INFLA
28-Oct-2021 08:50 ESTHTMDTF
Donnelley Financial LSWkumaacapNone
7*ESS 0C
VDI-W10-DPF-28621.7.8.0
Page 1 of 1
Notes to Financial StatementsAugust 31, 2021(Unaudited)
NOTE 1–Significant Accounting Policies
Invesco Short Duration Inflation Protected Fund (the “Fund”), is a series portfolio of AIM Investment Securities Funds (Invesco InvestmentSecurities Funds) (the “Trust”). The Trust is organized as a Delaware statutory trust and is registered under the Investment Company Act of1940, as amended (the “1940 Act”), as an open-end series management investment company authorized to issue an unlimited number ofshares of beneficial interest. Information presented in these financial statements pertains only to the Fund. Matters affecting the Fund oreach class will be voted on exclusively by the shareholders of the Fund or each class.
The Fund’s investment objective is to provide protection from the negative effects of unanticipated inflation.The Fund currently consists of five different classes of shares: Class A, Class A2, Class Y, Class R5 and Class R6. Class A and Class A2
shares are sold with a front-end sales charge unless certain waiver criteria are met. Under certain circumstances, load waived shares maybe subject to contingent deferred sales charges (“CDSC”). Class Y, Class R5 and Class R6 shares are sold at net asset value.
As of the close of business on October 30, 2002, Class A2 shares are closed to new investors.The Fund is an investment company and accordingly follows the investment company accounting and reporting guidance in accordance
with Financial Accounting Standards Board Accounting Standards Codification Topic 946, Financial Services – Investment Companies.The following is a summary of the significant accounting policies followed by the Fund in the preparation of its financial statements.
A. Security Valuations – Securities, including restricted securities, are valued according to the following policy.Securities are fair valued using an evaluated quote provided by an independent pricing service approved by the Board of Trustees.
Evaluated quotes provided by the pricing service may be determined without exclusive reliance on quoted prices and may reflectappropriate factors such as institution-size trading in similar groups of securities, yield, quality, coupon rate, maturity, type of issue,individual trading characteristics and other market data. Pricing services generally value debt obligations assuming orderly transactionsof institutional round lot size, but a fund may hold or transact in the same securities in smaller, odd lot sizes. Odd lots often trade atlower prices than institutional round lots. Debt securities are subject to interest rate and credit risks. In addition, all debt securitiesinvolve some risk of default with respect to interest and principal payments.
Securities for which market quotations either are not readily available or became unreliable are valued at fair value as determined ingood faith by or under the supervision of the Trust’s officers following procedures approved by the Board of Trustees. Some of thefactors which may be considered in determining fair value are fundamental analytical data relating to the investment; the nature andduration of any restrictions on transferability or disposition; trading in similar securities by the same issuer or comparable companies;relevant political, economic or issuer specific news; and other relevant factors under the circumstances.
The Fund may invest in securities that are subject to interest rate risk, meaning the risk that the prices will generally fall as interestrates rise and, conversely, the prices will generally rise as interest rates fall. Specific securities differ in their sensitivity to changes ininterest rates depending on their individual characteristics. Changes in interest rates may result in increased market volatility, whichmay affect the value and/or liquidity of certain Fund investments.
Valuations change in response to many factors including the historical and prospective earnings of the issuer, the value of theissuer’s assets, general market conditions which are not specifically related to the particular issuer, such as real or perceived adverseeconomic conditions, changes in the general outlook for revenues or corporate earnings, changes in interest or currency rates, regionalor global instability, natural or environmental disasters, widespread disease or other public health issues, war, acts of terrorism oradverse investor sentiment generally and market liquidity. Because of the inherent uncertainties of valuation, the values reflected in thefinancial statements may materially differ from the value received upon actual sale of those investments.
B. Securities Transactions and Investment Income – Securities transactions are accounted for on a trade date basis. Realized gains orlosses on sales are computed on the basis of specific identification of the securities sold. Interest income (net of withholding tax, if any)is recorded on an accrual basis from settlement date and includes coupon interest and amortization of premium and accretion ofdiscount on debt securities as applicable. Pay-in-kind interest income and non-cash dividend income received in the form of securitiesin-lieu of cash are recorded at the fair value of the securities received.
The Fund may periodically participate in litigation related to Fund investments. As such, the Fund may receive proceeds fromlitigation settlements. Any proceeds received are included in the Statement of Operations as realized gain (loss) for investments nolonger held and as unrealized gain (loss) for investments still held.
Brokerage commissions and mark ups are considered transaction costs and are recorded as an increase to the cost basis ofsecurities purchased and/or a reduction of proceeds on a sale of securities. Such transaction costs are included in the determination ofnet realized and unrealized gain (loss) from investment securities reported in the Statement of Operations and the Statement ofChanges in Net Assets and the net realized and unrealized gains (losses) on securities per share in the Financial Highlights.Transaction costs are included in the calculation of the Fund’s net asset value and, accordingly, they reduce the Fund’s total returns.These transaction costs are not considered operating expenses and are not reflected in net investment income reported in theStatement of Operations and the Statement of Changes in Net Assets, or the net investment income per share and the ratios ofexpenses and net investment income reported in the Financial Highlights, nor are they limited by any expense limitation arrangementsbetween the Fund and the investment adviser.
The Fund allocates realized and unrealized capital gains and losses to a class based on the relative net assets of each class. TheFund allocates income to a class based on the relative value of the settled shares of each class.
C. Distributions - Distributions from net investment income, if any, are declared and paid quarterly and are recorded on the ex-dividenddate. Distributions from net realized capital gain, if any, are generally declared and paid annually and recorded on the ex-dividend date.The Fund may elect to treat a portion of the proceeds from redemptions as distributions for federal income tax purposes.
D. Federal Income Taxes – The Fund intends to comply with the requirements of Subchapter M of the Internal Revenue Code of 1986, asamended (the “Internal Revenue Code”), necessary to qualify as a regulated investment company and to distribute substantially all ofthe Fund’s taxable earnings to shareholders. As such, the Fund will not be subject to federal income taxes on otherwise taxable income(including net realized capital gain) that is distributed to shareholders. Therefore, no provision for federal income taxes is recorded inthe financial statements.
The Fund recognizes the tax benefits of uncertain tax positions only when the position is more likely than not to be sustained.Management has analyzed the Fund’s uncertain tax positions and concluded that no liability for unrecognized tax benefits should berecorded related to uncertain tax positions. Management is not aware of any tax positions for which it is reasonably possible that thetotal amounts of unrecognized tax benefits will change materially in the next 12 months.
The Fund files tax returns in the U.S. Federal jurisdiction and certain other jurisdictions. Generally, the Fund is subject toexaminations by such taxing authorities for up to three years after the filing of the return for the tax period.
E. Expenses – Fees provided for under the Rule 12b-1 plan of a particular class of the Fund are charged to the operations of such class.Transfer agency fees and expenses and other shareholder recordkeeping fees and expenses attributable to Class R5 and Class R6 areallocated based on relative net assets of Class R5 and Class R6. Sub-accounting fees attributable to Class R5 are charged to theoperations of the class. Transfer agency fees and expenses and other shareholder recordkeeping fees and expenses relating to allother classes are allocated among those classes based on relative net assets. All other expenses are allocated among the classesbased on relative net assets.
F. Accounting Estimates – The preparation of financial statements in conformity with accounting principles generally accepted in theUnited States of America (“GAAP”) requires management to make estimates and assumptions that affect the reported amounts ofassets and liabilities at the date of the financial
11 Invesco Short Duration Inflation Protected Fund
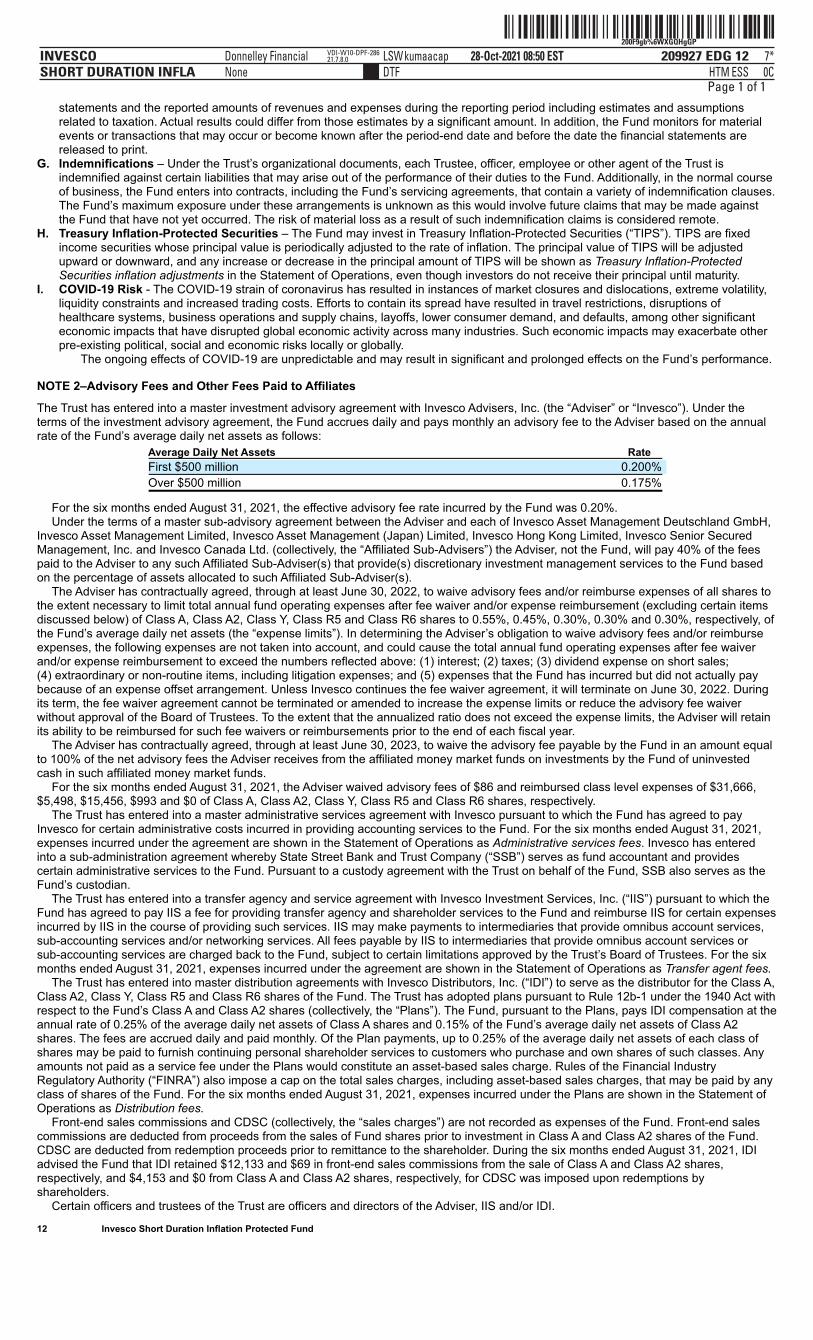
ˆ200F9gb%6WXGQHgGPŠ200F9gb%6WXGQHgGP
209927 EDG 12INVESCOSHORT DURATION INFLA
28-Oct-2021 08:50 ESTHTMDTF
Donnelley Financial LSWkumaacapNone
7*ESS 0C
VDI-W10-DPF-28621.7.8.0
Page 1 of 1
statements and the reported amounts of revenues and expenses during the reporting period including estimates and assumptionsrelated to taxation. Actual results could differ from those estimates by a significant amount. In addition, the Fund monitors for materialevents or transactions that may occur or become known after the period-end date and before the date the financial statements arereleased to print.
G. Indemnifications – Under the Trust’s organizational documents, each Trustee, officer, employee or other agent of the Trust isindemnified against certain liabilities that may arise out of the performance of their duties to the Fund. Additionally, in the normal courseof business, the Fund enters into contracts, including the Fund’s servicing agreements, that contain a variety of indemnification clauses.The Fund’s maximum exposure under these arrangements is unknown as this would involve future claims that may be made againstthe Fund that have not yet occurred. The risk of material loss as a result of such indemnification claims is considered remote.
H. Treasury Inflation-Protected Securities – The Fund may invest in Treasury Inflation-Protected Securities (“TIPS”). TIPS are fixedincome securities whose principal value is periodically adjusted to the rate of inflation. The principal value of TIPS will be adjustedupward or downward, and any increase or decrease in the principal amount of TIPS will be shown as Treasury Inflation-ProtectedSecurities inflation adjustments in the Statement of Operations, even though investors do not receive their principal until maturity.
I. COVID-19 Risk - The COVID-19 strain of coronavirus has resulted in instances of market closures and dislocations, extreme volatility,liquidity constraints and increased trading costs. Efforts to contain its spread have resulted in travel restrictions, disruptions ofhealthcare systems, business operations and supply chains, layoffs, lower consumer demand, and defaults, among other significanteconomic impacts that have disrupted global economic activity across many industries. Such economic impacts may exacerbate otherpre-existing political, social and economic risks locally or globally.
The ongoing effects of COVID-19 are unpredictable and may result in significant and prolonged effects on the Fund’s performance.
NOTE 2–Advisory Fees and Other Fees Paid to Affiliates
The Trust has entered into a master investment advisory agreement with Invesco Advisers, Inc. (the “Adviser” or “Invesco”). Under theterms of the investment advisory agreement, the Fund accrues daily and pays monthly an advisory fee to the Adviser based on the annualrate of the Fund’s average daily net assets as follows:
Average Daily Net Assets Rate
First $500 million 0.200%
Over $500 million 0.175%
For the six months ended August 31, 2021, the effective advisory fee rate incurred by the Fund was 0.20%.Under the terms of a master sub-advisory agreement between the Adviser and each of Invesco Asset Management Deutschland GmbH,
Invesco Asset Management Limited, Invesco Asset Management (Japan) Limited, Invesco Hong Kong Limited, Invesco Senior SecuredManagement, Inc. and Invesco Canada Ltd. (collectively, the “Affiliated Sub-Advisers”) the Adviser, not the Fund, will pay 40% of the feespaid to the Adviser to any such Affiliated Sub-Adviser(s) that provide(s) discretionary investment management services to the Fund basedon the percentage of assets allocated to such Affiliated Sub-Adviser(s).
The Adviser has contractually agreed, through at least June 30, 2022, to waive advisory fees and/or reimburse expenses of all shares tothe extent necessary to limit total annual fund operating expenses after fee waiver and/or expense reimbursement (excluding certain itemsdiscussed below) of Class A, Class A2, Class Y, Class R5 and Class R6 shares to 0.55%, 0.45%, 0.30%, 0.30% and 0.30%, respectively, ofthe Fund’s average daily net assets (the “expense limits”). In determining the Adviser’s obligation to waive advisory fees and/or reimburseexpenses, the following expenses are not taken into account, and could cause the total annual fund operating expenses after fee waiverand/or expense reimbursement to exceed the numbers reflected above: (1) interest; (2) taxes; (3) dividend expense on short sales;(4) extraordinary or non-routine items, including litigation expenses; and (5) expenses that the Fund has incurred but did not actually paybecause of an expense offset arrangement. Unless Invesco continues the fee waiver agreement, it will terminate on June 30, 2022. Duringits term, the fee waiver agreement cannot be terminated or amended to increase the expense limits or reduce the advisory fee waiverwithout approval of the Board of Trustees. To the extent that the annualized ratio does not exceed the expense limits, the Adviser will retainits ability to be reimbursed for such fee waivers or reimbursements prior to the end of each fiscal year.
The Adviser has contractually agreed, through at least June 30, 2023, to waive the advisory fee payable by the Fund in an amount equalto 100% of the net advisory fees the Adviser receives from the affiliated money market funds on investments by the Fund of uninvestedcash in such affiliated money market funds.
For the six months ended August 31, 2021, the Adviser waived advisory fees of $86 and reimbursed class level expenses of $31,666,$5,498, $15,456, $993 and $0 of Class A, Class A2, Class Y, Class R5 and Class R6 shares, respectively.
The Trust has entered into a master administrative services agreement with Invesco pursuant to which the Fund has agreed to payInvesco for certain administrative costs incurred in providing accounting services to the Fund. For the six months ended August 31, 2021,expenses incurred under the agreement are shown in the Statement of Operations as Administrative services fees. Invesco has enteredinto a sub-administration agreement whereby State Street Bank and Trust Company (“SSB”) serves as fund accountant and providescertain administrative services to the Fund. Pursuant to a custody agreement with the Trust on behalf of the Fund, SSB also serves as theFund’s custodian.
The Trust has entered into a transfer agency and service agreement with Invesco Investment Services, Inc. (“IIS”) pursuant to which theFund has agreed to pay IIS a fee for providing transfer agency and shareholder services to the Fund and reimburse IIS for certain expensesincurred by IIS in the course of providing such services. IIS may make payments to intermediaries that provide omnibus account services,sub-accounting services and/or networking services. All fees payable by IIS to intermediaries that provide omnibus account services orsub-accounting services are charged back to the Fund, subject to certain limitations approved by the Trust’s Board of Trustees. For the sixmonths ended August 31, 2021, expenses incurred under the agreement are shown in the Statement of Operations as Transfer agent fees.
The Trust has entered into master distribution agreements with Invesco Distributors, Inc. (“IDI”) to serve as the distributor for the Class A,Class A2, Class Y, Class R5 and Class R6 shares of the Fund. The Trust has adopted plans pursuant to Rule 12b-1 under the 1940 Act withrespect to the Fund’s Class A and Class A2 shares (collectively, the “Plans”). The Fund, pursuant to the Plans, pays IDI compensation at theannual rate of 0.25% of the average daily net assets of Class A shares and 0.15% of the Fund’s average daily net assets of Class A2shares. The fees are accrued daily and paid monthly. Of the Plan payments, up to 0.25% of the average daily net assets of each class ofshares may be paid to furnish continuing personal shareholder services to customers who purchase and own shares of such classes. Anyamounts not paid as a service fee under the Plans would constitute an asset-based sales charge. Rules of the Financial IndustryRegulatory Authority (“FINRA”) also impose a cap on the total sales charges, including asset-based sales charges, that may be paid by anyclass of shares of the Fund. For the six months ended August 31, 2021, expenses incurred under the Plans are shown in the Statement ofOperations as Distribution fees.
Front-end sales commissions and CDSC (collectively, the “sales charges”) are not recorded as expenses of the Fund. Front-end salescommissions are deducted from proceeds from the sales of Fund shares prior to investment in Class A and Class A2 shares of the Fund.CDSC are deducted from redemption proceeds prior to remittance to the shareholder. During the six months ended August 31, 2021, IDIadvised the Fund that IDI retained $12,133 and $69 in front-end sales commissions from the sale of Class A and Class A2 shares,respectively, and $4,153 and $0 from Class A and Class A2 shares, respectively, for CDSC was imposed upon redemptions byshareholders.
Certain officers and trustees of the Trust are officers and directors of the Adviser, IIS and/or IDI. 12 Invesco Short Duration Inflation Protected Fund
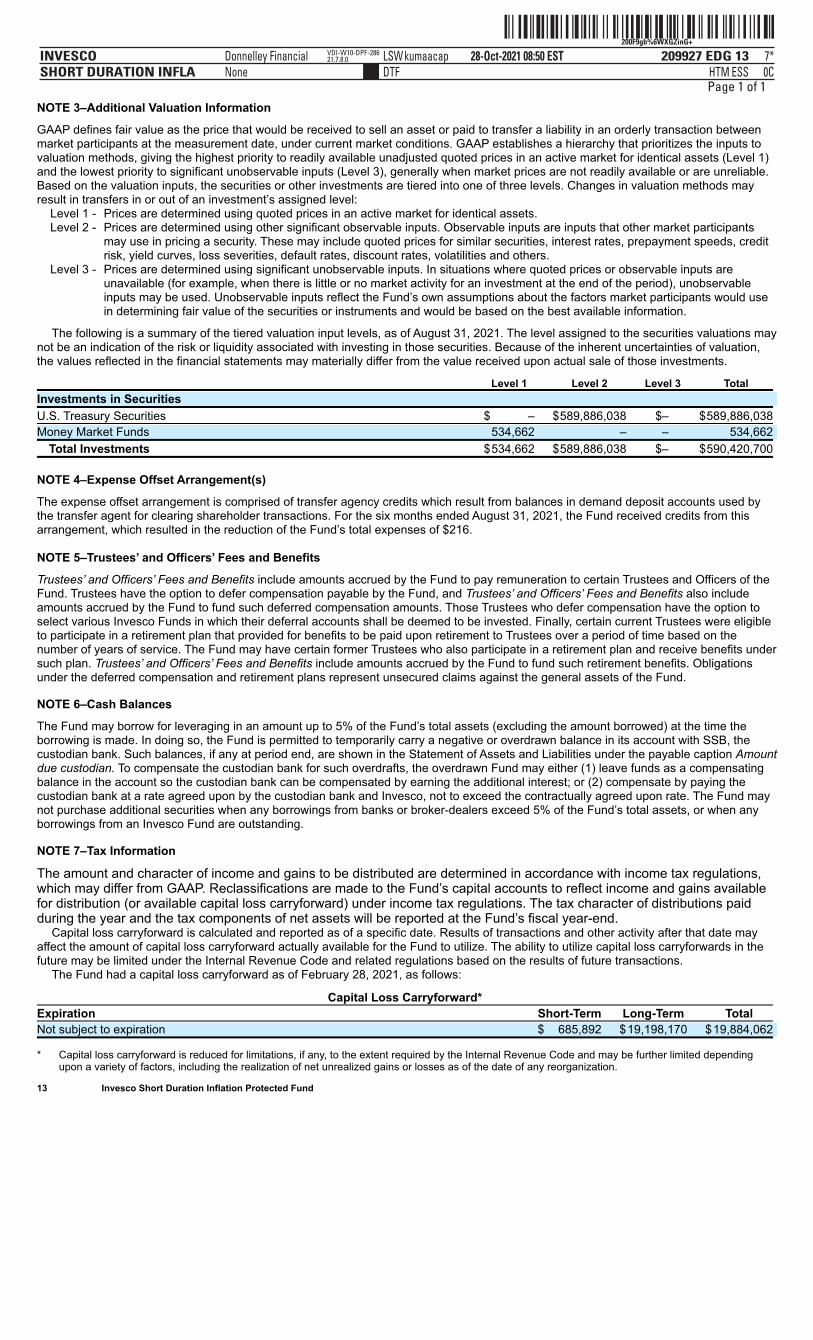
ˆ200F9gb%6WXGZinG+Š200F9gb%6WXGZinG+
209927 EDG 13INVESCOSHORT DURATION INFLA
28-Oct-2021 08:50 ESTHTMDTF
Donnelley Financial LSWkumaacapNone
7*ESS 0C
VDI-W10-DPF-28621.7.8.0
Page 1 of 1NOTE 3–Additional Valuation Information
GAAP defines fair value as the price that would be received to sell an asset or paid to transfer a liability in an orderly transaction betweenmarket participants at the measurement date, under current market conditions. GAAP establishes a hierarchy that prioritizes the inputs tovaluation methods, giving the highest priority to readily available unadjusted quoted prices in an active market for identical assets (Level 1)and the lowest priority to significant unobservable inputs (Level 3), generally when market prices are not readily available or are unreliable.Based on the valuation inputs, the securities or other investments are tiered into one of three levels. Changes in valuation methods mayresult in transfers in or out of an investment’s assigned level: Level 1 - Prices are determined using quoted prices in an active market for identical assets. Level 2 -
Prices are determined using other significant observable inputs. Observable inputs are inputs that other market participantsmay use in pricing a security. These may include quoted prices for similar securities, interest rates, prepayment speeds, creditrisk, yield curves, loss severities, default rates, discount rates, volatilities and others.
Level 3 -
Prices are determined using significant unobservable inputs. In situations where quoted prices or observable inputs areunavailable (for example, when there is little or no market activity for an investment at the end of the period), unobservableinputs may be used. Unobservable inputs reflect the Fund’s own assumptions about the factors market participants would usein determining fair value of the securities or instruments and would be based on the best available information.
The following is a summary of the tiered valuation input levels, as of August 31, 2021. The level assigned to the securities valuations maynot be an indication of the risk or liquidity associated with investing in those securities. Because of the inherent uncertainties of valuation,the values reflected in the financial statements may materially differ from the value received upon actual sale of those investments.
Level 1 Level 2 Level 3 Total
Investments in Securities
U.S. Treasury Securities $ – $589,886,038 $– $589,886,038
Money Market Funds 534,662 – – 534,662
Total Investments $534,662 $589,886,038 $– $590,420,700
NOTE 4–Expense Offset Arrangement(s)
The expense offset arrangement is comprised of transfer agency credits which result from balances in demand deposit accounts used bythe transfer agent for clearing shareholder transactions. For the six months ended August 31, 2021, the Fund received credits from thisarrangement, which resulted in the reduction of the Fund’s total expenses of $216.
NOTE 5–Trustees’ and Officers’ Fees and Benefits
Trustees’ and Officers’ Fees and Benefits include amounts accrued by the Fund to pay remuneration to certain Trustees and Officers of theFund. Trustees have the option to defer compensation payable by the Fund, and Trustees’ and Officers’ Fees and Benefits also includeamounts accrued by the Fund to fund such deferred compensation amounts. Those Trustees who defer compensation have the option toselect various Invesco Funds in which their deferral accounts shall be deemed to be invested. Finally, certain current Trustees were eligibleto participate in a retirement plan that provided for benefits to be paid upon retirement to Trustees over a period of time based on thenumber of years of service. The Fund may have certain former Trustees who also participate in a retirement plan and receive benefits undersuch plan. Trustees’ and Officers’ Fees and Benefits include amounts accrued by the Fund to fund such retirement benefits. Obligationsunder the deferred compensation and retirement plans represent unsecured claims against the general assets of the Fund.
NOTE 6–Cash Balances
The Fund may borrow for leveraging in an amount up to 5% of the Fund’s total assets (excluding the amount borrowed) at the time theborrowing is made. In doing so, the Fund is permitted to temporarily carry a negative or overdrawn balance in its account with SSB, thecustodian bank. Such balances, if any at period end, are shown in the Statement of Assets and Liabilities under the payable caption Amountdue custodian. To compensate the custodian bank for such overdrafts, the overdrawn Fund may either (1) leave funds as a compensatingbalance in the account so the custodian bank can be compensated by earning the additional interest; or (2) compensate by paying thecustodian bank at a rate agreed upon by the custodian bank and Invesco, not to exceed the contractually agreed upon rate. The Fund maynot purchase additional securities when any borrowings from banks or broker-dealers exceed 5% of the Fund’s total assets, or when anyborrowings from an Invesco Fund are outstanding.
NOTE 7–Tax Information
The amount and character of income and gains to be distributed are determined in accordance with income tax regulations,which may differ from GAAP. Reclassifications are made to the Fund’s capital accounts to reflect income and gains availablefor distribution (or available capital loss carryforward) under income tax regulations. The tax character of distributions paidduring the year and the tax components of net assets will be reported at the Fund’s fiscal year-end.
Capital loss carryforward is calculated and reported as of a specific date. Results of transactions and other activity after that date mayaffect the amount of capital loss carryforward actually available for the Fund to utilize. The ability to utilize capital loss carryforwards in thefuture may be limited under the Internal Revenue Code and related regulations based on the results of future transactions.
The Fund had a capital loss carryforward as of February 28, 2021, as follows:
Capital Loss Carryforward*
Expiration Short-Term Long-Term Total
Not subject to expiration $ 685,892 $19,198,170 $19,884,062
* Capital loss carryforward is reduced for limitations, if any, to the extent required by the Internal Revenue Code and may be further limited dependingupon a variety of factors, including the realization of net unrealized gains or losses as of the date of any reorganization.
13 Invesco Short Duration Inflation Protected Fund
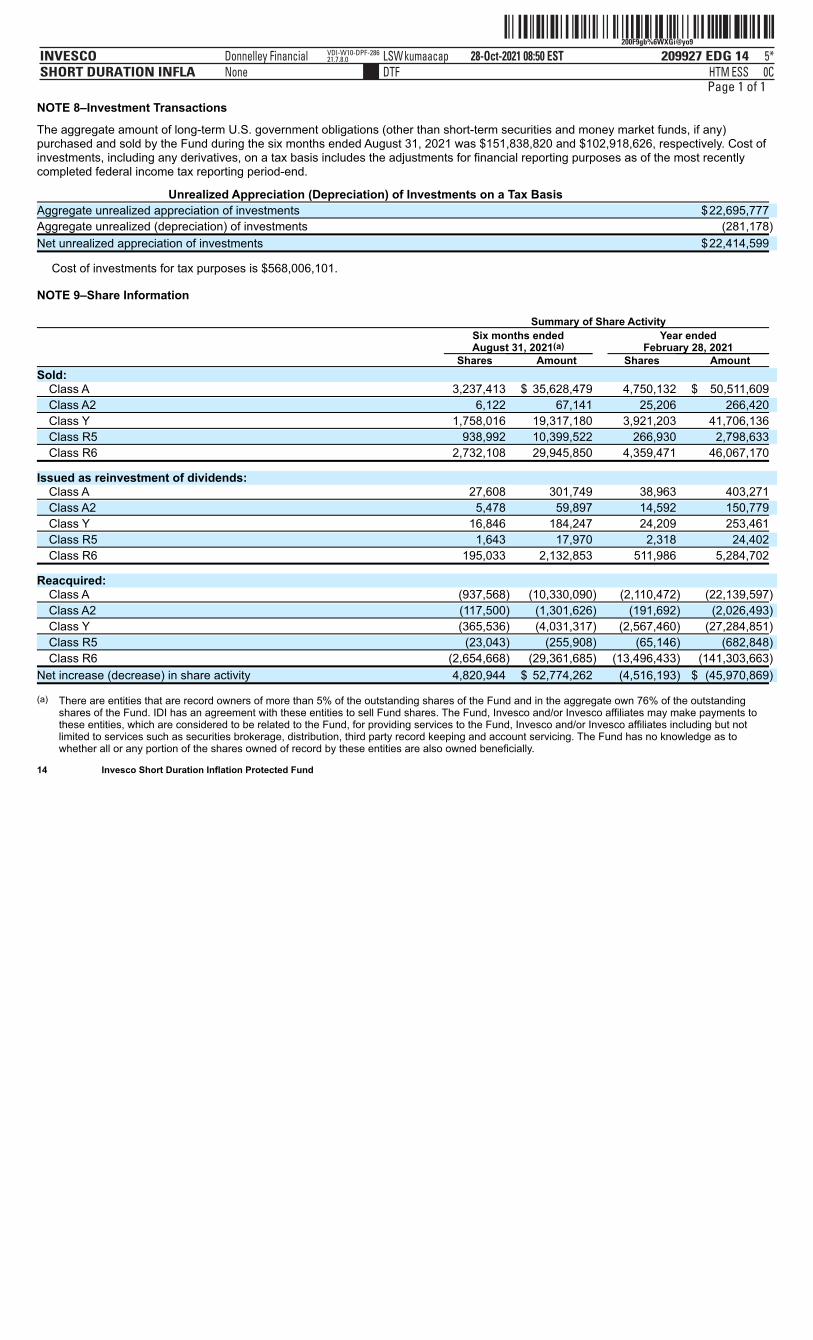
ˆ200F9gb%6WXGi@yo9Š200F9gb%6WXGi@yo9
209927 EDG 14INVESCOSHORT DURATION INFLA
28-Oct-2021 08:50 ESTHTMDTF
Donnelley Financial LSWkumaacapNone
5*ESS 0C
VDI-W10-DPF-28621.7.8.0
Page 1 of 1NOTE 8–Investment Transactions
The aggregate amount of long-term U.S. government obligations (other than short-term securities and money market funds, if any)purchased and sold by the Fund during the six months ended August 31, 2021 was $151,838,820 and $102,918,626, respectively. Cost ofinvestments, including any derivatives, on a tax basis includes the adjustments for financial reporting purposes as of the most recentlycompleted federal income tax reporting period-end.
Unrealized Appreciation (Depreciation) of Investments on a Tax Basis
Aggregate unrealized appreciation of investments $22,695,777
Aggregate unrealized (depreciation) of investments (281,178)
Net unrealized appreciation of investments $22,414,599
Cost of investments for tax purposes is $568,006,101.
NOTE 9–Share Information
Summary of Share Activity
Six months ended Year ended August 31, 2021(a) February 28, 2021 Shares Amount Shares Amount
Sold: Class A 3,237,413 $ 35,628,479 4,750,132 $ 50,511,609
Class A2 6,122 67,141 25,206 266,420
Class Y 1,758,016 19,317,180 3,921,203 41,706,136
Class R5 938,992 10,399,522 266,930 2,798,633
Class R6 2,732,108 29,945,850 4,359,471 46,067,170
Issued as reinvestment of dividends: Class A 27,608 301,749 38,963 403,271
Class A2 5,478 59,897 14,592 150,779
Class Y 16,846 184,247 24,209 253,461
Class R5 1,643 17,970 2,318 24,402
Class R6 195,033 2,132,853 511,986 5,284,702
Reacquired: Class A (937,568) (10,330,090) (2,110,472) (22,139,597)
Class A2 (117,500) (1,301,626) (191,692) (2,026,493)
Class Y (365,536) (4,031,317) (2,567,460) (27,284,851)
Class R5 (23,043) (255,908) (65,146) (682,848)
Class R6 (2,654,668) (29,361,685) (13,496,433) (141,303,663)
Net increase (decrease) in share activity 4,820,944 $ 52,774,262 (4,516,193) $ (45,970,869)
(a) There are entities that are record owners of more than 5% of the outstanding shares of the Fund and in the aggregate own 76% of the outstandingshares of the Fund. IDI has an agreement with these entities to sell Fund shares. The Fund, Invesco and/or Invesco affiliates may make payments tothese entities, which are considered to be related to the Fund, for providing services to the Fund, Invesco and/or Invesco affiliates including but notlimited to services such as securities brokerage, distribution, third party record keeping and account servicing. The Fund has no knowledge as towhether all or any portion of the shares owned of record by these entities are also owned beneficially.
14 Invesco Short Duration Inflation Protected Fund
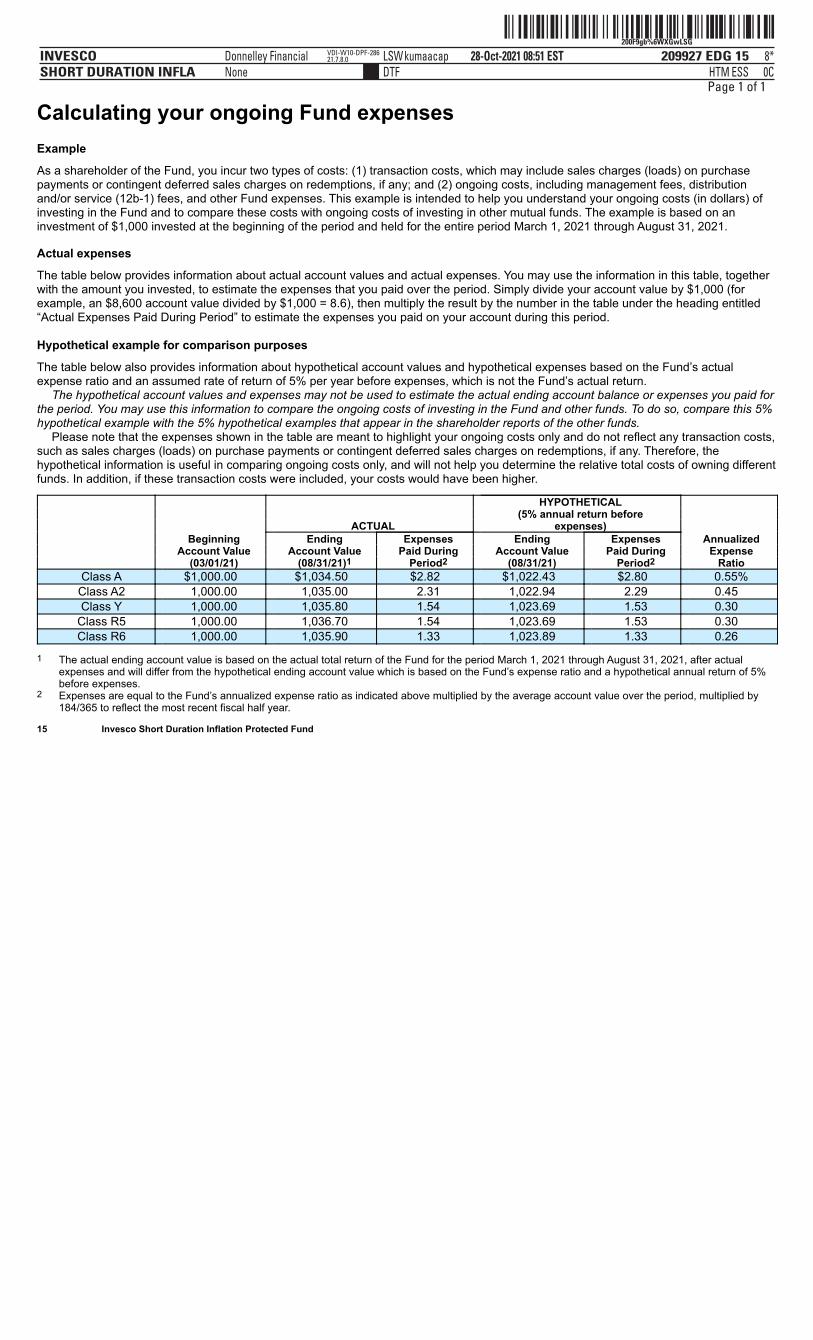
ˆ200F9gb%6WXGwLSG‹Š200F9gb%6WXGwLSG
209927 EDG 15INVESCOSHORT DURATION INFLA
28-Oct-2021 08:51 ESTHTMDTF
Donnelley Financial LSWkumaacapNone
8*ESS 0C
VDI-W10-DPF-28621.7.8.0
Page 1 of 1
Calculating your ongoing Fund expensesExample
As a shareholder of the Fund, you incur two types of costs: (1) transaction costs, which may include sales charges (loads) on purchasepayments or contingent deferred sales charges on redemptions, if any; and (2) ongoing costs, including management fees, distributionand/or service (12b-1) fees, and other Fund expenses. This example is intended to help you understand your ongoing costs (in dollars) ofinvesting in the Fund and to compare these costs with ongoing costs of investing in other mutual funds. The example is based on aninvestment of $1,000 invested at the beginning of the period and held for the entire period March 1, 2021 through August 31, 2021.
Actual expenses
The table below provides information about actual account values and actual expenses. You may use the information in this table, togetherwith the amount you invested, to estimate the expenses that you paid over the period. Simply divide your account value by $1,000 (forexample, an $8,600 account value divided by $1,000 = 8.6), then multiply the result by the number in the table under the heading entitled“Actual Expenses Paid During Period” to estimate the expenses you paid on your account during this period.
Hypothetical example for comparison purposes
The table below also provides information about hypothetical account values and hypothetical expenses based on the Fund’s actualexpense ratio and an assumed rate of return of 5% per year before expenses, which is not the Fund’s actual return.
The hypothetical account values and expenses may not be used to estimate the actual ending account balance or expenses you paid forthe period. You may use this information to compare the ongoing costs of investing in the Fund and other funds. To do so, compare this 5%hypothetical example with the 5% hypothetical examples that appear in the shareholder reports of the other funds.
Please note that the expenses shown in the table are meant to highlight your ongoing costs only and do not reflect any transaction costs,such as sales charges (loads) on purchase payments or contingent deferred sales charges on redemptions, if any. Therefore, thehypothetical information is useful in comparing ongoing costs only, and will not help you determine the relative total costs of owning differentfunds. In addition, if these transaction costs were included, your costs would have been higher.
HYPOTHETICAL (5% annual return before ACTUAL expenses) Beginning Ending Expenses Ending Expenses Annualized Account Value Account Value Paid During Account Value Paid During Expense (03/01/21) (08/31/21)1 Period2 (08/31/21) Period2 Ratio
Class A $1,000.00 $1,034.50 $2.82 $1,022.43 $2.80 0.55%Class A2 1,000.00 1,035.00 2.31 1,022.94 2.29 0.45 Class Y 1,000.00 1,035.80 1.54 1,023.69 1.53 0.30
Class R5 1,000.00 1,036.70 1.54 1,023.69 1.53 0.30 Class R6 1,000.00 1,035.90 1.33 1,023.89 1.33 0.26
1 The actual ending account value is based on the actual total return of the Fund for the period March 1, 2021 through August 31, 2021, after actualexpenses and will differ from the hypothetical ending account value which is based on the Fund’s expense ratio and a hypothetical annual return of 5%before expenses.
2 Expenses are equal to the Fund’s annualized expense ratio as indicated above multiplied by the average account value over the period, multiplied by184/365 to reflect the most recent fiscal half year.
15 Invesco Short Duration Inflation Protected Fund
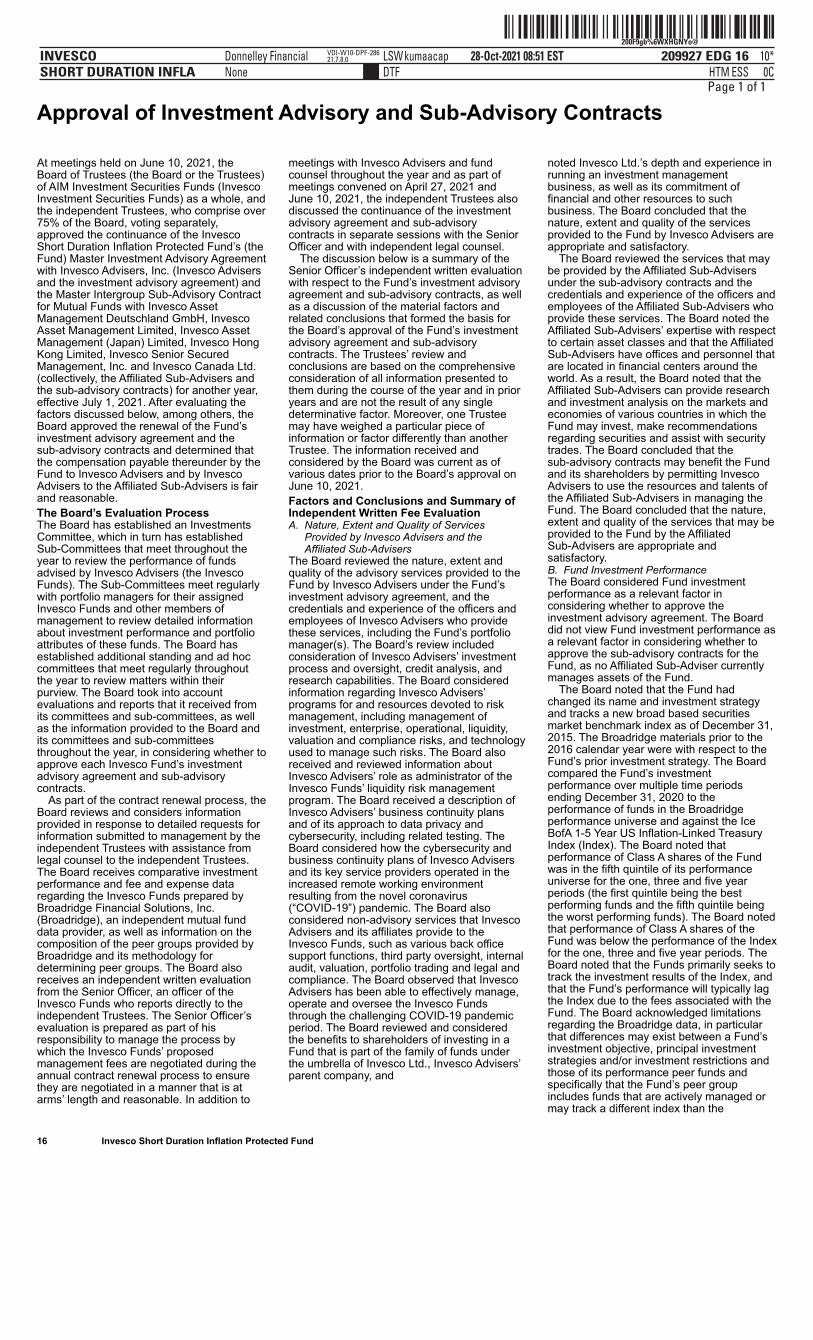
ˆ200F9gb%6WXHGNYo@Š200F9gb%6WXHGNYo@
209927 EDG 16INVESCOSHORT DURATION INFLA
28-Oct-2021 08:51 ESTHTMDTF
Donnelley Financial LSWkumaacapNone
10*ESS 0C
VDI-W10-DPF-28621.7.8.0
Page 1 of 1
Approval of Investment Advisory and Sub-Advisory Contracts
16 Invesco Short Duration Inflation Protected Fund
At meetings held on June 10, 2021, theBoard of Trustees (the Board or the Trustees)of AIM Investment Securities Funds (InvescoInvestment Securities Funds) as a whole, andthe independent Trustees, who comprise over75% of the Board, voting separately,approved the continuance of the InvescoShort Duration Inflation Protected Fund’s (theFund) Master Investment Advisory Agreementwith Invesco Advisers, Inc. (Invesco Advisersand the investment advisory agreement) andthe Master Intergroup Sub-Advisory Contractfor Mutual Funds with Invesco AssetManagement Deutschland GmbH, InvescoAsset Management Limited, Invesco AssetManagement (Japan) Limited, Invesco HongKong Limited, Invesco Senior SecuredManagement, Inc. and Invesco Canada Ltd.(collectively, the Affiliated Sub-Advisers andthe sub-advisory contracts) for another year,effective July 1, 2021. After evaluating thefactors discussed below, among others, theBoard approved the renewal of the Fund’sinvestment advisory agreement and thesub-advisory contracts and determined thatthe compensation payable thereunder by theFund to Invesco Advisers and by InvescoAdvisers to the Affiliated Sub-Advisers is fairand reasonable.The Board’s Evaluation ProcessThe Board has established an InvestmentsCommittee, which in turn has establishedSub-Committees that meet throughout theyear to review the performance of fundsadvised by Invesco Advisers (the InvescoFunds). The Sub-Committees meet regularlywith portfolio managers for their assignedInvesco Funds and other members ofmanagement to review detailed informationabout investment performance and portfolioattributes of these funds. The Board hasestablished additional standing and ad hoccommittees that meet regularly throughoutthe year to review matters within theirpurview. The Board took into accountevaluations and reports that it received fromits committees and sub-committees, as wellas the information provided to the Board andits committees and sub-committeesthroughout the year, in considering whether toapprove each Invesco Fund’s investmentadvisory agreement and sub-advisorycontracts.
As part of the contract renewal process, theBoard reviews and considers informationprovided in response to detailed requests forinformation submitted to management by theindependent Trustees with assistance fromlegal counsel to the independent Trustees.The Board receives comparative investmentperformance and fee and expense dataregarding the Invesco Funds prepared byBroadridge Financial Solutions, Inc.(Broadridge), an independent mutual funddata provider, as well as information on thecomposition of the peer groups provided byBroadridge and its methodology fordetermining peer groups. The Board alsoreceives an independent written evaluationfrom the Senior Officer, an officer of theInvesco Funds who reports directly to theindependent Trustees. The Senior Officer’sevaluation is prepared as part of hisresponsibility to manage the process bywhich the Invesco Funds’ proposedmanagement fees are negotiated during theannual contract renewal process to ensurethey are negotiated in a manner that is atarms’ length and reasonable. In addition to
meetings with Invesco Advisers and fundcounsel throughout the year and as part ofmeetings convened on April 27, 2021 andJune 10, 2021, the independent Trustees alsodiscussed the continuance of the investmentadvisory agreement and sub-advisorycontracts in separate sessions with the SeniorOfficer and with independent legal counsel.
The discussion below is a summary of theSenior Officer’s independent written evaluationwith respect to the Fund’s investment advisoryagreement and sub-advisory contracts, as wellas a discussion of the material factors andrelated conclusions that formed the basis forthe Board’s approval of the Fund’s investmentadvisory agreement and sub-advisorycontracts. The Trustees’ review andconclusions are based on the comprehensiveconsideration of all information presented tothem during the course of the year and in prioryears and are not the result of any singledeterminative factor. Moreover, one Trusteemay have weighed a particular piece ofinformation or factor differently than anotherTrustee. The information received andconsidered by the Board was current as ofvarious dates prior to the Board’s approval onJune 10, 2021.Factors and Conclusions and Summary ofIndependent Written Fee EvaluationA. Nature, Extent and Quality of Services
Provided by Invesco Advisers and theAffiliated Sub-Advisers
The Board reviewed the nature, extent andquality of the advisory services provided to theFund by Invesco Advisers under the Fund’sinvestment advisory agreement, and thecredentials and experience of the officers andemployees of Invesco Advisers who providethese services, including the Fund’s portfoliomanager(s). The Board’s review includedconsideration of Invesco Advisers’ investmentprocess and oversight, credit analysis, andresearch capabilities. The Board consideredinformation regarding Invesco Advisers’programs for and resources devoted to riskmanagement, including management ofinvestment, enterprise, operational, liquidity,valuation and compliance risks, and technologyused to manage such risks. The Board alsoreceived and reviewed information aboutInvesco Advisers’ role as administrator of theInvesco Funds’ liquidity risk managementprogram. The Board received a description ofInvesco Advisers’ business continuity plansand of its approach to data privacy andcybersecurity, including related testing. TheBoard considered how the cybersecurity andbusiness continuity plans of Invesco Advisersand its key service providers operated in theincreased remote working environmentresulting from the novel coronavirus(“COVID-19”) pandemic. The Board alsoconsidered non-advisory services that InvescoAdvisers and its affiliates provide to theInvesco Funds, such as various back officesupport functions, third party oversight, internalaudit, valuation, portfolio trading and legal andcompliance. The Board observed that InvescoAdvisers has been able to effectively manage,operate and oversee the Invesco Fundsthrough the challenging COVID-19 pandemicperiod. The Board reviewed and consideredthe benefits to shareholders of investing in aFund that is part of the family of funds underthe umbrella of Invesco Ltd., Invesco Advisers’parent company, and
noted Invesco Ltd.’s depth and experience inrunning an investment managementbusiness, as well as its commitment offinancial and other resources to suchbusiness. The Board concluded that thenature, extent and quality of the servicesprovided to the Fund by Invesco Advisers areappropriate and satisfactory.
The Board reviewed the services that maybe provided by the Affiliated Sub-Advisersunder the sub-advisory contracts and thecredentials and experience of the officers andemployees of the Affiliated Sub-Advisers whoprovide these services. The Board noted theAffiliated Sub-Advisers’ expertise with respectto certain asset classes and that the AffiliatedSub-Advisers have offices and personnel thatare located in financial centers around theworld. As a result, the Board noted that theAffiliated Sub-Advisers can provide researchand investment analysis on the markets andeconomies of various countries in which theFund may invest, make recommendationsregarding securities and assist with securitytrades. The Board concluded that thesub-advisory contracts may benefit the Fundand its shareholders by permitting InvescoAdvisers to use the resources and talents ofthe Affiliated Sub-Advisers in managing theFund. The Board concluded that the nature,extent and quality of the services that may beprovided to the Fund by the AffiliatedSub-Advisers are appropriate andsatisfactory.B. Fund Investment PerformanceThe Board considered Fund investmentperformance as a relevant factor inconsidering whether to approve theinvestment advisory agreement. The Boarddid not view Fund investment performance asa relevant factor in considering whether toapprove the sub-advisory contracts for theFund, as no Affiliated Sub-Adviser currentlymanages assets of the Fund.
The Board noted that the Fund hadchanged its name and investment strategyand tracks a new broad based securitiesmarket benchmark index as of December 31,2015. The Broadridge materials prior to the2016 calendar year were with respect to theFund’s prior investment strategy. The Boardcompared the Fund’s investmentperformance over multiple time periodsending December 31, 2020 to theperformance of funds in the Broadridgeperformance universe and against the IceBofA 1-5 Year US Inflation-Linked TreasuryIndex (Index). The Board noted thatperformance of Class A shares of the Fundwas in the fifth quintile of its performanceuniverse for the one, three and five yearperiods (the first quintile being the bestperforming funds and the fifth quintile beingthe worst performing funds). The Board notedthat performance of Class A shares of theFund was below the performance of the Indexfor the one, three and five year periods. TheBoard noted that the Funds primarily seeks totrack the investment results of the Index, andthat the Fund’s performance will typically lagthe Index due to the fees associated with theFund. The Board acknowledged limitationsregarding the Broadridge data, in particularthat differences may exist between a Fund’sinvestment objective, principal investmentstrategies and/or investment restrictions andthose of its performance peer funds andspecifically that the Fund’s peer groupincludes funds that are actively managed ormay track a different index than the
ˆ200F9gb%6WXHPePG%Š200F9gb%6WXHPePG%
209927 EDG 17INVESCOSHORT DURATION INFLA
28-Oct-2021 08:51 ESTHTMDTF
Donnelley Financial LSWkumaacapNone
7*ESS 0C
VDI-W10-DPF-28621.7.8.0
Page 1 of 1
17 Invesco Short Duration Inflation Protected Fund
Fund. The Board noted that because theFund isprimarily passively managed using anindexing approach, it may lag its activelymanaged peers. The Board recognized thatthe performance data reflects a snapshot intime as of a particular date and that selectinga different performance period could producedifferent results. The Board also reviewedmore recent Fund performance as well asother performance metrics, which did notchange its conclusions.C. Advisory and Sub-Advisory Fees and Fund
ExpensesThe Board compared the Fund’s contractualmanagement fee rate to the contractualmanagement fee rates of funds in the Fund’sBroadridge expense group. The Board notedthat the contractual management fee rate forClass A shares of the Fund was below themedian contractual management fee rate offunds in its expense group. The Board notedthat the term “contractual management fee”for funds in the expense group may includeboth advisory and certain non-portfoliomanagement administrative services fees,but that Broadridge is not able to provideinformation on a fund by fund basis as towhat is included. The Board also reviewedthe methodology used by Broadridge incalculating expense group information, whichincludes using each fund’s contractualmanagement fee schedule (including anyapplicable breakpoints) as reported in themost recent prospectus or statement ofadditional information for each fund in theexpense group. The Board also consideredcomparative information regarding the Fund’stotal expense ratio and its variouscomponents.
The Board noted that Invesco Advisers hascontractually agreed to waive fees and/or limitexpenses of the Fund for the term disclosedin the Fund’s registration statement in anamount necessary to limit total annualoperating expenses to a specified percentageof average daily net assets for each class ofthe Fund.
The Board noted that Invesco Advisers andthe Affiliated Sub-Advisers do not manageother similarly managed mutual funds orclient accounts.
The Board also considered the servicesthat may be provided by the AffiliatedSub-Advisers pursuant to the sub-advisorycontracts, as well as the fees payable byInvesco Advisers to the AffiliatedSub-Advisers pursuant to the sub-advisorycontracts.D. Economies of Scale and BreakpointsThe Board considered the extent to whichthere may be economies of scale in theprovision of advisory services to the Fundand the Invesco Funds, and the extent towhich such economies of scale are sharedwith the Fund and the Invesco Funds. TheBoard considered that the Fund benefits fromeconomies of scale through contractualbreakpoints in the Fund’s advisory feeschedule, which generally operate to reducethe Fund’s expense ratio as it grows in size.The Board requested and received additionalinformation from Invesco Advisers regardingthe levels of the Fund’s breakpoints in light ofcurrent assets. The Board noted that theFund also shares in economies of scalethrough Invesco Advisers’ ability to negotiatelower fee arrangements with third partyservice providers. The Board noted that theFund may also benefit from economies ofscale through initial fee setting, fee waiversand expense reimbursements, as well asInvesco Advisers’ investment in its business,including investments in businessinfrastructure, technology and cybersecurity.
E. Profitability and Financial ResourcesThe Board reviewed information from InvescoAdvisers concerning the costs of the advisoryand other services that Invesco Advisers andits affiliates provide to the Fund and theInvesco Funds and the profitability of InvescoAdvisers and its affiliates in providing theseservices in the aggregate and on an individualFund-by-Fund basis. The Board considered themethodology used for calculating profitabilityand noted that such methodology had recentlybeen reviewed and enhanced. The Boardnoted that Invesco Advisers continues tooperate at a net profit from services InvescoAdvisers and its affiliates provide to theInvesco Funds in the aggregate and to mostFunds individually. The Board did not deem thelevel of profits realized by Invesco Advisersand its affiliates from providing such services tobe excessive, given the nature, extent andquality of the services provided. The Boardnoted that Invesco Advisers providedinformation demonstrating that InvescoAdvisers is financially sound and has theresources necessary to perform its obligationsunder the investment advisory agreement, andprovided representations indicating that theAffiliated Sub-Advisers are financially soundand have the resources necessary to performtheir obligations under the sub-advisorycontracts.F. Collateral Benefits to Invesco Advisers and its
AffiliatesThe Board considered various other benefitsreceived by Invesco Advisers and its affiliatesfrom the relationship with the Fund, includingthe fees received for providing administrative,transfer agency and distribution services to theFund. The Board received comparativeinformation regarding fees charged for theseservices, including information provided byBroadridge and other independent sources.The Board reviewed the performance ofInvesco Advisers and its affiliates in providingthese services and the organizational structureemployed to provide these services. The Boardnoted that these services are provided to theFund pursuant to written contracts that arereviewed and subject to approval on an annualbasis by the Board based on its determinationthat the services are required for the operationof the Fund.
The Board considered the benefitsrealized by Invesco Advisers and theAffiliated Sub-Advisers as a result ofportfolio brokerage transactions executedthrough “soft dollar” arrangements. InvescoAdvisers noted that the Fund does notexecute brokerage transactions through“soft dollar” arrangements to any significantdegree.
The Board considered that the Fund’suninvested cash and cash collateral from anysecurities lending arrangements may beinvested in registered money market funds or,with regard to securities lending cashcollateral, unregistered funds that comply withRule 2a-7 (collectively referred to as “affiliatedmoney market funds”) advised by InvescoAdvisers. The Board considered informationregarding the returns of the affiliated moneymarket funds relative to comparable overnightinvestments, as well as the fees paid by theaffiliated money market funds to InvescoAdvisers and its affiliates. In this regard, theBoard noted that Invesco Advisers receivesadvisory fees from these affiliated moneymarket funds attributable to the Fund’sinvestments. The Board also noted thatInvesco Advisers has contractually agreed towaive through varying periods an amountequal to 100% of the net advisory fee InvescoAdvisers receives from the affiliated moneymarket
funds with respect to the Fund’s investment inthe affiliated money market funds ofuninvested cash, but not cash collateral. TheBoard concluded that the advisory feespayable to Invesco Advisers from the Fund’sinvestment of cash collateral from anysecurities lending arrangements in theaffiliated money market funds are for servicesthat are not duplicative of services providedby Invesco Advisers to the Fund.
The Board also received information aboutcommissions that an affiliated broker mayreceive for executing certain trades for theFund. Invesco Advisers and the AffiliatedSub-Advisers advised the Board of thebenefits to the Fund of executing tradesthrough the affiliated broker and that suchtrades were executed in compliance withrules under the federal securities laws andconsistent with best execution obligations.

ˆ200F9gb%6WXHRwuG.Š200F9gb%6WXHRwuG.
209927 EDG 18INVESCOSHORT DURATION INFLA
28-Oct-2021 08:51 ESTHTMDTF
Donnelley Financial LSWkumaacapNone
5*ESS 0C
VDI-W10-DPF-28621.7.8.0
Page 1 of 1
(This page intentionally left blank)

ˆ200F9gb%6WXHT03oCŠ200F9gb%6WXHT03oC
209927 EDG 19INVESCOSHORT DURATION INFLA
28-Oct-2021 08:51 ESTHTMDTF
Donnelley Financial LSWkumaacapNone
5*ESS 0C
VDI-W10-DPF-28621.7.8.0
Page 1 of 1
(This page intentionally left blank)
ˆ200F9gb%6WXHZPwoDŠ200F9gb%6WXHZPwoD
209927 EDG 20INVESCOSHORT DURATION INFLA
28-Oct-2021 08:51 ESTHTMDTF
Donnelley Financial LSWkumaacapNone
7*ESS 0C
VDI-W10-DPF-28621.7.8.0
dsp20dsp20a
Page 1 of 1
Go paperless with eDeliveryVisit invesco.com/edelivery to enjoy the convenience and security of anytime electronic access to your investmentdocuments.With eDelivery, you can elect to have any or all of the following materials delivered straight to your inbox to download, saveand print from your own computer:
∎ Fund reports and prospectuses∎ Quarterly statements∎ Daily confirmations∎ Tax forms Invesco mailing informationSend general correspondence to Invesco Investment Services, Inc., P.O. Box 219078, Kansas City, MO 64121-9078. Important notice regarding delivery of security holder documentsTo reduce Fund expenses, only one copy of most shareholder documents may be mailed to shareholders with multipleaccounts at the same address (Householding). Mailing of your shareholder documents may be householded indefinitelyunless you instruct us otherwise. If you do not want the mailing of these documents to be combined with those for othermembers of your household, please contact Invesco Investment Services, Inc. at 800 959 4246 or contact your financialinstitution. We will begin sending you individual copies for each account within 30 days after receiving your request. Fund holdings and proxy voting informationThe Fund provides a complete list of its portfolio holdings four times each fiscal year, at the end of each fiscal quarter. For thesecond and fourth quarters, the list appears, respectively, in the Fund’s semiannual and annual reports to shareholders. Forthe first and third quarters, the Fund files the list with the Securities and Exchange Commission (SEC) as an exhibit to itsreports on Form N-PORT. The most recent list of portfolio holdings is available at invesco.com/completeqtrholdings.Shareholders can also look up the Fund’s Form N-PORT filings on the SEC website, sec.gov. The SEC file numbers for theFund are shown below.
A description of the policies and procedures that the Fund uses to determine how to vote proxies relating to portfoliosecurities is available without charge, upon request, from our Client Services department at 800 959 4246, or at invesco.com/corporate/about-us/esg. The information is also available on the SEC website, sec.gov.
Information regarding how the Fund voted proxies related to its portfolio securities during the most recent 12-month periodended June 30 is available at invesco.com/proxysearch. This information is also available on the SEC website, sec.gov.
Invesco Advisers, Inc. is an investment adviser; it provides investment advisory services to individual and institutionalclients and does not sell securities. Invesco Distributors, Inc. is the US distributor for Invesco Ltd.’s retail mutual funds,exchange-traded funds and institutional money market funds. Both are wholly owned, indirect subsidiaries of Invesco Ltd.
SEC file number(s): 811-05686 and 003-39519 Invesco Distributors, Inc. SDIP-SAR-1
ˆ200F9gfMJwyWCvmodŠ200F9gfMJwyWCvmod
209933 EDG 1INVESCOSHORT TERM BOND
29-Oct-2021 07:23 ESTHTMLAN
Donnelley Financial LSWpf_rendNone
9*ESS 0C
LSWP64RS0921.10.7.0
dsp001
Page 1 of 1
Semiannual Report to Shareholders August 31, 2021
Invesco Short Term Bond FundNasdaq: A: STBAX ∎ C: STBCX ∎ R: STBRX ∎ Y: STBYX ∎ R5: ISTBX ∎ R6: ISTFX
2 Fund Performance4 Liquidity Risk Management Program5 Schedule of Investments22 Financial Statements25 Financial Highlights26 Notes to Financial Statements33 Fund Expenses34 Approval of Investment Advisory and Sub-Advisory Contracts
For the most current month-end Fund performance and commentary, please visit invesco.com/performance.Unless otherwise noted, all data provided by Invesco.
This report must be accompanied or preceded by a currently effective Fund prospectus, which contains more complete information, includingsales charges and expenses. Investors should read it carefully before investing. NOT FDIC INSURED | MAY LOSE VALUE | NO BANK GUARANTEE
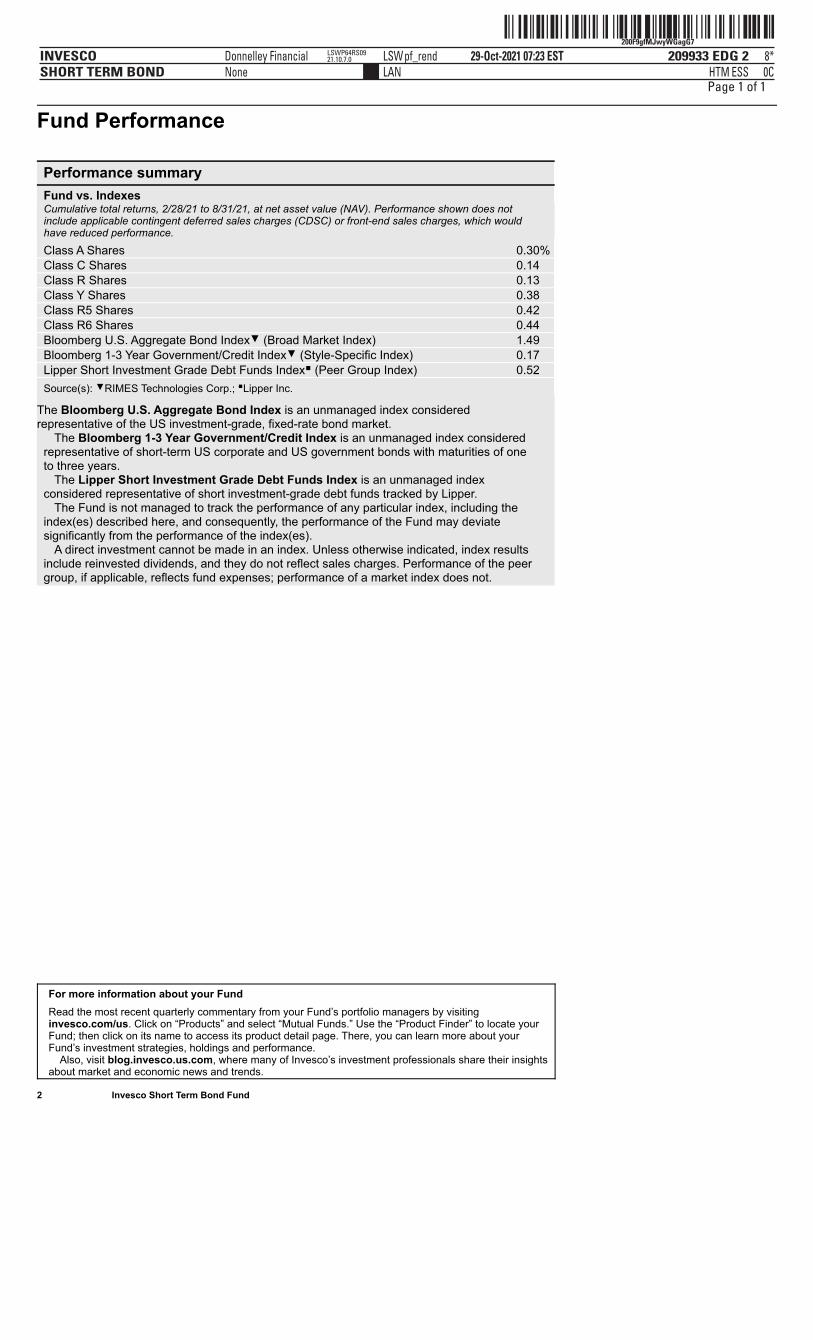
ˆ200F9gfMJwyWGagG7Š200F9gfMJwyWGagG7
209933 EDG 2INVESCOSHORT TERM BOND
29-Oct-2021 07:23 ESTHTMLAN
Donnelley Financial LSWpf_rendNone
8*ESS 0C
LSWP64RS0921.10.7.0
Page 1 of 1
Fund Performance
Performance summary
Fund vs. Indexes Cumulative total returns, 2/28/21 to 8/31/21, at net asset value (NAV). Performance shown does notinclude applicable contingent deferred sales charges (CDSC) or front-end sales charges, which wouldhave reduced performance.
Class A Shares 0.30% Class C Shares 0.14 Class R Shares 0.13 Class Y Shares 0.38 Class R5 Shares 0.42 Class R6 Shares 0.44 Bloomberg U.S. Aggregate Bond Index▼ (Broad Market Index) 1.49 Bloomberg 1-3 Year Government/Credit Index▼ (Style-Specific Index) 0.17 Lipper Short Investment Grade Debt Funds Index∎ (Peer Group Index) 0.52 Source(s): ▼RIMES Technologies Corp.; ∎Lipper Inc.
The Bloomberg U.S. Aggregate Bond Index is an unmanaged index consideredrepresentative of the US investment-grade, fixed-rate bond market.
The Bloomberg 1-3 Year Government/Credit Index is an unmanaged index consideredrepresentative of short-term US corporate and US government bonds with maturities of oneto three years.
The Lipper Short Investment Grade Debt Funds Index is an unmanaged indexconsidered representative of short investment-grade debt funds tracked by Lipper.
The Fund is not managed to track the performance of any particular index, including theindex(es) described here, and consequently, the performance of the Fund may deviatesignificantly from the performance of the index(es).
A direct investment cannot be made in an index. Unless otherwise indicated, index resultsinclude reinvested dividends, and they do not reflect sales charges. Performance of the peergroup, if applicable, reflects fund expenses; performance of a market index does not.
For more information about your Fund
Read the most recent quarterly commentary from your Fund’s portfolio managers by visitinginvesco.com/us. Click on “Products” and select “Mutual Funds.” Use the “Product Finder” to locate yourFund; then click on its name to access its product detail page. There, you can learn more about yourFund’s investment strategies, holdings and performance. Also, visit blog.invesco.us.com, where many of Invesco’s investment professionals share their insightsabout market and economic news and trends.
2 Invesco Short Term Bond Fund
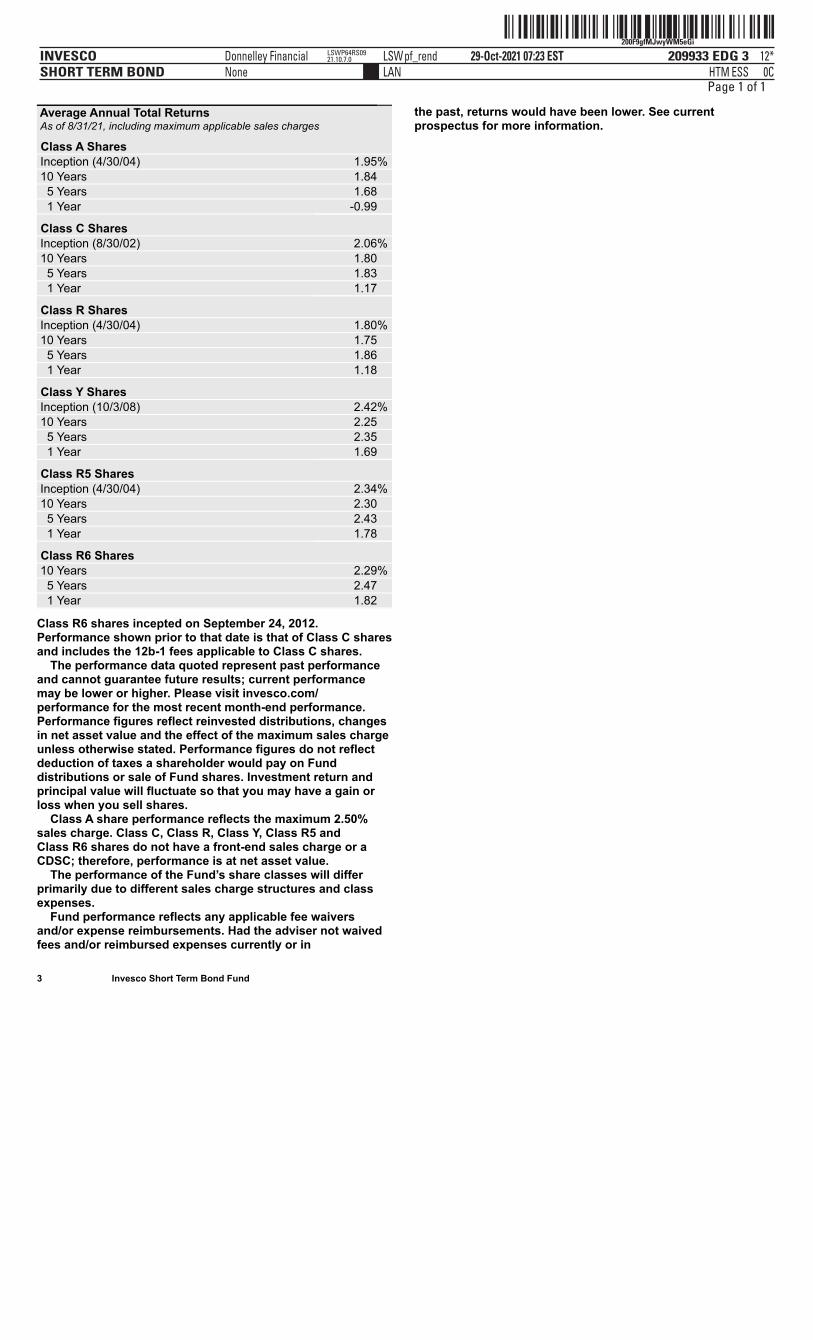
ˆ200F9gfMJwyWM5eGiŠ200F9gfMJwyWM5eGi
209933 EDG 3INVESCOSHORT TERM BOND
29-Oct-2021 07:23 ESTHTMLAN
Donnelley Financial LSWpf_rendNone
12*ESS 0C
LSWP64RS0921.10.7.0
Page 1 of 1
3 Invesco Short Term Bond Fund
Average Annual Total Returns As of 8/31/21, including maximum applicable sales charges
Class A Shares Inception (4/30/04) 1.95% 10 Years 1.84 5 Years 1.68 1 Year -0.99
Class C Shares Inception (8/30/02) 2.06% 10 Years 1.80 5 Years 1.83 1 Year 1.17
Class R Shares Inception (4/30/04) 1.80% 10 Years 1.75 5 Years 1.86 1 Year 1.18
Class Y Shares Inception (10/3/08) 2.42% 10 Years 2.25 5 Years 2.35 1 Year 1.69
Class R5 Shares Inception (4/30/04) 2.34% 10 Years 2.30 5 Years 2.43 1 Year 1.78
Class R6 Shares 10 Years 2.29% 5 Years 2.47 1 Year 1.82
Class R6 shares incepted on September 24, 2012.Performance shown prior to that date is that of Class C sharesand includes the 12b-1 fees applicable to Class C shares. The performance data quoted represent past performanceand cannot guarantee future results; current performancemay be lower or higher. Please visit invesco.com/performance for the most recent month-end performance.Performance figures reflect reinvested distributions, changesin net asset value and the effect of the maximum sales chargeunless otherwise stated. Performance figures do not reflectdeduction of taxes a shareholder would pay on Funddistributions or sale of Fund shares. Investment return andprincipal value will fluctuate so that you may have a gain orloss when you sell shares. Class A share performance reflects the maximum 2.50%sales charge. Class C, Class R, Class Y, Class R5 andClass R6 shares do not have a front-end sales charge or aCDSC; therefore, performance is at net asset value. The performance of the Fund’s share classes will differprimarily due to different sales charge structures and classexpenses. Fund performance reflects any applicable fee waiversand/or expense reimbursements. Had the adviser not waivedfees and/or reimbursed expenses currently or in
the past, returns would have been lower. See currentprospectus for more information.
ˆ200F9gfMJwyWRkcGHŠ200F9gfMJwyWRkcGH
209933 EDG 4INVESCOSHORT TERM BOND
29-Oct-2021 07:23 ESTHTMLAN
Donnelley Financial LSWpf_rendNone
12*ESS 0C
LSWP64RS0921.10.7.0
Page 1 of 1
4 Invesco Short Term Bond Fund
Liquidity Risk Management Program
In compliance with Rule 22e-4 under the Investment CompanyAct of 1940, as amended (the “Liquidity Rule”), the Fund hasadopted and implemented a liquidity risk management programin accordance with the Liquidity Rule (the “Program”). TheProgram is reasonably designed to assess and manage theFund’s liquidity risk, which is the risk that the Fund could notmeet redemption requests without significant dilution ofremaining investors’ interests in the Fund. The Board of Trusteesof the Fund (the “Board”) has appointed Invesco Advisers, Inc.(“Invesco”), the Fund’s investment adviser, as the Program’sadministrator, and Invesco has delegated oversight of theProgram to the Liquidity Risk Management Committee (the“Committee”), which is composed of senior representatives fromrelevant business groups at Invesco.
As required by the Liquidity Rule, the Program includes policiesand procedures providing for an assessment, no less frequentlythan annually, of the Fund’s liquidity risk that takes into account,as relevant to the Fund’s liquidity risk: (1) the Fund’s investmentstrategy and liquidity of portfolio investments during both normaland reasonably foreseeable stressed conditions; (2) short-termand long-term cash flow projections for the Fund during bothnormal and reasonably foreseeable stressed conditions; and(3) the Fund’s holdings of cash and cash equivalents and anyborrowing arrangements. The Liquidity Rule also requires theclassification of the Fund’s investments into categories thatreflect the assessment of their relative liquidity under currentmarket conditions. The Fund classifies its investments into oneof four categories defined in the Liquidity Rule: “Highly Liquid,”“Moderately Liquid,” “Less Liquid,” and “Illiquid. Funds that arenot invested primarily in “Highly Liquid Investments” that areassets (cash or investments that are reasonably expected to beconvertible into cash within three business days withoutsignificantly changing the market value of the investment) arerequired to establish a “Highly Liquid Investment Minimum”(“HLIM”), which is the minimum percentage of net assets thatmust be invested in Highly Liquid Investments. Funds withHLIMs have procedures for addressing HLIM shortfalls, includingreporting to the Board and the SEC (on a non-public basis) asrequired by the Program and the Liquidity Rule. In addition, theFund may not acquire an investment if, immediately after theacquisition, over 15% of the Fund’s net assets would consist of“Illiquid Investments” that are assets (an investment that cannotreasonably be expected to be sold or disposed of in currentmarket conditions in seven calendar days or less
without the sale or disposition significantly changing the marketvalue of the investment). The Liquidity Rule and the Program alsorequire reporting to the Board and the SEC (on a non-publicbasis) if a Fund’s holdings of Illiquid Investments exceed 15% ofthe Fund’s assets.
At a meeting held on March 22-24, 2021, the Committeepresented a report to the Board that addressed the operation ofthe Program and assessed the Program’s adequacy andeffectiveness of implementation (the “Report”). The Reportcovered the period from January 1, 2020 through December 31,2020 (the “Program Reporting Period”). The Report discussednotable events affecting liquidity over the Program ReportingPeriod, including the impact of the coronavirus pandemic on theFund and the overall market. The Report noted that there were nomaterial changes to the Program during the Program ReportingPeriod.The Report stated, in relevant part, that during the ProgramReporting Period:
∎ The Program, as adopted and implemented, remained reasonablydesigned to assess and manage the Fund’s liquidity risk and wasoperated effectively to achieve that goal;
∎ The Fund’s investment strategy remained appropriate for anopen-end fund;
∎ The Fund was able to meet requests for redemption withoutsignificant dilution of remaining investors’ interests in the Fund;
∎ The Fund did not breach the 15% limit on Illiquid Investments;and
∎ The Fund primarily held Highly Liquid Investments and thereforehas not adopted an HLIM.
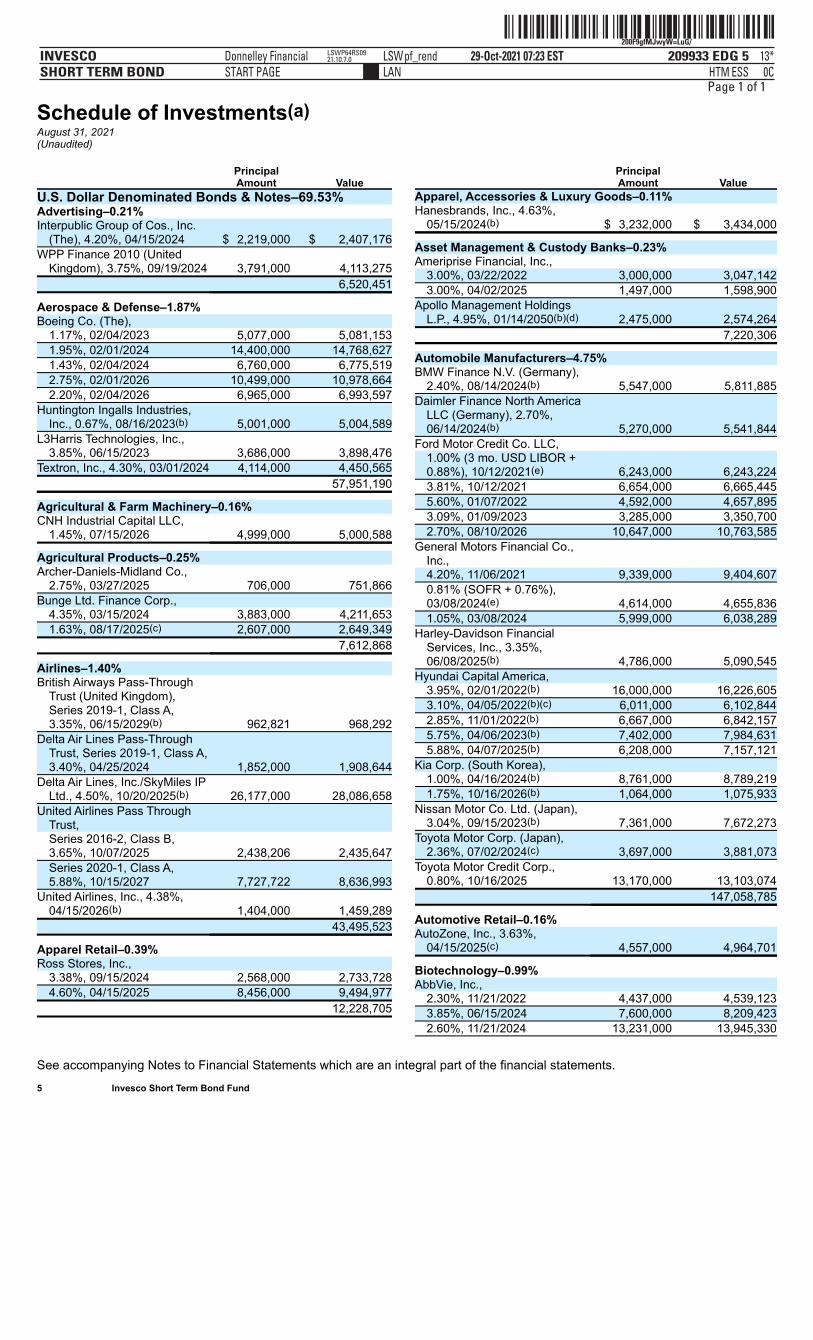
ˆ200F9gfMJwyW=LuG/Š200F9gfMJwyW=LuG/
209933 EDG 5INVESCOSHORT TERM BOND
29-Oct-2021 07:23 ESTHTMLAN
Donnelley Financial LSWpf_rendSTART PAGE
13*ESS 0C
LSWP64RS0921.10.7.0
Page 1 of 1
Schedule of Investments(a)August 31, 2021(Unaudited)
See accompanying Notes to Financial Statements which are an integral part of the financial statements. 5 Invesco Short Term Bond Fund
PrincipalAmount Value
U.S. Dollar Denominated Bonds & Notes–69.53%Advertising–0.21% Interpublic Group of Cos., Inc.
(The), 4.20%, 04/15/2024 $ 2,219,000 $ 2,407,176WPP Finance 2010 (United
Kingdom), 3.75%, 09/19/2024 3,791,000 4,113,275 6,520,451
Aerospace & Defense–1.87% Boeing Co. (The),
1.17%, 02/04/2023 5,077,000 5,081,1531.95%, 02/01/2024 14,400,000 14,768,6271.43%, 02/04/2024 6,760,000 6,775,5192.75%, 02/01/2026 10,499,000 10,978,6642.20%, 02/04/2026 6,965,000 6,993,597
Huntington Ingalls Industries,Inc., 0.67%, 08/16/2023(b) 5,001,000 5,004,589
L3Harris Technologies, Inc.,3.85%, 06/15/2023 3,686,000 3,898,476
Textron, Inc., 4.30%, 03/01/2024 4,114,000 4,450,565 57,951,190
Agricultural & Farm Machinery–0.16% CNH Industrial Capital LLC,
1.45%, 07/15/2026 4,999,000 5,000,588
Agricultural Products–0.25% Archer-Daniels-Midland Co.,
2.75%, 03/27/2025 706,000 751,866Bunge Ltd. Finance Corp.,
4.35%, 03/15/2024 3,883,000 4,211,6531.63%, 08/17/2025(c) 2,607,000 2,649,349
7,612,868
Airlines–1.40% British Airways Pass-Through
Trust (United Kingdom),Series 2019-1, Class A,3.35%, 06/15/2029(b) 962,821 968,292
Delta Air Lines Pass-ThroughTrust, Series 2019-1, Class A,3.40%, 04/25/2024 1,852,000 1,908,644
Delta Air Lines, Inc./SkyMiles IPLtd., 4.50%, 10/20/2025(b) 26,177,000 28,086,658
United Airlines Pass ThroughTrust, Series 2016-2, Class B,3.65%, 10/07/2025 2,438,206 2,435,647Series 2020-1, Class A,5.88%, 10/15/2027 7,727,722 8,636,993
United Airlines, Inc., 4.38%,04/15/2026(b) 1,404,000 1,459,289
43,495,523
Apparel Retail–0.39% Ross Stores, Inc.,
3.38%, 09/15/2024 2,568,000 2,733,7284.60%, 04/15/2025 8,456,000 9,494,977
12,228,705
PrincipalAmount Value
Apparel, Accessories & Luxury Goods–0.11%Hanesbrands, Inc., 4.63%,
05/15/2024(b) $ 3,232,000 $ 3,434,000
Asset Management & Custody Banks–0.23% Ameriprise Financial, Inc.,
3.00%, 03/22/2022 3,000,000 3,047,1423.00%, 04/02/2025 1,497,000 1,598,900
Apollo Management HoldingsL.P., 4.95%, 01/14/2050(b)(d) 2,475,000 2,574,264
7,220,306
Automobile Manufacturers–4.75%BMW Finance N.V. (Germany),
2.40%, 08/14/2024(b) 5,547,000 5,811,885Daimler Finance North America
LLC (Germany), 2.70%,06/14/2024(b) 5,270,000 5,541,844
Ford Motor Credit Co. LLC, 1.00% (3 mo. USD LIBOR +0.88%), 10/12/2021(e) 6,243,000 6,243,2243.81%, 10/12/2021 6,654,000 6,665,4455.60%, 01/07/2022 4,592,000 4,657,8953.09%, 01/09/2023 3,285,000 3,350,7002.70%, 08/10/2026 10,647,000 10,763,585
General Motors Financial Co.,Inc., 4.20%, 11/06/2021 9,339,000 9,404,6070.81% (SOFR + 0.76%),03/08/2024(e) 4,614,000 4,655,8361.05%, 03/08/2024 5,999,000 6,038,289
Harley-Davidson FinancialServices, Inc., 3.35%,06/08/2025(b) 4,786,000 5,090,545
Hyundai Capital America, 3.95%, 02/01/2022(b) 16,000,000 16,226,6053.10%, 04/05/2022(b)(c) 6,011,000 6,102,8442.85%, 11/01/2022(b) 6,667,000 6,842,1575.75%, 04/06/2023(b) 7,402,000 7,984,6315.88%, 04/07/2025(b) 6,208,000 7,157,121
Kia Corp. (South Korea), 1.00%, 04/16/2024(b) 8,761,000 8,789,2191.75%, 10/16/2026(b) 1,064,000 1,075,933
Nissan Motor Co. Ltd. (Japan),3.04%, 09/15/2023(b) 7,361,000 7,672,273
Toyota Motor Corp. (Japan),2.36%, 07/02/2024(c) 3,697,000 3,881,073
Toyota Motor Credit Corp.,0.80%, 10/16/2025 13,170,000 13,103,074
147,058,785
Automotive Retail–0.16% AutoZone, Inc., 3.63%,
04/15/2025(c) 4,557,000 4,964,701
Biotechnology–0.99% AbbVie, Inc.,
2.30%, 11/21/2022 4,437,000 4,539,1233.85%, 06/15/2024 7,600,000 8,209,4232.60%, 11/21/2024 13,231,000 13,945,330
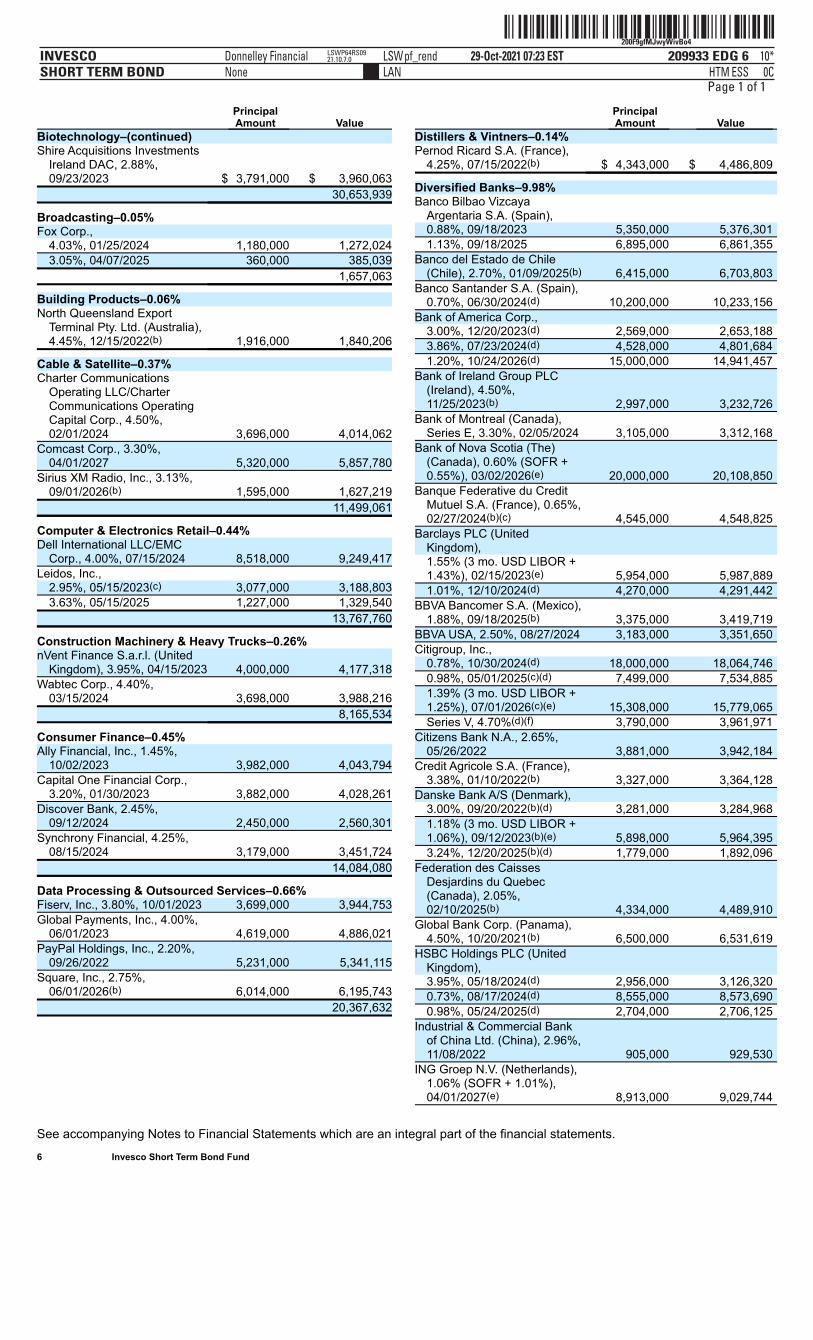
ˆ200F9gfMJwyWivBo4Š200F9gfMJwyWivBo4
209933 EDG 6INVESCOSHORT TERM BOND
29-Oct-2021 07:23 ESTHTMLAN
Donnelley Financial LSWpf_rendNone
10*ESS 0C
LSWP64RS0921.10.7.0
Page 1 of 1
See accompanying Notes to Financial Statements which are an integral part of the financial statements. 6 Invesco Short Term Bond Fund
PrincipalAmount Value
Biotechnology–(continued) Shire Acquisitions Investments
Ireland DAC, 2.88%,09/23/2023 $ 3,791,000 $ 3,960,063
30,653,939
Broadcasting–0.05% Fox Corp.,
4.03%, 01/25/2024 1,180,000 1,272,0243.05%, 04/07/2025 360,000 385,039
1,657,063
Building Products–0.06% North Queensland Export
Terminal Pty. Ltd. (Australia),4.45%, 12/15/2022(b) 1,916,000 1,840,206
Cable & Satellite–0.37% Charter Communications
Operating LLC/CharterCommunications OperatingCapital Corp., 4.50%,02/01/2024 3,696,000 4,014,062
Comcast Corp., 3.30%,04/01/2027 5,320,000 5,857,780
Sirius XM Radio, Inc., 3.13%,09/01/2026(b) 1,595,000 1,627,219
11,499,061
Computer & Electronics Retail–0.44% Dell International LLC/EMC
Corp., 4.00%, 07/15/2024 8,518,000 9,249,417Leidos, Inc.,
2.95%, 05/15/2023(c) 3,077,000 3,188,8033.63%, 05/15/2025 1,227,000 1,329,540
13,767,760
Construction Machinery & Heavy Trucks–0.26%nVent Finance S.a.r.l. (United
Kingdom), 3.95%, 04/15/2023 4,000,000 4,177,318Wabtec Corp., 4.40%,
03/15/2024 3,698,000 3,988,216 8,165,534
Consumer Finance–0.45% Ally Financial, Inc., 1.45%,
10/02/2023 3,982,000 4,043,794Capital One Financial Corp.,
3.20%, 01/30/2023 3,882,000 4,028,261Discover Bank, 2.45%,
09/12/2024 2,450,000 2,560,301Synchrony Financial, 4.25%,
08/15/2024 3,179,000 3,451,724 14,084,080
Data Processing & Outsourced Services–0.66%Fiserv, Inc., 3.80%, 10/01/2023 3,699,000 3,944,753Global Payments, Inc., 4.00%,
06/01/2023 4,619,000 4,886,021PayPal Holdings, Inc., 2.20%,
09/26/2022 5,231,000 5,341,115Square, Inc., 2.75%,
06/01/2026(b) 6,014,000 6,195,743 20,367,632
PrincipalAmount Value
Distillers & Vintners–0.14% Pernod Ricard S.A. (France),
4.25%, 07/15/2022(b) $ 4,343,000 $ 4,486,809
Diversified Banks–9.98% Banco Bilbao Vizcaya
Argentaria S.A. (Spain), 0.88%, 09/18/2023 5,350,000 5,376,301 1.13%, 09/18/2025 6,895,000 6,861,355
Banco del Estado de Chile(Chile), 2.70%, 01/09/2025(b) 6,415,000 6,703,803
Banco Santander S.A. (Spain),0.70%, 06/30/2024(d) 10,200,000 10,233,156
Bank of America Corp., 3.00%, 12/20/2023(d) 2,569,000 2,653,188 3.86%, 07/23/2024(d) 4,528,000 4,801,684 1.20%, 10/24/2026(d) 15,000,000 14,941,457
Bank of Ireland Group PLC(Ireland), 4.50%,11/25/2023(b) 2,997,000 3,232,726
Bank of Montreal (Canada),Series E, 3.30%, 02/05/2024 3,105,000 3,312,168
Bank of Nova Scotia (The)(Canada), 0.60% (SOFR +0.55%), 03/02/2026(e) 20,000,000 20,108,850
Banque Federative du CreditMutuel S.A. (France), 0.65%,02/27/2024(b)(c) 4,545,000 4,548,825
Barclays PLC (UnitedKingdom), 1.55% (3 mo. USD LIBOR +1.43%), 02/15/2023(e) 5,954,000 5,987,889 1.01%, 12/10/2024(d) 4,270,000 4,291,442
BBVA Bancomer S.A. (Mexico),1.88%, 09/18/2025(b) 3,375,000 3,419,719
BBVA USA, 2.50%, 08/27/2024 3,183,000 3,351,650 Citigroup, Inc.,
0.78%, 10/30/2024(d) 18,000,000 18,064,746 0.98%, 05/01/2025(c)(d) 7,499,000 7,534,885 1.39% (3 mo. USD LIBOR +1.25%), 07/01/2026(c)(e) 15,308,000 15,779,065 Series V, 4.70%(d)(f) 3,790,000 3,961,971
Citizens Bank N.A., 2.65%,05/26/2022 3,881,000 3,942,184
Credit Agricole S.A. (France),3.38%, 01/10/2022(b) 3,327,000 3,364,128
Danske Bank A/S (Denmark), 3.00%, 09/20/2022(b)(d) 3,281,000 3,284,968 1.18% (3 mo. USD LIBOR +1.06%), 09/12/2023(b)(e) 5,898,000 5,964,395 3.24%, 12/20/2025(b)(d) 1,779,000 1,892,096
Federation des CaissesDesjardins du Quebec(Canada), 2.05%,02/10/2025(b) 4,334,000 4,489,910
Global Bank Corp. (Panama),4.50%, 10/20/2021(b) 6,500,000 6,531,619
HSBC Holdings PLC (UnitedKingdom), 3.95%, 05/18/2024(d) 2,956,000 3,126,320 0.73%, 08/17/2024(d) 8,555,000 8,573,690 0.98%, 05/24/2025(d) 2,704,000 2,706,125
Industrial & Commercial Bankof China Ltd. (China), 2.96%,11/08/2022 905,000 929,530
ING Groep N.V. (Netherlands),1.06% (SOFR + 1.01%),04/01/2027(e) 8,913,000 9,029,744
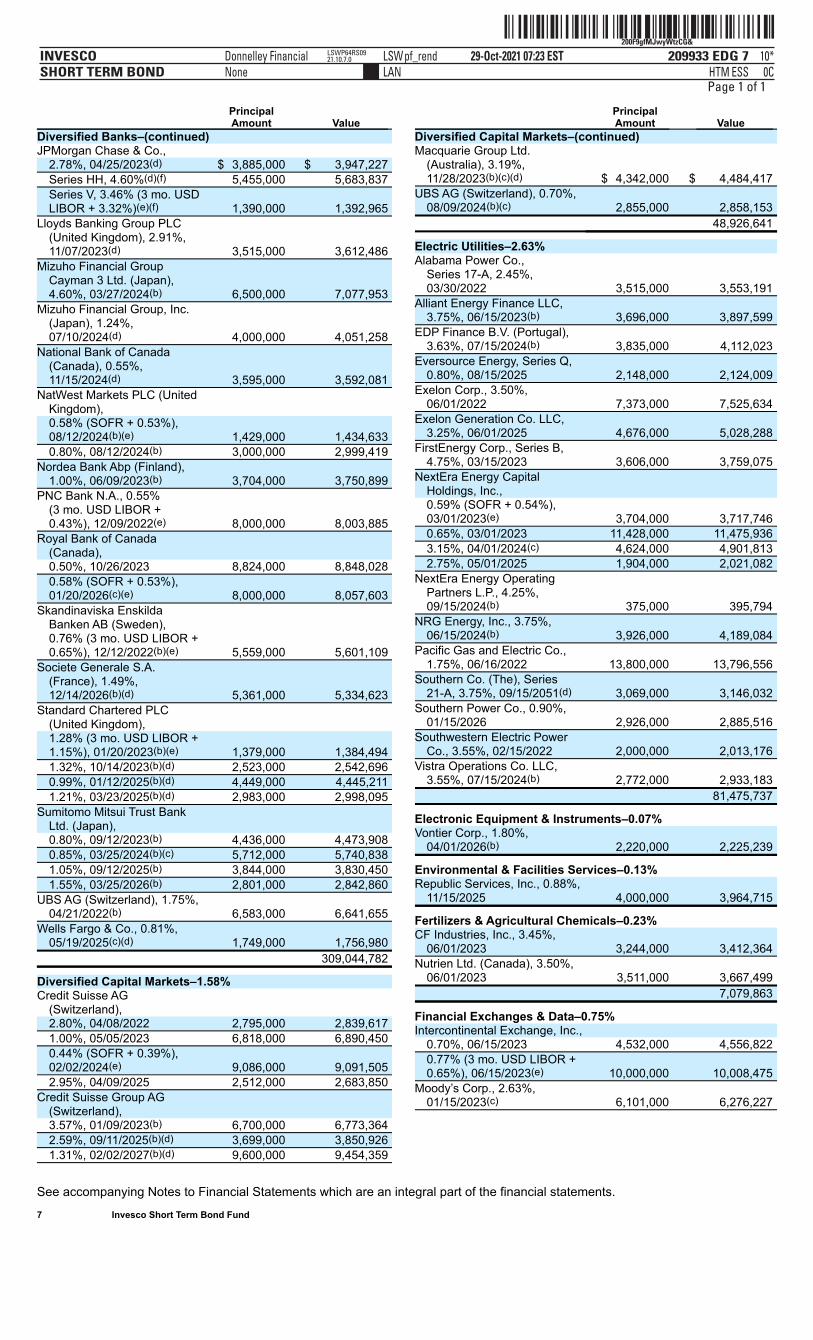
ˆ200F9gfMJwyWtzCG&Š200F9gfMJwyWtzCG&
209933 EDG 7INVESCOSHORT TERM BOND
29-Oct-2021 07:23 ESTHTMLAN
Donnelley Financial LSWpf_rendNone
10*ESS 0C
LSWP64RS0921.10.7.0
Page 1 of 1
See accompanying Notes to Financial Statements which are an integral part of the financial statements. 7 Invesco Short Term Bond Fund
PrincipalAmount Value
Diversified Banks–(continued) JPMorgan Chase & Co.,
2.78%, 04/25/2023(d) $ 3,885,000 $ 3,947,227 Series HH, 4.60%(d)(f) 5,455,000 5,683,837 Series V, 3.46% (3 mo. USDLIBOR + 3.32%)(e)(f) 1,390,000 1,392,965
Lloyds Banking Group PLC(United Kingdom), 2.91%,11/07/2023(d) 3,515,000 3,612,486
Mizuho Financial GroupCayman 3 Ltd. (Japan),4.60%, 03/27/2024(b) 6,500,000 7,077,953
Mizuho Financial Group, Inc.(Japan), 1.24%,07/10/2024(d) 4,000,000 4,051,258
National Bank of Canada(Canada), 0.55%,11/15/2024(d) 3,595,000 3,592,081
NatWest Markets PLC (UnitedKingdom), 0.58% (SOFR + 0.53%),08/12/2024(b)(e) 1,429,000 1,434,633 0.80%, 08/12/2024(b) 3,000,000 2,999,419
Nordea Bank Abp (Finland),1.00%, 06/09/2023(b) 3,704,000 3,750,899
PNC Bank N.A., 0.55%(3 mo. USD LIBOR +0.43%), 12/09/2022(e) 8,000,000 8,003,885
Royal Bank of Canada(Canada), 0.50%, 10/26/2023 8,824,000 8,848,028 0.58% (SOFR + 0.53%),01/20/2026(c)(e) 8,000,000 8,057,603
Skandinaviska EnskildaBanken AB (Sweden),0.76% (3 mo. USD LIBOR +0.65%), 12/12/2022(b)(e) 5,559,000 5,601,109
Societe Generale S.A.(France), 1.49%,12/14/2026(b)(d) 5,361,000 5,334,623
Standard Chartered PLC(United Kingdom), 1.28% (3 mo. USD LIBOR +1.15%), 01/20/2023(b)(e) 1,379,000 1,384,494 1.32%, 10/14/2023(b)(d) 2,523,000 2,542,696 0.99%, 01/12/2025(b)(d) 4,449,000 4,445,211 1.21%, 03/23/2025(b)(d) 2,983,000 2,998,095
Sumitomo Mitsui Trust BankLtd. (Japan), 0.80%, 09/12/2023(b) 4,436,000 4,473,908 0.85%, 03/25/2024(b)(c) 5,712,000 5,740,838 1.05%, 09/12/2025(b) 3,844,000 3,830,450 1.55%, 03/25/2026(b) 2,801,000 2,842,860
UBS AG (Switzerland), 1.75%,04/21/2022(b) 6,583,000 6,641,655
Wells Fargo & Co., 0.81%,05/19/2025(c)(d) 1,749,000 1,756,980
309,044,782
Diversified Capital Markets–1.58% Credit Suisse AG
(Switzerland), 2.80%, 04/08/2022 2,795,000 2,839,617 1.00%, 05/05/2023 6,818,000 6,890,450 0.44% (SOFR + 0.39%),02/02/2024(e) 9,086,000 9,091,505 2.95%, 04/09/2025 2,512,000 2,683,850
Credit Suisse Group AG(Switzerland), 3.57%, 01/09/2023(b) 6,700,000 6,773,364 2.59%, 09/11/2025(b)(d) 3,699,000 3,850,926 1.31%, 02/02/2027(b)(d) 9,600,000 9,454,359
PrincipalAmount Value
Diversified Capital Markets–(continued) Macquarie Group Ltd.
(Australia), 3.19%,11/28/2023(b)(c)(d) $ 4,342,000 $ 4,484,417
UBS AG (Switzerland), 0.70%,08/09/2024(b)(c) 2,855,000 2,858,153
48,926,641
Electric Utilities–2.63% Alabama Power Co.,
Series 17-A, 2.45%,03/30/2022 3,515,000 3,553,191
Alliant Energy Finance LLC,3.75%, 06/15/2023(b) 3,696,000 3,897,599
EDP Finance B.V. (Portugal),3.63%, 07/15/2024(b) 3,835,000 4,112,023
Eversource Energy, Series Q,0.80%, 08/15/2025 2,148,000 2,124,009
Exelon Corp., 3.50%,06/01/2022 7,373,000 7,525,634
Exelon Generation Co. LLC,3.25%, 06/01/2025 4,676,000 5,028,288
FirstEnergy Corp., Series B,4.75%, 03/15/2023 3,606,000 3,759,075
NextEra Energy CapitalHoldings, Inc., 0.59% (SOFR + 0.54%),03/01/2023(e) 3,704,000 3,717,746 0.65%, 03/01/2023 11,428,000 11,475,936 3.15%, 04/01/2024(c) 4,624,000 4,901,813 2.75%, 05/01/2025 1,904,000 2,021,082
NextEra Energy OperatingPartners L.P., 4.25%,09/15/2024(b) 375,000 395,794
NRG Energy, Inc., 3.75%,06/15/2024(b) 3,926,000 4,189,084
Pacific Gas and Electric Co.,1.75%, 06/16/2022 13,800,000 13,796,556
Southern Co. (The), Series21-A, 3.75%, 09/15/2051(d) 3,069,000 3,146,032
Southern Power Co., 0.90%,01/15/2026 2,926,000 2,885,516
Southwestern Electric PowerCo., 3.55%, 02/15/2022 2,000,000 2,013,176
Vistra Operations Co. LLC,3.55%, 07/15/2024(b) 2,772,000 2,933,183
81,475,737
Electronic Equipment & Instruments–0.07% Vontier Corp., 1.80%,
04/01/2026(b) 2,220,000 2,225,239
Environmental & Facilities Services–0.13% Republic Services, Inc., 0.88%,
11/15/2025 4,000,000 3,964,715
Fertilizers & Agricultural Chemicals–0.23% CF Industries, Inc., 3.45%,
06/01/2023 3,244,000 3,412,364 Nutrien Ltd. (Canada), 3.50%,
06/01/2023 3,511,000 3,667,499 7,079,863
Financial Exchanges & Data–0.75% Intercontinental Exchange, Inc.,
0.70%, 06/15/2023 4,532,000 4,556,822 0.77% (3 mo. USD LIBOR +0.65%), 06/15/2023(e) 10,000,000 10,008,475
Moody’s Corp., 2.63%,01/15/2023(c) 6,101,000 6,276,227
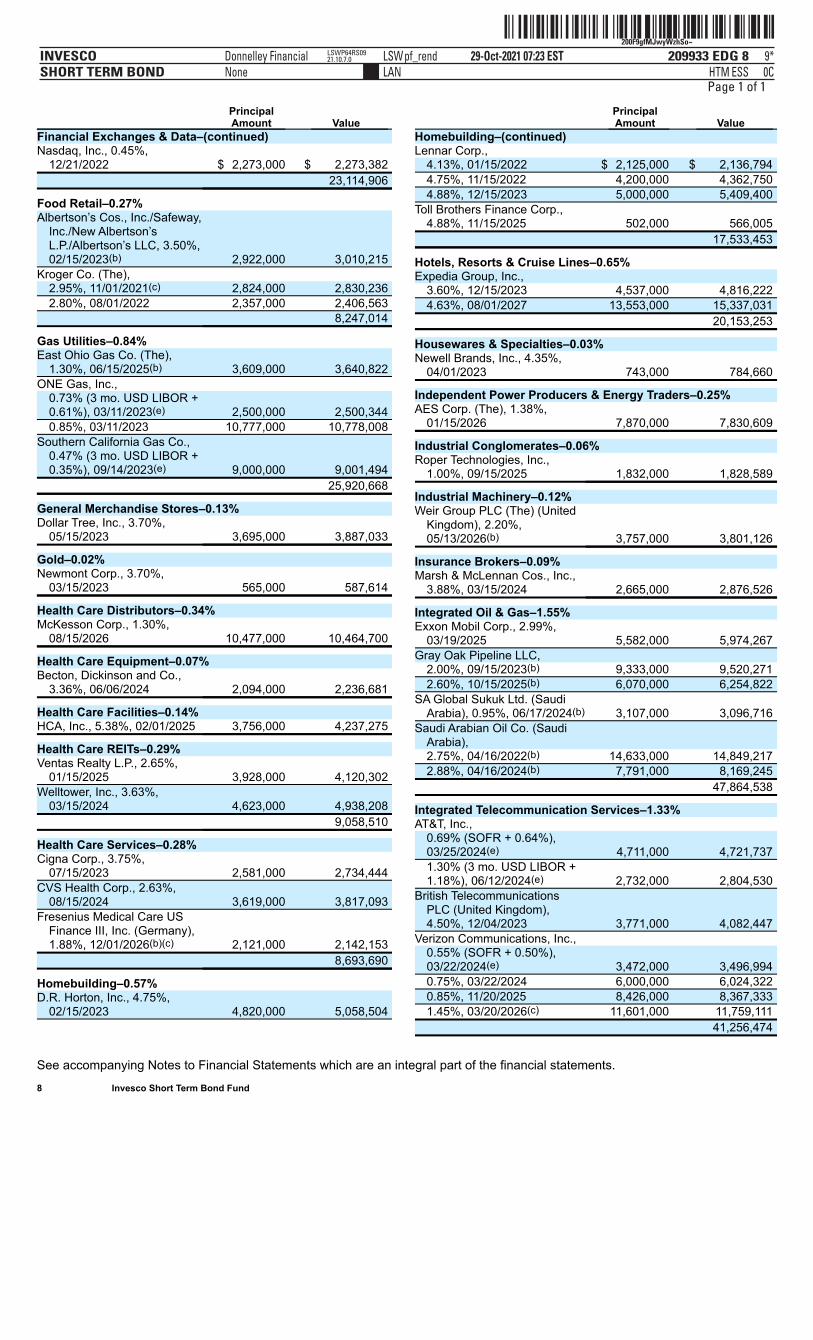
ˆ200F9gfMJwyWzhSo~Š200F9gfMJwyWzhSo~
209933 EDG 8INVESCOSHORT TERM BOND
29-Oct-2021 07:23 ESTHTMLAN
Donnelley Financial LSWpf_rendNone
9*ESS 0C
LSWP64RS0921.10.7.0
Page 1 of 1
See accompanying Notes to Financial Statements which are an integral part of the financial statements. 8 Invesco Short Term Bond Fund
PrincipalAmount Value
Financial Exchanges & Data–(continued) Nasdaq, Inc., 0.45%,
12/21/2022 $ 2,273,000 $ 2,273,382 23,114,906
Food Retail–0.27% Albertson’s Cos., Inc./Safeway,
Inc./New Albertson’sL.P./Albertson’s LLC, 3.50%,02/15/2023(b) 2,922,000 3,010,215
Kroger Co. (The), 2.95%, 11/01/2021(c) 2,824,000 2,830,236 2.80%, 08/01/2022 2,357,000 2,406,563
8,247,014
Gas Utilities–0.84% East Ohio Gas Co. (The),
1.30%, 06/15/2025(b) 3,609,000 3,640,822 ONE Gas, Inc.,
0.73% (3 mo. USD LIBOR +0.61%), 03/11/2023(e) 2,500,000 2,500,344 0.85%, 03/11/2023 10,777,000 10,778,008
Southern California Gas Co.,0.47% (3 mo. USD LIBOR +0.35%), 09/14/2023(e) 9,000,000 9,001,494
25,920,668
General Merchandise Stores–0.13% Dollar Tree, Inc., 3.70%,
05/15/2023 3,695,000 3,887,033
Gold–0.02% Newmont Corp., 3.70%,
03/15/2023 565,000 587,614
Health Care Distributors–0.34% McKesson Corp., 1.30%,
08/15/2026 10,477,000 10,464,700
Health Care Equipment–0.07% Becton, Dickinson and Co.,
3.36%, 06/06/2024 2,094,000 2,236,681
Health Care Facilities–0.14% HCA, Inc., 5.38%, 02/01/2025 3,756,000 4,237,275
Health Care REITs–0.29% Ventas Realty L.P., 2.65%,
01/15/2025 3,928,000 4,120,302 Welltower, Inc., 3.63%,
03/15/2024 4,623,000 4,938,208 9,058,510
Health Care Services–0.28% Cigna Corp., 3.75%,
07/15/2023 2,581,000 2,734,444 CVS Health Corp., 2.63%,
08/15/2024 3,619,000 3,817,093 Fresenius Medical Care US
Finance III, Inc. (Germany),1.88%, 12/01/2026(b)(c) 2,121,000 2,142,153
8,693,690
Homebuilding–0.57% D.R. Horton, Inc., 4.75%,
02/15/2023 4,820,000 5,058,504
PrincipalAmount Value
Homebuilding–(continued) Lennar Corp.,
4.13%, 01/15/2022 $ 2,125,000 $ 2,136,794 4.75%, 11/15/2022 4,200,000 4,362,750 4.88%, 12/15/2023 5,000,000 5,409,400
Toll Brothers Finance Corp.,4.88%, 11/15/2025 502,000 566,005
17,533,453
Hotels, Resorts & Cruise Lines–0.65% Expedia Group, Inc.,
3.60%, 12/15/2023 4,537,000 4,816,222 4.63%, 08/01/2027 13,553,000 15,337,031
20,153,253
Housewares & Specialties–0.03% Newell Brands, Inc., 4.35%,
04/01/2023 743,000 784,660
Independent Power Producers & Energy Traders–0.25% AES Corp. (The), 1.38%,
01/15/2026 7,870,000 7,830,609
Industrial Conglomerates–0.06% Roper Technologies, Inc.,
1.00%, 09/15/2025 1,832,000 1,828,589
Industrial Machinery–0.12% Weir Group PLC (The) (United
Kingdom), 2.20%,05/13/2026(b) 3,757,000 3,801,126
Insurance Brokers–0.09% Marsh & McLennan Cos., Inc.,
3.88%, 03/15/2024 2,665,000 2,876,526
Integrated Oil & Gas–1.55% Exxon Mobil Corp., 2.99%,
03/19/2025 5,582,000 5,974,267 Gray Oak Pipeline LLC,
2.00%, 09/15/2023(b) 9,333,000 9,520,271 2.60%, 10/15/2025(b) 6,070,000 6,254,822
SA Global Sukuk Ltd. (SaudiArabia), 0.95%, 06/17/2024(b) 3,107,000 3,096,716
Saudi Arabian Oil Co. (SaudiArabia), 2.75%, 04/16/2022(b) 14,633,000 14,849,217 2.88%, 04/16/2024(b) 7,791,000 8,169,245
47,864,538
Integrated Telecommunication Services–1.33% AT&T, Inc.,
0.69% (SOFR + 0.64%),03/25/2024(e) 4,711,000 4,721,737 1.30% (3 mo. USD LIBOR +1.18%), 06/12/2024(e) 2,732,000 2,804,530
British TelecommunicationsPLC (United Kingdom),4.50%, 12/04/2023 3,771,000 4,082,447
Verizon Communications, Inc., 0.55% (SOFR + 0.50%),03/22/2024(e) 3,472,000 3,496,994 0.75%, 03/22/2024 6,000,000 6,024,322 0.85%, 11/20/2025 8,426,000 8,367,333 1.45%, 03/20/2026(c) 11,601,000 11,759,111
41,256,474
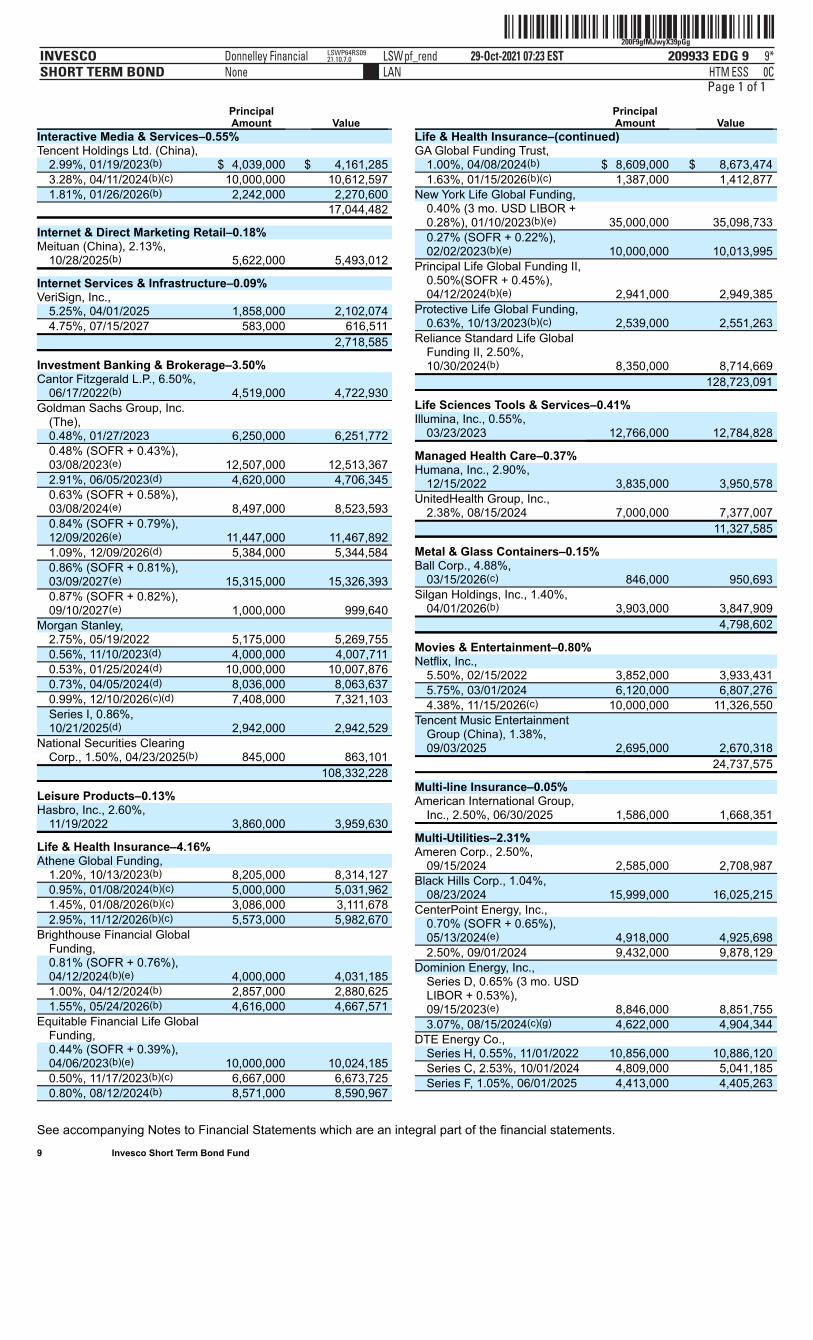
ˆ200F9gfMJwyX39pGgŠ200F9gfMJwyX39pGg
209933 EDG 9INVESCOSHORT TERM BOND
29-Oct-2021 07:23 ESTHTMLAN
Donnelley Financial LSWpf_rendNone
9*ESS 0C
LSWP64RS0921.10.7.0
Page 1 of 1
See accompanying Notes to Financial Statements which are an integral part of the financial statements. 9 Invesco Short Term Bond Fund
PrincipalAmount Value
Interactive Media & Services–0.55% Tencent Holdings Ltd. (China),
2.99%, 01/19/2023(b) $ 4,039,000 $ 4,161,285 3.28%, 04/11/2024(b)(c) 10,000,000 10,612,597 1.81%, 01/26/2026(b) 2,242,000 2,270,600
17,044,482
Internet & Direct Marketing Retail–0.18% Meituan (China), 2.13%,
10/28/2025(b) 5,622,000 5,493,012
Internet Services & Infrastructure–0.09% VeriSign, Inc.,
5.25%, 04/01/2025 1,858,000 2,102,074 4.75%, 07/15/2027 583,000 616,511
2,718,585
Investment Banking & Brokerage–3.50% Cantor Fitzgerald L.P., 6.50%,
06/17/2022(b) 4,519,000 4,722,930 Goldman Sachs Group, Inc.
(The), 0.48%, 01/27/2023 6,250,000 6,251,772 0.48% (SOFR + 0.43%),03/08/2023(e) 12,507,000 12,513,367 2.91%, 06/05/2023(d) 4,620,000 4,706,345 0.63% (SOFR + 0.58%),03/08/2024(e) 8,497,000 8,523,593 0.84% (SOFR + 0.79%),12/09/2026(e) 11,447,000 11,467,892 1.09%, 12/09/2026(d) 5,384,000 5,344,584 0.86% (SOFR + 0.81%),03/09/2027(e) 15,315,000 15,326,393 0.87% (SOFR + 0.82%),09/10/2027(e) 1,000,000 999,640
Morgan Stanley, 2.75%, 05/19/2022 5,175,000 5,269,755 0.56%, 11/10/2023(d) 4,000,000 4,007,711 0.53%, 01/25/2024(d) 10,000,000 10,007,876 0.73%, 04/05/2024(d) 8,036,000 8,063,637 0.99%, 12/10/2026(c)(d) 7,408,000 7,321,103 Series I, 0.86%,10/21/2025(d) 2,942,000 2,942,529
National Securities ClearingCorp., 1.50%, 04/23/2025(b) 845,000 863,101
108,332,228
Leisure Products–0.13% Hasbro, Inc., 2.60%,
11/19/2022 3,860,000 3,959,630
Life & Health Insurance–4.16% Athene Global Funding,
1.20%, 10/13/2023(b) 8,205,000 8,314,127 0.95%, 01/08/2024(b)(c) 5,000,000 5,031,962 1.45%, 01/08/2026(b)(c) 3,086,000 3,111,678 2.95%, 11/12/2026(b)(c) 5,573,000 5,982,670
Brighthouse Financial GlobalFunding, 0.81% (SOFR + 0.76%),04/12/2024(b)(e) 4,000,000 4,031,185 1.00%, 04/12/2024(b) 2,857,000 2,880,625 1.55%, 05/24/2026(b) 4,616,000 4,667,571
Equitable Financial Life GlobalFunding, 0.44% (SOFR + 0.39%),04/06/2023(b)(e) 10,000,000 10,024,185 0.50%, 11/17/2023(b)(c) 6,667,000 6,673,725 0.80%, 08/12/2024(b) 8,571,000 8,590,967
PrincipalAmount Value
Life & Health Insurance–(continued) GA Global Funding Trust,
1.00%, 04/08/2024(b) $ 8,609,000 $ 8,673,474 1.63%, 01/15/2026(b)(c) 1,387,000 1,412,877
New York Life Global Funding, 0.40% (3 mo. USD LIBOR +0.28%), 01/10/2023(b)(e) 35,000,000 35,098,733 0.27% (SOFR + 0.22%),02/02/2023(b)(e) 10,000,000 10,013,995
Principal Life Global Funding II,0.50%(SOFR + 0.45%),04/12/2024(b)(e) 2,941,000 2,949,385
Protective Life Global Funding,0.63%, 10/13/2023(b)(c) 2,539,000 2,551,263
Reliance Standard Life GlobalFunding II, 2.50%,10/30/2024(b) 8,350,000 8,714,669
128,723,091
Life Sciences Tools & Services–0.41% Illumina, Inc., 0.55%,
03/23/2023 12,766,000 12,784,828
Managed Health Care–0.37% Humana, Inc., 2.90%,
12/15/2022 3,835,000 3,950,578 UnitedHealth Group, Inc.,
2.38%, 08/15/2024 7,000,000 7,377,007 11,327,585
Metal & Glass Containers–0.15% Ball Corp., 4.88%,
03/15/2026(c) 846,000 950,693 Silgan Holdings, Inc., 1.40%,
04/01/2026(b) 3,903,000 3,847,909 4,798,602
Movies & Entertainment–0.80% Netflix, Inc.,
5.50%, 02/15/2022 3,852,000 3,933,431 5.75%, 03/01/2024 6,120,000 6,807,276 4.38%, 11/15/2026(c) 10,000,000 11,326,550
Tencent Music EntertainmentGroup (China), 1.38%,09/03/2025 2,695,000 2,670,318
24,737,575
Multi-line Insurance–0.05% American International Group,
Inc., 2.50%, 06/30/2025 1,586,000 1,668,351
Multi-Utilities–2.31% Ameren Corp., 2.50%,
09/15/2024 2,585,000 2,708,987 Black Hills Corp., 1.04%,
08/23/2024 15,999,000 16,025,215 CenterPoint Energy, Inc.,
0.70% (SOFR + 0.65%),05/13/2024(e) 4,918,000 4,925,698 2.50%, 09/01/2024 9,432,000 9,878,129
Dominion Energy, Inc., Series D, 0.65% (3 mo. USDLIBOR + 0.53%),09/15/2023(e) 8,846,000 8,851,755 3.07%, 08/15/2024(c)(g) 4,622,000 4,904,344
DTE Energy Co., Series H, 0.55%, 11/01/2022 10,856,000 10,886,120 Series C, 2.53%, 10/01/2024 4,809,000 5,041,185 Series F, 1.05%, 06/01/2025 4,413,000 4,405,263
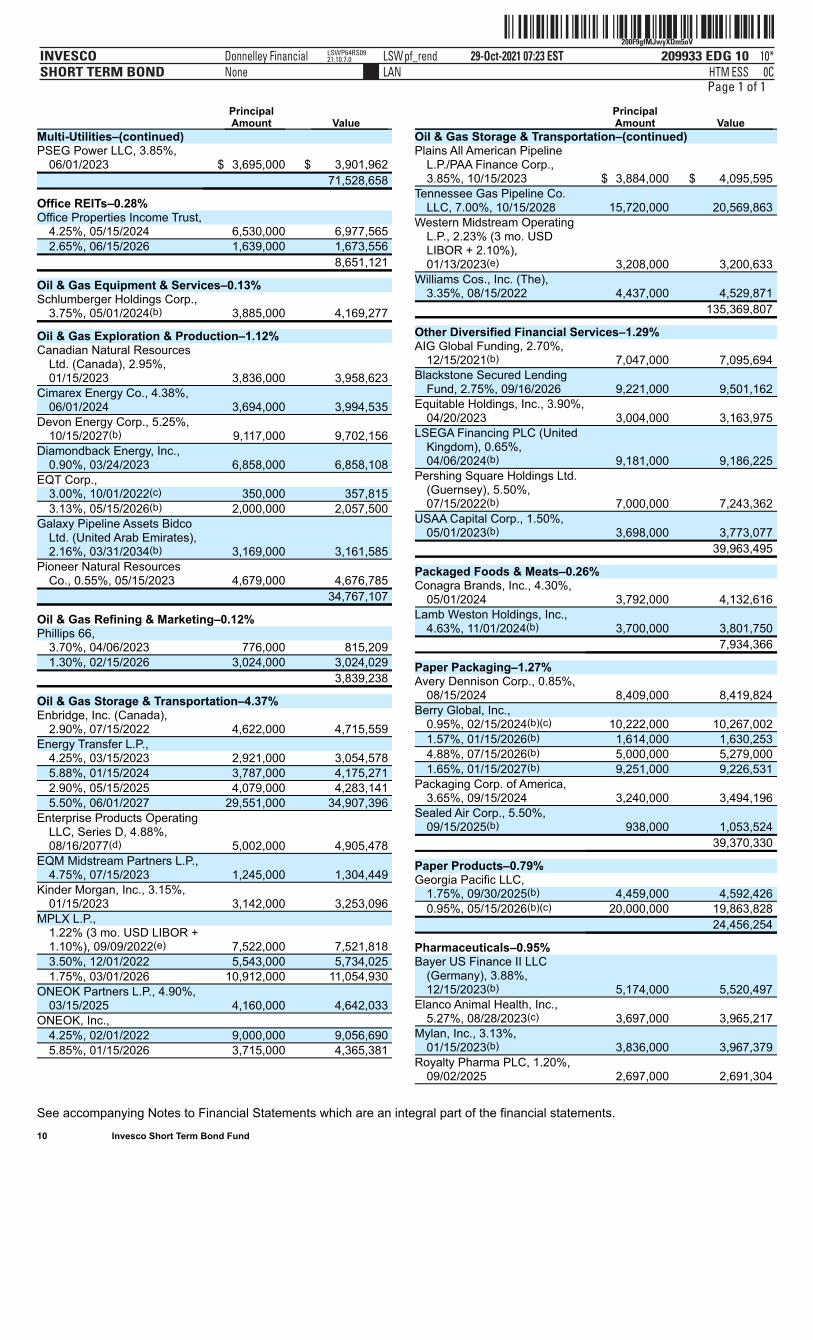
ˆ200F9gfMJwyXDm5oVŠ200F9gfMJwyXDm5oV
209933 EDG 10INVESCOSHORT TERM BOND
29-Oct-2021 07:23 ESTHTMLAN
Donnelley Financial LSWpf_rendNone
10*ESS 0C
LSWP64RS0921.10.7.0
Page 1 of 1
See accompanying Notes to Financial Statements which are an integral part of the financial statements. 10 Invesco Short Term Bond Fund
PrincipalAmount Value
Multi-Utilities–(continued) PSEG Power LLC, 3.85%,
06/01/2023 $ 3,695,000 $ 3,901,962 71,528,658
Office REITs–0.28% Office Properties Income Trust,
4.25%, 05/15/2024 6,530,000 6,977,565 2.65%, 06/15/2026 1,639,000 1,673,556
8,651,121
Oil & Gas Equipment & Services–0.13% Schlumberger Holdings Corp.,
3.75%, 05/01/2024(b) 3,885,000 4,169,277
Oil & Gas Exploration & Production–1.12% Canadian Natural Resources
Ltd. (Canada), 2.95%,01/15/2023 3,836,000 3,958,623
Cimarex Energy Co., 4.38%,06/01/2024 3,694,000 3,994,535
Devon Energy Corp., 5.25%,10/15/2027(b) 9,117,000 9,702,156
Diamondback Energy, Inc.,0.90%, 03/24/2023 6,858,000 6,858,108
EQT Corp., 3.00%, 10/01/2022(c) 350,000 357,815 3.13%, 05/15/2026(b) 2,000,000 2,057,500
Galaxy Pipeline Assets BidcoLtd. (United Arab Emirates),2.16%, 03/31/2034(b) 3,169,000 3,161,585
Pioneer Natural ResourcesCo., 0.55%, 05/15/2023 4,679,000 4,676,785
34,767,107
Oil & Gas Refining & Marketing–0.12% Phillips 66,
3.70%, 04/06/2023 776,000 815,209 1.30%, 02/15/2026 3,024,000 3,024,029
3,839,238
Oil & Gas Storage & Transportation–4.37% Enbridge, Inc. (Canada),
2.90%, 07/15/2022 4,622,000 4,715,559 Energy Transfer L.P.,
4.25%, 03/15/2023 2,921,000 3,054,578 5.88%, 01/15/2024 3,787,000 4,175,271 2.90%, 05/15/2025 4,079,000 4,283,141 5.50%, 06/01/2027 29,551,000 34,907,396
Enterprise Products OperatingLLC, Series D, 4.88%,08/16/2077(d) 5,002,000 4,905,478
EQM Midstream Partners L.P.,4.75%, 07/15/2023 1,245,000 1,304,449
Kinder Morgan, Inc., 3.15%,01/15/2023 3,142,000 3,253,096
MPLX L.P., 1.22% (3 mo. USD LIBOR +1.10%), 09/09/2022(e) 7,522,000 7,521,818 3.50%, 12/01/2022 5,543,000 5,734,025 1.75%, 03/01/2026 10,912,000 11,054,930
ONEOK Partners L.P., 4.90%,03/15/2025 4,160,000 4,642,033
ONEOK, Inc., 4.25%, 02/01/2022 9,000,000 9,056,690 5.85%, 01/15/2026 3,715,000 4,365,381
PrincipalAmount Value
Oil & Gas Storage & Transportation–(continued) Plains All American Pipeline
L.P./PAA Finance Corp.,3.85%, 10/15/2023 $ 3,884,000 $ 4,095,595
Tennessee Gas Pipeline Co.LLC, 7.00%, 10/15/2028 15,720,000 20,569,863
Western Midstream OperatingL.P., 2.23% (3 mo. USDLIBOR + 2.10%),01/13/2023(e) 3,208,000 3,200,633
Williams Cos., Inc. (The),3.35%, 08/15/2022 4,437,000 4,529,871
135,369,807
Other Diversified Financial Services–1.29% AIG Global Funding, 2.70%,
12/15/2021(b) 7,047,000 7,095,694 Blackstone Secured Lending
Fund, 2.75%, 09/16/2026 9,221,000 9,501,162 Equitable Holdings, Inc., 3.90%,
04/20/2023 3,004,000 3,163,975 LSEGA Financing PLC (United
Kingdom), 0.65%,04/06/2024(b) 9,181,000 9,186,225
Pershing Square Holdings Ltd.(Guernsey), 5.50%,07/15/2022(b) 7,000,000 7,243,362
USAA Capital Corp., 1.50%,05/01/2023(b) 3,698,000 3,773,077
39,963,495
Packaged Foods & Meats–0.26% Conagra Brands, Inc., 4.30%,
05/01/2024 3,792,000 4,132,616 Lamb Weston Holdings, Inc.,
4.63%, 11/01/2024(b) 3,700,000 3,801,750 7,934,366
Paper Packaging–1.27% Avery Dennison Corp., 0.85%,
08/15/2024 8,409,000 8,419,824 Berry Global, Inc.,
0.95%, 02/15/2024(b)(c) 10,222,000 10,267,002 1.57%, 01/15/2026(b) 1,614,000 1,630,253 4.88%, 07/15/2026(b) 5,000,000 5,279,000 1.65%, 01/15/2027(b) 9,251,000 9,226,531
Packaging Corp. of America,3.65%, 09/15/2024 3,240,000 3,494,196
Sealed Air Corp., 5.50%,09/15/2025(b) 938,000 1,053,524
39,370,330
Paper Products–0.79% Georgia Pacific LLC,
1.75%, 09/30/2025(b) 4,459,000 4,592,426 0.95%, 05/15/2026(b)(c) 20,000,000 19,863,828
24,456,254
Pharmaceuticals–0.95% Bayer US Finance II LLC
(Germany), 3.88%,12/15/2023(b) 5,174,000 5,520,497
Elanco Animal Health, Inc.,5.27%, 08/28/2023(c) 3,697,000 3,965,217
Mylan, Inc., 3.13%,01/15/2023(b) 3,836,000 3,967,379
Royalty Pharma PLC, 1.20%,09/02/2025 2,697,000 2,691,304
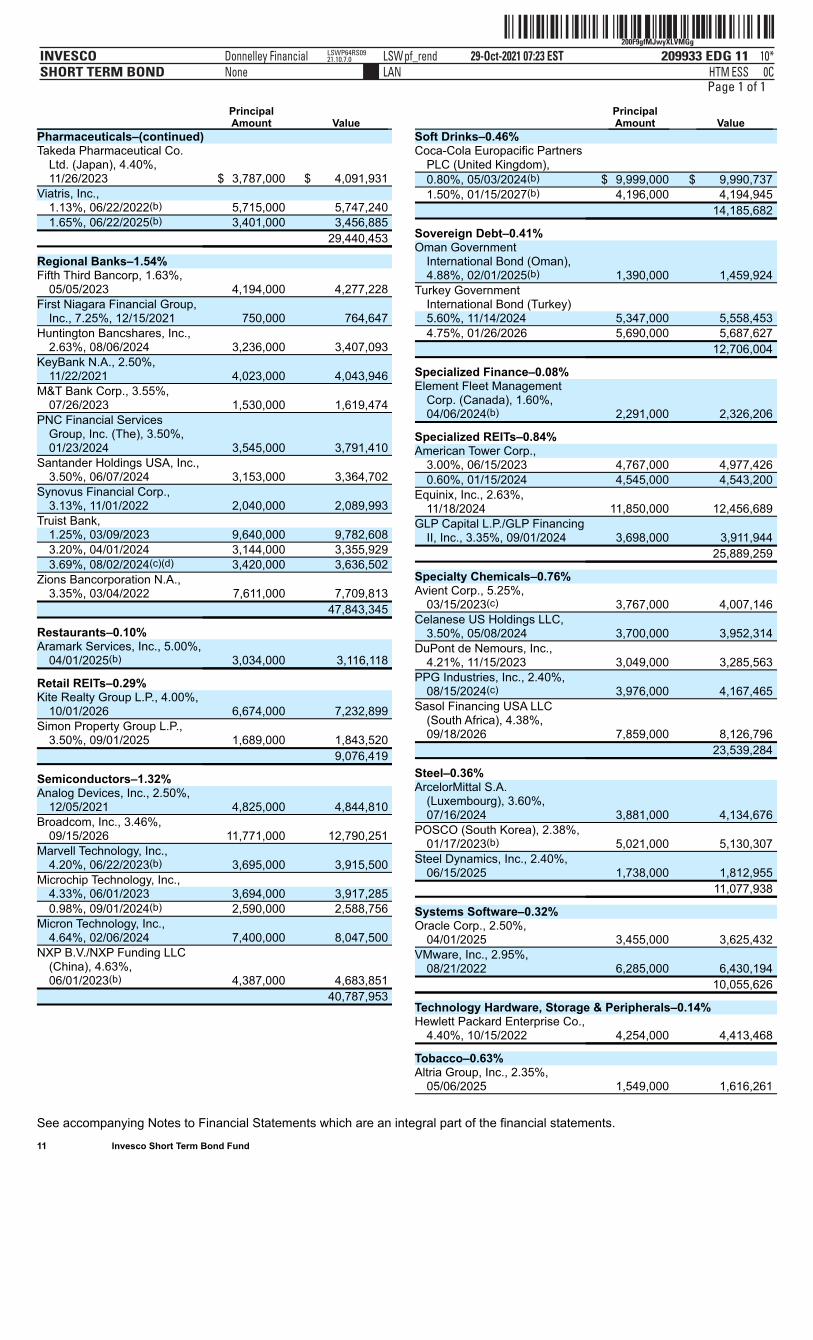
ˆ200F9gfMJwyXLVMGgŠ200F9gfMJwyXLVMGg
209933 EDG 11INVESCOSHORT TERM BOND
29-Oct-2021 07:23 ESTHTMLAN
Donnelley Financial LSWpf_rendNone
10*ESS 0C
LSWP64RS0921.10.7.0
Page 1 of 1
See accompanying Notes to Financial Statements which are an integral part of the financial statements. 11 Invesco Short Term Bond Fund
PrincipalAmount Value
Pharmaceuticals–(continued) Takeda Pharmaceutical Co.
Ltd. (Japan), 4.40%,11/26/2023 $ 3,787,000 $ 4,091,931
Viatris, Inc., 1.13%, 06/22/2022(b) 5,715,000 5,747,240 1.65%, 06/22/2025(b) 3,401,000 3,456,885
29,440,453
Regional Banks–1.54% Fifth Third Bancorp, 1.63%,
05/05/2023 4,194,000 4,277,228 First Niagara Financial Group,
Inc., 7.25%, 12/15/2021 750,000 764,647 Huntington Bancshares, Inc.,
2.63%, 08/06/2024 3,236,000 3,407,093 KeyBank N.A., 2.50%,
11/22/2021 4,023,000 4,043,946 M&T Bank Corp., 3.55%,
07/26/2023 1,530,000 1,619,474 PNC Financial Services
Group, Inc. (The), 3.50%,01/23/2024 3,545,000 3,791,410
Santander Holdings USA, Inc.,3.50%, 06/07/2024 3,153,000 3,364,702
Synovus Financial Corp.,3.13%, 11/01/2022 2,040,000 2,089,993
Truist Bank, 1.25%, 03/09/2023 9,640,000 9,782,608 3.20%, 04/01/2024 3,144,000 3,355,929 3.69%, 08/02/2024(c)(d) 3,420,000 3,636,502
Zions Bancorporation N.A.,3.35%, 03/04/2022 7,611,000 7,709,813
47,843,345
Restaurants–0.10% Aramark Services, Inc., 5.00%,
04/01/2025(b) 3,034,000 3,116,118
Retail REITs–0.29% Kite Realty Group L.P., 4.00%,
10/01/2026 6,674,000 7,232,899 Simon Property Group L.P.,
3.50%, 09/01/2025 1,689,000 1,843,520 9,076,419
Semiconductors–1.32% Analog Devices, Inc., 2.50%,
12/05/2021 4,825,000 4,844,810 Broadcom, Inc., 3.46%,
09/15/2026 11,771,000 12,790,251 Marvell Technology, Inc.,
4.20%, 06/22/2023(b) 3,695,000 3,915,500 Microchip Technology, Inc.,
4.33%, 06/01/2023 3,694,000 3,917,285 0.98%, 09/01/2024(b) 2,590,000 2,588,756
Micron Technology, Inc.,4.64%, 02/06/2024 7,400,000 8,047,500
NXP B.V./NXP Funding LLC(China), 4.63%,06/01/2023(b) 4,387,000 4,683,851
40,787,953
PrincipalAmount Value
Soft Drinks–0.46% Coca-Cola Europacific Partners
PLC (United Kingdom), 0.80%, 05/03/2024(b) $ 9,999,000 $ 9,990,737 1.50%, 01/15/2027(b) 4,196,000 4,194,945
14,185,682
Sovereign Debt–0.41% Oman Government
International Bond (Oman),4.88%, 02/01/2025(b) 1,390,000 1,459,924
Turkey GovernmentInternational Bond (Turkey) 5.60%, 11/14/2024 5,347,000 5,558,453 4.75%, 01/26/2026 5,690,000 5,687,627
12,706,004
Specialized Finance–0.08% Element Fleet Management
Corp. (Canada), 1.60%,04/06/2024(b) 2,291,000 2,326,206
Specialized REITs–0.84% American Tower Corp.,
3.00%, 06/15/2023 4,767,000 4,977,426 0.60%, 01/15/2024 4,545,000 4,543,200
Equinix, Inc., 2.63%,11/18/2024 11,850,000 12,456,689
GLP Capital L.P./GLP FinancingII, Inc., 3.35%, 09/01/2024 3,698,000 3,911,944
25,889,259
Specialty Chemicals–0.76% Avient Corp., 5.25%,
03/15/2023(c) 3,767,000 4,007,146 Celanese US Holdings LLC,
3.50%, 05/08/2024 3,700,000 3,952,314 DuPont de Nemours, Inc.,
4.21%, 11/15/2023 3,049,000 3,285,563 PPG Industries, Inc., 2.40%,
08/15/2024(c) 3,976,000 4,167,465 Sasol Financing USA LLC
(South Africa), 4.38%,09/18/2026 7,859,000 8,126,796
23,539,284
Steel–0.36% ArcelorMittal S.A.
(Luxembourg), 3.60%,07/16/2024 3,881,000 4,134,676
POSCO (South Korea), 2.38%,01/17/2023(b) 5,021,000 5,130,307
Steel Dynamics, Inc., 2.40%,06/15/2025 1,738,000 1,812,955
11,077,938
Systems Software–0.32% Oracle Corp., 2.50%,
04/01/2025 3,455,000 3,625,432 VMware, Inc., 2.95%,
08/21/2022 6,285,000 6,430,194 10,055,626
Technology Hardware, Storage & Peripherals–0.14% Hewlett Packard Enterprise Co.,
4.40%, 10/15/2022 4,254,000 4,413,468
Tobacco–0.63% Altria Group, Inc., 2.35%,
05/06/2025 1,549,000 1,616,261
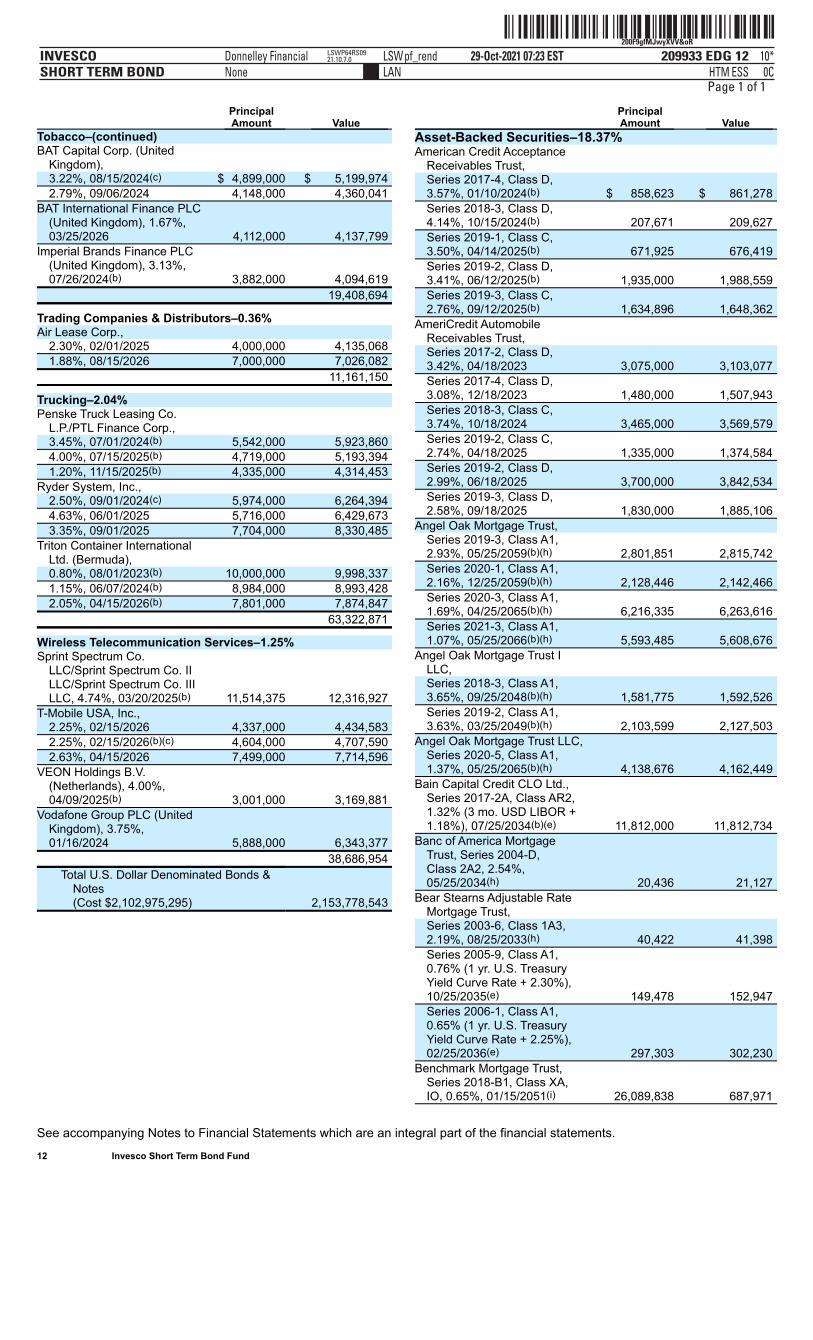
ˆ200F9gfMJwyXVV&oRŠ200F9gfMJwyXVV&oR
209933 EDG 12INVESCOSHORT TERM BOND
29-Oct-2021 07:23 ESTHTMLAN
Donnelley Financial LSWpf_rendNone
10*ESS 0C
LSWP64RS0921.10.7.0
Page 1 of 1
See accompanying Notes to Financial Statements which are an integral part of the financial statements. 12 Invesco Short Term Bond Fund
PrincipalAmount Value
Tobacco–(continued) BAT Capital Corp. (United
Kingdom), 3.22%, 08/15/2024(c) $ 4,899,000 $ 5,199,974 2.79%, 09/06/2024 4,148,000 4,360,041
BAT International Finance PLC(United Kingdom), 1.67%,03/25/2026 4,112,000 4,137,799
Imperial Brands Finance PLC(United Kingdom), 3.13%,07/26/2024(b) 3,882,000 4,094,619
19,408,694
Trading Companies & Distributors–0.36% Air Lease Corp.,
2.30%, 02/01/2025 4,000,000 4,135,068 1.88%, 08/15/2026 7,000,000 7,026,082
11,161,150
Trucking–2.04% Penske Truck Leasing Co.
L.P./PTL Finance Corp., 3.45%, 07/01/2024(b) 5,542,000 5,923,860 4.00%, 07/15/2025(b) 4,719,000 5,193,394 1.20%, 11/15/2025(b) 4,335,000 4,314,453
Ryder System, Inc., 2.50%, 09/01/2024(c) 5,974,000 6,264,394 4.63%, 06/01/2025 5,716,000 6,429,673 3.35%, 09/01/2025 7,704,000 8,330,485
Triton Container InternationalLtd. (Bermuda), 0.80%, 08/01/2023(b) 10,000,000 9,998,337 1.15%, 06/07/2024(b) 8,984,000 8,993,428 2.05%, 04/15/2026(b) 7,801,000 7,874,847
63,322,871
Wireless Telecommunication Services–1.25% Sprint Spectrum Co.
LLC/Sprint Spectrum Co. IILLC/Sprint Spectrum Co. IIILLC, 4.74%, 03/20/2025(b) 11,514,375 12,316,927
T-Mobile USA, Inc.,2.25%, 02/15/2026 4,337,000 4,434,583 2.25%, 02/15/2026(b)(c) 4,604,000 4,707,590 2.63%, 04/15/2026 7,499,000 7,714,596
VEON Holdings B.V.(Netherlands), 4.00%,04/09/2025(b) 3,001,000 3,169,881
Vodafone Group PLC (UnitedKingdom), 3.75%,01/16/2024 5,888,000 6,343,377
38,686,954 Total U.S. Dollar Denominated Bonds &
Notes(Cost $2,102,975,295)
2,153,778,543
PrincipalAmount Value
Asset-Backed Securities–18.37% American Credit Acceptance
Receivables Trust, Series 2017-4, Class D,3.57%, 01/10/2024(b) $ 858,623 $ 861,278 Series 2018-3, Class D,4.14%, 10/15/2024(b) 207,671 209,627 Series 2019-1, Class C,3.50%, 04/14/2025(b) 671,925 676,419 Series 2019-2, Class D,3.41%, 06/12/2025(b) 1,935,000 1,988,559 Series 2019-3, Class C,2.76%, 09/12/2025(b) 1,634,896 1,648,362
AmeriCredit AutomobileReceivables Trust, Series 2017-2, Class D,3.42%, 04/18/2023 3,075,000 3,103,077 Series 2017-4, Class D,3.08%, 12/18/2023 1,480,000 1,507,943 Series 2018-3, Class C,3.74%, 10/18/2024 3,465,000 3,569,579 Series 2019-2, Class C,2.74%, 04/18/2025 1,335,000 1,374,584 Series 2019-2, Class D,2.99%, 06/18/2025 3,700,000 3,842,534 Series 2019-3, Class D,2.58%, 09/18/2025 1,830,000 1,885,106
Angel Oak Mortgage Trust, Series 2019-3, Class A1,2.93%, 05/25/2059(b)(h) 2,801,851 2,815,742 Series 2020-1, Class A1,2.16%, 12/25/2059(b)(h) 2,128,446 2,142,466 Series 2020-3, Class A1,1.69%, 04/25/2065(b)(h) 6,216,335 6,263,616 Series 2021-3, Class A1,1.07%, 05/25/2066(b)(h) 5,593,485 5,608,676
Angel Oak Mortgage Trust ILLC, Series 2018-3, Class A1,3.65%, 09/25/2048(b)(h) 1,581,775 1,592,526 Series 2019-2, Class A1,3.63%, 03/25/2049(b)(h) 2,103,599 2,127,503
Angel Oak Mortgage Trust LLC,Series 2020-5, Class A1,1.37%, 05/25/2065(b)(h) 4,138,676 4,162,449
Bain Capital Credit CLO Ltd.,Series 2017-2A, Class AR2,1.32% (3 mo. USD LIBOR +1.18%), 07/25/2034(b)(e) 11,812,000 11,812,734
Banc of America MortgageTrust, Series 2004-D,Class 2A2, 2.54%,05/25/2034(h) 20,436 21,127
Bear Stearns Adjustable RateMortgage Trust, Series 2003-6, Class 1A3,2.19%, 08/25/2033(h) 40,422 41,398 Series 2005-9, Class A1,0.76% (1 yr. U.S. TreasuryYield Curve Rate + 2.30%),10/25/2035(e) 149,478 152,947 Series 2006-1, Class A1,0.65% (1 yr. U.S. TreasuryYield Curve Rate + 2.25%),02/25/2036(e) 297,303 302,230
Benchmark Mortgage Trust,Series 2018-B1, Class XA,IO, 0.65%, 01/15/2051(i) 26,089,838 687,971
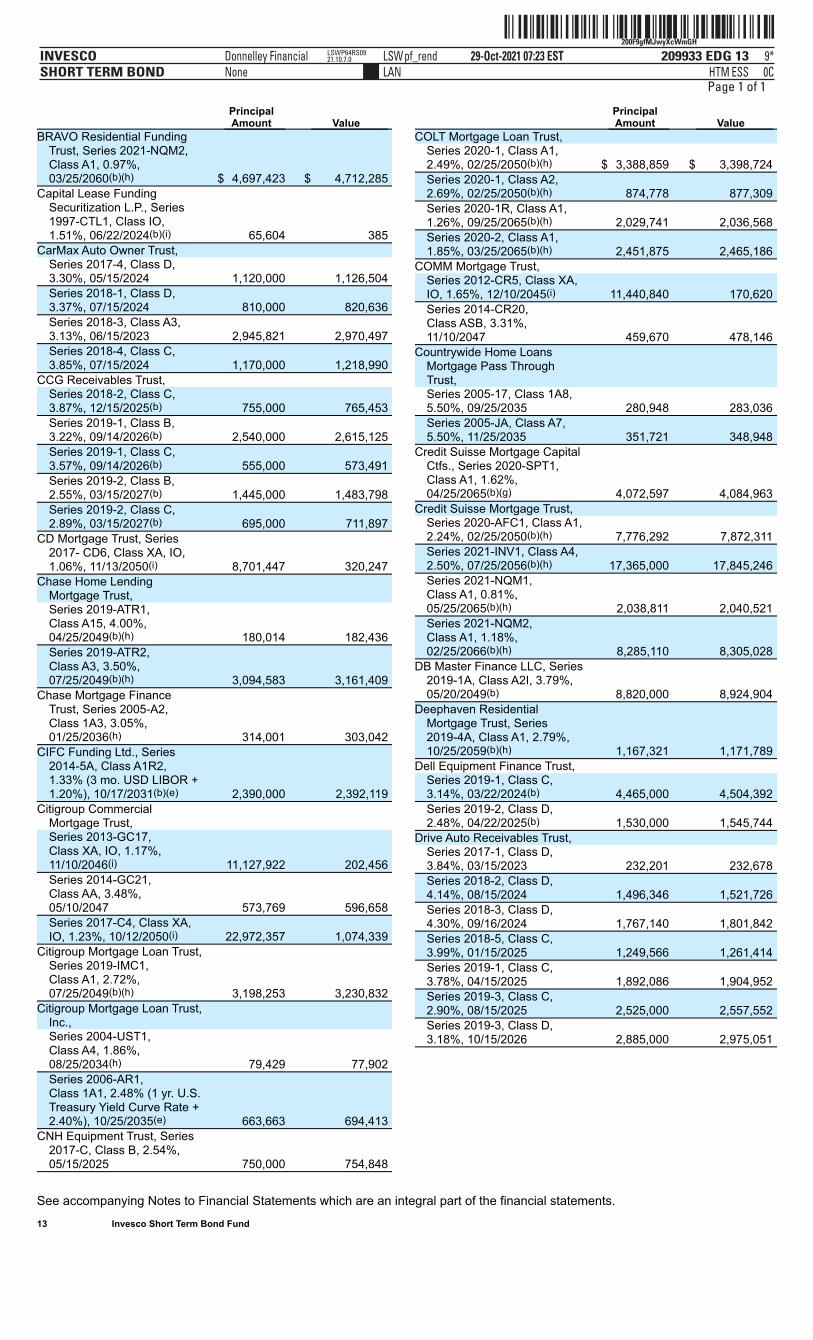
ˆ200F9gfMJwyXcWmGHŠ200F9gfMJwyXcWmGH
209933 EDG 13INVESCOSHORT TERM BOND
29-Oct-2021 07:23 ESTHTMLAN
Donnelley Financial LSWpf_rendNone
9*ESS 0C
LSWP64RS0921.10.7.0
Page 1 of 1
See accompanying Notes to Financial Statements which are an integral part of the financial statements. 13 Invesco Short Term Bond Fund
PrincipalAmount Value
BRAVO Residential FundingTrust, Series 2021-NQM2,Class A1, 0.97%,03/25/2060(b)(h) $ 4,697,423 $ 4,712,285
Capital Lease FundingSecuritization L.P., Series1997-CTL1, Class IO,1.51%, 06/22/2024(b)(i) 65,604 385
CarMax Auto Owner Trust, Series 2017-4, Class D,3.30%, 05/15/2024 1,120,000 1,126,504 Series 2018-1, Class D,3.37%, 07/15/2024 810,000 820,636 Series 2018-3, Class A3,3.13%, 06/15/2023 2,945,821 2,970,497 Series 2018-4, Class C,3.85%, 07/15/2024 1,170,000 1,218,990
CCG Receivables Trust, Series 2018-2, Class C,3.87%, 12/15/2025(b) 755,000 765,453 Series 2019-1, Class B,3.22%, 09/14/2026(b) 2,540,000 2,615,125 Series 2019-1, Class C,3.57%, 09/14/2026(b) 555,000 573,491 Series 2019-2, Class B,2.55%, 03/15/2027(b) 1,445,000 1,483,798 Series 2019-2, Class C,2.89%, 03/15/2027(b) 695,000 711,897
CD Mortgage Trust, Series2017- CD6, Class XA, IO,1.06%, 11/13/2050(i) 8,701,447 320,247
Chase Home LendingMortgage Trust, Series 2019-ATR1,Class A15, 4.00%,04/25/2049(b)(h) 180,014 182,436 Series 2019-ATR2,Class A3, 3.50%,07/25/2049(b)(h) 3,094,583 3,161,409
Chase Mortgage FinanceTrust, Series 2005-A2,Class 1A3, 3.05%,01/25/2036(h) 314,001 303,042
CIFC Funding Ltd., Series2014-5A, Class A1R2,1.33% (3 mo. USD LIBOR +1.20%), 10/17/2031(b)(e) 2,390,000 2,392,119
Citigroup CommercialMortgage Trust, Series 2013-GC17,Class XA, IO, 1.17%,11/10/2046(i) 11,127,922 202,456 Series 2014-GC21,Class AA, 3.48%,05/10/2047 573,769 596,658 Series 2017-C4, Class XA,IO, 1.23%, 10/12/2050(i) 22,972,357 1,074,339
Citigroup Mortgage Loan Trust,Series 2019-IMC1,Class A1, 2.72%,07/25/2049(b)(h) 3,198,253 3,230,832
Citigroup Mortgage Loan Trust,Inc., Series 2004-UST1,Class A4, 1.86%,08/25/2034(h) 79,429 77,902 Series 2006-AR1,Class 1A1, 2.48% (1 yr. U.S.Treasury Yield Curve Rate +2.40%), 10/25/2035(e) 663,663 694,413
CNH Equipment Trust, Series2017-C, Class B, 2.54%,05/15/2025 750,000 754,848
PrincipalAmount Value
COLT Mortgage Loan Trust, Series 2020-1, Class A1,2.49%, 02/25/2050(b)(h) $ 3,388,859 $ 3,398,724 Series 2020-1, Class A2,2.69%, 02/25/2050(b)(h) 874,778 877,309 Series 2020-1R, Class A1,1.26%, 09/25/2065(b)(h) 2,029,741 2,036,568 Series 2020-2, Class A1,1.85%, 03/25/2065(b)(h) 2,451,875 2,465,186
COMM Mortgage Trust, Series 2012-CR5, Class XA,IO, 1.65%, 12/10/2045(i) 11,440,840 170,620 Series 2014-CR20,Class ASB, 3.31%,11/10/2047 459,670 478,146
Countrywide Home LoansMortgage Pass ThroughTrust, Series 2005-17, Class 1A8,5.50%, 09/25/2035 280,948 283,036 Series 2005-JA, Class A7,5.50%, 11/25/2035 351,721 348,948
Credit Suisse Mortgage CapitalCtfs., Series 2020-SPT1,Class A1, 1.62%,04/25/2065(b)(g) 4,072,597 4,084,963
Credit Suisse Mortgage Trust, Series 2020-AFC1, Class A1,2.24%, 02/25/2050(b)(h) 7,776,292 7,872,311 Series 2021-INV1, Class A4,2.50%, 07/25/2056(b)(h) 17,365,000 17,845,246 Series 2021-NQM1,Class A1, 0.81%,05/25/2065(b)(h) 2,038,811 2,040,521 Series 2021-NQM2,Class A1, 1.18%,02/25/2066(b)(h) 8,285,110 8,305,028
DB Master Finance LLC, Series2019-1A, Class A2I, 3.79%,05/20/2049(b) 8,820,000 8,924,904
Deephaven ResidentialMortgage Trust, Series2019-4A, Class A1, 2.79%,10/25/2059(b)(h) 1,167,321 1,171,789
Dell Equipment Finance Trust, Series 2019-1, Class C,3.14%, 03/22/2024(b) 4,465,000 4,504,392 Series 2019-2, Class D,2.48%, 04/22/2025(b) 1,530,000 1,545,744
Drive Auto Receivables Trust, Series 2017-1, Class D,3.84%, 03/15/2023 232,201 232,678 Series 2018-2, Class D,4.14%, 08/15/2024 1,496,346 1,521,726 Series 2018-3, Class D,4.30%, 09/16/2024 1,767,140 1,801,842 Series 2018-5, Class C,3.99%, 01/15/2025 1,249,566 1,261,414 Series 2019-1, Class C,3.78%, 04/15/2025 1,892,086 1,904,952 Series 2019-3, Class C,2.90%, 08/15/2025 2,525,000 2,557,552 Series 2019-3, Class D,3.18%, 10/15/2026 2,885,000 2,975,051
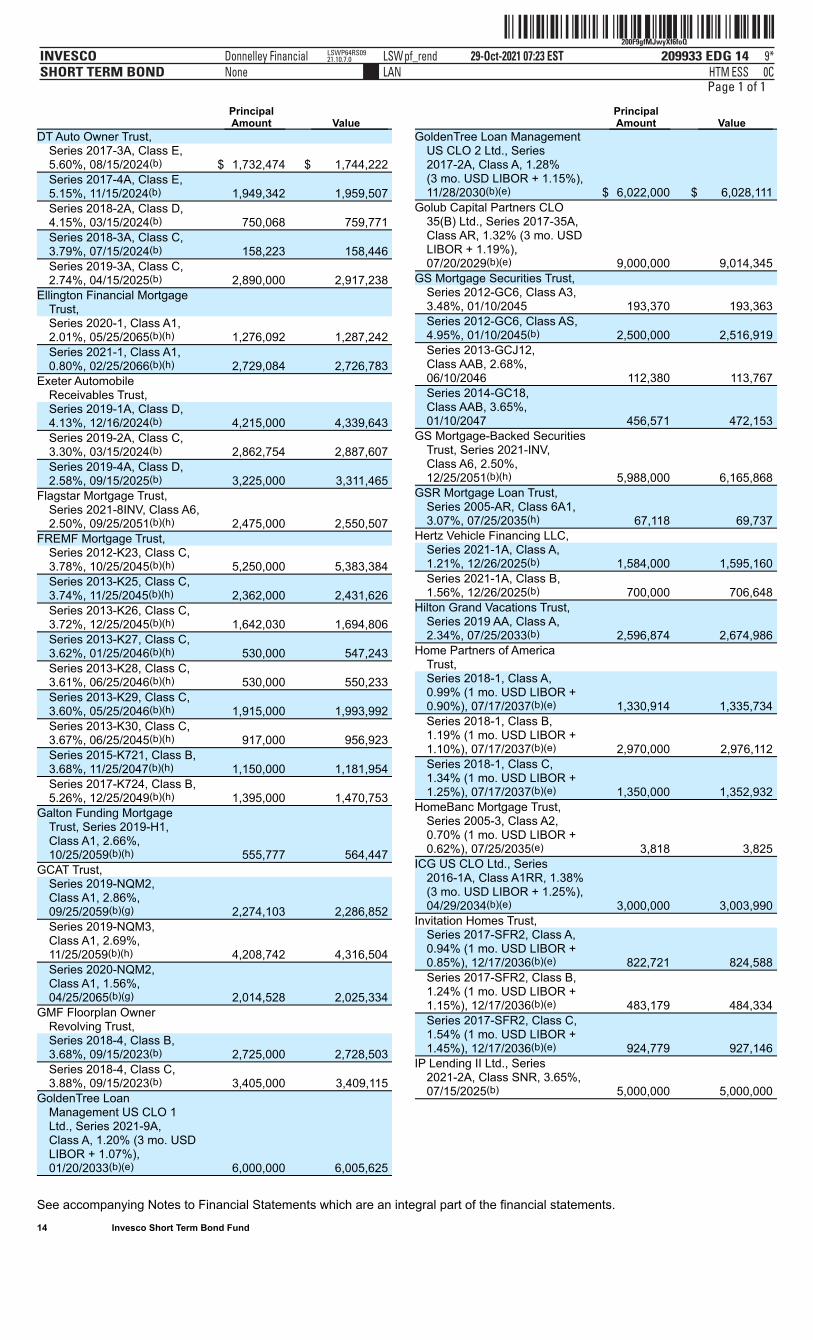
ˆ200F9gfMJwyXf6foQŠ200F9gfMJwyXf6foQ
209933 EDG 14INVESCOSHORT TERM BOND
29-Oct-2021 07:23 ESTHTMLAN
Donnelley Financial LSWpf_rendNone
9*ESS 0C
LSWP64RS0921.10.7.0
Page 1 of 1
See accompanying Notes to Financial Statements which are an integral part of the financial statements. 14 Invesco Short Term Bond Fund
PrincipalAmount Value
DT Auto Owner Trust, Series 2017-3A, Class E,5.60%, 08/15/2024(b) $ 1,732,474 $ 1,744,222 Series 2017-4A, Class E,5.15%, 11/15/2024(b) 1,949,342 1,959,507 Series 2018-2A, Class D,4.15%, 03/15/2024(b) 750,068 759,771 Series 2018-3A, Class C,3.79%, 07/15/2024(b) 158,223 158,446 Series 2019-3A, Class C,2.74%, 04/15/2025(b) 2,890,000 2,917,238
Ellington Financial MortgageTrust, Series 2020-1, Class A1,2.01%, 05/25/2065(b)(h) 1,276,092 1,287,242 Series 2021-1, Class A1,0.80%, 02/25/2066(b)(h) 2,729,084 2,726,783
Exeter AutomobileReceivables Trust, Series 2019-1A, Class D,4.13%, 12/16/2024(b) 4,215,000 4,339,643 Series 2019-2A, Class C,3.30%, 03/15/2024(b) 2,862,754 2,887,607 Series 2019-4A, Class D,2.58%, 09/15/2025(b) 3,225,000 3,311,465
Flagstar Mortgage Trust,Series 2021-8INV, Class A6,2.50%, 09/25/2051(b)(h) 2,475,000 2,550,507
FREMF Mortgage Trust, Series 2012-K23, Class C,3.78%, 10/25/2045(b)(h) 5,250,000 5,383,384 Series 2013-K25, Class C,3.74%, 11/25/2045(b)(h) 2,362,000 2,431,626 Series 2013-K26, Class C,3.72%, 12/25/2045(b)(h) 1,642,030 1,694,806 Series 2013-K27, Class C,3.62%, 01/25/2046(b)(h) 530,000 547,243 Series 2013-K28, Class C,3.61%, 06/25/2046(b)(h) 530,000 550,233 Series 2013-K29, Class C,3.60%, 05/25/2046(b)(h) 1,915,000 1,993,992 Series 2013-K30, Class C,3.67%, 06/25/2045(b)(h) 917,000 956,923 Series 2015-K721, Class B,3.68%, 11/25/2047(b)(h) 1,150,000 1,181,954 Series 2017-K724, Class B,5.26%, 12/25/2049(b)(h) 1,395,000 1,470,753
Galton Funding MortgageTrust, Series 2019-H1,Class A1, 2.66%,10/25/2059(b)(h) 555,777 564,447
GCAT Trust, Series 2019-NQM2,Class A1, 2.86%,09/25/2059(b)(g) 2,274,103 2,286,852 Series 2019-NQM3,Class A1, 2.69%,11/25/2059(b)(h) 4,208,742 4,316,504 Series 2020-NQM2,Class A1, 1.56%,04/25/2065(b)(g) 2,014,528 2,025,334
GMF Floorplan OwnerRevolving Trust, Series 2018-4, Class B,3.68%, 09/15/2023(b) 2,725,000 2,728,503 Series 2018-4, Class C,3.88%, 09/15/2023(b) 3,405,000 3,409,115
GoldenTree LoanManagement US CLO 1Ltd., Series 2021-9A,Class A, 1.20% (3 mo. USDLIBOR + 1.07%),01/20/2033(b)(e) 6,000,000 6,005,625
PrincipalAmount Value
GoldenTree Loan ManagementUS CLO 2 Ltd., Series2017-2A, Class A, 1.28%(3 mo. USD LIBOR + 1.15%),11/28/2030(b)(e) $ 6,022,000 $ 6,028,111
Golub Capital Partners CLO35(B) Ltd., Series 2017-35A,Class AR, 1.32% (3 mo. USDLIBOR + 1.19%),07/20/2029(b)(e) 9,000,000 9,014,345
GS Mortgage Securities Trust, Series 2012-GC6, Class A3,3.48%, 01/10/2045 193,370 193,363 Series 2012-GC6, Class AS,4.95%, 01/10/2045(b) 2,500,000 2,516,919 Series 2013-GCJ12,Class AAB, 2.68%,06/10/2046 112,380 113,767 Series 2014-GC18,Class AAB, 3.65%,01/10/2047 456,571 472,153
GS Mortgage-Backed SecuritiesTrust, Series 2021-INV,Class A6, 2.50%,12/25/2051(b)(h) 5,988,000 6,165,868
GSR Mortgage Loan Trust,Series 2005-AR, Class 6A1,3.07%, 07/25/2035(h) 67,118 69,737
Hertz Vehicle Financing LLC, Series 2021-1A, Class A,1.21%, 12/26/2025(b) 1,584,000 1,595,160 Series 2021-1A, Class B,1.56%, 12/26/2025(b) 700,000 706,648
Hilton Grand Vacations Trust,Series 2019 AA, Class A,2.34%, 07/25/2033(b) 2,596,874 2,674,986
Home Partners of AmericaTrust, Series 2018-1, Class A,0.99% (1 mo. USD LIBOR +0.90%), 07/17/2037(b)(e) 1,330,914 1,335,734 Series 2018-1, Class B,1.19% (1 mo. USD LIBOR +1.10%), 07/17/2037(b)(e) 2,970,000 2,976,112 Series 2018-1, Class C,1.34% (1 mo. USD LIBOR +1.25%), 07/17/2037(b)(e) 1,350,000 1,352,932
HomeBanc Mortgage Trust,Series 2005-3, Class A2,0.70% (1 mo. USD LIBOR +0.62%), 07/25/2035(e) 3,818 3,825
ICG US CLO Ltd., Series2016-1A, Class A1RR, 1.38%(3 mo. USD LIBOR + 1.25%),04/29/2034(b)(e) 3,000,000 3,003,990
Invitation Homes Trust, Series 2017-SFR2, Class A,0.94% (1 mo. USD LIBOR +0.85%), 12/17/2036(b)(e) 822,721 824,588 Series 2017-SFR2, Class B,1.24% (1 mo. USD LIBOR +1.15%), 12/17/2036(b)(e) 483,179 484,334 Series 2017-SFR2, Class C,1.54% (1 mo. USD LIBOR +1.45%), 12/17/2036(b)(e) 924,779 927,146
IP Lending II Ltd., Series2021-2A, Class SNR, 3.65%,07/15/2025(b) 5,000,000 5,000,000
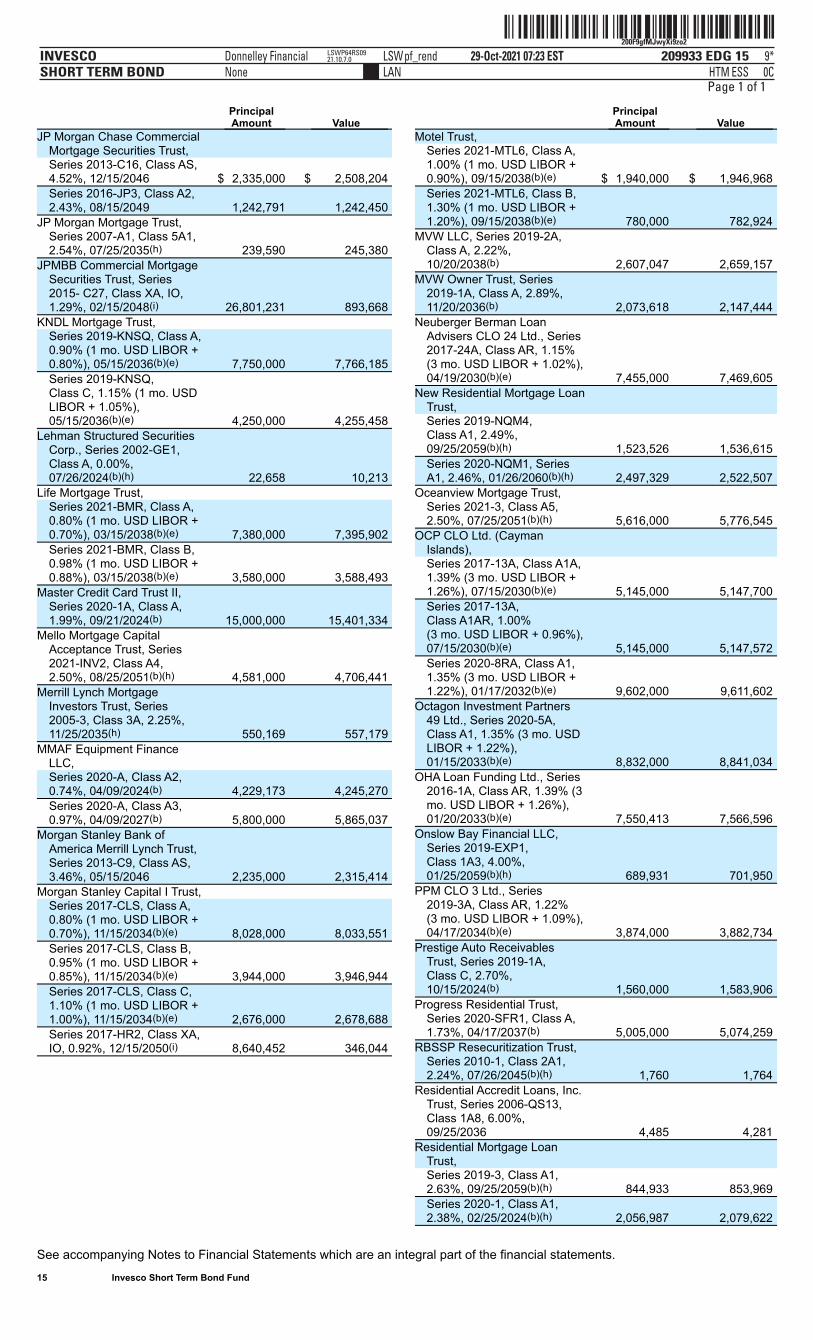
ˆ200F9gfMJwyXi9zo2Š200F9gfMJwyXi9zo2
209933 EDG 15INVESCOSHORT TERM BOND
29-Oct-2021 07:23 ESTHTMLAN
Donnelley Financial LSWpf_rendNone
9*ESS 0C
LSWP64RS0921.10.7.0
Page 1 of 1
See accompanying Notes to Financial Statements which are an integral part of the financial statements. 15 Invesco Short Term Bond Fund
PrincipalAmount Value
JP Morgan Chase CommercialMortgage Securities Trust, Series 2013-C16, Class AS,4.52%, 12/15/2046 $ 2,335,000 $ 2,508,204 Series 2016-JP3, Class A2,2.43%, 08/15/2049 1,242,791 1,242,450
JP Morgan Mortgage Trust,Series 2007-A1, Class 5A1,2.54%, 07/25/2035(h) 239,590 245,380
JPMBB Commercial MortgageSecurities Trust, Series2015- C27, Class XA, IO,1.29%, 02/15/2048(i) 26,801,231 893,668
KNDL Mortgage Trust, Series 2019-KNSQ, Class A,0.90% (1 mo. USD LIBOR +0.80%), 05/15/2036(b)(e) 7,750,000 7,766,185 Series 2019-KNSQ,Class C, 1.15% (1 mo. USDLIBOR + 1.05%),05/15/2036(b)(e) 4,250,000 4,255,458
Lehman Structured SecuritiesCorp., Series 2002-GE1,Class A, 0.00%,07/26/2024(b)(h) 22,658 10,213
Life Mortgage Trust, Series 2021-BMR, Class A,0.80% (1 mo. USD LIBOR +0.70%), 03/15/2038(b)(e) 7,380,000 7,395,902 Series 2021-BMR, Class B,0.98% (1 mo. USD LIBOR +0.88%), 03/15/2038(b)(e) 3,580,000 3,588,493
Master Credit Card Trust II,Series 2020-1A, Class A,1.99%, 09/21/2024(b) 15,000,000 15,401,334
Mello Mortgage CapitalAcceptance Trust, Series2021-INV2, Class A4,2.50%, 08/25/2051(b)(h) 4,581,000 4,706,441
Merrill Lynch MortgageInvestors Trust, Series2005-3, Class 3A, 2.25%,11/25/2035(h) 550,169 557,179
MMAF Equipment FinanceLLC, Series 2020-A, Class A2,0.74%, 04/09/2024(b) 4,229,173 4,245,270 Series 2020-A, Class A3,0.97%, 04/09/2027(b) 5,800,000 5,865,037
Morgan Stanley Bank ofAmerica Merrill Lynch Trust,Series 2013-C9, Class AS,3.46%, 05/15/2046 2,235,000 2,315,414
Morgan Stanley Capital I Trust, Series 2017-CLS, Class A,0.80% (1 mo. USD LIBOR +0.70%), 11/15/2034(b)(e) 8,028,000 8,033,551 Series 2017-CLS, Class B,0.95% (1 mo. USD LIBOR +0.85%), 11/15/2034(b)(e) 3,944,000 3,946,944 Series 2017-CLS, Class C,1.10% (1 mo. USD LIBOR +1.00%), 11/15/2034(b)(e) 2,676,000 2,678,688 Series 2017-HR2, Class XA,IO, 0.92%, 12/15/2050(i) 8,640,452 346,044
PrincipalAmount Value
Motel Trust, Series 2021-MTL6, Class A,1.00% (1 mo. USD LIBOR +0.90%), 09/15/2038(b)(e) $ 1,940,000 $ 1,946,968 Series 2021-MTL6, Class B,1.30% (1 mo. USD LIBOR +1.20%), 09/15/2038(b)(e) 780,000 782,924
MVW LLC, Series 2019-2A,Class A, 2.22%,10/20/2038(b) 2,607,047 2,659,157
MVW Owner Trust, Series2019-1A, Class A, 2.89%,11/20/2036(b) 2,073,618 2,147,444
Neuberger Berman LoanAdvisers CLO 24 Ltd., Series2017-24A, Class AR, 1.15%(3 mo. USD LIBOR + 1.02%),04/19/2030(b)(e) 7,455,000 7,469,605
New Residential Mortgage LoanTrust, Series 2019-NQM4,Class A1, 2.49%,09/25/2059(b)(h) 1,523,526 1,536,615 Series 2020-NQM1, SeriesA1, 2.46%, 01/26/2060(b)(h) 2,497,329 2,522,507
Oceanview Mortgage Trust,Series 2021-3, Class A5,2.50%, 07/25/2051(b)(h) 5,616,000 5,776,545
OCP CLO Ltd. (CaymanIslands), Series 2017-13A, Class A1A,1.39% (3 mo. USD LIBOR +1.26%), 07/15/2030(b)(e) 5,145,000 5,147,700 Series 2017-13A,Class A1AR, 1.00%(3 mo. USD LIBOR + 0.96%),07/15/2030(b)(e) 5,145,000 5,147,572 Series 2020-8RA, Class A1,1.35% (3 mo. USD LIBOR +1.22%), 01/17/2032(b)(e) 9,602,000 9,611,602
Octagon Investment Partners49 Ltd., Series 2020-5A,Class A1, 1.35% (3 mo. USDLIBOR + 1.22%),01/15/2033(b)(e) 8,832,000 8,841,034
OHA Loan Funding Ltd., Series2016-1A, Class AR, 1.39% (3mo. USD LIBOR + 1.26%),01/20/2033(b)(e) 7,550,413 7,566,596
Onslow Bay Financial LLC,Series 2019-EXP1,Class 1A3, 4.00%,01/25/2059(b)(h) 689,931 701,950
PPM CLO 3 Ltd., Series2019-3A, Class AR, 1.22%(3 mo. USD LIBOR + 1.09%),04/17/2034(b)(e) 3,874,000 3,882,734
Prestige Auto ReceivablesTrust, Series 2019-1A,Class C, 2.70%,10/15/2024(b) 1,560,000 1,583,906
Progress Residential Trust,Series 2020-SFR1, Class A,1.73%, 04/17/2037(b) 5,005,000 5,074,259
RBSSP Resecuritization Trust,Series 2010-1, Class 2A1,2.24%, 07/26/2045(b)(h) 1,760 1,764
Residential Accredit Loans, Inc.Trust, Series 2006-QS13,Class 1A8, 6.00%,09/25/2036 4,485 4,281
Residential Mortgage LoanTrust, Series 2019-3, Class A1,2.63%, 09/25/2059(b)(h) 844,933 853,969 Series 2020-1, Class A1,2.38%, 02/25/2024(b)(h) 2,056,987 2,079,622
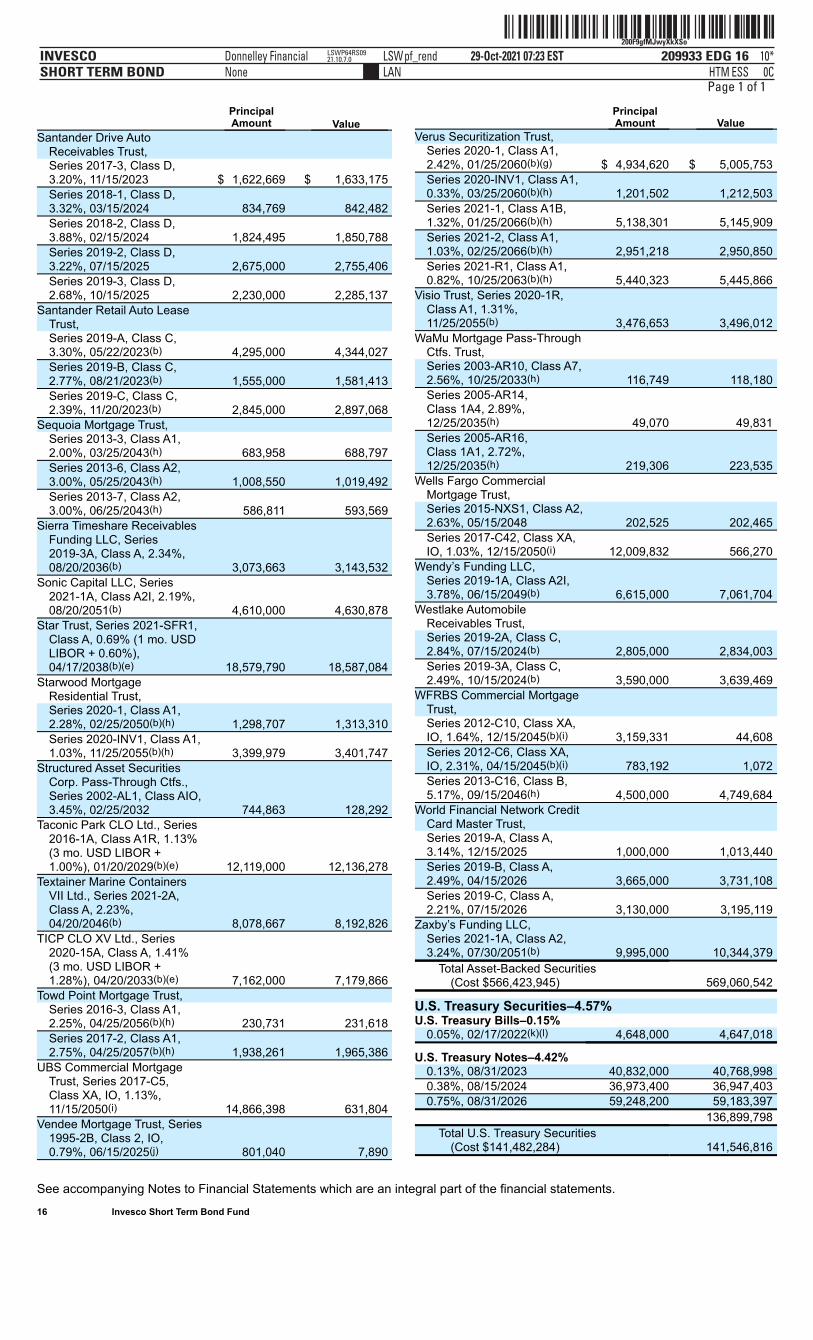
ˆ200F9gfMJwyXkXSoÇŠ200F9gfMJwyXkXSo˙
209933 EDG 16INVESCOSHORT TERM BOND
29-Oct-2021 07:23 ESTHTMLAN
Donnelley Financial LSWpf_rendNone
10*ESS 0C
LSWP64RS0921.10.7.0
Page 1 of 1
See accompanying Notes to Financial Statements which are an integral part of the financial statements. 16 Invesco Short Term Bond Fund
PrincipalAmount Value
Santander Drive AutoReceivables Trust, Series 2017-3, Class D,3.20%, 11/15/2023 $ 1,622,669 $ 1,633,175 Series 2018-1, Class D,3.32%, 03/15/2024 834,769 842,482 Series 2018-2, Class D,3.88%, 02/15/2024 1,824,495 1,850,788 Series 2019-2, Class D,3.22%, 07/15/2025 2,675,000 2,755,406 Series 2019-3, Class D,2.68%, 10/15/2025 2,230,000 2,285,137
Santander Retail Auto LeaseTrust, Series 2019-A, Class C,3.30%, 05/22/2023(b) 4,295,000 4,344,027 Series 2019-B, Class C,2.77%, 08/21/2023(b) 1,555,000 1,581,413 Series 2019-C, Class C,2.39%, 11/20/2023(b) 2,845,000 2,897,068
Sequoia Mortgage Trust, Series 2013-3, Class A1,2.00%, 03/25/2043(h) 683,958 688,797 Series 2013-6, Class A2,3.00%, 05/25/2043(h) 1,008,550 1,019,492 Series 2013-7, Class A2,3.00%, 06/25/2043(h) 586,811 593,569
Sierra Timeshare ReceivablesFunding LLC, Series2019-3A, Class A, 2.34%,08/20/2036(b) 3,073,663 3,143,532
Sonic Capital LLC, Series2021-1A, Class A2I, 2.19%,08/20/2051(b) 4,610,000 4,630,878
Star Trust, Series 2021-SFR1,Class A, 0.69% (1 mo. USDLIBOR + 0.60%),04/17/2038(b)(e) 18,579,790 18,587,084
Starwood MortgageResidential Trust, Series 2020-1, Class A1,2.28%, 02/25/2050(b)(h) 1,298,707 1,313,310 Series 2020-INV1, Class A1,1.03%, 11/25/2055(b)(h) 3,399,979 3,401,747
Structured Asset SecuritiesCorp. Pass-Through Ctfs.,Series 2002-AL1, Class AIO,3.45%, 02/25/2032 744,863 128,292
Taconic Park CLO Ltd., Series2016-1A, Class A1R, 1.13%(3 mo. USD LIBOR +1.00%), 01/20/2029(b)(e) 12,119,000 12,136,278
Textainer Marine ContainersVII Ltd., Series 2021-2A,Class A, 2.23%,04/20/2046(b) 8,078,667 8,192,826
TICP CLO XV Ltd., Series2020-15A, Class A, 1.41%(3 mo. USD LIBOR +1.28%), 04/20/2033(b)(e) 7,162,000 7,179,866
Towd Point Mortgage Trust, Series 2016-3, Class A1,2.25%, 04/25/2056(b)(h) 230,731 231,618 Series 2017-2, Class A1,2.75%, 04/25/2057(b)(h) 1,938,261 1,965,386
UBS Commercial MortgageTrust, Series 2017-C5,Class XA, IO, 1.13%,11/15/2050(i) 14,866,398 631,804
Vendee Mortgage Trust, Series1995-2B, Class 2, IO,0.79%, 06/15/2025(j) 801,040 7,890
PrincipalAmount Value
Verus Securitization Trust, Series 2020-1, Class A1,2.42%, 01/25/2060(b)(g) $ 4,934,620 $ 5,005,753 Series 2020-INV1, Class A1,0.33%, 03/25/2060(b)(h) 1,201,502 1,212,503 Series 2021-1, Class A1B,1.32%, 01/25/2066(b)(h) 5,138,301 5,145,909 Series 2021-2, Class A1,1.03%, 02/25/2066(b)(h) 2,951,218 2,950,850 Series 2021-R1, Class A1,0.82%, 10/25/2063(b)(h) 5,440,323 5,445,866
Visio Trust, Series 2020-1R,Class A1, 1.31%,11/25/2055(b) 3,476,653 3,496,012
WaMu Mortgage Pass-ThroughCtfs. Trust, Series 2003-AR10, Class A7,2.56%, 10/25/2033(h) 116,749 118,180 Series 2005-AR14,Class 1A4, 2.89%,12/25/2035(h) 49,070 49,831 Series 2005-AR16,Class 1A1, 2.72%,12/25/2035(h) 219,306 223,535
Wells Fargo CommercialMortgage Trust, Series 2015-NXS1, Class A2,2.63%, 05/15/2048 202,525 202,465 Series 2017-C42, Class XA,IO, 1.03%, 12/15/2050(i) 12,009,832 566,270
Wendy’s Funding LLC,Series 2019-1A, Class A2I,3.78%, 06/15/2049(b) 6,615,000 7,061,704
Westlake AutomobileReceivables Trust, Series 2019-2A, Class C,2.84%, 07/15/2024(b) 2,805,000 2,834,003 Series 2019-3A, Class C,2.49%, 10/15/2024(b) 3,590,000 3,639,469
WFRBS Commercial MortgageTrust, Series 2012-C10, Class XA,IO, 1.64%, 12/15/2045(b)(i) 3,159,331 44,608 Series 2012-C6, Class XA,IO, 2.31%, 04/15/2045(b)(i) 783,192 1,072 Series 2013-C16, Class B,5.17%, 09/15/2046(h) 4,500,000 4,749,684
World Financial Network CreditCard Master Trust, Series 2019-A, Class A,3.14%, 12/15/2025 1,000,000 1,013,440 Series 2019-B, Class A,2.49%, 04/15/2026 3,665,000 3,731,108 Series 2019-C, Class A,2.21%, 07/15/2026 3,130,000 3,195,119
Zaxby’s Funding LLC,Series 2021-1A, Class A2,3.24%, 07/30/2051(b) 9,995,000 10,344,379
Total Asset-Backed Securities(Cost $566,423,945)
569,060,542
U.S. Treasury Securities–4.57% U.S. Treasury Bills–0.15%
0.05%, 02/17/2022(k)(l) 4,648,000 4,647,018
U.S. Treasury Notes–4.42% 0.13%, 08/31/2023 40,832,000 40,768,998 0.38%, 08/15/2024 36,973,400 36,947,403 0.75%, 08/31/2026 59,248,200 59,183,397
136,899,798 Total U.S. Treasury Securities
(Cost $141,482,284) 141,546,816
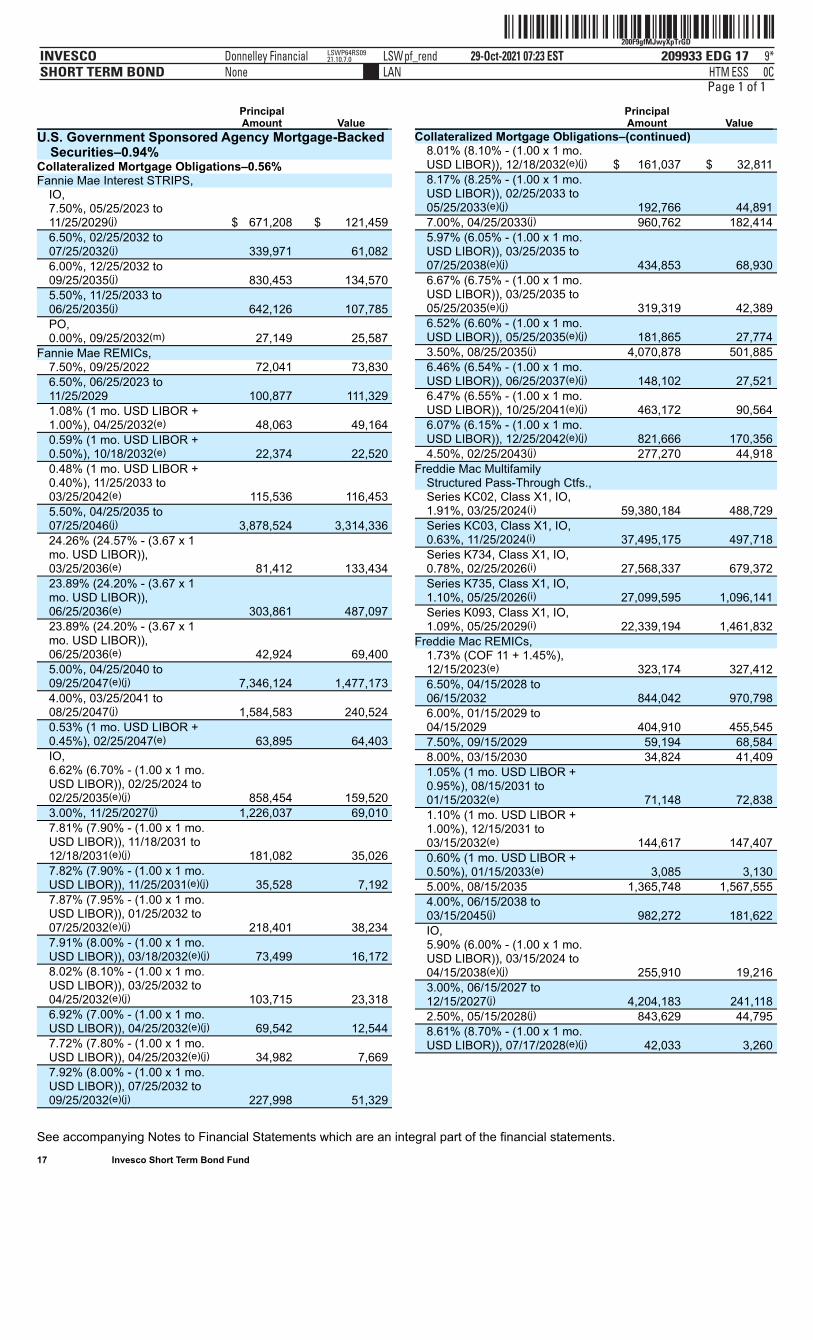
ˆ200F9gfMJwyXpTrGDŠ200F9gfMJwyXpTrGD
209933 EDG 17INVESCOSHORT TERM BOND
29-Oct-2021 07:23 ESTHTMLAN
Donnelley Financial LSWpf_rendNone
9*ESS 0C
LSWP64RS0921.10.7.0
Page 1 of 1
See accompanying Notes to Financial Statements which are an integral part of the financial statements. 17 Invesco Short Term Bond Fund
PrincipalAmount Value
U.S. Government Sponsored Agency Mortgage-BackedSecurities–0.94%
Collateralized Mortgage Obligations–0.56% Fannie Mae Interest STRIPS,
IO,7.50%, 05/25/2023 to11/25/2029(j) $ 671,208 $ 121,459 6.50%, 02/25/2032 to07/25/2032(j) 339,971 61,082 6.00%, 12/25/2032 to09/25/2035(j) 830,453 134,570 5.50%, 11/25/2033 to06/25/2035(j) 642,126 107,785 PO,0.00%, 09/25/2032(m) 27,149 25,587
Fannie Mae REMICs, 7.50%, 09/25/2022 72,041 73,830 6.50%, 06/25/2023 to11/25/2029 100,877 111,329 1.08% (1 mo. USD LIBOR +1.00%), 04/25/2032(e) 48,063 49,164 0.59% (1 mo. USD LIBOR +0.50%), 10/18/2032(e) 22,374 22,520 0.48% (1 mo. USD LIBOR +0.40%), 11/25/2033 to03/25/2042(e) 115,536 116,453 5.50%, 04/25/2035 to07/25/2046(j) 3,878,524 3,314,336 24.26% (24.57% - (3.67 x 1mo. USD LIBOR)),03/25/2036(e) 81,412 133,434 23.89% (24.20% - (3.67 x 1mo. USD LIBOR)),06/25/2036(e) 303,861 487,097 23.89% (24.20% - (3.67 x 1mo. USD LIBOR)),06/25/2036(e) 42,924 69,400 5.00%, 04/25/2040 to09/25/2047(e)(j) 7,346,124 1,477,173 4.00%, 03/25/2041 to08/25/2047(j) 1,584,583 240,524 0.53% (1 mo. USD LIBOR +0.45%), 02/25/2047(e) 63,895 64,403 IO,6.62% (6.70% - (1.00 x 1 mo.USD LIBOR)), 02/25/2024 to02/25/2035(e)(j) 858,454 159,520 3.00%, 11/25/2027(j) 1,226,037 69,010 7.81% (7.90% - (1.00 x 1 mo.USD LIBOR)), 11/18/2031 to12/18/2031(e)(j) 181,082 35,026 7.82% (7.90% - (1.00 x 1 mo.USD LIBOR)), 11/25/2031(e)(j) 35,528 7,192 7.87% (7.95% - (1.00 x 1 mo.USD LIBOR)), 01/25/2032 to07/25/2032(e)(j) 218,401 38,234 7.91% (8.00% - (1.00 x 1 mo.USD LIBOR)), 03/18/2032(e)(j) 73,499 16,172 8.02% (8.10% - (1.00 x 1 mo.USD LIBOR)), 03/25/2032 to04/25/2032(e)(j) 103,715 23,318 6.92% (7.00% - (1.00 x 1 mo.USD LIBOR)), 04/25/2032(e)(j) 69,542 12,544 7.72% (7.80% - (1.00 x 1 mo.USD LIBOR)), 04/25/2032(e)(j) 34,982 7,669 7.92% (8.00% - (1.00 x 1 mo.USD LIBOR)), 07/25/2032 to09/25/2032(e)(j) 227,998 51,329
PrincipalAmount Value
Collateralized Mortgage Obligations–(continued) 8.01% (8.10% - (1.00 x 1 mo.USD LIBOR)), 12/18/2032(e)(j) $ 161,037 $ 32,811 8.17% (8.25% - (1.00 x 1 mo.USD LIBOR)), 02/25/2033 to05/25/2033(e)(j) 192,766 44,891 7.00%, 04/25/2033(j) 960,762 182,414 5.97% (6.05% - (1.00 x 1 mo.USD LIBOR)), 03/25/2035 to07/25/2038(e)(j) 434,853 68,930 6.67% (6.75% - (1.00 x 1 mo.USD LIBOR)), 03/25/2035 to05/25/2035(e)(j) 319,319 42,389 6.52% (6.60% - (1.00 x 1 mo.USD LIBOR)), 05/25/2035(e)(j) 181,865 27,774 3.50%, 08/25/2035(j) 4,070,878 501,885 6.46% (6.54% - (1.00 x 1 mo.USD LIBOR)), 06/25/2037(e)(j) 148,102 27,521 6.47% (6.55% - (1.00 x 1 mo.USD LIBOR)), 10/25/2041(e)(j) 463,172 90,564 6.07% (6.15% - (1.00 x 1 mo.USD LIBOR)), 12/25/2042(e)(j) 821,666 170,356 4.50%, 02/25/2043(j) 277,270 44,918
Freddie Mac MultifamilyStructured Pass-Through Ctfs., Series KC02, Class X1, IO,1.91%, 03/25/2024(i) 59,380,184 488,729 Series KC03, Class X1, IO,0.63%, 11/25/2024(i) 37,495,175 497,718 Series K734, Class X1, IO,0.78%, 02/25/2026(i) 27,568,337 679,372 Series K735, Class X1, IO,1.10%, 05/25/2026(i) 27,099,595 1,096,141 Series K093, Class X1, IO,1.09%, 05/25/2029(i) 22,339,194 1,461,832
Freddie Mac REMICs, 1.73% (COF 11 + 1.45%),12/15/2023(e) 323,174 327,412 6.50%, 04/15/2028 to06/15/2032 844,042 970,798 6.00%, 01/15/2029 to04/15/2029 404,910 455,545 7.50%, 09/15/2029 59,194 68,584 8.00%, 03/15/2030 34,824 41,409 1.05% (1 mo. USD LIBOR +0.95%), 08/15/2031 to01/15/2032(e) 71,148 72,838 1.10% (1 mo. USD LIBOR +1.00%), 12/15/2031 to03/15/2032(e) 144,617 147,407 0.60% (1 mo. USD LIBOR +0.50%), 01/15/2033(e) 3,085 3,130 5.00%, 08/15/2035 1,365,748 1,567,555 4.00%, 06/15/2038 to03/15/2045(j) 982,272 181,622 IO,5.90% (6.00% - (1.00 x 1 mo.USD LIBOR)), 03/15/2024 to04/15/2038(e)(j) 255,910 19,216 3.00%, 06/15/2027 to12/15/2027(j) 4,204,183 241,118 2.50%, 05/15/2028(j) 843,629 44,795 8.61% (8.70% - (1.00 x 1 mo.USD LIBOR)), 07/17/2028(e)(j) 42,033 3,260
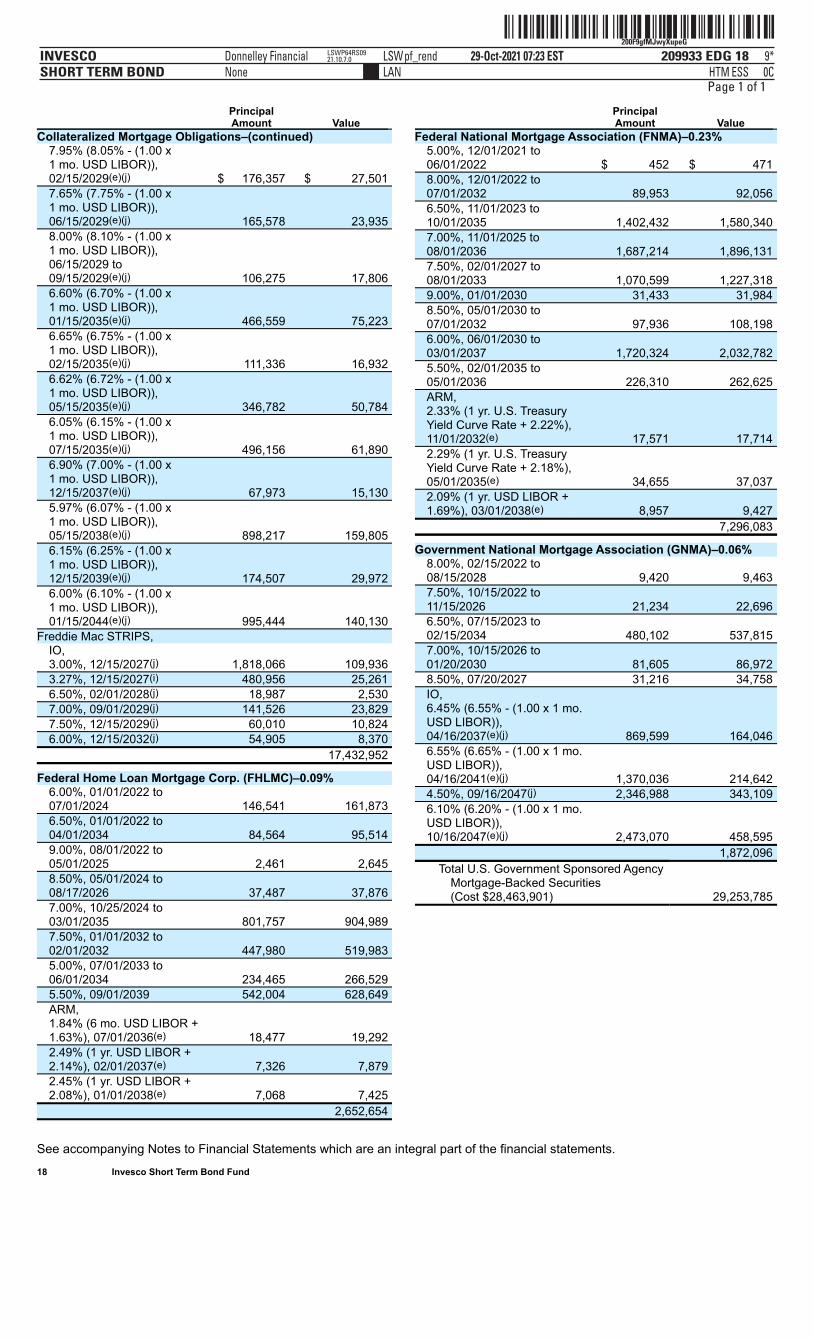
ˆ200F9gfMJwyXupeG‹Š200F9gfMJwyXupeG
209933 EDG 18INVESCOSHORT TERM BOND
29-Oct-2021 07:23 ESTHTMLAN
Donnelley Financial LSWpf_rendNone
9*ESS 0C
LSWP64RS0921.10.7.0
Page 1 of 1
See accompanying Notes to Financial Statements which are an integral part of the financial statements. 18 Invesco Short Term Bond Fund
PrincipalAmount Value
Collateralized Mortgage Obligations–(continued) 7.95% (8.05% - (1.00 x1 mo. USD LIBOR)),02/15/2029(e)(j) $ 176,357 $ 27,501 7.65% (7.75% - (1.00 x1 mo. USD LIBOR)),06/15/2029(e)(j) 165,578 23,935 8.00% (8.10% - (1.00 x1 mo. USD LIBOR)),06/15/2029 to09/15/2029(e)(j) 106,275 17,806 6.60% (6.70% - (1.00 x1 mo. USD LIBOR)),01/15/2035(e)(j) 466,559 75,223 6.65% (6.75% - (1.00 x1 mo. USD LIBOR)),02/15/2035(e)(j) 111,336 16,932 6.62% (6.72% - (1.00 x1 mo. USD LIBOR)),05/15/2035(e)(j) 346,782 50,784 6.05% (6.15% - (1.00 x1 mo. USD LIBOR)),07/15/2035(e)(j) 496,156 61,890 6.90% (7.00% - (1.00 x1 mo. USD LIBOR)),12/15/2037(e)(j) 67,973 15,130 5.97% (6.07% - (1.00 x1 mo. USD LIBOR)),05/15/2038(e)(j) 898,217 159,805 6.15% (6.25% - (1.00 x1 mo. USD LIBOR)),12/15/2039(e)(j) 174,507 29,972 6.00% (6.10% - (1.00 x1 mo. USD LIBOR)),01/15/2044(e)(j) 995,444 140,130
Freddie Mac STRIPS, IO,3.00%, 12/15/2027(j) 1,818,066 109,936 3.27%, 12/15/2027(i) 480,956 25,261 6.50%, 02/01/2028(j) 18,987 2,530 7.00%, 09/01/2029(j) 141,526 23,829 7.50%, 12/15/2029(j) 60,010 10,824 6.00%, 12/15/2032(j) 54,905 8,370
17,432,952
Federal Home Loan Mortgage Corp. (FHLMC)–0.09% 6.00%, 01/01/2022 to07/01/2024 146,541 161,873 6.50%, 01/01/2022 to04/01/2034 84,564 95,514 9.00%, 08/01/2022 to05/01/2025 2,461 2,645 8.50%, 05/01/2024 to08/17/2026 37,487 37,876 7.00%, 10/25/2024 to03/01/2035 801,757 904,989 7.50%, 01/01/2032 to02/01/2032 447,980 519,983 5.00%, 07/01/2033 to06/01/2034 234,465 266,529 5.50%, 09/01/2039 542,004 628,649 ARM,1.84% (6 mo. USD LIBOR +1.63%), 07/01/2036(e) 18,477 19,292 2.49% (1 yr. USD LIBOR +2.14%), 02/01/2037(e) 7,326 7,879 2.45% (1 yr. USD LIBOR +2.08%), 01/01/2038(e) 7,068 7,425
2,652,654
PrincipalAmount Value
Federal National Mortgage Association (FNMA)–0.23% 5.00%, 12/01/2021 to06/01/2022 $ 452 $ 471 8.00%, 12/01/2022 to07/01/2032 89,953 92,056 6.50%, 11/01/2023 to10/01/2035 1,402,432 1,580,340 7.00%, 11/01/2025 to08/01/2036 1,687,214 1,896,131 7.50%, 02/01/2027 to08/01/2033 1,070,599 1,227,318 9.00%, 01/01/2030 31,433 31,984 8.50%, 05/01/2030 to07/01/2032 97,936 108,198 6.00%, 06/01/2030 to03/01/2037 1,720,324 2,032,782 5.50%, 02/01/2035 to05/01/2036 226,310 262,625 ARM,2.33% (1 yr. U.S. TreasuryYield Curve Rate + 2.22%),11/01/2032(e) 17,571 17,714 2.29% (1 yr. U.S. TreasuryYield Curve Rate + 2.18%),05/01/2035(e) 34,655 37,037 2.09% (1 yr. USD LIBOR +1.69%), 03/01/2038(e) 8,957 9,427
7,296,083
Government National Mortgage Association (GNMA)–0.06% 8.00%, 02/15/2022 to08/15/2028 9,420 9,463 7.50%, 10/15/2022 to11/15/2026 21,234 22,696 6.50%, 07/15/2023 to02/15/2034 480,102 537,815 7.00%, 10/15/2026 to01/20/2030 81,605 86,972 8.50%, 07/20/2027 31,216 34,758 IO,6.45% (6.55% - (1.00 x 1 mo.USD LIBOR)),04/16/2037(e)(j) 869,599 164,046 6.55% (6.65% - (1.00 x 1 mo.USD LIBOR)),04/16/2041(e)(j) 1,370,036 214,642 4.50%, 09/16/2047(j) 2,346,988 343,109 6.10% (6.20% - (1.00 x 1 mo.USD LIBOR)),10/16/2047(e)(j) 2,473,070 458,595
1,872,096 Total U.S. Government Sponsored Agency
Mortgage-Backed Securities(Cost $28,463,901)
29,253,785
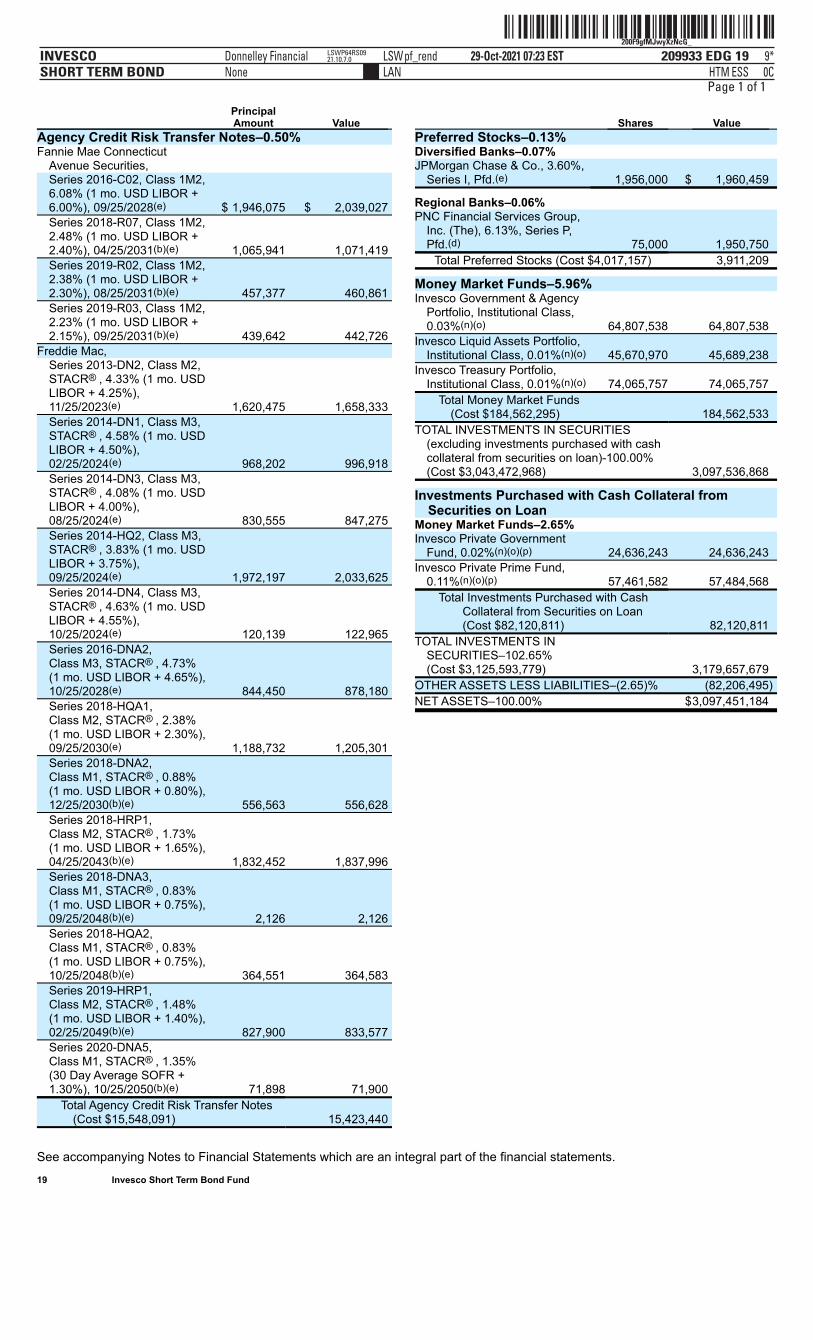
ˆ200F9gfMJwyXzNcG_Š200F9gfMJwyXzNcG_
209933 EDG 19INVESCOSHORT TERM BOND
29-Oct-2021 07:23 ESTHTMLAN
Donnelley Financial LSWpf_rendNone
9*ESS 0C
LSWP64RS0921.10.7.0
Page 1 of 1
See accompanying Notes to Financial Statements which are an integral part of the financial statements. 19 Invesco Short Term Bond Fund
PrincipalAmount Value
Agency Credit Risk Transfer Notes–0.50% Fannie Mae Connecticut
Avenue Securities, Series 2016-C02, Class 1M2,6.08% (1 mo. USD LIBOR +6.00%), 09/25/2028(e) $ 1,946,075 $ 2,039,027 Series 2018-R07, Class 1M2,2.48% (1 mo. USD LIBOR +2.40%), 04/25/2031(b)(e) 1,065,941 1,071,419 Series 2019-R02, Class 1M2,2.38% (1 mo. USD LIBOR +2.30%), 08/25/2031(b)(e) 457,377 460,861 Series 2019-R03, Class 1M2,2.23% (1 mo. USD LIBOR +2.15%), 09/25/2031(b)(e) 439,642 442,726
Freddie Mac, Series 2013-DN2, Class M2,STACR® , 4.33% (1 mo. USDLIBOR + 4.25%),11/25/2023(e) 1,620,475 1,658,333 Series 2014-DN1, Class M3,STACR® , 4.58% (1 mo. USDLIBOR + 4.50%),02/25/2024(e) 968,202 996,918 Series 2014-DN3, Class M3,STACR® , 4.08% (1 mo. USDLIBOR + 4.00%),08/25/2024(e) 830,555 847,275 Series 2014-HQ2, Class M3,STACR® , 3.83% (1 mo. USDLIBOR + 3.75%),09/25/2024(e) 1,972,197 2,033,625 Series 2014-DN4, Class M3,STACR® , 4.63% (1 mo. USDLIBOR + 4.55%),10/25/2024(e) 120,139 122,965 Series 2016-DNA2,Class M3, STACR® , 4.73%(1 mo. USD LIBOR + 4.65%),10/25/2028(e) 844,450 878,180 Series 2018-HQA1,Class M2, STACR® , 2.38%(1 mo. USD LIBOR + 2.30%),09/25/2030(e) 1,188,732 1,205,301 Series 2018-DNA2,Class M1, STACR® , 0.88%(1 mo. USD LIBOR + 0.80%),12/25/2030(b)(e) 556,563 556,628 Series 2018-HRP1,Class M2, STACR® , 1.73%(1 mo. USD LIBOR + 1.65%),04/25/2043(b)(e) 1,832,452 1,837,996 Series 2018-DNA3,Class M1, STACR® , 0.83%(1 mo. USD LIBOR + 0.75%),09/25/2048(b)(e) 2,126 2,126 Series 2018-HQA2,Class M1, STACR® , 0.83%(1 mo. USD LIBOR + 0.75%),10/25/2048(b)(e) 364,551 364,583 Series 2019-HRP1,Class M2, STACR® , 1.48%(1 mo. USD LIBOR + 1.40%),02/25/2049(b)(e) 827,900 833,577 Series 2020-DNA5,Class M1, STACR® , 1.35%(30 Day Average SOFR +1.30%), 10/25/2050(b)(e) 71,898 71,900
Total Agency Credit Risk Transfer Notes(Cost $15,548,091)
15,423,440
Shares Value Preferred Stocks–0.13% Diversified Banks–0.07% JPMorgan Chase & Co., 3.60%,
Series I, Pfd.(e) 1,956,000 $ 1,960,459
Regional Banks–0.06% PNC Financial Services Group,
Inc. (The), 6.13%, Series P,Pfd.(d) 75,000 1,950,750
Total Preferred Stocks (Cost $4,017,157) 3,911,209
Money Market Funds–5.96% Invesco Government & Agency
Portfolio, Institutional Class,0.03%(n)(o) 64,807,538 64,807,538
Invesco Liquid Assets Portfolio,Institutional Class, 0.01%(n)(o) 45,670,970 45,689,238
Invesco Treasury Portfolio,Institutional Class, 0.01%(n)(o) 74,065,757 74,065,757
Total Money Market Funds(Cost $184,562,295)
184,562,533
TOTAL INVESTMENTS IN SECURITIES(excluding investments purchased with cashcollateral from securities on loan)-100.00%(Cost $3,043,472,968)
3,097,536,868
Investments Purchased with Cash Collateral fromSecurities on Loan
Money Market Funds–2.65% Invesco Private Government
Fund, 0.02%(n)(o)(p) 24,636,243 24,636,243 Invesco Private Prime Fund,
0.11%(n)(o)(p) 57,461,582 57,484,568 Total Investments Purchased with Cash
Collateral from Securities on Loan(Cost $82,120,811)
82,120,811 TOTAL INVESTMENTS IN
SECURITIES–102.65%(Cost $3,125,593,779)
3,179,657,679 OTHER ASSETS LESS LIABILITIES–(2.65)% (82,206,495) NET ASSETS–100.00% $3,097,451,184
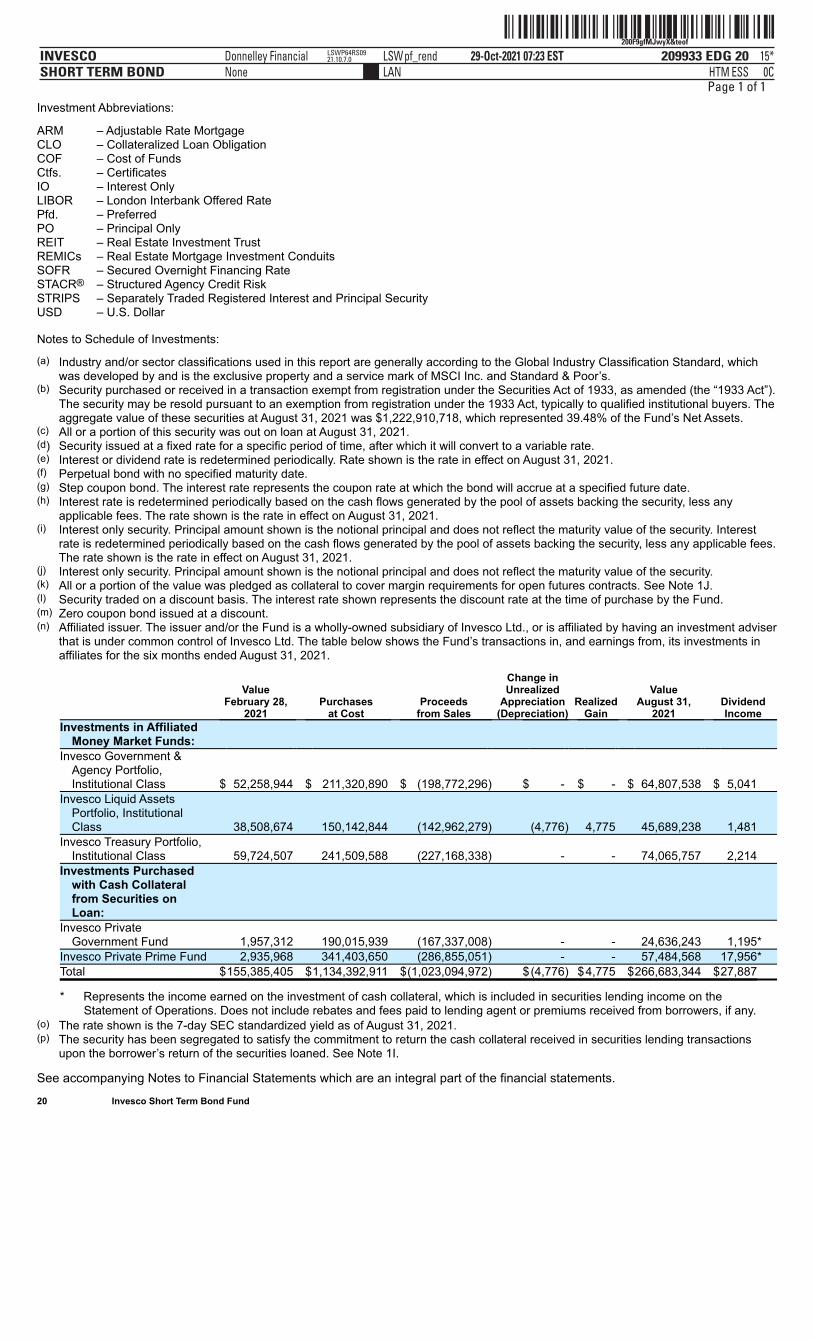
ˆ200F9gfMJwyX&teofŠ200F9gfMJwyX&teof
209933 EDG 20INVESCOSHORT TERM BOND
29-Oct-2021 07:23 ESTHTMLAN
Donnelley Financial LSWpf_rendNone
15*ESS 0C
LSWP64RS0921.10.7.0
Page 1 of 1Investment Abbreviations:
ARM – Adjustable Rate MortgageCLO – Collateralized Loan ObligationCOF – Cost of FundsCtfs. – CertificatesIO – Interest OnlyLIBOR – London Interbank Offered RatePfd. – PreferredPO – Principal OnlyREIT – Real Estate Investment TrustREMICs – Real Estate Mortgage Investment ConduitsSOFR – Secured Overnight Financing RateSTACR® – Structured Agency Credit RiskSTRIPS – Separately Traded Registered Interest and Principal SecurityUSD – U.S. Dollar
Notes to Schedule of Investments:
(a) Industry and/or sector classifications used in this report are generally according to the Global Industry Classification Standard, whichwas developed by and is the exclusive property and a service mark of MSCI Inc. and Standard & Poor’s.
(b) Security purchased or received in a transaction exempt from registration under the Securities Act of 1933, as amended (the “1933 Act”).The security may be resold pursuant to an exemption from registration under the 1933 Act, typically to qualified institutional buyers. Theaggregate value of these securities at August 31, 2021 was $1,222,910,718, which represented 39.48% of the Fund’s Net Assets.
(c) All or a portion of this security was out on loan at August 31, 2021.(d) Security issued at a fixed rate for a specific period of time, after which it will convert to a variable rate.(e) Interest or dividend rate is redetermined periodically. Rate shown is the rate in effect on August 31, 2021.(f) Perpetual bond with no specified maturity date.(g) Step coupon bond. The interest rate represents the coupon rate at which the bond will accrue at a specified future date.(h) Interest rate is redetermined periodically based on the cash flows generated by the pool of assets backing the security, less any
applicable fees. The rate shown is the rate in effect on August 31, 2021.(i) Interest only security. Principal amount shown is the notional principal and does not reflect the maturity value of the security. Interest
rate is redetermined periodically based on the cash flows generated by the pool of assets backing the security, less any applicable fees.The rate shown is the rate in effect on August 31, 2021.
(j) Interest only security. Principal amount shown is the notional principal and does not reflect the maturity value of the security.(k) All or a portion of the value was pledged as collateral to cover margin requirements for open futures contracts. See Note 1J.(l) Security traded on a discount basis. The interest rate shown represents the discount rate at the time of purchase by the Fund.(m) Zero coupon bond issued at a discount.(n) Affiliated issuer. The issuer and/or the Fund is a wholly-owned subsidiary of Invesco Ltd., or is affiliated by having an investment adviser
that is under common control of Invesco Ltd. The table below shows the Fund’s transactions in, and earnings from, its investments inaffiliates for the six months ended August 31, 2021.
ValueFebruary 28,
2021 Purchases
at Cost Proceeds
from Sales
Change inUnrealized
Appreciation(Depreciation)
RealizedGain
ValueAugust 31,
2021 DividendIncome
Investments in AffiliatedMoney Market Funds:
Invesco Government &Agency Portfolio,Institutional Class $ 52,258,944 $ 211,320,890 $ (198,772,296) $ - $ - $ 64,807,538 $ 5,041
Invesco Liquid AssetsPortfolio, InstitutionalClass 38,508,674 150,142,844 (142,962,279) (4,776) 4,775 45,689,238 1,481
Invesco Treasury Portfolio,Institutional Class 59,724,507 241,509,588 (227,168,338) - - 74,065,757 2,214
Investments Purchasedwith Cash Collateralfrom Securities onLoan:
Invesco PrivateGovernment Fund 1,957,312 190,015,939 (167,337,008) - - 24,636,243 1,195*
Invesco Private Prime Fund 2,935,968 341,403,650 (286,855,051) - - 57,484,568 17,956*Total $155,385,405 $1,134,392,911 $(1,023,094,972) $(4,776) $4,775 $266,683,344 $27,887 * Represents the income earned on the investment of cash collateral, which is included in securities lending income on the
Statement of Operations. Does not include rebates and fees paid to lending agent or premiums received from borrowers, if any.
(o) The rate shown is the 7-day SEC standardized yield as of August 31, 2021.(p) The security has been segregated to satisfy the commitment to return the cash collateral received in securities lending transactions
upon the borrower’s return of the securities loaned. See Note 1I.
See accompanying Notes to Financial Statements which are an integral part of the financial statements. 20 Invesco Short Term Bond Fund

ˆ200F9gfMJwyV%6soÄŠ200F9gfMJwyV%6so˜
209933 EDG 21INVESCOSHORT TERM BOND
29-Oct-2021 07:23 ESTHTMLAN
Donnelley Financial LSWpf_rendNone
9*ESS 0C
LSWP64RS0521.10.7.0
Page 1 of 1Open Futures Contracts
Unrealized Number of Expiration Notional Appreciation Long Futures Contracts Contracts Month Value Value (Depreciation) Interest Rate Risk U.S. Treasury 2 Year Notes 6,011 December-2021 $1,324,392,366 $ 791,388 $ 791,388
Short Futures Contracts Interest Rate Risk U.S. Treasury 5 Year Notes 4,609 December-2021 (570,219,719) (1,332,287) (1,332,287) U.S. Treasury 10 Year Notes 686 December-2021 (91,548,844) (321,563) (321,563) U.S. Treasury Long Bond 53 December-2021 (8,637,344) (28,156) (28,156)
Subtotal–Short Futures Contracts (1,682,006) (1,682,006) Total Futures Contracts $ (890,618) $ (890,618)
Portfolio CompositionBy security type, based on Net Assetsas of August 31, 2021 U.S. Dollar Denominated Bonds & Notes 69.53% Asset-Backed Securities 18.37 U.S. Treasury Securities 4.57 Security Types Each Less Than 1% of Portfolio 1.57 Money Market Funds Plus Other Assets Less Liabilities 5.96
See accompanying Notes to Financial Statements which are an integral part of the financial statements. 21 Invesco Short Term Bond Fund
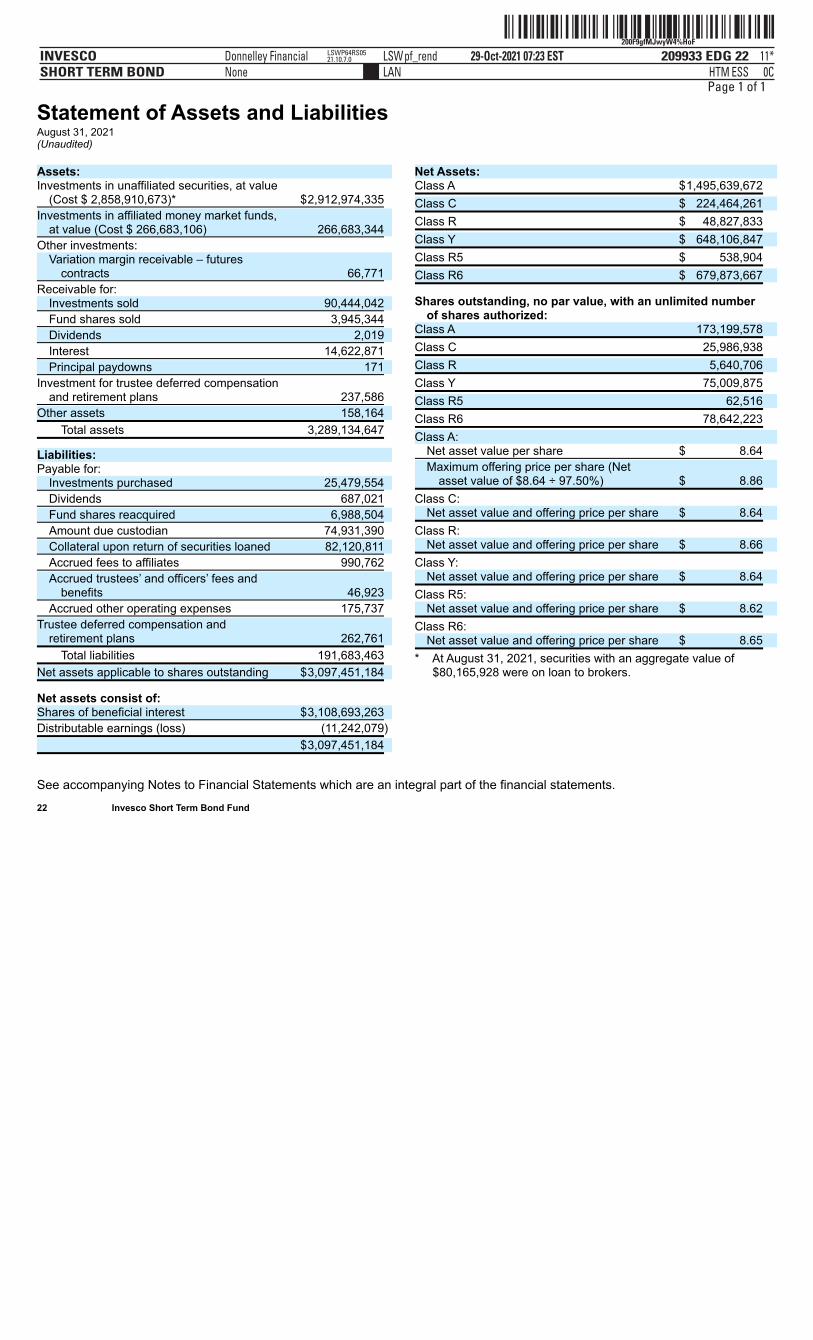
ˆ200F9gfMJwyW4%HoFŠ200F9gfMJwyW4%HoF
209933 EDG 22INVESCOSHORT TERM BOND
29-Oct-2021 07:23 ESTHTMLAN
Donnelley Financial LSWpf_rendNone
11*ESS 0C
LSWP64RS0521.10.7.0
Page 1 of 1
Statement of Assets and LiabilitiesAugust 31, 2021(Unaudited)
See accompanying Notes to Financial Statements which are an integral part of the financial statements. 22 Invesco Short Term Bond Fund
Assets: Investments in unaffiliated securities, at value
(Cost $ 2,858,910,673)* $2,912,974,335
Investments in affiliated money market funds,at value (Cost $ 266,683,106) 266,683,344
Other investments: Variation margin receivable – futures
contracts 66,771
Receivable for: Investments sold 90,444,042
Fund shares sold 3,945,344
Dividends 2,019
Interest 14,622,871
Principal paydowns 171
Investment for trustee deferred compensationand retirement plans 237,586
Other assets 158,164
Total assets 3,289,134,647
Liabilities: Payable for:
Investments purchased 25,479,554
Dividends 687,021
Fund shares reacquired 6,988,504
Amount due custodian 74,931,390
Collateral upon return of securities loaned 82,120,811
Accrued fees to affiliates 990,762
Accrued trustees’ and officers’ fees andbenefits 46,923
Accrued other operating expenses 175,737
Trustee deferred compensation andretirement plans 262,761
Total liabilities 191,683,463
Net assets applicable to shares outstanding $3,097,451,184
Net assets consist of: Shares of beneficial interest $3,108,693,263
Distributable earnings (loss) (11,242,079)
$3,097,451,184
Net Assets: Class A $1,495,639,672
Class C $ 224,464,261
Class R $ 48,827,833
Class Y $ 648,106,847
Class R5 $ 538,904
Class R6 $ 679,873,667
Shares outstanding, no par value, with an unlimited numberof shares authorized:
Class A 173,199,578
Class C 25,986,938
Class R 5,640,706
Class Y 75,009,875
Class R5 62,516
Class R6 78,642,223
Class A: Net asset value per share $ 8.64
Maximum offering price per share (Netasset value of $8.64 ÷ 97.50%) $ 8.86
Class C: Net asset value and offering price per share $ 8.64
Class R: Net asset value and offering price per share $ 8.66
Class Y: Net asset value and offering price per share $ 8.64
Class R5: Net asset value and offering price per share $ 8.62
Class R6: Net asset value and offering price per share $ 8.65
* At August 31, 2021, securities with an aggregate value of$80,165,928 were on loan to brokers.
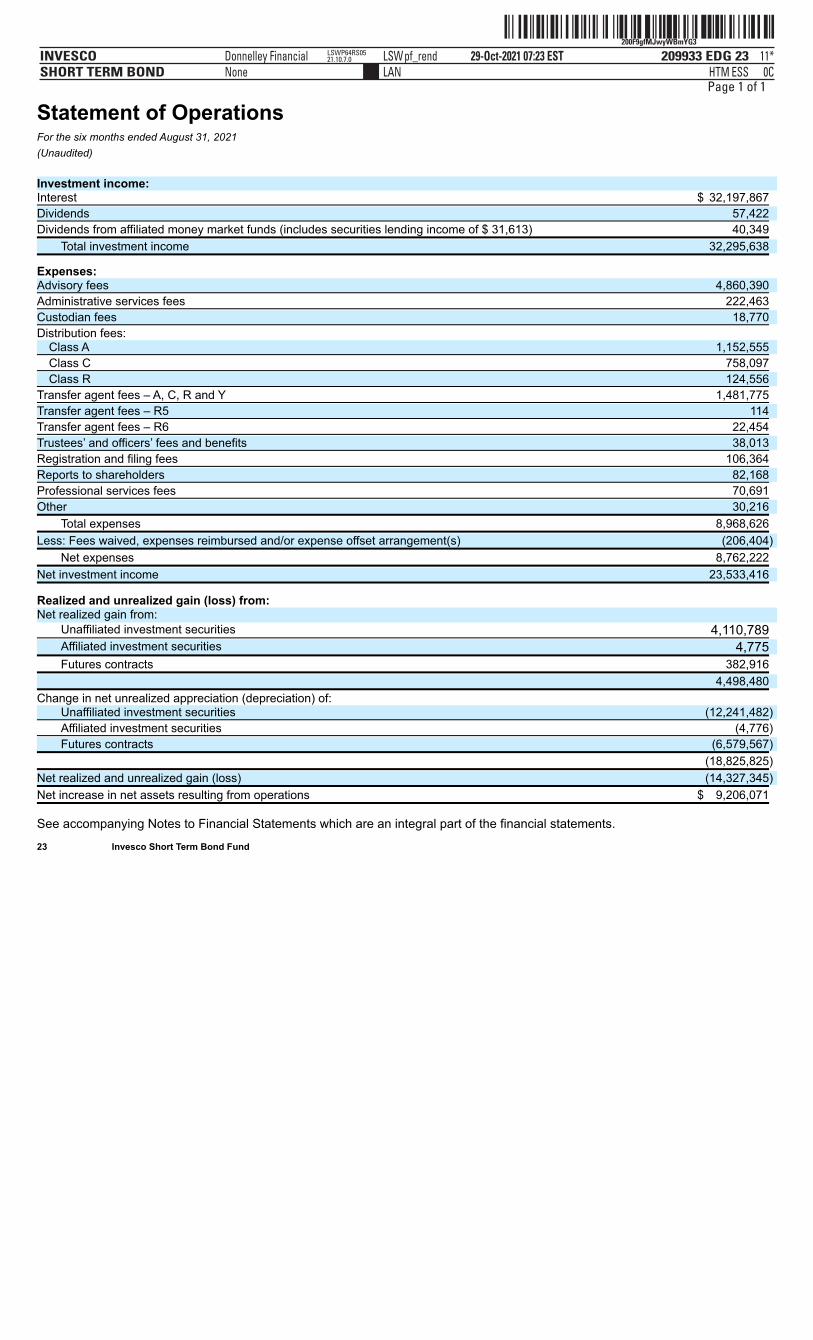
ˆ200F9gfMJwyWBmYG3Š200F9gfMJwyWBmYG3
209933 EDG 23INVESCOSHORT TERM BOND
29-Oct-2021 07:23 ESTHTMLAN
Donnelley Financial LSWpf_rendNone
11*ESS 0C
LSWP64RS0521.10.7.0
Page 1 of 1
Statement of OperationsFor the six months ended August 31, 2021(Unaudited) Investment income: Interest $ 32,197,867
Dividends 57,422
Dividends from affiliated money market funds (includes securities lending income of $ 31,613) 40,349
Total investment income 32,295,638
Expenses: Advisory fees 4,860,390
Administrative services fees 222,463
Custodian fees 18,770
Distribution fees: Class A 1,152,555
Class C 758,097
Class R 124,556
Transfer agent fees – A, C, R and Y 1,481,775
Transfer agent fees – R5 114
Transfer agent fees – R6 22,454
Trustees’ and officers’ fees and benefits 38,013
Registration and filing fees 106,364
Reports to shareholders 82,168
Professional services fees 70,691
Other 30,216
Total expenses 8,968,626
Less: Fees waived, expenses reimbursed and/or expense offset arrangement(s) (206,404)
Net expenses 8,762,222
Net investment income 23,533,416
Realized and unrealized gain (loss) from: Net realized gain from:
Unaffiliated investment securities 4,110,789
Affiliated investment securities 4,775
Futures contracts 382,916
4,498,480
Change in net unrealized appreciation (depreciation) of: Unaffiliated investment securities (12,241,482)
Affiliated investment securities (4,776)
Futures contracts (6,579,567)
(18,825,825)
Net realized and unrealized gain (loss) (14,327,345)
Net increase in net assets resulting from operations $ 9,206,071
See accompanying Notes to Financial Statements which are an integral part of the financial statements. 23 Invesco Short Term Bond Fund
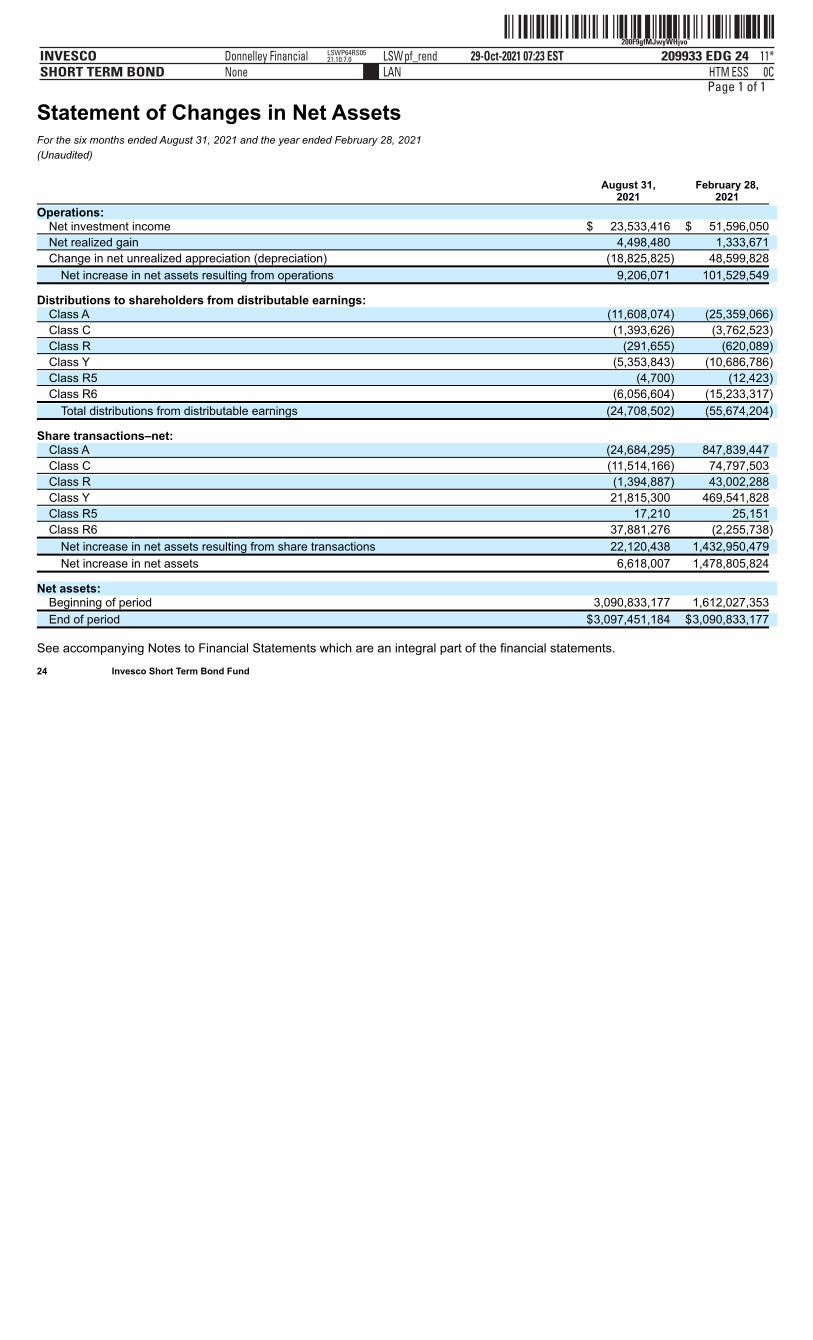
ˆ200F9gfMJwyWHjvoÈŠ200F9gfMJwyWHjvo¨
209933 EDG 24INVESCOSHORT TERM BOND
29-Oct-2021 07:23 ESTHTMLAN
Donnelley Financial LSWpf_rendNone
11*ESS 0C
LSWP64RS0521.10.7.0
Page 1 of 1
Statement of Changes in Net AssetsFor the six months ended August 31, 2021 and the year ended February 28, 2021(Unaudited)
August 31,
2021 February 28,
2021
Operations: Net investment income $ 23,533,416 $ 51,596,050
Net realized gain 4,498,480 1,333,671
Change in net unrealized appreciation (depreciation) (18,825,825) 48,599,828
Net increase in net assets resulting from operations 9,206,071 101,529,549
Distributions to shareholders from distributable earnings: Class A (11,608,074) (25,359,066)
Class C (1,393,626) (3,762,523)
Class R (291,655) (620,089)
Class Y (5,353,843) (10,686,786)
Class R5 (4,700) (12,423)
Class R6 (6,056,604) (15,233,317)
Total distributions from distributable earnings (24,708,502) (55,674,204)
Share transactions–net: Class A (24,684,295) 847,839,447
Class C (11,514,166) 74,797,503
Class R (1,394,887) 43,002,288
Class Y 21,815,300 469,541,828
Class R5 17,210 25,151
Class R6 37,881,276 (2,255,738)
Net increase in net assets resulting from share transactions 22,120,438 1,432,950,479
Net increase in net assets 6,618,007 1,478,805,824
Net assets: Beginning of period 3,090,833,177 1,612,027,353
End of period $3,097,451,184 $3,090,833,177
See accompanying Notes to Financial Statements which are an integral part of the financial statements. 24 Invesco Short Term Bond Fund
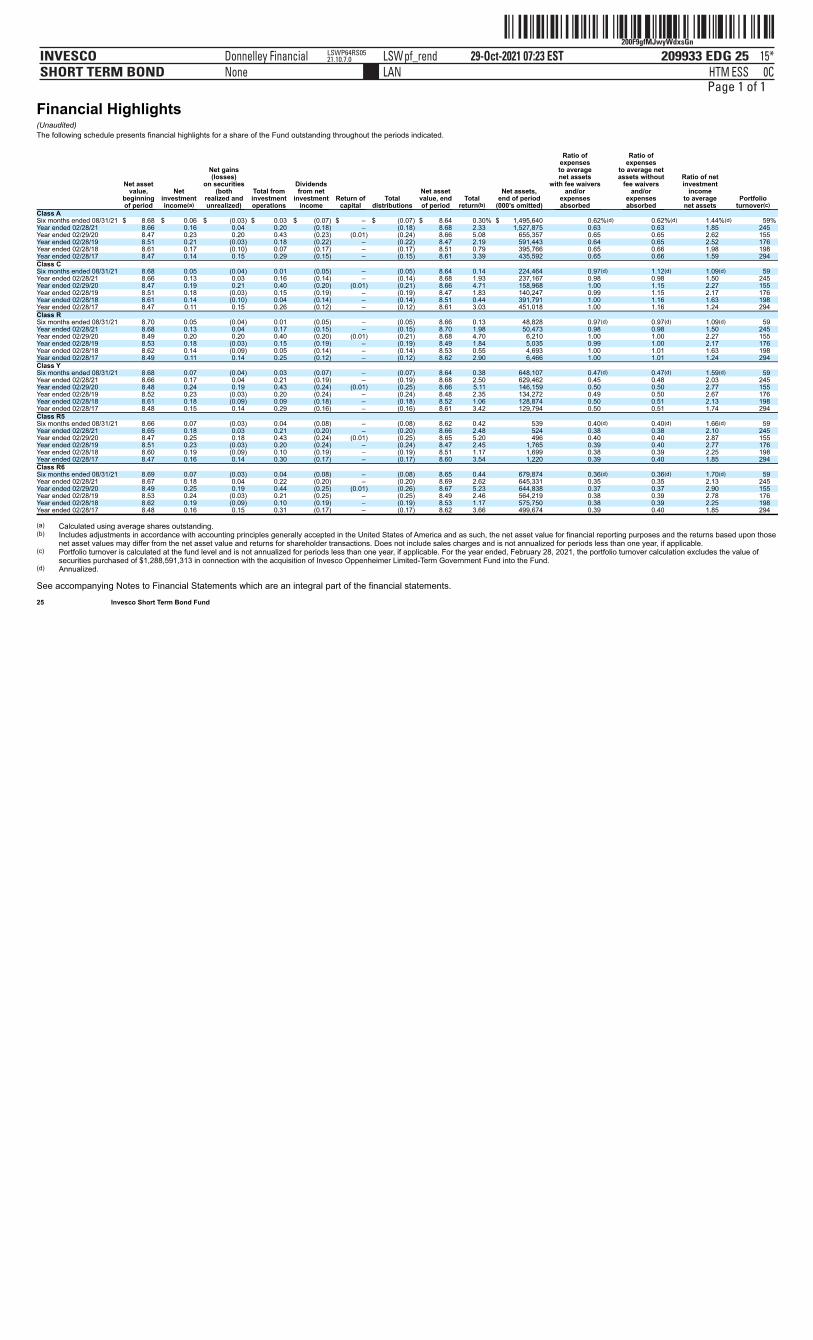
ˆ200F9gfMJwyWdxsGnŠ200F9gfMJwyWdxsGn
209933 EDG 25INVESCOSHORT TERM BOND
29-Oct-2021 07:23 ESTHTMLAN
Donnelley Financial LSWpf_rendNone
15*ESS 0C
LSWP64RS0521.10.7.0
Page 1 of 1
Financial Highlights(Unaudited)The following schedule presents financial highlights for a share of the Fund outstanding throughout the periods indicated. Ratio of Ratio of expenses expenses Net gains to average to average net (losses) net assets assets without Ratio of net Net asset on securities Dividends with fee waivers fee waivers investment value, Net (both Total from from net Net asset Net assets, and/or and/or income beginning investment realized and investment investment Return of Total value, end Total end of period expenses expenses to average Portfolio of period income(a) unrealized) operations income capital distributions of period return(b) (000’s omitted) absorbed absorbed net assets turnover(c) Class A Six months ended 08/31/21 $ 8.68 $ 0.06 $ (0.03) $ 0.03 $ (0.07) $ – $ (0.07) $ 8.64 0.30% $ 1,495,640 0.62%(d) 0.62%(d) 1.44%(d) 59% Year ended 02/28/21 8.66 0.16 0.04 0.20 (0.18) – (0.18) 8.68 2.33 1,527,875 0.63 0.63 1.85 245 Year ended 02/29/20 8.47 0.23 0.20 0.43 (0.23) (0.01) (0.24) 8.66 5.08 655,357 0.65 0.65 2.62 155 Year ended 02/28/19 8.51 0.21 (0.03) 0.18 (0.22) – (0.22) 8.47 2.19 591,443 0.64 0.65 2.52 176 Year ended 02/28/18 8.61 0.17 (0.10) 0.07 (0.17) – (0.17) 8.51 0.79 395,766 0.65 0.66 1.98 198 Year ended 02/28/17 8.47 0.14 0.15 0.29 (0.15) – (0.15) 8.61 3.39 435,592 0.65 0.66 1.59 294 Class C Six months ended 08/31/21 8.68 0.05 (0.04) 0.01 (0.05) – (0.05) 8.64 0.14 224,464 0.97(d) 1.12(d) 1.09(d) 59 Year ended 02/28/21 8.66 0.13 0.03 0.16 (0.14) – (0.14) 8.68 1.93 237,167 0.98 0.98 1.50 245 Year ended 02/29/20 8.47 0.19 0.21 0.40 (0.20) (0.01) (0.21) 8.66 4.71 158,968 1.00 1.15 2.27 155 Year ended 02/28/19 8.51 0.18 (0.03) 0.15 (0.19) – (0.19) 8.47 1.83 140,247 0.99 1.15 2.17 176 Year ended 02/28/18 8.61 0.14 (0.10) 0.04 (0.14) – (0.14) 8.51 0.44 391,791 1.00 1.16 1.63 198 Year ended 02/28/17 8.47 0.11 0.15 0.26 (0.12) – (0.12) 8.61 3.03 451,018 1.00 1.16 1.24 294 Class R Six months ended 08/31/21 8.70 0.05 (0.04) 0.01 (0.05) – (0.05) 8.66 0.13 48,828 0.97(d) 0.97(d) 1.09(d) 59 Year ended 02/28/21 8.68 0.13 0.04 0.17 (0.15) – (0.15) 8.70 1.98 50,473 0.98 0.98 1.50 245 Year ended 02/29/20 8.49 0.20 0.20 0.40 (0.20) (0.01) (0.21) 8.68 4.70 6,210 1.00 1.00 2.27 155 Year ended 02/28/19 8.53 0.18 (0.03) 0.15 (0.19) – (0.19) 8.49 1.84 5,035 0.99 1.00 2.17 176 Year ended 02/28/18 8.62 0.14 (0.09) 0.05 (0.14) – (0.14) 8.53 0.55 4,693 1.00 1.01 1.63 198 Year ended 02/28/17 8.49 0.11 0.14 0.25 (0.12) – (0.12) 8.62 2.90 6,466 1.00 1.01 1.24 294 Class Y Six months ended 08/31/21 8.68 0.07 (0.04) 0.03 (0.07) – (0.07) 8.64 0.38 648,107 0.47(d) 0.47(d) 1.59(d) 59 Year ended 02/28/21 8.66 0.17 0.04 0.21 (0.19) – (0.19) 8.68 2.50 629,462 0.45 0.48 2.03 245 Year ended 02/29/20 8.48 0.24 0.19 0.43 (0.24) (0.01) (0.25) 8.66 5.11 146,159 0.50 0.50 2.77 155 Year ended 02/28/19 8.52 0.23 (0.03) 0.20 (0.24) – (0.24) 8.48 2.35 134,272 0.49 0.50 2.67 176 Year ended 02/28/18 8.61 0.18 (0.09) 0.09 (0.18) – (0.18) 8.52 1.06 128,874 0.50 0.51 2.13 198 Year ended 02/28/17 8.48 0.15 0.14 0.29 (0.16) – (0.16) 8.61 3.42 129,794 0.50 0.51 1.74 294 Class R5 Six months ended 08/31/21 8.66 0.07 (0.03) 0.04 (0.08) – (0.08) 8.62 0.42 539 0.40(d) 0.40(d) 1.66(d) 59 Year ended 02/28/21 8.65 0.18 0.03 0.21 (0.20) – (0.20) 8.66 2.48 524 0.38 0.38 2.10 245 Year ended 02/29/20 8.47 0.25 0.18 0.43 (0.24) (0.01) (0.25) 8.65 5.20 496 0.40 0.40 2.87 155 Year ended 02/28/19 8.51 0.23 (0.03) 0.20 (0.24) – (0.24) 8.47 2.45 1,765 0.39 0.40 2.77 176 Year ended 02/28/18 8.60 0.19 (0.09) 0.10 (0.19) – (0.19) 8.51 1.17 1,699 0.38 0.39 2.25 198 Year ended 02/28/17 8.47 0.16 0.14 0.30 (0.17) – (0.17) 8.60 3.54 1,220 0.39 0.40 1.85 294 Class R6 Six months ended 08/31/21 8.69 0.07 (0.03) 0.04 (0.08) – (0.08) 8.65 0.44 679,874 0.36(d) 0.36(d) 1.70(d) 59 Year ended 02/28/21 8.67 0.18 0.04 0.22 (0.20) – (0.20) 8.69 2.62 645,331 0.35 0.35 2.13 245 Year ended 02/29/20 8.49 0.25 0.19 0.44 (0.25) (0.01) (0.26) 8.67 5.23 644,838 0.37 0.37 2.90 155 Year ended 02/28/19 8.53 0.24 (0.03) 0.21 (0.25) – (0.25) 8.49 2.46 564,219 0.38 0.39 2.78 176 Year ended 02/28/18 8.62 0.19 (0.09) 0.10 (0.19) – (0.19) 8.53 1.17 575,750 0.38 0.39 2.25 198 Year ended 02/28/17 8.48 0.16 0.15 0.31 (0.17) – (0.17) 8.62 3.66 499,674 0.39 0.40 1.85 294
(a) Calculated using average shares outstanding.(b) Includes adjustments in accordance with accounting principles generally accepted in the United States of America and as such, the net asset value for financial reporting purposes and the returns based upon those
net asset values may differ from the net asset value and returns for shareholder transactions. Does not include sales charges and is not annualized for periods less than one year, if applicable.(c) Portfolio turnover is calculated at the fund level and is not annualized for periods less than one year, if applicable. For the year ended, February 28, 2021, the portfolio turnover calculation excludes the value of
securities purchased of $1,288,591,313 in connection with the acquisition of Invesco Oppenheimer Limited-Term Government Fund into the Fund.(d) Annualized.
See accompanying Notes to Financial Statements which are an integral part of the financial statements. 25 Invesco Short Term Bond Fund
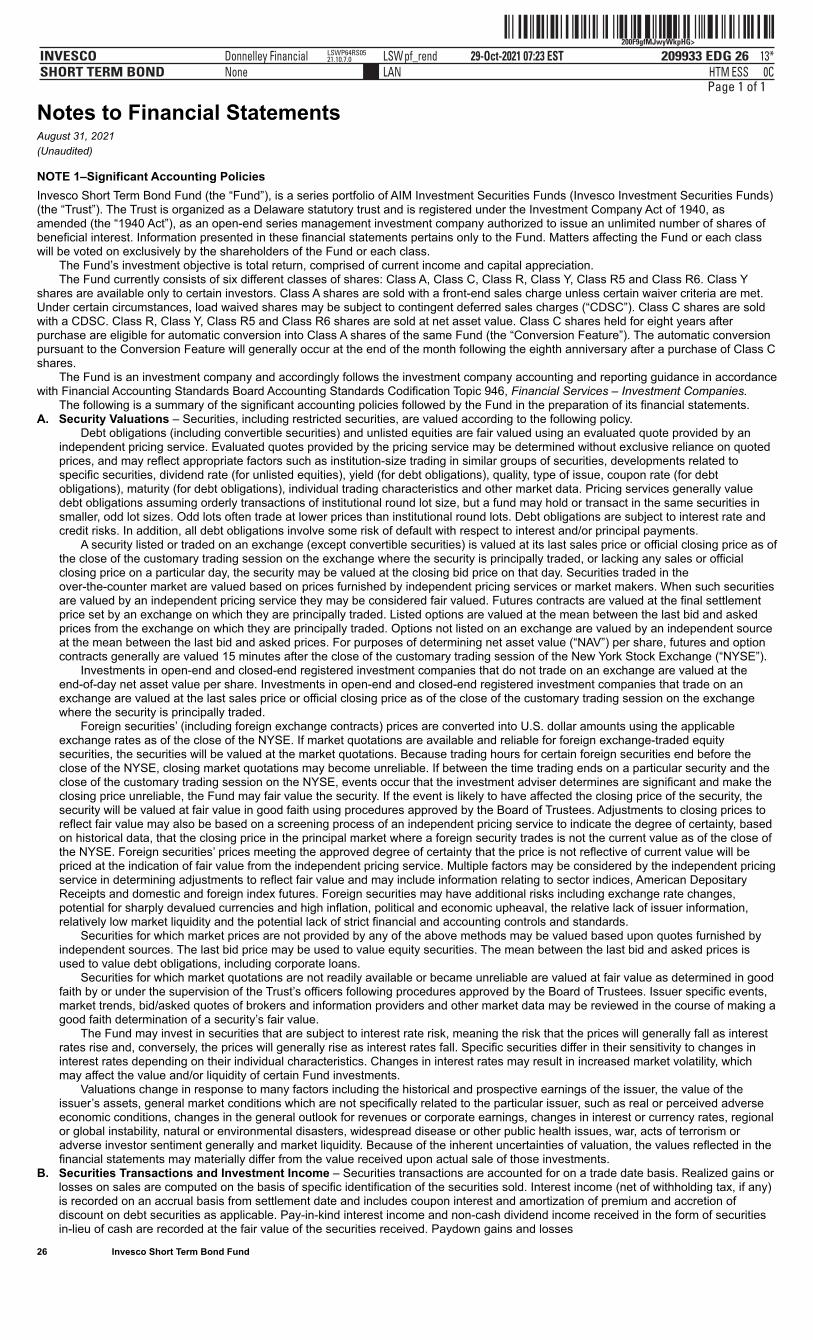
ˆ200F9gfMJwyWkpHG>Š200F9gfMJwyWkpHG>
209933 EDG 26INVESCOSHORT TERM BOND
29-Oct-2021 07:23 ESTHTMLAN
Donnelley Financial LSWpf_rendNone
13*ESS 0C
LSWP64RS0521.10.7.0
Page 1 of 1
Notes to Financial StatementsAugust 31, 2021(Unaudited)
NOTE 1–Significant Accounting PoliciesInvesco Short Term Bond Fund (the “Fund”), is a series portfolio of AIM Investment Securities Funds (Invesco Investment Securities Funds)(the “Trust”). The Trust is organized as a Delaware statutory trust and is registered under the Investment Company Act of 1940, asamended (the “1940 Act”), as an open-end series management investment company authorized to issue an unlimited number of shares ofbeneficial interest. Information presented in these financial statements pertains only to the Fund. Matters affecting the Fund or each classwill be voted on exclusively by the shareholders of the Fund or each class.
The Fund’s investment objective is total return, comprised of current income and capital appreciation.The Fund currently consists of six different classes of shares: Class A, Class C, Class R, Class Y, Class R5 and Class R6. Class Y
shares are available only to certain investors. Class A shares are sold with a front-end sales charge unless certain waiver criteria are met.Under certain circumstances, load waived shares may be subject to contingent deferred sales charges (“CDSC”). Class C shares are soldwith a CDSC. Class R, Class Y, Class R5 and Class R6 shares are sold at net asset value. Class C shares held for eight years afterpurchase are eligible for automatic conversion into Class A shares of the same Fund (the “Conversion Feature”). The automatic conversionpursuant to the Conversion Feature will generally occur at the end of the month following the eighth anniversary after a purchase of Class Cshares.
The Fund is an investment company and accordingly follows the investment company accounting and reporting guidance in accordancewith Financial Accounting Standards Board Accounting Standards Codification Topic 946, Financial Services – Investment Companies.
The following is a summary of the significant accounting policies followed by the Fund in the preparation of its financial statements.A. Security Valuations – Securities, including restricted securities, are valued according to the following policy.
Debt obligations (including convertible securities) and unlisted equities are fair valued using an evaluated quote provided by anindependent pricing service. Evaluated quotes provided by the pricing service may be determined without exclusive reliance on quotedprices, and may reflect appropriate factors such as institution-size trading in similar groups of securities, developments related tospecific securities, dividend rate (for unlisted equities), yield (for debt obligations), quality, type of issue, coupon rate (for debtobligations), maturity (for debt obligations), individual trading characteristics and other market data. Pricing services generally valuedebt obligations assuming orderly transactions of institutional round lot size, but a fund may hold or transact in the same securities insmaller, odd lot sizes. Odd lots often trade at lower prices than institutional round lots. Debt obligations are subject to interest rate andcredit risks. In addition, all debt obligations involve some risk of default with respect to interest and/or principal payments.
A security listed or traded on an exchange (except convertible securities) is valued at its last sales price or official closing price as ofthe close of the customary trading session on the exchange where the security is principally traded, or lacking any sales or officialclosing price on a particular day, the security may be valued at the closing bid price on that day. Securities traded in theover-the-counter market are valued based on prices furnished by independent pricing services or market makers. When such securitiesare valued by an independent pricing service they may be considered fair valued. Futures contracts are valued at the final settlementprice set by an exchange on which they are principally traded. Listed options are valued at the mean between the last bid and askedprices from the exchange on which they are principally traded. Options not listed on an exchange are valued by an independent sourceat the mean between the last bid and asked prices. For purposes of determining net asset value (“NAV”) per share, futures and optioncontracts generally are valued 15 minutes after the close of the customary trading session of the New York Stock Exchange (“NYSE”).
Investments in open-end and closed-end registered investment companies that do not trade on an exchange are valued at theend-of-day net asset value per share. Investments in open-end and closed-end registered investment companies that trade on anexchange are valued at the last sales price or official closing price as of the close of the customary trading session on the exchangewhere the security is principally traded.
Foreign securities’ (including foreign exchange contracts) prices are converted into U.S. dollar amounts using the applicableexchange rates as of the close of the NYSE. If market quotations are available and reliable for foreign exchange-traded equitysecurities, the securities will be valued at the market quotations. Because trading hours for certain foreign securities end before theclose of the NYSE, closing market quotations may become unreliable. If between the time trading ends on a particular security and theclose of the customary trading session on the NYSE, events occur that the investment adviser determines are significant and make theclosing price unreliable, the Fund may fair value the security. If the event is likely to have affected the closing price of the security, thesecurity will be valued at fair value in good faith using procedures approved by the Board of Trustees. Adjustments to closing prices toreflect fair value may also be based on a screening process of an independent pricing service to indicate the degree of certainty, basedon historical data, that the closing price in the principal market where a foreign security trades is not the current value as of the close ofthe NYSE. Foreign securities’ prices meeting the approved degree of certainty that the price is not reflective of current value will bepriced at the indication of fair value from the independent pricing service. Multiple factors may be considered by the independent pricingservice in determining adjustments to reflect fair value and may include information relating to sector indices, American DepositaryReceipts and domestic and foreign index futures. Foreign securities may have additional risks including exchange rate changes,potential for sharply devalued currencies and high inflation, political and economic upheaval, the relative lack of issuer information,relatively low market liquidity and the potential lack of strict financial and accounting controls and standards.
Securities for which market prices are not provided by any of the above methods may be valued based upon quotes furnished byindependent sources. The last bid price may be used to value equity securities. The mean between the last bid and asked prices isused to value debt obligations, including corporate loans.
Securities for which market quotations are not readily available or became unreliable are valued at fair value as determined in goodfaith by or under the supervision of the Trust’s officers following procedures approved by the Board of Trustees. Issuer specific events,market trends, bid/asked quotes of brokers and information providers and other market data may be reviewed in the course of making agood faith determination of a security’s fair value.
The Fund may invest in securities that are subject to interest rate risk, meaning the risk that the prices will generally fall as interestrates rise and, conversely, the prices will generally rise as interest rates fall. Specific securities differ in their sensitivity to changes ininterest rates depending on their individual characteristics. Changes in interest rates may result in increased market volatility, whichmay affect the value and/or liquidity of certain Fund investments.
Valuations change in response to many factors including the historical and prospective earnings of the issuer, the value of theissuer’s assets, general market conditions which are not specifically related to the particular issuer, such as real or perceived adverseeconomic conditions, changes in the general outlook for revenues or corporate earnings, changes in interest or currency rates, regionalor global instability, natural or environmental disasters, widespread disease or other public health issues, war, acts of terrorism oradverse investor sentiment generally and market liquidity. Because of the inherent uncertainties of valuation, the values reflected in thefinancial statements may materially differ from the value received upon actual sale of those investments.
B. Securities Transactions and Investment Income – Securities transactions are accounted for on a trade date basis. Realized gains orlosses on sales are computed on the basis of specific identification of the securities sold. Interest income (net of withholding tax, if any)is recorded on an accrual basis from settlement date and includes coupon interest and amortization of premium and accretion ofdiscount on debt securities as applicable. Pay-in-kind interest income and non-cash dividend income received in the form of securitiesin-lieu of cash are recorded at the fair value of the securities received. Paydown gains and losses
26 Invesco Short Term Bond Fund
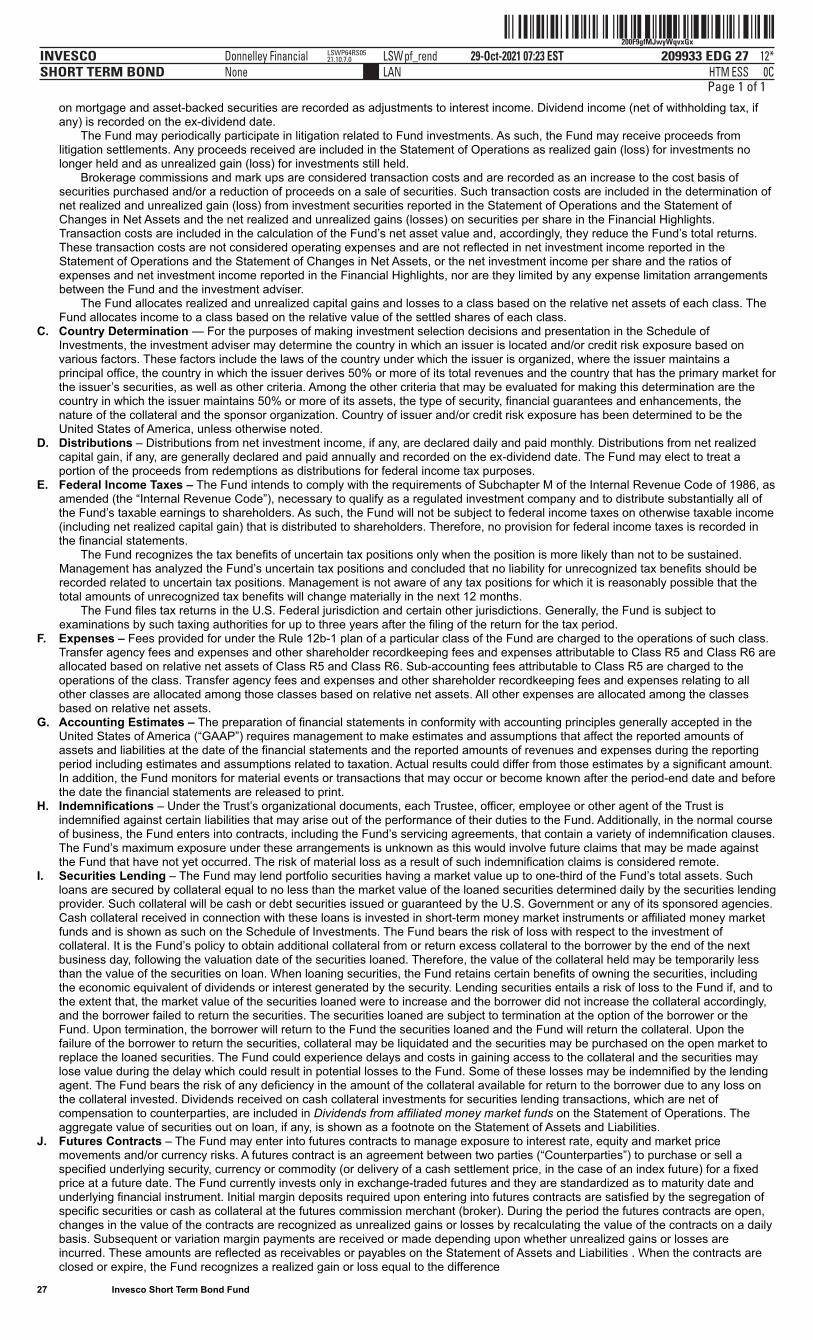
ˆ200F9gfMJwyWqvxGxŠ200F9gfMJwyWqvxGx
209933 EDG 27INVESCOSHORT TERM BOND
29-Oct-2021 07:23 ESTHTMLAN
Donnelley Financial LSWpf_rendNone
12*ESS 0C
LSWP64RS0521.10.7.0
Page 1 of 1
on mortgage and asset-backed securities are recorded as adjustments to interest income. Dividend income (net of withholding tax, ifany) is recorded on the ex-dividend date.
The Fund may periodically participate in litigation related to Fund investments. As such, the Fund may receive proceeds fromlitigation settlements. Any proceeds received are included in the Statement of Operations as realized gain (loss) for investments nolonger held and as unrealized gain (loss) for investments still held.
Brokerage commissions and mark ups are considered transaction costs and are recorded as an increase to the cost basis ofsecurities purchased and/or a reduction of proceeds on a sale of securities. Such transaction costs are included in the determination ofnet realized and unrealized gain (loss) from investment securities reported in the Statement of Operations and the Statement ofChanges in Net Assets and the net realized and unrealized gains (losses) on securities per share in the Financial Highlights.Transaction costs are included in the calculation of the Fund’s net asset value and, accordingly, they reduce the Fund’s total returns.These transaction costs are not considered operating expenses and are not reflected in net investment income reported in theStatement of Operations and the Statement of Changes in Net Assets, or the net investment income per share and the ratios ofexpenses and net investment income reported in the Financial Highlights, nor are they limited by any expense limitation arrangementsbetween the Fund and the investment adviser.
The Fund allocates realized and unrealized capital gains and losses to a class based on the relative net assets of each class. TheFund allocates income to a class based on the relative value of the settled shares of each class.
C. Country Determination — For the purposes of making investment selection decisions and presentation in the Schedule ofInvestments, the investment adviser may determine the country in which an issuer is located and/or credit risk exposure based onvarious factors. These factors include the laws of the country under which the issuer is organized, where the issuer maintains aprincipal office, the country in which the issuer derives 50% or more of its total revenues and the country that has the primary market forthe issuer’s securities, as well as other criteria. Among the other criteria that may be evaluated for making this determination are thecountry in which the issuer maintains 50% or more of its assets, the type of security, financial guarantees and enhancements, thenature of the collateral and the sponsor organization. Country of issuer and/or credit risk exposure has been determined to be theUnited States of America, unless otherwise noted.
D. Distributions – Distributions from net investment income, if any, are declared daily and paid monthly. Distributions from net realizedcapital gain, if any, are generally declared and paid annually and recorded on the ex-dividend date. The Fund may elect to treat aportion of the proceeds from redemptions as distributions for federal income tax purposes.
E. Federal Income Taxes – The Fund intends to comply with the requirements of Subchapter M of the Internal Revenue Code of 1986, asamended (the “Internal Revenue Code”), necessary to qualify as a regulated investment company and to distribute substantially all ofthe Fund’s taxable earnings to shareholders. As such, the Fund will not be subject to federal income taxes on otherwise taxable income(including net realized capital gain) that is distributed to shareholders. Therefore, no provision for federal income taxes is recorded inthe financial statements.
The Fund recognizes the tax benefits of uncertain tax positions only when the position is more likely than not to be sustained.Management has analyzed the Fund’s uncertain tax positions and concluded that no liability for unrecognized tax benefits should berecorded related to uncertain tax positions. Management is not aware of any tax positions for which it is reasonably possible that thetotal amounts of unrecognized tax benefits will change materially in the next 12 months.
The Fund files tax returns in the U.S. Federal jurisdiction and certain other jurisdictions. Generally, the Fund is subject toexaminations by such taxing authorities for up to three years after the filing of the return for the tax period.
F. Expenses – Fees provided for under the Rule 12b-1 plan of a particular class of the Fund are charged to the operations of such class.Transfer agency fees and expenses and other shareholder recordkeeping fees and expenses attributable to Class R5 and Class R6 areallocated based on relative net assets of Class R5 and Class R6. Sub-accounting fees attributable to Class R5 are charged to theoperations of the class. Transfer agency fees and expenses and other shareholder recordkeeping fees and expenses relating to allother classes are allocated among those classes based on relative net assets. All other expenses are allocated among the classesbased on relative net assets.
G. Accounting Estimates – The preparation of financial statements in conformity with accounting principles generally accepted in theUnited States of America (“GAAP”) requires management to make estimates and assumptions that affect the reported amounts ofassets and liabilities at the date of the financial statements and the reported amounts of revenues and expenses during the reportingperiod including estimates and assumptions related to taxation. Actual results could differ from those estimates by a significant amount.In addition, the Fund monitors for material events or transactions that may occur or become known after the period-end date and beforethe date the financial statements are released to print.
H. Indemnifications – Under the Trust’s organizational documents, each Trustee, officer, employee or other agent of the Trust isindemnified against certain liabilities that may arise out of the performance of their duties to the Fund. Additionally, in the normal courseof business, the Fund enters into contracts, including the Fund’s servicing agreements, that contain a variety of indemnification clauses.The Fund’s maximum exposure under these arrangements is unknown as this would involve future claims that may be made againstthe Fund that have not yet occurred. The risk of material loss as a result of such indemnification claims is considered remote.
I. Securities Lending – The Fund may lend portfolio securities having a market value up to one-third of the Fund’s total assets. Suchloans are secured by collateral equal to no less than the market value of the loaned securities determined daily by the securities lendingprovider. Such collateral will be cash or debt securities issued or guaranteed by the U.S. Government or any of its sponsored agencies.Cash collateral received in connection with these loans is invested in short-term money market instruments or affiliated money marketfunds and is shown as such on the Schedule of Investments. The Fund bears the risk of loss with respect to the investment ofcollateral. It is the Fund’s policy to obtain additional collateral from or return excess collateral to the borrower by the end of the nextbusiness day, following the valuation date of the securities loaned. Therefore, the value of the collateral held may be temporarily lessthan the value of the securities on loan. When loaning securities, the Fund retains certain benefits of owning the securities, includingthe economic equivalent of dividends or interest generated by the security. Lending securities entails a risk of loss to the Fund if, and tothe extent that, the market value of the securities loaned were to increase and the borrower did not increase the collateral accordingly,and the borrower failed to return the securities. The securities loaned are subject to termination at the option of the borrower or theFund. Upon termination, the borrower will return to the Fund the securities loaned and the Fund will return the collateral. Upon thefailure of the borrower to return the securities, collateral may be liquidated and the securities may be purchased on the open market toreplace the loaned securities. The Fund could experience delays and costs in gaining access to the collateral and the securities maylose value during the delay which could result in potential losses to the Fund. Some of these losses may be indemnified by the lendingagent. The Fund bears the risk of any deficiency in the amount of the collateral available for return to the borrower due to any loss onthe collateral invested. Dividends received on cash collateral investments for securities lending transactions, which are net ofcompensation to counterparties, are included in Dividends from affiliated money market funds on the Statement of Operations. Theaggregate value of securities out on loan, if any, is shown as a footnote on the Statement of Assets and Liabilities.
J. Futures Contracts – The Fund may enter into futures contracts to manage exposure to interest rate, equity and market pricemovements and/or currency risks. A futures contract is an agreement between two parties (“Counterparties”) to purchase or sell aspecified underlying security, currency or commodity (or delivery of a cash settlement price, in the case of an index future) for a fixedprice at a future date. The Fund currently invests only in exchange-traded futures and they are standardized as to maturity date andunderlying financial instrument. Initial margin deposits required upon entering into futures contracts are satisfied by the segregation ofspecific securities or cash as collateral at the futures commission merchant (broker). During the period the futures contracts are open,changes in the value of the contracts are recognized as unrealized gains or losses by recalculating the value of the contracts on a dailybasis. Subsequent or variation margin payments are received or made depending upon whether unrealized gains or losses areincurred. These amounts are reflected as receivables or payables on the Statement of Assets and Liabilities . When the contracts areclosed or expire, the Fund recognizes a realized gain or loss equal to the difference
27 Invesco Short Term Bond Fund
ˆ200F9gfMJwyWwe4o_Š200F9gfMJwyWwe4o_
209933 EDG 28INVESCOSHORT TERM BOND
29-Oct-2021 07:23 ESTHTMLAN
Donnelley Financial LSWpf_rendNone
12*ESS 0C
LSWP64RS0521.10.7.0
Page 1 of 1
between the proceeds from, or cost of, the closing transaction and the Fund’s basis in the contract. The net realized gain (loss) and thechange in unrealized gain (loss) on futures contracts held during the period is included on the Statement of Operations. The primaryrisks associated with futures contracts are market risk and the absence of a liquid secondary market. If the Fund were unable toliquidate a futures contract and/or enter into an offsetting closing transaction, the Fund would continue to be subject to market risk withrespect to the value of the contracts and continue to be required to maintain the margin deposits on the futures contracts. Futurescontracts have minimal Counterparty risk since the exchange’s clearinghouse, as Counterparty to all exchange-traded futures,guarantees the futures against default. Risks may exceed amounts recognized in the Statement of Assets and Liabilities.
K. LIBOR Risk – The Fund may invest in financial instruments that utilize LIBOR as the reference or benchmark rate for variable interestrate calculations. On July 27, 2017, the head of the United Kingdom’s Financial Conduct Authority announced a desire to phase out theuse of LIBOR by the end of 2021. Although many LIBOR rates will be phased out at the end of 2021 as originally intended, a selectionof widely used USD LIBOR rates will continue to be published until June 2023 in order to assist with the transition. There remainsuncertainty regarding the effect of the LIBOR transition process and therefore any impact of a transition away from LIBOR on the Fundor the instruments in which the Fund invests cannot yet be determined. There is no assurance that the composition or characteristics ofany alternative reference rate will be similar to or produce the same value or economic equivalence as LIBOR or that instruments usingan alternative rate will have the same volume or liquidity. Any such effects of the transition away from LIBOR and the adoption ofalternative reference rates could result in losses to the Fund.
L. Collateral – To the extent the Fund has designated or segregated a security as collateral and that security is subsequently sold, it is theFund’s practice to replace such collateral no later than the next business day.
M. COVID-19 Risk – The COVID-19 strain of coronavirus has resulted in instances of market closures and dislocations, extreme volatility,liquidity constraints and increased trading costs. Efforts to contain its spread have resulted in travel restrictions, disruptions ofhealthcare systems, business operations and supply chains, layoffs, lower consumer demand, and defaults, among other significanteconomic impacts that have disrupted global economic activity across many industries. Such economic impacts may exacerbate otherpre-existing political, social and economic risks locally or globally.The ongoing effects of COVID-19 are unpredictable and may result in significant and prolonged effects on the Fund’s performance.
NOTE 2—Advisory Fees and Other Fees Paid to AffiliatesThe Trust has entered into a master investment advisory agreement with Invesco Advisers, Inc. (the “Adviser” or “Invesco”). Under theterms of the investment advisory agreement, the Fund accrues daily and pays monthly an advisory fee to the Adviser based on the annualrate of the Fund’s average daily net assets as follows:
Average Daily Net Assets RateFirst $ 500 million 0.350%Next $500 million 0.325%Next $1.5 billion 0.300%Next $2.5 billion 0.290%Over $5 billion 0.280%
For the six months ended August 31, 2021, the effective advisory fee rate incurred by the Fund was 0.31%.Under the terms of a master sub-advisory agreement between the Adviser and each of Invesco Asset Management Deutschland
GmbH, Invesco Asset Management Limited, Invesco Asset Management (Japan) Limited, Invesco Hong Kong Limited, Invesco SeniorSecured Management, Inc. and Invesco Canada Ltd. (collectively, the “Affiliated Sub-Advisers”) the Adviser, not the Fund, will pay 40% ofthe fees paid to the Adviser to any such Affiliated Sub-Adviser(s) that provide(s) discretionary investment management services to the Fundbased on the percentage of assets allocated to such Affiliated Sub-Adviser(s).
The Adviser has contractually agreed, through June 30, 2022 to waive advisory fees and/or reimburse expenses of all shares to theextent necessary to limit total annual fund operating expenses after fee waiver and/or expense reimbursement (excluding certain itemsdiscussed below) of Class A, Class C, Class R, Class Y, Class R5 and Class R6 shares to 1.40%, 1.75% (after 12b-1 fee waivers), 1.75%,1.25%, 1.25% and 1.25%, respectively, of the Fund’s average daily net assets. Prior to June 1, 2021, the Adviser has contractually agreed,through May 31, 2021 to waive advisory fees and/or reimburse expenses of all shares to the extent necessary to limit total annual fundoperating expenses after fee waiver and/or expense reimbursement (excluding certain items discussed below) of Class A, Class C,Class R, Class Y, Class R5 and Class R6 shares to 0.75%, 1.59% (after 12b-1 fee waivers), 1.09%, 0.45%, 0.44% and 0.39%, respectively,of the Fund’s average daily net assets. In determining the Adviser’s obligation to waive advisory fees and/or reimburse expenses, thefollowing expenses are not taken into account, and could cause the total annual fund operating expenses after fee waiver and/or expensereimbursement to exceed the numbers reflected above: (1) interest; (2) taxes; (3) dividend expense on short sales; (4) extraordinary itemsor non-routine items, including litigation expenses; and (5) expenses that the Fund has incurred but did not actually pay because of anexpense offset arrangement. Unless Invesco continues the fee waiver agreement, it will terminate on June 30, 2022. During its term, the feewaiver agreement cannot be terminated or amended to increase the expense limits or reduce the advisory fee waiver without approval ofthe Board of Trustees.
Further, the Adviser has contractually agreed, through at least June 30, 2023, to waive the advisory fee payable by the Fund in anamount equal to 100% of the net advisory fees the Adviser receives from the affiliated money market funds on investments by the Fund ofuninvested cash (excluding investments of cash collateral from securities lending) in such affiliated money market funds.
For the six months ended August 31, 2021, the Adviser waived advisory fees of $13,416 and reimbursed class level expenses of $0, $0,$0, $14,707, $0 and $0 of Class A, Class C, Class R, Class Y, Class R5 and Class R6 shares, respectively.
The Trust has entered into a master administrative services agreement with Invesco pursuant to which the Fund has agreed to payInvesco for certain administrative costs incurred in providing accounting services to the Fund. For the six months ended August 31, 2021,expenses incurred under the agreement are shown in the Statement of Operations as Administrative services fees. Invesco has enteredinto a sub-administration agreement whereby State Street Bank and Trust Company (“SSB”) serves as fund accountant and providescertain administrative services to the Fund. Pursuant to a custody agreement with the Trust on behalf of the Fund, SSB also serves as theFund’s custodian.
The Trust has entered into a transfer agency and service agreement with Invesco Investment Services, Inc. (“IIS”) pursuant to which theFund has agreed to pay IIS a fee for providing transfer agency and shareholder services to the Fund and reimburse IIS for certain expensesincurred by IIS in the course of providing such services. IIS may make payments to intermediaries that provide omnibus account services,sub-accounting services and/or networking services. All fees payable by IIS to intermediaries that provide omnibus account services orsub-accounting services are charged back to the Fund, subject to certain limitations approved by the Trust’s Board of Trustees. For the sixmonths ended August 31, 2021, expenses incurred under the agreement are shown in the Statement of Operations as Transfer agent fees.
The Trust has entered into master distribution agreements with Invesco Distributors, Inc. (“IDI”) to serve as the distributor for theClass A, Class C, Class R, Class Y, Class R5 and Class R6 shares of the Fund. The Trust has adopted plans pursuant to Rule 12b-1 underthe 1940 Act with respect to the Fund’s Class A, Class C and Class R shares (collectively, the “Plans”). The Fund, pursuant to the Plans,pays IDI compensation at the annual rate of 0.15% of the Fund’s average daily net assets of Class A shares, 0.65% of the average daily netassets of Class C shares and 0.50% of the average daily net assets of Class R shares. The fees are accrued daily and paid monthly. Of thePlan payments, up to 0.25% of the average daily net assets of each class of shares may be paid to furnish continuing personal shareholderservices to customers who purchase and own shares of such classes. Any amounts not paid as a service fee under the Plans wouldconstitute an asset-based sales charge. Rules of the Financial Industry Regulatory Authority (“FINRA”) impose a cap on the total salescharges, including asset-based sales 28 Invesco Short Term Bond Fund
ˆ200F9gfMJwyW!qiG‹Š200F9gfMJwyW!qiG
209933 EDG 29INVESCOSHORT TERM BOND
29-Oct-2021 07:23 ESTHTMLAN
Donnelley Financial LSWpf_rendNone
12*ESS 0C
LSWP64RS0521.10.7.0
Page 1 of 1charges, that may be paid by any class of shares of the Fund. IDI has contractually agreed, through at least June 30, 2022, to waive 12b-1fees for Class C shares to the extent necessary to limit 12b-1 fees to 0.50% of average daily net assets. 12b-1 fees before fee waiversunder this agreement are shown as Distribution fees in the Statement of Operations. For the six months ended August 31, 2021, 12b-1 feesincurred for Class C shares were $583,152 after fee waivers of $174,945.
Front-end sales commissions and CDSC (collectively, the “sales charges”) are not recorded as expenses of the Fund. Front-end salescommissions are deducted from proceeds from the sales of Fund shares prior to investment in Class A shares of the Fund. CDSC arededucted from redemption proceeds prior to remittance to the shareholder. During the six months ended August 31, 2021, IDI advised theFund that IDI retained $66,902 in front-end sales commissions from the sale of Class A shares and $106,640 and $137 from Class A andClass C shares, respectively, for CDSC imposed upon redemptions by shareholders.
Certain officers and trustees of the Trust are officers and directors of the Adviser, IIS and/or IDI.
NOTE 3 – Additional Valuation InformationGAAP defines fair value as the price that would be received to sell an asset or paid to transfer a liability in an orderly transaction betweenmarket participants at the measurement date, under current market conditions. GAAP establishes a hierarchy that prioritizes the inputs tovaluation methods, giving the highest priority to readily available unadjusted quoted prices in an active market for identical assets (Level 1)and the lowest priority to significant unobservable inputs (Level 3), generally when market prices are not readily available or are unreliable.Based on the valuation inputs, the securities or other investments are tiered into one of three levels. Changes in valuation methods mayresult in transfers in or out of an investment’s assigned level:
Level 1 – Prices are determined using quoted prices in an active market for identical assets.Level 2
–
Prices are determined using other significant observable inputs. Observable inputs are inputs that other market participantsmay use in pricing a security. These may include quoted prices for similar securities, interest rates, prepayment speeds, creditrisk, yield curves, loss severities, default rates, discount rates, volatilities and others.
Level 3
–
Prices are determined using significant unobservable inputs. In situations where quoted prices or observable inputs areunavailable (for example, when there is little or no market activity for an investment at the end of the period), unobservableinputs may be used. Unobservable inputs reflect the Fund’s own assumptions about the factors market participants would usein determining fair value of the securities or instruments and would be based on the best available information.
The following is a summary of the tiered valuation input levels, as of August 31, 2021. The level assigned to the securities valuationsmay not be an indication of the risk or liquidity associated with investing in those securities. Because of the inherent uncertainties ofvaluation, the values reflected in the financial statements may materially differ from the value received upon actual sale of thoseinvestments.
Level 1 Level 2 Level 3 Total
Investments in Securities
U.S. Dollar Denominated Bonds & Notes $ – $2,153,778,543 $ – $2,153,778,543
Asset-Backed Securities – 569,060,542 – 569,060,542
U.S. Treasury Securities – 141,546,816 – 141,546,816
U.S. Government Sponsored Agency Mortgage-Backed Securities – 29,253,785 – 29,253,785
Agency Credit Risk Transfer Notes – 15,423,440 – 15,423,440
Preferred Stocks 1,950,750 1,960,459 – 3,911,209
Money Market Funds 184,562,533 82,120,811 – 266,683,344
Total Investments in Securities 186,513,283 2,993,144,396 – 3,179,657,679
Other Investments – Assets*
Futures Contracts 791,388 – – 791,388
Other Investments – Liabilities*
Futures Contracts (1,682,006) – – (1,682,006)
Total Other Investments (890,618) – – (890,618)
Total Investments $185,622,665 $2,993,144,396 $ – $3,178,767,061
* Unrealized appreciation (depreciation).
NOTE 4–Derivative InvestmentsThe Fund may enter into an International Swaps and Derivatives Association Master Agreement (“ISDA Master Agreement”) under which afund may trade OTC derivatives. An OTC transaction entered into under an ISDA Master Agreement typically involves a collateral postingarrangement, payment netting provisions and close-out netting provisions. These netting provisions allow for reduction of credit risk throughnetting of contractual obligations. The enforceability of the netting provisions of the ISDA Master Agreement depends on the governing lawof the ISDA Master Agreement, among other factors.
For financial reporting purposes, the Fund does not offset OTC derivative assets or liabilities that are subject to ISDA MasterAgreements in the Statement of Assets and Liabilities.
Value of Derivative Investments at Period-EndThe table below summarizes the value of the Fund’s derivative investments, detailed by primary risk exposure, held as of August 31, 2021:
Value
Derivative Assets Interest
Rate Risk
Unrealized appreciation on futures contracts – Exchange-Traded(a) $ 791,388
Derivatives not subject to master netting agreements (791,388)
Total Derivative Assets subject to master netting agreements $ –
29 Invesco Short Term Bond Fund
ˆ200F9gfMJwyX06WG;Š200F9gfMJwyX06WG;
209933 EDG 30INVESCOSHORT TERM BOND
29-Oct-2021 07:23 ESTHTMLAN
Donnelley Financial LSWpf_rendNone
13*ESS 0C
LSWP64RS0521.10.7.0
Page 1 of 1 Value
Derivative Liabilities Interest
Rate Risk
Unrealized depreciation on futures contracts – Exchange-Traded(a) $(1,682,006)
Derivatives not subject to master netting agreements 1,682,006
Total Derivative Liabilities subject to master netting agreements $ –
(a) The daily variation margin receivable at period-end is recorded in the Statement of Assets and Liabilities.
Effect of Derivative Investments for the six months ended August 31, 2021
The table below summarizes the gains (losses) on derivative investments, detailed by primary risk exposure, recognized in earnings duringthe period:
Location of Gain (Loss) onStatement of Operations
Interest
Rate Risk
Realized Gain: Futures contracts $ 382,916
Change in Net Unrealized Appreciation (Depreciation): Futures contracts (6,579,567)
Total $ (6,196,651)
The table below summarizes the average notional value of derivatives held during the period.
Futures
Contracts
Average notional value $2,142,115,468
NOTE 5–Expense Offset Arrangement(s)
The expense offset arrangement is comprised of transfer agency credits which result from balances in demand deposit accounts used bythe transfer agent for clearing shareholder transactions. For the six months ended August 31, 2021, the Fund received credits from thisarrangement, which resulted in the reduction of the Fund’s total expenses of $3,336.
NOTE 6–Trustees’ and Officers’ Fees and Benefits
Trustees’ and Officers’ Fees and Benefits include amounts accrued by the Fund to pay remuneration to certain Trustees and Officers of theFund. Trustees have the option to defer compensation payable by the Fund, and Trustees’ and Officers’ Fees and Benefits also includeamounts accrued by the Fund to fund such deferred compensation amounts. Those Trustees who defer compensation have the option toselect various Invesco Funds in which their deferral accounts shall be deemed to be invested. Finally, certain current Trustees were eligibleto participate in a retirement plan that provided for benefits to be paid upon retirement to Trustees over a period of time based on thenumber of years of service. The Fund may have certain former Trustees who also participate in a retirement plan and receive benefits undersuch plan. Trustees’ and Officers’ Fees and Benefits include amounts accrued by the Fund to fund such retirement benefits. Obligationsunder the deferred compensation and retirement plans represent unsecured claims against the general assets of the Fund.
NOTE 7–Cash Balances
The Fund may borrow for leveraging in an amount up to 5% of the Fund’s total assets (excluding the amount borrowed) at the time theborrowing is made. In doing so, the Fund is permitted to temporarily carry a negative or overdrawn balance in its account with SSB, thecustodian bank. Such balances, if any at period end, are shown in the Statement of Assets and Liabilities under the payable caption Amountdue custodian. To compensate the custodian bank for such overdrafts, the overdrawn Fund may either (1) leave funds as a compensatingbalance in the account so the custodian bank can be compensated by earning the additional interest; or (2) compensate by paying thecustodian bank at a rate agreed upon by the custodian bank and Invesco, not to exceed the contractually agreed upon rate. The Fund maynot purchase additional securities when any borrowings from banks or broker-dealers exceed 5% of the Fund’s total assets, or when anyborrowings from an Invesco Fund are outstanding.
NOTE 8–Tax Information
The amount and character of income and gains to be distributed are determined in accordance with income tax regulations, which maydiffer from GAAP. Reclassifications are made to the Fund’s capital accounts to reflect income and gains available for distribution (oravailable capital loss carryforward) under income tax regulations. The tax character of distributions paid during the year and the taxcomponents of net assets will be reported at the Fund’s fiscal year-end.
Capital loss carryforward is calculated and reported as of a specific date. Results of transactions and other activity after that date mayaffect the amount of capital loss carryforward actually available for the Fund to utilize. The ability to utilize capital loss carryforwards in thefuture may be limited under the Internal Revenue Code and related regulations based on the results of future transactions.
The Fund had a capital loss carryforward as of February 28, 2021, as follows:
Capital Loss Carryforward* Expiration Short-Term Long-Term Total Not subject to expiration $24,625,523 $37,460,892 $62,086,415
* Capital loss carryforward is reduced for limitations, if any, to the extent required by the Internal Revenue Code and may be further limited depending upona variety of factors, including the realization of net unrealized gains or losses as of the date of any reorganization.
30 Invesco Short Term Bond Fund
ˆ200F9gfMJwyX6fYo%Š200F9gfMJwyX6fYo%
209933 EDG 31INVESCOSHORT TERM BOND
29-Oct-2021 07:23 ESTHTMLAN
Donnelley Financial LSWpf_rendNone
12*ESS 0C
LSWP64RS0521.10.7.0
Page 1 of 1
NOTE 9–Investment TransactionsThe aggregate amount of investment securities (other than short-term securities, U.S. Government obligations and money market funds, ifany) purchased and sold by the Fund during the six months ended August 31, 2021 was $712,725,261 and $754,554,514, respectively.Cost of investments, including any derivatives, on a tax basis includes the adjustments for financial reporting purposes as of the mostrecently completed federal income tax reporting period-end.
Unrealized Appreciation (Depreciation) of Investments on a Tax Basis
Aggregate unrealized appreciation of investments $57,380,929
Aggregate unrealized (depreciation) of investments (9,839,275)
Net unrealized appreciation of investments $47,541,654
Cost of investments for tax purposes is $3,131,225,407.
NOTE 10–Share Information
Summary of Share Activity
Six months endedAugust 31, 2021(a)
Year endedFebruary 28, 2021
Shares Amount Shares Amount
Sold: Class A 24,949,212 $ 215,881,363 58,881,176 $ 505,448,194
Class C 4,783,374 41,401,644 13,661,101 117,320,096
Class R 677,137 5,874,832 1,792,362 15,480,563
Class Y 18,158,112 157,219,767 44,840,702 385,439,426
Class R5 4,904 42,362 14,730 124,587
Class R6 9,402,491 81,475,612 11,206,731 96,386,151
Issued as reinvestment of dividends: Class A 1,123,085 9,717,067 2,488,914 21,390,097
Class C 131,919 1,142,093 362,060 3,104,680
Class R 33,075 286,940 70,805 611,740
Class Y 373,280 3,231,427 749,468 6,456,337
Class R5 527 4,548 1,406 12,017
Class R6 683,874 5,923,628 1,745,870 14,966,771
Automatic conversion of Class C shares to Class A shares: Class A 852,524 7,373,760 5,113,852 44,216,450
Class C (852,230) (7,373,760) (5,113,278) (44,216,450)
Issued in connection with acquisitions:(b) Class A - - 81,158,649 682,135,260
Class C - - 11,583,605 97,310,533
Class R - - 4,433,094 37,326,256
Class Y - - 45,739,122 384,550,934
Class R5 - - 1,183 9,928
Class R6 - - 15,510,515 130,528,698
Reacquired: Class A (29,777,738) (257,656,485) (47,246,252) (405,350,554)
Class C (5,394,084) (46,684,143) (11,536,618) (98,721,356)
Class R (871,181) (7,556,659) (1,210,156) (10,416,271)
Class Y (16,011,776) (138,635,894) (35,707,062) (306,904,869)
Class R5 (3,436) (29,700) (14,102) (121,381)
Class R6 (5,719,806) (49,517,964) (28,533,148) (244,137,358)
Net increase in share activity 2,543,263 $ 22,120,438 169,994,729 $1,432,950,479
(a) There are entities that are record owners of more than 5% of the outstanding shares of the Fund and in the aggregate own 49% of theoutstanding shares of the Fund. IDI has an agreement with these entities to sell Fund shares. The Fund, Invesco and/or Invescoaffiliates may make payments to these entities, which are considered to be related to the Fund, for providing services to the Fund,Invesco and/or Invesco affiliates including but not limited to services such as securities brokerage, distribution, third party recordkeeping and account servicing. The Fund has no knowledge as to whether all or any portion of the shares owned of record by theseentities are also owned beneficially.
31 Invesco Short Term Bond Fund

ˆ200F9gfMJwyXB1DG)Š200F9gfMJwyXB1DG)
209933 EDG 32INVESCOSHORT TERM BOND
29-Oct-2021 07:23 ESTHTMLAN
Donnelley Financial LSWpf_rendNone
12*ESS 0C
LSWP64RS0521.10.7.0
Page 1 of 1(b) After the close of business on May 15, 2020, the Fund acquired all the net assets of Invesco Oppenheimer Limited-Term Bond Fund
(the “Target Fund”) pursuant to a plan of reorganization approved by the Board of Trustees of the Fund on February 14, 2020. Thereorganization was executed in order to reduce overlap and increase efficiencies in the Adviser’s product line. The acquisition wasaccomplished by a tax-free exchange of 158,426,168 shares of the Fund for 298,121,720 shares outstanding of the Target Fund as ofthe close of business on May 15, 2020. Shares of the Target Fund were exchanged for the like class of shares of the Fund, based onthe relative net asset value of the Target Fund to the net asset value of the Fund on the close of business, May 15, 2020. The TargetFund’s net assets as of the close of business on May 15, 2020 of $1,331,861,609, including $(3,211,961) of unrealized appreciation(depreciation), were combined with those of the Fund. The net assets of the Fund immediately before the acquisition were$1,589,317,925 and $2,921,179,534 immediately after the acquisition.
The pro forma results of operations for the year ended February 28, 2021 assuming the reorganization had been completed onMarch 1, 2020, the beginning of the annual reporting period are as follows:
Net investment income $59,556,930
Net realized/unrealized gains 1,730,190
Change in net assets resulting from operations $61,287,120
NOTE 11–Subsequent EventEffective November 1, 2021, Class C shares of the Fund are subject to a CDSC. If a shareholder acquires Class C shares of any other fundas a result of an exchange involving Class C shares of the Fund that were not subject to a CDSC prior to November 1, 2021, then theshares acquired as a result of the exchange will not be subject to a CDSC. 32 Invesco Short Term Bond Fund
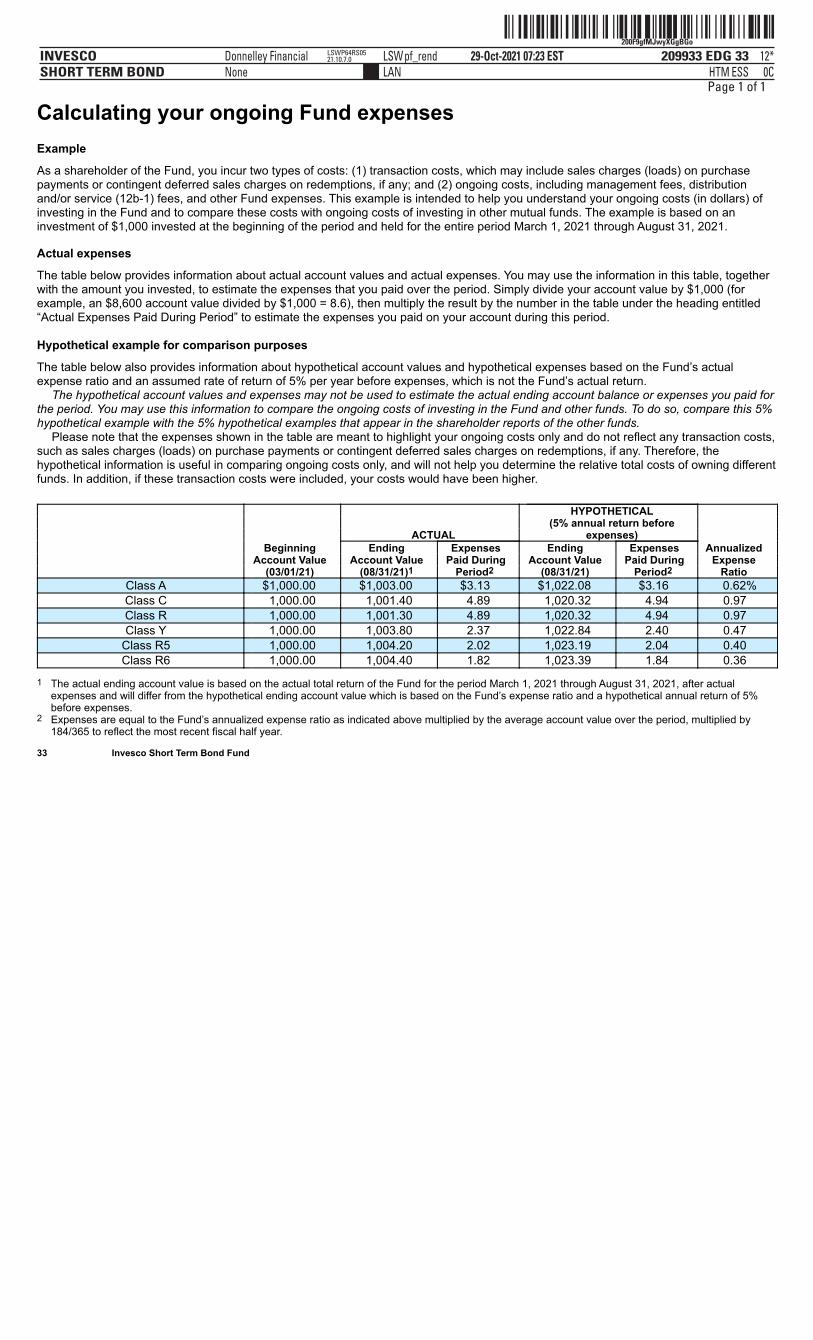
ˆ200F9gfMJwyXGgBGoŠ200F9gfMJwyXGgBGo
209933 EDG 33INVESCOSHORT TERM BOND
29-Oct-2021 07:23 ESTHTMLAN
Donnelley Financial LSWpf_rendNone
12*ESS 0C
LSWP64RS0521.10.7.0
Page 1 of 1
Calculating your ongoing Fund expensesExample
As a shareholder of the Fund, you incur two types of costs: (1) transaction costs, which may include sales charges (loads) on purchasepayments or contingent deferred sales charges on redemptions, if any; and (2) ongoing costs, including management fees, distributionand/or service (12b-1) fees, and other Fund expenses. This example is intended to help you understand your ongoing costs (in dollars) ofinvesting in the Fund and to compare these costs with ongoing costs of investing in other mutual funds. The example is based on aninvestment of $1,000 invested at the beginning of the period and held for the entire period March 1, 2021 through August 31, 2021.
Actual expenses
The table below provides information about actual account values and actual expenses. You may use the information in this table, togetherwith the amount you invested, to estimate the expenses that you paid over the period. Simply divide your account value by $1,000 (forexample, an $8,600 account value divided by $1,000 = 8.6), then multiply the result by the number in the table under the heading entitled“Actual Expenses Paid During Period” to estimate the expenses you paid on your account during this period.
Hypothetical example for comparison purposes
The table below also provides information about hypothetical account values and hypothetical expenses based on the Fund’s actualexpense ratio and an assumed rate of return of 5% per year before expenses, which is not the Fund’s actual return.
The hypothetical account values and expenses may not be used to estimate the actual ending account balance or expenses you paid forthe period. You may use this information to compare the ongoing costs of investing in the Fund and other funds. To do so, compare this 5%hypothetical example with the 5% hypothetical examples that appear in the shareholder reports of the other funds.
Please note that the expenses shown in the table are meant to highlight your ongoing costs only and do not reflect any transaction costs,such as sales charges (loads) on purchase payments or contingent deferred sales charges on redemptions, if any. Therefore, thehypothetical information is useful in comparing ongoing costs only, and will not help you determine the relative total costs of owning differentfunds. In addition, if these transaction costs were included, your costs would have been higher.
HYPOTHETICAL (5% annual return before ACTUAL expenses) Beginning Ending Expenses Ending Expenses Annualized Account Value Account Value Paid During Account Value Paid During Expense (03/01/21) (08/31/21)1 Period2 (08/31/21) Period2 Ratio
Class A $1,000.00 $1,003.00 $3.13 $1,022.08 $3.16 0.62% Class C 1,000.00 1,001.40 4.89 1,020.32 4.94 0.97 Class R 1,000.00 1,001.30 4.89 1,020.32 4.94 0.97 Class Y 1,000.00 1,003.80 2.37 1,022.84 2.40 0.47
Class R5 1,000.00 1,004.20 2.02 1,023.19 2.04 0.40 Class R6 1,000.00 1,004.40 1.82 1,023.39 1.84 0.36
1 The actual ending account value is based on the actual total return of the Fund for the period March 1, 2021 through August 31, 2021, after actualexpenses and will differ from the hypothetical ending account value which is based on the Fund’s expense ratio and a hypothetical annual return of 5%before expenses.
2 Expenses are equal to the Fund’s annualized expense ratio as indicated above multiplied by the average account value over the period, multiplied by184/365 to reflect the most recent fiscal half year.
33 Invesco Short Term Bond Fund
ˆ200F9gfMJwyXNmsG^Š200F9gfMJwyXNmsG^
209933 EDG 34INVESCOSHORT TERM BOND
29-Oct-2021 07:23 ESTHTMLAN
Donnelley Financial LSWpf_rendNone
19*ESS 0C
LSWP64RS0521.10.7.0
Page 1 of 1
Approval of Investment Advisory and Sub-Advisory Contracts
34 Invesco Short Term Bond Fund
At meetings held on June 10, 2021, theBoard of Trustees (the Board or the Trustees)of AIM Investment Securities Funds (InvescoInvestment Securities Funds) as a whole, andthe independent Trustees, who comprise over75% of the Board, voting separately,approved the continuance of the InvescoShort Term Bond Fund’s (the Fund) MasterInvestment Advisory Agreement with InvescoAdvisers, Inc. (Invesco Advisers and theinvestment advisory agreement) and theMaster Intergroup Sub-Advisory Contract forMutual Funds with Invesco AssetManagement Deutschland GmbH, InvescoAsset Management Limited, Invesco AssetManagement (Japan) Limited, Invesco HongKong Limited, Invesco Senior SecuredManagement, Inc. and Invesco Canada Ltd.(collectively, the Affiliated Sub-Advisers andthe sub-advisory contracts) for another year,effective July 1, 2021. After evaluating thefactors discussed below, among others, theBoard approved the renewal of the Fund’sinvestment advisory agreement and thesub-advisory contracts and determined thatthe compensation payable thereunder by theFund to Invesco Advisers and by InvescoAdvisers to the Affiliated Sub-Advisers is fairand reasonable.The Board’s Evaluation ProcessThe Board has established an InvestmentsCommittee, which in turn has establishedSub-Committees that meet throughout theyear to review the performance of fundsadvised by Invesco Advisers (the InvescoFunds). The Sub-Committees meet regularlywith portfolio managers for their assignedInvesco Funds and other members ofmanagement to review detailed informationabout investment performance and portfolioattributes of these funds. The Board hasestablished additional standing and ad hoccommittees that meet regularly throughoutthe year to review matters within theirpurview. The Board took into accountevaluations and reports that it received fromits committees and sub-committees, as wellas the information provided to the Board andits committees and sub-committeesthroughout the year, in considering whether toapprove each Invesco Fund’s investmentadvisory agreement and sub-advisorycontracts. As part of the contract renewal process,the Board reviews and considers informationprovided in response to detailed requests forinformation submitted to management by theindependent Trustees with assistance fromlegal counsel to the independent Trustees.The Board receives comparative investmentperformance and fee and expense dataregarding the Invesco Funds prepared byBroadridge Financial Solutions, Inc.(Broadridge), an independent mutual funddata provider, as well as information on thecomposition of the peer groups provided byBroadridge and its methodology fordetermining peer groups. The Board alsoreceives an independent written evaluationfrom the Senior Officer, an officer of theInvesco Funds who reports directly to theindependent Trustees. The Senior Officer’sevaluation is prepared as part of hisresponsibility to manage the process bywhich the Invesco Funds’ proposedmanagement fees are negotiated during theannual contract renewal process to ensurethey are negotiated in a manner that is atarms’ length and reasonable. In addition tomeetings with Invesco Advisers and fundcounsel
throughout the year and as part of meetingsconvened on April 27, 2021 and June 10,2021, the independent Trustees also discussedthe continuance of the investment advisoryagreement and sub-advisory contracts inseparate sessions with the Senior Officer andwith independent legal counsel. The discussion below is a summary of theSenior Officer’s independent written evaluationwith respect to the Fund’s investment advisoryagreement and sub-advisory contracts, as wellas a discussion of the material factors andrelated conclusions that formed the basis forthe Board’s approval of the Fund’s investmentadvisory agreement and sub-advisorycontracts. The Trustees’ review andconclusions are based on the comprehensiveconsideration of all information presented tothem during the course of the year and in prioryears and are not the result of any singledeterminative factor. Moreover, one Trusteemay have weighed a particular piece ofinformation or factor differently than anotherTrustee. The information received andconsidered by the Board was current as ofvarious dates prior to the Board’s approval onJune 10, 2021.Factors and Conclusions and Summary ofIndependent Written Fee EvaluationA. Nature, Extent and Quality of Services
Provided by Invesco Advisers and theAffiliated Sub-Advisers
The Board reviewed the nature, extent andquality of the advisory services provided to theFund by Invesco Advisers under the Fund’sinvestment advisory agreement, and thecredentials and experience of the officers andemployees of Invesco Advisers who providethese services, including the Fund’s portfoliomanager(s). The Board’s review includedconsideration of Invesco Advisers’ investmentprocess and oversight, credit analysis, andresearch capabilities. The Board consideredinformation regarding Invesco Advisers’programs for and resources devoted to riskmanagement, including management ofinvestment, enterprise, operational, liquidity,valuation and compliance risks, and technologyused to manage such risks. The Board alsoreceived and reviewed information aboutInvesco Advisers’ role as administrator of theInvesco Funds’ liquidity risk managementprogram. The Board received a description ofInvesco Advisers’ business continuity plansand of its approach to data privacy andcybersecurity, including related testing. TheBoard considered how the cybersecurity andbusiness continuity plans of Invesco Advisersand its key service providers operated in theincreased remote working environmentresulting from the novel coronavirus(“COVID-19”) pandemic. The Board alsoconsidered non-advisory services that InvescoAdvisers and its affiliates provide to theInvesco Funds, such as various back officesupport functions, third party oversight, internalaudit, valuation, portfolio trading and legal andcompliance. The Board observed that InvescoAdvisers has been able to effectively manage,operate and oversee the Invesco Fundsthrough the challenging COVID-19 pandemicperiod. The Board reviewed and consideredthe benefits to shareholders of investing in aFund that is part of the family of funds underthe umbrella of Invesco Ltd., Invesco Advisers’parent company, and noted Invesco Ltd.’sdepth and experience in running
an investment management business, as wellas its commitment of financial and otherresources to such business. The Boardconcluded that the nature, extent and qualityof the services provided to the Fund byInvesco Advisers are appropriate andsatisfactory. The Board reviewed the services that maybe provided by the Affiliated Sub-Advisersunder the sub-advisory contracts and thecredentials and experience of the officers andemployees of the Affiliated Sub-Advisers whoprovide these services. The Board noted theAffiliated Sub-Advisers’ expertise with respectto certain asset classes and that the AffiliatedSub-Advisers have offices and personnel thatare located in financial centers around theworld. As a result, the Board noted that theAffiliated Sub-Advisers can provide researchand investment analysis on the markets andeconomies of various countries in which theFund may invest, make recommendationsregarding securities and assist with securitytrades. The Board concluded that thesub-advisory contracts may benefit the Fundand its shareholders by permitting InvescoAdvisers to use the resources and talents ofthe Affiliated Sub-Advisers in managing theFund. The Board concluded that the nature,extent and quality of the services that may beprovided to the Fund by the AffiliatedSub-Advisers are appropriate andsatisfactory.
B. Fund Investment PerformanceThe Board considered Fund investmentperformance as a relevant factor inconsidering whether to approve theinvestment advisory agreement. The Boarddid not view Fund investment performance asa relevant factor in considering whether toapprove the sub-advisory contracts for theFund, as no Affiliated Sub-Adviser currentlymanages assets of the Fund. The Board compared the Fund’sinvestment performance over multiple timeperiods ending December 31, 2020 to theperformance of funds in the Broadridgeperformance universe and against theBloomberg U.S. Government & Credit 1-3Year Index (Index). The Board noted thatperformance of Class A shares of the Fundwas in the fourth quintile of its performanceuniverse for the one year period, the thirdquintile for the three year period and thesecond quintile for the five year period (thefirst quintile being the best performing fundsand the fifth quintile being the worstperforming funds). The Board noted thatduration positioning and security selection incertain sectors detracted from Fundperformance. The Board noted thatperformance of Class A shares of the Fundwas reasonably comparable to theperformance of the Index for the one andthree year periods and above theperformance of the Index for the five yearperiod. The Board recognized that theperformance data reflects a snapshot in timeas of a particular date and that selecting adifferent performance period could producedifferent results. The Board also reviewedmore recent Fund performance as well asother performance metrics, which did notchange its conclusions.
C. Advisory and Sub-Advisory Fees andFund Expenses
The Board compared the Fund’s contractualmanagement fee rate to the contractualmanagement fee rates of funds in the Fund’sBroadridge expense group. The Board notedthat the contractual
ˆ200F9gfMJwyXS8aoŠ200F9gfMJwyXS8ao´
209933 EDG 35INVESCOSHORT TERM BOND
29-Oct-2021 07:23 ESTHTMLAN
Donnelley Financial LSWpf_rendNone
12*ESS 0C
LSWP64RS0521.10.7.0
Page 1 of 2
management fee rate for Class A shares ofthe Fund was below the mediancontractual management fee rate of fundsin its expense group. The Board noted thatthe term “contractual management fee” forfunds in the expense group may includeboth advisory and certain non-portfoliomanagement administrative services fees,but that Broadridge is not able to provideinformation on a fund by fund basis as towhat is included. The Board also reviewedthe methodology used by Broadridge incalculating expense group information,which includes using each fund’scontractual management fee schedule(including any applicable breakpoints) asreported in the most recent prospectus orstatement of additional information foreach fund in the expense group. TheBoard also considered comparativeinformation regarding the Fund’s totalexpense ratio and its various components. The Board noted that Invesco Advisershas contractually agreed to waive feesand/or limit expenses of the Fund for theterm disclosed in the Fund’s registrationstatement in an amount necessary to limittotal annual operating expenses to aspecified percentage of average daily netassets for each class of the Fund. The Board noted that Invesco Advisersand the Affiliated Sub-Advisers do notmanage other similarly managed mutualfunds or client accounts. The Board also considered the servicesthat may be provided by the AffiliatedSub-Advisers pursuant to the sub-advisorycontracts, as well as the fees payable byInvesco Advisers to the AffiliatedSub-Advisers pursuant to the sub-advisorycontracts.
D. Economies of Scale and BreakpointsThe Board considered the extent to whichthere may be economies of scale in theprovision of advisory services to the Fundand the Invesco Funds, and the extent towhich such economies of scale are sharedwith the Fund and the Invesco Funds. TheBoard considered that the Fund benefitsfrom economies of scale throughcontractual breakpoints in the Fund’sadvisory fee schedule, which generallyoperate to reduce the Fund’s expense ratioas it grows in size. The Board noted thatthe Fund also shares in economies ofscale through Invesco Advisers’ ability tonegotiate lower fee arrangements withthird party service providers. The Boardnoted that the Fund may also benefit fromeconomies of scale through initial feesetting, fee waivers and expensereimbursements, as well as InvescoAdvisers’ investment in its business,including investments in businessinfrastructure, technology andcybersecurity.
E. Profitability and Financial ResourcesThe Board reviewed information fromInvesco Advisers concerning the costs ofthe advisory and other services thatInvesco Advisers and its affiliates provideto the Fund and the Invesco Funds and theprofitability of Invesco Advisers and itsaffiliates in providing these services in theaggregate and on an individualFund-by-Fund basis. The Boardconsidered the methodology used forcalculating profitability and noted that suchmethodology had recently been reviewedand enhanced. The Board noted thatInvesco Advisers continues to operate at anet profit from services Invesco Advisersand its affiliates provide to the InvescoFunds in the aggregate and to most Fundsindividually. The Board did not deem the
Advisers provided information demonstratingthat Invesco Advisers is financially soundand has the resources necessary to performits obligations under the investment advisoryagreement, and provided representationsindicating that the Affiliated Sub-Advisersare financially sound and have theresources necessary to perform theirobligations under the sub-advisorycontracts.
F. Collateral Benefits to Invesco Advisers and itsAffiliates
The Board considered various other benefitsreceived by Invesco Advisers and itsaffiliates from the relationship with the Fund,including the fees received for providingadministrative, transfer agency anddistribution services to the Fund. The Boardreceived comparative information regardingfees charged for these services, includinginformation provided by Broadridge andother independent sources. The Boardreviewed the performance of InvescoAdvisers and its affiliates in providing theseservices and the organizational structureemployed to provide these services. TheBoard noted that these services areprovided to the Fund pursuant to writtencontracts that are reviewed and subject toapproval on an annual basis by the Boardbased on its determination that the servicesare required for the operation of the Fund. The Board considered the benefitsrealized by Invesco Advisers and theAffiliated Sub-Advisers as a result ofportfolio brokerage transactions executedthrough “soft dollar” arrangements. InvescoAdvisers noted that the Fund does notexecute brokerage transactions through“soft dollar” arrangements to any significantdegree. The Board considered that the Fund’suninvested cash and cash collateral fromany securities lending arrangements may beinvested in registered money market fundsor, with regard to securities lending cashcollateral, unregistered funds that complywith Rule 2a-7 (collectively referred to as“affiliated money market funds”) advised byInvesco Advisers. The Board consideredinformation regarding the returns of theaffiliated money market funds relative tocomparable overnight investments, as wellas the fees paid by the affiliated moneymarket funds to Invesco Advisers and itsaffiliates. In this regard, the Board noted thatInvesco Advisers receives advisory feesfrom these affiliated money market fundsattributable to the Fund’s investments. TheBoard also noted that Invesco Advisers hascontractually agreed to waive throughvarying periods an amount equal to 100% ofthe net advisory fee Invesco Advisersreceives from the affiliated money marketfunds with respect to the Fund’s investmentin the affiliated money market funds ofuninvested cash, but not cash collateral. TheBoard concluded that the advisory feespayable to Invesco Advisers from the Fund’sinvestment of cash collateral from anysecurities lending arrangements in theaffiliated money market funds are forservices that are not duplicative of servicesprovided by Invesco Advisers to the Fund. The Board also received informationabout commissions that an affiliated brokermay receive for executing certain trades forthe Fund. Invesco Advisers and the AffiliatedSub-Advisers advised the Board of thebenefits to the Fund of executing tradesthrough the affiliated broker and that suchtrades were executed in compliance withrules under the federal securities laws andconsistent with best execution obligations.

ˆ200F9gfMJwyXS8aoŠ200F9gfMJwyXS8ao´
209933 EDG 35INVESCOSHORT TERM BOND
29-Oct-2021 07:23 ESTHTMLAN
Donnelley Financial LSWpf_rendNone
12*ESS 0C
LSWP64RS0521.10.7.0
ˆ200F9gfMJwyXS8aoŠ200F9gfMJwyXS8ao´
209933 EDG 35INVESCOSHORT TERM BOND
29-Oct-2021 07:23 ESTHTMLAN
Donnelley Financial LSWpf_rendNone
12*ESS 0C
LSWP64RS0521.10.7.0
Page 2 of 2
35 Invesco Short Term Bond Fund
level of profits realized by Invesco Advisersand its affiliates from providing suchservices to be excessive, given the nature,extent and quality of the services provided. The Board -noted that Invesco
ˆ200F9gfMJwyXWeHGHŠ200F9gfMJwyXWeHGH
209933 EDG 36INVESCOSHORT TERM BOND
29-Oct-2021 07:23 ESTHTMLAN
Donnelley Financial LSWpf_rendNone
11*ESS 0C
LSWP64RS0521.10.7.0
dsp001dsp0036
Page 1 of 1
Go paperless with eDeliveryVisit invesco.com/edelivery to enjoy the convenience and security of anytime electronic access to your investmentdocuments.With eDelivery, you can elect to have any or all of the following materials delivered straight to your inbox to download, saveand print from your own computer:
∎ Fund reports and prospectuses∎ Quarterly statements∎ Daily confirmations∎ Tax forms Invesco mailing informationSend general correspondence to Invesco Investment Services, Inc., P.O. Box 219078, Kansas City, MO 64121-9078. Important notice regarding delivery of security holder documentsTo reduce Fund expenses, only one copy of most shareholder documents may be mailed to shareholders with multipleaccounts at the same address (Householding). Mailing of your shareholder documents may be householded indefinitelyunless you instruct us otherwise. If you do not want the mailing of these documents to be combined with those for othermembers of your household, please contact Invesco Investment Services, Inc. at 800 959 4246 or contact your financialinstitution. We will begin sending you individual copies for each account within 30 days after receiving your request. Fund holdings and proxy voting informationThe Fund provides a complete list of its portfolio holdings four times each fiscal year, at the end of each fiscal quarter. For thesecond and fourth quarters, the list appears, respectively, in the Fund’s semiannual and annual reports to shareholders. Forthe first and third quarters, the Fund files the list with the Securities and Exchange Commission (SEC) as an exhibit to itsreports on Form N-PORT. The most recent list of portfolio holdings is available at invesco.com/completeqtrholdings.Shareholders can also look up the Fund’s Form N-PORT filings on the SEC website, sec.gov. The SEC file numbers for theFund are shown below. A description of the policies and procedures that the Fund uses to determine how to vote proxies relating to portfoliosecurities is available without charge, upon request, from our Client Services department at 800 959 4246, or at invesco.com/corporate/about-us/esg. The information is also available on the SEC website, sec.gov. Information regarding how the Fund voted proxies related to its portfolio securities during the most recent 12-month periodended June 30 is available at invesco.com/proxysearch. This information is also available on the SEC website, sec.gov. Invesco Advisers, Inc. is an investment adviser; it provides investment advisory services to individual and institutionalclients and does not sell securities. Invesco Distributors, Inc. is the US distributor for Invesco Ltd.’s retail mutual funds,exchange-traded funds and institutional money market funds. Both are wholly owned, indirect subsidiaries of Invesco Ltd.
SEC file numbers: 811-05686 and 033-39519 Invesco Distributors, Inc. STB-SAR-1
ˆ200F9ggVNNr@=V7G3Š200F9ggVNNr@=V7G3
209935 EDG 1INVESCOU.S. GOVERNMENT MONE
28-Oct-2021 14:35 ESTHTMLAN
Donnelley Financial LSWpf_rendNone
6*ESS 0C
LSWP64RS3521.10.7.0
dsp001
Page 1 of 1
Semiannual Report to Shareholders August 31, 2021
Invesco U.S. Government Money Portfolio Nasdaq:Invesco Cash Reserve: GMQXX ∎ C: GMCXX ∎ R: GMLXX ∎ Y: OMBXX ∎ R6: GMRXX
2 Fund Information3 Schedule of Investments6 Financial Statements9 Financial Highlights10 Notes to Financial Statements14 Fund Expenses15 Approval of Investment Advisory and Sub-Advisory Contracts
For the most current month-end Fund performance and commentary, please visit invesco.com/performance.Unless otherwise noted, all data provided by Invesco.This report must be accompanied or preceded by a currently effective Fund prospectus, which contains more completeinformation, including sales charges and expenses. Investors should read it carefully before investing.
NOT FDIC INSURED | MAY LOSE VALUE | NO BANK GUARANTEE

ˆ200F9ggVNNr@ep!GZŠ200F9ggVNNr@ep!GZ
209935 EDG 2INVESCOU.S. GOVERNMENT MONE
28-Oct-2021 14:35 ESTHTMLAN
Donnelley Financial LSWpf_rendNone
4*ESS 0C
LSWP64RS3521.10.7.0
Page 1 of 1 Fund Information
You could lose money by investing in the Fund. Although the Fund seeks to preserve your investment at $1.00 per share, itcannot guarantee it will do so. An investment in the Fund is not insured or guaranteed by the Federal Deposit InsuranceCorporation or any other government agency. The Fund’s sponsor has no legal obligation to provide financial support to theFund, and you should not expect that the sponsor will provide financial support to the Fund at any time. The Fund is subject to certain other risks. Please see the current prospectus for more information regarding the risksassociated with an investment in the Fund. Team managed by Invesco Advisers, Inc. 2 Invesco U.S. Government Money Portfolio
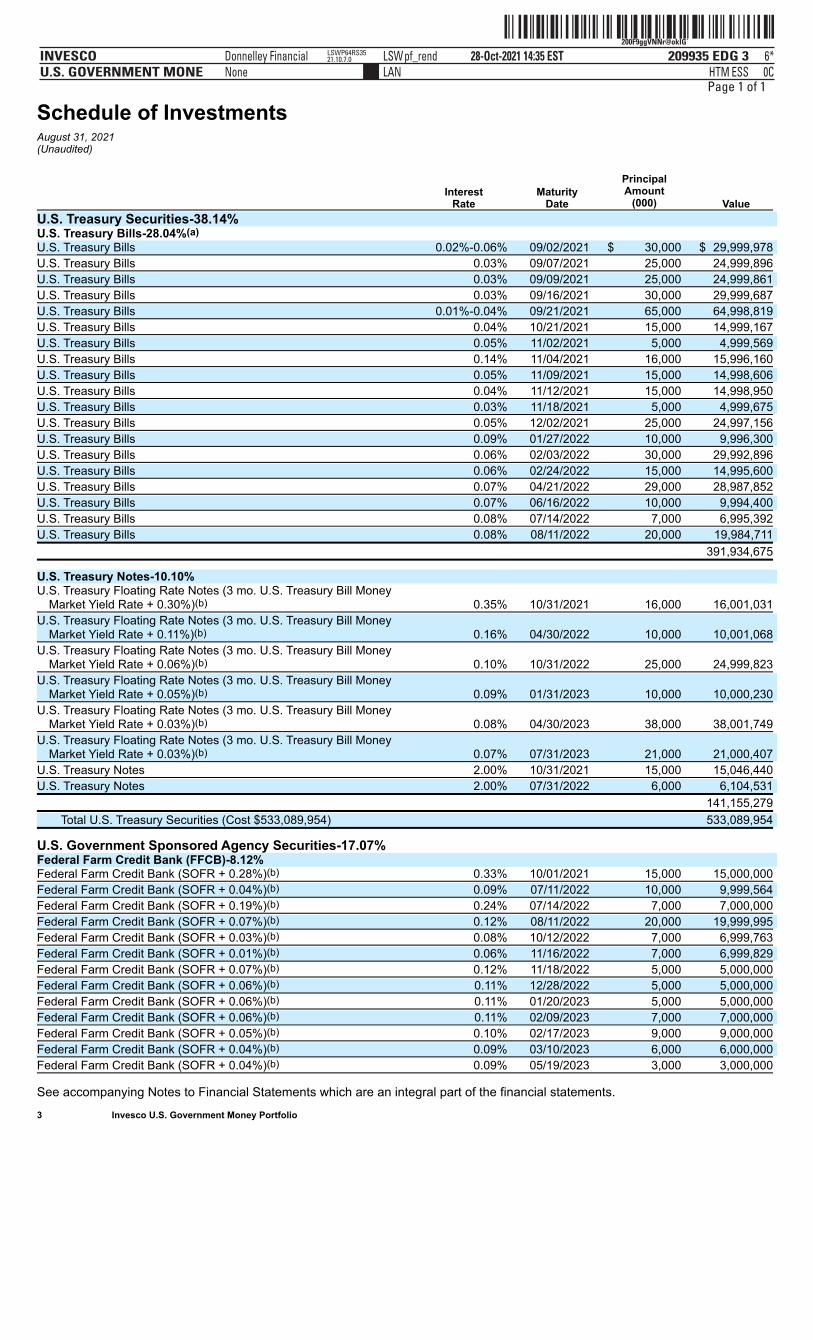
ˆ200F9ggVNNr@oklGÁŠ200F9ggVNNr@oklG`
209935 EDG 3INVESCOU.S. GOVERNMENT MONE
28-Oct-2021 14:35 ESTHTMLAN
Donnelley Financial LSWpf_rendNone
6*ESS 0C
LSWP64RS3521.10.7.0
Page 1 of 1
Schedule of InvestmentsAugust 31, 2021(Unaudited)
Interest
Rate Maturity
Date
PrincipalAmount
(000) Value
U.S. Treasury Securities-38.14% U.S. Treasury Bills-28.04%(a) U.S. Treasury Bills 0.02%-0.06% 09/02/2021 $ 30,000 $ 29,999,978
U.S. Treasury Bills 0.03% 09/07/2021 25,000 24,999,896
U.S. Treasury Bills 0.03% 09/09/2021 25,000 24,999,861
U.S. Treasury Bills 0.03% 09/16/2021 30,000 29,999,687
U.S. Treasury Bills 0.01%-0.04% 09/21/2021 65,000 64,998,819
U.S. Treasury Bills 0.04% 10/21/2021 15,000 14,999,167
U.S. Treasury Bills 0.05% 11/02/2021 5,000 4,999,569
U.S. Treasury Bills 0.14% 11/04/2021 16,000 15,996,160
U.S. Treasury Bills 0.05% 11/09/2021 15,000 14,998,606
U.S. Treasury Bills 0.04% 11/12/2021 15,000 14,998,950
U.S. Treasury Bills 0.03% 11/18/2021 5,000 4,999,675
U.S. Treasury Bills 0.05% 12/02/2021 25,000 24,997,156
U.S. Treasury Bills 0.09% 01/27/2022 10,000 9,996,300
U.S. Treasury Bills 0.06% 02/03/2022 30,000 29,992,896
U.S. Treasury Bills 0.06% 02/24/2022 15,000 14,995,600
U.S. Treasury Bills 0.07% 04/21/2022 29,000 28,987,852
U.S. Treasury Bills 0.07% 06/16/2022 10,000 9,994,400
U.S. Treasury Bills 0.08% 07/14/2022 7,000 6,995,392
U.S. Treasury Bills 0.08% 08/11/2022 20,000 19,984,711
391,934,675
U.S. Treasury Notes-10.10% U.S. Treasury Floating Rate Notes (3 mo. U.S. Treasury Bill Money
Market Yield Rate + 0.30%)(b) 0.35% 10/31/2021 16,000 16,001,031
U.S. Treasury Floating Rate Notes (3 mo. U.S. Treasury Bill MoneyMarket Yield Rate + 0.11%)(b) 0.16% 04/30/2022 10,000 10,001,068
U.S. Treasury Floating Rate Notes (3 mo. U.S. Treasury Bill MoneyMarket Yield Rate + 0.06%)(b) 0.10% 10/31/2022 25,000 24,999,823
U.S. Treasury Floating Rate Notes (3 mo. U.S. Treasury Bill MoneyMarket Yield Rate + 0.05%)(b) 0.09% 01/31/2023 10,000 10,000,230
U.S. Treasury Floating Rate Notes (3 mo. U.S. Treasury Bill MoneyMarket Yield Rate + 0.03%)(b) 0.08% 04/30/2023 38,000 38,001,749
U.S. Treasury Floating Rate Notes (3 mo. U.S. Treasury Bill MoneyMarket Yield Rate + 0.03%)(b) 0.07% 07/31/2023 21,000 21,000,407
U.S. Treasury Notes 2.00% 10/31/2021 15,000 15,046,440
U.S. Treasury Notes 2.00% 07/31/2022 6,000 6,104,531
141,155,279
Total U.S. Treasury Securities (Cost $533,089,954) 533,089,954
U.S. Government Sponsored Agency Securities-17.07% Federal Farm Credit Bank (FFCB)-8.12% Federal Farm Credit Bank (SOFR + 0.28%)(b) 0.33% 10/01/2021 15,000 15,000,000
Federal Farm Credit Bank (SOFR + 0.04%)(b) 0.09% 07/11/2022 10,000 9,999,564
Federal Farm Credit Bank (SOFR + 0.19%)(b) 0.24% 07/14/2022 7,000 7,000,000
Federal Farm Credit Bank (SOFR + 0.07%)(b) 0.12% 08/11/2022 20,000 19,999,995
Federal Farm Credit Bank (SOFR + 0.03%)(b) 0.08% 10/12/2022 7,000 6,999,763
Federal Farm Credit Bank (SOFR + 0.01%)(b) 0.06% 11/16/2022 7,000 6,999,829
Federal Farm Credit Bank (SOFR + 0.07%)(b) 0.12% 11/18/2022 5,000 5,000,000
Federal Farm Credit Bank (SOFR + 0.06%)(b) 0.11% 12/28/2022 5,000 5,000,000
Federal Farm Credit Bank (SOFR + 0.06%)(b) 0.11% 01/20/2023 5,000 5,000,000
Federal Farm Credit Bank (SOFR + 0.06%)(b) 0.11% 02/09/2023 7,000 7,000,000
Federal Farm Credit Bank (SOFR + 0.05%)(b) 0.10% 02/17/2023 9,000 9,000,000
Federal Farm Credit Bank (SOFR + 0.04%)(b) 0.09% 03/10/2023 6,000 6,000,000
Federal Farm Credit Bank (SOFR + 0.04%)(b) 0.09% 05/19/2023 3,000 3,000,000
See accompanying Notes to Financial Statements which are an integral part of the financial statements. 3 Invesco U.S. Government Money Portfolio
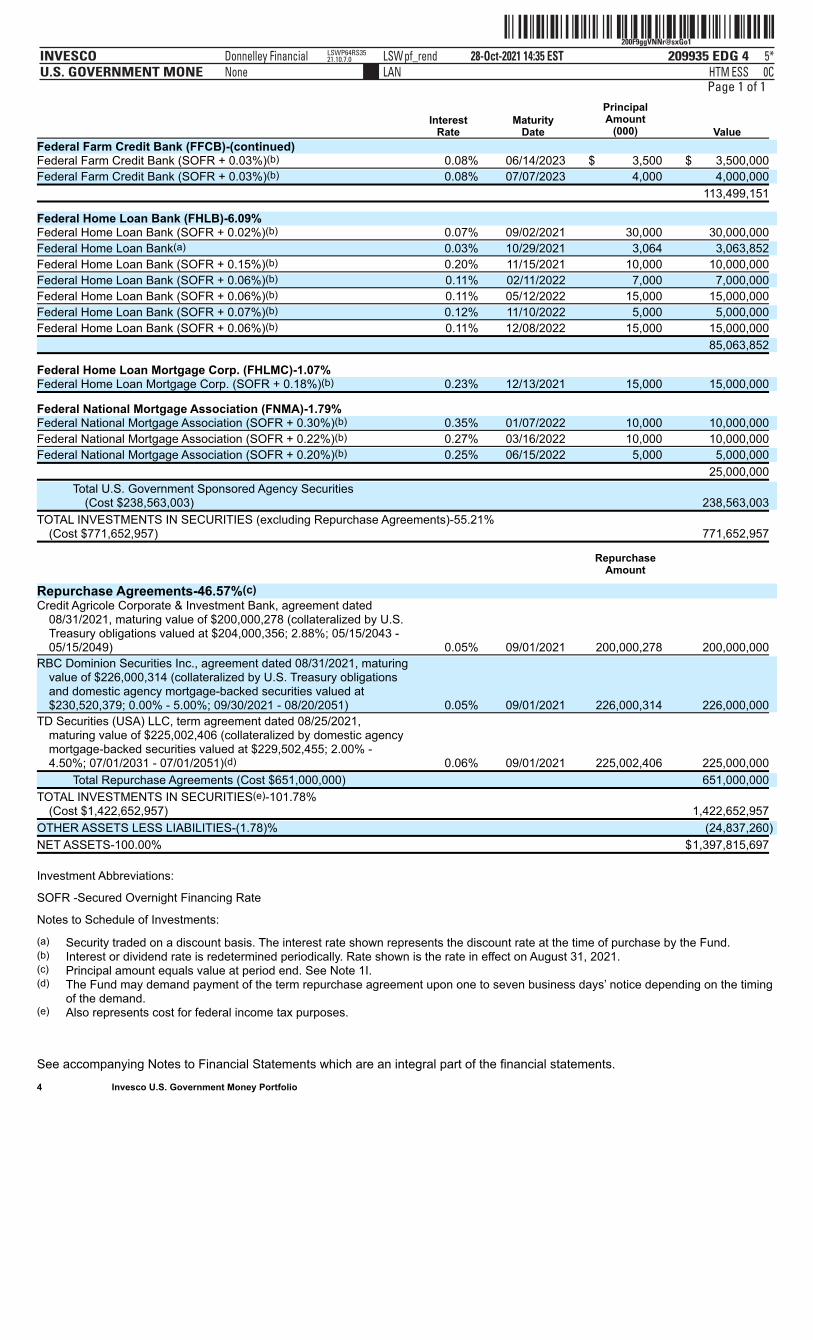
ˆ200F9ggVNNr@sxGo1Š200F9ggVNNr@sxGo1
209935 EDG 4INVESCOU.S. GOVERNMENT MONE
28-Oct-2021 14:35 ESTHTMLAN
Donnelley Financial LSWpf_rendNone
5*ESS 0C
LSWP64RS3521.10.7.0
Page 1 of 1
Interest
Rate Maturity
Date
PrincipalAmount
(000) Value
Federal Farm Credit Bank (FFCB)-(continued) Federal Farm Credit Bank (SOFR + 0.03%)(b) 0.08% 06/14/2023 $ 3,500 $ 3,500,000
Federal Farm Credit Bank (SOFR + 0.03%)(b) 0.08% 07/07/2023 4,000 4,000,000
113,499,151
Federal Home Loan Bank (FHLB)-6.09% Federal Home Loan Bank (SOFR + 0.02%)(b) 0.07% 09/02/2021 30,000 30,000,000
Federal Home Loan Bank(a) 0.03% 10/29/2021 3,064 3,063,852
Federal Home Loan Bank (SOFR + 0.15%)(b) 0.20% 11/15/2021 10,000 10,000,000
Federal Home Loan Bank (SOFR + 0.06%)(b) 0.11% 02/11/2022 7,000 7,000,000
Federal Home Loan Bank (SOFR + 0.06%)(b) 0.11% 05/12/2022 15,000 15,000,000
Federal Home Loan Bank (SOFR + 0.07%)(b) 0.12% 11/10/2022 5,000 5,000,000
Federal Home Loan Bank (SOFR + 0.06%)(b) 0.11% 12/08/2022 15,000 15,000,000
85,063,852
Federal Home Loan Mortgage Corp. (FHLMC)-1.07% Federal Home Loan Mortgage Corp. (SOFR + 0.18%)(b) 0.23% 12/13/2021 15,000 15,000,000
Federal National Mortgage Association (FNMA)-1.79% Federal National Mortgage Association (SOFR + 0.30%)(b) 0.35% 01/07/2022 10,000 10,000,000
Federal National Mortgage Association (SOFR + 0.22%)(b) 0.27% 03/16/2022 10,000 10,000,000
Federal National Mortgage Association (SOFR + 0.20%)(b) 0.25% 06/15/2022 5,000 5,000,000
25,000,000
Total U.S. Government Sponsored Agency Securities(Cost $238,563,003) 238,563,003
TOTAL INVESTMENTS IN SECURITIES (excluding Repurchase Agreements)-55.21%(Cost $771,652,957)
771,652,957
Repurchase
Amount
Repurchase Agreements-46.57%(c) Credit Agricole Corporate & Investment Bank, agreement dated
08/31/2021, maturing value of $200,000,278 (collateralized by U.S.Treasury obligations valued at $204,000,356; 2.88%; 05/15/2043 -05/15/2049) 0.05% 09/01/2021 200,000,278 200,000,000
RBC Dominion Securities Inc., agreement dated 08/31/2021, maturingvalue of $226,000,314 (collateralized by U.S. Treasury obligationsand domestic agency mortgage-backed securities valued at$230,520,379; 0.00% - 5.00%; 09/30/2021 - 08/20/2051) 0.05% 09/01/2021 226,000,314 226,000,000
TD Securities (USA) LLC, term agreement dated 08/25/2021,maturing value of $225,002,406 (collateralized by domestic agencymortgage-backed securities valued at $229,502,455; 2.00% -4.50%; 07/01/2031 - 07/01/2051)(d) 0.06% 09/01/2021 225,002,406 225,000,000
Total Repurchase Agreements (Cost $651,000,000) 651,000,000
TOTAL INVESTMENTS IN SECURITIES(e)-101.78%(Cost $1,422,652,957) 1,422,652,957
OTHER ASSETS LESS LIABILITIES-(1.78)% (24,837,260)
NET ASSETS-100.00% $1,397,815,697
Investment Abbreviations:
SOFR -Secured Overnight Financing Rate
Notes to Schedule of Investments:
(a) Security traded on a discount basis. The interest rate shown represents the discount rate at the time of purchase by the Fund.(b) Interest or dividend rate is redetermined periodically. Rate shown is the rate in effect on August 31, 2021.(c) Principal amount equals value at period end. See Note 1I.(d) The Fund may demand payment of the term repurchase agreement upon one to seven business days’ notice depending on the timing
of the demand.(e) Also represents cost for federal income tax purposes.
See accompanying Notes to Financial Statements which are an integral part of the financial statements. 4 Invesco U.S. Government Money Portfolio
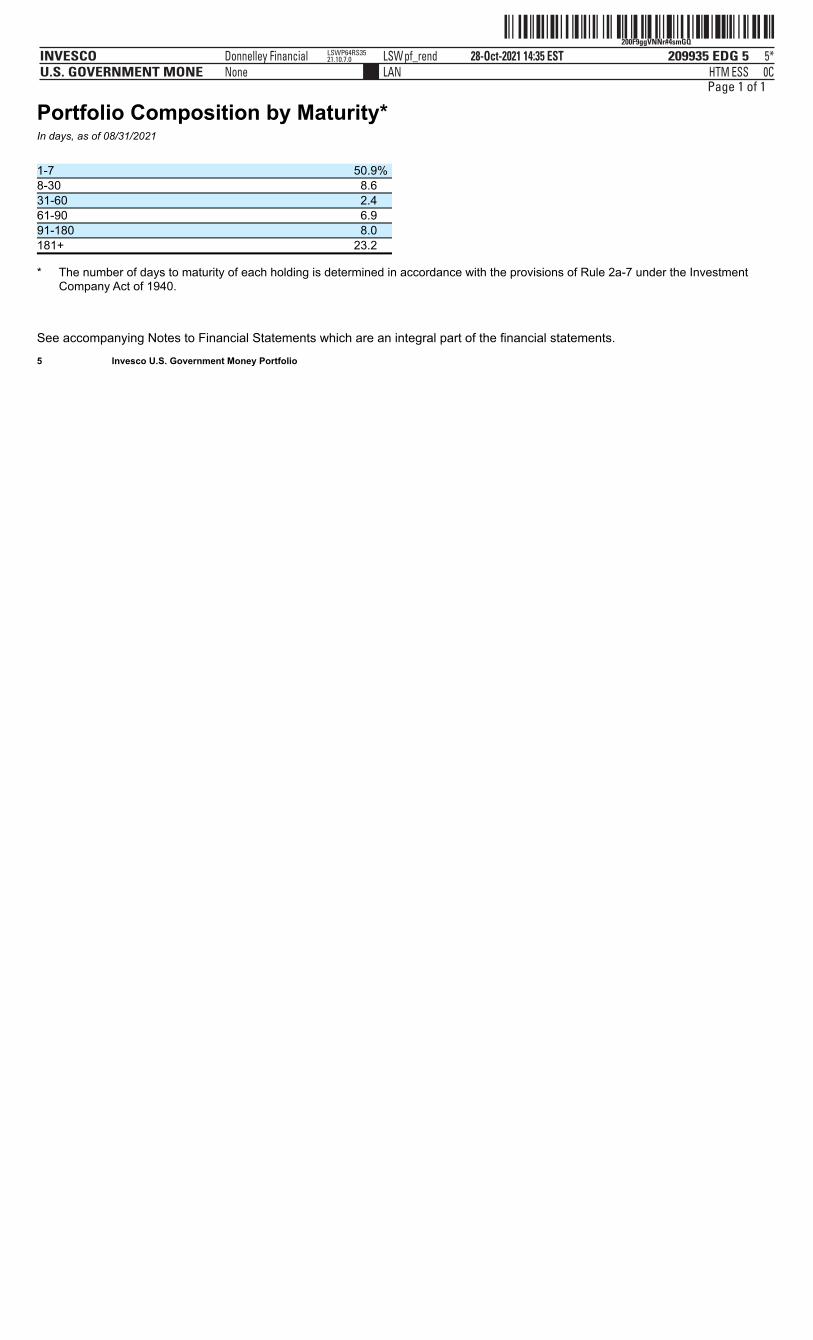
ˆ200F9ggVNNr#4smGQŠ200F9ggVNNr#4smGQ
209935 EDG 5INVESCOU.S. GOVERNMENT MONE
28-Oct-2021 14:35 ESTHTMLAN
Donnelley Financial LSWpf_rendNone
5*ESS 0C
LSWP64RS3521.10.7.0
Page 1 of 1
Portfolio Composition by Maturity*In days, as of 08/31/2021
* The number of days to maturity of each holding is determined in accordance with the provisions of Rule 2a-7 under the InvestmentCompany Act of 1940.
See accompanying Notes to Financial Statements which are an integral part of the financial statements. 5 Invesco U.S. Government Money Portfolio
1-7 50.9% 8-30 8.6 31-60 2.4 61-90 6.9 91-180 8.0 181+ 23.2
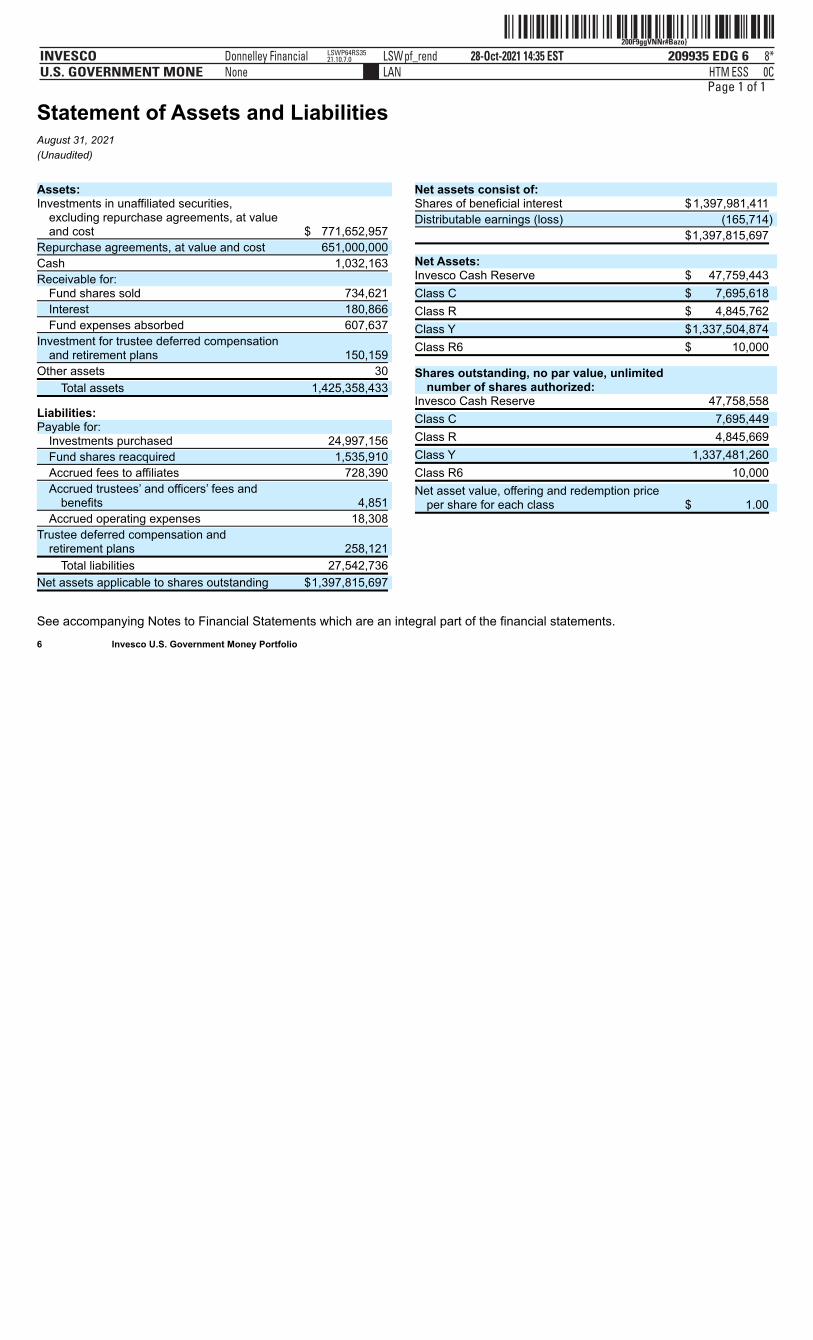
ˆ200F9ggVNNr#Bazo}Š200F9ggVNNr#Bazo}
209935 EDG 6INVESCOU.S. GOVERNMENT MONE
28-Oct-2021 14:35 ESTHTMLAN
Donnelley Financial LSWpf_rendNone
8*ESS 0C
LSWP64RS3521.10.7.0
Page 1 of 1
Statement of Assets and LiabilitiesAugust 31, 2021(Unaudited)
See accompanying Notes to Financial Statements which are an integral part of the financial statements. 6 Invesco U.S. Government Money Portfolio
Assets: Investments in unaffiliated securities,
excluding repurchase agreements, at valueand cost $ 771,652,957
Repurchase agreements, at value and cost 651,000,000
Cash 1,032,163
Receivable for: Fund shares sold 734,621
Interest 180,866
Fund expenses absorbed 607,637
Investment for trustee deferred compensationand retirement plans 150,159
Other assets 30
Total assets 1,425,358,433
Liabilities: Payable for:
Investments purchased 24,997,156
Fund shares reacquired 1,535,910
Accrued fees to affiliates 728,390
Accrued trustees’ and officers’ fees andbenefits 4,851
Accrued operating expenses 18,308
Trustee deferred compensation andretirement plans 258,121
Total liabilities 27,542,736
Net assets applicable to shares outstanding $1,397,815,697
Net assets consist of: Shares of beneficial interest $1,397,981,411
Distributable earnings (loss) (165,714)
$1,397,815,697
Net Assets: Invesco Cash Reserve $ 47,759,443
Class C $ 7,695,618
Class R $ 4,845,762
Class Y $1,337,504,874
Class R6 $ 10,000
Shares outstanding, no par value, unlimitednumber of shares authorized:
Invesco Cash Reserve 47,758,558
Class C 7,695,449
Class R 4,845,669
Class Y 1,337,481,260
Class R6 10,000
Net asset value, offering and redemption priceper share for each class $ 1.00
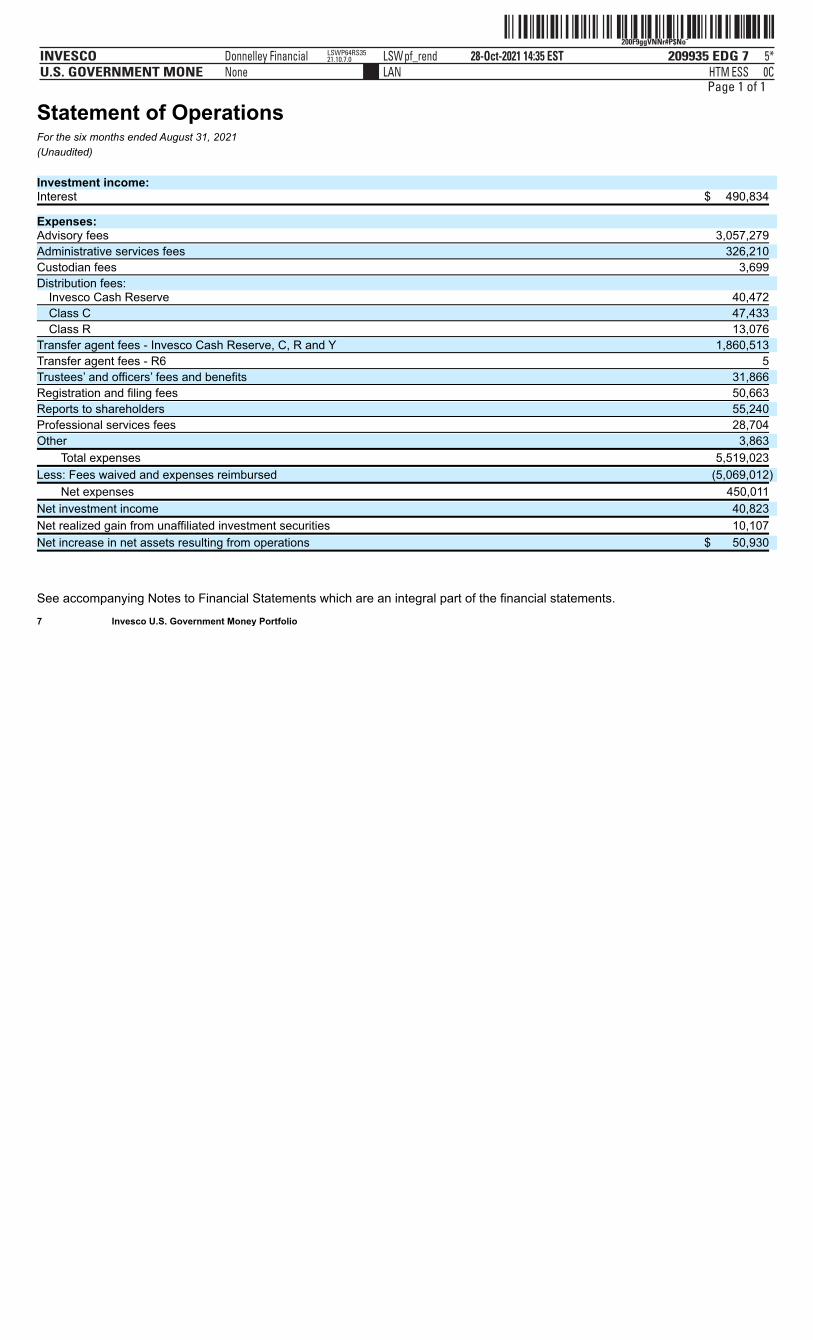
ˆ200F9ggVNNr#P$NoÈŠ200F9ggVNNr#P$No¨
209935 EDG 7INVESCOU.S. GOVERNMENT MONE
28-Oct-2021 14:35 ESTHTMLAN
Donnelley Financial LSWpf_rendNone
5*ESS 0C
LSWP64RS3521.10.7.0
Page 1 of 1
Statement of OperationsFor the six months ended August 31, 2021(Unaudited) Investment income: Interest $ 490,834
Expenses: Advisory fees 3,057,279
Administrative services fees 326,210
Custodian fees 3,699
Distribution fees: Invesco Cash Reserve 40,472
Class C 47,433
Class R 13,076
Transfer agent fees - Invesco Cash Reserve, C, R and Y 1,860,513
Transfer agent fees - R6 5
Trustees’ and officers’ fees and benefits 31,866
Registration and filing fees 50,663
Reports to shareholders 55,240
Professional services fees 28,704
Other 3,863
Total expenses 5,519,023
Less: Fees waived and expenses reimbursed (5,069,012)
Net expenses 450,011
Net investment income 40,823
Net realized gain from unaffiliated investment securities 10,107
Net increase in net assets resulting from operations $ 50,930
See accompanying Notes to Financial Statements which are an integral part of the financial statements. 7 Invesco U.S. Government Money Portfolio
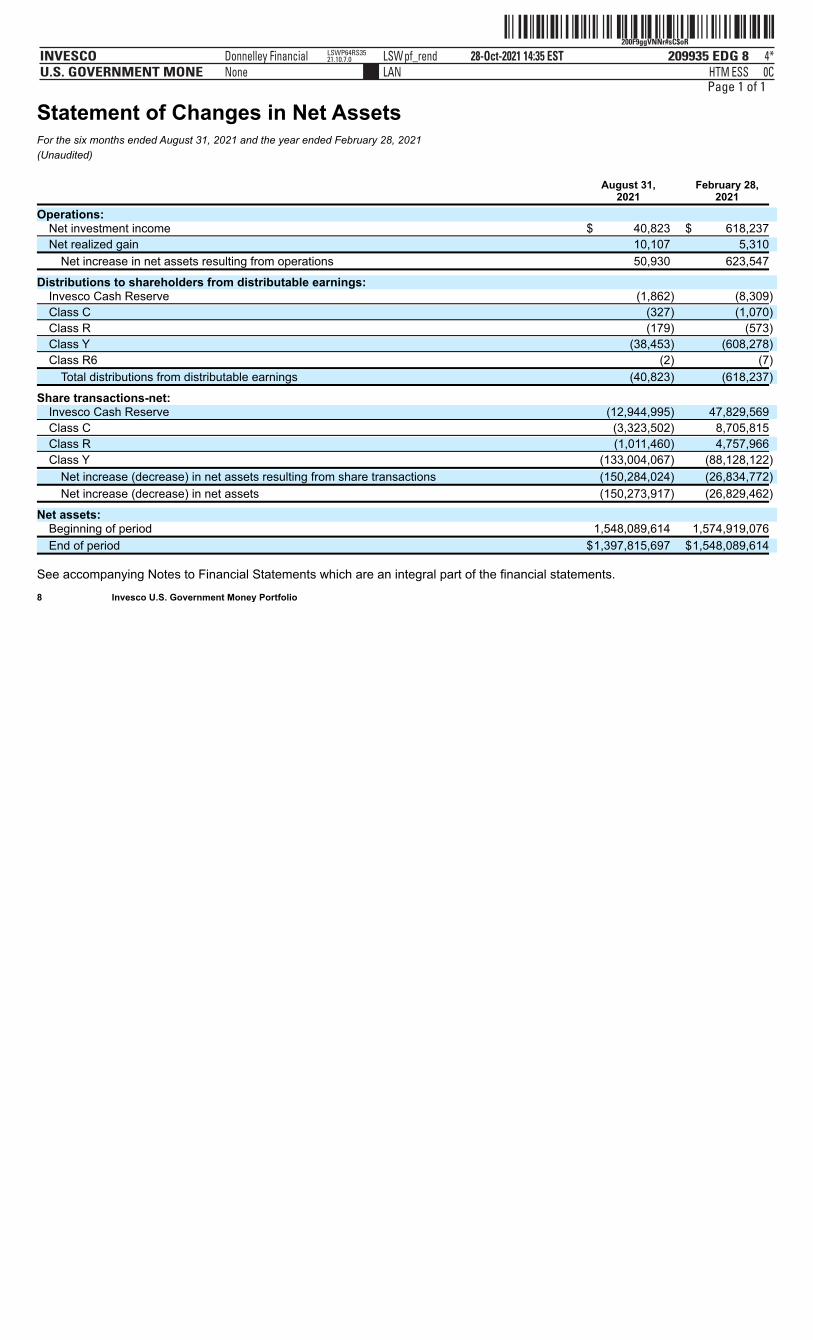
ˆ200F9ggVNNr#sC$oRŠ200F9ggVNNr#sC$oR
209935 EDG 8INVESCOU.S. GOVERNMENT MONE
28-Oct-2021 14:35 ESTHTMLAN
Donnelley Financial LSWpf_rendNone
4*ESS 0C
LSWP64RS3521.10.7.0
Page 1 of 1
Statement of Changes in Net AssetsFor the six months ended August 31, 2021 and the year ended February 28, 2021(Unaudited)
August 31,
2021 February 28,
2021
Operations: Net investment income $ 40,823 $ 618,237
Net realized gain 10,107 5,310
Net increase in net assets resulting from operations 50,930 623,547
Distributions to shareholders from distributable earnings: Invesco Cash Reserve (1,862) (8,309)
Class C (327) (1,070)
Class R (179) (573)
Class Y (38,453) (608,278)
Class R6 (2) (7)
Total distributions from distributable earnings (40,823) (618,237)
Share transactions-net: Invesco Cash Reserve (12,944,995) 47,829,569
Class C (3,323,502) 8,705,815
Class R (1,011,460) 4,757,966
Class Y (133,004,067) (88,128,122)
Net increase (decrease) in net assets resulting from share transactions (150,284,024) (26,834,772)
Net increase (decrease) in net assets (150,273,917) (26,829,462)
Net assets: Beginning of period 1,548,089,614 1,574,919,076
End of period $1,397,815,697 $1,548,089,614
See accompanying Notes to Financial Statements which are an integral part of the financial statements. 8 Invesco U.S. Government Money Portfolio
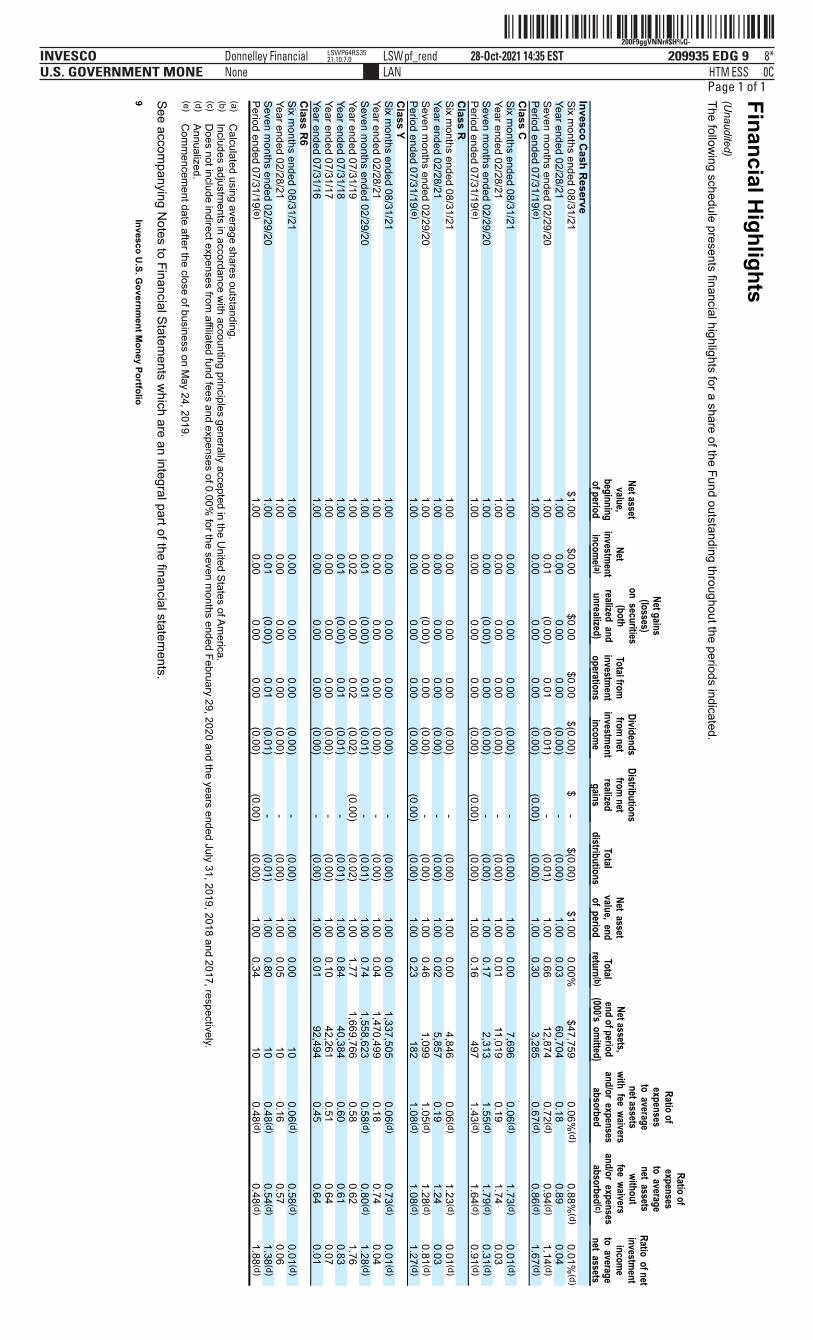
ˆ200F9ggVNNr#$H%G-Š200F9ggVNNr#$H%G-
209935 EDG 9INVESCOU.S. GOVERNMENT MONE
28-Oct-2021 14:35 ESTHTMLAN
Donnelley Financial LSWpf_rendNone
8*ESS 0C
LSWP64RS3521.10.7.0
Page 1 of 1Financial Highlights
(Unaudited)
The following schedule presents financial highlights for a share of the Fund outstanding throughout the periods indicated.
Net assetvalue,
beginningof period
Netinvestm
entincom
e (a)
Net gains(losses)
on�securities(both
realized�andunrealized)
Total frominvestm
entoperations
Dividendsfrom
netinvestm
entincom
e
Distributionsfrom
netrealizedgains
Total
distributions
Net�assetvalue,�endof�period
Total
return (b)
Net assets,end of period
(000’s�omitted)
Ratio ofexpenses
to�averagenet assets
with�fee�waiversand/or�expenses
absorbed
Ratio ofexpenses
to�averagenet�assets
withoutfee�waivers
and/or�expensesabsorbed (c)
Ratio�of netinvestm
entincom
eto�averagenet�assets
Invesco Cash R
eserve
Six m
onths ended 08/31/21
$1.00
$0.00
$0.00
$0.00
$(0.00)
$ -
$(0.00)
$1.00
0.00%
$47,759
0.06%(d)
0.88%
(d) 0.01%
(d)Year ended 02/28/21
1.00
0.00
0.00
0.00
(0.00)
-
(0.00)
1.00
0.03
60,704
0.18
0.89
0.04Seven m
onths ended 02/29/20
1.00
0.01
(0.00)
0.01
(0.01)
-
(0.01)
1.00
0.66
12,874
0.72 (d)
0.94 (d)
1.14 (d)
Period ended 07/31/19 (e)
1.00
0.00
0.00
0.00
(0.00)
(0.00)
(0.00)
1.00
0.30
3,285
0.67 (d)
0.86 (d)
1.67 (d)
Class C
Six months ended 08/31/21
1.00
0.00
0.00
0.00
(0.00)
-
(0.00)
1.00
0.00
7,696
0.06 (d)
1.73 (d)
0.01 (d) Year ended 02/28/21
1.00
0.00
0.00
0.00
(0.00)
-
(0.00)
1.00
0.01
11,019
0.19
1.74
0.03Seven m
onths ended 02/29/20
1.00
0.00
(0.00)
0.00
(0.00)
-
(0.00)
1.00
0.17
2,313
1.55 (d)
1.79 (d)
0.31 (d)
Period ended 07/31/19 (e)
1.00
0.00
0.00
0.00
(0.00)
(0.00)
(0.00)
1.00
0.16
497
1.43 (d)
1.64 (d)
0.91 (d)
Class R
Six months ended 08/31/21
1.00
0.00
0.00
0.00
(0.00)
-
(0.00)
1.00
0.00
4,846
0.06 (d)
1.23 (d)
0.01 (d) Year ended 02/28/21
1.00
0.00
0.00
0.00
(0.00)
-
(0.00)
1.00
0.02
5,857
0.19
1.24
0.03Seven m
onths ended 02/29/20
1.00
0.00
(0.00)
0.00
(0.00)
-
(0.00)
1.00
0.46
1,099
1.05 (d)
1.28 (d)
0.81 (d)
Period ended 07/31/19 (e)
1.00
0.00
0.00
0.00
(0.00)
(0.00)
(0.00)
1.00
0.23
182
1.08 (d)
1.08 (d)
1.27 (d)
Class Y
Six months ended 08/31/21
1.00
0.00
0.00
0.00
(0.00)
-
(0.00)
1.00
0.00
1,337,505
0.06 (d)
0.73 (d)
0.01 (d)
Year ended 02/28/21
1.00
0.00
0.00
0.00
(0.00)
-
(0.00)
1.00
0.04
1,470,499
0.18
0.74
0.04Seven m
onths ended 02/29/20
1.00
0.01
(0.00)
0.01
(0.01)
-
(0.01)
1.00
0.74
1,558,623
0.58 (d)
0.80 (d)
1.28 (d) Year ended 07/31/19
1.00
0.02
0.00
0.02
(0.02)
(0.00)
(0.02)
1.00
1.77
1,669,766
0.58
0.62
1.76
Year ended 07/31/18
1.00
0.01
(0.00)
0.01
(0.01)
-
(0.01)
1.00
0.84
40,384
0.60
0.61
0.83
Year ended 07/31/17
1.00
0.00
0.00
0.00
(0.00)
-
(0.00)
1.00
0.10
42,261
0.51
0.64
0.07
Year ended 07/31/16
1.00
0.00
0.00
0.00
(0.00)
-
(0.00)
1.00
0.01
92,494
0.45
0.64
0.01
Class R
6
Six m
onths ended 08/31/21
1.00
0.00
0.00
0.00
(0.00)
-
(0.00)
1.00
0.00
10
0.06 (d)
0.58 (d)
0.01 (d)
Year ended 02/28/21
1.00
0.00
0.00
0.00
(0.00)
-
(0.00)
1.00
0.05
10
0.16
0.57
0.06
Seven months ended 02/29/20
1.00
0.01
(0.00)
0.01
(0.01)
-
(0.01)
1.00
0.80
10
0.48 (d)
0.54 (d)
1.38 (d) Period ended 07/31/19 (e)
1.00
0.00
0.00
0.00
(0.00)
(0.00)
(0.00)
1.00
0.34
10
0.48 (d)
0.48 (d)
1.88 (d) (a)
Calculated using average shares outstanding.
(b) Includes adjustm
ents in accordance with accounting principles generally accepted in the U
nited States of America.
(c) D
oes not include indirect expenses from affiliated fund fees and expenses of 0.00%
for the seven months ended February 29, 2020 and the years ended July 31, 2019, 2018 and 2017, respectively.
(d) Annualized.
(e) C
omm
encement date after the close of business on M
ay 24, 2019. See accom
panying Notes to Financial Statem
ents which are an integral part of the financial statem
ents. 9
Invesco U
.S. Governm
ent Money Portfolio
ˆ200F9ggVNNr$1Xbo0Š200F9ggVNNr$1Xbo0
209935 EDG 10INVESCOU.S. GOVERNMENT MONE
28-Oct-2021 14:35 ESTHTMLAN
Donnelley Financial LSWpf_rendNone
6*ESS 0C
LSWP64RS3521.10.7.0
Page 1 of 1
Notes to Financial StatementsAugust 31, 2021(Unaudited)
NOTE 1–Significant Accounting Policies
Invesco U.S. Government Money Portfolio, (the “Fund”) is a series portfolio of AIM Investment Securities Funds (Invesco InvestmentSecurities Funds) (the “Trust”). The Trust is a Delaware statutory trust registered under the Investment Company Act of 1940, as amended(the “1940 Act”), as an open-end series management investment company authorized to issue an unlimited number of shares of beneficialinterest. Information presented in these financial statements pertains only to the Fund. Matters affecting the Fund or each class will bevoted on exclusively by the shareholders of such Fund or each class. The Fund’s investment objective is to seek income consistent with stability of principal. The Fund currently consists of five different classes of shares: Invesco Cash Reserve, Class C, Class R, Class Y and Class R6. Class Yshares are available only to certain investors. Class C shares are sold with a contingent deferred sales charges (“CDSC”). Invesco CashReserve, Class R, Class Y and Class R6 shares are sold at net asset value. Class C shares held for eight years after purchase are eligiblefor automatic conversion into Invesco Cash Reserve shares of the same Fund (the “Conversion Feature”). The automatic conversionpursuant to the Conversion Feature will generally occur at the end of the month following the eighth anniversary after a purchase of Class Cshares. The Fund is an investment company and accordingly follows the investment company accounting and reporting guidance in accordancewith Financial Accounting Standards Board Accounting Standards Codification Topic 946, Financial Services – Investment Companies. The Fund is a “government money market fund” as defined in Rule 2a-7 under the 1940 Act and seeks to maintain a stable or constantNAV of $1.00 per share using an amortized cost method of valuation. “Government money market funds” are required to invest at least99.5% of their total assets in cash, Government Securities (as defined in the 1940 Act), and/or repurchase agreements collateralized fullyby cash or Government Securities. The Board of Trustees has elected not to subject the Fund to the liquidity fee and redemption gaterequirement at this time, as permitted by Rule 2a-7. The following is a summary of the significant accounting policies followed by the Fund in the preparation of its financial statements.A. Security Valuations - The Fund’s securities are recorded on the basis of amortized cost which approximates value as permitted by
Rule 2a-7 under the 1940 Act. This method values a security at its cost on the date of purchase and, thereafter, assumes a constantamortization to maturity of any premiums or accretion of any discounts. Because of the inherent uncertainties of valuation, the values reflected in the financial statements may materially differ from the valuereceived upon actual sale of those investments. The Fund may invest in securities that are subject to interest rate risk, meaning the risk that the prices will generally fall as interestrates rise and, conversely, the prices will generally rise as interest rates fall. Specific securities differ in their sensitivity to changes ininterest rates depending on their individual characteristics. Changes in interest rates may result in increased market volatility, whichmay affect the value and/or liquidity of certain Fund investments.
B. Securities Transactions and Investment Income - Securities transactions are accounted for on a trade date basis. Realized gains orlosses on sales are computed on the basis of specific identification of the securities sold. Interest income (net of withholding tax, if any)is recorded on the accrual basis from settlement date and includes coupon interest and amortization of premium and accretion ofdiscount on debt securities as applicable. The Fund may periodically participate in litigation related to Fund investments. As such, the Fund may receive proceeds fromlitigation settlements. Any proceeds received are included in the Statement of Operations as realized gain (loss) for investments nolonger held and as unrealized gain (loss) for investments still held. Brokerage commissions and mark ups are considered transaction costs and are recorded as an increase to the cost basis ofsecurities purchased and/or a reduction of proceeds on a sale of securities. Such transaction costs are included in the determination ofnet realized gain (loss) from investment securities reported in the Statement of Operations and the Statement of Changes in Net Assetsand the net realized gains (losses) on securities per share in the Financial Highlights. Transaction costs are included in the calculationof the Fund’s net asset value and, accordingly, they reduce the Fund’s total returns. These transaction costs are not consideredoperating expenses and are not reflected in net investment income reported in the Statement of Operations and the Statement ofChanges in Net Assets, or the net investment income per share and the ratios of expenses and net investment income reported in theFinancial Highlights, nor are they limited by any expense limitation arrangements between the Fund and the investment adviser. The Fund allocates realized capital gains and losses to a class based on the relative net assets of each class. The Fund allocatesincome to a class based on the relative value of the settled shares of each class.
C. Country Determination - For the purposes of making investment selection decisions and presentation in the Schedule of Investments,the investment adviser may determine the country in which an issuer is located and/or credit risk exposure based on various factors.These factors include the laws of the country under which the issuer is organized, where the issuer maintains a principal office, thecountry in which the issuer derives 50% or more of its total revenues and the country that has the primary market for the issuer’ssecurities, as well as other criteria. Among the other criteria that may be evaluated for making this determination are the country inwhich the issuer maintains 50% or more of its assets, the type of security, financial guarantees and enhancements, the nature of thecollateral and the sponsor organization. Country of issuer and/or credit risk exposure has been determined to be the United States ofAmerica, unless otherwise noted.
D. Distributions - Distributions from net investment income, if any, are declared daily and paid monthly. Distributions from net realizedcapital gain, if any, are generally declared and paid annually and recorded on the ex-dividend date.
E. Federal Income Taxes - The Fund intends to comply with the requirements of Subchapter M of the Internal Revenue Code of 1986, asamended (the “Internal Revenue Code”), necessary to qualify as a regulated investment company and to distribute substantially all ofthe Fund’s taxable earnings to shareholders. As such, the Fund will not be subject to federal income taxes on otherwise taxable income(including net realized capital gain) that is distributed to shareholders. Therefore, no provision for federal income taxes is recorded inthe financial statements. The Fund recognizes the tax benefits of uncertain tax positions only when the position is more likely than not to be sustained.Management has analyzed the Fund’s uncertain tax positions and concluded that no liability for unrecognized tax benefits should berecorded related to uncertain tax positions. Management is not aware of any tax positions for which it is reasonably possible that thetotal amounts of unrecognized tax benefits will change materially in the next 12 months. The Fund files tax returns in the U.S. Federal jurisdiction and certain other jurisdictions. Generally, the Fund is subject toexaminations by such taxing authorities for up to three years after the filing of the return for the tax period.
F. Expenses - Fees provided for under the Rule 12b-1 plan of a particular class of the Fund are charged to the operations of such class.Transfer agency fees and expenses and other shareholder recordkeeping fees and expenses attributable to Class R6 are charged tosuch class. Transfer agency fees and expenses and other shareholder recordkeeping fees and expenses relating to all other classesare allocated among those classes based on relative net assets. All other expenses are allocated among the classes based on relativenet assets.
G. Accounting Estimates - The preparation of financial statements in conformity with accounting principles generally accepted in theUnited States of America (“GAAP”) requires management to make estimates and assumptions that affect the reported amounts ofassets and liabilities at the date of the financial statements and the reported amounts of revenues and expenses during the reportingperiod including estimates and assumptions related to taxation. Actual
10 Invesco U.S. Government Money Portfolio
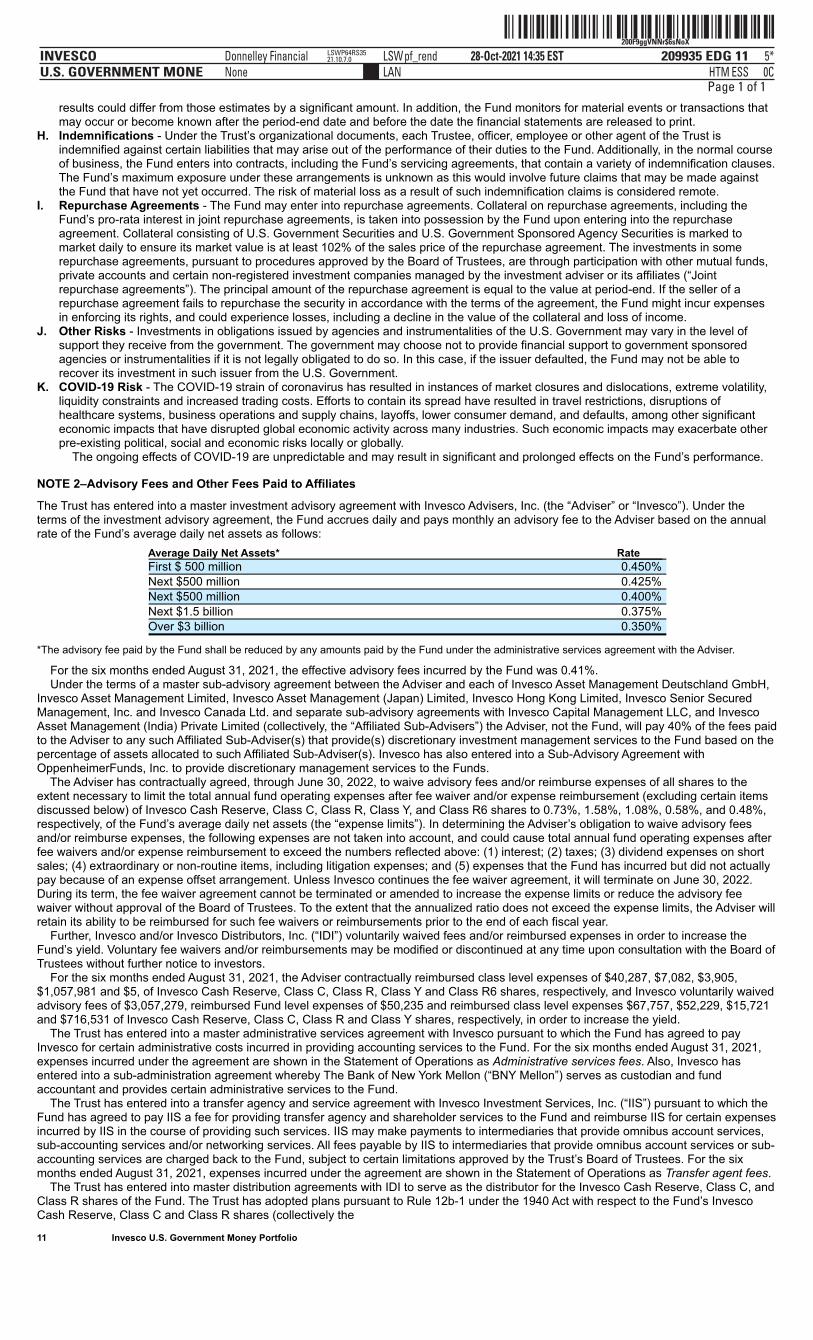
ˆ200F9ggVNNr$6sNoXŠ200F9ggVNNr$6sNoX
209935 EDG 11INVESCOU.S. GOVERNMENT MONE
28-Oct-2021 14:35 ESTHTMLAN
Donnelley Financial LSWpf_rendNone
5*ESS 0C
LSWP64RS3521.10.7.0
Page 1 of 1 results could differ from those estimates by a significant amount. In addition, the Fund monitors for material events or transactions that
may occur or become known after the period-end date and before the date the financial statements are released to print.H. Indemnifications - Under the Trust’s organizational documents, each Trustee, officer, employee or other agent of the Trust is
indemnified against certain liabilities that may arise out of the performance of their duties to the Fund. Additionally, in the normal courseof business, the Fund enters into contracts, including the Fund’s servicing agreements, that contain a variety of indemnification clauses.The Fund’s maximum exposure under these arrangements is unknown as this would involve future claims that may be made againstthe Fund that have not yet occurred. The risk of material loss as a result of such indemnification claims is considered remote.
I. Repurchase Agreements - The Fund may enter into repurchase agreements. Collateral on repurchase agreements, including theFund’s pro-rata interest in joint repurchase agreements, is taken into possession by the Fund upon entering into the repurchaseagreement. Collateral consisting of U.S. Government Securities and U.S. Government Sponsored Agency Securities is marked tomarket daily to ensure its market value is at least 102% of the sales price of the repurchase agreement. The investments in somerepurchase agreements, pursuant to procedures approved by the Board of Trustees, are through participation with other mutual funds,private accounts and certain non-registered investment companies managed by the investment adviser or its affiliates (“Jointrepurchase agreements”). The principal amount of the repurchase agreement is equal to the value at period-end. If the seller of arepurchase agreement fails to repurchase the security in accordance with the terms of the agreement, the Fund might incur expensesin enforcing its rights, and could experience losses, including a decline in the value of the collateral and loss of income.
J. Other Risks - Investments in obligations issued by agencies and instrumentalities of the U.S. Government may vary in the level ofsupport they receive from the government. The government may choose not to provide financial support to government sponsoredagencies or instrumentalities if it is not legally obligated to do so. In this case, if the issuer defaulted, the Fund may not be able torecover its investment in such issuer from the U.S. Government.
K. COVID-19 Risk - The COVID-19 strain of coronavirus has resulted in instances of market closures and dislocations, extreme volatility,liquidity constraints and increased trading costs. Efforts to contain its spread have resulted in travel restrictions, disruptions ofhealthcare systems, business operations and supply chains, layoffs, lower consumer demand, and defaults, among other significanteconomic impacts that have disrupted global economic activity across many industries. Such economic impacts may exacerbate otherpre-existing political, social and economic risks locally or globally. The ongoing effects of COVID-19 are unpredictable and may result in significant and prolonged effects on the Fund’s performance.
NOTE 2–Advisory Fees and Other Fees Paid to Affiliates
The Trust has entered into a master investment advisory agreement with Invesco Advisers, Inc. (the “Adviser” or “Invesco”). Under theterms of the investment advisory agreement, the Fund accrues daily and pays monthly an advisory fee to the Adviser based on the annualrate of the Fund’s average daily net assets as follows:
Average Daily Net Assets* Rate First $ 500 million 0.450% Next $500 million 0.425% Next $500 million 0.400% Next $1.5 billion 0.375% Over $3 billion 0.350%
*The advisory fee paid by the Fund shall be reduced by any amounts paid by the Fund under the administrative services agreement with the Adviser.
For the six months ended August 31, 2021, the effective advisory fees incurred by the Fund was 0.41%. Under the terms of a master sub-advisory agreement between the Adviser and each of Invesco Asset Management Deutschland GmbH,Invesco Asset Management Limited, Invesco Asset Management (Japan) Limited, Invesco Hong Kong Limited, Invesco Senior SecuredManagement, Inc. and Invesco Canada Ltd. and separate sub-advisory agreements with Invesco Capital Management LLC, and InvescoAsset Management (India) Private Limited (collectively, the “Affiliated Sub-Advisers”) the Adviser, not the Fund, will pay 40% of the fees paidto the Adviser to any such Affiliated Sub-Adviser(s) that provide(s) discretionary investment management services to the Fund based on thepercentage of assets allocated to such Affiliated Sub-Adviser(s). Invesco has also entered into a Sub-Advisory Agreement withOppenheimerFunds, Inc. to provide discretionary management services to the Funds. The Adviser has contractually agreed, through June 30, 2022, to waive advisory fees and/or reimburse expenses of all shares to theextent necessary to limit the total annual fund operating expenses after fee waiver and/or expense reimbursement (excluding certain itemsdiscussed below) of Invesco Cash Reserve, Class C, Class R, Class Y, and Class R6 shares to 0.73%, 1.58%, 1.08%, 0.58%, and 0.48%,respectively, of the Fund’s average daily net assets (the “expense limits”). In determining the Adviser’s obligation to waive advisory feesand/or reimburse expenses, the following expenses are not taken into account, and could cause total annual fund operating expenses afterfee waivers and/or expense reimbursement to exceed the numbers reflected above: (1) interest; (2) taxes; (3) dividend expenses on shortsales; (4) extraordinary or non-routine items, including litigation expenses; and (5) expenses that the Fund has incurred but did not actuallypay because of an expense offset arrangement. Unless Invesco continues the fee waiver agreement, it will terminate on June 30, 2022.During its term, the fee waiver agreement cannot be terminated or amended to increase the expense limits or reduce the advisory feewaiver without approval of the Board of Trustees. To the extent that the annualized ratio does not exceed the expense limits, the Adviser willretain its ability to be reimbursed for such fee waivers or reimbursements prior to the end of each fiscal year. Further, Invesco and/or Invesco Distributors, Inc. (“IDI”) voluntarily waived fees and/or reimbursed expenses in order to increase theFund’s yield. Voluntary fee waivers and/or reimbursements may be modified or discontinued at any time upon consultation with the Board ofTrustees without further notice to investors. For the six months ended August 31, 2021, the Adviser contractually reimbursed class level expenses of $40,287, $7,082, $3,905,$1,057,981 and $5, of Invesco Cash Reserve, Class C, Class R, Class Y and Class R6 shares, respectively, and Invesco voluntarily waivedadvisory fees of $3,057,279, reimbursed Fund level expenses of $50,235 and reimbursed class level expenses $67,757, $52,229, $15,721and $716,531 of Invesco Cash Reserve, Class C, Class R and Class Y shares, respectively, in order to increase the yield. The Trust has entered into a master administrative services agreement with Invesco pursuant to which the Fund has agreed to payInvesco for certain administrative costs incurred in providing accounting services to the Fund. For the six months ended August 31, 2021,expenses incurred under the agreement are shown in the Statement of Operations as Administrative services fees. Also, Invesco hasentered into a sub-administration agreement whereby The Bank of New York Mellon (“BNY Mellon”) serves as custodian and fundaccountant and provides certain administrative services to the Fund. The Trust has entered into a transfer agency and service agreement with Invesco Investment Services, Inc. (“IIS”) pursuant to which theFund has agreed to pay IIS a fee for providing transfer agency and shareholder services to the Fund and reimburse IIS for certain expensesincurred by IIS in the course of providing such services. IIS may make payments to intermediaries that provide omnibus account services,sub-accounting services and/or networking services. All fees payable by IIS to intermediaries that provide omnibus account services or sub-accounting services are charged back to the Fund, subject to certain limitations approved by the Trust’s Board of Trustees. For the sixmonths ended August 31, 2021, expenses incurred under the agreement are shown in the Statement of Operations as Transfer agent fees. The Trust has entered into master distribution agreements with IDI to serve as the distributor for the Invesco Cash Reserve, Class C, andClass R shares of the Fund. The Trust has adopted plans pursuant to Rule 12b-1 under the 1940 Act with respect to the Fund’s InvescoCash Reserve, Class C and Class R shares (collectively the 11 Invesco U.S. Government Money Portfolio
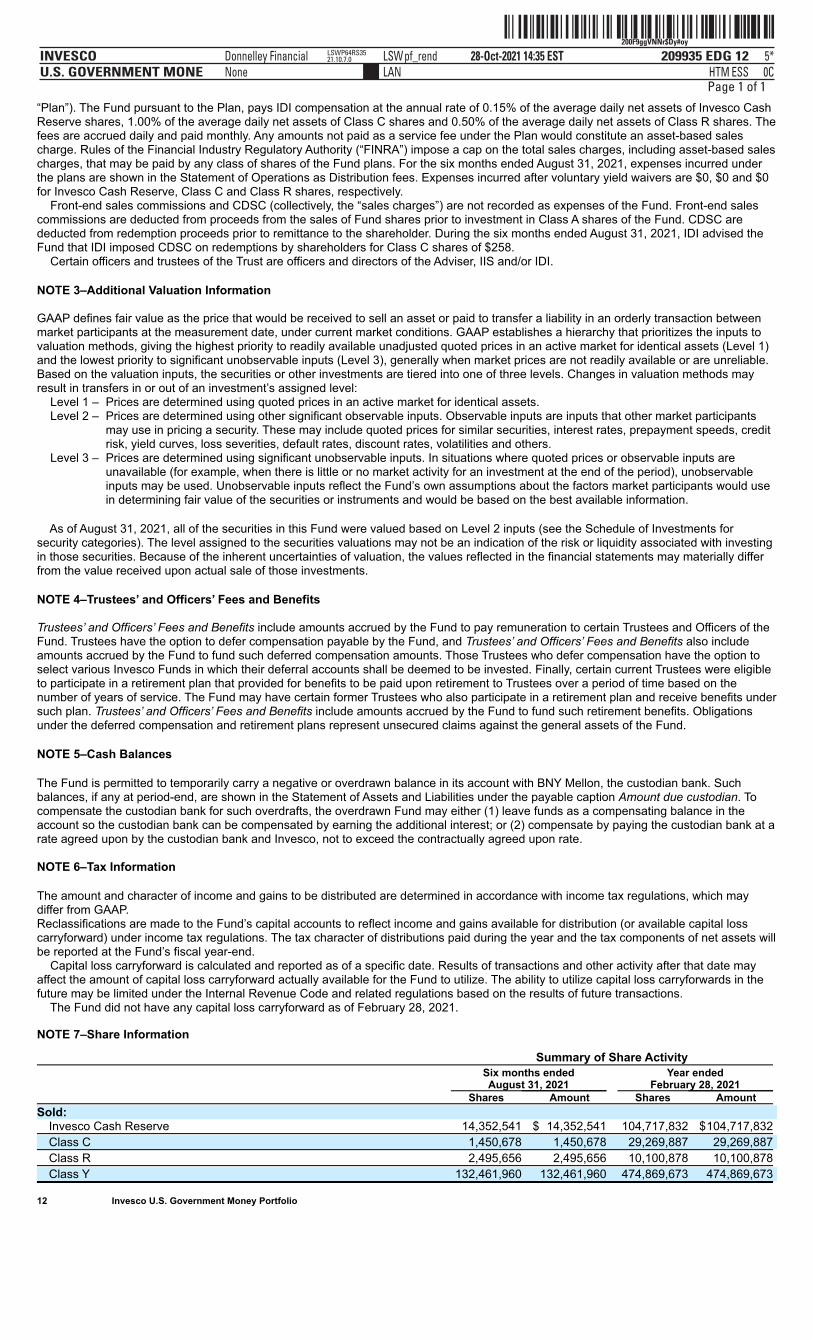
ˆ200F9ggVNNr$Dy#oyŠ200F9ggVNNr$Dy#oy
209935 EDG 12INVESCOU.S. GOVERNMENT MONE
28-Oct-2021 14:35 ESTHTMLAN
Donnelley Financial LSWpf_rendNone
5*ESS 0C
LSWP64RS3521.10.7.0
Page 1 of 1“Plan”). The Fund pursuant to the Plan, pays IDI compensation at the annual rate of 0.15% of the average daily net assets of Invesco CashReserve shares, 1.00% of the average daily net assets of Class C shares and 0.50% of the average daily net assets of Class R shares. Thefees are accrued daily and paid monthly. Any amounts not paid as a service fee under the Plan would constitute an asset-based salescharge. Rules of the Financial Industry Regulatory Authority (“FINRA”) impose a cap on the total sales charges, including asset-based salescharges, that may be paid by any class of shares of the Fund plans. For the six months ended August 31, 2021, expenses incurred underthe plans are shown in the Statement of Operations as Distribution fees. Expenses incurred after voluntary yield waivers are $0, $0 and $0for Invesco Cash Reserve, Class C and Class R shares, respectively. Front-end sales commissions and CDSC (collectively, the “sales charges”) are not recorded as expenses of the Fund. Front-end salescommissions are deducted from proceeds from the sales of Fund shares prior to investment in Class A shares of the Fund. CDSC arededucted from redemption proceeds prior to remittance to the shareholder. During the six months ended August 31, 2021, IDI advised theFund that IDI imposed CDSC on redemptions by shareholders for Class C shares of $258. Certain officers and trustees of the Trust are officers and directors of the Adviser, IIS and/or IDI.
NOTE 3–Additional Valuation Information
GAAP defines fair value as the price that would be received to sell an asset or paid to transfer a liability in an orderly transaction betweenmarket participants at the measurement date, under current market conditions. GAAP establishes a hierarchy that prioritizes the inputs tovaluation methods, giving the highest priority to readily available unadjusted quoted prices in an active market for identical assets (Level 1)and the lowest priority to significant unobservable inputs (Level 3), generally when market prices are not readily available or are unreliable.Based on the valuation inputs, the securities or other investments are tiered into one of three levels. Changes in valuation methods mayresult in transfers in or out of an investment’s assigned level: Level 1 – Prices are determined using quoted prices in an active market for identical assets. Level 2 –
Prices are determined using other significant observable inputs. Observable inputs are inputs that other market participantsmay use in pricing a security. These may include quoted prices for similar securities, interest rates, prepayment speeds, creditrisk, yield curves, loss severities, default rates, discount rates, volatilities and others.
Level 3 –
Prices are determined using significant unobservable inputs. In situations where quoted prices or observable inputs areunavailable (for example, when there is little or no market activity for an investment at the end of the period), unobservableinputs may be used. Unobservable inputs reflect the Fund’s own assumptions about the factors market participants would usein determining fair value of the securities or instruments and would be based on the best available information.
As of August 31, 2021, all of the securities in this Fund were valued based on Level 2 inputs (see the Schedule of Investments forsecurity categories). The level assigned to the securities valuations may not be an indication of the risk or liquidity associated with investingin those securities. Because of the inherent uncertainties of valuation, the values reflected in the financial statements may materially differfrom the value received upon actual sale of those investments.
NOTE 4–Trustees’ and Officers’ Fees and Benefits
Trustees’ and Officers’ Fees and Benefits include amounts accrued by the Fund to pay remuneration to certain Trustees and Officers of theFund. Trustees have the option to defer compensation payable by the Fund, and Trustees’ and Officers’ Fees and Benefits also includeamounts accrued by the Fund to fund such deferred compensation amounts. Those Trustees who defer compensation have the option toselect various Invesco Funds in which their deferral accounts shall be deemed to be invested. Finally, certain current Trustees were eligibleto participate in a retirement plan that provided for benefits to be paid upon retirement to Trustees over a period of time based on thenumber of years of service. The Fund may have certain former Trustees who also participate in a retirement plan and receive benefits undersuch plan. Trustees’ and Officers’ Fees and Benefits include amounts accrued by the Fund to fund such retirement benefits. Obligationsunder the deferred compensation and retirement plans represent unsecured claims against the general assets of the Fund.
NOTE 5–Cash Balances
The Fund is permitted to temporarily carry a negative or overdrawn balance in its account with BNY Mellon, the custodian bank. Suchbalances, if any at period-end, are shown in the Statement of Assets and Liabilities under the payable caption Amount due custodian. Tocompensate the custodian bank for such overdrafts, the overdrawn Fund may either (1) leave funds as a compensating balance in theaccount so the custodian bank can be compensated by earning the additional interest; or (2) compensate by paying the custodian bank at arate agreed upon by the custodian bank and Invesco, not to exceed the contractually agreed upon rate.
NOTE 6–Tax Information
The amount and character of income and gains to be distributed are determined in accordance with income tax regulations, which maydiffer from GAAP.Reclassifications are made to the Fund’s capital accounts to reflect income and gains available for distribution (or available capital losscarryforward) under income tax regulations. The tax character of distributions paid during the year and the tax components of net assets willbe reported at the Fund’s fiscal year-end. Capital loss carryforward is calculated and reported as of a specific date. Results of transactions and other activity after that date mayaffect the amount of capital loss carryforward actually available for the Fund to utilize. The ability to utilize capital loss carryforwards in thefuture may be limited under the Internal Revenue Code and related regulations based on the results of future transactions. The Fund did not have any capital loss carryforward as of February 28, 2021.
NOTE 7–Share Information
Summary of Share Activity
Six months endedAugust 31, 2021
Year endedFebruary 28, 2021
Shares Amount Shares Amount
Sold: Invesco Cash Reserve 14,352,541 $ 14,352,541 104,717,832 $104,717,832
Class C 1,450,678 1,450,678 29,269,887 29,269,887
Class R 2,495,656 2,495,656 10,100,878 10,100,878
Class Y 132,461,960 132,461,960 474,869,673 474,869,673
12 Invesco U.S. Government Money Portfolio
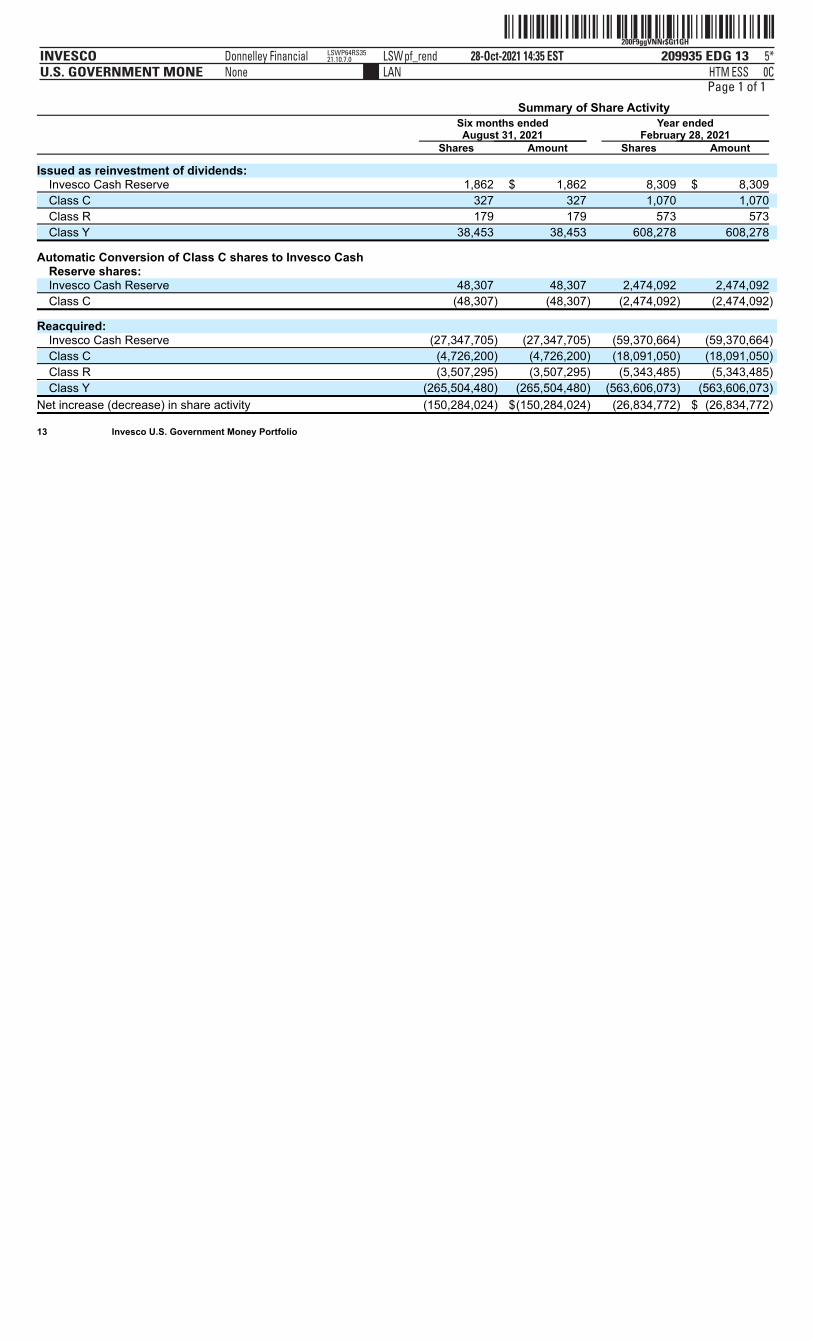
ˆ200F9ggVNNr$Gt1GHŠ200F9ggVNNr$Gt1GH
209935 EDG 13INVESCOU.S. GOVERNMENT MONE
28-Oct-2021 14:35 ESTHTMLAN
Donnelley Financial LSWpf_rendNone
5*ESS 0C
LSWP64RS3521.10.7.0
Page 1 of 1 Summary of Share Activity
Six months endedAugust 31, 2021
Year endedFebruary 28, 2021
Shares Amount Shares Amount
Issued as reinvestment of dividends: Invesco Cash Reserve 1,862 $ 1,862 8,309 $ 8,309
Class C 327 327 1,070 1,070
Class R 179 179 573 573
Class Y 38,453 38,453 608,278 608,278
Automatic Conversion of Class C shares to Invesco CashReserve shares: Invesco Cash Reserve 48,307 48,307 2,474,092 2,474,092
Class C (48,307) (48,307) (2,474,092) (2,474,092)
Reacquired: Invesco Cash Reserve (27,347,705) (27,347,705) (59,370,664) (59,370,664)
Class C (4,726,200) (4,726,200) (18,091,050) (18,091,050)
Class R (3,507,295) (3,507,295) (5,343,485) (5,343,485)
Class Y (265,504,480) (265,504,480) (563,606,073) (563,606,073)
Net increase (decrease) in share activity (150,284,024) $(150,284,024) (26,834,772) $ (26,834,772)
13 Invesco U.S. Government Money Portfolio
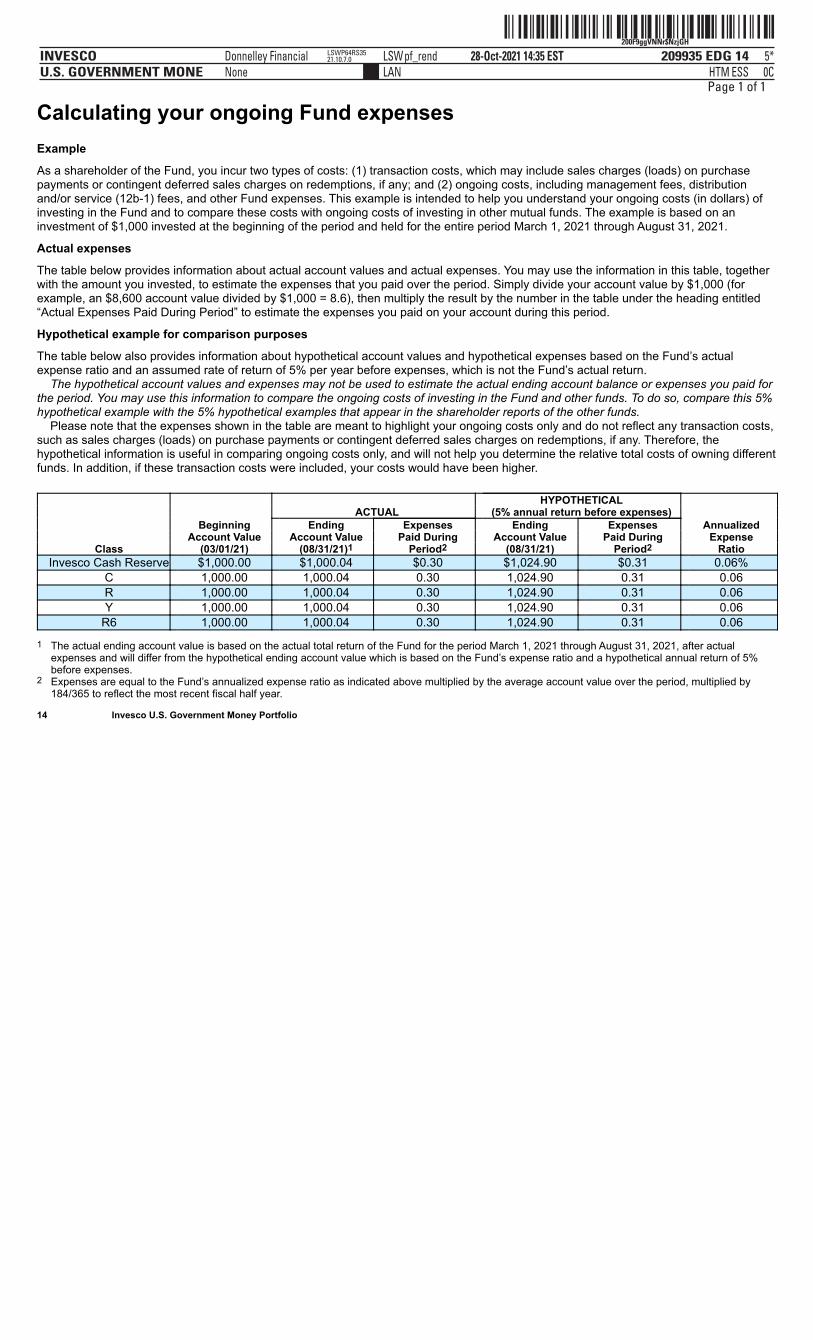
ˆ200F9ggVNNr$NzjGHŠ200F9ggVNNr$NzjGH
209935 EDG 14INVESCOU.S. GOVERNMENT MONE
28-Oct-2021 14:35 ESTHTMLAN
Donnelley Financial LSWpf_rendNone
5*ESS 0C
LSWP64RS3521.10.7.0
Page 1 of 1
Calculating your ongoing Fund expensesExample
As a shareholder of the Fund, you incur two types of costs: (1) transaction costs, which may include sales charges (loads) on purchasepayments or contingent deferred sales charges on redemptions, if any; and (2) ongoing costs, including management fees, distributionand/or service (12b-1) fees, and other Fund expenses. This example is intended to help you understand your ongoing costs (in dollars) ofinvesting in the Fund and to compare these costs with ongoing costs of investing in other mutual funds. The example is based on aninvestment of $1,000 invested at the beginning of the period and held for the entire period March 1, 2021 through August 31, 2021.
Actual expenses
The table below provides information about actual account values and actual expenses. You may use the information in this table, togetherwith the amount you invested, to estimate the expenses that you paid over the period. Simply divide your account value by $1,000 (forexample, an $8,600 account value divided by $1,000 = 8.6), then multiply the result by the number in the table under the heading entitled“Actual Expenses Paid During Period” to estimate the expenses you paid on your account during this period.
Hypothetical example for comparison purposes
The table below also provides information about hypothetical account values and hypothetical expenses based on the Fund’s actualexpense ratio and an assumed rate of return of 5% per year before expenses, which is not the Fund’s actual return. The hypothetical account values and expenses may not be used to estimate the actual ending account balance or expenses you paid forthe period. You may use this information to compare the ongoing costs of investing in the Fund and other funds. To do so, compare this 5%hypothetical example with the 5% hypothetical examples that appear in the shareholder reports of the other funds. Please note that the expenses shown in the table are meant to highlight your ongoing costs only and do not reflect any transaction costs,such as sales charges (loads) on purchase payments or contingent deferred sales charges on redemptions, if any. Therefore, thehypothetical information is useful in comparing ongoing costs only, and will not help you determine the relative total costs of owning differentfunds. In addition, if these transaction costs were included, your costs would have been higher.
HYPOTHETICAL ACTUAL (5% annual return before expenses) Beginning Ending Expenses Ending Expenses Annualized Account Value Account Value Paid During Account Value Paid During Expense
Class (03/01/21) (08/31/21)1 Period2 (08/31/21) Period2 RatioInvesco Cash Reserve $1,000.00 $1,000.04 $0.30 $1,024.90 $0.31 0.06%
C 1,000.00 1,000.04 0.30 1,024.90 0.31 0.06R 1,000.00 1,000.04 0.30 1,024.90 0.31 0.06Y 1,000.00 1,000.04 0.30 1,024.90 0.31 0.06
R6 1,000.00 1,000.04 0.30 1,024.90 0.31 0.06
1 The actual ending account value is based on the actual total return of the Fund for the period March 1, 2021 through August 31, 2021, after actualexpenses and will differ from the hypothetical ending account value which is based on the Fund’s expense ratio and a hypothetical annual return of 5%before expenses.
2 Expenses are equal to the Fund’s annualized expense ratio as indicated above multiplied by the average account value over the period, multiplied by184/365 to reflect the most recent fiscal half year.
14 Invesco U.S. Government Money Portfolio
ˆ200F9ggVNNr$WSlokŠ200F9ggVNNr$WSlok
209935 EDG 15INVESCOU.S. GOVERNMENT MONE
28-Oct-2021 14:35 ESTHTMLAN
Donnelley Financial LSWpf_rendNone
7*ESS 0C
LSWP64RS3521.10.7.0
Page 1 of 1
Approval of Investment Advisory and Sub-Advisory Contracts
15 Invesco U.S. Government Money Portfolio
At meetings held on June 10, 2021, theBoard of Trustees (the Board or the Trustees)of AIM Investment Securities Funds (InvescoInvestment Securities Funds) as a whole, andthe independent Trustees, who comprise over75% of the Board, voting separately,approved the continuance of the Invesco U.S.Government Money Portfolio’s (formerly,Invesco Oppenheimer Government MoneyMarket Fund) (the Fund) Master InvestmentAdvisory Agreement with Invesco Advisers,Inc. (Invesco Advisers and the investmentadvisory agreement) and the MasterIntergroup Sub-Advisory Contract for MutualFunds with Invesco Asset ManagementDeutschland GmbH, Invesco AssetManagement Limited, Invesco AssetManagement (Japan) Limited, Invesco HongKong Limited, Invesco Senior SecuredManagement, Inc. and Invesco Canada Ltd.and separate sub-advisory contracts withInvesco Capital Management LLC andInvesco Asset Management (India) PrivateLimited and OppenheimerFunds, Inc.(collectively, the Affiliated Sub-Advisers andthe sub-advisory contracts) for another year,effective July 1, 2021. After evaluating thefactors discussed below, among others, theBoard approved the renewal of the Fund’sinvestment advisory agreement and the sub-advisory contracts and determined that thecompensation payable thereunder by theFund to Invesco Advisers and by InvescoAdvisers to the Affiliated Sub-Advisers is fairand reasonable.The Board’s Evaluation ProcessThe Board has established an InvestmentsCommittee, which in turn has establishedSub-Committees that meet throughout theyear to review the performance of fundsadvised by Invesco Advisers (the InvescoFunds). The Sub-Committees meet regularlywith portfolio managers for their assignedInvesco Funds and other members ofmanagement to review detailed informationabout investment performance and portfolioattributes of these funds. The Board hasestablished additional standing and ad hoccommittees that meet regularly throughoutthe year to review matters within theirpurview. The Board took into accountevaluations and reports that it received fromits committees and sub-committees, as wellas the information provided to the Board andits committees and sub-committeesthroughout the year, in considering whether toapprove each Invesco Fund’s investmentadvisory agreement and sub-advisorycontracts. As part of the contract renewal process,the Board reviews and considers informationprovided in response to detailed requests forinformation submitted to management by theindependent Trustees with assistance fromlegal counsel to the independent Trustees.The Board receives comparative investmentperformance and fee and expense dataregarding the Invesco Funds prepared byBroadridge Financial Solutions, Inc.(Broadridge), an independent mutual funddata provider, as well as information on thecomposition of the peer groups provided byBroadridge and its methodology fordetermining peer groups. The Board alsoreceives an independent written evaluationfrom the Senior Officer, an officer of theInvesco Funds who reports directly to theindependent Trustees. The Senior Officer’sevaluation is prepared as part of hisresponsibility to manage the process bywhich the
Invesco Funds’ proposed management feesare negotiated during the annual contractrenewal process to ensure they are negotiatedin a manner that is at arms’ length andreasonable. In addition to meetings withInvesco Advisers and fund counsel throughoutthe year and as part of meetings convened onApril 27, 2021 and June 10, 2021, theindependent Trustees also discussed thecontinuance of the investment advisoryagreement and sub-advisory contracts inseparate sessions with the Senior Officer andwith independent legal counsel.
The discussion below is a summary of theSenior Officer’s independent written evaluationwith respect to the Fund’s investment advisoryagreement and sub-advisory contracts, as wellas a discussion of the material factors andrelated conclusions that formed the basis forthe Board’s approval of the Fund’s investmentadvisory agreement and sub-advisorycontracts. The Trustees’ review andconclusions are based on the comprehensiveconsideration of all information presented tothem during the course of the year and in prioryears and are not the result of any singledeterminative factor. Moreover, one Trusteemay have weighed a particular piece ofinformation or factor differently than anotherTrustee. The information received andconsidered by the Board was current as ofvarious dates prior to the Board’s approval onJune 10, 2021.Factors and Conclusions and Summary ofIndependent Written Fee EvaluationA. Nature, Extent and Quality of Services
Provided by Invesco Advisers and theAffiliated Sub-Advisers
The Board reviewed the nature, extent andquality of the advisory services provided to theFund by Invesco Advisers under the Fund’sinvestment advisory agreement, and thecredentials and experience of the officers andemployees of Invesco Advisers who providethese services, including the Fund’s portfoliomanager(s). The Board’s review includedconsideration of Invesco Advisers’ investmentprocess and oversight, credit analysis, andresearch capabilities. The Board consideredinformation regarding Invesco Advisers’programs for and resources devoted to riskmanagement, including management ofinvestment, enterprise, operational, liquidity,valuation and compliance risks, and technologyused to manage such risks. The Boardreceived a description of Invesco Advisers’business continuity plans and of its approachto data privacy and cybersecurity, includingrelated testing. The Board considered how thecybersecurity and business continuity plans ofInvesco Advisers and its key service providersoperated in the increased remote workingenvironment resulting from the novelcoronavirus (“COVID-19”) pandemic. TheBoard also considered non-advisory servicesthat Invesco Advisers and its affiliates provideto the Invesco Funds, such as various backoffice support functions, third party oversight,internal audit, valuation, portfolio trading andlegal and compliance. The Board observed thatInvesco Advisers has been able to effectivelymanage, operate and oversee the InvescoFunds through the challenging COVID-19pandemic period. The Board reviewed andconsidered the benefits to shareholders ofinvesting in a Fund that is part of the family offunds under the umbrella of
Invesco Ltd., Invesco Advisers’ parentcompany, and noted Invesco Ltd.’s depth andexperience in running an investmentmanagement business, as well as itscommitment of financial and other resourcesto such business. The Board concluded thatthe nature, extent and quality of the servicesprovided to the Fund by Invesco Advisers areappropriate and satisfactory.
The Board reviewed the services that maybe provided by the Affiliated Sub-Advisersunder the sub-advisory contracts and thecredentials and experience of the officers andemployees of the Affiliated Sub-Advisers whoprovide these services. The Board noted theAffiliated Sub-Advisers’ expertise with respectto certain asset classes and that the AffiliatedSub-Advisers have offices and personnel thatare located in financial centers around theworld. As a result, the Board noted that theAffiliated Sub-Advisers can provide researchand investment analysis on the markets andeconomies of various countries in which theFund may invest, make recommendationsregarding securities and assist with securitytrades. The Board concluded that the sub-advisory contracts may benefit the Fund andits shareholders by permitting InvescoAdvisers to use the resources and talents ofthe Affiliated Sub-Advisers in managing theFund. The Board concluded that the nature,extent and quality of the services that may beprovided to the Fund by the Affiliated Sub-Advisers are appropriate and satisfactory.B. Fund Investment PerformanceThe Board considered Fund investmentperformance as a relevant factor inconsidering whether to approve theinvestment advisory agreement. The Boarddid not view Fund investment performance asa relevant factor in considering whether toapprove the sub-advisory contracts for theFund, as no Affiliated Sub-Adviser currentlymanages assets of the Fund. The Board compared the Fund’sinvestment performance over multiple timeperiods ending December 31, 2020 to theperformance of funds in the Broadridgeperformance universe. The Board noted thatperformance of Class Y shares of the Fundwas in the fourth quintile of its performanceuniverse for the one year period and the thirdquintile for the three and five year periods(the first quintile being the best performingfunds and the fifth quintile being the worstperforming funds). The Board noted thatperformance of the Fund was below theperformance universe median for the oneyear period, reasonably comparable to theperformance universe median for the threeyear period and the same as the performanceuniverse median for the five year period. TheBoard considered that the Fund was createdin connection with Invesco Ltd.’s acquisitionof OppenheimerFunds, Inc. and itssubsidiaries (the “Transaction”) and that theFund’s performance prior to the closing of theTransaction on May 24, 2019 is that of itspredecessor fund. The Board recognized thatthe performance data reflects a snapshot intime as of a particular date and that selectinga different performance period could producedifferent results. The Board also reviewedmore recent Fund performance as well asother performance metrics, which did notchange its conclusions.
ˆ200F9ggVNNr$ZuVG@Š200F9ggVNNr$ZuVG@
209935 EDG 16INVESCOU.S. GOVERNMENT MONE
28-Oct-2021 14:35 ESTHTMLAN
Donnelley Financial LSWpf_rendNone
4*ESS 0C
LSWP64RS3521.10.7.0
Page 1 of 2
C. Advisory and Sub-Advisory Fees and FundExpenses
The Board compared the Fund’scontractual management fee rate to thecontractual management fee rates of fundsin the Fund’s Broadridge expense group.The Board noted that the contractualmanagement fee rate for Class Y shares ofthe Fund was above the mediancontractual management fee rate of fundsin its expense group. The Board noted thatthe term “contractual management fee” forfunds in the expense group may includeboth advisory and certain non-portfoliomanagement administrative services fees,but that Broadridge is not able to provideinformation on a fund by fund basis as towhat is included. The Board also reviewedthe methodology used by Broadridge incalculating expense group information,which includes using each fund’scontractual management fee schedule(including any applicable breakpoints) asreported in the most recent prospectus orstatement of additional information foreach fund in the expense group. TheBoard also considered comparativeinformation regarding the Fund’s totalexpense ratio and its various components.The Board noted that the Fund’scontractual management fees and totalexpense ratio were in the fourth and fifthquintile, respectively, of its expense groupand discussed with management reasonsfor such relative contractual managementfees and total expenses, including thatsome of the Fund’s expense group peershave a unitary fee structure. The Boardalso noted that the Fund’s total expenseratio is as of the fiscal year end ofFebruary 28, 2020 and does not reflectadditional voluntary waivers to maintain apositive yield subsequent to such date. The Board noted that Invesco Advisershas contractually agreed to waive feesand/or limit expenses of the Fund for theterm disclosed in the Fund’s registrationstatement in an amount necessary to limittotal annual operating expenses to aspecified percentage of average daily netassets for each class of the Fund. The Board also considered the feescharged by Invesco Advisers and itsaffiliates to other client accounts that aresimilarly managed. Invesco Advisersreviewed with the Board differences in thescope of services it provides to the InvescoFunds relative to that provided by InvescoAdvisers and its affiliates to certain othertypes of client accounts, including, amongothers: management of cash flows as aresult of redemptions and purchases;necessary infrastructure such as officers,office space, technology, legal anddistribution; oversight of service providers;costs and business risks associated withlaunching new funds and sponsoring andmaintaining the product line; andcompliance with federal and state laws andregulations. Invesco Advisers also advisedthe Board that many of the similarlymanaged client accounts have all-inclusivefee structures, which are not easily un-bundled. The Board also considered the servicesthat may be provided by the Affiliated Sub-Advisers pursuant to the sub-advisorycontracts, as well as the fees payable byInvesco Advisers to the Affiliated Sub-Advisers pursuant to the sub-advisorycontracts.D. Economies of Scale and BreakpointsThe Board considered the extent to whichthere may be economies of scale in theprovision of advisory services to the Fundand the Invesco Funds, and the extent to
scale through contractual breakpoints in theFund’s advisory fee schedule, whichgenerally operate to reduce the Fund’sexpense ratio as it grows in size. The Boardnoted that the Fund also shares ineconomies of scale through InvescoAdvisers’ ability to negotiate lower feearrangements with third party serviceproviders. The Board noted that the Fundmay also benefit from economies of scalethrough initial fee setting, fee waivers andexpense reimbursements, as well asInvesco Advisers’ investment in its business,including investments in businessinfrastructure, technology and cybersecurity.E. Profitability and Financial ResourcesThe Board reviewed information fromInvesco Advisers concerning the costs of theadvisory and other services that InvescoAdvisers and its affiliates provide to theFund and the Invesco Funds and theprofitability of Invesco Advisers and itsaffiliates in providing these services in theaggregate and on an individual Fund-by-Fund basis. The Board considered themethodology used for calculating profitabilityand noted that such methodology hadrecently been reviewed and enhanced. TheBoard noted that Invesco Advisers continuesto operate at a net profit from servicesInvesco Advisers and its affiliates provide tothe Invesco Funds in the aggregate and tomost Funds individually. The Board did notdeem the level of profits realized by InvescoAdvisers and its affiliates from providingsuch services to be excessive, given thenature, extent and quality of the servicesprovided. The Board noted that InvescoAdvisers provided information demonstratingthat Invesco Advisers is financially soundand has the resources necessary to performits obligations under the investment advisoryagreement, and provided representationsindicating that the Affiliated Sub-Advisersare financially sound and have theresources necessary to perform theirobligations under the sub-advisorycontracts.F. Collateral Benefits to Invesco Advisers and its
AffiliatesThe Board considered various other benefitsreceived by Invesco Advisers and itsaffiliates from the relationship with the Fund,including the fees received for providingadministrative, transfer agency anddistribution services to the Fund. The Boardreceived comparative information regardingfees charged for these services, includinginformation provided by Broadridge andother independent sources. The Boardreviewed the performance of InvescoAdvisers and its affiliates in providing theseservices and the organizational structureemployed to provide these services. TheBoard noted that these services areprovided to the Fund pursuant to writtencontracts that are reviewed and subject toapproval on an annual basis by the Boardbased on its determination that the servicesare required for the operation of the Fund.

ˆ200F9ggVNNr$ZuVG@Š200F9ggVNNr$ZuVG@
209935 EDG 16INVESCOU.S. GOVERNMENT MONE
28-Oct-2021 14:35 ESTHTMLAN
Donnelley Financial LSWpf_rendNone
4*ESS 0C
LSWP64RS3521.10.7.0
ˆ200F9ggVNNr$ZuVG@Š200F9ggVNNr$ZuVG@
209935 EDG 16INVESCOU.S. GOVERNMENT MONE
28-Oct-2021 14:35 ESTHTMLAN
Donnelley Financial LSWpf_rendNone
4*ESS 0C
LSWP64RS3521.10.7.0
Page 2 of 2
16 Invesco U.S. Government Money Portfolio
which such economies of scale are sharedwith the Fund and the Invesco Funds. TheBoard considered that the Fund benefitsfrom economies of

ˆ200F9ggVNNr$bxoGFŠ200F9ggVNNr$bxoGF
209935 EDG 17INVESCOU.S. GOVERNMENT MONE
28-Oct-2021 14:35 ESTHTMLAN
Donnelley Financial LSWpf_rendNone
4*ESS 0C
LSWP64RS3521.10.7.0
Page 1 of 1
(This page intentionally left blank)

ˆ200F9ggVNNr$drso^Š200F9ggVNNr$drso^
209935 EDG 18INVESCOU.S. GOVERNMENT MONE
28-Oct-2021 14:36 ESTHTMLAN
Donnelley Financial LSWpf_rendNone
4*ESS 0C
LSWP64RS3521.10.7.0
Page 1 of 1
(This page intentionally left blank)

ˆ200F9ggVNNr$g4KokŠ200F9ggVNNr$g4Kok
209935 EDG 19INVESCOU.S. GOVERNMENT MONE
28-Oct-2021 14:36 ESTHTMLAN
Donnelley Financial LSWpf_rendNone
4*ESS 0C
LSWP64RS3521.10.7.0
Page 1 of 1
(This page intentionally left blank)
ˆ200F9ggVNNr$hf@o%Š200F9ggVNNr$hf@o%
209935 EDG 20INVESCOU.S. GOVERNMENT MONE
28-Oct-2021 14:36 ESTHTMLAN
Donnelley Financial LSWpf_rendNone
5*ESS 0C
LSWP64RS3521.10.7.0
dsp001dsp020
Page 1 of 1
Go paperless with eDeliveryVisit invesco.com/edelivery to enjoy the convenience and security of anytime electronic access to your investmentdocuments.With eDelivery, you can elect to have any or all of the following materials delivered straight to your inbox to download, saveand print from your own computer:
∎ Fund reports and prospectuses∎ Quarterly statements∎ Daily confirmations∎ Tax forms Invesco mailing informationSend general correspondence to Invesco Investment Services, Inc., P.O. Box 219078, Kansas City, MO 64121-9078. Important notice regarding delivery of security holder documentsTo reduce Fund expenses, only one copy of most shareholder documents may be mailed to shareholders with multipleaccounts at the same address (Householding). Mailing of your shareholder documents may be householded indefinitelyunless you instruct us otherwise. If you do not want the mailing of these documents to be combined with those for othermembers of your household, please contact Invesco Investment Services, Inc. at 800 959 4246 or contact your financialinstitution. We will begin sending you individual copies for each account within 30 days after receiving your request. Fund holdings and proxy voting informationThe Fund provides a complete list of its portfolio holdings in various monthly and quarterly regulatory filings. The Fund files acomplete schedule of portfolio holdings with the Securities and Exchange Commission (SEC) monthly on Form N-MFP. Forthe second and fourth quarters, the list appears, respectively, in the Fund’s semiannual and annual reports to shareholders.The most recent list of portfolio holdings is available at invesco.com/us. Shareholders can also look up the Fund’s Form N-MFP filings on the SEC website, sec.gov. The SEC file numbers for the Fund are shown below. A description of the policies and procedures that the Fund uses to determine how to vote proxies relating to portfoliosecurities is available without charge, upon request, from our Client Services department at 800 959 4246, or atinvesco.com/corporate/about-us/esg. The information is also available on the SEC website, sec.gov. Information regarding how the Fund voted proxies related to its portfolio securities during the most recent 12-month periodended June 30 is available at invesco.com/proxysearch. This information is also available on the SEC website, sec.gov. Invesco Advisers, Inc. is an investment adviser; it provides investment advisory services to individual and institutionalclients and does not sell securities. Invesco Distributors, Inc. is the US distributor for Invesco Ltd.’s retail mutual funds,exchange-traded funds and institutional money market funds. Both are wholly owned, indirect subsidiaries of Invesco Ltd.
SEC file number(s): 811-05686 and 033-39519 Invesco Distributors, Inc. O-GMKT-SAR-1
ˆ200FCfZfKdj4HbhoÇŠ200FCfZfKdj4Hbho˙
224563 ITEM2 1INVESCOAIS SOX & N-CSRS
27-Oct-2021 05:19 ESTHTMDTF
Donnelley Financial LSWpf_rendNone
5*ESS 0C
FWPLAN-PFRS4321.10.7.0
Page 1 of 1
ITEM 2. CODE OF ETHICS.
Not applicable for a semi-annual report.
ITEM 3. AUDIT COMMITTEE FINANCIAL EXPERT.
Not applicable.
ITEM 4. PRINCIPAL ACCOUNTANT FEES AND SERVICES.
Not applicable.
ITEM 5. AUDIT COMMITTEE OF LISTED REGISTRANTS.
Not applicable.
ITEM 6. SCHEDULE OF INVESTMENTS.
Investments in securities of unaffiliated issuers is included as part of the reports to stockholders filed under Item 1 of this Form.
ITEM 7. DISCLOSURE OF PROXY VOTING POLICIES AND PROCEDURES FOR CLOSED-END MANAGEMENT
INVESTMENT COMPANIES.
Not applicable.
ITEM 8. PORTFOLIO MANAGERS OF CLOSED-END MANAGEMENT COMPANIES.
Not applicable.
ITEM 9. PURCHASES OF EQUITY SECURITIES BY CLOSED-END MANAGEMENT INVESTMENT COMPANY AND
AFFILIATED PURCHASERS.
Not applicable.
ITEM 10. SUBMISSION OF MATTERS TO A VOTE OF SECURITY HOLDERS.
None
ˆ200FCfZfKdjRMYsoPŠ200FCfZfKdjRMYsoP
224563 ITEM2 2INVESCOAIS SOX & N-CSRS
27-Oct-2021 05:28 ESTHTMDTF
Donnelley Financial LSWmeenm0apNone
6*ESS 0C
VDI-W10-DPF-16421.7.8.0
Page 1 of 1
ITEM 11. CONTROLS AND PROCEDURES.
(a) As of October 21, 2021, an evaluation was performed under the supervision and with the participation of the officers of the
Registrant, including the PEO and PFO, to assess the effectiveness of the Registrant’s disclosure controls and procedures, as that
term is defined in Rule 30a-3(c) under the Investment Company Act of 1940 (the “Act”), as amended. Based on that evaluation, the
Registrant’s officers, including the PEO and PFO, concluded that, as of October 21, 2021, the Registrant’s disclosure controls and
procedures were reasonably designed to ensure: (1) that information required to be disclosed by the Registrant on Form N-CSR is
recorded, processed, summarized and reported within the time periods specified by the rules and forms of the Securities and
Exchange Commission; and (2) that material information relating to the Registrant is made known to the PEO and PFO as
appropriate to allow timely decisions regarding required disclosure.
(b) There have been no changes in the Registrant’s internal control over financial reporting (as defined in Rule 30a-3(d) under the Act)
that occurred during the period covered by this report that have materially affected, or are reasonably likely to materially affect, the
Registrant’s internal control over financial reporting.
ITEM 12. DISCLOSURE OF SECURITIES LENDING ACTIVITIES FOR CLOSED-END MANAGEMENT INVESTMENT
COMPANIES
Not applicable.
ITEM 13. EXHIBITS.
13(a) (1) Not applicable.
13(a) (2)
Certifications of principal executive officer and principal financial officer as required by Rule 30a-2(a) under the
Investment Company Act of 1940 and Section 302 of the Sarbanes-Oxley Act of 2002.
13(a) (3) Not applicable.
13(a) (4) Not applicable
13(b)
Certifications of principal executive officer and principal financial officer as required by Rule 30a-2(b) under the
Investment Company Act of 1940 and Section 906 of the Sarbanes-Oxley Act of 2002.
ˆ200FCfZfKdj3s9pGcŠ200FCfZfKdj3s9pGc
224563 SIG 1INVESCOAIS SOX & N-CSRS
27-Oct-2021 05:19 ESTHTMDTF
Donnelley Financial LSWpf_rendNone
4*ESS 0C
LSWP64RS3421.10.7.0
Page 1 of 1
SIGNATURES
Pursuant to the requirements of the Securities Exchange Act of 1934 and the Investment Company Act of 1940, the Registrant has duly
caused this report to be signed on its behalf by the undersigned, thereunto duly authorized.
Registrant: AIM Investment Securities Funds (Invesco Investment Securities Funds)
By: /s/ Sheri Morris
Sheri Morris
Principal Executive Officer
Date: November 4, 2021
Pursuant to the requirements of the Securities and Exchange Act of 1934 and the Investment Company Act of 1940, this report has been
signed below by the following persons on behalf of the Registrant and in the capacities and on the dates indicated.
By: /s/ Sheri Morris
Sheri Morris
Principal Executive Officer
Date: November 4, 2021
By: /s/ Adrien Deberghes
Adrien Deberghes
Principal Financial Officer
Date: November 4, 2021
ˆ200FCfZfKdj3tL%ocŠ200FCfZfKdj3tL%oc
224563 EX99_CERT 1INVESCOAIS SOX & N-CSRS
27-Oct-2021 05:19 ESTHTMDTF
Donnelley Financial LSWpf_rendNone
4*ESS 0C
LSWP64RS3621.10.7.0
Page 1 of 1
I, Sheri Morris, Principal Executive Officer, certify that:
1. I have reviewed this report on Form N-CSR of AIM Investment Securities Funds (Invesco Investment Securities Funds);
2. Based on my knowledge, this report does not contain any untrue statement of a material fact or omit to state a material fact necessary to
make the statements made, in light of the circumstances under which such statements were made, not misleading with respect to the period
covered by this report;
3. Based on my knowledge, the schedules of investments included in this report fairly present in all material respects the investments of
the registrant as of the end of the fiscal quarter for which the report is filed;
4. The registrant’s other certifying officer and I are responsible for establishing and maintaining disclosure controls and procedures (as
defined in Rule 30a-3(c) under the Investment Company Act of 1940) and internal control over financial reporting (as defined in Rule
30a-3(d) under the Investment Company Act of 1940) for the registrant and have:
(a) Designed such disclosure controls and procedures, or caused such disclosure controls and procedures to be designed under our
supervision, to ensure that material information relating to the registrant, including its consolidated subsidiaries, is made known to us
by others within those entities, particularly during the period in which this report is being prepared;
(b) Designed such internal control over financial reporting, or caused such internal control over financial reporting to be designed
under our supervision, to provide reasonable assurance regarding the reliability of financial reporting and the preparation of financial
statements for external purposes in accordance with generally accepted accounting principles;
(c) Evaluated the effectiveness of the registrant’s disclosure controls and procedures and presented in this report our conclusions
about the effectiveness of the disclosure controls and procedures, as of a date within 90 days prior to the filing date of this report,
based on such evaluation; and
(d) Disclosed in this report any change in the registrant’s internal control over financial reporting that occurred during the period
covered by this report that has materially affected, or is reasonably likely to materially affect, the registrant’s internal control over
financial reporting.
5. The registrant’s other certifying officer and I have disclosed to the registrant’s auditors and the audit committee of the registrant’s board
of trustees (or persons performing the equivalent functions):
(a) All significant deficiencies and material weaknesses in the design or operation of internal control over financial reporting which
are reasonably likely to adversely affect the registrant’s ability to record, process, summarize, and report financial information; and
(b) Any fraud, whether or not material, that involves management or other employees who have a significant role in the registrant’s
internal control over financial reporting.
Date: November 4, 2021 /s/ Sheri Morris
Sheri Morris, Principal Executive Officer
ˆ200FCfZfKdj3yiroMŠ200FCfZfKdj3yiroM
224563 EX99_CERT 2INVESCOAIS SOX & N-CSRS
27-Oct-2021 05:19 ESTHTMDTF
Donnelley Financial LSWpf_rendNone
4*ESS 0C
LSWP64RS3621.10.7.0
Page 1 of 1
I, Adrien Deberghes, Principal Financial Officer, certify that:
1. I have reviewed this report on Form N-CSR of AIM Investment Securities Funds (Invesco Investment Securities Funds);
2. Based on my knowledge, this report does not contain any untrue statement of a material fact or omit to state a material fact necessary to
make the statements made, in light of the circumstances under which such statements were made, not misleading with respect to the period
covered by this report;
3. Based on my knowledge, the schedules of investments included in this report fairly present in all material respects the investments of
the registrant as of the end of the fiscal quarter for which the report is filed;
4. The registrant’s other certifying officer and I are responsible for establishing and maintaining disclosure controls and procedures (as
defined in Rule 30a-3(c) under the Investment Company Act of 1940) and internal control over financial reporting (as defined in Rule
30a-3(d) under the Investment Company Act of 1940) for the registrant and have:
(a) Designed such disclosure controls and procedures, or caused such disclosure controls and procedures to be designed under our
supervision, to ensure that material information relating to the registrant, including its consolidated subsidiaries, is made known to us
by others within those entities, particularly during the period in which this report is being prepared;
(b) Designed such internal control over financial reporting, or caused such internal control over financial reporting to be designed
under our supervision, to provide reasonable assurance regarding the reliability of financial reporting and the preparation of financial
statements for external purposes in accordance with generally accepted accounting principles;
(c) Evaluated the effectiveness of the registrant’s disclosure controls and procedures and presented in this report our conclusions
about the effectiveness of the disclosure controls and procedures, as of a date within 90 days prior to the filing date of this report,
based on such evaluation; and
(d) Disclosed in this report any change in the registrant’s internal control over financial reporting that occurred during the period
covered by this report that has materially affected, or is reasonably likely to materially affect, the registrant’s internal control over
financial reporting.
5. The registrant’s other certifying officer and I have disclosed to the registrant’s auditors and the audit committee of the registrant’s board
of trustees (or persons performing the equivalent functions):
(a) All significant deficiencies and material weaknesses in the design or operation of internal control over financial reporting which
are reasonably likely to adversely affect the registrant’s ability to record, process, summarize, and report financial information; and
(b) Any fraud, whether or not material, that involves management or other employees who have a significant role in the registrant’s
internal control over financial reporting.
Date: November 4, 2021 /s/ Adrien Deberghes
Adrien Deberghes, Principal Financial Officer

ˆ200FCfZfKdj43NRoHŠ200FCfZfKdj43NRoH
224563 EX99_906CE 1INVESCOAIS SOX & N-CSRS
27-Oct-2021 05:19 ESTHTMDTF
Donnelley Financial LSWpf_rendNone
5*ESS 0C
FWPLAN-PFRS5021.10.7.0
Page 1 of 1
CERTIFICATION OF SHAREHOLDER REPORT
In connection with the Certified Shareholder Report of AIM Investment Securities Funds (Invesco Investment Securities Funds) (the
“Company”) on Form N-CSR for the period ended August 31, 2021, as filed with the Securities and Exchange Commission (the
“Report”), I, Sheri Morris, Principal Executive Officer of the Company, certify, pursuant to 18 U.S.C. section 1350, as adopted pursuant to
section 906 of the Sarbanes-Oxley Act of 2002, that:
(1) The Report fully complies with the requirements of Section 13(a) or 15(d) of the Securities Exchange Act of 1934; and
(2) The information contained in the Report fairly presents, in all material respects, the financial condition and results of operations
of the Company.
Date: November 4, 2021 /s/ Sheri Morris
Sheri Morris, Principal Executive Officer

ˆ200FCfZfKdj4QT4oŠ200FCfZfKdj4QT4o´
224563 EX99_906CE 2INVESCOAIS SOX & N-CSRS
27-Oct-2021 05:19 ESTHTMDTF
Donnelley Financial LSWpf_rendNone
5*ESS 0C
FWPLAN-PFRS5021.10.7.0
Page 1 of 1
CERTIFICATION OF SHAREHOLDER REPORT
In connection with the Certified Shareholder Report of AIM Investment Securities Funds (Invesco Investment Securities Funds) (the
“Company”) on Form N-CSR for the period ended August 31, 2021, as filed with the Securities and Exchange Commission (the
“Report”), I, Adrien Deberghes, Principal Financial Officer of the Company, certify, pursuant to 18 U.S.C. section 1350, as adopted
pursuant to section 906 of the Sarbanes-Oxley Act of 2002, that:
(1) The Report fully complies with the requirements of Section 13(a) or 15(d) of the Securities Exchange Act of 1934; and
(2) The information contained in the Report fairly presents, in all material respects, the financial condition and results of operations
of the Company.
Date: November 4, 2021 /s/ Adrien Deberghes
Adrien Deberghes, Principal Financial Officer
Related Documents