Distribution System Phase Attribute Measurements Using The Origo PhaseID System 1 © Origo Corporation 2004 www.origocorp.com Technology Made Simple Distribution System Phase Attribute Measurements Using the Origo PhaseID System Introduction The Origo PhaseID System measures phase in a power distribution system by using a GPS timing signal to simultaneously measure voltage phase at a base and field location. By comparing the unknown phase at the field location to the known phase at the base location, the unknown field phase attribute can be deter- mined. This white paper explains how we would expect voltage phase to vary at different points in the distribution system, as it passes though various transmission and distribution transformers and power lines. Potential sources of phase measurement error, and their magnitude, are discussed. Phase Shift Through Ideal Transformers Delta-Grounded Wye A popular substation transformer connection is the delta-grounded wye illustrated in figure 1. By conven- tion, capital letters (A, B, C, N) refer to the source side and lower case letters (a, b, c, n) refer to the load side. Delta-wye and wye-delta transformers are also connected in the standard 30 degree connection in which the source voltage leads the load voltage by 30 degrees. The voltage phase vector rotation is as- sumed to be CCW. FIGURE 1 DELTA - GROUNDED WYE STEP DOWN ADDITIVE + CA - + AB - + BC - + an - + bn - + cn - H1 - A H2 - B H3 - C X1 - a X2 - b X3 - c X0 - n

Welcome message from author
This document is posted to help you gain knowledge. Please leave a comment to let me know what you think about it! Share it to your friends and learn new things together.
Transcript
Distribution System Phase Attribute Measurements Using The Origo PhaseID System 1
© Origo Corporation 2004 www.origocorp.com Technology Made Simple
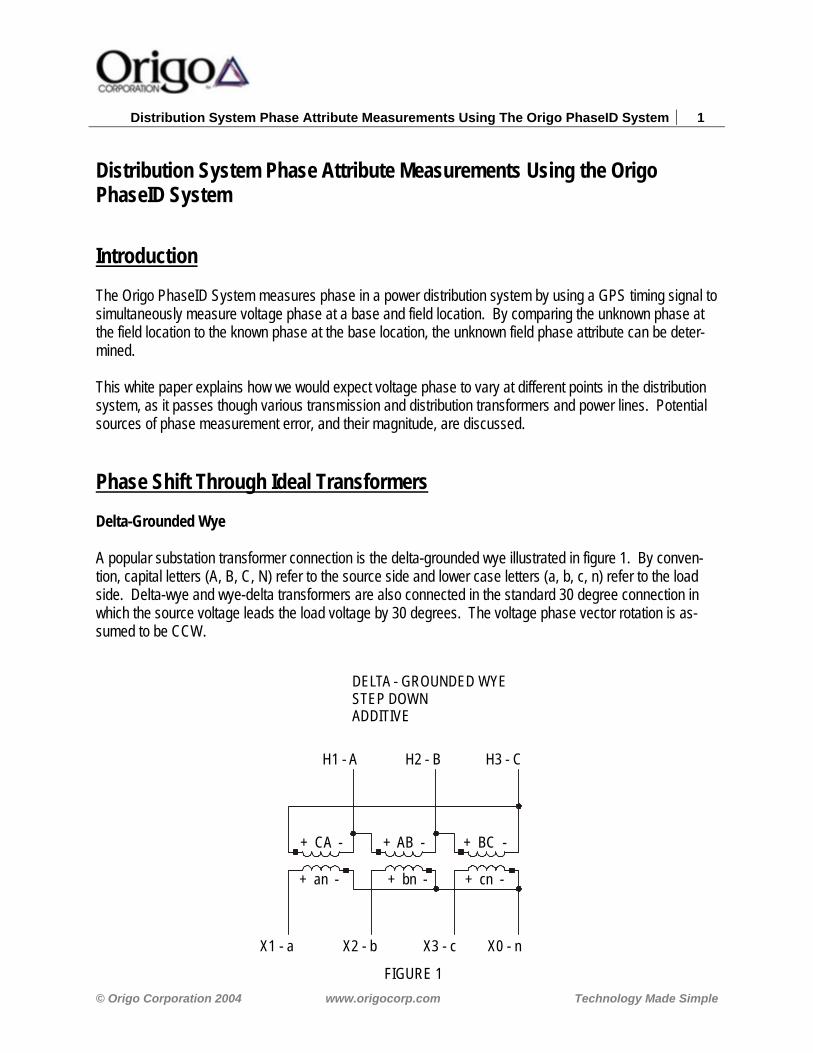
Distribution System Phase Attribute Measurements Using the Origo PhaseID System Introduction The Origo PhaseID System measures phase in a power distribution system by using a GPS timing signal to simultaneously measure voltage phase at a base and field location. By comparing the unknown phase at the field location to the known phase at the base location, the unknown field phase attribute can be deter-mined. This white paper explains how we would expect voltage phase to vary at different points in the distribution system, as it passes though various transmission and distribution transformers and power lines. Potential sources of phase measurement error, and their magnitude, are discussed. Phase Shift Through Ideal Transformers Delta-Grounded Wye A popular substation transformer connection is the delta-grounded wye illustrated in figure 1. By conven-tion, capital letters (A, B, C, N) refer to the source side and lower case letters (a, b, c, n) refer to the load side. Delta-wye and wye-delta transformers are also connected in the standard 30 degree connection in which the source voltage leads the load voltage by 30 degrees. The voltage phase vector rotation is as-sumed to be CCW.
FIGURE 1
DELTA - GROUNDED WYESTEP DOWNADDITIVE
+ CA - + AB - + BC -
+ an - + bn - + cn -
H1 - A H2 - B H3 - C
X1 - a X2 - b X3 - c X0 - n
© Origo Corporation 2004 Technology Made Simple 2
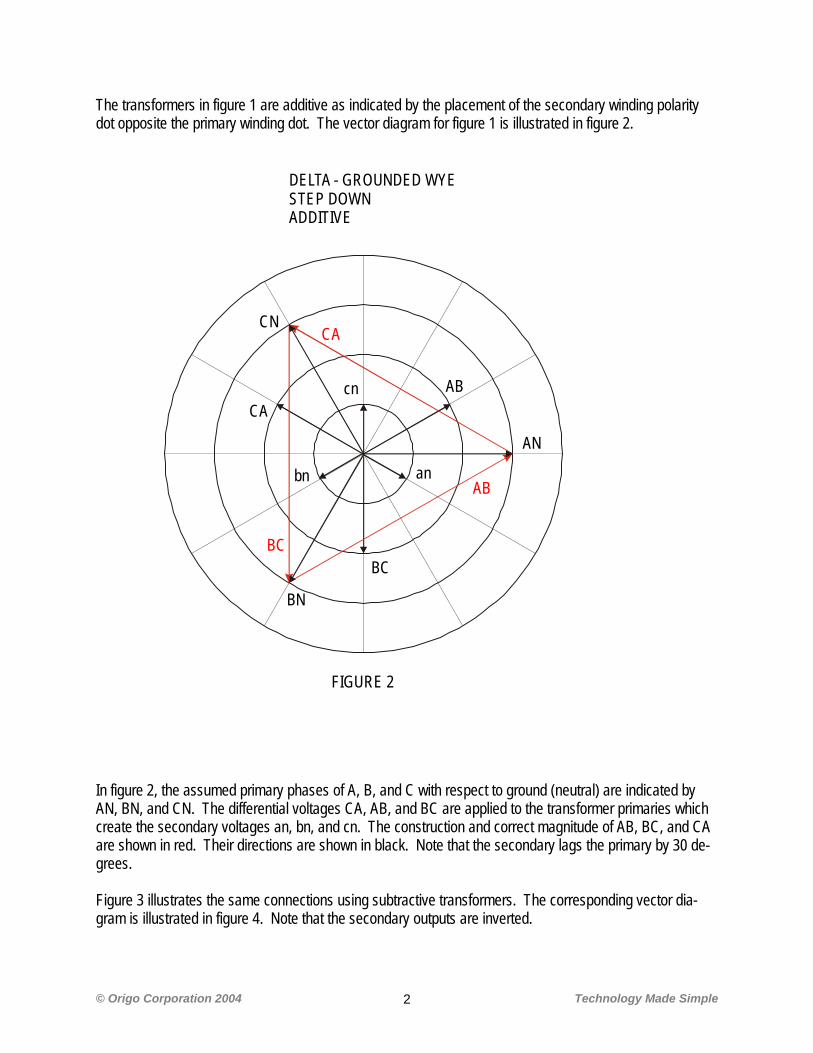
The transformers in figure 1 are additive as indicated by the placement of the secondary winding polarity dot opposite the primary winding dot. The vector diagram for figure 1 is illustrated in figure 2.
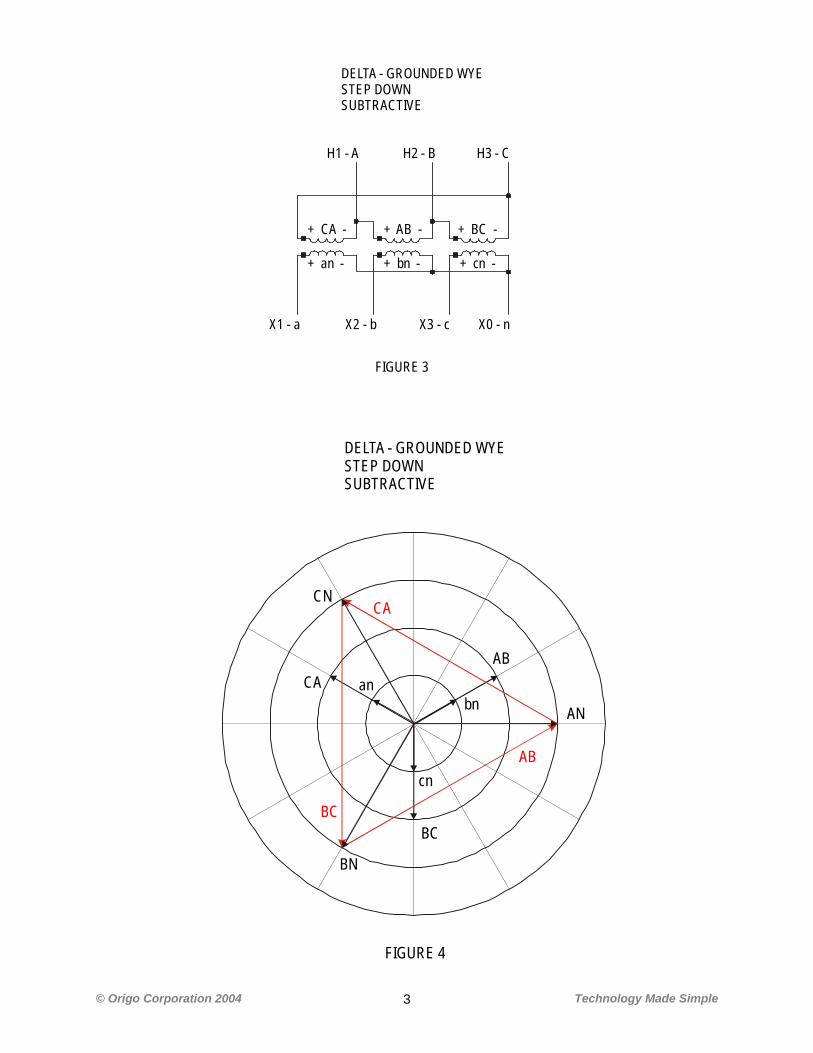
In figure 2, the assumed primary phases of A, B, and C with respect to ground (neutral) are indicated by AN, BN, and CN. The differential voltages CA, AB, and BC are applied to the transformer primaries which create the secondary voltages an, bn, and cn. The construction and correct magnitude of AB, BC, and CA are shown in red. Their directions are shown in black. Note that the secondary lags the primary by 30 de-grees. Figure 3 illustrates the same connections using subtractive transformers. The corresponding vector dia-gram is illustrated in figure 4. Note that the secondary outputs are inverted.
AN
BN
CN
AB
BC
CAcn
bn anAB
CA
BC
DELTA - GROUNDED WYESTEP DOWNADDITIVE
FIGURE 2
© Origo Corporation 2004 Technology Made Simple 3
DELTA - GROUNDED WYESTEP DOWNSUBTRACTIVE
H1 - A H2 - B H3 - C
X1 - a X2 - b X3 - c X0 - n
+ CA - + AB - + BC -
+ an - + bn - + cn -
FIGURE 3
AN
BN
CN
AB
BC
CA
cn
bnan
AB
CA
BC
DELTA - GROUNDED WYESTEP DOWNSUBTRACTIVE
FIGURE 4
© Origo Corporation 2004 Technology Made Simple 4
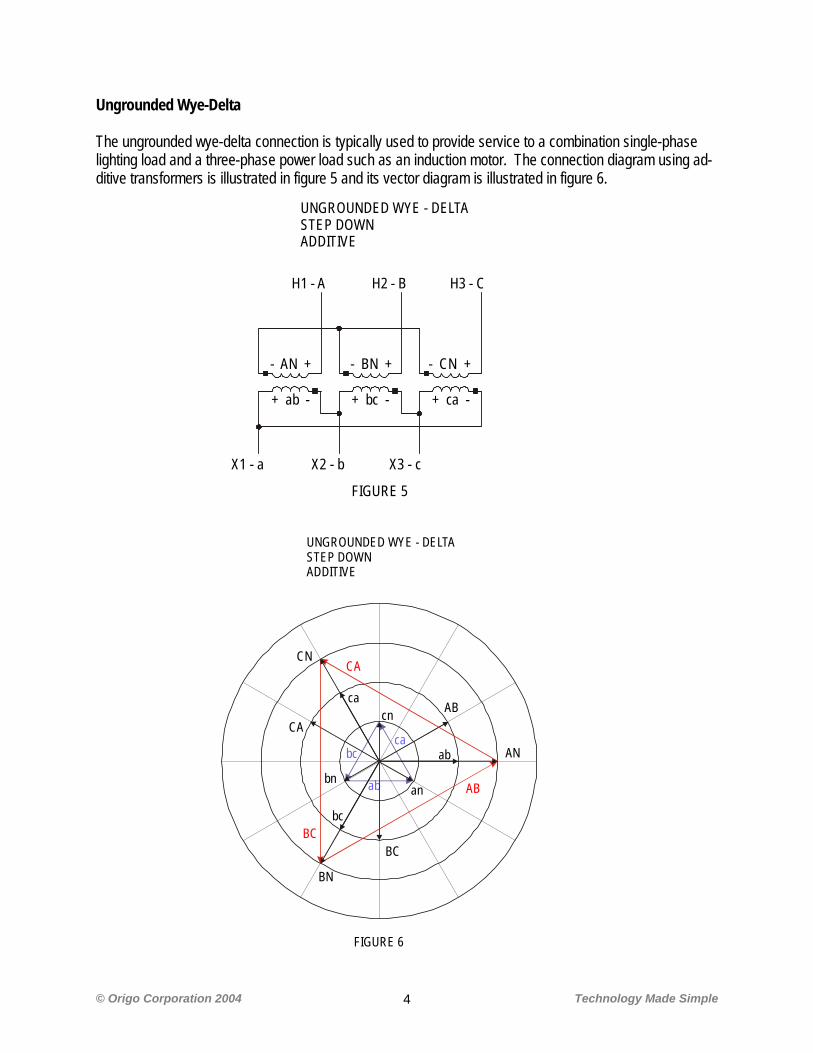
Ungrounded Wye-Delta The ungrounded wye-delta connection is typically used to provide service to a combination single-phase lighting load and a three-phase power load such as an induction motor. The connection diagram using ad-ditive transformers is illustrated in figure 5 and its vector diagram is illustrated in figure 6.
FIGURE 5
UNGROUNDED WYE - DELTASTEP DOWNADDITIVE
- AN + - BN + - CN +
+ ab - + bc - + ca -
H1 - A H2 - B H3 - C
X1 - a X2 - b X3 - c
ab
cabc AN
BN
CN
AB
BC
CAcn
bnan AB
CA
BC
FIGURE 6
UNGROUNDED WYE - DELTASTEP DOWNADDITIVE
ab
bc
ca
© Origo Corporation 2004 Technology Made Simple 5
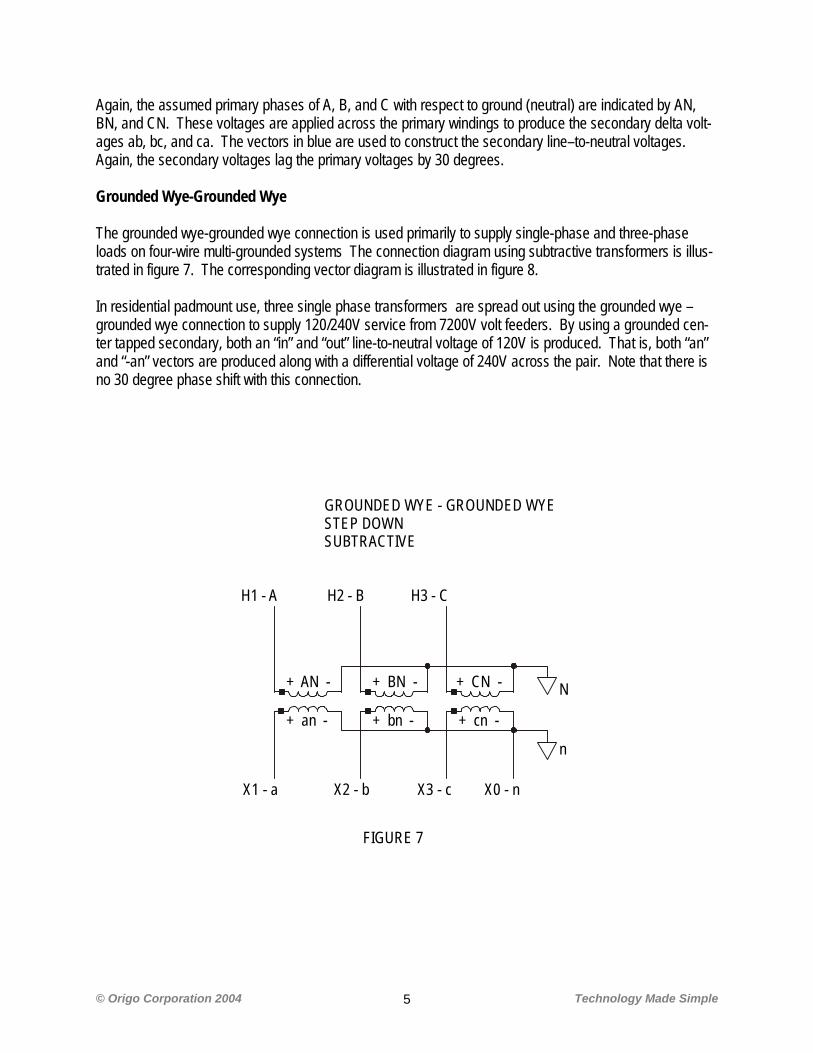
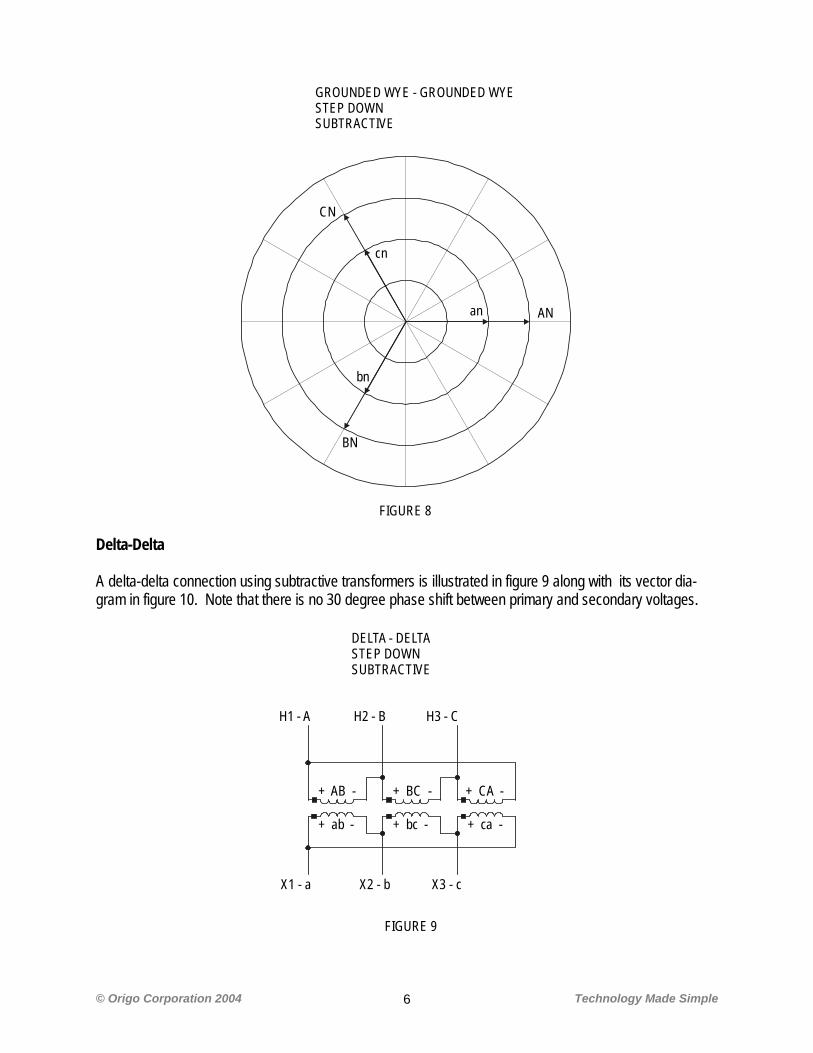
Again, the assumed primary phases of A, B, and C with respect to ground (neutral) are indicated by AN, BN, and CN. These voltages are applied across the primary windings to produce the secondary delta volt-ages ab, bc, and ca. The vectors in blue are used to construct the secondary line–to-neutral voltages. Again, the secondary voltages lag the primary voltages by 30 degrees. Grounded Wye-Grounded Wye The grounded wye-grounded wye connection is used primarily to supply single-phase and three-phase loads on four-wire multi-grounded systems The connection diagram using subtractive transformers is illus-trated in figure 7. The corresponding vector diagram is illustrated in figure 8. In residential padmount use, three single phase transformers are spread out using the grounded wye – grounded wye connection to supply 120/240V service from 7200V volt feeders. By using a grounded cen-ter tapped secondary, both an “in” and “out” line-to-neutral voltage of 120V is produced. That is, both “an” and “-an” vectors are produced along with a differential voltage of 240V across the pair. Note that there is no 30 degree phase shift with this connection.
GROUNDED WYE - GROUNDED WYESTEP DOWNSUBTRACTIVE
H1 - A H2 - B H3 - C
X1 - a X2 - b X3 - c X0 - n
+ AN - + BN - + CN -
+ an - + bn - + cn -
FIGURE 7
N
n
© Origo Corporation 2004 Technology Made Simple 6
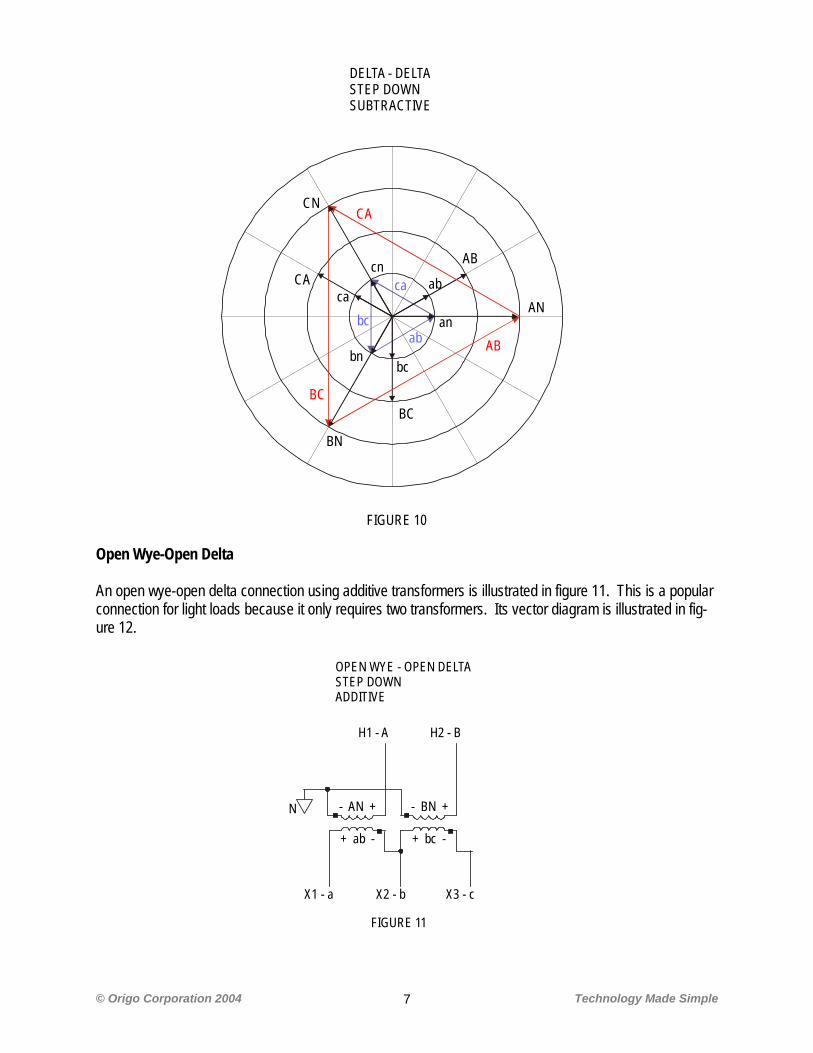
Delta-Delta A delta-delta connection using subtractive transformers is illustrated in figure 9 along with its vector dia-gram in figure 10. Note that there is no 30 degree phase shift between primary and secondary voltages.
AN
BN
CN
cn
bn
an
FIGURE 8
GROUNDED WYE - GROUNDED WYESTEP DOWNSUBTRACTIVE
DELTA - DELTASTEP DOWNSUBTRACTIVE
H1 - A H2 - B H3 - C
X1 - a X2 - b X3 - c
+ AB - + BC - + CA -
+ ab - + bc - + ca -
FIGURE 9
© Origo Corporation 2004 Technology Made Simple 7
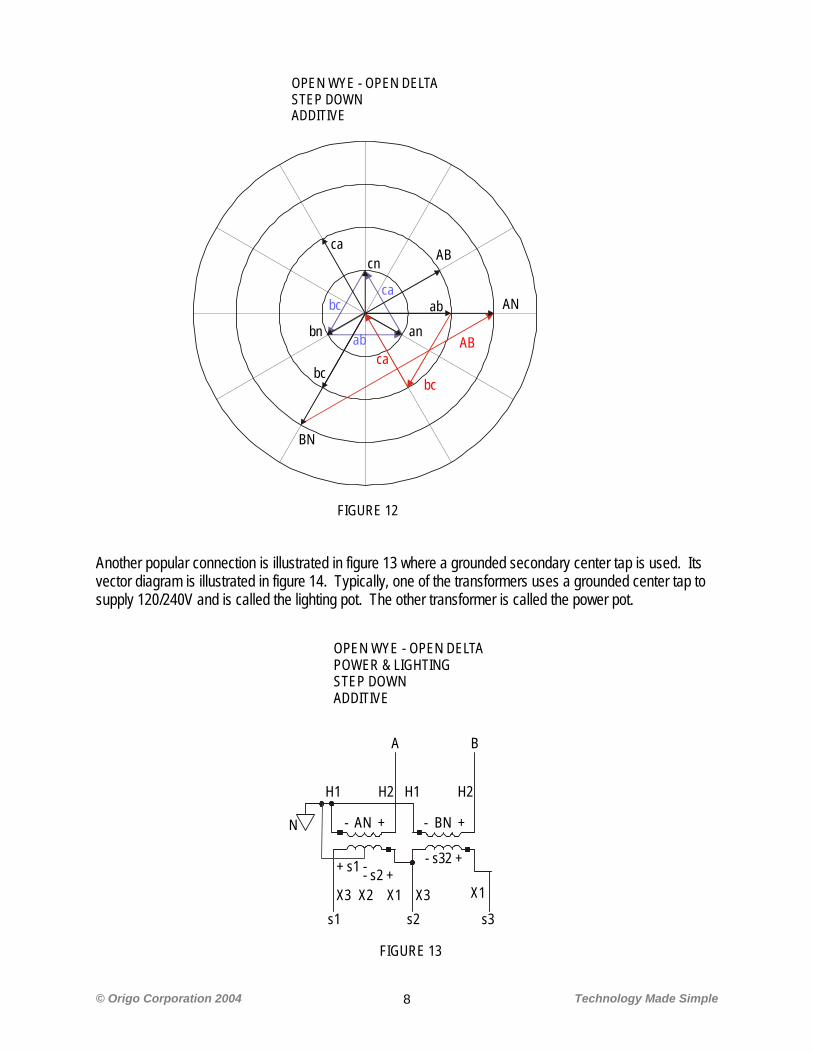
Open Wye-Open Delta An open wye-open delta connection using additive transformers is illustrated in figure 11. This is a popular connection for light loads because it only requires two transformers. Its vector diagram is illustrated in fig-ure 12.
AN
BN
CN
AB
BC
CA
bc
abca
AB
CA
BC
FIGURE 10
DELTA - DELTASTEP DOWNSUBTRACTIVE
an
bn
cn
abbc
ca
FIGURE 11
OPEN WYE - OPEN DELTASTEP DOWNADDITIVE
- AN + - BN +
+ ab - + bc -
H1 - A H2 - B
X1 - a X2 - b X3 - c
N
© Origo Corporation 2004 Technology Made Simple 8
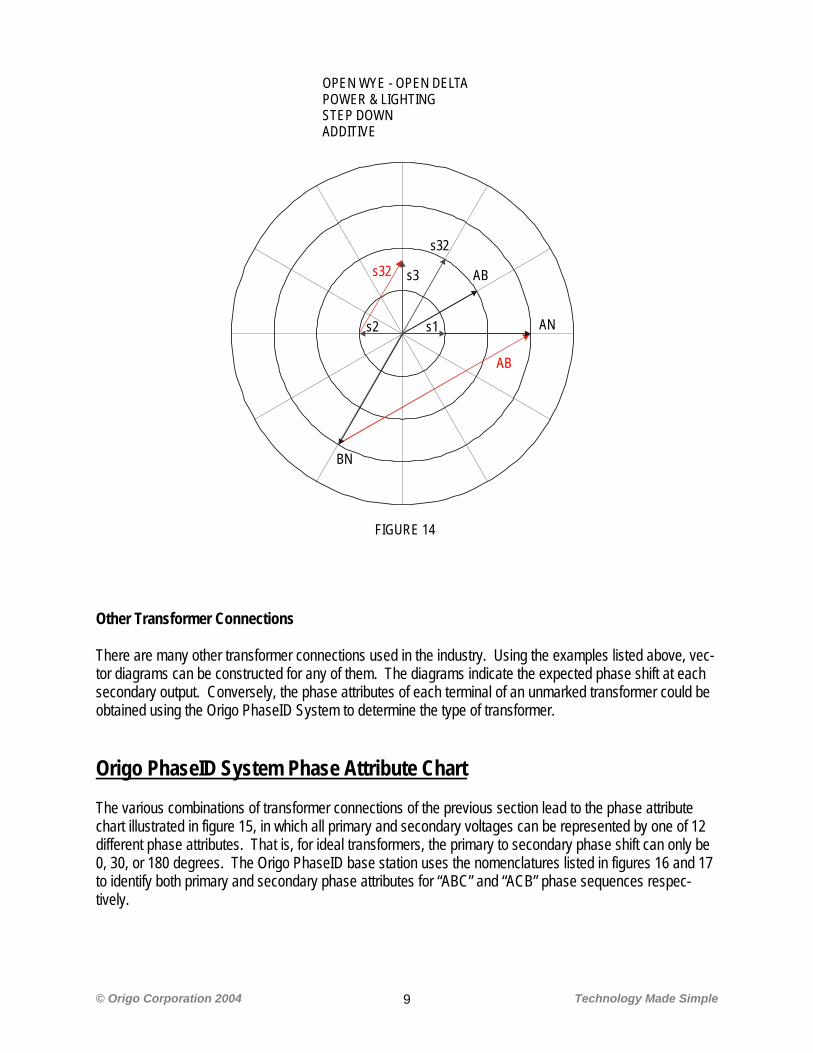
Another popular connection is illustrated in figure 13 where a grounded secondary center tap is used. Its vector diagram is illustrated in figure 14. Typically, one of the transformers uses a grounded center tap to supply 120/240V and is called the lighting pot. The other transformer is called the power pot.
AN
BN
ABcn
bn anAB
FIGURE 12
ab
bc
ca
OPEN WYE - OPEN DELTASTEP DOWNADDITIVE
caab
cabc
bc
FIGURE 13
OPEN WYE - OPEN DELTAPOWER & LIGHTINGSTEP DOWNADDITIVE
- AN + - BN +
- s32 +
A B
s1 s2 s3
N
+ s1 -- s2 +
H1 H2 H1 H2
X1X2X3 X1X3
© Origo Corporation 2004 Technology Made Simple 9
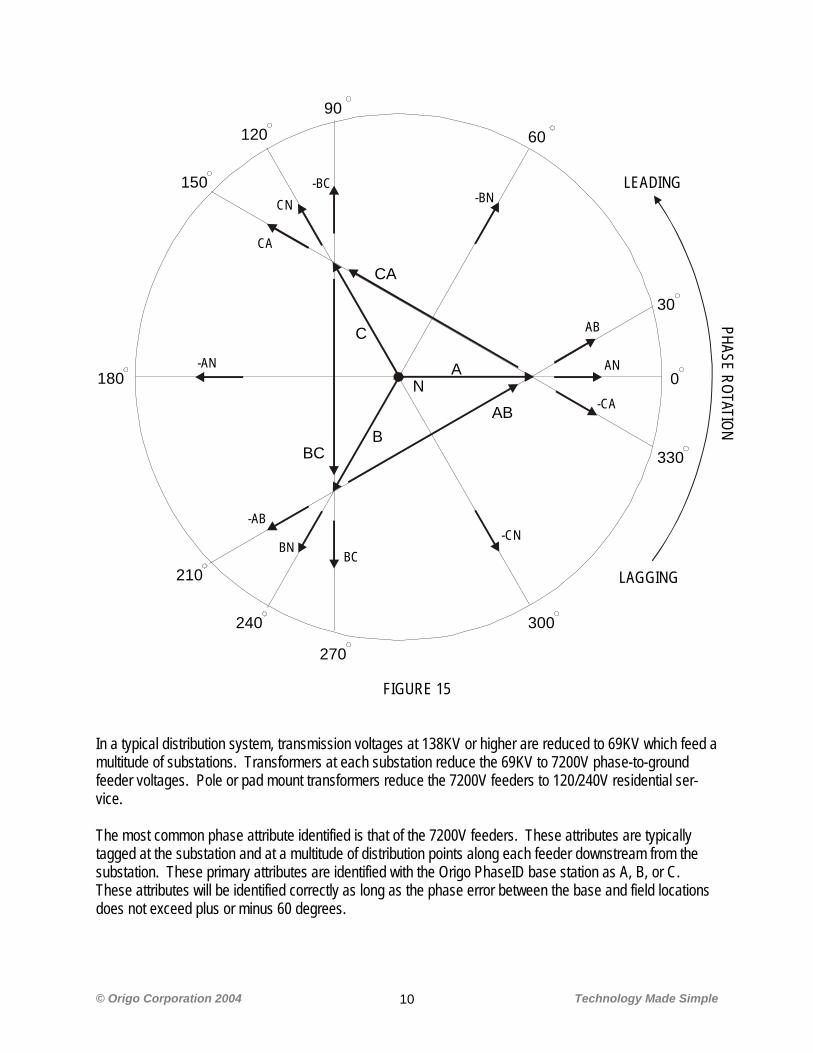
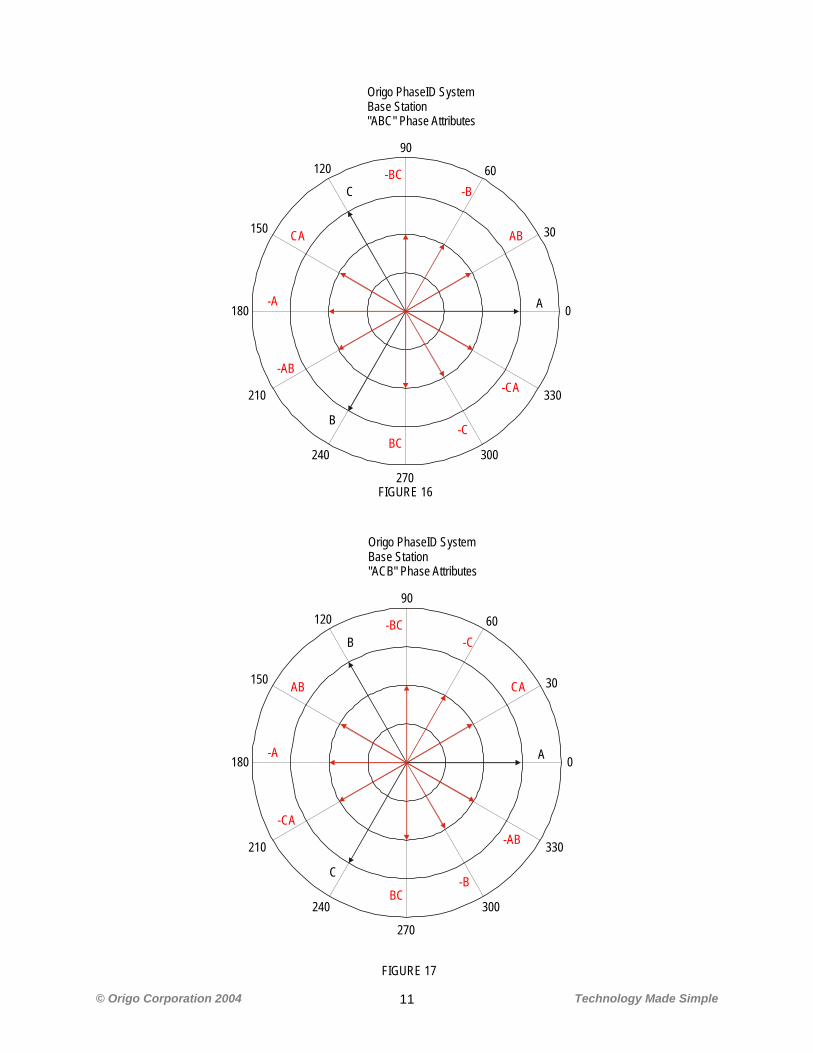
Other Transformer Connections There are many other transformer connections used in the industry. Using the examples listed above, vec-tor diagrams can be constructed for any of them. The diagrams indicate the expected phase shift at each secondary output. Conversely, the phase attributes of each terminal of an unmarked transformer could be obtained using the Origo PhaseID System to determine the type of transformer. Origo PhaseID System Phase Attribute Chart The various combinations of transformer connections of the previous section lead to the phase attribute chart illustrated in figure 15, in which all primary and secondary voltages can be represented by one of 12 different phase attributes. That is, for ideal transformers, the primary to secondary phase shift can only be 0, 30, or 180 degrees. The Origo PhaseID base station uses the nomenclatures listed in figures 16 and 17 to identify both primary and secondary phase attributes for “ABC” and “ACB” phase sequences respec-tively.
AN
BN
AB
AB
FIGURE 14
s32
OPEN WYE - OPEN DELTAPOWER & LIGHTINGSTEP DOWNADDITIVE
s2 s1
s32
s3
© Origo Corporation 2004 Technology Made Simple 10
FIGURE 15 In a typical distribution system, transmission voltages at 138KV or higher are reduced to 69KV which feed a multitude of substations. Transformers at each substation reduce the 69KV to 7200V phase-to-ground feeder voltages. Pole or pad mount transformers reduce the 7200V feeders to 120/240V residential ser-vice. The most common phase attribute identified is that of the 7200V feeders. These attributes are typically tagged at the substation and at a multitude of distribution points along each feeder downstream from the substation. These primary attributes are identified with the Origo PhaseID base station as A, B, or C. These attributes will be identified correctly as long as the phase error between the base and field locations does not exceed plus or minus 60 degrees.
330
300
270
240
210
180
150
90
60
30
0
120
A
B
C
NAB
BC
CA
AN
BN
-AN
-BC
BC
-CA
CN
AB
-AB
CA
-CN
-BN
PHASE ROTATION
LEADING
LAGGING
© Origo Corporation 2004 Technology Made Simple 11
FIGURE 17
Origo PhaseID SystemBase Station "ACB" Phase Attributes
0
30
60
90120
150
180
210
240
270
300
330
A
CA
-C-BC
B
AB
-A
-CA
C
BC-B
-AB
FIGURE 16
Origo PhaseID SystemBase Station "ABC" Phase Attributes
0
30
60
90120
150
180
210
240
270
300
330
A
AB
-B-BC
C
CA
-A
-AB
B
BC-C
-CA
© Origo Corporation 2004 Technology Made Simple 12
Many times it is faster and more convenient to identify primary feeder attributes by measuring secondary voltages such as at standard 120V outlets. If the residential transformer is connected wye-wye, the possi-ble measured phase attributes are A, -A, B, -B, C, or –C. However, if the residential transformer is con-nected delta-wye, then the possible measured attributes are AB, -AB, BC, -BC, CA, or –CA. That is, these delta secondary attributes identify which of the two primary feeders are supplying power to this particular residential customer. This information is important in feeder load balancing operations where load must be moved from heavily loaded phases to lightly loaded phases. For measuring secondary phase attributes, the Origo PhaseID base station identifies the phase attribute as being one of the 12 possible attributes. The secondary attribute will be identified correctly as long as the phase error between the base and field locations does not exceed plus or minus 15 degrees. The Origo base station reference phase is obtained by plugging the base station unit into any standard 120V outlet. Typically, the base station is placed at a utility dispatch facility which could be serviced by ei-ther a wye or delta transformer. Service type is not a problem with the Origo PhaseID System because the base station reference phase attribute can be selected as any one of the 12 possible phase attributes. Setting up the Origo base station is very simple. The procedure is to plug the coupler into a convenient outlet and initially select the base attribute as A and the phase sequence as ABC. The field probe is next taken to a source of primary A voltage, such as at a substation, and a reading obtained. When this reading is entered into the base station, the reading will be identified as being one of the 12 possible phase attrib-utes. If the reading is not identified as A, a chart directs the base station operator to set the base attribute to a different attribute. That is, the attribute of the wall outlet is identified using a primary A attribute at the base station and taking a phase reading at a known A phase attribute field location. A source of primary B or C voltage is then measured. If the base station identifies B as C or C as B, then the phase sequence ACB is selected in the base station setup screen. Once the base attribute and sequence is selected correctly, it does not have to be changed unless the phase servicing the base station facility is changed. Substation transformers are typically connected delta-wye. If the base station has been set up for the 7200V feeders, and phase A of a 69KV primary feeding the substation is measured, the base station will identify it as phase A with a phase error of 30 degrees since the 69KV leads the 7200V feeder voltages by 30 degrees. A better procedure is to either set the primary phase offset (to be explained later) to 30 de-grees or to set the base station to the next attribute CCW on the phase chart. That is, if the base is cur-rently on phase B, move it to BC. Then, 69KV primaries will be identified as A, B, or C with no phase error. The Origo base station program makes it easy to set up “apples-to apples” phase measurements simply by using various configuration files. For example, the normal feeder and secondary configuration file could be named 7200V_feeder.pid. The 69KV primaries could be named 69KV_primary.pid. The 135KV primaries could be named 135KV_primary, etc. In this way, no interpretation by the base station operator is required to account for the 30 degrees phase shift encountered in delta-wye or wye-delta transformations. It also allows different phase offsets (also explained later) to be used for each different class of voltages being measured.
© Origo Corporation 2004 Technology Made Simple 13
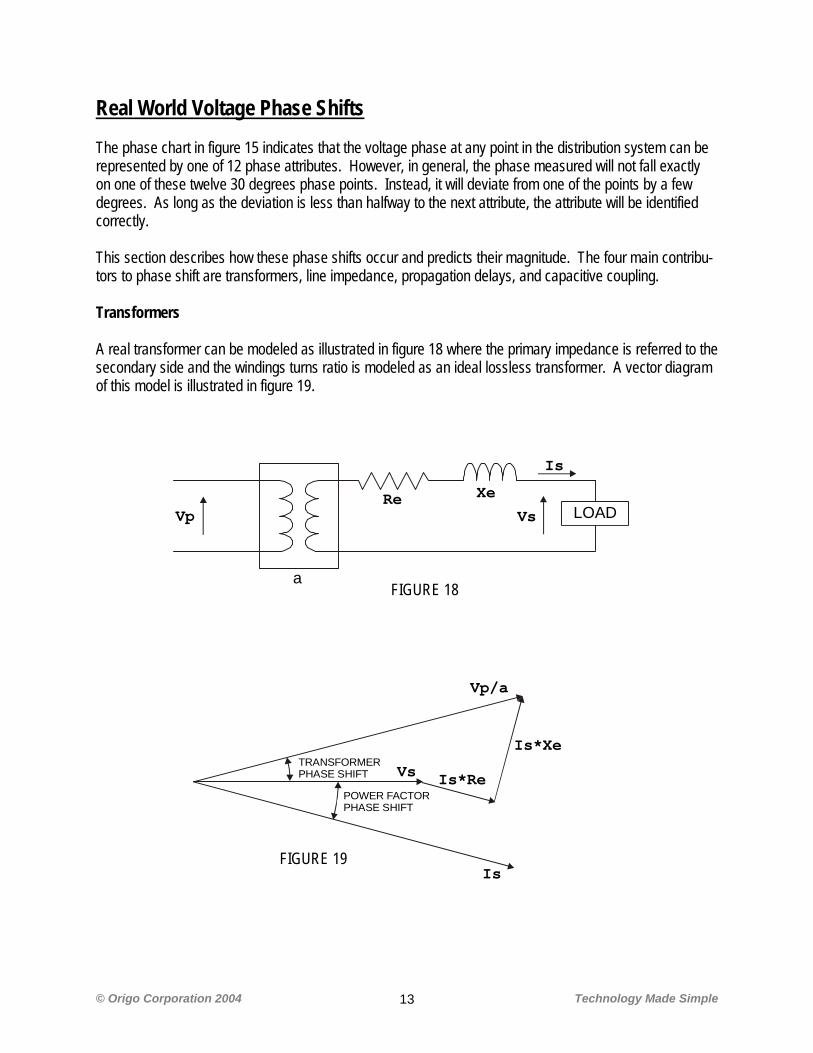
Real World Voltage Phase Shifts The phase chart in figure 15 indicates that the voltage phase at any point in the distribution system can be represented by one of 12 phase attributes. However, in general, the phase measured will not fall exactly on one of these twelve 30 degrees phase points. Instead, it will deviate from one of the points by a few degrees. As long as the deviation is less than halfway to the next attribute, the attribute will be identified correctly. This section describes how these phase shifts occur and predicts their magnitude. The four main contribu-tors to phase shift are transformers, line impedance, propagation delays, and capacitive coupling. Transformers A real transformer can be modeled as illustrated in figure 18 where the primary impedance is referred to the secondary side and the windings turns ratio is modeled as an ideal lossless transformer. A vector diagram of this model is illustrated in figure 19.
a
LOAD
Is
VsVpXeRe
FIGURE 18
Is
Vs
Vp/a
Is*Xe
Is*RePOWER FACTORPHASE SHIFT
TRANSFORMERPHASE SHIFT
FIGURE 19
© Origo Corporation 2004 Technology Made Simple 14
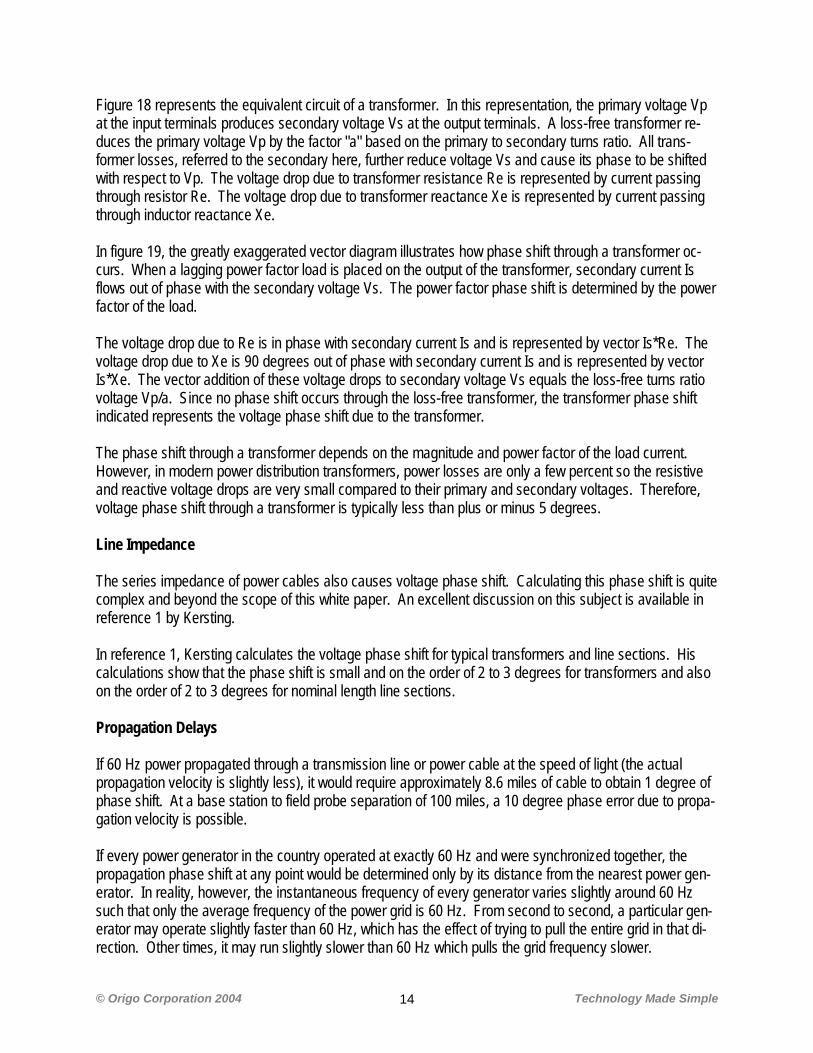
Figure 18 represents the equivalent circuit of a transformer. In this representation, the primary voltage Vp at the input terminals produces secondary voltage Vs at the output terminals. A loss-free transformer re-duces the primary voltage Vp by the factor "a" based on the primary to secondary turns ratio. All trans-former losses, referred to the secondary here, further reduce voltage Vs and cause its phase to be shifted with respect to Vp. The voltage drop due to transformer resistance Re is represented by current passing through resistor Re. The voltage drop due to transformer reactance Xe is represented by current passing through inductor reactance Xe. In figure 19, the greatly exaggerated vector diagram illustrates how phase shift through a transformer oc-curs. When a lagging power factor load is placed on the output of the transformer, secondary current Is flows out of phase with the secondary voltage Vs. The power factor phase shift is determined by the power factor of the load. The voltage drop due to Re is in phase with secondary current Is and is represented by vector Is*Re. The voltage drop due to Xe is 90 degrees out of phase with secondary current Is and is represented by vector Is*Xe. The vector addition of these voltage drops to secondary voltage Vs equals the loss-free turns ratio voltage Vp/a. Since no phase shift occurs through the loss-free transformer, the transformer phase shift indicated represents the voltage phase shift due to the transformer. The phase shift through a transformer depends on the magnitude and power factor of the load current. However, in modern power distribution transformers, power losses are only a few percent so the resistive and reactive voltage drops are very small compared to their primary and secondary voltages. Therefore, voltage phase shift through a transformer is typically less than plus or minus 5 degrees. Line Impedance The series impedance of power cables also causes voltage phase shift. Calculating this phase shift is quite complex and beyond the scope of this white paper. An excellent discussion on this subject is available in reference 1 by Kersting. In reference 1, Kersting calculates the voltage phase shift for typical transformers and line sections. His calculations show that the phase shift is small and on the order of 2 to 3 degrees for transformers and also on the order of 2 to 3 degrees for nominal length line sections. Propagation Delays If 60 Hz power propagated through a transmission line or power cable at the speed of light (the actual propagation velocity is slightly less), it would require approximately 8.6 miles of cable to obtain 1 degree of phase shift. At a base station to field probe separation of 100 miles, a 10 degree phase error due to propa-gation velocity is possible. If every power generator in the country operated at exactly 60 Hz and were synchronized together, the propagation phase shift at any point would be determined only by its distance from the nearest power gen-erator. In reality, however, the instantaneous frequency of every generator varies slightly around 60 Hz such that only the average frequency of the power grid is 60 Hz. From second to second, a particular gen-erator may operate slightly faster than 60 Hz, which has the effect of trying to pull the entire grid in that di-rection. Other times, it may run slightly slower than 60 Hz which pulls the grid frequency slower.
© Origo Corporation 2004 Technology Made Simple 15
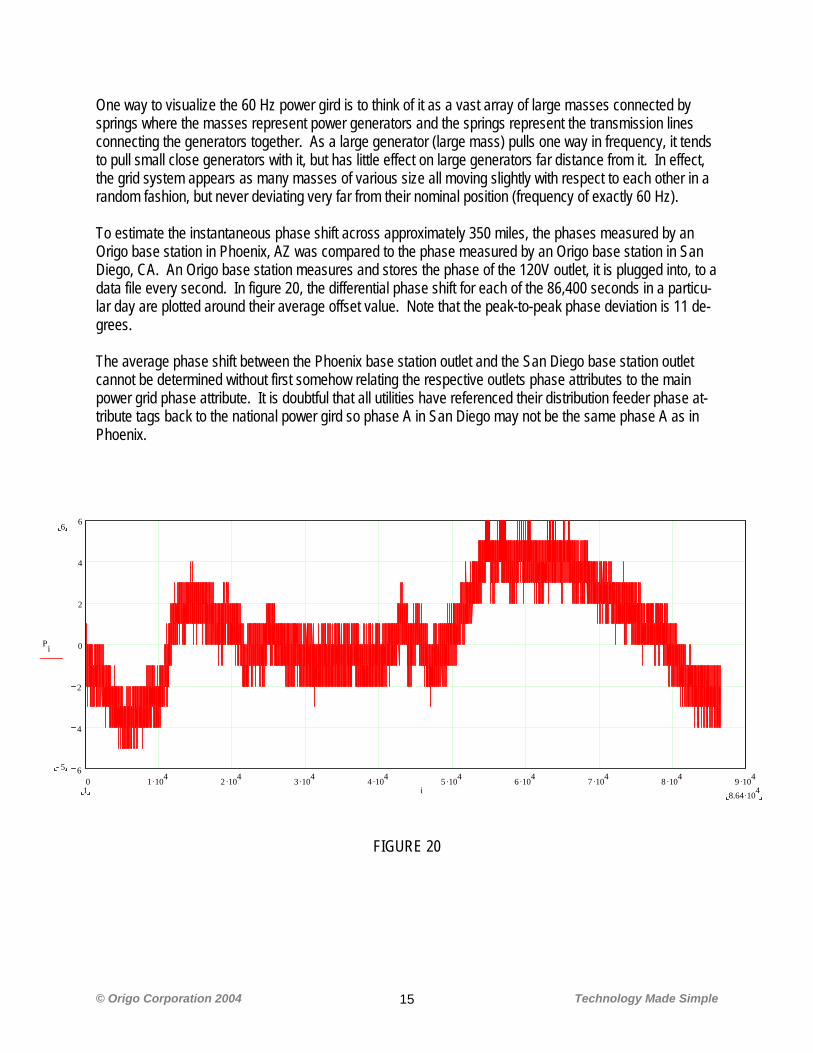
One way to visualize the 60 Hz power gird is to think of it as a vast array of large masses connected by springs where the masses represent power generators and the springs represent the transmission lines connecting the generators together. As a large generator (large mass) pulls one way in frequency, it tends to pull small close generators with it, but has little effect on large generators far distance from it. In effect, the grid system appears as many masses of various size all moving slightly with respect to each other in a random fashion, but never deviating very far from their nominal position (frequency of exactly 60 Hz). To estimate the instantaneous phase shift across approximately 350 miles, the phases measured by an Origo base station in Phoenix, AZ was compared to the phase measured by an Origo base station in San Diego, CA. An Origo base station measures and stores the phase of the 120V outlet, it is plugged into, to a data file every second. In figure 20, the differential phase shift for each of the 86,400 seconds in a particu-lar day are plotted around their average offset value. Note that the peak-to-peak phase deviation is 11 de-grees. The average phase shift between the Phoenix base station outlet and the San Diego base station outlet cannot be determined without first somehow relating the respective outlets phase attributes to the main power grid phase attribute. It is doubtful that all utilities have referenced their distribution feeder phase at-tribute tags back to the national power gird so phase A in San Diego may not be the same phase A as in Phoenix.
FIGURE 20
0 1 .104 2 .104 3 .104 4 .104 5 .104 6 .104 7 .104 8 .104 9 .1046
4
2
0
2
4
66
5
Pi
8.64 104.1 i
© Origo Corporation 2004 Technology Made Simple 16
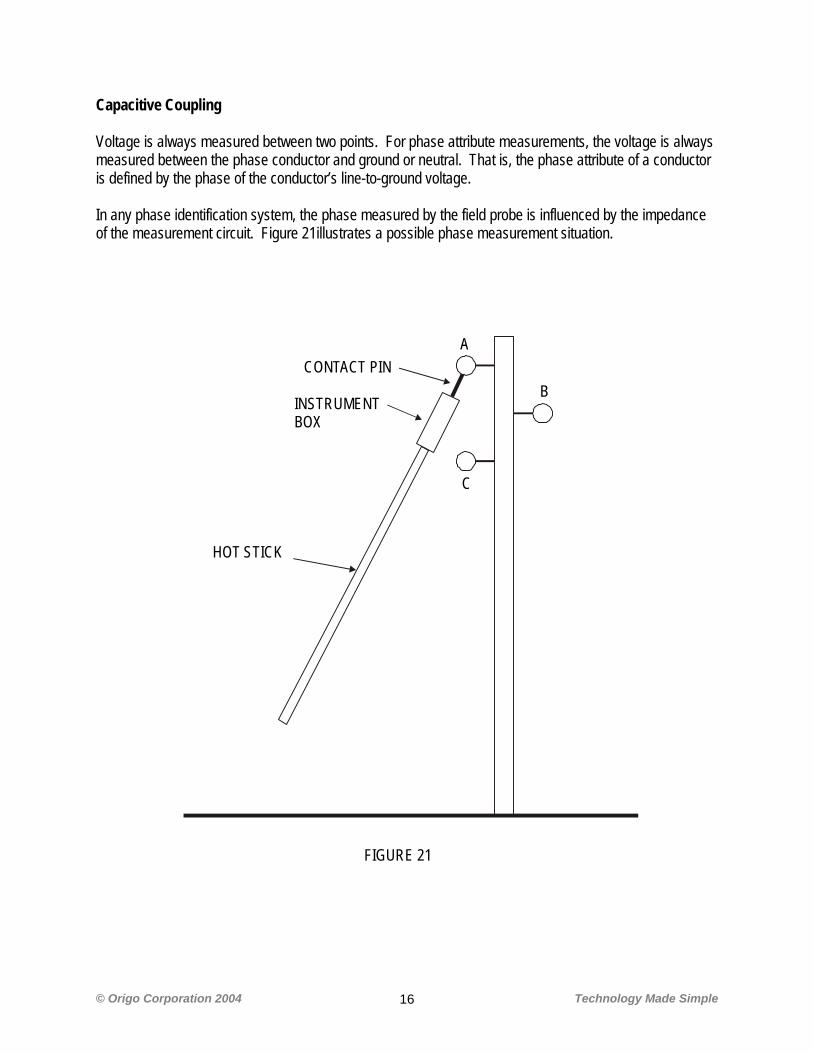
Capacitive Coupling Voltage is always measured between two points. For phase attribute measurements, the voltage is always measured between the phase conductor and ground or neutral. That is, the phase attribute of a conductor is defined by the phase of the conductor’s line-to-ground voltage. In any phase identification system, the phase measured by the field probe is influenced by the impedance of the measurement circuit. Figure 21illustrates a possible phase measurement situation.
A
B
C
HOT STICK
INSTRUMENTBOX
CONTACT PIN
FIGURE 21
© Origo Corporation 2004 Technology Made Simple 17
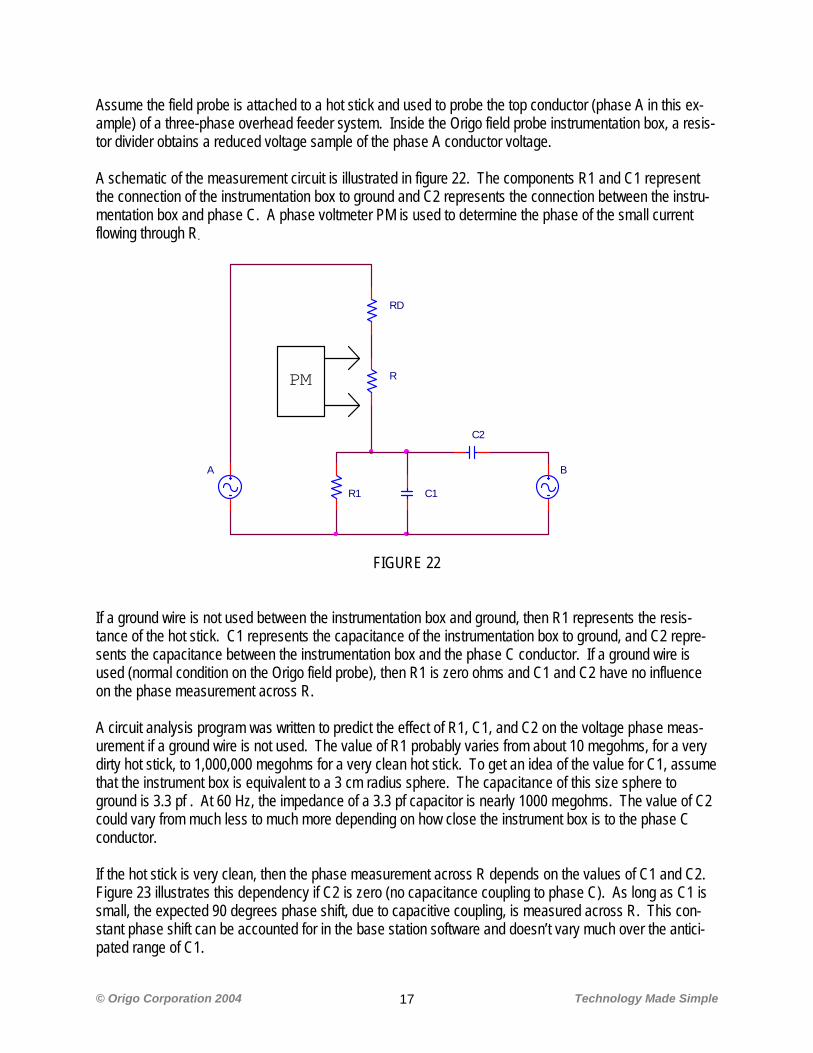
Assume the field probe is attached to a hot stick and used to probe the top conductor (phase A in this ex-ample) of a three-phase overhead feeder system. Inside the Origo field probe instrumentation box, a resis-tor divider obtains a reduced voltage sample of the phase A conductor voltage. A schematic of the measurement circuit is illustrated in figure 22. The components R1 and C1 represent the connection of the instrumentation box to ground and C2 represents the connection between the instru-mentation box and phase C. A phase voltmeter PM is used to determine the phase of the small current flowing through R.
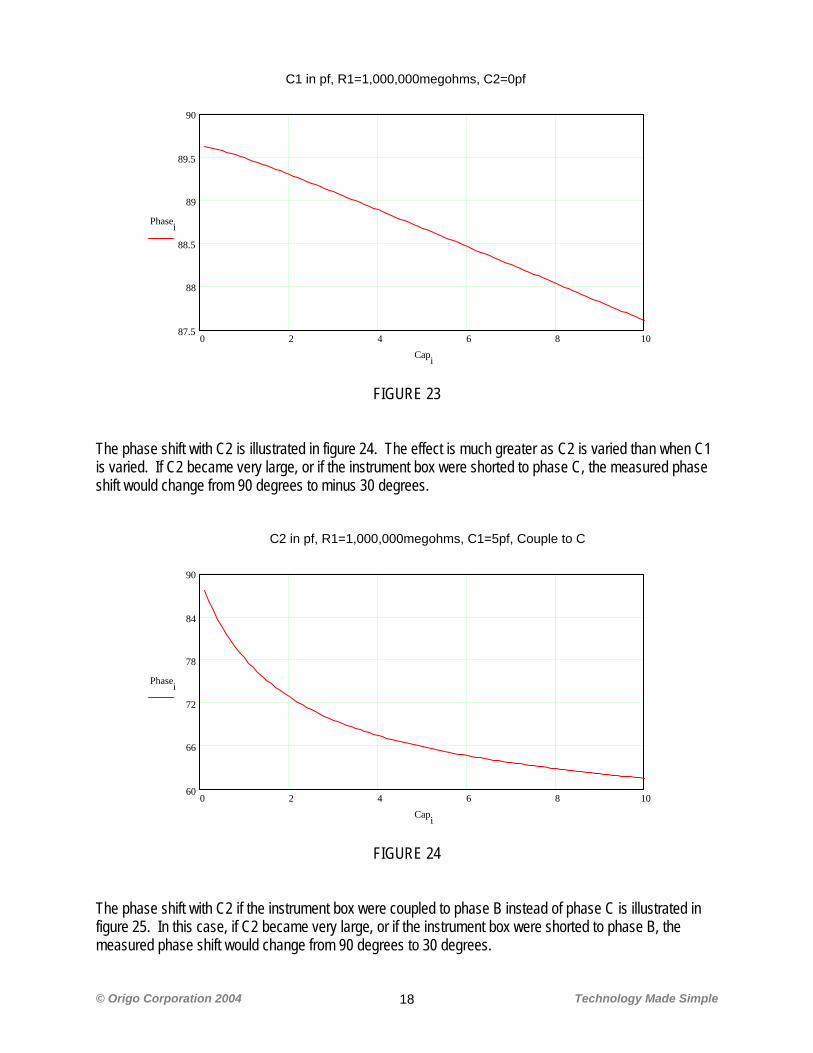
FIGURE 22 If a ground wire is not used between the instrumentation box and ground, then R1 represents the resis-tance of the hot stick. C1 represents the capacitance of the instrumentation box to ground, and C2 repre-sents the capacitance between the instrumentation box and the phase C conductor. If a ground wire is used (normal condition on the Origo field probe), then R1 is zero ohms and C1 and C2 have no influence on the phase measurement across R. A circuit analysis program was written to predict the effect of R1, C1, and C2 on the voltage phase meas-urement if a ground wire is not used. The value of R1 probably varies from about 10 megohms, for a very dirty hot stick, to 1,000,000 megohms for a very clean hot stick. To get an idea of the value for C1, assume that the instrument box is equivalent to a 3 cm radius sphere. The capacitance of this size sphere to ground is 3.3 pf . At 60 Hz, the impedance of a 3.3 pf capacitor is nearly 1000 megohms. The value of C2 could vary from much less to much more depending on how close the instrument box is to the phase C conductor. If the hot stick is very clean, then the phase measurement across R depends on the values of C1 and C2. Figure 23 illustrates this dependency if C2 is zero (no capacitance coupling to phase C). As long as C1 is small, the expected 90 degrees phase shift, due to capacitive coupling, is measured across R. This con-stant phase shift can be accounted for in the base station software and doesn’t vary much over the antici-pated range of C1.
R
RD
R1 C1
B
PM
A
C2
© Origo Corporation 2004 Technology Made Simple 18
FIGURE 23
The phase shift with C2 is illustrated in figure 24. The effect is much greater as C2 is varied than when C1 is varied. If C2 became very large, or if the instrument box were shorted to phase C, the measured phase shift would change from 90 degrees to minus 30 degrees.
FIGURE 24
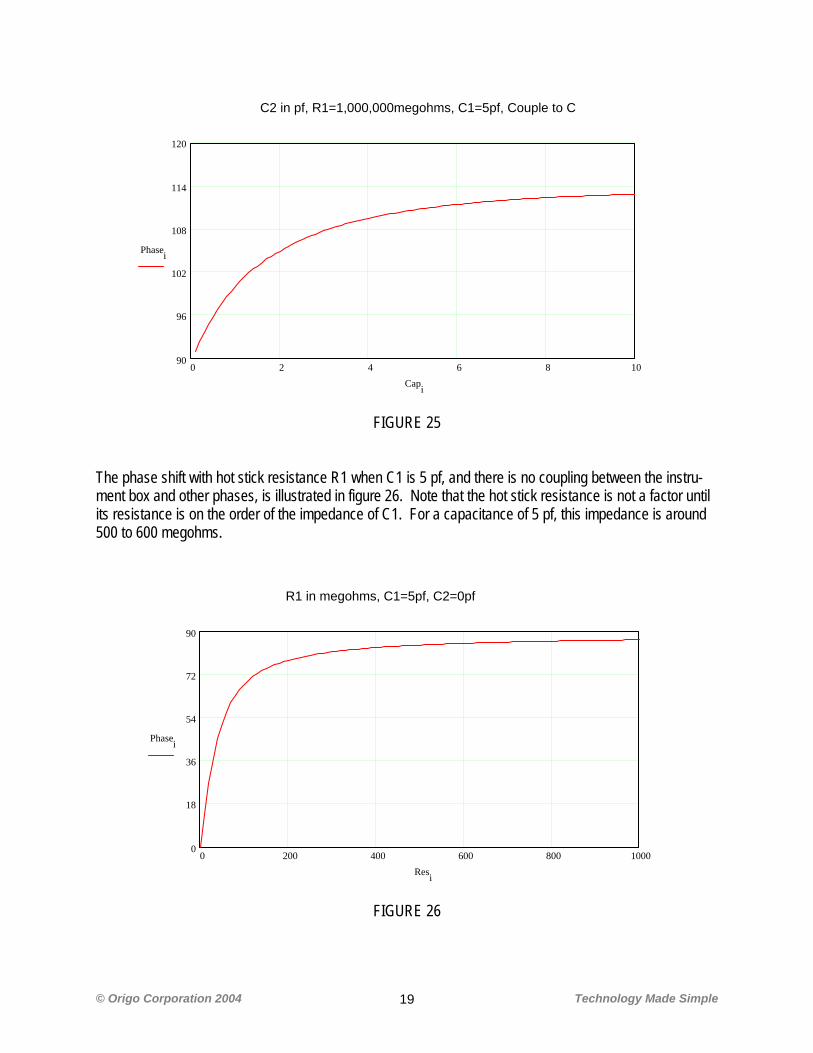
The phase shift with C2 if the instrument box were coupled to phase B instead of phase C is illustrated in figure 25. In this case, if C2 became very large, or if the instrument box were shorted to phase B, the measured phase shift would change from 90 degrees to 30 degrees.
C1 in pf, R1=1,000,000megohms, C2=0pf
0 2 4 6 8 1087.5
88
88.5
89
89.5
90
Phasei
Capi
C2 in pf, R1=1,000,000megohms, C1=5pf, Couple to C
0 2 4 6 8 1060
66
72
78
84
90
Phasei
Capi
© Origo Corporation 2004 Technology Made Simple 19
FIGURE 25
The phase shift with hot stick resistance R1 when C1 is 5 pf, and there is no coupling between the instru-ment box and other phases, is illustrated in figure 26. Note that the hot stick resistance is not a factor until its resistance is on the order of the impedance of C1. For a capacitance of 5 pf, this impedance is around 500 to 600 megohms.
FIGURE 26
R1 in megohms, C1=5pf, C2=0pf
0 200 400 600 800 10000
18
36
54
72
90
Phasei
Resi
C2 in pf, R1=1,000,000megohms, C1=5pf, Couple to C
0 2 4 6 8 1090
96
102
108
114
120
Phasei
Capi
© Origo Corporation 2004 Technology Made Simple 20
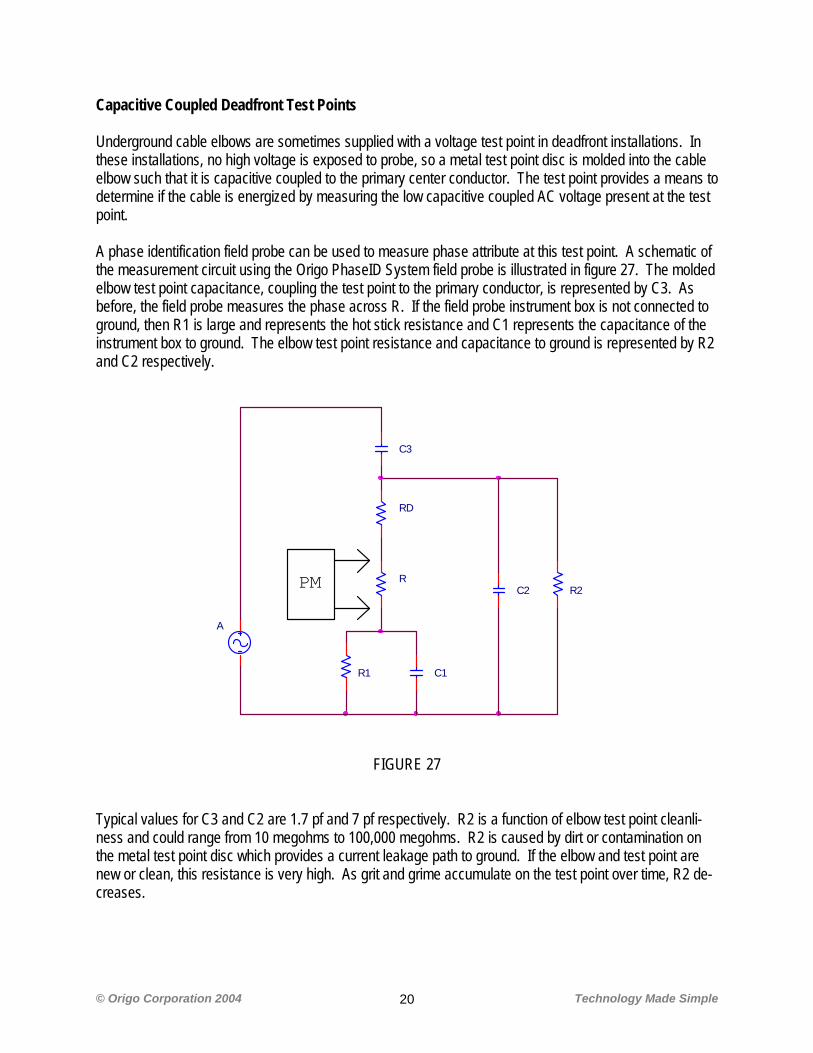
Capacitive Coupled Deadfront Test Points Underground cable elbows are sometimes supplied with a voltage test point in deadfront installations. In these installations, no high voltage is exposed to probe, so a metal test point disc is molded into the cable elbow such that it is capacitive coupled to the primary center conductor. The test point provides a means to determine if the cable is energized by measuring the low capacitive coupled AC voltage present at the test point. A phase identification field probe can be used to measure phase attribute at this test point. A schematic of the measurement circuit using the Origo PhaseID System field probe is illustrated in figure 27. The molded elbow test point capacitance, coupling the test point to the primary conductor, is represented by C3. As before, the field probe measures the phase across R. If the field probe instrument box is not connected to ground, then R1 is large and represents the hot stick resistance and C1 represents the capacitance of the instrument box to ground. The elbow test point resistance and capacitance to ground is represented by R2 and C2 respectively.
FIGURE 27 Typical values for C3 and C2 are 1.7 pf and 7 pf respectively. R2 is a function of elbow test point cleanli-ness and could range from 10 megohms to 100,000 megohms. R2 is caused by dirt or contamination on the metal test point disc which provides a current leakage path to ground. If the elbow and test point are new or clean, this resistance is very high. As grit and grime accumulate on the test point over time, R2 de-creases.
A
C2R
RD
R1
R2
C3
C1
PM
© Origo Corporation 2004 Technology Made Simple 21
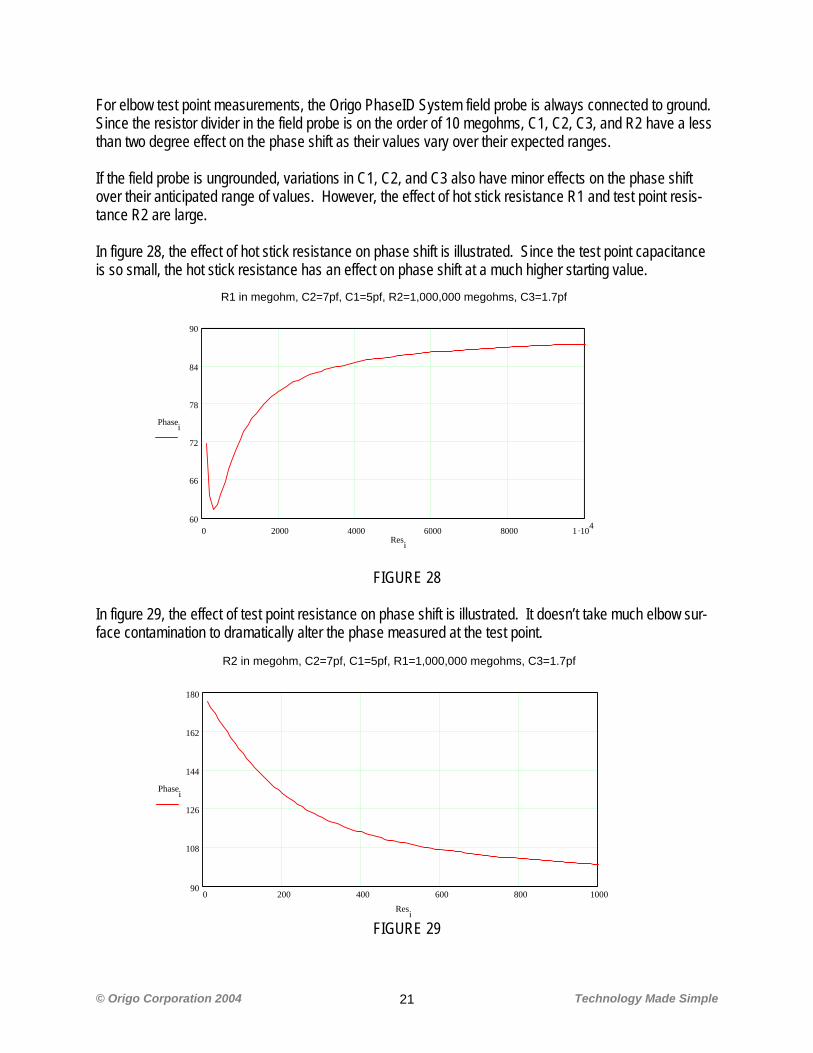
For elbow test point measurements, the Origo PhaseID System field probe is always connected to ground. Since the resistor divider in the field probe is on the order of 10 megohms, C1, C2, C3, and R2 have a less than two degree effect on the phase shift as their values vary over their expected ranges. If the field probe is ungrounded, variations in C1, C2, and C3 also have minor effects on the phase shift over their anticipated range of values. However, the effect of hot stick resistance R1 and test point resis-tance R2 are large. In figure 28, the effect of hot stick resistance on phase shift is illustrated. Since the test point capacitance is so small, the hot stick resistance has an effect on phase shift at a much higher starting value.
FIGURE 28
In figure 29, the effect of test point resistance on phase shift is illustrated. It doesn’t take much elbow sur-face contamination to dramatically alter the phase measured at the test point.
FIGURE 29
R1 in megohm, C2=7pf, C1=5pf, R2=1,000,000 megohms, C3=1.7pf
0 2000 4000 6000 8000 1 .10460
66
72
78
84
90
Phasei
Resi
R2 in megohm, C2=7pf, C1=5pf, R1=1,000,000 megohms, C3=1.7pf
0 200 400 600 800 100090
108
126
144
162
180
Phasei
Resi
© Origo Corporation 2004 Technology Made Simple 22
Effect of Voltage Phase Shifts and Use of Offsets When only the 3 primary attributes are required, the line-to-ground voltage phase error measured between the base station and field probe can vary plus or minus 60 degrees, before a phase attribute error will oc-cur. However, if all 12 secondary attributes are desired, the phase error can only be plus or minus 15 de-grees. The phase error in any situation is equal to the summation of phase errors due to all sources. The previous section look at errors due to transformers, line impedance, propagation delays, capacitance coupling, and deadfront test point measurements. To remove the effect of most of these error sources, the Origo PhaseID System field probe comes with an attached ground wire and recommends it be used whenever possible. If a field probe ground wire is not used, the field probe must complete its voltage measurement circuit via capacitance coupling to its surroundings. The analysis of the preceding section applies to any non-grounded phase identification field probe produced by any vendor. That is, the accuracy of the phase measurement depends almost entirely on the physical measurement environment and depends very little on the circuit design of the instrument itself. If the field probe ground wire cannot be used on primary attribute measurements, the analysis of the pre-ceding section shows that no attribute errors should occur as long as a clean hot stick is used and an at-tempt is made to hold the field probe away from phases not being measured. This can easily be done in nearly all measurement situations. On elbow deadfront test point primary phase attribute measurements, the ground wire must always be used unless time is taken to thoroughly clean the elbow in the vicinity of the test point. Primary phase attribute errors are very possible, without the ground wire, due to the large effect of elbow surface contamination on phase shift. For secondary phase attribute measurements, 12 different attributes are identified and the phase error must be less than 15 degrees. To prevent errors, the Origo PhaseID System is designed to use the ground wire on all secondary phase attribute measurements. If a very distant base station must be used, caution must be used on secondary measurements because it has been shown that phase shifts due to propaga-tion delays can vary by at least 11 degrees peak-to-peak over a range of 350 miles. To obtain the maximum phase error margin, the Origo PhaseID System base station allows the user to sub-tract out static phase errors. That is, the constant portion of phase errors due to a particular type of meas-urement can be zeroed out so that the entire error margin between attributes can be used for per meas-urement error deviation. For example, secondary phase measurements made using the field probe pin has a slightly different static phase shift than the same secondary phase measurement made using the secondary adapter. Although the phase difference is only a few degrees, and can be ignored when using a local base station, it helps to remove every bit of static phase error possible when using a distant base station for secondary measure-ments.
© Origo Corporation 2004 Technology Made Simple 23
The base station implements a separate offset for primary, secondary, and capacitive measurements. In general, the defaults can be used for primary, secondary, and capacitive coupled measurements other than on elbow deadfront test points. For elbow test point measurements, tests thus far indicate an offset of 165 gives better results than the default of 110. The proper way to use offsets is to monitor the phase error reported by the base station for awhile on a par-ticular type of measurement. For example, if primary feeder measurements always seem to report a phase error of around 10 degrees, simply increase the primary offset by 10 degrees to bring the average phase error closer to zero degrees. On secondary measurements, adjust the secondary offset so that the average phase error of all secondary measurements is about zero. You may find that all secondary measurements made using the probe pin fall a few degrees on one side of zero and all secondary measurements made using the secondary adapter fall a few degrees on the other side of zero. The goal is to balance the error around zero so that they don’t all fall on one side and use up a significant portion of the 15 degree error margin. Another observation from this analysis is that, unless a field probe ground wire is used, the measurement phase accuracy is not good enough to get any meaningful phase information other than phase attribute information. Although the phase accuracy is good enough to identify the 3 primary phases (phase error less than 60 degrees), figures 24 and 25 illustrate that very small differences in capacitive coupling to other phases cause many degrees of variation in the measured phase shift. For example, if one wished to determine phase shift down a cable, it is very improbable that multiple meas-urements made along the cable would all have an identical instrumentation box capacitance to either ground or other phases. Without an identical physical measurement environment at each measurement location, the phase error obtained on each measurement would be far too large to provide any credible in-formation for this or any other situation in which small differential phase measurements are required. References 1. “Distribution System Modeling and Analysis”; William H. Kersting; CRC Press, 2002.
Related Documents