Directional (Circular) Statistics

Welcome message from author
This document is posted to help you gain knowledge. Please leave a comment to let me know what you think about it! Share it to your friends and learn new things together.
Transcript
Directional (Circular) Statistics
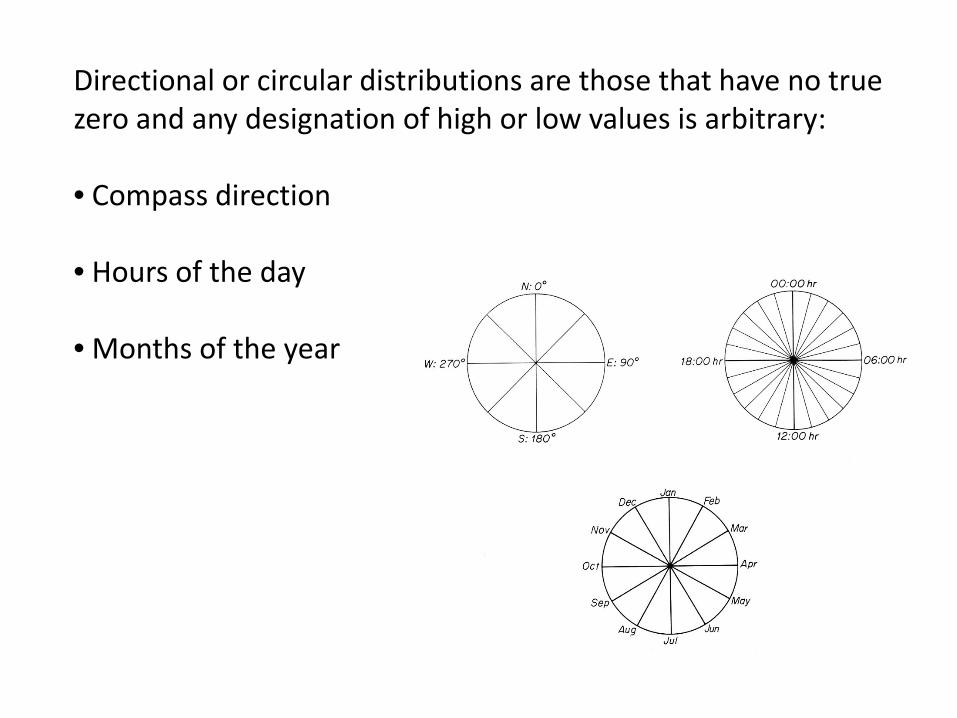
Directional or circular distributions are those that have no truezero and any designation of high or low values is arbitrary:
• Compass direction
• Hours of the day
• Months of the year
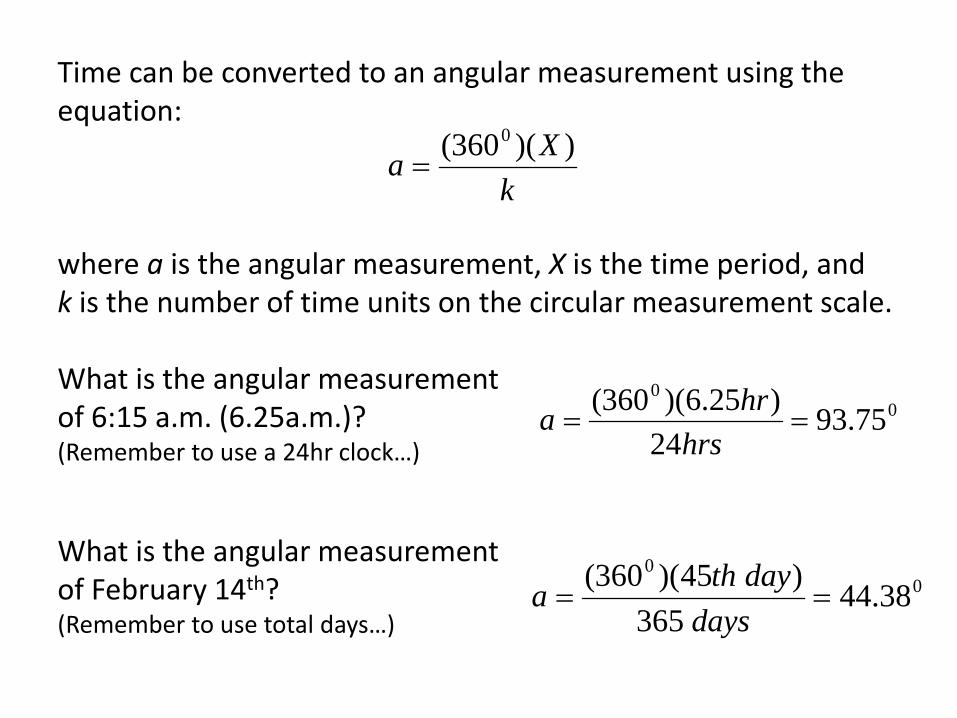
Time can be converted to an angular measurement using the equation:
where a is the angular measurement, X is the time period, andk is the number of time units on the circular measurement scale.
What is the angular measurement of 6:15 a.m. (6.25a.m.)?(Remember to use a 24hr clock…)
What is the angular measurement of February 14th?(Remember to use total days…)
kXa ))(360( 0
=
00
75.9324
)25.6)(360(==
hrshra
00
38.44365
)45)(360(==
daysdaytha
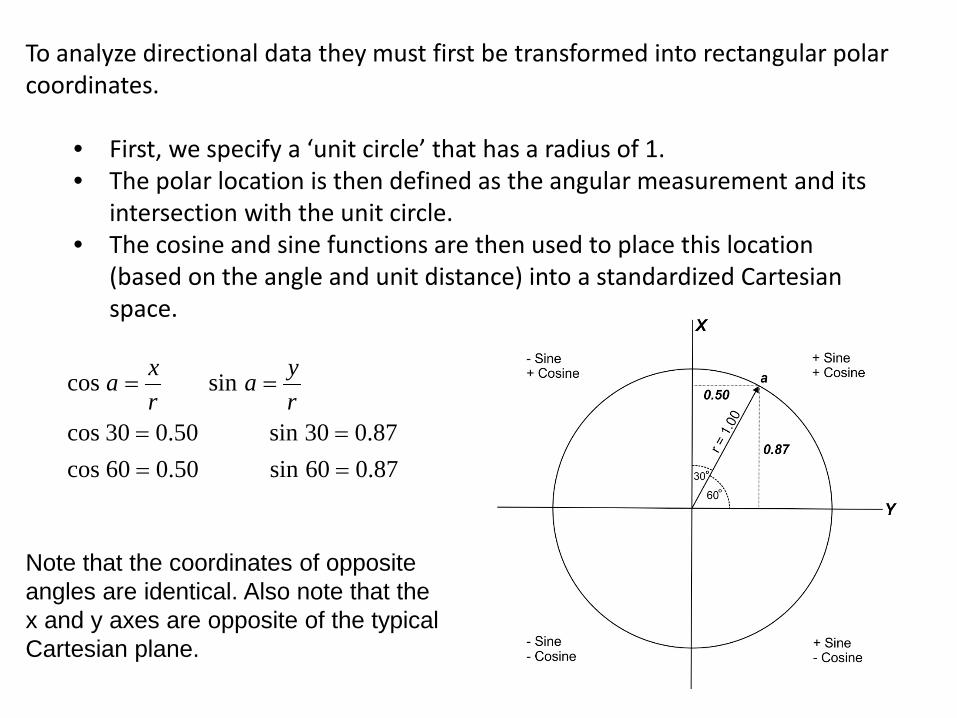
To analyze directional data they must first be transformed into rectangular polar coordinates.
• First, we specify a ‘unit circle’ that has a radius of 1. • The polar location is then defined as the angular measurement and its
intersection with the unit circle.• The cosine and sine functions are then used to place this location
(based on the angle and unit distance) into a standardized Cartesian space.
87.060sin50.060cos87.030sin50.030cos
sincos
====
==rya
rxa
Note that the coordinates of opposite angles are identical. Also note that the x and y axes are opposite of the typical Cartesian plane.
Alsore, Chile
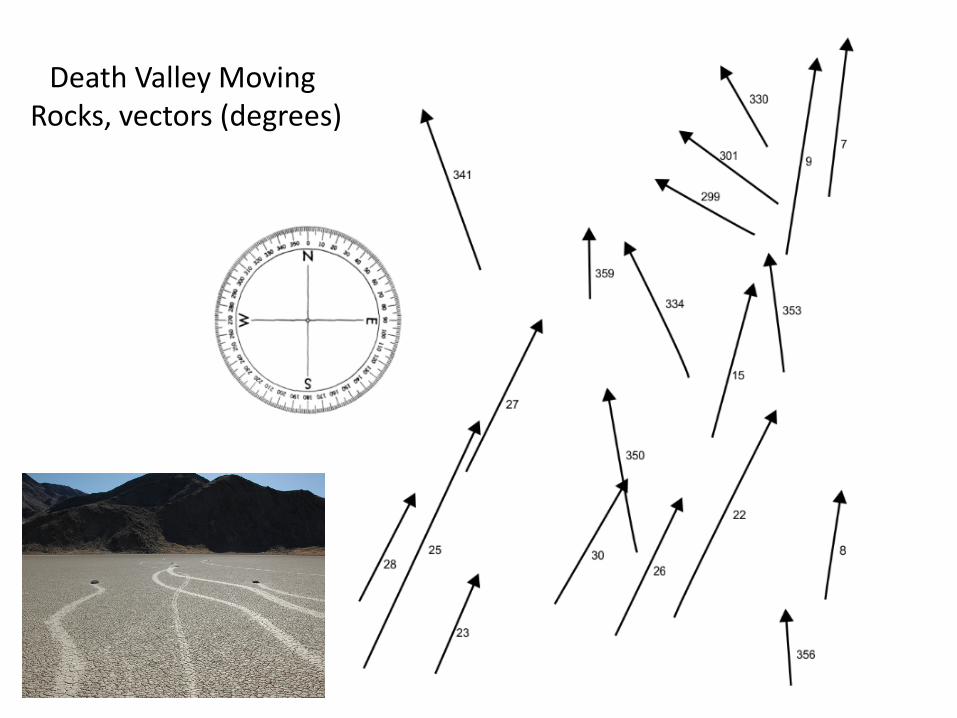
Death Valley Moving Rocks, vectors (degrees)
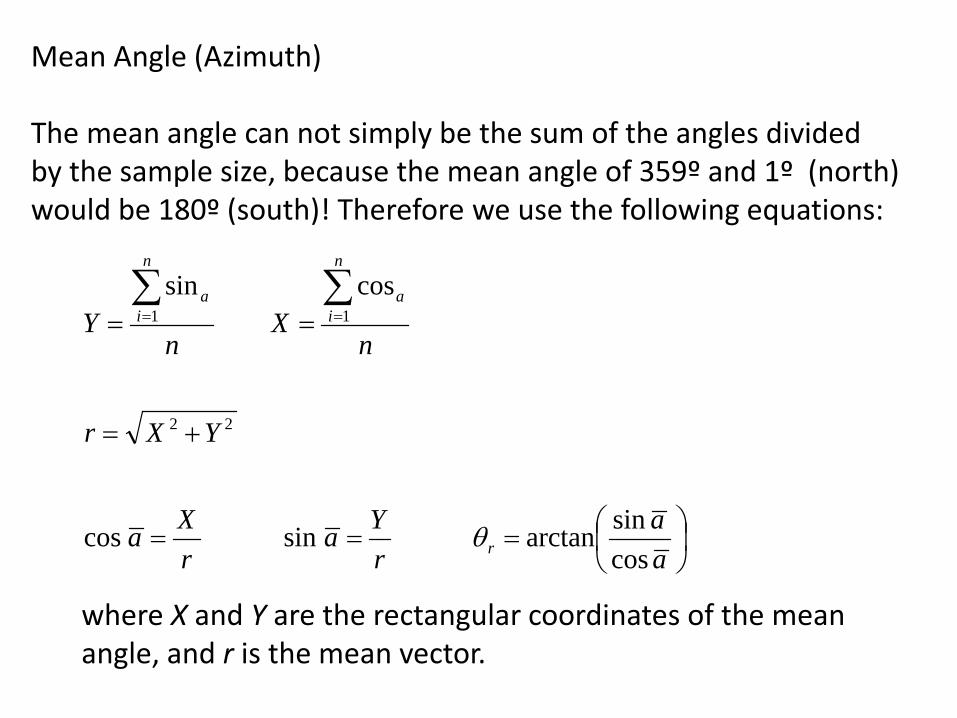
where X and Y are the rectangular coordinates of the meanangle, and r is the mean vector.
Mean Angle (Azimuth)
The mean angle can not simply be the sum of the angles dividedby the sample size, because the mean angle of 359º and 1º (north)would be 180º (south)! Therefore we use the following equations:
===
+=
==∑∑==
aa
rYa
rXa
YXr
nX
nY
r
n
ia
n
ia
cossinarctansincos
cos
sin
22
11
θ
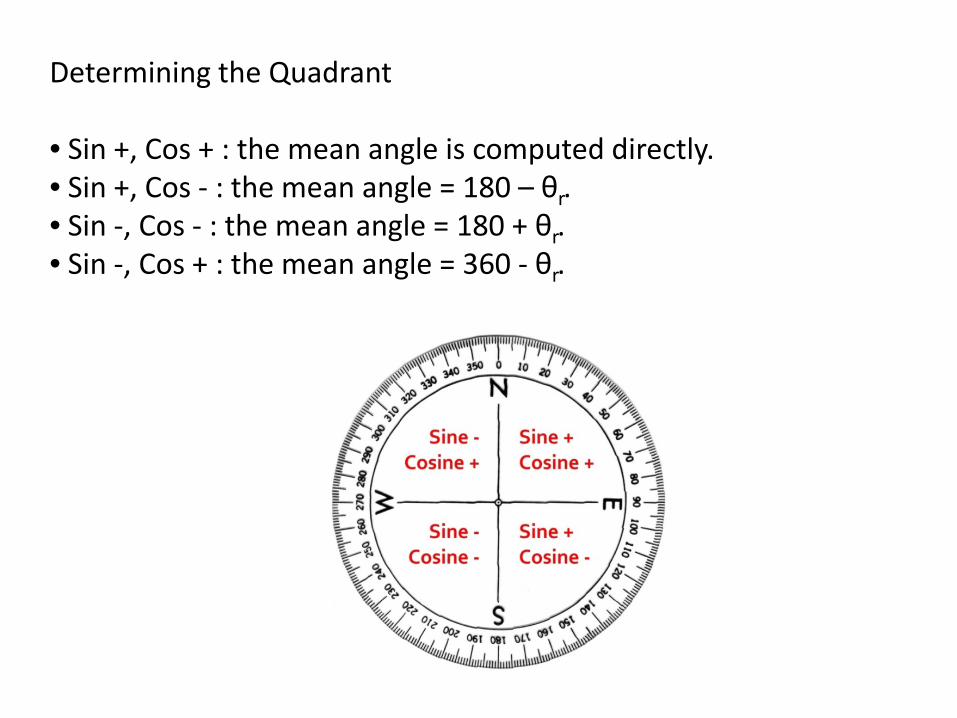
Determining the Quadrant
• Sin +, Cos + : the mean angle is computed directly.• Sin +, Cos - : the mean angle = 180 – θr.• Sin -, Cos - : the mean angle = 180 + θr.• Sin -, Cos + : the mean angle = 360 - θr.
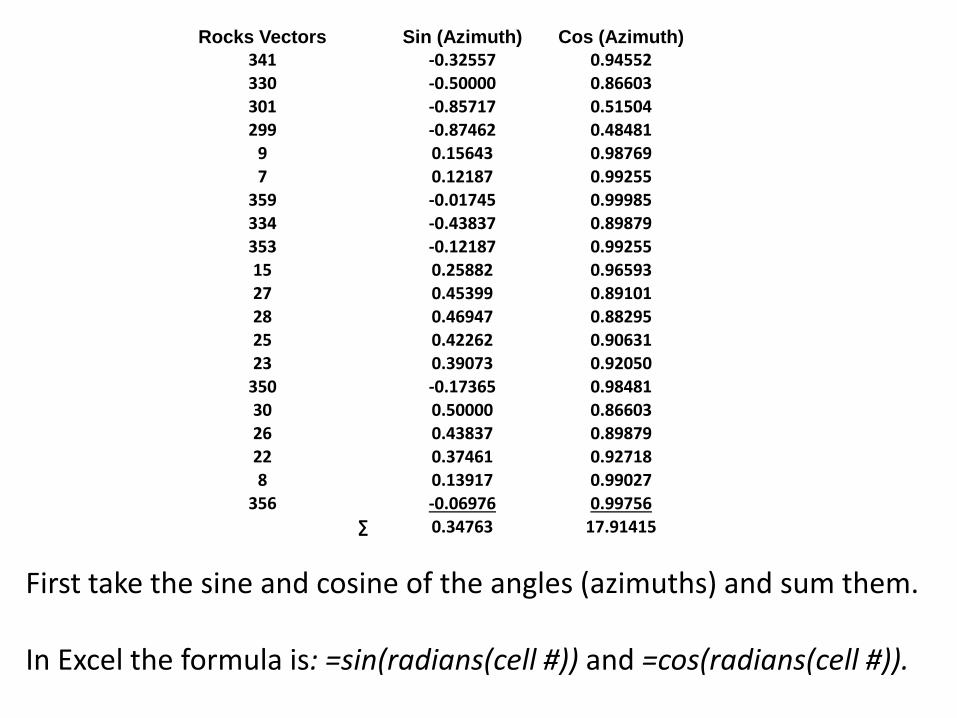
Rocks Vectors Sin (Azimuth) Cos (Azimuth)341 -0.32557 0.94552330 -0.50000 0.86603301 -0.85717 0.51504299 -0.87462 0.48481
9 0.15643 0.987697 0.12187 0.99255
359 -0.01745 0.99985334 -0.43837 0.89879353 -0.12187 0.9925515 0.25882 0.9659327 0.45399 0.8910128 0.46947 0.8829525 0.42262 0.9063123 0.39073 0.92050
350 -0.17365 0.9848130 0.50000 0.8660326 0.43837 0.8987922 0.37461 0.927188 0.13917 0.99027
356 -0.06976 0.99756∑ 0.34763 17.91415
First take the sine and cosine of the angles (azimuths) and sum them.
In Excel the formula is: =sin(radians(cell #)) and =cos(radians(cell #)).
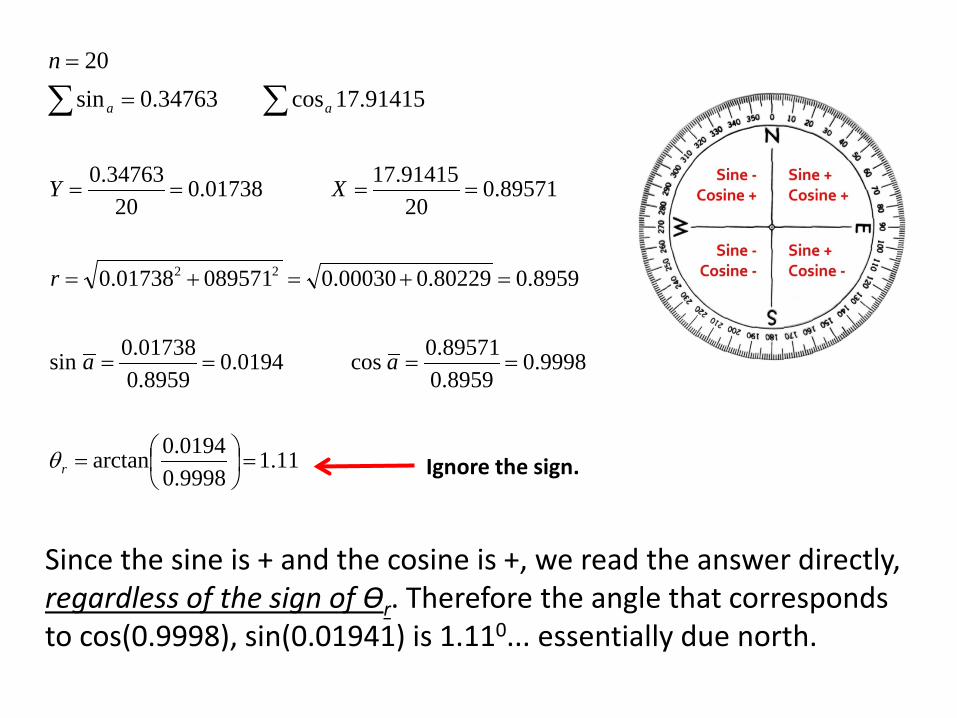
∑ ∑=
=
91415.17cos34763.0sin20
aa
n
11.19998.00194.0arctan
9998.08959.089571.0cos0194.0
8959.001738.0sin
8959.080229.000030.008957101738.0
89571.02091415.1701738.0
2034763.0
22
=
=
====
=+=+=
====
r
aa
r
XY
θ
Since the sine is + and the cosine is +, we read the answer directly, regardless of the sign of Ɵr. Therefore the angle that corresponds to cos(0.9998), sin(0.01941) is 1.110... essentially due north.
Ignore the sign.
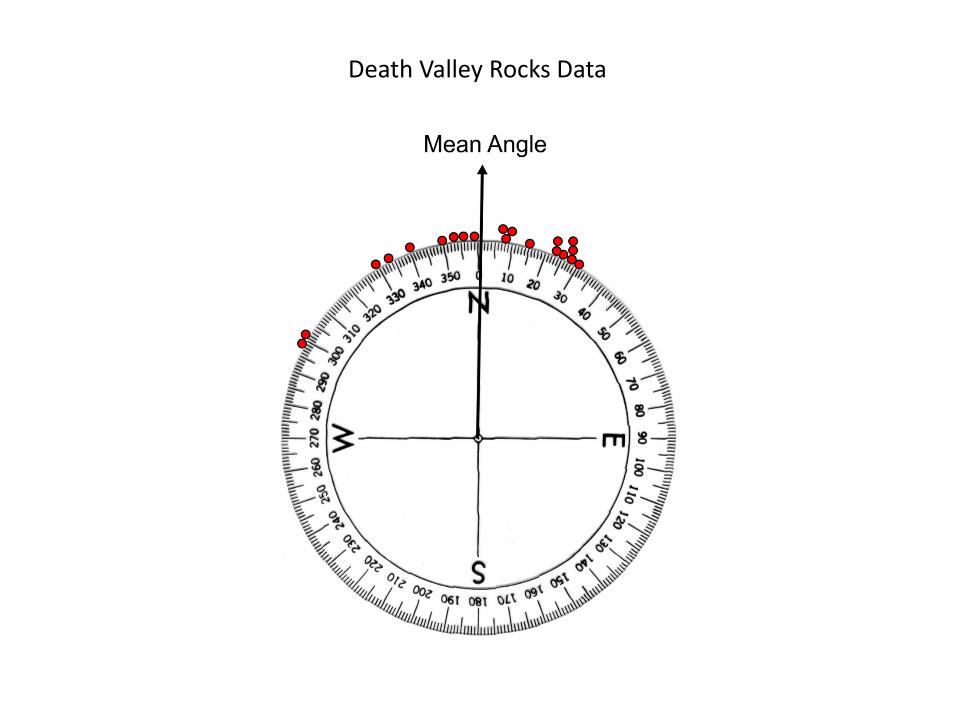
Death Valley Rocks Data
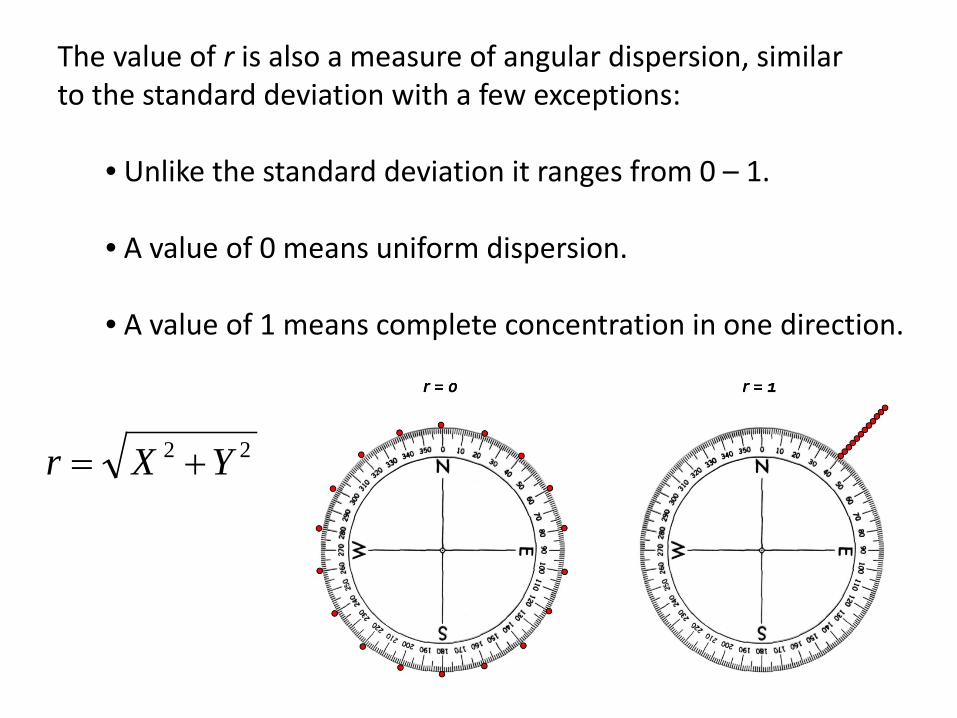
The value of r is also a measure of angular dispersion, similarto the standard deviation with a few exceptions:
• Unlike the standard deviation it ranges from 0 – 1.
• A value of 0 means uniform dispersion.
• A value of 1 means complete concentration in one direction.
22 YXr +=
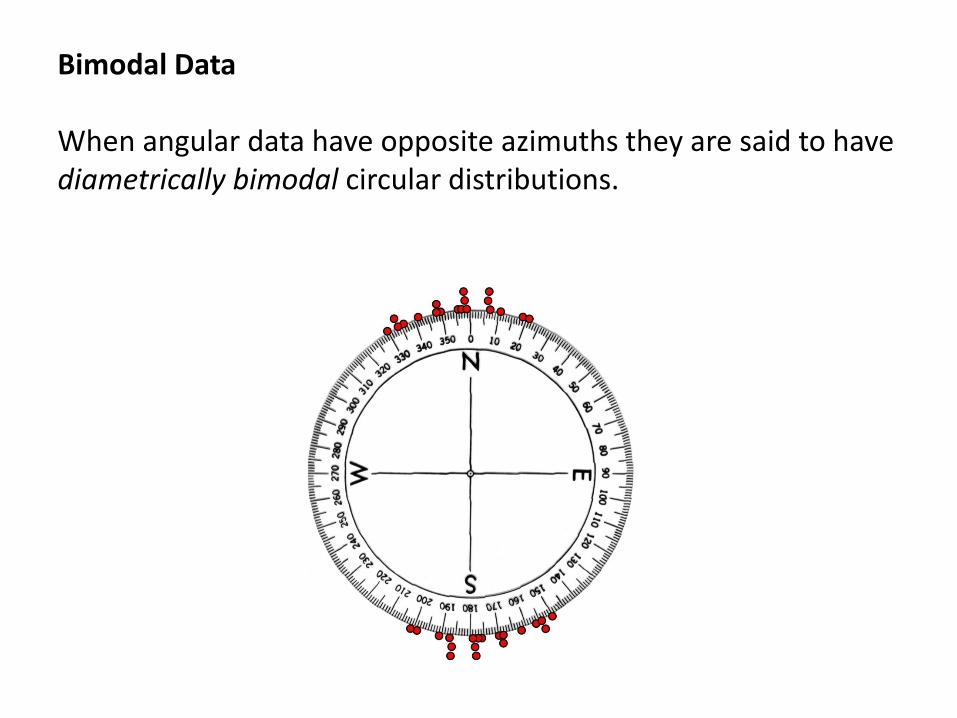
Bimodal Data
When angular data have opposite azimuths they are said to have diametrically bimodal circular distributions.
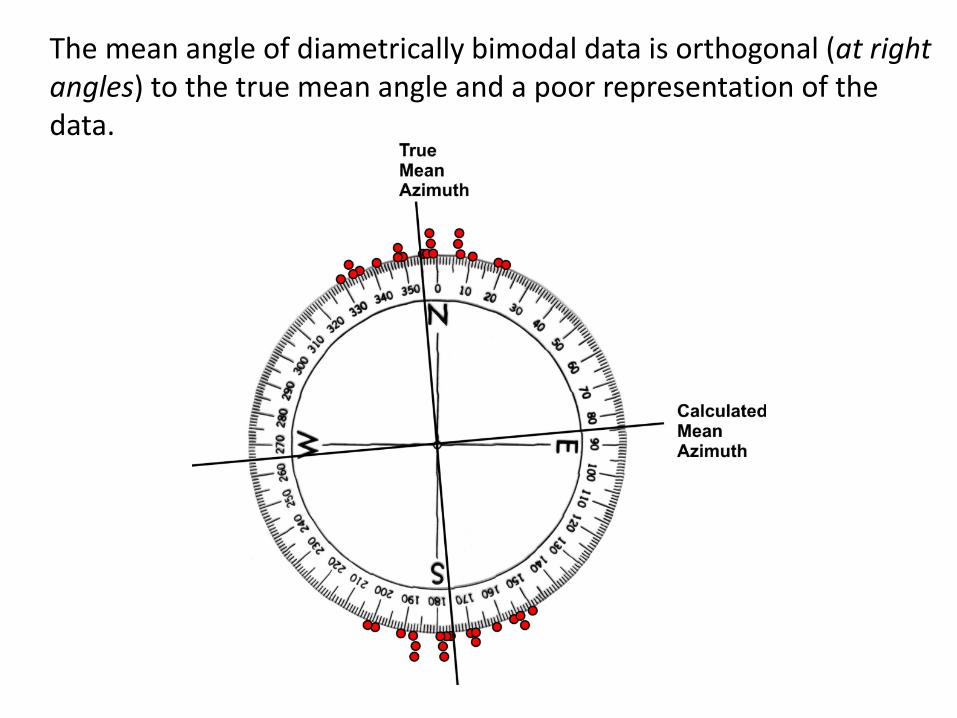
The mean angle of diametrically bimodal data is orthogonal (at rightangles) to the true mean angle and a poor representation of the data.
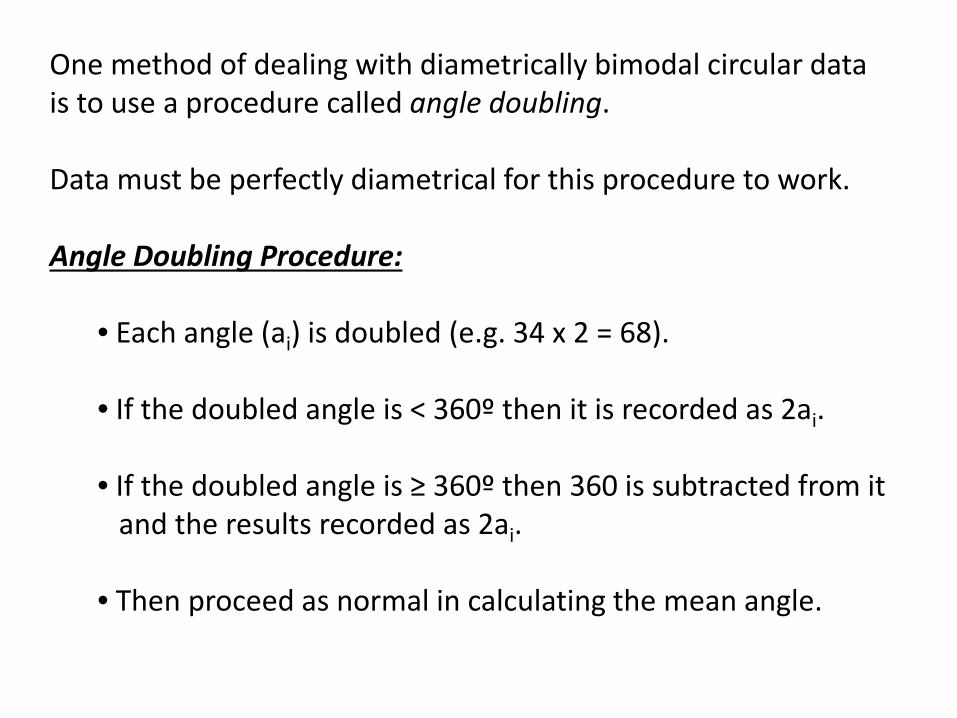
One method of dealing with diametrically bimodal circular datais to use a procedure called angle doubling.
Data must be perfectly diametrical for this procedure to work.
Angle Doubling Procedure:
• Each angle (ai) is doubled (e.g. 34 x 2 = 68).
• If the doubled angle is < 360º then it is recorded as 2ai.
• If the doubled angle is ≥ 360º then 360 is subtracted from itand the results recorded as 2ai.
• Then proceed as normal in calculating the mean angle.
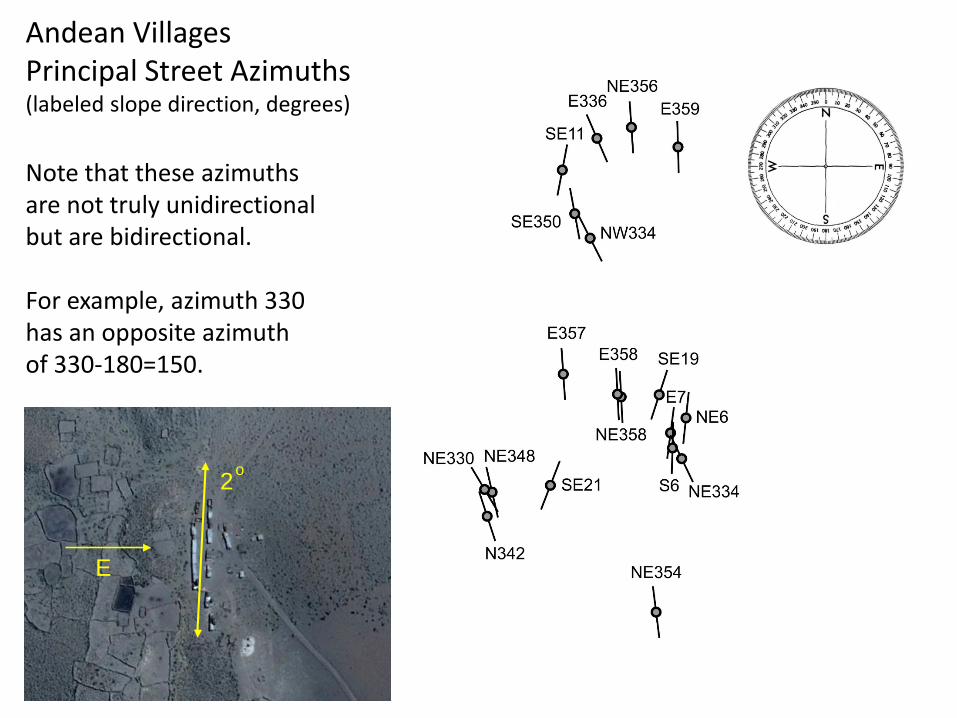
Andean VillagesPrincipal Street Azimuths (labeled slope direction, degrees)
Note that these azimuthsare not truly unidirectionalbut are bidirectional.
For example, azimuth 330 has an opposite azimuth of 330-180=150.
2o
E
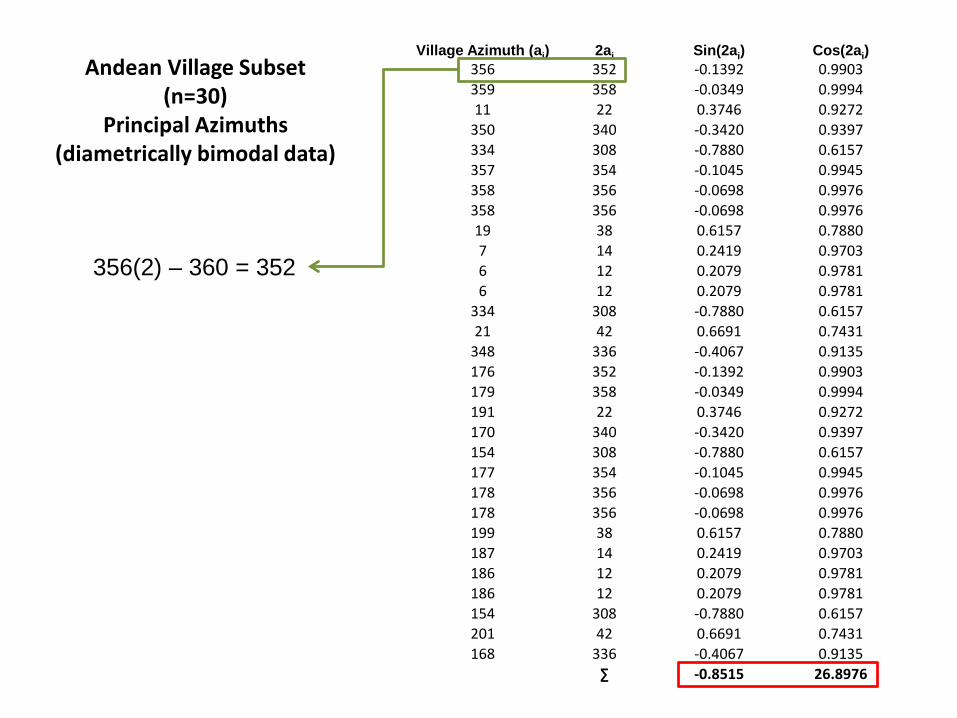
Village Azimuth (ai) 2ai Sin(2ai) Cos(2ai)356 352 -0.1392 0.9903359 358 -0.0349 0.999411 22 0.3746 0.9272
350 340 -0.3420 0.9397334 308 -0.7880 0.6157357 354 -0.1045 0.9945358 356 -0.0698 0.9976358 356 -0.0698 0.997619 38 0.6157 0.78807 14 0.2419 0.97036 12 0.2079 0.97816 12 0.2079 0.9781
334 308 -0.7880 0.615721 42 0.6691 0.7431
348 336 -0.4067 0.9135176 352 -0.1392 0.9903179 358 -0.0349 0.9994191 22 0.3746 0.9272170 340 -0.3420 0.9397154 308 -0.7880 0.6157177 354 -0.1045 0.9945178 356 -0.0698 0.9976178 356 -0.0698 0.9976199 38 0.6157 0.7880187 14 0.2419 0.9703186 12 0.2079 0.9781186 12 0.2079 0.9781154 308 -0.7880 0.6157201 42 0.6691 0.7431168 336 -0.4067 0.9135
∑ -0.8515 26.8976
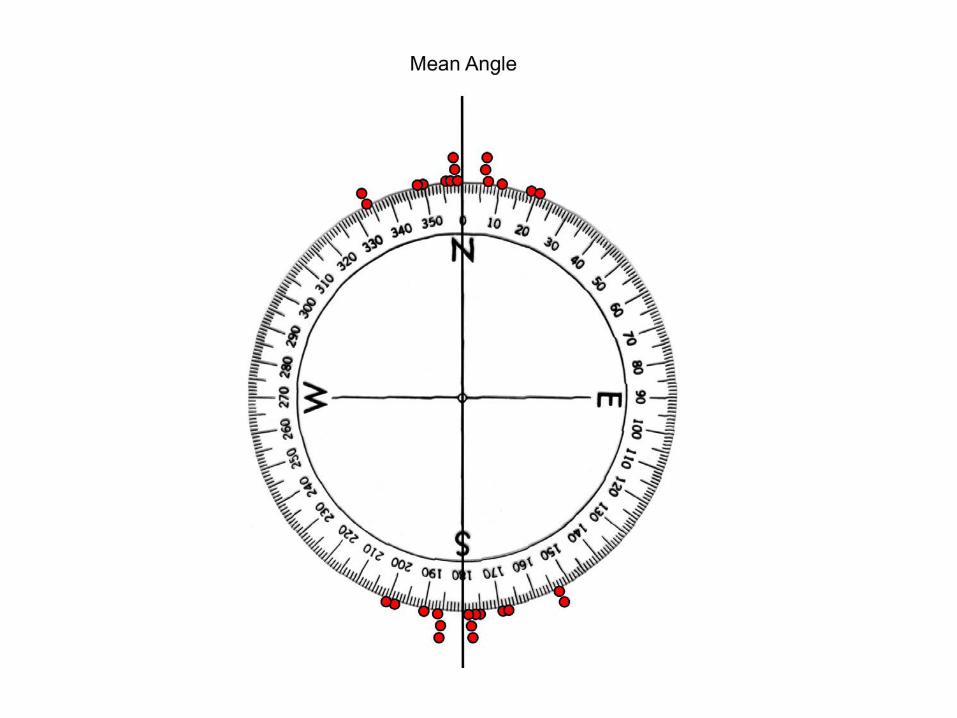
Andean Village Subset(n=30)
Principal Azimuths(diametrically bimodal data)
356(2) – 360 = 352
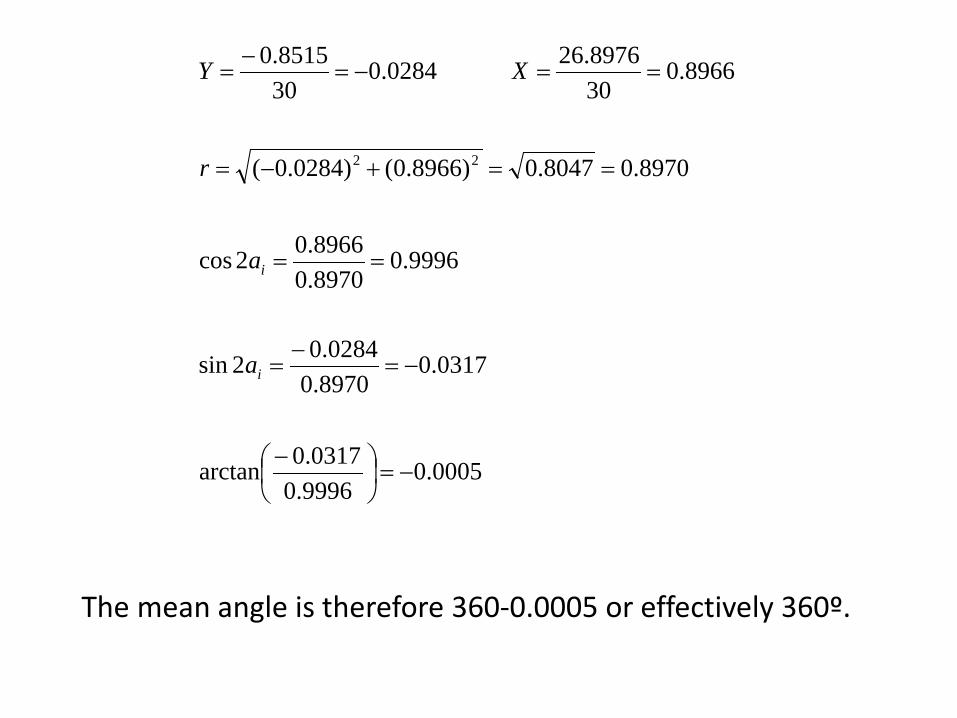
The mean angle is therefore 360-0.0005 or effectively 360º.
0005.09996.00317.0arctan
0317.08970.00284.02sin
9996.08970.08966.02cos
8970.08047.0)8966.0()0284.0(
8966.0308976.260284.0
308515.0
22
−=
−
−=−
=
==
==+−=
==−=−
=
i
i
a
a
r
XY
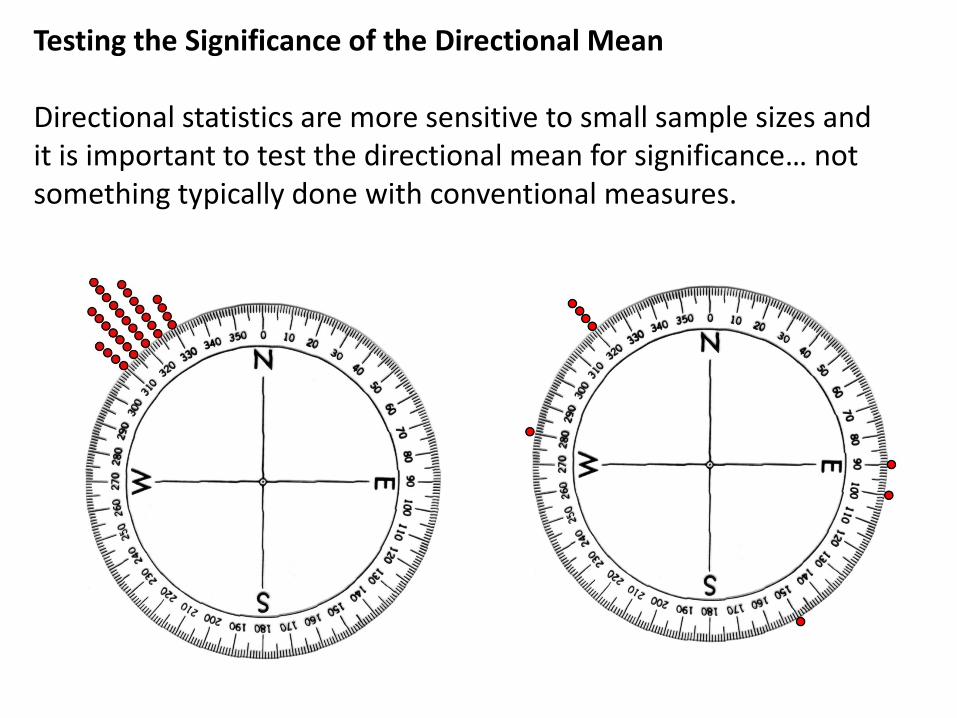
Testing the Significance of the Directional Mean
Directional statistics are more sensitive to small sample sizes andit is important to test the directional mean for significance… notsomething typically done with conventional measures.
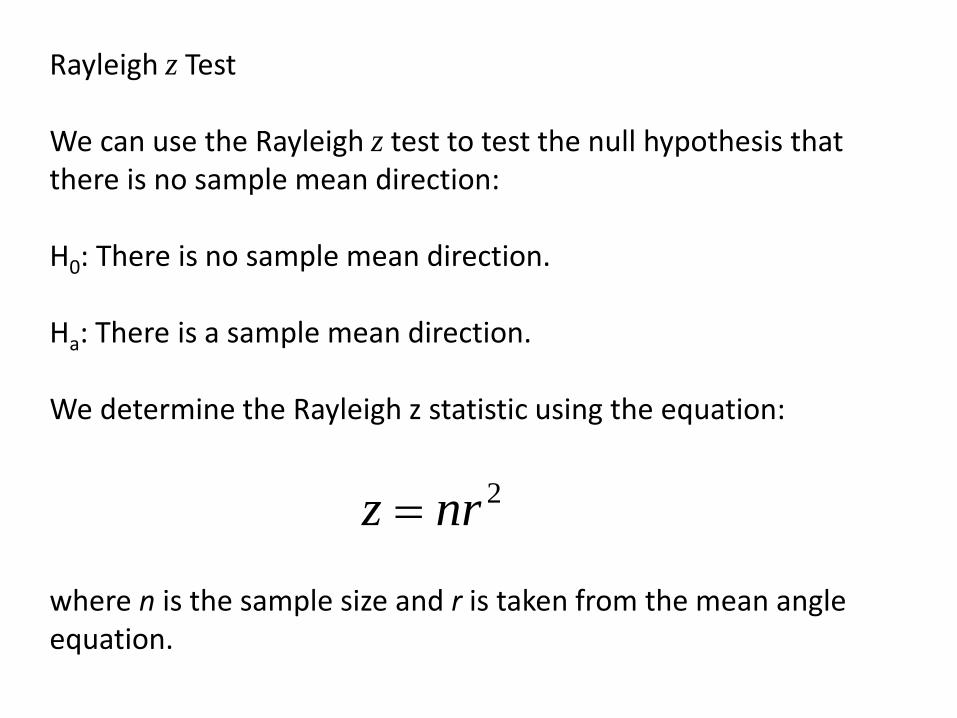
Rayleigh z Test
We can use the Rayleigh z test to test the null hypothesis thatthere is no sample mean direction:
H0: There is no sample mean direction.
Ha: There is a sample mean direction.
We determine the Rayleigh z statistic using the equation:
where n is the sample size and r is taken from the mean angleequation.
2nrz =
The Rayleigh’s test has a few very important assumptions:
• The data are not diametrically bidirectional.
• The data are unimodal, meaning there are not more than oneclustering of points around the circle.
So for the Andean village azimuth which are diametrically bidirectional we must use the data from the angle doubling procedure.
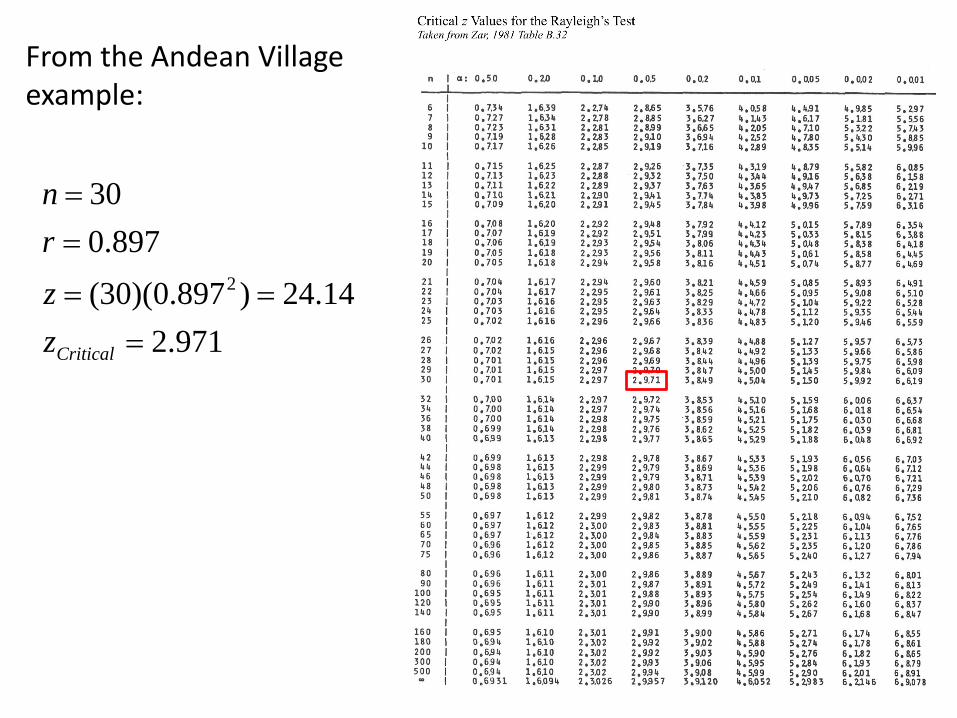
From the Andean Village example:
971.214.24)897.0)(30(
897.030
2
===
==
Criticalzzrn
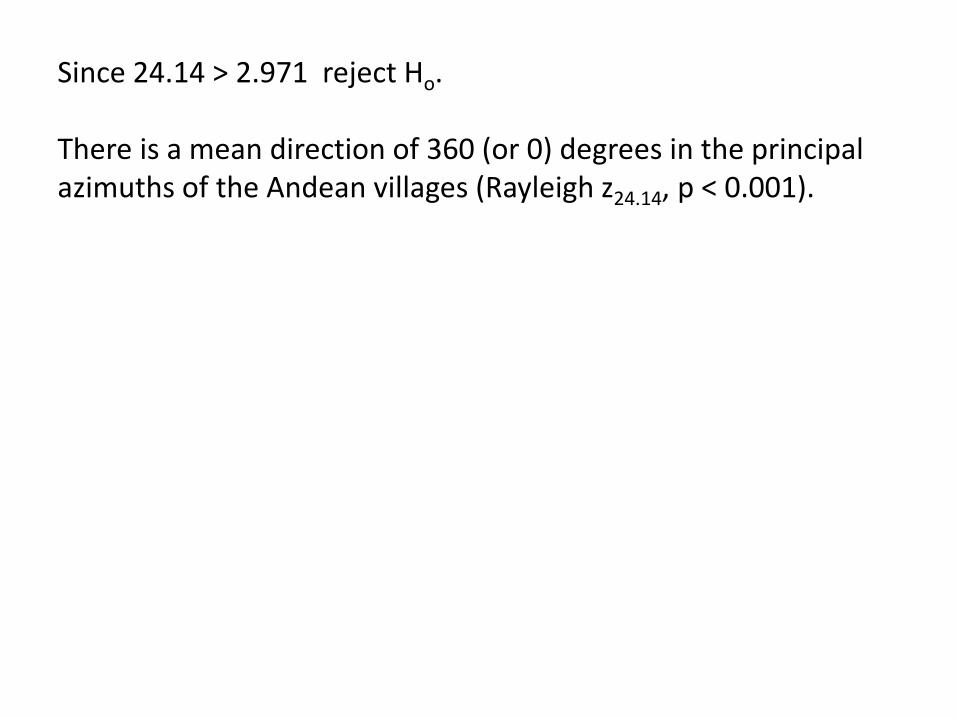
Since 24.14 > 2.971 reject Ho.
There is a mean direction of 360 (or 0) degrees in the principalazimuths of the Andean villages (Rayleigh z24.14, p < 0.001).
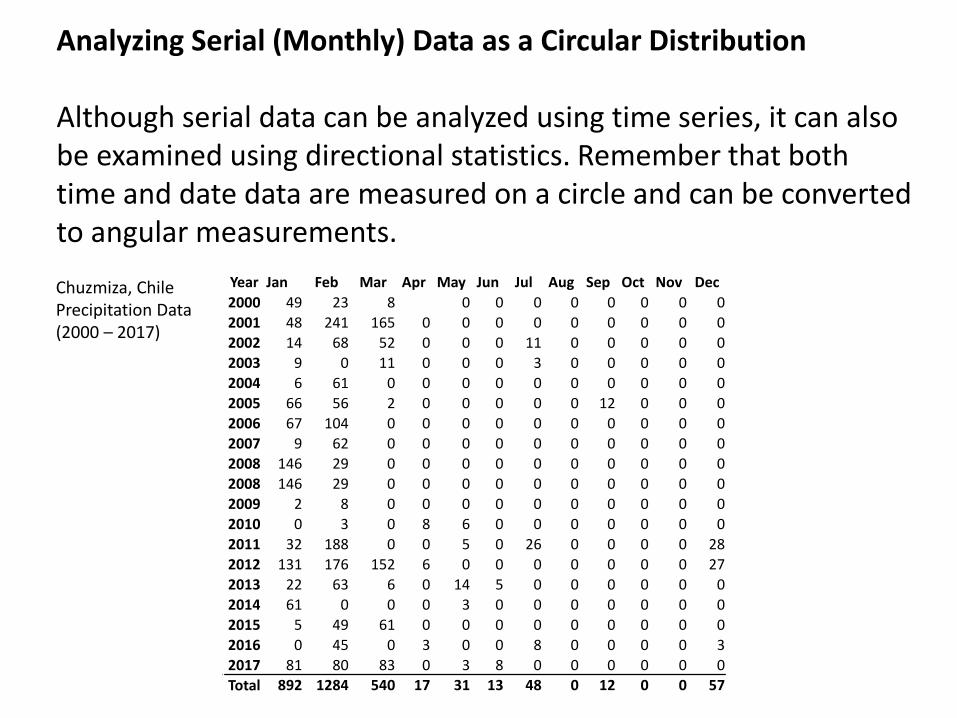
Analyzing Serial (Monthly) Data as a Circular Distribution
Although serial data can be analyzed using time series, it can also be examined using directional statistics. Remember that both time and date data are measured on a circle and can be converted to angular measurements.
Year Jan Feb Mar Apr May Jun Jul Aug Sep Oct Nov Dec2000 49 23 8 0 0 0 0 0 0 0 02001 48 241 165 0 0 0 0 0 0 0 0 02002 14 68 52 0 0 0 11 0 0 0 0 02003 9 0 11 0 0 0 3 0 0 0 0 02004 6 61 0 0 0 0 0 0 0 0 0 02005 66 56 2 0 0 0 0 0 12 0 0 02006 67 104 0 0 0 0 0 0 0 0 0 02007 9 62 0 0 0 0 0 0 0 0 0 02008 146 29 0 0 0 0 0 0 0 0 0 02008 146 29 0 0 0 0 0 0 0 0 0 02009 2 8 0 0 0 0 0 0 0 0 0 02010 0 3 0 8 6 0 0 0 0 0 0 02011 32 188 0 0 5 0 26 0 0 0 0 282012 131 176 152 6 0 0 0 0 0 0 0 272013 22 63 6 0 14 5 0 0 0 0 0 02014 61 0 0 0 3 0 0 0 0 0 0 02015 5 49 61 0 0 0 0 0 0 0 0 02016 0 45 0 3 0 0 8 0 0 0 0 32017 81 80 83 0 3 8 0 0 0 0 0 0Total 892 1284 540 17 31 13 48 0 12 0 0 57
Chuzmiza, Chile Precipitation Data (2000 – 2017)
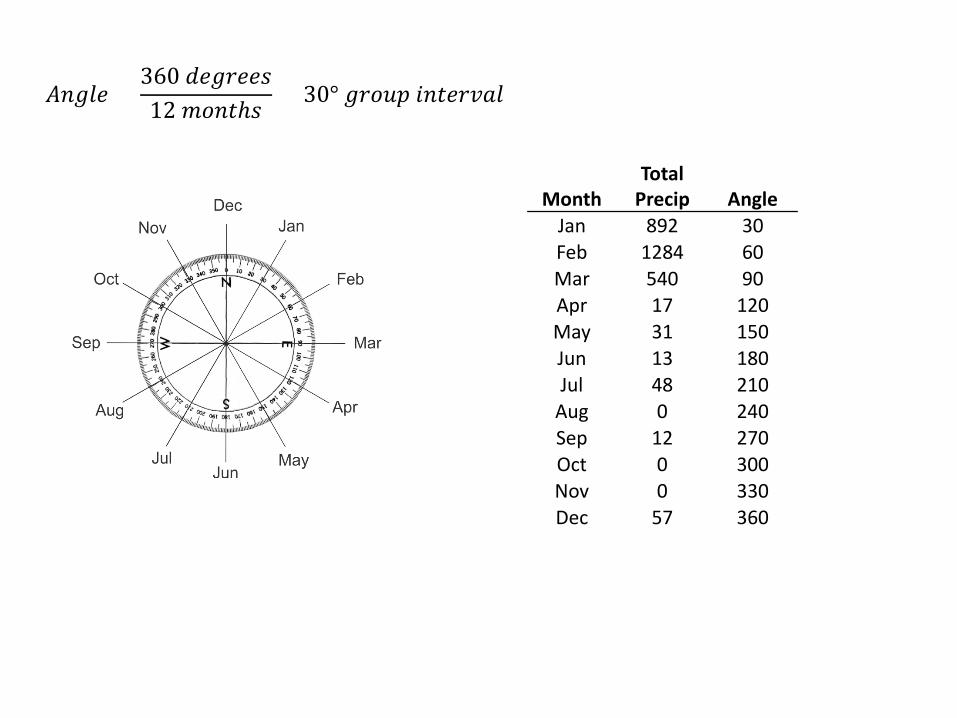
𝐴𝐴𝐴𝐴𝐴𝐴𝐴𝐴𝐴𝐴 =360 𝑑𝑑𝐴𝐴𝐴𝐴𝑑𝑑𝐴𝐴𝐴𝐴𝑑𝑑12 𝑚𝑚𝑚𝑚𝐴𝐴𝑚𝑚𝑚𝑑𝑑
= 30° 𝐴𝐴𝑑𝑑𝑚𝑚𝑔𝑔𝑔𝑔 𝑖𝑖𝐴𝐴𝑚𝑚𝐴𝐴𝑑𝑑𝑖𝑖𝑖𝑖𝐴𝐴
MonthTotal
Precip AngleJan 892 30Feb 1284 60Mar 540 90Apr 17 120May 31 150Jun 13 180Jul 48 210
Aug 0 240Sep 12 270Oct 0 300Nov 0 330Dec 57 360
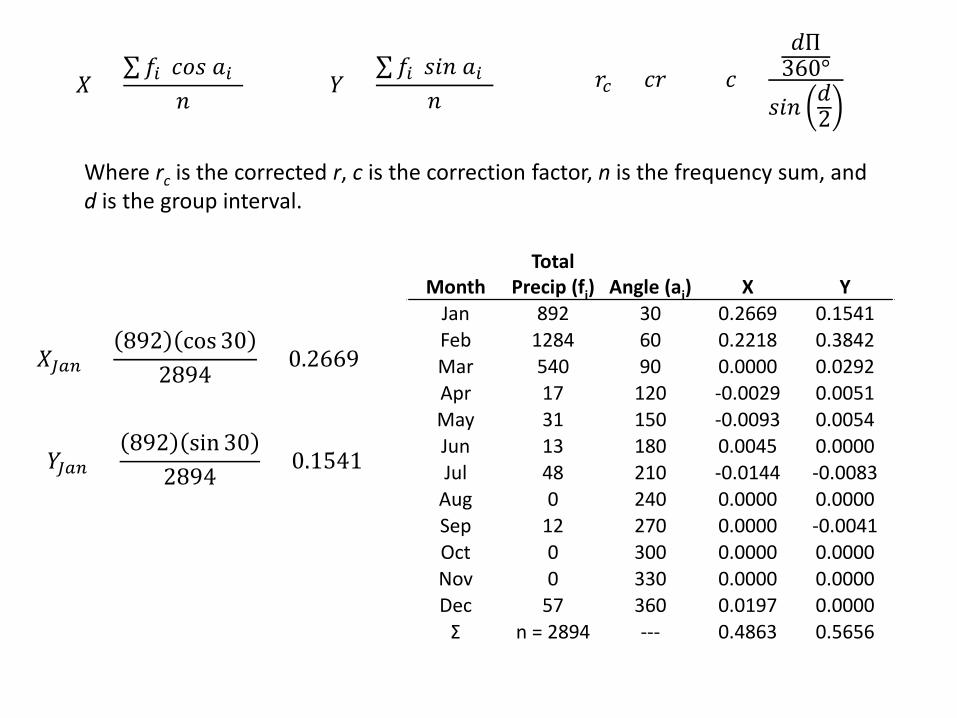
𝑋𝑋 =∑𝑓𝑓𝑖𝑖(𝑐𝑐𝑚𝑚𝑑𝑑 𝑖𝑖𝑖𝑖)
𝐴𝐴𝑌𝑌 =
∑𝑓𝑓𝑖𝑖(𝑑𝑑𝑖𝑖𝐴𝐴 𝑖𝑖𝑖𝑖)𝐴𝐴
𝑑𝑑𝑐𝑐 = 𝑐𝑐𝑑𝑑 𝑐𝑐 =𝑑𝑑Π
360°𝑑𝑑𝑖𝑖𝐴𝐴 𝑑𝑑
2
Where rc is the corrected r, c is the correction factor, n is the frequency sum, and d is the group interval.
MonthTotal
Precip (fi) Angle (ai) X YJan 892 30 0.2669 0.1541Feb 1284 60 0.2218 0.3842Mar 540 90 0.0000 0.0292Apr 17 120 -0.0029 0.0051May 31 150 -0.0093 0.0054Jun 13 180 0.0045 0.0000Jul 48 210 -0.0144 -0.0083
Aug 0 240 0.0000 0.0000Sep 12 270 0.0000 -0.0041Oct 0 300 0.0000 0.0000Nov 0 330 0.0000 0.0000Dec 57 360 0.0197 0.0000
Σ n = 2894 --- 0.4863 0.5656
𝑋𝑋𝐽𝐽𝐽𝐽𝐽𝐽 =892 cos 30
2894 = 0.2669
𝑌𝑌𝐽𝐽𝐽𝐽𝐽𝐽 =892 sin 30
2894 = 0.1541
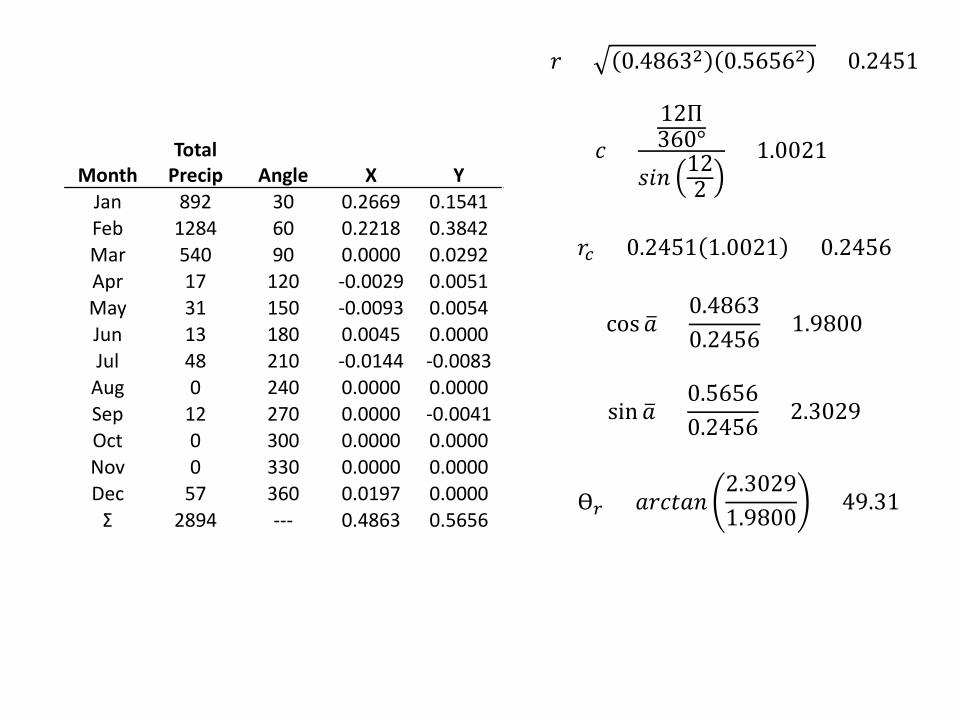
MonthTotal
Precip Angle X YJan 892 30 0.2669 0.1541Feb 1284 60 0.2218 0.3842Mar 540 90 0.0000 0.0292Apr 17 120 -0.0029 0.0051May 31 150 -0.0093 0.0054Jun 13 180 0.0045 0.0000Jul 48 210 -0.0144 -0.0083
Aug 0 240 0.0000 0.0000Sep 12 270 0.0000 -0.0041Oct 0 300 0.0000 0.0000Nov 0 330 0.0000 0.0000Dec 57 360 0.0197 0.0000
Σ 2894 --- 0.4863 0.5656
𝑑𝑑 = 0.48632 0.56562 = 0.2451
cos �𝑖𝑖 =0.48630.2456
= 1.9800
𝑑𝑑𝑐𝑐 = 0.2451 1.0021 = 0.2456
𝑐𝑐 =12Π360°
𝑑𝑑𝑖𝑖𝐴𝐴 122
= 1.0021
sin �𝑖𝑖 =0.56560.2456 = 2.3029
Ɵ𝑟𝑟 = 𝑖𝑖𝑑𝑑𝑐𝑐𝑚𝑚𝑖𝑖𝐴𝐴2.30291.9800 = 49.31
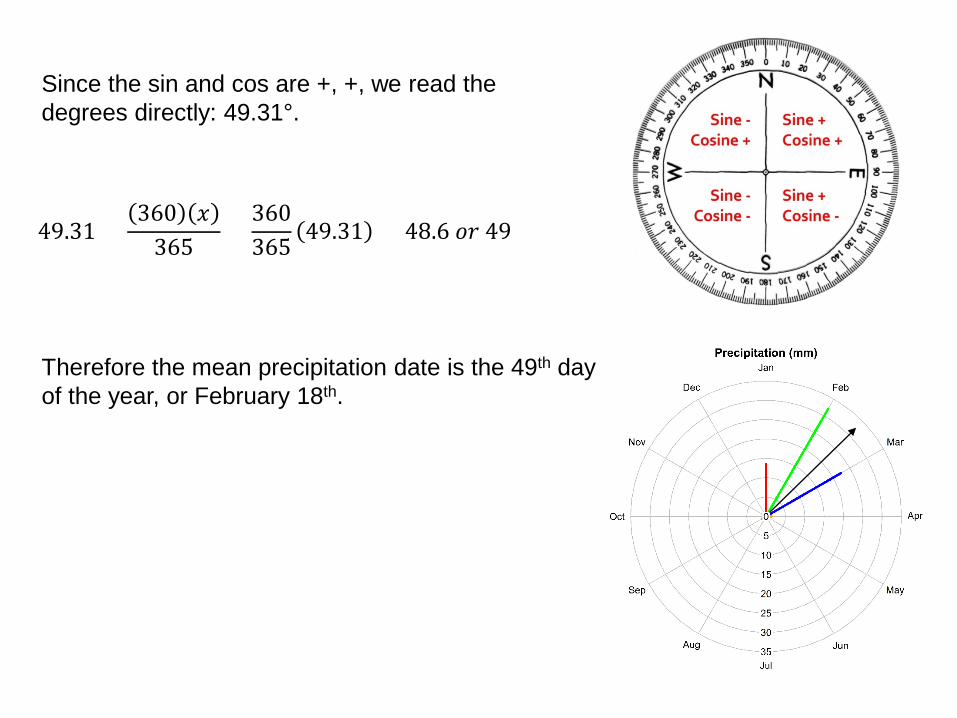
Since the sin and cos are +, +, we read the degrees directly: 49.31°.
49.31 =360 𝑥𝑥
365=
360365 49.31 = 48.6 𝑚𝑚𝑑𝑑 49
Therefore the mean precipitation date is the 49th day of the year, or February 18th.
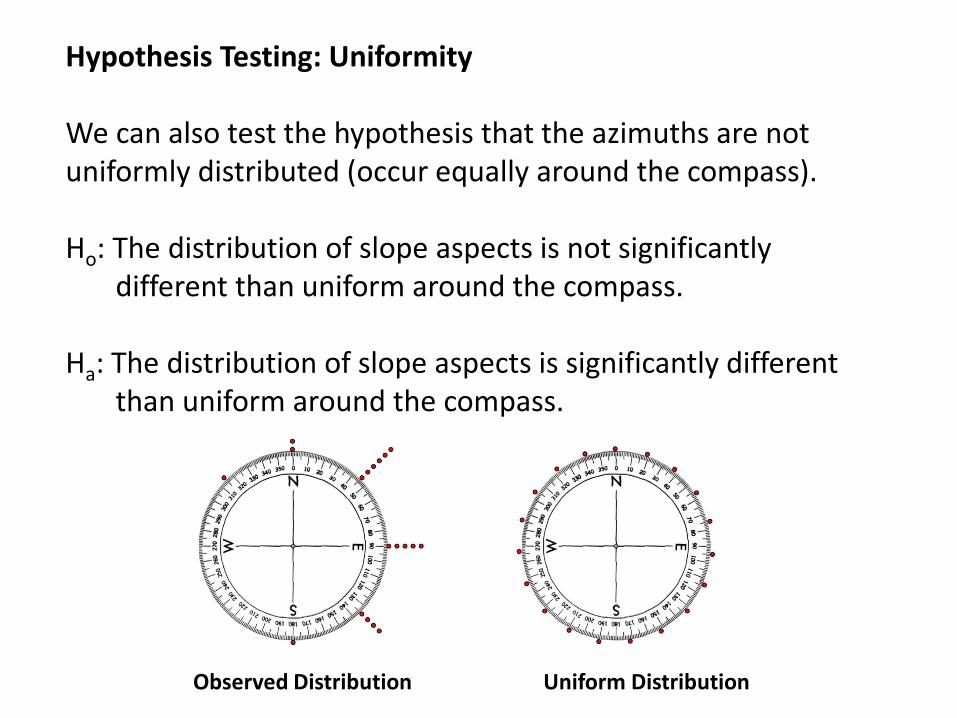
Hypothesis Testing: Uniformity
We can also test the hypothesis that the azimuths are notuniformly distributed (occur equally around the compass).
Ho: The distribution of slope aspects is not significantlydifferent than uniform around the compass.
Ha: The distribution of slope aspects is significantly different than uniform around the compass.
Observed Distribution Uniform Distribution
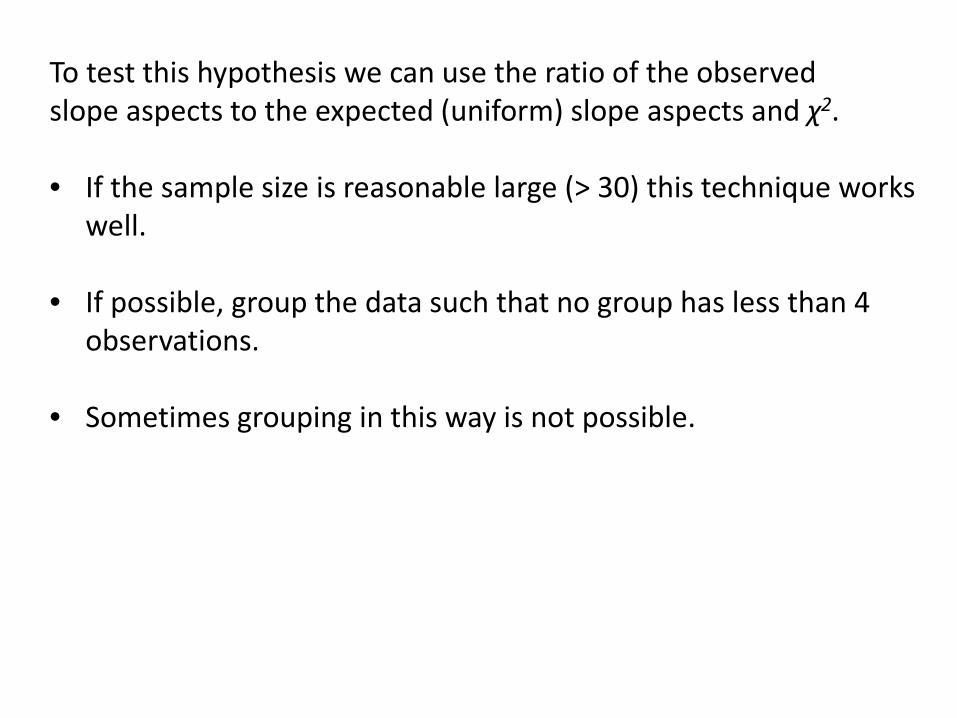
To test this hypothesis we can use the ratio of the observedslope aspects to the expected (uniform) slope aspects and χ2.
• If the sample size is reasonable large (> 30) this technique works well.
• If possible, group the data such that no group has less than 4 observations.
• Sometimes grouping in this way is not possible.
∑ −=
i
ii
fff
ˆ)ˆ( 2
2χ
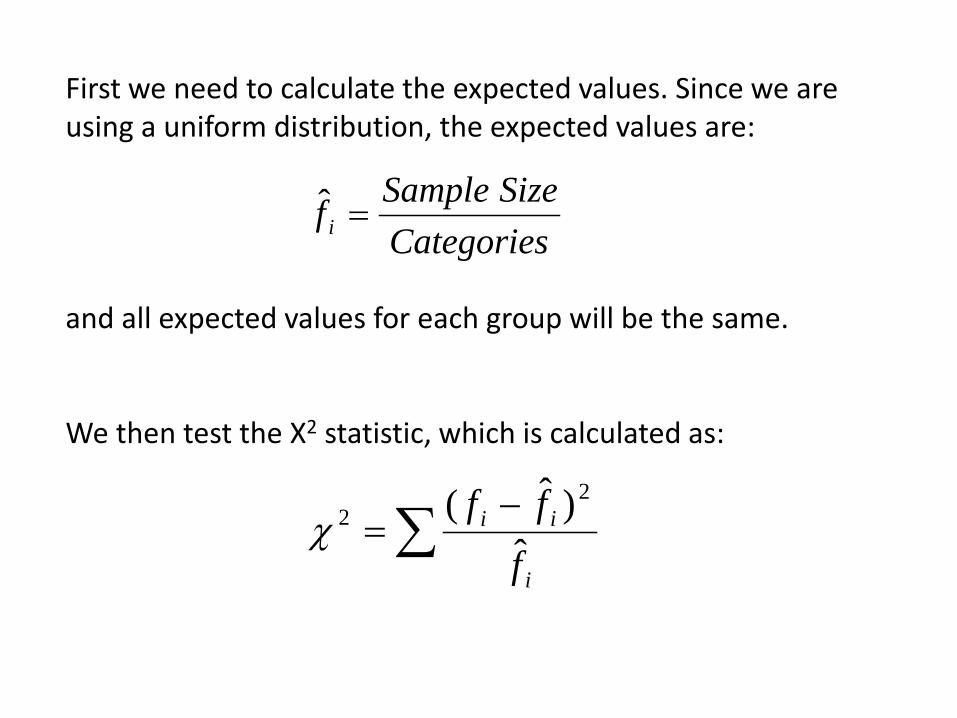
First we need to calculate the expected values. Since we areusing a uniform distribution, the expected values are:
and all expected values for each group will be the same.
We then test the X2 statistic, which is calculated as:
CategoriesSizeSamplefi =ˆ
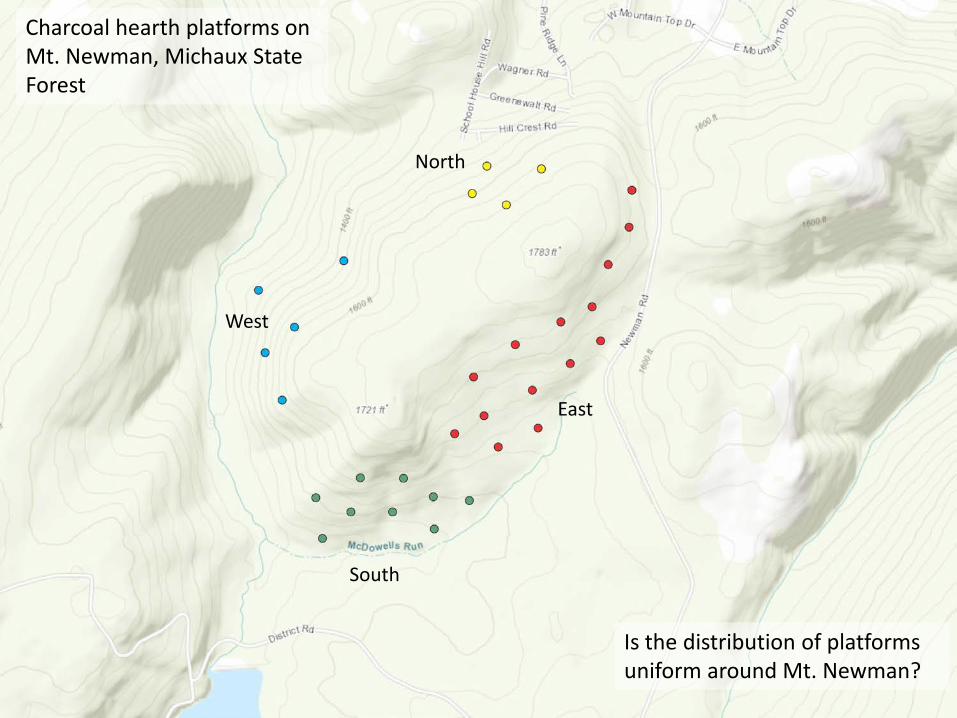
Charcoal hearth platforms on Mt. Newman, Michaux StateForest
Is the distribution of platforms uniform around Mt. Newman?
West
South
North
East
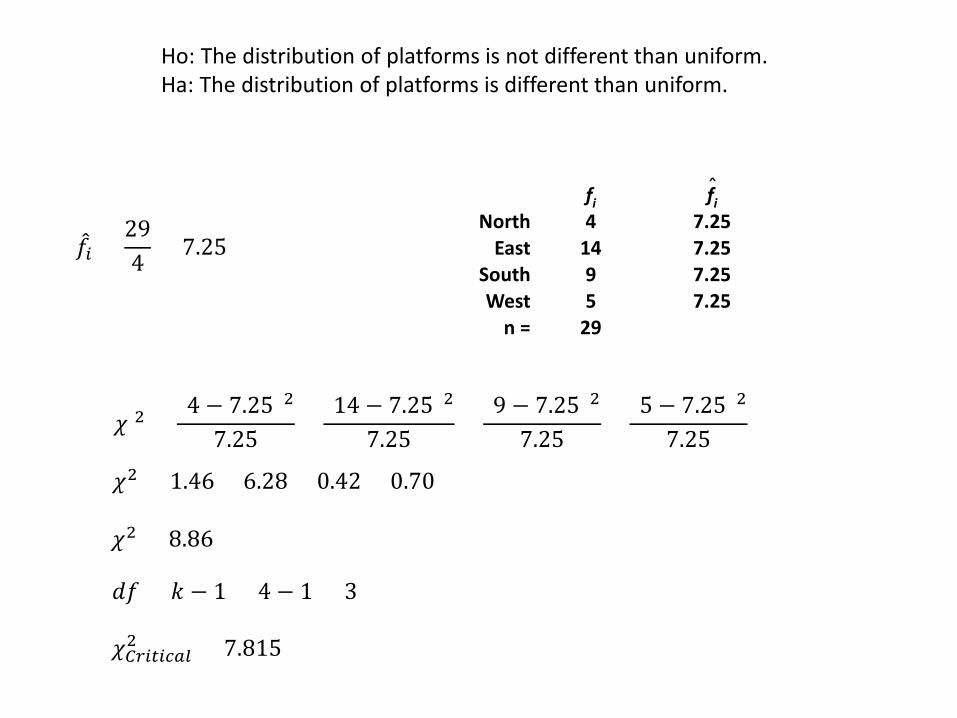
fi fiNorth 4 7.25
East 14 7.25South 9 7.25West 5 7.25
n = 29
ˆ
𝑓𝑓𝑖𝑖 =294
= 7.25
𝜒𝜒 2 =(4 − 7.25)2
7.25 +(14 − 7.25)2
7.25 +(9 − 7.25)2
7.25 +(5 − 7.25)2
7.25
𝜒𝜒2 = 1.46 + 6.28 + 0.42 + 0.70
𝜒𝜒2 = 8.86
𝑑𝑑𝑓𝑓 = 𝑘𝑘 − 1 = 4 − 1 = 3
𝜒𝜒𝐶𝐶𝑟𝑟𝑖𝑖𝐶𝐶𝑖𝑖𝑐𝑐𝐽𝐽𝐶𝐶2 = 7.815
Ho: The distribution of platforms is not different than uniform.Ha: The distribution of platforms is different than uniform.
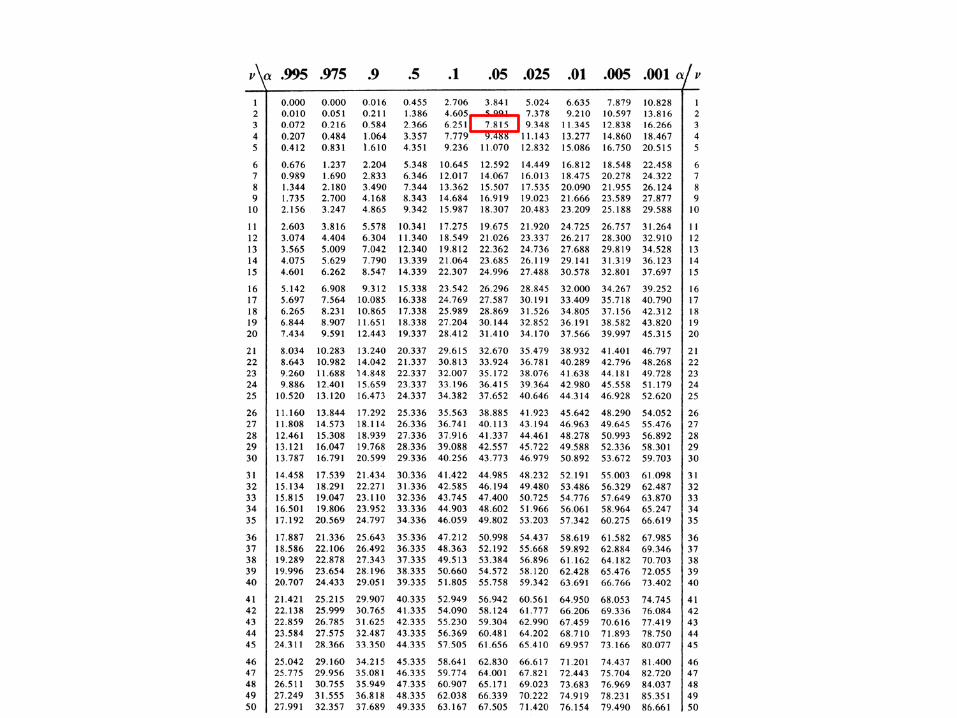
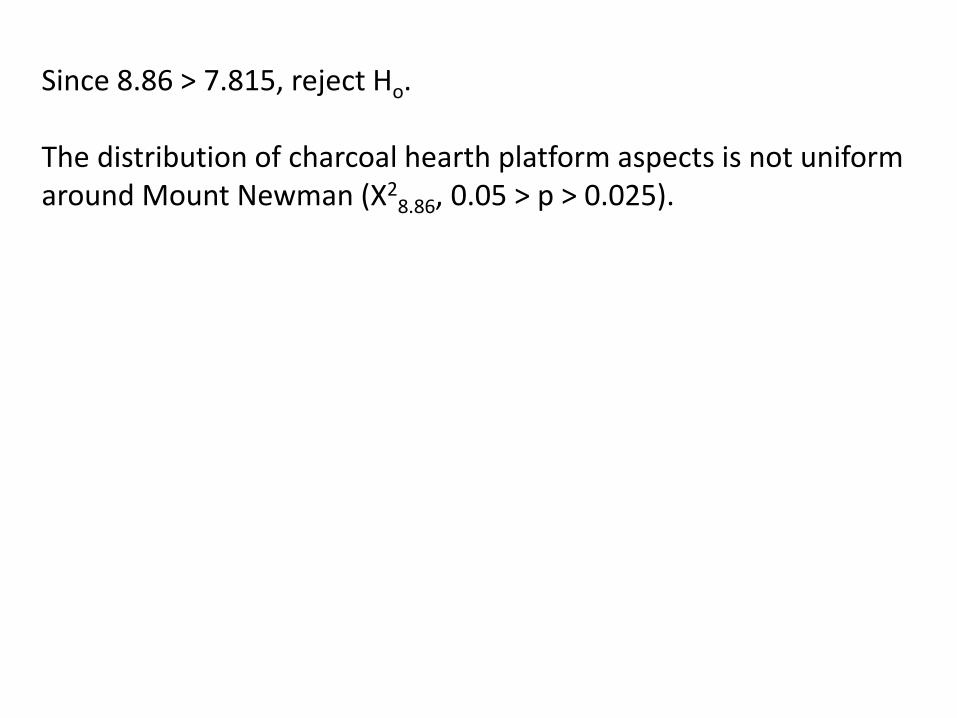
Since 8.86 > 7.815, reject Ho.
The distribution of charcoal hearth platform aspects is not uniform around Mount Newman (X2
8.86, 0.05 > p > 0.025).
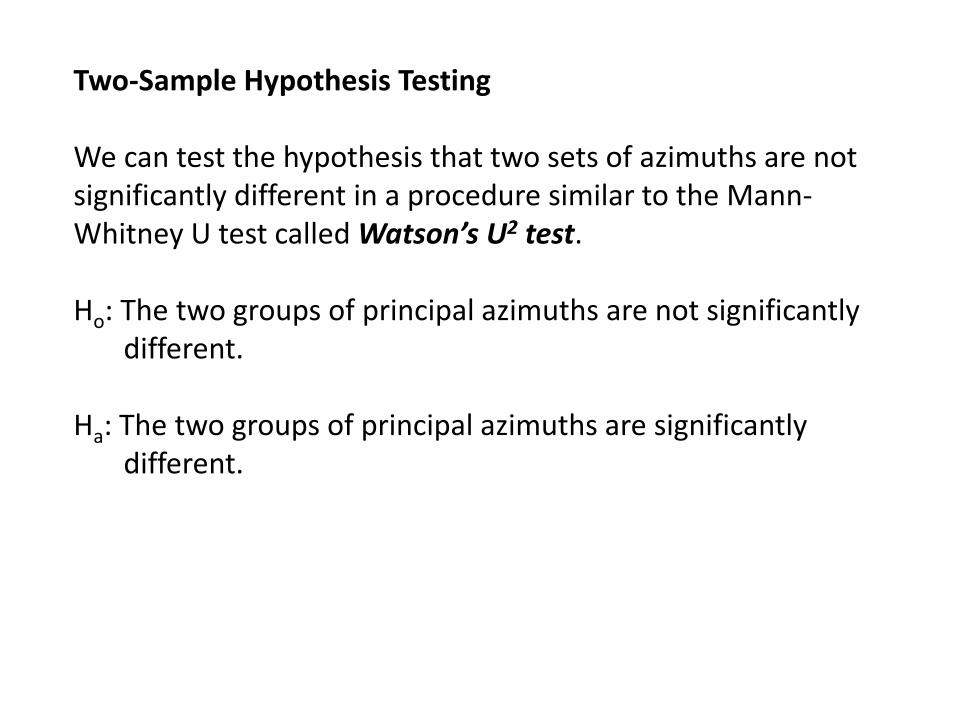
Two-Sample Hypothesis Testing
We can test the hypothesis that two sets of azimuths are notsignificantly different in a procedure similar to the Mann-Whitney U test called Watson’s U2 test.
Ho: The two groups of principal azimuths are not significantlydifferent.
Ha: The two groups of principal azimuths are significantlydifferent.
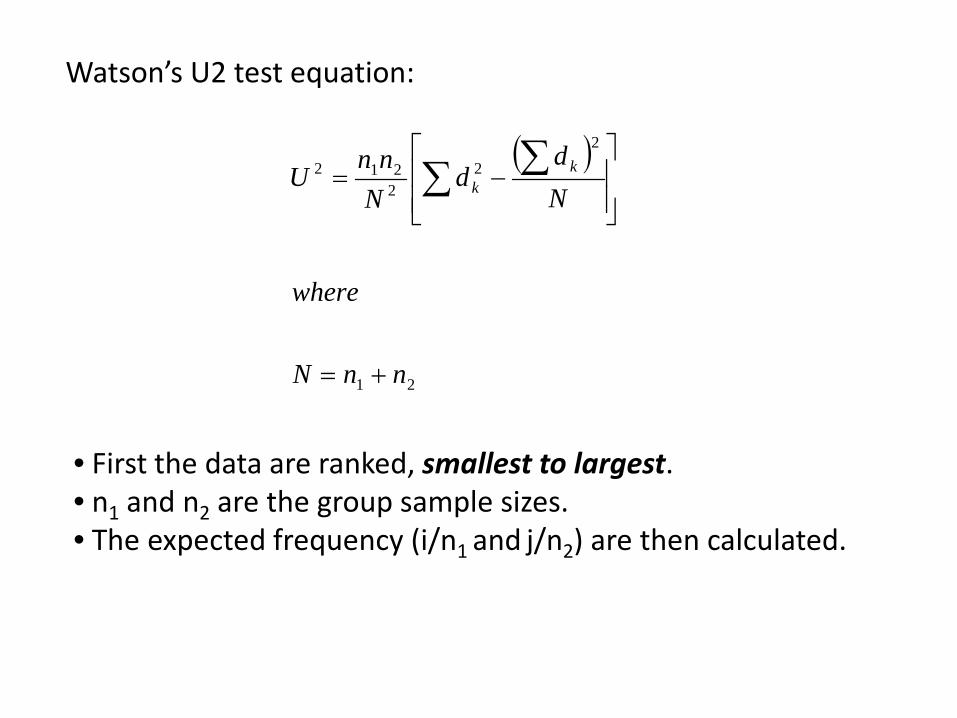
• First the data are ranked, smallest to largest.• n1 and n2 are the group sample sizes.• The expected frequency (i/n1 and j/n2) are then calculated.
( )
21
22
2212
nnN
where
Nd
dN
nnU kk
+=
−= ∑∑
Watson’s U2 test equation:
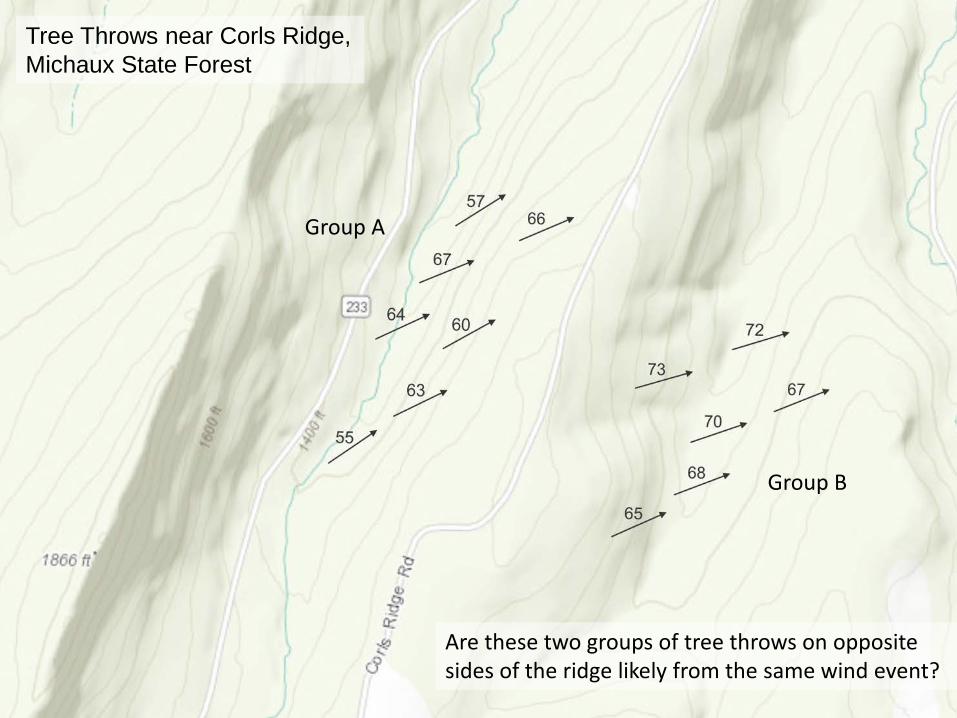
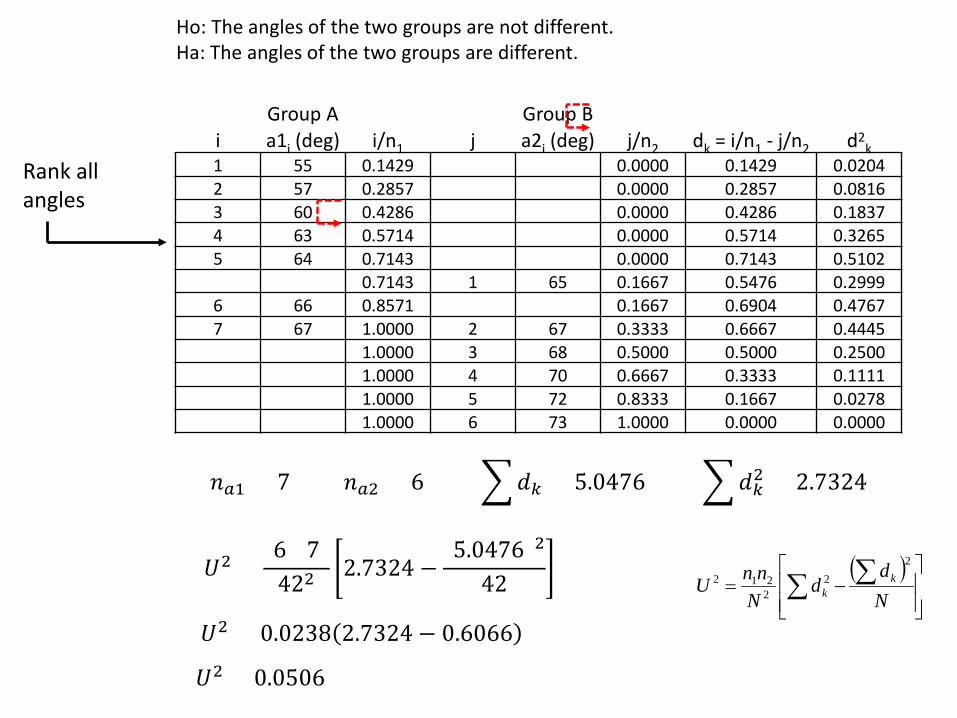
Group A
Group B
Tree Throws near Corls Ridge,Michaux State Forest
Are these two groups of tree throws on opposite sides of the ridge likely from the same wind event?
( )
−= ∑∑ N
dd
NnnU k
k
22
2212
Group A Group Bi a1i (deg) i/n1 j a2i (deg) j/n2 dk = i/n1 - j/n2 d2
k1 55 0.1429 0.0000 0.1429 0.02042 57 0.2857 0.0000 0.2857 0.08163 60 0.4286 0.0000 0.4286 0.18374 63 0.5714 0.0000 0.5714 0.32655 64 0.7143 0.0000 0.7143 0.5102
0.7143 1 65 0.1667 0.5476 0.29996 66 0.8571 0.1667 0.6904 0.47677 67 1.0000 2 67 0.3333 0.6667 0.4445
1.0000 3 68 0.5000 0.5000 0.25001.0000 4 70 0.6667 0.3333 0.11111.0000 5 72 0.8333 0.1667 0.02781.0000 6 73 1.0000 0.0000 0.0000
Rank all angles
𝐴𝐴𝐽𝐽𝑎 = 7 𝐴𝐴𝐽𝐽2 = 6 �𝑑𝑑𝑘𝑘 = 5.0476 �𝑑𝑑𝑘𝑘2 = 2.7324
𝑈𝑈2 =(6)(7)
422 2.7324 −(5.0476)2
42
𝑈𝑈2 = 0.0238 2.7324 − 0.6066
𝑈𝑈2 = 0.0506
Ho: The angles of the two groups are not different.Ha: The angles of the two groups are different.
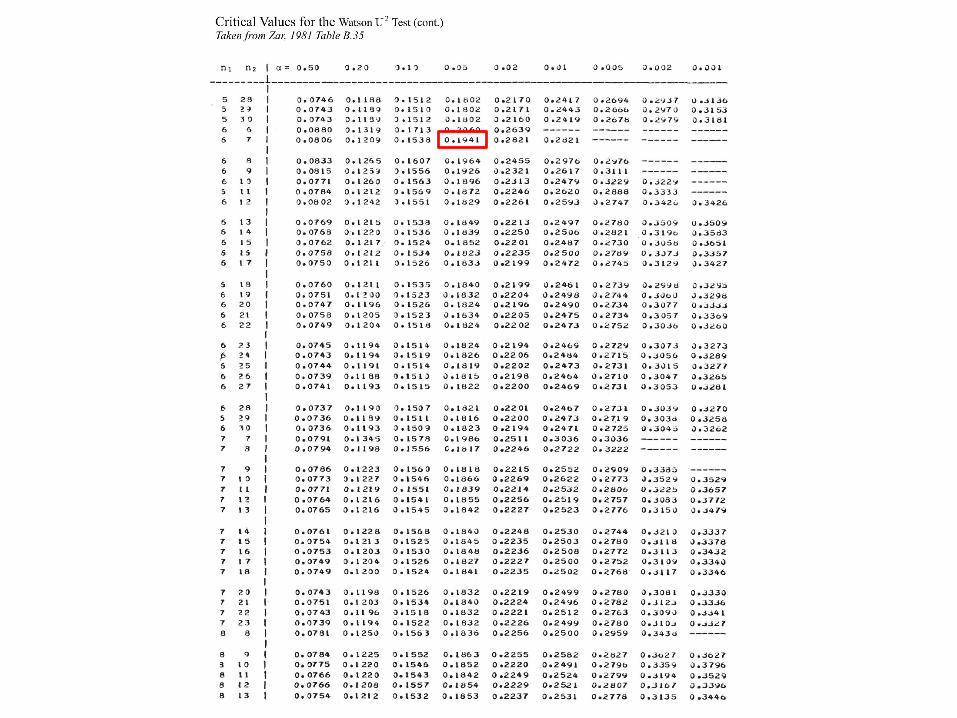
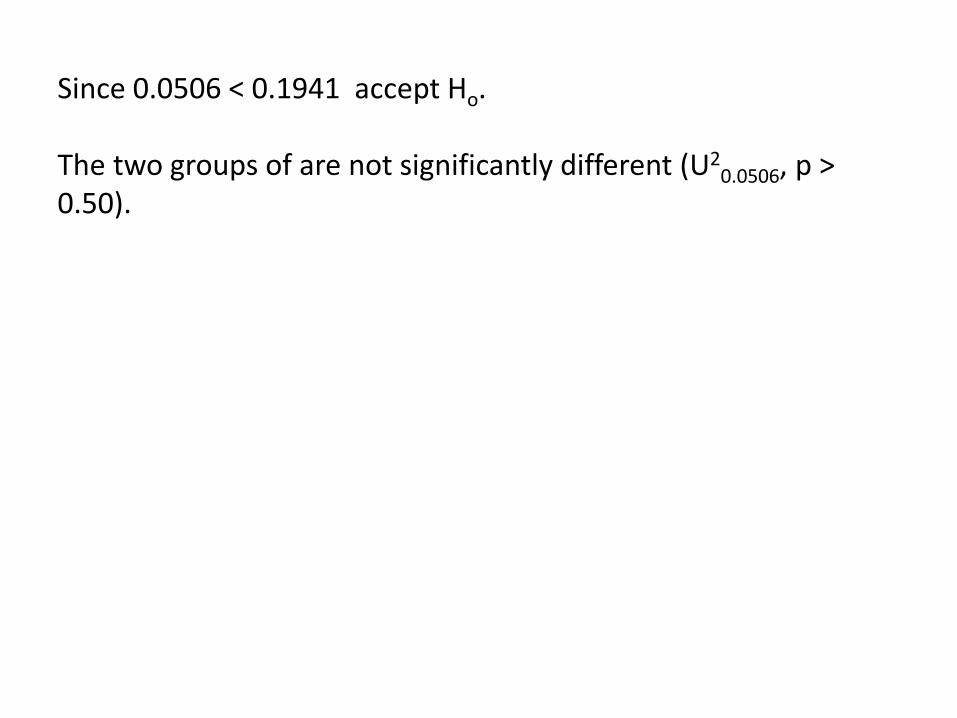
Since 0.0506 < 0.1941 accept Ho.
The two groups of are not significantly different (U20.0506, p >
0.50).
Related Documents