ASIA-PACIFIC RESEARCH AND TRAINING NETWORK ON TRADE Working Paper NO. 144 | APRIL 2014 Bala Ramasamy Matthew Yeung Enter the dragon: Policies to attract Chinese investment

Welcome message from author
This document is posted to help you gain knowledge. Please leave a comment to let me know what you think about it! Share it to your friends and learn new things together.
Transcript

ASIA-PACIFIC RESE
ASIA-PACIFIC RESEARCH AND TRAINING NETWORK ON TRADE
Working Paper NO. 144 | APRIL 2014
Bala Ramasamy
Matthew Yeung
Enter the dragon: Policies to
attract Chinese investment
The Asia-Pacific Research and Training Network on Trade (ARTNeT) is an open regional
network of research and academic institutions specializing in international trade policy and
facilitation issues. IDRC, UNCTAD, UNDP, ESCAP and WTO, as core network partners,
provide substantive and/or financial support to the network. The Trade and Investment
Division of ESCAP, the regional branch of the United Nations for Asia and the Pacific,
provides the Secretariat of the network and a direct regional link to trade policymakers and
other international organizations.
The ARTNeT Working Paper Series disseminates the findings of work in progress to
encourage the exchange of ideas about trade issues. An objective of the series is to publish
the findings quickly, even if the presentations are less than fully polished. ARTNeT Working
Papers are available online at www.artnetontrade.org. All material in the Working Papers
may be freely quoted or reprinted, but acknowledgment is requested, together with a copy of
the publication containing the quotation or reprint. The use of the working papers for any
commercial purpose, including resale, is prohibited.
Disclaimer:
The designations employed and the presentation of the material in this Working Paper do
not imply the expression of any opinion whatsoever on the part of the Secretariat of the
United Nations concerning the legal status of any country, territory, city or area, or of its
authorities, or concerning the delimitation of its frontiers or boundaries. Where the
designation “country or area” appears, it covers countries, territories, cities or areas.
Bibliographical and other references have, wherever possible, been verified. The United
Nations bears no responsibility for the availability or functioning of URLs. The views
expressed in this publication are those of the author(s) and do not necessarily reflect the
views of the United Nations. The opinions, figures and estimates set forth in this publication
are the responsibility of the author(s), and should not necessarily be considered as reflecting
the views or carrying the endorsement of the United Nations. Any errors are the
responsibility of the author(s). Mention of firm names and commercial products does not
imply the endorsement of the United Nations.
© ARTNeT 2014
NO. 144 | APRIL 2014
Enter the dragon: Policies to attract
Chinese investment
Bala Ramasamy and Matthew Yeung*
* Bala Ramasamy is Professor of Economics at the China Europe International Business School in Shanghai,
China and Matthew Yeung is an Assistant Professor at the Open University of Hong Kong, China. The technical support of the United Nations Economic and Social Commission for Asia and the Pacific and ARTNeT Secretariats is gratefully acknowledged. Any remaining errors are the responsibility of the authors. Please contact the corresponding author at [email protected].
WORKING PAPER ASIA-PACIFIC RESEARCH AND TRAINING NETWORK ON TRADE
Please cite this paper as: Ramasamy, Bala and Matthew Yeung (2014). Enter the
dragon: Policies to attract Chinese investment,
ARTNeT Working Paper Series No. 144, April 2014, Bangkok, ESCAP.
Available at www.artnetontrade.org
1
Abstract:
Over the last ten years, Chinese enterprises have become more multi-national in nature.
China’s outward foreign direct investment (OFDI) has been growing at a phenomenal rate. In
2012, China became the third largest investor, after the US and Japan; and the largest
investor among developing countries. How can host governments attract more of this
Chinese capital? What are some short to medium term policies that host governments can
initiate to make their respective nations attractive to Chinese investors? We consider these
questions by utilizing a best-worst choice exercise among 114 senior corporate decision-
makers of Chinese companies who have planned or are planning to globalize. Using the
maximum difference scaling methodology, we rank 19 most common determinants that
influence FDI location choice. We propose five “low hanging fruits” that policy-makers should
consider that could ensure their countries come within the radar of Chinese multi-nationals.
JEL classification: F21, F23, F40
Keywords: Foreign Direct Investment (FDI), outward FDI, FDI policies, China, Investment,
Maximum difference scaling
1
Contents
Introduction ........................................................................................................................... 3
1. China’s OFDI: Trends, destinations and sectors ............................................................... 4
2. What attracts Chinese investments: Hypotheses development ......................................... 8
3. Data and method ............................................................................................................ 15
4. Results ............................................................................................................................ 20
5. Implications for policymakers .......................................................................................... 23
6. Conclusion and limitations ............................................................................................... 25
References ......................................................................................................................... 27
2
List of Tables
Table 1: FDI inflows and outflows, recent years.
Table 2a: Significant destinations of OFDI from China
Table 2b: Shares of China’s OFDI by destinations
Table 3: China’s OFDI, sectoral distribution
Table 4: Profile of respondents
Table 5: The choice of determinants included in the study
Table 6: A sample of most/least important evaluation task
Table 7: Summary statistics of relative importance of factors that influence investment
decisions
List of Figures
Figure 1: Best-worst ranking of determinants
Figure 2: Private vs. state-owned ranking of determinants

3
Introduction
An obvious consequence of the economic crisis that started in late 2007 has been the effect
on global foreign direct investment (FDI) trends. In 2012, global FDI outflows continued its
downward trend, decreasing by 17 per cent from the previous year. The EU was a significant
region that reduced its FDI outflow in contrast to the developing countries that became a
relatively more important source of capital. The share of FDI outflows by developed
economies declined from 88 per cent to 65 per cent between 2000 and 2011 while
developing and transition economies increased their share from 12 per cent to 35 per cent
during the same period (UNCTAD, 2013). Among developing countries, China is increasingly
becoming an important source of capital. In the 1990s, the average annual FDI outflow from
China was about USD 2.3 billion. In the first half of 2000s, the annual average increased to
about USD 5.2 billion. Since 2006, the increase in China’s outward foreign direct investment
(OFDI) has been phenomenal. In 2012, China’s OFDI reached USD 84.2 billion. In terms of
proportion, while in the 1990s, China’s outward FDI accounted for less than 1 per cent of
total world FDI outflow; in 2012, this surpassed the 6 per cent mark. This is also close to 20
per cent of FDI outflow among developing countries.
The benefits that FDI brings to a nation are evident from the literature. They range from job
creation to technological advancement as well as creation of new industries through the spill-
over effects of FDI. The many benefits that FDI offers on one hand, and the relative scarcity
of FDI outflow on the other, create a competition for foreign capital. As Chinese businesses
continue their “go global” strategy, it becomes increasingly important for policy makers to
identify those factors that Chinese decision-makers consider to be important location factors;
and structure their policies accordingly so that their respective countries are competitive in
this FDI market. The objective of this paper is to identify location factors that Chinese
managers look for when making internationalization decisions and the relative magnitude of
the importance of various factors. The novelty of our study lies in the type of respondents we
utilize for data collection and the method of data collection. While previous studies have
used China’s OFDI from various sources (China’s Statistical Bureau, UNCTAD, Financial
Times etc.) to consider the determinants of OFDI at the macro level, we base our analysis
on the choices of actual decision makers who are senior managers of Chinese companies
(both state-owned and private) involved in the internationalization process of their respective
companies. Furthermore, we utilize best-worst choice decisions in our questionnaire design
4
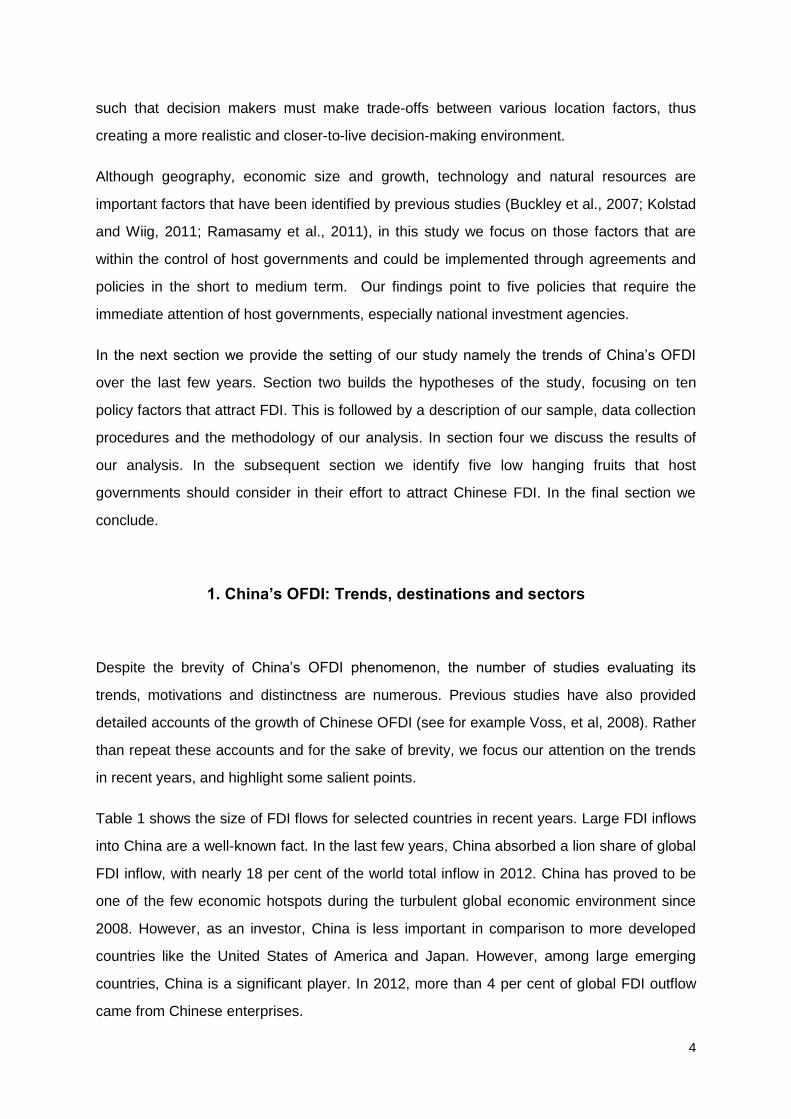
such that decision makers must make trade-offs between various location factors, thus
creating a more realistic and closer-to-live decision-making environment.
Although geography, economic size and growth, technology and natural resources are
important factors that have been identified by previous studies (Buckley et al., 2007; Kolstad
and Wiig, 2011; Ramasamy et al., 2011), in this study we focus on those factors that are
within the control of host governments and could be implemented through agreements and
policies in the short to medium term. Our findings point to five policies that require the
immediate attention of host governments, especially national investment agencies.
In the next section we provide the setting of our study namely the trends of China’s OFDI
over the last few years. Section two builds the hypotheses of the study, focusing on ten
policy factors that attract FDI. This is followed by a description of our sample, data collection
procedures and the methodology of our analysis. In section four we discuss the results of
our analysis. In the subsequent section we identify five low hanging fruits that host
governments should consider in their effort to attract Chinese FDI. In the final section we
conclude.
1. China’s OFDI: Trends, destinations and sectors
Despite the brevity of China’s OFDI phenomenon, the number of studies evaluating its
trends, motivations and distinctness are numerous. Previous studies have also provided
detailed accounts of the growth of Chinese OFDI (see for example Voss, et al, 2008). Rather
than repeat these accounts and for the sake of brevity, we focus our attention on the trends
in recent years, and highlight some salient points.
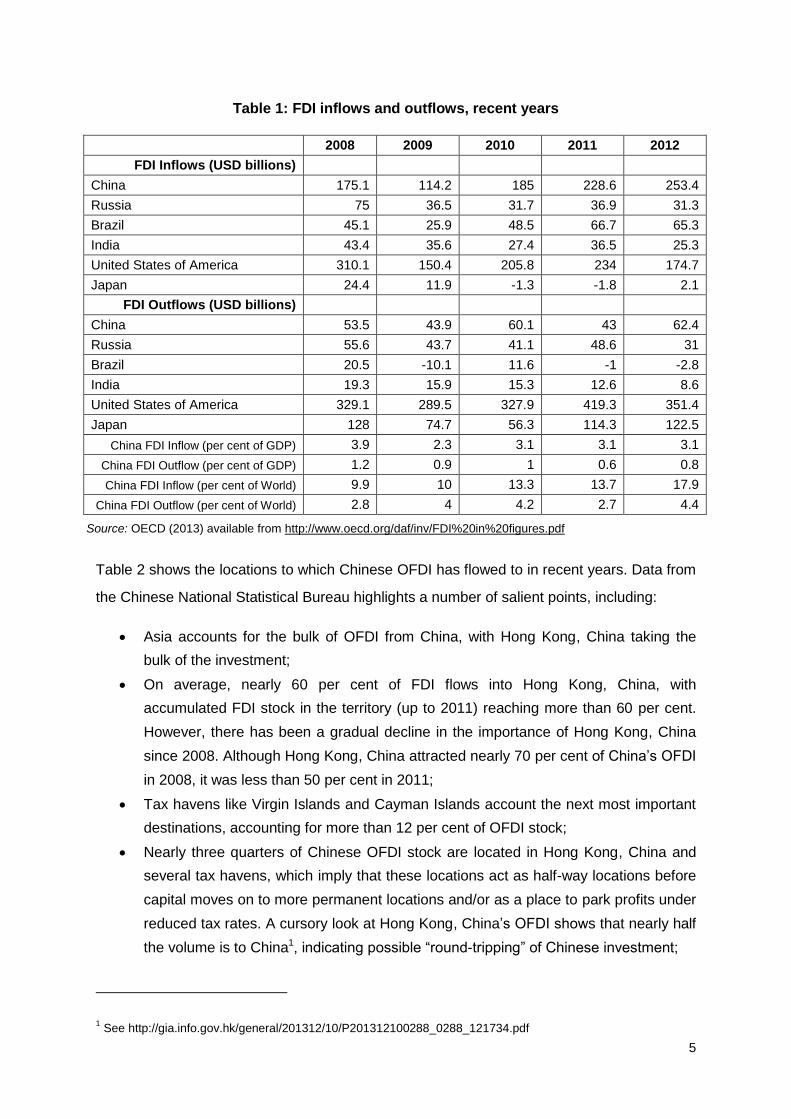
Table 1 shows the size of FDI flows for selected countries in recent years. Large FDI inflows
into China are a well-known fact. In the last few years, China absorbed a lion share of global
FDI inflow, with nearly 18 per cent of the world total inflow in 2012. China has proved to be
one of the few economic hotspots during the turbulent global economic environment since
2008. However, as an investor, China is less important in comparison to more developed
countries like the United States of America and Japan. However, among large emerging
countries, China is a significant player. In 2012, more than 4 per cent of global FDI outflow
came from Chinese enterprises.
5
Table 1: FDI inflows and outflows, recent years
2008 2009 2010 2011 2012
FDI Inflows (USD billions)
China 175.1 114.2 185 228.6 253.4
Russia 75 36.5 31.7 36.9 31.3
Brazil 45.1 25.9 48.5 66.7 65.3
India 43.4 35.6 27.4 36.5 25.3
United States of America 310.1 150.4 205.8 234 174.7
Japan 24.4 11.9 -1.3 -1.8 2.1
FDI Outflows (USD billions)
China 53.5 43.9 60.1 43 62.4
Russia 55.6 43.7 41.1 48.6 31
Brazil 20.5 -10.1 11.6 -1 -2.8
India 19.3 15.9 15.3 12.6 8.6
United States of America 329.1 289.5 327.9 419.3 351.4
Japan 128 74.7 56.3 114.3 122.5
China FDI Inflow (per cent of GDP) 3.9 2.3 3.1 3.1 3.1
China FDI Outflow (per cent of GDP) 1.2 0.9 1 0.6 0.8
China FDI Inflow (per cent of World) 9.9 10 13.3 13.7 17.9
China FDI Outflow (per cent of World) 2.8 4 4.2 2.7 4.4
Source: OECD (2013) available from http://www.oecd.org/daf/inv/FDI%20in%20figures.pdf
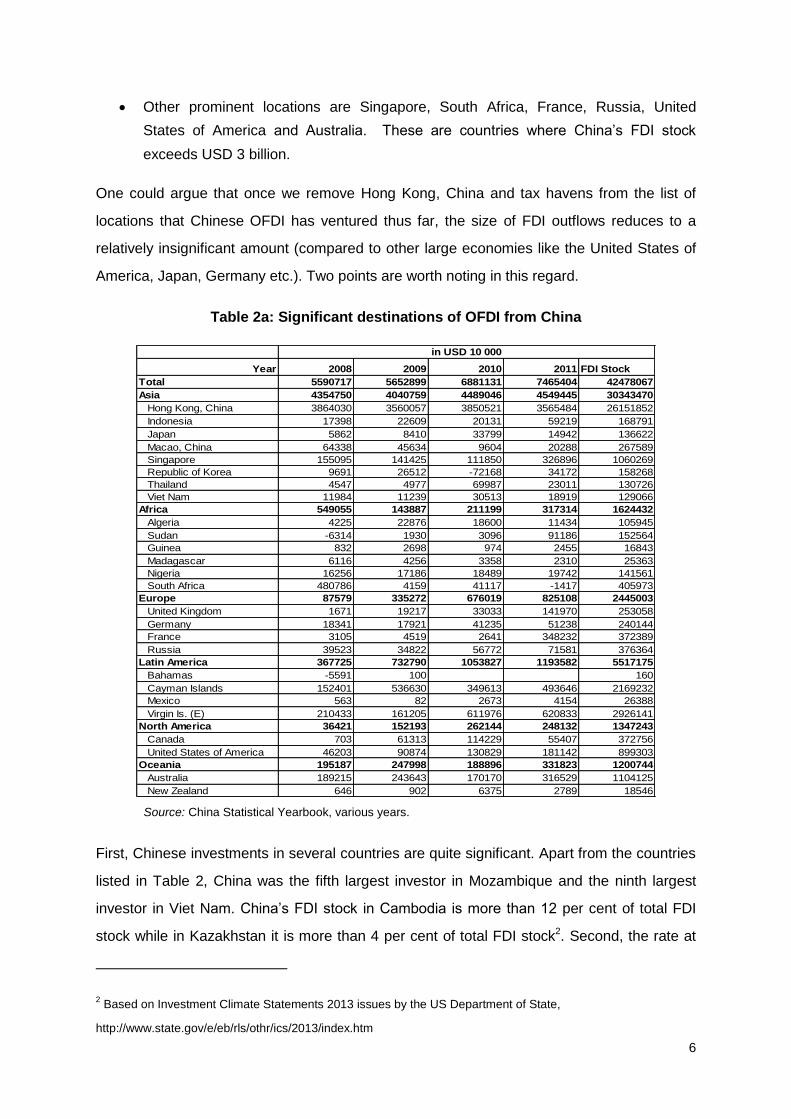
Table 2 shows the locations to which Chinese OFDI has flowed to in recent years. Data from
the Chinese National Statistical Bureau highlights a number of salient points, including:
Asia accounts for the bulk of OFDI from China, with Hong Kong, China taking the
bulk of the investment;
On average, nearly 60 per cent of FDI flows into Hong Kong, China, with
accumulated FDI stock in the territory (up to 2011) reaching more than 60 per cent.
However, there has been a gradual decline in the importance of Hong Kong, China
since 2008. Although Hong Kong, China attracted nearly 70 per cent of China’s OFDI
in 2008, it was less than 50 per cent in 2011;
Tax havens like Virgin Islands and Cayman Islands account the next most important
destinations, accounting for more than 12 per cent of OFDI stock;
Nearly three quarters of Chinese OFDI stock are located in Hong Kong, China and
several tax havens, which imply that these locations act as half-way locations before
capital moves on to more permanent locations and/or as a place to park profits under
reduced tax rates. A cursory look at Hong Kong, China’s OFDI shows that nearly half
the volume is to China1, indicating possible “round-tripping” of Chinese investment;
1 See http://gia.info.gov.hk/general/201312/10/P201312100288_0288_121734.pdf
6
Other prominent locations are Singapore, South Africa, France, Russia, United
States of America and Australia. These are countries where China’s FDI stock
exceeds USD 3 billion.
One could argue that once we remove Hong Kong, China and tax havens from the list of
locations that Chinese OFDI has ventured thus far, the size of FDI outflows reduces to a
relatively insignificant amount (compared to other large economies like the United States of
America, Japan, Germany etc.). Two points are worth noting in this regard.
Table 2a: Significant destinations of OFDI from China
Year 2008 2009 2010 2011 FDI Stock
Total 5590717 5652899 6881131 7465404 42478067
Asia 4354750 4040759 4489046 4549445 30343470
Hong Kong, China 3864030 3560057 3850521 3565484 26151852
Indonesia 17398 22609 20131 59219 168791
Japan 5862 8410 33799 14942 136622
Macao, China 64338 45634 9604 20288 267589
Singapore 155095 141425 111850 326896 1060269
Republic of Korea 9691 26512 -72168 34172 158268
Thailand 4547 4977 69987 23011 130726
Viet Nam 11984 11239 30513 18919 129066
Africa 549055 143887 211199 317314 1624432
Algeria 4225 22876 18600 11434 105945
Sudan -6314 1930 3096 91186 152564
Guinea 832 2698 974 2455 16843
Madagascar 6116 4256 3358 2310 25363
Nigeria 16256 17186 18489 19742 141561
South Africa 480786 4159 41117 -1417 405973
Europe 87579 335272 676019 825108 2445003
United Kingdom 1671 19217 33033 141970 253058
Germany 18341 17921 41235 51238 240144
France 3105 4519 2641 348232 372389
Russia 39523 34822 56772 71581 376364
Latin America 367725 732790 1053827 1193582 5517175
Bahamas -5591 100 160
Cayman Islands 152401 536630 349613 493646 2169232
Mexico 563 82 2673 4154 26388
Virgin Is. (E) 210433 161205 611976 620833 2926141
North America 36421 152193 262144 248132 1347243
Canada 703 61313 114229 55407 372756
United States of America 46203 90874 130829 181142 899303
Oceania 195187 247998 188896 331823 1200744
Australia 189215 243643 170170 316529 1104125
New Zealand 646 902 6375 2789 18546
in USD 10 000
Source: China Statistical Yearbook, various years.
First, Chinese investments in several countries are quite significant. Apart from the countries
listed in Table 2, China was the fifth largest investor in Mozambique and the ninth largest
investor in Viet Nam. China’s FDI stock in Cambodia is more than 12 per cent of total FDI
stock while in Kazakhstan it is more than 4 per cent of total FDI stock2. Second, the rate at
2 Based on Investment Climate Statements 2013 issues by the US Department of State,
http://www.state.gov/e/eb/rls/othr/ics/2013/index.htm

7
which OFDI from China has increased since 2007 has been impressive, making it the third
largest source of FDI in 2012 (UNCTAD, 2013). In addition, foreign investments by private
Chinese companies are also increasing. Ramasamy et. al (2011) for instance found that
more than 47 per cent of FDI projects undertaken by their sample Chinese companies listed
on the Shanghai and Shenzhen stock exchanges were privately owned. Thus,
understanding the determinants of China’s OFDI, in anticipation of greater involvement of
Chinese businesses, particularly private ones, in international investments in the future is
definitely warranted
Table 2b: Shares of China’s OFDI by destinations
Year 2008 2009 2010 2011
Average
Annual FDI
Flow 2008-11 FDI Stock
Total
Asia 77.89 71.48 65.24 60.94 68.89 71.43
Hong Kong, China 69.12 62.98 55.96 47.76 58.95 61.57
Indonesia 0.31 0.40 0.29 0.79 0.45 0.40
Japan 0.10 0.15 0.49 0.20 0.24 0.32
Macao, China 1.15 0.81 0.14 0.27 0.59 0.63
Singapore 2.77 2.50 1.63 4.38 2.82 2.50
Republic of Korea 0.17 0.47 -1.05 0.46 0.01 0.37
Thailand 0.08 0.09 1.02 0.31 0.37 0.31
Viet Nam 0.21 0.20 0.44 0.25 0.28 0.30
Africa 9.82 2.55 3.07 4.25 4.92 3.82
Algeria 0.08 0.40 0.27 0.15 0.23 0.25
Sudan -0.11 0.03 0.04 1.22 0.30 0.36
Guinea 0.01 0.05 0.01 0.03 0.03 0.04
Madagascar 0.11 0.08 0.05 0.03 0.07 0.06
Nigeria 0.29 0.30 0.27 0.26 0.28 0.33
South Africa 8.60 0.07 0.60 -0.02 2.31 0.96
Europe 1.57 5.93 9.82 11.05 7.09 5.76
United Kingdom 0.03 0.34 0.48 1.90 0.69 0.60
Germany 0.33 0.32 0.60 0.69 0.48 0.57
France 0.06 0.08 0.04 4.66 1.21 0.88
Russia 0.71 0.62 0.83 0.96 0.78 0.89
Latin America 6.58 12.96 15.31 15.99 12.71 12.99
Bahamas -0.10 0.00 0.00 0.00 -0.02 0.00
Cayman Islands 2.73 9.49 5.08 6.61 5.98 5.11
Mexico 0.01 0.00 0.04 0.06 0.03 0.06
Virgin Is. (E) 3.76 2.85 8.89 8.32 5.96 6.89
North America 0.65 2.69 3.81 3.32 2.62 3.17
Canada 0.01 1.08 1.66 0.74 0.87 0.88
United States of America 0.83 1.61 1.90 2.43 1.69 2.12
Oceania 3.49 4.39 2.75 4.44 3.77 2.83
Australia 3.38 4.31 2.47 4.24 3.60 2.60
New Zealand 0.01 0.02 0.09 0.04 0.04 0.04
Percentage of total
Source: China Statistical Yearbook, various years.
In terms of sectoral distribution of OFDI, Table 3 shows that about a third of China’s
overseas investments are in leasing and business services and about 16 per cent in financial
intermediation. These two sectors account for about half of China’s OFDI stock and are
most likely related to destinations like Hong Kong, China and the tax havens mentioned
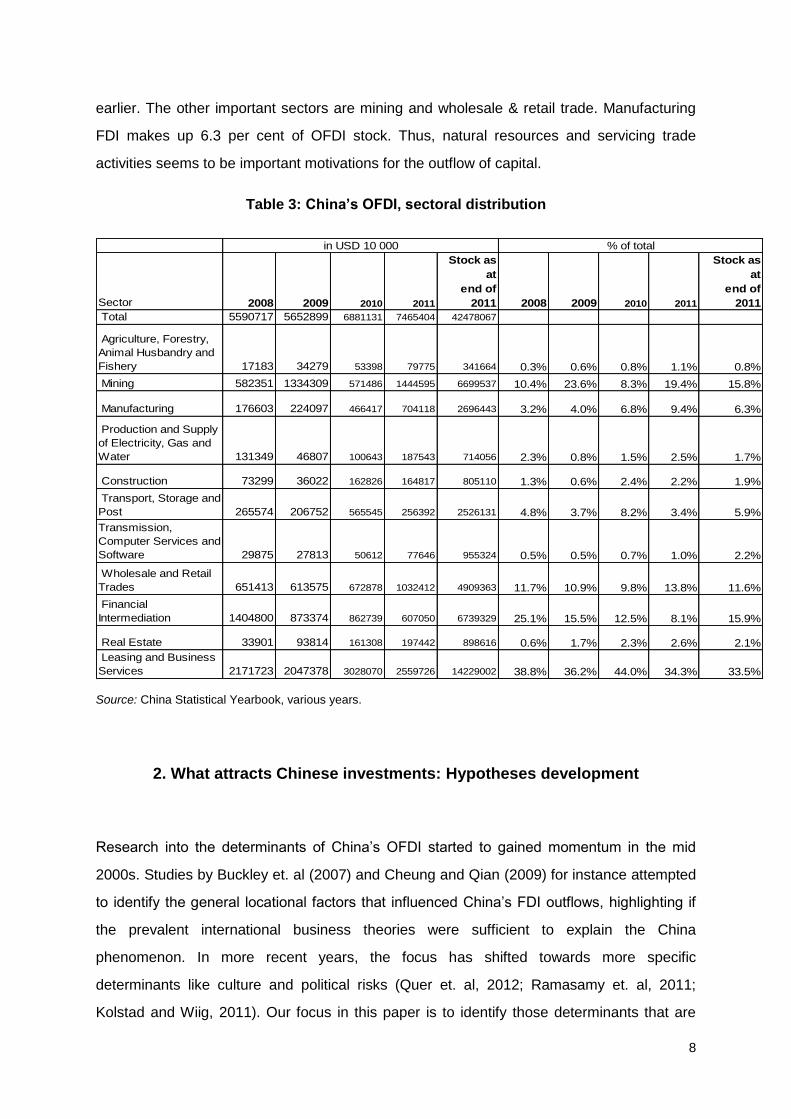
8
earlier. The other important sectors are mining and wholesale & retail trade. Manufacturing
FDI makes up 6.3 per cent of OFDI stock. Thus, natural resources and servicing trade
activities seems to be important motivations for the outflow of capital.
Table 3: China’s OFDI, sectoral distribution
Sector 2008 2009 2010 2011
Stock as
at
end of
2011 2008 2009 2010 2011
Stock as
at
end of
2011
Total 5590717 5652899 6881131 7465404 42478067
Agriculture, Forestry,
Animal Husbandry and
Fishery 17183 34279 53398 79775 341664 0.3% 0.6% 0.8% 1.1% 0.8%
Mining 582351 1334309 571486 1444595 6699537 10.4% 23.6% 8.3% 19.4% 15.8%
Manufacturing 176603 224097 466417 704118 2696443 3.2% 4.0% 6.8% 9.4% 6.3%
Production and Supply
of Electricity, Gas and
Water 131349 46807 100643 187543 714056 2.3% 0.8% 1.5% 2.5% 1.7%
Construction 73299 36022 162826 164817 805110 1.3% 0.6% 2.4% 2.2% 1.9%
Transport, Storage and
Post 265574 206752 565545 256392 2526131 4.8% 3.7% 8.2% 3.4% 5.9% Information
Transmission,
Computer Services and
Software 29875 27813 50612 77646 955324 0.5% 0.5% 0.7% 1.0% 2.2%
Wholesale and Retail
Trades 651413 613575 672878 1032412 4909363 11.7% 10.9% 9.8% 13.8% 11.6%
Financial
Intermediation 1404800 873374 862739 607050 6739329 25.1% 15.5% 12.5% 8.1% 15.9%
Real Estate 33901 93814 161308 197442 898616 0.6% 1.7% 2.3% 2.6% 2.1%
Leasing and Business
Services 2171723 2047378 3028070 2559726 14229002 38.8% 36.2% 44.0% 34.3% 33.5%
in USD 10 000 % of total
Source: China Statistical Yearbook, various years.
2. What attracts Chinese investments: Hypotheses development
Research into the determinants of China’s OFDI started to gained momentum in the mid
2000s. Studies by Buckley et. al (2007) and Cheung and Qian (2009) for instance attempted
to identify the general locational factors that influenced China’s FDI outflows, highlighting if
the prevalent international business theories were sufficient to explain the China
phenomenon. In more recent years, the focus has shifted towards more specific
determinants like culture and political risks (Quer et. al, 2012; Ramasamy et. al, 2011;
Kolstad and Wiig, 2011). Our focus in this paper is to identify those determinants that are
9
within the control of policy makers in the short to medium term. Although market size and
growth as determinants of FDI outflow generally (Chakrabarti, 2001) as well as in China’s
case (Buckley et. al, 2007 and others) is well established, these are factors that can only be
influenced in the longer term. On the other hand, negotiating a free trade agreement with
China, or encouraging more trade flows are policies that could be affected in the short to
medium term. These and other relevant policies are the hypotheses that we develop in the
following paragraphs.
If the purpose of FDI is to circumvent high import tariffs, Regional Trading Arrangements
(RTAs) involving China would reduce FDI to partner countries as arms length business
transaction may become a cheaper option. However, this could be true only for country-
specific market seeking FDI. On the other hand, if RTAs are designed to increase economic
activity of the region because of a larger common market and improved overall efficiency,
potential growth could be FDI enhancing (Blomstrom and Kokko, 1997). Case studies on
RTAs and FDI tend to show that these are indeed investment enhancing policies. In the case
of the NAFTA for instance, Mexico attracted large amounts of FDI both before and after the
agreement came into effect (Kokko, 1994 and Blomström et al., 1994). However, RTAs are
rarely included into empirical studies. In studies that included it as a determinant, there has
been strong support (Blonigen and Piger, 2011). It should be noted however, that FDI flows
between partner countries are only enhanced if the RTA allows for liberal FDI policies
including offering national treatment to foreign enterprises (Berger et. al, 2012). Medvedev’s
(2012) study indicates that RTAs formed in the last two decades tend to be more inclusive of
investment components and so are FDI enhancing.
In the context of Chinese businesses, RTAs can be attractive because it allows an extension
of the supply chain abroad to take advantage of capabilities available in partner countries.
This may include cheaper labour in relatively less developed economies like Myanmar and
Cambodia (as per Collie’s (2011) export platform variety) as well advanced technology in
more developed economies like the United Kingdom and Germany. Reduced barriers to
trade and investment via these RTAs can create an impetus for more investments into
partner countries. Given this, we hypothesize that:
H1: Chinese managers consider countries that have a trade agreement with China as
relatively more attractive investment locations.
10
The notion that increased trade and FDI flows between countries reduces the probability of
nations going into conflicts is well accepted. This proposition, also known as the liberal
peace hypothesis states that countries trading intensively with each other are less prone to
engage in bilateral conflict because it is easier to acquire goods through trade than through
armed conflicts (Rosecrance, 1986). In addition, the trading relationship increases contacts
between individuals, businesses and governments of both countries, and so political co-
operation is promoted. In the case of FDI, the argument that political relationships are
enhanced is even more compelling since FDI has positive effects on both host and home
countries and is longer term in nature (Polachek et. al, 2005). However, inter-state
relationship as a determinant of bilateral FDI has received limited attention. The focus in
international business and international political economy literature has been the role of
country specific attributes like political stability of a nation (Sethi et. al, 2003; Globerman and
Shapiro, 2003; etc.) or democratic institutions (Garland and Biglaiser, 2009; Jensen, 2008).
For a multinational, a soured bilateral relationship between home and host countries can
increase the risk of doing business as the fear of the host country expropriating the assets of
the multinational as an instrument of retaliation increases (Boehmer et al., 2001; Desbordes
and Vicard, 2005). Nigh (1985) argues that host country officials and citizens do not
differentiate the interests of the public and private sector of the home country, and so inter-
state relationships provide valuable information to the investor on the business environment
of the host country. This was proven in the case of manufacturing FDI by US firms to 24
countries over a period of 21 years, where inter-nation cooperation increases FDI flows and
vice versa for inter-nation conflicts. Further evidence was provided by Li and Vaschilko
(2010), in particular for FDI involving low-income countries. More recently, territorial disputes
between China and Japan on the islands of Diaoyu/Senkaku and the establishment of an Air
Defence Identification Zone by China damaged trade relationship between the countries
including a call for boycott of Japanese goods in China (Financial Times, 29 Nov. 2013).
In China, there is significant influence of government in OFDI. The biggest source of FDI is
known to be from state-owned enterprises (SOEs) (Morck, et. al, 2008) while private
Chinese firms invest in locations that already host Chinese SOEs for strategic reasons
(Ramasamy et. al, 2011) i.e. to act as important suppliers. With continued sponsoring or
even direct funding by the state (Buckley et. al, 2007; Zhang, 2003), the importance of host
locations that have cordial relationship with China cannot be overstated. Thus we argue that:
11
H2: Chinese managers consider the international relationship that host countries has with
China an important factor when choosing investment locations.
A related issue within the broader area of international relationships is visa requirements of
Chinese citizens, particularly business people, to enter foreign countries. Neumayer (2011)
argues that potential gains from FDI can only be discovered after personal contact and
multiple face-to-face meetings. Thus, visa restrictions can damage FDI by increasing the risk
of doing business. Estimates show that unilateral and bilateral visa restrictions can reduce
FDI by about 25 percent. An evidence of the negative impact of visa restrictions is reported
to be the shift of Huawei’s headquarters from the UK to Germany, which was due to the
Schengen visa facilities offered by Germany among other reasons (The Telegraph, 2011).
The importance of relaxing visa restrictions was also highlighted in a policy memorandum of
the US’s Council on Foreign Relations as a means towards attracting greater Chinese FDI
(Marchick, 2012).
Given the above arguments, we propose that:
H3: Chinese managers are attracted to invest in countries and territories that offer relatively
easy entry (visa) permits.
The institutional approach of explaining FDI location choices suggests that MNCs require an
institutional legitimacy to survive and succeed in a foreign environment (Kostova and Zaheer,
1999). It has even been suggested that institutions affect all three components of Dunning’s
eclectic paradigm (Dunning and Lundan, 2008). Studies have shown that decisions of
Chinese MNCs on FDI locations are shaped by the institutional forces both at home (Buckley
et.al, 2008; Alon and McIntyre, 2008) and host locations (Globerman and Shapiro, 2002; Rui
and Yip, 2008).
In traditional FDI literature, locations that are institutionally less repressive to FDI would be
favoured (Kang and Jiang, 2011). However, in the context of Chinese MNCs, the evidence
thus far has been mixed (Quer et. al, 2012). Duanmu (2011) and Duanmu and Guney (2009)
suggested that these MNCs are no different than their counterparts from other parts of the
world in that they would be reluctant to invest in countries that are institutionally
unpredictable. Others like Cui and Jiang (2009) found that institutional risks do not affect the
decision choices of Chinese MNCs while Buckley et. al (2007) did not confirm the negative
association between outward FDI and high levels of political risks in host countries. However,
there are also several studies that report the preference of Chinese MNCs for countries that

12
are institutionally risky (Kang and Jiang, 2011; Malhotra and Zhu, 2009; Ramasamy et. al,
2011; Kolstad and Wiig, 2011). Ramasamy et. al (2011) found that the affinity to institutional
risks is ownership dependent i.e. Chinese MNCs owned by local government are attracted to
natural resource rich countries with weak institutional systems but private Chinese firms are
more risk averse.
Given the mixed results from previous studies, we propose that:
H4: Chinese managers consider institutional risks in host locations to be a significant
determinant of location choice decisions.
The FDI Report 2013 alluded to the role of host country taxation on FDI inflows (Financial
Times, 2013). At a multilateral level, low corporate tax paid by MNCs in some countries irks
other high tax home country governments. Nevertheless, tax incentives can act as an
attraction for FDI inflows. Using a sample of 46 countries (accounting for 80 per cent of world
GDP in 2011; and 70 per cent of FDI projects between 2010-12), the Financial Times
showed a clear correlation between lower tax rates and stronger performance in attracting
FDI even when economic size was controlled for. A study of 25 cities in Europe found that a
one-point decrease in corporate tax increased FDI job creation up to 4 per cent, depending
on the starting level of corporate tax (Financial Times, 2012).
In a global survey of tax incentives, UNCTAD (2000) explain that incentives are only
secondary to more fundamental determinants like market size, access to raw materials and
availability of skilled labour. Thus, investment incentives come at the second stage of the
country choice decision process. Nevertheless, because of the speed and ease at which
these incentives can be changed, tax incentives are popular among many governments (85
per cent of the surveyed 45 countries offered some form of tax rate reductions). Blomstrom
and Kokko (2003) argued that investment incentives are not necessarily an efficient way to
increase national welfare. The important motive for providing financial incentives i.e.
spillovers of foreign technology and skills to the domestic economy is not guaranteed,
particularly if local firms and labour force does not have the capability to absorb these
positive spillovers. The investment incentive policies among many Investment Promotion
Agencies (IPAs) in the European Union for instance tend to be nationality neutral. Thus,
foreign firms receive the same treatment as local firms (Clegg and Voss, 2012).
For Chinese MNCs, tax and investment incentives can act as a deal-breaker because
investment outflows could take place as a way to circumvent higher tax rates at home. Since

13
domestic tax rates could go as high as 33 per cent of sales revenue, managers can be
motivated to move their more profitable aspect of their business abroad (Korniyenko and
Sakatsume, 2009).
We propose that:
H5: Chinese managers are relatively more attracted to countries that offer lucrative tax and
investment incentives.
Both Dunning’s eclectic paradigm and the Transaction Cost theory tend to suggest that
national cultural distance is a significant determinant of FDI (Dunning, 1993; Shenkar, 2001).
Cultural similarity increases FDI flows between two countries due to more efficient
communication and lower managerial costs (Edwards and Buckley, 1998). Cultural similarity
also reduces uncertainties over investment prospects and facilitates learning about both
countries (Kogut and Singh, 1988). The close cultural distance provides some explanation to
the large amount of inward FDI flow into China from Hong Kong, China and Taiwan Province
of China, particularly in the early years of economic reforms, despite the vast differences in
political systems.
Buckely et. al (2007) argued that since the Chinese diaspora in East Asia largely contributed
to the globalization of China, the guanxi networks that Chinese managers had built over the
years are used to identify business opportunities abroad. The size of Chinese population in
host countries as a determinant of OFDI finds empirical support in Buckley et. al (2007).
Similar results also turn up in Ramasamy et. al (2011) and Quer et. al (2012) although in the
former, the cultural distance variable is not significant among private Chinese companies.
Given the dominant support by previous literature, we suggest that:
H6: A sizeable overseas Chinese population in host countries is an important factor
influencing the OFDI location choice of Chinese managers.
Exports to and import from the home country as a determinant of FDI inflows has been
addressed in previous literature to explain if FDI and trade are substitutes or complements.
Horizontal FDI is considered as a substitute for imports from the home country while vertical
FDI is complementary to imports (Markusen, 1984; Brainard, 1997; Markusen and Venables,
2000). Rather than considering trade as a determinant, perhaps it should be thought of as a
consequence of FDI inflows. However, in the context of our research, trade flows to the host
country can be seen as a way to decrease the perceived “liability of foreignness” (Zaheer,

14
1995). Host countries that are important trading partners of China will be more familiar with
Chinese brands, Chinese companies and Chinese people. In like manner, the tendency for
foreign investors to agglomerate near other firms from the same country of origin (Head et.
al, 1999; Shaver and Flyer, 2000) also implies that managers would prefer those locations
that have already attracted other Chinese investments.
Thus we propose that:
H7: Chinese managers are attracted to host countries that are significant destination of
Chinese exports and/or source of Chinese imports.
H8: Chinese managers are attracted to host locations that have already attracted a
significant amount Chinese OFDI.
Efficiency seeking FDI flows to countries that offer labour cost advantages (Dunning, 1993).
This is especially true for manufacturing based FDI and the offshoring of labour intensive
services activities. However, Chakrabarti’s (2001) review of empirical studies provided a
mixed set of results i.e. positive, negative and insignificant relationship between wages and
FDI inflows. Studies that considered the FDI inflows into China, especially during the 1990s,
tend to show a negative relationship between wages and FDI inflows when productivity is
controlled for (Coughlin and Segev, 2000). This was particularly true for the inland provinces
of China (Ramasamy and Yeung, 2010). Although cheap labour had been an attractive
characteristic of the Chinese economy, in recent years, rising labour costs has been stated
as a reason for the shifting of labour intensive activities to neighbouring countries including
Viet Nam and Cambodia (Wang and Wang, 2011). By investing in countries that are
relatively less developed, Chinese firms are able to exploit their existing competitive
advantage, and defend their positions as low cost producers (Parmentola, 2011). Thus it is
likely that cheaper labour cost in other locations could attract Chinese FDI, especially labour
intensive production processes. We suggest that:
H9: Chinese managers are attracted to locations that offer cheaper labour resources.
Similar to lower labour cost, FDI would also flow to locations that are able to provide quality
public infrastructure, including paved roads, ports, telecommunication networks and stable
electricity supply. Such infrastructure can reduce the cost of doing business and provide an
incentive for vertical FDI and efficiency seeking FDI (Markusen, 1984). Empirical evidence to
support this determinant is robust (Coughlin et. al, 1991; Wheeler and Moody, 1992). As a
15
recipient of FDI, China was able to become an attractive location because of the impressive
network of roads it offered (Cheng and Kwan, 2000). However, it should be noted that a
recent study of FDI inflows into various districts in India suggest that a significant positive
relationship between FDI and infrastructure only takes effect after a certain threshold level of
infrastructure has been reached (Subramanian et. al, 2011).
We propose that:
H10: Chinese managers consider the quality of infrastructure in host locations as an
important determinant when selecting location for foreign investment.
3. Data and method
Previous research that studied the determinants of China’s OFDI tend to rely on secondary
data for the LHS variable. Buckley et. al (2007) for instance relied on the total amount of
foreign exchange approved by China’s State Administration of Foreign Exchange. Cheung
and Qian (2009) use OFDI approved by the Chinese authorities, while Kolstad and Wiig
(2011) use data from UNCTAD. Ramasamy et. al (2011) on the other hand use data based
on actual number of investment projects reported in the annual reports of listed Chinese
companies while Amighini et. al (2011) use the Financial Times’ FDI database comprising all
new cross border greenfield investments. The novelty of our study is in the primary data
collection method used. We went to the source of the decision-making process, i.e. the
managers.
The population we based our study on was a pool of senior managers studying for an
Executive MBA (EMBA) programme at a leading business school in China. The school
recruits about 750 EMBA students a year, divided into 12 classes of about 65 students each,
based in Shanghai, Beijing and Shenzhen. Nearly 85 per cent of the students of the 2012
and 2013 intake claim to be in a senior management position. Four and three classes from
the 2012 and 2013 intakes respectively were chosen for this study, representing about 450
students. A preliminary survey was handed out comprising questions related to the
experience of the manager/company in international investment, the role of the manager in
such a decision-making process and also the willingness of the manager to take part in a
further study. A total of 128 managers were found suitable in that they fulfilled all three
16
above-mentioned criteria. An email was sent out to these managers inviting them to do an
online choice survey. After several reminder emails, a total of 114 surveys were successfully
completed. The online survey comprised of two parts: eight general questions on
respondents’ backgrounds and a 12-round Maxdiff tasks described below. A summary profile
of our respondents is provided in Table 4. Our respondents come from various industries
although about a quarter are linked to the manufacturing industry. About a quarter are from
state-owned firms while two thirds are from private companies. Table 4 also shows that our
respondents mainly come from large companies with more than 40 per cent linked to
companies with annual average turnover of more than RMB 1 billion and an employee size
of more than 1000 people. About 60 percent of our respondents will be venturing into
investment abroad for the first time.
We designed our survey according to the maximum difference scaling methodology (Maxdiff)
(see Sawtooth, 20133 ; Louviere et al., 2013; Adamsen et al. 2013). Maxdiff studies are
designed to determine the relative importance among a large number of attributes of a
particular subject. Because the data collection process asks respondents to select their best
and worst choice among sets of alternatives, it is also known as best-worst choice
experiment. Maxdiff has a number of methodological advantages when compared to many
traditional methods. Cohen and Orme (2002) showed that Maxdiff performs better in terms of
predictive accuracy when applied to any sort of evaluation. It could also offer some
information that normal econometric analysis is incapable of handling.
Asking respondents to rate the importance of a large number of attributes has many
weaknesses including respondent fatigue. To overcome the associated weaknesses, an
alternative is to offer a pair of attribute, and respondents are asked to choose the more
significant one. All possible pairs need to be compared by respondents. In such a case,
respondents are loaded with a large number of repeated tasks especially when the numbers
of attributes are large. In contrast, in a given Maxdiff study each respondent evaluates only a
fraction of all possible subsets of attributes. Buckley et al. (2007) applied the choice
experiment to a group of managers from Australia, Denmark and the US to determine the
relative importance among 12 attributes that would be relevant to making a location choice
decision. Their data collection was done via a paper-and-pencil method. However, Jaeger
3 http://www.sawtoothsoftware.com/downloadPDF.php?file=maxdifftech.pdf (accessed on Jan 2014)

17
and MacFie (2010) recommended to collect Best-Worst choice data via electronic data
collection methods because respondents are more likely to miss out one of the two
Table 4: Profile of respondents
Profile Categories PercentageAgriculture, Forestry, Animal Husbandry and
Fishery
4.4
Mining 2.6
Manufacturing 25.4
Production and Supply of Electricity, Gas and
Water
1.8
Construction 4.4
Transport, Storage and Post 3.5
Information Transmission, Computer
Services and Software
14.9
Wholesale and Retail Trades 2.6
Hotels and Catering Services 3.5
Financial Intermediation 9.6
Real Estate 9.6
Scientific Research, Technical Service and
Geologic Prospecting
0.9
Management of Water Conservancy,
Environment and Public Facilities
1.8
Services to Households and Other Services 2.6
Health, Social Security and Social Welfare 0.9
Culture, Sports and Entertainment 4.4
Others 7.0
State owned, listed 8.8
State owned, unlisted 17.5
Private, listed 18.4
Private, unlisted 46.5
Joint venture 1.8
Other 7.0
10to 100 million 14.0
100 milion to 1 billion 45.6
More than 1 billion 40.4
Less than 100 13.2
100 to 499 30.7
500 to 999 12.3
More than 1000 43.9
Yes 40.4
No 59.6
Industry
Type of Company
Annual turnover value
Number of employees
Previous investment experience
Note: Total respondents: 114
selections when completing the best-worst tables, leading to increased difficulties in
exploring preference heterogeneity. In addition, conducting choice experiment via electronic
data collection methods allows the researcher to ensure that one task is completed before
moving on to the next task. Unlike collecting choice data electronically where choice sets are
displayed in a sequential order one set at a time (for example, see Table 6), paper-and-
pencil studies display all choice sets to the respondents at once. In this regard, the former
method makes each choice task more independent from each other, while the latter allows
the possibility for the respondents to make references to their own selections in the previous
choice tasks when completing the current choice task.
18
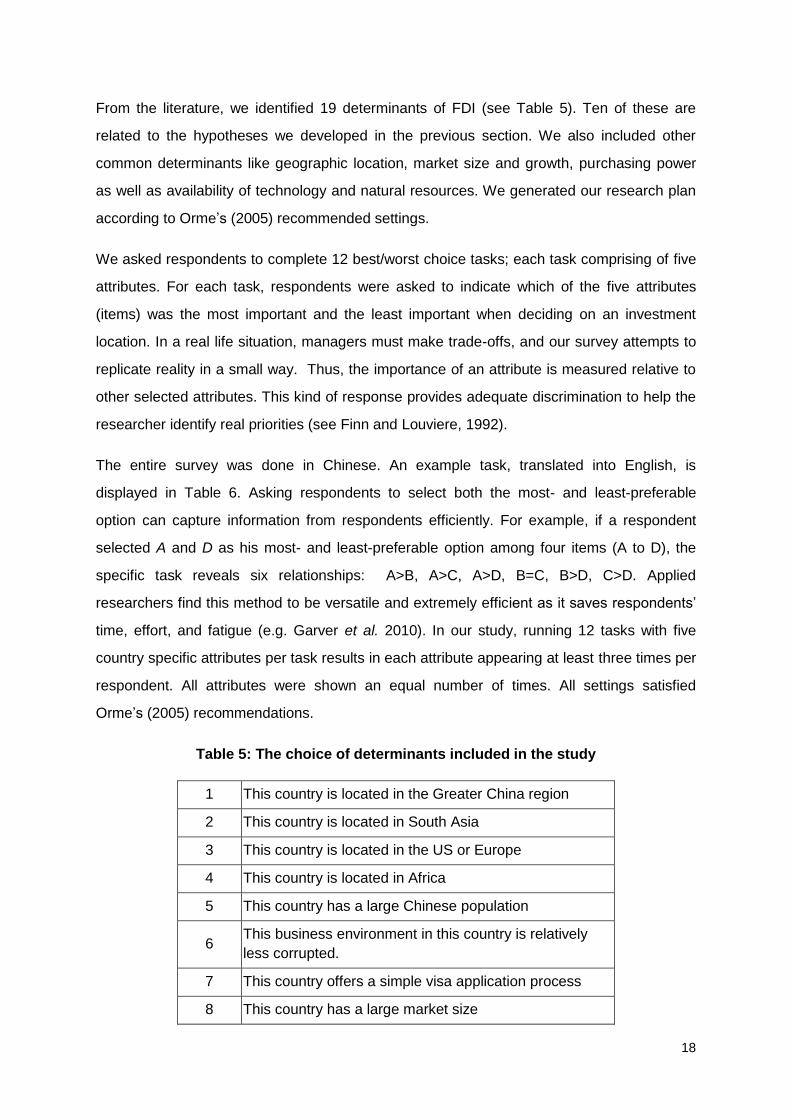
From the literature, we identified 19 determinants of FDI (see Table 5). Ten of these are
related to the hypotheses we developed in the previous section. We also included other
common determinants like geographic location, market size and growth, purchasing power
as well as availability of technology and natural resources. We generated our research plan
according to Orme’s (2005) recommended settings.
We asked respondents to complete 12 best/worst choice tasks; each task comprising of five
attributes. For each task, respondents were asked to indicate which of the five attributes
(items) was the most important and the least important when deciding on an investment
location. In a real life situation, managers must make trade-offs, and our survey attempts to
replicate reality in a small way. Thus, the importance of an attribute is measured relative to
other selected attributes. This kind of response provides adequate discrimination to help the
researcher identify real priorities (see Finn and Louviere, 1992).
The entire survey was done in Chinese. An example task, translated into English, is
displayed in Table 6. Asking respondents to select both the most- and least-preferable
option can capture information from respondents efficiently. For example, if a respondent
selected A and D as his most- and least-preferable option among four items (A to D), the
specific task reveals six relationships: A>B, A>C, A>D, B=C, B>D, C>D. Applied
researchers find this method to be versatile and extremely efficient as it saves respondents’
time, effort, and fatigue (e.g. Garver et al. 2010). In our study, running 12 tasks with five
country specific attributes per task results in each attribute appearing at least three times per
respondent. All attributes were shown an equal number of times. All settings satisfied
Orme’s (2005) recommendations.
Table 5: The choice of determinants included in the study
1 This country is located in the Greater China region
2 This country is located in South Asia
3 This country is located in the US or Europe
4 This country is located in Africa
5 This country has a large Chinese population
6 This business environment in this country is relatively
less corrupted.
7 This country offers a simple visa application process
8 This country has a large market size
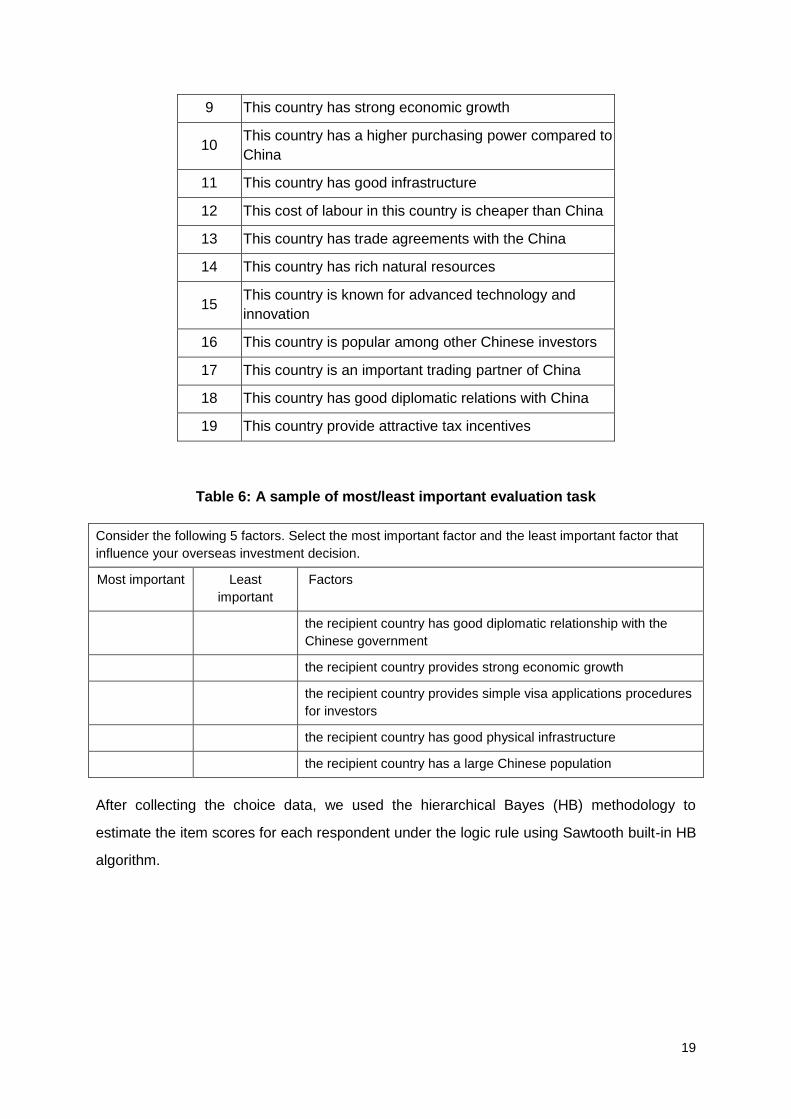
19
9 This country has strong economic growth
10 This country has a higher purchasing power compared to
China
11 This country has good infrastructure
12 This cost of labour in this country is cheaper than China
13 This country has trade agreements with the China
14 This country has rich natural resources
15 This country is known for advanced technology and
innovation
16 This country is popular among other Chinese investors
17 This country is an important trading partner of China
18 This country has good diplomatic relations with China
19 This country provide attractive tax incentives
Table 6: A sample of most/least important evaluation task
Consider the following 5 factors. Select the most important factor and the least important factor that
influence your overseas investment decision.
Most important Least
important
Factors
the recipient country has good diplomatic relationship with the
Chinese government
the recipient country provides strong economic growth
the recipient country provides simple visa applications procedures
for investors
the recipient country has good physical infrastructure
the recipient country has a large Chinese population
After collecting the choice data, we used the hierarchical Bayes (HB) methodology to
estimate the item scores for each respondent under the logic rule using Sawtooth built-in HB
algorithm.

20
4. Results
The summary statistics of individual scores for each attribute are reported in Table 7. The
mean value shows the relative importance of each of the considered country attribute, in
order of importance.
Table 7: Summary statistics of relative importance of factors that influence
investment decisions
Rank Factor Mean (per
cent)
Accumulated Mean (per
cent) S.D. Min Max
1 Market size 11.616 11.616 2.053 0.008 15.055
2 Economic Growth 10.549 22.165 1.930 0.016 13.052
3 Relatively less corrupted business environment 8.052 30.217 4.853 0.023 16.183
4 Availability of Advanced technology 7.957 38.174 2.202 0.003 13.937
5 Good diplomatic relationship with China 7.347 45.521 4.204 0.004 15.899
6 Trade Agreement with China 6.914 52.435 4.583 0.566 16.078
7 Attractive tax incentives 6.616 59.051 1.991 0.028 9.164
8 Availability of natural resources 6.588 65.639 4.032 1.324 16.962
9 High purchasing power 6.373 72.012 3.938 1.070 17.545
10 Important trading partner 5.515 77.527 4.803 0.032 15.279
11 Good infrastructure 4.904 82.431 3.586 0.212 14.637
12 Popular among Chinese investors 3.921 86.352 3.595 0.019 14.524
13 Located in US or Europe 3.837 90.189 3.891 0.368 15.449
14 Lower labour cost 2.831 93.02 5.837 0.012 18.035
15 Large Chinese Population 2.727 95.747 5.112 0.170 16.590
16 Simple visa procedures 1.871 97.618 3.287 0.225 15.273
17 Located in Africa 0.900 98.518 4.370 0.118 15.058
18 Located in South Asia 0.750 99.268 4.565 0.185 16.532
19 Located in Greater China 0.733 100.00 3.653 0.294 15.210
These average scores were derived from the analysis of both best and worst scores. Market
size and market growth were ranked the top two factors influencing the respondents’
investment decisions. A high purchasing power (ranked ninth) contributes 6.4 per cent of the

21
importance. Thus, market related factors (size, growth and purchasing power) accounted for
more than 28 per cent of the overall importance. Although previous studies (for example
Buckely et. al, 2007; Ramasamy et. al, 2011; Amighini et. al, 2011) also showed the
significance of these market factors in determining location choices of China’s OFDI, we are
able to show the extent to which they influence the decision-making. At the other end, our
respondents do not consider geographic location to be relatively important. Locations closer
to home and in developing economies in South Asia and Africa are among the least
significant determinants. The US and Europe however are relatively more attractive.
Turning now to our hypotheses, we find that the ten determinants of location choice are
important in varying degrees. If we use 80 per cent accumulated mean score as the cut-off
for evaluating the degree of importance, our results provides support for H1, H2, H4, H5, H7
and H10. There is some amount of justification to reject H3, H6, H8 and H9. Considering the
order of importance, institutional risks, operationalized in our study by a less corrupted
business environment, is the most important determinant among our hypothesis. Countries
with good diplomatic relationship and those that have trade agreements with China are also
among the preferred locations for Chinese investment. This is irrespective of the geographic
location. Chinese managers are also looking for incentives from the host government. Prior
international business experience does count, even arms length relationship through trade.
On the other hand, visa restrictions and a sizeable Chinese population in host countries are
relatively less important. Labour costs that are relatively cheaper than China is also relatively
unattractive. The implications of the supported and unsupported hypotheses are discussed
in the next section.
As a robustness test, we also analyzed the best-only and worst-only choice data to check if
any discrepancy exists when preferences are analysed separately. In other words, a choice
that is most preferred should also be the one that is least rejected. The average relative
importance based on most preferred and least preferred is shown in Figure 1. The least
preferred choice has been rescaled such that it represents the extent to which a particular
determinant is never rejected. As shown in the figure, choices are consistent for most
determinants. Three determinants with the highest degree of inconsistency are: a relatively
less corrupted environment, popular investment location, and advanced technology. This
can be interpreted as follows: Though a relatively less corrupt environment has been ranked
as a very important determinant of location choice, the extent to which it has never been
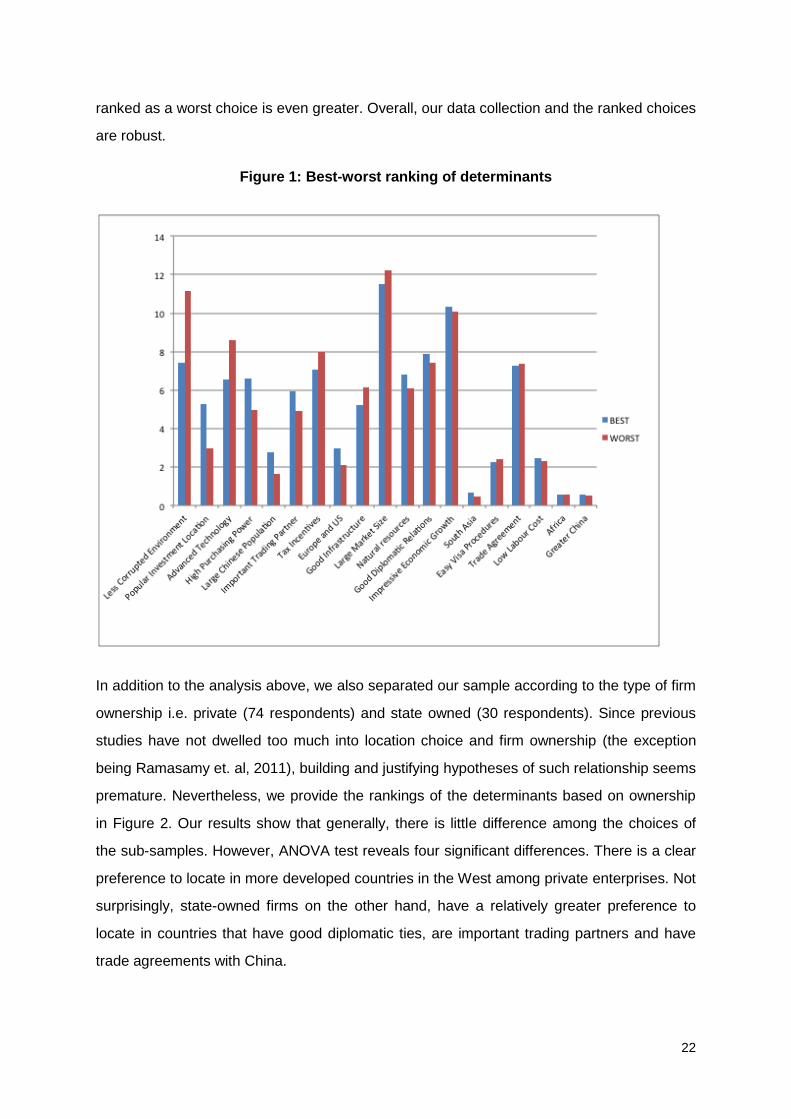
22
ranked as a worst choice is even greater. Overall, our data collection and the ranked choices
are robust.
Figure 1: Best-worst ranking of determinants
In addition to the analysis above, we also separated our sample according to the type of firm
ownership i.e. private (74 respondents) and state owned (30 respondents). Since previous
studies have not dwelled too much into location choice and firm ownership (the exception
being Ramasamy et. al, 2011), building and justifying hypotheses of such relationship seems
premature. Nevertheless, we provide the rankings of the determinants based on ownership
in Figure 2. Our results show that generally, there is little difference among the choices of
the sub-samples. However, ANOVA test reveals four significant differences. There is a clear
preference to locate in more developed countries in the West among private enterprises. Not
surprisingly, state-owned firms on the other hand, have a relatively greater preference to
locate in countries that have good diplomatic ties, are important trading partners and have
trade agreements with China.

23
Figure 2: Private vs. state-owned ranking of determinants
5. Implications for policymakers
What can a host country government do to attract a portion of the nearly USD 100 billion
capital that leaves the shores of China annually? This has been the motivating question of
this study. In particular, we are interested in short to medium term policies that host
governments can implement that could make their respective countries attractive enough
such that their nation would appear in the radar of Chinese companies seeking to
internationalize their business. No doubt, having a large and growing market with high
purchasing power attracts market seeking Chinese firms, while countries offering advanced
technology would attract these companies with a strategic interest. In addition to these
factors, or despite not having them, our study offers five key policies that host country
governments should consider.
a) Minimize institutional risks – Although previous studies based on macroeconomic
data (Ramasamy et. al, 2011; Kolstad and Wiig, 2011) suggest that Chinese
companies are attracted to countries with weak institutions or rather corrupted
systems, our study suggest otherwise. Our respondents reveal that they prefer a
business environment that is less corrupted, and rank this high on their wish list. The
relatively significant importance placed on this factor applies to both private and state

24
owned companies. This change in preference suggests that Chinese companies are
reaching a point where they possess some form of ownership specific assets that
they wish to protect. Host government efforts in raising the level of integrity in B2B
and B2G relationships will attract the necessary investment. Countries that already
have a relatively clean business environment may wish to highlight this fact when
dealing with Chinese prospects.
b) Promote international relations with China – Political relationships between China
and the host country seems to matter to Chinese managers. This could be due to the
important role the state plays in the Chinese economy, particularly in promoting the
outward expansion of Chinese enterprises and the engineering of selected industries
at home. Chinese managers may also be fearful of the risks involved when political
relationships turn sour. The huge investments made in Africa by Chinese enterprises
on the one hand, and the boycott by certain quarters of Japanese products on the
other, are two clear examples of how politics and business are intertwined.
c) Initiate trade agreements with China – Trade agreements can be seen as a way in
which political relationships are taken one notch higher. In an era where tariffs are
relatively low historically, trade agreements can ease the way in which business is
done by businesses domiciled in two or more countries. The ease at which good and
services can move across borders, reduction in red-tapes as well as the movement
of managers between two countries can encourage greater economic relationships.
China, in particular, has been active in establishing trade agreements since 2000.
The China-ASEAN FTA, China-Chile FTA, China-New Zealand FTA, and others are
examples of the rigor at which the Chinese authorities are promoting trade and
investment relationships in the absence of a WTO initiated multilateral framework.
d) Offer and promote tax and investment incentives – Although a McKinsey (2003)
study suggests that investment and tax incentives are not the primary drivers of an
MNCs location choice, our study shows otherwise. Perhaps the subsidy and
incentive culture is strong in China that managers expect these in overseas locations
as well. Similarly, the relatively high tax environment in China may make tax
incentives exceptionally attractive. Additionally, given the brevity of the global
expansion of Chinese enterprises, any form of reduction in the cost of doing business
may be seen as attractive. This is particularly true for low-tech industries like
garments, footwear and other labour intensive industries that are cost-driven. Lower
25
wage countries like Viet Nam, Laos, Cambodia, Bangladesh and others keen in
attracting Chinese low end manufacturing will need to offer tax and investment
incentives to make up for other barriers (eg. weak infrastructure and logistics) that
may exist.
e) Encourage more trade with China – In a typical stages approach towards
internationalization, arms length relationship is a pre-cursor to deeper equity based
relationship. A host country that has established sound trade relationships with China
provides confidence to managers that Chinese goods and services are accepted by
the local market. The liability of Chineseness is minimized and deeper relationships
can be considered. “Crossing the river by feeling the stones” – a famous saying of
Deng Xiaopeng – has been a mainstay of Chinese economic reforms. In like manner,
Chinese managers are pragmatic in their internationalization decisions.
6. Conclusion and limitations
Governments, both from the developed and the developing world, are actively pursuing
Chinese businesses to invest in their countries. Since investors from China may be different
in terms of their motivations and objectives, identifying those location factors that Chinese
managers consider to be relatively more important, is essential for host governments.
Although market related factors are very important in location choice decision, some
interesting results surfaced in our study. Chinese managers are becoming increasingly
aware of the need to have a business environment that follows the rule of law with strong
institutions. A relatively less corrupted environment appears as a significant factor in choice
decisions among Chinese managers. On the other hand, simpler visa procedures are not
considered to be much of an obstacle among Chinese managers. Economic and political
relationships between China and host governments are also important considerations. Our
study points to the critical need for strong government to government (G2G) relationships
that need to be cultivated to attract more FDI from China.
Obviously, the main limitation of this study is the size of our sample. Nevertheless, the
quality and seniority of our respondents makes the study meaningful. Due to the smallness
of our sample, evaluating country-specific attributes based on the motivation behind the

26
investment decision or geography was not possible. Future studies may wish to extend the
study into those areas as well.

27
References
Adamsen, J. M., Rundle-Thiele, S., and Whitty, J. (2013). Best-Worst scaling…reflections on
presentation, analysis, and lessons learnt from case 3 BWS experiments. Market
and Social Research, Vol.21, No.1, pp 9–27.
Alon, I. and McIntyre, J. R. (2008). Globalization of Chinese enterprises, Basingstoke, UK:
Palgrave Macmillan.
Amighini, A., Rabellotti, R., and Sanfilippo, M. (2011). China’s Outward FDI: An Industry-
level Analysis of Host Country Determinants, CESifo Working Paper, No. 3688.
Berger, A., Busse, M., Nunnenkamp, P., and Roy, M. (2012). Attracting FDI through BITs
and RTAs: Does treaty content matter? Columbia FDI Perspectives, Vol. 75, July.
Blomstrom, M. and Kokko, A. (2003). The economics of foreign direct investment incentives,
Working Paper 9489, National Bureau of Economic Research.
Blomstrom, M., Lipsey, R. E., & Zejan, M. (1994). What Explains Developing Country Growth?
National Bureau of Economic Research Working Paper Series. Retrieved from
http://www.nber.org/papers/w4132
Blonigen, B. a, and Piger, J. (2011). Determinants of Foreign Direct Investment. Journal of
Asian Economics, Vol. 22, pp 222–234. doi:10.1007/s10198-006-0010-9
Brainard, S. Lael (1997). An Empirical Assessment of the Proximity-Concentration Trade-Off
between Multinational Sales and Trade. The American Economic Review, Vol.
87, No.4, pp 520–544.
Buckley, P. J., Clegg, L. J., Cross, A. R., Liu, X., Voss, H., and Zheng, P. (2007). ‘The
determinants of Chinese outward foreign direct investment’, Journal of
International Business Studies, Vol. 38, pp 499-518.
Buckley, P. J., Cross, A. R., Tan, H., Liu, X., and Voss, H. (2008). Historical and emergent
trends in Chinese outward direct investment, Management International Review,
Vol. 48, No.6, pp 715-748.
C. Boehmer, et al. (2001). Investing in the Peace: Economic Interdependence and
International Conflict, International Organization, Vol. 55, No.2, pp 391- 438.
28
Cardello, A. V., and Jaeger, S. R. (2010). Hedonic measurement for product development:
new methods for direct and indirect scaling. In In Jaeger, S.R. and MacFie, H.,
Consumer-Driven Innovation in Food and Personal Care Products, pp 135–174.
Chakrabarti, A. (2001). The determinants of foreign direct investments: sensitivity analyses
of cross-country regressions, Kyklos, Vol. 54, No.1, pp 89–114.
Cheng, L. K., and Y. K. Kwan (2000) What are the determinants of the location of foreign
direct investment? The Chinese experience, Journal of International Economics,
Vol. 51. No.2, pp 379-400.
Cheung, Y.W., and Qian, X. (2009). Empirics of China’s Outward Direct Investment. Pacific
Economic Review, Vol. 14, pp 312–341. doi:10.1111/j.1468-0106.2009.00451.x
Clegg, J. and Voss, H. (2012) Chinese overseas direct investment in the European Union,
Europe China Research and Advise Network, London.
Cohen, S., and Orme, B. (2004). What’s your preference? Marketing Research, Vol.16, pp
32–37.
Collie, D. (2011) Multilateral trade liberalisation, foreign direct investment and the volume of
world trade, Economics Letters, Vol. 113, pp 47-49.
Coughlin, C. and Segev, E. (2000). Foreign direct investment in China: A spatial
econometric study, World Economy, Vol. 23, No.1, pp 1-23.
Coughlin, Cletus C., Joseph V. Terza, and Vachira Arromdee. (1991). State Characteristics
and the Location of Foreign Direct Investment within the United States. Review
of Economics and Statistics Vol. 73, No.4, pp 675-83.
Cui, L., and Jiang, F. (2009). FDI entry mode choice of Chinese MNCs: A strategic
behaviour perspective. Journal of World Business, Vol.44, pp 434-444.
Desbordes, R. and Vicard, V. (2005). Being nice makes you attractive: the FDI-international
political relations nexus, accessed at
www.carecon.org.uk/Conferences/Conf2005/Papers/Vicard.pdf
Duanmu, J.L. (2011). Firm heterogeneity and location choice of Chinese multinational
enterprises (MNEs). Journal of World Business, Vol.47, No.1, pp. 64-72.
29
Duanmu, J.L., and Guney, Y. (2009). A panel data analysis of locational determinants of
Chinese and Indian outward foreign direct investment. Journal of Asia Business
Studies, Vol. 3, No. 2, pp 1–15.
Dunning, J. H. (1994). Multinational enterprises and the globalization of innovatory capacity.
Research Policy, Vol. 23, pp 67–88. doi:10.1016/0048-7333(94)90027-2
Dunning, J. H., and Lundan, S. (2008). Institutions and the OLI paradigm of the multinational
enterprise. Asia Pacific Journal of Management, Vol. 25, No.4, pp 573–593.
Financial Times (2012). Improving the quality of foreign direct investment to Northern Ireland,
accessed at http://www.detini.gov.uk/attracting_fdi_executive_summary.pdf
______ (2013). The fDi Report 2013. Available from
http://ftbsitessvr01.ft.com/forms/fDi/report2013/files/The_fDi_Report_2013.pdf
______ (2013). China heightens fears of widening tensions in Asian airspace, 29 November.
Available from http://www.ft.com/intl/cms/s/0/e657c1da-58bf-11e3-a7cb-
00144feabdc0.html#axzz2mNSvL8vN.
Finn, A., and Louviere, J. J. (1992). Determining the Appropriate Response to Evidence of
Public Concern: The Case of Food Safety. Journal of Public Policy & Marketing,
Vol. 11, pp 12. doi:10.2307/30000270
Garland, M., and Biglaiser, G. (2009). Do Electoral Rules Matter? Political Institutions and
Foreign Direct Investment in Latin America. Comparative Political Studies, Vol.
42, No.2, pp 224-251.
Garver, M. S., Williams, Z., and LeMay, S. A. (2010). Measuring the importance of attributes
in logistics research. The International Journal of Logistics Management, Vol. 21,
pp 22–44. doi:10.1108/09574091011042160
Globerman, S., and Shapiro, D. (2003). Governance infrastructure and US foreign direct
investment. Journal of International Business Studies, Vol. 34, No.1, pp 19-40.
Head, K., Ries, J. and Swenson, D. (1999). Attracting foreign manufacturing: Investment
promotion and agglomeration. Regional Science and Urban Studies, Vol. 29,
No.2, pp 197-216.

30
Jensen, Nathan M. (2008). Political Regimes and Political Risk: Democratic Institutions and
Expropriation Risk for Multinational Investors. Journal of Politics, Vol. 70, No.4,
pp 1040-1052.
Kang, Y., and Jiang, F. (2011). FDI location choice of Chinese multinationals in East and
Southeast Asia: Traditional economic factors and institutional perspective.
Journal of World Business, Vol. 47, No. 1, pp 45-53.
Kogut, B., and Nath, R. (1988). The Effect of National Culture on the Choice of Entry Mode.
Journal of International Business Studies. doi:10.1057/palgrave.jibs.8490394
Kokko, A. (1994). Technology, market characteristics, and spillovers. Journal of
Development Economics, Vol. 43, pp 279–293. doi:10.1016/0304-
3878(94)90008-6
Kolstad, I.,and Wiig, A (2009). What determines Chinese outward FDI? Journal of World
Business, Vol. 47, No.1, pp 26-34.
Korniyenko, Y and Sakatsume, T. (2009). Chinese investments in transition countries,
Working Paper No. 107, European Bank for Reconstruction and Development.
Available from
http://www.ebrd.com/downloads/research/economics/workingpapers/wp0107.pdf
Kostova, T., and Zaheer, S. (1999). Organisational legitimacy under conditions of complexity:
The case of the multinational enterprise. Academy of Management Review, Vol.
24, No.1, pp 64-81.
Li, Q., and Vashchilko, T. (2010). Dyadic military conflict, security alliances, and bilateral FDI
flows. Journal of International Business Studies. doi:10.1057/jibs.2009.91
Li, Q. and Tatiana V. (2010). Dyadic Military Conflict, Security Alliances, and Bilateral FDI
Flows, Journal of International Business Studies Vol. 41, pp 765-782.
Louviere, J., Lings, I., Islam, T., Gudergan, S., and Flynn, T. (2013). An Introduction to the
Application of (Case 1) Best-Worst Scaling in Marketing Research. International
Journal of Research in Marketing, Vol.30, No. 3, pp 292–303.
Malhotra, S., and Zhu, P. C. 2009. Determinants and valuation impact of cross-border
acquisitions by firms from China and India. Paper presented at the AIB 2009
31
Annual Meeting, San Diego, California, June 27–30.
Marchick, D. (2012). Fostering greater Chinese Investment in the United States, Policy
Innovation Memorandum No. 13, Council on Foreign Relations, United States.
Markusen, James R. (1984). Multinationals, Multi-plant Economies, and the Gains from
Trade. Journal of International Economics, Vol. 16, pp 205–226
Markusen, James R., and Anthony Venables (2000). Theory of Endowment: Intra-Industry
and Multinational Trade. Journal of International Economics, Vol. 52, No.2, pp
209–234
McKinsey Global Institute (2003). New Horizons: Multinational Company Investment in
Developing Countries, McKinsey Global Institute: San Francisco.
Medvedev, D. (2012). Beyond Trade: The Impact of Preferential Trade Agreements on FDI
Inflows, World Development, Vol. 40, pp 49-61.
Morck, R., Yeung, B., and Zhao, M. (2008). Perspectives on China’s outward foreign direct
investment. Journal of International Business Studies, Vol. 39, No.3, pp 337–350.
Neumayer, E. (2011). On the detrimental impact of visa restrictions on bilateral trade and
foreign direct investment. Applied Geography, Vol. 31, pp 901–907.
Nigh, D. (1985). The effect of political events on United States direct foreign investment: a
pooled time-series cross-sectional analysis. Journal of International Business
Studies, Vol. 16, No.1, pp 1-17.
Nueumayer, E. (2011), On the detrimental impact of visa restrictions on bilateral trade and
foreign direct investment, Applied Geography, Vol. 31, pp. 901-07.
Orme, B. (2005). Accuracy of HB Estimation in MaxDiff Experiments. Sawtooth Technical
Paper. Available from www.sawtoothsoftware.com
Parmentola, A. (2011). The internationalization strategy of new Chinese multinationals:
Determinants and evolution, International Journal of Management, Vol. 28, No.1,
pp 369-86.
32
Polachek, S., Seiglie, C. and Xiang, J. (2005). Globalization and international conflict: Can
FDI increase peace as trade does? Available from
http://www.aeaweb.org/assa/2005/0109_0800_0204.pdf
Quer, D., Claver, E., & Rienda, L. (n.d.). Political Risk, Cultural Distance, and Outward
Foreign Direct Investment: Empirical Evidence from Large Chinese Firms. Asia
Pacific Journal of Management, Vol.29, No. 4, pp 1089–1104.
Ramasamy, B. and Yeung, M. (2010). A causality analysis of the FDI-wages-productivity
nexus in China, Journal of Chinese Economic and Foreign Trade Studies, Vol. 3,
No. 1, pp 5-23
Ramasamy, B., Yeung, M., and Laforet, S. (2011). China’s outward foreign direct investment:
Location choice and firm ownership. Journal of World Business, Vol. 47, No. 1,
pp.17-25.
Rosecrance, R. (1986). The rise of the trading state: commerce. New York: Basic Books.
Rui, H., and Yip, G. S. (2008). Foreign acquisition by Chinese firms: A strategic intent
perspective. Journal of World Business, Vol.43, pp 213–226.
Sethi, D., Guisinger, S.E., Phelan, S.E. and Berg, D.M. (2003). Trends in foreign direct
investment flows: a theoretical and empirical analysis. Journal of International
Business Studies, Vol. 34, No.4, pp 315-326.
Shaver, J. M. & Flyer, F. (2000). Agglomeration economies, firm heterogeneity, and foreign
direct investment in the United States. Strategic Management Journal, Vol. 21,
No.12, pp 1175-1193.
Subramanian, Krishnamurthy and Chakrabarti, Rajesh and Sairam, Sesha and Kuntluru
(2011). Sudershan, Infrastructure and FDI: Evidence from District-Level Data in
India. Available from SSRN:
http://ssrn.com/abstract=1712185 or http://dx.doi.org/10.2139/ssrn.1712185
The Telegraph (2011). Dusseldorf has lessons for UK in attracting Chinese investment, 23
October. Available from
http://www.telegraph.co.uk/finance/economics/8844423/Dusseldorf-has-lessons-
for-UK-in-attracting-Chinese-investment.html.

33
UNCTAD (2000). Tax incentives and foreign direct investment: A global survey, ASIT
Advisory Studies No. 16, Geneva.
Voss, H., Buckley, P. J., and Cross, A. R. (2008). Thirty years of Chinese outward foreign
direct investment. In the CEA UK Conference-China’s Three Decades of
Economic Reform (1978-2008) pp 1-2
Wang, Bijun and Huiyao Wang (2011). Chinese Manufacturing Firms’ Overseas Direct
Investment: Patterns, Motivations, and Challenges. In Jane Golley and Ligang
Song, eds. Rising China Global Challenges and Opportunities. Canberra,
Australia: Australian National University Press.
Wheeler, David, and Ashoka Mody (1992). International Investment Location Decisions: The
Case of U.S. Firms. Journal of International Economics, Vol.33, pp 57-76.
Zaheer S. (1995). Overcoming the liability of foreignness. Academy of Management Journal,
Vol. 38, No.2, pp 341-363.
Zhang, Y. (2003) China’s Emerging Global Businesses: Political Economy and Institutional
Investigations, Palgrave Macmillan: Basingstoke.

ARTNeT Secretariat
United Nations
Economic and Social Commission
for Asia and the Pacific
Trade and Investment Division
United Nations Building
Rajadamnern Nok Avenue
Bangkok 10200, Thailand
Tel: +66 (0)2-288-2251
Fax: +66(0)2-288-1027
Email: [email protected]
Website: www.artnetontrade.org
ARTNeT Working Paper Series
is available at www.artnetontrade.org
Related Documents