Computers & Security 97 (2020) 101994 Contents lists available at ScienceDirect Computers & Security journal homepage: www.elsevier.com/locate/cose Detecting stealthy false data injection attacks in the smart grid using ensemble-based machine learning Mohammad Ashrafuzzaman a,∗ , Saikat Das b , Yacine Chakhchoukh c , Sajjan Shiva b , Frederick T. Sheldon a a Computer Science, University of Idaho, Moscow, ID 83843, United States b Computer Science, University of Memphis, Memphis, TN 38152, United States c Electrical and Computer Engineering, University of Idaho, Moscow, ID 83843, United States a r t i c l e i n f o Article history: Received 22 April 2020 Revised 21 July 2020 Accepted 29 July 2020 Available online 5 August 2020 Keywords: Smart grid security Stealthy false data injection attack Ensemble-based machine learning Cyber-physical system security Critical infrastructure protection a b s t r a c t Stealthy false data injection attacks target state estimation in energy management systems in smart power grids to adversely affect operations of the power transmission systems. This paper presents a data- driven machine learning based scheme to detect stealthy false data injection attacks on state estimation. The scheme employs ensemble learning, where multiple classifiers are used and decisions by individual classifiers are further classified. Two ensembles are used in this scheme, one uses supervised classifiers while the other uses unsupervised classifiers. The scheme is validated using simulated data on the stan- dard IEEE 14-bus system. Experimental results show that the performance of both supervised individual and ensemble models are comparable. However, for unsupervised models, the ensembles performed bet- ter than the individual classifiers. © 2020 Elsevier Ltd. All rights reserved. 1. Introduction With the integration of cyberspace for communication, con- trol and monitoring of the physical processes of generation, trans- mission, distribution, and consumption of electricity, the smart grid (SG) has evolved into the largest and most complex cyber- physical system (CPS). Even though CPS industry has attempted to “air-gap” the operational technology (OT) of CPSs from their in- formation technology (IT) networks, the OT networks are unfor- tunately still not fully insulated from IT networks. OT networks are in fact vulnerable to both internal and external cybersecu- rity threats (Byres, 2013). A study by the Ponemon Institute re- ports that 90% of organizations relying on OT have experienced at least one business-impacting cyber-attack within the 2 years prior to the report (Ponemon Institute, 2019). Being that SGs are criti- cal national infrastructures, there is widespread concern about re- ducing the attack surface of SGs. For example, in December 2015, three power distribution companies were taken down in a coordi- nated cyber-attack, resulting in a power outage for about 225,000 Ukrainians (Liang et al., 2017). ∗ Corresponding author. E-mail addresses: [email protected] (M. Ashrafuzzaman), [email protected] (S. Das), [email protected] (Y. Chakhchoukh), [email protected] (S. Shiva), [email protected] (F.T. Sheldon). Rapid advancement in machine learning algorithms have en- abled them to find natural patterns in data that generate insight and enable better decisions and predictions. The use of data ana- lytics to predict, detect, and prevent security threats is termed se- curity analytics (Cybenko and Landwehr, 2012). The incorporation of cyber capabilities into SG functionality has led to the prolifera- tion of new data sources. The availability of abundant data gener- ated by these components has enabled investigators to better study cybersecurity threats and countermeasures in SGs using security analytics (Tan et al., 2017). 1.1. The research problem State estimation (SE) is the principal tool used by energy man- agement systems (EMS) at power transmission control centers. SE computes voltage magnitudes and phase angles for all of the differ- ent buses after collecting measurement data communicated to the control center from remote terminal units (RTUs) equipped with SCADA units (Abur and Gomez-Exposito, 2004). A cyber-attacker can subtly modify these measurement data after compromising RTUs or substation meters, by gaining unauthorized access to the control system or by intruding into the wireless communication networks, for example, by successfully conducting a man-in-the- middle attack. This new type of cyber-attack against SE in EMS is called false data injection (FDI) attacks (Liu et al., 2011). The falsely injected measurement data can affect the outcome of the https://doi.org/10.1016/j.cose.2020.101994 0167-4048/© 2020 Elsevier Ltd. All rights reserved.

Welcome message from author
This document is posted to help you gain knowledge. Please leave a comment to let me know what you think about it! Share it to your friends and learn new things together.
Transcript
Computers & Security 97 (2020) 101994
Contents lists available at ScienceDirect
Computers & Security
journal homepage: www.elsevier.com/locate/cose
Detecting stealthy false data injection attacks in the smart grid using
ensemble-based machine learning
Mohammad Ashrafuzzaman
a , ∗, Saikat Das b , Yacine Chakhchoukh
c , Sajjan Shiva
b , Frederick T. Sheldon
a
a Computer Science, University of Idaho, Moscow, ID 83843, United States b Computer Science, University of Memphis, Memphis, TN 38152, United States c Electrical and Computer Engineering, University of Idaho, Moscow, ID 83843, United States
a r t i c l e i n f o
Article history:
Received 22 April 2020
Revised 21 July 2020
Accepted 29 July 2020
Available online 5 August 2020
Keywords:
Smart grid security
Stealthy false data injection attack
Ensemble-based machine learning
Cyber-physical system security
Critical infrastructure protection
a b s t r a c t
Stealthy false data injection attacks target state estimation in energy management systems in smart
power grids to adversely affect operations of the power transmission systems. This paper presents a data-
driven machine learning based scheme to detect stealthy false data injection attacks on state estimation.
The scheme employs ensemble learning, where multiple classifiers are used and decisions by individual
classifiers are further classified. Two ensembles are used in this scheme, one uses supervised classifiers
while the other uses unsupervised classifiers. The scheme is validated using simulated data on the stan-
dard IEEE 14-bus system. Experimental results show that the performance of both supervised individual
and ensemble models are comparable. However, for unsupervised models, the ensembles performed bet-
ter than the individual classifiers.
© 2020 Elsevier Ltd. All rights reserved.
1
t
m
g
p
“
f
t
a
r
p
l
t
c
d
t
n
U
s
s
a
a
l
c
o
t
a
c
a
1
a
c
e
c
S
c
h
0
. Introduction
With the integration of cyberspace for communication, con-
rol and monitoring of the physical processes of generation, trans-
ission, distribution, and consumption of electricity, the smart
rid (SG) has evolved into the largest and most complex cyber-
hysical system (CPS). Even though CPS industry has attempted to
air-gap” the operational technology (OT) of CPSs from their in-
ormation technology (IT) networks, the OT networks are unfor-
unately still not fully insulated from IT networks. OT networks
re in fact vulnerable to both internal and external cybersecu-
ity threats ( Byres, 2013 ). A study by the Ponemon Institute re-
orts that 90% of organizations relying on OT have experienced at
east one business-impacting cyber-attack within the 2 years prior
o the report ( Ponemon Institute, 2019 ). Being that SGs are criti-
al national infrastructures, there is widespread concern about re-
ucing the attack surface of SGs. For example, in December 2015,
hree power distribution companies were taken down in a coordi-
ated cyber-attack, resulting in a power outage for about 225,0 0 0
krainians ( Liang et al., 2017 ).
∗ Corresponding author.
E-mail addresses: [email protected] (M. Ashrafuzzaman),
[email protected] (S. Das), [email protected] (Y. Chakhchoukh),
[email protected] (S. Shiva), [email protected] (F.T. Sheldon).
R
c
n
m
i
f
ttps://doi.org/10.1016/j.cose.2020.101994
167-4048/© 2020 Elsevier Ltd. All rights reserved.
Rapid advancement in machine learning algorithms have en-
bled them to find natural patterns in data that generate insight
nd enable better decisions and predictions. The use of data ana-
ytics to predict, detect, and prevent security threats is termed se-
urity analytics ( Cybenko and Landwehr, 2012 ). The incorporation
f cyber capabilities into SG functionality has led to the prolifera-
ion of new data sources. The availability of abundant data gener-
ted by these components has enabled investigators to better study
ybersecurity threats and countermeasures in SGs using security
nalytics ( Tan et al., 2017 ).
.1. The research problem
State estimation (SE) is the principal tool used by energy man-
gement systems (EMS) at power transmission control centers. SE
omputes voltage magnitudes and phase angles for all of the differ-
nt buses after collecting measurement data communicated to the
ontrol center from remote terminal units (RTUs) equipped with
CADA units ( Abur and Gomez-Exposito, 2004 ). A cyber-attacker
an subtly modify these measurement data after compromising
TUs or substation meters, by gaining unauthorized access to the
ontrol system or by intruding into the wireless communication
etworks, for example, by successfully conducting a man-in-the-
iddle attack. This new type of cyber-attack against SE in EMS
s called false data injection (FDI) attacks ( Liu et al., 2011 ). The
alsely injected measurement data can affect the outcome of the

2 M. Ashrafuzzaman, S. Das and Y. Chakhchoukh et al. / Computers & Security 97 (2020) 101994
m
a
m
s
s
f
t
1
a
1
m
a
A
a
s
e
T
i
o
2
p
t
s
a
o
i
t
m
a
u
t
t
(
o
d
d
b
s
SE and can reduce the control center operators level of situational
awareness. This can potentially force operators to take erroneous
corrective actions against spoofed data, which may disrupt the
real-time operation of the grid by impacting OT tools and meth-
ods such as contingency analysis, unit commitment, optimal power
flow and the computational outcomes of locational marginal pric-
ing for electricity markets. The FDI attacks that impact SE predic-
tions have been presented in several publications ( Hug and Gi-
ampapa, 2012 ; Kosut et al., 2011 ; Li et al., 2017 ; Liu et al., 2011 ;
Xie et al., 2011 ). FDI is an important element of a coordinated at-
tack on the power grid and, represents an important class of CPS
attack ( Xiang et al., 2017 ).
Numerous attempts have been undertaken to devise detection
methods for FDI attacks using traditional statistical approaches and
based on the physics of state estimation ( Chakhchoukh et al., 2019 ;
Li et al., 2017 ) and using data-driven machine learning-based secu-
rity analytics ( Tan et al., 2017 ).
1.2. Motivation
Machine learning approaches work by treating FDI attacks on
the measurement data as anomalous compared to the normal
data. Hence the problem is reduced to a binary classification
task. Most of the related studies up to now have used stand-
alone (either supervised, unsupervised or semi-supervised) clas-
sification methods. Different classifiers usually perform differently
on the same data. In ensemble-based machine learning, multiple
classifiers are used together and the results given by these con-
stituent classifiers are further classified by another (second stage)
classifier ( Dietterich, 20 0 0 ; Polikar, 2012 ). Ensemble-based ma-
chine learning approaches have been shown to perform well in
solving other problems ( Das et al., 2020 ; Moustafa et al., 2018 ;
Zhang et al., 2019 ).
Supervised methods have the advantage of learning to differen-
tiate the anomalous from normal data using a tagged or labeled
dataset. Unsupervised methods, on the other hand, sort data into
different clusters where the strength of the clustering lies within
the algorithm itself. Among unsupervised methods, novelty and
outlier detection strategies have shown significant promise in de-
tecting otherwise hidden anomalies. The supervised methods re-
quire large amounts of data to be curated as labeled data (i.e., with
ground truth). It is not very difficult to collect data during normal
operation. However, “attack” data is very sparsely available mak-
ing the process of creating labeled datasets onerous. Unsupervised
methods do not require labeled data. These methods, though more
prone to higher rates of false detection, are better equipped to dis-
cover zero-day attacks never before encountered. A scheme that
utilizes both supervised and unsupervised classifiers can address
and counterbalance the drawbacks inherent to each other.
1.3. Ensemble-based machine learning
In this paper, a security analytics approach that employs
two sets of machine learning ensembles is presented to identify
stealthy FDI attacks on state estimation. One set of the ensem-
bles uses only supervised methods while the other one uses only
unsupervised methods. The supervised methods used are logistic
regression (LR), support vector machines (SVM), naive Bayes with
Gaussian function (NB), decision tree (DT), and neural networks
(NN). The unsupervised methods are one-class SVM (OCSVM), iso-
lation forest (ISOF), elliptic envelope (EE), and local outlier factor
(LOF). These individual classifiers when run together, simultane-
ously or one after another, form the first phase of a machine learn-
ing ensemble. The resultant classifications, into either normal or
anomalous, are used as input to another classifier, called the en-
semble classifier . Majority voting, logistic regression, support vector
achines, naive Bayes with Gaussian function, decision tree, and
rtificial neural networks are used as the ensemble classifiers. The
odels are trained using historical data and the best performing
upervised and unsupervised ensemble models are chosen out of
ix ensemble models of each kind. Both of these “best” models
rom these experiments would then be deployed online for real-
ime detection of stealthy FDI attacks on SE.
.4. Contributions
The major technical contributions of this paper are summarized
s follows.
• Design of an ensemble-based machine learning (EML) scheme
that consists of ensembles of both supervised and unsupervised
classification methods to leverage the advantages of these two
learning classes. • Inclusion of the random forest classifier (RFC) in the EML
scheme enabling a reduced number of features in the data
thereby assessing and minimizing the effect of the so-called
“curse of dimensionality” ( Verleysen and François, 2005 ). • Generation of power transmission system measurement data
using a standard IEEE 14-bus system simulated in MAT-
POWER ( Zimmerman et al., 2011 ) and introduction of stealthy
FDI attacks, i.e., intelligently crafted modifications, to the power
flow data. • Development of a testing and evaluation scheme using the sim-
ulated data to enable performance assessment of the differ-
ent EMLs against stand-alone models using standard evaluation
metrics.
.5. Paper organization
Henceforward this paper is organized as follows. Section 2 sum-
arizes the related works. Section 3 describes the state estimation
nd stealthy FDI process. Section 4 presents the EML framework.
set of experiments with this framework along with the results
re presented in Section 5 . Conclusions and future work are pre-
ented in Section 6 , followed by an acknowledgment and the refer-
nces. All the abbreviations used throughout the paper are listed in
able A.7 in Appendix A . Additional literature review is presented
n Appendix B , and a brief overview of the machine learning meth-
ds used in this paper is given in Appendix C .
. Related work
A number of machine learning based approaches have been
roposed to detect false data injection attacks on the state estima-
ion in energy management systems. Table 1 lists the related works
howing the learning class, algorithms used for feature selections,
lgorithms used for training, and how the datasets were generated
r obtained for each of the works listed. A review of these works
s given in Appendix B . In this section, the works directly related
o the current work are discussed.
Ozay et al. (2015) employed supervised and semi-supervised
achine learning methods to detect both observable (non-stealthy)
nd unobservable (stealthy) FDI attacks. The supervised methods
sed were perceptron, k-nearest neighbors (k-NN), support vec-
or machine (SVM) with linear and Gaussian kernels, sparse logis-
ic regression (SLR), and AdaBoost; and the semi-supervised SVM
S3VM). They evaluated the models using MATPOWER simulations
f IEEE 9-, 57- and 118-bus systems. While they used multiple in-
ividual classifiers and a boosting algorithm (i.e., AdaBoost), they
id not assemble the methods in an ensemble.
Wang et al. (2017a) applied the concept of “first difference”,
orrowed from economics and statistics to time-series mea-
urement data to detect time-synchronous attacks on SE. The

M. Ashrafuzzaman, S. Das and Y. Chakhchoukh et al. / Computers & Security 97 (2020) 101994 3
Table 1
Overview of machine learning-based detection of FDI attacks on the SE in the SGs.
ML Class Author(s) Feature Training Datasets
Selections Models Generator
Supervised Esmalifalak et al. (2017) PCA Distributed SVM MATPOWER
Ozay et al. (2015) Perceptron, k-NN, SVM & SLR MATPOWER
He et al. (2017) CGB-RBM CDBN MATPOWER
Wang et al. (2017b) MSA Simulink
Wang et al. (2017a) k-NN, ANN, SVM, NB & DT MATPOWER
Ashrafuzzaman et al. (2018) RFC ANN MATPOWER
Ayad et al. (2018) RNN MATPOWER
Ahmed et al. (2018a) GA ED-based MATPOWER
Ahmed et al. (2018b) GA SVM MATPOWER
Niu et al. (2019) RNN & CNN MATPOWER
Wang et al. (2019) RF, AdaBoost Simulated
Alimi et al. (2019) SVM & ANN Nigerian Grid
Camana-Acosta et al. (2020) KPCA ERT MATPOWER
Mohammadpourfard et al. (2020) PCA k-NN MATPOWER
Unsupervised Chaojun et al. (2015) KLD-based MATPOWER
Hao et al. (2015) PCA-approximation MATPOWER
Ahmed et al. (2018a) GA ED-based MATPOWER
Wang et al. (2018) SAE LR MATPOWER
Yang et al. (2018) PCA OCSVM, RC, ISOF & LOF MATPOWER
Ahmed et al. (2019) PCA ISOF MATPOWER
Semi-supervised Ozay et al. (2015) S3VM & SLR MATPOWER
Chakhchoukh et al. (2016) DRE MATPOWER
Foroutan and Salmasi (2017) PCA MGD-based MATPOWER
Reinforcement Kurt et al. (2018) SARSA MATPOWER
“
v
a
M
a
c
a
t
a
3
s
i
a
3
u
t
s
s
c
t
Fig. 1. The state estimation process for power transmission systems
(from Thomas and McDonald (2015) ).
S
s
d
n
o
e
F
(
first-difference aware” data is then trained using five super-
ised models k-NN, neural network (NN), SVM, naive Bayes (NB)
nd decision tree (DT). They tested their proposed approach on
ATPOWER-simulated IEEE 14-bus system. In this case also the
uthors used the methods as stand-alone methods only.
On the unsupervised learning side, ( Yang et al., 2018 ) used one-
lass SVM (OCSVM), robust covariance (RC), isolation forest (ISOF)
nd local outlier factor (LOF) as individual classifiers. They ran
hese methods using data from a simulated IEEE 14-bus system.
A few observations can be made from the review of the works
bove and the works listed in Table 1 :
1. Different learning classes had been attempted by the re-
searchers. However, no attempts to use adversarial learning or
explanation-based learning have been undertaken up to now.
2. None of the investigations combined both supervised and un-
supervised methods together in one approach.
3. A few studies mentioned here used multiple classifiers as indi-
vidual methods, but none used any ensemble methods.
4. Almost all the studies used simulated datasets for validating
their approaches. ( Alimi et al., 2019 ) used power flow data from
the Nigerian power grid, but they seeded synthetic attacks into
the dataset later.
. False data injection attacks on state estimation
This section describes state estimation (SE) in power transmis-
ion system, the mathematical formulation for stealthy false data
njection (FDI) attacks on static SE, and how stealthy FDI attacks
re carried out on SE.
.1. State estimation in power transmission systems
State Estimation is used to provide the best estimate of the val-
es of the system’s unknown state variables, i.e., voltage magni-
udes and phase angles on the system buses, based on the mea-
urements available from the network model and sent by the
upervisory control and data acquisition (SCADA) system to the
ontrol center. This is known as static state estimation which cap-
ures the quasi-static behavior of the power transmission system.
E is run every few seconds to few minutes. The functions of the
tate estimator include identifying and correcting anomalies in the
ata, suppressing any bad data, and refining the measurements. Fi-
ally, SE delivers a set of state variables that are acceptable to the
perator and as inputs to other computational programs within the
nergy management system (EMS) ( Thomas and McDonald, 2015 ).
ig. 1 gives the data flow in a typical state estimator.
These EMS tools are directly dependent on SE outputs process
Thomas and McDonald, 2015 ):
Contingency analysis is one of the most important tasks of the
EMS. It involves performing efficient calculations of system

4 M. Ashrafuzzaman, S. Das and Y. Chakhchoukh et al. / Computers & Security 97 (2020) 101994
3
i
t
l
g
t
a
a
t
t
F
t
a
d
o
i
r
t
i
r
T
o
(
3
o
a
h
t
s
T
m
performance from a set of simplified system contingency
conditions and is used for fast estimation of system static
stability right after outages.
Unit commitment is an operational planning method used to
determine the schedule called the unit commitment sched-
ule which tells the system operators beforehand when and
which units to start and shut down during the operation
over a pre-specified time, such that the total operating cost
for that period is minimized.
Optimal power flow is a technique used to simulate load flow
through an AC power system by finding the combination of
flows that is operationally and economically optimal.
Locational marginal pricing tools are used to price out the
cost of electricity for the local distributors and consumers.
The SE process generates a “residual vector” which is analyzed
to detect possible abnormal measurements by checking for residu-
als that do not obey the Gaussian assumption. While the standard
residual analysis tests can identify the presence of errors, it may
not detect “stealthy” FDI attacks because an attacker familiar with
the target power transmission system topology can carefully craft
the amount of data to be injected in such a way that the residual
of the original measurement vector remains equal to the residual
of the measurement vector that contains the injected (or spoofed)
false data.
3.2. Formulation of SE and FDI attacks
The static SE is run after the SCADA units collect the power
flows, power injections and voltage magnitudes measurements
from the system buses. The static SE estimates the state vector
x ∈ R
n that contains phase angles and voltage magnitudes at the
different buses, where n = 2 k − 1 and k is the number of buses in
the system. For AC static SE, the state vector x obeys the following
nonlinear equation:
z = h ( x ) + e (1)
In the above equation, the vector of measurements z ∈ R
m contains
measurement readings from SCADA units, where m is the number
of measurements. The nonlinear vector function h ( · ) is computed
from the grid topology and the transmission lines, transformers
and other grid device parameters. The error vector e ∈ R
m is as-
sumed Gaussian with a covariance matrix R . The SE is run to com-
pute and estimate the state vector x using an iterative algorithm
based on the weighted least squares (WLS) ( Abur and Gomez-
Exposito, 2004 ).
ˆ x k =
ˆ x k −1 + H
�
k ( z k − h ( x k −1 ) ) (2)
where H
�
k = (H
� k
R −1 H k ) −1 H
� k
R −1 and H k is the Jacobian matrix of h
with respect to x at step k . The WLS algorithm is optimal under
Gaussian noise.
After the algorithm converges, i.e., once ‖ ̂ x k − ˆ x k −1 ‖ < δ for
some chosen small threshold δ > 0, the obtained residuals are an-
alyzed for possible abnormal measurements by checking for resid-
uals that do not obey the Gaussian assumption. These abnormal or
bad data could be due to natural failures such as sensor or com-
munication error, or due to FDI attacks. The chi-square test ( χ2 )
and the “3 σ ” rejection rule are used, in most cases, to detect the
bad data ( Abur and Gomez-Exposito, 2004 ).
A DC static SE can also be computed. In this case, only phase
angles are estimated. All voltages are assumed to be equal to 1pu.
The line resistances are neglected and the phase angles differences
between buses are assumed to be small. The DC model obeys a
linear regression model.
z = H x + e (3) b
.3. Stealthy FDI attacks on state estimation
Conventional methods detect abnormal or bad data by analyz-
ng the residual (i.e., the difference between the measurement vec-
or z and the calculated value from the SE, i.e., z − H ̂
x ). If the
argest absolute value of the elements in normalized residual is
reater than a pre-defined threshold α > 0, ( α is generally chosen
o be 3) the corresponding measurement is identified as bad data
nd reported to system operators. The measurement is removed
nd the estimation is re-executed. Therefore, if the bad data is due
o FDI attacks and the injected data are large enough, the conven-
ional residual tests can detect them: these are called non-stealthy
DI attacks , or simply FDI attacks. In the non-stealthy case, the at-
ackers do not have the knowledge of the measurement matrix H
nd they simply manipulate the meter readings to generate ran-
om attacks. If the attackers have knowledge of the system topol-
gy or know the measurement matrix H , they can carefully and
ntelligently craft the false data in such a way that the residual
, the true residual of the original measurement vector z , remains
he same as the residual r a of the measurement vector z with the
njected data z a .
a = z a − H ̂
x a = z − H ̂
x = r (4)
hese attacks cannot be detected using the conventional meth-
ds based on residual analysis, and are called stealthy FDI attacks
Liu et al., 2011 ).
.4. Stealthy FDI attack process
False data injection attacks can be carried out on different parts
f the power grid, e.g., transmission systems, distribution systems,
dvanced metering infrastructure, etc. ( Liu and Li, 2017 ). However
ere, only FDI attacks on the SE in the AC power transmission sys-
em are considered.
The following are the steps an adversary may use to commit a
tealthy FDI attack:
1. Intrusion into the System (the stepping-stone):
(a) If the adversary is an outsider, they will hack into the
system using any or more of the usual cyber-attacks,
e.g., spear-phishing, password-cracking, cracking the crypto-
graphic protection, or using a man-in-the-middle attack by
compromising any wired or wireless communication chan-
nel, among others.
(b) An outside adversary can also be successful in installing
malware using the means described above or by using so-
cial engineering ploys. This malware may have the ability to
steal system information, particularly bus topology.
(c) If the adversary is a trusted insider, then they may already
have the access and authority to the needed information.
2. Carry out stealthy FDI attacks:
(a) After the adversary has gained access into the system
and obtained the necessary system information, they can
now surreptitiously change measurement data to achieve a
stealthy FDI attack.
(b) The operator and the state estimator assume that the data is
correct and estimate the state variable values based on this
false assumption.
(c) Since the state variable values do not represent the actual
state of the system, calculation by any of the post-SE tools
will be incorrect. This will cause an erroneous situation re-
sulting in adverse operation of the system in turn causing
malfunctions or major disruptions.
he goal of the attacker is to disrupt the operation of the trans-
ission system leading to a failure in one or more components or
uses, which may even trigger a cascade of failures, i.e., tripping of

M. Ashrafuzzaman, S. Das and Y. Chakhchoukh et al. / Computers & Security 97 (2020) 101994 5
Fig. 2. High-level diagram of the training pipelines for supervised and unsupervised learning.
b
s
4
s
m
i
s
I
p
u
b
p
f
m
A
4
w
i
d
t
4
g
d
1
s
i
a
f
f
w
f
a
t
o
m
w
s
4
s
i
o
l
i
reakers because of power overload, and causing localized to wide-
cale power disruption.
. Ensemble-based method
This section provides an overview of the ensemble-based
tealthy FDI attack detection scheme. The framework imple-
ents pipelines of individual and ensemble methods consist-
ng of both supervised and unsupervised classifiers. The detailed
chematic diagram depicting the process flow is given in Fig. 2 .
t shows the individual processing phases, namely (1) data pre-
rocessing, (2) feature selection, (3) classification using individ-
al classifiers, (4) classification using ensemble methods, and (5)
uilding the best performing detection models. The training is
erformed offline with historical data, and the testing is per-
ormed online in real-time deployment mode. A review of the
achine learning methods used in this framework is given in
ppendix C .
.1. Data preprocessing
Data preprocessing is the first and foremost task before starting
ith any machine learning application. There are various sub-tasks
n a data preprocessing phase such as removing unwanted data,
ata conversion, scaling, removing invalid data, etc. At this time,
he framework supports standard and min-max scaling.
.2. Feature selection
The dimension of a dataset increase with the size of the power
rid. For example, the number of features in the measurement
ata for state estimation is 27 for the IEEE 9-bus system and is
122 for the IEEE 300-bus system. With increasing feature dimen-
ions the complexity and elapsed time for training the models
ncrease very steeply, causing the so-called “curse of dimension-
lity” ( Verleysen and François, 2005 ). To minimize this problem,
eature selection is often used to eliminate the least discriminating
eatures from the dataset, thereby reducing the dimensionality
ithout sacrificing much of the information. Selecting the best
eature and best number of features could lead the method to
chieve its optimal performance while minimizing its running
ime. The feature selection phase is one of the most crucial phases
f model classification, which can be done by various inbuilt
echanisms or by using domain knowledge. The ensemble frame-
ork currently supports random forest classifier (RFC) as a feature
election algorithm.
.3. Individual classifiers
The scheme employs both supervised and unsupervised clas-
ifier methods. In supervised learning, labeled data, i.e., a train-
ng set of examples with correct responses, is provided and based
n this training the machine learning algorithm generalizes (i.e.,
earns the patterns in the training data) to classify the unlabeled
nput sets. In unsupervised learning, the algorithm is trained with

6 M. Ashrafuzzaman, S. Das and Y. Chakhchoukh et al. / Computers & Security 97 (2020) 101994
s
p
u
t
d
a
d
s
d
5
u
5
t
o
t
s
h
t
a
t
a
5
t
s
i
t
b
n
e
t
i
s
s
5
m
l
a
o
5
t
f
t
i
t
t
e
“
r
t
t
unlabeled data to identify similarities between the inputs that have
something in common. These similar inputs are then categorized
together. In other words, the algorithm attempts to learn the hid-
den patterns in the input data, and later predicts responses to test
inputs based on the learned patterns.
If trained with well-developed labeled data, supervised learning
models perform better than unsupervised models. However, the
additional and often cumbersome data engineering needed to la-
bel raw data is painstaking and challenging. Moreover, attack data
is very sparse. Consequently, the availability of labeled data is not
always guaranteed in a timely manner. That is why most datasets
are synthetic. Because supervised models are trained with labeled
data, they learn the patterns associated with “attacks” very well
and can detect such patterns more consistently. However, if the at-
tack pattern is not one of the learned patterns or if the attack is
a new one, then the performance of supervised models is highly
degraded. In these cases, unsupervised models which flag any out-
of-the-ordinary pattern more consistently must be considered. For
these reasons, both supervised and unsupervised models are in-
cluded in the framework.
4.3.1. Supervised classifiers
The supervised classifiers included in the framework are: deci-
sion tree (DT), logistic regression (LR), naive Bayes (NB), support
vector machine (SVM), and artificial neural network (NN). C.2 pro-
vides a brief description of these methods.
4.3.2. Unsupervised classifiers
The unsupervised classifier models included in the framework
are: one-class support vector machine with polynomial kernel
(OCSVM_P), one-class support vector machine with linear kernel
(OCSVM_L), isolation forest (ISOF), elliptic envelope (EE), and local
outlier factor (LOF). C.3 provides a brief description of these meth-
ods.
4.4. Ensemble classifiers
Ensemble is a learning method where different classifiers are
combined into a meta-classifier that has better generalization per-
formance than each individual classifier alone ( Dietterich, 20 0 0 ;
Polikar, 2012 ). Ensemble is a two-stage process. The first stage
consists of different classification methods, for example, DT, SVM,
LR, and so on, or one base classification algorithm can be used
repeatedly with different subsets of the training data. These in-
dividual classifiers are run together, simultaneously or one after
another. In the second stage, the decisions given by individual
classifiers are fed as input to another classifier, called the ensemble
classifier , for the final decision. Majority voting is the most popular
ensemble method, which selects the class label that has been
predicted by the majority of the constituent classifiers. Instead of
majority voting any binary classification method can be used as
the ensemble classifier.
This framework contains two ensembles: one is an ensemble of
all the individual supervised classifiers used in the framework, and
the other is an ensemble of all the individual unsupervised clas-
sifiers. The framework uses six classifiers as the ensemble classi-
fier: majority voting (Ens_MV), logistic regression (Ens_LR), naive
Bayes (Ens_NB), neural network (Ens_NN), decision tree (Ens_DT),
and support vector machine (Ens_SVM). Fig. 3 shows the ensemble
arrangements.
4.5. Best performing models
The datasets in the pipeline go through all the individual and
ensemble classifiers. The performance of all the supervised clas-
sifiers and the unsupervised classifiers are then compared using
tandard evaluation metrics. This comparison identifies the best
erforming supervised ensemble model and the best performing
nsupervised ensemble model. These models will be deployed in
he state estimation process for real-time detection of stealthy false
ata injection attack in power transmission systems. Fig. 4 depicts
possible real-time detection pipeline. Any unknown FDI attack
etected by the best unsupervised model, can be used to train the
upervised ensemble, so that next time around those attacks are
etected more quickly and more reliably.
. Experiments and results
This section presents a set of experiments that were performed
sing the framework presented above and associated results.
.1. Attack model
The attack model considered in this paper constitute FDI at-
acks targeting the static AC (alternating current) state estimation
f the transmission system. The considered attack model assumes
hat the attacker is capable of changing the communicated data
uch as voltages, currents and power magnitudes. The adversary
as only selected partial knowledge of the network topology and
herefore can generate a stealthy attack on a single bus only. The
ttack model assumes one fixed bus is targeted throughout the en-
ire duration of the attack, meaning that it is a targeted attack, not
random attack.
.2. Simulation and data generation
Simulation of the standard IEEE 14-bus system is used for
he purpose of generating power flow data. The IEEE 14-bus
ystem has 5 generators and 11 loads ( University of Wash-
ngton, 2018 ), as shown in Fig. 5 . The measurements are ob-
ained from solving power flows using the MATPOWER tool-
ox ( Zimmerman et al., 2011 ) and adding Gaussian measurement
oise. The loads are considered to vary randomly around their av-
rage values. The measurements are 40 active power-flows, 14 ac-
ive power-injections, 40 reactive power flows, 14 reactive power-
njections and 14 voltage magnitudes giving a total of 122 mea-
urement features. The dataset consists of 10 0,0 0 0 sets of mea-
urements.
.3. Experimental setup
The framework has been implemented in the Python program-
ing language and using the machine learning library scikit-
earn ( Pedregosa et al., 2011 ). The experiments were executed on
PC with x64 Intel®CORE TM i5-6600K CPU @ 3.50GHz, 8GB mem-
ry and running a 64-bit Ubuntu Linux operating system.
.4. Data preprocessing
The dataset generated contains 90% “normal” data and 10% “at-
ack” data implying that the dataset is imbalanced. Classifiers per-
orm poorly when trained with imbalanced datasets, especially for
he minority class. In this case, the “attacks” are in the minor-
ty class, and the goal is to detect these precisely. To overcome
his problem, two popular techniques to balance datasets, namely
he synthetic minority over-sampling technique (SMOTE) and the
dited nearest neighbor (ENN), were applied to over-sample the
attack” sets of data and under-sample the “normal” sets of data
espectively ( Batista et al., 2004 ). After this balancing act the ra-
io of major and minor class samples in the dataset was 3:2. Since
he unsupervised models function as outlier or anomaly detectors

M. Ashrafuzzaman, S. Das and Y. Chakhchoukh et al. / Computers & Security 97 (2020) 101994 7
Fig. 3. Five individual classifiers combining with one of six ensemble classifiers to form six ensembles.
Fig. 4. High-level diagram of the deployment pipeline using the best-performing
models.
Fig. 5. Diagram of IEEE 14-bus system (adapted from University of Washington
(2018) ) showing the stealthy FDI attack on bus number 4.
i
m
s
t
b
c
t
r
r
t
a
f
Fig. 6. Plot showing the features in the dataset in order of importance.
Table 2
The Confusion Matrix.
Predicted Predicted
Normal Attack
Actual Normal TN FP
Actual Attack FN TP
5
a
s
t
o
v
5
w
T
s
t
w
r
g
u
s
T
v
t
p
5
o
n this paper, the dataset was not balanced for the unsupervised
odels.
The dataset did not have any missing data or invalid data; con-
equently, no data cleaning was performed. The data types of all
he features in the dataset are numeric, except for the class la-
el which is either “normal” or “attack”. All the “normal”s were
hanged to 0s and “attack”s to 1s. Standard scaling was applied
o the dataset. In standard scaling, the features are normalized by
emoving the mean and scaling to unit variance. Standard scaling
eplaces the data values in a feature by their z score. For a value x ,
he z score is calculated as: z = (x − μ) /σ, where μ is the mean
nd σ is the standard deviation of the data values for a given
eature.
.5. Feature selection
The random forest algorithm was used on the dataset to obtain
n ordering of the features according to their importance. A plot
howing the feature importance is given in Fig. 6 . The figure shows
hat the first 21 features have the largest variances, and therefore
nly these features were retained in the dataset as the predictor
ariables, plus the target variable.
.6. Model training
In the model training phase, the experiments were conducted
ith individual classification first and then ensemble classification.
he experiments ran the data through five supervised and five un-
upervised learning models. Six ensemble models were run with
he outcomes of the supervised models, and six ensemble models
ith the outcomes of the unsupervised models. The models were
un using grid-search and the best values of the hyper-parameters
iven by grid-search were retained. The optimal hyper-parameters
sed for different models are given in Table 3 . The dataset was
plit into two subsets: 70% for training and 30% for testing.
o avoid over-fitting and to obtain robust models, 10-fold cross
alidation over randomly divided training data was used. Then
he test data was used for prediction and for measuring model
erformance.
.7. Evaluation metrics
A machine learning classification model predicts class labels as
utput for a given input data. In this case, the class labels are
8 M. Ashrafuzzaman, S. Das and Y. Chakhchoukh et al. / Computers & Security 97 (2020) 101994
Table 3
Hyper-parameter values used for different individual and ensemble classifiers.
Classifier Short Hyper-parameter Values
Names
Supervised Logistic Regression LR random_state = 0, solver = ‘lbfgs’,
Models multi_class = ‘multinomial’
Decision Tree DT default parameters
Naive Bayes NB alpha = 1.0, binarize = 0.0,
fit_prior = True, class_prior = None
Neural Network NN solver = ‘lbfgs’, alpha = 1e-5,
hidden_layer_sizes = (5, 2), random_state = 1
Support Vector SVM C = 1.0, kernel = ‘rbf’, degree = 3, gamma = ‘scale’,
Machine coef0 = 0.0, shrinking = True, probability = True
Unsupervised One Class SVM- OCSVM_P nu = 0.2, kernel = ‘poly’, gamma = 0.1
Models Polynomial Kernel
One Class SVM- OCSVM_L nu = 0.2, kernel = ‘linear’, gamma = 0.1
Linear Kernel
Local Outlier Factor LOF n_neighbors = 20,
contamination = 0.1, novelty = True
Isolation Forest ISOF behaviour = ‘new’, max_samples = 100,
random_state = rng, contamination = 0.1
Elliptic Envelope EE support_fraction = 1, contamination = 0.1,
random_state = rng
Ensemble Majority Voting Ens_MV none
Models Decision Tree Ens_DT default parameters
Naive Bayes Ens-NB alpha = 1.0, binarize = 0.0,
fit_prior = True, class_prior = None
Logistic Regresion Ens_LR random_state = 0, solver = ‘lbfgs’,
multi_class = ‘multinomial’
Neural Network Ens_NN solver = ‘lbfgs’, alpha = 1e-5, novelty = True
hidden_layer_sizes = (5, 2), random_state = 1
Support Vector Ens_SVM C = 1.0, kernel = ‘rbf’, degree = 3, gamma = ‘scale’,
Machine coef0 = 0.0, shrinking = True, probability = True
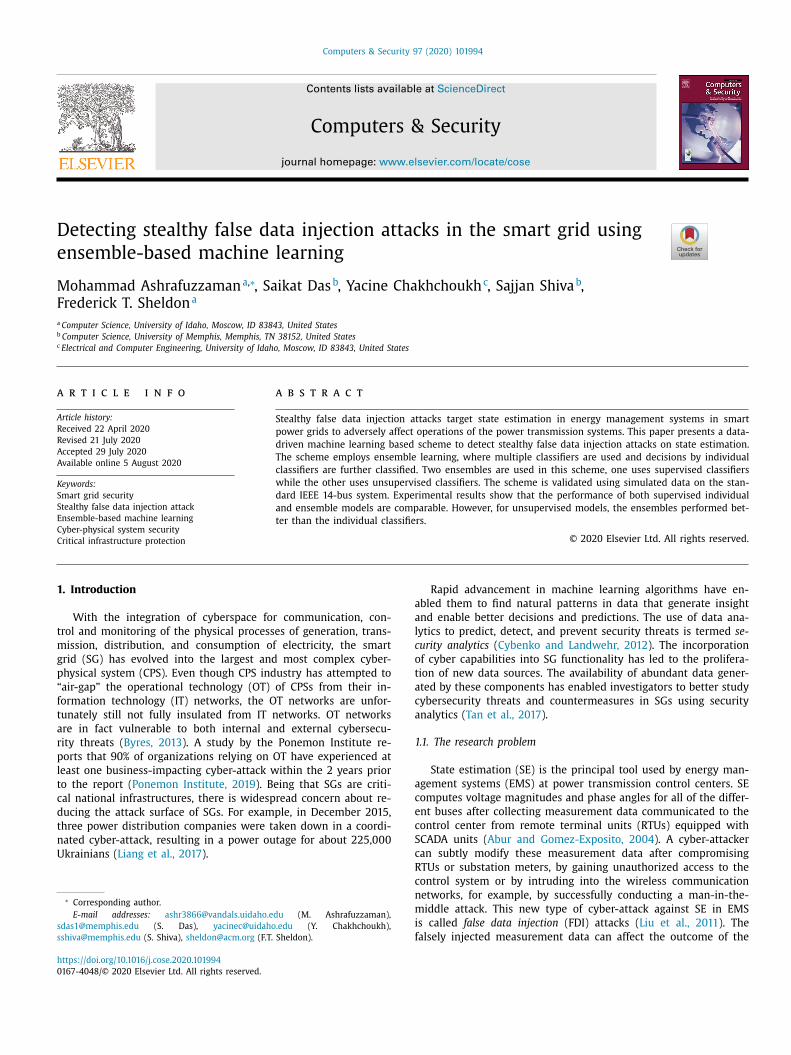
Table 4
Evaluation metrics values for supervised individual and ensemble models using the test dataset.
Models F1-Score Accuracy Precision Sensitivity FPR Specificity ROC AUC
LR 0.8439 0.8931 0.9991 0.7304 0.0003 0.9997 0.8639
NB 0.8439 0.8931 0.9991 0.7304 0.0003 0.9997 0.8081
NN 0.8439 0.8931 0.9991 0.7304 0.0003 0.9997 0.8650
DT 0.8438 0.8930 0.9991 0.7302 0.0003 0.9997 0.8797
SVM 0.8439 0.8931 0.9991 0.7304 0.0003 0.9997 0.8642
Ens_MV 0.8439 0.8931 0.9991 0.7304 0.0003 0.9997 –
Ens_LR 0.8472 0.8961 0.9993 0.7353 0.0003 0.9997 0.8675
En_NB 0.8472 0.8961 0.9993 0.7353 0.0003 0.9997 0.8675
Ens_NN 0.8472 0.8961 0.9993 0.7353 0.0003 0.9997 0.8675
Ens_DT 0.8472 0.8961 0.9993 0.7353 0.0003 0.9997 0.8675
Ens_SVM 0.8472 0.8961 0.9993 0.7353 0.0003 0.9997 0.8675
o
d
t
t
a
a
a
a
s
o
m
c
f
a
5
r
a
f
s
“normal” and “attack”. Depending on the predicted class labels,
the outcomes for binary classification can be categorized as: (1)
True positive (TP): when the model correctly identifies an attack,
(2) True negative (TN): when it correctly identifies a normal or
non-attack, (3) False positive (FP): when a non-attack is incorrectly
identified as an attack, and (4) False negative (FN): when an at-
tack is incorrectly identified as a non-attack. These four catego-
rizes constitute the so-called confusion matrix ( Hastie et al., 2008 )
shown in Table 2 .
To evaluate the models in this paper, the following metrics de-
rived from the confusion matrix were used ( Sokolova and Lapalme,
2009 ).
1. Accuracy = (T P + T N) /T otal Popul ation
2. Precision = T P/ (F P + T P )
3. False Positive Rate (FPR) = F P/ (F P + T N)
4. Sensitivity = T P/ (F N + T P )
5. Specificity = T N/ (F P + T N)
6. F1-score = 2 T P/ (2 T N + F P + F N)
Accuracy is the percentage of correct identification over to-
tal data instances. Precision , also known as the positive predictive
value, represents how often the model correctly identifies an at-
tack. Sensitivity , also known as the true positive rate (TPR), recall,
r detection rate, indicates how many of the attacks the model
oes identify correctly. Sensitivity intuitively gives the ability of
he classifier to find all the positive samples and the precision in-
uitively gives the ability of the classifier not to label as positive
sample that is negative. Specificity , also known as the true neg-
tive rate, measures the proportion of actual negatives, i.e., non-
ttacks, that are correctly identified as such. F1-score , also known
s F-measure, provides the harmonic average of precision and sen-
itivity. The ROC AUC score is a measure of the diagnostic ability
f binary classifier systems. To demonstrate the detection perfor-
ance of different models over all possible thresholds, the ROC
urves are plotted.
In addition, the run times (i.e., elapsed times) were measured
or comparing the speed of different training models running the
ll-feature dataset versus the reduced-feature dataset.
.8. Discussion of results
Table 4 and the corresponding bar-graph in Fig. 7 show the
esults, i.e., the values for the evaluation metrics, from running
ll the five supervised classifiers and six ensemble classifiers on a
eature-reduced dataset with 21 features. The experiment results
how that the values for individual classifiers and those for the

M. Ashrafuzzaman, S. Das and Y. Chakhchoukh et al. / Computers & Security 97 (2020) 101994 9
Fig. 7. Bar-graph of the evaluation metrics values for supervised individual and ensemble models.
Table 5
Training times for supervised individual and ensemble models.
Models Elapsed Time (in s)
21 Features 122 Features Without SVM
LR 0.56 1.02
NB 0.27 1.03
NN 0.57 0.83
DT 1.59 114.52
SVM 2713.82 8897.83
Ens_MV 2718.96 9017.94 6.07
Ens_LR 2717.06 9015.59 4.15
En_NB 2717.01 9015.32 4.12
Ens_NN 2717.11 9015.91 4.33
Ens_DT 2717.02 9015.59 4.08
Ens_SVM 2733.31 9031.70 8.55
e
T
c
a
o
i
c
t
a
m
b
w
2
9
a
e
a
m
u
l
m
m
i
t
t
r
t
t
nsemble classifiers are effectively the same for all the metrics.
he table shows that precision values for the models are very
lose to 100%, whereas accuracy values are about 90%. However, in
classification problem where the goal is to detect the minor class
ccurrences, the most important metrics are the sensitivity which,
n this case, measures the proportion of actual “attacks” that are
orrectly identified as such; and the specificity which measures
he proportion of actual “non-attacks” that are correctly identified
Table 6
Evaluation metrics values for unsupervised individual and ensemble m
Models F1-Score Accuracy Precision Sensitivity FP
OCSVM_P 0.0834 0.4549 0.0494 0.2661 0.5
LOF 0.1388 0.8586 0.1604 0.1223 0.0
ISOF 0.3781 0.7939 0.2630 0.6722 0.1
EE 0.6318 0.9214 0.5606 0.7237 0.0
OCSVM_L 0.1731 0.5000 0.1023 0.5617 0.5
Ens_MV 0.4375 0.8892 0.4150 0.4626 0.0
Ens_LR 0.6409 0.9394 0.6739 0.6111 0.0
Ens_NB 0.5502 0.9034 0.4679 0.6676 0.0
Ens_NN 0.6218 0.9216 0.5428 0.7278 0.0
Ens_DT 0.6615 0.9407 0.6689 0.6544 0.0
Ens_SVM 0.6615 0.9407 0.6689 0.6544 0.0
s such. For supervised models, the sensitivity values for all the
odels are very similar, with the ensemble models having a little
etter number at 73.53%. This indicates that even the best model
ould be able to detect about 73% of the attacks and the rest
7% will go undetected. The specificity values for the models are
9.97% meaning that the models are able to identify a “non-attack”
s such almost always, and will seldom raise a false alert.
Table 5 shows the elapsed time for training the different mod-
ls. It is notable that not only the ensemble models do not perform
ny better, but they also take more time to run than the individual
odels. This is because the ensembles first run all the five indi vid-
al models and then run the ensemble classifier, and the accumu-
ated elapsed time is therefore higher.
The dataset with all the 122 features was also used to train the
odels and it was found that the performance numbers for the
odels do not change at all for this case. Comparison of the values
n column two in Table 5 with those in column three, shows that
he training times from 122 features are up to 400% more than
hose with 21 features.
As seen in Section 2 the SVM is a popular model among the
esearchers working on the problem of detecting stealthy FDI at-
acks on SE. However, the experiment shows that SVM performs
he same as the other models. Moreover, SVM takes much more
odels using the test dataset.
R Specificity ROC Elapsed Time (in s)
AUC 21 Features 122 Features
257 0.4743 0.3702 284.16 7962.94
657 0.9343 0.5283 841.25 3047.80
935 0.8065 0.7393 7.87 19.16
582 0.9418 0.8327 12.39 84.20
062 0.4938 0.5277 35.14 199.62
669 0.9331 – 1212.97 11316.29
287 0.9713 0.7912 1211.11 11313.98
736 0.9264 0.7969 1211.03 11313.96
595 0.9505 0.8341 1211.35 11315.06
314 0.9686 0.8114 1211.04 11315.05
314 0.9686 0.8114 1224.92 11316.29

10 M. Ashrafuzzaman, S. Das and Y. Chakhchoukh et al. / Computers & Security 97 (2020) 101994
Fig. 8. Bar-graph of the evaluation metrics values for unsupervised individual and ensemble models.
Fig. 9. ROC curves for the learning models. ROC curves predict probabilities for two-class problems.
o
i
p
s
u
l
f
2
f
w
T
w
c
c
p
t
h
e
A
time to train. Whereas the other individual models take less than
2 s to train, SVM takes more than 2700 s or 45 min on the feature-
reduced dataset. On the original dataset with 122 features, SVM
takes an astounding 8900 s or 2.47 h. This also exemplifies the
“curse of dimensionality” and how it can be handled by reducing
the feature set. It was also observed that if SVM is taken out as
a constituent individual model, then the times taken by the en-
semble models were reduced drastically without any reduction in
performance. The last column in Table 5 shows times taken by the
ensemble models when SVM is not included in the set of the indi-
vidual models.
Table 6 and the corresponding bar-graph in Fig. 8 show the
evaluation metrics for the unsupervised models and the ensemble
models for the 21-feature dataset. For the unsupervised models, it
was observed that four out of six ensemble models have better ac-
curacy values than any of the individual classifiers. Among the in-
dividual classifiers, the elliptic envelope performs with 63.18% F1-
score and 92.14% accuracy. Two of the ensemble models, namely
ensemble with DT and ensemble with SVM, perform with 66.15%
F1-score and 94.07% accuracy. However, considering the sensitivity,
the best performing model is the ensemble with NN giving a value
f 72.78%, closely followed by the elliptic envelop with 72.37%. This
ndicates that the best diagnostic or detection ability of either su-
ervised, unsupervised or ensemble models is about 73%. The en-
emble using the LR model has the best specificity value of all the
nsupervised models at 97.13%. Among the individual models, el-
iptic envelope has the best specificity value at 94.18%.
For the unsupervised models, training the dataset with all 122
eatures takes up to 900% more time compared to the times for the
1-feature dataset. In this case also it was observed that the per-
ormance numbers do not improve when the models are trained
ith 122 features.
The ROC curve plots FPR on the X -axis and TPR on the Y -axis.
his means that the top left corner of the plot is the “ideal” point,
here the F P R = 0 , and T P R = 1 . The larger the area under the
urve (AUC) the better. The red dotted line indicates the random
lassification and has an AUC of 0.5. The ROC curves for the su-
ervised and unsupervised models are shown in Fig. 9 . Among
he supervised individual and ensemble models, the DT model
as the largest AUC, and among the unsupervised individual and
nsemble models, the ensemble with NN model has the largest
UC.

M. Ashrafuzzaman, S. Das and Y. Chakhchoukh et al. / Computers & Security 97 (2020) 101994 11
6
o
m
c
t
t
s
u
T
s
l
l
w
T
a
v
i
r
d
p
s
r
6
e
c
a
d
s
f
R
r
d
w
s
D
c
i
C
W
w
t
e
a
A
t
C
A
. Conclusion
An attacker can execute stealthy false data injection attacks
n the state estimation of a power grid to steal electricity, cause
inor disruption in the grid, induce cascading failures and/or
ause large-scale outages. Therefore, it is of utmost importance
hat stealthy FDI attacks are detected quickly and accurately. In
his paper, a machine learning-based scheme having two en-
emble pipelines, one of supervised classifiers and another of
nsupervised, was described for detection of stealthy FDI attacks.
he scheme also includes RFC for dimension reduction. The
cheme was implemented using the Python machine-learning
ibraries and tested using a standard IEEE 14-bus system simu-
ated by MATPOWER. The performance of the ensemble scheme
as compared with the performance of individual classifiers.
he performance of individual supervised models are the same
s those of the ensemble models. However, for the unsuper-
ised models, the ensemble models performed better than the
ndividual models. The best models have a sensitivity met-
ic value of 73%, meaning that the models would be able to
etect 73% of the attacks. For both the supervised and unsu-
ervised models, reducing the feature set increases the training
peed many-fold without suffering any degradation in detection
ates.
.1. Future work
The next step with this research is to use these mod-
ls for power systems with larger numbers of buses to as-
ertain whether the performance scales reasonably. It would
lso be interesting to find out whether the training time re-
uction with the reduced feature-sets is significant for large
ystems.
Table A.7
List of abbreviations used in the paper.
Abbreviation Term A
AC alternating current L
ANN artificial neural network M
BDD bad data detection M
CDBN conditional deep belief network M
CGB conditional Gaussian-Bernoulli M
CNN convolutional neural network N
CPS cyber-physical system N
DC direct current O
DRE density ratio estimation O
DT decision tree O
ED Euclidean distance O
EE elliptic envelope O
EMS energy management system P
Ens_DT ensemble with decision tree P
Ens_LR ensemble with logistic regression R
Ens_MV ensemble with majority voting R
Ens_NB ensemble with naive Bayes R
Ens_NN ensemble with neural network R
Ens_SVM ensemble with SVM R
ERT extremely randomized tree R
FDI false data injection R
FDIA false data injection attack S
FN false negative S
FP false positive S
FPR false positive rate S
GA genetic algorithm S
ISOF isolation forest S
IT information technology S
KLD Kullback-Leibler distance S
k-NN k-nearest neighbors T
KPCA kernel PCA T
LMP locational marginal pricing T
LR logistic regression W
This work used simulated data generated by MATPOWER. The
uture plan is to run the models on realistic datasets generated by
eal-time Digital Simulation (RTDS) and physical testbeds.
Another planned work is to extend the framework to incorpo-
ate additional methods, and to configure the training pipeline for
ifferent sets of methods. An extensible and configurable frame-
ork will ensure that such a technique could be standardized for
ystematic use in transmission smart grids.
eclaration of Competing Interest
The authors declare that they have no known competing finan-
ial interests or personal relationships that could have appeared to
nfluence the work reported in this paper.
RediT authorship contribution statement
Mohammad Ashrafuzzaman: Conceptualization, Methodology,
riting - original draft, Project administration. Saikat Das: Soft-
are, Validation, Methodology. Yacine Chakhchoukh: Data cura-
ion, Writing - review & editing. Sajjan Shiva: Writing - review &
diting. Frederick T. Sheldon: Writing - review & editing, Funding
cquisition, Supervision.
cknowledgment
This research was partially supported by an Idaho Global En-
repreneurial Mission (IGEM) grant for Security Management of
yber-Physical Control Systems, 2016 (Grant number IGEM17-001).
ppendix A. Abbreviations
bbreviation Term
STM long short-term memory
GD mixed Gaussian distribution
L machine learning
LP multi-layer perceptron
SA margin-setting algorithm
B naive Bayes
N neural network
CSVM one-class SVM
CSVM_L OCSVM with linear kernel
CSVM_P OCSVM with polynomial kernel
PF optimal power flow
T operational technology
CA principal component analysis
MU phasor measurement unit
BM restricted Boltzmann machine
C robust covariance
FC random forest classifier
LR robust logistic regression
NN recurrent neural network
OC receiver operating characteristic
TU remote terminal unit
3VM semi-supervised SVM
AE stacked autoencoder
ARSA stateactionrewardstateaction
E state estimation
FDI stealthy false data injection
G smart grid
LR sparse logistic regression
VM support vector machine
N true negative
P true positive
PR true positive rate
LS weighted least square

12 M. Ashrafuzzaman, S. Das and Y. Chakhchoukh et al. / Computers & Security 97 (2020) 101994
n
d
s
u
o
o
a
e
s
m
o
a
c
A
d
T
s
s
r
m
t
c
o
i
u
c
a
o
d
M
A
u
t
(
C
C
c
i
w
d
u
o
t
i
t
a
C
C
f
f
c
t
Appendix B. Literature review
This section presents a literature review of machine learning-
based approaches to detect false data injection attacks on the state
estimation used in energy management systems.
The work by ( Esmalifalak et al., 2017 ) employed a distributed
support vector machine (SVM) algorithm for training and principal
component analysis (PCA) for feature selection. Further, they tested
their model on an IEEE 118-bus system simulated by MATPOWER.
He et al. (2017) proposed a conditional deep belief network
(CDBN), one of various deep neural network architectures, to reveal
the high-dimensional temporal behavior features of the stealthy
FDI attacks. The CDBN they employed uses conditional Gaussian–
Bernoulli restricted Boltzmann machines (CGB-RBM) for the first
hidden layer to extract those features. In all other hidden layers
conventional restricted Boltzmann machines (RBM) were used. An
IEEE 118-bus system was simulated using MATPOWER to validate
their approach.
Wang et al. (2017b) proposed a detection method using the
margin setting algorithm (MSA). MSA is a new learning algorithm
for spherical classification. They validated their work using phasor
measurement unit (PMU) data from an IEEE 6-bus system simu-
lated in MATLAB/Simulink.
Ashrafuzzaman et al. (2018) proposed a feed-forward neural
networks (FFNN) based scheme with different configurations for
detecting stealthy FDI attacks on SE. They used random forest
for feature selection and compared the deep learning scheme
with three other methods, namely gradient boosting machines
(GBM), generalized linear models (GLM), and the distributed ran-
dom forests (DRF). Like others, they conducted experiments using
data generated for an IEEE 14-bus system using MATPOWER.
Ahmed et al. (2018a) proposed two Euclidean distance-
based anomaly detection schemes. The first scheme utilizes
unsupervised-learning over unlabeled data to detect outliers or
deviations in the measurements. The second scheme employs
supervised-learning over labeled data to detect deviations in the
measurements. The authors used a genetic algorithm for feature
selection. They tested the proposed methods on IEEE 14-, 39-, 57-
and 118-bus systems using MATPOWER generated data.
Ahmed et al. (2019) utilized unsupervised learning method iso-
lation forest (ISOF) to detect FDI attacks using simulated data gen-
erated by MATPOWER. They reduce the dimensionality of the data
using PCA. To demonstrate that ISOF performs better, they com-
pared their results with those of a few other learning methods
namely SVM, k-NN, NB and MLP. They did not report how long it
took to train the models. It is unexpected that their results of ISOF
are better than the other models which are all supervised models.
Generally, supervised models perform better in terms of accuracy
than unsupervised models on the same dataset.
The proposed framework by ( Niu et al., 2019 ) has two de-
tectors: a network anomaly detector and an FDI attack detector.
For detecting the FDI attacks, they formulated these attacks as
time-series anomalies and used a long short-term memory (LSTM)
based convolutional neural network (CNN). At the same time a re-
current neural network (RNN) with an LSTM cell is deployed to
capture the dynamic behavior of cyber activities within an IEEE
39-bus system simulated by MATPOWER.
Wang et al. (2018) proposed a 6-layer stacked auto-encoder
(SAE), one of various deep neural network architectures, to detect
anomalies caused by stealthy FDI attacks. The SAE was used as an
advanced feature extractor and then a classical predictor, namely
logistic regression classifier, was used as the last layer. Their pro-
posed system was tested on IEEE 9-, 14-, 30- and 118-bus systems
simulated with MATPOWER.
Camana-Acosta et al. (2020) proposed a classification scheme
based on the extremely randomized trees (ERT) algorithm and ker-
el principal component analysis (KPCA) for dimensionality re-
uction. They evaluated the proposed scheme using MATPOWER-
imulated standard IEEE 5- and 118-bus systems.
Mohammadpourfard et al. (2020) used the idea of concept drift ,
npredictable shifts in the underlying distribution of historical data
ver time, to develop a technique to improve the performance
f existing supervised learning methods in detecting stealthy FDI
ttacks. They tested their idea using k-NN with PCA as feature
xtractor and evaluated the performance using a MATPOWER-
imulated standard IEEE 14-bus system.
Hao et al. (2015) proposed a sparse PCA-approximation based
ethod to detect stealthy FDI attacks. In this model, identification
f real measurements with the availability of sparse data sets is
chieved by using recovery functions. The recovery function’s ac-
uracy is inversely proportional to the sparsity of available data.
s such, this model falls short from identifying FDI attacks when
ata is too sparse to produce reliably accurate recovery functions.
hey evaluated their approach on IEEE 9-, 14-, and 57-bus systems
imulated with MATPOWER.
Chakhchoukh et al. (2016) proposed a detection method using a
emi-supervised machine learning technique known as the density
atio estimation (DRE) ( Sugiyama et al., 2012 ). They tested their
odel on an IEEE 118-bus system simulated by MATPOWER.
Foroutan and Salmasi (2017) proposed a four-phase classifica-
ion: (1) dimension reduction using PCA, (2) mixed Gaussian model
onstruction using a positively labeled set, (3) classification thresh-
ld selection using a mixture dataset, and finally (4) evaluation us-
ng an unlabeled dataset. An IEEE 118-bus system was simulated
sing MATPOWER to validate their semi-supervised approach by
omparing its performance with those of SVM and MLP.
Kurt et al. (2018) proposed a detection mechanism using SARSA,
reinforcement learning algorithm. They formulated the problem
f stealthy FDI attack detection as a partially observable Markov
ecision process (POMDP). Their approach was validated using
ATPOWER-generated data for an IEEE 14-bus system.
ppendix C. Machine learning methods
This section briefly describes the machine learning methods
sed in the scheme presented in this paper. More information on
hese learning methods can be found in the books by Hastie et al.
2008) and Marsland (2015) .
1. Feature selection algorithm
1.1. Random forest
Random forest, a popular classification and regression method,
an also be used to rank the features in a dataset based on their
mportance. Random forest consists of a number of decision trees,
here every node in the trees is a condition on a single feature,
esigned to split the dataset into two so that similar response val-
es end up in the same set. At the time of this split, a measure
f how much each feature contributes in making this decision is
aken. This measure forms the basis of ranking the features accord-
ng to their importance. Then, a number of the most important fea-
ures are retained from the ordered list of features while the others
re deleted from the dataset to obtain a feature-reduced dataset.
2. Supervised learning algorithms
2.1. Logistic regression
Logistic regression (LR) is a classification algorithm that per-
orms very well on linearly separable classes. LR builds on ideas
rom the field of statistics where the logistic model is used to dis-
ern the probability of a true/false class or event. This can be ex-
ended to models with more than two classes of events. Each of

M. Ashrafuzzaman, S. Das and Y. Chakhchoukh et al. / Computers & Security 97 (2020) 101994 13
t
1
t
i
T
v
0
C
i
g
f
t
c
s
a
m
c
G
(
C
i
s
k
n
a
n
C
m
b
n
f
T
p
s
a
C
n
n
i
r
o
o
l
f
a
m
p
t
C
C
c
m
o
fi
e
O
a
o
w
a
C
s
r
f
T
t
m
p
e
l
d
R
l
p
C
n
t
t
b
M
R
t
C
p
b
g
d
j
a
R
A
A
A
A
A
A
A
B
he events would be assigned a probability value between 0 and
, where the sum of all probabilities is unity. The coefficients of
he logistic regression algorithm must be estimated from the train-
ng data which is done by using maximum-likelihood estimation.
he best coefficients would result in a model that would predict a
alue very close to 1 for the default class and value very close to
for the other class.
2.2. Support vector machine
Support vector machine (SVM) is a group of supervised learn-
ng methods that identify the patterns for data classification or re-
ression analysis based on finding a separating hyperplane in the
eature space between two classes, in such a way that the dis-
ance between the hyperplane and the closest data points for each
lass is maximized. The SVM algorithm is based on probabilistic
tatistical learning theory ( Cortes and Vapnik, 1995 ) whereby the
pproach favors a minimized classification risk rather than opti-
al classification. Various types of dividing classification surfaces
an be realized by applying a kernel, such as linear, polynomial,
aussian radial basis function (RBF), sigmoid, or hyperbolic tangent
Christianini and Shawe-Taylor, 20 0 0 ).
2.3. Naive Bayes
Naive Bayes is a simple classifier used in many machine learn-
ng problems. Based on the Bayes theorem this probabilistic clas-
ifier helps define the probability of an event based on some prior
nowledge of certain conditions associated with that event. The
ame naive Bayes originates from the fact that the input features
re assumed to be independent, even though in practice this may
ot always be true.
2.4. Decision tree
Decision tree (DT) is a non-parametric supervised learning
ethod and is used both for classification and regression. DT
uilds a tree in which each branch shows a probability between a
umber of possibilities and each leaf shows a decision. The paths
rom the root of the tree to the leaves represent classification rules.
he algorithm collects information and applies the rules for the
urpose of the decision to take a particular path. In DT, each level
plits the data according to different attributes and attempts to
chieve perfect classification with a minimal number of decisions.
2.5. Artificial neural networks
The computational architecture of neural networks mimics the
eural structure and function of the brain forming the intercon-
ected groups of artificial neurons. Each of these artificial neurons
s a set of input values and associated weights that trigger the neu-
on beyond a threshold. The neural network is organized in layers
f neurons. The first layer is the input layer and the last one is the
utput layer. The layers in between these two are called hidden
ayers. The neural networks attempt to hierarchically learn deep
eatures and correlations in input data by adjusting the weight
ssociated with the neurons. Neural network architectures have
any variants with each finding success in specific domains of ap-
lications. An extensive review of neural networks can be found in
he paper by Schmidhuber (2015) .
3. Unsupervised learning algorithms
3.1. One-class SVM
One-class classification, also known as unary classification or
lass-modeling, tries to identify objects of a specific class pri-
arily by learning from an unlabeled training set containing
nly the objects of that class. Trained in this way, the classi-
er flags any object not recognized according to the learned gen-
ralization as an outlier or anomaly ( Khan and Madden, 2009 ).
CSVM ( Schölkopf et al., 20 0 0 ) is a support vector machine based
nomaly detector. Like the supervised SVM models, unsupervised
ne-class versions also work with different kernels. In this frame-
ork one-class SVMs with a linear kernel and a polynomial kernel
re used.
3.2. Isolation forest
Isolation forest ( Liu et al., 2012 ) is an ensemble regressor con-
isting of a number of isolation trees. Each tree is trained on a
andom subset of the training data. Isolation forest is used to per-
orm the outlier detection efficiently in high-dimensional datasets.
he algorithm isolates observations by randomly selecting a fea-
ure and then randomly selecting a split value between the maxi-
um and minimum values of the selected features using recursive
artitioning. The required number of splits to isolate a sample is
quivalent to the path length from the root to the leaf. The path
ength from the root to leaf, averaged over a forest of such ran-
om trees, is a measure of normality and the decision function.
andom partitioning produces noticeably shorter paths for anoma-
ies. Therefore, the trees that collectively produce shorter paths for
articular samples are highly likely to be anomalies.
3.3. Elliptic envelope
Elliptic envelope (EE) attempts to ‘draw’ an ellipse putting the
ormal class members inside the ellipse. Any observation outside
he ellipse is then classified as an outlier or anomaly. EE models
he data as a high dimensional Gaussian distribution with possi-
le covariances between feature dimensions and uses the FAST-
inimum Covariance Determinant ( Hubert and Debruyne, 2010 ;
ousseeuw and Driessen, 1999 ) to estimate the size and shape of
he ellipse.
3.4. Local outlier factor
The local outlier factor (LOF) ( Breunig et al., 20 0 0 ) first com-
utes the local densities of the data objects using distances given
y k-nearest neighbors (k-NN) algorithm. LOF then identifies re-
ions of similar density by comparing the local density of a given
ata object to the local densities of its neighbors. The data ob-
ects that have substantially lower densities than their neighbors
re identified as the anomalies.
eferences
bur, A., Gomez-Exposito, A., 2004. Power System State Estimation: Theory and Im-
plementation. CRC Press, New York doi: 10.1201/9780203913673 . hmed, S., Lee, Y., Hyun, S.-H., Koo, I., 2018. Covert cyber assault detection in smart
grid networks utilizing feature selection and Euclidean distance-based machinelearning. Appl. Sci. 8 (5), 772–792. doi: 10.3390/app8050772 .
hmed, S., Lee, Y., Hyun, S.-H., Koo, I., 2018. Feature selection–based detection ofcovert cyber deception assaults in smart grid communications networks us-
ing machine learning. IEEE Access 6, 27518–27529. doi: 10.1109/ACCESS.2018.
2835527 . hmed, S., Lee, Y., Hyun, S.-H., Koo, I., 2019. Unsupervised machine learning-based
detection of covert data integrity assault in smart grid networks utilizing isola-tion forest. IEEE Trans. Inf. Forens. Secur. 14 (10), 2765–2777. doi: 10.1109/TIFS.
2019.2902822 . limi, O.A., Ouahada, K., Abu-Mahfouz, A.M., 2019. Real time security assessment of
the power system using a hybrid support vector machine and multilayer per-
ceptron neural network algorithms. Sustainability 11 (13), 3586. doi: 10.3390/su11133586 .
shrafuzzaman, m., Chakhchoukh, Y., Jillepalli, A., Tosic, P., Conte de Leon, D., Shel-don, F., Johnson, B., 2018. Detecting stealthy false data injection attacks in
power grids using deep learning. In: Proceedings of the Fourteenth Interna-tional Wireless Communications and Mobile Computing Conference (IWCMC).
IEEE, pp. 219–225. doi: 10.1109/IWCMC.2018.8450487 . yad, A., Farag, H.E., Youssef, A., El-Saadany, E.F., 2018. Detection of false data injec-
tion attacks in smart grids using recurrent neural networks. In: 2018 Proceed-
ings of the IEEE Power & Energy Society Innovative Smart Grid TechnologiesConference (ISGT). IEEE, pp. 1–5. doi: 10.1109/ISGT.2018.8403355 .
atista, G.E., Prati, R.C., Monard, M.C., 2004. A study of the behavior of several meth-ods for balancing machine learning training data. ACM SIGKDD Explor. Newslett.
6 (1), 20–29. doi: 10.1145/1007730.1007735 .

14 M. Ashrafuzzaman, S. Das and Y. Chakhchoukh et al. / Computers & Security 97 (2020) 101994
P
P
P
R
S
S
T
U
V
W
W
W
W
X
X
Y
Z
Z
M
v
c
b
H
t
S
v
H
n
S
H
c
t
a
i
Breunig, M.M., Kriegel, H.-P., Ng, R.T., Sander, J., 20 0 0. LOF: identifying density-basedlocal outliers. In: Proceedings of the 20 0 0 ACM SIGMOD International Confer-
ence on Management of Data, pp. 93–104. doi: 10.1145/342009.335388 . Byres, E., 2013. The air gap: SCADA’s enduring security myth. Commun. ACM 56 (8),
29–31. doi: 10.1145/2492007.2492018 . Camana-Acosta, M.R., Ahmed, S., Garcia, C.E., Koo, I., 2020. Extremely randomized
trees-based scheme for stealthy cyber-attack detection in smart grid networks.IEEE Access 8, 19921–19933. doi: 10.1109/ACCESS.2020.2968934 .
Chakhchoukh, Y., Lei, H., Johnson, B.K., 2019. Diagnosis of outliers and cyber attacks
in dynamic PMU-based power state estimation. IEEE Trans. Power Syst. doi: 10.1109/TPWRS.2019.2939192 .
Chakhchoukh, Y. , Liu, S. , Sugiyama, M. , Ishii, H. , 2016. Statistical outlier detectionfor diagnosis of cyber attacks in power state estimation. In: Proceedings of the
2016 IEEE Power and Energy Society General Meeting (PESGM). IEEE, pp. 1–5 . Chaojun, G., Jirutitijaroen, P., Motani, M., 2015. Detecting false data injection attacks
in AC state estimation. IEEE Trans. Smart Grid 6 (5), 2476–2483. doi: 10.1109/
TSG.2015.2388545 . Christianini, N., Shawe-Taylor, J., 20 0 0. Support vector machines and other kernel-
based learning methods, Cambridge UP. Cortes, C., Vapnik, V., 1995. Support-vector networks. Mach. Learn. 20 (3), 273–297.
doi: 10.10 07/BF0 0994018 . Cybenko, G., Landwehr, C.E., 2012. Security analytics and measurements. IEEE Secur.
Privacy 10 (3), 5–8. doi: 10.1109/MSP.2012.75 .
Das, S., Venugopal, D., Shiva, S., 2020. A holistic approach for detecting DDoS at-tacks by using ensemble unsupervised machine learning. In: Proceedings of the
Future of Information and Communication Conference. Springer, pp. 721–738.doi: 10.1007/978- 3- 030- 39442- 4 _ 53 .
Dietterich, T.G., 20 0 0. Ensemble methods in machine learning. In: Proceedings ofthe International Workshop on Multiple Classifier Systems. Springer, pp. 1–15.
doi: 10.1007/3- 540- 45014- 9 _ 1 .
Esmalifalak, M., Liu, L., Nguyen, N., Zheng, R., Han, Z., 2017. Detecting stealthy falsedata injection using machine learning in smart grid. IEEE Syst. J. 11 (3), 1644–
1652. doi: 10.1109/JSYST.2014.2341597 . Foroutan, S.A., Salmasi, F.R., 2017. Detection of false data injection attacks against
state estimation in smart grids based on a mixture Gaussian distribution learn-ing method. IET Cyber-Phys. Syst.: Theory Appl. doi: 10.1049/iet-cps.2017.0013 .
Hao, J., Piechocki, R.J., Kaleshi, D., Chin, W.H., Fan, Z., 2015. Sparse malicious false
data injection attacks and defense mechanisms in smart grids. IEEE Transactionson Industrial Informatics 11 (5), 1–12. doi: 10.1109/TII.2015.2475695 .
Hastie, T. , Tibshirani, R. , Friedman, J. , 2008. The Elements of Statistical Learning:Data Mining, Inference, and Prediction, 2nd New York: Springer-Verlag .
He, Y., Mendis, G.J., Wei, J., 2017. Real-time detection of false data injection attacksin smart grid: a deep learning-based intelligent mechanism. IEEE Trans. Smart
Grid doi: 10.1109/TSG.2017.2703842 .
Hubert, M., Debruyne, M., 2010. Minimum Covariance Determinant, 2. Wiley Inter-disciplinary Reviews: Computational Statistics, pp. 36–43. doi: 10.1002/wics.61 .
Hug, G., Giampapa, J.A., 2012. Vulnerability assessment of AC state estimation withrespect to false data injection cyber-attacks. IEEE Trans. Smart Grid 3 (3), 1362–
1370. doi: 10.1109/TSG.2012.2195338 . Khan, S.S., Madden, M.G., 2009. A survey of recent trends in one class classification.
In: Proceedings of the Irish Conference on Artificial Intelligence and CognitiveScience. Springer, pp. 188–197. doi: 10.1007/978- 3- 642- 17080- 5 _ 21 .
Kosut, O., Jia, L., Thomas, R.J., Tong, L., 2011. Malicious data attacks on the smart
grid. IEEE Trans. Smart Grid 2 (4), 645–658. doi: 10.1109/TSG.2011.2163807 . Kurt, M.N., Ogundijo, O., Li, C., Wang, X., 2018. Online cyber-attack detection in
smart grid: a reinforcement learning approach. IEEE Trans. Smart Grid 10 (5),5174–5185. doi: 10.1109/TSG.2018.2878570 .
Li, B., Lu, R., Wang, W., Choo, K.-K.R., 2017. Distributed host-based collaborative de-tection for false data injection attacks in smart grid cyber-physical system. J.
Parall. Distrib. Comput. 103, 32–41. doi: 10.1016/j.jpdc.2016.12.012 .
Liang, G., Weller, S.R., Zhao, J., Luo, F., Dong, Z.Y., 2017. The 2015 Ukraine black-out: implications for false data injection attacks. IEEE Trans. Power Syst. 32 (4),
3317–3318. doi: 10.1109/TPWRS.2016.2631891 . Liu, F.T., Ting, K.M., Zhou, Z.-H., 2012. Isolation-based anomaly detection. ACM Trans.
Knowl. Discov. Data (TKDD) 6 (1), 1–39. doi: 10.1145/2133360.2133363 . Liu, X., Li, Z., 2017. False data attack models, impact analyses and defense strategies
in the electricity grid. Electr. J. 30, 35–42. doi: 10.1016/j.tej.2017.04.001 .
Liu, Y., Ning, P., Reiter, M.K., 2011. False data injection attacks against state esti-mation in electric power grids. ACM Trans. Inf. Syst. Secur. 14 (1), 13:1–13:33.
doi: 10.1145/1952982.1952995 . Marsland, S. , 2015. Machine Learning: An Algorithmic Perspective. CRC press .
Mohammadpourfard, M., Weng, Y., Pechenizkiy, M., Tajdinian, M., Mohammadi-Ivatloo, B., 2020. Ensuring cybersecurity of smart grid against data integrity
attacks under concept drift. Int. J. Electr. Power Energy Syst. 119, 105947.
doi: 10.1016/j.ijepes.2020.105947 . Moustafa, N., Turnbull, B., Choo, K.-K.R., 2018. An ensemble intrusion detection tech-
nique based on proposed statistical flow features for protecting network trafficof internet of things. IEEE Internet Things J. 6 (3), 4 815–4 830. doi: 10.1109/JIOT.
2018.2871719 . Niu, X., Li, J., Sun, J., Tomsovic, K., 2019. Dynamic detection of false data injection
attack in smart grid using deep learning. In: Proceeding of the 2019 IEEE Power
& Energy Society Innovative Smart Grid Technologies Conference (ISGT). IEEE,pp. 1–6. doi: 10.1109/ISGT.2019.8791598 .
Ozay, M., Esnaola, I., Vural, F.T.Y., Kulkarni, S.R., Poor, H.V., 2015. Machine learningmethods for attack detection in the smart grid. IEEE Trans. Neural Netw. Learn.
Syst. 27 (8), 1773–1786. doi: 10.1109/TNNLS.2015.2404803 .
edregosa, F. , Varoquaux, G. , Gramfort, A. , Michel, V. , Thirion, B. , Grisel, O. , Blon-del, M. , Prettenhofer, P. , Weiss, R. , Dubourg, V. , Vanderplas, J. , Passos, A. , Cour-
napeau, D. , Brucher, M. , Perrot, M. , Duchesnay, E. , 2011. Scikit-learn: machinelearning in Python. J. Mach. Learn. Res. 12, 2825–2830 .
olikar, R., 2012. Ensemble learning. In: Ensemble Machine Learning. Springer,pp. 1–34. doi: 10.1007/978- 1- 4419- 9326- 7 _ 1 .
onemon Institute, 2019. Cybersecurity in operational technology: 7 insights youneed to know. Accessed on April 10, 2020.
ousseeuw, P.J. , Driessen, K.V. , 1999. A fast algorithm for the minimum covariance
determinant estimator. Technometrics 41 (3), 212–223 . chmidhuber, J., 2015. Deep learning in neural networks: an overview. Neural Netw.
61, 85–117. doi: 10.1016/j.neunet.2014.09.003 . Schölkopf, B. , Williamson, R.C. , Smola, A.J. , Shawe-Taylor, J. , Platt, J.C. , 20 0 0. Sup-
port vector method for novelty detection. In: Advances in Neural InformationProcessing Systems, pp. 582–588 .
Sokolova, M., Lapalme, G., 2009. A systematic analysis of performance measures for
classification tasks. Inf. Process. Manag. 45 (4), 427–437. doi: 10.1016/j.ipm.2009.03.002 .
ugiyama, M. , Suzuki, T. , Kanamori, T. , 2012. Density Ratio Estimation in MachineLearning. Cambridge University Press .
an, S., De, D., Song, W.-Z., Yang, J., Das, S.K., 2017. Survey of security advances insmart grid: A data driven approach. IEEE Commun. Surv. Tutorials 19 (1), 397–
422. doi: 10.1109/COMST.2016.2616442 .
Thomas, M.S. , McDonald, J.D. , 2015. Power System SCADA and Smart Grids. CRCPress .
niversity of Washington, 2018. Power System Test Case Archive. [Online]. Available:http://www.ee.washington.edu/research/pstca/ .
erleysen, M., François, D., 2005. The curse of dimensionality in data mining andtime series prediction. In: Proceeding of the International Work-Conference on
Artificial Neural Networks. Springer, pp. 758–770. doi: 10.1007/11494669 _ 93 .
ang, D., Wang, X., Zhang, Y., Jin, L., 2019. Detection of power grid disturbances andcyber-attacks based on machine learning. J. Inf. Secur. Appl. 46, 42–52. doi: 10.
1016/j.jisa.2019.02.008 . ang, H., Ruan, J., Wang, G., Zhou, B., Liu, Y., Fu, X., Peng, J.-C., 2018. Deep learning
based interval state estimation of AC smart grids against sparse cyber attacks.IEEE Trans. Ind. Inf. doi: 10.1109/TII.2018.2804669 .
ang, J., Tu, W., Hui, L.C., Yiu, S.-M., Wang, E.K., 2017. Detecting time synchroniza-
tion attacks in cyber-physical systems with machine learning techniques. In:Proceeding of the 2017 IEEE Thirty-seventh International Conference on Dis-
tributed Computing Systems (ICDCS). IEEE, pp. 2246–2251. doi: 10.1109/ICDCS.2017.25 .
ang, Y., Amin, M., Fu, J., Moussa, H., 2017. A novel data analytical approach forfalse data injection cyber-physical attack mitigation in smart grids. IEEE Access
doi: 10.1109/ACCESS.2017.2769099 .
iang, Y., Wang, L., Liu, N., 2017. Coordinated attacks on electric power systems in acyber-physical environment. Electr. Power Syst. Res. 14 9, 156–16 8. doi: 10.1016/
j.epsr.2017.04.023 . ie, L., Mo, Y., Sinopoli, B., 2011. Integrity data attacks in power market operations.
IEEE Trans. Smart Grid 2 (4), 659–666. doi: 10.1109/TSG.2011.2161892 . ang, C., Wang, Y., Zhou, Y., Ruan, J., Liu, W., et al., 2018. False data injection attacks
detection in power system using machine learning method. J. Comput. Com-mun. 6 (11), 276. doi: 10.4236/jcc.2018.611025 .
hang, X., Zhao, Z., Zheng, Y., Li, J., 2019. Prediction of taxi destinations using a novel
data embedding method and ensemble learning. IEEE Trans. Intell. Transp. Syst.doi: 10.1109/TITS.2018.2888587 .
immerman, R.D., Murillo-Sánchez, C.E., Thomas, R.J., 2011. MATPOWER: Steady-state operations, planning, and analysis tools for power systems research and
education. IEEE Trans. Power Syst. 26 (1), 12–19. doi: 10.1109/TPWRS.2010.2051168 .
ohammad Ashrafuzzaman is a Ph.D. candidate of computer science at the Uni-
ersity of Idaho. He is doing his research in cybersecurity and machine learning. Heompleted his M.Sc. in computer science at the University of Saskatchewan funded
y a Canadian Commonwealth Scholarship. He went on to work for the software
industry in companies like RSA Security and Lexmark before coming back to school.e was a recipient of the IGEM research assistantship. He is a senior member of
he IEEE.
aikat Das is a Ph.D. candidate in the Computer Science department at the Uni-ersity of Memphis, TN, USA. He has completed his M.Sc. degree from the same.
e worked as an Instructor in Cyber Defense program at Southwest TN Commu-ity College and as his industry experience, he worked more than five years as a
enior Software Engineer in various tech companies including Samsung Electronics.is research interests include intrusion detection system with machine learning for
yber-attacks, explanation-based machine learning in cybersecurity, stealth migra-
ion protocol in cloud computing, runtime verification in software systems, etc.
Yacine Chakhchoukh received the Ph.D. degree in electrical engineering from Paris-
Sud XI University, Paris, France, in 2010. His industrial experience was with theFrench Electrical Transmission System Operator (RTE-EDF, France). He is currently
n Assistant Professor with the University of Idaho, Moscow, ID, USA. His researchnterests include cyber and physical security for the smart grid, power systems con-
trol, and analysis. In 2017, he was the recipient of the IEEE SPS Signal Processing
Magazine Best Paper Award.

M. Ashrafuzzaman, S. Das and Y. Chakhchoukh et al. / Computers & Security 97 (2020) 101994 15
S
f
r
p
U
s
c
f
a
F
e
w
a
l
S
i
n
s
ajjan Shiva is a Professor of computer science and served as the Director andounding chairman of the Department from 2002 to August 2015. He is the Di-
ector of Game Theory and Cyber Security laboratory. He has served on the com-uter science faculty at the University of Alabama in Huntsville and Alabama A&M
niversity and has been a consultant to industry and Government. His current re-earch spans cyber security, cloud security, secure software development and ma-
hine learning applications. He is a Life Fellow of IEEE and ACM and has authoredour books (9 editions) on computer architecture used in more than 120 universities
round the world.
rederick Sheldon has 35+ years of experience from academia, industry and gov-rnment in various roles working on a diverse set of computer science problems
ithin the scope of software engineering, formal methods, information assurancend security in domains such as embedded real-time avionics/vehicular, energy de-
ivery systems, supply chain, and cryptographic key management. He received theigma Xi research and UT-Battelle key contributor and significant event awards and
s senior member of IEEE and ACM. He has degrees from the University of Min-esota and University of Texas at Arlington. Currently he is a professor of computer
cience at the University of Idaho.
Related Documents