1 Department of Consumer and Employment Protection © 2007 Resources Safety Please read this before using presentation The charts and tables in this presentation were prepared by Resources Safety from data submitted by mining operations throughout Western Australia as required by section 76 of the Mines Safety and Inspection Act 1994. Note that exploration data are not included. This presentation is made available for non-commercial use (e.g. toolbox meetings) subject to the condition that the PowerPoint file is not altered without permission from Resources Safety Supporting resources, such as brochures and posters, are available from Resources Safety For resources, information or clarification, please contact: [email protected] or visit www.docep.wa.gov.au/ResourcesSafety

Department of Consumer and Employment Protection © 2007 Resources Safety 1 Please read this before using presentation The charts and tables in this presentation.
Dec 18, 2015
Welcome message from author
This document is posted to help you gain knowledge. Please leave a comment to let me know what you think about it! Share it to your friends and learn new things together.
Transcript
1Department of Consumerand Employment Protection © 2007 Resources Safety
Please read this before using presentation
The charts and tables in this presentation were prepared by Resources Safety from data submitted by mining operations throughout Western Australia as required by section 76 of the Mines Safety and Inspection Act 1994. Note that exploration data are not included.
This presentation is made available for non-commercial use (e.g. toolbox meetings) subject to the condition that the PowerPoint file is not altered without permission from Resources Safety
Supporting resources, such as brochures and posters, are available from Resources Safety
For resources, information or clarification, please contact:
or visit
www.docep.wa.gov.au/ResourcesSafety
Toolbox presentation:Safety performance in the Western Australian mineral industry 2005–06 June 2007
3Department of Consumerand Employment Protection © 2007 Resources Safety
Definitions
Lost time injury (LTI): A work injury that results in an absence from work for at least one full day or shift any time after the day or shift on which the injury occurred
Serious injury: A lost time injury that results in the injured person being disabled for a period of two weeks or more.
Minor injury: A lost time injury that results in the injured person being disabled for a period of less than two weeks
Incidence rate: The number of lost time injuries per 1000 employees for a 12 month period
Fatal injury incidence rate: The number of fatal injuries per 1000 employees for a 12 month period
Lost time injury frequency rate (LTIFR): The number of lost time injuries per million hours worked
4Department of Consumerand Employment Protection © 2007 Resources Safety
Definitions continued
Duration rate: The average number of workdays lost per injury Injury index: The number of workdays lost per million hours worked Serious injury frequency rate: The number of serious injuries per million
hours worked Metalliferous mines: All mines other than coal mines are classed as
metalliferous mines NOC: Not otherwise classified
5Department of Consumerand Employment Protection © 2007 Resources Safety
Statistical summary for 2005–06
There were five fatal accidents
There were 462 lost time injuries, 37 more than the previous year (425 injuries)
There was an average workforce of 56,425 employees, an increase of 10% over the previous year (51,207 employees)
6Department of Consumerand Employment Protection © 2007 Resources Safety
Statistical summary for 2005–06 continued
The overall lost time injury frequency rate improved slightly by 2%, falling from 4.2 to 4.1
The overall lost time injury duration rate deteriorated slightly by 4%, rising from 19.4 to 20.2
The overall injury index deteriorated slightly by 1%, up from 82 to 83
7Department of Consumerand Employment Protection © 2007 Resources Safety
Statistical summary for 2005–06 continued
Serious injuries in the mining industry totalled 349, which is 33 more than for 2004–05
The overall serious injury frequency rate improved slightly by 3%, falling from 3.2 to 3.1
8Department of Consumerand Employment Protection © 2007 Resources Safety
Statistical summary for 2005–06 continued
Lost time injury frequency rates by sector: Gold – deteriorated by 13%, rising from 3.9 to 4.4 Iron ore – deteriorated by 9%, rising from 2.2 to 2.4 Bauxite & alumina – deteriorated by 20%, rising from 2.5 to 3.0 Nickel – improved by 16%, falling from 7.0 to 5.9
9Department of Consumerand Employment Protection © 2007 Resources Safety
Fatal accidents 2005–06
A project manager died after becoming trapped between the trays of two haul trucks at a gold mine. One of the haul trucks had broken down and another haul truck was being maneuvered into position to enable jumper cables to be connected to re-start the disabled haul truck. The manager was standing on the cab decking of the disabled haul truck directing the driver of the other haul truck who was watching the manager’s hand signals in order to get as close as possible. The manager was looking down and as the gap between the vehicles narrowed his head was caught and crushed between the trays of the trucks.
10Department of Consumerand Employment Protection © 2007 Resources Safety
Fatal accidents 2005–06 continued
A drill jumbo operator died in an underground gold mine after a rock weighing about one tonne fell from the backs, striking his head, shoulders and back. He was assisting another drill jumbo operator during ground support operations and was in the process of placing a split set rock bolt onto a boom of the twin boom drill jumbo when the rock fell from behind an area of mesh that had not been pinned to the backs.
11Department of Consumerand Employment Protection © 2007 Resources Safety
Fatal accidents 2005–06 continued
An electrician was electrocuted while attempting to restore a dewatering pump to working condition in a pump chamber in an underground nickel mine. A supervisor found the deceased lying face up on the floor in front of the open pump starter box with a plastic termination shroud and a screwdriver nearby. A subsequent inspection of the pump starter box identified that the pump circuit was switched on at the time of the accident.
12Department of Consumerand Employment Protection © 2007 Resources Safety
Fatal accidents 2005–06 continued
A senior charge-up operator received fatal injuries when an explosion occurred while he was attempting to assemble an impact cannon adjacent to a hung up ore pass in an underground nickel mine. The deceased had intended to use the cannon to fire an explosive projectile into the ore pass. Evidence indicates that the projectile detonated in the barrel of the cannon.
13Department of Consumerand Employment Protection © 2007 Resources Safety
Fatal accidents 2004–05 continued
A blast hole drill operator received fatal injuries at night when the tray-back truck he was driving collided with the back of a truck parked near an open pit gold mine workshop. Two drill rods protruding from the tray of the parked truck speared through the operator’s windscreen and struck him, causing massive injuries. The operator was treated at a hospital but succumbed to his injuries two days later.
14Department of Consumerand Employment Protection © 2007 Resources Safety
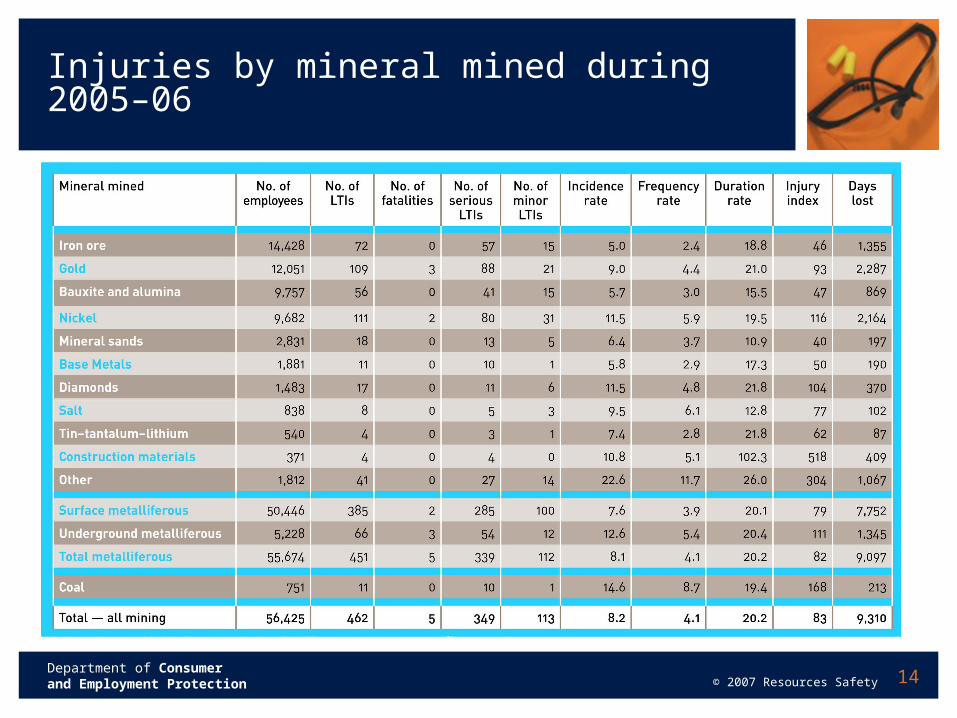
Injuries by mineral mined during 2005–06
15Department of Consumerand Employment Protection © 2007 Resources Safety
Graphs
16Department of Consumerand Employment Protection © 2007 Resources Safety
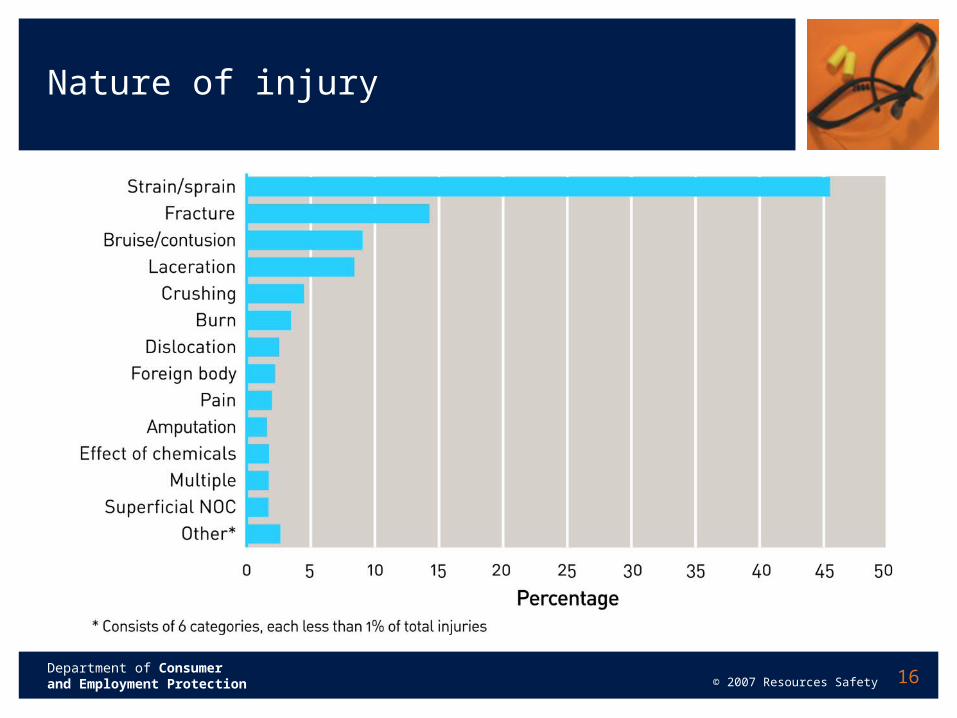
Nature of injury
17Department of Consumerand Employment Protection © 2007 Resources Safety
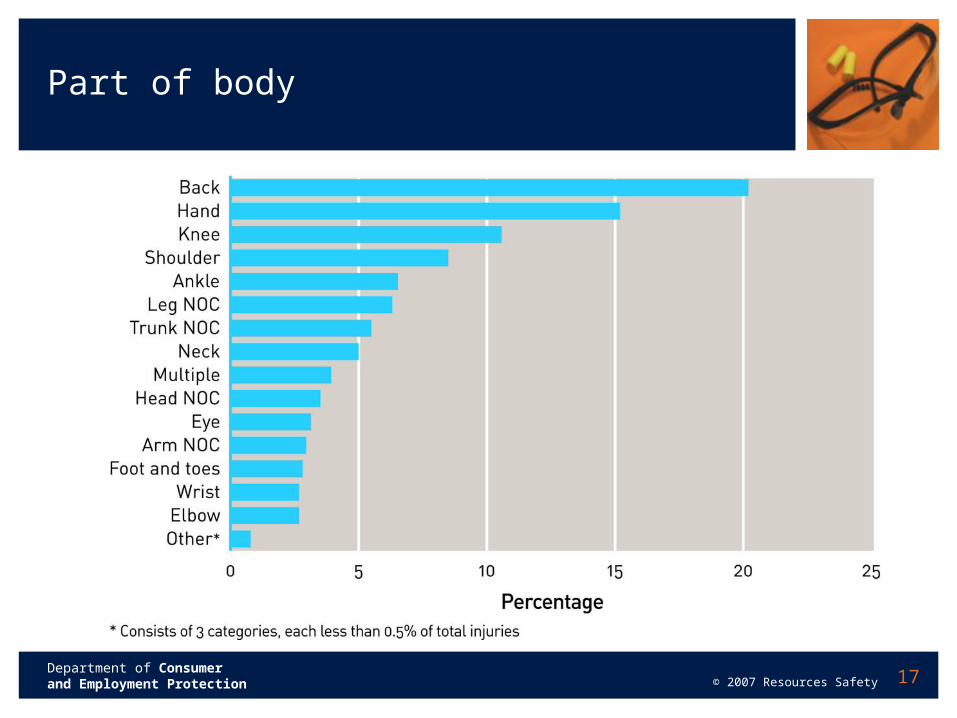
Part of body
18Department of Consumerand Employment Protection © 2007 Resources Safety
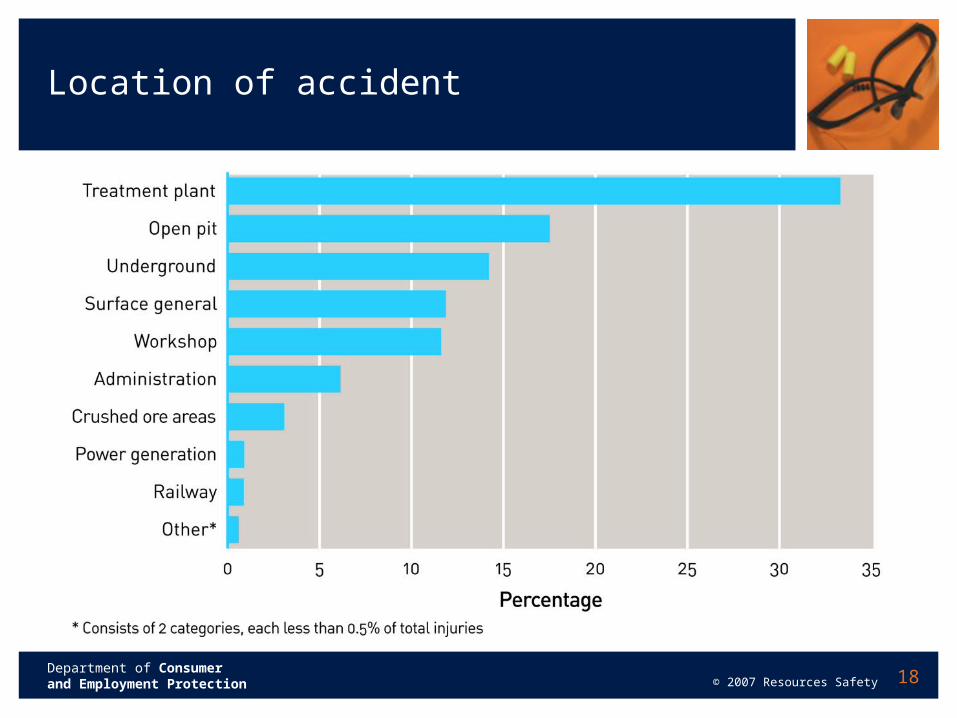
Location of accident
19Department of Consumerand Employment Protection © 2007 Resources Safety
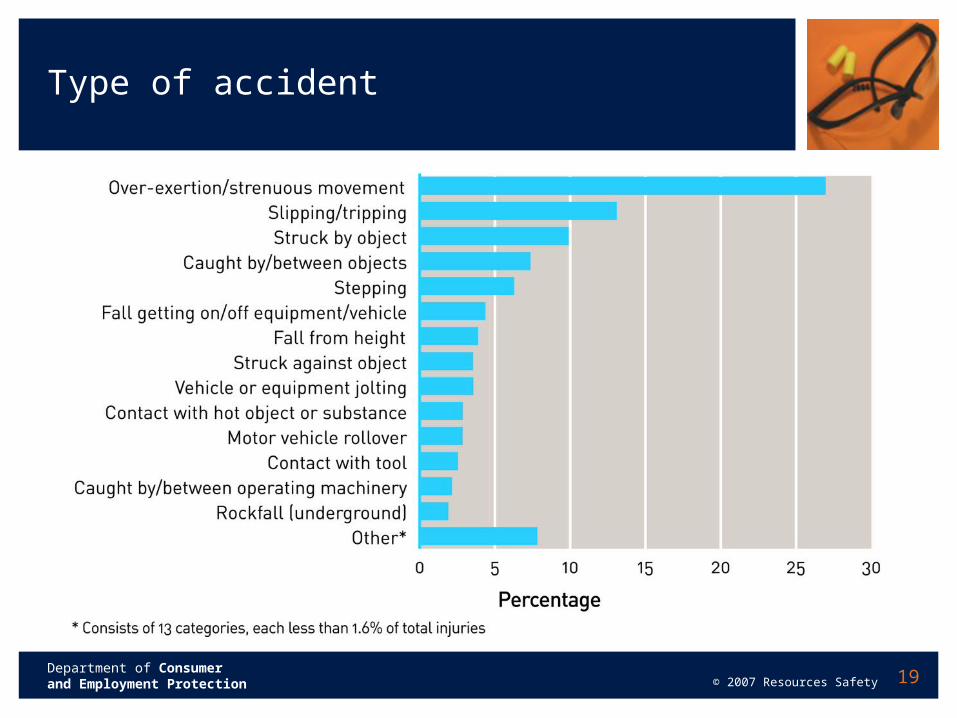
Type of accident
20Department of Consumerand Employment Protection © 2007 Resources Safety
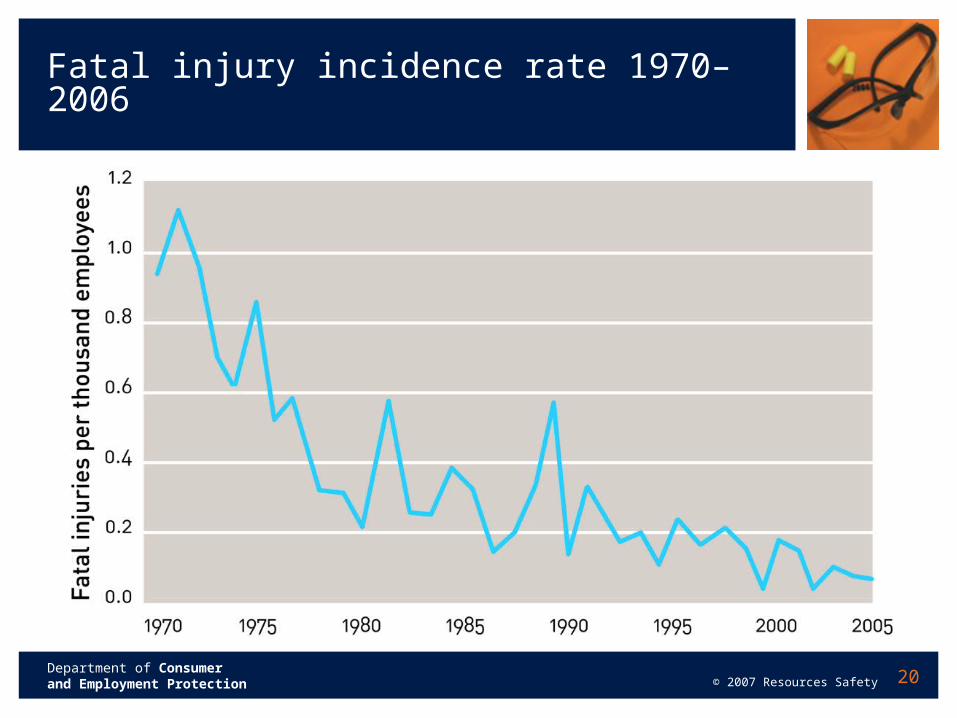
Fatal injury incidence rate 1970–2006
21Department of Consumerand Employment Protection © 2007 Resources Safety
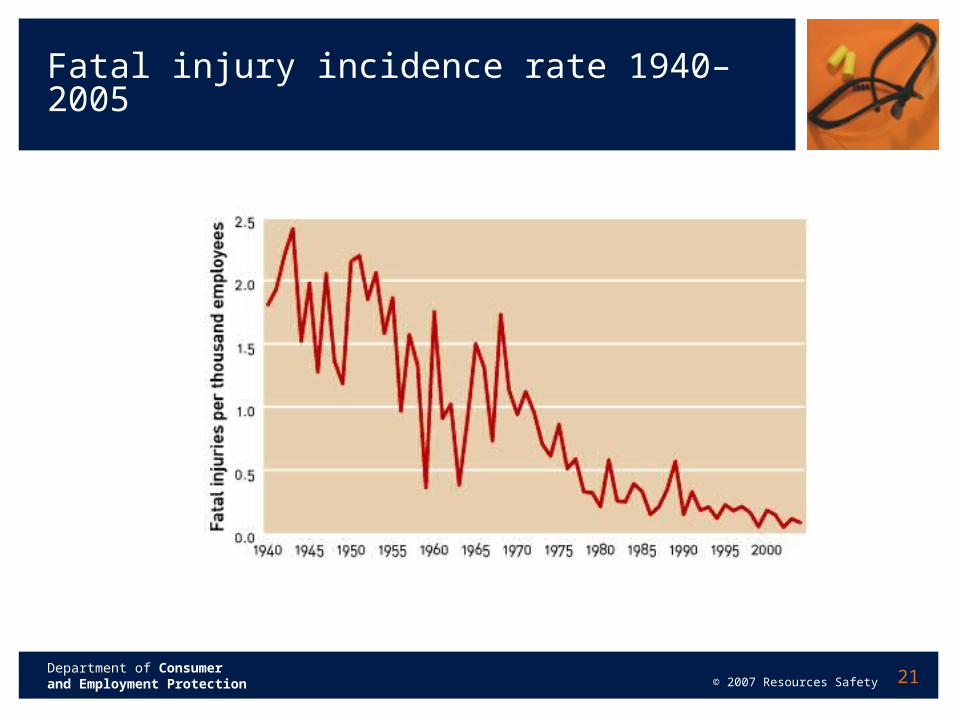
Fatal injury incidence rate 1940–2005
22Department of Consumerand Employment Protection © 2007 Resources Safety
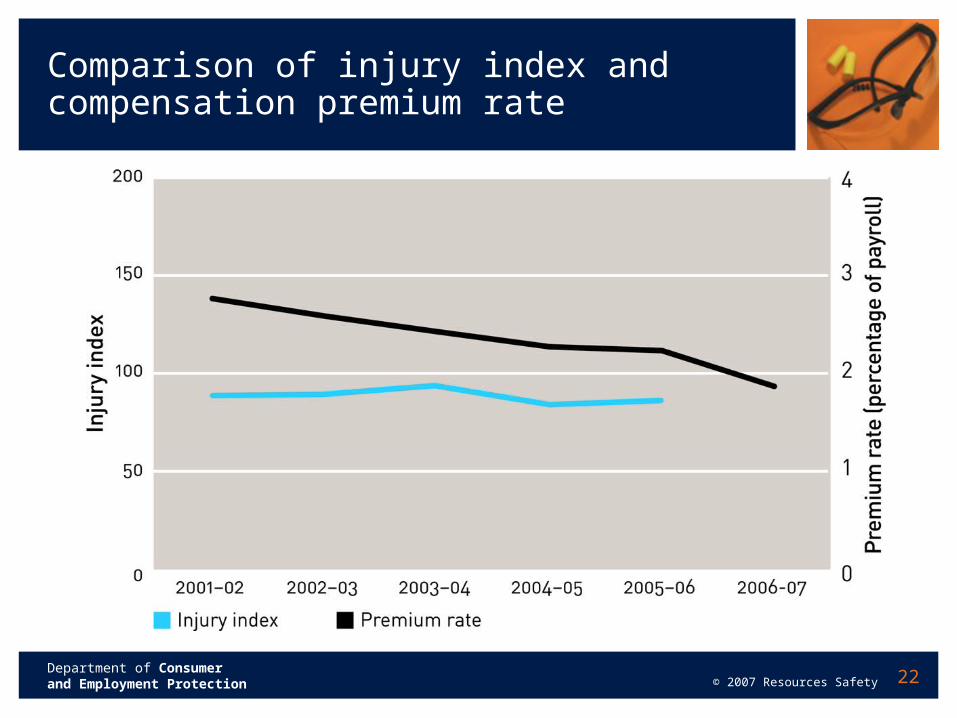
Comparison of injury index andcompensation premium rate
23Department of Consumerand Employment Protection © 2007 Resources Safety
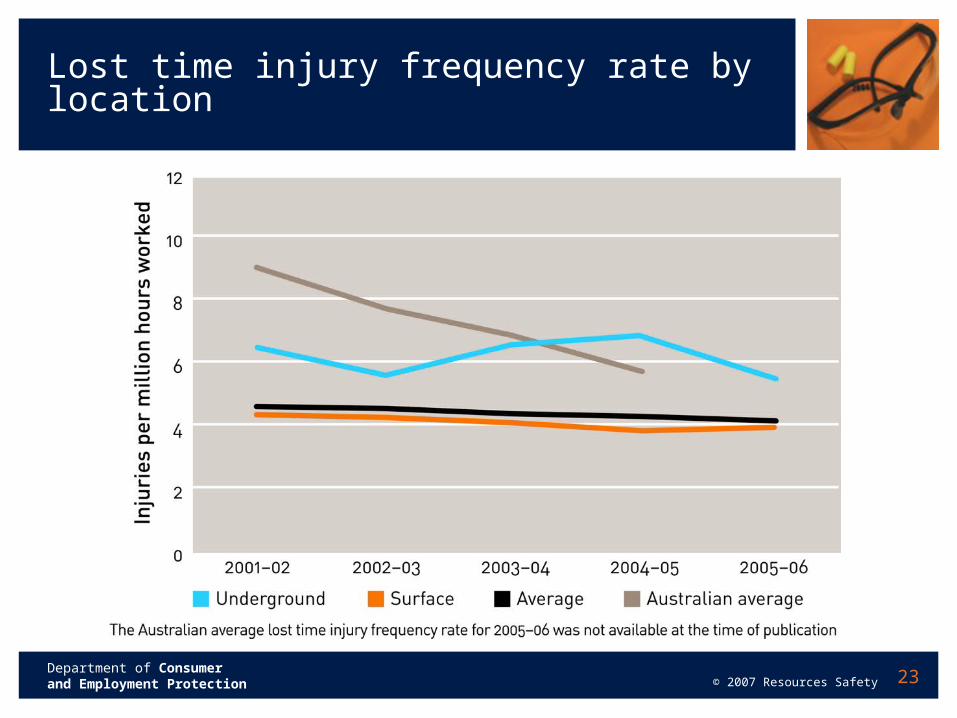
Lost time injury frequency rate by location
24Department of Consumerand Employment Protection © 2007 Resources Safety
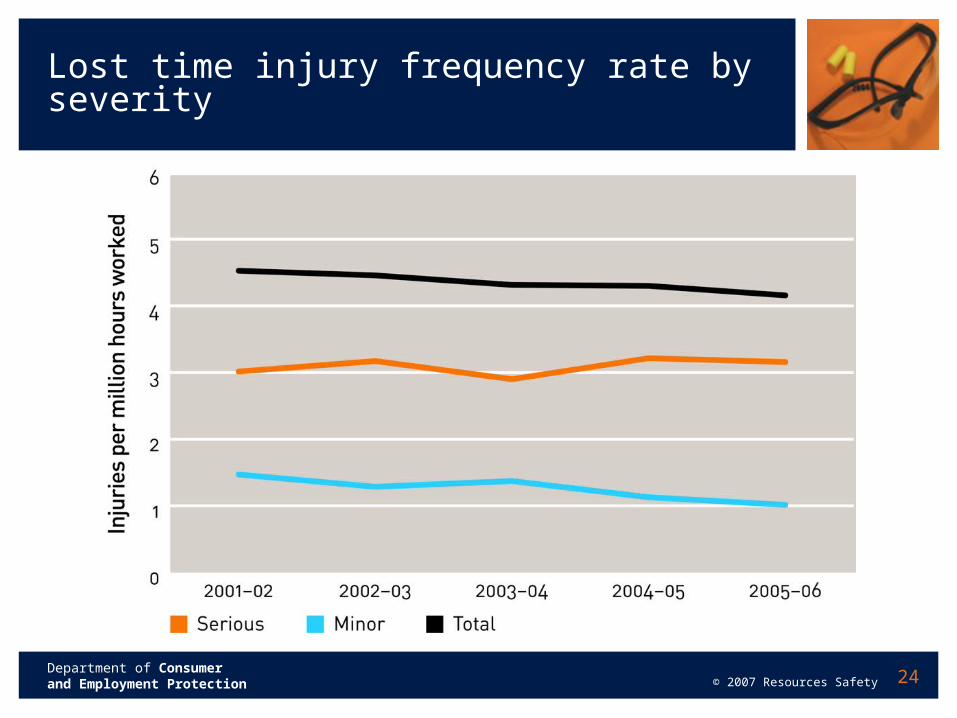
Lost time injury frequency rate by severity
Related Documents