Demonstrating Electric Vehicles in Buffalo CarShare Final Report August 2015 Report Number 15-27 NYSERDA Department of Transportation

Welcome message from author
This document is posted to help you gain knowledge. Please leave a comment to let me know what you think about it! Share it to your friends and learn new things together.
Transcript
Demonstrating Electric Vehicles in Buffalo CarShareFinal Report
August 2015 Report Number 15-27
NYSERDA Department of Transportation
You can slide the agency groupings to the left as neccessary to accomodate a larger name

Cover Image: Energetics, Inc.
Demonstrating Electric Vehicles in Buffalo CarShare
Final Report
Prepared for:
New York State Energy Research and Development Authority
Albany, NY
Joseph D. Tario, PE Senior Project Manager
and
New York State Department of Transportation
Robert Ancar Senior Transportation Analyst
Prepared by:
Buffalo CarShare / Wellness Institute of Greater Buffalo & Western New York
Michael Galligano Executive Director
and
Energetics Incorporated
Bryan Roy Commercial Sector Team Lead – Transportation Technologies
Paul Windover Associate Engineer
NYSERDA Report 15-27 NYSERDA Contract. 30907 August 2015
Notice This report was prepared by Buffalo CarShare / Wellness Institute of Greater Buffalo & Western New
York and Energetics Incorporated in the course of performing work contracted for and sponsored by the
New York State Energy Research and Development Authority (hereafter “NYSERDA”). The opinions
expressed in this report do not necessarily reflect those of NYSERDA or the State of New York, and
reference to any specific product, service, process, or method does not constitute an implied or expressed
recommendation or endorsement of it. Further, NYSERDA, the State of New York, and the contractor
make no warranties or representations, expressed or implied, as to the fitness for particular purpose or
merchantability of any product, apparatus, or service, or the usefulness, completeness, or accuracy of
any processes, methods, or other information contained, described, disclosed, or referred to in this
report. NYSERDA, the State of New York, and the contractor make no representation that the use of any
product, apparatus, process, method, or other information will not infringe privately owned rights and
will assume no liability for any loss, injury, or damage resulting from, or occurring in connection with,
the use of information contained, described, disclosed, or referred to in this report.
NYSERDA makes every effort to provide accurate information about copyright owners and related
matters in the reports we publish. Contractors are responsible for determining and satisfying copyright or
other use restrictions regarding the content of reports that they write, in compliance with NYSERDA’s
policies and federal law. If you are the copyright owner and believe a NYSERDA report has not properly
attributed your work to you or has used it without permission, please email [email protected]
ii
Abstract Buffalo CarShare (BCS) deployed four Ford Focus electric vehicles (EVs) in their fleet to evaluate the
potential performance and suitability of this technology in a carsharing operation. Sponsored by the
New York State Energy Research and Development Authority (NYSERDA), this project tested EVs in a
carsharing environment, gathered a broad range of information on the operational characteristics of EVs
in real-world conditions as used by a multitude of drivers, and increased awareness of EVs throughout
Buffalo. The EVs met the carsharing member needs for many of their trips, especially during warm
weather operations. BCS members were very satisfied with the EVs’ performance and many chose the
EVs afterward because of the superior driving experience. Unfortunately, the EVs did not have a positive
return on investment for the carsharing organization because they were not driven nearly as much (only
used 53% as much as the ICE cars). The EVs’ limited range in cold conditions and need to charge back at
base to be ready for use the next day hurt the economic viability of this concept. However, carsharing
operations are a good opportunity to understand the functionality and durability of vehicle technologies
in real-world conditions for a broad audience of drivers. This project also provided some useful insight
on EV operations in a New York State-based fleet and gave many drivers a chance to drive an EV for the
first time, significantly increasing its awareness and acceptance.
Keywords Electric vehicles, carshare
Acknowledgements The authors gratefully acknowledge sponsorship of this project by NYSERDA under the direction
of Joseph D. Tario and additional support from Robert Ancar at the New York State Department of
Transportation. We also acknowledge the very helpful input and contributions throughout the course
of the project provided by Lisa Krieger and Joseph Fuchs from Buffalo State University, Lynn Brennan
from Baptist Manor, Bill Smith from Buffalo-Niagara Medical Campus, Laura Tadevossian from
National Grid, David Stebbins from Buffalo Urban Development Corporation, Jennifer Dotson from
Ithaca Carshare, and Craig Jackson from Clean Communities of Western New York.
iii
Table of Contents Notice ........................................................................................................................................ ii
Abstract ....................................................................................................................................iii
Keywords ..................................................................................................................................iii
Acknowledgements .................................................................................................................iii
List of Figures .......................................................................................................................... v
Executive Summary ............................................................................................................ ES-1
1 Introduction ....................................................................................................................... 1
1.1 Project Overview ........................................................................................................................... 1 1.2 Electric Vehicle Data Collection Protocol and Evaluation Procedure ........................................... 4
2 Performance Evaluation ................................................................................................... 6
2.1 The Fleet ....................................................................................................................................... 6 2.2 Vehicle Use Analysis ..................................................................................................................... 8 2.3 EV User Evaluation ..................................................................................................................... 15 2.4 Environmental Savings ............................................................................................................... 16
3 Lessons Learned from BCS EV Deployment .................................................................18
3.1 Issues and Resolutions ............................................................................................................... 18 3.1.1 Member Anxiety or Confusion ............................................................................................. 18 3.1.2 EV Car Problems................................................................................................................. 19 3.1.3 EV Charging ........................................................................................................................ 20 3.1.4 Quick Depletion of Battery .................................................................................................. 21 3.1.5 Stranded EVs with Dead Batteries ...................................................................................... 22 3.1.6 Poor Traction in Snowy Conditions ..................................................................................... 22 3.1.7 Lower than Expected Usage ............................................................................................... 23 3.1.8 EV Charger Issues .............................................................................................................. 23
3.2 Survey ......................................................................................................................................... 24
4 Conclusions .....................................................................................................................27
iv
List of Figures Figure 1. Example BCS Ford Focus EV ..................................................................................... 2 Figure 2. Third BCS EV (2014 Ford Focus EV) .......................................................................... 2 Figure 3. Fourth BCS EV (2014 Ford Focus EV) ........................................................................ 3 Figure 4. Non-networked Level 2 Charging Stations Installed for BCS EVs ............................... 3 Figure 5. Map and Schedule for Electric Vehicle Base Locations ............................................... 4 Figure 6. Screenshot from MyFordMobile showing Trip and Charge Log ................................... 5 Figure 7. Sample Datafile from Metavera ................................................................................... 5 Figure 8. BCS Fleet Vehicle Make-up ........................................................................................ 7 Figure 9. Buffalo CarShare Vehicle Utilization Rates ................................................................. 8 Figure 10. EV vs. ICE Reservation and Utilization Levels .......................................................... 9 Figure 11. EV Economics for Similar Utilization Levels .............................................................10 Figure 12. Buffalo CarShare Vehicle Operating Cost ................................................................11 Figure 13. EV Percent of ICE Mileage for Economic Feasibility ................................................12 Figure 14. Buffalo CarShare Vehicle Trip Distance Distribution .................................................13 Figure 15. EV Energy Efficiency vs. Ambient Temperature .......................................................14 Figure 16. Potential and Actual EV Use per Vehicle ..................................................................15 Figure 17. EV Users Total EV Trips ..........................................................................................16 Figure 18. Experienced EV User Localized Preferences ...........................................................16 Figure 19. New York State Electricity Sources ..........................................................................17 Figure 20. Calculated BCS Vehicle Emission Factors ...............................................................17 Figure 21. Notices Placed Inside Each EV ................................................................................19 Figure 22. Average EV Energy Efficiency in the U.S. ................................................................21 Figure 23. Had you driven an EV prior to driving Buffalo CarShare’s EV? .................................24 Figure 24. What Was Your Primary Motivation for Choosing the EV? .......................................24 Figure 25. Preliminary Survey Problem Reports ........................................................................25 Figure 26. Final Survey Problem Reports ..................................................................................25 Figure 27. Would You Choose the EV for Your Next Trip? ........................................................26 Figure 28. Level of Satisfaction from EV Use ............................................................................26 Figure 29. Which Technology Do You Feel Is the Best for the Buffalo CarShare Fleet? ............26
v
Executive Summary To evaluate the potential performance and suitability of electric vehicles (EVs) in a carsharing operation,
the New York State Energy Research and Development Authority (NYSERDA) provided funding to
deploy four Ford Focus EVs in the Buffalo CarShare (BCS) fleet. BCS, which began in 2009, had
over 500 members and 12 internal combustion engine (ICE) vehicles at the launch of the project. This
setting provided an excellent opportunity to test EVs in a carsharing environment, evaluate and enhance
public education of EVs throughout Buffalo, and gather a broad range of information on the operational
characteristics of EVs in real-world conditions as used by a multitude of drivers. EVs were monitored
using Ford telematics software as well as hardware installed for carsharing vehicle security. The project
team used this data acquisition to evaluate the use and performance of the EVs while in the BCS fleet.
The majority of the BCS fleet is comprised of small, economic sedans and hybrid electric vehicles.
Additional vehicle types provide users with more options when needed, including minivans and a
pickup truck. The four project EVs made up approximately 17% of the total fleet. Due public perception,
availability, and range limitations, EVs were only used 53% as much as the ICE cars. It was estimated
that a utilization rate approximately 82% of the ICE vehicles would be needed for the lower operational
costs of the EVs to offset their higher acquisition costs. Although heavier use is necessary for economic
justification, the environmental savings are notable even at lower utilization rates. Due to the clean and
renewable sources of electrical power generation in New York State, EVs have the potential to reduce
on-road emissions by up to 37%.
This project illuminated some existing issues and opportunities for EV use in carsharing operations,
as well as other applications. Public education and driver support were vital to program success because
the majority of drivers were not familiar with EV technology at first. However, through projects such
as this and the expanding EV market, this issue may not be as prominent as when the project started.
Throughout the project, the majority of the issues with the vehicles pertained to driver unfamiliarity
with EV technology or the activation sequence required for the carsharing hardware. Other issues
included confusion with the EV charging activation process and prior users not charging the EVs.
Winter-time driving range significantly decreased compared to summer-time range (due to battery
performance and cabin heating) and traction on ice and snow covered roads was initially sub-par.
Snow tires on two of the EVs (to replace the low rolling resistance tires) solved most traction issues,
but the EVs were still removed from service during snowstorms.
ES-1
Carshare members that had driven EVs responded to surveys at two different times during the project.
One survey was administered near the beginning to capture operator’s initial perspective and a second
near the end to gauge any change in perspective and overall satisfaction. The majority of people taking
the surveys reported never driving an EV before this project. Throughout both surveys, the overall
reaction of the users was extremely positive. They were very satisfied with the EVs’ performance and
many returned to drive the EVs repeatedly because of the superior driving experience.
The project showed that EVs could meet the functionalities required by carsharing members for many of
their trips. During warm weather operations, the EVs’ range was sufficient for most of the trips made by
the carsharing members (including trips taken with a gasoline vehicle). User satisfaction was extremely
high and continuously improved throughout the demonstration due to driver education and increased
awareness. As members better understood the capabilities of the EVs, the vehicles experienced steady
use during the later period of the project. Other benefits noted throughout this pilot project, which are
not as clearly quantifiable, included public awareness, outreach, and increased knowledge of EV
operations in various conditions. The California Air Resources Board became very interested in the
concept of a low-income EV carsharing program and called the project team to learn about this
demonstration. In July 2015, a $1.6 million state grant was awarded for a carsharing program in low-
income Los Angeles neighborhoods that will operate about 100 electric and hybrid vehicles.
The economic analysis for this project showed strong economic potential for EVs, but ultimately
the vehicles lacked sufficient use to realize this potential. Cold conditions and some extremely hot
weather limited the range the EVs, due to heating or cooling requirements, and resulted in insufficient
range for many users’ trips. The EVs were also not available for long, overnight reservations because
charging was required each night back at the base location (having BCS members charge at other
locations or using the portable level 1 unit was not advised due to the challenge of providing support
for that activity and potential safety risks associated with plugging the level 1 unit into an outlet that
was not designed to handle it). Long reservations significantly help the business case for any carsharing
vehicle, so eliminating these for the EVs caused them to not be economically viable for BCS. However,
with the proper support from a vehicle manufacturer or an interested sponsor, carsharing operations are
a good opportunity to understand the functionality and durability of vehicle technologies in real-world
conditions for a broad audience of drivers. This project provided some useful insight on EV operations in
a New York State based fleet. It is also very successful at increasing public awareness and acceptance of
new technologies because many drivers get a chance to drive it for the first time and many others see or
hear about their experience.
ES-2
1 Introduction
1.1 Project Overview
Buffalo CarShare (BCS) began operations in June 2009 with four vehicles and 30 pioneering members.
New York State Energy Research and Development Authority (NYSERDA) and New York State
Department of Transportation (NYSDOT) provided some initial funding, but the organization
quickly grew and became self-sufficient. By September 2012, BCS had grown to over 500 members
and 12 vehicles. Carsharing allows members to reduce their transportation costs while enjoying
increased mobility and many rely on the service to access healthy food, medical care, and employment
opportunities. BCS members reserve vehicles by the hour, which are located throughout Buffalo.
The program offers the peace-of-mind of the automobile without the up-front costs, hassles, or
larger environmental impacts of private vehicle ownership.
Electric vehicles (EVs) are ideal for short trips in city locations, which match well with the
characteristics of many BCS trips. EVs have lower operating costs, so this technology presents an
opportunity to increase the cost effectiveness of the carshare program. With additional funding from
NYSERDA, BCS conducted a demonstration of four EVs at various sites in the City of Buffalo to
determine if the technology is able to serve the needs of the members and be cost effective for their
car share program. A subcontractor, Energetics Incorporated, assisted BCS with the evaluation of the
demonstration activities. Three other key members of the project team are the Buffalo Niagara Medical
Campus (BNMC), Buffalo State University, and Baptist Manor (a senior citizen apartment building on
Linwood Avenue), which agreed to host the EVs for the duration of the project.
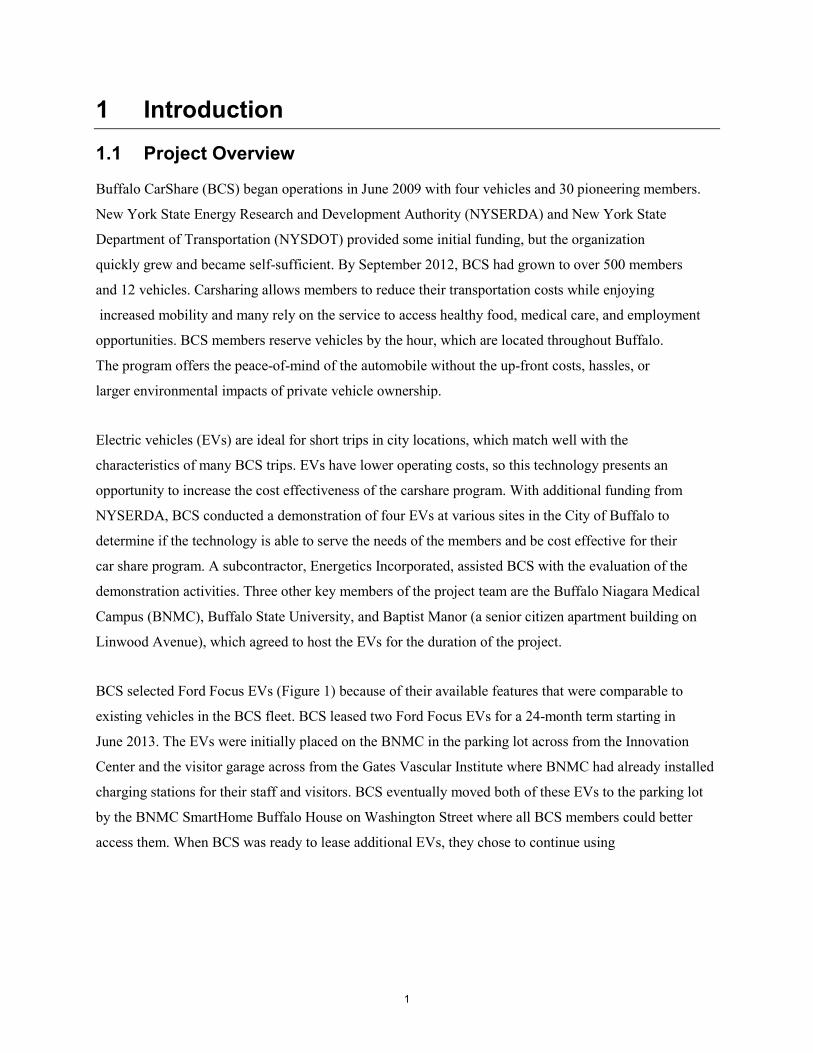
BCS selected Ford Focus EVs (Figure 1) because of their available features that were comparable to
existing vehicles in the BCS fleet. BCS leased two Ford Focus EVs for a 24-month term starting in
June 2013. The EVs were initially placed on the BNMC in the parking lot across from the Innovation
Center and the visitor garage across from the Gates Vascular Institute where BNMC had already installed
charging stations for their staff and visitors. BCS eventually moved both of these EVs to the parking lot
by the BNMC SmartHome Buffalo House on Washington Street where all BCS members could better
access them. When BCS was ready to lease additional EVs, they chose to continue using
1
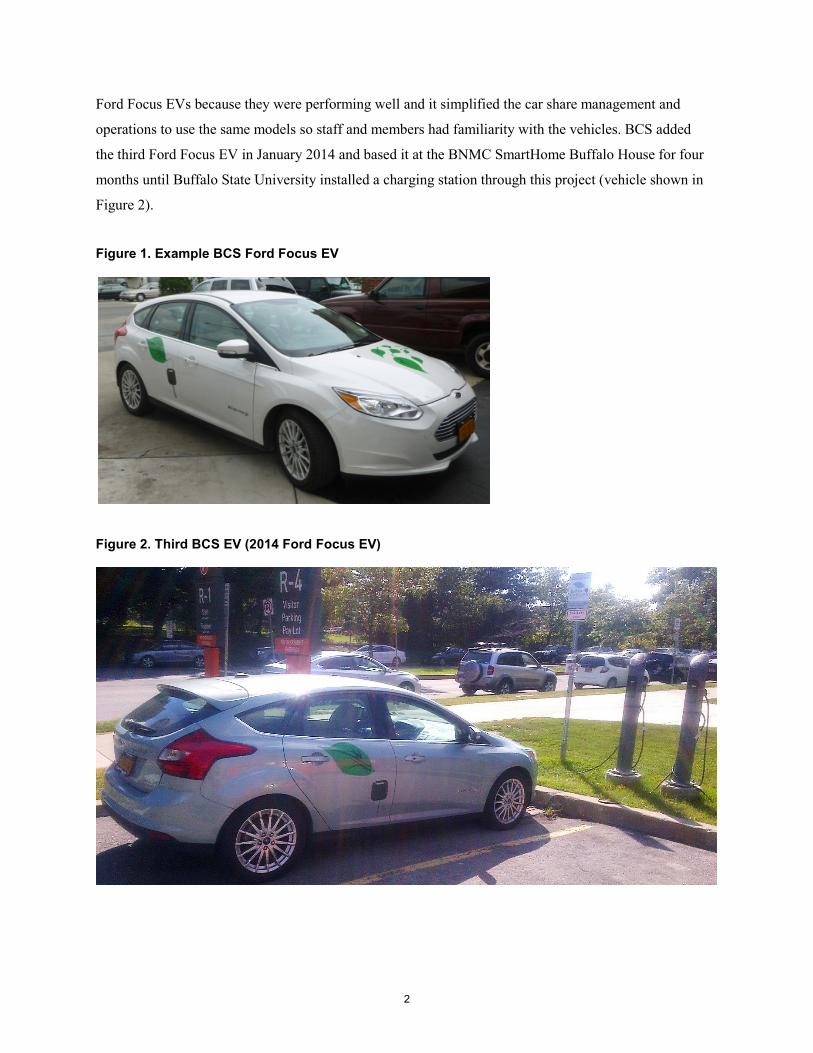
Ford Focus EVs because they were performing well and it simplified the car share management and
operations to use the same models so staff and members had familiarity with the vehicles. BCS added
the third Ford Focus EV in January 2014 and based it at the BNMC SmartHome Buffalo House for four
months until Buffalo State University installed a charging station through this project (vehicle shown in
Figure 2).
Figure 1. Example BCS Ford Focus EV
Figure 2. Third BCS EV (2014 Ford Focus EV)
2
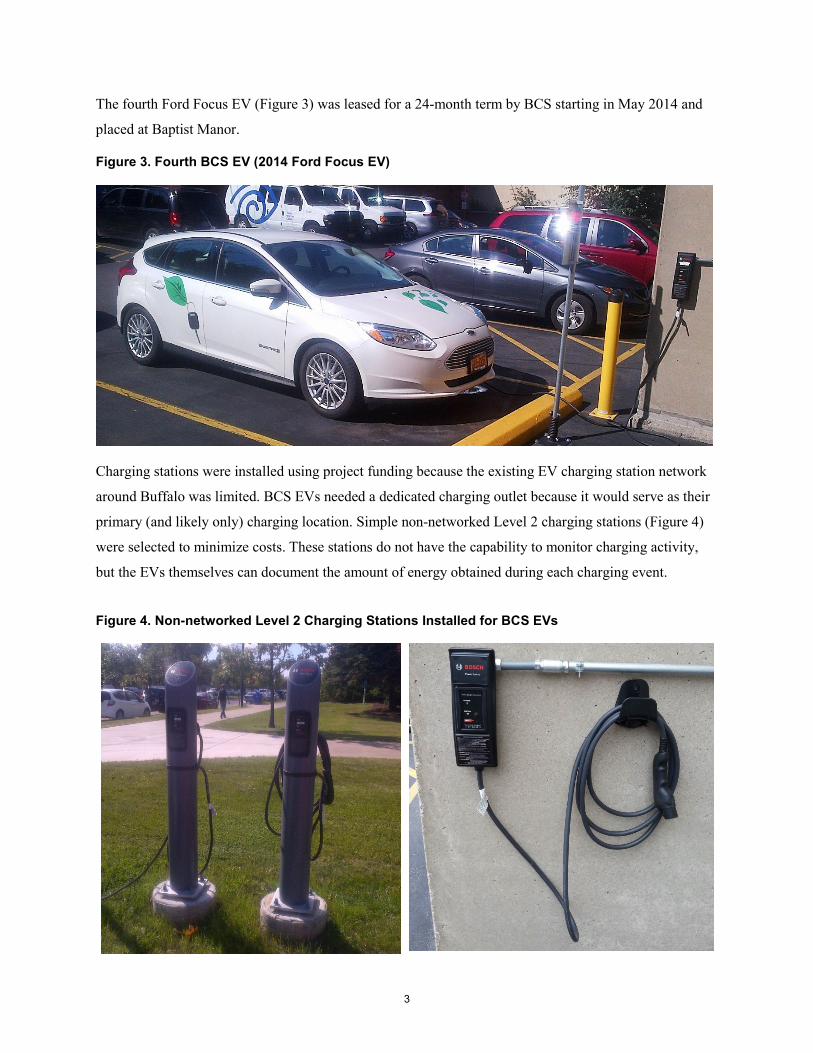
The fourth Ford Focus EV (Figure 3) was leased for a 24-month term by BCS starting in May 2014 and
placed at Baptist Manor.
Figure 3. Fourth BCS EV (2014 Ford Focus EV)
Charging stations were installed using project funding because the existing EV charging station network
around Buffalo was limited. BCS EVs needed a dedicated charging outlet because it would serve as their
primary (and likely only) charging location. Simple non-networked Level 2 charging stations (Figure 4)
were selected to minimize costs. These stations do not have the capability to monitor charging activity,
but the EVs themselves can document the amount of energy obtained during each charging event.
Figure 4. Non-networked Level 2 Charging Stations Installed for BCS EVs
3
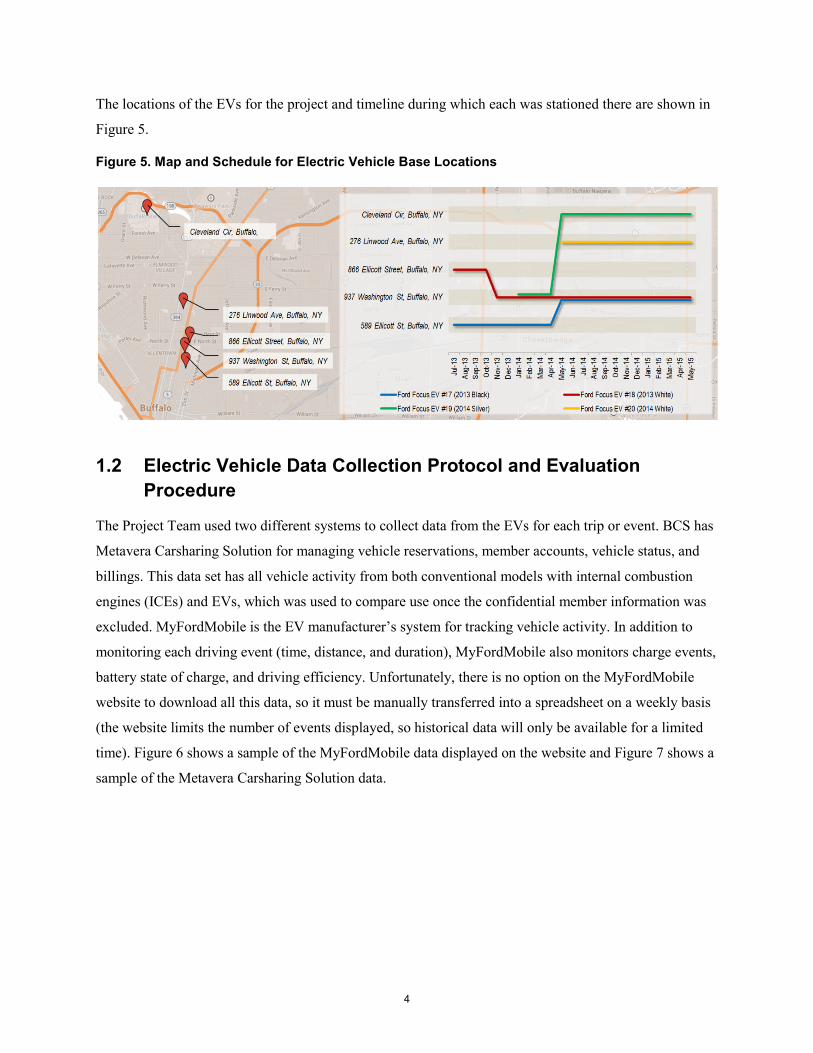
The locations of the EVs for the project and timeline during which each was stationed there are shown in
Figure 5.
Figure 5. Map and Schedule for Electric Vehicle Base Locations
1.2 Electric Vehicle Data Collection Protocol and Evaluation Procedure
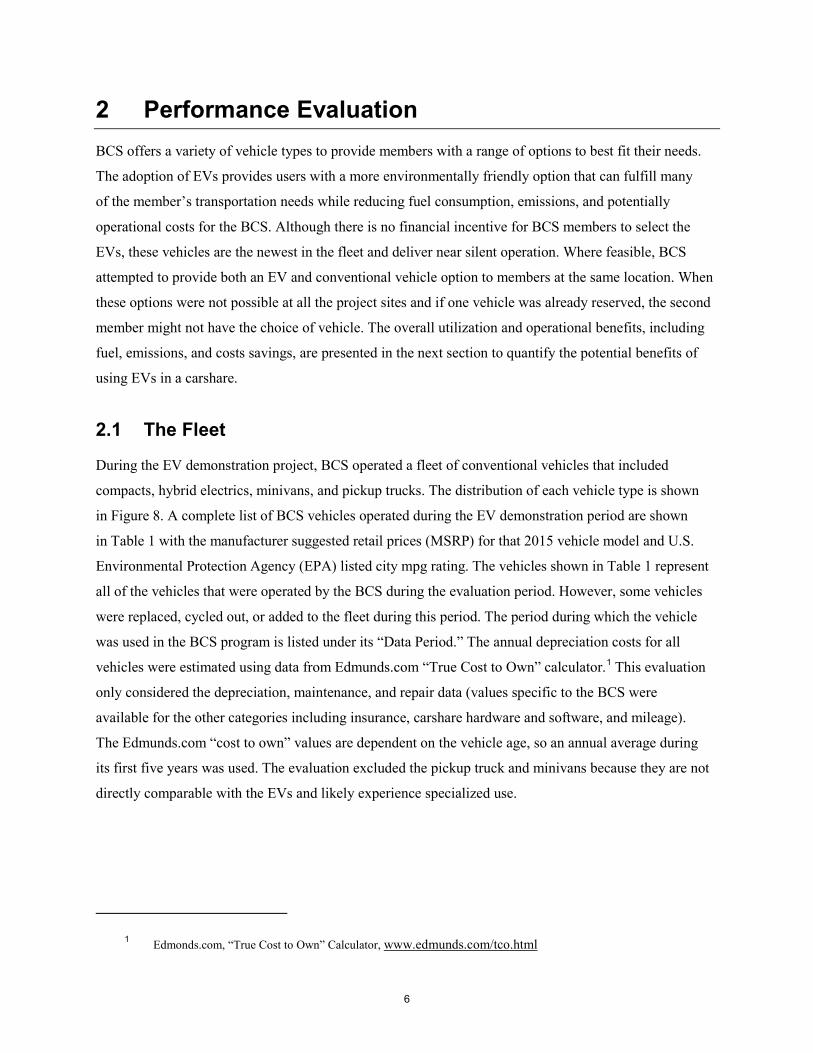
The Project Team used two different systems to collect data from the EVs for each trip or event. BCS has
Metavera Carsharing Solution for managing vehicle reservations, member accounts, vehicle status, and
billings. This data set has all vehicle activity from both conventional models with internal combustion
engines (ICEs) and EVs, which was used to compare use once the confidential member information was
excluded. MyFordMobile is the EV manufacturer’s system for tracking vehicle activity. In addition to
monitoring each driving event (time, distance, and duration), MyFordMobile also monitors charge events,
battery state of charge, and driving efficiency. Unfortunately, there is no option on the MyFordMobile
website to download all this data, so it must be manually transferred into a spreadsheet on a weekly basis
(the website limits the number of events displayed, so historical data will only be available for a limited
time). Figure 6 shows a sample of the MyFordMobile data displayed on the website and Figure 7 shows a
sample of the Metavera Carsharing Solution data.
4
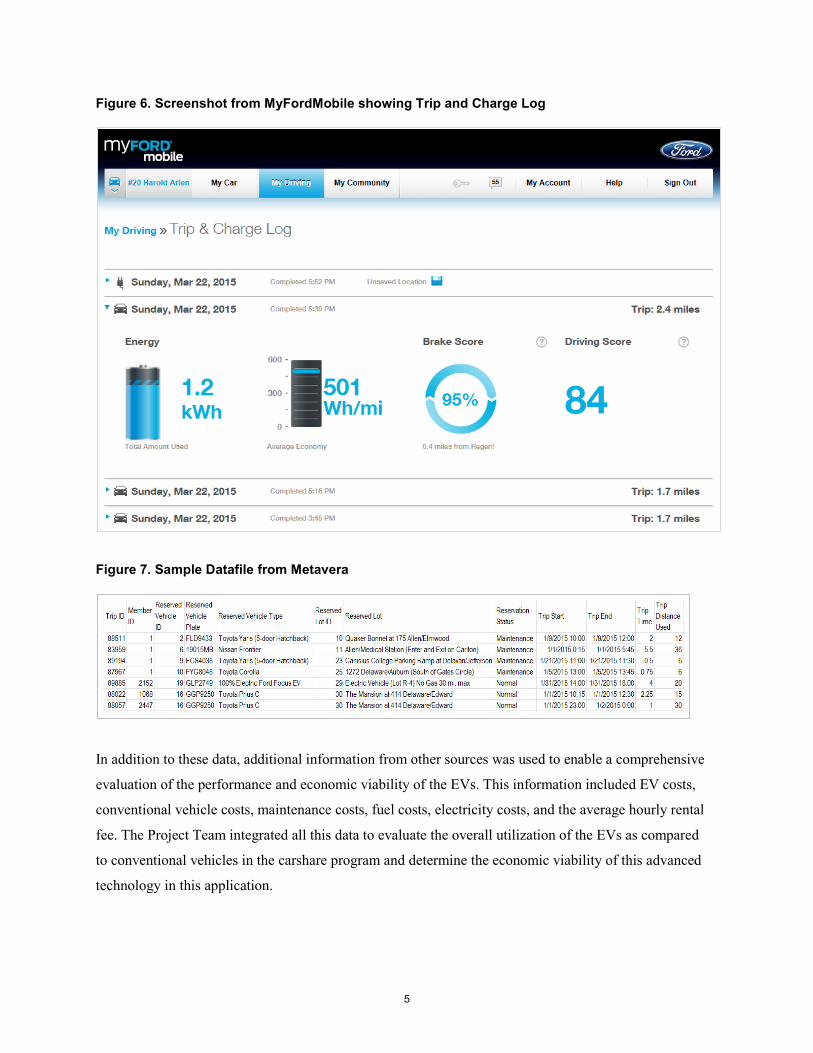
Figure 6. Screenshot from MyFordMobile showing Trip and Charge Log
Figure 7. Sample Datafile from Metavera
In addition to these data, additional information from other sources was used to enable a comprehensive
evaluation of the performance and economic viability of the EVs. This information included EV costs,
conventional vehicle costs, maintenance costs, fuel costs, electricity costs, and the average hourly rental
fee. The Project Team integrated all this data to evaluate the overall utilization of the EVs as compared
to conventional vehicles in the carshare program and determine the economic viability of this advanced
technology in this application.
5
2 Performance Evaluation BCS offers a variety of vehicle types to provide members with a range of options to best fit their needs.
The adoption of EVs provides users with a more environmentally friendly option that can fulfill many
of the member’s transportation needs while reducing fuel consumption, emissions, and potentially
operational costs for the BCS. Although there is no financial incentive for BCS members to select the
EVs, these vehicles are the newest in the fleet and deliver near silent operation. Where feasible, BCS
attempted to provide both an EV and conventional vehicle option to members at the same location. When
these options were not possible at all the project sites and if one vehicle was already reserved, the second
member might not have the choice of vehicle. The overall utilization and operational benefits, including
fuel, emissions, and costs savings, are presented in the next section to quantify the potential benefits of
using EVs in a carshare.
2.1 The Fleet
During the EV demonstration project, BCS operated a fleet of conventional vehicles that included
compacts, hybrid electrics, minivans, and pickup trucks. The distribution of each vehicle type is shown
in Figure 8. A complete list of BCS vehicles operated during the EV demonstration period are shown
in Table 1 with the manufacturer suggested retail prices (MSRP) for that 2015 vehicle model and U.S.
Environmental Protection Agency (EPA) listed city mpg rating. The vehicles shown in Table 1 represent
all of the vehicles that were operated by the BCS during the evaluation period. However, some vehicles
were replaced, cycled out, or added to the fleet during this period. The period during which the vehicle
was used in the BCS program is listed under its “Data Period.” The annual depreciation costs for all
vehicles were estimated using data from Edmunds.com “True Cost to Own” calculator.1 This evaluation
only considered the depreciation, maintenance, and repair data (values specific to the BCS were
available for the other categories including insurance, carshare hardware and software, and mileage).
The Edmunds.com “cost to own” values are dependent on the vehicle age, so an annual average during
its first five years was used. The evaluation excluded the pickup truck and minivans because they are not
directly comparable with the EVs and likely experience specialized use.
1 Edmonds.com, “True Cost to Own” Calculator, www.edmunds.com/tco.html
6
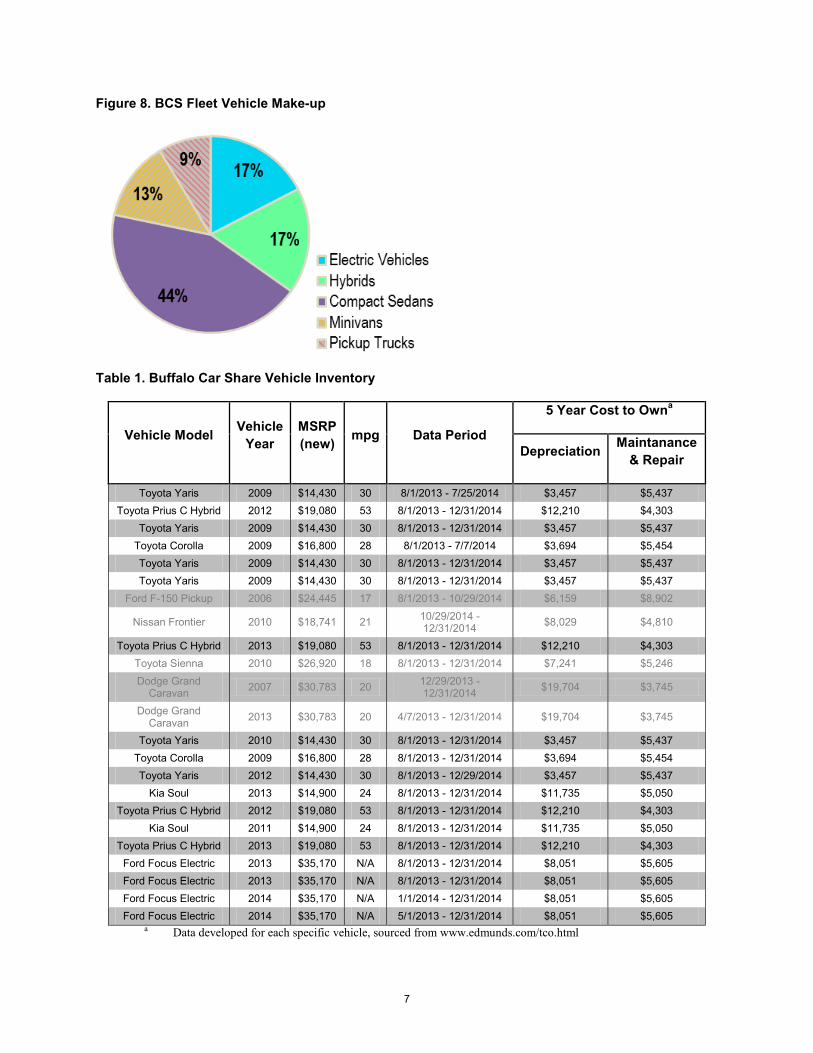
Figure 8. BCS Fleet Vehicle Make-up
Table 1. Buffalo Car Share Vehicle Inventory
Vehicle Model Vehicle Year
MSRP (new) mpg Data Period
5 Year Cost to Owna
Depreciation Maintanance & Repair
Toyota Yaris 2009 $14,430 30 8/1/2013 - 7/25/2014 $3,457 $5,437 Toyota Prius C Hybrid 2012 $19,080 53 8/1/2013 - 12/31/2014 $12,210 $4,303
Toyota Yaris 2009 $14,430 30 8/1/2013 - 12/31/2014 $3,457 $5,437 Toyota Corolla 2009 $16,800 28 8/1/2013 - 7/7/2014 $3,694 $5,454 Toyota Yaris 2009 $14,430 30 8/1/2013 - 12/31/2014 $3,457 $5,437 Toyota Yaris 2009 $14,430 30 8/1/2013 - 12/31/2014 $3,457 $5,437
Ford F-150 Pickup 2006 $24,445 17 8/1/2013 - 10/29/2014 $6,159 $8,902
Nissan Frontier 2010 $18,741 21 10/29/2014 - 12/31/2014 $8,029 $4,810
Toyota Prius C Hybrid 2013 $19,080 53 8/1/2013 - 12/31/2014 $12,210 $4,303 Toyota Sienna 2010 $26,920 18 8/1/2013 - 12/31/2014 $7,241 $5,246 Dodge Grand
Caravan 2007 $30,783 20 12/29/2013 - 12/31/2014 $19,704 $3,745
Dodge Grand Caravan 2013 $30,783 20 4/7/2013 - 12/31/2014 $19,704 $3,745
Toyota Yaris 2010 $14,430 30 8/1/2013 - 12/31/2014 $3,457 $5,437 Toyota Corolla 2009 $16,800 28 8/1/2013 - 12/31/2014 $3,694 $5,454 Toyota Yaris 2012 $14,430 30 8/1/2013 - 12/29/2014 $3,457 $5,437
Kia Soul 2013 $14,900 24 8/1/2013 - 12/31/2014 $11,735 $5,050 Toyota Prius C Hybrid 2012 $19,080 53 8/1/2013 - 12/31/2014 $12,210 $4,303
Kia Soul 2011 $14,900 24 8/1/2013 - 12/31/2014 $11,735 $5,050 Toyota Prius C Hybrid 2013 $19,080 53 8/1/2013 - 12/31/2014 $12,210 $4,303
Ford Focus Electric 2013 $35,170 N/A 8/1/2013 - 12/31/2014 $8,051 $5,605 Ford Focus Electric 2013 $35,170 N/A 8/1/2013 - 12/31/2014 $8,051 $5,605 Ford Focus Electric 2014 $35,170 N/A 1/1/2014 - 12/31/2014 $8,051 $5,605 Ford Focus Electric 2014 $35,170 N/A 5/1/2013 - 12/31/2014 $8,051 $5,605
a Data developed for each specific vehicle, sourced from www.edmunds.com/tco.html
7
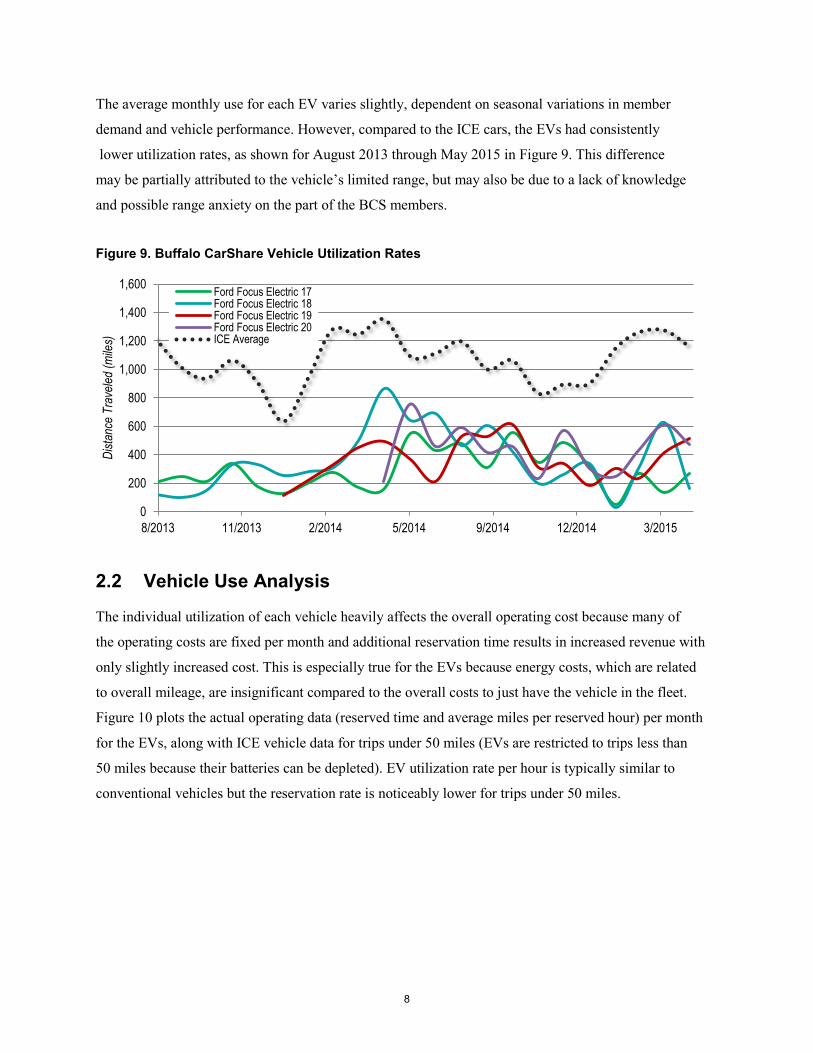
The average monthly use for each EV varies slightly, dependent on seasonal variations in member
demand and vehicle performance. However, compared to the ICE cars, the EVs had consistently
lower utilization rates, as shown for August 2013 through May 2015 in Figure 9. This difference
may be partially attributed to the vehicle’s limited range, but may also be due to a lack of knowledge
and possible range anxiety on the part of the BCS members.
Figure 9. Buffalo CarShare Vehicle Utilization Rates
2.2 Vehicle Use Analysis
The individual utilization of each vehicle heavily affects the overall operating cost because many of
the operating costs are fixed per month and additional reservation time results in increased revenue with
only slightly increased cost. This is especially true for the EVs because energy costs, which are related
to overall mileage, are insignificant compared to the overall costs to just have the vehicle in the fleet.
Figure 10 plots the actual operating data (reserved time and average miles per reserved hour) per month
for the EVs, along with ICE vehicle data for trips under 50 miles (EVs are restricted to trips less than
50 miles because their batteries can be depleted). EV utilization rate per hour is typically similar to
conventional vehicles but the reservation rate is noticeably lower for trips under 50 miles.
0
200
400
600
800
1,000
1,200
1,400
1,600
8/2013 11/2013 2/2014 5/2014 9/2014 12/2014 3/2015
Dista
nce
Trav
eled
(mile
s)
Ford Focus Electric 17 Ford Focus Electric 18 Ford Focus Electric 19 Ford Focus Electric 20 ICE Average
8
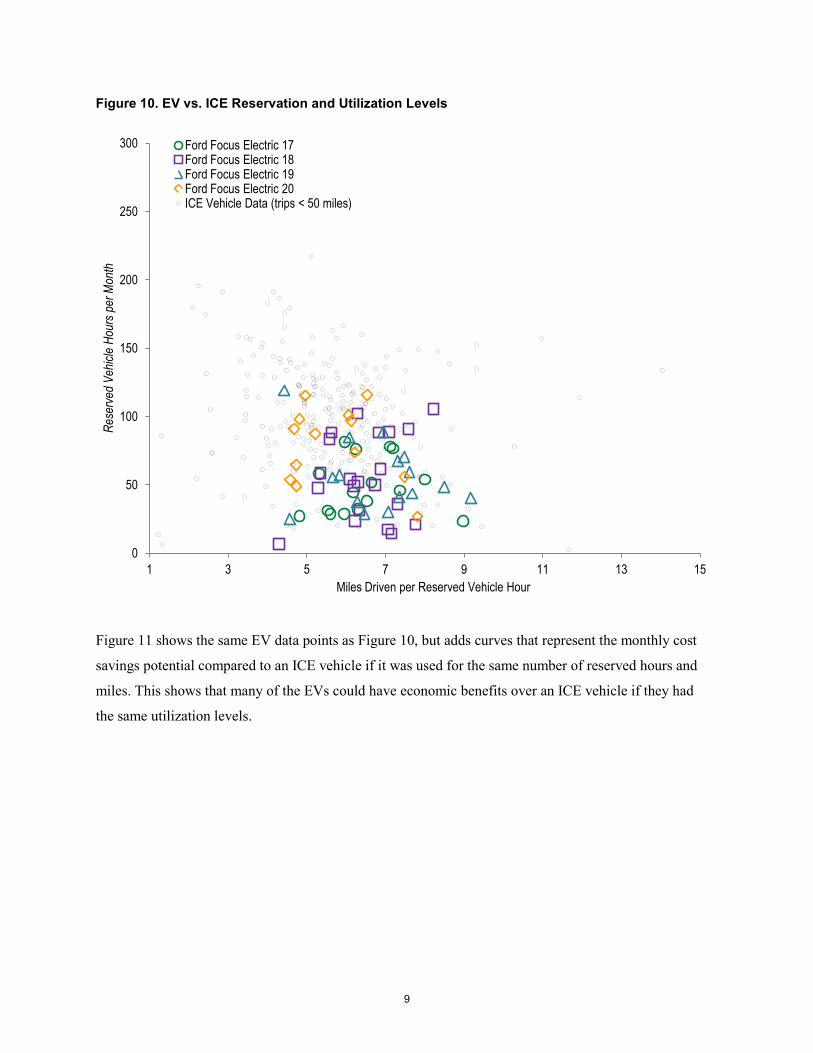
Figure 10. EV vs. ICE Reservation and Utilization Levels
Figure 11 shows the same EV data points as Figure 10, but adds curves that represent the monthly cost
savings potential compared to an ICE vehicle if it was used for the same number of reserved hours and
miles. This shows that many of the EVs could have economic benefits over an ICE vehicle if they had
the same utilization levels.
0
50
100
150
200
250
300
1 3 5 7 9 11 13 15
Rese
rved
Veh
icle
Hour
s per
Mon
th
Miles Driven per Reserved Vehicle Hour
Ford Focus Electric 17 Ford Focus Electric 18 Ford Focus Electric 19 Ford Focus Electric 20 ICE Vehicle Data (trips < 50 miles)
9
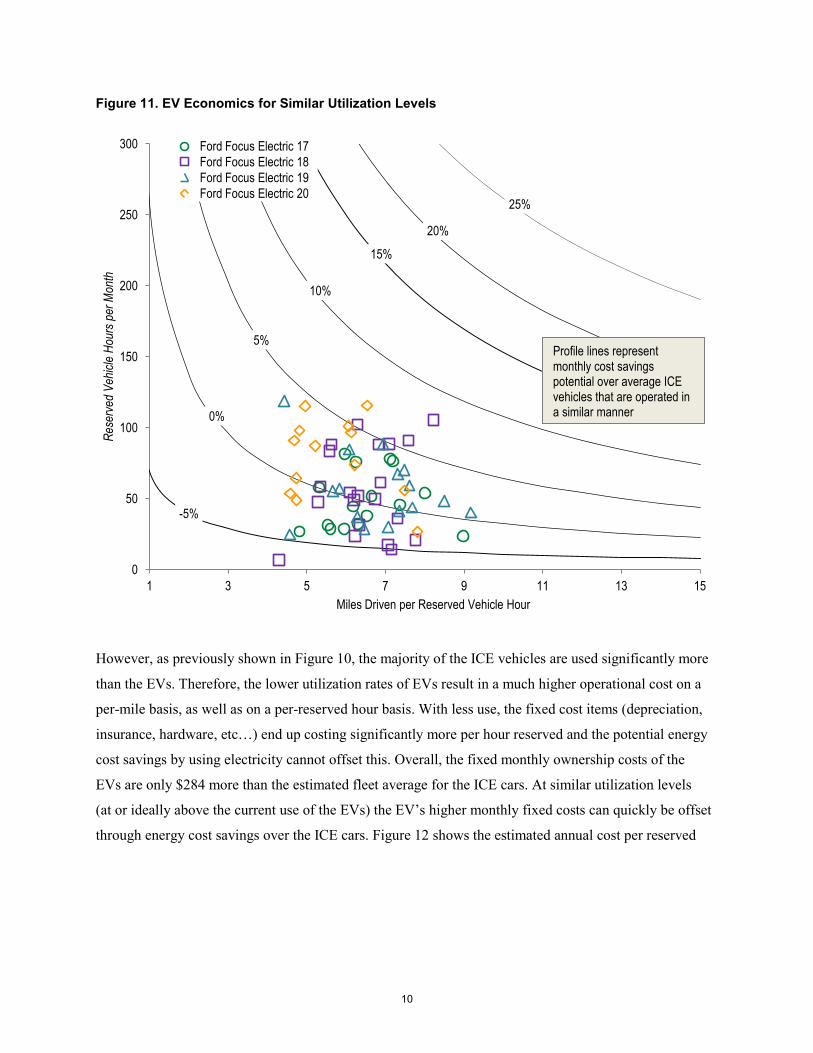
Figure 11. EV Economics for Similar Utilization Levels
However, as previously shown in Figure 10, the majority of the ICE vehicles are used significantly more
than the EVs. Therefore, the lower utilization rates of EVs result in a much higher operational cost on a
per-mile basis, as well as on a per-reserved hour basis. With less use, the fixed cost items (depreciation,
insurance, hardware, etc…) end up costing significantly more per hour reserved and the potential energy
cost savings by using electricity cannot offset this. Overall, the fixed monthly ownership costs of the
EVs are only $284 more than the estimated fleet average for the ICE cars. At similar utilization levels
(at or ideally above the current use of the EVs) the EV’s higher monthly fixed costs can quickly be offset
through energy cost savings over the ICE cars. Figure 12 shows the estimated annual cost per reserved
-5%
0%
5%
10%
15%
20%
25%
0
50
100
150
200
250
300
1 3 5 7 9 11 13 15
Rese
rved
Veh
icle
Hour
s per
Mon
th
Miles Driven per Reserved Vehicle Hour
Ford Focus Electric 17 Ford Focus Electric 18 Ford Focus Electric 19 Ford Focus Electric 20
Profile lines represent monthly cost savings potential over average ICE vehicles that are operated in a similar manner
10
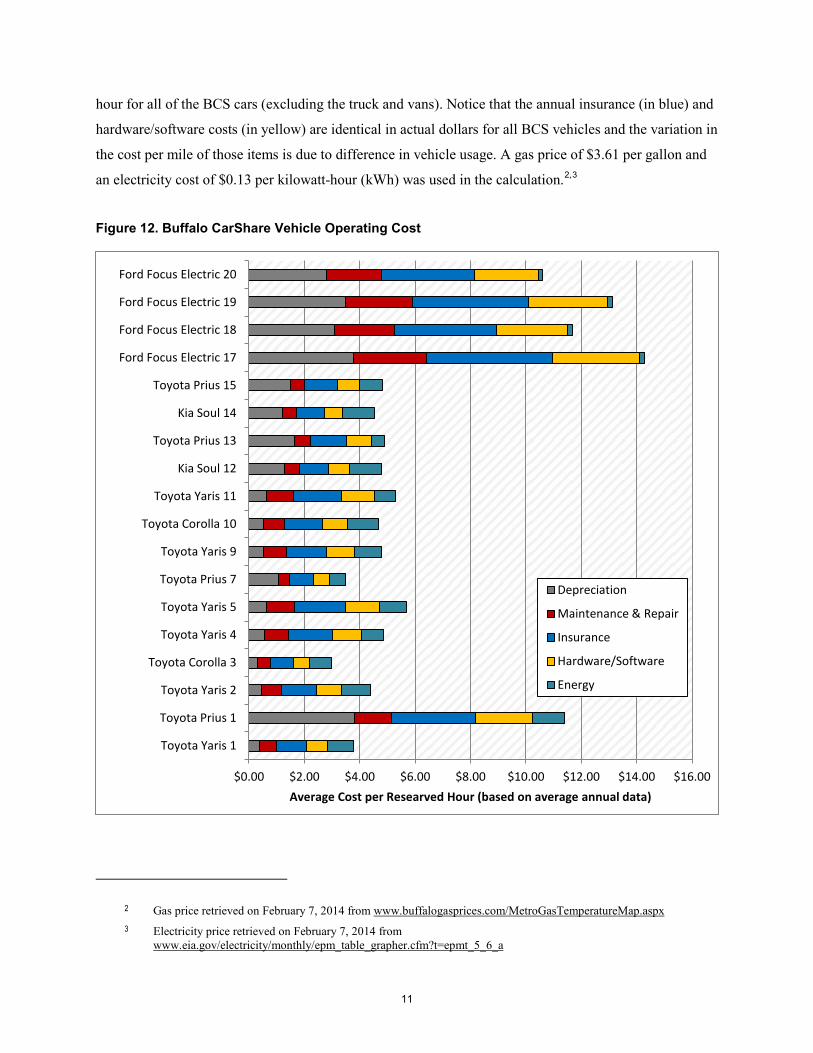
hour for all of the BCS cars (excluding the truck and vans). Notice that the annual insurance (in blue) and
hardware/software costs (in yellow) are identical in actual dollars for all BCS vehicles and the variation in
the cost per mile of those items is due to difference in vehicle usage. A gas price of $3.61 per gallon and
an electricity cost of $0.13 per kilowatt-hour (kWh) was used in the calculation.2,3
Figure 12. Buffalo CarShare Vehicle Operating Cost
2 Gas price retrieved on February 7, 2014 from www.buffalogasprices.com/MetroGasTemperatureMap.aspx 3 Electricity price retrieved on February 7, 2014 from
www.eia.gov/electricity/monthly/epm_table_grapher.cfm?t=epmt_5_6_a
$0.00 $2.00 $4.00 $6.00 $8.00 $10.00 $12.00 $14.00 $16.00
Toyota Yaris 1
Toyota Prius 1
Toyota Yaris 2
Toyota Corolla 3
Toyota Yaris 4
Toyota Yaris 5
Toyota Prius 7
Toyota Yaris 9
Toyota Corolla 10
Toyota Yaris 11
Kia Soul 12
Toyota Prius 13
Kia Soul 14
Toyota Prius 15
Ford Focus Electric 17
Ford Focus Electric 18
Ford Focus Electric 19
Ford Focus Electric 20
Average Cost per Researved Hour (based on average annual data)
Depreciation
Maintenance & Repair
Insurance
Hardware/Software
Energy
11
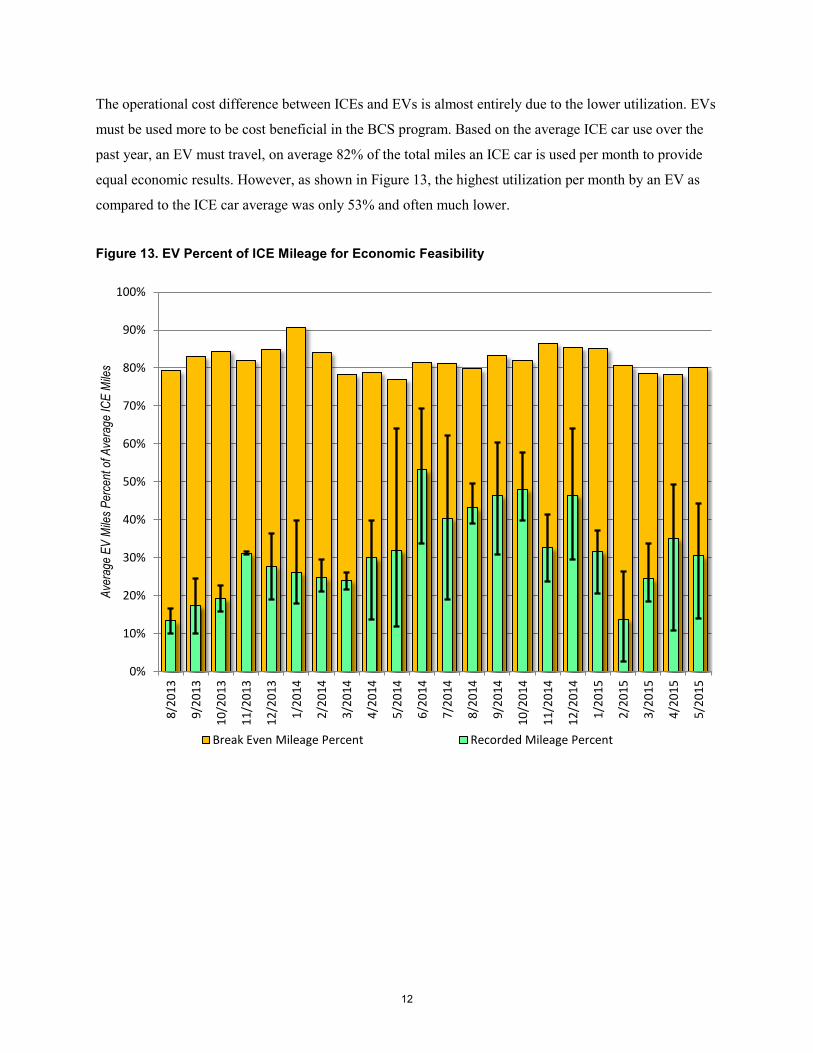
The operational cost difference between ICEs and EVs is almost entirely due to the lower utilization. EVs
must be used more to be cost beneficial in the BCS program. Based on the average ICE car use over the
past year, an EV must travel, on average 82% of the total miles an ICE car is used per month to provide
equal economic results. However, as shown in Figure 13, the highest utilization per month by an EV as
compared to the ICE car average was only 53% and often much lower.
Figure 13. EV Percent of ICE Mileage for Economic Feasibility
0%
10%
20%
30%
40%
50%
60%
70%
80%
90%
100%
8/20
13
9/20
13
10/2
013
11/2
013
12/2
013
1/20
14
2/20
14
3/20
14
4/20
14
5/20
14
6/20
14
7/20
14
8/20
14
9/20
14
10/2
014
11/2
014
12/2
014
1/20
15
2/20
15
3/20
15
4/20
15
5/20
15
Aver
age E
V M
iles P
erce
nt o
f Ave
rage
ICE
Mile
s
Break Even Mileage Percent Recorded Mileage Percent
12
In addition to the fuel and cost savings, the use of EVs in the BCS fleet also provides emission
savings when compared to the ICE cars. Based on emission factors for gasoline and electricity, the
EVs are capable of offsetting approximately 40.5 pounds of carbon dioxide every 100 miles they
are driven instead of an ICE car.4,5 From August 2013 to May 2015, the four EVs have been driven
26,200 cumulative miles, offsetting over 10,600 pounds of carbon dioxide.
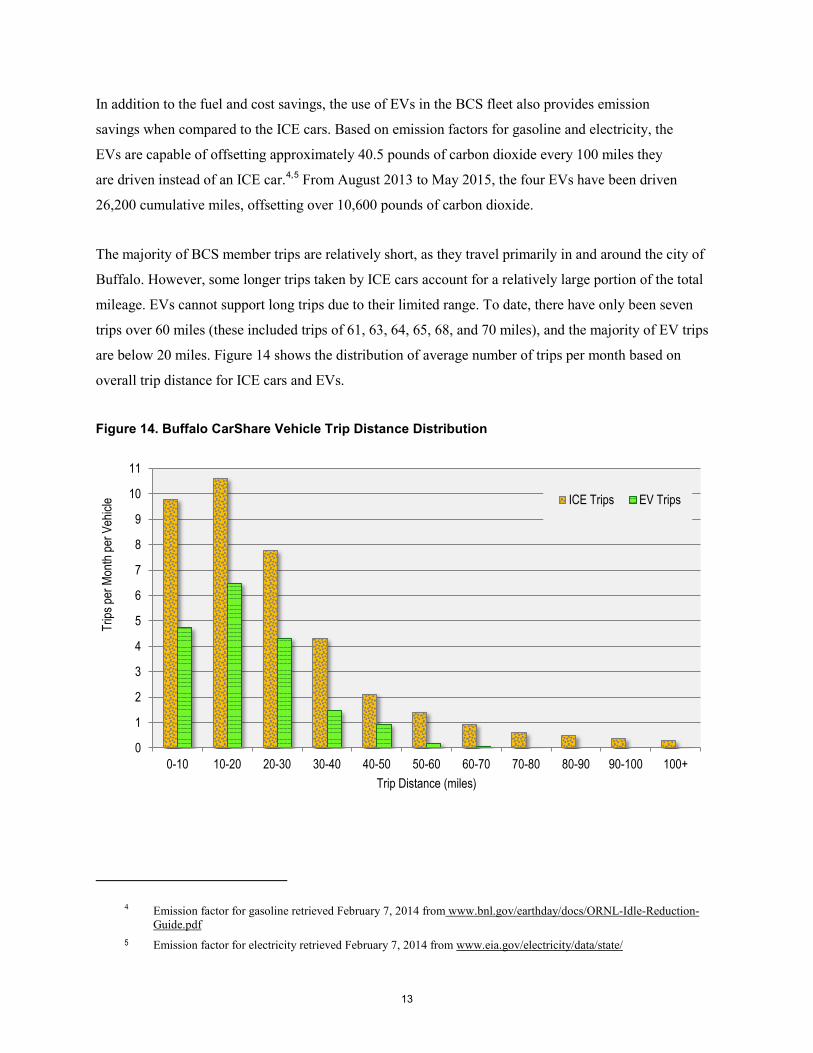
The majority of BCS member trips are relatively short, as they travel primarily in and around the city of
Buffalo. However, some longer trips taken by ICE cars account for a relatively large portion of the total
mileage. EVs cannot support long trips due to their limited range. To date, there have only been seven
trips over 60 miles (these included trips of 61, 63, 64, 65, 68, and 70 miles), and the majority of EV trips
are below 20 miles. Figure 14 shows the distribution of average number of trips per month based on
overall trip distance for ICE cars and EVs.
Figure 14. Buffalo CarShare Vehicle Trip Distance Distribution
4 Emission factor for gasoline retrieved February 7, 2014 from www.bnl.gov/earthday/docs/ORNL-Idle-Reduction-Guide.pdf
5 Emission factor for electricity retrieved February 7, 2014 from www.eia.gov/electricity/data/state/
0
1
2
3
4
5
6
7
8
9
10
11
0-10 10-20 20-30 30-40 40-50 50-60 60-70 70-80 80-90 90-100 100+
Trips
per M
onth
per V
ehicl
e
Trip Distance (miles)
ICE Trips EV Trips
13
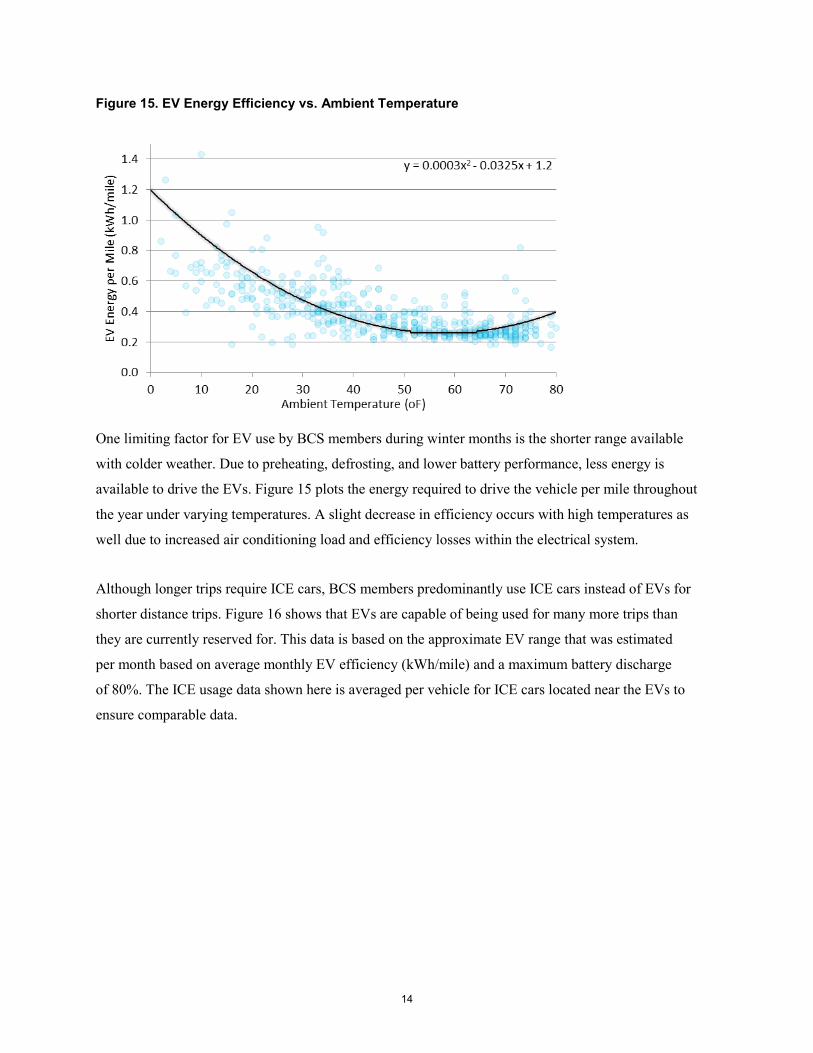
Figure 15. EV Energy Efficiency vs. Ambient Temperature
One limiting factor for EV use by BCS members during winter months is the shorter range available
with colder weather. Due to preheating, defrosting, and lower battery performance, less energy is
available to drive the EVs. Figure 15 plots the energy required to drive the vehicle per mile throughout
the year under varying temperatures. A slight decrease in efficiency occurs with high temperatures as
well due to increased air conditioning load and efficiency losses within the electrical system.
Although longer trips require ICE cars, BCS members predominantly use ICE cars instead of EVs for
shorter distance trips. Figure 16 shows that EVs are capable of being used for many more trips than
they are currently reserved for. This data is based on the approximate EV range that was estimated
per month based on average monthly EV efficiency (kWh/mile) and a maximum battery discharge
of 80%. The ICE usage data shown here is averaged per vehicle for ICE cars located near the EVs to
ensure comparable data.
14
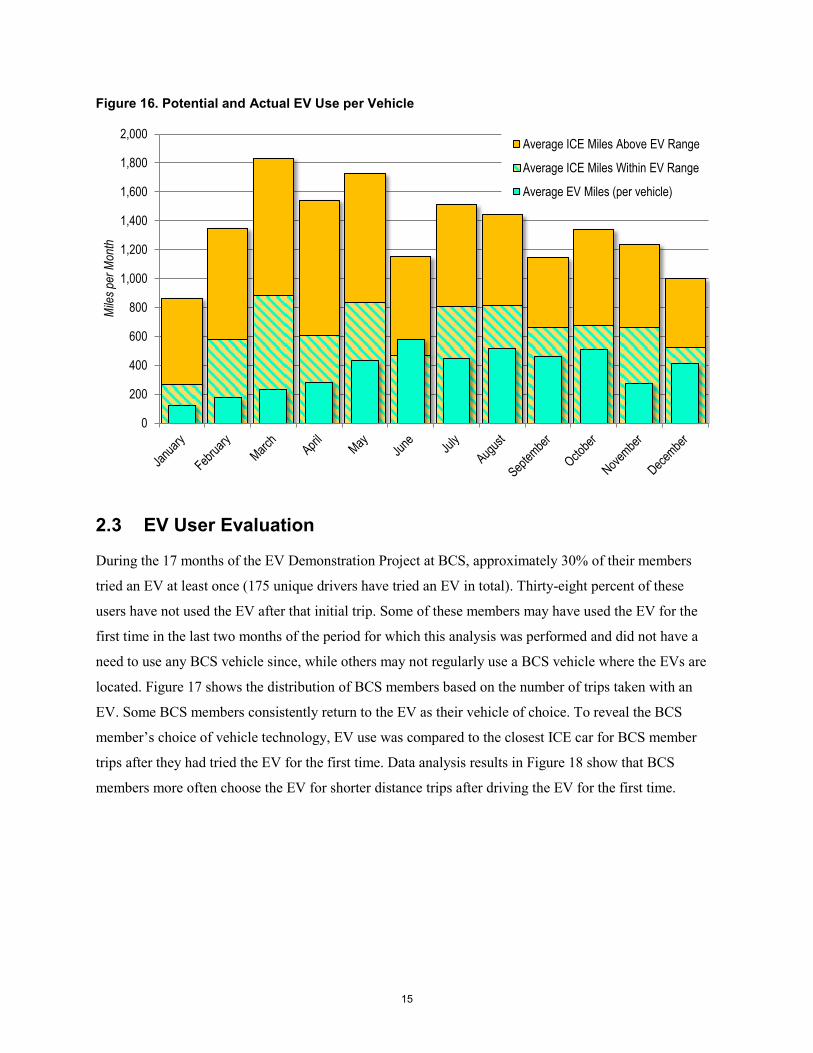
Figure 16. Potential and Actual EV Use per Vehicle
2.3 EV User Evaluation
During the 17 months of the EV Demonstration Project at BCS, approximately 30% of their members
tried an EV at least once (175 unique drivers have tried an EV in total). Thirty-eight percent of these
users have not used the EV after that initial trip. Some of these members may have used the EV for the
first time in the last two months of the period for which this analysis was performed and did not have a
need to use any BCS vehicle since, while others may not regularly use a BCS vehicle where the EVs are
located. Figure 17 shows the distribution of BCS members based on the number of trips taken with an
EV. Some BCS members consistently return to the EV as their vehicle of choice. To reveal the BCS
member’s choice of vehicle technology, EV use was compared to the closest ICE car for BCS member
trips after they had tried the EV for the first time. Data analysis results in Figure 18 show that BCS
members more often choose the EV for shorter distance trips after driving the EV for the first time.
0
200
400
600
800
1,000
1,200
1,400
1,600
1,800
2,000
Mile
s per
Mon
th
Average ICE Miles Above EV Range
Average ICE Miles Within EV Range
Average EV Miles (per vehicle)
15
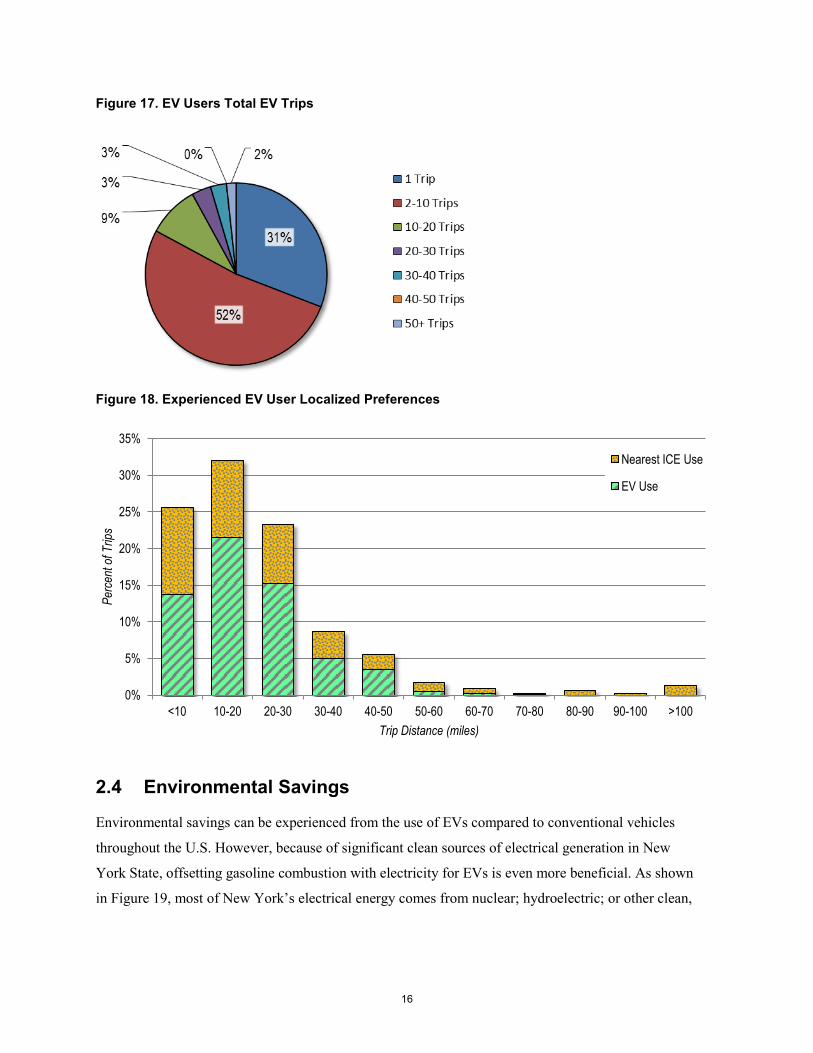
Figure 17. EV Users Total EV Trips
Figure 18. Experienced EV User Localized Preferences
2.4 Environmental Savings
Environmental savings can be experienced from the use of EVs compared to conventional vehicles
throughout the U.S. However, because of significant clean sources of electrical generation in New
York State, offsetting gasoline combustion with electricity for EVs is even more beneficial. As shown
in Figure 19, most of New York’s electrical energy comes from nuclear; hydroelectric; or other clean,
0%
5%
10%
15%
20%
25%
30%
35%
<10 10-20 20-30 30-40 40-50 50-60 60-70 70-80 80-90 90-100 >100
Perc
ent o
f Trip
s
Trip Distance (miles)
Nearest ICE Use
EV Use
16
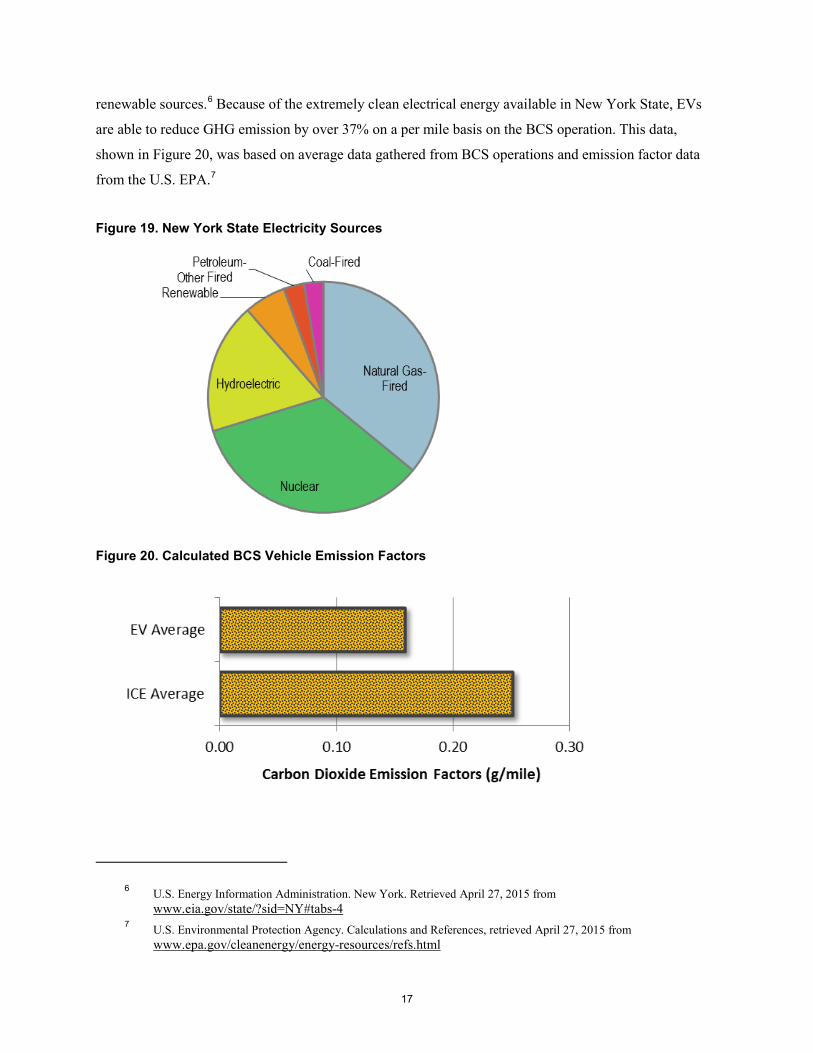
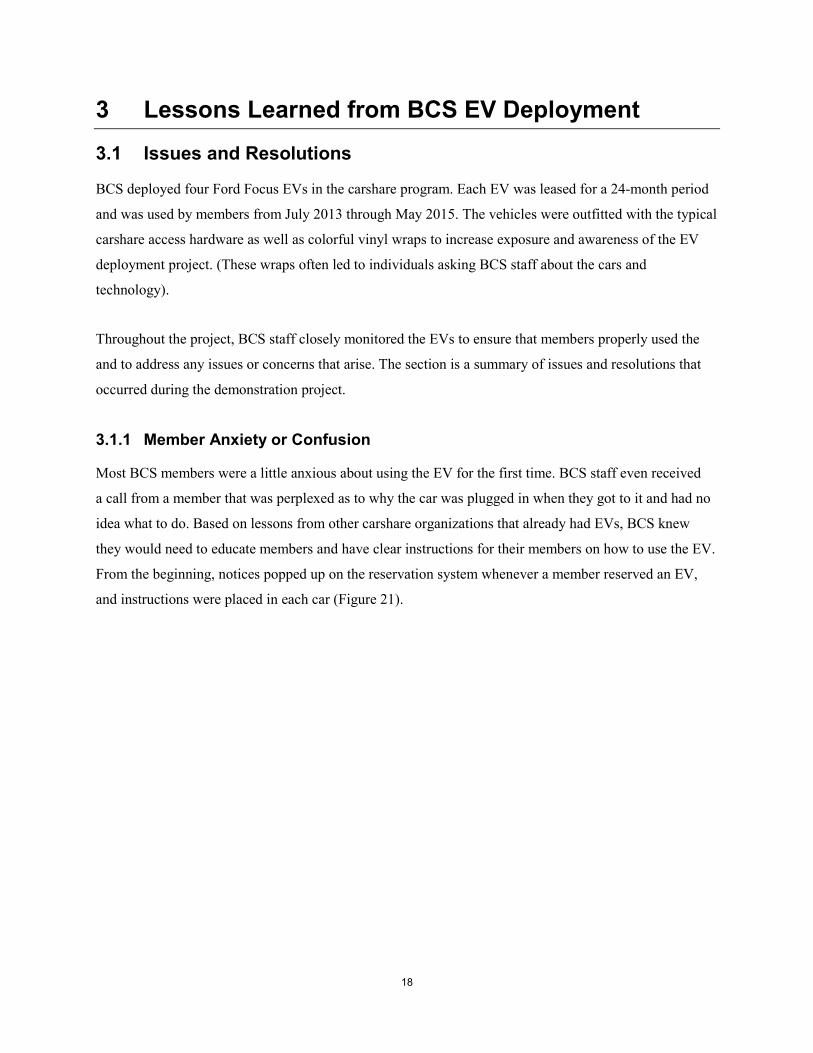
renewable sources.6 Because of the extremely clean electrical energy available in New York State, EVs
are able to reduce GHG emission by over 37% on a per mile basis on the BCS operation. This data,
shown in Figure 20, was based on average data gathered from BCS operations and emission factor data
from the U.S. EPA.7
Figure 19. New York State Electricity Sources
Figure 20. Calculated BCS Vehicle Emission Factors
6 U.S. Energy Information Administration. New York. Retrieved April 27, 2015 from www.eia.gov/state/?sid=NY#tabs-4
7 U.S. Environmental Protection Agency. Calculations and References, retrieved April 27, 2015 from www.epa.gov/cleanenergy/energy-resources/refs.html
17
3 Lessons Learned from BCS EV Deployment
3.1 Issues and Resolutions
BCS deployed four Ford Focus EVs in the carshare program. Each EV was leased for a 24-month period
and was used by members from July 2013 through May 2015. The vehicles were outfitted with the typical
carshare access hardware as well as colorful vinyl wraps to increase exposure and awareness of the EV
deployment project. (These wraps often led to individuals asking BCS staff about the cars and
technology).
Throughout the project, BCS staff closely monitored the EVs to ensure that members properly used the
and to address any issues or concerns that arise. The section is a summary of issues and resolutions that
occurred during the demonstration project.
3.1.1 Member Anxiety or Confusion
Most BCS members were a little anxious about using the EV for the first time. BCS staff even received
a call from a member that was perplexed as to why the car was plugged in when they got to it and had no
idea what to do. Based on lessons from other carshare organizations that already had EVs, BCS knew
they would need to educate members and have clear instructions for their members on how to use the EV.
From the beginning, notices popped up on the reservation system whenever a member reserved an EV,
and instructions were placed in each car (Figure 21).
18
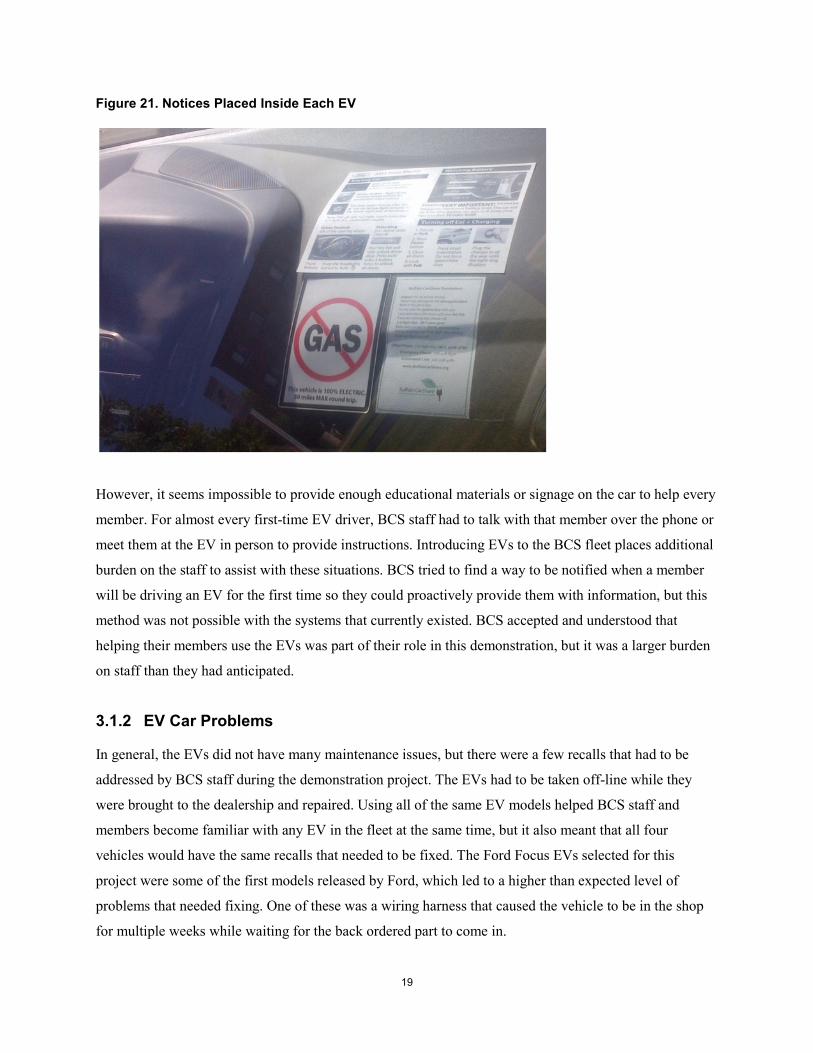
Figure 21. Notices Placed Inside Each EV
However, it seems impossible to provide enough educational materials or signage on the car to help every
member. For almost every first-time EV driver, BCS staff had to talk with that member over the phone or
meet them at the EV in person to provide instructions. Introducing EVs to the BCS fleet places additional
burden on the staff to assist with these situations. BCS tried to find a way to be notified when a member
will be driving an EV for the first time so they could proactively provide them with information, but this
method was not possible with the systems that currently existed. BCS accepted and understood that
helping their members use the EVs was part of their role in this demonstration, but it was a larger burden
on staff than they had anticipated.
3.1.2 EV Car Problems
In general, the EVs did not have many maintenance issues, but there were a few recalls that had to be
addressed by BCS staff during the demonstration project. The EVs had to be taken off-line while they
were brought to the dealership and repaired. Using all of the same EV models helped BCS staff and
members become familiar with any EV in the fleet at the same time, but it also meant that all four
vehicles would have the same recalls that needed to be fixed. The Ford Focus EVs selected for this
project were some of the first models released by Ford, which led to a higher than expected level of
problems that needed fixing. One of these was a wiring harness that caused the vehicle to be in the shop
for multiple weeks while waiting for the back ordered part to come in.
19
Early on in the demonstration while one BCS staff member was using an EV, it unexpectedly would not
run. They went through the start-up procedure multiple times and could not get it to start until they held
the key fob very close to the dashboard. BCS staff attempted to replicate the issue, but could not. The
issue did not reoccur, so it was likely just a rare glitch.
One other issue is that when the EVs did require a tow due to running out of energy or other technical
issue, a flatbed tow truck was required as a typical tow truck could damage the vehicles low chassis.
Towing did require some attention from the BCS staff, but was not a serious issue.
3.1.3 EV Charging
It is important for EVs in the BCS program to get a full battery charge each day when they are plugged
at their base location so they are ready for the next member to use. BCS elected to place a maintenance
reservation on the EVs each night from 2am to 6am so they must be parked in their space and charging
during this time. This scheduling limited the length of reservations for the EVs, which may have had a
slight impact on their reserved time, but it was mostly successful at preventing a fully drained battery.
The charger at the Baptist Manor appeared to develop a glitch at some point during the demonstration
period that caused it to stop providing a charge. BCS members reported this issue when they prepared
to take the EV and it did not have enough charge for them to complete their trip. BCS staff ended up
pressing the charging unit’s reset button to have it start working again. After a few weeks, the same
issue occurred again. Unable to diagnose the cause of the problem, the best solution was determined
to be that the BCS members would need to press the charging unit’s reset button every time they plugged
in. Instructions were posted to press the reset button and the problem has not happened again. However,
BCS staff try to regularly monitor the EV’s state of charge to proactively address when a charger is not
working properly.
The charging station at SmartHomeBuffalo on Washington Street had an issue and was not working
for two weeks in March 2015. National Grid maintains that station and they responded as promptly as
possible to fix it, but it still kept the EVs offline for that period.
20
3.1.4 Quick Depletion of Battery
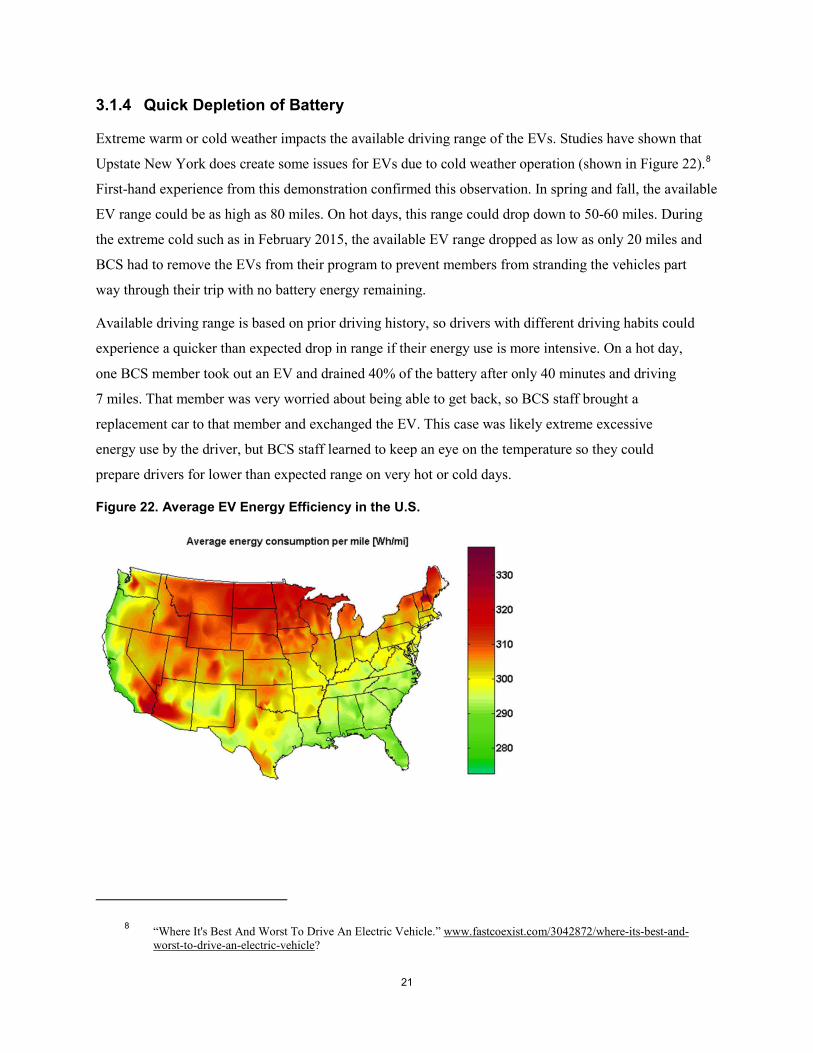
Extreme warm or cold weather impacts the available driving range of the EVs. Studies have shown that
Upstate New York does create some issues for EVs due to cold weather operation (shown in Figure 22).8
First-hand experience from this demonstration confirmed this observation. In spring and fall, the available
EV range could be as high as 80 miles. On hot days, this range could drop down to 50-60 miles. During
the extreme cold such as in February 2015, the available EV range dropped as low as only 20 miles and
BCS had to remove the EVs from their program to prevent members from stranding the vehicles part
way through their trip with no battery energy remaining.
Available driving range is based on prior driving history, so drivers with different driving habits could
experience a quicker than expected drop in range if their energy use is more intensive. On a hot day,
one BCS member took out an EV and drained 40% of the battery after only 40 minutes and driving
7 miles. That member was very worried about being able to get back, so BCS staff brought a
replacement car to that member and exchanged the EV. This case was likely extreme excessive
energy use by the driver, but BCS staff learned to keep an eye on the temperature so they could
prepare drivers for lower than expected range on very hot or cold days.
Figure 22. Average EV Energy Efficiency in the U.S.
8 “Where It's Best And Worst To Drive An Electric Vehicle.” www.fastcoexist.com/3042872/where-its-best-and-worst-to-drive-an-electric-vehicle?
21
Although loss of performance is expected during colder periods due to defrosting, heating, and
suboptimal battery temperatures, preheating the vehicles while plugged in could significantly
increase their potential range during colder periods. From the factory, the Ford Focus EV has the
ability to preheat the cabin, battery pack, and defrost the windows before being unplugged to avoid
draining the battery. However, because of the access technology used by the carshare program to
monitor and control vehicle operation for various users, this preheating option is not functional. This
access technology requires all heating and defrosting to be done once unplugged, which can account
for a relatively high percent of the overall total energy and reduced the overall range of the vehicle.
Currently there is no commercially available method for activating this system in conjunction with
the access system.
3.1.5 Stranded EVs with Dead Batteries
Despite all the warnings provided by the EV to the driver regarding available range, there were a handful
of times that a BCS member drove the EV until its battery was completely dead. Therefore, the stranded
EV had to be towed. When this scenario occurred on a major highway, the EV was impounded by the
police and required some effort to retrieve. Ford’s protocol for EVs with dead batteries (if they are
notified) requires the vehicle to be towed back to the dealership. This situation is not convenient for
BCS because they must find a way to go retrieve the vehicle when they have availability. When
possible and properly notified by the BCS member, BCS staff attempted to find a way to trickle
charge the EV using the portable Level 1 charger and a 110-V outlet. Once it had enough charge to return
it to the Level 2 charger, they would do so. Otherwise, they tried to coordinate with the towing service to
bring the EV directly back to the charger so they would not have to retrieve it from another location later.
3.1.6 Poor Traction in Snowy Conditions
It became apparent after the first significant snowfall that the low rolling-resistance tires supplied with
the EVs in this demonstration project would not be good on snowy roads during the winter in Buffalo.
Initially, the EVs were removed from service whenever the roads in Buffalo were snow covered. To
remedy the limited traction available with the low rolling-resistance tires, a snow tire lease was procured
for one of the EVs in February 2014 and the fourth EV lease included snow tires as well (installed in
November 2014). Snow tires drastically improved inclement weather performance for the two EVs that
were outfitted. The other two EVs continued to be removed from service during inclement
22
weather. In extremely bad weather, all vehicles, including the EVs outfitted with snow tires, are
removed from service for safety purposes. Based on data received, it is estimated that the addition
of snow tires allowed the EVs to be removed from service 24% less than EVs with original equipment
manufacturer tires (due to weather issues). However, this number is difficult to fully quantify and
was up to the discretion of the BCS staff. Overall, snow tires have shown to provide 72% better
acceleration, 56% better deceleration, and 100% better cornering grip in the snow than summer
tires (similar to low rolling-resistance tires) in a study by Edmunds.com.9
3.1.7 Lower than Expected Usage
Throughout the project, the EVs did not experience as much usage as the other conventional vehicles.
Initially, the BNMC parking spaces with available charging where not in locations where BCS members
were used to getting vehicles. Once the charging station at SmartHomeBuffalo was completed, the EVs
were moved there, which is the main hub for BCS vehicles. Usage increased, but was still much less than
the conventional vehicles.
Where possible, BCS tried to place a conventional vehicle at the exact location of the EV so vehicle
preference would not be influenced by the location. They were placed at the BNMC SmartHomeBuffalo
location and Buffalo State University. However, the Baptist Manor location for the fourth EV was a new
location for BCS and there was not enough member demand to place two cars at this location. Regardless
of whether there was a corresponding conventional vehicle at the same location or not, the EVs continued
to have lower use.
3.1.8 EV Charger Issues
Overall, the charging stations used to charge the Focus EVs were quite reliable and straightforward to
use. However, the ChargePoint station would not work if snow was around the base because it needed
to be kept clear for venting. This issue was not well known prior to this event and was likely due to the
frequency of use.
Some issues did arise with cord management and users regularly had problems freeing the cord on the
ChargePoint unit. On other chargers, the cord was easier to wrap up, however it did not hold the end
of the plug so ice could form inside it and make it harder to insert and pull out of the car.
9 “Tire Test: All-Season vs. Snow vs. Summer,” www.edmunds.com/car-reviews/features/tire-test-all-season-vs-snow-vs-summer.html
23
3.2 Survey
Two surveys were developed and sent out to BCS users that had previously used the EVs to evaluate their
experience and obtain feedback on the performance and convenience of the EVs in the fleet. One of these
surveys was administered nearly eight months after the deployment of the EVs in the BCS while the other
survey was administered 15 months later (at the end of the project) to capture the final opinion of the BCS
users that participated.
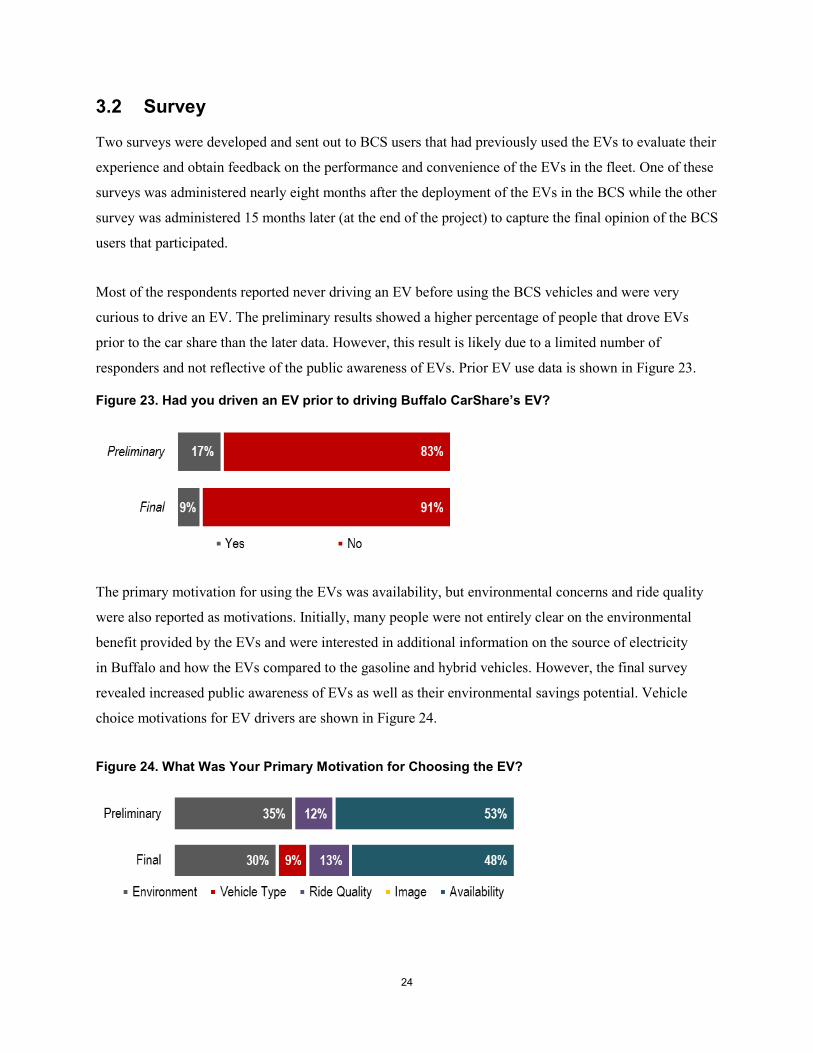
Most of the respondents reported never driving an EV before using the BCS vehicles and were very
curious to drive an EV. The preliminary results showed a higher percentage of people that drove EVs
prior to the car share than the later data. However, this result is likely due to a limited number of
responders and not reflective of the public awareness of EVs. Prior EV use data is shown in Figure 23.
Figure 23. Had you driven an EV prior to driving Buffalo CarShare’s EV?
The primary motivation for using the EVs was availability, but environmental concerns and ride quality
were also reported as motivations. Initially, many people were not entirely clear on the environmental
benefit provided by the EVs and were interested in additional information on the source of electricity
in Buffalo and how the EVs compared to the gasoline and hybrid vehicles. However, the final survey
revealed increased public awareness of EVs as well as their environmental savings potential. Vehicle
choice motivations for EV drivers are shown in Figure 24.
Figure 24. What Was Your Primary Motivation for Choosing the EV?
24
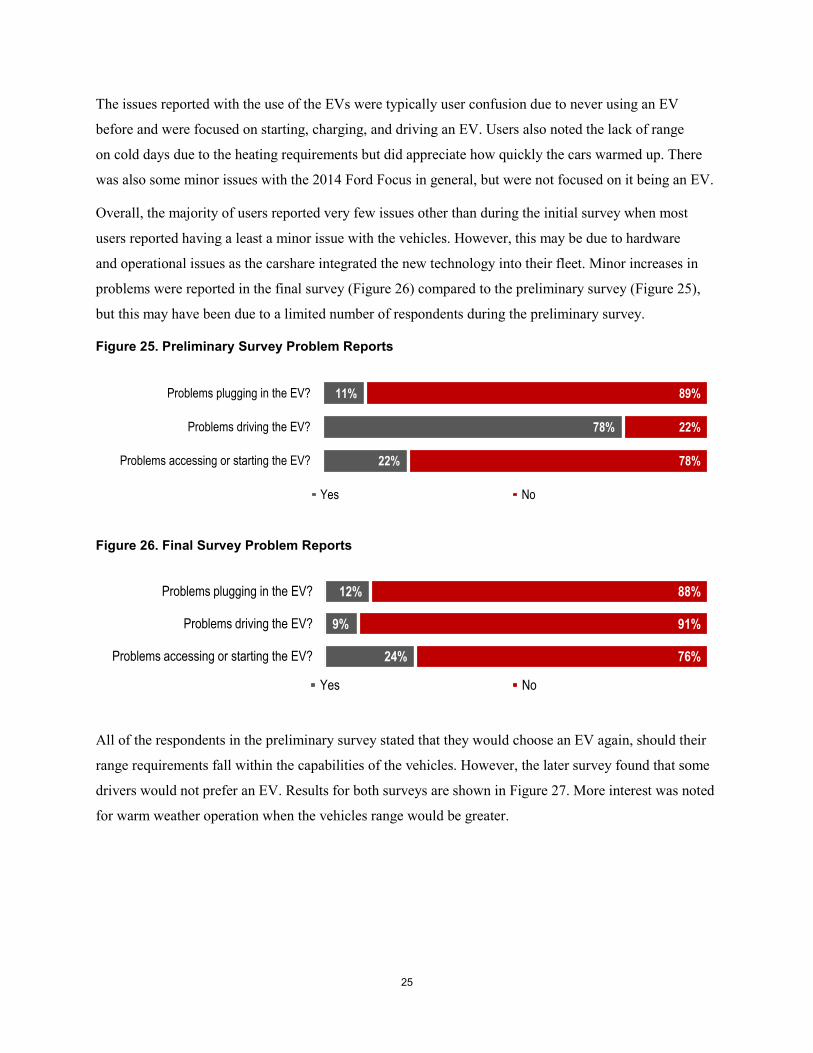
The issues reported with the use of the EVs were typically user confusion due to never using an EV
before and were focused on starting, charging, and driving an EV. Users also noted the lack of range
on cold days due to the heating requirements but did appreciate how quickly the cars warmed up. There
was also some minor issues with the 2014 Ford Focus in general, but were not focused on it being an EV.
Overall, the majority of users reported very few issues other than during the initial survey when most
users reported having a least a minor issue with the vehicles. However, this may be due to hardware
and operational issues as the carshare integrated the new technology into their fleet. Minor increases in
problems were reported in the final survey (Figure 26) compared to the preliminary survey (Figure 25),
but this may have been due to a limited number of respondents during the preliminary survey.
Figure 25. Preliminary Survey Problem Reports
Figure 26. Final Survey Problem Reports
All of the respondents in the preliminary survey stated that they would choose an EV again, should their
range requirements fall within the capabilities of the vehicles. However, the later survey found that some
drivers would not prefer an EV. Results for both surveys are shown in Figure 27. More interest was noted
for warm weather operation when the vehicles range would be greater.
22%
78%
11%
78%
22%
89%
Problems accessing or starting the EV?
Problems driving the EV?
Problems plugging in the EV?
Yes No
24%
9%
12%
76%
91%
88%
Problems accessing or starting the EV?
Problems driving the EV?
Problems plugging in the EV?
Yes No
25
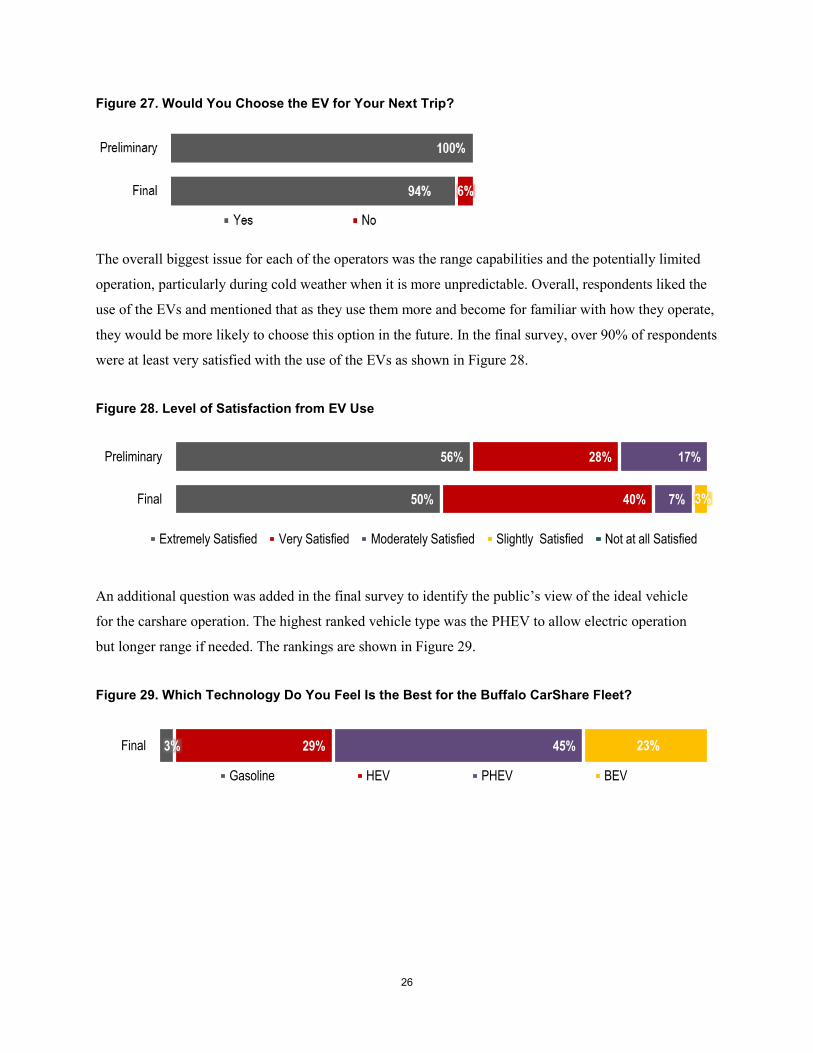
Figure 27. Would You Choose the EV for Your Next Trip?
The overall biggest issue for each of the operators was the range capabilities and the potentially limited
operation, particularly during cold weather when it is more unpredictable. Overall, respondents liked the
use of the EVs and mentioned that as they use them more and become for familiar with how they operate,
they would be more likely to choose this option in the future. In the final survey, over 90% of respondents
were at least very satisfied with the use of the EVs as shown in Figure 28.
Figure 28. Level of Satisfaction from EV Use
An additional question was added in the final survey to identify the public’s view of the ideal vehicle
for the carshare operation. The highest ranked vehicle type was the PHEV to allow electric operation
but longer range if needed. The rankings are shown in Figure 29.
Figure 29. Which Technology Do You Feel Is the Best for the Buffalo CarShare Fleet?
50%
56%
40%
28%
7%
17%
3% Final
Preliminary
Extremely Satisfied Very Satisfied Moderately Satisfied Slightly Satisfied Not at all Satisfied
3% 29% 45% 23% Final
Gasoline HEV PHEV BEV
26
4 Conclusions Overall, the EVs proved their functionality within the carshare setting and provided reliable service
with limited issues. The Project Team successfully completed the project objective to evaluate EVs
in the carshare environment. Although the economic viability for BCS to operate EVs was not good,
user satisfaction and performance, along with additional factors (e.g., public awareness, information
gathering, and outreach) were highly positive outcomes of the demonstration.
The economic analysis showed strong economic potential for EVs, but these vehicles lacked sufficient
use to see this potential realized. Throughout this demonstration, the average utilization level of the EVs
was only 53% of the gasoline-powered cars. For the EVs to be economically viable for Buffalo Car Share,
they needed to achieve a utilization rate of 82% (unlikely due to the current EVs’ range which limits its
use on longer trips). Because of the higher acquisition costs associated with the EVs, the limited use
(compared to gasoline cars) did not provide enough operational savings over the existing vehicle fleet.
EV user satisfaction was high and improved throughout the demonstration with increased driver
education and awareness. A survey administered near the end of the demonstration revealed that
90% of the EV users were very or extremely satisfied with the EV performance and their overall driving
experience. Few issues were reported with the operation of the EV (e.g., starting, driving, and plugging
in), but most were quickly overcome after the member’s first experience with the EV. One general issue
addressed by BCS during the demonstration was outfitting two of the EVs with snow tires to improve
winter performance since the factory-issued low-rolling resistant tires provided poor grip in snow and
ice. From this group of EV drivers, there was strong interest in keeping the EVs in the fleet and over
95% of responders would choose an EV in the future if it could meet their required driving range.
During warm weather operations, the vehicle’s range and performance met or exceeded BCS member’s
needs for many of the trips made by the car share users (even if the users chose a gasoline vehicle the EVs
could have completed the trip if chosen). However, a lot of the revenue generation for the organization
(reserved hours) and operational costs saving potential for the EVs (driven miles) comes from longer trips
that are not feasible with EVs. Also during some months, cold weather, and to some extent extremely hot
weather, lowered the EV range below what was needed for even some of the shorter in-town trips.
27

Additional benefits of this project were public outreach and an increased knowledge of EV operations
in various conditions. Public awareness significantly increased through this project because most of
the 175 EV users never previously drove an EV. The California Air Resources Board became very
interested in the concept of a low-income EV carsharing program and called the Project Team to learn
about this demonstration. In July 2015, a $1.6 million state grant was awarded for a carsharing program
in low-income Los Angeles neighborhoods that will operate about 100 electric and hybrid vehicles.
28

NYSERDA, a public benefit corporation, offers objective information and analysis, innovative programs, technical expertise, and support to help New Yorkers increase energy efficiency, save money, use renewable energy, and reduce reliance on fossil fuels. NYSERDA professionals work to protect the environment and create clean-energy jobs. NYSERDA has been developing partnerships to advance innovative energy solutions in New York State since 1975.
To learn more about NYSERDA’s programs and funding opportunities,
visit nyserda.ny.gov or follow us on Twitter, Facebook, YouTube, or
Instagram.
New York State Department of Transportation
50 Wolf Road Albany, NY 12232
telephone: 518-457-6195
dot.ny.us
New York State Energy Research and
Development Authority
17 Columbia CircleAlbany, NY 12203-6399
toll free: 866-NYSERDAlocal: 518-862-1090fax: 518-862-1091
State of New York
Andrew M. Cuomo, Governor
New York State Energy Research and Development Authority
Richard L. Kauffman, Chair | John B. Rhodes, President and CEO
New York State Department of TransportationMatthew J. Driscoll, Commissioner
NYSERDADepartment of Transportation
Related Documents