4 CHAPTER Demand, Supply, Markets and Learning Outcomes LO 1 Explain how the law of demand affects market activity LO 2 Explain how the law of supply affects market activity LO 3 Describe how the interaction between supply and demand creates markets LO 4 Describe how markets reach equilibrium LO 5 Explain how markets react during periods of disequilibrium

Welcome message from author
This document is posted to help you gain knowledge. Please leave a comment to let me know what you think about it! Share it to your friends and learn new things together.
Transcript
4C H A P T E R
Demand,Supply,
MarketsandLearning OutcomesLO1 Explain how the law of demand affects market activity LO2 Explain how the law of supply affects market activityLO3 Describe how the interaction between supply and demand creates markets LO4 Describe how markets reach equilibriumLO5 Explain how markets react during periods of disequilibrium

CHAPTER 4 Demand, Supply, and Markets 5 1
Why do roses cost more on Valentine’s Day than during the rest of the year? Why doTV ads cost more during the Super Bowl ($2.6 million for 30 seconds in 2007) than dur-ing Nick at Nite reruns? Why do Miami hotels charge more in February than in August?Why do surgeons earn more thanbutchers? Why do basketball prosearn more than hockey pros? Whydo economics majors earn morethan most other majors? Answersto these and most economic ques-tions boil down to the workings ofdemand and supply—the subject ofthis chapter.
This chapter introduces demandand supply and shows how theyinteract in competitive markets. Demand and supply are the most fundamental and the mostpowerful of all economic tools—important enough to warrant a chapter. Indeed, somebelieve that if you program a computer to answer “demand and supply” to every eco-nomic question, you could put many economists out of work. An understanding of thetwo ideas will take you far in mastering the art and science of economic analysis. Thischapter uses graphs, so you may need to review the Chapter 1 appendix as a refresher.
DemandHow many six packs of Pepsi will people buy each monthat a price of $3? What if the price is $2? What if it’s $4? Theanswers reveal the relationship between the price of Pepsi andthe quantity demanded. Such a relationship is called the demandfor Pepsi. Demand indicates the quantity consumers are bothwilling and able to buy at each possible price during a given time
Professional athletes should earn comparable salaries regardlessof the sport they play.Strongly Disagree Strongly Agree1 2 3 4 5 6 7
What do youthink?
zzzzzzzzzz
z z z z z z z z z z z z z z z z z z z z z z z z z z z z z z z z z z z z z z z z z z z z z z z
“Why does the bakery never haveenough of the cakes you want and plenty
of the ones you don’t?”©
YO
KOIN
OU
E/N
ON
STO
CK
/JU
PIT
ER
IMA
GE
S
LO 1
Topics discussed inChapter 4 include:
Demand and quantity demanded Movement along a supply curve
Movement along a demand curve Shift of a supply curve
Shift of a demand curve Markets and equilibrium
Supply and quantity supplied Disequilibrium
z z z z z z z z z z z z z z z z z z z z z z z z z z z z z z z z z z z z z z z z z z z z
demanda relation between theprice of a good and thequantity that consumersare willing and able tobuy per period, otherthings constant
5 2 PART 1 Introduction to Economics
price? The explanation begins with unlimited wantsconfronting scarce resources. Many goods and ser-vices could satisfy particular wants. For example, youcan satisfy your hunger with pizza, tacos, burgers,chicken, or hundreds of other foods. Similarly, youcan satisfy your desire for warmth in the winter withwarm clothing, a home-heating system, a trip toHawaii, or in many other ways. Clearly, some alterna-tives have more appeal than others (a trip to Hawaii ismore fun than warm clothing). In a world withoutscarcity, everything would be free, so you wouldalways choose the most attractive alternative.Scarcity, however, is a reality, and the degree ofscarcity of one good relative to another helps deter-mine each good’s relative price.
Notice that the definition of demand includes theother-things-constant assumption. Among the“other things” assumed to remain constant are theprices of other goods. For example, if the price ofpizza declines while other prices remain constant,pizza becomes relatively cheaper. Consumers aremore willing to purchase pizza when its relative pricefalls; they substitute pizza for other goods.This prin-ciple is called the substitution effect of a pricechange. On the other hand, an increase in the priceof pizza, other things constant, increases the oppor-tunity cost of pizza. This higher opportunity costcauses consumers to substitute other goods for thenow higher-priced pizza, thus reducing their quan-tity of pizza demanded. Remember that it is thechange in the relative price—the price of one good relativeto the prices of other goods—that causes the substitutioneffect. If all prices changed by the same percentage,there would be no change in relative prices and nosubstitution effect.
The Income Effect of a Price Change
A fall in the price increases the quantity demandedfor a second reason. Suppose you earn $30 a weekfrom a part-time job, so $30 is your money income.Money income is simply the number of dollarsreceived per period, in this case, $30 per week.Suppose you spend all that income on pizza, buyingthree a week at $10 each. What if the price drops to$6? At the lower price you can now afford five pizzasa week. Your money income remains at $30 perweek, but the decrease in the price has increasedyour real income—that is, your income measured interms of what it can buy. The price reduction, otherthings constant, increases the purchasing power ofyour income, thereby increasing your ability to buypizza. The quantity of pizza you demand will likelyincrease because of this income effect of a pricechange. You may not increase your quantitydemanded to five pizzas, but you could. If you decide
period, other things constant. Because demand per-tains to a specific period—a day, a week, a month—think of demand as the amounts purchased per periodat each possible price. Also, notice the emphasis onwilling and able. You may be able to buy a new Harley-Davidson XL 883 for $6,600 because you can affordone, but you may not be willing to buy one if motor-cycles don’t interest you.
The Law of DemandIn 1962, Sam Walton opened his first store in Rogers,Arkansas, with a sign that read “Wal-Mart DiscountCity. We sell for less.” Wal-Mart now sells more thanany other retailer in the world because prices areamong the lowest around. As a consumer, you under-stand why people buy more at a lower price. Sell forless, and the world will beat a path to your door. Wal-Mart, for example, sells on average over 20,000 pairsof shoes an hour. This relation between the price andthe quantity demanded is an economic law. The lawof demand says that quantity demanded varies
inversely with price, otherthings constant. Thus, thehigher the price, the smallerthe quantity demanded; thelower the price, the greaterthe quantity demanded.
Demand, Wants, and Needs
Consumer demand and wantsare not the same. As we haveseen, wants are unlimited.Youmay want a new MercedesSL600 Roadster convertible,but the $132,500 price tag islikely beyond your budget(that is, the quantity youdemand at that price is zero).Nor is demand the same asneed. You may need a newmuffler for your car, but aprice of $300 is just too highfor you. If, however, the pricedrops enough—say, to $200—then you become both willingand able to buy one.
The Substitution Effectof a Price Change
What explains the law ofdemand? Why, for example, ismore demanded at a lower
law of demandthe quantity of a goodthat consumers arewilling and able to buyper period relatesinversely, or negatively,to the price, otherthings constant
substitution effectof a price changewhen the price of agood falls, that goodbecomes cheaper com-pared to other goods soconsumers tend to sub-stitute that good forother goods
money incomethe number of dollars aperson receives perperiod, such as $400per week
real incomeincome measured interms of the goods andservices it can buy; realincome changes whenthe price changes
income effect of aprice changea fall in the price of agood increases con-sumers’ real income,making consumersmore able to purchasegoods; for a normalgood, the quantitydemanded increases
CHAPTER 4 Demand, Supply, and Markets 5 3
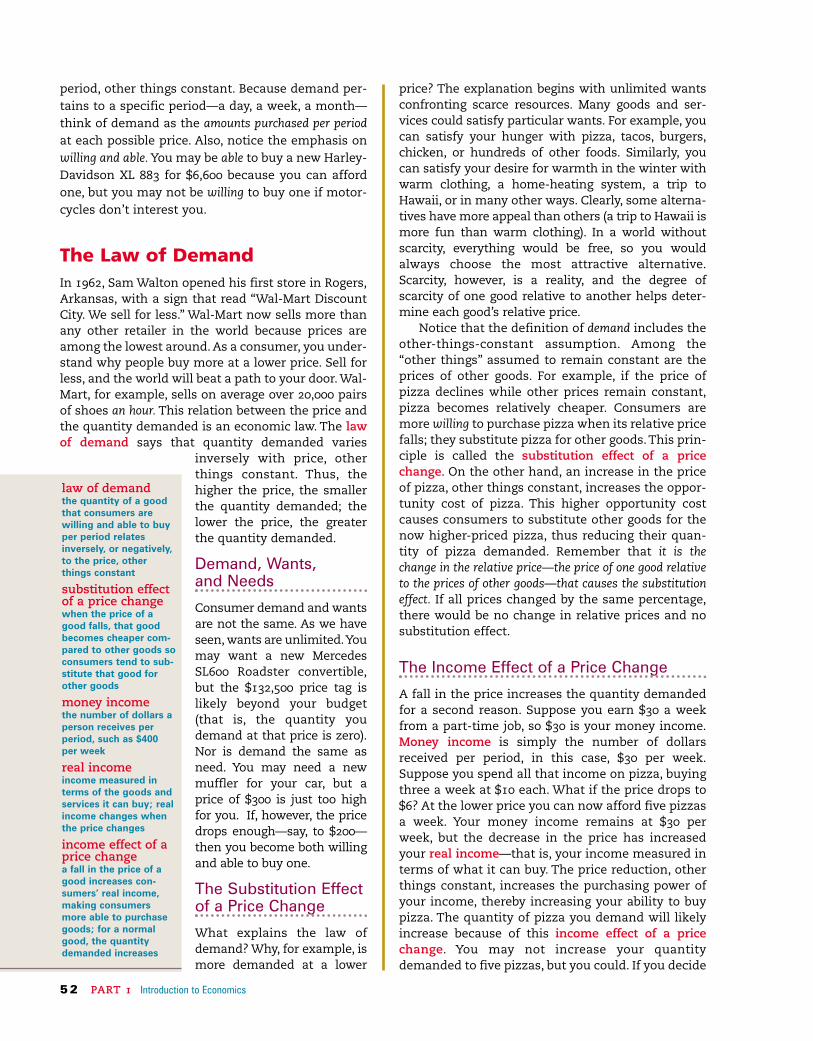
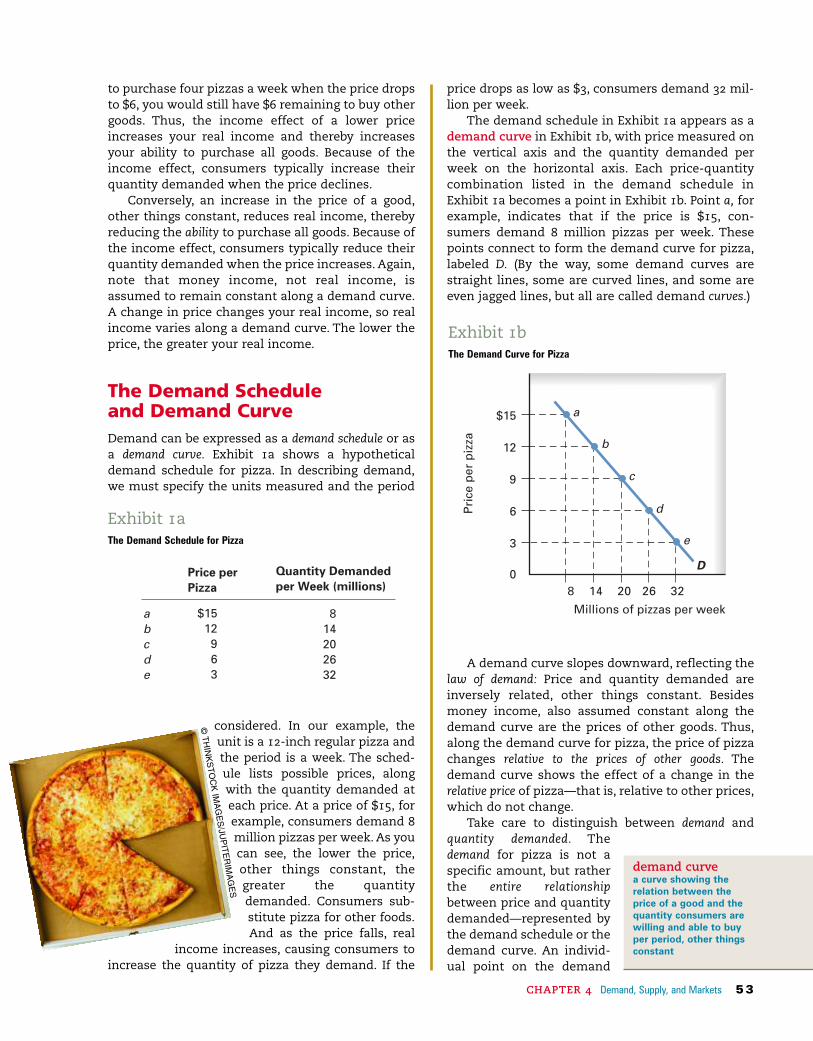
price drops as low as $3, consumers demand 32 mil-lion per week.
The demand schedule in Exhibit 1a appears as ademand curve in Exhibit 1b, with price measured onthe vertical axis and the quantity demanded perweek on the horizontal axis. Each price-quantitycombination listed in the demand schedule inExhibit 1a becomes a point in Exhibit 1b. Point a, forexample, indicates that if the price is $15, con-sumers demand 8 million pizzas per week. Thesepoints connect to form the demand curve for pizza,labeled D. (By the way, some demand curves arestraight lines, some are curved lines, and some areeven jagged lines, but all are called demand curves.)
A demand curve slopes downward, reflecting thelaw of demand: Price and quantity demanded areinversely related, other things constant. Besidesmoney income, also assumed constant along thedemand curve are the prices of other goods. Thus,along the demand curve for pizza, the price of pizzachanges relative to the prices of other goods. Thedemand curve shows the effect of a change in therelative price of pizza—that is, relative to other prices,which do not change.
Take care to distinguish between demand andquantity demanded. Thedemand for pizza is not aspecific amount, but ratherthe entire relationshipbetween price and quantitydemanded—represented bythe demand schedule or thedemand curve. An individ-ual point on the demand
to purchase four pizzas a week when the price dropsto $6, you would still have $6 remaining to buy othergoods. Thus, the income effect of a lower priceincreases your real income and thereby increasesyour ability to purchase all goods. Because of theincome effect, consumers typically increase theirquantity demanded when the price declines.
Conversely, an increase in the price of a good,other things constant, reduces real income, therebyreducing the ability to purchase all goods. Because ofthe income effect, consumers typically reduce theirquantity demanded when the price increases. Again,note that money income, not real income, isassumed to remain constant along a demand curve.A change in price changes your real income, so realincome varies along a demand curve. The lower theprice, the greater your real income.
The Demand Schedule and Demand CurveDemand can be expressed as a demand schedule or asa demand curve. Exhibit 1a shows a hypotheticaldemand schedule for pizza. In describing demand,we must specify the units measured and the period
considered. In our example, theunit is a 12-inch regular pizza andthe period is a week. The sched-ule lists possible prices, alongwith the quantity demanded ateach price. At a price of $15, forexample, consumers demand 8million pizzas per week. As youcan see, the lower the price,other things constant, thegreater the quantitydemanded. Consumers sub-stitute pizza for other foods.And as the price falls, real
income increases, causing consumers toincrease the quantity of pizza they demand. If the
abcde
$1512963
814202632
Price perPizza
Quantity Demandedper Week (millions)
(Exhibit 1aThe Demand Schedule for Pizza
demand curvea curve showing therelation between theprice of a good and thequantity consumers arewilling and able to buyper period, other thingsconstant
Pri
cep
erp
izza
8 14 20 26 32
$15
12
9
6
3
0
a
b
c
d
e
D
Millions of pizzas per week
Exhibit 1bThe Demand Curve for Pizza
©T
HIN
KS
TO
CK
IMA
GE
S/JU
PIT
ER
IMA
GE
S
5 4 PART 1 Introduction to Economics
good and quantity demanded whenother factors that could affectdemand remain unchanged. Whatare those other factors, and how dochanges in them affect demand?Variables that can affect market
demand are (1) the money incomeof consumers, (2) prices of
other goods, (3) consumerexpectations, (4) the numberor composition of con-sumers in the market, and(5) consumer tastes. How do
changes in each affect demand?
Changes in Consumer Income
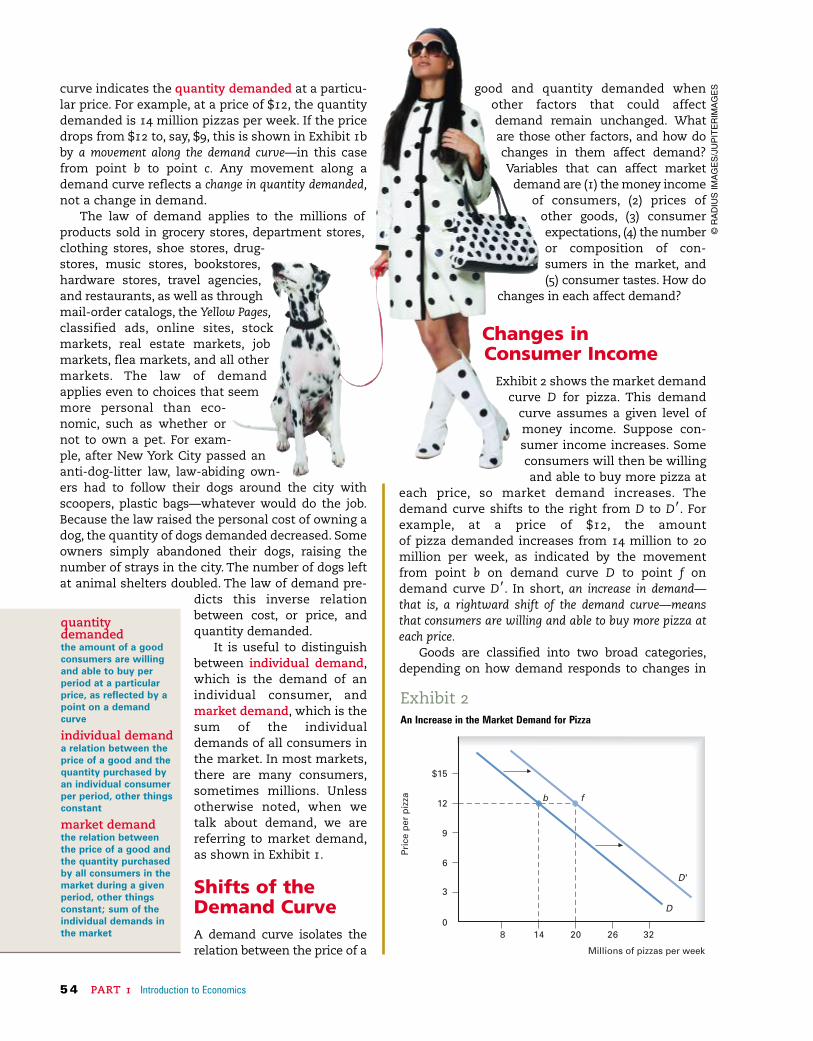
Exhibit 2 shows the market demandcurve D for pizza. This demand
curve assumes a given level ofmoney income. Suppose con-sumer income increases. Someconsumers will then be willingand able to buy more pizza at
each price, so market demand increases. Thedemand curve shifts to the right from D to D9. Forexample, at a price of $12, the amount of pizza demanded increases from 14 million to 20million per week, as indicated by the movementfrom point b on demand curve D to point f ondemand curve D9. In short, an increase in demand—that is, a rightward shift of the demand curve—meansthat consumers are willing and able to buy more pizza ateach price.
Goods are classified into two broad categories,depending on how demand responds to changes in
curve indicates the quantity demanded at a particu-lar price. For example, at a price of $12, the quantitydemanded is 14 million pizzas per week. If the pricedrops from $12 to, say, $9, this is shown in Exhibit 1bby a movement along the demand curve—in this casefrom point b to point c. Any movement along ademand curve reflects a change in quantity demanded,not a change in demand.
The law of demand applies to the millions ofproducts sold in grocery stores, department stores,clothing stores, shoe stores, drug-stores, music stores, bookstores,hardware stores, travel agencies,and restaurants, as well as throughmail-order catalogs, the Yellow Pages,classified ads, online sites, stockmarkets, real estate markets, jobmarkets, flea markets, and all othermarkets. The law of demandapplies even to choices that seemmore personal than eco-nomic, such as whether ornot to own a pet. For exam-ple, after New York City passed ananti-dog-litter law, law-abiding own-ers had to follow their dogs around the city withscoopers, plastic bags—whatever would do the job.Because the law raised the personal cost of owning adog, the quantity of dogs demanded decreased. Someowners simply abandoned their dogs, raising thenumber of strays in the city. The number of dogs leftat animal shelters doubled. The law of demand pre-
dicts this inverse relationbetween cost, or price, andquantity demanded.
It is useful to distinguishbetween individual demand,which is the demand of anindividual consumer, andmarket demand, which is thesum of the individualdemands of all consumers inthe market. In most markets,there are many consumers,sometimes millions. Unlessotherwise noted, when wetalk about demand, we arereferring to market demand,as shown in Exhibit 1.
Shifts of the Demand CurveA demand curve isolates therelation between the price of a
quantitydemandedthe amount of a goodconsumers are willingand able to buy perperiod at a particularprice, as reflected by apoint on a demandcurve
individual demanda relation between theprice of a good and thequantity purchased byan individual consumerper period, other thingsconstant
market demandthe relation betweenthe price of a good andthe quantity purchasedby all consumers in themarket during a givenperiod, other thingsconstant; sum of theindividual demands inthe market
$15
12
9
6
3
08 14 20 26 32
Millions of pizzas per week
Pri
cep
erp
izza
D
D'
fb
Exhibit 2An Increase in the Market Demand for Pizza
©R
AD
IUS
IMA
GE
S/J
UP
ITE
RIM
AG
ES
CHAPTER 4 Demand, Supply, and Markets 5 5
Changes in Consumer ExpectationsAnother factor assumed constant along a givendemand curve is consumer expectations about fac-tors that influence demand, such as incomes orprices. A change in consumers’ income expectationscan shift the demand curve. For example, a con-sumer who learns about a pay raise might increasedemand well before the raise takes effect. A collegesenior who lands that first real job may buy a new careven before graduation. Likewise, a change in con-sumers’ price expectations can shift the demand curve.For example, if you expect the price of pizza to jumpnext week, you may buy an extra one today for thefreezer, shifting this week’s demand for pizza right-ward. Or if consumers come to believe that homeprices will climb next month, some will increasetheir demand for housing now, shifting this month’sdemand for housing rightward. On the other hand, ifhousing prices are expected to fall next month, someconsumers will postpone purchases, thereby shiftingthis month’s housing demand leftward.
Changes in the Number orComposition of ConsumersAs mentioned earlier, the market demand curve is thesum of the individual demand curves of all consumersin the market. If the number of consumers changes,the demand curve will shift. For example, if the popu-lation grows, the demandcurve for pizza will shiftrightward. Even if total pop-ulation remains unchanged,demand could shift with achange in the compositionof the population. For exam-ple, a bulge in the teenagepopulation could shift pizzademand rightward. A babyboom would shift rightwardthe demand for car seatsand baby food. A growingLatino population wouldaffect the demand for Latinofoods.
Changes inConsumer TastesDo you like anchovies onyour pizza? How aboutsauerkraut on your hot
money income. The demand fora normal good increases asmoney income increases.Because pizza is a normalgood, its demand curve shiftsrightward when moneyincome increases. Mostgoods are normal. In con-trast, demand for an inferiorgood actually decreases as
money income increases, sothe demand curve shifts leftward. Examples
of inferior goods include bologna sandwiches, usedfurniture, and used clothing. As money incomeincreases, consumers tend to switch from these infe-rior goods to normal goods (such as roast beef sand-wiches, new furniture, and new clothing).
Changes in the Prices of Other GoodsAgain, the prices of other goods are assumed toremain constant along a given demand curve. Nowlet’s bring these other prices into play. Consumershave various ways of trying to satisfy any particularwant. Consumers choose among substitutes basedon relative prices. For example, pizza and tacos aresubstitutes, though not perfect ones. An increase inthe price of tacos, other things constant, reduces thequantity of tacos demanded along a given tacodemand curve. An increase in the price of tacos alsoincreases the demand for pizza, shifting the demandcurve for pizza to the right. Two goods are consid-ered substitutes if an increase in the price of oneshifts the demand for the other rightward and, con-versely, if a decrease in the price of one shiftsdemand for the other leftward.
Goods used in combination are called comple-ments. Examples include Coke and pizza, milk andcookies, computer software and hardware, and air-line tickets and rental cars. Two goods are consid-ered complements if an increase in the price ofone decreases the demand for the other, shiftingthat demand curve leftward. For example, anincrease in the price of pizza shifts the demandcurve for Coke leftward. But most pairs of goodsselected at random are unrelated—for example,pizza and housing, or milk and gasoline. Still, anincrease in the price of an unrelated good reducesthe consumer’s real income and can reduce thedemand for pizza and other goods. For example, asharp increase in housing prices reduces theamount of income people have to spend on othergoods, such as pizza.
normal gooda good, such as newclothes, for whichdemand increases, orshifts rightward, as con-sumer income rises
inferior gooda good, such as usedclothes, for whichdemand decreases, orshifts leftward, as con-sumer income rises
substitutesgoods, such as Coke andPepsi, that relate in sucha way that an increasein the price of one shiftsthe demand for theother rightward
complementsgoods, such as milk andcookies, that relate insuch a way that anincrease in the price ofone shifts the demandfor the other leftward
©T
HIN
KS
TO
CK
IMA
GE
S/JU
PIT
ER
IMA
GE
S
5 6 PART 1 Introduction to Economics
demand curve before accepting a change in tastes asthe explanation.
That wraps up our look at changes in demand.Before we turn to supply, you should remember thedistinction between a movement along a givendemand curve and a shift of a demand curve. Achange in price, other things constant, causes amovement along a demand curve, changing the quan-tity demanded. A change in one of the determinantsof demand other than price causes a shift of a demandcurve, changing demand.
SupplyJust as demand is a relation between price andquantity demanded, supply is a relationbetween price and quantity supplied. Supplyindicates how much producers are willing and able tooffer for sale per period at each possible price, otherthings constant. The law of supply states that thequantity supplied is usually directly related to itsprice, other things constant. Thus, the lower theprice, the smaller the quantity supplied; the higherthe price, the greater the quantity supplied.
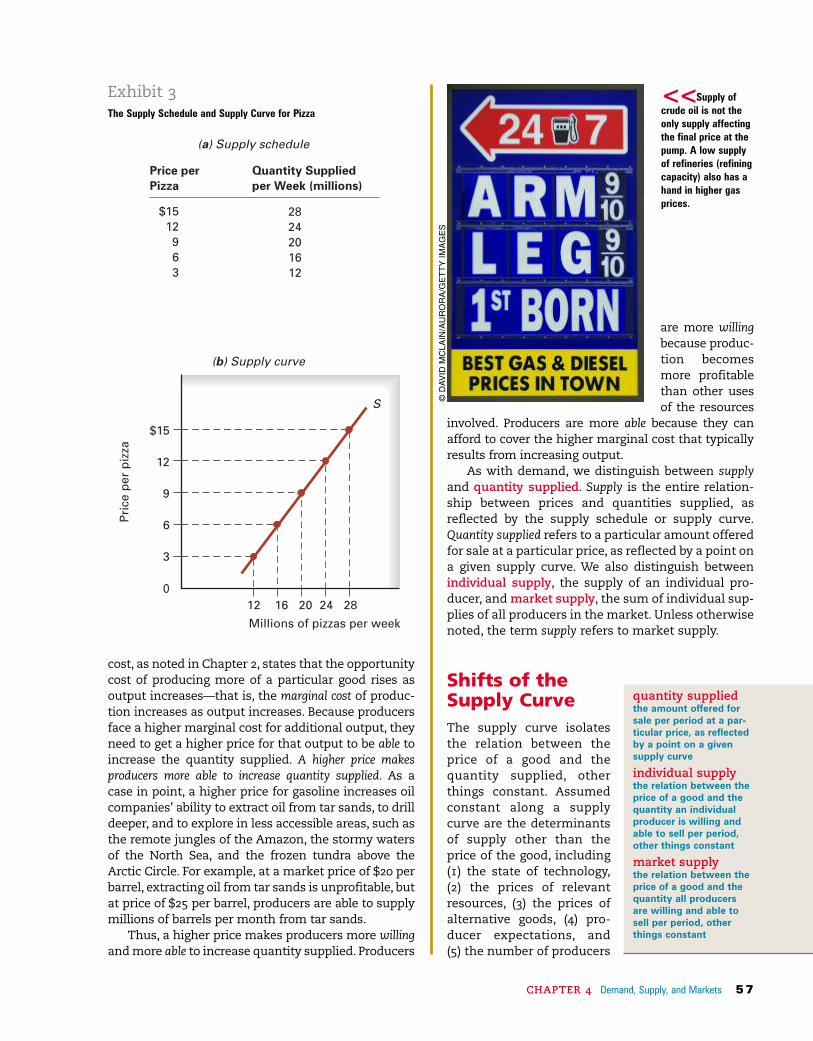
The Supply Schedule and Supply CurveExhibit 3 presents the market supply schedule andmarket supply curve S for pizza. Both show thequantities supplied per week at various possibleprices by the thousands of pizza makers in the econ-omy. As you can see, price andquantity supplied are directly, orpositively, related. Producersoffer more at a higher pricethan at a lower price, so thesupply curve slopes upward.
There are two reasons whyproducers offer more for salewhen the price rises. First, asthe price increases, otherthings constant, a producerbecomes more willing tosupply the good. Prices actas signals to existing andpotential suppliers aboutthe rewards for producing variousgoods. A higher pizza price attracts resources fromlower-valued uses. A higher price makes producers morewilling to increase quantity supplied.
Higher prices also increase the producer’s ability tosupply the good. The law of increasing opportunity
dogs? Are you into tattoos and body piercings? Ismusic to your ears more likely to be rock, country, hip-hop, reggae, R&B, jazz, funk, Latin, gospel, new age, orclassical? Choices in food, body art, music, clothing,books, movies,TV—indeed, all consumer choices—areinfluenced by consumer tastes. Tastes are nothingmore than your likes and dislikes as a consumer.Whatdetermines tastes? Your desires for food when hungryand drink when thirsty are largely biological. So too isyour desire for comfort, rest, shelter, friendship, love,status, personal safety, and a pleasant environment.Your family background affects some of your tastes—your taste in food, for example, has been shaped byyears of home cooking. Other influences include thesurrounding culture, peer pressure, and religious con-victions. So economists can say a little about the ori-
gin of tastes, but they claim no special expertise in under-standing how tastes developand change over time.Economists recognize, how-ever, that tastes have animportant impact on demand.For example, although pizza ispopular, some people justdon’t like it, and those whoare lactose intolerant can’tstomach the cheese topping.Thus, most people like pizzabut some don’t.
In our analysis of con-sumer demand, we willassume that tastes are givenand are relatively stable. Tastesare assumed to remain con-stant along a given demandcurve. A change in the tastesfor a particular good wouldshift that good’s demandcurve. For example, a discov-ery that the tomato sauceand cheese combination onpizza promotes overallhealth could change con-sumer tastes, shifting thedemand curve for pizza tothe right. But because achange in tastes is so difficultto isolate from other eco-nomic changes, we should bereluctant to attribute a shiftof the demand curve to achange in tastes. We try torule out other possible rea-sons for a shift of the
tastesconsumer preferences;likes and dislikes inconsumption; assumedto remain constantalong a given demandcurve
movement along ademand curvechange in quantitydemanded resultingfrom a change in theprice of the good, otherthings constant
shift of a demandcurvemovement of a demandcurve right or leftresulting from a changein one of the determi-nants of demand otherthan the price of the good
supplya relation between theprice of a good and thequantity that producersare willing and able tosell per period, otherthings constant
law of supplythe amount of a goodthat producers are will-ing and able to sell perperiod is usuallydirectly related to itsprice, other things constant
supply curvea curve showing therelation between theprice of a good and thequantity producers arewilling and able to sellper period other things constant
LO 2
©T
HIN
KS
TO
CK
IMA
GE
S/J
UP
ITE
RIM
AG
ES
CHAPTER 4 Demand, Supply, and Markets 5 7
are more willingbecause produc-tion becomesmore profitablethan other usesof the resources
involved. Producers are more able because they canafford to cover the higher marginal cost that typicallyresults from increasing output.
As with demand, we distinguish between supplyand quantity supplied. Supply is the entire relation-ship between prices and quantities supplied, asreflected by the supply schedule or supply curve.Quantity supplied refers to a particular amount offeredfor sale at a particular price, as reflected by a point ona given supply curve. We also distinguish betweenindividual supply, the supply of an individual pro-ducer, and market supply, the sum of individual sup-plies of all producers in the market. Unless otherwisenoted, the term supply refers to market supply.
Shifts of theSupply CurveThe supply curve isolatesthe relation between theprice of a good and thequantity supplied, otherthings constant. Assumedconstant along a supplycurve are the determinantsof supply other than theprice of the good, including(1) the state of technology,(2) the prices of relevantresources, (3) the prices ofalternative goods, (4) pro-ducer expectations, and (5) the number of producers
cost, as noted in Chapter 2, states that the opportunitycost of producing more of a particular good rises asoutput increases—that is, the marginal cost of produc-tion increases as output increases. Because producersface a higher marginal cost for additional output, theyneed to get a higher price for that output to be able toincrease the quantity supplied. A higher price makesproducers more able to increase quantity supplied. As acase in point, a higher price for gasoline increases oilcompanies’ ability to extract oil from tar sands, to drilldeeper, and to explore in less accessible areas, such asthe remote jungles of the Amazon, the stormy watersof the North Sea, and the frozen tundra above theArctic Circle. For example, at a market price of $20 perbarrel, extracting oil from tar sands is unprofitable, butat price of $25 per barrel, producers are able to supplymillions of barrels per month from tar sands.
Thus, a higher price makes producers more willingand more able to increase quantity supplied. Producers
$1512
963
2824201612
Price perPizza
Quantity Suppliedper Week (millions)
(a) Supply schedule
Exhibit 3The Supply Schedule and Supply Curve for Pizza
Pri
cep
erp
izza
(b) Supply curve
12 16 20 24 28
$15
12
9
6
3
0
S
Millions of pizzas per week
quantity suppliedthe amount offered forsale per period at a par-ticular price, as reflectedby a point on a givensupply curve
individual supplythe relation between theprice of a good and thequantity an individualproducer is willing andable to sell per period,other things constant
market supplythe relation between theprice of a good and thequantity all producersare willing and able tosell per period, otherthings constant
<<Supply ofcrude oil is not theonly supply affectingthe final price at thepump. A low supplyof refineries (refiningcapacity) also has ahand in higher gasprices.
©D
AV
IDM
CLA
IN/A
UR
OR
A/G
ET
TY
IMA
GE
S
5 8 PART 1 Introduction to Economics
to run a pizza business could produceother baked goods. Alternative goodsare those that use some of the sameresources employed to produce thegood under consideration. For exam-ple, a decrease in the price of Italianbread reduces the opportunity costof making pizza. As a result, somebread makers become pizza mak-ers so the supply of pizzaincreases, shifting the supplycurve of pizza rightward as inExhibit 3. On the other hand, ifthe price of an alternative good,
such as Italian bread, increases, supplyingpizza becomes relatively less attractive compared tosupplying Italian bread. As resources shift frompizza to bread, the supply of pizza decreases, orshifts to the left.
Changes in Producer ExpectationsChanges in producer expectations can shift the sup-ply curve. For example, a pizza maker expectinghigher pizza prices in the future may expand his orher pizzeria now, thereby shifting the supply of pizzarightward. When a good can be easily stored (crudeoil, for example, can be left in the ground), expectinghigher prices in the future might prompt some pro-ducers to reduce their current supply while awaitingthe higher price.Thus, an expectation of higher pricesin the future could either increase or decrease currentsupply, depending on the good. More generally, any
in the market. Let’s see how a change in each affectsthe supply curve.
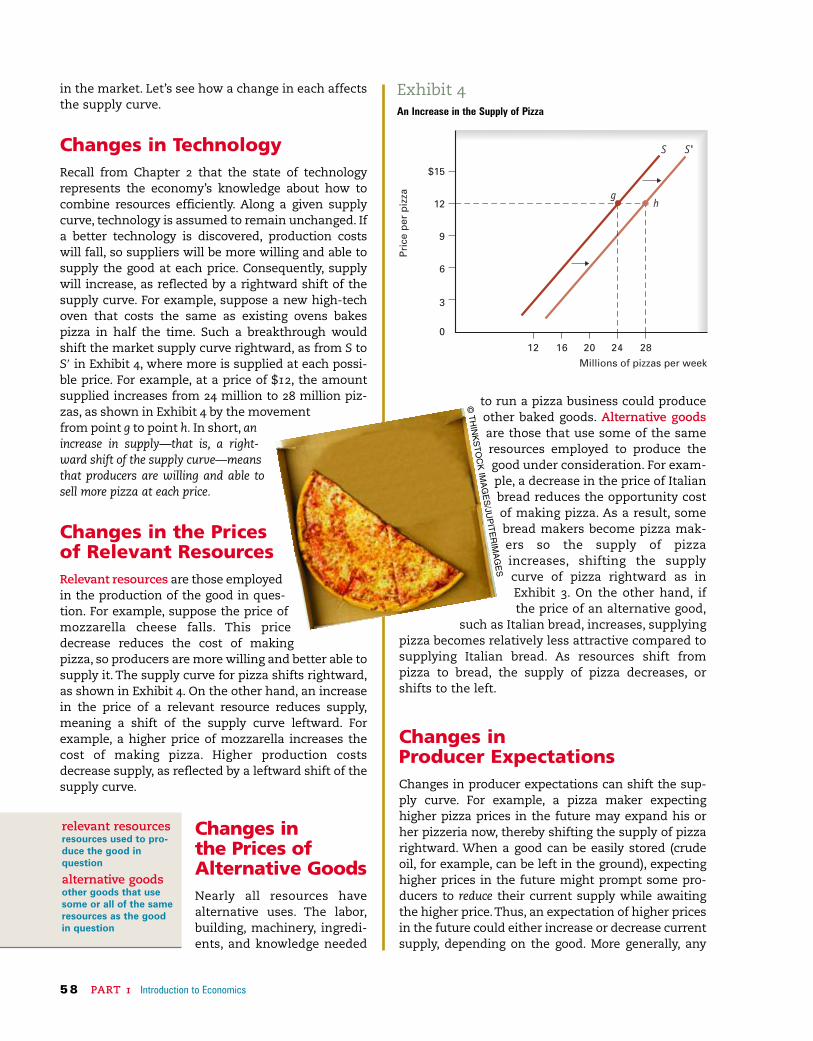
Changes in TechnologyRecall from Chapter 2 that the state of technologyrepresents the economy’s knowledge about how tocombine resources efficiently. Along a given supplycurve, technology is assumed to remain unchanged. Ifa better technology is discovered, production costswill fall, so suppliers will be more willing and able tosupply the good at each price. Consequently, supplywill increase, as reflected by a rightward shift of thesupply curve. For example, suppose a new high-techoven that costs the same as existing ovens bakespizza in half the time. Such a breakthrough wouldshift the market supply curve rightward, as from S toS9 in Exhibit 4, where more is supplied at each possi-ble price. For example, at a price of $12, the amountsupplied increases from 24 million to 28 million piz-zas, as shown in Exhibit 4 by the movementfrom point g to point h. In short, anincrease in supply—that is, a right-ward shift of the supply curve—meansthat producers are willing and able tosell more pizza at each price.
Changes in the Prices of Relevant ResourcesRelevant resources are those employedin the production of the good in ques-tion. For example, suppose the price ofmozzarella cheese falls. This pricedecrease reduces the cost of makingpizza, so producers are more willing and better able tosupply it. The supply curve for pizza shifts rightward,as shown in Exhibit 4. On the other hand, an increasein the price of a relevant resource reduces supply,meaning a shift of the supply curve leftward. Forexample, a higher price of mozzarella increases thecost of making pizza. Higher production costsdecrease supply, as reflected by a leftward shift of thesupply curve.
Changes in the Prices ofAlternative GoodsNearly all resources havealternative uses. The labor,building, machinery, ingredi-ents, and knowledge needed
$15
12
9
6
3
0
12 16 20 24 28
Millions of pizzas per week
Pri
cep
erp
izza
S'
h
S
g
Exhibit 4An Increase in the Supply of Pizza
relevant resourcesresources used to pro-duce the good in question
alternative goodsother goods that usesome or all of the sameresources as the goodin question
©T
HIN
KS
TO
CK
IMA
GE
S/JU
PIT
ER
IMA
GE
S
is this conflict between producers and consumersresolved?
MarketsA market sorts out differences between demandersand suppliers. A market, as you know from Chapter1, includes all the arrangements used to buy andsell a particular good or service. Markets reducetransaction costs—the costs of time and informa-tion required for exchange. For example, supposeyou are looking for a summer job. One approachmight be to go from employer to employer lookingfor openings. But this could have you runningaround for days or weeks. A more efficient strategywould be to pick up a copy of the local newspaper orgo online and look for openings. Classified ads andWeb sites, which are elements of the job market,reduce the transaction costs of bringing workersand employers together.
The coordination that occurs through marketstakes place not because ofsome central plan butbecause of Adam Smith’s“invisible hand.” For exam-ple, the auto dealers inyour community tend tolocate together, usually onthe outskirts of town,where land is cheaper. Thedealers congregate notbecause they all took aneconomics course orbecause they like oneanother’s company butbecause together theybecome a more attractivedestination for car buyers.A dealer who makes the
change affecting future profitability, such as a changein business taxes, could shift the supply curve now.
Changes in the Number of ProducersBecause market supply sums the amounts suppliedat each price by all producers, market supplydepends on the number of producers in the market.If that number increases, supply will increase, shift-ing supply to the right. If the number of producersdecreases, supply will decrease, shifting supply tothe left. As an example of increased supply, thenumber of gourmet coffee bars in the United Stateshas more than quadrupled since 1990 (thinkStarbucks), shifting the supply curve of gourmet cof-fee to the right.
Finally, note again the distinction between a move-ment along a supply curve and a shift of a supplycurve. A change in price, other things constant, causesa movement along a supply curve, changing the quantitysupplied. A change in one of the determinants of sup-ply other than price causes a shift of a supply curve,changing supply.
You are now ready to bring demand and supplytogether.
Demand and SupplyCreate a MarketDemanders and suppliers have different viewsof price. Demanders pay the price and suppliersreceive it. Thus, a higher price is bad news for con-sumers but good news for producers. As the pricerises, consumers reduce their quantity demandedalong the demand curve and producers increasetheir quantity supplied along the supply curve. How
movement along asupply curvechange in quantity sup-plied resulting from achange in the price ofthe good, other thingsconstant
shift of a supplycurvemovement of a supplycurve left or right result-ing from a change inone of the determinantsof supply other than theprice of the good
transaction coststhe costs of time andinformation required tocarry out marketexchange
LO 3
CHAPTER 4 Demand, Supply, and Markets 5 9©F
OO
DC
OLL
EC
TIO
NR
F/G
ET
TY
IMA
GE
S
6 0 PART 1 Introduction to Economics
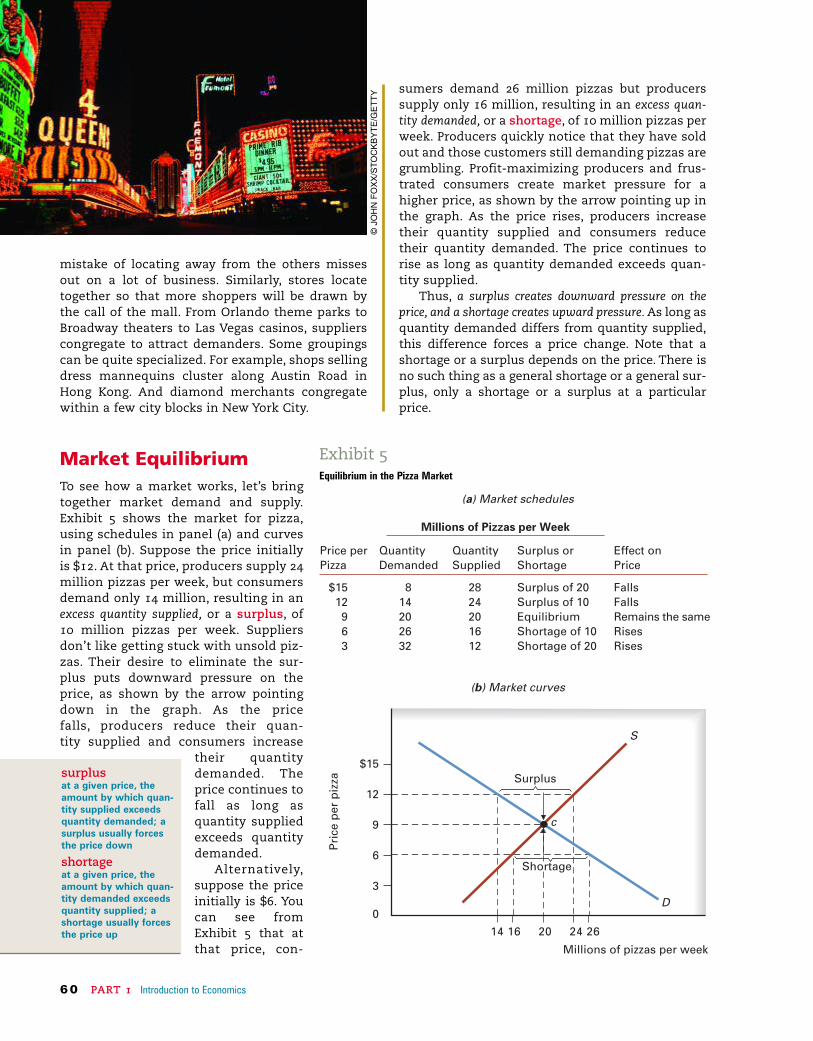
sumers demand 26 million pizzas but producerssupply only 16 million, resulting in an excess quan-tity demanded, or a shortage, of 10 million pizzas perweek. Producers quickly notice that they have soldout and those customers still demanding pizzas aregrumbling. Profit-maximizing producers and frus-trated consumers create market pressure for ahigher price, as shown by the arrow pointing up inthe graph. As the price rises, producers increasetheir quantity supplied and consumers reducetheir quantity demanded. The price continues torise as long as quantity demanded exceeds quan-tity supplied.
Thus, a surplus creates downward pressure on theprice, and a shortage creates upward pressure. As long asquantity demanded differs from quantity supplied,this difference forces a price change. Note that ashortage or a surplus depends on the price. There isno such thing as a general shortage or a general sur-plus, only a shortage or a surplus at a particularprice.
mistake of locating away from the others missesout on a lot of business. Similarly, stores locatetogether so that more shoppers will be drawn bythe call of the mall. From Orlando theme parks toBroadway theaters to Las Vegas casinos, supplierscongregate to attract demanders. Some groupingscan be quite specialized. For example, shops sellingdress mannequins cluster along Austin Road inHong Kong. And diamond merchants congregatewithin a few city blocks in New York City.
Market EquilibriumTo see how a market works, let’s bringtogether market demand and supply.Exhibit 5 shows the market for pizza,using schedules in panel (a) and curvesin panel (b). Suppose the price initiallyis $12. At that price, producers supply 24million pizzas per week, but consumersdemand only 14 million, resulting in anexcess quantity supplied, or a surplus, of10 million pizzas per week. Suppliersdon’t like getting stuck with unsold piz-zas. Their desire to eliminate the sur-plus puts downward pressure on theprice, as shown by the arrow pointingdown in the graph. As the price falls, producers reduce their quan-tity supplied and consumers increase
their quantitydemanded. Theprice continues tofall as long asquantity suppliedexceeds quantitydemanded.
Alternatively,suppose the priceinitially is $6. Youcan see fromExhibit 5 that atthat price, con-
surplusat a given price, theamount by which quan-tity supplied exceedsquantity demanded; asurplus usually forcesthe price down
shortageat a given price, theamount by which quan-tity demanded exceedsquantity supplied; ashortage usually forcesthe price up
Price per Pizza
QuantityDemanded
QuantitySupplied
Surplus orShortage
Effect onPrice
$1512
963
814202632
2824201612
Surplus of 20Surplus of 10EquilibriumShortage of 10Shortage of 20
FallsFallsRemains the sameRisesRises
Millions of Pizzas per Week
14 16 20 24 26
Millions of pizzas per week
Pri
cep
erp
izza
$15
12
9
6
3
0
Shortage
Surplus
c
S
D
(a) Market schedules
(b) Market curves
Exhibit 5Equilibrium in the Pizza Market
©JO
HN
FO
XX
/ST
OC
KB
YT
E/G
ET
TY
CHAPTER 4 Demand, Supply, and Markets 6 1
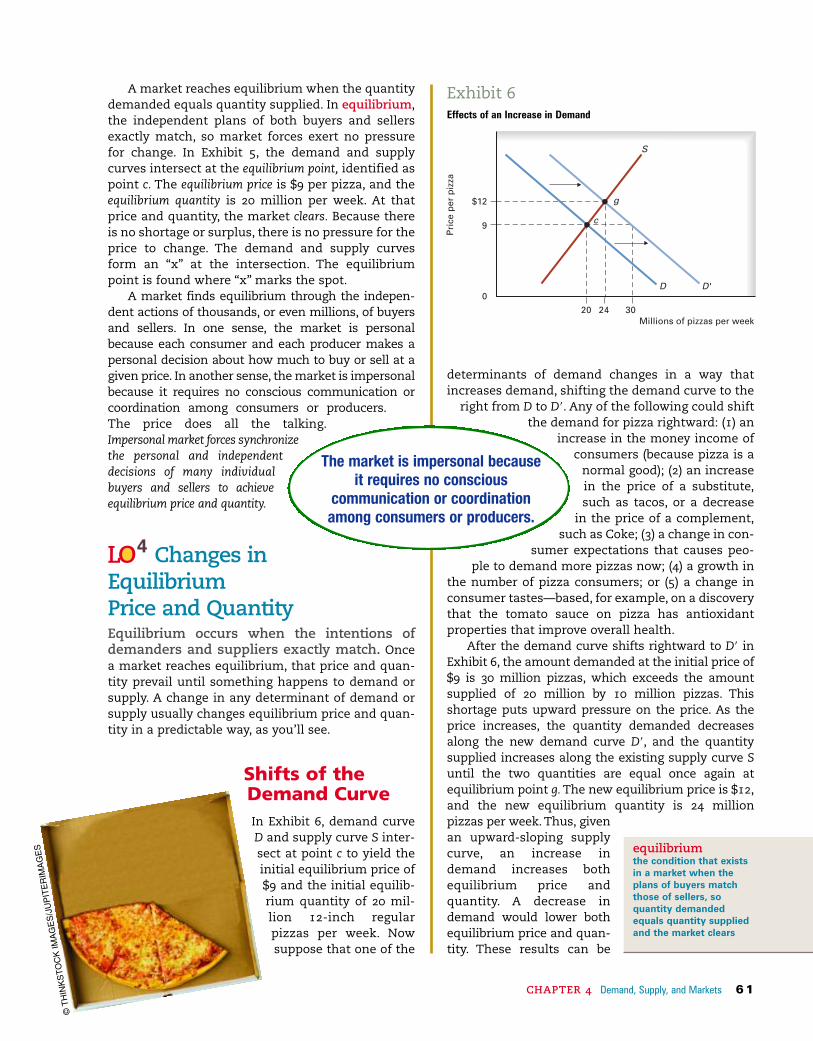
determinants of demand changes in a way thatincreases demand, shifting the demand curve to the
right from D to D9. Any of the following could shiftthe demand for pizza rightward: (1) an
increase in the money income ofconsumers (because pizza is a
normal good); (2) an increasein the price of a substitute,such as tacos, or a decrease
in the price of a complement,such as Coke; (3) a change in con-
sumer expectations that causes peo-ple to demand more pizzas now; (4) a growth in
the number of pizza consumers; or (5) a change inconsumer tastes—based, for example, on a discoverythat the tomato sauce on pizza has antioxidantproperties that improve overall health.
After the demand curve shifts rightward to D9 inExhibit 6, the amount demanded at the initial price of$9 is 30 million pizzas, which exceeds the amountsupplied of 20 million by 10 million pizzas. Thisshortage puts upward pressure on the price. As theprice increases, the quantity demanded decreasesalong the new demand curve D9, and the quantitysupplied increases along the existing supply curve Suntil the two quantities are equal once again atequilibrium point g. The new equilibrium price is $12,and the new equilibrium quantity is 24 million pizzas per week. Thus, givenan upward-sloping supplycurve, an increase indemand increases bothequilibrium price andquantity. A decrease indemand would lower bothequilibrium price and quan-tity. These results can be
A market reaches equilibrium when the quantitydemanded equals quantity supplied. In equilibrium,the independent plans of both buyers and sellersexactly match, so market forces exert no pressurefor change. In Exhibit 5, the demand and supplycurves intersect at the equilibrium point, identified aspoint c. The equilibrium price is $9 per pizza, and theequilibrium quantity is 20 million per week. At thatprice and quantity, the market clears. Because thereis no shortage or surplus, there is no pressure for theprice to change. The demand and supply curvesform an “x” at the intersection. The equilibriumpoint is found where “x” marks the spot.
A market finds equilibrium through the indepen-dent actions of thousands, or even millions, of buyersand sellers. In one sense, the market is personalbecause each consumer and each producer makes apersonal decision about how much to buy or sell at agiven price. In another sense, the market is impersonalbecause it requires no conscious communication orcoordination among consumers or producers.The price does all the talking.Impersonal market forces synchronizethe personal and independentdecisions of many individualbuyers and sellers to achieveequilibrium price and quantity.
Changes inEquilibrium Price and QuantityEquilibrium occurs when the intentions ofdemanders and suppliers exactly match. Oncea market reaches equilibrium, that price and quan-tity prevail until something happens to demand orsupply. A change in any determinant of demand orsupply usually changes equilibrium price and quan-tity in a predictable way, as you’ll see.
Shifts of theDemand CurveIn Exhibit 6, demand curveD and supply curve S inter-sect at point c to yield theinitial equilibrium price of$9 and the initial equilib-rium quantity of 20 mil-lion 12-inch regularpizzas per week. Nowsuppose that one of the
equilibriumthe condition that existsin a market when theplans of buyers matchthose of sellers, soquantity demandedequals quantity suppliedand the market clears
20 24 30 Millions of pizzas per week
Pri
cep
erp
izza
$12
9
0
S
D 'D
g
c
Exhibit 6Effects of an Increase in Demand
The market is impersonal becauseit requires no conscious
communication or coordinationamong consumers or producers.
©T
HIN
KS
TO
CK
IMA
GE
S/J
UP
ITE
RIM
AG
ES
LO 4

SimultaneousShifts ofDemand andSupply CurvesAs long as only one curveshifts, we can say for surehow equilibrium price andquantity will change. If bothcurves shift, however, theoutcome is less obvious. Forexample, suppose bothdemand and supply increase,or shift rightward, as in Exhibit 8. Note that in panel(a), demand shifts more than supply, and in panel (b), supply shifts more than demand. In both panels,equilibrium quantity increases. The change in equi-librium price, however, depends on which curve shiftsmore. If demand shifts more, as in panel (a), equilib-rium price increases. For example, between 1995 and
summarized as follows: Given an upward-sloping supplycurve, a rightward shift of the demand curve increases bothequilibrium price and quantity and a leftward shiftdecreases both equilibrium price and quantity.
Shifts of the Supply CurveLet’s consider shifts of the supply curve. In Exhibit 7,as before, we begin with demand curve D and supplycurve S intersecting at point c to yield an equilibriumprice of $9 and an equilibrium quantity of 20 millionpizzas per week. Suppose one of the determinants ofsupply changes, increasing supply from S to S9.Changes that could shift the supply curve rightwardinclude (1) a technological breakthrough in pizzaovens; (2) a reduction in the price of a relevantresource, such as mozzarella cheese; (3) a decline inthe price of an alternative good, such as Italianbread; (4) a change in expectations that encouragespizza makers to expand production now; or (5) anincrease in the number of pizzerias.
After the supply curve shifts rightward in Exhibit 7,the amount supplied at the initial price of $9 increasesfrom 20 million to 30 million, so producers now supply10 million more pizzas than consumers demand. Thissurplus forces the price down. As the price falls, thequantity supplied declines along the new supply curvebut the quantity demanded increases along the exist-ing demand curve until a new equilibrium point d isestablished. The new equilibrium price is $6, and thenew equilibrium quantity is 26 million pizzas perweek. In short, an increase in supply reduces the priceand increases the quantity. On the other hand, adecrease in supply increases the price but decreasesthe quantity. Thus, given a downward-sloping demandcurve, a rightward shift of the supply curve decreases pricebut increases quantity, and a leftward shift increases pricebut decreases quantity.
20 26 30 Millions of pizzas per week
Pri
cep
erp
izza
$9
6
0
S
D
c
d
S'
Exhibit 7Effects of an Increase in Supply
p'
p
0
Pri
ce
Q Q' Units per period
S S'
D'
D
(a) Shift of demand dominates
a
b
Exhibit 8Indeterminate Effect of an Increase in Both Demand and Supply
pp"
Pri
ce
Q Q" Units per period
U
DD"
S S"
(b) Shift of supply dominates
(
0
ac
©T
HIN
KS
TO
CK
IMA
GE
S/J
UP
ITE
RIM
AG
ES
6 2 PART 1 Introduction to Economics
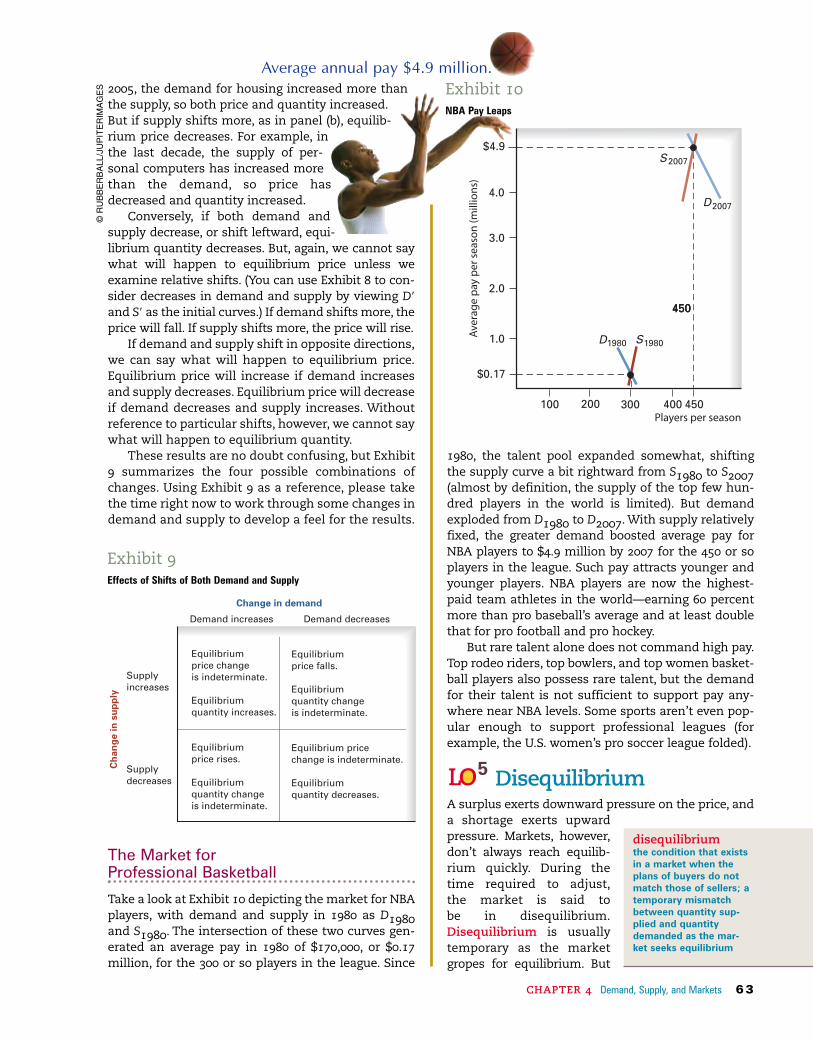
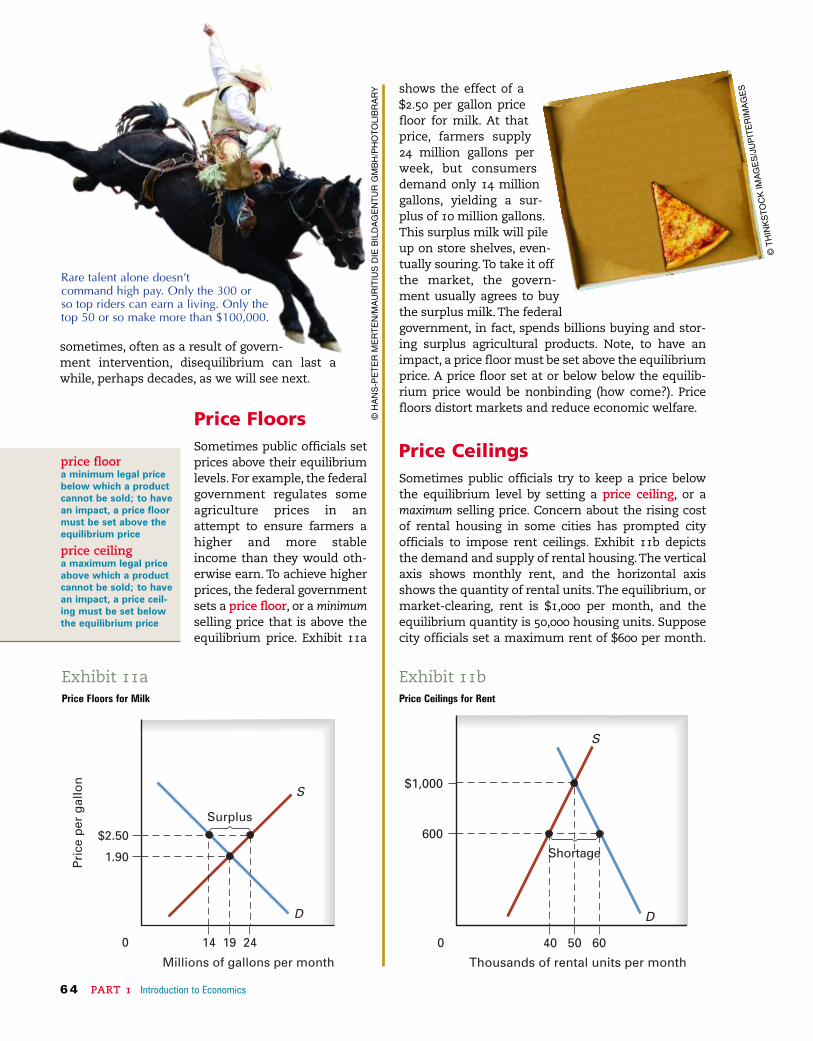
1980, the talent pool expanded somewhat, shiftingthe supply curve a bit rightward from S1980 to S2007(almost by definition, the supply of the top few hun-dred players in the world is limited). But demandexploded from D1980 to D2007. With supply relativelyfixed, the greater demand boosted average pay forNBA players to $4.9 million by 2007 for the 450 or soplayers in the league. Such pay attracts younger andyounger players. NBA players are now the highest-paid team athletes in the world—earning 60 percentmore than pro baseball’s average and at least doublethat for pro football and pro hockey.
But rare talent alone does not command high pay.Top rodeo riders, top bowlers, and top women basket-ball players also possess rare talent, but the demandfor their talent is not sufficient to support pay any-where near NBA levels. Some sports aren’t even pop-ular enough to support professional leagues (forexample, the U.S. women’s pro soccer league folded).
DisequilibriumA surplus exerts downward pressure on the price, and a shortage exerts upwardpressure. Markets, however,don’t always reach equilib-rium quickly. During thetime required to adjust,the market is said to be in disequilibrium.Disequilibrium is usuallytemporary as the marketgropes for equilibrium. But
2005, the demand for housing increased more thanthe supply, so both price and quantity increased.But if supply shifts more, as in panel (b), equilib-rium price decreases. For example, inthe last decade, the supply of per-sonal computers has increased morethan the demand, so price hasdecreased and quantity increased.
Conversely, if both demand andsupply decrease, or shift leftward, equi-librium quantity decreases. But, again, we cannot saywhat will happen to equilibrium price unless weexamine relative shifts. (You can use Exhibit 8 to con-sider decreases in demand and supply by viewing D9
and S9 as the initial curves.) If demand shifts more, theprice will fall. If supply shifts more, the price will rise.
If demand and supply shift in opposite directions,we can say what will happen to equilibrium price.Equilibrium price will increase if demand increasesand supply decreases. Equilibrium price will decreaseif demand decreases and supply increases. Withoutreference to particular shifts, however, we cannot saywhat will happen to equilibrium quantity.
These results are no doubt confusing, but Exhibit9 summarizes the four possible combinations ofchanges. Using Exhibit 9 as a reference, please takethe time right now to work through some changes indemand and supply to develop a feel for the results.
The Market for Professional Basketball
Take a look at Exhibit 10 depicting the market for NBAplayers, with demand and supply in 1980 as D1980and S1980. The intersection of these two curves gen-erated an average pay in 1980 of $170,000, or $0.17million, for the 300 or so players in the league. Since
Supply increases
Supply decreases
Demand increases Demand decreases
Change in demand
Ch
ang
ein
sup
ply
Equilibrium price change is indeterminate. Equilibrium quantity increases.
Equilibrium price rises. Equilibrium quantity change is indeterminate.
Equilibrium price falls. Equilibrium quantity change is indeterminate.
Equilibrium price change is indeterminate. Equilibrium quantity decreases.
Exhibit 9Effects of Shifts of Both Demand and Supply
©R
UB
BE
RB
ALL
/JU
PIT
ER
IMA
GE
S
disequilibriumthe condition that existsin a market when theplans of buyers do notmatch those of sellers; atemporary mismatchbetween quantity sup-plied and quantitydemanded as the mar-ket seeks equilibrium
CHAPTER 4 Demand, Supply, and Markets 6 3
450
1980 1980D S
$4.92007
2007D
S
450450450
300
$0.17
Players per season
Ave
rag
ep
ayp
erse
aso
n(m
illio
ns)
200100 400
4.0
3.0
2.0
1.0
Exhibit 10NBA Pay Leaps
Average annual pay $4.9 million.
LO 5
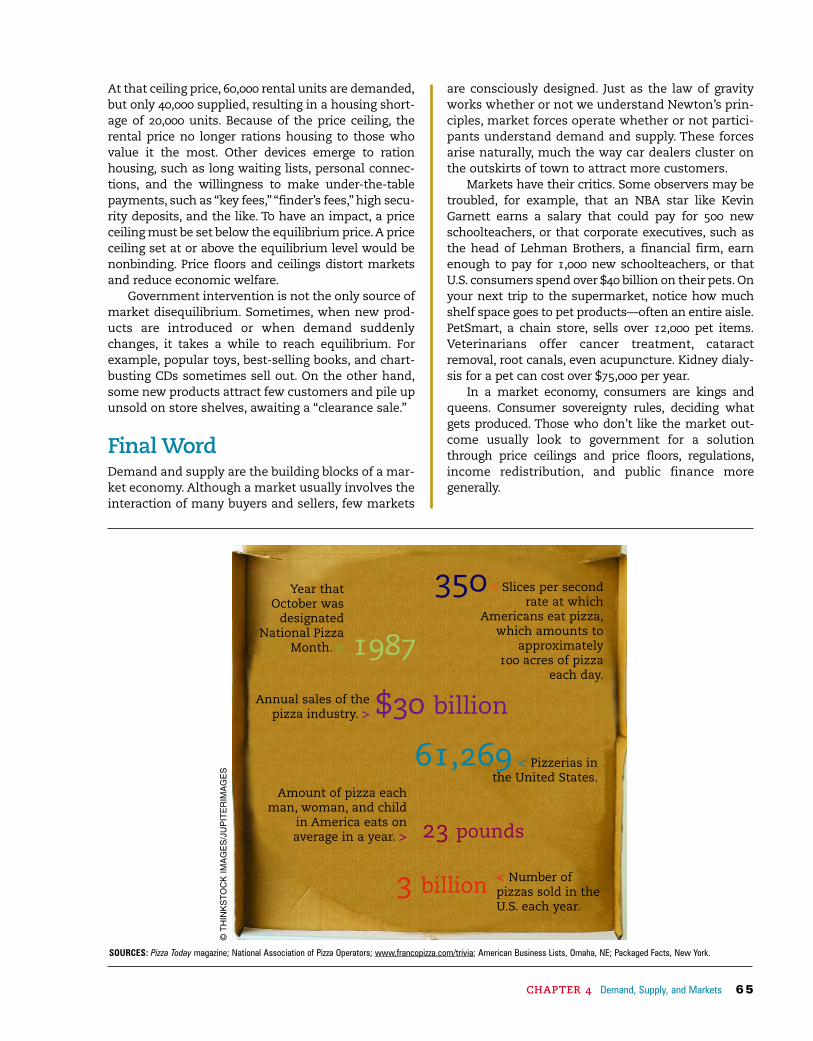
shows the effect of a$2.50 per gallon pricefloor for milk. At thatprice, farmers supply24 million gallons perweek, but consumersdemand only 14 milliongallons, yielding a sur-plus of 10 million gallons.This surplus milk will pileup on store shelves, even-tually souring. To take it offthe market, the govern-ment usually agrees to buythe surplus milk. The federalgovernment, in fact, spends billions buying and stor-ing surplus agricultural products. Note, to have animpact, a price floor must be set above the equilibriumprice. A price floor set at or below below the equilib-rium price would be nonbinding (how come?). Pricefloors distort markets and reduce economic welfare.
Price CeilingsSometimes public officials try to keep a price belowthe equilibrium level by setting a price ceiling, or amaximum selling price. Concern about the rising costof rental housing in some cities has prompted cityofficials to impose rent ceilings. Exhibit 11b depictsthe demand and supply of rental housing.The verticalaxis shows monthly rent, and the horizontal axisshows the quantity of rental units.The equilibrium, ormarket-clearing, rent is $1,000 per month, and theequilibrium quantity is 50,000 housing units. Supposecity officials set a maximum rent of $600 per month.
sometimes, often as a result of govern-ment intervention, disequilibrium can last awhile, perhaps decades, as we will see next.
Price FloorsSometimes public officials setprices above their equilibriumlevels. For example, the federalgovernment regulates someagriculture prices in anattempt to ensure farmers ahigher and more stableincome than they would oth-erwise earn. To achieve higherprices, the federal governmentsets a price floor, or a minimumselling price that is above theequilibrium price. Exhibit 11a
price floora minimum legal pricebelow which a productcannot be sold; to havean impact, a price floormust be set above theequilibrium price
price ceilinga maximum legal priceabove which a productcannot be sold; to havean impact, a price ceil-ing must be set belowthe equilibrium price
$2.50
Pri
cep
erg
allo
n
14 19 24
S
D
Millions of gallons per month
Surplus
S1.90
0
Exhibit 11aPrice Floors for Milk
$1,000
600
M
40 50 60
D
S
Shortage
Thousands of rental units per month
(
0
Exhibit 11bPrice Ceilings for Rent
©T
HIN
KS
TO
CK
IMA
GE
S/J
UP
ITE
RIM
AG
ES
©H
AN
S-P
ET
ER
ME
RT
EN
/MA
UR
ITIU
SD
IEB
ILD
AG
EN
TU
RG
MB
H/P
HO
TO
LIB
RA
RY
Rare talent alone doesn’t command high pay. Only the 300 or so top riders can earn a living. Only the top 50 or so make more than $100,000.
6 4 PART 1 Introduction to Economics
CHAPTER 4 Demand, Supply, and Markets 6 5
are consciously designed. Just as the law of gravityworks whether or not we understand Newton’s prin-ciples, market forces operate whether or not partici-pants understand demand and supply. These forcesarise naturally, much the way car dealers cluster onthe outskirts of town to attract more customers.
Markets have their critics. Some observers may betroubled, for example, that an NBA star like KevinGarnett earns a salary that could pay for 500 newschoolteachers, or that corporate executives, such asthe head of Lehman Brothers, a financial firm, earnenough to pay for 1,000 new schoolteachers, or thatU.S. consumers spend over $40 billion on their pets. Onyour next trip to the supermarket, notice how muchshelf space goes to pet products—often an entire aisle.PetSmart, a chain store, sells over 12,000 pet items.Veterinarians offer cancer treatment, cataractremoval, root canals, even acupuncture. Kidney dialy-sis for a pet can cost over $75,000 per year.
In a market economy, consumers are kings andqueens. Consumer sovereignty rules, deciding whatgets produced. Those who don’t like the market out-come usually look to government for a solutionthrough price ceilings and price floors, regulations,income redistribution, and public finance moregenerally.
At that ceiling price, 60,000 rental units are demanded,but only 40,000 supplied, resulting in a housing short-age of 20,000 units. Because of the price ceiling, therental price no longer rations housing to those whovalue it the most. Other devices emerge to rationhousing, such as long waiting lists, personal connec-tions, and the willingness to make under-the-tablepayments, such as “key fees,”“finder’s fees,” high secu-rity deposits, and the like. To have an impact, a priceceiling must be set below the equilibrium price.A priceceiling set at or above the equilibrium level would benonbinding. Price floors and ceilings distort marketsand reduce economic welfare.
Government intervention is not the only source ofmarket disequilibrium. Sometimes, when new prod-ucts are introduced or when demand suddenlychanges, it takes a while to reach equilibrium. Forexample, popular toys, best-selling books, and chart-busting CDs sometimes sell out. On the other hand,some new products attract few customers and pile upunsold on store shelves, awaiting a “clearance sale.”
Final WordDemand and supply are the building blocks of a mar-ket economy. Although a market usually involves theinteraction of many buyers and sellers, few markets
©T
HIN
KS
TO
CK
IMA
GE
S/J
UP
ITE
RIM
AG
ES
SOURCES: Pizza Today magazine; National Association of Pizza Operators; www.francopizza.com/trivia; American Business Lists, Omaha, NE; Packaged Facts, New York.
Year thatOctober was
designatedNational Pizza
Month. > 1987
< Slices per secondrate at which
Americans eat pizza,which amounts to
approximately 100 acres of pizza
each day.
350
Annual sales of thepizza industry. > $30 billion
Amount of pizza eachman, woman, and child
in America eats on average in a year. > 23 pounds
< Pizzerias in the United States.
61,269
< Number of pizzas sold in theU.S. each year.
3 billion
Related Documents