ANNUAL REPORT AND ACCOUNTS 2017 DELIVERING TOMORROW’S DIGITAL WORKFORCE

Welcome message from author
This document is posted to help you gain knowledge. Please leave a comment to let me know what you think about it! Share it to your friends and learn new things together.
Transcript
ANNUAL REPORT AND ACCOUNTS
2017
BLU
E P
RIS
M G
RO
UP P
LC A
NN
UA
L REPO
RT A
ND
AC
CO
UN
TS 2
017
DELIVERING TOMORROW’S DIGITAL WORKFORCE
We are Blue Prism
PIONEERS OF ROBOTIC PROCESS AUTOMATION SOFTWAREDelivering the world’s most successful digital workforce
Strategic ReportHighlights of the Year 01
Company Overview 02
Market Overview 10
Chairman’s Statement 12
Chief Executive’s Review 13
Financial Review 18
Principal Risks and Uncertainties 20
GovernanceBoard of Directors 22
Senior Management 24
Corporate Governance Statement 26
Directors’ Report 27
Directors’ Responsibilities 29
Financial StatementsIndependent Auditor’s Report 30
Consolidated Statement of Profit or Loss and Other Comprehensive Income 34
Consolidated Statement of Financial Position 35
Consolidated Statement of Cash Flows 36
Consolidated Statement of Changes in Equity 37
Notes forming part of the Financial Statements 38
Company Statement of Financial Position 54
Company Statement of Cash Flows 55
Company Statement of Changes in Equity 56
Notes to the Company Financial Statements 57
Company Information 59
Blue Prism Group plc ANNUAL REPORT AND ACCOUNTS 2017
01
HIGHLIGHTS OF THE YEAR
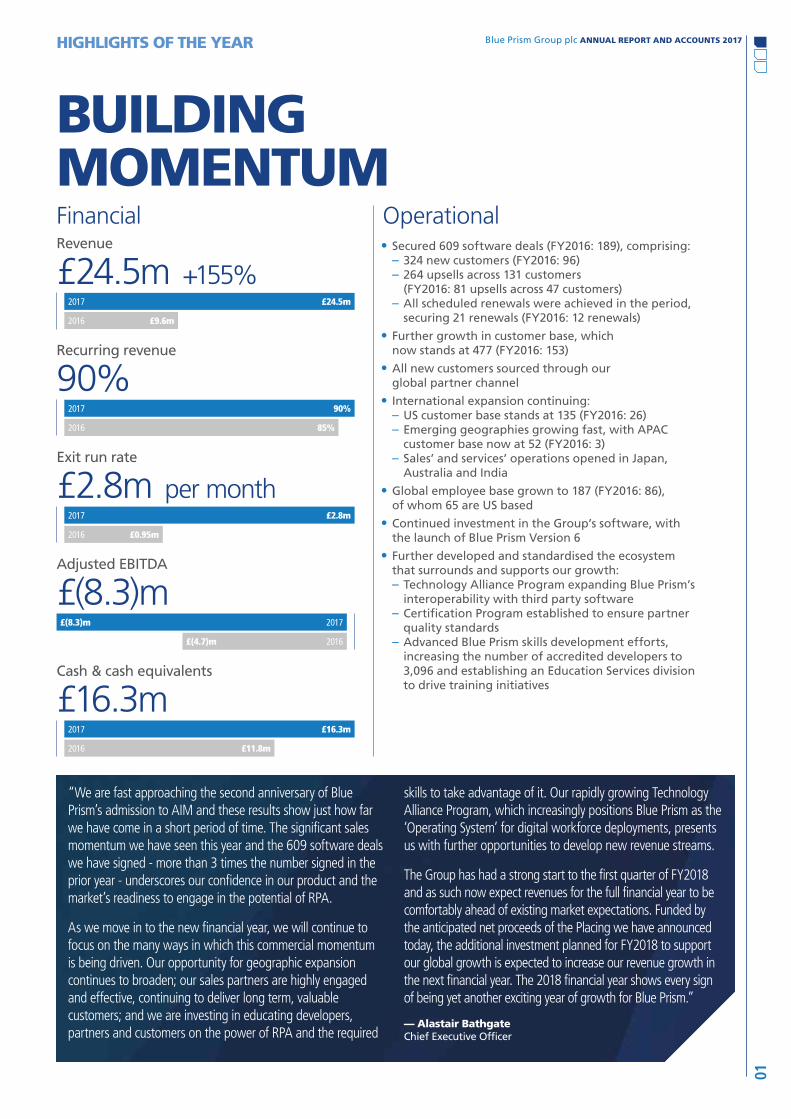
BUILDING MOMENTUMFinancialRevenue
£24.5m +155%2017 £24.5m
2016 £9.6m
Recurring revenue
90%2017 90%
2016 85%
Exit run rate
£2.8m per month2017 £2.8m
2016 £0.95m
Adjusted EBITDA
£(8.3)m£(8.3)m 2017
£(4.7)m 2016
Cash & cash equivalents
£16.3m2017 £16.3m
2016 £11.8m
Operational• Secured 609 software deals (FY2016: 189), comprising:
– 324 new customers (FY2016: 96) – 264 upsells across 131 customers (FY2016: 81 upsells across 47 customers)
– All scheduled renewals were achieved in the period, securing 21 renewals (FY2016: 12 renewals)
• Further growth in customer base, which now stands at 477 (FY2016: 153)
• All new customers sourced through our global partner channel
• International expansion continuing: – US customer base stands at 135 (FY2016: 26) – Emerging geographies growing fast, with APAC customer base now at 52 (FY2016: 3)
– Sales’ and services’ operations opened in Japan, Australia and India
• Global employee base grown to 187 (FY2016: 86), of whom 65 are US based
• Continued investment in the Group’s software, with the launch of Blue Prism Version 6
• Further developed and standardised the ecosystem that surrounds and supports our growth: – Technology Alliance Program expanding Blue Prism’s interoperability with third party software
– Certification Program established to ensure partner quality standards
– Advanced Blue Prism skills development efforts, increasing the number of accredited developers to 3,096 and establishing an Education Services division to drive training initiatives
“We are fast approaching the second anniversary of Blue Prism’s admission to AIM and these results show just how far we have come in a short period of time. The significant sales momentum we have seen this year and the 609 software deals we have signed - more than 3 times the number signed in the prior year - underscores our confidence in our product and the market’s readiness to engage in the potential of RPA.
As we move in to the new financial year, we will continue to focus on the many ways in which this commercial momentum is being driven. Our opportunity for geographic expansion continues to broaden; our sales partners are highly engaged and effective, continuing to deliver long term, valuable customers; and we are investing in educating developers, partners and customers on the power of RPA and the required
skills to take advantage of it. Our rapidly growing Technology Alliance Program, which increasingly positions Blue Prism as the ‘Operating System’ for digital workforce deployments, presents us with further opportunities to develop new revenue streams.
The Group has had a strong start to the first quarter of FY2018 and as such now expect revenues for the full financial year to be comfortably ahead of existing market expectations. Funded by the anticipated net proceeds of the Placing we have announced today, the additional investment planned for FY2018 to support our global growth is expected to increase our revenue growth in the next financial year. The 2018 financial year shows every sign of being yet another exciting year of growth for Blue Prism.”
— Alastair BathgateChief Executive Officer
Blue Prism Group plc ANNUAL REPORT AND ACCOUNTS 2017COMPANY OVERVIEW
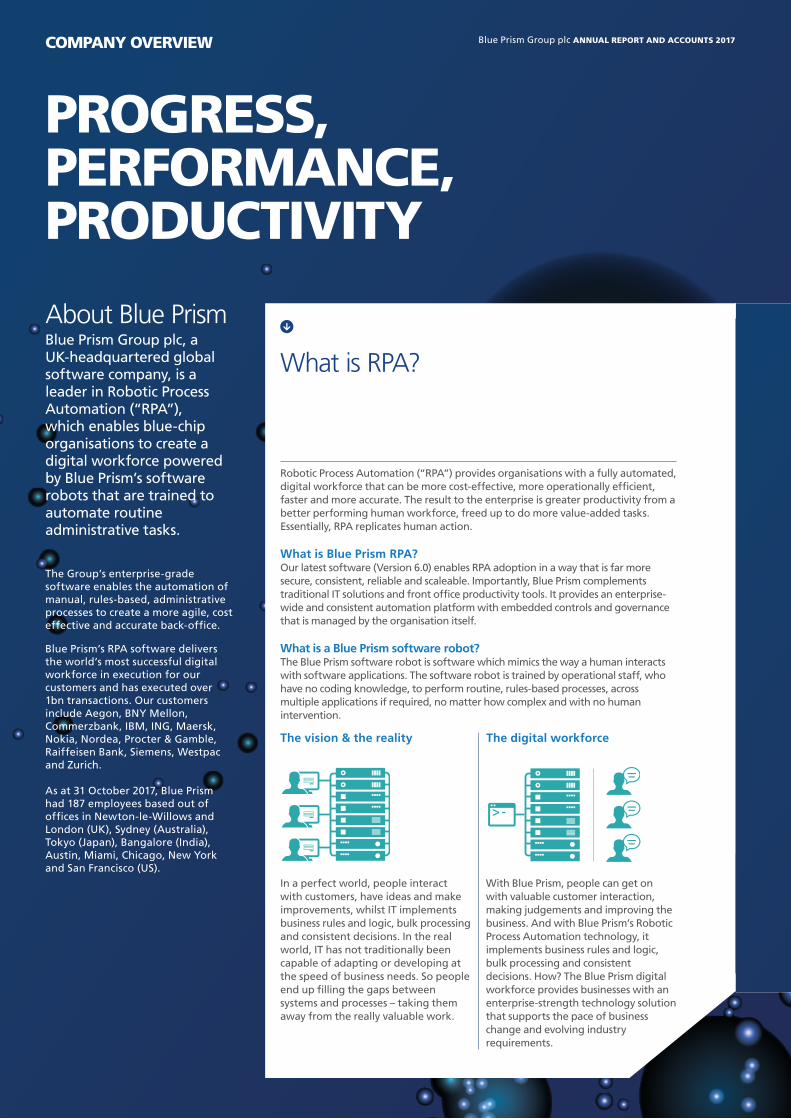
PROGRESS, PERFORMANCE, PRODUCTIVITY
About Blue Prism
The Group’s enterprise-grade software enables the automation of manual, rules-based, administrative processes to create a more agile, cost effective and accurate back-office.
Blue Prism’s RPA software delivers the world’s most successful digital workforce in execution for our customers and has executed over 1bn transactions. Our customers include Aegon, BNY Mellon, Commerzbank, IBM, ING, Maersk, Nokia, Nordea, Procter & Gamble, Raiffeisen Bank, Siemens, Westpac and Zurich.
As at 31 October 2017, Blue Prism had 187 employees based out of offices in Newton-le-Willows and London (UK), Sydney (Australia), Tokyo (Japan), Bangalore (India), Austin, Miami, Chicago, New York and San Francisco (US).
What is RPA?
In a perfect world, people interact with customers, have ideas and make improvements, whilst IT implements business rules and logic, bulk processing and consistent decisions. In the real world, IT has not traditionally been capable of adapting or developing at the speed of business needs. So people end up filling the gaps between systems and processes – taking them away from the really valuable work.
With Blue Prism, people can get on with valuable customer interaction, making judgements and improving the business. And with Blue Prism’s Robotic Process Automation technology, it implements business rules and logic, bulk processing and consistent decisions. How? The Blue Prism digital workforce provides businesses with an enterprise-strength technology solution that supports the pace of business change and evolving industry requirements.
The vision & the reality The digital workforce
Blue Prism Group plc, a UK-headquartered global software company, is a leader in Robotic Process Automation (“RPA”), which enables blue-chip organisations to create a digital workforce powered by Blue Prism’s software robots that are trained to automate routine administrative tasks.
Robotic Process Automation (“RPA”) provides organisations with a fully automated, digital workforce that can be more cost-effective, more operationally efficient, faster and more accurate. The result to the enterprise is greater productivity from a better performing human workforce, freed up to do more value-added tasks. Essentially, RPA replicates human action.
What is Blue Prism RPA?Our latest software (Version 6.0) enables RPA adoption in a way that is far more secure, consistent, reliable and scaleable. Importantly, Blue Prism complements traditional IT solutions and front office productivity tools. It provides an enterprise-wide and consistent automation platform with embedded controls and governance that is managed by the organisation itself.
What is a Blue Prism software robot?The Blue Prism software robot is software which mimics the way a human interacts with software applications. The software robot is trained by operational staff, who have no coding knowledge, to perform routine, rules-based processes, across multiple applications if required, no matter how complex and with no human intervention.
Blue Prism Group plc ANNUAL REPORT AND ACCOUNTS 2017
02 –
03
Turn to page 04 to see who has benefited from our software
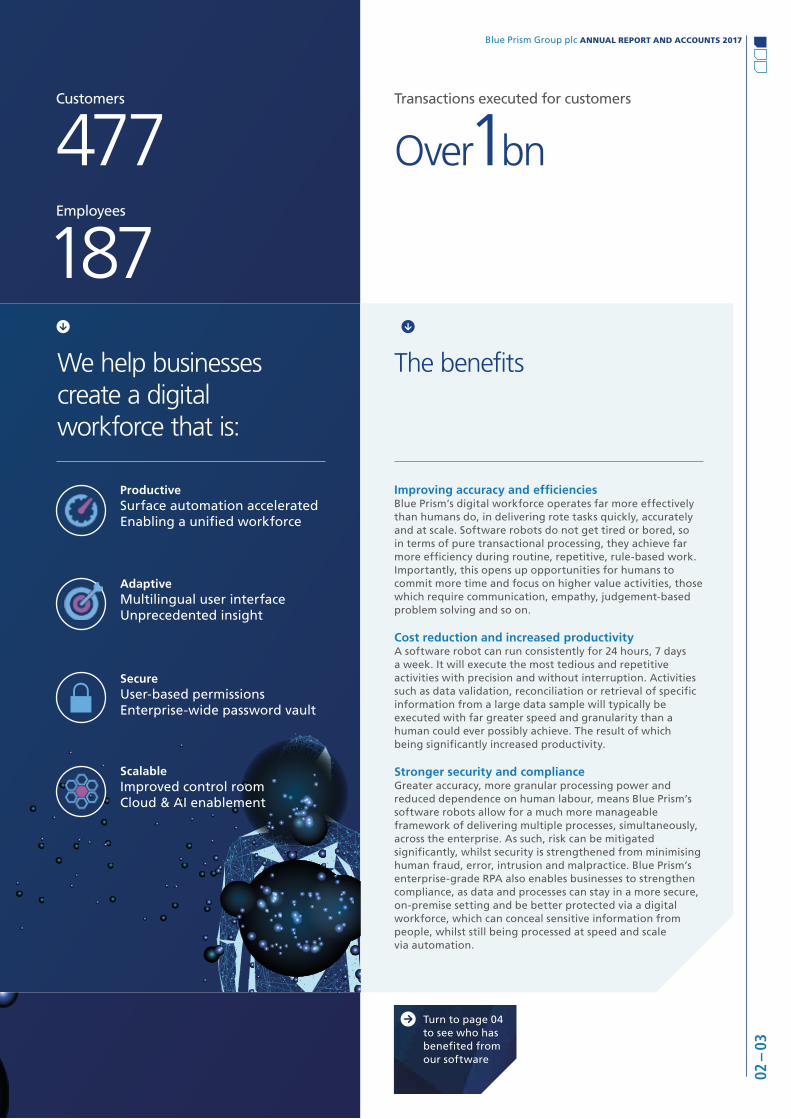
The benefits
Improving accuracy and efficienciesBlue Prism’s digital workforce operates far more effectively than humans do, in delivering rote tasks quickly, accurately and at scale. Software robots do not get tired or bored, so in terms of pure transactional processing, they achieve far more efficiency during routine, repetitive, rule-based work. Importantly, this opens up opportunities for humans to commit more time and focus on higher value activities, those which require communication, empathy, judgement-based problem solving and so on.
Cost reduction and increased productivityA software robot can run consistently for 24 hours, 7 days a week. It will execute the most tedious and repetitive activities with precision and without interruption. Activities such as data validation, reconciliation or retrieval of specific information from a large data sample will typically be executed with far greater speed and granularity than a human could ever possibly achieve. The result of which being significantly increased productivity.
Stronger security and complianceGreater accuracy, more granular processing power and reduced dependence on human labour, means Blue Prism’s software robots allow for a much more manageable framework of delivering multiple processes, simultaneously, across the enterprise. As such, risk can be mitigated significantly, whilst security is strengthened from minimising human fraud, error, intrusion and malpractice. Blue Prism’s enterprise-grade RPA also enables businesses to strengthen compliance, as data and processes can stay in a more secure, on-premise setting and be better protected via a digital workforce, which can conceal sensitive information from people, whilst still being processed at speed and scale via automation.
We help businesses create a digital workforce that is:
SecureUser-based permissions Enterprise-wide password vault
ScalableImproved control roomCloud & AI enablement
AdaptiveMultilingual user interfaceUnprecedented insight
ProductiveSurface automation acceleratedEnabling a unified workforce
Customers
477Employees
187
Transactions executed for customers
Over 1bn

Blue Prism Group plc ANNUAL REPORT AND ACCOUNTS 2017COMPANY OVERVIEW
04 –
05
Blue Prism Group plc ANNUAL REPORT AND ACCOUNTS 2017
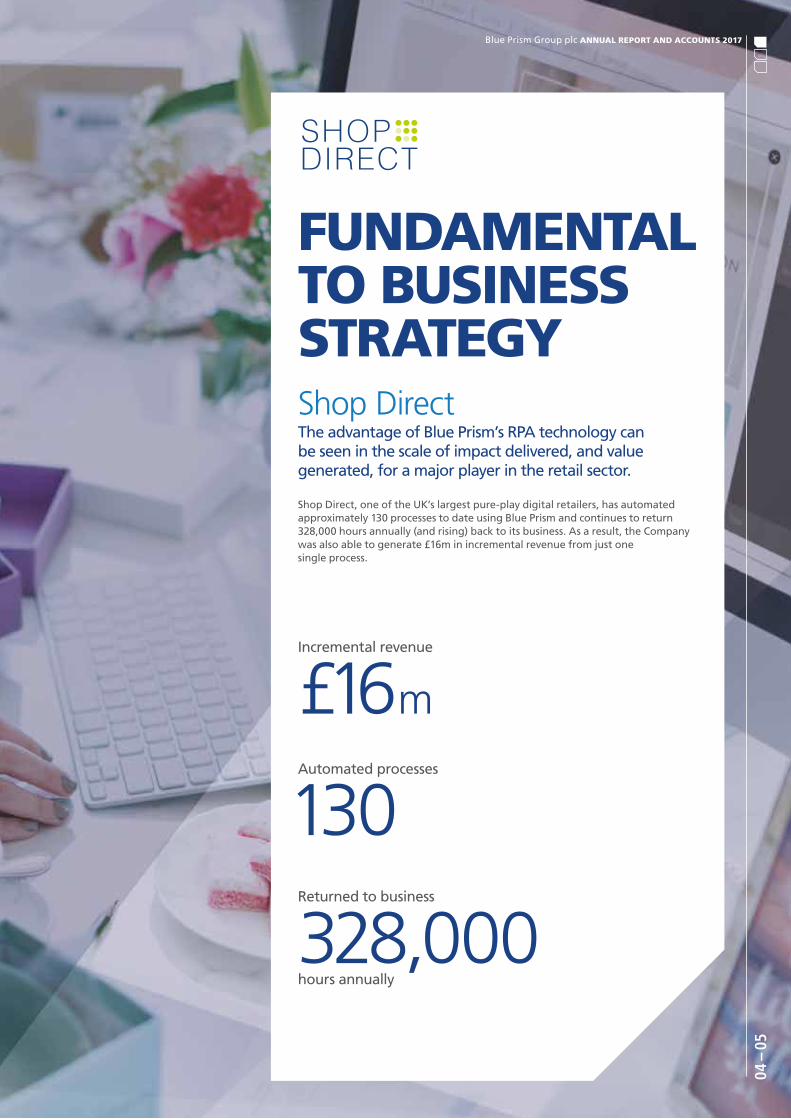
Shop DirectThe advantage of Blue Prism’s RPA technology can be seen in the scale of impact delivered, and value generated, for a major player in the retail sector.
Shop Direct, one of the UK’s largest pure-play digital retailers, has automated approximately 130 processes to date using Blue Prism and continues to return 328,000 hours annually (and rising) back to its business. As a result, the Company was also able to generate £16m in incremental revenue from just one single process.
FUNDAMENTAL TO BUSINESS STRATEGY
Incremental revenue
£16mAutomated processes
130Returned to business
328,000hours annually
Blue Prism Group plc ANNUAL REPORT AND ACCOUNTS 2017
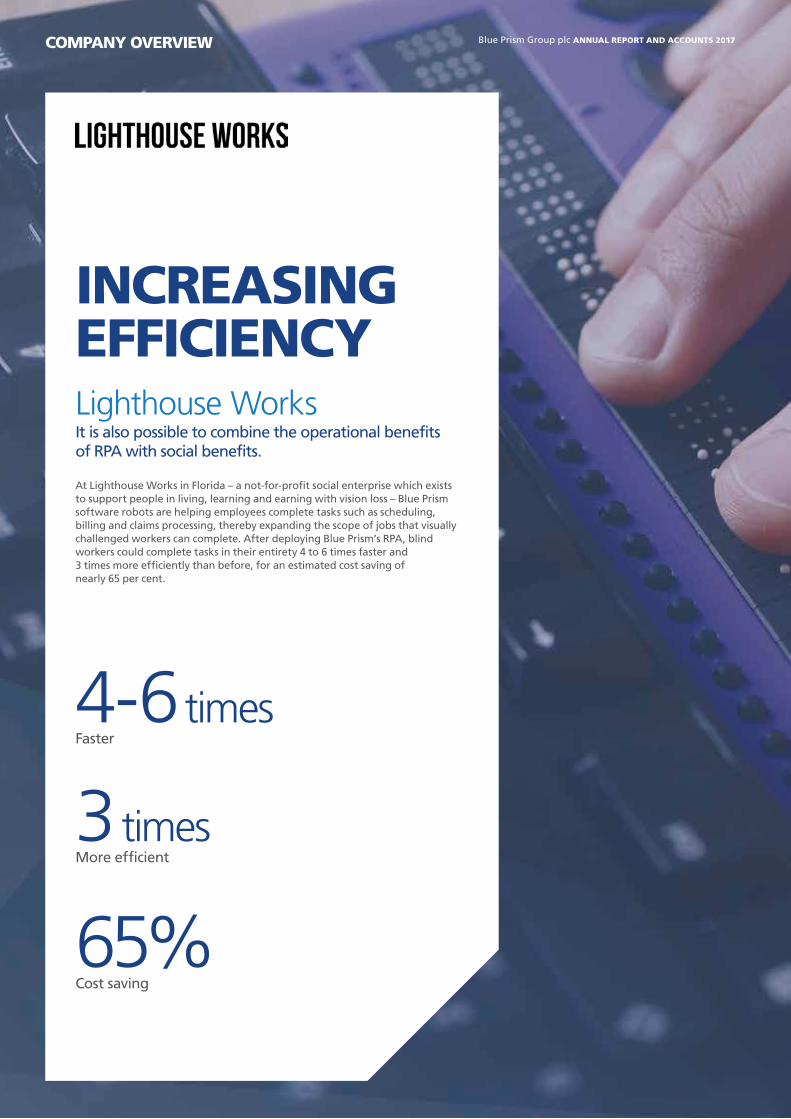
Lighthouse WorksIt is also possible to combine the operational benefits of RPA with social benefits.
At Lighthouse Works in Florida – a not-for-profit social enterprise which exists to support people in living, learning and earning with vision loss – Blue Prism software robots are helping employees complete tasks such as scheduling, billing and claims processing, thereby expanding the scope of jobs that visually challenged workers can complete. After deploying Blue Prism’s RPA, blind workers could complete tasks in their entirety 4 to 6 times faster and 3 times more efficiently than before, for an estimated cost saving of nearly 65 per cent.
COMPANY OVERVIEW
INCREASING EFFICIENCY
4-6 timesFaster
3 timesMore efficient
65%Cost saving

06 –
07
Blue Prism Group plc ANNUAL REPORT AND ACCOUNTS 2017

Blue Prism Group plc ANNUAL REPORT AND ACCOUNTS 2017COMPANY OVERVIEW
08 –
09
Blue Prism Group plc ANNUAL REPORT AND ACCOUNTS 2017
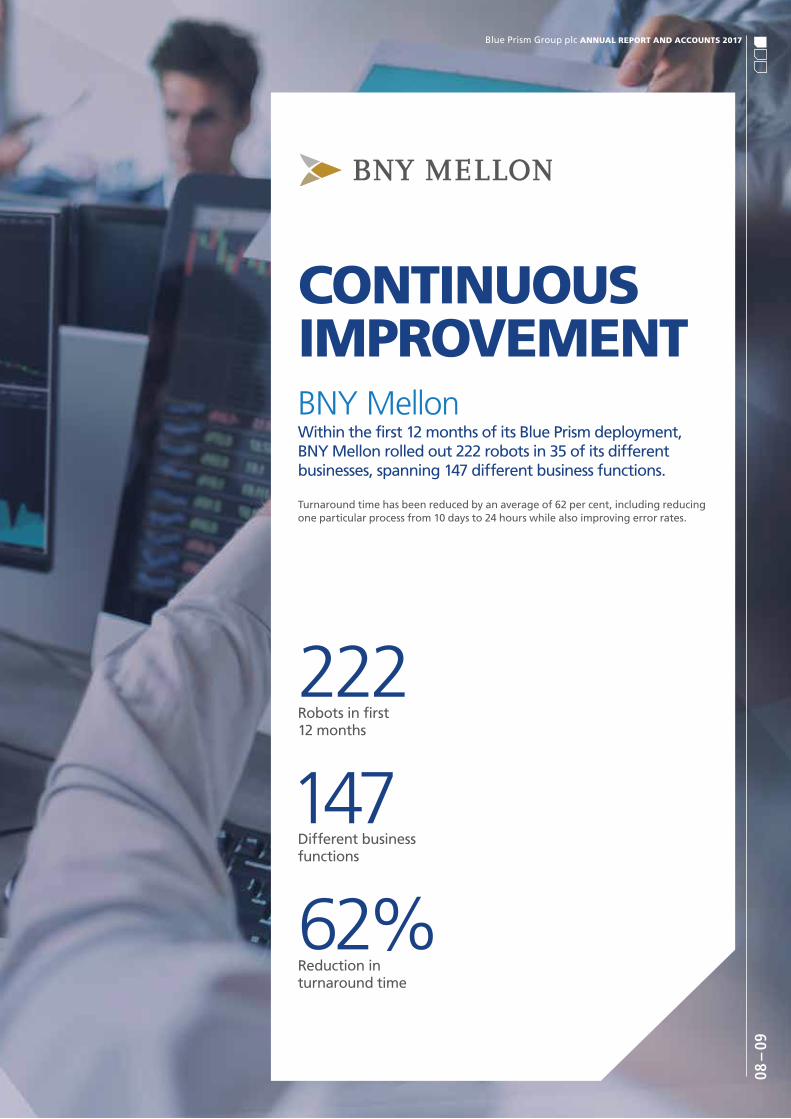
BNY MellonWithin the first 12 months of its Blue Prism deployment, BNY Mellon rolled out 222 robots in 35 of its different businesses, spanning 147 different business functions.
Turnaround time has been reduced by an average of 62 per cent, including reducing one particular process from 10 days to 24 hours while also improving error rates.
CONTINUOUS IMPROVEMENT
222Robots in first 12 months
Different business functions
62%Reduction in turnaround time
147
Blue Prism Group plc ANNUAL REPORT AND ACCOUNTS 2017MARKET OVERVIEW
DELIVERING TOMORROW’S DIGITAL WORKFORCE WORLDWIDEWe believe that the combination of intelligent automation targeted at transformational change, supported by technical partners and a robust methodology is appealing to both our distribution partners and our customers, and along with our public status and strengthened balance sheet, sets us apart from other RPA vendors.
MARKET REVIEWSupported by Board level conversations between global consulting firms and their clients, Intelligent Automation, the digital enterprise, robotics and the future of work are all themes that RPA plays well to, and this is driving the market into global expansion. As today’s major organisations look to find new ways of interacting with their customers, it is becoming clear that RPA can become a transformational enabler to the digital enterprise and not just a tactical automation tool focused on cost reduction.
This is reinforced by increasing media and analyst attention. For example, in November, the primary product category search terms on Gartner Inc’s website, a leading technology research and advisory firm, were Cloud, Internet of Things, Blockchain and RPA.
Blue Prism has helped shape the growth in media, analyst and industry awareness of RPA throughout the year, and endorsement for the RPA market continues to be supported by an increasing number of independent commentators. According to McKinsey*, the introduction and development of business process automation offers returns on investment, in the first year alone, of up to 200 per cent. Such rapid growth and adoption – and the recognition of the value RPA can provide at the enterprise level – stems from an increasing demand at Board level to introduce automation technologies into their business.
Analysts and media continue to point to the scale of opportunity ahead, as enterprises look to RPA to automate legacy business processes at a time when their talent, technology and time resources are constrained.** Industry analysts are starting to make significant forecasts of a large, growing market size for RPA – with one business consulting and market research firm forecasting the RPA market to reach up to $8.75bn by 2024*** – and we can see already the demand from growing levels of interest.
COMPETING IN THE MARKET PLACEAgainst an increasingly positive wider market, Blue Prism continues to emerge as an important thought leader in the market for RPA. We were 1 of only 2 British companies, and the only RPA vendor, to feature in Massachusetts Institute of Technology (“MIT") Technology Review’s 50 Smartest Companies of 2017. We continue to grow and deepen our partnerships with global consulting and implementation firms who, with us, are working to make customer engagement with RPA increasingly transformational. We also partner with niche and specialised players with a specific geographic, industry or functional focus who make a valuable contribution to our revenue mix.
Although the US remains a key priority strategically, we have opened offices in Australia, Japan and India resulting in encouraging early revenues in the Asia Pacific region. Japan is the world’s third largest
* Source: McKinsey, http://bit.ly/2ABnkLW ** Source: CIO.com, http://bit.ly/2iT5j3Z *** Source: GVR, http://bit.ly/2BrkRYs
Blue Prism Group plc ANNUAL REPORT AND ACCOUNTS 2017
10 –
11
economy. It has one of the worst demographic “time-bombs” of the developed world with many baby-boomers already moving into retirement. The workforce is shrinking and production must be maintained. Japan is culturally pre-disposed towards automation, based on positive experience in manufacturing (especially robotics in automotive) and the high value its society places culturally on the quality of products and relationships. Japan is in the earliest stages of RPA adoption and Blue Prism is quickly building a presence there with key customer wins including Dai-ichi Life and DeNa via partners including Accenture, EY, RPA Technologies and Deloitte.
We have plans for further geographic expansion in FY2018 in the Americas, localisation and specialisation in Europe, and entering new areas of the Asia Pacific region.
As with any growth market, there is healthy competition. Industry analysts such as Forrester and HfS Research continue to highlight UIPath and Automation Anywhere alongside Blue Prism as the three leaders in the market.
Against that competition, Blue Prism continues to differentiate on enterprise scale, security, performance and adaptability. We believe competitors will invest not just in distribution, but in product development to directly compete in the enterprise space and we continue to invest in our own software product to maintain its position and to increase its value to the customer. This value arises in a variety of business outcomes, which we reference further down in this report, and in the comfort of knowing the solution is going to meet data security, regulatory compliance, and governance requirements.
In 2017 we released Blue Prism Version 6 which included a number of software enhancements to help internationalise the product, make it easier to use, faster to deploy, more intelligent and responsive. For example, Version 6 now includes:• Intelligent Surface Automation and Adaptive
Positioning Technology to give the robots more sophisticated and flexible “visual” capabilities when reading applications.
• Certified reference architectures for all the main cloud vendors (Microsoft, Amazon, Google, IBM) to offer rapid scale-out and Artificial Intelligence Capabilities.
• Enhanced security and encryption controls that provide greater configurability and flexibility to ensure absolute secure connectivity, data storage and access across an extended range of deployment models.
• Double byte character support to enable international languages, and the ability to translate and localise our own user interface.
• An improved Control Room giving real time visibility of robot activity, health and digital workforce achievements.
Blue Prism Group plc ANNUAL REPORT AND ACCOUNTS 2017CHAIRMAN’S STATEMENT
OVERVIEWSince the flotation of Blue Prism in March 2016 we have seen significant progress in the RPA market and in our business.
There have been advances in the size and visibility of the RPA market and it is clear that RPA as a technology offering is now high on the agenda for many organisations. The growing interest in the market for RPA from new and existing participants is testament to its increasing importance.
Blue Prism is both driving and benefiting from this evolution of the market. In the period, we have seen a significant increase in sales, a substantial growth of our customer base and further strengthening of our market-leading position whilst managing the cost base and cash flow with real discipline.
The executive management has successfully executed the strategy for growth set out at the time of the flotation. Our principal route to market is through our partner channel which is now highly engaged and growing in sophistication and global reach and has contributed enormously to our growth.
THE BOARDThe Board, which was formed just prior to flotation, is functioning well and interacting effectively with the executive management contributing a good balance of skills and experience. Gary Johnson, our Chief Financial Officer (“CFO”) at the time of flotation, has decided to step down from the Board. Gary has made a significant contribution over the past 3 years developing and
strengthening the financial systems to support our expansion and growth. Ijoma Maluza has joined the Board as CFO and will continue to build on the strong platform established by Gary.
While businesses experiencing rapid growth, such as Blue Prism, often face managerial challenges, the Board is fully engaged with the executive management team to ensure that the Group is positioned to address the growth challenge head-on. In particular, ensuring the ongoing recruitment of senior experienced staff with strong track records who can proactively engage in the challenge of building a world-class technology Company.
OUR PEOPLEWithout the energy, commitment and enthusiasm of the Blue Prism employees the rapid growth and financial performance of Blue Prism would not be possible. We thank them for another year of hard work and execution.
OUTLOOKIn the year ahead, we are focused on maintaining our growth momentum. The attractiveness of our market will inevitably encourage competition. However, we believe 2018 will be a year in which we extend and capitalise on the clear lead we have built in the enterprise market for RPA, positioning us to deliver another exciting year of growth.
Jason KingdonNon-Executive Chairman
New customers
324Revenue
+155%
Blue Prism Group plc ANNUAL REPORT AND ACCOUNTS 2017
12 –
13
OVERVIEWFY2017 was a year of global growth and growing commercial momentum. We have seen significant increases in our revenues, customer numbers, geographic coverage and in our skilled developer base. Alongside this, we have doubled our employee base and opened 3 new offices globally. We have also seen significant growth in industry recognition of the RPA sector, and strong, global endorsement of Blue Prism’s leading position in the market.
As our business has developed, so has the market we serve. The RPA market is now advancing beyond the early hype stage and our indirect partner channel continues to grow and diversify in recognition of this shift. This channel was responsible for sourcing all new customers in FY2017 and there was a healthy number of upsells given that two thirds of our customer base joined the roster in FY2017. In addition, all 21 expected renewals in the year were secured.
We are pleased to report that total recognised revenue for the year ended 31 October 2017 increased by 155 per cent to £24.5m (FY2016: £9.6m) driven by sales from both new and existing customers. Sales momentum built throughout the year such that our exit run-rate (monthly recognised, recurring licence revenue) stood on 31 October 2017 at £2.8m per month (FY2016: £0.95m per month): a strong foundation for FY2018 and beyond.
EBITDA losses for the period were £9.4m (FY2016: £5.2m) and adjusted EBITDA losses for the period were £8.3m (FY2016: £4.7m), being EBITDA before share-based payments, foreign exchange gains/(losses) and IPO costs (FY2016), to remove the effect of volatile share-based payments expenses , foreign exchange gains/(losses)and one off IPO costs, both representing continued investment in our global expansion. Cash and cash equivalents at 31 October 2017 were £16.3m (31 October 2016: £11.8m).
CHIEF EXECUTIVE’S REVIEW
Upsells
264Renewal rate
EXECUTING OUR STRATEGYThe Group set out a growth strategy at the time of its IPO based on 4 strategic objectives. During the past 12 months we have continued to make meaningful progress against each, as follows:
BUILDING SCALABLE DEVELOPMENT, SALES AND DELIVERY CHANNELSBlue Prism’s sales strategy is to achieve broad and scalable sales growth through a global channel of distribution partners. This partner sales channel includes a wide range of highly engaged partners, comprising some of the world’s largest consulting firms such as Accenture, EY, IBM, KPMG, Deloitte and HCL as well as specialist technology and digital transformation firms, such as Thoughtonomy, DXC, RPAi, Symphony and Reveal Group. All of the 324 new customers in FY2017 were sourced through the channel for the first time (FY2016: 90 per cent), including an increase in reseller deals.
The Group launched a partner certification programme during the period, designed to maintain the highest levels of quality assurance in our sales and delivery model. 11 partners are now certified and, in March 2017, EY became the first partner to achieve Gold status, followed later in the year by Accenture. As interest in RPA continues to increase, our focus remains to ensure the Group is best equipped to service increasing demand by maximising and optimising this partner distribution channel.
The Group has seen strong levels of industry recognition and community support, as evidenced by the scale of attendance and quality of sponsors at our Blue Prism World events. Almost 2,000 customers and partners attended events in San Francisco, New York, London, Tokyo and Sydney. With premium sponsors including Accenture, EY, Deloitte, KPMG, IBM, and Capgemini, we go into 2018 with the confidence of having leading names in the sectors we serve supporting our long-term vision.
100%
Blue Prism Group plc ANNUAL REPORT AND ACCOUNTS 2017
SAN FRANCISCO � NEW YORK � LONDON � SYDNEY
Event delegates
1,900+
CHIEF EXECUTIVE’S REVIEW CONTINUED
INCREASING BUSINESS WITH THE GROUP’S CUSTOMERSDuring the first 6 months of the year, the Group introduced an account management function to help improve the effectiveness of customer management following the initial sale. This has proven effective in driving increased adoption in the legacy direct accounts. We have been working on rolling this out into the indirect model with early signs of success. In FY2017 the Group secured 264 upsells across 131 customers, a meaningful increase on the 81 upsells secured across 47 customers in the prior financial year. 49 of the 131 customers who upsold during the period upsold more than once with approximately 27 per cent of all customers buying more licences in the period. Renewals of existing licences also continue to be healthy with all 21 of those due in the period secured (FY2016: 12).
These increasing levels of adoption are a result of our customers’ engagement with RPA and the subsequent return on investment they see from increased use of our software.
The Financial Services sector is one of many realising real benefits from RPA. For example, a leading Middle East retail bank is using Blue Prism software robots to process over 15,000 transactions daily, bringing greater operational efficiency, accuracy and speed along with a 70 per cent reduction in fraud. Elsewhere in the sector, within the first 12 months of its Blue Prism deployment, BNY Mellon rolled out 222 robots in 35 of its different businesses, spanning 147 different business functions. Turnaround time has been reduced by an average of 62 per cent, including reducing one particular process from 10 days to 24 hours while also improving error rates.
Blue Prism RPA has also delivered significant business benefits, within just 6 months of deployment, to a leading Fortune 500 financial services provider in the US – with over $3tn of life insurance in force worldwide. Blue Prism’s software robots were deployed to support an enterprise-wide programme of strategic revenue growth, which needed to be deployable at speed and across all its subsidiary businesses and functional areas. Using Blue Prism enabled the organisation to improve customer experience and reduce costs by eliminating an onerous, lengthy re-underwriting backlog. It took just 10 months to put the robotic operating model in place, and since deployment Blue Prism RPA has resulted in a $500,000 one-time cost avoidance and delivered more than $3m savings from run rate cost reductions annually.
In addition to process automation, the value of Blue Prism’s RPA can be realised in its positive impact on customer experience. A leading global payments services provider – which in 2016 completed 791m transactions for its consumer and business clients – needed to improve customer experience whilst expanding automation capabilities throughout the organisation. Automating more than 15 processes to date, Blue Prism delivered end-to-end automation of financial transactions whilst enabling the Company to maintain full regulatory compliance, and with seamless integration with existing infrastructure. It took only half a year to see the returns on investment of using Blue Prism RPA, with $1.3m worth of savings generated in the first 6 months, resulting in a 3.6 times return on the investment in the RPA programme. Employee satisfaction and productivity also increased with 12 FTEs reassigned to more cognitive, value-added tasks, as employee attrition reduced due to the elimination of repetitive and non-value added work.
Similarly, the advantage of Blue Prism’s RPA technology can be seen in the scale of impact delivered, and value generated, for a major player in the retail sector. Shop Direct, one of the UK’s largest pure-play digital retailers, has automated approximately 130 processes to date using Blue Prism and continues to return 328,000 hours annually (and rising) back to its business. As a result, the Company was also able to generate £16m in incremental revenue from just one single process.
It is also possible to combine the operational benefits of RPA with social benefits. At Lighthouse Works in Florida – a not-for-profit social enterprise which exists to support people in living, learning and earning with vision loss – Blue Prism software robots are helping employees complete tasks such as scheduling, billing and claims processing, thereby expanding the scope of jobs that visually challenged workers can complete. After deploying Blue Prism’s RPA, blind workers could complete tasks in their entirety 4 to 6 times faster and 3 times more efficiently than before, for an estimated cost saving of nearly 65 per cent.
The breadth of RPA use cases is phenomenal with Blue Prism software already in use across more than 40 industry sectors. It is hard to imagine an industry that could not benefit from RPA.
Blue Prism Group plc ANNUAL REPORT AND ACCOUNTS 2017
14 –
15
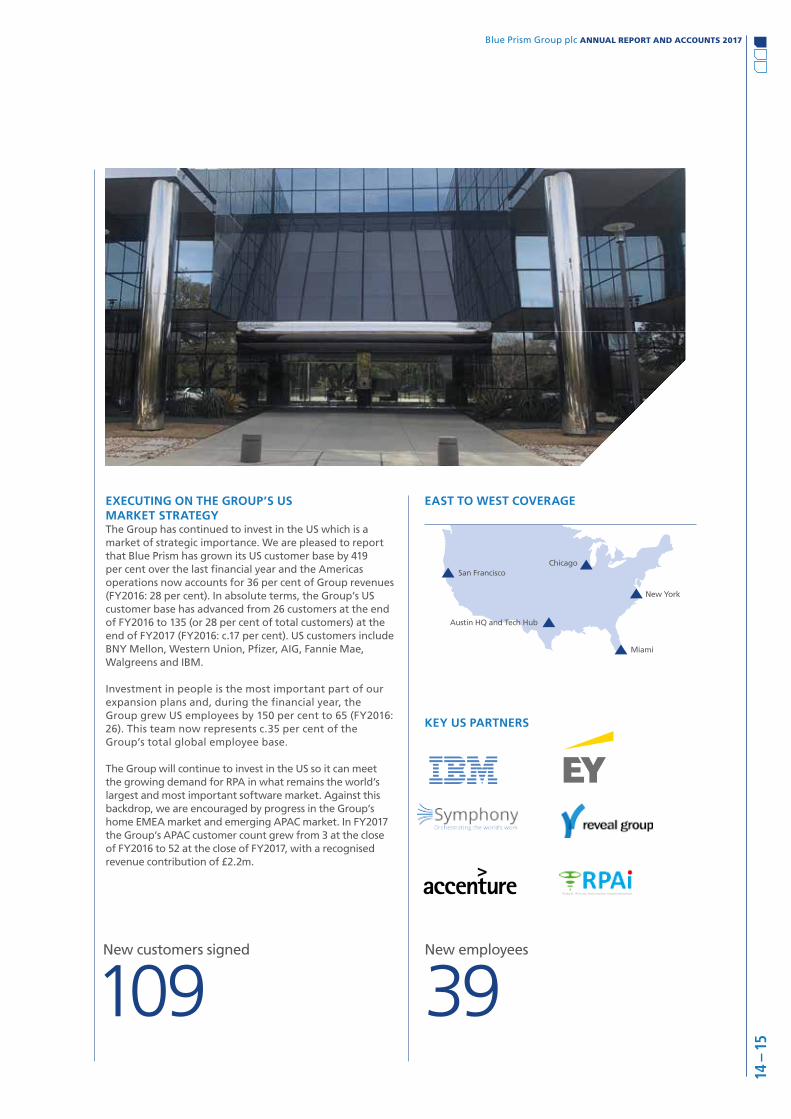
EXECUTING ON THE GROUP’S US MARKET STRATEGYThe Group has continued to invest in the US which is a market of strategic importance. We are pleased to report that Blue Prism has grown its US customer base by 419 per cent over the last financial year and the Americas operations now accounts for 36 per cent of Group revenues (FY2016: 28 per cent). In absolute terms, the Group’s US customer base has advanced from 26 customers at the end of FY2016 to 135 (or 28 per cent of total customers) at the end of FY2017 (FY2016: c.17 per cent). US customers include BNY Mellon, Western Union, Pfizer, AIG, Fannie Mae, Walgreens and IBM.
Investment in people is the most important part of our expansion plans and, during the financial year, the Group grew US employees by 150 per cent to 65 (FY2016: 26). This team now represents c.35 per cent of the Group’s total global employee base.
The Group will continue to invest in the US so it can meet the growing demand for RPA in what remains the world’s largest and most important software market. Against this backdrop, we are encouraged by progress in the Group’s home EMEA market and emerging APAC market. In FY2017 the Group’s APAC customer count grew from 3 at the close of FY2016 to 52 at the close of FY2017, with a recognised revenue contribution of £2.2m.
EAST TO WEST COVERAGE
Chicago
New York
Miami
San Francisco
Austin HQ and Tech Hub
KEY US PARTNERS
New customers signed
109New employees
39
Blue Prism Group plc ANNUAL REPORT AND ACCOUNTS 2017CHIEF EXECUTIVE’S REVIEW CONTINUED
REINFORCING THE GROUP’S MARKET LEADERSHIP TO TAKE ADVANTAGE OF RPA ADOPTIONThe launch of Version 6, billed as the “Operating System” edition of our software, has helped to build on Blue Prism’s profile as a thought leader in the RPA market. This latest release of our software is designed with the specific requirements of enterprise level deployment as an execution platform, or “operating system”, supporting the digital enterprise.
During the year, advances have been made with our Technology Alliance Program (“TAP"). Originally designed with the architectural objective of positioning Blue Prism as the de-facto “operating system” for digital workforce deployments, the programme has enjoyed an encouraging reception from customers, partners and commentators. We have already announced TAP collaborations with partners including Microsoft, Appian, Captricity, and IBM.
We believe that the TAP offers Blue Prism the potential to find new revenue streams. For example, Appian offers Blue Prism as an extension to its low code application development and BPM platform and extends its automation footprint. FY2018 will see us invest in further commercialisation and extension of the Technology Alliance Program.
Skills shortages can, as with any early market, hold back customer adoption. In FY2017, the Group established a formal Education Services department to bring customer and partner education under one roof. This has resulted in a 389 per cent increase in accredited Blue Prism developers to 3,096, a 408 per cent increase in (now outsourced) accreditation exams to 4,176 across 44 countries, and the introduction of new accredited roles to align with our ROM delivery framework and methodology.
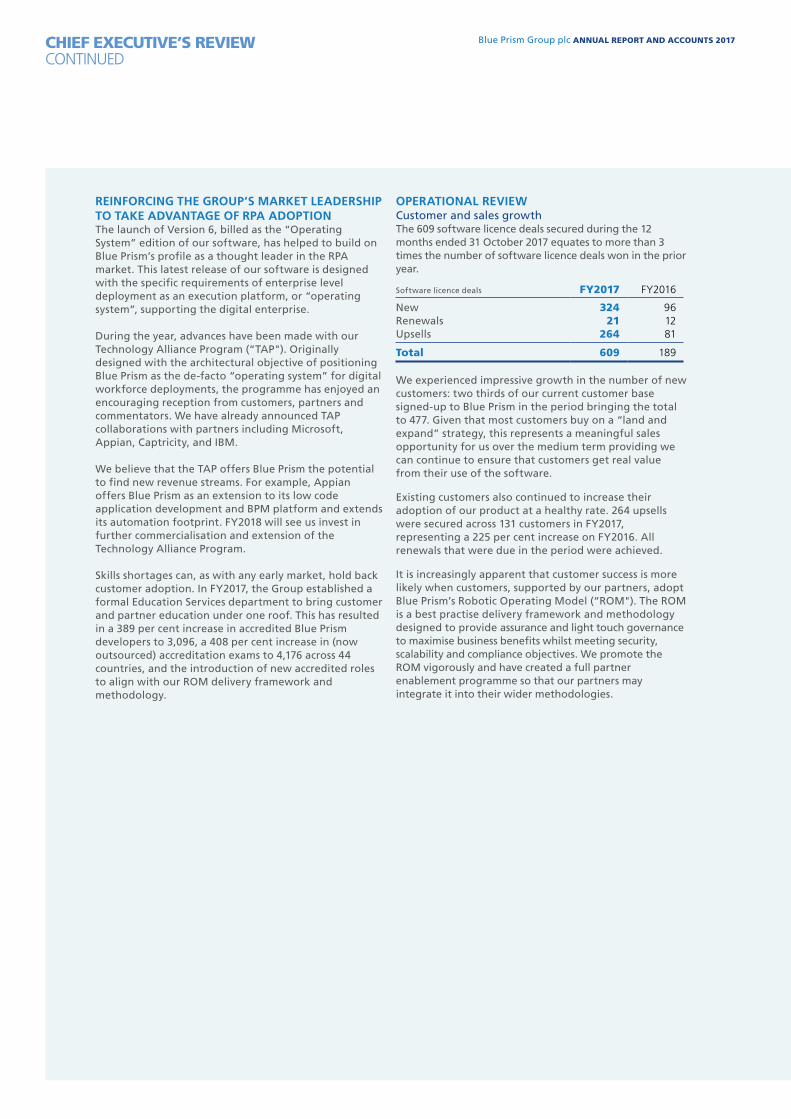
OPERATIONAL REVIEWCustomer and sales growth The 609 software licence deals secured during the 12 months ended 31 October 2017 equates to more than 3 times the number of software licence deals won in the prior year.
Software licence deals FY2017 FY2016
New 324 96Renewals 21 12Upsells 264 81
Total 609 189
We experienced impressive growth in the number of new customers: two thirds of our current customer base signed-up to Blue Prism in the period bringing the total to 477. Given that most customers buy on a “land and expand” strategy, this represents a meaningful sales opportunity for us over the medium term providing we can continue to ensure that customers get real value from their use of the software.
Existing customers also continued to increase their adoption of our product at a healthy rate. 264 upsells were secured across 131 customers in FY2017, representing a 225 per cent increase on FY2016. All renewals that were due in the period were achieved.
It is increasingly apparent that customer success is more likely when customers, supported by our partners, adopt Blue Prism’s Robotic Operating Model (“ROM"). The ROM is a best practise delivery framework and methodology designed to provide assurance and light touch governance to maximise business benefits whilst meeting security, scalability and compliance objectives. We promote the ROM vigorously and have created a full partner enablement programme so that our partners may integrate it into their wider methodologies.
Blue Prism Group plc ANNUAL REPORT AND ACCOUNTS 2017
16 –
17
EmployeesAs at 31 October 2017, Blue Prism had 187 employees worldwide, compared to 86 at the end of FY2016 and 127 at the end of H117. Whilst this level of growth inevitably places challenges on the Company, the management team has worked hard to build new organisational infrastructure. In particular, we have strengthened the management team with key appointments including Shail Khiyara, Chief Marketing Officer; Pat Geary who stepped into the newly-created role of Chief Evangelist; and Nicola Bergstrom who joined Blue Prism to lead Human Resources. We also implemented a new, scalable, accounting platform and invested in a corporate development team to co-ordinate and build the people, systems and processes needed for a larger organisation. Having made extensive use of our own robots in product development, we are now starting to scale their use into other parts of the business for flexibility, accuracy and efficiency.
Our Public Company status and employee share ownership schemes are enabling us to attract high quality talent. We will continue to invest in people to support our growth plans, and in systems and processes to provide an organisational platform for the next phase of Blue Prism’s growth.
SUMMARY AND OUTLOOKThis has been a successful year for Blue Prism. Our product and the global partner sales channel built to commercialise it have delivered real sales momentum, strengthening our market position and underpinning our belief in our long-term potential. In FY2018, the focus remains on addressing the global demand for RPA software through our indirect go to market model with particular investment in geographical expansion and in our Technology Alliance Program.
The Group has had a strong start to the first quarter of FY2018 and as such now expect revenues for the full financial year to be comfortably ahead of existing market expectations. Funded by the anticipated net proceeds of the placing we have announced today, the additional investment planned for FY2018 to support our global growth is expected to increase our revenue growth in the next financial year. The 2018 financial year shows every sign of being yet another exciting year of growth for Blue Prism.
Alastair BathgateChief Executive Officer
Blue Prism Group plc ANNUAL REPORT AND ACCOUNTS 2017FINANCIAL REVIEW
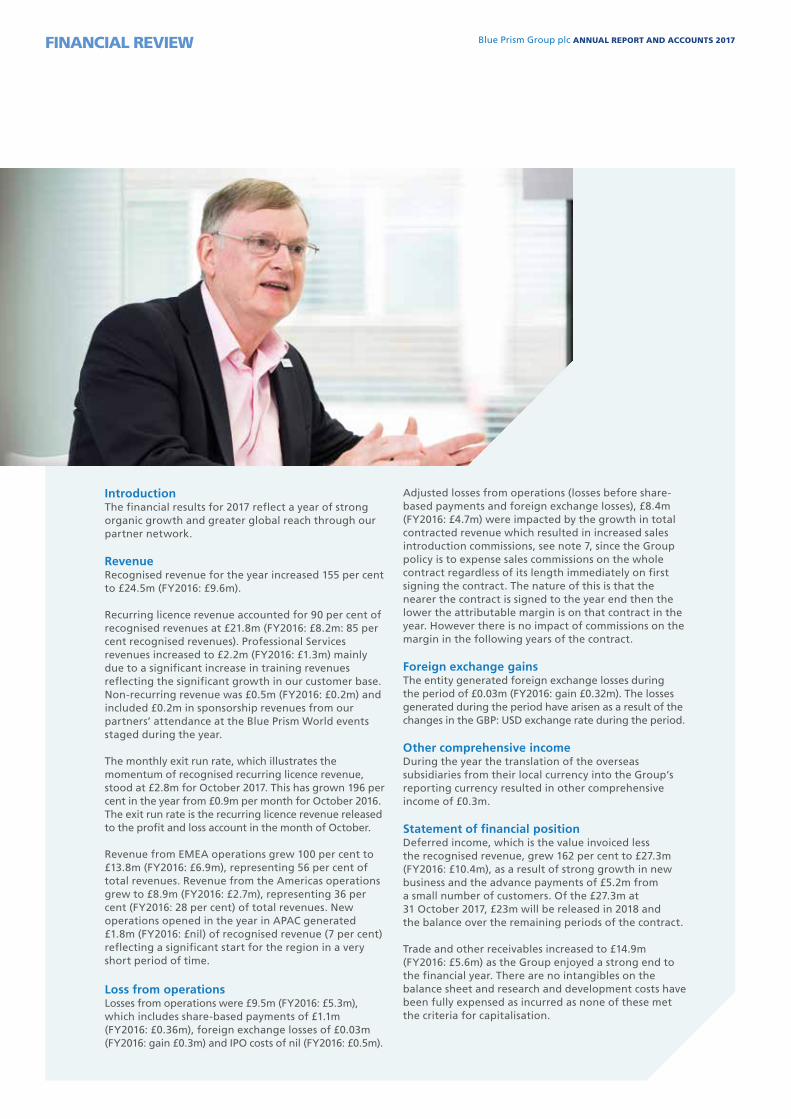
IntroductionThe financial results for 2017 reflect a year of strong organic growth and greater global reach through our partner network.
RevenueRecognised revenue for the year increased 155 per cent to £24.5m (FY2016: £9.6m).
Recurring licence revenue accounted for 90 per cent of recognised revenues at £21.8m (FY2016: £8.2m: 85 per cent recognised revenues). Professional Services revenues increased to £2.2m (FY2016: £1.3m) mainly due to a significant increase in training revenues reflecting the significant growth in our customer base. Non-recurring revenue was £0.5m (FY2016: £0.2m) and included £0.2m in sponsorship revenues from our partners’ attendance at the Blue Prism World events staged during the year.
The monthly exit run rate, which illustrates the momentum of recognised recurring licence revenue, stood at £2.8m for October 2017. This has grown 196 per cent in the year from £0.9m per month for October 2016. The exit run rate is the recurring licence revenue released to the profit and loss account in the month of October.
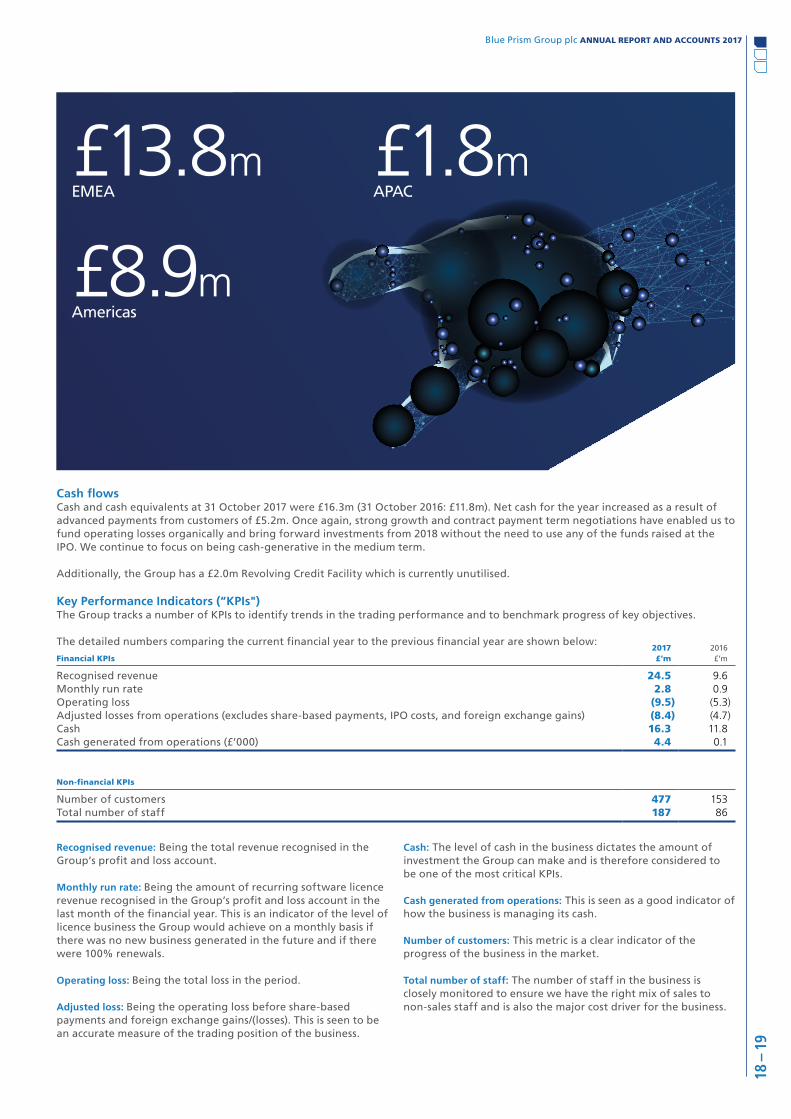
Revenue from EMEA operations grew 100 per cent to £13.8m (FY2016: £6.9m), representing 56 per cent of total revenues. Revenue from the Americas operations grew to £8.9m (FY2016: £2.7m), representing 36 per cent (FY2016: 28 per cent) of total revenues. New operations opened in the year in APAC generated £1.8m (FY2016: £nil) of recognised revenue (7 per cent) reflecting a significant start for the region in a very short period of time.
Loss from operationsLosses from operations were £9.5m (FY2016: £5.3m), which includes share-based payments of £1.1m (FY2016: £0.36m), foreign exchange losses of £0.03m (FY2016: gain £0.3m) and IPO costs of nil (FY2016: £0.5m).
Adjusted losses from operations (losses before share-based payments and foreign exchange losses), £8.4m (FY2016: £4.7m) were impacted by the growth in total contracted revenue which resulted in increased sales introduction commissions, see note 7, since the Group policy is to expense sales commissions on the whole contract regardless of its length immediately on first signing the contract. The nature of this is that the nearer the contract is signed to the year end then the lower the attributable margin is on that contract in the year. However there is no impact of commissions on the margin in the following years of the contract.
Foreign exchange gainsThe entity generated foreign exchange losses during the period of £0.03m (FY2016: gain £0.32m). The losses generated during the period have arisen as a result of the changes in the GBP: USD exchange rate during the period.
Other comprehensive incomeDuring the year the translation of the overseas subsidiaries from their local currency into the Group’s reporting currency resulted in other comprehensive income of £0.3m.
Statement of financial positionDeferred income, which is the value invoiced less the recognised revenue, grew 162 per cent to £27.3m (FY2016: £10.4m), as a result of strong growth in new business and the advance payments of £5.2m from a small number of customers. Of the £27.3m at 31 October 2017, £23m will be released in 2018 and the balance over the remaining periods of the contract.
Trade and other receivables increased to £14.9m (FY2016: £5.6m) as the Group enjoyed a strong end to the financial year. There are no intangibles on the balance sheet and research and development costs have been fully expensed as incurred as none of these met the criteria for capitalisation.
Blue Prism Group plc ANNUAL REPORT AND ACCOUNTS 2017
18 –
19
Cash flowsCash and cash equivalents at 31 October 2017 were £16.3m (31 October 2016: £11.8m). Net cash for the year increased as a result of advanced payments from customers of £5.2m. Once again, strong growth and contract payment term negotiations have enabled us to fund operating losses organically and bring forward investments from 2018 without the need to use any of the funds raised at the IPO. We continue to focus on being cash-generative in the medium term.
Additionally, the Group has a £2.0m Revolving Credit Facility which is currently unutilised.
Key Performance Indicators (“KPIs")The Group tracks a number of KPIs to identify trends in the trading performance and to benchmark progress of key objectives.
The detailed numbers comparing the current financial year to the previous financial year are shown below:
Financial KPIs2017£’m
2016£’m
Recognised revenue 24.5 9.6Monthly run rate 2.8 0.9Operating loss (9.5) (5.3)Adjusted losses from operations (excludes share-based payments, IPO costs, and foreign exchange gains) (8.4) (4.7)Cash 16.3 11.8Cash generated from operations (£’000) 4.4 0.1
Non-financial KPIs
Number of customers 477 153Total number of staff 187 86
£13.8mEMEA
£8.9mAmericas
£1.8mAPAC
Recognised revenue: Being the total revenue recognised in the Group’s profit and loss account.
Monthly run rate: Being the amount of recurring software licence revenue recognised in the Group’s profit and loss account in the last month of the financial year. This is an indicator of the level of licence business the Group would achieve on a monthly basis if there was no new business generated in the future and if there were 100% renewals.
Operating loss: Being the total loss in the period.
Adjusted loss: Being the operating loss before share-based payments and foreign exchange gains/(losses). This is seen to be an accurate measure of the trading position of the business.
Cash: The level of cash in the business dictates the amount of investment the Group can make and is therefore considered to be one of the most critical KPIs.
Cash generated from operations: This is seen as a good indicator of how the business is managing its cash.
Number of customers: This metric is a clear indicator of the progress of the business in the market.
Total number of staff: The number of staff in the business is closely monitored to ensure we have the right mix of sales to non-sales staff and is also the major cost driver for the business.
Blue Prism Group plc ANNUAL REPORT AND ACCOUNTS 2017PRINCIPAL RISKS AND UNCERTAINTIES
Risk Description
GROWTH STRATEGIES
Failing to successfully implement its growth strategies
The Company intends to carry out certain growth and expansion strategies. The Group’s growth and future success will be dependent to some extent on the successful completion of such growth and expansion strategies currently or proposed to be undertaken by the Group and the sufficiency of demand for the Group’s software. The execution of the Group’s growth and expansion strategies may also place strain on its managerial, operational and financial reserves and the failure to implement such a strategy may adversely affect the Group’s reputation, business, prospects, results of operation and financial condition. The Board manages these growth strategies against the market conditions, the cash available and the monthly performance of the Group against budget and reforecasts.
CHANNEL PARTNERS
Dependence on Channel Partners
GROUP’S OPERATING MODEL
Failure of the market to accept the Group’s operating model of a fully automated Digital Workforce
SOFTWARE RELIABILITY
Undetected defects in the software provided by the Group
SOFTWARE PERFORMANCE
The Group’s software may not perform as expected and the Group could be at risk of defects which adversely affect its customers
The Group sells its software robots through Partners and has established a partner accreditation programme to enable potential customers to select a partner suitable for their needs. There can be no guarantee that these Partners sell the Group’s software robots to their end-customers. The loss of certain key Partners (and the resulting loss of indirect customers contracted via those Partners) could have a material adverse effect on the Group’s business and financial condition.
A large proportion of the Group’s target market still uses traditional systems relying on human driven activities for the major part of their operations. The Directors believe the market needs further education on the virtues of its software machine-driven technology, and on how to integrate it into its current operations. Potential customers may however favour more traditional methodologies and/or be cautious about investing in the Group’s software due to lack of education as to how it operates. Failure by the Group to bring about a change in the market’s readiness to accept a new technology will lead to slower than projected growth in the Group’s revenues and profits.
The Group’s business involves providing customers with reliable software. If the software contains undetected defects when first introduced or when upgraded or enhanced, the Group may fail to meet its customers’ performance requirements or otherwise satisfy contract specifications. As a result, it may lose customers and/or become liable to its customers for damages and this may, amongst other things, damage the Group’s reputation and financial condition. The Group endeavours to negotiate limitations on its liability in its customer contracts, however, defects in either the software developed on behalf of customers or developed and sold by the Group could result in the loss of a customer, a reduction in business from any particular customer, negative publicity, reduced prospects and/or a distraction to its management team. A successful claim by a customer to recover such losses could have a material adverse effect on the Group’s reputation, business, prospects, results of operation and financial condition.
There is no guarantee that the Group’s software will perform as intended. Costs spent on developing the software may therefore not be recouped and this may result in reduced profitability for the Group. As the Group’s software is complex, it may contain defects or vulnerabilities which may not be detected until after their deployment to end customers. These could result in the Group’s customers being vulnerable to security attacks or adverse performance. The Group moreover may not always be able to identify the cause of performance problems in its software. The Group’s business would be harmed if any of the events described above caused its end customers or potential end customers to believe the Group’s software is not reliable or secure.
The Group is exposed to a number of potential risks which may have a material effect on the reputation, financial or operational performance.It is not possible to identify or anticipate every risk that may affect the Group, or the materiality of that risk, however, the principal risks and uncertainties faced by the Group are set out below.
The Board has overall responsibility for risk management and internal controls and is fully supported by the Audit Committee.
For financial instrument risk management and objectives please see note 3 of the financial statements.
Key areas for on-going risk management are:
This report was approved by the Board and signed on its behalf:
Gary JohnsonChief Financial Officer25 January 2018
Blue Prism Group plc ANNUAL REPORT AND ACCOUNTS 2017
20 –
21
SECURITY BREACHES
Security breaches of the Group’s or customer’s systems
The Group is often required and authorised by its customers to work with confidential information in the deployment of the Group’s software and services. Although the Group employs security and testing measures for the software it deploys, these may not protect against all possible security breaches that could harm the Group’s or its customers’ business. Any compromise of the Group’s security could harm its reputation or financial condition and, therefore, its business. In addition, a party who is able to circumvent the Group’s security measures could, among other things, misappropriate proprietary information, interrupt the Group’s operations or expose customers to computer viruses or other disruptions. Actual or perceived vulnerabilities may lead to claims against the Group. Whilst the Group will, where possible, seek to ensure that its customer agreements contain provisions that limit the Group’s liability, the Group may need to enforce these provisions to enjoy the benefit of them, with the associated risk and expense.
CYBER-ATTACKS
The Group’s software may be at risk from cyber-attacks
TECHNOLOGICAL CHANGES
The Group may be adversely affected by technological change in the artificial intelligence industry
MARKET
The Group faces strong competition in a rapidly evolving market
GROWTH MANAGEMENT
Growth management
The Group relies on information technology systems to conduct its operations. Because of this, the Group and its software are at risk from cyber-attacks. Cyber-attacks can result from deliberate attacks or unintentional events and may include (but are not limited to) third parties gaining unauthorised access to the Group’s software for the purpose of misappropriating financial assets, intellectual property or sensitive information, corrupting data, or causing operational disruption. If the Group suffers from a cyber-attack, whether by a third party or insider, it may incur significant costs and suffer other negative consequences, such as remediation costs (including liability for stolen assets or information) and repairing any damage caused to the Group’s network infrastructure and systems. The Group may also suffer reputational damage and loss of investor confidence. If the Group suffers a cyber-attack, this could expose the Group to potential financial and reputational harm.
The Group expects that new artificial intelligence technology will continue to emerge and develop, therefore it is possible that this technology may be superior to, or render obsolete or unmarketable, the technology that the Group currently offers. Any failure of the Group to ensure that its software remains up to date with the latest technology may have a material impact on the Group’s competitiveness and financial performance. The Group plans to continue to develop innovative solutions for its customers but there can be no assurance that the Group will be able successfully to develop new products and expand its business as planned or that these new products will be successful or profitable. The Company’s success will depend, in part, on its ability to develop and adapt to these technological changes and industry trends.
Although the Directors believe that significant barriers to entry exist in the markets in which the Group operates, including for example the technical skill and expertise required to develop its technology, the Group may face an increasing amount of competition. Competitors may seek to develop software which more successfully compete with the Group’s current product range and they may also adopt more aggressive pricing policies or undertake more extensive marketing and advertising campaigns. This may have a negative impact on sales volumes or profit margins achieved by the Group in the future. The Group would also face an increase in competition if its competitors adopted but further developed the Group’s software or if there were new entrants to the market with comparable or competitively superior technology.
The Directors believe that further expansion, either organically or through acquisition, may be required to capitalise on the market opportunities available to the Group. Such expansion is expected to place further demands on management, support functions, sales and marketing functions and other resources of the Group. In order to manage the further expansion of the Group’s business and the growth of its operations and personnel, the Group may be required to expand and enhance its infrastructure and technology, and enhance its operational and financial systems and procedures and controls from time to time in order to match that expansion. This could have a material cost to the Group. Historically, the Group has invested in its people, infrastructure, processes and policies to enable and support continued revenue growth but its future success will depend, in part, on its ability to continue to manage this anticipated expansion. There can be no assurance that the Group’s current and planned staff, infrastructure, systems, procedures and controls will be adequate to support its expanding operations in the future. If the Group fails to manage its expansion effectively, its business, prospects and results of operations may be materially and adversely affected.
Risk Description
Blue Prism Group plc ANNUAL REPORT AND ACCOUNTS 2017BOARD OF DIRECTORS
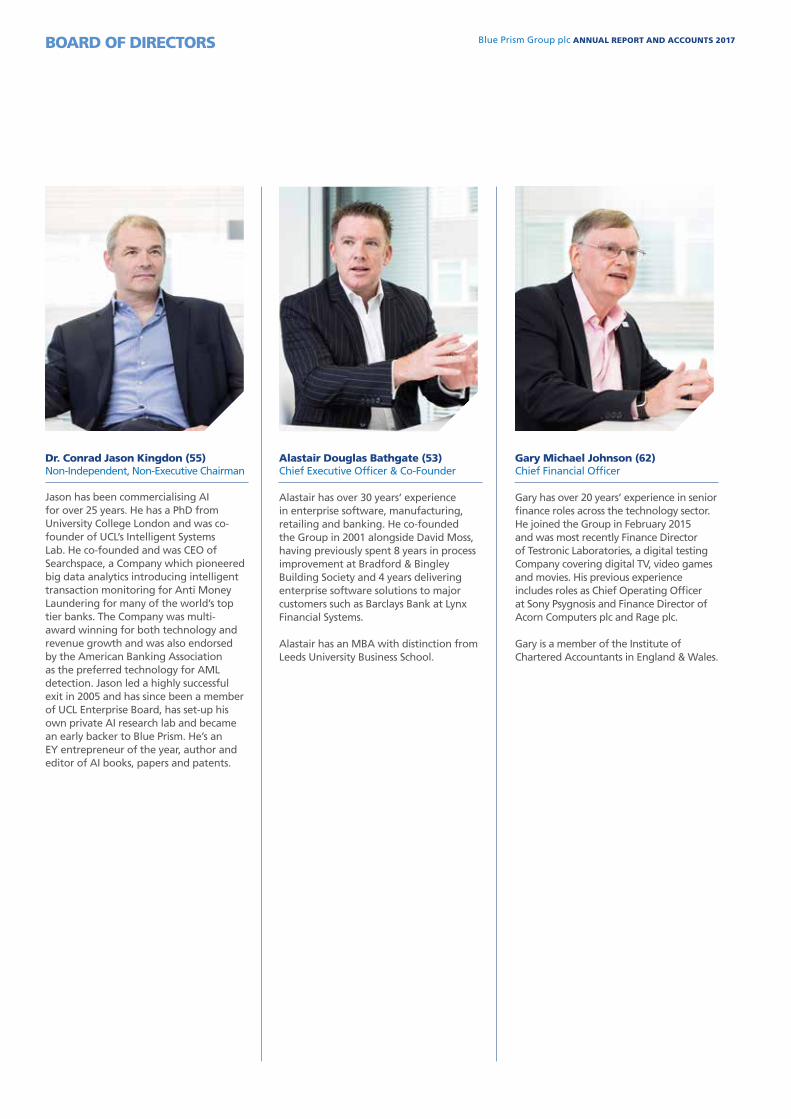
Dr. Conrad Jason Kingdon (55)Non-Independent, Non-Executive Chairman
Jason has been commercialising AI for over 25 years. He has a PhD from University College London and was co-founder of UCL’s Intelligent Systems Lab. He co-founded and was CEO of Searchspace, a Company which pioneered big data analytics introducing intelligent transaction monitoring for Anti Money Laundering for many of the world’s top tier banks. The Company was multi-award winning for both technology and revenue growth and was also endorsed by the American Banking Association as the preferred technology for AML detection. Jason led a highly successful exit in 2005 and has since been a member of UCL Enterprise Board, has set-up his own private AI research lab and became an early backer to Blue Prism. He’s an EY entrepreneur of the year, author and editor of AI books, papers and patents.
Alastair Douglas Bathgate (53) Chief Executive Officer & Co-Founder
Alastair has over 30 years’ experience in enterprise software, manufacturing, retailing and banking. He co-founded the Group in 2001 alongside David Moss, having previously spent 8 years in process improvement at Bradford & Bingley Building Society and 4 years delivering enterprise software solutions to major customers such as Barclays Bank at Lynx Financial Systems.
Alastair has an MBA with distinction from Leeds University Business School.
Gary Michael Johnson (62)Chief Financial Officer
Gary has over 20 years’ experience in senior finance roles across the technology sector. He joined the Group in February 2015 and was most recently Finance Director of Testronic Laboratories, a digital testing Company covering digital TV, video games and movies. His previous experience includes roles as Chief Operating Officer at Sony Psygnosis and Finance Director of Acorn Computers plc and Rage plc.
Gary is a member of the Institute of Chartered Accountants in England & Wales.
Blue Prism Group plc ANNUAL REPORT AND ACCOUNTS 2017
22 –
23
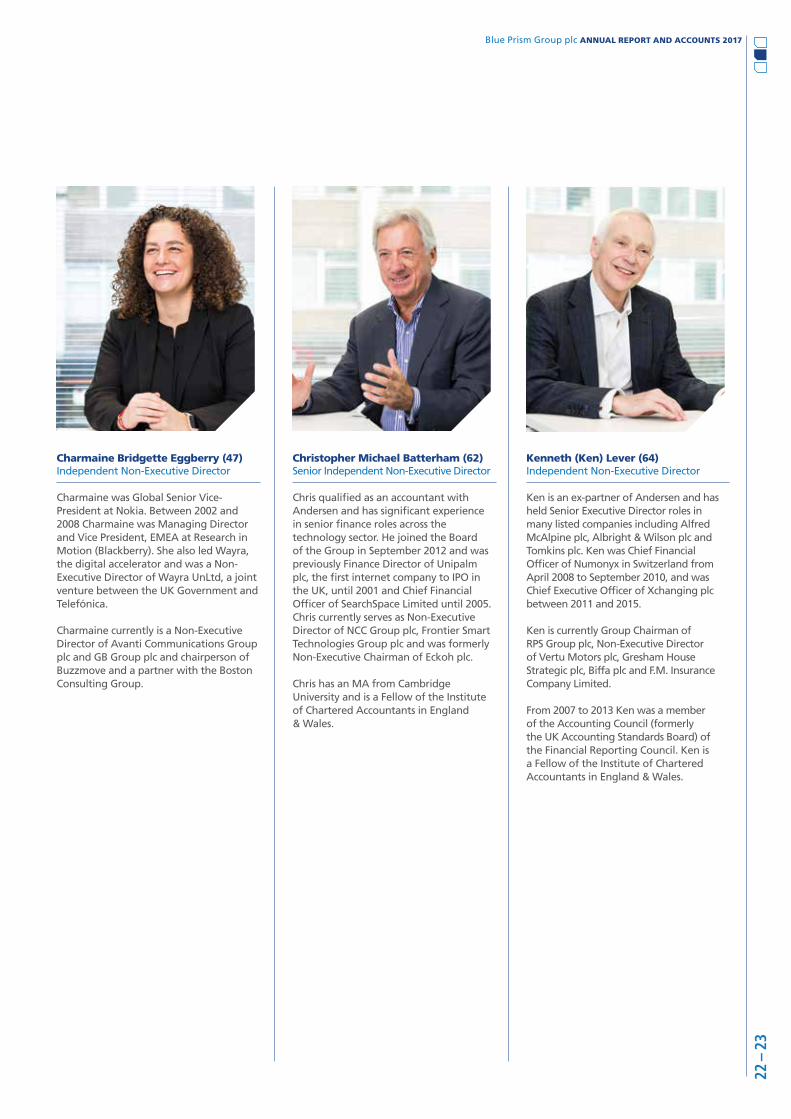
Christopher Michael Batterham (62) Senior Independent Non-Executive Director
Chris qualified as an accountant with Andersen and has significant experience in senior finance roles across the technology sector. He joined the Board of the Group in September 2012 and was previously Finance Director of Unipalm plc, the first internet company to IPO in the UK, until 2001 and Chief Financial Officer of SearchSpace Limited until 2005. Chris currently serves as Non-Executive Director of NCC Group plc, Frontier Smart Technologies Group plc and was formerly Non-Executive Chairman of Eckoh plc.
Chris has an MA from Cambridge University and is a Fellow of the Institute of Chartered Accountants in England & Wales.
Kenneth (Ken) Lever (64) Independent Non-Executive Director
Ken is an ex-partner of Andersen and has held Senior Executive Director roles in many listed companies including Alfred McAlpine plc, Albright & Wilson plc and Tomkins plc. Ken was Chief Financial Officer of Numonyx in Switzerland from April 2008 to September 2010, and was Chief Executive Officer of Xchanging plc between 2011 and 2015.
Ken is currently Group Chairman of RPS Group plc, Non-Executive Director of Vertu Motors plc, Gresham House Strategic plc, Biffa plc and F.M. Insurance Company Limited.
From 2007 to 2013 Ken was a member of the Accounting Council (formerly the UK Accounting Standards Board) of the Financial Reporting Council. Ken is a Fellow of the Institute of Chartered Accountants in England & Wales.
Charmaine Bridgette Eggberry (47)Independent Non-Executive Director
Charmaine was Global Senior Vice-President at Nokia. Between 2002 and 2008 Charmaine was Managing Director and Vice President, EMEA at Research in Motion (Blackberry). She also led Wayra, the digital accelerator and was a Non-Executive Director of Wayra UnLtd, a joint venture between the UK Government and Telefónica.
Charmaine currently is a Non-Executive Director of Avanti Communications Group plc and GB Group plc and chairperson of Buzzmove and a partner with the Boston Consulting Group.
Blue Prism Group plc ANNUAL REPORT AND ACCOUNTS 2017SENIOR MANAGEMENT
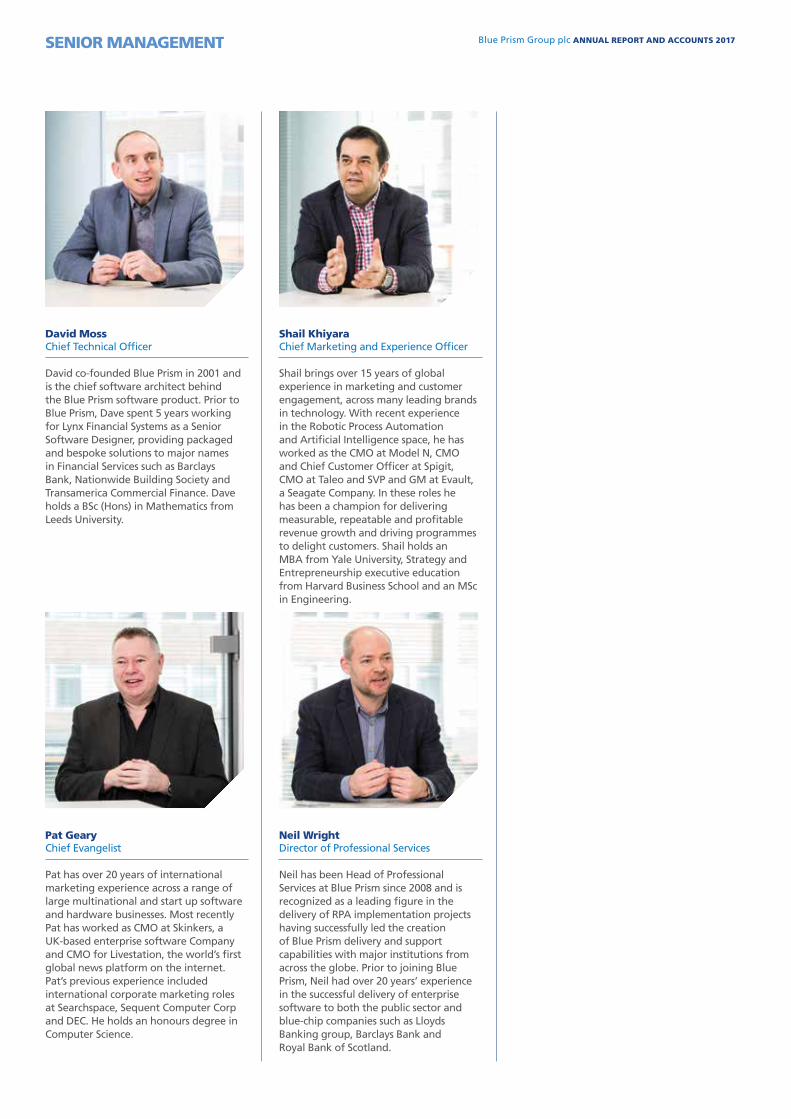
David Moss Chief Technical Officer
David co-founded Blue Prism in 2001 and is the chief software architect behind the Blue Prism software product. Prior to Blue Prism, Dave spent 5 years working for Lynx Financial Systems as a Senior Software Designer, providing packaged and bespoke solutions to major names in Financial Services such as Barclays Bank, Nationwide Building Society and Transamerica Commercial Finance. Dave holds a BSc (Hons) in Mathematics from Leeds University.
Shail Khiyara Chief Marketing and Experience Officer
Shail brings over 15 years of global experience in marketing and customer engagement, across many leading brands in technology. With recent experience in the Robotic Process Automation and Artificial Intelligence space, he has worked as the CMO at Model N, CMO and Chief Customer Officer at Spigit, CMO at Taleo and SVP and GM at Evault, a Seagate Company. In these roles he has been a champion for delivering measurable, repeatable and profitable revenue growth and driving programmes to delight customers. Shail holds an MBA from Yale University, Strategy and Entrepreneurship executive education from Harvard Business School and an MSc in Engineering.
Pat Geary Chief Evangelist
Pat has over 20 years of international marketing experience across a range of large multinational and start up software and hardware businesses. Most recently Pat has worked as CMO at Skinkers, a UK-based enterprise software Company and CMO for Livestation, the world’s first global news platform on the internet. Pat’s previous experience included international corporate marketing roles at Searchspace, Sequent Computer Corp and DEC. He holds an honours degree in Computer Science.
Neil Wright Director of Professional Services
Neil has been Head of Professional Services at Blue Prism since 2008 and is recognized as a leading figure in the delivery of RPA implementation projects having successfully led the creation of Blue Prism delivery and support capabilities with major institutions from across the globe. Prior to joining Blue Prism, Neil had over 20 years’ experience in the successful delivery of enterprise software to both the public sector and blue-chip companies such as Lloyds Banking group, Barclays Bank and Royal Bank of Scotland.

Blue Prism Group plc ANNUAL REPORT AND ACCOUNTS 2017
24 –
25
Alex BentleyDirector of Corporate Development
Alex is responsible for leading and delivering the corporate and strategic initiatives that underpin the Blue Prism growth strategy. Prior to joining Blue Prism in 2013, Alex was a management consultant at Deloitte with a background in operational excellence and business architecture. Alex spent the majority of his consulting career delivering Target Operating Model design, process improvement and business transformation programmes for Financial Services clients. He has a BA (Hons) in Management from Leeds University.
Martin FloodDirector of Sales
Martin brings sales and sales management expertise and experience, gained in the IT industry over 2 decades in a variety of enterprise software and hardware businesses. Martin’s roles have ranged from large international organizations such as Sybase and Sun Microsystems through to early stage software companies such as Whitelight Systems and Searchspace. Martin recently headed the new products Division of Progress Software EMEA, which comprised SOA integration, business activity monitoring and business process management offerings.
Nicola BergstromDirector of Human Resources
Nicola Bergstrom brings over 10 years’ experience in Human Resources (“HR”) management, having held a number of HR roles across BAE Systems Group. Nicola has a Postgraduate Diploma in Human Resource Management (CIPD) alongside a degree in Business Management and French from the University of Manchester.
John Warrick General Counsel and Company Secretary
John has 14 years’ experience of international corporate and technology law. Having begun his legal career at global law firm Allen & Overy, he has since worked in a variety of in-house legal roles with General Electric, ADP and, most recently, automotive retail software specialist CDK Global. John is admitted as solicitor in England and Wales.
Blue Prism Group plc ANNUAL REPORT AND ACCOUNTS 2017CORPORATE GOVERNANCE STATEMENT
At 31 October 2017 the Board comprised the Chairman, 2 Executive Directors and 3 Non-Executive Directors whose Board and Committee responsibilities are set out below.
Board Audit Committee Remuneration Committee
Jason Kingdon Chairman Chairman – –Alastair Bathgate CEO Member – –Gary Johnson CFO Member – –Chris Batterham Senior Independent NED Member Member MemberKen Lever Independent NED Member Chairman MemberCharmaine Eggberry Independent NED Member Member Chairman
The Board meets formally on a regular basis to monitor operating issues, risk and trading performance, to review forecasts, strategy and policy, to consider key projects and to oversee shareholder reporting. The Board is responsible for corporate governance and delegates operational control to the Executive Directors.
The Chairman and NEDs have held meetings throughout the year with the various senior managers to improve insight into the business operations and the marketplace.
There is a formal schedule of matters reserved for the decision of the Board that covers the key areas of the Group’s affairs. The schedule includes approval of the Annual Report and any other financial statements, the adoption of the budgets and business plans, material financial commitments, and the release of inside information.
The Board considers its overall size and composition to be appropriate, having regard to the experience and skills which the Board members bring together. The Board confirmed that Chris Batterham, Ken Lever and Charmaine Eggberry are independent in character and judgement. The Chairman, Jason Kingdon is not independent, however the Board considers that Jason Kingdon’s long experience as Chairman of the Board of Blue Prism Limited (which until the IPO was the Parent of the Group) will be of benefit to the Board in providing continuity of knowledge and additional industry expertise to the Group.
Directors’ indemnitiesAt the date of this Directors’ and Corporate Governance Report, indemnities are in force for both the Directors and the Company Secretary, to the extent permitted by law and by Blue Prism Group plc’s Articles of Association, in respect of losses arising in their capacity as officer of any member of the Blue Prism Group. In addition, Blue Prism has purchased and maintained throughout the year Directors’ and officers’ liability insurance in respect of itself and its Directors and officers.
Board committeesAudit CommitteeThe Audit Committee comprises Ken Lever (Chairman), Chris Batterham and Charmaine Eggberry. The committee meets at least twice per year and more frequently if required. The committee is responsible for monitoring the integrity of the Group’s financial statements, monitoring the quality of the internal controls, reviewing significant financial reporting issues, overseeing the relationship with the external auditors (including advising on their appointment, agreeing the scope of the audit and reviewing the audit findings). Executive Directors or other members of the management team may be invited to attend meetings.
Remuneration CommitteeThe Remuneration Committee comprises Charmaine Eggberry (Chairman), Ken Lever and Chris Batterham. The committee meets at least twice per year and more frequently if required. The committee is responsible for determining and agreeing with the Board the framework for the remuneration of the Executive Directors and other designated senior management and determining the total remuneration packages including where appropriate bonuses, incentive payments, share option awards and other share awards. The remuneration of the Non-Executive Directors will be determined by the Chairman and the Executive members of the Board. No Director will be involved in any decision as to his or her own remuneration.
Internal controlThe Board has overall responsibility for the Group’s system of internal control and for reviewing its effectiveness. The processes to identify and manage the key risks of the Group are an integral part of the internal control environment. Such processes, which are regularly reviewed and improved as necessary, include strategic planning, approval of annual budgets, regular monitoring of performance against budget (including full investigation of significant variances), control of capital expenditure, ensuring proper accounting records are maintained, the appointment of senior management and the setting of high standards for health, safety and environmental performance.
The effectiveness of the internal control system and procedures is monitored regularly through a combination of review by management, the results of which are reported to and considered by the Audit Committee. The system of internal control comprises those controls established to provide assurance that the assets of the Group are safeguarded against unauthorised use and to ensure the maintenance of proper accounting records and the reliability of financial information used within the business or for publication. Any system of internal control can only provide reasonable, but not absolute, assurance against material misstatement or loss, as it is designed to manage rather than eliminate the risk of failing to achieve the business objectives of the Group.
Relations with shareholdersThe Group is committed to open communications with all its shareholders. Communication is primarily through the Company’s website and the Annual General Meeting. All shareholders will receive a copy of the Annual Report (electronic or hard copy depending on shareholder preference) and an interim report at the half year will be available on the Company’s website.
Blue Prism Group plc ANNUAL REPORT AND ACCOUNTS 2017
26 –
27
Business review and future developmentsA review of the Group’s operations and future developments is covered in the Strategic Report section of the Annual Report and Accounts on pages 13 to 21.
DividendThe Directors do not recommend the payment of a dividend.
Going concernAfter making enquiries, the Directors have confidence that the Group has adequate resources to continue in operational existence for the foreseeable future. For this reason they continue to adopt the going concern basis in preparing the Annual Report and Accounts.
DirectorsThe Directors who served on the Board and on Board Committees during the year are set out on page 26.
Information on Directors’ remuneration and share option rights is given in the Directors’ Remuneration section below.
Significant shareholders The Company is informed that at 31 October 2017, individual registered shareholdings of more than 3% of the Company’s issued share capital were as follows:
Number of 1p Ordinary Shares
% of issued Ordinary Share capital
Jason Kingdon 6,229,822 9.9%Alastair Bathgate 5,658,462 9.0%Old Mutual UK Mid Cap Fund 3,951,202 6.3%David Moss 3,141,872 5.0%Rising Stars Growth Fund 3,061,549 4.9%Oppenheimer Global Opportunities Fund 3,000,000 4.8%Old Mutual UK Select Smaller Companies Fund 2,789,323 4.5%Hargreaves Lansdowne Asset Mgmt Clients 2,130,677 3.4%
A list of current significant shareholders can be found on the Company’s website.
Directors’ share interestsAt 31 October 2017 the Directors who held office during the year had the following interests in the Ordinary Shares of Blue Prism Group plc according to the register of Directors’ interests:
Number of 1p Ordinary Shares
% of Company’s issued shares
Jason Kingdon 6,229,822 9.9 %Alastair Bathgate 5,658,462 9.0%Gary Johnson 99,820 0.2%Chris Batterham 214,000 0.3%Ken Lever 32,051 <0.1%Charmaine Eggberry 330,000 0.5%
Also as at 31 October 2017 the following options over the Company’s Ordinary Shares had been granted to the following Directors, pursuant to the Share Plans:
Number of options
Exercise period
Exercise price
Alastair Bathgate 497,436 18 March 2019 to 14 March 2026 78pGary Johnson 402,564 18 March 2019 to 14 March 2026 78p
None of the Directors had any interest in the share capital of any subsidiary company.
DIRECTORS’ REPORTFOR THE YEAR ENDED 31 OCTOBER 2017
Blue Prism Group plc ANNUAL REPORT AND ACCOUNTS 2017
Directors’ remunerationThe emoluments of the Directors were as follows (audited):
Year ended 31 October 2017
Salary £
Bonus/ Commission
£Pension
£
Other benefits
£Total
£
Year ended 31 October 2016 Total
£
Alastair Bathgate 133,900 65,000 14,554 8,332 221,786 157,695Gary Johnson 113,300 55,000 6,056 7,680 182,036 133,147Jason Kingdon 55,000 – – – 55,000 63,829Chris Batterham 50,000 – – – 50,000 41,333Ken Lever 50,000 – – – 50,000 30,208Charmaine Eggberry 50,000 – – – 50,000 30,208
Totals 452,200 120,000 20,610 16,012 608,822 456,420
Alastair Bathgate was the highest paid Director.
Research & developmentInvestment in the development of its product and the protection of the intellectual property of such development work is considered key to the further improvement of Blue Prism’s competitive position. Further details can be found in the principal risks and uncertainties section on pages 20 and 21.
Political donationsThe Group made no political donations.
Provision of information to the auditorsEach of the Directors at the time when this Report of the Directors is approved has confirmed that:• So far as that Director is aware, there is no relevant audit information of which the Company’s and the Group’s auditors are unaware; and• Each Director has taken all the steps that ought to have been taken as a Director in order to be aware of any information needed
by the Company and the Group’s auditors in connection with preparing their report and to establish that the Company and the Group’s auditors are aware of that information.
Post balance sheet eventsThe Group is looking to place approximately £40m (before transaction fees) by way of a primary fundraising. The Directors anticipate that approximately one third of the proceeds of the Primary Placing will be deployed in the current financial year to underwrite the Company’s global growth activities with the balance of the proceeds to be used to strengthen the Company’s balance sheet and provide Blue Prism with the financial flexibility to address new opportunities as they emerge.
Areas of investment include:• Expanding the Company’s sales and marketing activities across the US, Asia Pacific and EMEA.• Continuing to develop and scale the Company’s global Channel Partner network through further engagement and partner
certification programme.• Investing in the commercialisation of different partnership opportunities through the Company’s Technology Alliance Program,
which aims at positioning Blue Prism as the de facto “operating system”.• Building the Blue Prism ecosystem to support our growth and enhancing the recently established Education Services department
to support Blue Prism developers.• Reinforcing the Company’s market leadership by investing further in our product and its differentiation, following the release of
Blue Prism Version 6.• Investing in people, process and infrastructure to support the growing business.
The Directors expect these investments to start generating incremental revenue during the financial year ending 31 October 2019.
AGM noticeThe notice covering the AGM to be held on 20 March 2018, together with an explanation of the resolutions to be proposed at the meeting, is contained in a separate circular to shareholders.
Independent auditorsThe auditors, BDO LLP, have expressed their willingness to continue in office and a resolution to re-appoint them will be proposed at the AGM.
This report was approved by the Board and signed on its behalf:
Gary JohnsonChief Financial Officer25 January 2018
DIRECTORS’ REPORT CONTINUEDFOR THE YEAR ENDED 31 OCTOBER 2017
Blue Prism Group plc ANNUAL REPORT AND ACCOUNTS 2017
28 –
29
The Directors are responsible for preparing the Annual Report and financial statements in accordance with applicable law and regulations.
Company law requires the Directors to prepare financial statements for each financial year. Under that law the Directors have elected to prepare the Group and Company financial statements in accordance with International Financial Reporting Standards (“IFRSs") as adopted by the European Union. Under company law the Directors must not approve the financial statements unless they are satisfied that they give a true and fair view of the state of affairs of the Group and Company and of the profit or loss of the Group for that period. The Directors are also required to prepare financial statements in accordance with the rules of the London Stock Exchange for companies trading securities on the Alternative Investment Market.
In preparing these financial statements, the Directors are required to:• select suitable accounting policies and then apply them consistently;• make judgements and accounting estimates that are reasonable and prudent;• state whether they have been prepared in accordance with IFRSs as adopted by the European Union, subject to any material
departures disclosed and explained in the financial statements; and• prepare the financial statements on the going concern basis unless it is inappropriate to presume that the Company will continue
in business.
The Directors are responsible for keeping adequate accounting records that are sufficient to show and explain the Company’s transactions and disclose with reasonable accuracy at any time the financial position of the Company and enable them to ensure that the financial statements comply with the requirements of the Companies Act 2006. They are also responsible for safeguarding the assets of the Company and hence for taking reasonable steps for the prevention and detection of fraud and other irregularities.
Website publicationThe Directors are responsible for ensuring the Annual Report and the financial statements are made available on a website. Financial statements are published on the Company’s website in accordance with legislation in the United Kingdom governing the preparation and dissemination of financial statements, which may vary from legislation in other jurisdictions. The maintenance and integrity of the Company’s website is the responsibility of the Directors. The Directors’ responsibility also extends to the ongoing integrity of the financial statements contained therein.
DIRECTORS’ RESPONSIBILITIES
Blue Prism Group plc ANNUAL REPORT AND ACCOUNTS 2017INDEPENDENT AUDITOR’S REPORTTO THE MEMBERS OF BLUE PRISM GROUP PLC
OpinionWe have audited the financial statements of Blue Prism Group plc (the “Parent Company”) and its subsidiaries (the “Group”) for the year ended 31 October 2017 which comprise the consolidated statement of profit or loss and comprehensive income, the consolidated statement of financial position, the consolidated statement of cash flows, the consolidated statement of changes in equity, the Company statement of financial position, the Company statement of changes in equity, the Company statement of cash flows and notes to the financial statements, including a summary of significant accounting policies.
The financial reporting framework that has been applied in the preparation of the financial statements is applicable law and International Financial Reporting Standards (IFRSs) as adopted by the European Union and, as regards the Parent Company financial statements, as applied in accordance with the provisions of the Companies Act 2006.
In our opinion:• the financial statements give a true and fair view of the state of the Group’s and of the Parent Company’s affairs as at 31 October
2017 and of the Group’s loss for the year then ended;• the Group financial statements have been properly prepared in accordance with IFRSs as adopted by the European Union;• the Parent Company financial statements have been properly prepared in accordance with IFRSs as adopted by the European
Union and as applied in accordance with the provisions of the Companies Act 2006; and• the financial statements have been prepared in accordance with the requirements of the Companies Act 2006.
Basis for opinionWe conducted our audit in accordance with International Standards on Auditing (UK) (ISAs (UK)) and applicable law. Our responsibilities under those standards are further described in the auditor’s responsibilities for the audit of the financial statements section of our report. We are independent of the Group and the Parent Company in accordance with the ethical requirements that are relevant to our audit of the financial statements in the UK, including the FRC’s Ethical Standard as applied to listed entities, and we have fulfilled our other ethical responsibilities in accordance with these requirements. We believe that the audit evidence we have obtained is sufficient and appropriate to provide a basis for our opinion.
Conclusions relating to going concernWe have nothing to report in respect of the following matters in relation to which the ISAs (UK) require us to report to you where:• the Directors’ use of the going concern basis of accounting in the preparation of the financial statements is not appropriate; or• the Directors have not disclosed in the financial statements any identified material uncertainties that may cast significant doubt
about the Group’s or the Parent Company’s ability to continue to adopt the going concern basis of accounting for a period of at least 12 months from the date when the financial statements are authorised for issue.
Key audit mattersKey audit matters are those matters that, in our professional judgment, were of most significance in our audit of the financial statements of the current period and include the most significant assessed risks of material misstatement (whether or not due to fraud) we identified, including those which had the greatest effect on: the overall audit strategy, the allocation of resources in the audit; and directing the efforts of the engagement team. These matters were addressed in the context of our audit of the financial statements as a whole, and in forming our opinion thereon, and we do not provide a separate opinion on these matters.
REVENUE RECOGNITION
Key audit matter International Standards on Auditing (UK) (ISAs (UK)) note that there is a presumed significant audit risk arising from inappropriate or incorrect recognition of revenue unless conditions exist that permit the rebuttal of that risk.
Due to the different elements of the contracts entered into by the Group and the length of those contracts also varying, the key risk of material misstatement arises both from the recognition of revenue around the year end (cut-off) and the revenue recognition policy itself, as detailed within note 2 of these financial statements, ensuring it is in line with International Financial Reporting Standards (“IFRS”) as adopted by the European Union.
Cut-off risk arises around the correct apportionment of revenue to the correct accounting period and subsequent amount deferred at the year end.
Blue Prism Group plc ANNUAL REPORT AND ACCOUNTS 2017
30 –
31
Our application of materialityWe apply the concept of materiality both in planning and performing our audit, and in evaluating the effect of misstatements. At the planning stage we set an overall level of materiality for the financial statements as a whole based on our understanding of the elements of the financial statements that are likely to be of greatest significance to users. In order to reduce to an appropriately low level the probability that any misstatements exceed materiality, we use a lower materiality level, performance materiality, to determine the extent of testing needed. Importantly, misstatements below these levels will not necessarily be evaluated as immaterial as we also take account of the nature of identified misstatements, and the particular circumstances of their occurrence, when evaluating their effect on the financial statements as a whole.
MaterialityPlanning materiality for the Group as a whole was set at £368,000 (2016: £118,000), which represents 1.5% (2016: 1.25%) of Group revenue. Revenue provides us with a consistent year on year basis for determining materiality and has been concluded as the most relevant performance measure to the stakeholders of the Group, while also providing a more stable measure year on year when compared to the Group loss before tax. The increase in percentage from 1.25% to 1.5% used to generate the Group materiality is a consequence of the Group being in its second year reporting under IFRS and due to the absence of a major Group restructure and the initial public offering which took place in 2016. Parent Company materiality has been set at £132,000, reflecting 1.5% (2016: 1.25%) of total assets of the entity, which has been deemed the most suitable benchmark for a non-trading holding Parent Company. The percentages used have increased due to the same reasons as the Group.
Performance materialityBased upon our assessment of the risks within the Group and the Group’s control environment, performance materiality for the financial statements has been set at £276,000 (2016: £82,600), being 75% (2016: 70%) of planning materiality.
Performance materiality levels used for the 2 key components identified within the Group were based upon the same benchmarks and percentages detailed for the Group, due to each component being consistent in both nature, audit risks identified and control environment to the Group as a whole. In the current year, the range of performance materiality allocated to components was £175,500 to £100,500 (2016: £61,950 to £60,900).
Reporting thresholdThe reporting threshold is the amount below which identified misstatements are considered as being clearly trivial.
We agreed with the Audit Committee that we would report to them all uncorrected audit differences in excess of £18,400 (2016: £2,360), which is set at 5% (2016: 2%) of planning materiality, as well as differences below that threshold that, in our view, warranted reporting on qualitative grounds.
We evaluate any uncorrected misstatements against both the quantitative measures of materiality discussed above and in light of other relevant qualitative considerations in forming our opinion.
How the key audit matter was addressed by our audit scope
Our procedures included reviewing the Group’s adopted revenue recognition policy in accordance with the requirements of IAS 18 – Revenue. We have reviewed the adopted policy, and confirmed that consistent application has been adhered to throughout the year.
Furthermore, we have performed specific substantive testing over each revenue stream, including the following:• Generating expectations of contract revenue recognised during the period based upon
both ongoing contracts entered into in the prior period and contracts entered into during the current period, taking into consideration the revenue days applicable to the financial year. Inputs into this calculation have been tested substantively including selecting a sample of items and tracing to source documentation such as customer contracts. We have also traced from the source listing of revenue generating items back into the population used to generate expectations to ensure completeness. For those contracts spanning over the year end, a sample of the balances deferred were re-calculated.
• Verifying a sample of non-recurring/non-contract revenue recognised in the year, reconciling to underlying agreements, cash receipt and appropriate trigger events for revenue recognition.
• Critically reviewing the existence and accuracy of deferred revenue balances shown in the statement of financial position at year end to ensure no material misstatements were identified.
Blue Prism Group plc ANNUAL REPORT AND ACCOUNTS 2017
Scope of our auditOur Group audit was scoped by obtaining an understanding of the Group and its environment, including the Group’s system of internal control, and assessing the risks of material misstatement in the financial statements at the Group level.
In determining the scope of our audit we considered the size and nature of each component within the Group to determine the level of work to be performed at each in order to ensure sufficient assurance was gained to allow us to express an opinion on the financial statements of the Group as a whole.
We obtained an understanding of the internal control environment related to the financial reporting process and assessed the appropriateness, completeness and accuracy of Group journals and other adjustments performed on consolidation.
Classification of componentTwo components have been identified as significant (defined as those that contributed greater than 15% of Group revenue) and have been audited for Group reporting purposes.
The 2 significant components audited for Group reporting purposes accounted for 100% (2016: 100%) of the Group’s revenue, 86% (2016: 65%) of the Group’s loss before tax and 59% (2016: 62%) of the Group’s total assets and have been subject to a full scope audit. The Group audit team carried out these audits using materiality levels specified above.
The remaining 3 components not identified as significant have been reviewed for Group reporting purposes, using analytic procedures to corroborate the conclusions reached that there are no significant risks of material misstatement of the aggregated financial information of those components.
Other informationThe Directors are responsible for the other information. The other information comprises the information included in the Annual Report, other than the financial statements and our auditor’s report thereon. Our opinion on the financial statements does not cover the other information and, except to the extent otherwise explicitly stated in our report, we do not express any form of assurance conclusion thereon.
In connection with our audit of the financial statements, our responsibility is to read the other information and, in doing so, consider whether the other information is materially inconsistent with the financial statements or our knowledge obtained in the audit or otherwise appears to be materially misstated. If we identify such material inconsistencies or apparent material misstatements, we are required to determine whether there is a material misstatement in the financial statements or a material misstatement of the other information. If, based on the work we have performed, we conclude that there is a material misstatement of this other information, we are required to report that fact. We have nothing to report in this regard.
Opinions on other matters prescribed by the Companies Act 2006In our opinion, based on the work undertaken in the course of the audit:• the information given in the Strategic Report and the Directors’ Report for the financial year for which the financial statements
are prepared is consistent with the financial statements; and• the Strategic Report and the Directors’ Report have been prepared in accordance with applicable legal requirements.
Matters on which we are required to report by exceptionIn the light of the knowledge and understanding of the Group and the Parent Company and its environment obtained in the course of the audit, we have not identified material misstatements in the Strategic Report or the Directors’ Report.
We have nothing to report in respect of the following matters in relation to which the Companies Act 2006 requires us to report to you if, in our opinion:• adequate accounting records have not been kept by the Parent Company, or returns adequate for our audit have not been
received from branches not visited by us; or• the Parent Company financial statements are not in agreement with the accounting records and returns; or• certain disclosures of Directors’ remuneration specified by law are not made; or • we have not received all the information and explanations we require for our audit.
Responsibilities of DirectorsAs explained more fully in the Directors’ responsibilities statement set out on page 29, the Directors are responsible for the preparation of the financial statements and for being satisfied that they give a true and fair view, and for such internal control as the Directors determine is necessary to enable the preparation of financial statements that are free from material misstatement, whether due to fraud or error.
In preparing the financial statements, the Directors are responsible for assessing the Group’s and the Parent Company’s ability to continue as a going concern, disclosing, as applicable, matters related to going concern and using the going concern basis of accounting unless the Directors either intend to liquidate the Group or the Parent Company or to cease operations, or have no realistic alternative but to do so.
INDEPENDENT AUDITOR’S REPORT CONTINUEDTO THE MEMBERS OF BLUE PRISM GROUP PLC
Blue Prism Group plc ANNUAL REPORT AND ACCOUNTS 2017
32 –
33
Auditor’s responsibilities for the audit of the financial statementsThis report is made solely to the Parent Company’s members, as a body, in accordance with Chapter 3 of Part 16 of the Companies Act 2006. Our audit work has been undertaken so that we might state to the Parent Company’s members those matters we are required to state to them in an auditor’s report and for no other purpose. To the fullest extent permitted by law, we do not accept or assume responsibility to anyone other than the Parent Company and the Parent Company’s members as a body, for our audit work, for this report, or for the opinions we have formed.
Our objectives are to obtain reasonable assurance about whether the financial statements as a whole are free from material misstatement, whether due to fraud or error, and to issue an auditor’s report that includes our opinion. Reasonable assurance is a high level of assurance, but is not a guarantee that an audit conducted in accordance with ISAs (UK) will always detect a material misstatement when it exists.
Misstatements can arise from fraud or error and are considered material if, individually or in the aggregate, they could reasonably be expected to influence the economic decisions of users taken on the basis of these financial statements.
A further description of our responsibilities for the audit of the financial statements is located on the Financial Reporting Council’s website at: www.frc.org.uk/auditorsresponsibilities.This description forms part of our auditor’s report.
Nicole Martin (Senior Statutory Auditor)For and on behalf of BDO LLP, Statutory AuditorLondon, United Kingdom25 January 2018
BDO LLP is a limited liability partnership registered in England and Wales (with registered number OC305127).
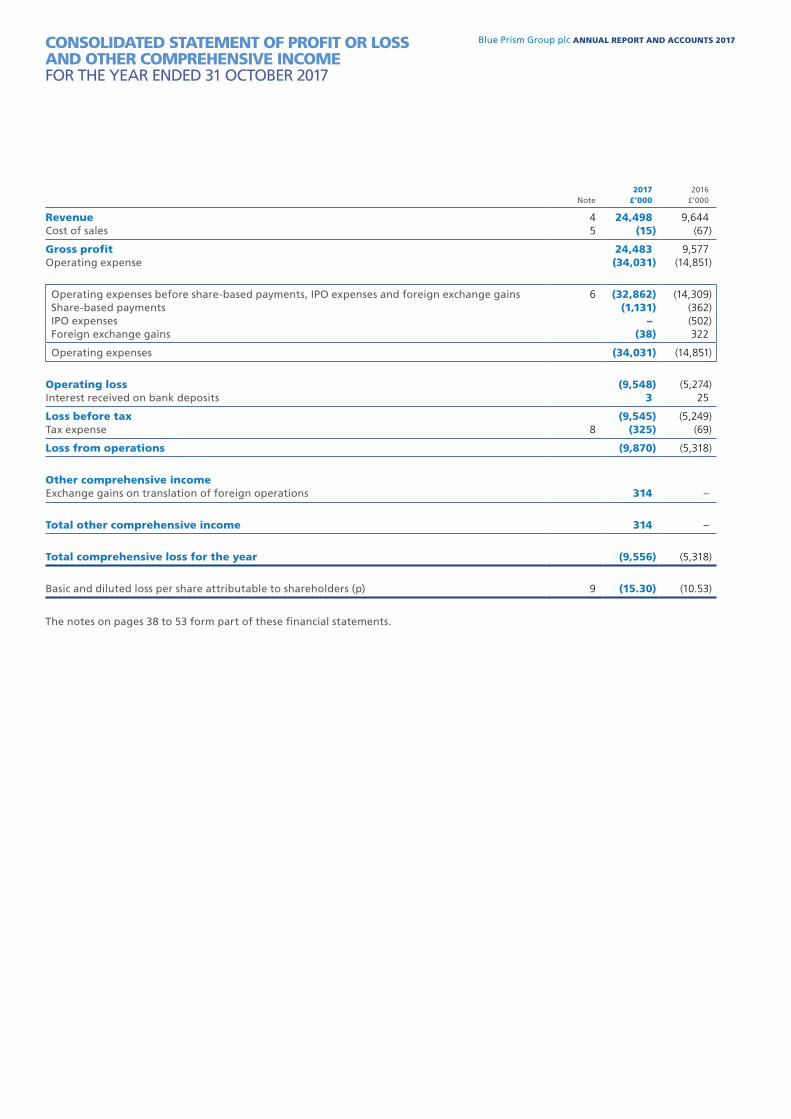
Blue Prism Group plc ANNUAL REPORT AND ACCOUNTS 2017
Note2017
£’0002016
£’000
Revenue 4 24,498 9,644Cost of sales 5 (15) (67)
Gross profit 24,483 9,577Operating expense (34,031) (14,851)
Operating expenses before share-based payments, IPO expenses and foreign exchange gains 6 (32,862) (14,309) Share-based payments (1,131) (362) IPO expenses – (502) Foreign exchange gains (38) 322
Operating expenses (34,031) (14,851)
Operating loss (9,548) (5,274)Interest received on bank deposits 3 25
Loss before tax (9,545) (5,249)Tax expense 8 (325) (69)
Loss from operations (9,870) (5,318)
Other comprehensive incomeExchange gains on translation of foreign operations 314 –
Total other comprehensive income 314 –
Total comprehensive loss for the year (9,556) (5,318)
Basic and diluted loss per share attributable to shareholders (p) 9 (15.30) (10.53)
The notes on pages 38 to 53 form part of these financial statements.
CONSOLIDATED STATEMENT OF PROFIT OR LOSS AND OTHER COMPREHENSIVE INCOMEFOR THE YEAR ENDED 31 OCTOBER 2017
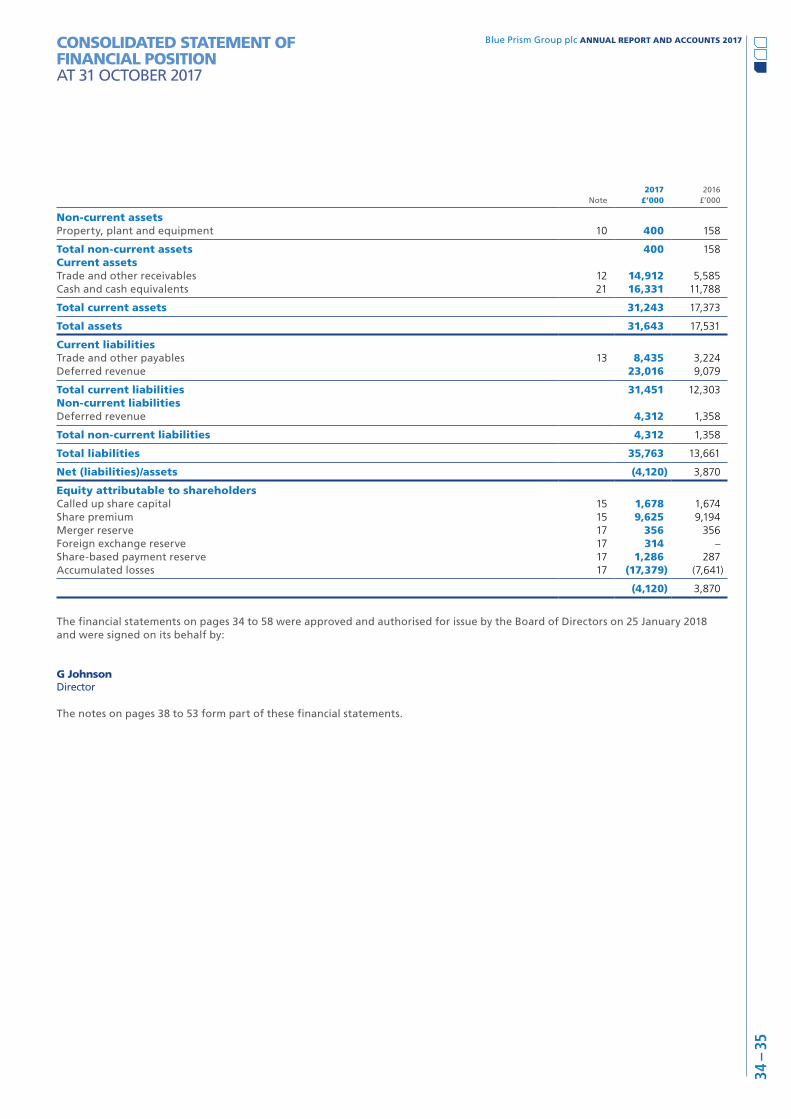
Blue Prism Group plc ANNUAL REPORT AND ACCOUNTS 2017
34 –
35
Note2017
£’0002016
£’000
Non-current assetsProperty, plant and equipment 10 400 158
Total non-current assets 400 158Current assetsTrade and other receivables 12 14,912 5,585Cash and cash equivalents 21 16,331 11,788
Total current assets 31,243 17,373
Total assets 31,643 17,531
Current liabilitiesTrade and other payables 13 8,435 3,224Deferred revenue 23,016 9,079
Total current liabilities 31,451 12,303Non-current liabilitiesDeferred revenue 4,312 1,358
Total non-current liabilities 4,312 1,358
Total liabilities 35,763 13,661
Net (liabilities)/assets (4,120) 3,870
Equity attributable to shareholdersCalled up share capital 15 1,678 1,674Share premium 15 9,625 9,194Merger reserve 17 356 356Foreign exchange reserve 17 314 –Share-based payment reserve 17 1,286 287Accumulated losses 17 (17,379) (7,641)
(4,120) 3,870
The financial statements on pages 34 to 58 were approved and authorised for issue by the Board of Directors on 25 January 2018 and were signed on its behalf by:
G JohnsonDirector
The notes on pages 38 to 53 form part of these financial statements.
CONSOLIDATED STATEMENT OF FINANCIAL POSITIONAT 31 OCTOBER 2017
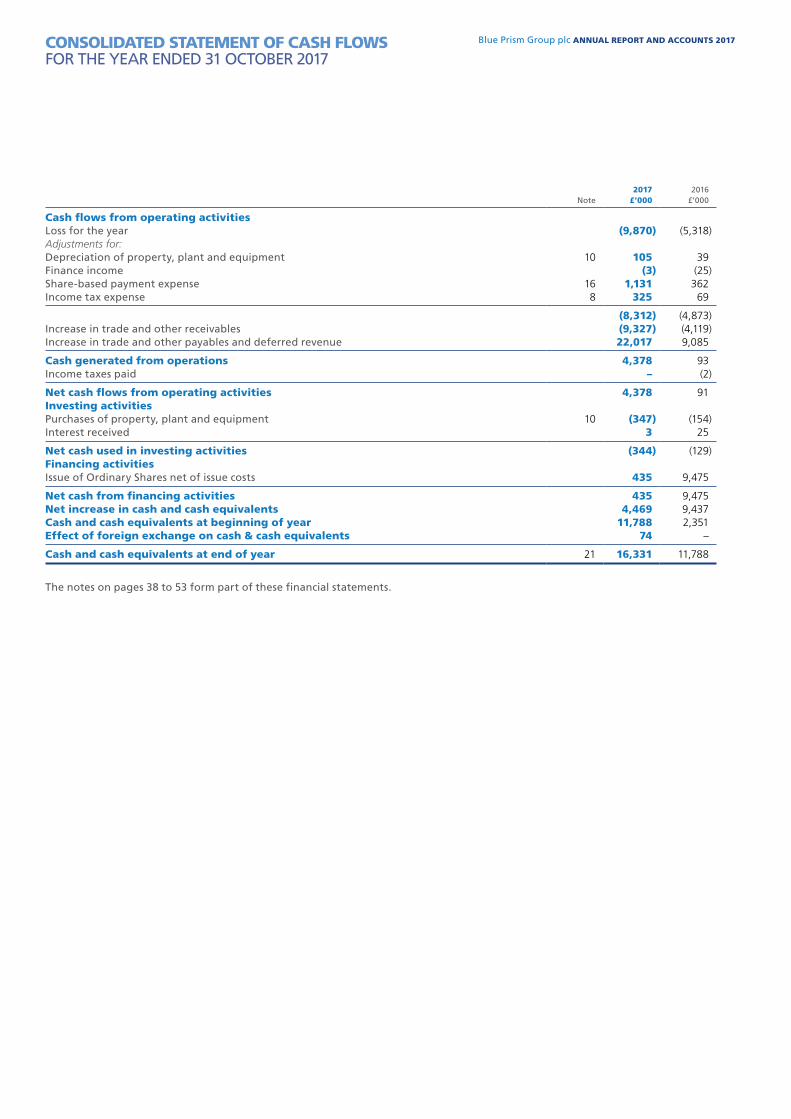
Blue Prism Group plc ANNUAL REPORT AND ACCOUNTS 2017
Note2017
£’0002016
£’000
Cash flows from operating activitiesLoss for the year (9,870) (5,318)Adjustments for:Depreciation of property, plant and equipment 10 105 39Finance income (3) (25)Share-based payment expense 16 1,131 362Income tax expense 8 325 69
(8,312) (4,873)Increase in trade and other receivables (9,327) (4,119)Increase in trade and other payables and deferred revenue 22,017 9,085
Cash generated from operations 4,378 93Income taxes paid – (2)
Net cash flows from operating activities 4,378 91Investing activitiesPurchases of property, plant and equipment 10 (347) (154)Interest received 3 25
Net cash used in investing activities (344) (129)Financing activitiesIssue of Ordinary Shares net of issue costs 435 9,475
Net cash from financing activities 435 9,475Net increase in cash and cash equivalents 4,469 9,437Cash and cash equivalents at beginning of year 11,788 2,351Effect of foreign exchange on cash & cash equivalents 74 –
Cash and cash equivalents at end of year 21 16,331 11,788
The notes on pages 38 to 53 form part of these financial statements.
CONSOLIDATED STATEMENT OF CASH FLOWSFOR THE YEAR ENDED 31 OCTOBER 2017
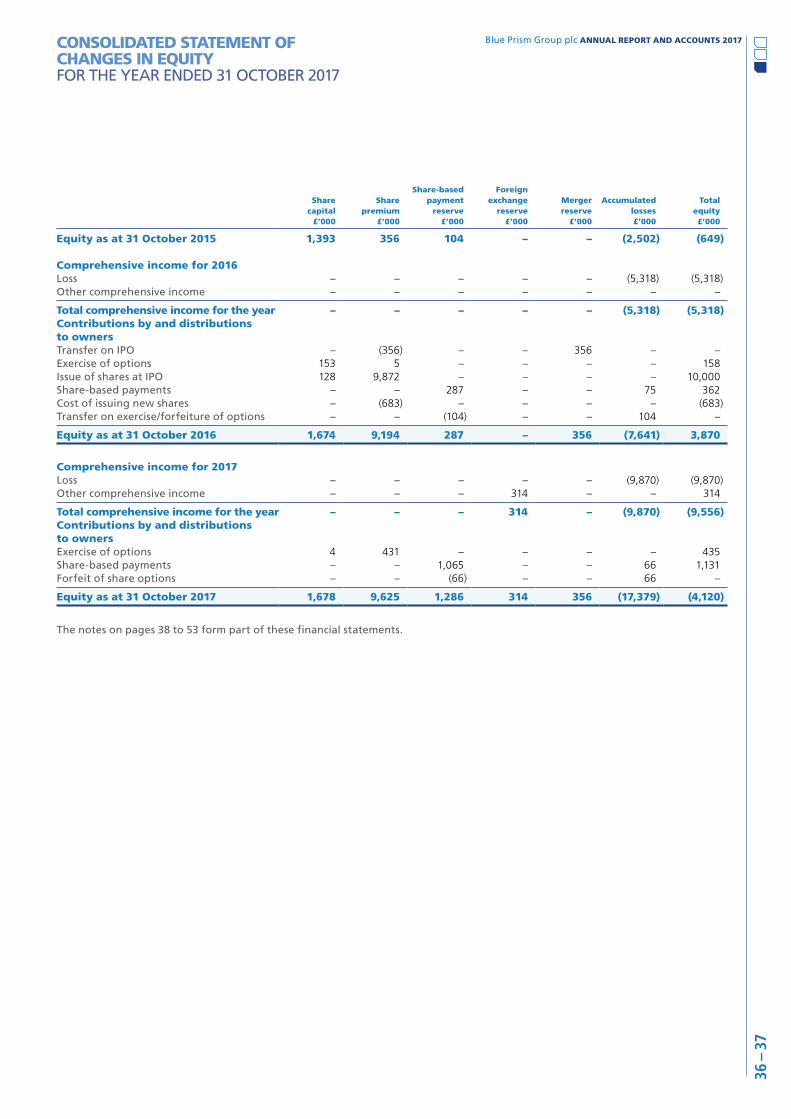
Blue Prism Group plc ANNUAL REPORT AND ACCOUNTS 2017
36 –
37
Share capital
£’000
Share premium
£’000
Share-based payment
reserve£’000
Foreign exchange
reserve£’000
Merger reserve
£’000
Accumulated losses£’000
Total equity£’000
Equity as at 31 October 2015 1,393 356 104 – – (2,502) (649)
Comprehensive income for 2016Loss – – – – – (5,318) (5,318)Other comprehensive income – – – – – – –
Total comprehensive income for the year – – – – – (5,318) (5,318)Contributions by and distributionsto ownersTransfer on IPO – (356) – – 356 – –Exercise of options 153 5 – – – – 158Issue of shares at IPO 128 9,872 – – – – 10,000Share-based payments – – 287 – – 75 362Cost of issuing new shares – (683) – – – – (683)Transfer on exercise/forfeiture of options – – (104) – – 104 –
Equity as at 31 October 2016 1,674 9,194 287 – 356 (7,641) 3,870
Comprehensive income for 2017Loss – – – – – (9,870) (9,870)Other comprehensive income – – – 314 – – 314
Total comprehensive income for the year – – – 314 – (9,870) (9,556)Contributions by and distributions to ownersExercise of options 4 431 – – – – 435Share-based payments – – 1,065 – – 66 1,131Forfeit of share options – – (66) – – 66 –
Equity as at 31 October 2017 1,678 9,625 1,286 314 356 (17,379) (4,120)
The notes on pages 38 to 53 form part of these financial statements.
CONSOLIDATED STATEMENT OF CHANGES IN EQUITYFOR THE YEAR ENDED 31 OCTOBER 2017
Blue Prism Group plc ANNUAL REPORT AND ACCOUNTS 2017
1 Accounting policiesBasis of preparationThe principal accounting policies adopted in the preparation of the consolidated financial statements are set out below. The policies have been consistently applied to all the years presented, unless otherwise stated.
The financial statements of the Group have been prepared on a going concern basis and in accordance with International Financial Reporting Standards (“IFRS") and their interpretations which have been issued by the International Accounting Standards Board (“IASB"), as adopted by the European Union. They have also been prepared with those parts of the 2006 Companies Act applicable to companies reporting under IFRS.
The preparation of financial statements in compliance with adopted IFRS requires the use of certain critical accounting estimates. It also requires Group management to exercise judgment in applying the Group’s accounting policies. The areas where significant judgements and estimates have been made in preparing the financial statements and their effect are disclosed in note 2.
Changes in accounting policiesa) New standards, interpretations and amendments effective from 1 November 2016There were no new standards or interpretations effective for the first time for periods beginning on or after 1 November 2016. None of the amendments to standards that are effective from that date had a significant effect on the Group’s financial statements.
b) New standards, interpretations and amendments not yet effectiveThe following new IASB standards, interpretations and amendments, which are not yet effective and have not been adopted early in these financial statements, may have a material impact on these financial statements:
IFRS 15 Revenue from Contracts with Customers, effective for periods commencing on or after 1 January 2018. The Directors have begun to assess the potential effects of this standard on the business and, in particular, if it will have any impact on the way revenue is recognised. A study is underway to fully understand and identify the impact on:i) revenue recognition; andii) accounting for commission on sales.
The Company is taking external advice and has set up a working committee to do the following:
IFRS 15 considerations What is the issue? Actions Potential impacts on the Group
Transitional arrangements
The IASB provides a choice of transition methods for the implementation of IFRS 15. The Group needs to determine which adoption approach is the most appropriate for the business.
Review all contracts completed by 1 November 2017 and due to be completed by 1 November 2018 to ascertain the most appropriate adoption approach.
Blue Prism is planning to apply the standard retrospectively, using the practical expedient to not restate contracts that begin and end within the same annual accounting period.
Identify contracts with customers
IFRS 15, as specified in its name, applies to contracts with customers. Blue Prism transacts through third parties but the contractual relationship for the software licence is directly between Blue Prism and the end user. There is a requirement to clearly identify who Blue Prism’s customer is in relation to this standard, the end user or the third party who sold the software to the end user.
Review the nature of our contracts to ascertain principal/agent position and confirm the end user is Blue Prism’s customer.
It is expected that Blue Prism is to be considered the principal, with the end user as its customer concerning licensing of the software. This is due to access to the software being provided by means of a key provided by Blue Prism to the end user and the contractual relationship concerning the licence is between Blue Prism and the end user.
Identify each performance obligation in our contracts
Support services for:a) upgrades; andb) end users and third party consultancy firms
Standard support services are included in the software licence fee. In addition, the end user may purchase extended support. There is a requirement to determine if the customer support obligations for separately purchased customer support programmes are distinct from the inclusive support obligations.
Review our contracts to identify the inter-relationship between licences and upgrades.
It is likely that the promises to license the software and provide upgrades will be regarded as distinct due to the software being capable of being used without the upgrades. Therefore the value of consideration under the contracts needs to be allocated between the obligations, and revenue recognised when the various obligations are performed.
NOTES FORMING PART OF THE FINANCIAL STATEMENTSFOR THE YEAR ENDED 31 OCTOBER 2017
Blue Prism Group plc ANNUAL REPORT AND ACCOUNTS 2017
38 –
39
IFRS 15 considerations What is the issue? Actions Potential impacts on the Group
Identify each performance obligation in our contracts
There is a requirement to ascertain over what period each distinct service is delivered. In addition, it needs to be determined if the end user has a right to access or right to use the software.
Evaluate contracts against the criteria described.
Ascertain whether the benefits are received rateably or not.
Review the metrics for the support activities across the different versions of the software and how this moves over the life of that version.
It is expected that the licence will be regarded as a right to use the software at a point in time, therefore meaning consideration allocated to the licence would then be recognised as revenue at that point. Currently revenue is recognised over the licence term and therefore IFRS 15 is likely to result in the acceleration of recognition of some revenue.
Determining the transaction price
There is a requirement to determine the stand alone selling price for each distinct performance obligation, such that this revenue can be recognised as each performance obligation is met.
Carry out a stand alone selling price exercise.
Transaction price is expected to be identified by either valuing the upgrade service using the cost plus approach with the licence value being determined on a residual basis. Alternatively, it may be that “upsell” prices can be used as a starting point for estimating the value of the licence obligation, with the upgrade service being valued as a residual.
Consideration of financing
Blue Prism usually receives payment for its services annually in advance. There is a requirement to assess whether there is a significant financing component where payments are received more than 12 months upfront.
Review quantum of payment terms more advantageous than annually in advance for potential existence of a significant financing component.
Amortisation will need to be matched with the period over which the relevant contract services are provided. Therefore, if the Group’s recognition of licence income is accelerated, and this forms the bulk of revenues under the standard, then the current policy of expensing commissions may not require substantial amendment.
Costs of obtaining contracts
Sales commission Currently Blue Prism expenses all commissions to the P&L as they are incurred. Under IFRS 15, Blue Prism will be required to capitalise sales commissions under certain conditions. In this case, the amortised commissions will be matched over the period the relevant contract services are provided.
An analysis of the commissions incurred over the relevant transition period needs to be undertaken and compared with the margins and periods of performance obligations identified during the revenue analysis.
Amortisation will need to be matched with the period over which the relevant contract services are provided. It may be that if Blue Prism’s recognition of licence income is accelerated, and this forms the bulk of revenues under the standard, then the current policy of expensing commissions may not require substantial amendment.
This project commenced in November 2017 and is expected to be completed prior to the year-end October 2018.
IFRS 9 Financial Instruments, effective for periods commencing on or after 1 January 2018. The impact of this standard is being considered by the Directors and any impact, especially around the value of debtors, is yet to be fully investigated.
IFRS 16 Leases, effective for periods commencing on or after 1 January 2019. The Directors are assessing the impact of this standard and the possible impact of any leases being capitalised on the balance sheet. A full review is yet to take place. Due to the pace of growth of the business this will be more appropriately reviewed during 2018.
Blue Prism Group plc ANNUAL REPORT AND ACCOUNTS 2017
1 Accounting policies continuedBasis of consolidationThe consolidated financial statements present the results of the Company and its subsidiaries (“the Group”) as if they formed a single entity. Intercompany transactions and balances between Group companies are therefore eliminated in full. The financial statements of the Group have been prepared on a going concern basis and in accordance with International Financial Reporting Standards (“IFRS") and their interpretations which have been issued by the International Accounting Standards Board (“IASB"), as adopted by the European Union. They have also been prepared with those parts of the 2006 Companies Act applicable to companies reporting under IFRS. Due to the nature of the Group’s business model, which involves annual invoicing of software licences and recognising the revenues over the period of the contract, and due to the fast growth of the business, the deferred revenue account has grown significantly which has created the negative balance sheet in the financial statements. The deferred income is non-refundable and so the Directors are confident that the business has sufficient working capital to satisfy liabilities as they arise.
The preparation of financial statements in compliance with adopted IFRS requires the use of certain critical accounting estimates. It also requires Group management to exercise judgement in applying the Group’s accounting policies. The areas where significant judgements and estimates have been made in preparing the financial statements and their effect are disclosed in note 2.
Group reorganisation and IPODuring 2016 the Group was subject to restructuring prior to the IPO. Blue Prism Group plc was positioned at the top of the Group as the new Parent Company, with the former Parent, Blue Prism Limited, becoming a wholly-owned direct subsidiary of Blue Prism Group plc through a share-for-share exchange. Such Group reorganisations are outside of IFRS3 as the Company does not meet the definition of a business and as such has been accounted for as a Group reorganisation rather than a reverse acquisition.
The Group reconstruction in 2016 has been accounted for using merger accounting principles. Therefore, the consolidated financial statements of Blue Prism Group plc are presented as if Blue Prism Group plc and Blue Prism Limited had always been part of the same Group. Accordingly, the results of Blue Prism Limited for the entire year ended 31 October 2016 are shown in the consolidated statement of comprehensive income.
Transaction costs that relate directly to the issue of new equity instruments were accounted for as a deduction from equity. Where IPO transaction costs related to both the listing of pre-existing and newly issued shares, those costs have been allocated proportionally between profit or loss and equity on the basis of the proportion of the new shares issued.
Revenue recognitionThe Group recognises revenue depending on the substance and legal form of the contracts with its customers. Revenue is recognised once a legally binding contract between the Group and its customers has been established and the delivery of the service has commenced. Service delivery is triggered by providing a “software key” to the customer, and the commencement date of the licence is reached, allowing them access to the software for the licence period.
Revenue includes the provision of a licence through a software key, follow up support, and maintenance, throughout the term of the licence. Provided the amount of revenue can be measured reliably and it is probable that the Group will receive consideration, revenue from the provision of a licence and follow up services is recognised from the licence start date over the period of the licence, which is also the period in which the services are rendered, on a straight-line basis.
Licence fee revenues, support revenues, and maintenance revenues are bundled together, as the revenue streams have no individual value as standalone items, due to the specific nature of the software, and the specific nature of the support services and maintenance. As such, these elements are considered as being intertwined and therefore inseparable due to their value together. Maintenance is incurred throughout the licence term on an ongoing basis. Support is provided throughout the licence period, and varies depending on how the customer chooses to deploy the software.
Revenue for these licences, support, and maintenance are recognised on an accruals basis; when invoiced in advance, the income is deferred in the statement of financial position and recognised in the income statement over the length of the licence and maintenance period. This policy is consistently applied across all customers and contracts.
Professional services revenues are recognised when the service has been delivered. If billed in advance, the income related to consultancy days not yet delivered at the end of the period is deferred and recognised in the income statement when the service takes place.
Training revenues are recognised at the point the training course has been completed.
Sales commissionSales commission is recognised in the profit and loss in wages and salaries at the point at which the contract is signed and paid once the initial invoice has been collected. This is recognised up front as opposed to deferring this cost over the period of the contract as it is deemed an introductory fee, and is not affected by the future performance of a contract.
NOTES FORMING PART OF THE FINANCIAL STATEMENTS CONTINUEDFOR THE YEAR ENDED 31 OCTOBER 2017
Blue Prism Group plc ANNUAL REPORT AND ACCOUNTS 2017
40 –
41
Foreign currencyTransactions entered into by Group entities in a currency other than the currency of the primary economic environment in which they operate (their “functional currency”) are recorded at the rates ruling when the transactions occur. Foreign currency monetary assets and liabilities are translated at the rates ruling at the reporting date. Exchange differences arising on the retranslation of unsettled monetary assets and liabilities are recognised immediately in profit or loss. At the balance sheet date the non-sterling balances of the overseas entities are retranslated at the rate ruling at the balance sheet date and the foreign exchange gain or loss is shown in foreign exchange reserves.
During the period the Board has made the decision to change the functional currency of Blue Prism Software Inc, a wholly-owned subsidiary within the Group, to US dollars. The decision to change the functional currency to US dollars was made as a consequence of sales volumes increasing in the prior period and expenses becoming increasingly US dollar denominated. As a result of this, with effective 1 November 2016, the Board made the decision to change the functional currency to US dollars.
Trade receivablesTrade receivables are amounts due from customers for services provided in the ordinary course of business and are stated net of any provision for impairment. Impairment provisions are recognised when there is objective evidence (such as significant financial difficulties on the part of the counterparty or default, or significant delay in payment) that the Group will be unable to collect all of the amounts due. The amount of such a provision is the difference between the net carrying amount and the present value of the future expected cash flows associated with the impaired receivable. Cash and cash equivalents Cash and cash equivalents includes cash in hand, deposits held at call with banks, other short-term highly liquid investments with original maturities of 3 months or less.
Financial assetsThe only financial assets held by Blue Prism Group plc are trade receivables and other cash and cash equivalents. Due to their short term nature, the carrying value of cash and cash equivalents, trade and other receivables approximate their fair value.
Financial liabilitiesFinancial liabilities are recognised when the Group becomes a party to the contractual provisions of the financial instrument.
All financial liabilities are recognised initially at fair value plus directly attributable transaction costs and subsequently measured at amortised cost using the effective interest method other than those categorised as fair value through income statement.
Share capitalFinancial instruments issued by the Group are classified as equity only to the extent that they do not meet the definition of a financial liability or financial asset.
The Group’s Ordinary Shares are classified as equity instruments.
Share-based paymentsWhere equity-settled share options are awarded to employees, the fair value of the options at the date of grant is charged to the consolidated statement of comprehensive income over the vesting period. Non-market vesting conditions are taken into account by adjusting the number of equity instruments expected to vest at each reporting date so that, ultimately, the cumulative amount recognised over the vesting period is based on the number of options that eventually vest. Non-vesting conditions and market vesting conditions are factored into the fair value of the options granted. As long as all other vesting conditions are satisfied, a charge is made irrespective of whether the market vesting conditions are satisfied. The cumulative expense is not adjusted for failure to achieve a market vesting condition or where a non-vesting condition is not satisfied.
Where the terms and conditions of options are modified before they vest, the increase in the fair value of the options, measured immediately before and after the modification, is also charged to the consolidated statement of comprehensive income over the remaining vesting period.
Where equity instruments are granted to persons other than employees, the consolidated statement of comprehensive income is charged with the fair value of goods and services received.
Defined contribution pension schemesContributions to defined contribution pension schemes are charged to the consolidated statement of comprehensive income in the year to which they relate.
Leased assetsWhere substantially all of the risks and rewards incidental to ownership are not transferred to the Group (an “operating lease”), the total rentals payable under the lease are charged to the consolidated statement of comprehensive income on a straight-line basis over the lease term. The aggregate benefit of lease incentives is recognised as a reduction of the rental expense over the lease term on a straight-line basis.
Blue Prism Group plc ANNUAL REPORT AND ACCOUNTS 2017
1 Accounting policies continuedDeferred taxationDeferred tax is recognised in respect of relevant temporary differences that have originated but not reversed at the balance sheet date. A deferred tax asset is recognised to the extent that it is probable that future taxable profits will be available against which temporary differences can be utilised. The deferred tax assets and liabilities are not discounted.
Property, plant and equipmentProperty, plant and equipment are stated at cost less accumulated depreciation and impairment losses, if any. The cost of an item of property, plant and equipment initially recognised includes its purchase price and any cost that is directly attributable to bringing the asset to the location and condition necessary for it to be capable of operating in the manner intended by management.
Depreciation is calculated under the straight-line method to write off the depreciable amount of the assets over their estimated useful lives. The principal annual rates used for this purpose are:
Computer equipment – straight line over 3 years
Research and development expenditureResearch expenditure is recognised as an expense when it is incurred.Development expenditure is capitalised if, and only if, the Group can demonstrate all of the following:(i) the ability to measure reliably the expenditure attributable to the asset under development;(ii) the product or process is technically and commercially feasible; (iii) its future economic benefits are probable;(iv) the ability to use or sell the developed asset; and(v) the availability of adequate technical, financial and other resources to complete the asset under development.
Currently, development expenditure does not meet the criteria to be capitalised as it is not possible to reliably measure the expenditure attributable to the RPA (see note 2). This development expenditure is expensed as incurred. If the criteria is met, future capitalised development expenditure would be measured at cost less accumulated amortisation and impairment losses, if any.
Any future capitalised development expenditure will be amortised on a straight-line method when the services are ready for sale or use. In the event that it is no longer probable that the expected future economic benefits will be recovered, the development expenditure would be written down to its recoverable amount.
NOTES FORMING PART OF THE FINANCIAL STATEMENTS CONTINUEDFOR THE YEAR ENDED 31 OCTOBER 2017
Blue Prism Group plc ANNUAL REPORT AND ACCOUNTS 2017
42 –
43
2 Key accounting estimates and judgementsThe Group makes certain estimates and assumptions regarding the future. Estimates and judgements are continually evaluated based on historical experience and other factors, including expectations of future events that are believed to be reasonable under the circumstances. In the future, actual experience may differ from these estimates and assumptions. The estimates and assumptions that have a significant risk of causing a material adjustment to the carrying amounts of assets and liabilities within the next financial year are discussed below.• Licence fee revenues, support revenues, and maintenance revenues are bundled together, as the revenue streams have no
individual value as stand alone items, due to the specific nature of the software, and the specific nature of the support services and maintenance. As such, these elements are considered as being intertwined and therefore inseparable due to their value together. Maintenance is incurred throughout the licence term on an ongoing basis. Support is provided throughout the licence period, and varies depending on how the customer chooses to deploy the software. The key judgements are that the different elements are bundled together due to the fact the 2 parts are intertwined with each constituent part been deemed to have no value as a stand alone function, and as such all elements are recognised together, spread over the licence period.
• Research and development costs – Under IAS 38, Research and development costs, internally generated technology should be capitalised if the capitalisation criteria are met. Assumptions and judgements are made with regard to assessing the expected future economic benefits, the economic useful life and the level of completion of the databases. Under IAS 38, at the point where activities no longer relate to development but to maintenance, capitalisation is to be discontinued.
The key judgements here are defining the cut-off point between when research ends and development starts, and reliably measuring the expenditure attributable to the asset. An assessment is made when looking at the costs incurred and criteria for development costs, including the commercial and technical viability of the costs being assured. The main costs attributed to research and development costs is that of payroll, with research and development team tasked with other aspects of quality assurance, customer support, project management, along with other tasks. Therefore, further to considerations above, it is therefore difficult to ascertain the cut-off between research and development, and to quantify any value between each within the business.
3 Financial instruments – risk managementIn common with all other businesses, the Group is exposed to risks that arise from its use of financial instruments. This note describes the Group’s objectives, policies and processes for managing those risks and the methods used to measure them. Further quantitative information in respect of these risks is presented throughout these financial statements.
There have been no substantive changes in the Group’s exposure to financial instrument risks, its objectives, policies and processes for managing those risks or the methods used to measure them from previous periods unless otherwise stated in this note.
Capital risk managementThe Group manages its capital to ensure that all Group entities will be able to continue on a going concern basis while maximising its long-term return to shareholders. The capital structure of the Group consists of Company equity only, comprising issued capital, share premium, reserves and retained earnings. The Group is not exposed to any externally imposed capital requirements and has no borrowings.
Financial instruments by category
Financial assets2017
£’0002016
£’000
Trade receivables 13,532 4,931Other debtors 739 80Cash and cash equivalents 16,331 11,788
Total financial assets 30,602 16,799
Financial liabilities2017
£’0002016
£’000
Trade and other payables 1,552 1,193Accruals 5,801 2,031
Total financial liabilities 7,353 3,224
Blue Prism Group plc ANNUAL REPORT AND ACCOUNTS 2017
3 Financial instruments – risk management continuedGeneral objectives, policies and processesThe Board has overall responsibility for the determination of the Group’s risk management objectives and policies and, whilst retaining ultimate responsibility for them, it has delegated the authority for designing and operating processes that ensure the effective implementation of the objectives and policies to the Group’s finance function.
The overall objective of the Board is to set policies that seek to reduce risk as far as possible without unduly affecting the Group’s competitiveness and flexibility. Further details regarding these policies are set out below:
Credit riskCredit risk is the risk of financial loss to the Group if a customer or counterparty to a financial instrument fails to meet its contractual obligations. The Group is mainly exposed to credit risk from credit sales. It is Group policy to assess the credit risk of new customers before entering contracts.
The Board has established a credit policy under which each new customer is analysed individually for creditworthiness before the Group’s standard payment and delivery terms and conditions are offered. The Group’s review includes external ratings, when available.
Credit risk also arises from cash and cash equivalents and deposits with banks and financial institutions. For banks and financial institutions, only independently rated parties with minimum rating “A” are accepted.
Further disclosures regarding trade and other receivables, which are neither past due nor impaired, are provided in note 12.
Cash at bank and short-term depositsThe Group’s cash is held on deposit with the Group’s principal bankers.
Foreign exchange riskForeign exchange risk arises when individual Group entities enter into transactions denominated in a currency other than their functional currency. The Group’s policy is, where possible, to allow Group entities to settle liabilities denominated in their functional currency, with the cash generated from their own operations in that currency. Where Group entities have liabilities denominated in a currency other than their functional currency (and have insufficient reserves of that currency to settle them), cash already denominated in that currency will, where possible, be transferred from elsewhere within the Group.
During the year the Group’s potential exposure to currency risk has increased due to the increased level of business in the US. The Group is predominantly exposed to currency risk on the balances held in working capital within the Group and the exposure is concentrated therefore in the movement of the US dollar against sterling. The effect of a strengthening and weakening of 10% of the US dollar against sterling at the reporting date on the working capital balances held at this date, on the basis that all other variables remained constant, would have resulted in the following pre-tax profit or (loss) impact for the year as follows:
10% strengthening
£’000
10% weakening
£’000
US dollar to sterling 724 (890)
Liquidity riskLiquidity risk arises from the Group’s management of working capital. It is the risk that the Group will encounter difficulty in meeting its financial obligations as they fall due.
The Group’s policy is to ensure that it will always have sufficient cash to allow it to meet its liabilities when they become due. To achieve this aim, it seeks to maintain cash balances (or agreed facilities) to meet expected requirements for a period of at least 90 days.
The maximum exposure to liquidity risk is the trade payables and sales introduction commissions accrued at the year end, these are all current and expected to be settled within 90 days of the year end.
The Board receives rolling 12-month cash flow projections on a monthly basis as well as information regarding cash balances. At the end of the financial year, these projections indicated that the Group expected to have sufficient liquid resources to meet its obligations under all reasonably expected circumstances for at least 12 months from the date of signing these financial statements.
NOTES FORMING PART OF THE FINANCIAL STATEMENTS CONTINUEDFOR THE YEAR ENDED 31 OCTOBER 2017
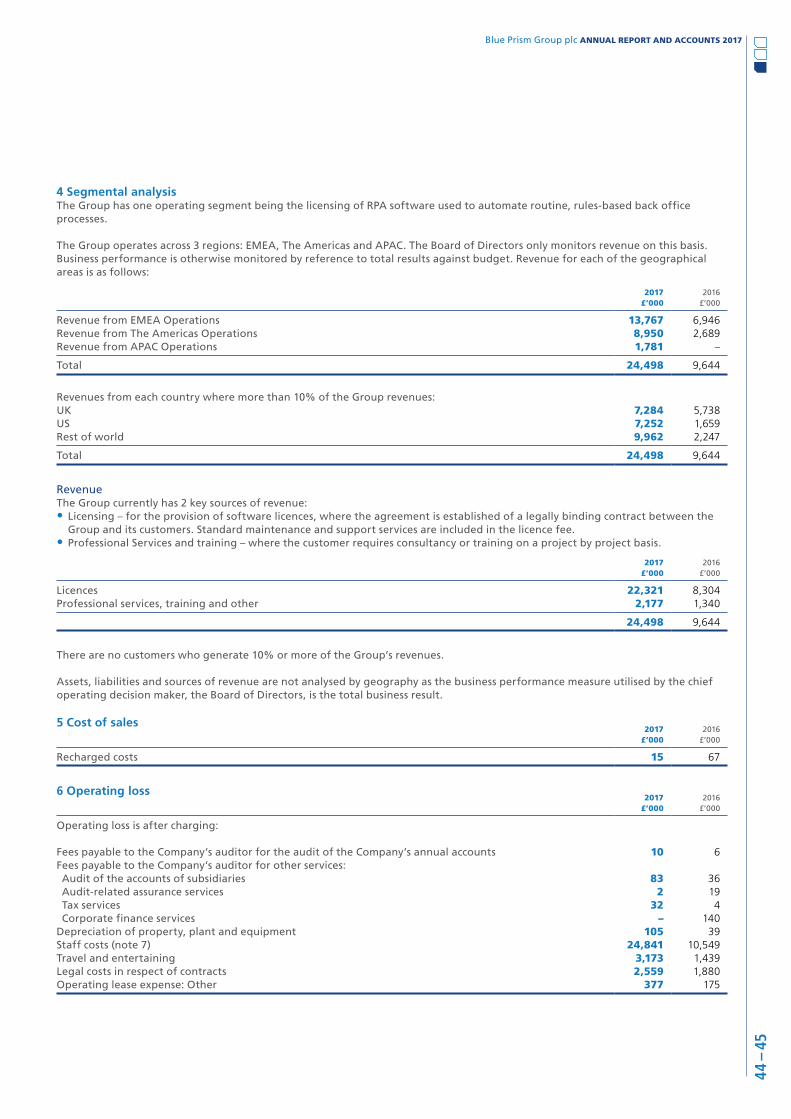
Blue Prism Group plc ANNUAL REPORT AND ACCOUNTS 2017
44 –
45
4 Segmental analysisThe Group has one operating segment being the licensing of RPA software used to automate routine, rules-based back office processes.
The Group operates across 3 regions: EMEA, The Americas and APAC. The Board of Directors only monitors revenue on this basis. Business performance is otherwise monitored by reference to total results against budget. Revenue for each of the geographical areas is as follows:
2017£’000
2016£’000
Revenue from EMEA Operations 13,767 6,946Revenue from The Americas Operations 8,950 2,689Revenue from APAC Operations 1,781 –
Total 24,498 9,644
Revenues from each country where more than 10% of the Group revenues:UK 7,284 5,738US 7,252 1,659Rest of world 9,962 2,247
Total 24,498 9,644
RevenueThe Group currently has 2 key sources of revenue:• Licensing – for the provision of software licences, where the agreement is established of a legally binding contract between the
Group and its customers. Standard maintenance and support services are included in the licence fee.• Professional Services and training – where the customer requires consultancy or training on a project by project basis.
2017£’000
2016£’000
Licences 22,321 8,304Professional services, training and other 2,177 1,340
24,498 9,644
There are no customers who generate 10% or more of the Group’s revenues.
Assets, liabilities and sources of revenue are not analysed by geography as the business performance measure utilised by the chief operating decision maker, the Board of Directors, is the total business result.
5 Cost of sales2017
£’0002016
£’000
Recharged costs 15 67
6 Operating loss2017
£’0002016
£’000
Operating loss is after charging:
Fees payable to the Company’s auditor for the audit of the Company’s annual accounts 10 6Fees payable to the Company’s auditor for other services: Audit of the accounts of subsidiaries 83 36 Audit-related assurance services 2 19 Tax services 32 4 Corporate finance services – 140Depreciation of property, plant and equipment 105 39Staff costs (note 7) 24,841 10,549Travel and entertaining 3,173 1,439Legal costs in respect of contracts 2,559 1,880Operating lease expense: Other 377 175
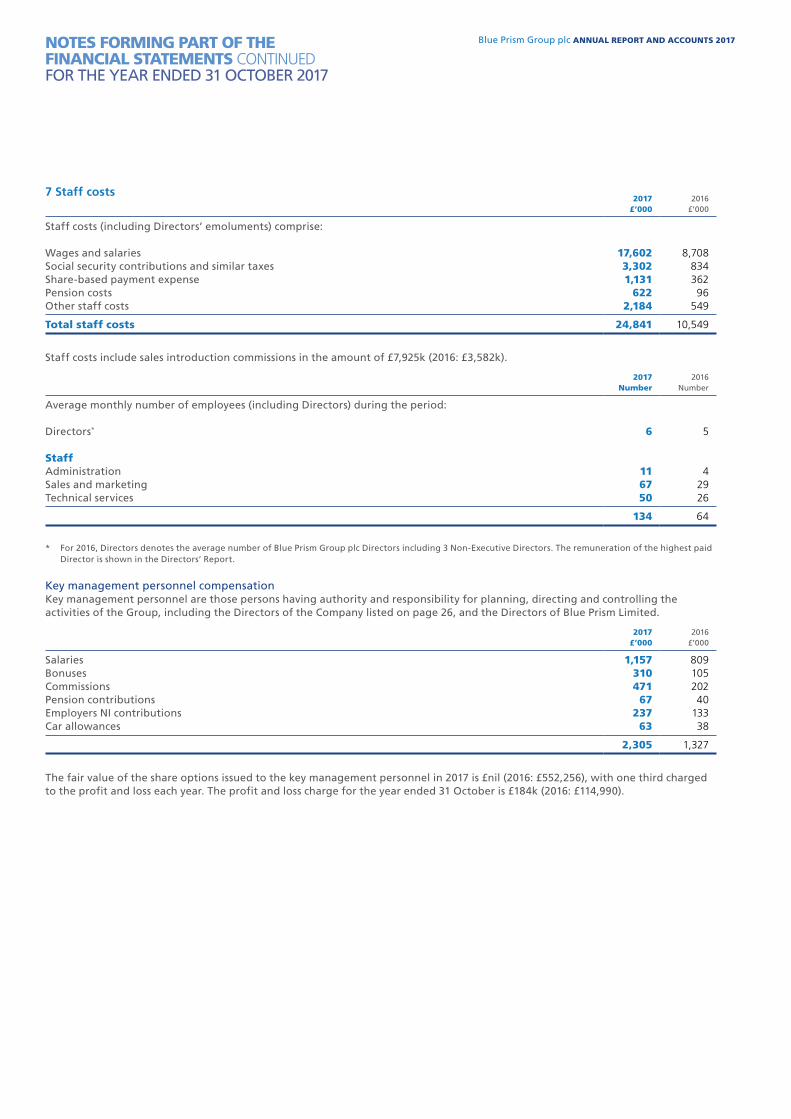
Blue Prism Group plc ANNUAL REPORT AND ACCOUNTS 2017
7 Staff costs2017
£’0002016
£’000
Staff costs (including Directors’ emoluments) comprise:
Wages and salaries 17,602 8,708Social security contributions and similar taxes 3,302 834Share-based payment expense 1,131 362Pension costs 622 96Other staff costs 2,184 549
Total staff costs 24,841 10,549
Staff costs include sales introduction commissions in the amount of £7,925k (2016: £3,582k).
2017Number
2016Number
Average monthly number of employees (including Directors) during the period:
Directors* 6 5
StaffAdministration 11 4Sales and marketing 67 29Technical services 50 26
134 64
* For 2016, Directors denotes the average number of Blue Prism Group plc Directors including 3 Non-Executive Directors. The remuneration of the highest paid Director is shown in the Directors’ Report.
Key management personnel compensationKey management personnel are those persons having authority and responsibility for planning, directing and controlling the activities of the Group, including the Directors of the Company listed on page 26, and the Directors of Blue Prism Limited.
2017£’000
2016£’000
Salaries 1,157 809Bonuses 310 105Commissions 471 202Pension contributions 67 40Employers NI contributions 237 133Car allowances 63 38
2,305 1,327
The fair value of the share options issued to the key management personnel in 2017 is £nil (2016: £552,256), with one third charged to the profit and loss each year. The profit and loss charge for the year ended 31 October is £184k (2016: £114,990).
NOTES FORMING PART OF THE FINANCIAL STATEMENTS CONTINUEDFOR THE YEAR ENDED 31 OCTOBER 2017
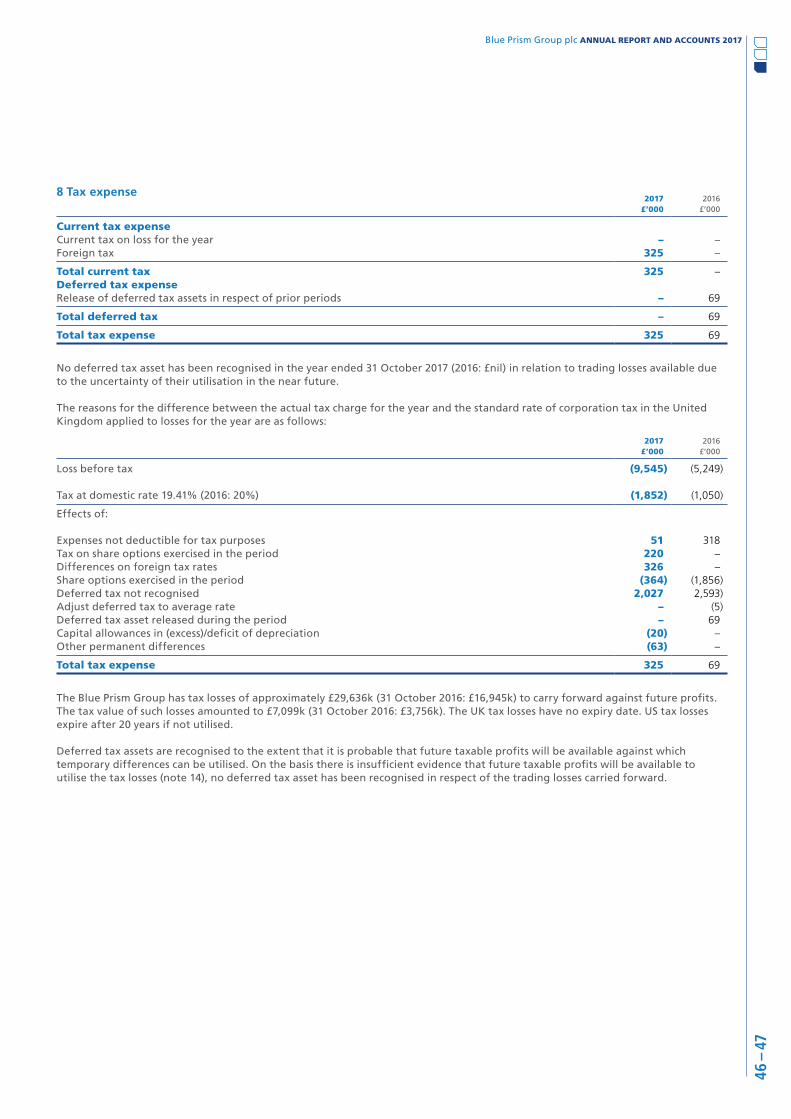
Blue Prism Group plc ANNUAL REPORT AND ACCOUNTS 2017
46 –
47
8 Tax expense2017
£’0002016
£’000
Current tax expenseCurrent tax on loss for the year – –Foreign tax 325 –
Total current tax 325 –Deferred tax expenseRelease of deferred tax assets in respect of prior periods – 69
Total deferred tax – 69
Total tax expense 325 69
No deferred tax asset has been recognised in the year ended 31 October 2017 (2016: £nil) in relation to trading losses available due to the uncertainty of their utilisation in the near future.
The reasons for the difference between the actual tax charge for the year and the standard rate of corporation tax in the United Kingdom applied to losses for the year are as follows:
2017£’000
2016£’000
Loss before tax (9,545) (5,249)
Tax at domestic rate 19.41% (2016: 20%) (1,852) (1,050)
Effects of:
Expenses not deductible for tax purposes 51 318Tax on share options exercised in the period 220 –Differences on foreign tax rates 326 –Share options exercised in the period (364) (1,856)Deferred tax not recognised 2,027 2,593)Adjust deferred tax to average rate – (5)Deferred tax asset released during the period – 69Capital allowances in (excess)/deficit of depreciation (20) –Other permanent differences (63) –
Total tax expense 325 69
The Blue Prism Group has tax losses of approximately £29,636k (31 October 2016: £16,945k) to carry forward against future profits. The tax value of such losses amounted to £7,099k (31 October 2016: £3,756k). The UK tax losses have no expiry date. US tax losses expire after 20 years if not utilised.
Deferred tax assets are recognised to the extent that it is probable that future taxable profits will be available against which temporary differences can be utilised. On the basis there is insufficient evidence that future taxable profits will be available to utilise the tax losses (note 14), no deferred tax asset has been recognised in respect of the trading losses carried forward.
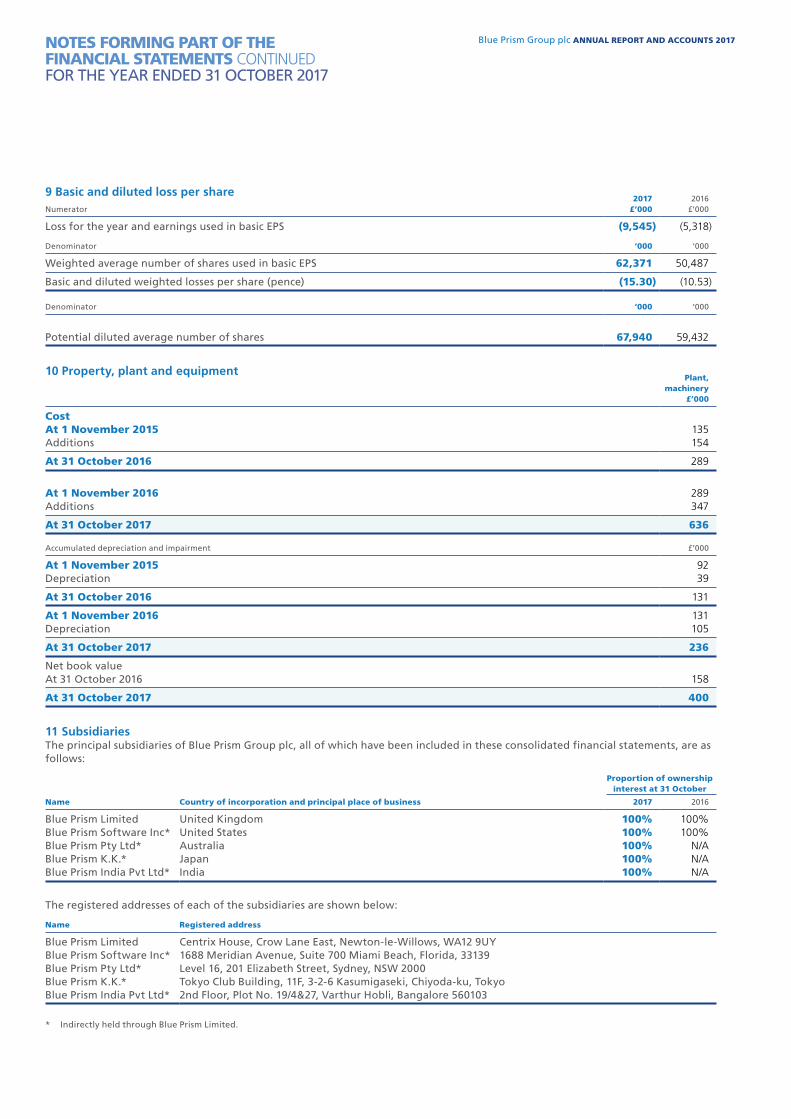
Blue Prism Group plc ANNUAL REPORT AND ACCOUNTS 2017
9 Basic and diluted loss per shareNumerator
2017£’000
2016£’000
Loss for the year and earnings used in basic EPS (9,545) (5,318)
Denominator ‘000 ‘000
Weighted average number of shares used in basic EPS 62,371 50,487
Basic and diluted weighted losses per share (pence) (15.30) (10.53)
Denominator ‘000 ‘000
Potential diluted average number of shares 67,940 59,432
10 Property, plant and equipmentPlant,
machinery£’000
CostAt 1 November 2015 135Additions 154
At 31 October 2016 289
At 1 November 2016 289Additions 347
At 31 October 2017 636
Accumulated depreciation and impairment £’000
At 1 November 2015 92Depreciation 39
At 31 October 2016 131
At 1 November 2016 131Depreciation 105
At 31 October 2017 236
Net book valueAt 31 October 2016 158
At 31 October 2017 400
11 SubsidiariesThe principal subsidiaries of Blue Prism Group plc, all of which have been included in these consolidated financial statements, are as follows:
Proportion of ownership interest at 31 October
Name Country of incorporation and principal place of business 2017 2016
Blue Prism Limited United Kingdom 100% 100%Blue Prism Software Inc* United States 100% 100%Blue Prism Pty Ltd* Australia 100% N/ABlue Prism K.K.* Japan 100% N/ABlue Prism India Pvt Ltd* India 100% N/A
The registered addresses of each of the subsidiaries are shown below:
Name Registered address
Blue Prism Limited Centrix House, Crow Lane East, Newton-le-Willows, WA12 9UYBlue Prism Software Inc* 1688 Meridian Avenue, Suite 700 Miami Beach, Florida, 33139Blue Prism Pty Ltd* Level 16, 201 Elizabeth Street, Sydney, NSW 2000Blue Prism K.K.* Tokyo Club Building, 11F, 3-2-6 Kasumigaseki, Chiyoda-ku, TokyoBlue Prism India Pvt Ltd* 2nd Floor, Plot No. 19/4&27, Varthur Hobli, Bangalore 560103
* Indirectly held through Blue Prism Limited.
NOTES FORMING PART OF THE FINANCIAL STATEMENTS CONTINUEDFOR THE YEAR ENDED 31 OCTOBER 2017
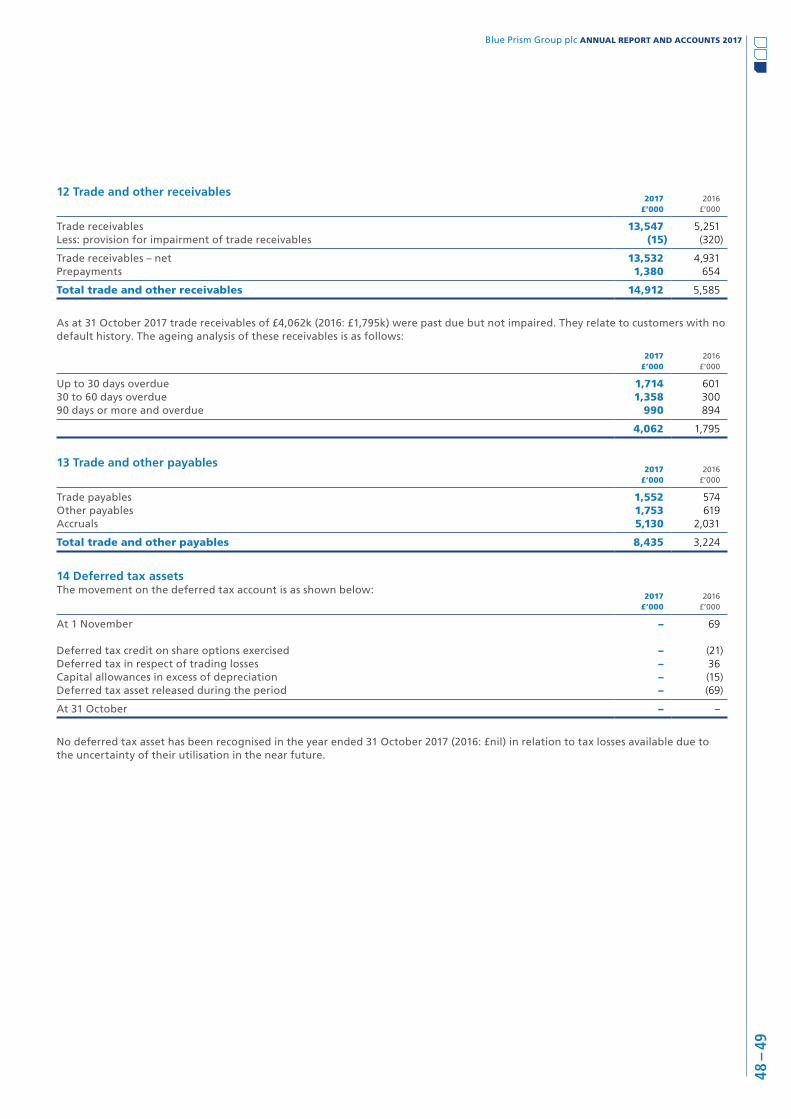
Blue Prism Group plc ANNUAL REPORT AND ACCOUNTS 2017
48 –
49
12 Trade and other receivables2017
£’0002016
£’000
Trade receivables 13,547 5,251Less: provision for impairment of trade receivables (15) (320)
Trade receivables – net 13,532 4,931Prepayments 1,380 654
Total trade and other receivables 14,912 5,585
As at 31 October 2017 trade receivables of £4,062k (2016: £1,795k) were past due but not impaired. They relate to customers with no default history. The ageing analysis of these receivables is as follows:
2017£’000
2016£’000
Up to 30 days overdue 1,714 60130 to 60 days overdue 1,358 30090 days or more and overdue 990 894
4,062 1,795
13 Trade and other payables2017
£’0002016
£’000
Trade payables 1,552 574Other payables 1,753 619Accruals 5,130 2,031
Total trade and other payables 8,435 3,224
14 Deferred tax assetsThe movement on the deferred tax account is as shown below:
2017 £’000
2016 £’000
At 1 November – 69
Deferred tax credit on share options exercised – (21)Deferred tax in respect of trading losses – 36Capital allowances in excess of depreciation – (15)Deferred tax asset released during the period – (69)
At 31 October – –
No deferred tax asset has been recognised in the year ended 31 October 2017 (2016: £nil) in relation to tax losses available due to the uncertainty of their utilisation in the near future.
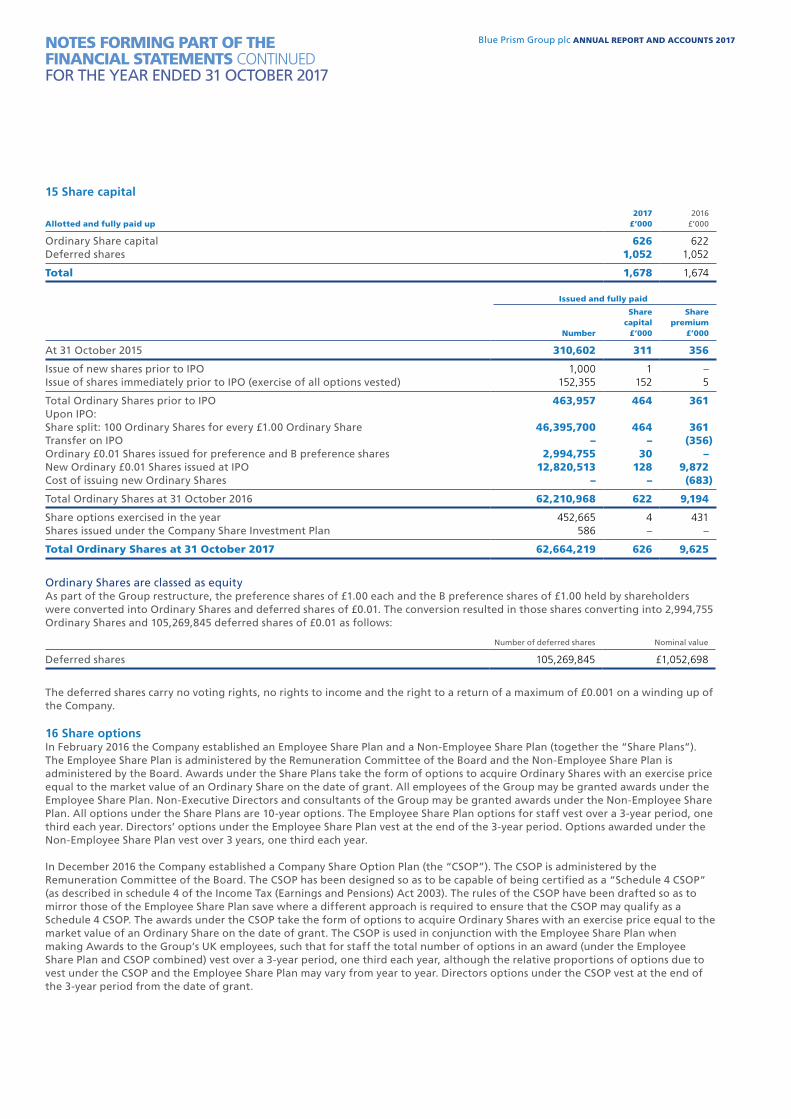
Blue Prism Group plc ANNUAL REPORT AND ACCOUNTS 2017
15 Share capital
Allotted and fully paid up2017
£’0002016
£’000
Ordinary Share capital 626 622Deferred shares 1,052 1,052
Total 1,678 1,674
Issued and fully paid
Number
Share capital
£’000
Share premium
£’000
At 31 October 2015 310,602 311 356
Issue of new shares prior to IPO 1,000 1 –Issue of shares immediately prior to IPO (exercise of all options vested) 152,355 152 5
Total Ordinary Shares prior to IPO 463,957 464 361Upon IPO:Share split: 100 Ordinary Shares for every £1.00 Ordinary Share 46,395,700 464 361Transfer on IPO – – (356)Ordinary £0.01 Shares issued for preference and B preference shares 2,994,755 30 –New Ordinary £0.01 Shares issued at IPO 12,820,513 128 9,872Cost of issuing new Ordinary Shares – – (683)
Total Ordinary Shares at 31 October 2016 62,210,968 622 9,194
Share options exercised in the year 452,665 4 431Shares issued under the Company Share Investment Plan 586 – –
Total Ordinary Shares at 31 October 2017 62,664,219 626 9,625
Ordinary Shares are classed as equityAs part of the Group restructure, the preference shares of £1.00 each and the B preference shares of £1.00 held by shareholders were converted into Ordinary Shares and deferred shares of £0.01. The conversion resulted in those shares converting into 2,994,755 Ordinary Shares and 105,269,845 deferred shares of £0.01 as follows:
Number of deferred shares Nominal value
Deferred shares 105,269,845 £1,052,698
The deferred shares carry no voting rights, no rights to income and the right to a return of a maximum of £0.001 on a winding up of the Company.
16 Share optionsIn February 2016 the Company established an Employee Share Plan and a Non-Employee Share Plan (together the “Share Plans”). The Employee Share Plan is administered by the Remuneration Committee of the Board and the Non-Employee Share Plan is administered by the Board. Awards under the Share Plans take the form of options to acquire Ordinary Shares with an exercise price equal to the market value of an Ordinary Share on the date of grant. All employees of the Group may be granted awards under the Employee Share Plan. Non-Executive Directors and consultants of the Group may be granted awards under the Non-Employee Share Plan. All options under the Share Plans are 10-year options. The Employee Share Plan options for staff vest over a 3-year period, one third each year. Directors’ options under the Employee Share Plan vest at the end of the 3-year period. Options awarded under the Non-Employee Share Plan vest over 3 years, one third each year.
In December 2016 the Company established a Company Share Option Plan (the “CSOP”). The CSOP is administered by the Remuneration Committee of the Board. The CSOP has been designed so as to be capable of being certified as a “Schedule 4 CSOP” (as described in schedule 4 of the Income Tax (Earnings and Pensions) Act 2003). The rules of the CSOP have been drafted so as to mirror those of the Employee Share Plan save where a different approach is required to ensure that the CSOP may qualify as a Schedule 4 CSOP. The awards under the CSOP take the form of options to acquire Ordinary Shares with an exercise price equal to the market value of an Ordinary Share on the date of grant. The CSOP is used in conjunction with the Employee Share Plan when making Awards to the Group’s UK employees, such that for staff the total number of options in an award (under the Employee Share Plan and CSOP combined) vest over a 3-year period, one third each year, although the relative proportions of options due to vest under the CSOP and the Employee Share Plan may vary from year to year. Directors options under the CSOP vest at the end of the 3-year period from the date of grant.
NOTES FORMING PART OF THE FINANCIAL STATEMENTS CONTINUEDFOR THE YEAR ENDED 31 OCTOBER 2017
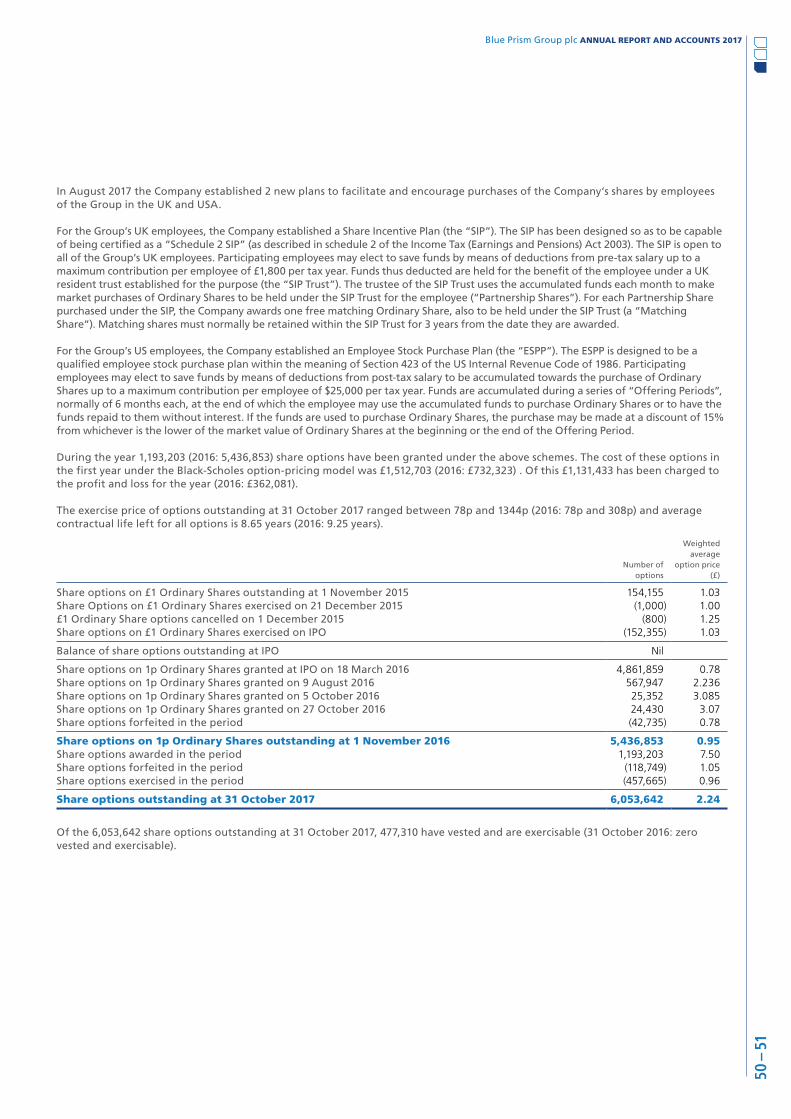
Blue Prism Group plc ANNUAL REPORT AND ACCOUNTS 2017
50 –
51
In August 2017 the Company established 2 new plans to facilitate and encourage purchases of the Company’s shares by employees of the Group in the UK and USA.
For the Group’s UK employees, the Company established a Share Incentive Plan (the “SIP”). The SIP has been designed so as to be capable of being certified as a “Schedule 2 SIP” (as described in schedule 2 of the Income Tax (Earnings and Pensions) Act 2003). The SIP is open to all of the Group’s UK employees. Participating employees may elect to save funds by means of deductions from pre-tax salary up to a maximum contribution per employee of £1,800 per tax year. Funds thus deducted are held for the benefit of the employee under a UK resident trust established for the purpose (the “SIP Trust”). The trustee of the SIP Trust uses the accumulated funds each month to make market purchases of Ordinary Shares to be held under the SIP Trust for the employee (“Partnership Shares”). For each Partnership Share purchased under the SIP, the Company awards one free matching Ordinary Share, also to be held under the SIP Trust (a “Matching Share”). Matching shares must normally be retained within the SIP Trust for 3 years from the date they are awarded.
For the Group’s US employees, the Company established an Employee Stock Purchase Plan (the “ESPP”). The ESPP is designed to be a qualified employee stock purchase plan within the meaning of Section 423 of the US Internal Revenue Code of 1986. Participating employees may elect to save funds by means of deductions from post-tax salary to be accumulated towards the purchase of Ordinary Shares up to a maximum contribution per employee of $25,000 per tax year. Funds are accumulated during a series of “Offering Periods”, normally of 6 months each, at the end of which the employee may use the accumulated funds to purchase Ordinary Shares or to have the funds repaid to them without interest. If the funds are used to purchase Ordinary Shares, the purchase may be made at a discount of 15% from whichever is the lower of the market value of Ordinary Shares at the beginning or the end of the Offering Period.
During the year 1,193,203 (2016: 5,436,853) share options have been granted under the above schemes. The cost of these options in the first year under the Black-Scholes option-pricing model was £1,512,703 (2016: £732,323) . Of this £1,131,433 has been charged to the profit and loss for the year (2016: £362,081).
The exercise price of options outstanding at 31 October 2017 ranged between 78p and 1344p (2016: 78p and 308p) and average contractual life left for all options is 8.65 years (2016: 9.25 years).
Number of options
Weighted average
option price (£)
Share options on £1 Ordinary Shares outstanding at 1 November 2015 154,155 1.03Share Options on £1 Ordinary Shares exercised on 21 December 2015 (1,000) 1.00£1 Ordinary Share options cancelled on 1 December 2015 (800) 1.25Share options on £1 Ordinary Shares exercised on IPO (152,355) 1.03
Balance of share options outstanding at IPO Nil
Share options on 1p Ordinary Shares granted at IPO on 18 March 2016 4,861,859 0.78Share options on 1p Ordinary Shares granted on 9 August 2016 567,947 2.236Share options on 1p Ordinary Shares granted on 5 October 2016 25,352 3.085Share options on 1p Ordinary Shares granted on 27 October 2016 24,430 3.07Share options forfeited in the period (42,735) 0.78
Share options on 1p Ordinary Shares outstanding at 1 November 2016 5,436,853 0.95Share options awarded in the period 1,193,203 7.50Share options forfeited in the period (118,749) 1.05Share options exercised in the period (457,665) 0.96
Share options outstanding at 31 October 2017 6,053,642 2.24
Of the 6,053,642 share options outstanding at 31 October 2017, 477,310 have vested and are exercisable (31 October 2016: zero vested and exercisable).
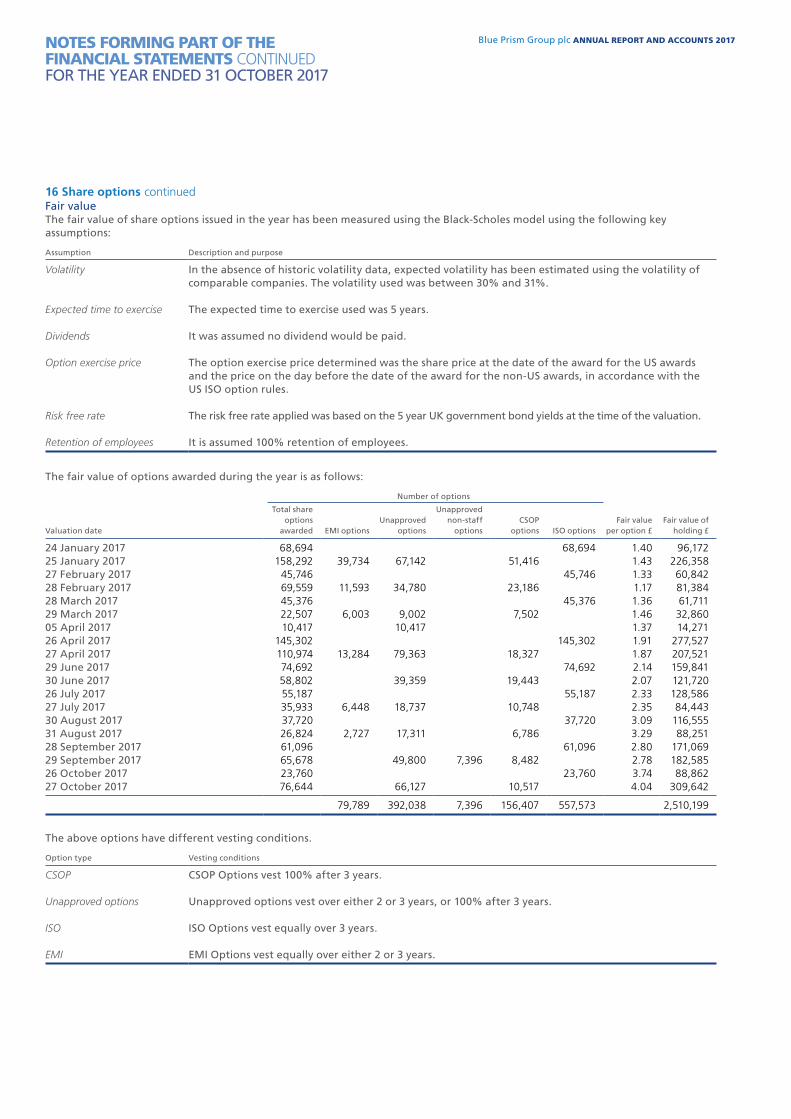
Blue Prism Group plc ANNUAL REPORT AND ACCOUNTS 2017
16 Share options continuedFair valueThe fair value of share options issued in the year has been measured using the Black-Scholes model using the following key assumptions:
Assumption Description and purpose
Volatility In the absence of historic volatility data, expected volatility has been estimated using the volatility of comparable companies. The volatility used was between 30% and 31%.
Expected time to exercise The expected time to exercise used was 5 years.
Dividends It was assumed no dividend would be paid.
Option exercise price The option exercise price determined was the share price at the date of the award for the US awards and the price on the day before the date of the award for the non-US awards, in accordance with the US ISO option rules.
Risk free rate The risk free rate applied was based on the 5 year UK government bond yields at the time of the valuation.
Retention of employees It is assumed 100% retention of employees.
The fair value of options awarded during the year is as follows:
Number of options
Valuation date
Total share options
awarded EMI optionsUnapproved
options
Unapproved non-staff
optionsCSOP
options ISO optionsFair value
per option £Fair value of
holding £
24 January 2017 68,694 68,694 1.40 96,17225 January 2017 158,292 39,734 67,142 51,416 1.43 226,35827 February 2017 45,746 45,746 1.33 60,84228 February 2017 69,559 11,593 34,780 23,186 1.17 81,38428 March 2017 45,376 45,376 1.36 61,71129 March 2017 22,507 6,003 9,002 7,502 1.46 32,86005 April 2017 10,417 10,417 1.37 14,27126 April 2017 145,302 145,302 1.91 277,52727 April 2017 110,974 13,284 79,363 18,327 1.87 207,52129 June 2017 74,692 74,692 2.14 159,84130 June 2017 58,802 39,359 19,443 2.07 121,72026 July 2017 55,187 55,187 2.33 128,58627 July 2017 35,933 6,448 18,737 10,748 2.35 84,44330 August 2017 37,720 37,720 3.09 116,55531 August 2017 26,824 2,727 17,311 6,786 3.29 88,25128 September 2017 61,096 61,096 2.80 171,06929 September 2017 65,678 49,800 7,396 8,482 2.78 182,58526 October 2017 23,760 23,760 3.74 88,86227 October 2017 76,644 66,127 10,517 4.04 309,642
79,789 392,038 7,396 156,407 557,573 2,510,199
The above options have different vesting conditions.
Option type Vesting conditions
CSOP CSOP Options vest 100% after 3 years.
Unapproved options Unapproved options vest over either 2 or 3 years, or 100% after 3 years.
ISO ISO Options vest equally over 3 years.
EMI EMI Options vest equally over either 2 or 3 years.
NOTES FORMING PART OF THE FINANCIAL STATEMENTS CONTINUEDFOR THE YEAR ENDED 31 OCTOBER 2017
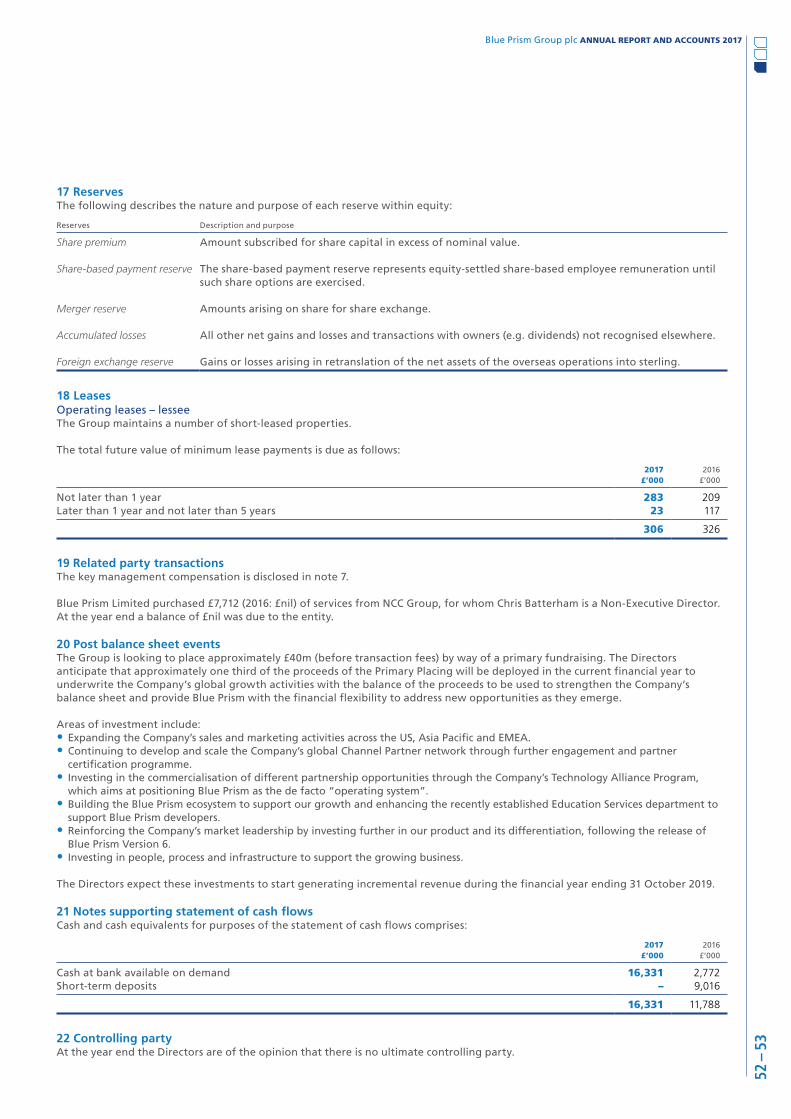
Blue Prism Group plc ANNUAL REPORT AND ACCOUNTS 2017
52 –
53
17 ReservesThe following describes the nature and purpose of each reserve within equity:
Reserves Description and purpose
Share premium Amount subscribed for share capital in excess of nominal value.
Share-based payment reserve The share-based payment reserve represents equity-settled share-based employee remuneration until such share options are exercised.
Merger reserve Amounts arising on share for share exchange.
Accumulated losses All other net gains and losses and transactions with owners (e.g. dividends) not recognised elsewhere.
Foreign exchange reserve Gains or losses arising in retranslation of the net assets of the overseas operations into sterling.
18 LeasesOperating leases – lesseeThe Group maintains a number of short-leased properties.
The total future value of minimum lease payments is due as follows:
2017 £’000
2016 £’000
Not later than 1 year 283 209Later than 1 year and not later than 5 years 23 117
306 326
19 Related party transactionsThe key management compensation is disclosed in note 7.
Blue Prism Limited purchased £7,712 (2016: £nil) of services from NCC Group, for whom Chris Batterham is a Non-Executive Director. At the year end a balance of £nil was due to the entity.
20 Post balance sheet eventsThe Group is looking to place approximately £40m (before transaction fees) by way of a primary fundraising. The Directors anticipate that approximately one third of the proceeds of the Primary Placing will be deployed in the current financial year to underwrite the Company’s global growth activities with the balance of the proceeds to be used to strengthen the Company’s balance sheet and provide Blue Prism with the financial flexibility to address new opportunities as they emerge.
Areas of investment include:• Expanding the Company’s sales and marketing activities across the US, Asia Pacific and EMEA.• Continuing to develop and scale the Company’s global Channel Partner network through further engagement and partner
certification programme.• Investing in the commercialisation of different partnership opportunities through the Company’s Technology Alliance Program,
which aims at positioning Blue Prism as the de facto “operating system”.• Building the Blue Prism ecosystem to support our growth and enhancing the recently established Education Services department to
support Blue Prism developers. • Reinforcing the Company’s market leadership by investing further in our product and its differentiation, following the release of
Blue Prism Version 6.• Investing in people, process and infrastructure to support the growing business.
The Directors expect these investments to start generating incremental revenue during the financial year ending 31 October 2019.
21 Notes supporting statement of cash flowsCash and cash equivalents for purposes of the statement of cash flows comprises:
2017£’000
2016£’000
Cash at bank available on demand 16,331 2,772Short-term deposits – 9,016
16,331 11,788
22 Controlling partyAt the year end the Directors are of the opinion that there is no ultimate controlling party.
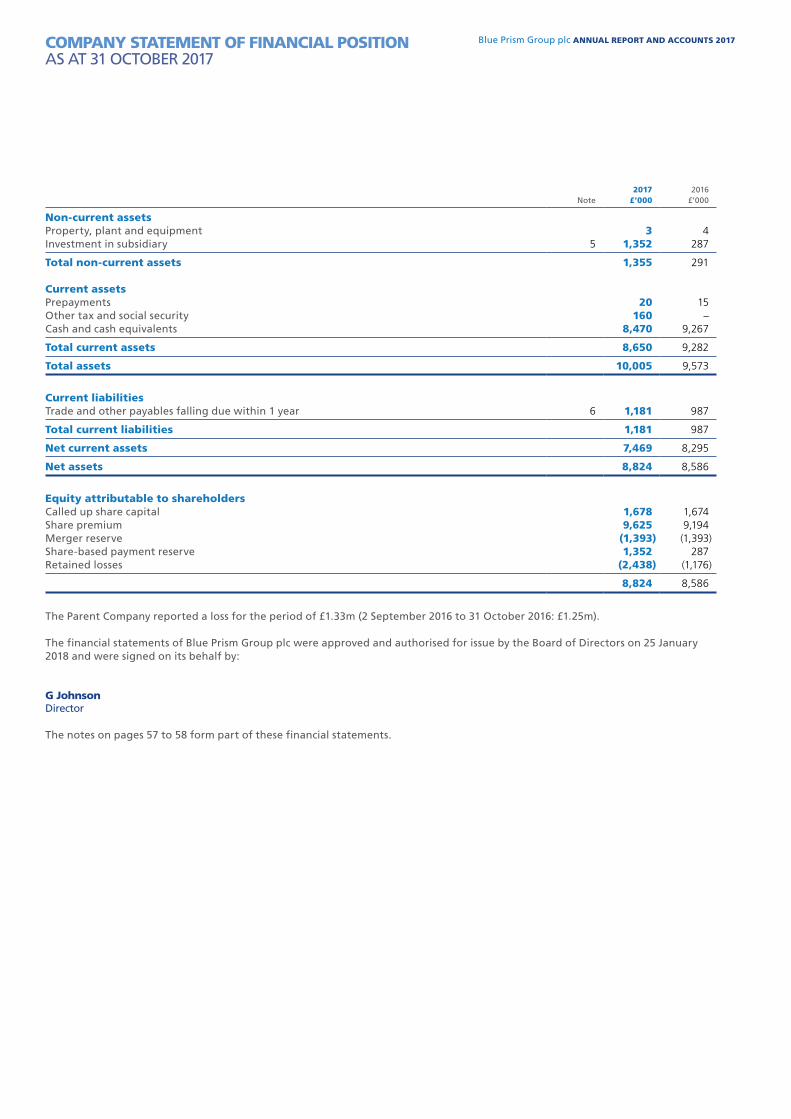
Blue Prism Group plc ANNUAL REPORT AND ACCOUNTS 2017
Note2017
£’0002016
£’000
Non-current assetsProperty, plant and equipment 3 4Investment in subsidiary 5 1,352 287
Total non-current assets 1,355 291
Current assetsPrepayments 20 15Other tax and social security 160 –Cash and cash equivalents 8,470 9,267
Total current assets 8,650 9,282
Total assets 10,005 9,573
Current liabilitiesTrade and other payables falling due within 1 year 6 1,181 987
Total current liabilities 1,181 987
Net current assets 7,469 8,295
Net assets 8,824 8,586
Equity attributable to shareholdersCalled up share capital 1,678 1,674Share premium 9,625 9,194Merger reserve (1,393) (1,393)Share-based payment reserve 1,352 287Retained losses (2,438) (1,176)
8,824 8,586
The Parent Company reported a loss for the period of £1.33m (2 September 2016 to 31 October 2016: £1.25m).
The financial statements of Blue Prism Group plc were approved and authorised for issue by the Board of Directors on 25 January 2018 and were signed on its behalf by:
G Johnson Director
The notes on pages 57 to 58 form part of these financial statements.
COMPANY STATEMENT OF FINANCIAL POSITIONAS AT 31 OCTOBER 2017
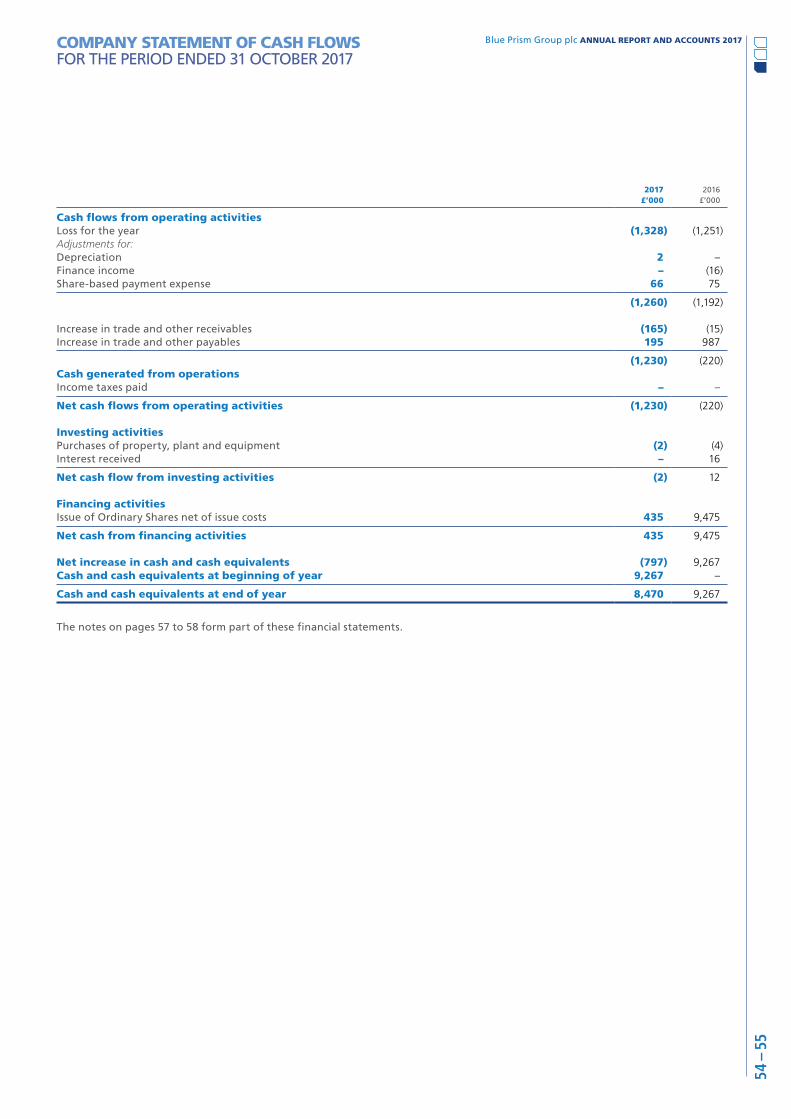
Blue Prism Group plc ANNUAL REPORT AND ACCOUNTS 2017
54 –
55
2017 £’000
2016 £’000
Cash flows from operating activitiesLoss for the year (1,328) (1,251)Adjustments for:Depreciation 2 –Finance income – (16)Share-based payment expense 66 75
(1,260) (1,192)
Increase in trade and other receivables (165) (15)Increase in trade and other payables 195 987
(1,230) (220)Cash generated from operationsIncome taxes paid – –
Net cash flows from operating activities (1,230) (220)
Investing activitiesPurchases of property, plant and equipment (2) (4)Interest received – 16
Net cash flow from investing activities (2) 12
Financing activitiesIssue of Ordinary Shares net of issue costs 435 9,475
Net cash from financing activities 435 9,475
Net increase in cash and cash equivalents (797) 9,267Cash and cash equivalents at beginning of year 9,267 –
Cash and cash equivalents at end of year 8,470 9,267
The notes on pages 57 to 58 form part of these financial statements.
COMPANY STATEMENT OF CASH FLOWSFOR THE PERIOD ENDED 31 OCTOBER 2017
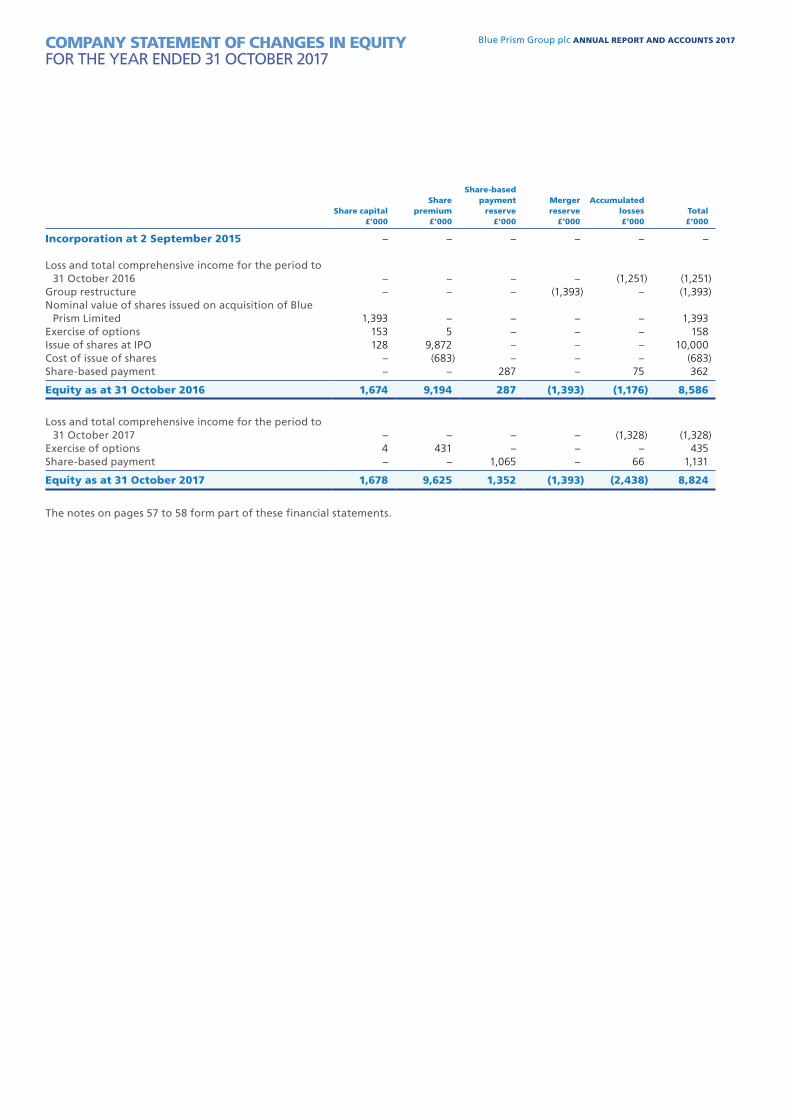
Blue Prism Group plc ANNUAL REPORT AND ACCOUNTS 2017
Share capital £’000
Share premium
£’000
Share-based payment
reserve £’000
Merger reserve
£’000
Accumulated losses £’000
Total £’000
Incorporation at 2 September 2015 – – – – – –
Loss and total comprehensive income for the period to 31 October 2016 – – – – (1,251) (1,251)
Group restructure – – – (1,393) – (1,393)Nominal value of shares issued on acquisition of Blue
Prism Limited 1,393 – – – – 1,393Exercise of options 153 5 – – – 158Issue of shares at IPO 128 9,872 – – – 10,000Cost of issue of shares – (683) – – – (683)Share-based payment – – 287 – 75 362
Equity as at 31 October 2016 1,674 9,194 287 (1,393) (1,176) 8,586
Loss and total comprehensive income for the period to 31 October 2017 – – – – (1,328) (1,328)
Exercise of options 4 431 – – – 435Share-based payment – – 1,065 – 66 1,131
Equity as at 31 October 2017 1,678 9,625 1,352 (1,393) (2,438) 8,824
The notes on pages 57 to 58 form part of these financial statements.
COMPANY STATEMENT OF CHANGES IN EQUITYFOR THE YEAR ENDED 31 OCTOBER 2017
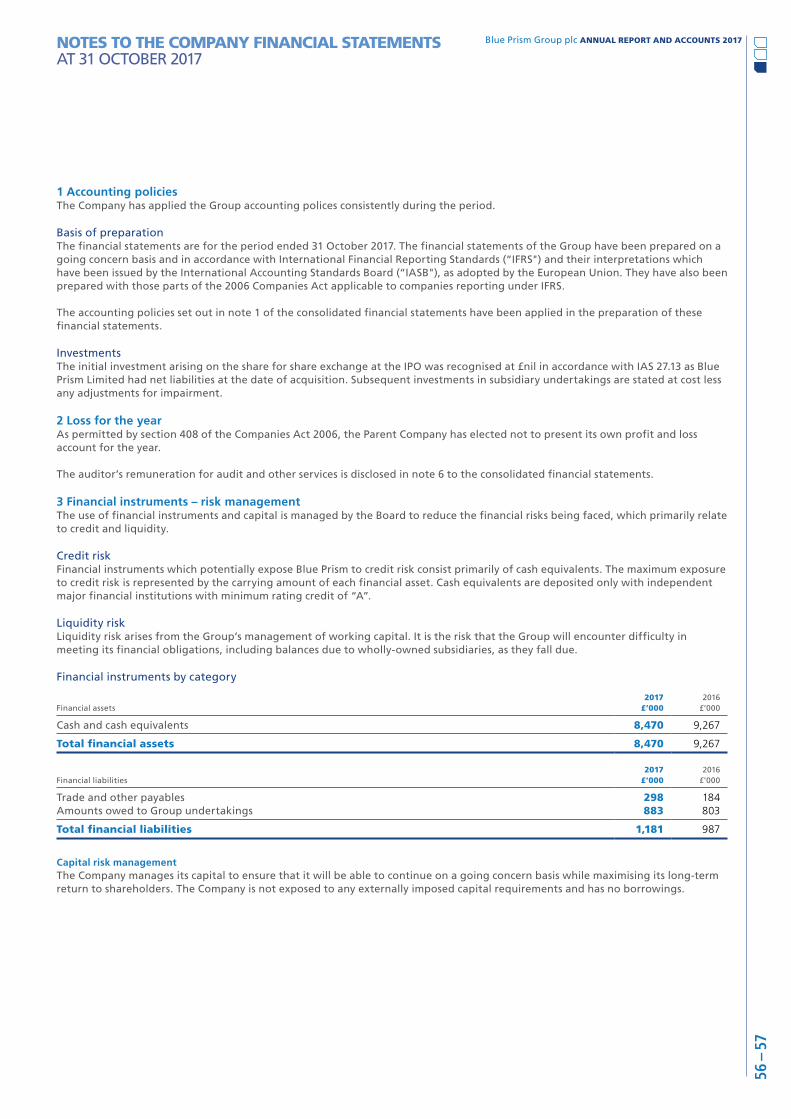
Blue Prism Group plc ANNUAL REPORT AND ACCOUNTS 2017
56 –
57
1 Accounting policiesThe Company has applied the Group accounting polices consistently during the period.
Basis of preparationThe financial statements are for the period ended 31 October 2017. The financial statements of the Group have been prepared on a going concern basis and in accordance with International Financial Reporting Standards (“IFRS") and their interpretations which have been issued by the International Accounting Standards Board (“IASB"), as adopted by the European Union. They have also been prepared with those parts of the 2006 Companies Act applicable to companies reporting under IFRS.
The accounting policies set out in note 1 of the consolidated financial statements have been applied in the preparation of these financial statements.
InvestmentsThe initial investment arising on the share for share exchange at the IPO was recognised at £nil in accordance with IAS 27.13 as Blue Prism Limited had net liabilities at the date of acquisition. Subsequent investments in subsidiary undertakings are stated at cost less any adjustments for impairment.
2 Loss for the yearAs permitted by section 408 of the Companies Act 2006, the Parent Company has elected not to present its own profit and loss account for the year.
The auditor’s remuneration for audit and other services is disclosed in note 6 to the consolidated financial statements.
3 Financial instruments – risk managementThe use of financial instruments and capital is managed by the Board to reduce the financial risks being faced, which primarily relate to credit and liquidity.
Credit riskFinancial instruments which potentially expose Blue Prism to credit risk consist primarily of cash equivalents. The maximum exposure to credit risk is represented by the carrying amount of each financial asset. Cash equivalents are deposited only with independent major financial institutions with minimum rating credit of “A”.
Liquidity riskLiquidity risk arises from the Group’s management of working capital. It is the risk that the Group will encounter difficulty in meeting its financial obligations, including balances due to wholly-owned subsidiaries, as they fall due.
Financial instruments by category
Financial assets2017
£’0002016
£’000
Cash and cash equivalents 8,470 9,267
Total financial assets 8,470 9,267
Financial liabilities2017
£’0002016
£’000
Trade and other payables 298 184Amounts owed to Group undertakings 883 803
Total financial liabilities 1,181 987
Capital risk managementThe Company manages its capital to ensure that it will be able to continue on a going concern basis while maximising its long-term return to shareholders. The Company is not exposed to any externally imposed capital requirements and has no borrowings.
NOTES TO THE COMPANY FINANCIAL STATEMENTS AT 31 OCTOBER 2017
Blue Prism Group plc ANNUAL REPORT AND ACCOUNTS 2017
4 EmployeesThe average number of employees employed by the Company during the year was:
2017 Number
2016 Number
Directors and Company Secretary* 7 7
7 7
* This includes 3 Non-Executive Directors and the Chairman.
5 Investment in subsidiary2017
£’0002016
£’000
Cost brought forward 287 –Share-based payments during period for employees of subsidiaries 1,065 287
Cost carried forward at 31 October 1,352 287
Details of the Group’s subsidiaries at 31 October 2017 are included in note 11 of the consolidated financial statements.
6 Trade and other payables2017
£’0002016
£’000
Amounts owed to Group undertakings 883 803Trade creditors and accruals 243 154Other creditors 32 30
1,158 987
Amounts payable to Group undertakings are repayable on demand and unsecured.
7 Related party transactions Blue Prism Group plc has a related party relationship with its subsidiaries and with its Directors and members of key management. There are no transactions with related parties who are not members of the Group. The remuneration paid to members of key management is disclosed within note 7 of the consolidated financial statements and remuneration of individual Directors is disclosed within the Directors’ Report.
The following balances are due to wholly-owned subsidiaries at the period end:
2017£’000
2016£’000
Blue Prism Limited 833 801Blue Prism Software Inc. 50 2
883 803
During the year, the Company had the following expenses recharged from/(to) wholly-owned subsidiaries as follows:
2017£’000
2016£’000
Blue Prism Limited 32 801Blue Prism Software Inc. 48 2
80 803
NOTES TO THE COMPANY FINANCIAL STATEMENTS CONTINUEDAT 31 OCTOBER 2017
Blue Prism Group plc ANNUAL REPORT AND ACCOUNTS 2017
58 –
59
Company number09759493
Directors
Name Position
Jason Kingdon ChairmanAlastair Bathgate CEO & FounderGary Johnson CFOKen Lever Non-Executive DirectorChris Batterham Non-Executive DirectorCharmaine Eggberry Non-Executive Director Company SecretaryJohn Warrick
Registered officeCentrix HouseCrow Lane EastNewton-le-WillowsWA12 9UY
AuditorsBDO LLP55 Baker StreetLondonW1U 7EU
RegistrarsLink Market Services LtdThe Registry34 Beckenham RoadBeckenhamKentBR3 4TU
Financial PRFTI Consulting LLP200 AldersgateAldersgate StreetLondon EC1A 4HD
Nominated adviser and brokerInvestec Bank plc2 Gresham StreetLondonEC2V 7QP
COMPANY INFORMATION

Blue Prism Group plc ANNUAL REPORT AND ACCOUNTS 2017NOTES


CENTRIX HOUSECROW LANE EASTNEWTON-LE-WILLOWSWA12 9UY
T: 0870 879 3000W: BLUEPRISM.COM
BLU
E P
RIS
M G
RO
UP P
LC A
NN
UA
L REPO
RT A
ND
AC
CO
UN
TS 2
017
Related Documents