Delaware River Basin Flood Analysis Model Reservoir Operations and Streamflow Routing Component February 2010 Approved for Public Release. Distribution Unlimited. PR-73 US Army Corps of Engineers Hydrologic Engineering Center

Welcome message from author
This document is posted to help you gain knowledge. Please leave a comment to let me know what you think about it! Share it to your friends and learn new things together.
Transcript
Delaware River Basin Flood Analysis Model
Reservoir Operations and Streamflow Routing Component February 2010 Approved for Public Release. Distribution Unlimited. PR-73
US Army Corps of Engineers Hydrologic Engineering Center

REPORT DOCUMENTATION PAGE Form Approved OMB No. 0704-0188
The public reporting burden for this collection of information is estimated to average 1 hour per response, including the time for reviewing instructions, searching existing data sources, gathering and maintaining the data needed, and completing and reviewing the collection of information. Send comments regarding this burden estimate or any other aspect of this collection of information, including suggestions for reducing this burden, to the Department of Defense, Executive Services and Communications Directorate (0704-0188). Respondents should be aware that notwithstanding any other provision of law, no person shall be subject to any penalty for failing to comply with a collection of information if it does not display a currently valid OMB control number. PLEASE DO NOT RETURN YOUR FORM TO THE ABOVE ORGANIZATION. 1. REPORT DATE (DD-MM-YYYY) February 2010
2. REPORT TYPE Project Report
3. DATES COVERED (From - To)
5a. CONTRACT NUMBER
5b. GRANT NUMBER
4. TITLE AND SUBTITLE Delaware River Basin Flood Analysis Model Reservoir Operations and Streamflow Routing Component
5c. PROGRAM ELEMENT NUMBER
5d. PROJECT NUMBER 5e. TASK NUMBER
6. AUTHOR(S) Joan Klipsch, CEIWR-HEC-WMS Marilyn Hurst, CEIWR-HEC-WRS Matthew Fleming, CEIWR-HEC-HHT 5F. WORK UNIT NUMBER
7. PERFORMING ORGANIZATION NAME(S) AND ADDRESS(ES) US Army Corps of Engineers Institute for Water Resources Hydrologic Engineering Center (HEC) 609 Second Street Davis, CA 95616-4687
8. PERFORMING ORGANIZATION REPORT NUMBER PR-73
10. SPONSOR/ MONITOR'S ACRONYM(S) 9. SPONSORING/MONITORING AGENCY NAME(S) AND ADDRESS(ES) Delaware River Basin Commission 25 State Police Drive PO Box 7360 West Trenton, NJ 08628-0360
11. SPONSOR/ MONITOR'S REPORT NUMBER(S)
12. DISTRIBUTION / AVAILABILITY STATEMENT Approved for public release; distribution is unlimited. 13. SUPPLEMENTARY NOTES
14. ABSTRACT The Delaware River Basin Commission (DRBC) engaged the Hydrologic Engineering Center (HEC), along with the U.S. Geological Survey (USGS), and the National Weather Service (NWS), in the development of a flood analysis model for the Delaware River Basin. The flood analysis model was developed to evaluate the existing reservoirs for flood mitigation and provide data to evaluate the effects of various reservoir operating alternatives on flooding locations downstream of the reservoirs. HEC in coordination with DRBC, USGS and NWS created the HEC-ResSim model of the Delaware River Basin. The purpose of this report is to describe the reservoir modeling and flow routing, focusing primarily on the aspects or features the modelers will need to be aware of as further alternatives are developed. 15. SUBJECT TERMS HEC-ResSim, reservoir, operations, streamflow, routing, Delaware River Basin Commission, DRBC, Delaware River, Delaware River Basin, USACE, HEC, CENAP, watershed, projects, computation points, junctions, basins, reaches, reservoir network, data collection, alternatives, simulations, Delaware River Flood Analysis Model, flood, river system, flood damage reduction, conservation storage 16. SECURITY CLASSIFICATION OF: 19a. NAME OF RESPONSIBLE
PERSON a. REPORT U
b. ABSTRACT U
c. THIS PAGE U
17. LIMITATION OF ABSTRACT UU
18. NUMBER OF PAGES 219 19b. TELEPHONE NUMBER
Standard Form 298 (Rev. 8/98) Prescribed by ANSI Std. Z39-18
Delaware River Basin Flood Analysis Model
Reservoir Operations and Streamflow Routing Component
February 2010 Prepared for: Delaware River Basin Commission 25 State Police Drive PO Box 7360 West Trenton, NJ 08628-0360 Prepared by: US Army Corps of Engineers Institute for Water Resources Hydrologic Engineering Center 609 Second Street Davis, CA 95616 (530) 756-1104 (530) 756-8250 FAX www.hec.usace.army.mil PR-73

Table of Contents
i
Table of Contents List of Tables ......................................................................................................................... v List of Figures .......................................................................................................................vii Abbreviations........................................................................................................................ xi Acknowledgments ...............................................................................................................xiii Executive Summary............................................................................................................. xv Chapters 1 Introduction 1.1 Background ..................................................................................................... 1 1.2 Scope of Model................................................................................................ 1 1.3 Study Area....................................................................................................... 2 2 Watershed Setup 2.1 Watershed Creation and Layout...................................................................... 5 2.2 Stream Alignment ............................................................................................ 6 2.3 Watershed Configurations ............................................................................... 7 2.3.1 Projects................................................................................................ 7 2.3.2 Computation Points ............................................................................. 9 2.4 Summary ....................................................................................................... 14 3 Data Collections 3.1 Time Series Data........................................................................................... 17 3.1.1 USGS Gage Data .............................................................................. 17 3.1.2 CENAP Gage Data ............................................................................ 17 3.1.3 DRBC Data ........................................................................................ 18 3.2 Model Data .................................................................................................... 18 4 Reservoir Network 4.1 Junctions ....................................................................................................... 20 4.2 Reaches ........................................................................................................ 24 4.3 Reservoirs ..................................................................................................... 29 4.3.1 Upper Basin Reservoirs..................................................................... 29 4.3.1.1 Cannonsville ...................................................................... 30 FC Ops - Normal Flood Operations .............................. 34 FC Ops-SpecDiv - Normal Flood Operations, Specified Diversions.................................................. 35 4.3.1.2 Pepacton ........................................................................... 37 4.3.1.3 Neversink........................................................................... 39 4.3.2 Lackawaxen River Basin Reservoirs ................................................. 40 4.3.2.1 Prompton ........................................................................... 42 4.3.2.2 Jadwin ............................................................................... 42 4.3.2.3 Lake Wallenpaupack ......................................................... 43
Table of Contents
ii
Table of Contents Chapters 4.3.3 Mongaup Basin Reservoirs................................................................ 44 4.3.3.1 Toronto .............................................................................. 46 4.3.3.2 Swinging Bridge................................................................. 47 4.3.3.3 Rio ..................................................................................... 49 4.3.4 Lehigh River Basin Reservoir ............................................................ 51 4.3.4.1 F.E. Walter......................................................................... 51 4.3.4.2 Beltzville ............................................................................ 52 4.3.5 Mainstem Delaware River Basin Reservoirs ..................................... 53 4.3.5.1 Merrill Creek ...................................................................... 53 4.3.5.2 Nockamixon....................................................................... 54 5 Alternatives and Simulations 5.1 Alternatives.................................................................................................... 57 5.2 Simulations .................................................................................................... 58 5.2.1 Upper Basin ....................................................................................... 58 5.2.1.1 Cannonsville ...................................................................... 58 5.2.1.2 Stilesville............................................................................ 60 5.2.1.3 Hale Eddy .......................................................................... 61 5.2.1.4 Pepacton ........................................................................... 63 5.2.1.5 Downsville ......................................................................... 65 5.1.2.6 Harvard.............................................................................. 66 5.1.2.7 Barryville............................................................................ 67 5.1.2.8 Neversink........................................................................... 68 5.1.2.9 Neversink Diversion to NYC .............................................. 71 5.2.1.10 Bridgeville .......................................................................... 72 5.2.2 Lackawaxen River Basin ................................................................... 74 5.2.2.1 Prompton ........................................................................... 74 5.2.2.2 Jadwin ............................................................................... 76 5.2.2.3 Hawley............................................................................... 78 5.2.2.4 Lake Wallenpaupack ......................................................... 79 5.2.3 Mongaup River Basin ........................................................................ 82 5.2.3.1 Toronto .............................................................................. 82 5.2.3.2 Swinging Bridge................................................................. 84 5.2.3.3 Rio ..................................................................................... 86 5.2.3.4 Port Jervis.......................................................................... 87 5.2.4 Lehigh River Basin............................................................................. 89 5.2.4.1 F.E. Walter......................................................................... 89 5.2.4.2 Lehighton........................................................................... 91 5.2.4.3 Beltzville ............................................................................ 93 5.2.4.4 Walnutport ......................................................................... 94 5.2.4.5 Bethlehem ......................................................................... 96 5.2.5 Mainstem Delaware River Basin........................................................ 97 5.2.5.1 Montague........................................................................... 97 5.2.5.2 Belvidere............................................................................ 98 5.2.5.3 Merrill Creek .................................................................... 100 5.2.5.4 Riegelsville ...................................................................... 102
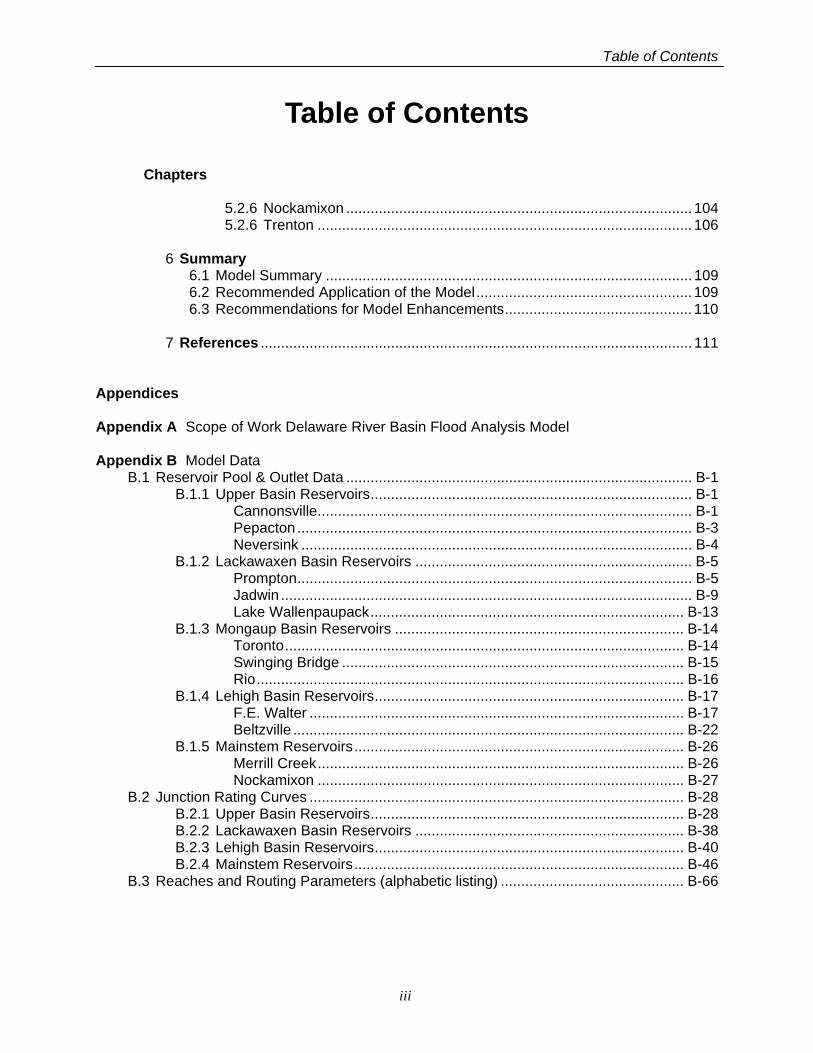
Table of Contents
iii
Table of Contents Chapters 5.2.6 Nockamixon ..................................................................................... 104 5.2.6 Trenton ............................................................................................ 106 6 Summary 6.1 Model Summary .......................................................................................... 109 6.2 Recommended Application of the Model..................................................... 109 6.3 Recommendations for Model Enhancements.............................................. 110 7 References .......................................................................................................... 111 Appendices Appendix A Scope of Work Delaware River Basin Flood Analysis Model Appendix B Model Data B.1 Reservoir Pool & Outlet Data ..................................................................................... B-1 B.1.1 Upper Basin Reservoirs............................................................................... B-1 Cannonsville............................................................................................ B-1 Pepacton ................................................................................................. B-3 Neversink ................................................................................................ B-4 B.1.2 Lackawaxen Basin Reservoirs .................................................................... B-5 Prompton................................................................................................. B-5 Jadwin ..................................................................................................... B-9 Lake Wallenpaupack............................................................................. B-13 B.1.3 Mongaup Basin Reservoirs ....................................................................... B-14 Toronto.................................................................................................. B-14 Swinging Bridge .................................................................................... B-15 Rio......................................................................................................... B-16 B.1.4 Lehigh Basin Reservoirs............................................................................ B-17 F.E. Walter ............................................................................................ B-17 Beltzville ................................................................................................ B-22 B.1.5 Mainstem Reservoirs................................................................................. B-26 Merrill Creek.......................................................................................... B-26 Nockamixon .......................................................................................... B-27 B.2 Junction Rating Curves ............................................................................................ B-28 B.2.1 Upper Basin Reservoirs............................................................................. B-28 B.2.2 Lackawaxen Basin Reservoirs .................................................................. B-38 B.2.3 Lehigh Basin Reservoirs............................................................................ B-40 B.2.4 Mainstem Reservoirs................................................................................. B-46 B.3 Reaches and Routing Parameters (alphabetic listing) ............................................. B-66

Table of Contents
iv
List of Tables
v
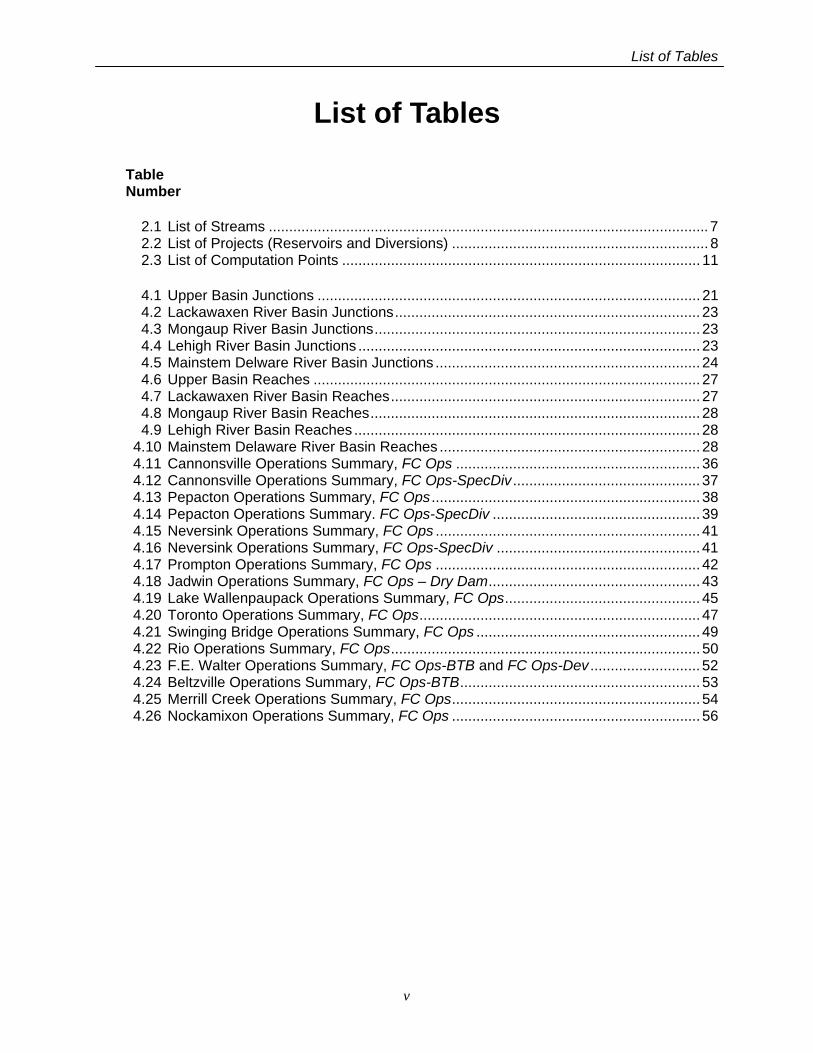
List of Tables Table Number 2.1 List of Streams ............................................................................................................ 7 2.2 List of Projects (Reservoirs and Diversions) ............................................................... 8 2.3 List of Computation Points ........................................................................................ 11 4.1 Upper Basin Junctions .............................................................................................. 21 4.2 Lackawaxen River Basin Junctions........................................................................... 23 4.3 Mongaup River Basin Junctions................................................................................ 23 4.4 Lehigh River Basin Junctions .................................................................................... 23 4.5 Mainstem Delware River Basin Junctions ................................................................. 24 4.6 Upper Basin Reaches ............................................................................................... 27 4.7 Lackawaxen River Basin Reaches............................................................................ 27 4.8 Mongaup River Basin Reaches................................................................................. 28 4.9 Lehigh River Basin Reaches ..................................................................................... 28 4.10 Mainstem Delaware River Basin Reaches ................................................................ 28 4.11 Cannonsville Operations Summary, FC Ops ............................................................ 36 4.12 Cannonsville Operations Summary, FC Ops-SpecDiv .............................................. 37 4.13 Pepacton Operations Summary, FC Ops .................................................................. 38 4.14 Pepacton Operations Summary. FC Ops-SpecDiv ................................................... 39 4.15 Neversink Operations Summary, FC Ops ................................................................. 41 4.16 Neversink Operations Summary, FC Ops-SpecDiv .................................................. 41 4.17 Prompton Operations Summary, FC Ops ................................................................. 42 4.18 Jadwin Operations Summary, FC Ops – Dry Dam.................................................... 43 4.19 Lake Wallenpaupack Operations Summary, FC Ops................................................ 45 4.20 Toronto Operations Summary, FC Ops..................................................................... 47 4.21 Swinging Bridge Operations Summary, FC Ops ....................................................... 49 4.22 Rio Operations Summary, FC Ops............................................................................ 50 4.23 F.E. Walter Operations Summary, FC Ops-BTB and FC Ops-Dev ........................... 52 4.24 Beltzville Operations Summary, FC Ops-BTB........................................................... 53 4.25 Merrill Creek Operations Summary, FC Ops............................................................. 54 4.26 Nockamixon Operations Summary, FC Ops ............................................................. 56

List of Tables
vi
List of Figures
vii
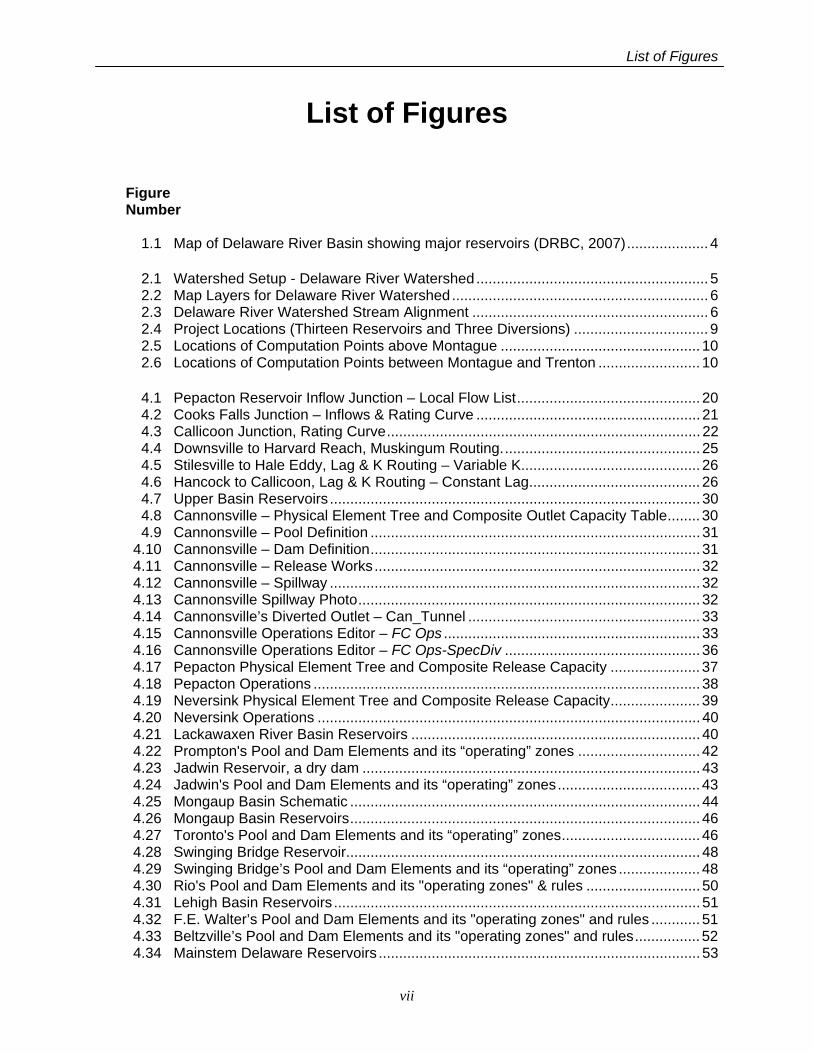
List of Figures Figure Number 1.1 Map of Delaware River Basin showing major reservoirs (DRBC, 2007).................... 4 2.1 Watershed Setup - Delaware River Watershed......................................................... 5 2.2 Map Layers for Delaware River Watershed............................................................... 6 2.3 Delaware River Watershed Stream Alignment .......................................................... 6 2.4 Project Locations (Thirteen Reservoirs and Three Diversions) ................................. 9 2.5 Locations of Computation Points above Montague ................................................. 10 2.6 Locations of Computation Points between Montague and Trenton ......................... 10 4.1 Pepacton Reservoir Inflow Junction – Local Flow List............................................. 20 4.2 Cooks Falls Junction – Inflows & Rating Curve ....................................................... 21 4.3 Callicoon Junction, Rating Curve............................................................................. 22 4.4 Downsville to Harvard Reach, Muskingum Routing................................................. 25 4.5 Stilesville to Hale Eddy, Lag & K Routing – Variable K............................................ 26 4.6 Hancock to Callicoon, Lag & K Routing – Constant Lag.......................................... 26 4.7 Upper Basin Reservoirs ........................................................................................... 30 4.8 Cannonsville – Physical Element Tree and Composite Outlet Capacity Table........ 30 4.9 Cannonsville – Pool Definition ................................................................................. 31 4.10 Cannonsville – Dam Definition................................................................................. 31 4.11 Cannonsville – Release Works................................................................................ 32 4.12 Cannonsville – Spillway ........................................................................................... 32 4.13 Cannonsville Spillway Photo.................................................................................... 32 4.14 Cannonsville’s Diverted Outlet – Can_Tunnel ......................................................... 33 4.15 Cannonsville Operations Editor – FC Ops ............................................................... 33 4.16 Cannonsville Operations Editor – FC Ops-SpecDiv ................................................ 36 4.17 Pepacton Physical Element Tree and Composite Release Capacity ...................... 37 4.18 Pepacton Operations ............................................................................................... 38 4.19 Neversink Physical Element Tree and Composite Release Capacity...................... 39 4.20 Neversink Operations .............................................................................................. 40 4.21 Lackawaxen River Basin Reservoirs ....................................................................... 40 4.22 Prompton's Pool and Dam Elements and its “operating” zones .............................. 42 4.23 Jadwin Reservoir, a dry dam ................................................................................... 43 4.24 Jadwin's Pool and Dam Elements and its “operating” zones................................... 43 4.25 Mongaup Basin Schematic ...................................................................................... 44 4.26 Mongaup Basin Reservoirs...................................................................................... 46 4.27 Toronto's Pool and Dam Elements and its “operating” zones.................................. 46 4.28 Swinging Bridge Reservoir....................................................................................... 48 4.29 Swinging Bridge’s Pool and Dam Elements and its “operating” zones .................... 48 4.30 Rio's Pool and Dam Elements and its "operating zones" & rules ............................ 50 4.31 Lehigh Basin Reservoirs .......................................................................................... 51 4.32 F.E. Walter’s Pool and Dam Elements and its "operating zones" and rules ............ 51 4.33 Beltzville’s Pool and Dam Elements and its "operating zones" and rules................ 52 4.34 Mainstem Delaware Reservoirs ............................................................................... 53
List of Figures
viii
List of Figures Figure Number 4.35 Merrill Creek’s Pool and Dam Elements and its “operating” zones and rules.......... 54 4.36 Nockamixon Dam .................................................................................................... 55 4.37 Nockamixon’s Pool and Dam Elements and its “operating” zones and rules .......... 55 5.1 Cannonsville Reservoir Plot – 2004 Event............................................................... 59 5.2 Cannonsville Reservoir Plot – 2005 Event............................................................... 59 5.3 Cannonsville Reservoir Plot – 2006 Event............................................................... 60 5.4 Stilesville Junction Plot – 2004 Event ...................................................................... 60 5.5 Stilesville Junction Plot – 2005 Event ...................................................................... 61 5.6 Stilesville Junction Plot – 2006 Event ...................................................................... 61 5.7 Hale Eddy Junction Plot – total and cumulative local flow – 2004 Event................. 62 5.8 Hale Eddy Junction Plot – total and cumulative local flow – 2005 Event................. 62 5.9 Hale Eddy Junction Plot – total and cumulative local flow – 2006 Event................. 63 5.10 Pepacton Reservoir Plot – 2004 Event .................................................................... 63 5.11 Pepacton Reservoir Plot – 2005 Event .................................................................... 64 5.12 Pepacton Reservoir Plot – 2006 Event .................................................................... 64 5.13 Downsville Operations Plot – 2004 Event................................................................ 65 5.14 Downsville Operations Plot – 2005 Event................................................................ 65 5.15 Downsville Operations Plot – 2006 Event................................................................ 66 5.16 Harvard Total and Cumulative Local Flow – 2004 Event......................................... 66 5.17 Harvard Total and Cumulative Local Flow – 2005 Event......................................... 67 5.18 Harvard Total and Cumulative Local Flow – 2006 Event......................................... 67 5.19 Barryville Total and Cumulative Local Flow – 2004 Event....................................... 68 5.20 Barryville Total and Cumulative Local Flow – 2005 Event....................................... 68 5.21 Barryville Total and Cumulative Local Flow – 2006 Event....................................... 69 5.22 Neversink Reservoir Plot – 2004 Event ................................................................... 69 5.23 Neversink Reservoir Plot – 2005 Event ................................................................... 70 5.24 Neversink Reservoir Plot – 2006 Event ................................................................... 70 5.25 Neversink Diversion Plot – 2004 Event.................................................................... 71 5.26 Neversink Diversion Plot – 2005 Event.................................................................... 71 5.27 Neversink Diversion Plot – 2006 Event.................................................................... 72 5.28 Bridgeville Junction Plot – total and cumulative local flow – 2004 Event................. 72 5.29 Bridgeville Junction Plot – total and cumulative local flow – 2005 Event................. 73 5.30 Bridgeville Junction Plot – total and cumulative local flow – 2006 Event................. 73 5.31 Prompton Reservoir Plot – 2004 Event.................................................................... 74 5.32 Prompton Reservoir Plot – 2005 Event.................................................................... 75 5.33 Prompton Reservoir Plot – 2006 Event.................................................................... 75 5.34 Jadwin Reservoir Plot – 2004 Event ........................................................................ 76 5.35 Jadwin Reservoir Plot – 2005 Event ........................................................................ 77 5.36 Jadwin Reservoir Plot – 2006 Event ........................................................................ 77 5.37 Hawley Flow and Stage – 2004 Event ..................................................................... 78 5.38 Hawley Flow and Stage – 2005 Event ..................................................................... 78 5.39 Hawley Flow and Stage – 2006 Event ..................................................................... 79
List of Figures
ix
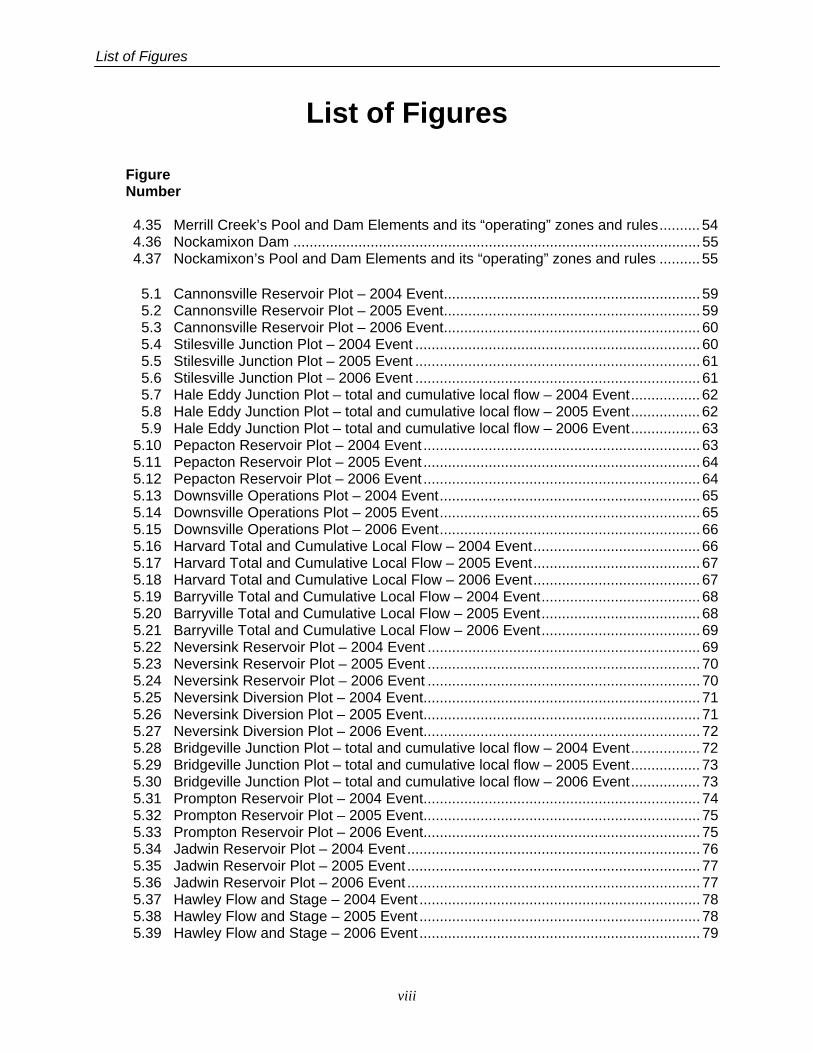
List of Figures Figure Number 5.40 Lake Wallenpaupack Reservoir Plot – 2004 Event.................................................. 80 5.41 Lake Wallenpaupack Reservoir Plot – 2005 Event.................................................. 81 5.42 Lake Wallenpaupack Reservoir Plot – 2006 Event.................................................. 81 5.43 Toronto Reservoir Plot – 2004 Event....................................................................... 82 5.44 Toronto Reservoir Plot – 2005 Event....................................................................... 83 5.45 Toronto Reservoir Plot – 2006 Event....................................................................... 83 5.46 Swinging Bridge Reservoir Plot – 2004 Event ......................................................... 84 5.47 Swinging Bridge Reservoir Plot – 2005 Event ......................................................... 85 5.48 Swinging Bridge Reservoir Plot – 2006 Event ......................................................... 85 5.49 Rio Reservoir Plot – 2004 Event.............................................................................. 86 5.50 Rio Reservoir Plot – 2005 Event.............................................................................. 86 5.51 Rio Reservoir Plot – 2006 Event.............................................................................. 87 5.52 Port Jervis Operations Plot – 2004 Event ................................................................ 88 5.53 Port Jervis Operations Plot – 2005 Event ................................................................ 88 5.54 Port Jervis Operations Plot – 2006 Event ................................................................ 89 5.55 F.E. Walter Reservoir Plot – 2004 Event ................................................................. 90 5.56 F.E. Walter Reservoir Plot – 2005 Event ................................................................. 90 5.57 F.E. Walter Reservoir Plot – 2006 Event ................................................................. 91 5.58 Lehighton Operations Plot – with cumulative local flow added – 2004 Event.......... 91 5.59 Lehighton Operations Plot – with cumulative local flow added – 2005 Event.......... 92 5.60 Lehighton Operations Plot – with cumulative local flow added – 2006 Event.......... 92 5.61 Beltzville Reservoir Plot – 2004 Event ..................................................................... 93 5.62 Beltzville Reservoir Plot – 2005 Event ..................................................................... 93 5.63 Beltzville Reservoir Plot – 2006 Event ..................................................................... 94 5.64 Walnutport Operations Plot – with cumulative local flow added – 2004 Event ........ 94 5.65 Walnutport Operations Plot – with cumulative local flow added – 2005 Event ........ 95 5.66 Walnutport Operations Plot – with cumulative local flow added – 2006 Event ........ 95 5.67 Bethlehem Operations Plot – Flow and Stage – 2004 Event................................... 96 5.68 Bethlehem Operations Plot– Flow and Stage – 2005 Event.................................... 96 5.69 Bethlehem Operations Plot – Flow and Stage – 2006 Event................................... 97 5.70 Montague Flow and Stage – 2004 Event................................................................. 97 5.71 Montague Flow and Stage – 2005 Event................................................................. 98 5.72 Montague Flow and Stage – 2006 Event................................................................. 98 5.73 Belvidere Flow and Stage – 2004 Event.................................................................. 99 5.74 Belvidere Flow and Stage – 2005 Event.................................................................. 99 5.75 Belvidere Flow and Stage – 2006 Event................................................................ 100 5.76 Merrill Creek Reservoir Plot – 2004 Event............................................................. 101 5.77 Merrill Creek Reservoir Plot – 2005 Event............................................................. 101 5.78 Merrill Creek Reservoir Plot – 2006 Event............................................................. 102 5.79 Reigelsville Flow and Stage – 2004 Event............................................................. 103 5.80 Riegelsville Flow and Stage – 2005 Event............................................................. 103 5.81 Riegelsville Flow and Stage – 2006 Event............................................................. 104 5.82 Nockamixon Reservoir Plot – 2004 Event ............................................................. 104 5.83 Nockamixon Reservoir Plot – 2005 Event ............................................................. 105
List of Figures
x
List of Figures Figure Number 5.84 Nockamixon Reservoir Plot – 2006 Event ............................................................. 105 5.85 Trenton Flow and Stage – 2004 Event .................................................................. 106 5.86 Trenton Flow and Stage – 2005 Event .................................................................. 106 5.87 Trenton Flow and Stage – 2006 Event .................................................................. 107

Abbreviations
xi
Abbreviations acre-ft – acre-feet (a unit of measurement for storage in a reservoirs)
cfs – cubic feet per second (a unit of measurement for flow)
elev – elevation
ft – feet (a unit of measurement for elevation, stage, or distance)
CEIWR-HEC - U.S. Army Corps of Engineers, Institute for Water Resources, Hydrologic Engineering Center
CENAP – U.S. Army Corps of Engineers, Philadelphia District
DEL-FAM - Delaware River Flood Analysis Model
DRBC – Delaware River Basin Commission
EAP Emergency Action Plan
EB Del R - East Branch Delaware River
EPA - Environmental Protection Agency
FEMA - Federal Emergency Management Agency
FERC - Federal Energy Regulatory Commission
GIS – Geographical Information System
HEC – Hydrologic Engineering Center
HEC-HMS – Hydrologic Modeling System
HEC-ResSim – Reservoir System Simulation
MCOG – Merrill Creek Owners Group
NRCS - Natural Resrouces Conservation Service
NWS – National Weather Service
NWS-RFC – National Weather Service, River Forecast Center
NYC - New York City
NYCDEP – New York City Department of Environmental Protection
O&M – Operations and Maintenance
OASIS - Operational Analysis and Simulation of Integrated Systems
PPL – or PPL Corporation, originally Pennsylvania Power & Light Co.

Abbreviations
xii
PRMS - Precipitation-Runoff Modeling System
SI - International System of Units (metric)
USACE – U.S. Army Corps of Engineers
USGS – U.S. Geological Survey

Acknowledgements
xiii
Acknowledgements This work has been conducted under the general and technical direction of Christopher N. Dunn, Director, Hydrologic Engineering Center and Thomas A. Evans, Chief, Water Management Systems Division, Hydrologic Engineering Center. The model was developed by Joan D. Klipsch, Marilyn B. Hurst, and Matthew J. Fleming of the Hydrologic Engineering Center. The report was written by Joan D. Klipsch with input from Marilyn B. Hurst and Amy L. Shallcross, Delaware River Basin Commission. The report was prepared for publication by Penni R. Baker of the Hydrologic Engineering Center.

Acknowledgements
xiv

Executive Summary
xv
Executive Summary Following three recent major flood events in the Delaware River Basin, the Delaware River Basin Commission (DRBC) initiated a study to develop flood damage reduction strategies. As part of this study, a flood analysis model of the Delaware River Basin was needed. An interagency team of experienced hydrology and reservoir simulation modelers from the United States Geologic Survey (USGS), the United States Army Corps of Engineers (USACE), and the National Weather Service (NWS) were assembled to develop the Delaware River Basin Flood Analysis Model. The USACE Hydrologic Engineering Center (HEC) was tasked to develop the HEC-ResSim (Reservoir System Simulation) component of the Delaware River Flood Analysis Model for the simulation of reservoir operations under flood conditions and routing of flood flows through the river system. HEC-ResSim (USACE, 2007) is a modeling software program used to assist in planning studies for evaluating existing and proposed reservoirs, reservoir operations, and to assist in sizing the flood risk management and conservation storage requirements for each project. In this application, an HEC-ResSim model was developed as a tool to assess the influence of major reservoirs on flood flows and flood crests in the Delaware River Basin. HEC coordinated with the DRBC, USGS, and NWS to create the HEC-ResSim component of the Flood Analysis Model of the Delaware River Basin. Model development began with creation of an HEC-ResSim watershed which is defined through the development of a stream alignment that serves as the framework or skeleton upon which the model schematic is created. Geo-referenced map files (provided by USGS and DRBC) were used to establish the stream alignment and model schematic. Such files included rivers and streams, lakes and reservoirs, watershed boundaries with sub-basin delineations, stream gage locations, and state boundaries. The next step in model development was the establishment of a reservoir network. The network includes all the reservoirs, reaches and junctions needed for the model and is where all the physical and operational data are entered and stored in the model. Physical reservoir data about the reservoirs were obtained from reservoir operators, reservoir operating plans, DRBC's water code in place at the time of the events (D-77-20 CP Rev 7), and the DRBC's OASIS (Operational Analysis and Simulation of Integrated Systems) model (storage-area-elevation curves, capacities, etc.). The junctions were defined primarily by the locations of headwaters, NWS Flood Forecast Points and confluences of major rivers and tributaries. Where available, primarily at gages co-located with NWS Flood Forecast points, the USGS provide rating curves that are used to convert flow to river stage. Initial river routing parameters were obtained from the NWS. Routing parameters define how the flow travels through a reach. The final step in model development was the formation of simulations and alternatives. Storm event observed data, start time, end time and duration and any scenarios for that event are stored as a simulation. Alternatives specify the initial conditions, operations rule sets, and time-series data (inflows) that are needed to run the model. Alternatives are run and analyzed within a

Executive Summary
xvi
simulation. The USGS provided time-series data (both observed and simulated by Precipitation-Runoff Modeling System (PRMS)) for use as inflows to the HEC-ResSim model. USACE, Philadelphia District (CENAP), provided observed time series data for the USACE reservoirs and other locations on the river. Chapters 2, 3, 4, and 5 describe how the HEC-ResSim model was developed for the Delaware River Basin above Trenton. Trenton is the downstream-most flood damage area significantly impacted by upstream reservoir operations but not subject to tidal influence. These chapters discuss the information that was available and how it was used. Chapter 5 also presents model results at the reservoirs and at key NWS Flood Forecast points and demonstrates the ability of the model to simulate the 2004, 2005, and 2006 observed storm events. Chapter 6 summarizes how the ResSim model was built, description of the alternatives and their usage, and provides recommendations for enhancements to the final model. Chapter 7 contains a list of references that were used in the development of the model and this report.

Chapter 1 - Introduction
1
Chapter 1
Introduction 1.1 Background In September 2004, April 2005 and June 2006, the Delaware River Basin received excessive amounts of precipitation, resulting in major flooding along the Delaware River and its tributaries. Other than floods related to ice jams, the main stem had not experienced such pervasive flooding since August of 1955, from back-to-back Hurricanes Connie and Diane1. The Delaware River Basin Commission (DRBC) was tasked by the Governors of its four member states to develop an Interstate Flood Mitigation Task Force to develop flood damage reduction strategies. One recommendation was to develop a Flood Analysis Model to gain a better understanding of the flood mitigation potential of existing reservoirs within the basin. The DRBC was able to implement this recommendation with funding2 provided by the four basin states along with in-kind contributions from the United States Geological Survey (USGS), the United States Army Corps of Engineers (USACE) and the National Weather Service (NWS). The USGS, USACE and NWS formed the interagency team of experts that developed the Flood Analysis Model. 1.2 Scope of Model The Flood Analysis Model was developed as a tool to evaluate the effects of hydrology and reservoir operations on flooding throughout the basin. It will be used to inform, but will not set, policy decisions. Two public domain software packages were used to develop the Flood Analysis Model: the USGS's Precipitation Runoff Modeling System (PRMS) and the USACE's HEC-ResSim (Reservoir System Simulation) program. The intent of using PRMS was to develop a rainfall-runoff model of the basin to generate inflows (runoff and snowmelt) to the HEC-ResSim model in order to evaluate the effects that land use decisions might have on resulting streamflows. The purpose of developing an HEC-ResSim reservoir operations model was to evaluate the potential flood mitigation opportunities from existing reservoirs, in particular, the ability of the reservoirs to reduce flood crests. As part of model development, both models have been used to simulate the three storm events identified above and integrated through a graphical user interface intended for use by experienced PRMS and HEC-ResSim modelers.
1 Information about recent flooding events and associated damages in the Delaware River Basin can be found on
the DRBC website at http://www.state.nj.us/drbc/Flood_Website/floodinf.htm. 2 The Governor of Delaware contributed $50,000; the Governors of New Jersey, New York and Pennsylvania
contributed $150,000 each; the USGS contributed $155,000 as match and in-kind services; the USACE contributed $100,000; and the National Weather Service contributed $30,000 in in-kind services.
Chapter 1 - Introduction
2
In addition to the PRMS inflow file, an alternate inflow file was developed based on observed data from streamflow gages. The additional inflow file was developed because the rainfall-runoff model, while generally capturing the nature of the storm events, did not predict the peak flood flows with the desired accuracy to evaluate the effects of the reservoirs on flood crests. By using the alternate inflow file, the effects of reservoir operations can be isolated from uncertainties associated with the inflows generated by the rainfall-runoff model. In the absence of a rainfall-runoff model, a HEC-ResSim model would typically be developed using observed data from streamflow gages. The Delaware River Basin was modeled as three separate watersheds: the non-tidal portion of the basin above Trenton, New Jersey; the non-tidal portion of the Schuylkill River basin; and the non-tidal portion of the Christina-Brandywine basin. The reservoirs in one watershed do not affect river elevations or flood flows in the other basins. This report summarizes the development of the HEC-ResSim component of the Flood Analysis Model for the non-tidal portion of the basin above Trenton. The report does not present the results of simulations used to test the potential flood mitigation opportunities using existing reservoirs. The documentation of the PRMS model development and the user interface that integrates both models can be found at www.usgs.gov. Development of the HEC-ResSim models of the Schuylkill and Christina-Brandywine basin will be documented as an addendum to this report. 1.3 Study Area The Delaware River is the longest un-dammed river east of the Mississippi River, extending 330 miles from the Catskill Mountains of New York State to the mouth of the Delaware Bay where it flows into the Atlantic Ocean. The natural drainage area of the Delaware River Basin crosses many man-made boundaries in addition to the four state lines: 25 congressional districts, two Federal Emergency Management Agency (FEMA) regions, two Environmental Protection Agency (EPA) regions, five U.S. Geological Survey (USGS) offices, four Natural Resources Conservation Service (NRCS) state offices, two National Weather Service (NWS) local forecast offices, 42 counties, and 838 municipalities. The Delaware River Basin Commission has regulatory authority3 and responsibilities for planning and coordinating management of the Basin’s water resources, both water quality and quantity. The headwaters of the Delaware River form in New York State, Pennsylvania, New Jersey, and Delaware. The river is fed by 216 substantial tributaries, the largest of which are the Schuylkill and Lehigh rivers in Pennsylvania. The watershed drains four-tenths of one percent of the total continental U.S. land area. In all, the basin contains 13,539 square miles, draining parts of Pennsylvania (6,422 square miles, 50.3 percent of the basin's total land area); New Jersey (2,969 square miles, 23.3 percent); New York (2,362 square miles, 18.5 percent); and Delaware (1,004 square miles, 7.9 percent). Approximately five percent of the nation's population (15 million people) relies on the waters of the Delaware River Basin for drinking and industrial use. The Catskill Mountain Region in the upper basin provides New York City (NYC) with a high quality source of water from three basin
3 The Commission’s authority is limited by the enabling Compact of 1961 and 1954 Supreme Court Decree.

Chapter 1 - Introduction
3
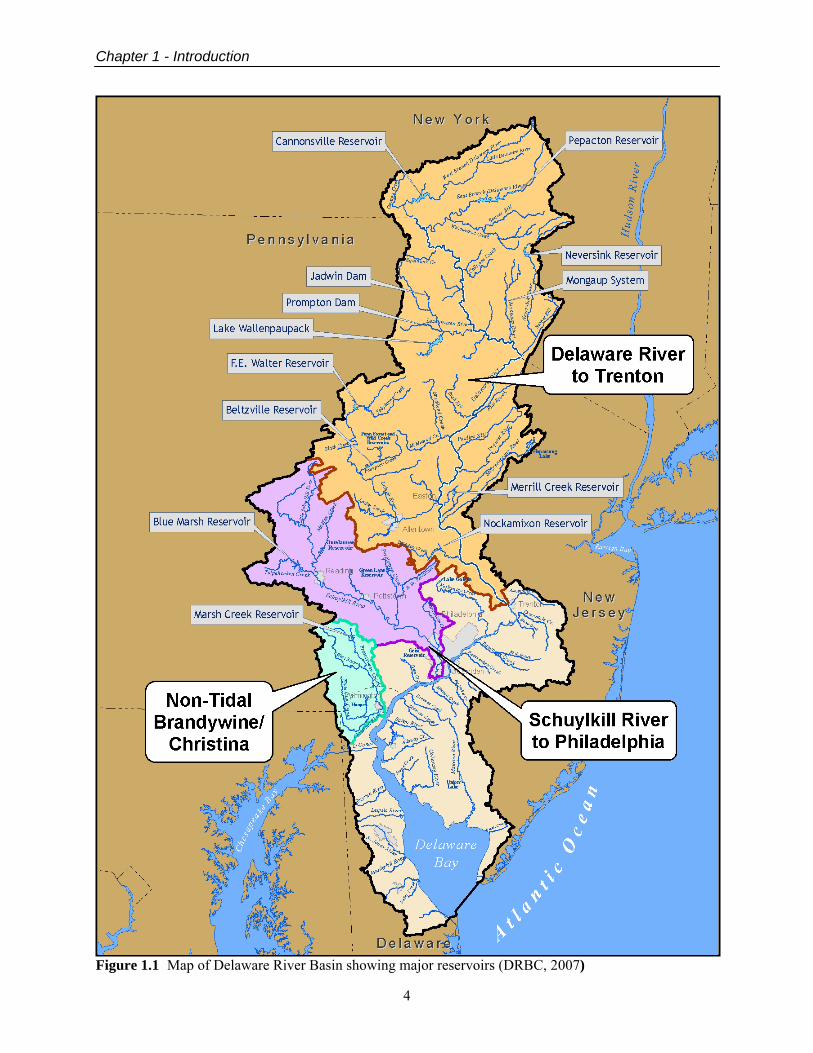
reservoirs, Cannonsville, Pepacton, and Neversink. Nearly half of its municipal water supply comes from these reservoirs. Within the basin, the river supplies drinking water to much of the Philadelphia metropolitan area and major portions of New Jersey, both within and outside of the basin. From the Delaware River's headwaters in New York to the Delaware Estuary and Bay, the river also serves as an ecological and recreational resource. Over the past half century, as a result of the maintenance of minimum flow targets in Montague and Trenton, New Jersey, cold-water fisheries have been established in the tailwater reaches of the East Branch Delaware, West Branch Delaware, Neversink River and the upper main stem Delaware River. Most of the main stem upstream of Trenton, New Jersey has been designated by Congress as part of the federal Wild and Scenic Rivers system. Figure 1.1 (page 4) depicts the watershed and major reservoirs of the Delaware River Basin and denotes the three model sub-basins. The reservoirs include five projects of the Corps that were designed to maintain dedicated flood storage capacity. Other major reservoirs not specifically designed for flood damage reduction, include water supply, hydropower, and recreational reservoirs. The USACE' projects include Jadwin, Prompton, Beltzville, Blue Marsh and Francis E. Walter Reservoirs. The New York City water supply and flow augmentation reservoirs include Cannonsville, Pepacton and Neversink. The hydroelectric power generation reservoirs are Toronto, Swinging Bridge, and Rio in the Mongaup System and Lake Wallenpaupack in the Lackawaxen Basin. Other major multipurpose reservoirs include Marsh Creek, Lake Nockamixon, and Merrill Creek. The reservoirs included in the Delaware above Trenton model include Cannonsville, Pepacton, Neversink, Prompton, Jadwin, Lake Wallenpaupack, the Mongaup System (Toronto, Swinging Bridge, Rio), Francis E Walter, Beltzville, Merrill Creek and Nockamixon. Blue Marsh and Marsh Creek are contained in the Schuylkill and Christina-Brandywine watersheds, respectively.
Chapter 1 - Introduction
4
Figure 1.1 Map of Delaware River Basin showing major reservoirs (DRBC, 2007)
Chapter 2 - Watershed Setup
5
Figure 2.1 Watershed Setup - Delaware River Watershed
Chapter 2
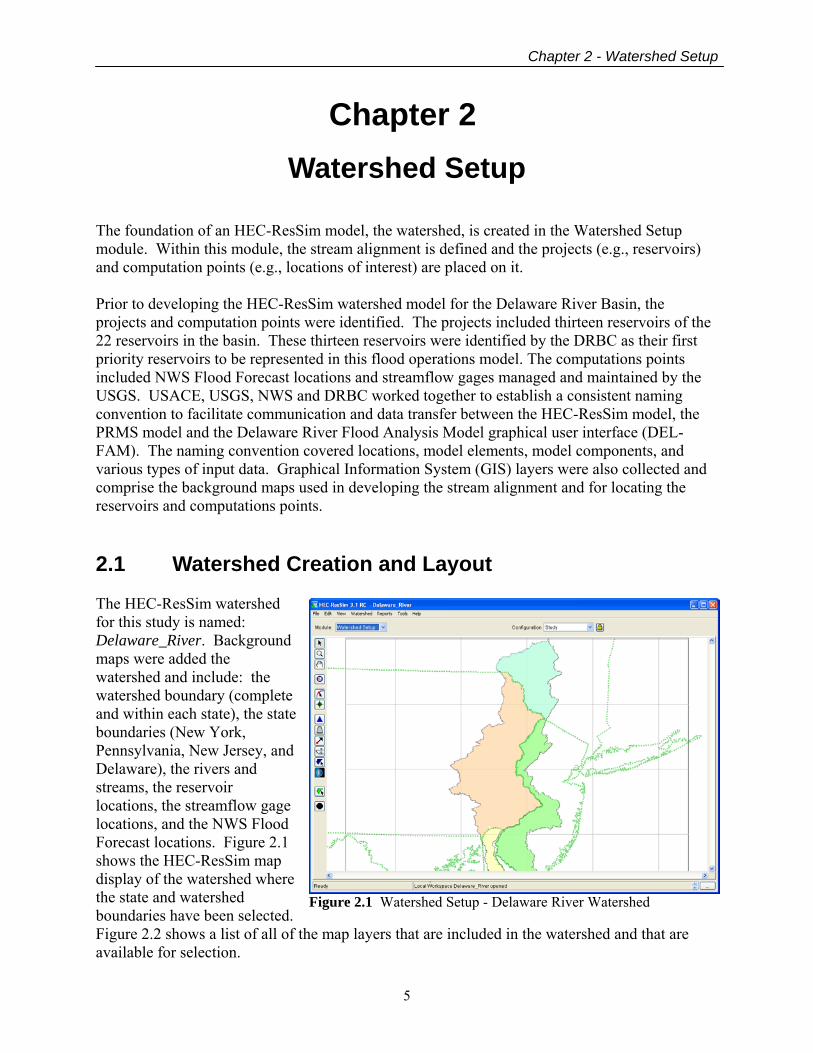
Watershed Setup The foundation of an HEC-ResSim model, the watershed, is created in the Watershed Setup module. Within this module, the stream alignment is defined and the projects (e.g., reservoirs) and computation points (e.g., locations of interest) are placed on it. Prior to developing the HEC-ResSim watershed model for the Delaware River Basin, the projects and computation points were identified. The projects included thirteen reservoirs of the 22 reservoirs in the basin. These thirteen reservoirs were identified by the DRBC as their first priority reservoirs to be represented in this flood operations model. The computations points included NWS Flood Forecast locations and streamflow gages managed and maintained by the USGS. USACE, USGS, NWS and DRBC worked together to establish a consistent naming convention to facilitate communication and data transfer between the HEC-ResSim model, the PRMS model and the Delaware River Flood Analysis Model graphical user interface (DEL-FAM). The naming convention covered locations, model elements, model components, and various types of input data. Graphical Information System (GIS) layers were also collected and comprise the background maps used in developing the stream alignment and for locating the reservoirs and computations points. 2.1 Watershed Creation and Layout The HEC-ResSim watershed for this study is named: Delaware_River. Background maps were added the watershed and include: the watershed boundary (complete and within each state), the state boundaries (New York, Pennsylvania, New Jersey, and Delaware), the rivers and streams, the reservoir locations, the streamflow gage locations, and the NWS Flood Forecast locations. Figure 2.1 shows the HEC-ResSim map display of the watershed where the state and watershed boundaries have been selected. Figure 2.2 shows a list of all of the map layers that are included in the watershed and that are available for selection.
Chapter 2 - Watershed Setup
6
Figure 2.2 Map Layers for Delaware River Watershed
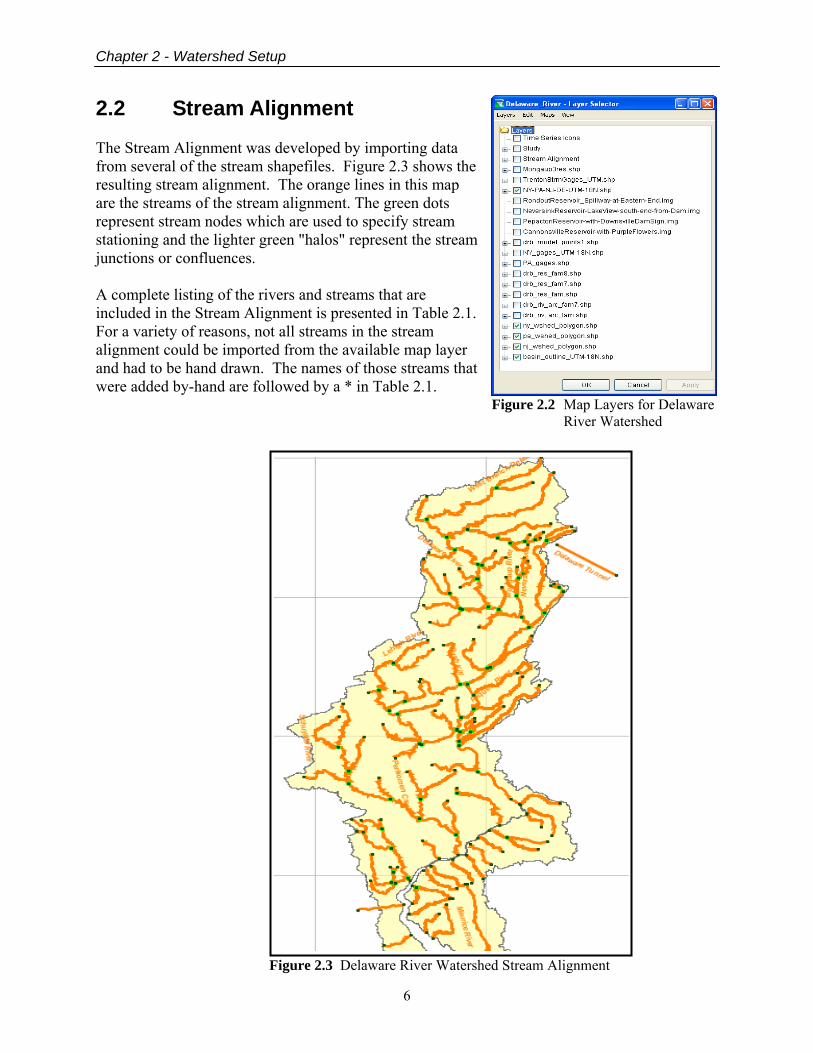
2.2 Stream Alignment The Stream Alignment was developed by importing data from several of the stream shapefiles. Figure 2.3 shows the resulting stream alignment. The orange lines in this map are the streams of the stream alignment. The green dots represent stream nodes which are used to specify stream stationing and the lighter green "halos" represent the stream junctions or confluences. A complete listing of the rivers and streams that are included in the Stream Alignment is presented in Table 2.1. For a variety of reasons, not all streams in the stream alignment could be imported from the available map layer and had to be hand drawn. The names of those streams that were added by-hand are followed by a * in Table 2.1.
Figure 2.3 Delaware River Watershed Stream Alignment
Chapter 2 - Watershed Setup
7
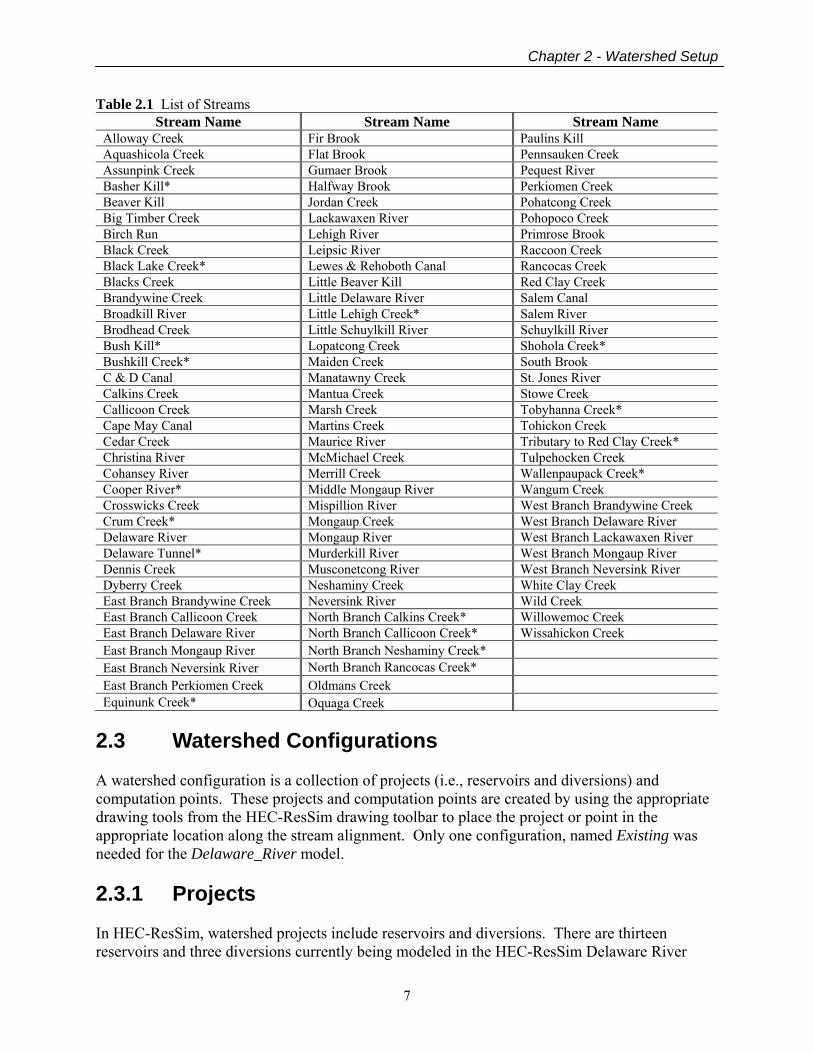
Table 2.1 List of Streams Stream Name Stream Name Stream Name
Alloway Creek Fir Brook Paulins Kill Aquashicola Creek Flat Brook Pennsauken Creek Assunpink Creek Gumaer Brook Pequest River Basher Kill* Halfway Brook Perkiomen Creek Beaver Kill Jordan Creek Pohatcong Creek Big Timber Creek Lackawaxen River Pohopoco Creek Birch Run Lehigh River Primrose Brook Black Creek Leipsic River Raccoon Creek Black Lake Creek* Lewes & Rehoboth Canal Rancocas Creek Blacks Creek Little Beaver Kill Red Clay Creek Brandywine Creek Little Delaware River Salem Canal Broadkill River Little Lehigh Creek* Salem River Brodhead Creek Little Schuylkill River Schuylkill River Bush Kill* Lopatcong Creek Shohola Creek* Bushkill Creek* Maiden Creek South Brook C & D Canal Manatawny Creek St. Jones River Calkins Creek Mantua Creek Stowe Creek Callicoon Creek Marsh Creek Tobyhanna Creek* Cape May Canal Martins Creek Tohickon Creek Cedar Creek Maurice River Tributary to Red Clay Creek* Christina River McMichael Creek Tulpehocken Creek Cohansey River Merrill Creek Wallenpaupack Creek* Cooper River* Middle Mongaup River Wangum Creek Crosswicks Creek Mispillion River West Branch Brandywine Creek Crum Creek* Mongaup Creek West Branch Delaware River Delaware River Mongaup River West Branch Lackawaxen River Delaware Tunnel* Murderkill River West Branch Mongaup River Dennis Creek Musconetcong River West Branch Neversink River Dyberry Creek Neshaminy Creek White Clay Creek East Branch Brandywine Creek Neversink River Wild Creek East Branch Callicoon Creek North Branch Calkins Creek* Willowemoc Creek East Branch Delaware River North Branch Callicoon Creek* Wissahickon Creek East Branch Mongaup River North Branch Neshaminy Creek* East Branch Neversink River North Branch Rancocas Creek* East Branch Perkiomen Creek Oldmans Creek Equinunk Creek* Oquaga Creek
2.3 Watershed Configurations A watershed configuration is a collection of projects (i.e., reservoirs and diversions) and computation points. These projects and computation points are created by using the appropriate drawing tools from the HEC-ResSim drawing toolbar to place the project or point in the appropriate location along the stream alignment. Only one configuration, named Existing was needed for the Delaware_River model. 2.3.1 Projects In HEC-ResSim, watershed projects include reservoirs and diversions. There are thirteen reservoirs and three diversions currently being modeled in the HEC-ResSim Delaware River
Chapter 2 - Watershed Setup
8
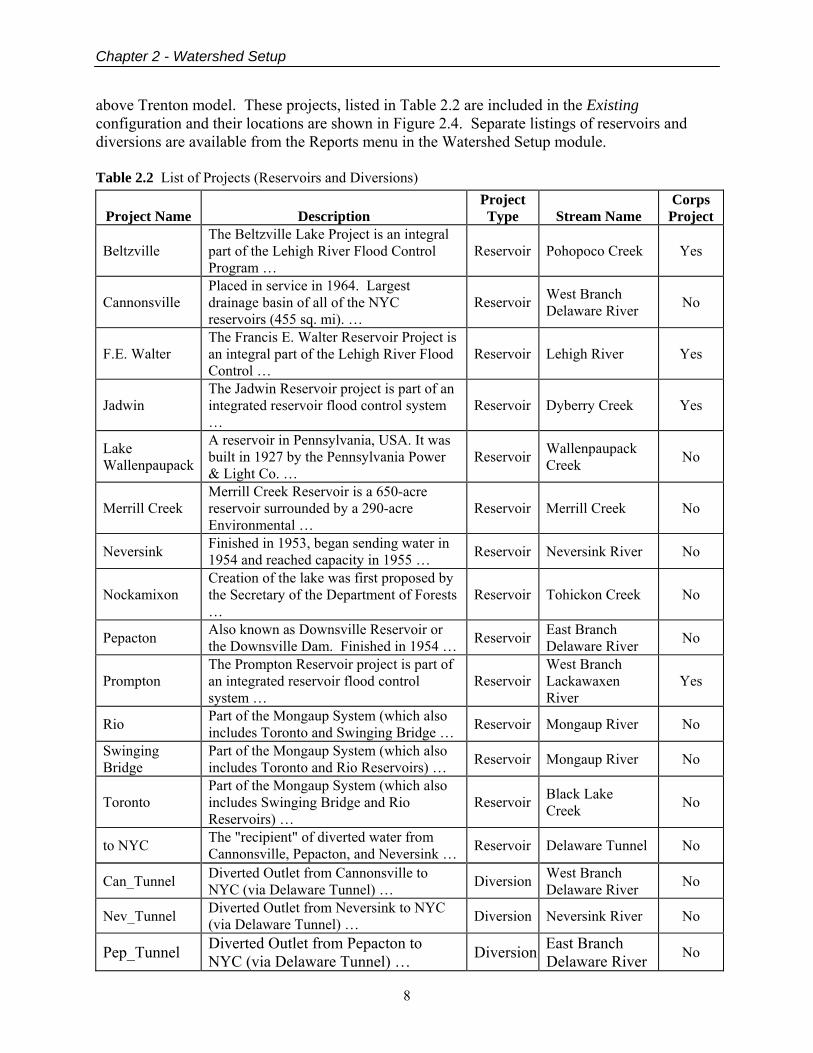
above Trenton model. These projects, listed in Table 2.2 are included in the Existing configuration and their locations are shown in Figure 2.4. Separate listings of reservoirs and diversions are available from the Reports menu in the Watershed Setup module. Table 2.2 List of Projects (Reservoirs and Diversions)
Project Name Description Project Type Stream Name
Corps Project
Beltzville The Beltzville Lake Project is an integral part of the Lehigh River Flood Control Program …
Reservoir Pohopoco Creek Yes
Cannonsville Placed in service in 1964. Largest drainage basin of all of the NYC reservoirs (455 sq. mi). …
Reservoir West Branch Delaware River No
F.E. Walter The Francis E. Walter Reservoir Project is an integral part of the Lehigh River Flood Control …
Reservoir Lehigh River Yes
Jadwin The Jadwin Reservoir project is part of an integrated reservoir flood control system …
Reservoir Dyberry Creek Yes
Lake Wallenpaupack
A reservoir in Pennsylvania, USA. It was built in 1927 by the Pennsylvania Power & Light Co. …
Reservoir Wallenpaupack Creek No
Merrill Creek Merrill Creek Reservoir is a 650-acre reservoir surrounded by a 290-acre Environmental …
Reservoir Merrill Creek No
Neversink Finished in 1953, began sending water in 1954 and reached capacity in 1955 … Reservoir Neversink River No
Nockamixon Creation of the lake was first proposed by the Secretary of the Department of Forests …
Reservoir Tohickon Creek No
Pepacton Also known as Downsville Reservoir or the Downsville Dam. Finished in 1954 … Reservoir East Branch
Delaware River No
Prompton The Prompton Reservoir project is part of an integrated reservoir flood control system …
Reservoir West Branch Lackawaxen River
Yes
Rio Part of the Mongaup System (which also includes Toronto and Swinging Bridge … Reservoir Mongaup River No
Swinging Bridge
Part of the Mongaup System (which also includes Toronto and Rio Reservoirs) … Reservoir Mongaup River No
Toronto Part of the Mongaup System (which also includes Swinging Bridge and Rio Reservoirs) …
Reservoir Black Lake Creek No
to NYC The "recipient" of diverted water from Cannonsville, Pepacton, and Neversink … Reservoir Delaware Tunnel No
Can_Tunnel Diverted Outlet from Cannonsville to NYC (via Delaware Tunnel) … Diversion West Branch
Delaware River No
Nev_Tunnel Diverted Outlet from Neversink to NYC (via Delaware Tunnel) … Diversion Neversink River No
Pep_Tunnel Diverted Outlet from Pepacton to NYC (via Delaware Tunnel) … Diversion East Branch
Delaware River No
Chapter 2 - Watershed Setup
9
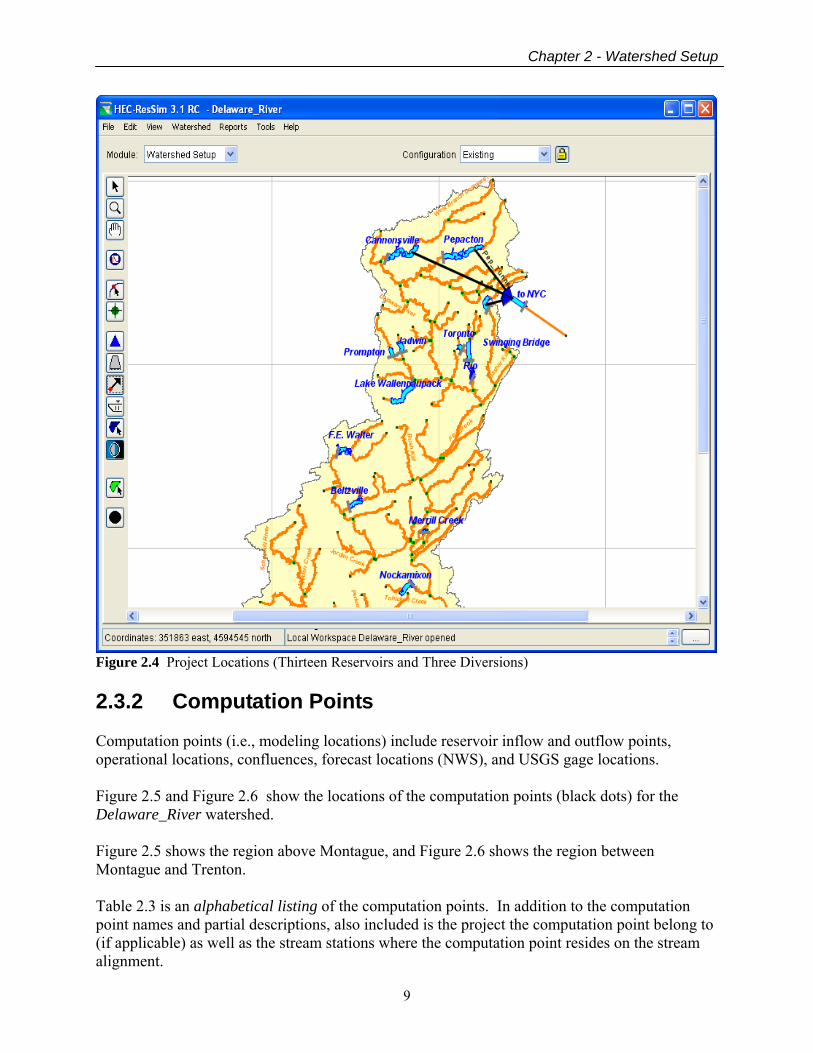
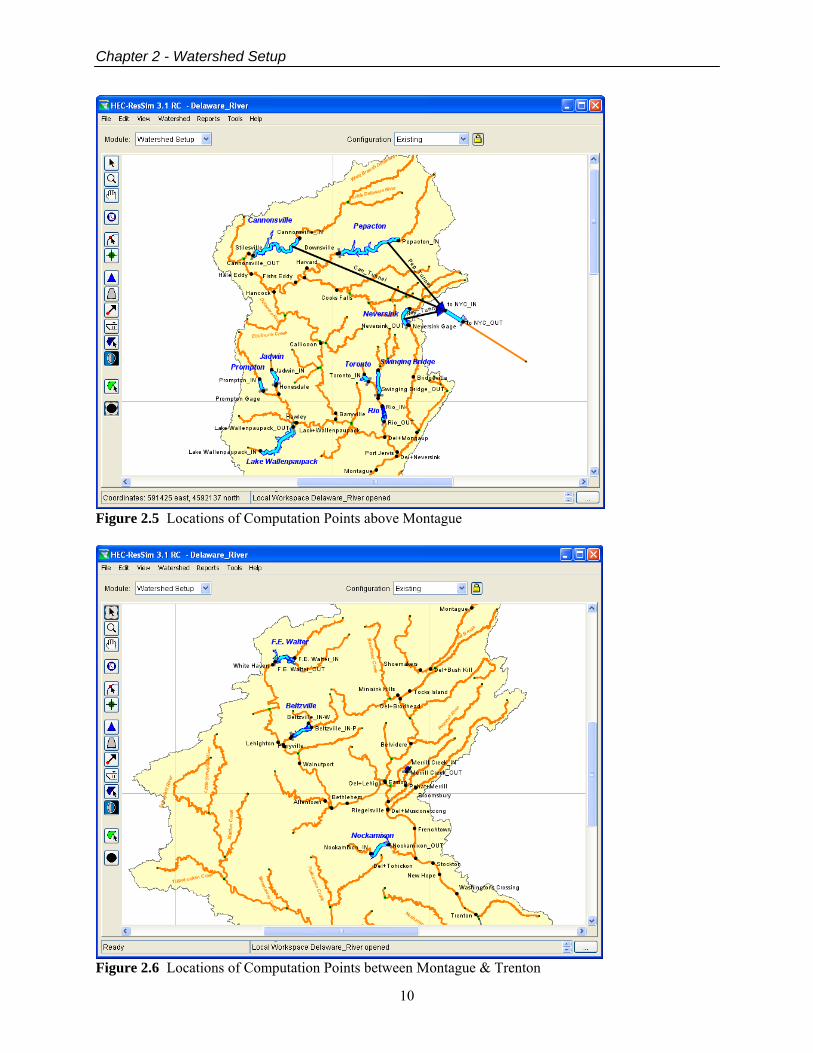
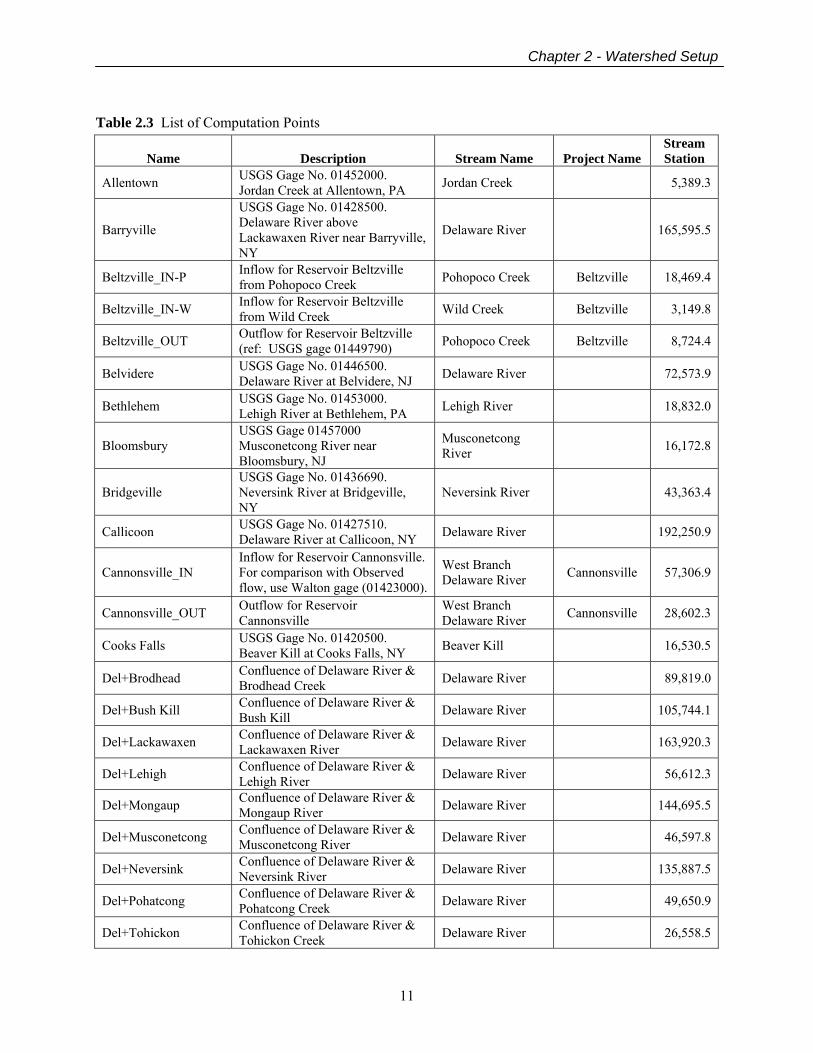
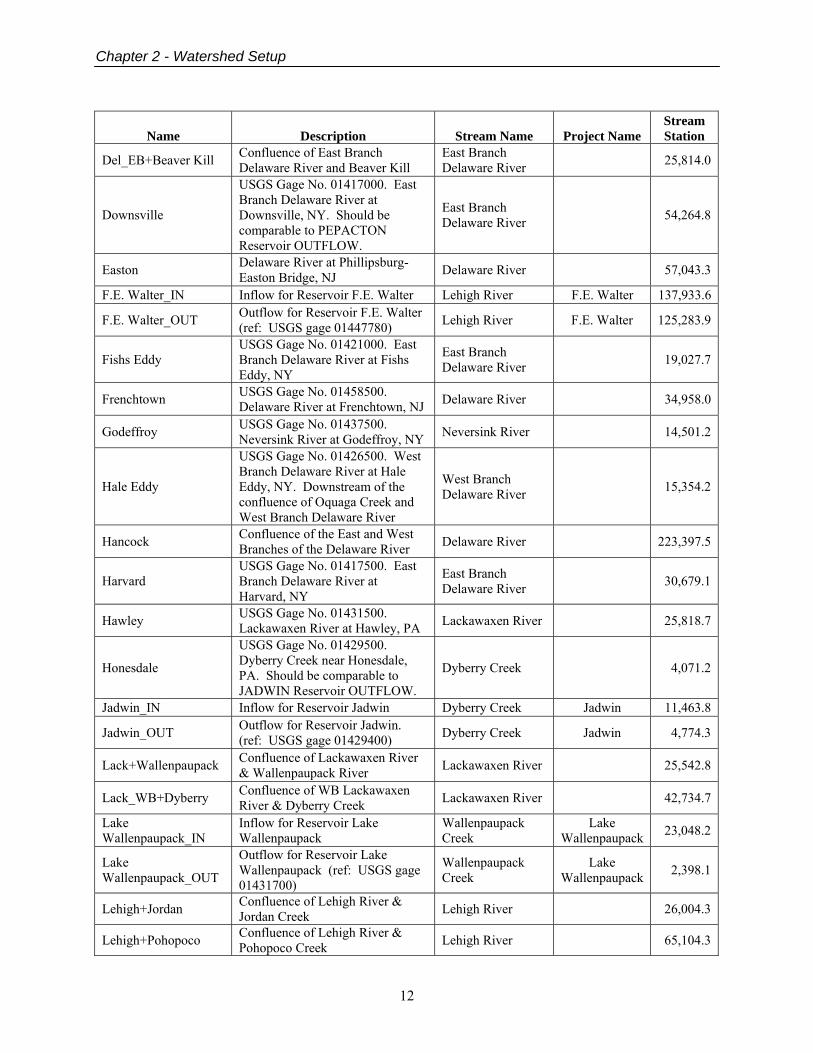
Figure 2.4 Project Locations (Thirteen Reservoirs and Three Diversions) 2.3.2 Computation Points Computation points (i.e., modeling locations) include reservoir inflow and outflow points, operational locations, confluences, forecast locations (NWS), and USGS gage locations. Figure 2.5 and Figure 2.6 show the locations of the computation points (black dots) for the Delaware_River watershed. Figure 2.5 shows the region above Montague, and Figure 2.6 shows the region between Montague and Trenton. Table 2.3 is an alphabetical listing of the computation points. In addition to the computation point names and partial descriptions, also included is the project the computation point belong to (if applicable) as well as the stream stations where the computation point resides on the stream alignment.
Chapter 2 - Watershed Setup
10
Figure 2.5 Locations of Computation Points above Montague
Figure 2.6 Locations of Computation Points between Montague & Trenton
Chapter 2 - Watershed Setup
11
Table 2.3 List of Computation Points
Name Description Stream Name Project Name Stream Station
Allentown USGS Gage No. 01452000. Jordan Creek at Allentown, PA Jordan Creek 5,389.3
Barryville
USGS Gage No. 01428500. Delaware River above Lackawaxen River near Barryville, NY
Delaware River 165,595.5
Beltzville_IN-P Inflow for Reservoir Beltzville from Pohopoco Creek Pohopoco Creek Beltzville 18,469.4
Beltzville_IN-W Inflow for Reservoir Beltzville from Wild Creek Wild Creek Beltzville 3,149.8
Beltzville_OUT Outflow for Reservoir Beltzville (ref: USGS gage 01449790) Pohopoco Creek Beltzville 8,724.4
Belvidere USGS Gage No. 01446500. Delaware River at Belvidere, NJ Delaware River 72,573.9
Bethlehem USGS Gage No. 01453000. Lehigh River at Bethlehem, PA Lehigh River 18,832.0
Bloomsbury USGS Gage 01457000 Musconetcong River near Bloomsbury, NJ
Musconetcong River 16,172.8
Bridgeville USGS Gage No. 01436690. Neversink River at Bridgeville, NY
Neversink River 43,363.4
Callicoon USGS Gage No. 01427510. Delaware River at Callicoon, NY Delaware River 192,250.9
Cannonsville_IN Inflow for Reservoir Cannonsville. For comparison with Observed flow, use Walton gage (01423000).
West Branch Delaware River Cannonsville 57,306.9
Cannonsville_OUT Outflow for Reservoir Cannonsville
West Branch Delaware River Cannonsville 28,602.3
Cooks Falls USGS Gage No. 01420500. Beaver Kill at Cooks Falls, NY Beaver Kill 16,530.5
Del+Brodhead Confluence of Delaware River & Brodhead Creek Delaware River 89,819.0
Del+Bush Kill Confluence of Delaware River & Bush Kill Delaware River 105,744.1
Del+Lackawaxen Confluence of Delaware River & Lackawaxen River Delaware River 163,920.3
Del+Lehigh Confluence of Delaware River & Lehigh River Delaware River 56,612.3
Del+Mongaup Confluence of Delaware River & Mongaup River Delaware River 144,695.5
Del+Musconetcong Confluence of Delaware River & Musconetcong River Delaware River 46,597.8
Del+Neversink Confluence of Delaware River & Neversink River Delaware River 135,887.5
Del+Pohatcong Confluence of Delaware River & Pohatcong Creek Delaware River 49,650.9
Del+Tohickon Confluence of Delaware River & Tohickon Creek Delaware River 26,558.5
Chapter 2 - Watershed Setup
12
Name Description Stream Name Project Name Stream Station
Del_EB+Beaver Kill Confluence of East Branch Delaware River and Beaver Kill
East Branch Delaware River 25,814.0
Downsville
USGS Gage No. 01417000. East Branch Delaware River at Downsville, NY. Should be comparable to PEPACTON Reservoir OUTFLOW.
East Branch Delaware River 54,264.8
Easton Delaware River at Phillipsburg-Easton Bridge, NJ Delaware River 57,043.3
F.E. Walter_IN Inflow for Reservoir F.E. Walter Lehigh River F.E. Walter 137,933.6
F.E. Walter_OUT Outflow for Reservoir F.E. Walter (ref: USGS gage 01447780) Lehigh River F.E. Walter 125,283.9
Fishs Eddy USGS Gage No. 01421000. East Branch Delaware River at Fishs Eddy, NY
East Branch Delaware River 19,027.7
Frenchtown USGS Gage No. 01458500. Delaware River at Frenchtown, NJ Delaware River 34,958.0
Godeffroy USGS Gage No. 01437500. Neversink River at Godeffroy, NY Neversink River 14,501.2
Hale Eddy
USGS Gage No. 01426500. West Branch Delaware River at Hale Eddy, NY. Downstream of the confluence of Oquaga Creek and West Branch Delaware River
West Branch Delaware River 15,354.2
Hancock Confluence of the East and West Branches of the Delaware River Delaware River 223,397.5
Harvard USGS Gage No. 01417500. East Branch Delaware River at Harvard, NY
East Branch Delaware River 30,679.1
Hawley USGS Gage No. 01431500. Lackawaxen River at Hawley, PA Lackawaxen River 25,818.7
Honesdale
USGS Gage No. 01429500. Dyberry Creek near Honesdale, PA. Should be comparable to JADWIN Reservoir OUTFLOW.
Dyberry Creek 4,071.2
Jadwin_IN Inflow for Reservoir Jadwin Dyberry Creek Jadwin 11,463.8
Jadwin_OUT Outflow for Reservoir Jadwin. (ref: USGS gage 01429400) Dyberry Creek Jadwin 4,774.3
Lack+Wallenpaupack Confluence of Lackawaxen River & Wallenpaupack River Lackawaxen River 25,542.8
Lack_WB+Dyberry Confluence of WB Lackawaxen River & Dyberry Creek Lackawaxen River 42,734.7
Lake Wallenpaupack_IN
Inflow for Reservoir Lake Wallenpaupack
Wallenpaupack Creek
Lake Wallenpaupack 23,048.2
Lake Wallenpaupack_OUT
Outflow for Reservoir Lake Wallenpaupack (ref: USGS gage 01431700)
Wallenpaupack Creek
Lake Wallenpaupack 2,398.1
Lehigh+Jordan Confluence of Lehigh River & Jordan Creek Lehigh River 26,004.3
Lehigh+Pohopoco Confluence of Lehigh River & Pohopoco Creek Lehigh River 65,104.3

Chapter 2 - Watershed Setup
13
Name Description Stream Name Project Name Stream Station
Lehighton USGS Gage No. 01449000. Lehigh River at Lehighton, PA Lehigh River 68,346.2
Merrill Creek_IN Inflow for Reservoir Merrill Creek Merrill Creek Merrill Creek 8,172.8
Merrill Creek_OUT Outflow for Reservoir Merrill Creek Merrill Creek Merrill Creek 6,268.5
Minisink Hills USGS Gage No. 01442500. Brodhead Creek at Minisink Hills, PA
Brodhead Creek 1,641.3
Mongaup+Black Lake Cr
Confluence of Mongaup River & Black Lake Creek Mongaup River 19,609.9
Montague USGS Gage No. 01438500. Delaware River at Montague, NJ Delaware River 127,936.6
Neversink Gage
USGS Gage No. 01436000. Neversink River at Neversink, NY. Should be comparable to NEVERSINK Reservoir OUTFLOW.
Neversink River 69,126.8
Neversink_IN Inflow for Reservoir Neversink Neversink River Neversink 78,004.2 Neversink_OUT Outflow for Reservoir Neversink Neversink River Neversink 69,693.2
New Hope Delaware River at New Hope Bridge, PA Delaware River 17,164.7
Nockamixon_IN Inflow for Reservoir Nockamixon Tohickon Creek Nockamixon 28,433.3
Nockamixon_OUT Outflow for Reservoir Nockamixon Tohickon Creek Nockamixon 18,014.2
Parryville USGS Gage No. 01449800. Pohopoco Creek Below Beltzville Dam near Parryville, PA
Pohopoco Creek 7,791.6
Pepacton_IN
Inflow for Reservoir Pepacton. For comparison with observed flow, use Margaretville gage (01413500).
East Branch Delaware River Pepacton 84,641.2
Pepacton_OUT Outflow for Reservoir Pepacton East Branch Delaware River Pepacton 55,123.2
Pohat+Merrill Confluence of Pohatcong Creek & Merrill River Pohatcong Creek 12,477.1
Pohopoco Mouth
Pohopoco Creek Near Parryville, PA, site of the original Parryville Gage (UGSG #01450000 - discontinued in 1970)
Pohopoco Creek 1,049.8
Port Jervis USGS Gage No. 01434000. Delaware River at Port Jervis, NY. Delaware River 137,461.1
Prompton Gage
USGS Gage No. 01429000. West Branch Lackawaxen River at Prompton, PA. Should be comparable to PROMPTON Reservoir OUTFLOW.
West Branch Lackawaxen River 7,387.3
Prompton_IN Inflow for Reservoir Prompton West Branch Lackawaxen River Prompton 12,390.7
Prompton_OUT Outflow for Reservoir Prompton (ref: USGS gage 01428900)
West Branch Lackawaxen River Prompton 7,726.7
Riegelsville USGS Gage No. 01457500. Delaware River at Riegelsville, NJ Delaware River 46,720.9
Chapter 2 - Watershed Setup
14
Name Description Stream Name Project Name Stream Station
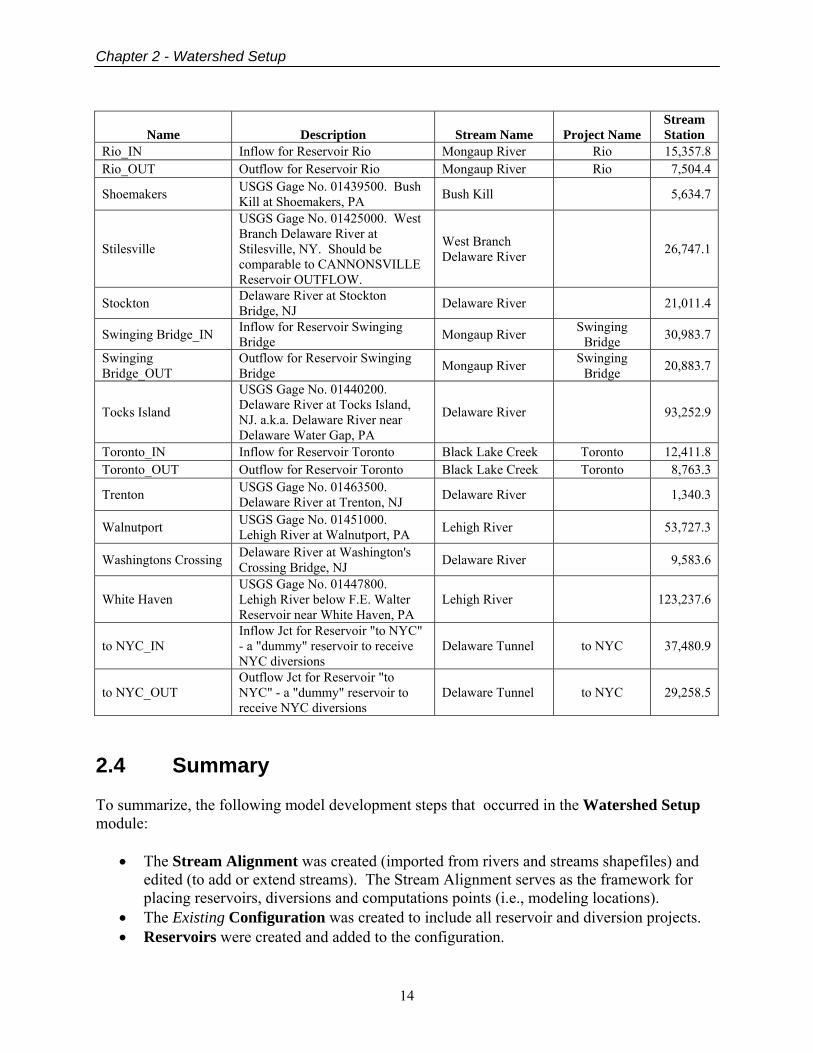
Rio_IN Inflow for Reservoir Rio Mongaup River Rio 15,357.8 Rio_OUT Outflow for Reservoir Rio Mongaup River Rio 7,504.4
Shoemakers USGS Gage No. 01439500. Bush Kill at Shoemakers, PA Bush Kill 5,634.7
Stilesville
USGS Gage No. 01425000. West Branch Delaware River at Stilesville, NY. Should be comparable to CANNONSVILLE Reservoir OUTFLOW.
West Branch Delaware River 26,747.1
Stockton Delaware River at Stockton Bridge, NJ Delaware River 21,011.4
Swinging Bridge_IN Inflow for Reservoir Swinging Bridge Mongaup River Swinging
Bridge 30,983.7
Swinging Bridge_OUT
Outflow for Reservoir Swinging Bridge Mongaup River Swinging
Bridge 20,883.7
Tocks Island
USGS Gage No. 01440200. Delaware River at Tocks Island, NJ. a.k.a. Delaware River near Delaware Water Gap, PA
Delaware River 93,252.9
Toronto_IN Inflow for Reservoir Toronto Black Lake Creek Toronto 12,411.8 Toronto_OUT Outflow for Reservoir Toronto Black Lake Creek Toronto 8,763.3
Trenton USGS Gage No. 01463500. Delaware River at Trenton, NJ Delaware River 1,340.3
Walnutport USGS Gage No. 01451000. Lehigh River at Walnutport, PA Lehigh River 53,727.3
Washingtons Crossing Delaware River at Washington's Crossing Bridge, NJ Delaware River 9,583.6
White Haven USGS Gage No. 01447800. Lehigh River below F.E. Walter Reservoir near White Haven, PA
Lehigh River 123,237.6
to NYC_IN Inflow Jct for Reservoir "to NYC" - a "dummy" reservoir to receive NYC diversions
Delaware Tunnel to NYC 37,480.9
to NYC_OUT Outflow Jct for Reservoir "to NYC" - a "dummy" reservoir to receive NYC diversions
Delaware Tunnel to NYC 29,258.5
2.4 Summary To summarize, the following model development steps that occurred in the Watershed Setup module:
• The Stream Alignment was created (imported from rivers and streams shapefiles) and edited (to add or extend streams). The Stream Alignment serves as the framework for placing reservoirs, diversions and computations points (i.e., modeling locations).
• The Existing Configuration was created to include all reservoir and diversion projects. • Reservoirs were created and added to the configuration.

Chapter 2 - Watershed Setup
15
• Diversions were created (from the three NYC Reservoirs) and added to the configuration.
• Computation Points were created to represent NWS Flood Forecast locations, USGS gage locations, and other points of interest.
USACE, USGS, NWS and DRBC worked together to establish the Naming Conventions for consistency among modeling software programs (PRMS, HEC-ResSim, and the GUI) being used for this study. Computation points (black dots) in the Watershed Setup module become Junctions (red circles) in the Reservoir Network module. In the Watershed Setup module, the computation points are not connected with one another. The connections or Routing Reaches are defined in the Reservoir Network module. Similarly, Diversions from Reservoirs in the Watershed Setup module become Diverted Outlets in the Reservoir Network module.

Chapter 2 - Watershed Setup
16
Chapter 3 - Data Collection
17
Chapter 3
Data Collection Data for the reservoir and streamflow routing component of the Delaware River Flood Analysis model was gathered from three primary sources: the Delaware River Basin Commission (DRBC), the Philadelphia District (CENAP), and the US Geologic Survey (USGS). Other data sources included: the National Weather Service (NWS), the New York City Department of Environmental Protection (NYCDEP), Pennsylvania Power and Light (PPL), Merrill Creek Owners Group (MCOG), and the current superintendant of the hydropower reservoirs in the Mongaup system. Two categories of data were collected: time-series data representing stream flows, reservoir release, river stages, and pool elevations; and model data defining the physical capacities and operational limits of the rivers and reservoirs in the basin. 3.1 Time Series Data 3.1.1 USGS Gage Data The USGS provided most of the time-series data used in the model. The data covered the three flood events studied (September 2004, March-April 2005, and June-July 2006) and includes:
• daily and hourly flow records for all the streamflow gages in the basin • hourly stage records for a subset of the stream gages • hourly pool elevation records for the CENAP reservoirs • daily and hourly inflows computed by the USGS's PRMS model for all headwater and
inflow locations throughout the model. • elevation datum for the streamflow or reservoir pool elevation gages is specific for each
gage and was not used in the model 3.1.2 CENAP Gage Data The CENAP partners with the USGS to maintain many of the gages in the basin needed for operation of the CENAP reservoirs. CENAP maintains a database of these gage records for its own use. The CENAP database also includes records of observed and computed reservoir elevation, storage, inflow, and releases. The data provided by CENAP spans the three flood events studied (September 2004, March-April 2005, and June-July 2006) and includes:

Chapter 3 - Data Collection
18
• daily and hourly flow and stage records for most of the streamflow gages in the basin • hourly pool elevation, storage, and computed inflow records for the CENAP reservoirs • hourly reservoir releases from the CENAP reservoirs
3.1.3 DRBC Data As a regulating and monitoring authority in the basin, the DRBC also maintains a database of time-series data covering most of the reservoirs and stream gages in the basin. Data provided by the DRBC originated with the operators of the reservoirs and is identified as such. This data includes:
• daily and hourly elevation and release records for the NYCDEP reservoirs, Cannonsville, Pepacton and Neversink
• hourly elevation and release records for the PPL reservoir, Lake Wallenpaupack • hourly release records for Rio Reservoir, a part of the Mongaup system of hydropower
reservoirs. • hourly elevation and release records for Merrill Creek Reservoir, owned and operated by
MCOG • monthly elevation and release records for Nockamixon Dam and Reservoir, owned and
operated by the Pennsylvania Department of Natural Resources 3.2 Model Data CENAP provided electronic and hard copies of the Water Control Manuals for the four USACE reservoirs in the Delaware River Basin above Trenton: Prompton, Jadwin, F.E. Walter, and Beltzville. The water control manuals contained most of the physical and operational data used to describe these reservoirs in the model. Other data was also provided by CENAP in Excel® spreadsheets and by email. The DRBC provided the physical and operational data for all other reservoirs modeled in the basin. This data was provided through a mixture of media including: hard copies of various documents that described the reservoirs, an electronic copy of the DRBC's OASIS (Operational Analysis and Simulation of Integrated Systems) model that they use to study water supply issues in the basin, and email correspondence with reservoir operators to fill in the gaps. OASIS is a software product developed by HydroLogics, Inc. for modeling the operations of water resources systems. OASIS uses a linear programming solver to optimize the reservoir releases to best meet the operating rules that have been represented as either goals or constraints. NWS provided the routing parameters used in their real-time forecasting model of the Delaware River Basin as well as a complete description of the Variable Lag and K routing method. Tables listing all the physical and some of the operational data used in the model can be found in Appendix B of this report.
Chapter 4 - Reservoir Network
19
Chapter 4
Reservoir Network The reservoir network is the basis of a reservoir model developed using HEC-ResSim. The network developed for this project is named: Delaware above Trenton. This network includes all the physical and operational data needed for the various alternatives developed for the Delaware_River watershed. From this point forward in the report, the network, Delaware above Trenton, and its associated alternatives will be referred to as "the model". The alternatives will be described in Chapter 5, Alternatives and Simulations. The modeling elements that make up a reservoir network include: reservoirs, reaches, junctions, diversions, reservoir systems, and state variables. Each of these elements consists of one or more sub-elements. The following sections will describe each element type beginning with the simplest elements, the junctions, and working up to the most complex, the reservoirs and reservoir systems. The Delaware River Basin above Trenton consists of the following major subbasins:
• The Upper Basin contains all three of the New York City water supply reservoirs and includes the West and East Branches of the Delaware River and the Neversink River. Cannonsville and Pepacton Reservoirs are located on the West and East Branches, respectively. The Neversink Reservoir is on the Neversink River and it releases flows into the Delaware below two other major subbasins (Lackawaxen and Mongaup). It was included with the Upper Basin so that all three New York City water supply reservoirs and the unique aspects of their operations could be evaluated together.
• The Lackawaxen River Basin which includes Prompton and Jadwin, two USACE flood damage reduction reservoirs, and Lake Wallenpaupack, a PPL Corporation hydropower reservoir.
• The Mongaup River Basin includes three hydropower reservoirs: Swinging Bridge, Toronto and Rio Reservoirs. Although the Mongaup River basin contains five reservoirs, only the three largest were represented in the model in order to enable the DRBC to evaluate their possible flood damage reduction benefits.
• The Lehigh River Basin contains F.E. Walter and Beltzville Reservoirs, both USACE flood damage reduction reservoirs.
• The Mainstem Delaware River Basin receives flow from all the other basins as well as several smaller tributaries, two of which include Merrill Creek and Nockamixon Reservoirs which are located on two of the smaller tributaries, Merrill Creek and Tohickon Creek.
The following sections will describe each element type beginning with the simplest elements, the junctions, and ending with the most complex, the reservoirs and reservoir systems. To facilitate
Chapter 4 - Reservoir Network
20
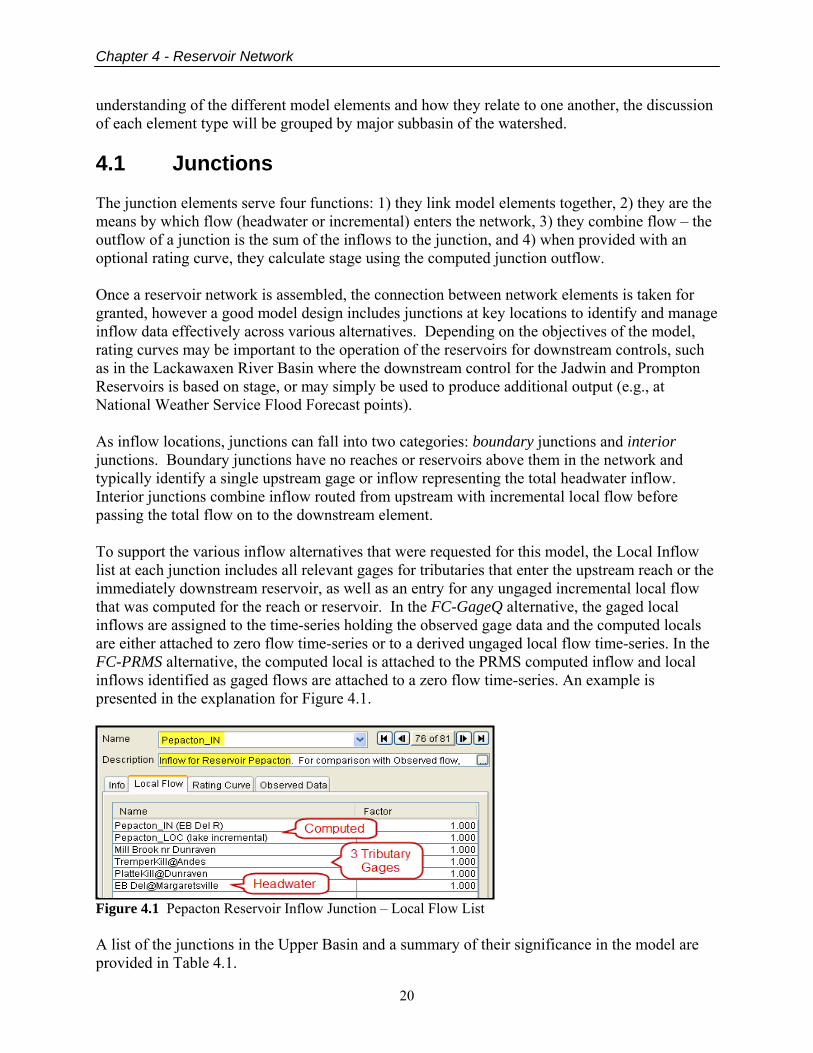
understanding of the different model elements and how they relate to one another, the discussion of each element type will be grouped by major subbasin of the watershed. 4.1 Junctions The junction elements serve four functions: 1) they link model elements together, 2) they are the means by which flow (headwater or incremental) enters the network, 3) they combine flow – the outflow of a junction is the sum of the inflows to the junction, and 4) when provided with an optional rating curve, they calculate stage using the computed junction outflow. Once a reservoir network is assembled, the connection between network elements is taken for granted, however a good model design includes junctions at key locations to identify and manage inflow data effectively across various alternatives. Depending on the objectives of the model, rating curves may be important to the operation of the reservoirs for downstream controls, such as in the Lackawaxen River Basin where the downstream control for the Jadwin and Prompton Reservoirs is based on stage, or may simply be used to produce additional output (e.g., at National Weather Service Flood Forecast points). As inflow locations, junctions can fall into two categories: boundary junctions and interior junctions. Boundary junctions have no reaches or reservoirs above them in the network and typically identify a single upstream gage or inflow representing the total headwater inflow. Interior junctions combine inflow routed from upstream with incremental local flow before passing the total flow on to the downstream element. To support the various inflow alternatives that were requested for this model, the Local Inflow list at each junction includes all relevant gages for tributaries that enter the upstream reach or the immediately downstream reservoir, as well as an entry for any ungaged incremental local flow that was computed for the reach or reservoir. In the FC-GageQ alternative, the gaged local inflows are assigned to the time-series holding the observed gage data and the computed locals are either attached to zero flow time-series or to a derived ungaged local flow time-series. In the FC-PRMS alternative, the computed local is attached to the PRMS computed inflow and local inflows identified as gaged flows are attached to a zero flow time-series. An example is presented in the explanation for Figure 4.1.
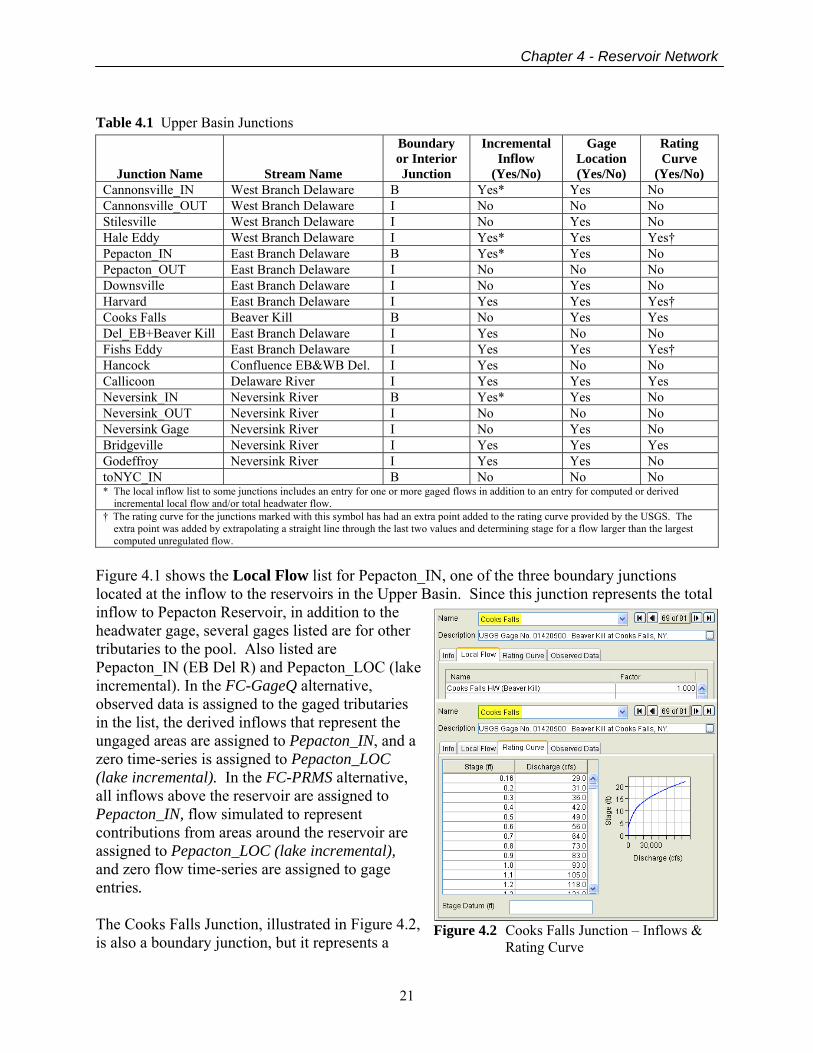
Figure 4.1 Pepacton Reservoir Inflow Junction – Local Flow List A list of the junctions in the Upper Basin and a summary of their significance in the model are provided in Table 4.1.
Chapter 4 - Reservoir Network
21
Figure 4.2 Cooks Falls Junction – Inflows & Rating Curve
Table 4.1 Upper Basin Junctions
Junction Name Stream Name
Boundary or Interior Junction
Incremental Inflow
(Yes/No)
Gage Location (Yes/No)
Rating Curve
(Yes/No) Cannonsville_IN West Branch Delaware B Yes* Yes No Cannonsville_OUT West Branch Delaware I No No No Stilesville West Branch Delaware I No Yes No Hale Eddy West Branch Delaware I Yes* Yes Yes† Pepacton_IN East Branch Delaware B Yes* Yes No Pepacton_OUT East Branch Delaware I No No No Downsville East Branch Delaware I No Yes No Harvard East Branch Delaware I Yes Yes Yes† Cooks Falls Beaver Kill B No Yes Yes Del_EB+Beaver Kill East Branch Delaware I Yes No No Fishs Eddy East Branch Delaware I Yes Yes Yes† Hancock Confluence EB&WB Del. I Yes No No Callicoon Delaware River I Yes Yes Yes Neversink_IN Neversink River B Yes* Yes No Neversink_OUT Neversink River I No No No Neversink Gage Neversink River I No Yes No Bridgeville Neversink River I Yes Yes Yes Godeffroy Neversink River I Yes Yes No toNYC_IN B No No No * The local inflow list to some junctions includes an entry for one or more gaged flows in addition to an entry for computed or derived
incremental local flow and/or total headwater flow. † The rating curve for the junctions marked with this symbol has had an extra point added to the rating curve provided by the USGS. The
extra point was added by extrapolating a straight line through the last two values and determining stage for a flow larger than the largest computed unregulated flow.
Figure 4.1 shows the Local Flow list for Pepacton_IN, one of the three boundary junctions located at the inflow to the reservoirs in the Upper Basin. Since this junction represents the total inflow to Pepacton Reservoir, in addition to the headwater gage, several gages listed are for other tributaries to the pool. Also listed are Pepacton_IN (EB Del R) and Pepacton_LOC (lake incremental). In the FC-GageQ alternative, observed data is assigned to the gaged tributaries in the list, the derived inflows that represent the ungaged areas are assigned to Pepacton_IN, and a zero time-series is assigned to Pepacton_LOC (lake incremental). In the FC-PRMS alternative, all inflows above the reservoir are assigned to Pepacton_IN, flow simulated to represent contributions from areas around the reservoir are assigned to Pepacton_LOC (lake incremental), and zero flow time-series are assigned to gage entries. The Cooks Falls Junction, illustrated in Figure 4.2, is also a boundary junction, but it represents a
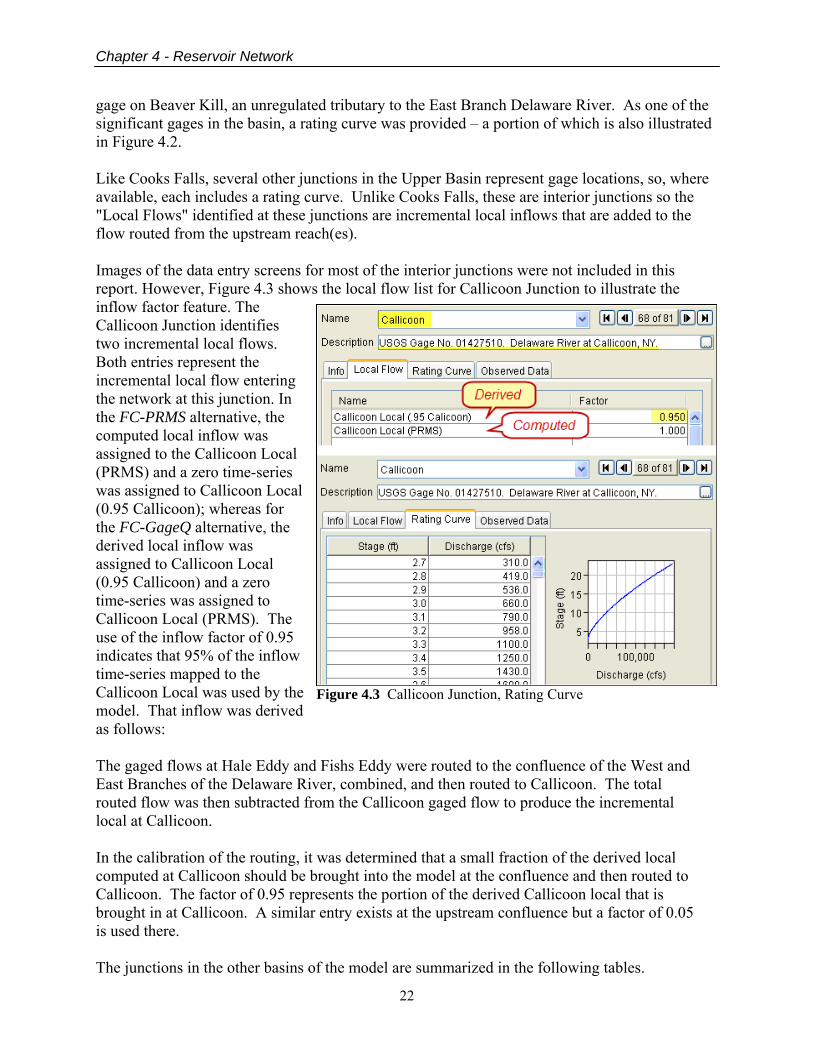
Chapter 4 - Reservoir Network
22
Figure 4.3 Callicoon Junction, Rating Curve
gage on Beaver Kill, an unregulated tributary to the East Branch Delaware River. As one of the significant gages in the basin, a rating curve was provided – a portion of which is also illustrated in Figure 4.2. Like Cooks Falls, several other junctions in the Upper Basin represent gage locations, so, where available, each includes a rating curve. Unlike Cooks Falls, these are interior junctions so the "Local Flows" identified at these junctions are incremental local inflows that are added to the flow routed from the upstream reach(es). Images of the data entry screens for most of the interior junctions were not included in this report. However, Figure 4.3 shows the local flow list for Callicoon Junction to illustrate the inflow factor feature. The Callicoon Junction identifies two incremental local flows. Both entries represent the incremental local flow entering the network at this junction. In the FC-PRMS alternative, the computed local inflow was assigned to the Callicoon Local (PRMS) and a zero time-series was assigned to Callicoon Local (0.95 Callicoon); whereas for the FC-GageQ alternative, the derived local inflow was assigned to Callicoon Local (0.95 Callicoon) and a zero time-series was assigned to Callicoon Local (PRMS). The use of the inflow factor of 0.95 indicates that 95% of the inflow time-series mapped to the Callicoon Local was used by the model. That inflow was derived as follows: The gaged flows at Hale Eddy and Fishs Eddy were routed to the confluence of the West and East Branches of the Delaware River, combined, and then routed to Callicoon. The total routed flow was then subtracted from the Callicoon gaged flow to produce the incremental local at Callicoon. In the calibration of the routing, it was determined that a small fraction of the derived local computed at Callicoon should be brought into the model at the confluence and then routed to Callicoon. The factor of 0.95 represents the portion of the derived Callicoon local that is brought in at Callicoon. A similar entry exists at the upstream confluence but a factor of 0.05 is used there. The junctions in the other basins of the model are summarized in the following tables.
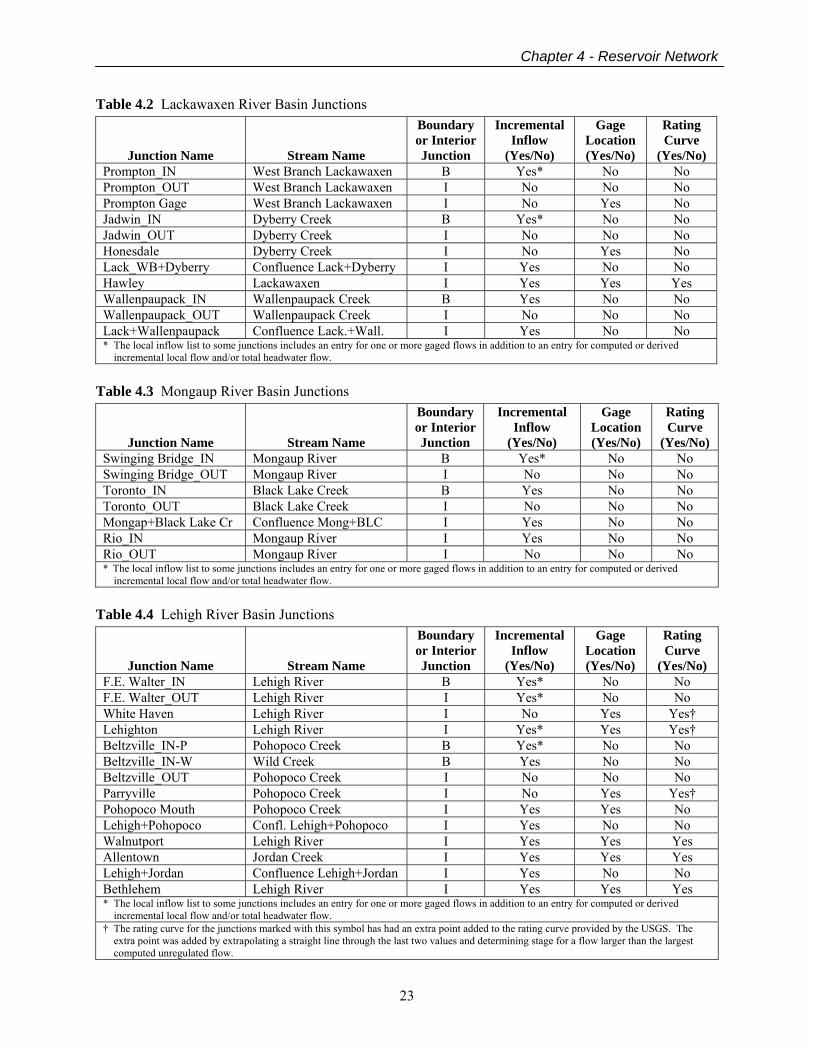
Chapter 4 - Reservoir Network
23
Table 4.2 Lackawaxen River Basin Junctions
Junction Name Stream Name
Boundary or Interior Junction
Incremental Inflow
(Yes/No)
Gage Location (Yes/No)
Rating Curve
(Yes/No) Prompton_IN West Branch Lackawaxen B Yes* No No Prompton_OUT West Branch Lackawaxen I No No No Prompton Gage West Branch Lackawaxen I No Yes No Jadwin_IN Dyberry Creek B Yes* No No Jadwin_OUT Dyberry Creek I No No No Honesdale Dyberry Creek I No Yes No Lack_WB+Dyberry Confluence Lack+Dyberry I Yes No No Hawley Lackawaxen I Yes Yes Yes Wallenpaupack_IN Wallenpaupack Creek B Yes No No Wallenpaupack_OUT Wallenpaupack Creek I No No No Lack+Wallenpaupack Confluence Lack.+Wall. I Yes No No * The local inflow list to some junctions includes an entry for one or more gaged flows in addition to an entry for computed or derived
incremental local flow and/or total headwater flow.
Table 4.3 Mongaup River Basin Junctions
Junction Name Stream Name
Boundary or Interior Junction
Incremental Inflow
(Yes/No)
Gage Location (Yes/No)
Rating Curve
(Yes/No) Swinging Bridge_IN Mongaup River B Yes* No No Swinging Bridge_OUT Mongaup River I No No No Toronto_IN Black Lake Creek B Yes No No Toronto_OUT Black Lake Creek I No No No Mongap+Black Lake Cr Confluence Mong+BLC I Yes No No Rio_IN Mongaup River I Yes No No Rio_OUT Mongaup River I No No No * The local inflow list to some junctions includes an entry for one or more gaged flows in addition to an entry for computed or derived
incremental local flow and/or total headwater flow.
Table 4.4 Lehigh River Basin Junctions
Junction Name Stream Name
Boundary or Interior Junction
Incremental Inflow
(Yes/No)
Gage Location (Yes/No)
Rating Curve
(Yes/No) F.E. Walter_IN Lehigh River B Yes* No No F.E. Walter_OUT Lehigh River I Yes* No No White Haven Lehigh River I No Yes Yes† Lehighton Lehigh River I Yes* Yes Yes† Beltzville_IN-P Pohopoco Creek B Yes* No No Beltzville_IN-W Wild Creek B Yes No No Beltzville_OUT Pohopoco Creek I No No No Parryville Pohopoco Creek I No Yes Yes† Pohopoco Mouth Pohopoco Creek I Yes Yes No Lehigh+Pohopoco Confl. Lehigh+Pohopoco I Yes No No Walnutport Lehigh River I Yes Yes Yes Allentown Jordan Creek I Yes Yes Yes Lehigh+Jordan Confluence Lehigh+Jordan I Yes No No Bethlehem Lehigh River I Yes Yes Yes * The local inflow list to some junctions includes an entry for one or more gaged flows in addition to an entry for computed or derived
incremental local flow and/or total headwater flow. † The rating curve for the junctions marked with this symbol has had an extra point added to the rating curve provided by the USGS. The
extra point was added by extrapolating a straight line through the last two values and determining stage for a flow larger than the largest computed unregulated flow.

Chapter 4 - Reservoir Network
24
Table 4.5 Mainstem Delaware River Basin Junctions
Junction Name Stream Name
Boundary or Interior Junction
Incremental Inflow
(Yes/No)
Gage Location (Yes/No)
Rating Curve
(Yes/No) Barryville Delaware River I Yes* Yes Yes Del+Lackawaxen Confluence Del+Lack I Yes* No No Del+Mongaup Confluence Del+Mongaup I No Yes No Port Jervis Delaware River I Yes Yes Yes Montague Delaware River I Yes Yes Yes† Shoemakers Bush Kill B Yes* Yes Yes Del+Bush Kill Confluence Del+Bush Kill I Yes No No Tocks Island Delaware River I Yes Yes Yes Minisink Hills Brodhead Creek B Yes Yes Yes Del+Brodhead Confluence Del+Brodhead I Yes No No Belvidere Delaware River I Yes Yes Yes Easton Delaware River I Yes No No Delaware+Lehigh Confluence Del+Lehigh I Yes No No Merrill Creek_IN Merrill Creek B Yes No No Merrill Creek_OUT Merrill Creek I No No No Pohat+Merrill Confl. Pohatcong+Merrill I Yes No No Del+Pohatcong Confl. Del.+Pohatcong Cr I Yes No No BloomsBury Musconetcong River B Yes Yes No Riegelsville Delaware River I Yes Yes Yes Del+Musconetcong Confl. Del.+Musconetcong I Yes No No Frenchtown Delaware River I Yes Yes No Nockamixon_IN Tohickon Creek B Yes No No Nockamixon_OUT Tohickon Creek I No No No Del+Tohickon Confluence Del+Tohickon I Yes No No Stockton Delaware River I Yes No No New Hope Delaware River I Yes No No Washingtons Crossing Delaware River I Yes No No Trenton Delaware River I Yes Yes Yes * The local inflow list to some junctions includes an entry for one or more gaged flows in addition to an entry for computed or derived
incremental local flow and/or total headwater flow. † The rating curve for the junctions marked with this symbol has had an extra point added to the rating curve provided by the USGS. The extra
point was added by extrapolating a straight line through the last two values and determining stage for a flow larger than the largest computed unregulated flow.
4.2 Reaches The reaches route water from one junction to another in the network. Routing is performed in HEC-ResSim using one of a handful of hydrologic routing methods. In this model, only three of the available methods were used: Null (direct translation – no lag or attenuation), Variable Lag & K, and Muskingum. Null routing was used for very short reaches that have no appreciable impact on the flow that can be represented in a one-hour timestep. The Variable Lag & K method is a routing method used extensively by the NWS in their hydrologic forecasting models. Since calibration of routing parameters can be significantly labor intensive and because the NWS already had developed Lag & K routing parameters calibrated for much of the Delaware River Basin, at the onset of this project, HEC chose to add the Lag & K routing method to HEC-ResSim rather than redevelop routing parameters for the entire basin in another method. However, due to differences in model configurations and assumptions, the
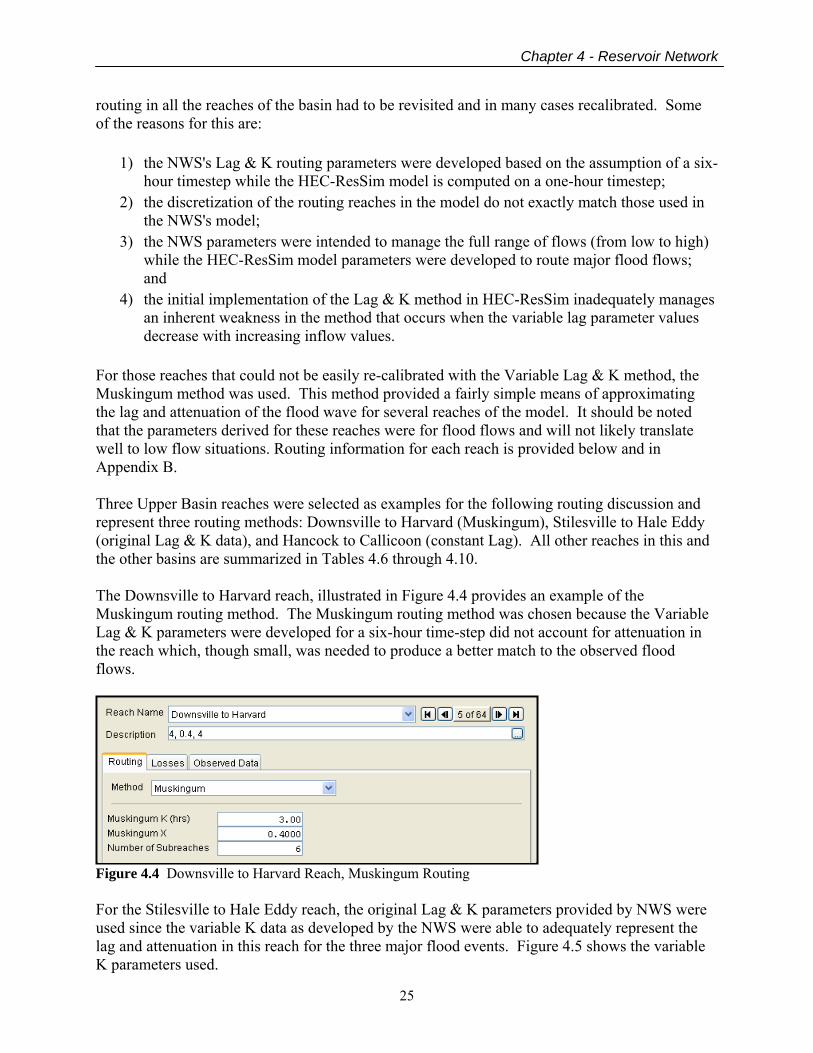
Chapter 4 - Reservoir Network
25
routing in all the reaches of the basin had to be revisited and in many cases recalibrated. Some of the reasons for this are:
1) the NWS's Lag & K routing parameters were developed based on the assumption of a six-hour timestep while the HEC-ResSim model is computed on a one-hour timestep;
2) the discretization of the routing reaches in the model do not exactly match those used in the NWS's model;
3) the NWS parameters were intended to manage the full range of flows (from low to high) while the HEC-ResSim model parameters were developed to route major flood flows; and
4) the initial implementation of the Lag & K method in HEC-ResSim inadequately manages an inherent weakness in the method that occurs when the variable lag parameter values decrease with increasing inflow values.
For those reaches that could not be easily re-calibrated with the Variable Lag & K method, the Muskingum method was used. This method provided a fairly simple means of approximating the lag and attenuation of the flood wave for several reaches of the model. It should be noted that the parameters derived for these reaches were for flood flows and will not likely translate well to low flow situations. Routing information for each reach is provided below and in Appendix B. Three Upper Basin reaches were selected as examples for the following routing discussion and represent three routing methods: Downsville to Harvard (Muskingum), Stilesville to Hale Eddy (original Lag & K data), and Hancock to Callicoon (constant Lag). All other reaches in this and the other basins are summarized in Tables 4.6 through 4.10. The Downsville to Harvard reach, illustrated in Figure 4.4 provides an example of the Muskingum routing method. The Muskingum routing method was chosen because the Variable Lag & K parameters were developed for a six-hour time-step did not account for attenuation in the reach which, though small, was needed to produce a better match to the observed flood flows.
Figure 4.4 Downsville to Harvard Reach, Muskingum Routing For the Stilesville to Hale Eddy reach, the original Lag & K parameters provided by NWS were used since the variable K data as developed by the NWS were able to adequately represent the lag and attenuation in this reach for the three major flood events. Figure 4.5 shows the variable K parameters used.
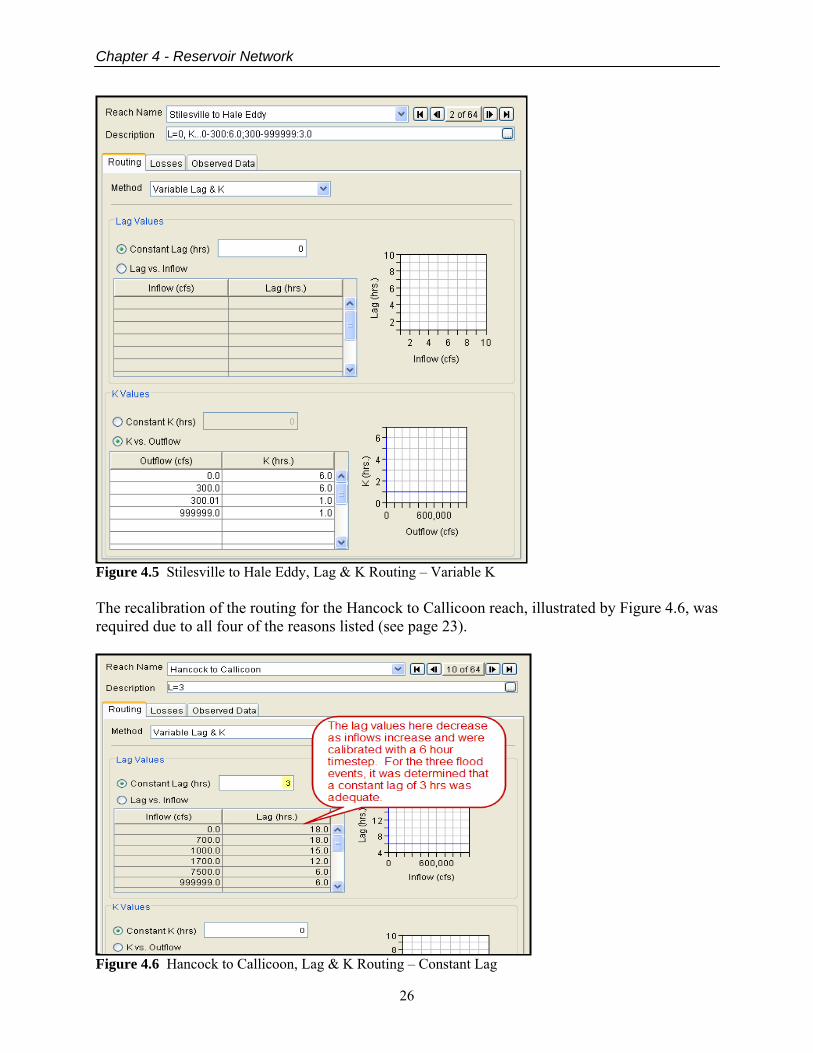
Chapter 4 - Reservoir Network
26
Figure 4.5 Stilesville to Hale Eddy, Lag & K Routing – Variable K The recalibration of the routing for the Hancock to Callicoon reach, illustrated by Figure 4.6, was required due to all four of the reasons listed (see page 23).
Figure 4.6 Hancock to Callicoon, Lag & K Routing – Constant Lag
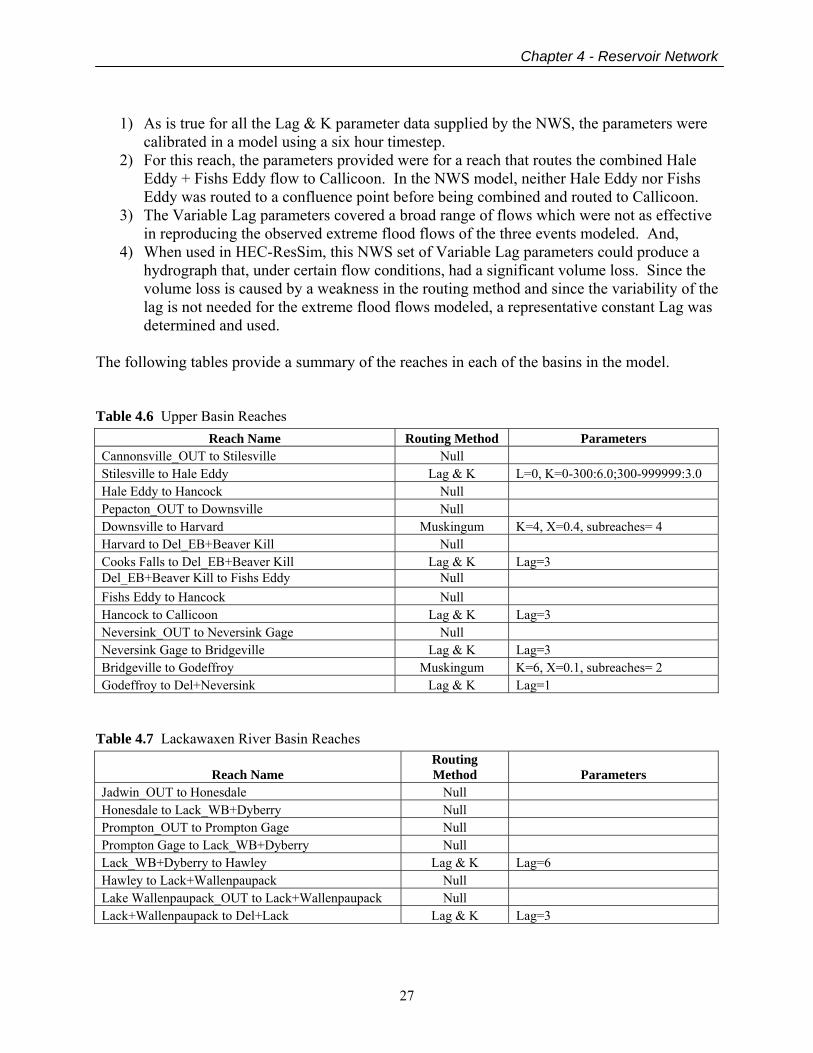
Chapter 4 - Reservoir Network
27
1) As is true for all the Lag & K parameter data supplied by the NWS, the parameters were
calibrated in a model using a six hour timestep. 2) For this reach, the parameters provided were for a reach that routes the combined Hale
Eddy + Fishs Eddy flow to Callicoon. In the NWS model, neither Hale Eddy nor Fishs Eddy was routed to a confluence point before being combined and routed to Callicoon.
3) The Variable Lag parameters covered a broad range of flows which were not as effective in reproducing the observed extreme flood flows of the three events modeled. And,
4) When used in HEC-ResSim, this NWS set of Variable Lag parameters could produce a hydrograph that, under certain flow conditions, had a significant volume loss. Since the volume loss is caused by a weakness in the routing method and since the variability of the lag is not needed for the extreme flood flows modeled, a representative constant Lag was determined and used.
The following tables provide a summary of the reaches in each of the basins in the model. Table 4.6 Upper Basin Reaches
Reach Name Routing Method Parameters Cannonsville_OUT to Stilesville Null Stilesville to Hale Eddy Lag & K L=0, K=0-300:6.0;300-999999:3.0 Hale Eddy to Hancock Null Pepacton_OUT to Downsville Null Downsville to Harvard Muskingum K=4, X=0.4, subreaches= 4 Harvard to Del_EB+Beaver Kill Null Cooks Falls to Del_EB+Beaver Kill Lag & K Lag=3 Del_EB+Beaver Kill to Fishs Eddy Null Fishs Eddy to Hancock Null Hancock to Callicoon Lag & K Lag=3 Neversink_OUT to Neversink Gage Null Neversink Gage to Bridgeville Lag & K Lag=3 Bridgeville to Godeffroy Muskingum K=6, X=0.1, subreaches= 2 Godeffroy to Del+Neversink Lag & K Lag=1
Table 4.7 Lackawaxen River Basin Reaches
Reach Name Routing Method Parameters
Jadwin_OUT to Honesdale Null Honesdale to Lack_WB+Dyberry Null Prompton_OUT to Prompton Gage Null Prompton Gage to Lack_WB+Dyberry Null Lack_WB+Dyberry to Hawley Lag & K Lag=6 Hawley to Lack+Wallenpaupack Null Lake Wallenpaupack_OUT to Lack+Wallenpaupack Null Lack+Wallenpaupack to Del+Lack Lag & K Lag=3
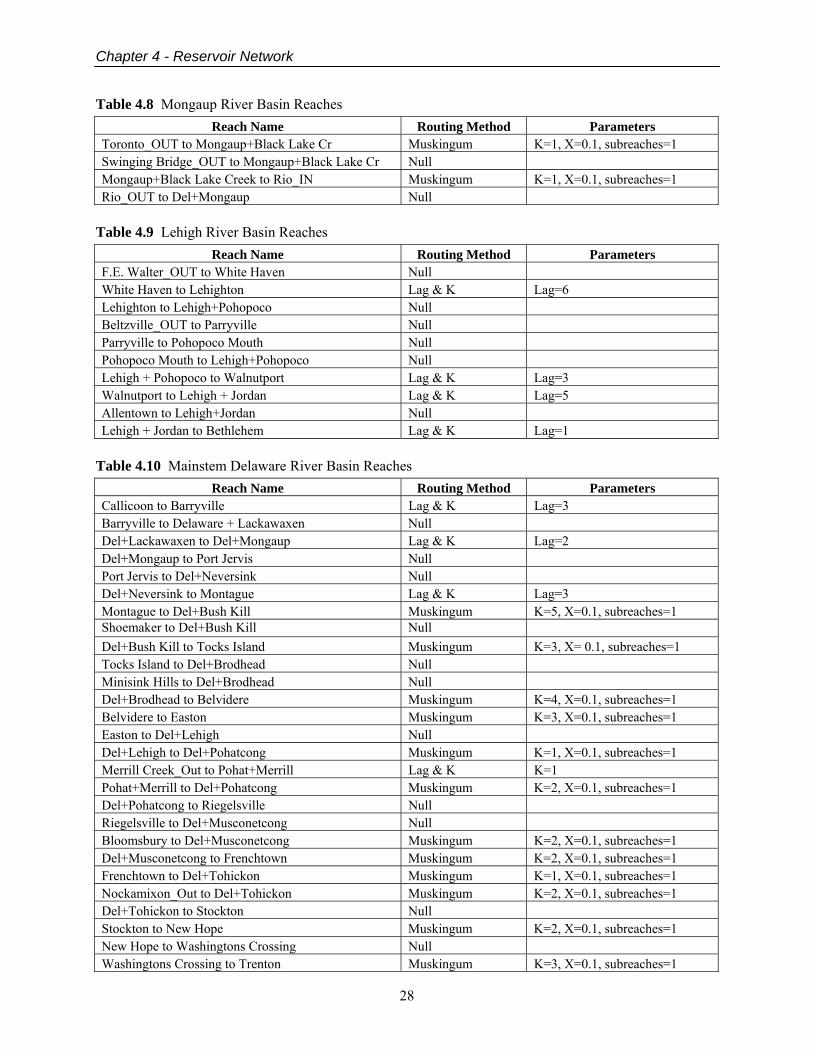
Chapter 4 - Reservoir Network
28
Table 4.8 Mongaup River Basin Reaches Reach Name Routing Method Parameters
Toronto_OUT to Mongaup+Black Lake Cr Muskingum K=1, X=0.1, subreaches=1 Swinging Bridge_OUT to Mongaup+Black Lake Cr Null Mongaup+Black Lake Creek to Rio_IN Muskingum K=1, X=0.1, subreaches=1 Rio_OUT to Del+Mongaup Null
Table 4.9 Lehigh River Basin Reaches
Reach Name Routing Method Parameters F.E. Walter_OUT to White Haven Null White Haven to Lehighton Lag & K Lag=6 Lehighton to Lehigh+Pohopoco Null Beltzville_OUT to Parryville Null Parryville to Pohopoco Mouth Null Pohopoco Mouth to Lehigh+Pohopoco Null Lehigh + Pohopoco to Walnutport Lag & K Lag=3 Walnutport to Lehigh + Jordan Lag & K Lag=5 Allentown to Lehigh+Jordan Null Lehigh + Jordan to Bethlehem Lag & K Lag=1
Table 4.10 Mainstem Delaware River Basin Reaches
Reach Name Routing Method Parameters Callicoon to Barryville Lag & K Lag=3 Barryville to Delaware + Lackawaxen Null Del+Lackawaxen to Del+Mongaup Lag & K Lag=2 Del+Mongaup to Port Jervis Null Port Jervis to Del+Neversink Null Del+Neversink to Montague Lag & K Lag=3 Montague to Del+Bush Kill Muskingum K=5, X=0.1, subreaches=1 Shoemaker to Del+Bush Kill Null Del+Bush Kill to Tocks Island Muskingum K=3, X= 0.1, subreaches=1 Tocks Island to Del+Brodhead Null Minisink Hills to Del+Brodhead Null Del+Brodhead to Belvidere Muskingum K=4, X=0.1, subreaches=1 Belvidere to Easton Muskingum K=3, X=0.1, subreaches=1 Easton to Del+Lehigh Null Del+Lehigh to Del+Pohatcong Muskingum K=1, X=0.1, subreaches=1 Merrill Creek_Out to Pohat+Merrill Lag & K K=1 Pohat+Merrill to Del+Pohatcong Muskingum K=2, X=0.1, subreaches=1 Del+Pohatcong to Riegelsville Null Riegelsville to Del+Musconetcong Null Bloomsbury to Del+Musconetcong Muskingum K=2, X=0.1, subreaches=1 Del+Musconetcong to Frenchtown Muskingum K=2, X=0.1, subreaches=1 Frenchtown to Del+Tohickon Muskingum K=1, X=0.1, subreaches=1 Nockamixon_Out to Del+Tohickon Muskingum K=2, X=0.1, subreaches=1 Del+Tohickon to Stockton Null Stockton to New Hope Muskingum K=2, X=0.1, subreaches=1 New Hope to Washingtons Crossing Null Washingtons Crossing to Trenton Muskingum K=3, X=0.1, subreaches=1
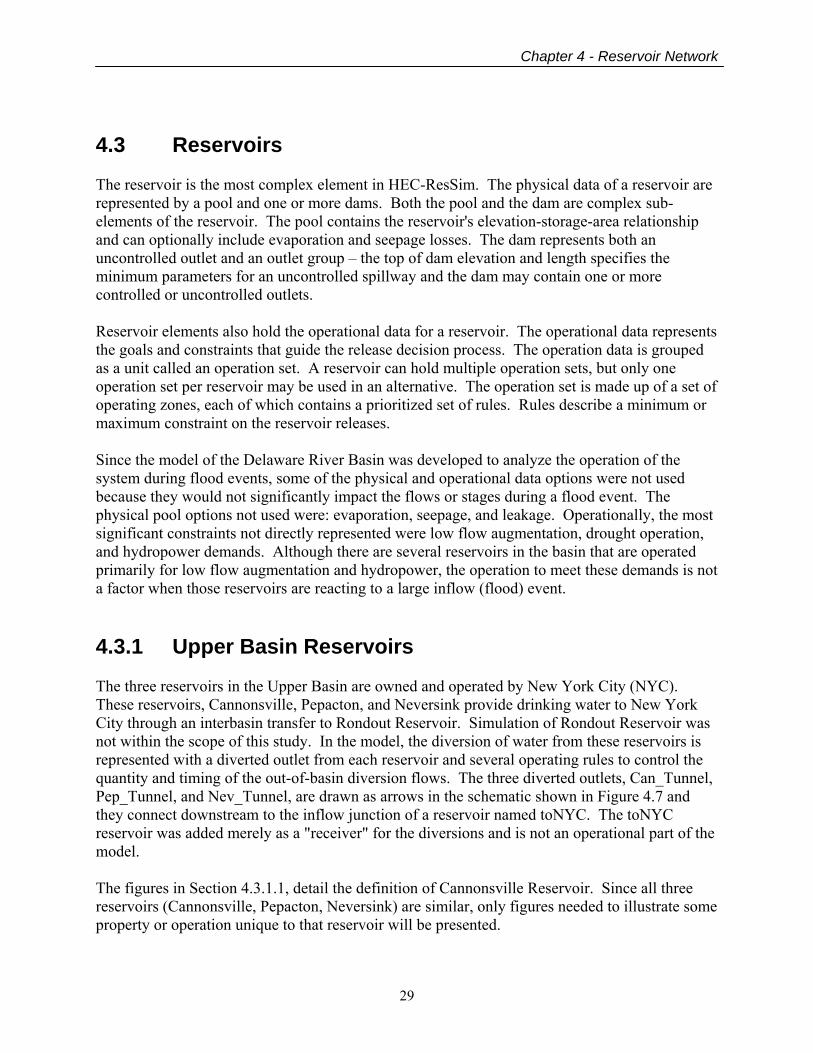
Chapter 4 - Reservoir Network
29
4.3 Reservoirs The reservoir is the most complex element in HEC-ResSim. The physical data of a reservoir are represented by a pool and one or more dams. Both the pool and the dam are complex sub-elements of the reservoir. The pool contains the reservoir's elevation-storage-area relationship and can optionally include evaporation and seepage losses. The dam represents both an uncontrolled outlet and an outlet group – the top of dam elevation and length specifies the minimum parameters for an uncontrolled spillway and the dam may contain one or more controlled or uncontrolled outlets. Reservoir elements also hold the operational data for a reservoir. The operational data represents the goals and constraints that guide the release decision process. The operation data is grouped as a unit called an operation set. A reservoir can hold multiple operation sets, but only one operation set per reservoir may be used in an alternative. The operation set is made up of a set of operating zones, each of which contains a prioritized set of rules. Rules describe a minimum or maximum constraint on the reservoir releases. Since the model of the Delaware River Basin was developed to analyze the operation of the system during flood events, some of the physical and operational data options were not used because they would not significantly impact the flows or stages during a flood event. The physical pool options not used were: evaporation, seepage, and leakage. Operationally, the most significant constraints not directly represented were low flow augmentation, drought operation, and hydropower demands. Although there are several reservoirs in the basin that are operated primarily for low flow augmentation and hydropower, the operation to meet these demands is not a factor when those reservoirs are reacting to a large inflow (flood) event. 4.3.1 Upper Basin Reservoirs The three reservoirs in the Upper Basin are owned and operated by New York City (NYC). These reservoirs, Cannonsville, Pepacton, and Neversink provide drinking water to New York City through an interbasin transfer to Rondout Reservoir. Simulation of Rondout Reservoir was not within the scope of this study. In the model, the diversion of water from these reservoirs is represented with a diverted outlet from each reservoir and several operating rules to control the quantity and timing of the out-of-basin diversion flows. The three diverted outlets, Can_Tunnel, Pep_Tunnel, and Nev_Tunnel, are drawn as arrows in the schematic shown in Figure 4.7 and they connect downstream to the inflow junction of a reservoir named toNYC. The toNYC reservoir was added merely as a "receiver" for the diversions and is not an operational part of the model. The figures in Section 4.3.1.1, detail the definition of Cannonsville Reservoir. Since all three reservoirs (Cannonsville, Pepacton, Neversink) are similar, only figures needed to illustrate some property or operation unique to that reservoir will be presented.
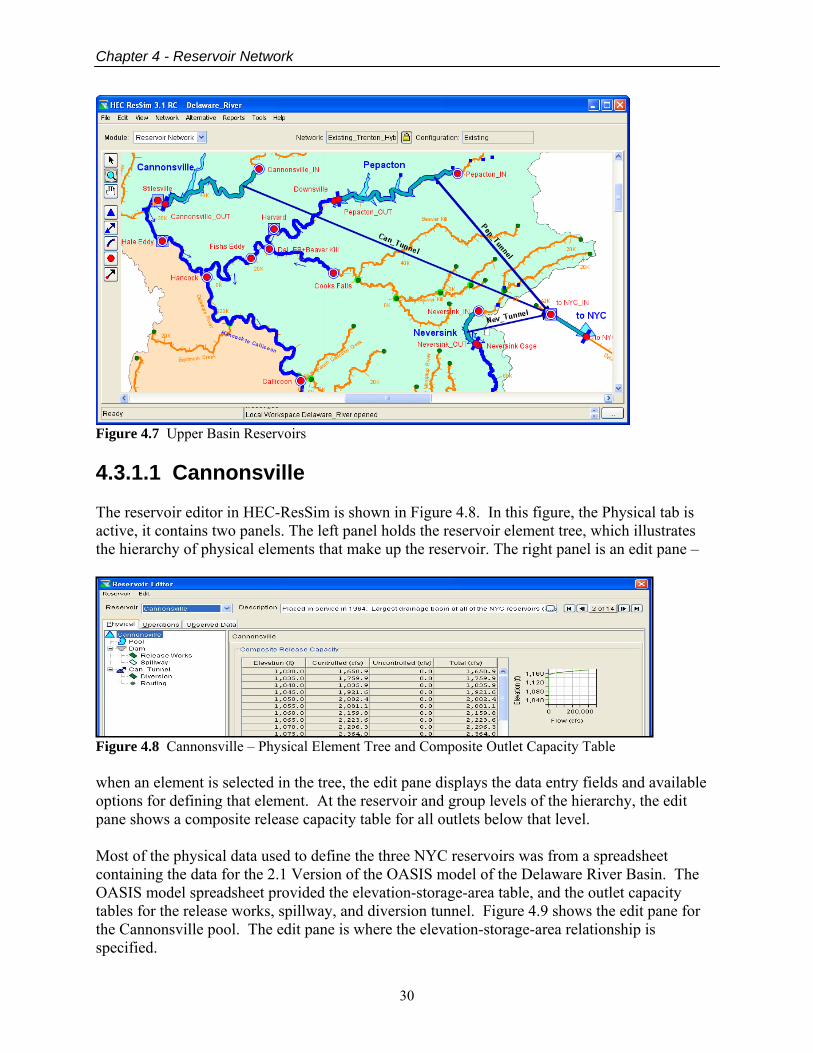
Chapter 4 - Reservoir Network
30
Figure 4.7 Upper Basin Reservoirs 4.3.1.1 Cannonsville The reservoir editor in HEC-ResSim is shown in Figure 4.8. In this figure, the Physical tab is active, it contains two panels. The left panel holds the reservoir element tree, which illustrates the hierarchy of physical elements that make up the reservoir. The right panel is an edit pane –
Figure 4.8 Cannonsville – Physical Element Tree and Composite Outlet Capacity Table when an element is selected in the tree, the edit pane displays the data entry fields and available options for defining that element. At the reservoir and group levels of the hierarchy, the edit pane shows a composite release capacity table for all outlets below that level. Most of the physical data used to define the three NYC reservoirs was from a spreadsheet containing the data for the 2.1 Version of the OASIS model of the Delaware River Basin. The OASIS model spreadsheet provided the elevation-storage-area table, and the outlet capacity tables for the release works, spillway, and diversion tunnel. Figure 4.9 shows the edit pane for the Cannonsville pool. The edit pane is where the elevation-storage-area relationship is specified.
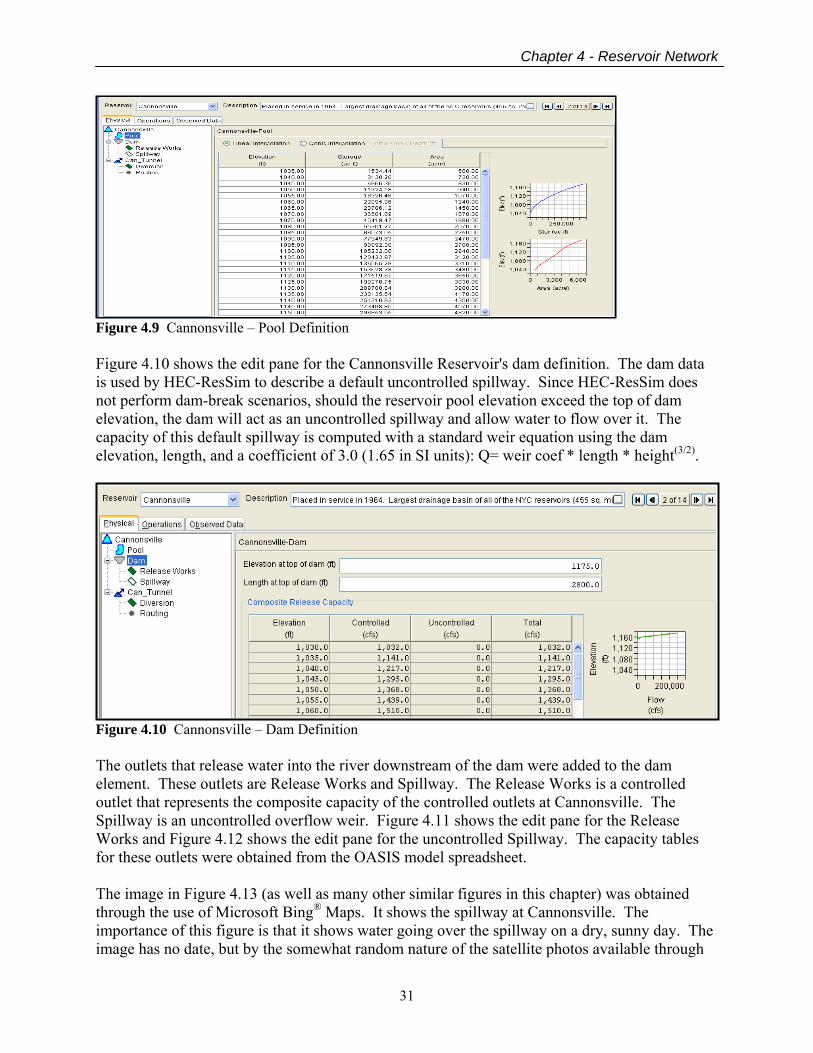
Chapter 4 - Reservoir Network
31
Figure 4.9 Cannonsville – Pool Definition Figure 4.10 shows the edit pane for the Cannonsville Reservoir's dam definition. The dam data is used by HEC-ResSim to describe a default uncontrolled spillway. Since HEC-ResSim does not perform dam-break scenarios, should the reservoir pool elevation exceed the top of dam elevation, the dam will act as an uncontrolled spillway and allow water to flow over it. The capacity of this default spillway is computed with a standard weir equation using the dam elevation, length, and a coefficient of 3.0 (1.65 in SI units): Q= weir coef * length * height(3/2).
Figure 4.10 Cannonsville – Dam Definition The outlets that release water into the river downstream of the dam were added to the dam element. These outlets are Release Works and Spillway. The Release Works is a controlled outlet that represents the composite capacity of the controlled outlets at Cannonsville. The Spillway is an uncontrolled overflow weir. Figure 4.11 shows the edit pane for the Release Works and Figure 4.12 shows the edit pane for the uncontrolled Spillway. The capacity tables for these outlets were obtained from the OASIS model spreadsheet. The image in Figure 4.13 (as well as many other similar figures in this chapter) was obtained through the use of Microsoft Bing® Maps. It shows the spillway at Cannonsville. The importance of this figure is that it shows water going over the spillway on a dry, sunny day. The image has no date, but by the somewhat random nature of the satellite photos available through
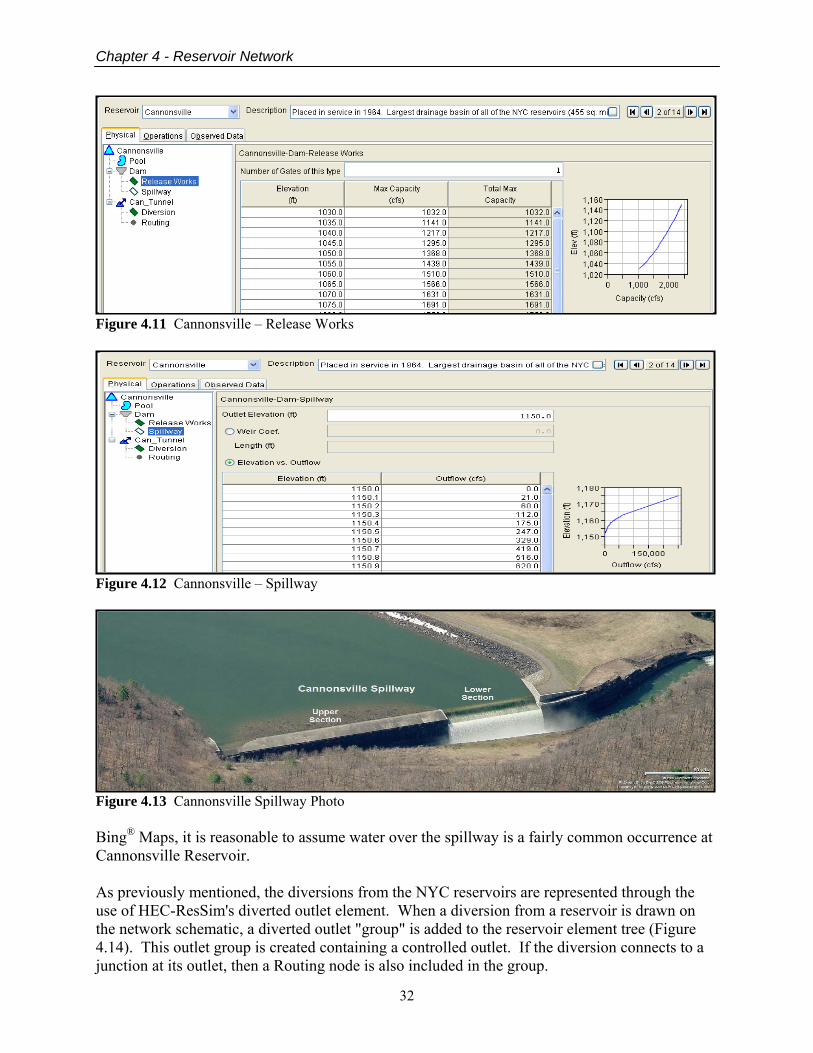
Chapter 4 - Reservoir Network
32
Figure 4.11 Cannonsville – Release Works
Figure 4.12 Cannonsville – Spillway
Figure 4.13 Cannonsville Spillway Photo Bing® Maps, it is reasonable to assume water over the spillway is a fairly common occurrence at Cannonsville Reservoir. As previously mentioned, the diversions from the NYC reservoirs are represented through the use of HEC-ResSim's diverted outlet element. When a diversion from a reservoir is drawn on the network schematic, a diverted outlet "group" is added to the reservoir element tree (Figure 4.14). This outlet group is created containing a controlled outlet. If the diversion connects to a junction at its outlet, then a Routing node is also included in the group.
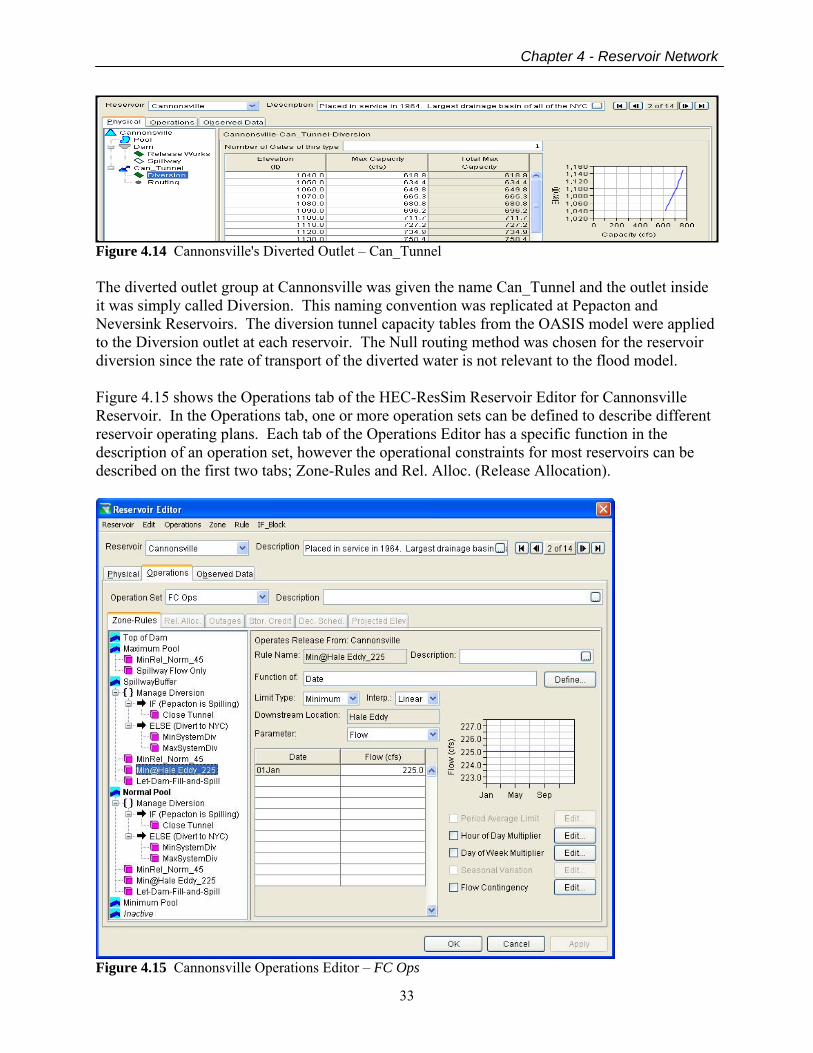
Chapter 4 - Reservoir Network
33
Figure 4.14 Cannonsville's Diverted Outlet – Can_Tunnel The diverted outlet group at Cannonsville was given the name Can_Tunnel and the outlet inside it was simply called Diversion. This naming convention was replicated at Pepacton and Neversink Reservoirs. The diversion tunnel capacity tables from the OASIS model were applied to the Diversion outlet at each reservoir. The Null routing method was chosen for the reservoir diversion since the rate of transport of the diverted water is not relevant to the flood model. Figure 4.15 shows the Operations tab of the HEC-ResSim Reservoir Editor for Cannonsville Reservoir. In the Operations tab, one or more operation sets can be defined to describe different reservoir operating plans. Each tab of the Operations Editor has a specific function in the description of an operation set, however the operational constraints for most reservoirs can be described on the first two tabs; Zone-Rules and Rel. Alloc. (Release Allocation).
Figure 4.15 Cannonsville Operations Editor – FC Ops

Chapter 4 - Reservoir Network
34
Operation sets are a set of zones and rules that describe the constraints on reservoir releases. Each zone can have a prioritized list of rules that are followed if the reservoir pool elevation is within that zone. Additional constraints can be applied to the rule list with If-Blocks. Other operational constraints can be defined by activating and specifying the data for any of the other tabs of the Operations editor. The operation set displayed in Figure 4.15 is called FC Ops. There are two operation sets defined for each of the NYC reservoirs – FC Ops and FC Ops-SpecDiv. The FC Ops operation sets were developed to represent the standard flood operations at each reservoir. Included in this operation set is a subset of rules that attempt to define the operational constraints on the diversions as they were operated during the three flood events studied. In FC Ops-SpecDiv the primary operation of the reservoir is same as in FC Ops, but the rules constraining the diversion has been changed to exactly replicate the observed diversion record for the three flood events studied in order to avoid introducing errors related to not reproducing the observed diversion. Development of each operation set began with the definition of the operating zones of the reservoirs. Operational information for the NYC reservoirs was drawn from the OASIS model. The OASIS model identified dead storage and max storage – using the elevation-storage relationship for each reservoir, these storage values were converted to elevation and used to represent the Inactive and Top of Dam zones, respectively. Similarly, the OASIS Upper and Lower Rule storages were converted to elevations and used to represent the top of the Buffer and Conservation zones. And, for modeling purposes, the extent of the storage and/or spillway capacity table was used to define the top of the Maximum Pool zone. FC Ops – Normal Flood Operations Since the primary purpose of the NYC reservoirs is to divert water to New York City, a group of diversion rules were developed in an attempt to mimic the observed operation of the diversions as well as to approximate the operations described in the OASIS model. The primary rules developed for the diversions are MinSystemDiv and MaxSystemDiv. These are downstream control rules for the control point, to NYC_IN, and are used in all three reservoirs so that they can share the responsibility to meet the water supply demand. In addition, a minimum release function rule for the diversion was added at Pepacton and Neversink to influence the allocation of the demand between the three reservoirs. The values of these local minimum requirements were estimated based on a review of the available observed data for the three events. The more complex operation of the diversions for water supply, as detailed in the OASIS model, were not attempted as they define operations during extended low flow and low storage periods and were not needed to assess flood operations. The operation of the diversions during a flood event was determined to be different from normal operation. Based on analysis of the observed data provide for the three flood events, the diversions were suspended during each event. In most reservoir systems with interbasin water supply diversions, the diversions are seldom used to divert flood waters from one basin into another basin to avoid possibly causing flooding in the receiving basin. The rule used to represent this behavior in the model is Close Tunnel. At both Cannonsville and Pepacton the rule is contained within an If-block. The purpose of the If-block is to check if the other reservoir is spilling, if so then to stop diverting. This cross correlation between Cannonsville's and Pepacton's state of spill and the closing of the diversions was observed in the event data and used
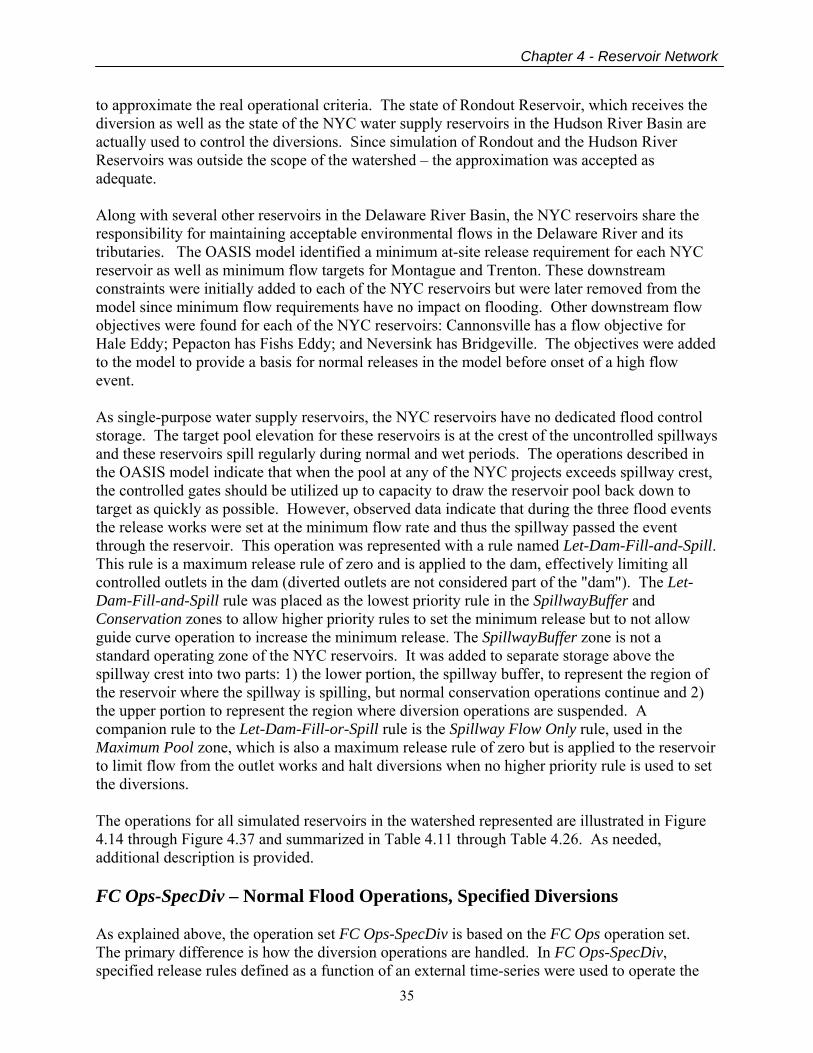
Chapter 4 - Reservoir Network
35
to approximate the real operational criteria. The state of Rondout Reservoir, which receives the diversion as well as the state of the NYC water supply reservoirs in the Hudson River Basin are actually used to control the diversions. Since simulation of Rondout and the Hudson River Reservoirs was outside the scope of the watershed – the approximation was accepted as adequate. Along with several other reservoirs in the Delaware River Basin, the NYC reservoirs share the responsibility for maintaining acceptable environmental flows in the Delaware River and its tributaries. The OASIS model identified a minimum at-site release requirement for each NYC reservoir as well as minimum flow targets for Montague and Trenton. These downstream constraints were initially added to each of the NYC reservoirs but were later removed from the model since minimum flow requirements have no impact on flooding. Other downstream flow objectives were found for each of the NYC reservoirs: Cannonsville has a flow objective for Hale Eddy; Pepacton has Fishs Eddy; and Neversink has Bridgeville. The objectives were added to the model to provide a basis for normal releases in the model before onset of a high flow event. As single-purpose water supply reservoirs, the NYC reservoirs have no dedicated flood control storage. The target pool elevation for these reservoirs is at the crest of the uncontrolled spillways and these reservoirs spill regularly during normal and wet periods. The operations described in the OASIS model indicate that when the pool at any of the NYC projects exceeds spillway crest, the controlled gates should be utilized up to capacity to draw the reservoir pool back down to target as quickly as possible. However, observed data indicate that during the three flood events the release works were set at the minimum flow rate and thus the spillway passed the event through the reservoir. This operation was represented with a rule named Let-Dam-Fill-and-Spill. This rule is a maximum release rule of zero and is applied to the dam, effectively limiting all controlled outlets in the dam (diverted outlets are not considered part of the "dam"). The Let-Dam-Fill-and-Spill rule was placed as the lowest priority rule in the SpillwayBuffer and Conservation zones to allow higher priority rules to set the minimum release but to not allow guide curve operation to increase the minimum release. The SpillwayBuffer zone is not a standard operating zone of the NYC reservoirs. It was added to separate storage above the spillway crest into two parts: 1) the lower portion, the spillway buffer, to represent the region of the reservoir where the spillway is spilling, but normal conservation operations continue and 2) the upper portion to represent the region where diversion operations are suspended. A companion rule to the Let-Dam-Fill-or-Spill rule is the Spillway Flow Only rule, used in the Maximum Pool zone, which is also a maximum release rule of zero but is applied to the reservoir to limit flow from the outlet works and halt diversions when no higher priority rule is used to set the diversions. The operations for all simulated reservoirs in the watershed represented are illustrated in Figure 4.14 through Figure 4.37 and summarized in Table 4.11 through Table 4.26. As needed, additional description is provided. FC Ops-SpecDiv – Normal Flood Operations, Specified Diversions As explained above, the operation set FC Ops-SpecDiv is based on the FC Ops operation set. The primary difference is how the diversion operations are handled. In FC Ops-SpecDiv, specified release rules defined as a function of an external time-series were used to operate the
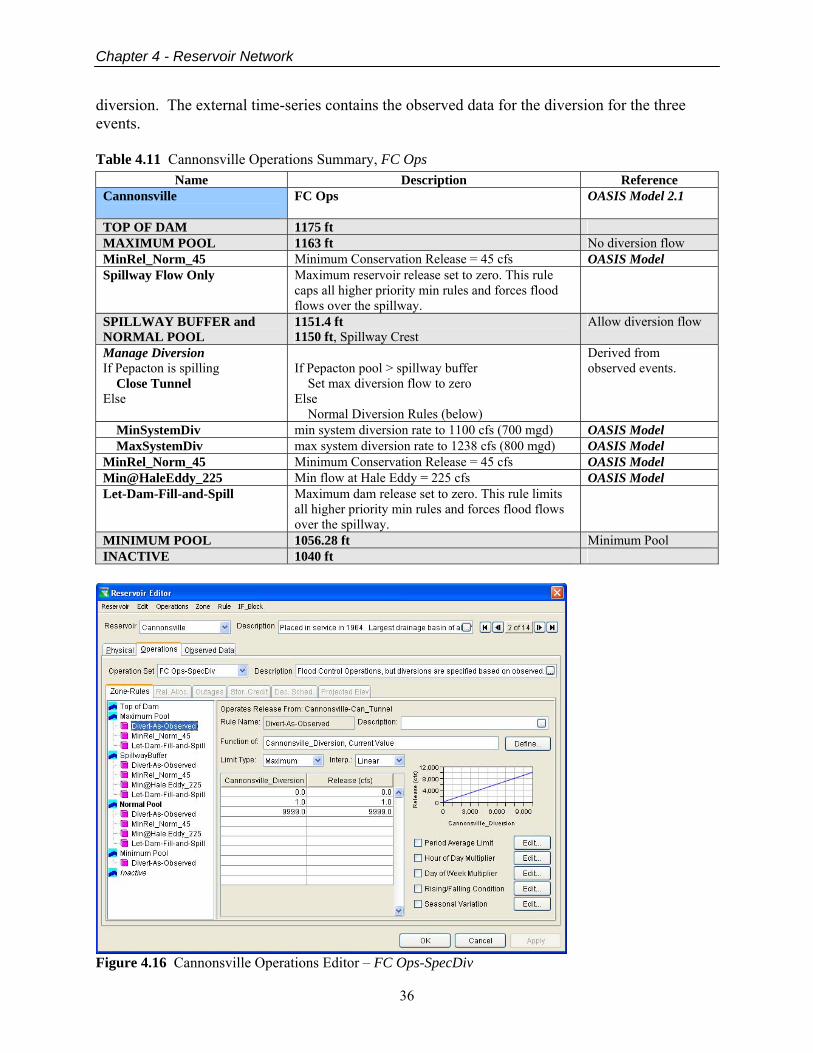
Chapter 4 - Reservoir Network
36
diversion. The external time-series contains the observed data for the diversion for the three events. Table 4.11 Cannonsville Operations Summary, FC Ops
Name Description Reference Cannonsville
FC Ops OASIS Model 2.1
TOP OF DAM 1175 ft MAXIMUM POOL 1163 ft No diversion flow MinRel_Norm_45 Minimum Conservation Release = 45 cfs OASIS Model Spillway Flow Only Maximum reservoir release set to zero. This rule
caps all higher priority min rules and forces flood flows over the spillway.
SPILLWAY BUFFER and NORMAL POOL
1151.4 ft 1150 ft, Spillway Crest
Allow diversion flow
Manage Diversion If Pepacton is spilling Close Tunnel Else
If Pepacton pool > spillway buffer Set max diversion flow to zero Else Normal Diversion Rules (below)
Derived from observed events.
MinSystemDiv min system diversion rate to 1100 cfs (700 mgd) OASIS Model MaxSystemDiv max system diversion rate to 1238 cfs (800 mgd) OASIS Model MinRel_Norm_45 Minimum Conservation Release = 45 cfs OASIS Model Min@HaleEddy_225 Min flow at Hale Eddy = 225 cfs OASIS Model Let-Dam-Fill-and-Spill Maximum dam release set to zero. This rule limits
all higher priority min rules and forces flood flows over the spillway.
MINIMUM POOL 1056.28 ft Minimum Pool INACTIVE 1040 ft
Figure 4.16 Cannonsville Operations Editor – FC Ops-SpecDiv
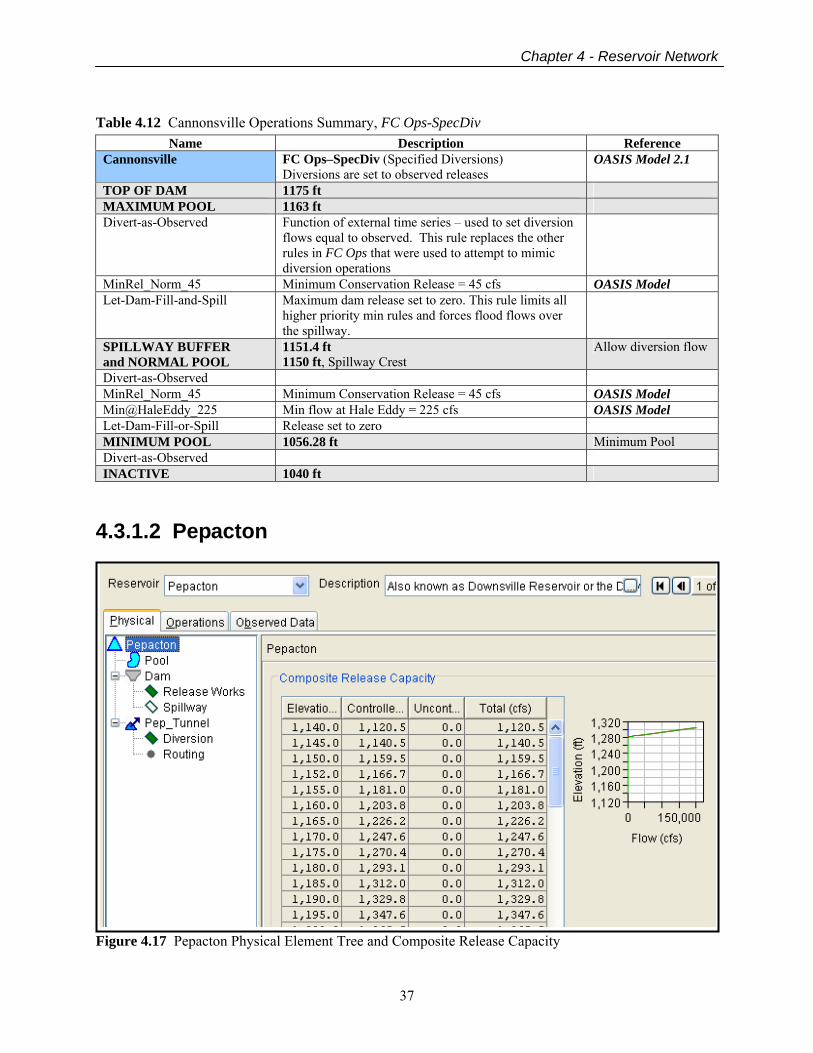
Chapter 4 - Reservoir Network
37
Table 4.12 Cannonsville Operations Summary, FC Ops-SpecDiv
Name Description Reference Cannonsville FC Ops–SpecDiv (Specified Diversions)
Diversions are set to observed releases OASIS Model 2.1
TOP OF DAM 1175 ft MAXIMUM POOL 1163 ft Divert-as-Observed Function of external time series – used to set diversion
flows equal to observed. This rule replaces the other rules in FC Ops that were used to attempt to mimic diversion operations
MinRel_Norm_45 Minimum Conservation Release = 45 cfs OASIS Model Let-Dam-Fill-and-Spill Maximum dam release set to zero. This rule limits all
higher priority min rules and forces flood flows over the spillway.
SPILLWAY BUFFER and NORMAL POOL
1151.4 ft 1150 ft, Spillway Crest
Allow diversion flow
Divert-as-Observed MinRel_Norm_45 Minimum Conservation Release = 45 cfs OASIS Model Min@HaleEddy_225 Min flow at Hale Eddy = 225 cfs OASIS Model Let-Dam-Fill-or-Spill Release set to zero MINIMUM POOL 1056.28 ft Minimum Pool Divert-as-Observed INACTIVE 1040 ft
4.3.1.2 Pepacton
Figure 4.17 Pepacton Physical Element Tree and Composite Release Capacity
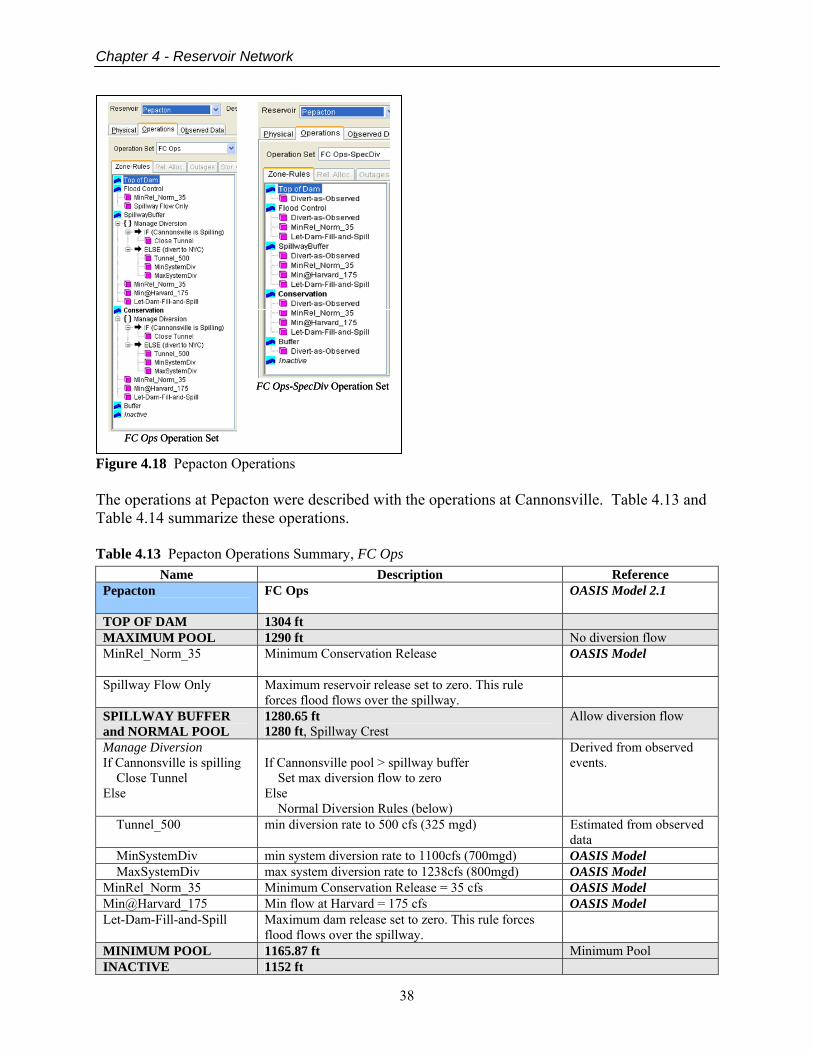
Chapter 4 - Reservoir Network
38
FC Ops Operation Set
FC Ops-SpecDiv Operation Set
FC Ops Operation Set
FC Ops-SpecDiv Operation Set
Figure 4.18 Pepacton Operations The operations at Pepacton were described with the operations at Cannonsville. Table 4.13 and Table 4.14 summarize these operations. Table 4.13 Pepacton Operations Summary, FC Ops
Name Description Reference Pepacton
FC Ops OASIS Model 2.1
TOP OF DAM 1304 ft MAXIMUM POOL 1290 ft No diversion flow MinRel_Norm_35 Minimum Conservation Release OASIS Model
Spillway Flow Only Maximum reservoir release set to zero. This rule
forces flood flows over the spillway.
SPILLWAY BUFFER and NORMAL POOL
1280.65 ft 1280 ft, Spillway Crest
Allow diversion flow
Manage Diversion If Cannonsville is spilling Close Tunnel Else
If Cannonsville pool > spillway buffer Set max diversion flow to zero Else Normal Diversion Rules (below)
Derived from observed events.
Tunnel_500 min diversion rate to 500 cfs (325 mgd) Estimated from observed data
MinSystemDiv min system diversion rate to 1100cfs (700mgd) OASIS Model MaxSystemDiv max system diversion rate to 1238cfs (800mgd) OASIS Model MinRel_Norm_35 Minimum Conservation Release = 35 cfs OASIS Model Min@Harvard_175 Min flow at Harvard = 175 cfs OASIS Model Let-Dam-Fill-and-Spill Maximum dam release set to zero. This rule forces
flood flows over the spillway.
MINIMUM POOL 1165.87 ft Minimum Pool INACTIVE 1152 ft
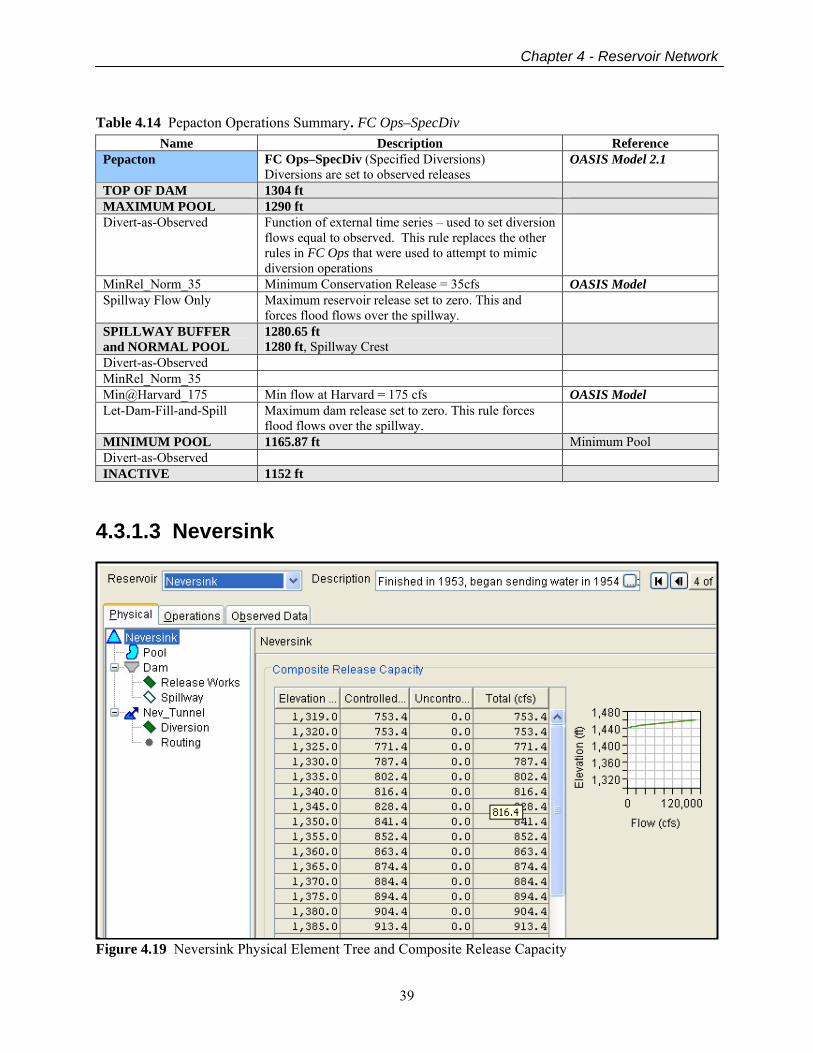
Chapter 4 - Reservoir Network
39
Table 4.14 Pepacton Operations Summary. FC Ops–SpecDiv
Name Description Reference Pepacton FC Ops–SpecDiv (Specified Diversions)
Diversions are set to observed releases OASIS Model 2.1
TOP OF DAM 1304 ft MAXIMUM POOL 1290 ft Divert-as-Observed Function of external time series – used to set diversion
flows equal to observed. This rule replaces the other rules in FC Ops that were used to attempt to mimic diversion operations
MinRel_Norm_35 Minimum Conservation Release = 35cfs OASIS Model Spillway Flow Only Maximum reservoir release set to zero. This and
forces flood flows over the spillway.
SPILLWAY BUFFER and NORMAL POOL
1280.65 ft 1280 ft, Spillway Crest
Divert-as-Observed MinRel_Norm_35 Min@Harvard_175 Min flow at Harvard = 175 cfs OASIS Model Let-Dam-Fill-and-Spill Maximum dam release set to zero. This rule forces
flood flows over the spillway.
MINIMUM POOL 1165.87 ft Minimum Pool Divert-as-Observed INACTIVE 1152 ft
4.3.1.3 Neversink
Figure 4.19 Neversink Physical Element Tree and Composite Release Capacity
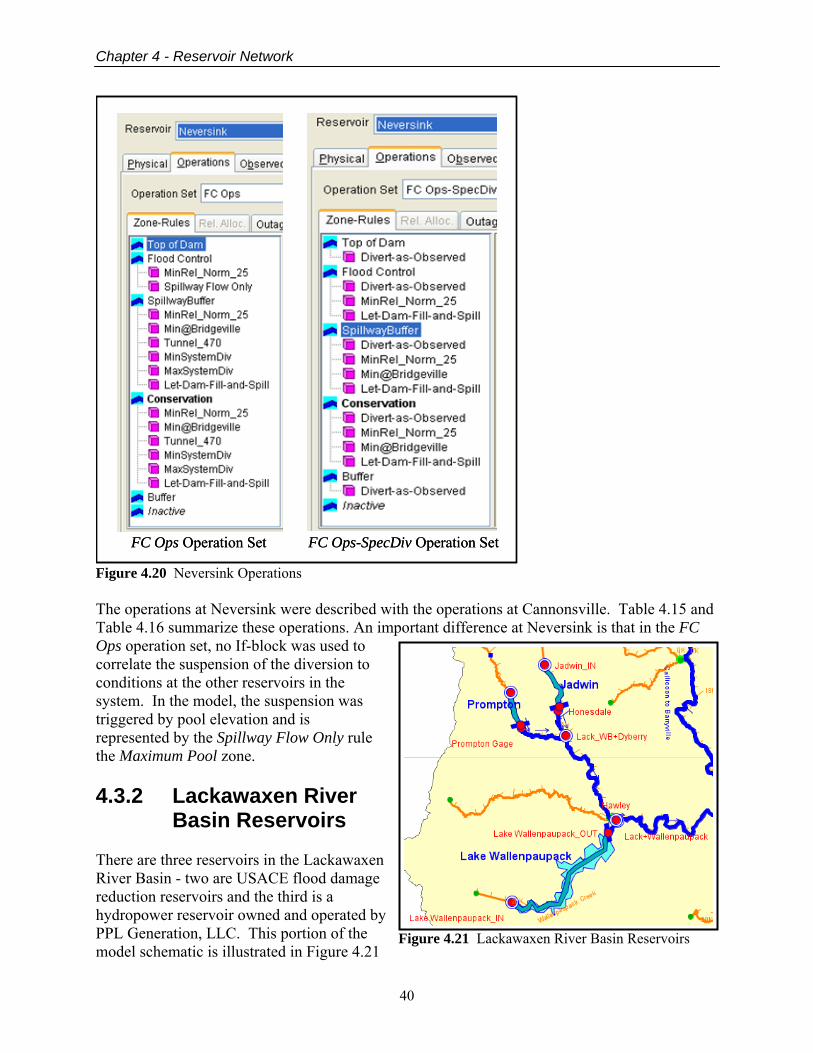
Chapter 4 - Reservoir Network
40
Figure 4.21 Lackawaxen River Basin Reservoirs
FC Ops Operation Set FC Ops-SpecDiv Operation SetFC Ops Operation Set FC Ops-SpecDiv Operation Set
Figure 4.20 Neversink Operations The operations at Neversink were described with the operations at Cannonsville. Table 4.15 and Table 4.16 summarize these operations. An important difference at Neversink is that in the FC Ops operation set, no If-block was used to correlate the suspension of the diversion to conditions at the other reservoirs in the system. In the model, the suspension was triggered by pool elevation and is represented by the Spillway Flow Only rule the Maximum Pool zone. 4.3.2 Lackawaxen River
Basin Reservoirs There are three reservoirs in the Lackawaxen River Basin - two are USACE flood damage reduction reservoirs and the third is a hydropower reservoir owned and operated by PPL Generation, LLC. This portion of the model schematic is illustrated in Figure 4.21
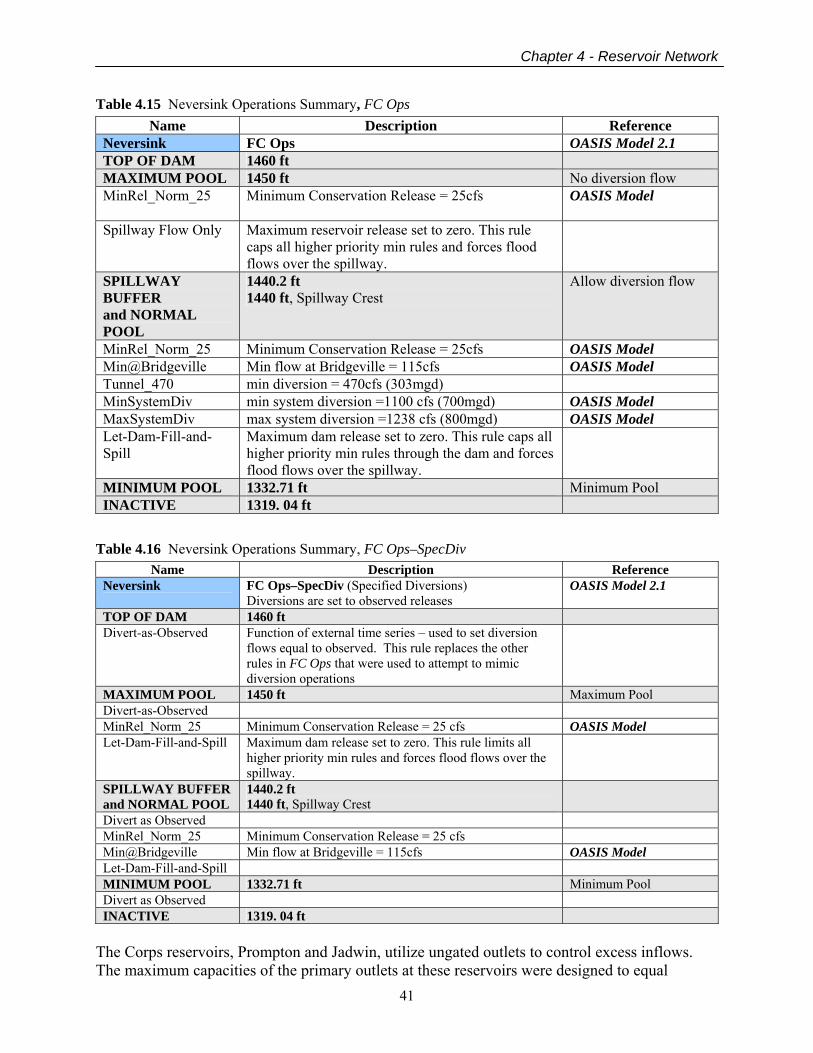
Chapter 4 - Reservoir Network
41
Table 4.15 Neversink Operations Summary, FC Ops Name Description Reference
Neversink FC Ops OASIS Model 2.1 TOP OF DAM 1460 ft MAXIMUM POOL 1450 ft No diversion flow MinRel_Norm_25 Minimum Conservation Release = 25cfs OASIS Model
Spillway Flow Only
Maximum reservoir release set to zero. This rule caps all higher priority min rules and forces flood flows over the spillway.
SPILLWAY BUFFER and NORMAL POOL
1440.2 ft 1440 ft, Spillway Crest
Allow diversion flow
MinRel_Norm_25 Minimum Conservation Release = 25cfs OASIS Model Min@Bridgeville Min flow at Bridgeville = 115cfs OASIS Model Tunnel_470 min diversion = 470cfs (303mgd) MinSystemDiv min system diversion =1100 cfs (700mgd) OASIS Model MaxSystemDiv max system diversion =1238 cfs (800mgd) OASIS Model Let-Dam-Fill-and-Spill
Maximum dam release set to zero. This rule caps all higher priority min rules through the dam and forces flood flows over the spillway.
MINIMUM POOL 1332.71 ft Minimum Pool INACTIVE 1319. 04 ft
Table 4.16 Neversink Operations Summary, FC Ops–SpecDiv
Name Description Reference Neversink FC Ops–SpecDiv (Specified Diversions)
Diversions are set to observed releases OASIS Model 2.1
TOP OF DAM 1460 ft Divert-as-Observed Function of external time series – used to set diversion
flows equal to observed. This rule replaces the other rules in FC Ops that were used to attempt to mimic diversion operations
MAXIMUM POOL 1450 ft Maximum Pool Divert-as-Observed MinRel_Norm_25 Minimum Conservation Release = 25 cfs OASIS Model Let-Dam-Fill-and-Spill Maximum dam release set to zero. This rule limits all
higher priority min rules and forces flood flows over the spillway.
SPILLWAY BUFFER and NORMAL POOL
1440.2 ft 1440 ft, Spillway Crest
Divert as Observed MinRel_Norm_25 Minimum Conservation Release = 25 cfs Min@Bridgeville Min flow at Bridgeville = 115cfs OASIS Model Let-Dam-Fill-and-Spill MINIMUM POOL 1332.71 ft Minimum Pool Divert as Observed INACTIVE 1319. 04 ft
The Corps reservoirs, Prompton and Jadwin, utilize ungated outlets to control excess inflows. The maximum capacities of the primary outlets at these reservoirs were designed to equal
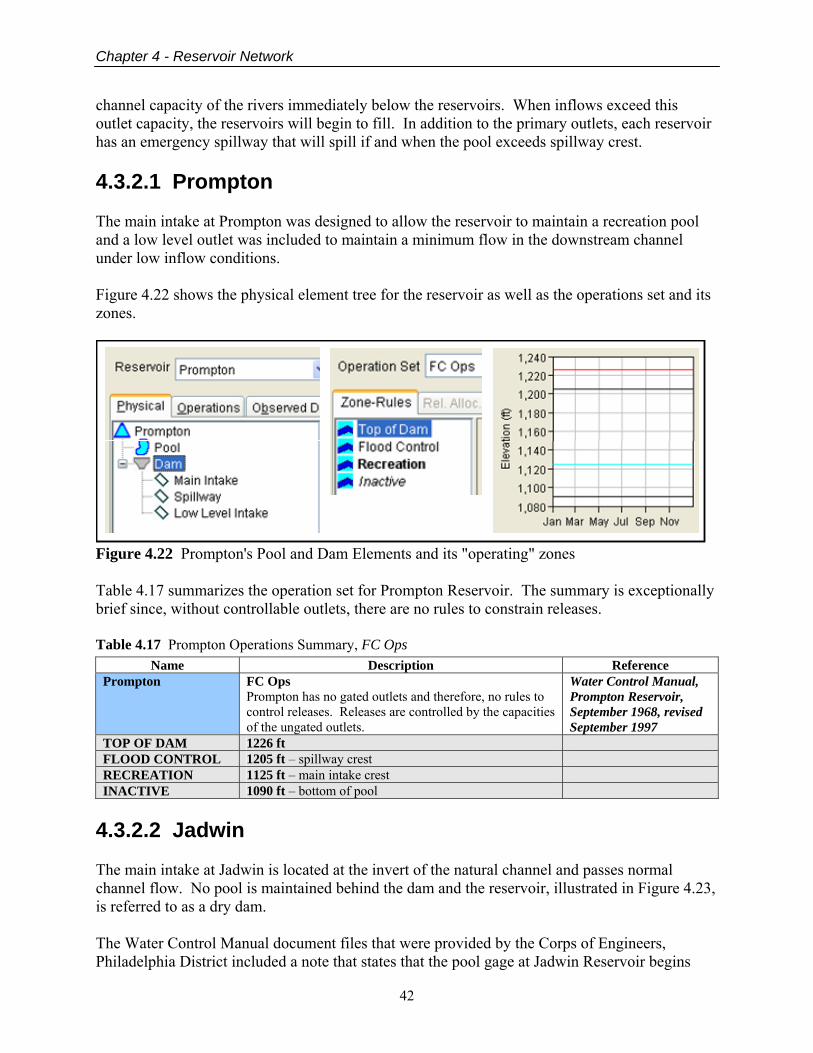
Chapter 4 - Reservoir Network
42
channel capacity of the rivers immediately below the reservoirs. When inflows exceed this outlet capacity, the reservoirs will begin to fill. In addition to the primary outlets, each reservoir has an emergency spillway that will spill if and when the pool exceeds spillway crest. 4.3.2.1 Prompton The main intake at Prompton was designed to allow the reservoir to maintain a recreation pool and a low level outlet was included to maintain a minimum flow in the downstream channel under low inflow conditions. Figure 4.22 shows the physical element tree for the reservoir as well as the operations set and its zones.
Figure 4.22 Prompton's Pool and Dam Elements and its "operating" zones Table 4.17 summarizes the operation set for Prompton Reservoir. The summary is exceptionally brief since, without controllable outlets, there are no rules to constrain releases. Table 4.17 Prompton Operations Summary, FC Ops
Name Description Reference Prompton FC Ops
Prompton has no gated outlets and therefore, no rules to control releases. Releases are controlled by the capacities of the ungated outlets.
Water Control Manual, Prompton Reservoir, September 1968, revised September 1997
TOP OF DAM 1226 ft FLOOD CONTROL 1205 ft – spillway crest RECREATION 1125 ft – main intake crest INACTIVE 1090 ft – bottom of pool
4.3.2.2 Jadwin The main intake at Jadwin is located at the invert of the natural channel and passes normal channel flow. No pool is maintained behind the dam and the reservoir, illustrated in Figure 4.23, is referred to as a dry dam. The Water Control Manual document files that were provided by the Corps of Engineers, Philadelphia District included a note that states that the pool gage at Jadwin Reservoir begins
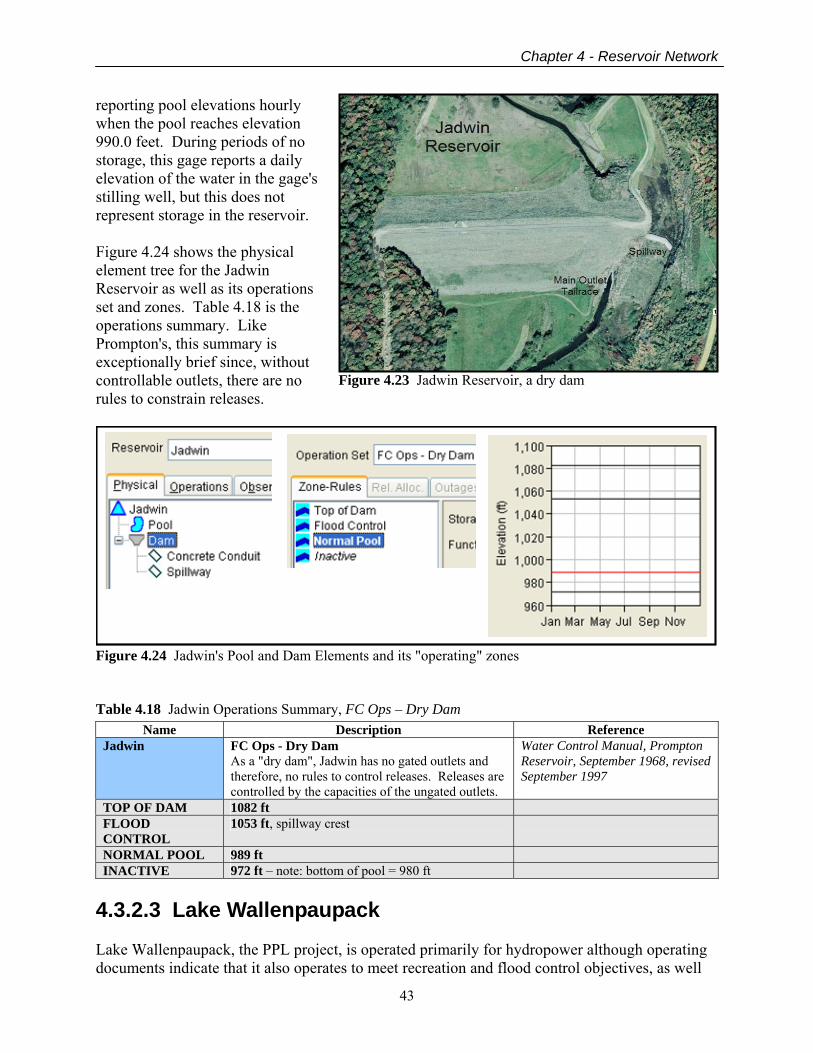
Chapter 4 - Reservoir Network
43
Figure 4.23 Jadwin Reservoir, a dry dam
reporting pool elevations hourly when the pool reaches elevation 990.0 feet. During periods of no storage, this gage reports a daily elevation of the water in the gage's stilling well, but this does not represent storage in the reservoir. Figure 4.24 shows the physical element tree for the Jadwin Reservoir as well as its operations set and zones. Table 4.18 is the operations summary. Like Prompton's, this summary is exceptionally brief since, without controllable outlets, there are no rules to constrain releases.
Figure 4.24 Jadwin's Pool and Dam Elements and its "operating" zones Table 4.18 Jadwin Operations Summary, FC Ops – Dry Dam
Name Description Reference Jadwin FC Ops - Dry Dam
As a "dry dam", Jadwin has no gated outlets and therefore, no rules to control releases. Releases are controlled by the capacities of the ungated outlets.
Water Control Manual, Prompton Reservoir, September 1968, revised September 1997
TOP OF DAM 1082 ft FLOOD CONTROL
1053 ft, spillway crest
NORMAL POOL 989 ft INACTIVE 972 ft – note: bottom of pool = 980 ft
4.3.2.3 Lake Wallenpaupack Lake Wallenpaupack, the PPL project, is operated primarily for hydropower although operating documents indicate that it also operates to meet recreation and flood control objectives, as well
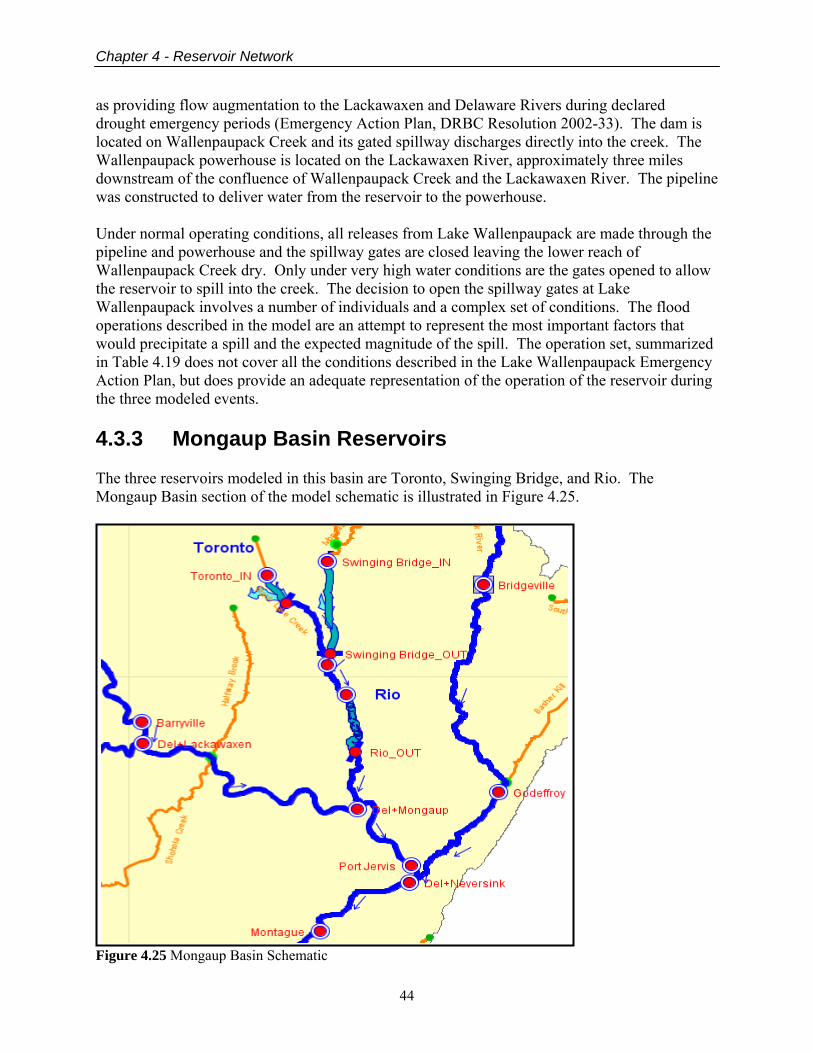
Chapter 4 - Reservoir Network
44
as providing flow augmentation to the Lackawaxen and Delaware Rivers during declared drought emergency periods (Emergency Action Plan, DRBC Resolution 2002-33). The dam is located on Wallenpaupack Creek and its gated spillway discharges directly into the creek. The Wallenpaupack powerhouse is located on the Lackawaxen River, approximately three miles downstream of the confluence of Wallenpaupack Creek and the Lackawaxen River. The pipeline was constructed to deliver water from the reservoir to the powerhouse. Under normal operating conditions, all releases from Lake Wallenpaupack are made through the pipeline and powerhouse and the spillway gates are closed leaving the lower reach of Wallenpaupack Creek dry. Only under very high water conditions are the gates opened to allow the reservoir to spill into the creek. The decision to open the spillway gates at Lake Wallenpaupack involves a number of individuals and a complex set of conditions. The flood operations described in the model are an attempt to represent the most important factors that would precipitate a spill and the expected magnitude of the spill. The operation set, summarized in Table 4.19 does not cover all the conditions described in the Lake Wallenpaupack Emergency Action Plan, but does provide an adequate representation of the operation of the reservoir during the three modeled events. 4.3.3 Mongaup Basin Reservoirs The three reservoirs modeled in this basin are Toronto, Swinging Bridge, and Rio. The Mongaup Basin section of the model schematic is illustrated in Figure 4.25.
Figure 4.25 Mongaup Basin Schematic

Chapter 4 - Reservoir Network
45
Table 4.19 Lake Wallenpaupack Operations Summary, FC Ops Name Description Reference
Lake Wallenpaupack FC Ops Release Allocation – sequential: Pipeline Spillway
Lake Wallenpaupack Emergency Action Plan, Dec2007 Revision
TOP OF DAM 1200 ft DRBC Resolution No. 2002-33 Max 6200_Spillway Maximum Spillway Release of 6200 cfs.
Spillway + Powerhouse = 8000 cfs 8000 cfs =Wallenpaupack Creek channel capacity
MAJOR FLOOD 1193 ft Maintain Peak Release Decreasing rate of change rule of zero – on the
spillway. This will not allow spillway releases to decrease.
IROC_Spillway Increasing rate of change rule of 1000 cfs/hr EAP, Dec07 pg G-14 ManageSpillway_MajorFC This if-block is used to limit the spillway release
as long as possible…
MaxSpill : pool>1192 ft Max 6200_Spillway
Maximum Spillway Release of 6200 cfs Spillway + Powerhouse = 8000
MediumSpill: pool > 1190 ft Max 4200_Spillway
Maximum Spillway Release of 4200 cfs Spillway + Powerhouse = 6000
MustSpill: pool > 1189 ft Max 2200_Spillway
Maximum Spillway Release of 2200 cfs Spillway + Powerhouse = 4000
Run Pipeline Full Minimum pipeline release of 1999 cfs – this is greater than phys-max-cap to force power plant flow to full capacity. When the reservoir is above target pool, the primary operation is to max out the powerhouse before considering spilling.
FLOOD CONTROL 1189 ft DROC_Spillway A decreasing rate of change rule of 2000 cfs – to
limit how fast the spillway can be closed – a safety concern.
IROC_Spillway Increasing rate of change rule of 1000 cfs/hr EAP, Dec07 pg G-14 Lower Flood Pool If pool > 1185 ft Keep Spillway Closed
Since the bottom of the flood pool varies seasonally, this if-block is used to keep the spillway closed if the pool is below 1185.4.
EAP, Dec07 pg G-15
Control Spillway on Recession: If inflow falling MaintainPeakRelease
This if-block will maintain the peak spillway flow if the pool is approaching Major Flood, but the inflow is falling.
Manage Spillway_Normal This if block uses the projected pool elevation to limit the spillway release as long as possible. Although the original structure of this if-block was based on the Figure 1, EAP, Dec07 pg G-28, the computed results did not match the observed operation – so the decision structure was modified to attempt to better match observed.
Max Spill: proj pool > 1193 ft Max 6200_Spillway
Maximum Spillway Release of 6200 cfs
MustSpillMore: proj pool>1189 ft Max 4200_Spillway
Maximum Spillway Release of 4200 cfs
Don't Spill: pool <=1189 ft Keep Spillway Closed
Maximum Spillway Release of 0 cfs
Manage Pipeline RunPipelineFull
This if block used to force the power house to flow full if pool > 1 ft over guide curve
CONSERVATION Seasonally varies: 1180 ft-1187 ft Keep Spillway Closed Maximum Spillway Release of 0 cfs INACTIVE 1160 ft
Two other reservoirs exist in the Mongaup basin. Cliff Lake is located downstream of Toronto on Black Lake Creek and Mongaup Falls is located upstream of Rio. These reservoirs were not included in the model because they do not significantly impact the routing of flood water through the system. Figure 4.26 shows a map of the five reservoirs obtained from Google Maps®. The reservoirs in the Mongaup Basin are operated primarily for hydropower benefits, although some flow augmentation during declared drought emergency periods may be called for by the
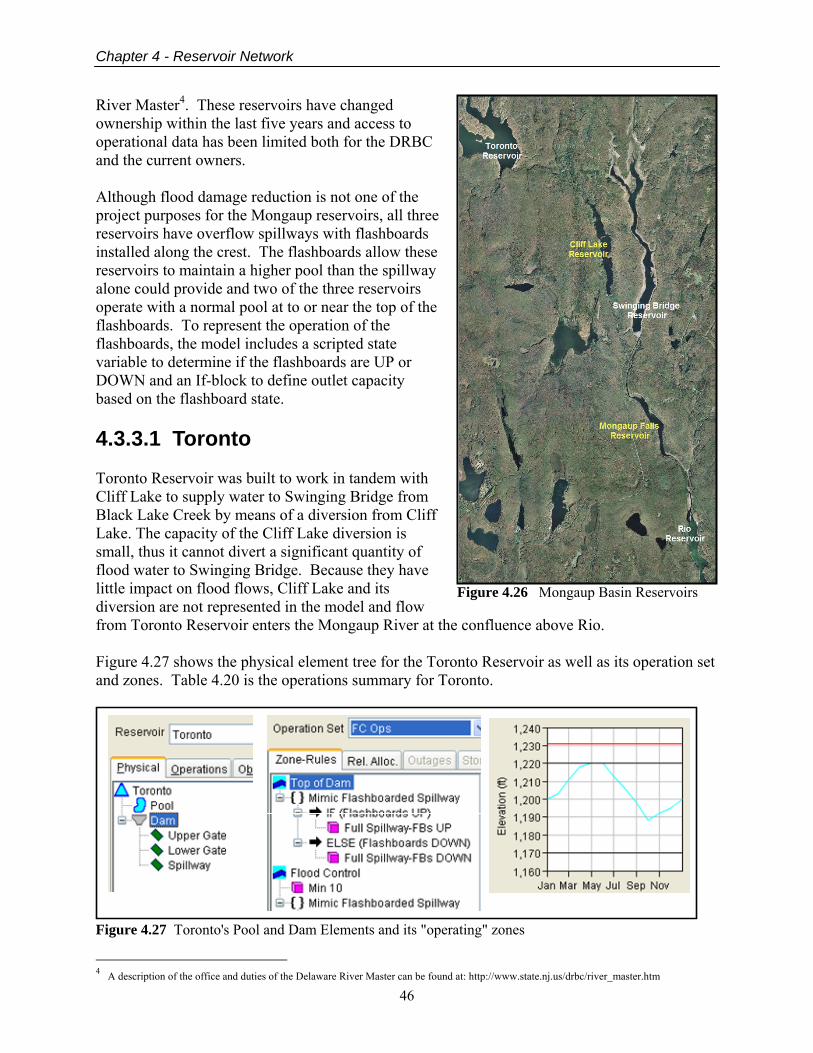
Chapter 4 - Reservoir Network
46
Figure 4.26 Mongaup Basin Reservoirs
River Master4. These reservoirs have changed ownership within the last five years and access to operational data has been limited both for the DRBC and the current owners. Although flood damage reduction is not one of the project purposes for the Mongaup reservoirs, all three reservoirs have overflow spillways with flashboards installed along the crest. The flashboards allow these reservoirs to maintain a higher pool than the spillway alone could provide and two of the three reservoirs operate with a normal pool at to or near the top of the flashboards. To represent the operation of the flashboards, the model includes a scripted state variable to determine if the flashboards are UP or DOWN and an If-block to define outlet capacity based on the flashboard state. 4.3.3.1 Toronto Toronto Reservoir was built to work in tandem with Cliff Lake to supply water to Swinging Bridge from Black Lake Creek by means of a diversion from Cliff Lake. The capacity of the Cliff Lake diversion is small, thus it cannot divert a significant quantity of flood water to Swinging Bridge. Because they have little impact on flood flows, Cliff Lake and its diversion are not represented in the model and flow from Toronto Reservoir enters the Mongaup River at the confluence above Rio. Figure 4.27 shows the physical element tree for the Toronto Reservoir as well as its operation set and zones. Table 4.20 is the operations summary for Toronto.
Figure 4.27 Toronto's Pool and Dam Elements and its "operating" zones
4 A description of the office and duties of the Delaware River Master can be found at: http://www.state.nj.us/drbc/river_master.htm
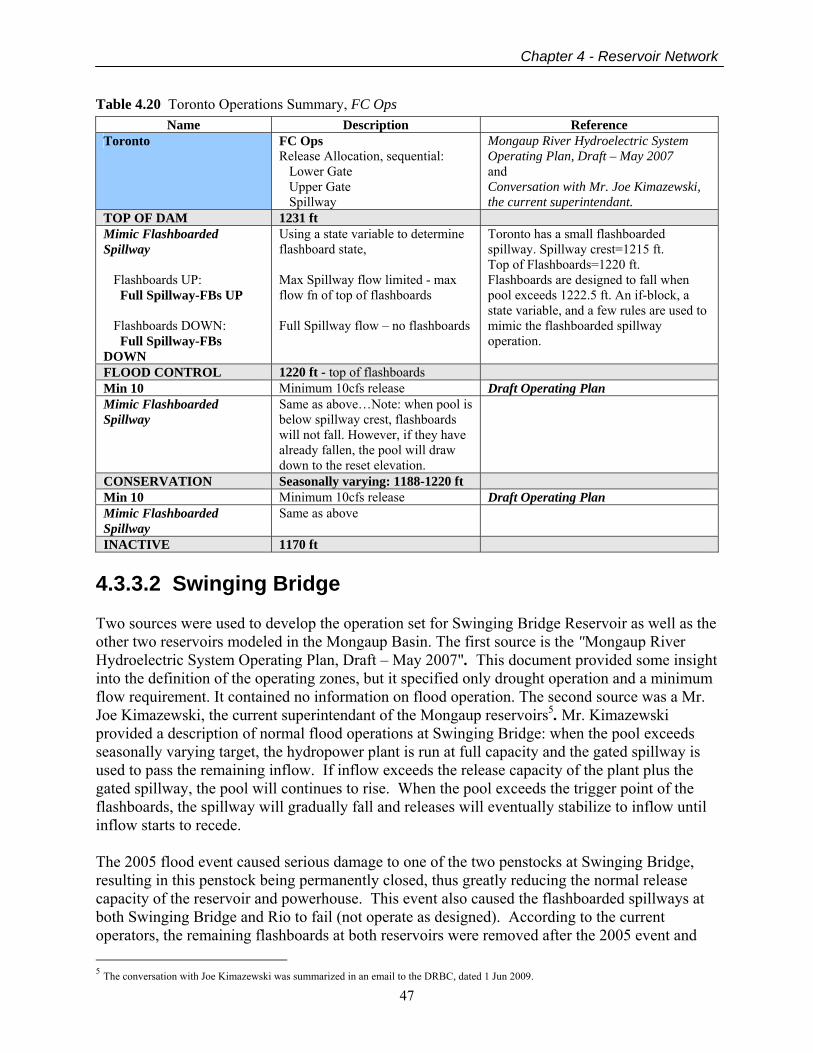
Chapter 4 - Reservoir Network
47
Table 4.20 Toronto Operations Summary, FC Ops Name Description Reference
Toronto FC Ops Release Allocation, sequential: Lower Gate Upper Gate Spillway
Mongaup River Hydroelectric System Operating Plan, Draft – May 2007 and Conversation with Mr. Joe Kimazewski, the current superintendant.
TOP OF DAM 1231 ft Mimic Flashboarded Spillway Flashboards UP: Full Spillway-FBs UP Flashboards DOWN: Full Spillway-FBs DOWN
Using a state variable to determine flashboard state, Max Spillway flow limited - max flow fn of top of flashboards Full Spillway flow – no flashboards
Toronto has a small flashboarded spillway. Spillway crest=1215 ft. Top of Flashboards=1220 ft. Flashboards are designed to fall when pool exceeds 1222.5 ft. An if-block, a state variable, and a few rules are used to mimic the flashboarded spillway operation.
FLOOD CONTROL 1220 ft - top of flashboards Min 10 Minimum 10cfs release Draft Operating Plan Mimic Flashboarded Spillway
Same as above…Note: when pool is below spillway crest, flashboards will not fall. However, if they have already fallen, the pool will draw down to the reset elevation.
CONSERVATION Seasonally varying: 1188-1220 ft Min 10 Minimum 10cfs release Draft Operating Plan Mimic Flashboarded Spillway
Same as above
INACTIVE 1170 ft 4.3.3.2 Swinging Bridge Two sources were used to develop the operation set for Swinging Bridge Reservoir as well as the other two reservoirs modeled in the Mongaup Basin. The first source is the "Mongaup River Hydroelectric System Operating Plan, Draft – May 2007". This document provided some insight into the definition of the operating zones, but it specified only drought operation and a minimum flow requirement. It contained no information on flood operation. The second source was a Mr. Joe Kimazewski, the current superintendant of the Mongaup reservoirs5. Mr. Kimazewski provided a description of normal flood operations at Swinging Bridge: when the pool exceeds seasonally varying target, the hydropower plant is run at full capacity and the gated spillway is used to pass the remaining inflow. If inflow exceeds the release capacity of the plant plus the gated spillway, the pool will continues to rise. When the pool exceeds the trigger point of the flashboards, the spillway will gradually fall and releases will eventually stabilize to inflow until inflow starts to recede. The 2005 flood event caused serious damage to one of the two penstocks at Swinging Bridge, resulting in this penstock being permanently closed, thus greatly reducing the normal release capacity of the reservoir and powerhouse. This event also caused the flashboarded spillways at both Swinging Bridge and Rio to fail (not operate as designed). According to the current operators, the remaining flashboards at both reservoirs were removed after the 2005 event and 5 The conversation with Joe Kimazewski was summarized in an email to the DRBC, dated 1 Jun 2009.
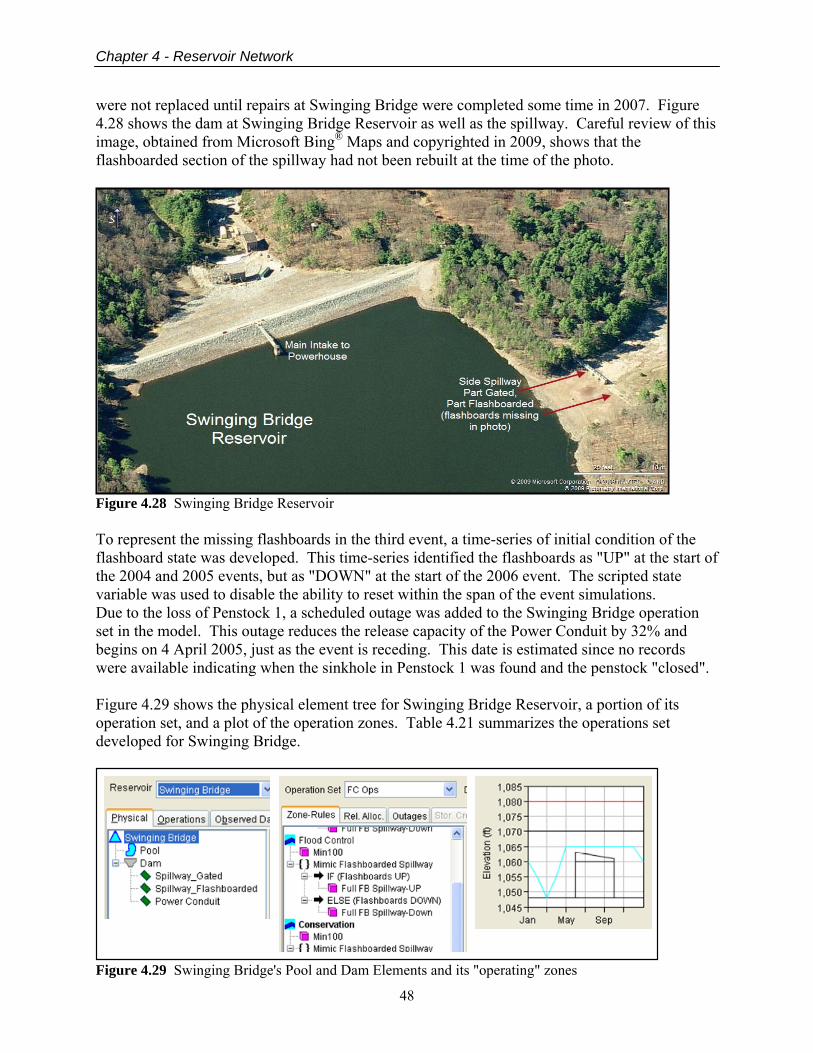
Chapter 4 - Reservoir Network
48
were not replaced until repairs at Swinging Bridge were completed some time in 2007. Figure 4.28 shows the dam at Swinging Bridge Reservoir as well as the spillway. Careful review of this image, obtained from Microsoft Bing® Maps and copyrighted in 2009, shows that the flashboarded section of the spillway had not been rebuilt at the time of the photo.
Figure 4.28 Swinging Bridge Reservoir To represent the missing flashboards in the third event, a time-series of initial condition of the flashboard state was developed. This time-series identified the flashboards as "UP" at the start of the 2004 and 2005 events, but as "DOWN" at the start of the 2006 event. The scripted state variable was used to disable the ability to reset within the span of the event simulations. Due to the loss of Penstock 1, a scheduled outage was added to the Swinging Bridge operation set in the model. This outage reduces the release capacity of the Power Conduit by 32% and begins on 4 April 2005, just as the event is receding. This date is estimated since no records were available indicating when the sinkhole in Penstock 1 was found and the penstock "closed". Figure 4.29 shows the physical element tree for Swinging Bridge Reservoir, a portion of its operation set, and a plot of the operation zones. Table 4.21 summarizes the operations set developed for Swinging Bridge.
Figure 4.29 Swinging Bridge's Pool and Dam Elements and its "operating" zones

Chapter 4 - Reservoir Network
49
Table 4.21 Swinging Bridge Operations Summary, FC Ops Name Description Reference Swinging Bridge FC Ops
Release Allocation, sequential: Power Conduit Spillway-Gated Spillway-Flashboarded OUTAGE: Power Conduit - Penstock 1 was permanently disabled after April 2005 Event. Max Cap now about 1075 ft. With a 0.68 factor in scheduled outage, Max Cap = 1068 ft
Mongaup River Hydroelectric System Operating Plan, Draft – May 2007; and Conversation with Joe Kimazewski, the current superintendant
TOP OF DAM 1080 ft Mimic Flashboarded Spillway Flashboards Up – Full FB Spillway-UP Flashboards Down – Full FB Spillway-Down
Using a state variable to determine flashboard state, Max Spillway flow limited - max flow fn of top of flashboards Full Spillway flow – no flashboards
This reservoir has a spillway with a gated section and a flashboarded section. Spillway crest=1065. Top of Flashboards=1070. Flashboards are designed to fall when pool exceeds (1073 ft). An if-block, a state variable, and a few rules are used to mimic the flashboarded spillway operation.
FLOOD CONTROL 1070 ft – top of flashboards Min100 Minimum release of 100cfs Draft Operating Plan Mimic Flashboarded Spillway
Same as above…Note: when pool is below spillway crest, flashboards will not fall. However, if they have already fallen, the pool will draw down to the reset elevation.
CONSERVATION Seasonally varying: 1048-1065 ft Min100 Minimum release of 100cfs Draft Operating Plan Mimic Flashboarded Spillway
Same as above…
LEVEL 2 1048 ft except summer varies 1063-1061 ft
Levels 2 and 1 are defined for summer operation of hydropower versus recreation and are meaningful only to low flow operation – no minimum flow is required from these zones
Mimic Flashboarded Spillway
Same as above
LEVEL 1 1048 ft except summer 1060 ft Mimic Flashboarded Spillway
Same as above
INACTIVE 1048 ft 4.3.3.3 Rio Rio is the downstream-most reservoir in the Mongaup River Basin. As such, Rio receives the releases from its upstream partners. In the 2005 event, the flashboards failed to fall at Swinging Bridge and Rio. The model indicates that they could have fallen. As with Swinging Bridge, the flashboards were removed after the 2005 event, so a similar time-series was developed to set the flashboard state initial condition for each event appropriately. The only observed records
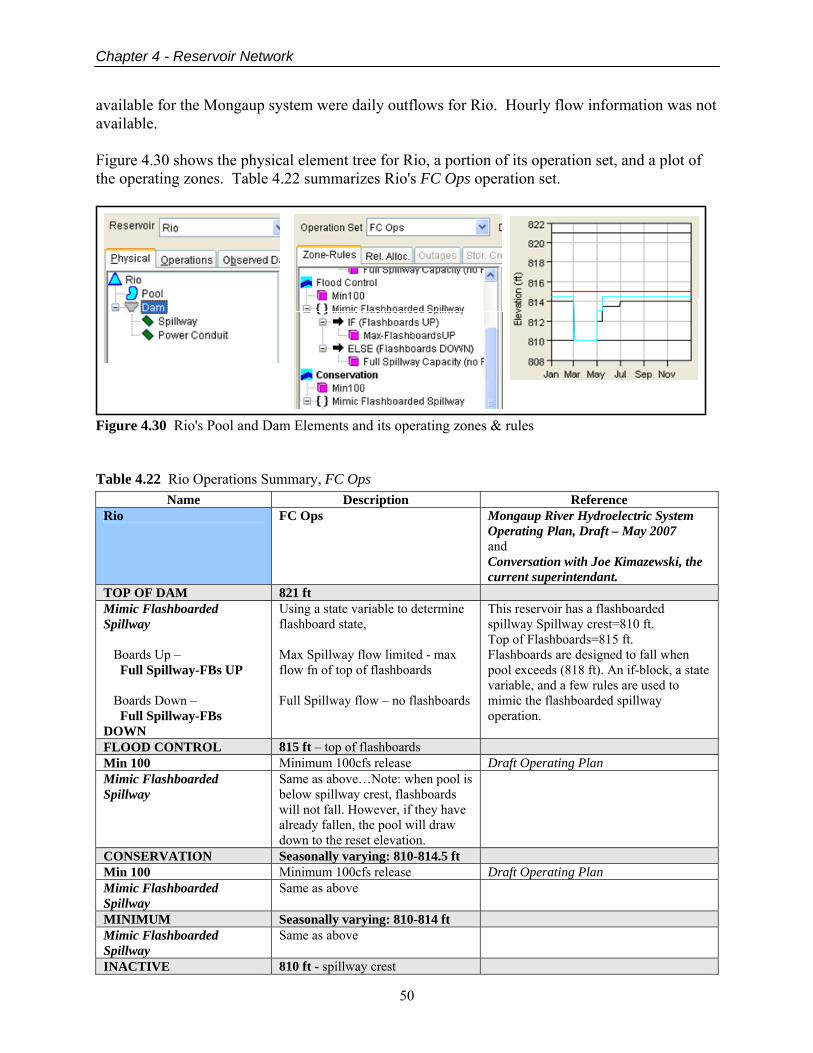
Chapter 4 - Reservoir Network
50
available for the Mongaup system were daily outflows for Rio. Hourly flow information was not available. Figure 4.30 shows the physical element tree for Rio, a portion of its operation set, and a plot of the operating zones. Table 4.22 summarizes Rio's FC Ops operation set.
Figure 4.30 Rio's Pool and Dam Elements and its operating zones & rules Table 4.22 Rio Operations Summary, FC Ops
Name Description Reference Rio FC Ops Mongaup River Hydroelectric System
Operating Plan, Draft – May 2007 and Conversation with Joe Kimazewski, the current superintendant.
TOP OF DAM 821 ft Mimic Flashboarded Spillway Boards Up – Full Spillway-FBs UP Boards Down – Full Spillway-FBs DOWN
Using a state variable to determine flashboard state, Max Spillway flow limited - max flow fn of top of flashboards Full Spillway flow – no flashboards
This reservoir has a flashboarded spillway Spillway crest=810 ft. Top of Flashboards=815 ft. Flashboards are designed to fall when pool exceeds (818 ft). An if-block, a state variable, and a few rules are used to mimic the flashboarded spillway operation.
FLOOD CONTROL 815 ft – top of flashboards Min 100 Minimum 100cfs release Draft Operating Plan Mimic Flashboarded Spillway
Same as above…Note: when pool is below spillway crest, flashboards will not fall. However, if they have already fallen, the pool will draw down to the reset elevation.
CONSERVATION Seasonally varying: 810-814.5 ft Min 100 Minimum 100cfs release Draft Operating Plan Mimic Flashboarded Spillway
Same as above
MINIMUM Seasonally varying: 810-814 ft Mimic Flashboarded Spillway
Same as above
INACTIVE 810 ft - spillway crest
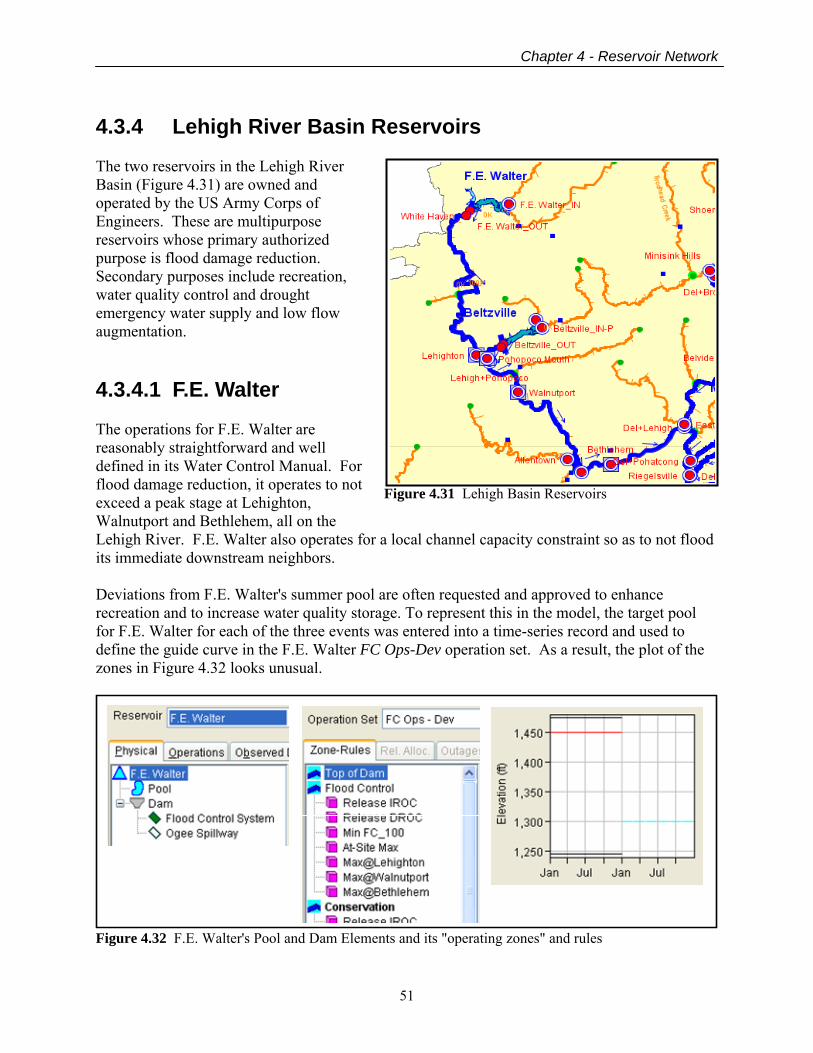
Chapter 4 - Reservoir Network
51
Figure 4.31 Lehigh Basin Reservoirs
4.3.4 Lehigh River Basin Reservoirs The two reservoirs in the Lehigh River Basin (Figure 4.31) are owned and operated by the US Army Corps of Engineers. These are multipurpose reservoirs whose primary authorized purpose is flood damage reduction. Secondary purposes include recreation, water quality control and drought emergency water supply and low flow augmentation. 4.3.4.1 F.E. Walter The operations for F.E. Walter are reasonably straightforward and well defined in its Water Control Manual. For flood damage reduction, it operates to not exceed a peak stage at Lehighton, Walnutport and Bethlehem, all on the Lehigh River. F.E. Walter also operates for a local channel capacity constraint so as to not flood its immediate downstream neighbors. Deviations from F.E. Walter's summer pool are often requested and approved to enhance recreation and to increase water quality storage. To represent this in the model, the target pool for F.E. Walter for each of the three events was entered into a time-series record and used to define the guide curve in the F.E. Walter FC Ops-Dev operation set. As a result, the plot of the zones in Figure 4.32 looks unusual.
Figure 4.32 F.E. Walter's Pool and Dam Elements and its "operating zones" and rules
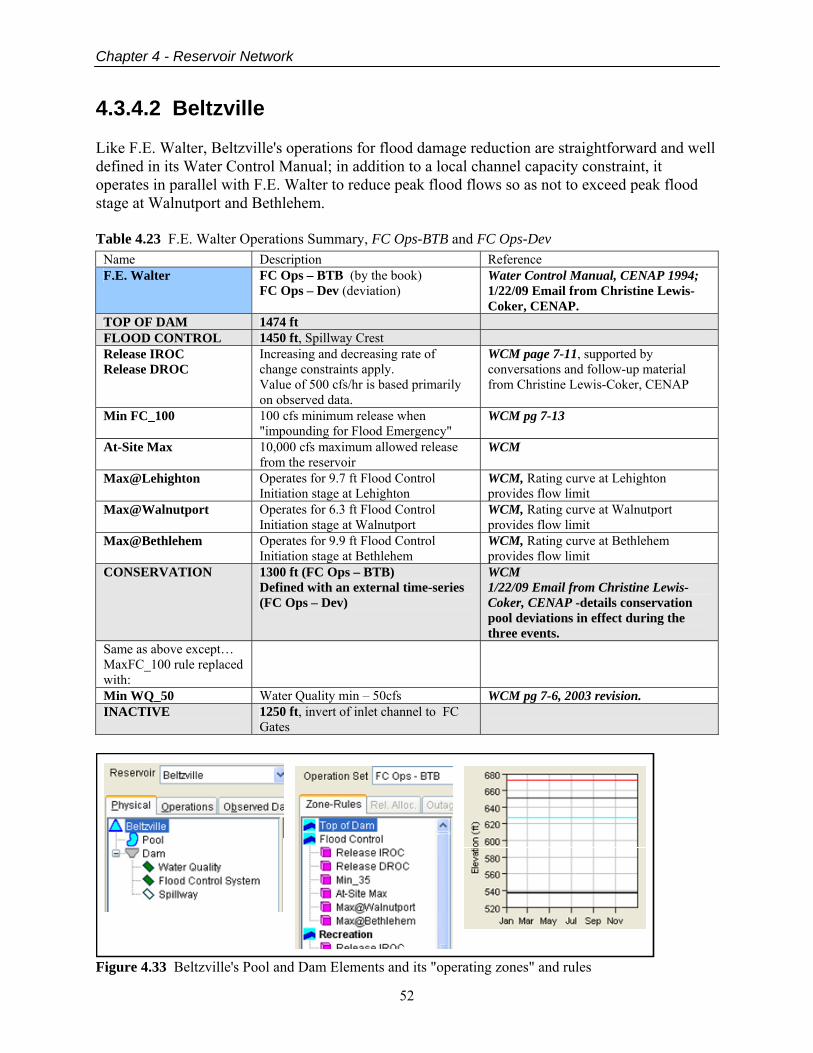
Chapter 4 - Reservoir Network
52
4.3.4.2 Beltzville Like F.E. Walter, Beltzville's operations for flood damage reduction are straightforward and well defined in its Water Control Manual; in addition to a local channel capacity constraint, it operates in parallel with F.E. Walter to reduce peak flood flows so as not to exceed peak flood stage at Walnutport and Bethlehem. Table 4.23 F.E. Walter Operations Summary, FC Ops-BTB and FC Ops-Dev
Name Description Reference F.E. Walter FC Ops – BTB (by the book)
FC Ops – Dev (deviation)
Water Control Manual, CENAP 1994; 1/22/09 Email from Christine Lewis-Coker, CENAP.
TOP OF DAM 1474 ft FLOOD CONTROL 1450 ft, Spillway Crest Release IROC Release DROC
Increasing and decreasing rate of change constraints apply. Value of 500 cfs/hr is based primarily on observed data.
WCM page 7-11, supported by conversations and follow-up material from Christine Lewis-Coker, CENAP
Min FC_100 100 cfs minimum release when "impounding for Flood Emergency"
WCM pg 7-13
At-Site Max 10,000 cfs maximum allowed release from the reservoir
WCM
Max@Lehighton Operates for 9.7 ft Flood Control Initiation stage at Lehighton
WCM, Rating curve at Lehighton provides flow limit
Max@Walnutport Operates for 6.3 ft Flood Control Initiation stage at Walnutport
WCM, Rating curve at Walnutport provides flow limit
Max@Bethlehem Operates for 9.9 ft Flood Control Initiation stage at Bethlehem
WCM, Rating curve at Bethlehem provides flow limit
CONSERVATION 1300 ft (FC Ops – BTB) Defined with an external time-series (FC Ops – Dev)
WCM 1/22/09 Email from Christine Lewis-Coker, CENAP -details conservation pool deviations in effect during the three events.
Same as above except… MaxFC_100 rule replaced with:
Min WQ_50 Water Quality min – 50cfs WCM pg 7-6, 2003 revision. INACTIVE 1250 ft, invert of inlet channel to FC
Gates
Figure 4.33 Beltzville's Pool and Dam Elements and its "operating zones" and rules
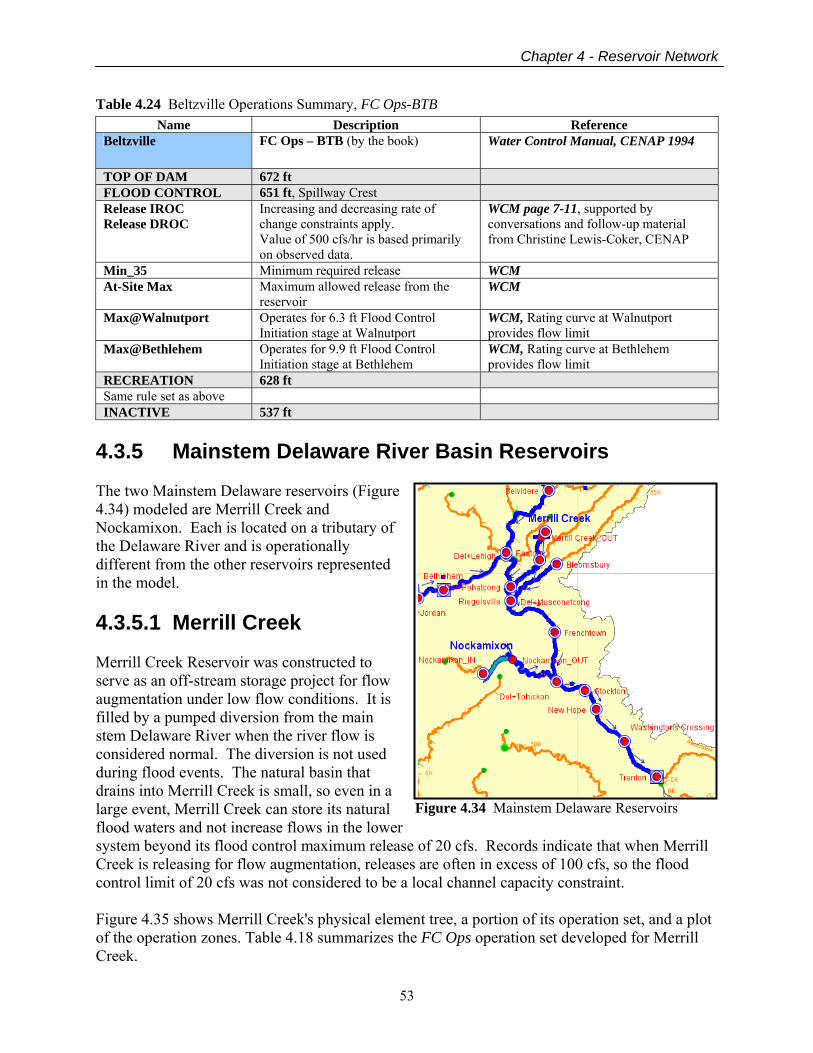
Chapter 4 - Reservoir Network
53
Figure 4.34 Mainstem Delaware Reservoirs
Table 4.24 Beltzville Operations Summary, FC Ops-BTB Name Description Reference
Beltzville FC Ops – BTB (by the book)
Water Control Manual, CENAP 1994
TOP OF DAM 672 ft FLOOD CONTROL 651 ft, Spillway Crest Release IROC Release DROC
Increasing and decreasing rate of change constraints apply. Value of 500 cfs/hr is based primarily on observed data.
WCM page 7-11, supported by conversations and follow-up material from Christine Lewis-Coker, CENAP
Min_35 Minimum required release WCM At-Site Max Maximum allowed release from the
reservoir WCM
Max@Walnutport Operates for 6.3 ft Flood Control Initiation stage at Walnutport
WCM, Rating curve at Walnutport provides flow limit
Max@Bethlehem Operates for 9.9 ft Flood Control Initiation stage at Bethlehem
WCM, Rating curve at Bethlehem provides flow limit
RECREATION 628 ft Same rule set as above INACTIVE 537 ft
4.3.5 Mainstem Delaware River Basin Reservoirs The two Mainstem Delaware reservoirs (Figure 4.34) modeled are Merrill Creek and Nockamixon. Each is located on a tributary of the Delaware River and is operationally different from the other reservoirs represented in the model. 4.3.5.1 Merrill Creek Merrill Creek Reservoir was constructed to serve as an off-stream storage project for flow augmentation under low flow conditions. It is filled by a pumped diversion from the main stem Delaware River when the river flow is considered normal. The diversion is not used during flood events. The natural basin that drains into Merrill Creek is small, so even in a large event, Merrill Creek can store its natural flood waters and not increase flows in the lower system beyond its flood control maximum release of 20 cfs. Records indicate that when Merrill Creek is releasing for flow augmentation, releases are often in excess of 100 cfs, so the flood control limit of 20 cfs was not considered to be a local channel capacity constraint. Figure 4.35 shows Merrill Creek's physical element tree, a portion of its operation set, and a plot of the operation zones. Table 4.18 summarizes the FC Ops operation set developed for Merrill Creek.
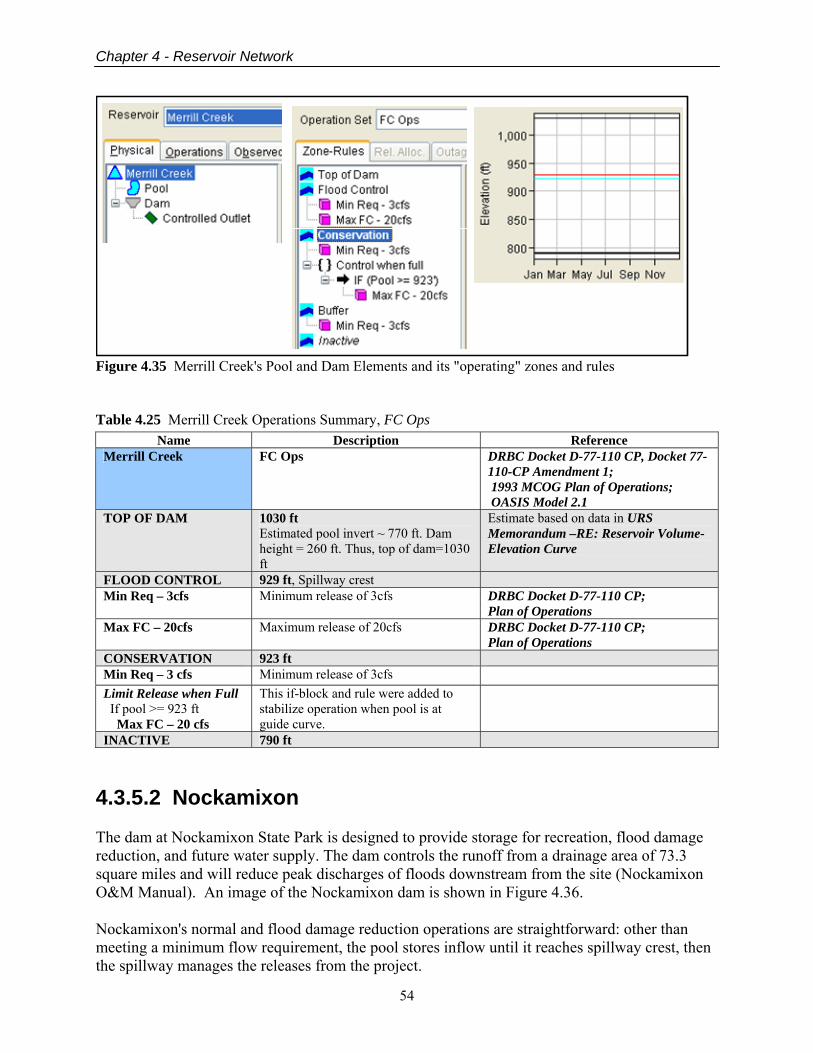
Chapter 4 - Reservoir Network
54
Figure 4.35 Merrill Creek's Pool and Dam Elements and its "operating" zones and rules Table 4.25 Merrill Creek Operations Summary, FC Ops
Name Description Reference Merrill Creek FC Ops
DRBC Docket D-77-110 CP, Docket 77-110-CP Amendment 1; 1993 MCOG Plan of Operations; OASIS Model 2.1
TOP OF DAM 1030 ft Estimated pool invert ~ 770 ft. Dam height = 260 ft. Thus, top of dam=1030 ft
Estimate based on data in URS Memorandum –RE: Reservoir Volume-Elevation Curve
FLOOD CONTROL 929 ft, Spillway crest Min Req – 3cfs Minimum release of 3cfs DRBC Docket D-77-110 CP;
Plan of Operations Max FC – 20cfs Maximum release of 20cfs DRBC Docket D-77-110 CP;
Plan of Operations CONSERVATION 923 ft Min Req – 3 cfs Minimum release of 3cfs Limit Release when Full If pool >= 923 ft Max FC – 20 cfs
This if-block and rule were added to stabilize operation when pool is at guide curve.
INACTIVE 790 ft 4.3.5.2 Nockamixon The dam at Nockamixon State Park is designed to provide storage for recreation, flood damage reduction, and future water supply. The dam controls the runoff from a drainage area of 73.3 square miles and will reduce peak discharges of floods downstream from the site (Nockamixon O&M Manual). An image of the Nockamixon dam is shown in Figure 4.36. Nockamixon's normal and flood damage reduction operations are straightforward: other than meeting a minimum flow requirement, the pool stores inflow until it reaches spillway crest, then the spillway manages the releases from the project.
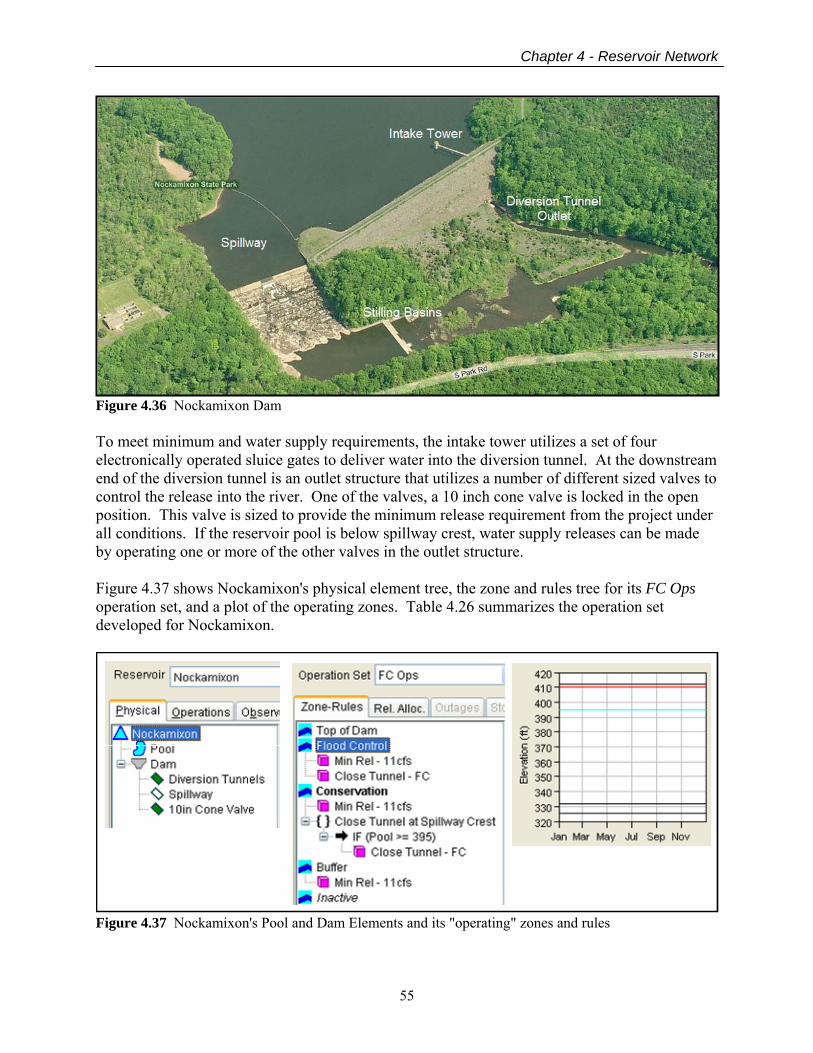
Chapter 4 - Reservoir Network
55
Figure 4.36 Nockamixon Dam To meet minimum and water supply requirements, the intake tower utilizes a set of four electronically operated sluice gates to deliver water into the diversion tunnel. At the downstream end of the diversion tunnel is an outlet structure that utilizes a number of different sized valves to control the release into the river. One of the valves, a 10 inch cone valve is locked in the open position. This valve is sized to provide the minimum release requirement from the project under all conditions. If the reservoir pool is below spillway crest, water supply releases can be made by operating one or more of the other valves in the outlet structure. Figure 4.37 shows Nockamixon's physical element tree, the zone and rules tree for its FC Ops operation set, and a plot of the operating zones. Table 4.26 summarizes the operation set developed for Nockamixon.
Figure 4.37 Nockamixon's Pool and Dam Elements and its "operating" zones and rules

Chapter 4 - Reservoir Network
56
Table 4.26 Nockamixon Operations Summary, FC Ops Name Description Reference
Nockamixon FC Ops Release Allocation, sequential: Cone Valve Diversion Tunnel Spillway (uncontrolled)
Nockamixon O&M Manual; OASIS model 2.1; Letter dated 22May1979 from Pennsylvania Dept of Environmental Resources
TOP OF DAM 412 ft FLOOD CONTROL 409.9 ft No source. Value is the last
value in the elev-storage data found in documentation and the OASIS model
Min Rel – 11cfs Min release, all the time, 11cfs – cone valve capacity
PA Letter, Cone Valve remains open at all times
Close Tunnel - FC Max controlled release =0 used to direct flood flows to spillway. No flood control is provided for the downstream system (other than that controlled by the spillway capacity.) Therefore, all outlets other than the cone valve, are closed when the reservoir is spilling.
O&M Manual , Chapter 3, Section 7 "Flood Emergency Operation Procedures"
CONSERVATION 395 ft, Spillway Crest O&M Manual Min Rel – 11cfs Close Tunnel at Spillway Crest: If (pool>=395) Close Tunnel - FC
used to curtail tunnel flows if pool is sitting at guide curve
BUFFER 331.5 ft Min Rel – 11cfs INACTIVE 325.5 ft
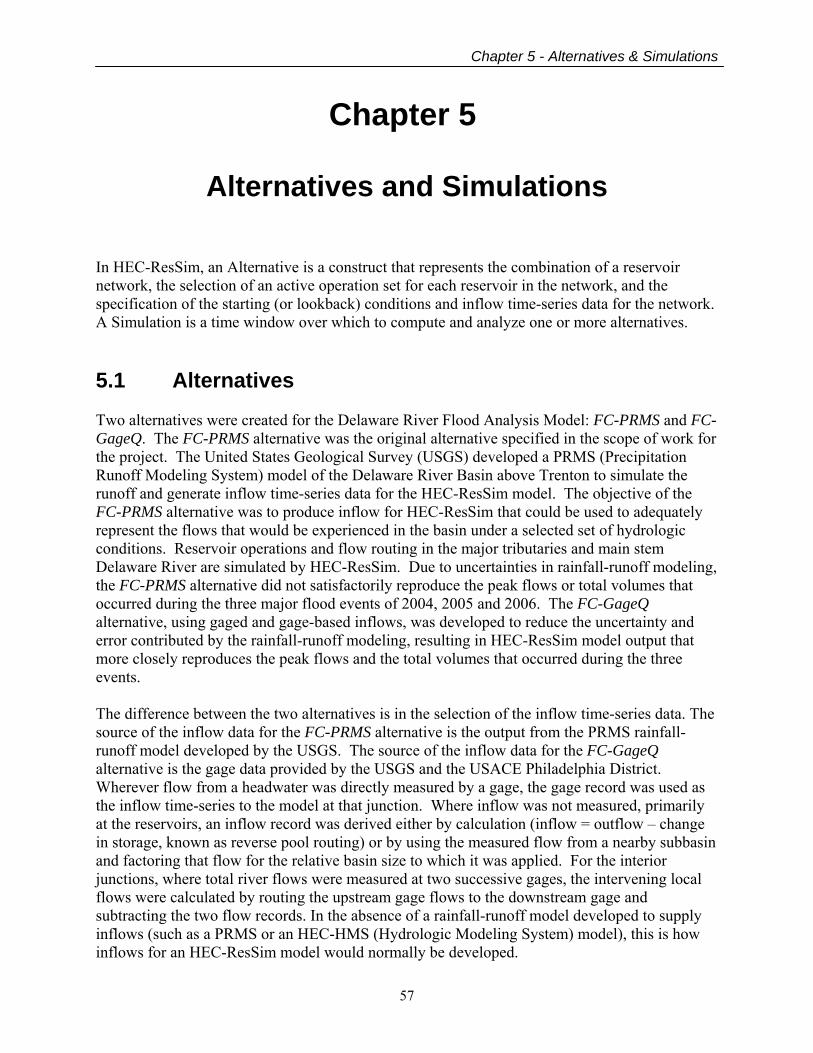
Chapter 5 - Alternatives & Simulations
57
Chapter 5
Alternatives and Simulations In HEC-ResSim, an Alternative is a construct that represents the combination of a reservoir network, the selection of an active operation set for each reservoir in the network, and the specification of the starting (or lookback) conditions and inflow time-series data for the network. A Simulation is a time window over which to compute and analyze one or more alternatives. 5.1 Alternatives Two alternatives were created for the Delaware River Flood Analysis Model: FC-PRMS and FC-GageQ. The FC-PRMS alternative was the original alternative specified in the scope of work for the project. The United States Geological Survey (USGS) developed a PRMS (Precipitation Runoff Modeling System) model of the Delaware River Basin above Trenton to simulate the runoff and generate inflow time-series data for the HEC-ResSim model. The objective of the FC-PRMS alternative was to produce inflow for HEC-ResSim that could be used to adequately represent the flows that would be experienced in the basin under a selected set of hydrologic conditions. Reservoir operations and flow routing in the major tributaries and main stem Delaware River are simulated by HEC-ResSim. Due to uncertainties in rainfall-runoff modeling, the FC-PRMS alternative did not satisfactorily reproduce the peak flows or total volumes that occurred during the three major flood events of 2004, 2005 and 2006. The FC-GageQ alternative, using gaged and gage-based inflows, was developed to reduce the uncertainty and error contributed by the rainfall-runoff modeling, resulting in HEC-ResSim model output that more closely reproduces the peak flows and the total volumes that occurred during the three events. The difference between the two alternatives is in the selection of the inflow time-series data. The source of the inflow data for the FC-PRMS alternative is the output from the PRMS rainfall-runoff model developed by the USGS. The source of the inflow data for the FC-GageQ alternative is the gage data provided by the USGS and the USACE Philadelphia District. Wherever flow from a headwater was directly measured by a gage, the gage record was used as the inflow time-series to the model at that junction. Where inflow was not measured, primarily at the reservoirs, an inflow record was derived either by calculation (inflow = outflow – change in storage, known as reverse pool routing) or by using the measured flow from a nearby subbasin and factoring that flow for the relative basin size to which it was applied. For the interior junctions, where total river flows were measured at two successive gages, the intervening local flows were calculated by routing the upstream gage flows to the downstream gage and subtracting the two flow records. In the absence of a rainfall-runoff model developed to supply inflows (such as a PRMS or an HEC-HMS (Hydrologic Modeling System) model), this is how inflows for an HEC-ResSim model would normally be developed.
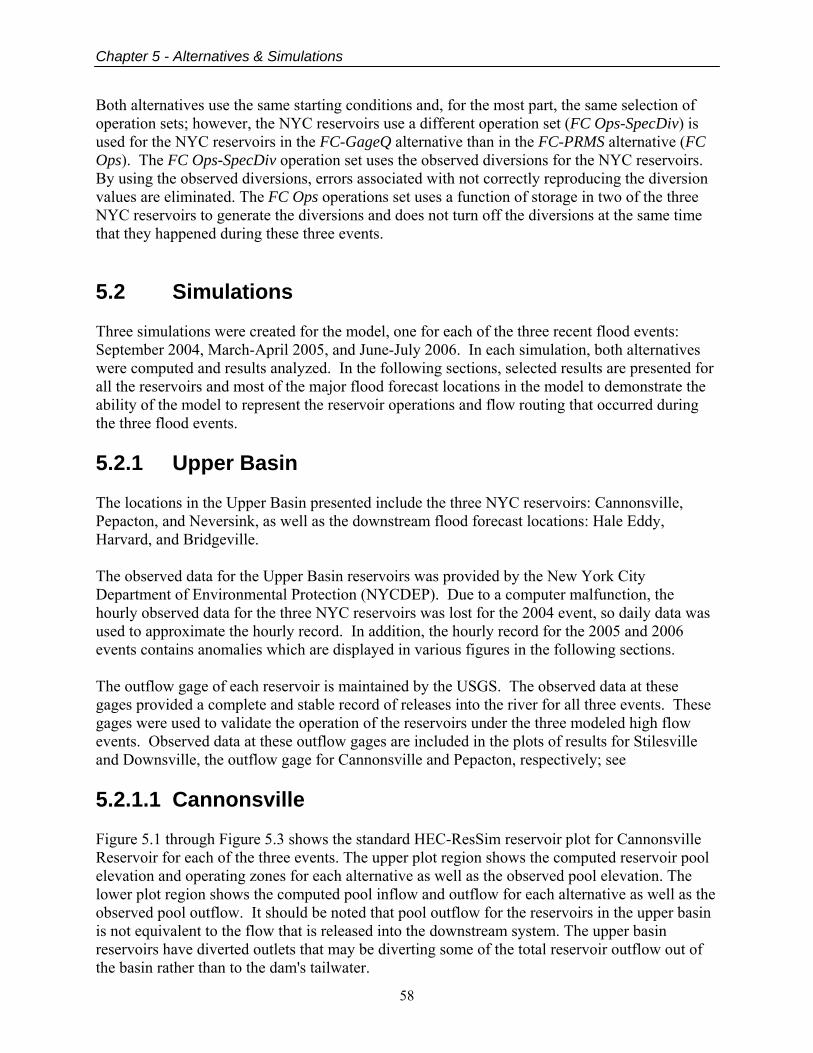
Chapter 5 - Alternatives & Simulations
58
Both alternatives use the same starting conditions and, for the most part, the same selection of operation sets; however, the NYC reservoirs use a different operation set (FC Ops-SpecDiv) is used for the NYC reservoirs in the FC-GageQ alternative than in the FC-PRMS alternative (FC Ops). The FC Ops-SpecDiv operation set uses the observed diversions for the NYC reservoirs. By using the observed diversions, errors associated with not correctly reproducing the diversion values are eliminated. The FC Ops operations set uses a function of storage in two of the three NYC reservoirs to generate the diversions and does not turn off the diversions at the same time that they happened during these three events. 5.2 Simulations Three simulations were created for the model, one for each of the three recent flood events: September 2004, March-April 2005, and June-July 2006. In each simulation, both alternatives were computed and results analyzed. In the following sections, selected results are presented for all the reservoirs and most of the major flood forecast locations in the model to demonstrate the ability of the model to represent the reservoir operations and flow routing that occurred during the three flood events. 5.2.1 Upper Basin The locations in the Upper Basin presented include the three NYC reservoirs: Cannonsville, Pepacton, and Neversink, as well as the downstream flood forecast locations: Hale Eddy, Harvard, and Bridgeville. The observed data for the Upper Basin reservoirs was provided by the New York City Department of Environmental Protection (NYCDEP). Due to a computer malfunction, the hourly observed data for the three NYC reservoirs was lost for the 2004 event, so daily data was used to approximate the hourly record. In addition, the hourly record for the 2005 and 2006 events contains anomalies which are displayed in various figures in the following sections. The outflow gage of each reservoir is maintained by the USGS. The observed data at these gages provided a complete and stable record of releases into the river for all three events. These gages were used to validate the operation of the reservoirs under the three modeled high flow events. Observed data at these outflow gages are included in the plots of results for Stilesville and Downsville, the outflow gage for Cannonsville and Pepacton, respectively; see 5.2.1.1 Cannonsville Figure 5.1 through Figure 5.3 shows the standard HEC-ResSim reservoir plot for Cannonsville Reservoir for each of the three events. The upper plot region shows the computed reservoir pool elevation and operating zones for each alternative as well as the observed pool elevation. The lower plot region shows the computed pool inflow and outflow for each alternative as well as the observed pool outflow. It should be noted that pool outflow for the reservoirs in the upper basin is not equivalent to the flow that is released into the downstream system. The upper basin reservoirs have diverted outlets that may be diverting some of the total reservoir outflow out of the basin rather than to the dam's tailwater.
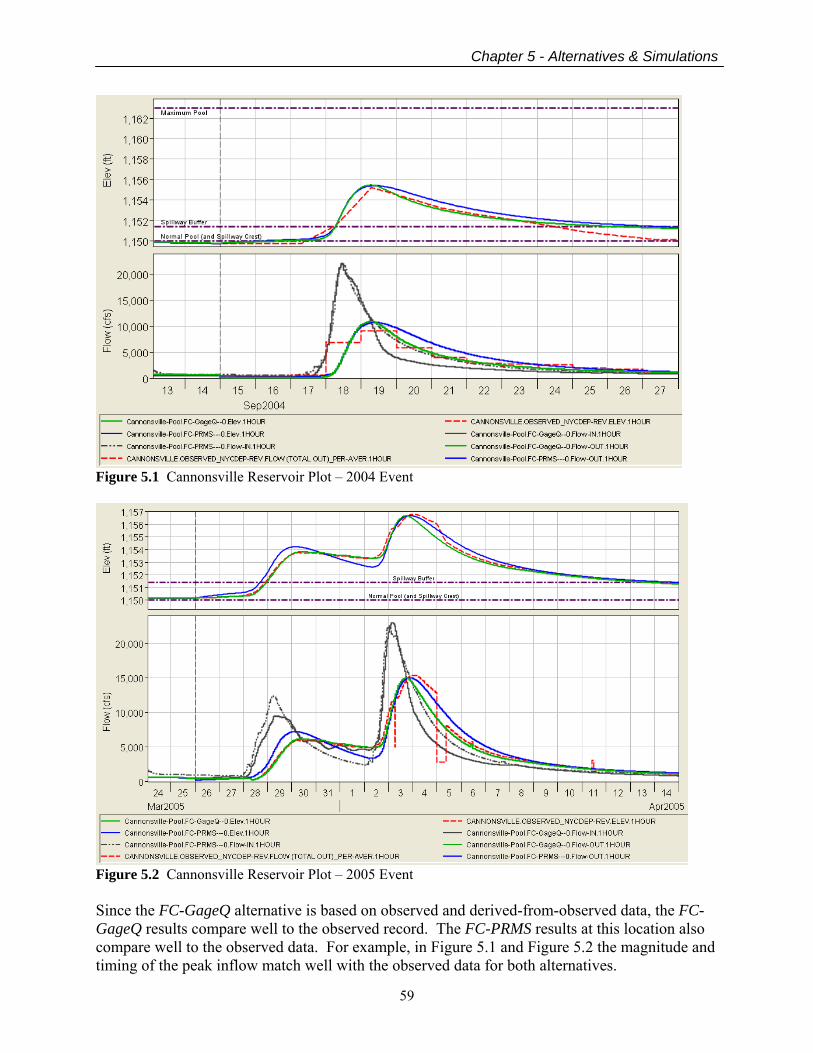
Chapter 5 - Alternatives & Simulations
59
Figure 5.1 Cannonsville Reservoir Plot – 2004 Event
Figure 5.2 Cannonsville Reservoir Plot – 2005 Event Since the FC-GageQ alternative is based on observed and derived-from-observed data, the FC-GageQ results compare well to the observed record. The FC-PRMS results at this location also compare well to the observed data. For example, in Figure 5.1 and Figure 5.2 the magnitude and timing of the peak inflow match well with the observed data for both alternatives.
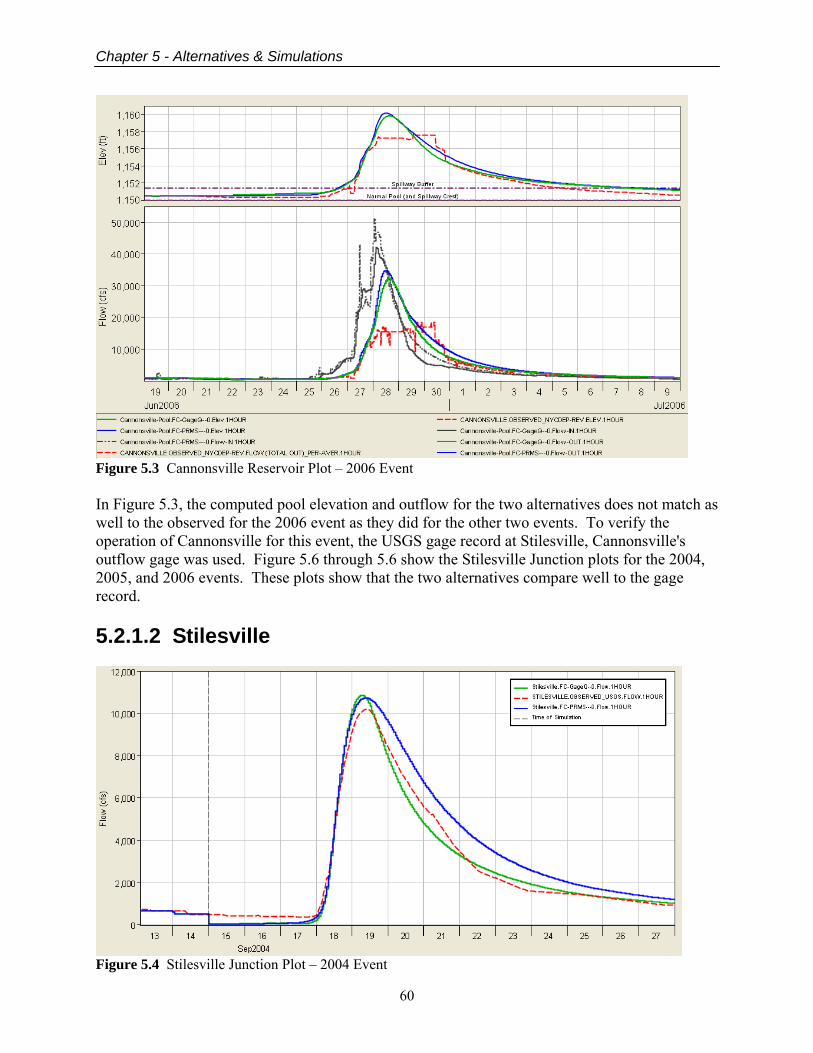
Chapter 5 - Alternatives & Simulations
60
Figure 5.3 Cannonsville Reservoir Plot – 2006 Event In Figure 5.3, the computed pool elevation and outflow for the two alternatives does not match as well to the observed for the 2006 event as they did for the other two events. To verify the operation of Cannonsville for this event, the USGS gage record at Stilesville, Cannonsville's outflow gage was used. Figure 5.6 through 5.6 show the Stilesville Junction plots for the 2004, 2005, and 2006 events. These plots show that the two alternatives compare well to the gage record. 5.2.1.2 Stilesville
Figure 5.4 Stilesville Junction Plot – 2004 Event
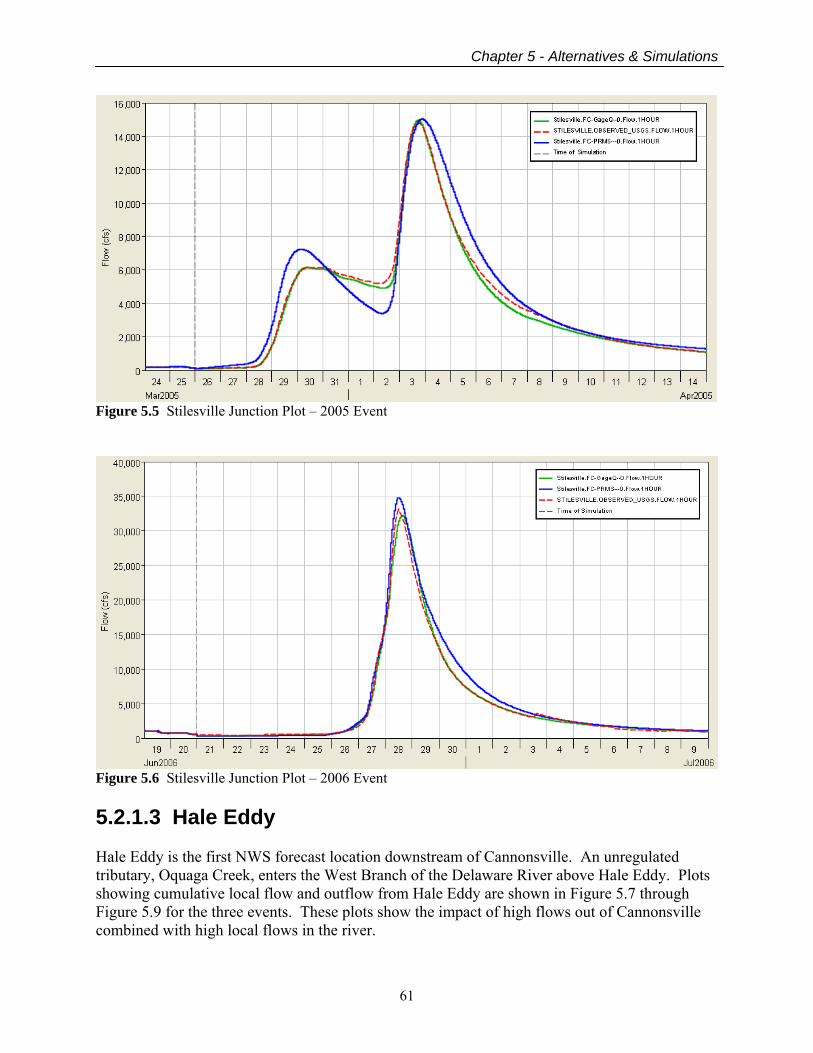
Chapter 5 - Alternatives & Simulations
61
Figure 5.5 Stilesville Junction Plot – 2005 Event
Figure 5.6 Stilesville Junction Plot – 2006 Event 5.2.1.3 Hale Eddy Hale Eddy is the first NWS forecast location downstream of Cannonsville. An unregulated tributary, Oquaga Creek, enters the West Branch of the Delaware River above Hale Eddy. Plots showing cumulative local flow and outflow from Hale Eddy are shown in Figure 5.7 through Figure 5.9 for the three events. These plots show the impact of high flows out of Cannonsville combined with high local flows in the river.
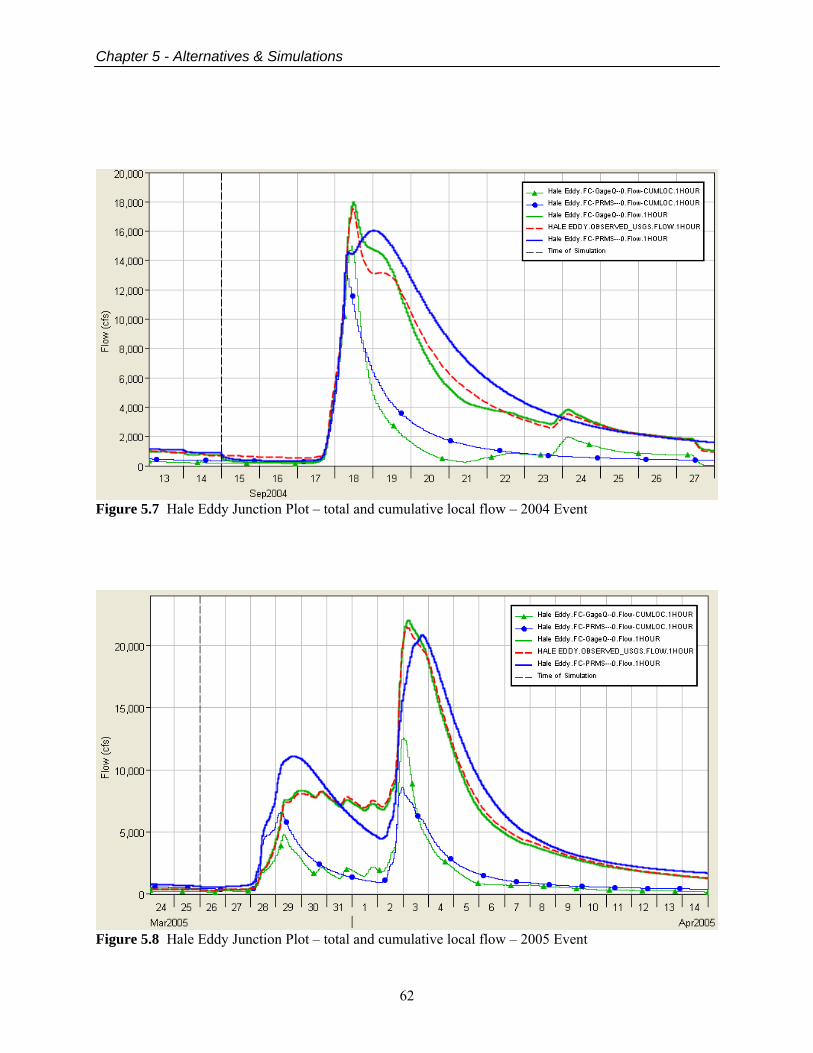
Chapter 5 - Alternatives & Simulations
62
Figure 5.7 Hale Eddy Junction Plot – total and cumulative local flow – 2004 Event
Figure 5.8 Hale Eddy Junction Plot – total and cumulative local flow – 2005 Event
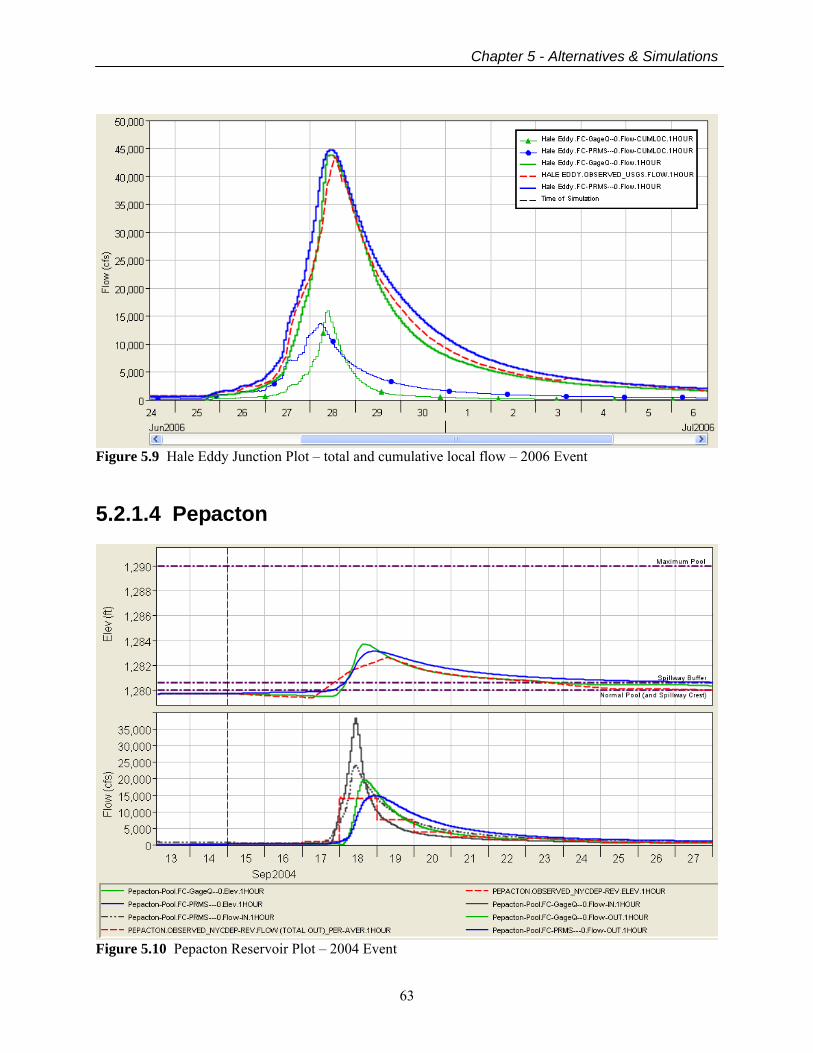
Chapter 5 - Alternatives & Simulations
63
Figure 5.9 Hale Eddy Junction Plot – total and cumulative local flow – 2006 Event 5.2.1.4 Pepacton
Figure 5.10 Pepacton Reservoir Plot – 2004 Event
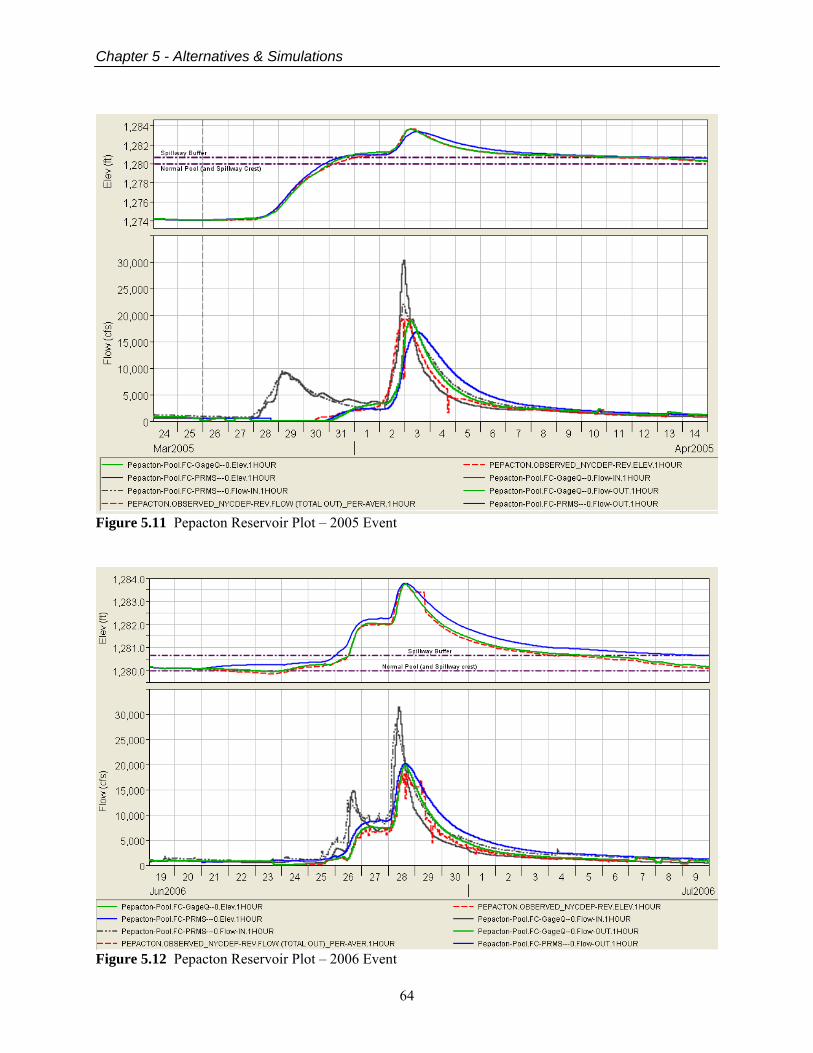
Chapter 5 - Alternatives & Simulations
64
Figure 5.11 Pepacton Reservoir Plot – 2005 Event
Figure 5.12 Pepacton Reservoir Plot – 2006 Event
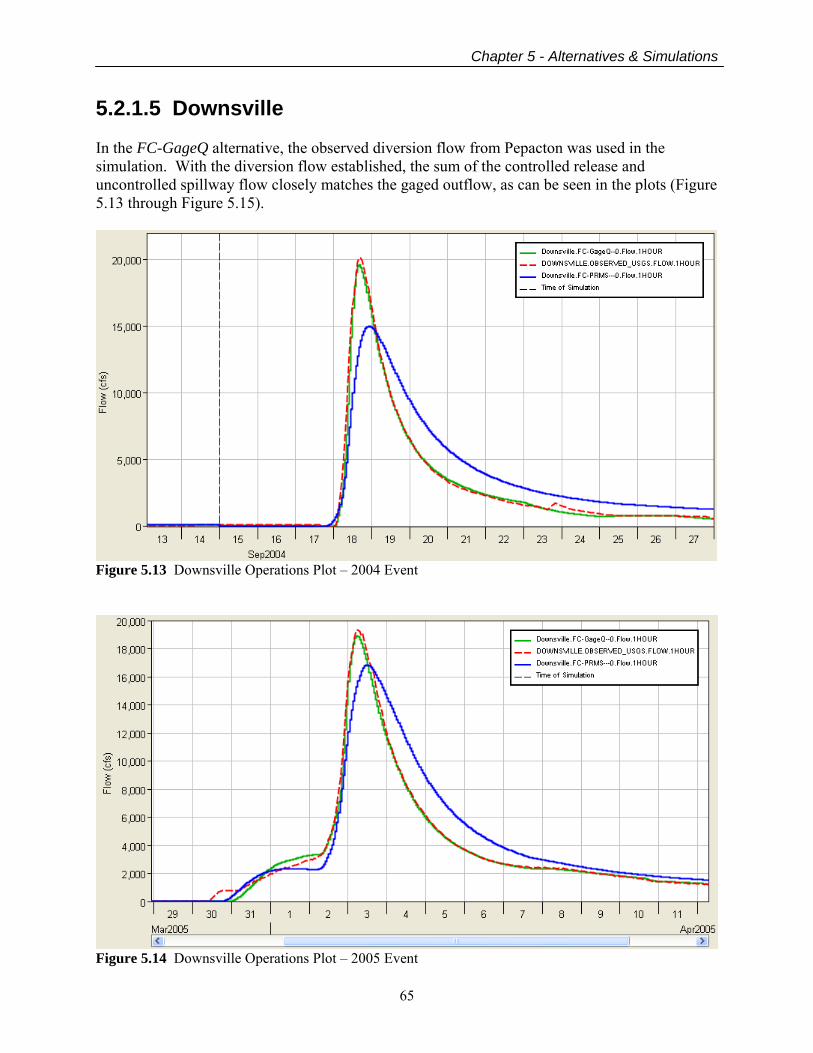
Chapter 5 - Alternatives & Simulations
65
5.2.1.5 Downsville In the FC-GageQ alternative, the observed diversion flow from Pepacton was used in the simulation. With the diversion flow established, the sum of the controlled release and uncontrolled spillway flow closely matches the gaged outflow, as can be seen in the plots (Figure 5.13 through Figure 5.15).
Figure 5.13 Downsville Operations Plot – 2004 Event
Figure 5.14 Downsville Operations Plot – 2005 Event
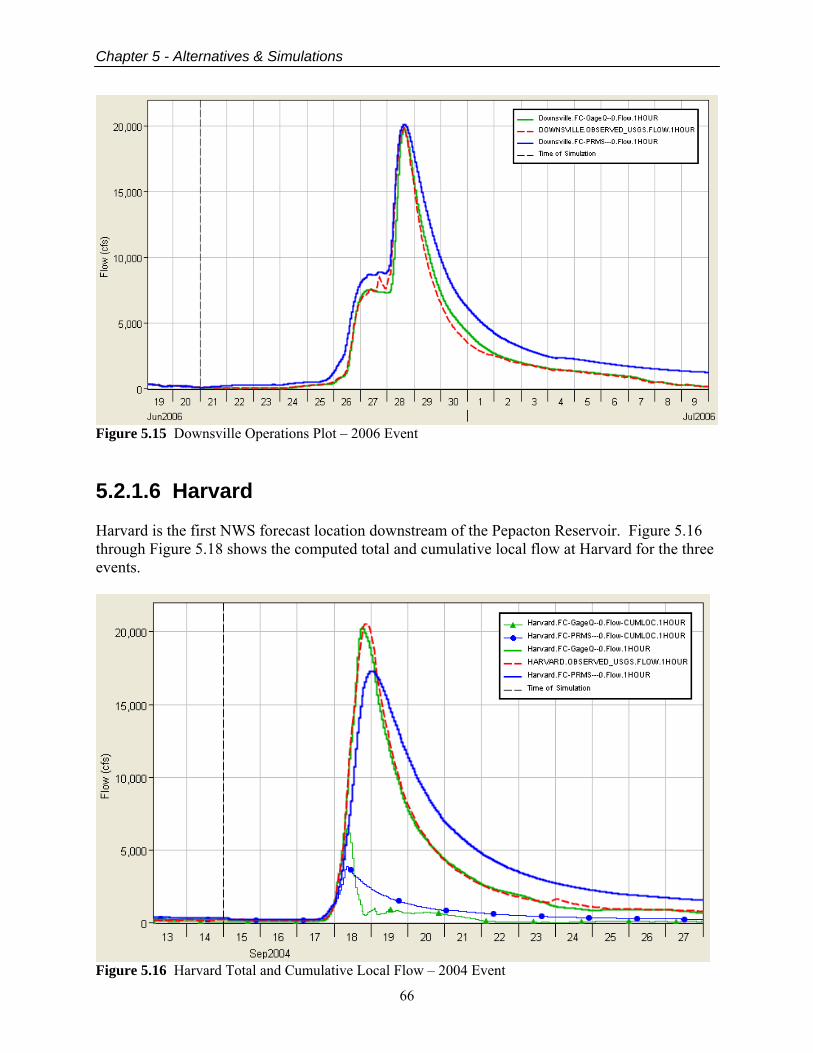
Chapter 5 - Alternatives & Simulations
66
Figure 5.15 Downsville Operations Plot – 2006 Event 5.2.1.6 Harvard Harvard is the first NWS forecast location downstream of the Pepacton Reservoir. Figure 5.16 through Figure 5.18 shows the computed total and cumulative local flow at Harvard for the three events.
Figure 5.16 Harvard Total and Cumulative Local Flow – 2004 Event
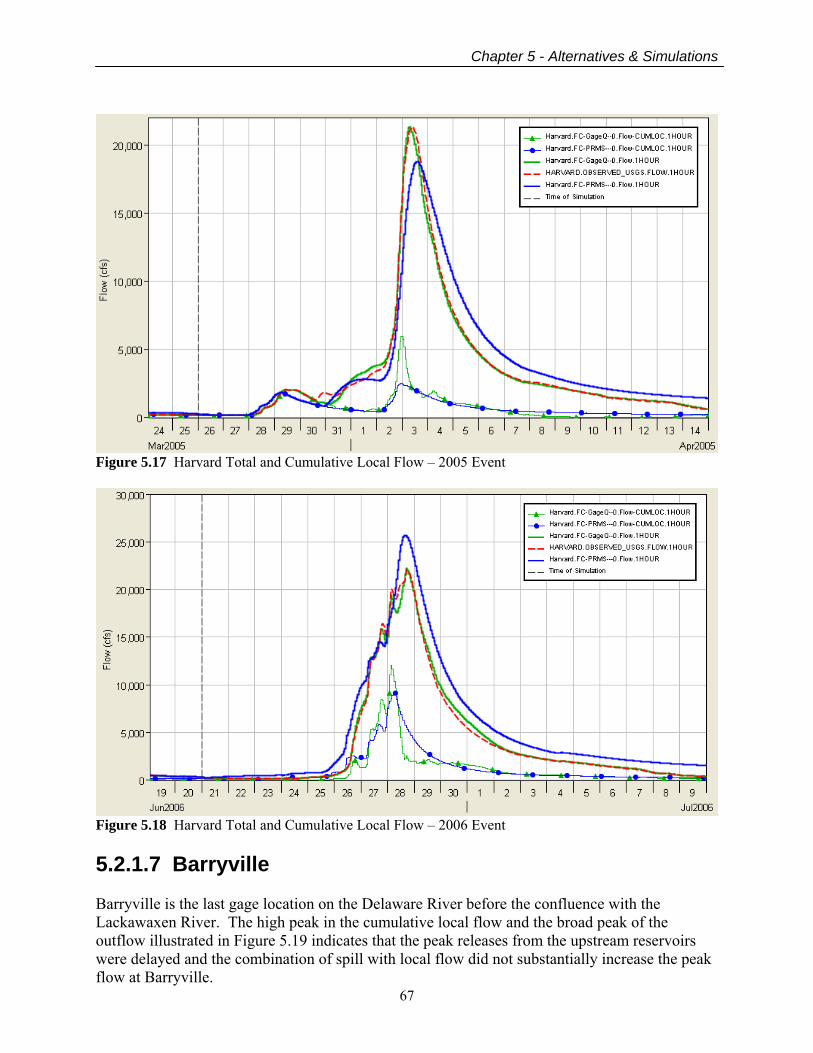
Chapter 5 - Alternatives & Simulations
67
Figure 5.17 Harvard Total and Cumulative Local Flow – 2005 Event
Figure 5.18 Harvard Total and Cumulative Local Flow – 2006 Event 5.2.1.7 Barryville Barryville is the last gage location on the Delaware River before the confluence with the Lackawaxen River. The high peak in the cumulative local flow and the broad peak of the outflow illustrated in Figure 5.19 indicates that the peak releases from the upstream reservoirs were delayed and the combination of spill with local flow did not substantially increase the peak flow at Barryville.
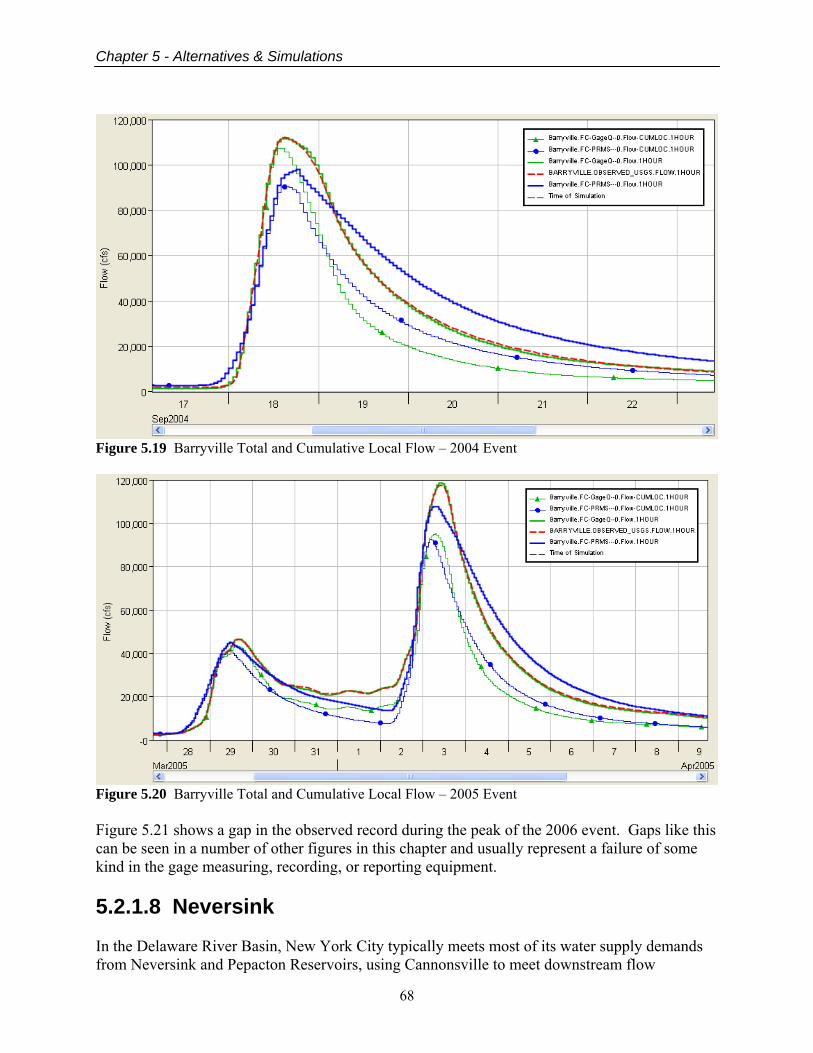
Chapter 5 - Alternatives & Simulations
68
Figure 5.19 Barryville Total and Cumulative Local Flow – 2004 Event
Figure 5.20 Barryville Total and Cumulative Local Flow – 2005 Event Figure 5.21 shows a gap in the observed record during the peak of the 2006 event. Gaps like this can be seen in a number of other figures in this chapter and usually represent a failure of some kind in the gage measuring, recording, or reporting equipment. 5.2.1.8 Neversink In the Delaware River Basin, New York City typically meets most of its water supply demands from Neversink and Pepacton Reservoirs, using Cannonsville to meet downstream flow
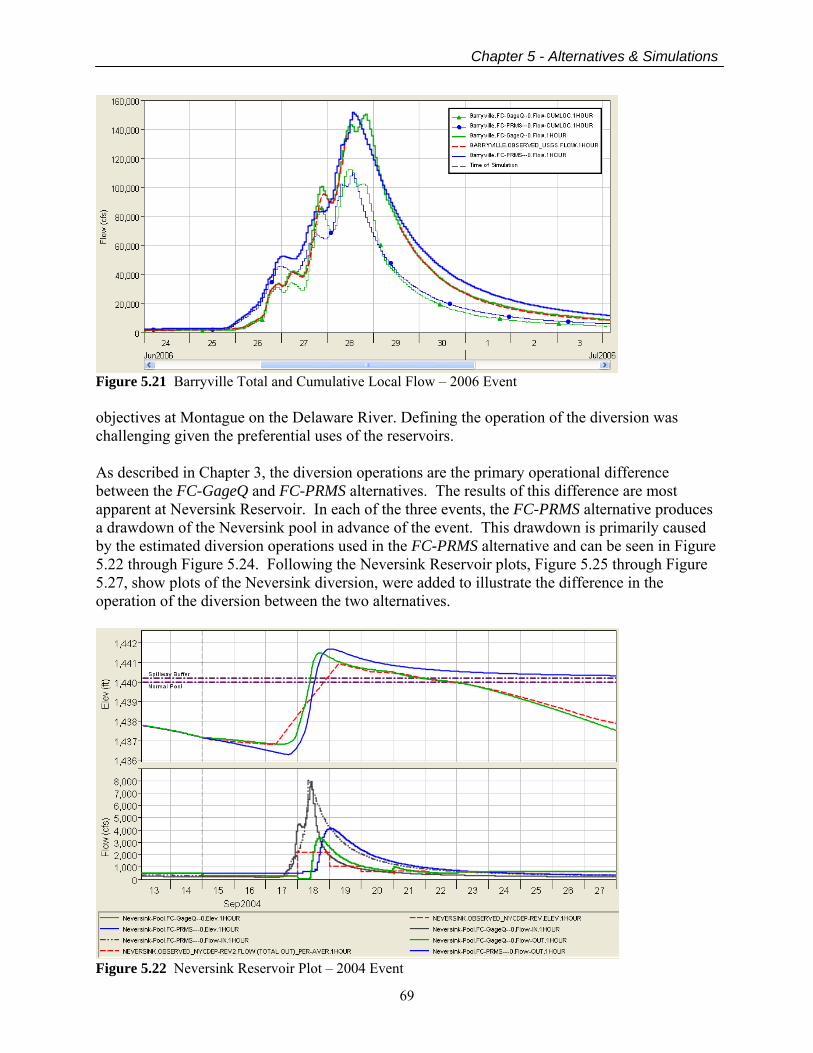
Chapter 5 - Alternatives & Simulations
69
Figure 5.21 Barryville Total and Cumulative Local Flow – 2006 Event objectives at Montague on the Delaware River. Defining the operation of the diversion was challenging given the preferential uses of the reservoirs. As described in Chapter 3, the diversion operations are the primary operational difference between the FC-GageQ and FC-PRMS alternatives. The results of this difference are most apparent at Neversink Reservoir. In each of the three events, the FC-PRMS alternative produces a drawdown of the Neversink pool in advance of the event. This drawdown is primarily caused by the estimated diversion operations used in the FC-PRMS alternative and can be seen in Figure 5.22 through Figure 5.24. Following the Neversink Reservoir plots, Figure 5.25 through Figure 5.27, show plots of the Neversink diversion, were added to illustrate the difference in the operation of the diversion between the two alternatives.
Figure 5.22 Neversink Reservoir Plot – 2004 Event
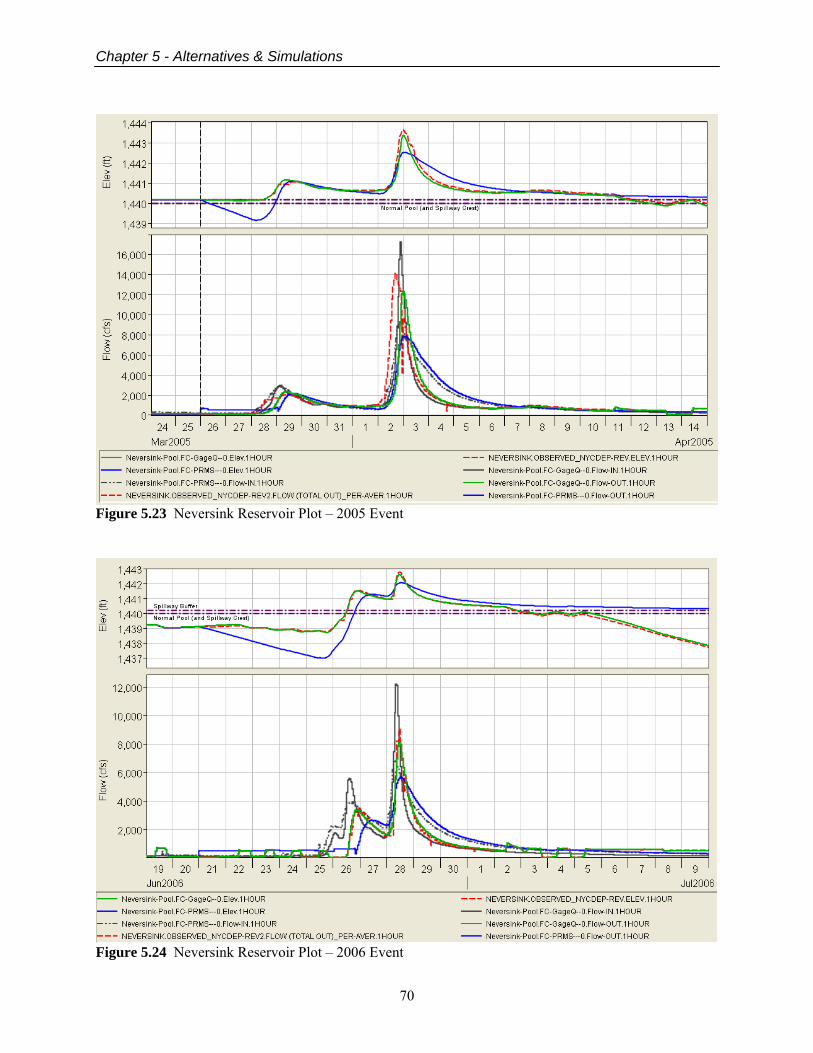
Chapter 5 - Alternatives & Simulations
70
Figure 5.23 Neversink Reservoir Plot – 2005 Event
Figure 5.24 Neversink Reservoir Plot – 2006 Event
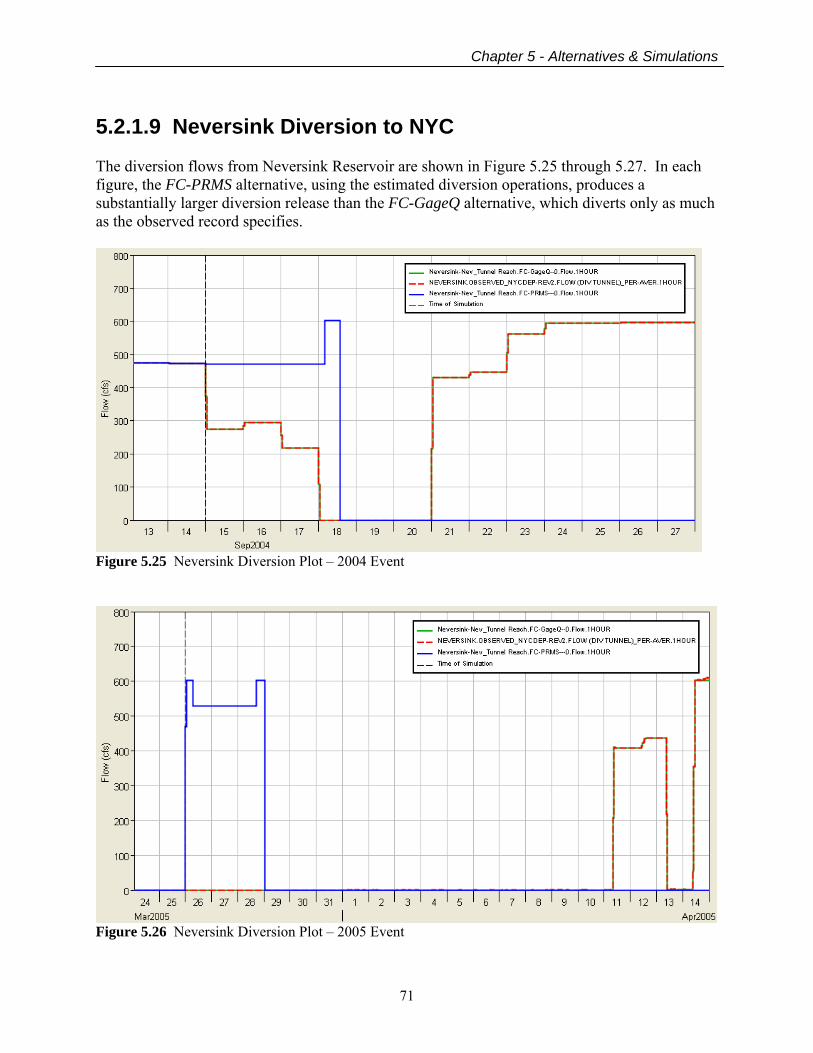
Chapter 5 - Alternatives & Simulations
71
5.2.1.9 Neversink Diversion to NYC The diversion flows from Neversink Reservoir are shown in Figure 5.25 through 5.27. In each figure, the FC-PRMS alternative, using the estimated diversion operations, produces a substantially larger diversion release than the FC-GageQ alternative, which diverts only as much as the observed record specifies.
Figure 5.25 Neversink Diversion Plot – 2004 Event
Figure 5.26 Neversink Diversion Plot – 2005 Event
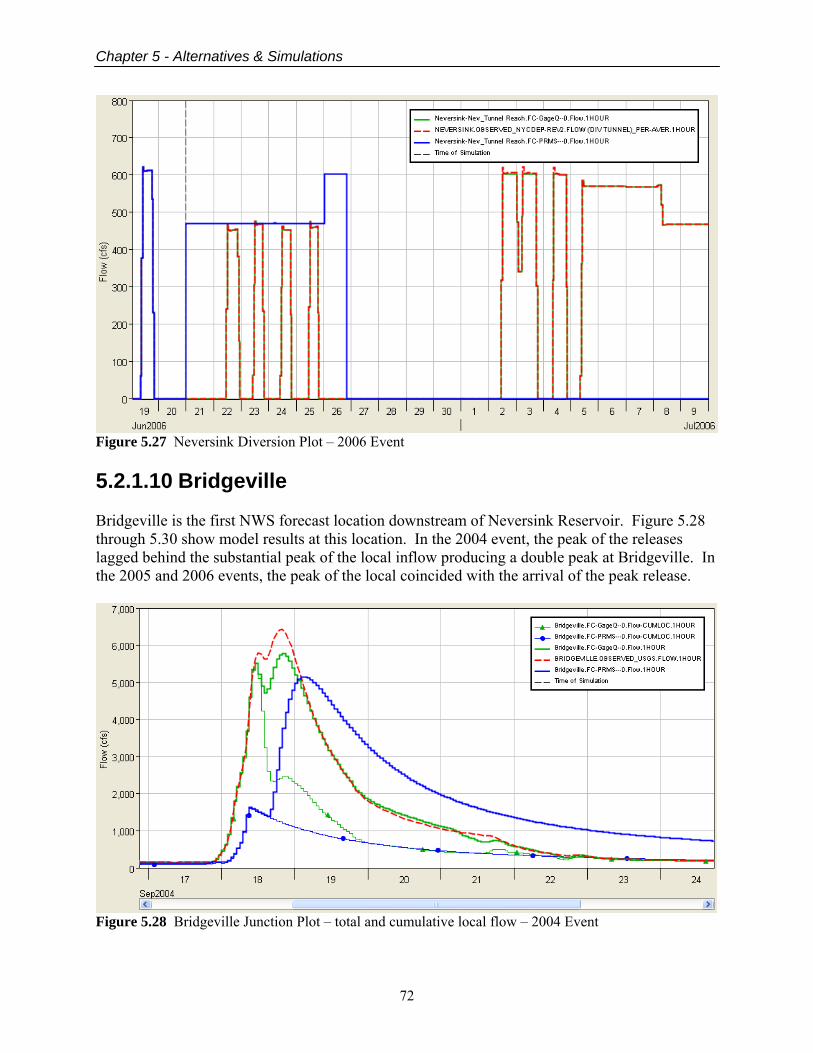
Chapter 5 - Alternatives & Simulations
72
Figure 5.27 Neversink Diversion Plot – 2006 Event 5.2.1.10 Bridgeville Bridgeville is the first NWS forecast location downstream of Neversink Reservoir. Figure 5.28 through 5.30 show model results at this location. In the 2004 event, the peak of the releases lagged behind the substantial peak of the local inflow producing a double peak at Bridgeville. In the 2005 and 2006 events, the peak of the local coincided with the arrival of the peak release.
Figure 5.28 Bridgeville Junction Plot – total and cumulative local flow – 2004 Event
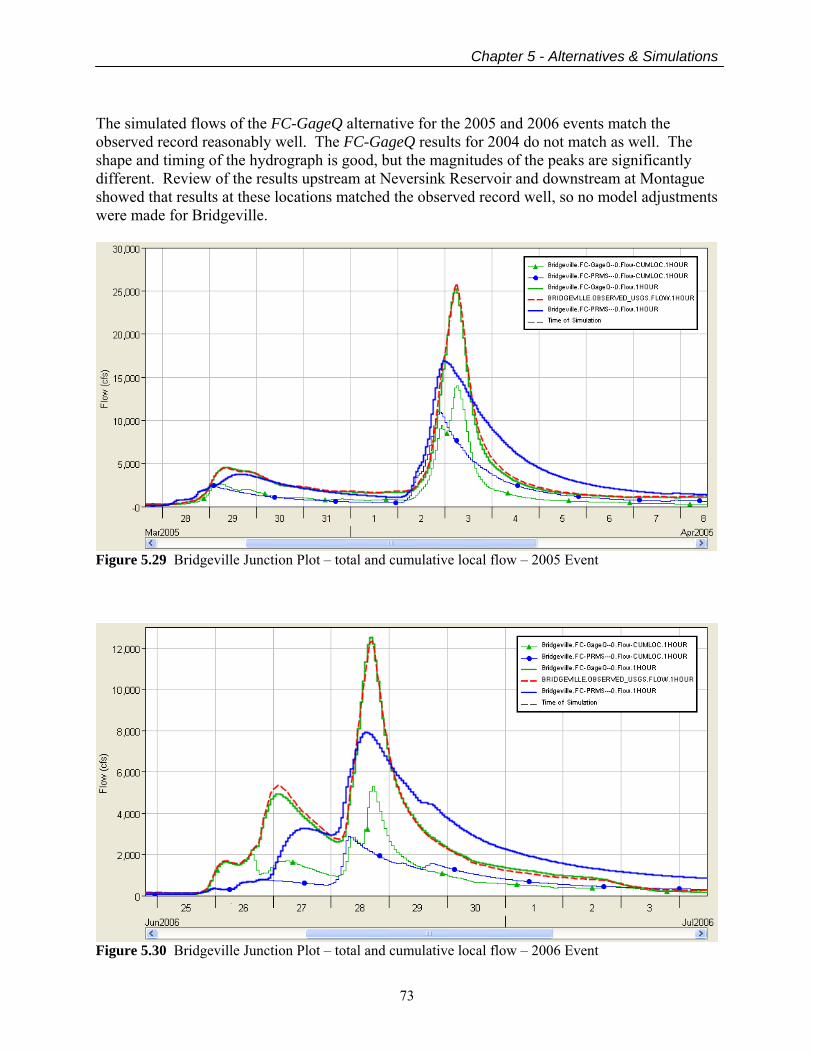
Chapter 5 - Alternatives & Simulations
73
The simulated flows of the FC-GageQ alternative for the 2005 and 2006 events match the observed record reasonably well. The FC-GageQ results for 2004 do not match as well. The shape and timing of the hydrograph is good, but the magnitudes of the peaks are significantly different. Review of the results upstream at Neversink Reservoir and downstream at Montague showed that results at these locations matched the observed record well, so no model adjustments were made for Bridgeville.
Figure 5.29 Bridgeville Junction Plot – total and cumulative local flow – 2005 Event
Figure 5.30 Bridgeville Junction Plot – total and cumulative local flow – 2006 Event
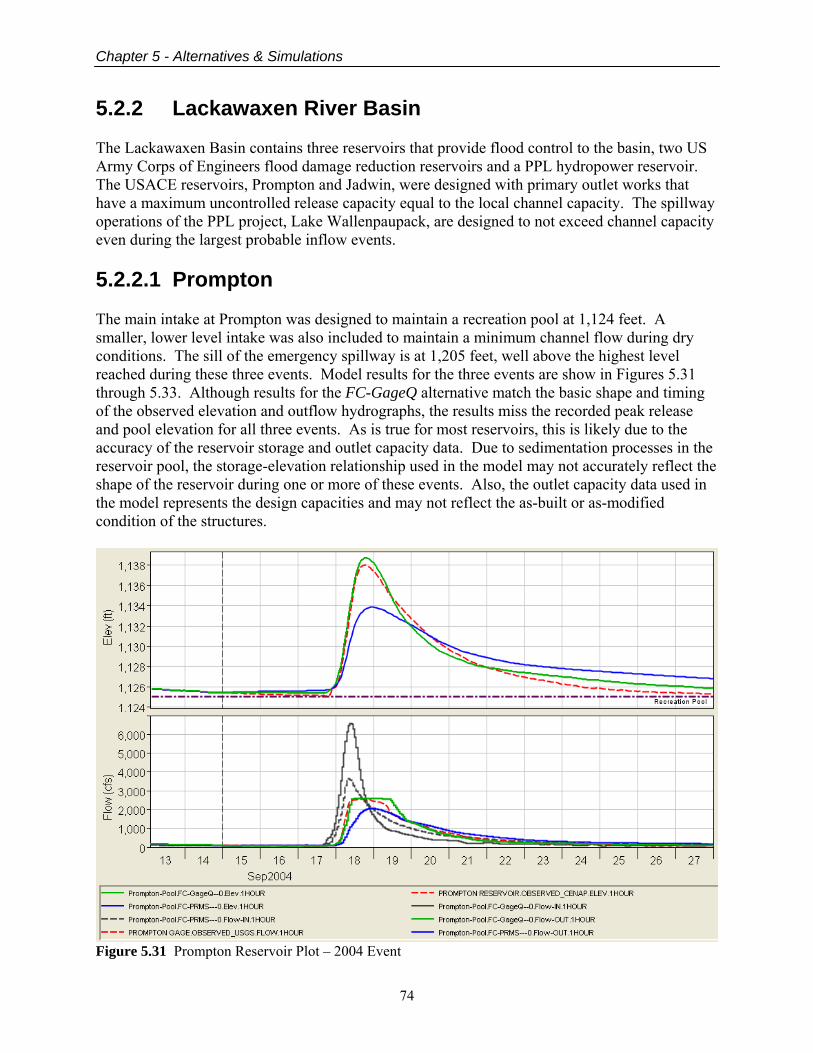
Chapter 5 - Alternatives & Simulations
74
5.2.2 Lackawaxen River Basin The Lackawaxen Basin contains three reservoirs that provide flood control to the basin, two US Army Corps of Engineers flood damage reduction reservoirs and a PPL hydropower reservoir. The USACE reservoirs, Prompton and Jadwin, were designed with primary outlet works that have a maximum uncontrolled release capacity equal to the local channel capacity. The spillway operations of the PPL project, Lake Wallenpaupack, are designed to not exceed channel capacity even during the largest probable inflow events. 5.2.2.1 Prompton The main intake at Prompton was designed to maintain a recreation pool at 1,124 feet. A smaller, lower level intake was also included to maintain a minimum channel flow during dry conditions. The sill of the emergency spillway is at 1,205 feet, well above the highest level reached during these three events. Model results for the three events are show in Figures 5.31 through 5.33. Although results for the FC-GageQ alternative match the basic shape and timing of the observed elevation and outflow hydrographs, the results miss the recorded peak release and pool elevation for all three events. As is true for most reservoirs, this is likely due to the accuracy of the reservoir storage and outlet capacity data. Due to sedimentation processes in the reservoir pool, the storage-elevation relationship used in the model may not accurately reflect the shape of the reservoir during one or more of these events. Also, the outlet capacity data used in the model represents the design capacities and may not reflect the as-built or as-modified condition of the structures.
Figure 5.31 Prompton Reservoir Plot – 2004 Event
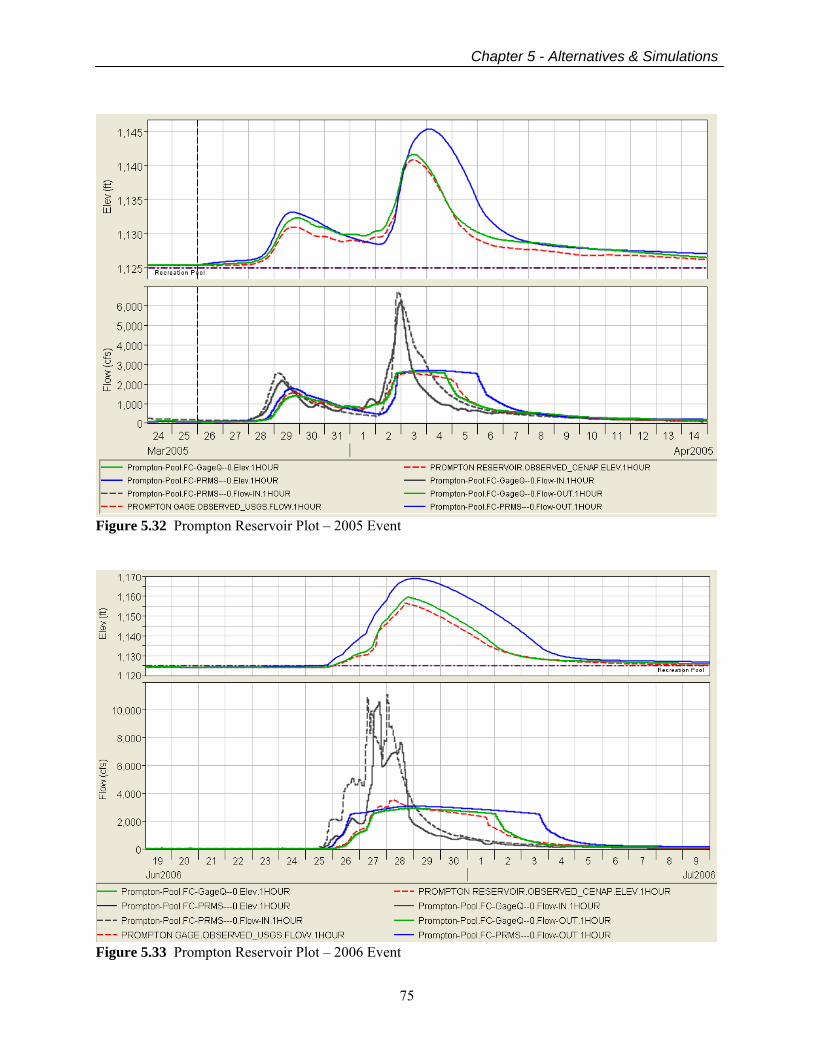
Chapter 5 - Alternatives & Simulations
75
Figure 5.32 Prompton Reservoir Plot – 2005 Event
Figure 5.33 Prompton Reservoir Plot – 2006 Event
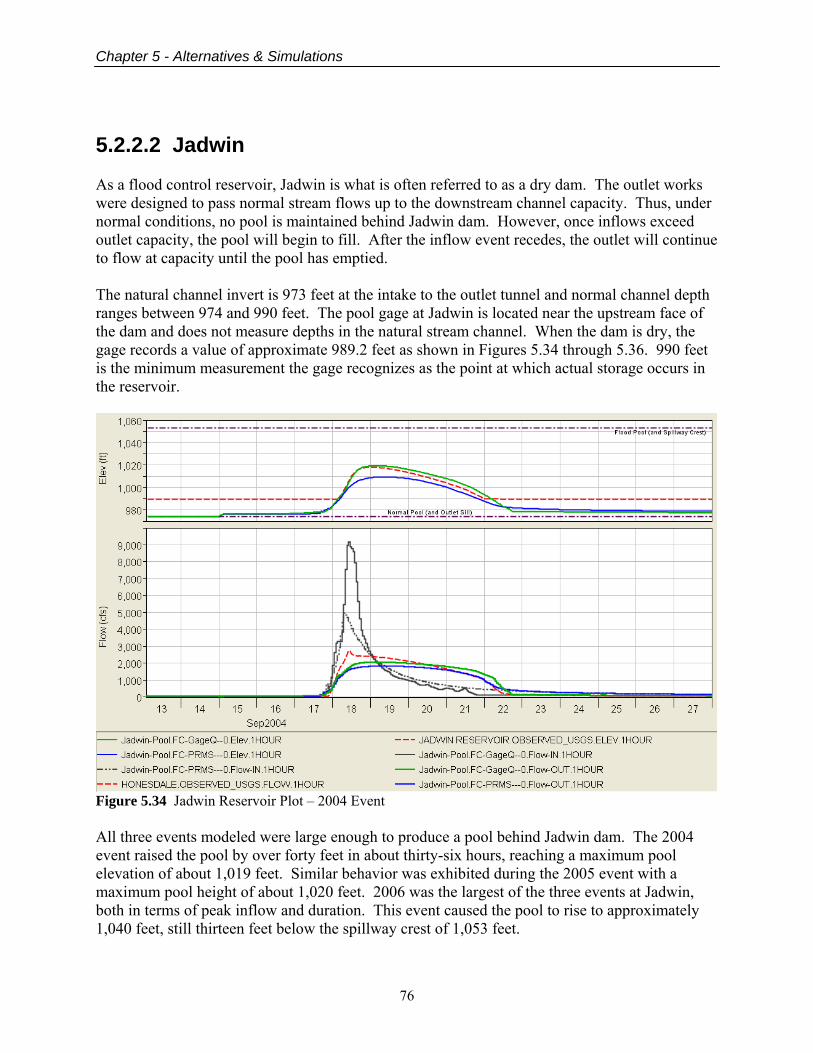
Chapter 5 - Alternatives & Simulations
76
5.2.2.2 Jadwin As a flood control reservoir, Jadwin is what is often referred to as a dry dam. The outlet works were designed to pass normal stream flows up to the downstream channel capacity. Thus, under normal conditions, no pool is maintained behind Jadwin dam. However, once inflows exceed outlet capacity, the pool will begin to fill. After the inflow event recedes, the outlet will continue to flow at capacity until the pool has emptied. The natural channel invert is 973 feet at the intake to the outlet tunnel and normal channel depth ranges between 974 and 990 feet. The pool gage at Jadwin is located near the upstream face of the dam and does not measure depths in the natural stream channel. When the dam is dry, the gage records a value of approximate 989.2 feet as shown in Figures 5.34 through 5.36. 990 feet is the minimum measurement the gage recognizes as the point at which actual storage occurs in the reservoir.
Figure 5.34 Jadwin Reservoir Plot – 2004 Event All three events modeled were large enough to produce a pool behind Jadwin dam. The 2004 event raised the pool by over forty feet in about thirty-six hours, reaching a maximum pool elevation of about 1,019 feet. Similar behavior was exhibited during the 2005 event with a maximum pool height of about 1,020 feet. 2006 was the largest of the three events at Jadwin, both in terms of peak inflow and duration. This event caused the pool to rise to approximately 1,040 feet, still thirteen feet below the spillway crest of 1,053 feet.
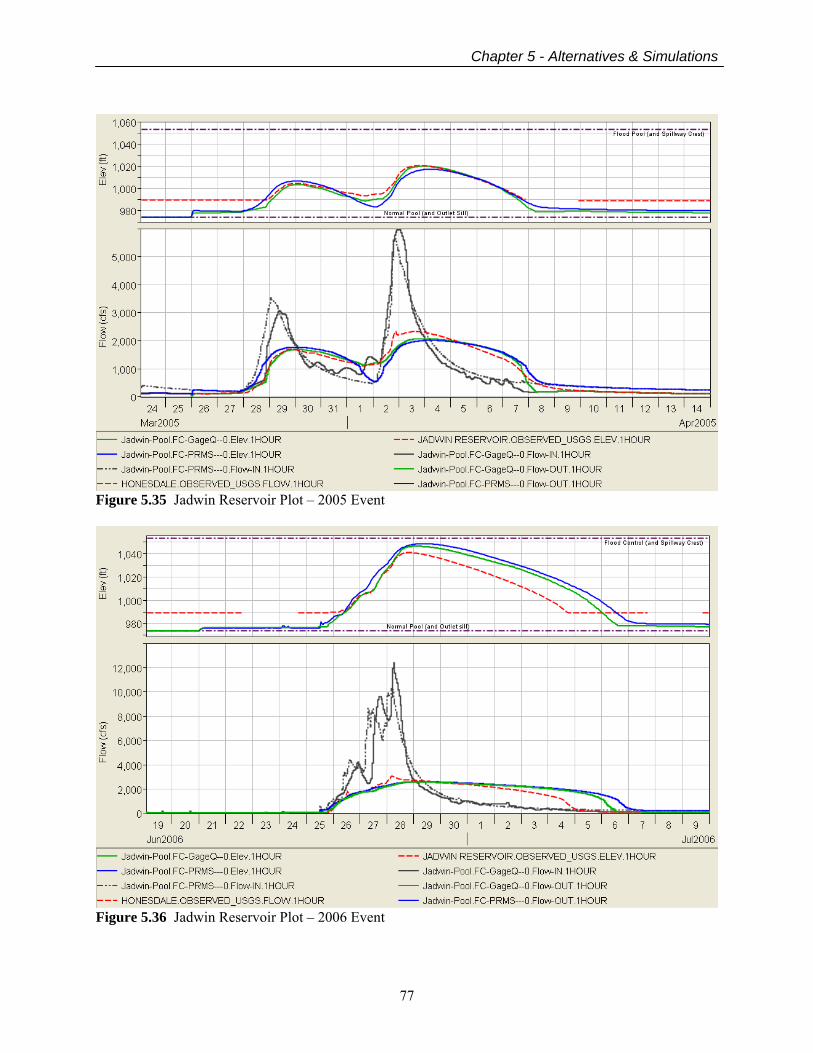
Chapter 5 - Alternatives & Simulations
77
Figure 5.35 Jadwin Reservoir Plot – 2005 Event
Figure 5.36 Jadwin Reservoir Plot – 2006 Event
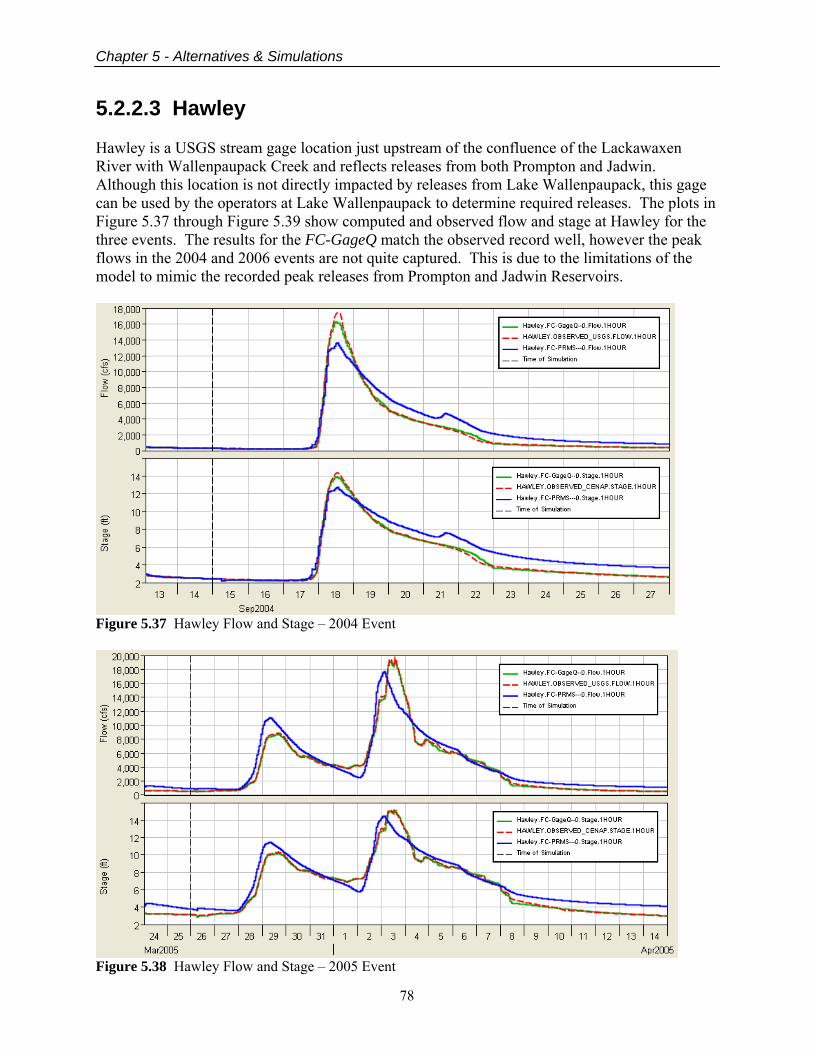
Chapter 5 - Alternatives & Simulations
78
5.2.2.3 Hawley Hawley is a USGS stream gage location just upstream of the confluence of the Lackawaxen River with Wallenpaupack Creek and reflects releases from both Prompton and Jadwin. Although this location is not directly impacted by releases from Lake Wallenpaupack, this gage can be used by the operators at Lake Wallenpaupack to determine required releases. The plots in Figure 5.37 through Figure 5.39 show computed and observed flow and stage at Hawley for the three events. The results for the FC-GageQ match the observed record well, however the peak flows in the 2004 and 2006 events are not quite captured. This is due to the limitations of the model to mimic the recorded peak releases from Prompton and Jadwin Reservoirs.
Figure 5.37 Hawley Flow and Stage – 2004 Event
Figure 5.38 Hawley Flow and Stage – 2005 Event
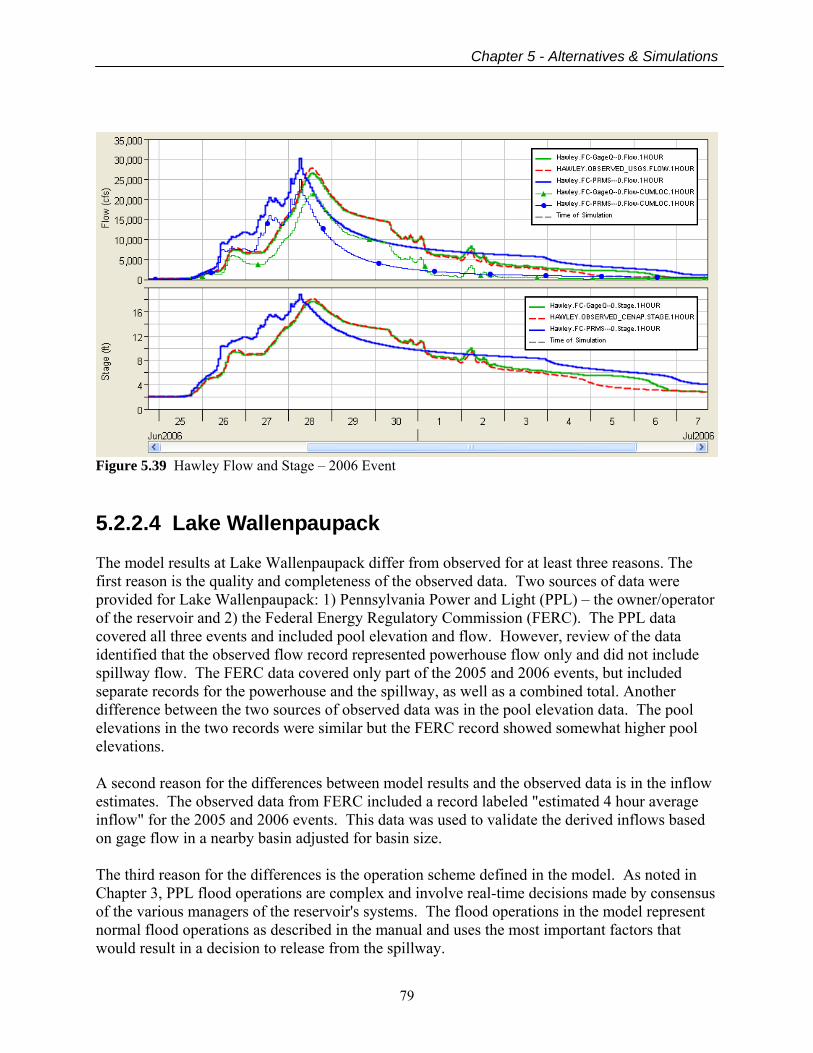
Chapter 5 - Alternatives & Simulations
79
Figure 5.39 Hawley Flow and Stage – 2006 Event 5.2.2.4 Lake Wallenpaupack The model results at Lake Wallenpaupack differ from observed for at least three reasons. The first reason is the quality and completeness of the observed data. Two sources of data were provided for Lake Wallenpaupack: 1) Pennsylvania Power and Light (PPL) – the owner/operator of the reservoir and 2) the Federal Energy Regulatory Commission (FERC). The PPL data covered all three events and included pool elevation and flow. However, review of the data identified that the observed flow record represented powerhouse flow only and did not include spillway flow. The FERC data covered only part of the 2005 and 2006 events, but included separate records for the powerhouse and the spillway, as well as a combined total. Another difference between the two sources of observed data was in the pool elevation data. The pool elevations in the two records were similar but the FERC record showed somewhat higher pool elevations. A second reason for the differences between model results and the observed data is in the inflow estimates. The observed data from FERC included a record labeled "estimated 4 hour average inflow" for the 2005 and 2006 events. This data was used to validate the derived inflows based on gage flow in a nearby basin adjusted for basin size. The third reason for the differences is the operation scheme defined in the model. As noted in Chapter 3, PPL flood operations are complex and involve real-time decisions made by consensus of the various managers of the reservoir's systems. The flood operations in the model represent normal flood operations as described in the manual and uses the most important factors that would result in a decision to release from the spillway.
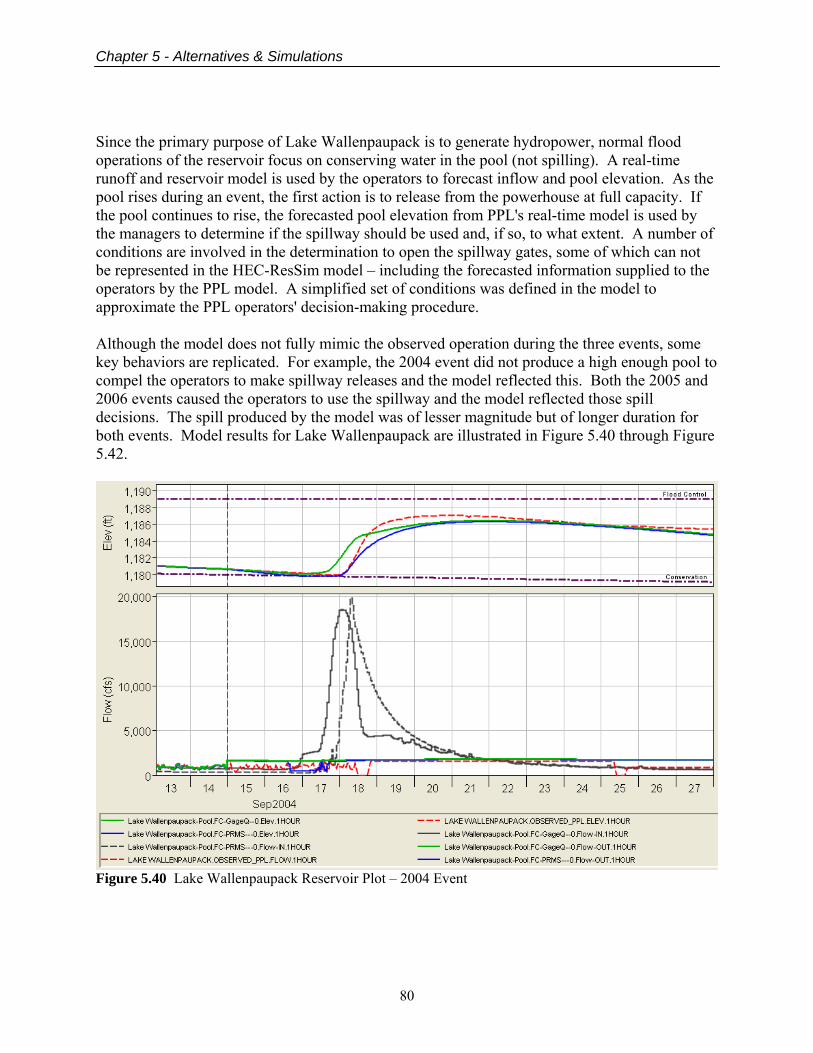
Chapter 5 - Alternatives & Simulations
80
Since the primary purpose of Lake Wallenpaupack is to generate hydropower, normal flood operations of the reservoir focus on conserving water in the pool (not spilling). A real-time runoff and reservoir model is used by the operators to forecast inflow and pool elevation. As the pool rises during an event, the first action is to release from the powerhouse at full capacity. If the pool continues to rise, the forecasted pool elevation from PPL's real-time model is used by the managers to determine if the spillway should be used and, if so, to what extent. A number of conditions are involved in the determination to open the spillway gates, some of which can not be represented in the HEC-ResSim model – including the forecasted information supplied to the operators by the PPL model. A simplified set of conditions was defined in the model to approximate the PPL operators' decision-making procedure. Although the model does not fully mimic the observed operation during the three events, some key behaviors are replicated. For example, the 2004 event did not produce a high enough pool to compel the operators to make spillway releases and the model reflected this. Both the 2005 and 2006 events caused the operators to use the spillway and the model reflected those spill decisions. The spill produced by the model was of lesser magnitude but of longer duration for both events. Model results for Lake Wallenpaupack are illustrated in Figure 5.40 through Figure 5.42.
Figure 5.40 Lake Wallenpaupack Reservoir Plot – 2004 Event

Chapter 5 - Alternatives & Simulations
81
Figure 5.41 Lake Wallenpaupack Reservoir Plot – 2005 Event
Figure 5.42 Lake Wallenpaupack Reservoir Plot – 2006 Event
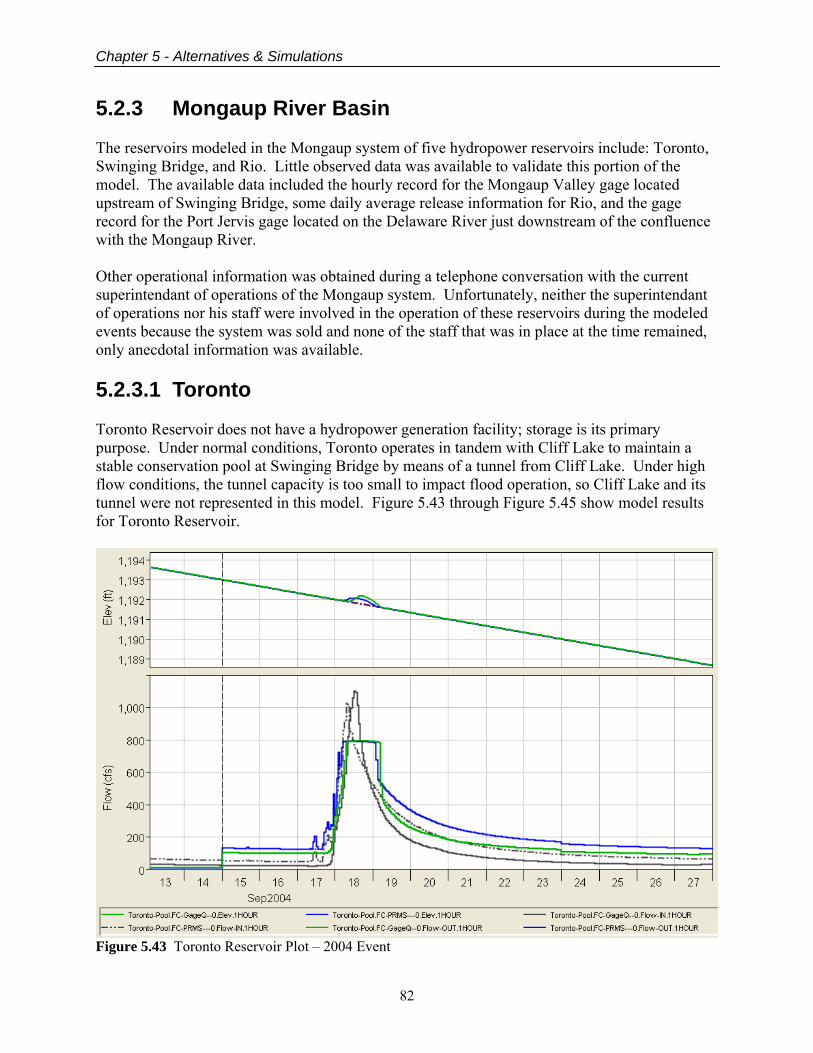
Chapter 5 - Alternatives & Simulations
82
5.2.3 Mongaup River Basin The reservoirs modeled in the Mongaup system of five hydropower reservoirs include: Toronto, Swinging Bridge, and Rio. Little observed data was available to validate this portion of the model. The available data included the hourly record for the Mongaup Valley gage located upstream of Swinging Bridge, some daily average release information for Rio, and the gage record for the Port Jervis gage located on the Delaware River just downstream of the confluence with the Mongaup River. Other operational information was obtained during a telephone conversation with the current superintendant of operations of the Mongaup system. Unfortunately, neither the superintendant of operations nor his staff were involved in the operation of these reservoirs during the modeled events because the system was sold and none of the staff that was in place at the time remained, only anecdotal information was available. 5.2.3.1 Toronto Toronto Reservoir does not have a hydropower generation facility; storage is its primary purpose. Under normal conditions, Toronto operates in tandem with Cliff Lake to maintain a stable conservation pool at Swinging Bridge by means of a tunnel from Cliff Lake. Under high flow conditions, the tunnel capacity is too small to impact flood operation, so Cliff Lake and its tunnel were not represented in this model. Figure 5.43 through Figure 5.45 show model results for Toronto Reservoir.
Figure 5.43 Toronto Reservoir Plot – 2004 Event
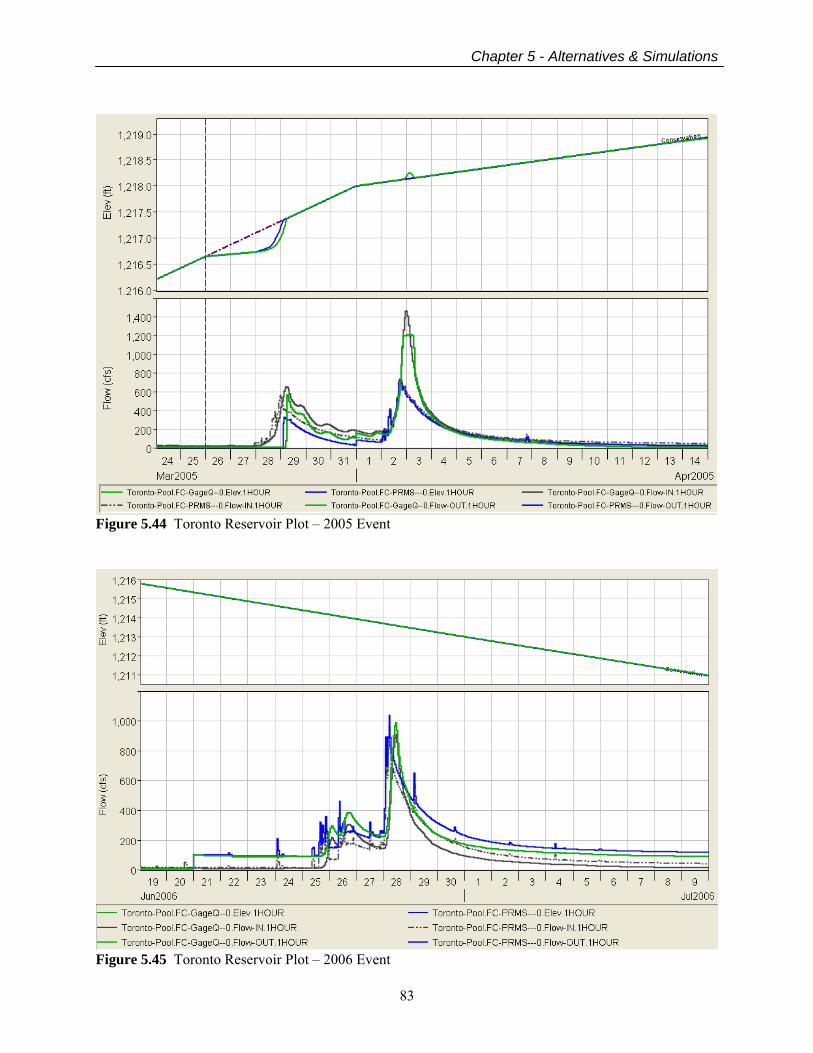
Chapter 5 - Alternatives & Simulations
83
Figure 5.44 Toronto Reservoir Plot – 2005 Event
Figure 5.45 Toronto Reservoir Plot – 2006 Event
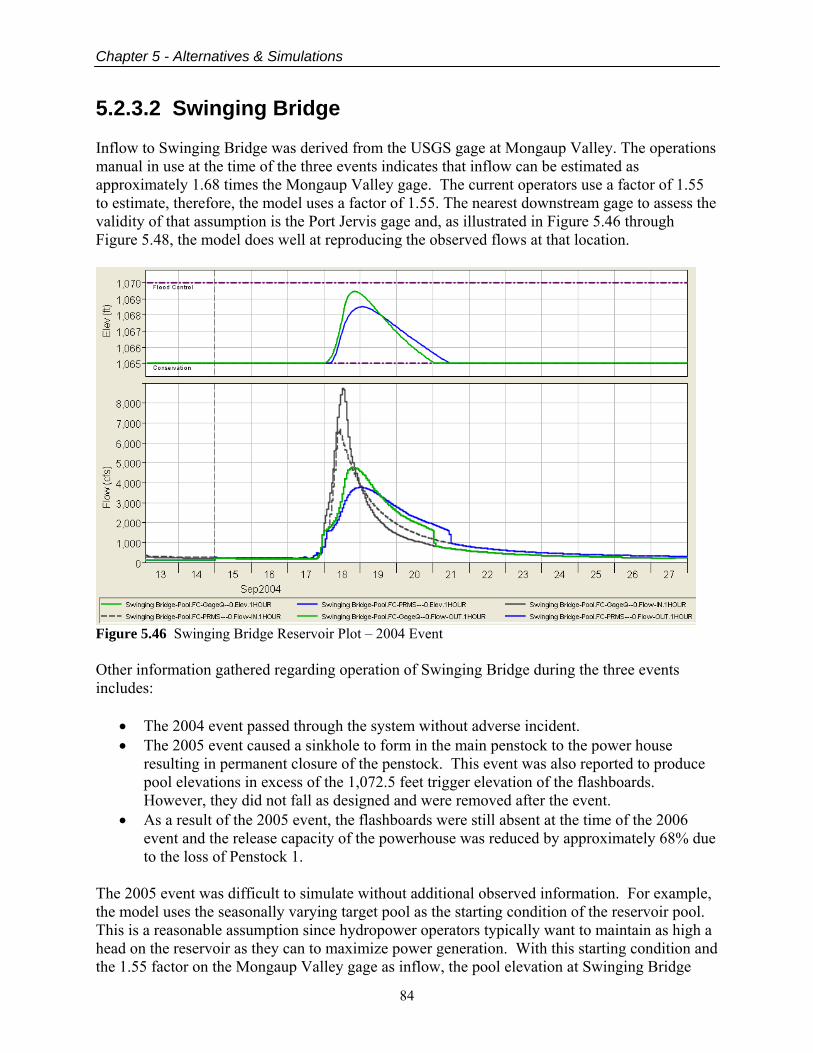
Chapter 5 - Alternatives & Simulations
84
5.2.3.2 Swinging Bridge Inflow to Swinging Bridge was derived from the USGS gage at Mongaup Valley. The operations manual in use at the time of the three events indicates that inflow can be estimated as approximately 1.68 times the Mongaup Valley gage. The current operators use a factor of 1.55 to estimate, therefore, the model uses a factor of 1.55. The nearest downstream gage to assess the validity of that assumption is the Port Jervis gage and, as illustrated in Figure 5.46 through Figure 5.48, the model does well at reproducing the observed flows at that location.
Figure 5.46 Swinging Bridge Reservoir Plot – 2004 Event Other information gathered regarding operation of Swinging Bridge during the three events includes:
• The 2004 event passed through the system without adverse incident. • The 2005 event caused a sinkhole to form in the main penstock to the power house
resulting in permanent closure of the penstock. This event was also reported to produce pool elevations in excess of the 1,072.5 feet trigger elevation of the flashboards. However, they did not fall as designed and were removed after the event.
• As a result of the 2005 event, the flashboards were still absent at the time of the 2006 event and the release capacity of the powerhouse was reduced by approximately 68% due to the loss of Penstock 1.
The 2005 event was difficult to simulate without additional observed information. For example, the model uses the seasonally varying target pool as the starting condition of the reservoir pool. This is a reasonable assumption since hydropower operators typically want to maintain as high a head on the reservoir as they can to maximize power generation. With this starting condition and the 1.55 factor on the Mongaup Valley gage as inflow, the pool elevation at Swinging Bridge
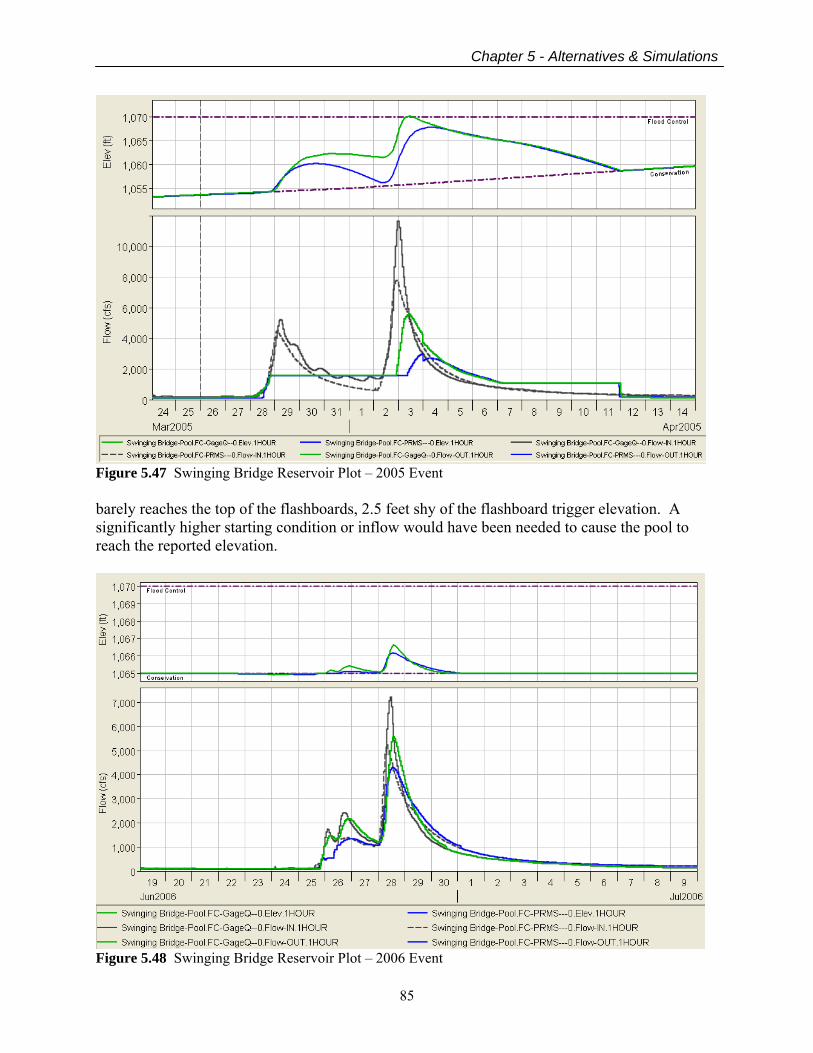
Chapter 5 - Alternatives & Simulations
85
Figure 5.47 Swinging Bridge Reservoir Plot – 2005 Event barely reaches the top of the flashboards, 2.5 feet shy of the flashboard trigger elevation. A significantly higher starting condition or inflow would have been needed to cause the pool to reach the reported elevation.
Figure 5.48 Swinging Bridge Reservoir Plot – 2006 Event

Chapter 5 - Alternatives & Simulations
86
5.2.3.3 Rio As with Swinging Bridge, the 2004 event passed through Rio Reservoir without incident. Figure 5.49 shows the model results at Rio for the 2004 event.
Figure 5.49 Rio Reservoir Plot – 2004 Event The 2005 event was reported to produce pool elevations in excess of the flashboard trigger elevation of 818 feet, but the flashboards did not fa1l as designed here, either. Using the seasonally varying target pool elevation as a starting condition, the peak pool elevation reached
Figure 5.50 Rio Reservoir Plot – 2005 Event
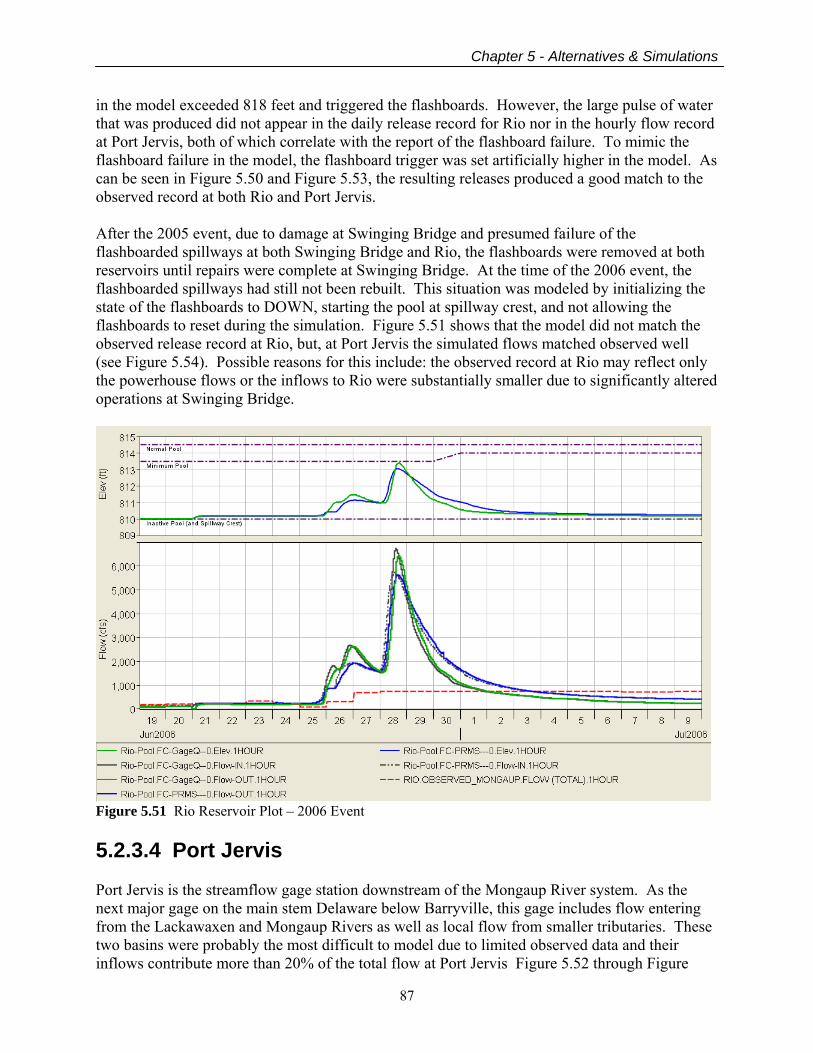
Chapter 5 - Alternatives & Simulations
87
in the model exceeded 818 feet and triggered the flashboards. However, the large pulse of water that was produced did not appear in the daily release record for Rio nor in the hourly flow record at Port Jervis, both of which correlate with the report of the flashboard failure. To mimic the flashboard failure in the model, the flashboard trigger was set artificially higher in the model. As can be seen in Figure 5.50 and Figure 5.53, the resulting releases produced a good match to the observed record at both Rio and Port Jervis. After the 2005 event, due to damage at Swinging Bridge and presumed failure of the flashboarded spillways at both Swinging Bridge and Rio, the flashboards were removed at both reservoirs until repairs were complete at Swinging Bridge. At the time of the 2006 event, the flashboarded spillways had still not been rebuilt. This situation was modeled by initializing the state of the flashboards to DOWN, starting the pool at spillway crest, and not allowing the flashboards to reset during the simulation. Figure 5.51 shows that the model did not match the observed release record at Rio, but, at Port Jervis the simulated flows matched observed well (see Figure 5.54). Possible reasons for this include: the observed record at Rio may reflect only the powerhouse flows or the inflows to Rio were substantially smaller due to significantly altered operations at Swinging Bridge.
Figure 5.51 Rio Reservoir Plot – 2006 Event 5.2.3.4 Port Jervis Port Jervis is the streamflow gage station downstream of the Mongaup River system. As the next major gage on the main stem Delaware below Barryville, this gage includes flow entering from the Lackawaxen and Mongaup Rivers as well as local flow from smaller tributaries. These two basins were probably the most difficult to model due to limited observed data and their inflows contribute more than 20% of the total flow at Port Jervis Figure 5.52 through Figure
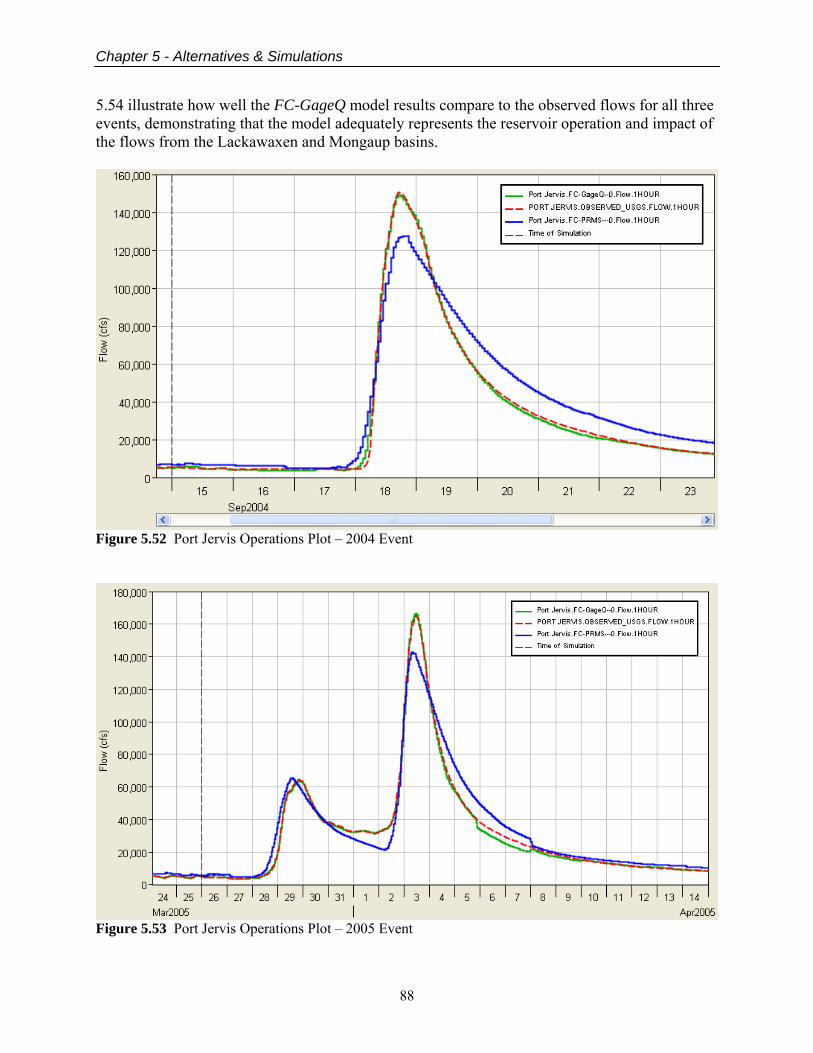
Chapter 5 - Alternatives & Simulations
88
5.54 illustrate how well the FC-GageQ model results compare to the observed flows for all three events, demonstrating that the model adequately represents the reservoir operation and impact of the flows from the Lackawaxen and Mongaup basins.
Figure 5.52 Port Jervis Operations Plot – 2004 Event
Figure 5.53 Port Jervis Operations Plot – 2005 Event
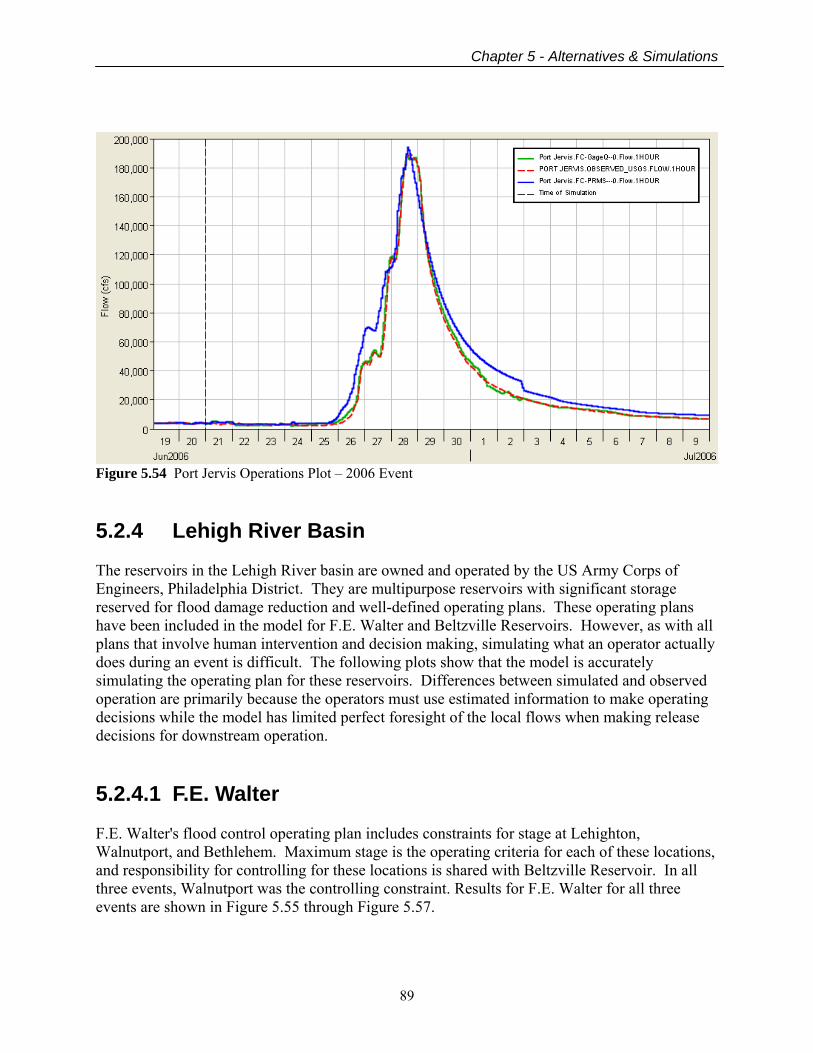
Chapter 5 - Alternatives & Simulations
89
Figure 5.54 Port Jervis Operations Plot – 2006 Event 5.2.4 Lehigh River Basin The reservoirs in the Lehigh River basin are owned and operated by the US Army Corps of Engineers, Philadelphia District. They are multipurpose reservoirs with significant storage reserved for flood damage reduction and well-defined operating plans. These operating plans have been included in the model for F.E. Walter and Beltzville Reservoirs. However, as with all plans that involve human intervention and decision making, simulating what an operator actually does during an event is difficult. The following plots show that the model is accurately simulating the operating plan for these reservoirs. Differences between simulated and observed operation are primarily because the operators must use estimated information to make operating decisions while the model has limited perfect foresight of the local flows when making release decisions for downstream operation. 5.2.4.1 F.E. Walter F.E. Walter's flood control operating plan includes constraints for stage at Lehighton, Walnutport, and Bethlehem. Maximum stage is the operating criteria for each of these locations, and responsibility for controlling for these locations is shared with Beltzville Reservoir. In all three events, Walnutport was the controlling constraint. Results for F.E. Walter for all three events are shown in Figure 5.55 through Figure 5.57.
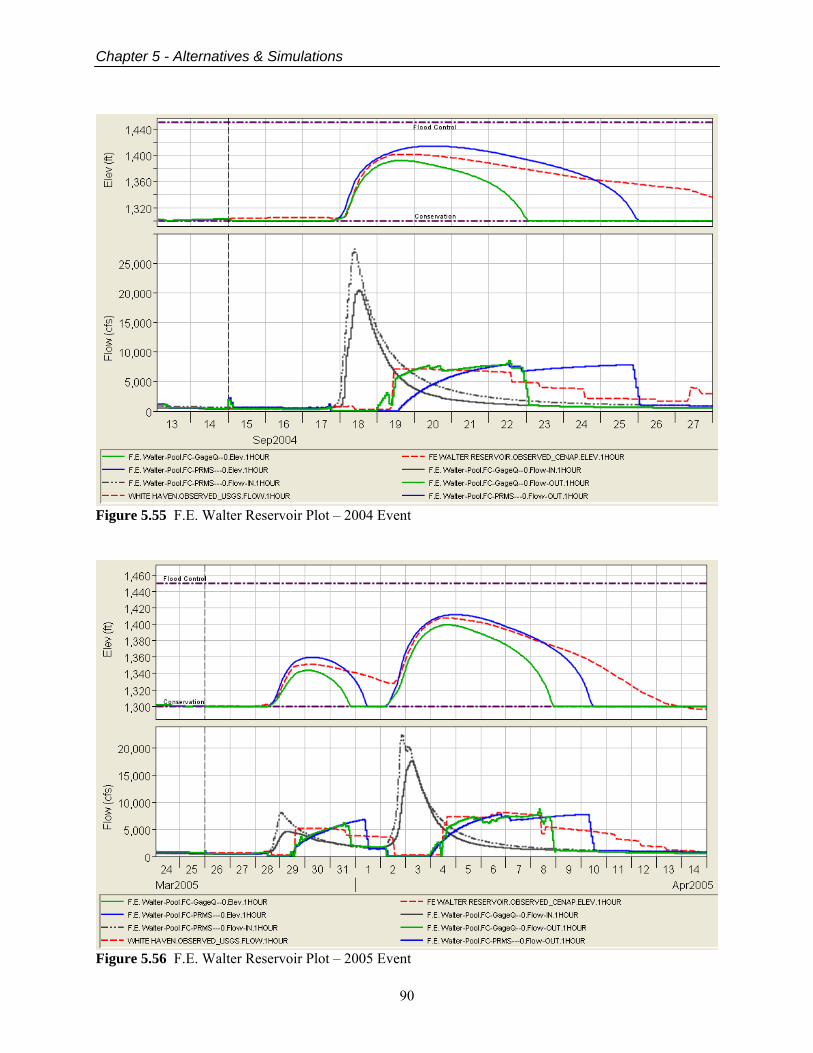
Chapter 5 - Alternatives & Simulations
90
Figure 5.55 F.E. Walter Reservoir Plot – 2004 Event
Figure 5.56 F.E. Walter Reservoir Plot – 2005 Event
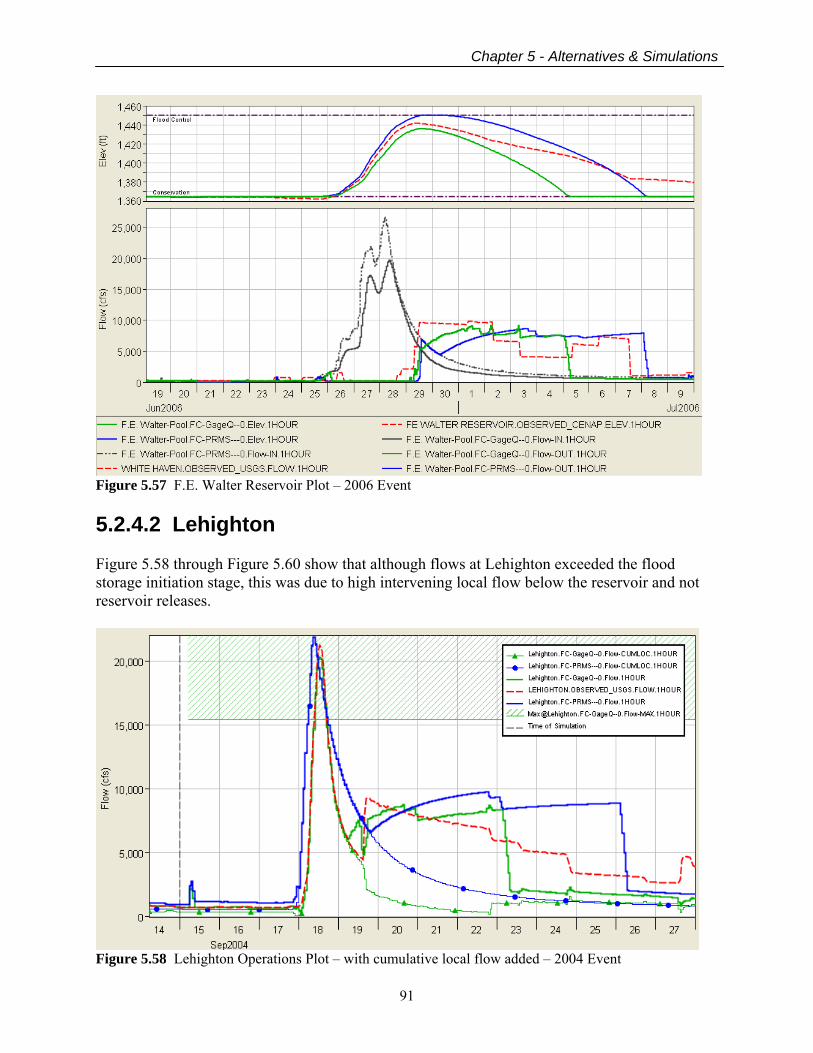
Chapter 5 - Alternatives & Simulations
91
Figure 5.57 F.E. Walter Reservoir Plot – 2006 Event 5.2.4.2 Lehighton Figure 5.58 through Figure 5.60 show that although flows at Lehighton exceeded the flood storage initiation stage, this was due to high intervening local flow below the reservoir and not reservoir releases.
Figure 5.58 Lehighton Operations Plot – with cumulative local flow added – 2004 Event
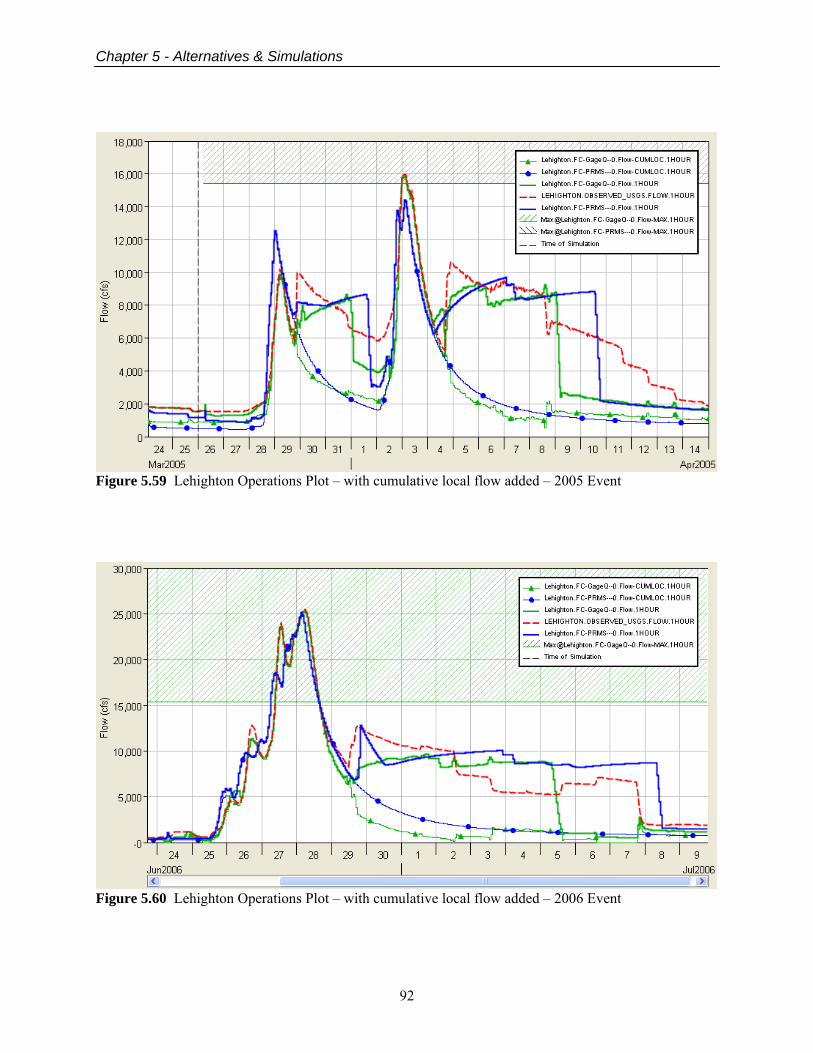
Chapter 5 - Alternatives & Simulations
92
Figure 5.59 Lehighton Operations Plot – with cumulative local flow added – 2005 Event
Figure 5.60 Lehighton Operations Plot – with cumulative local flow added – 2006 Event
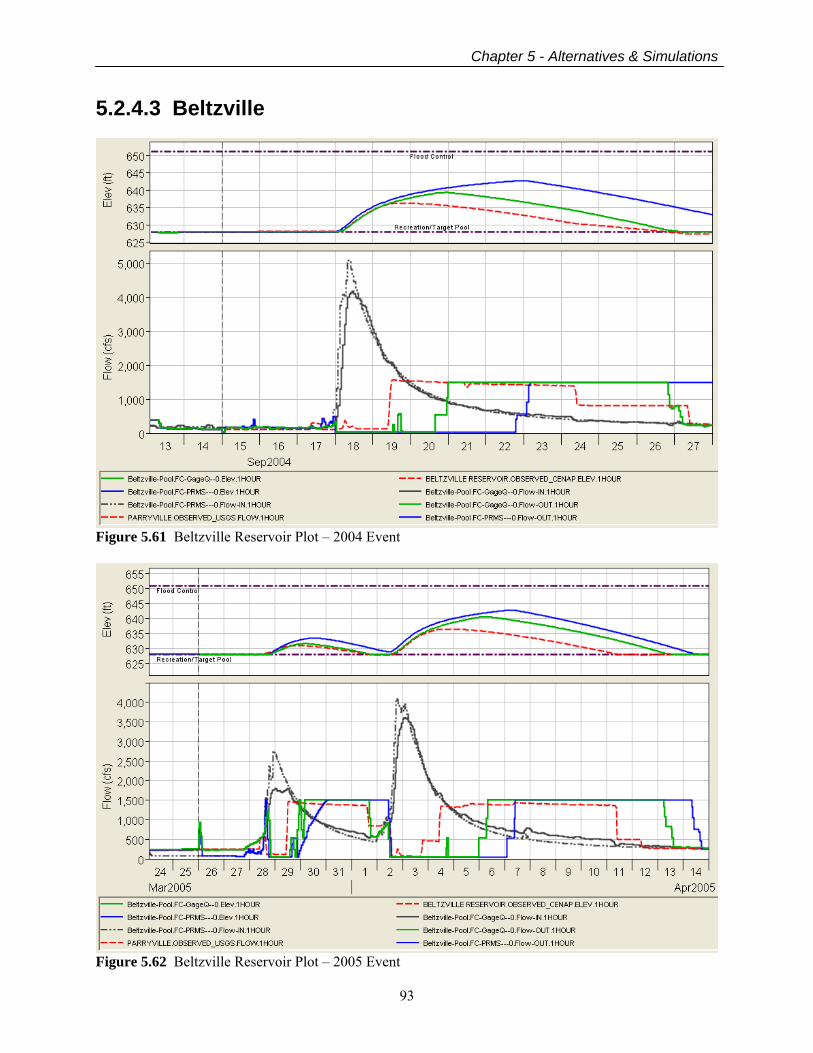
Chapter 5 - Alternatives & Simulations
93
5.2.4.3 Beltzville
Figure 5.61 Beltzville Reservoir Plot – 2004 Event
Figure 5.62 Beltzville Reservoir Plot – 2005 Event
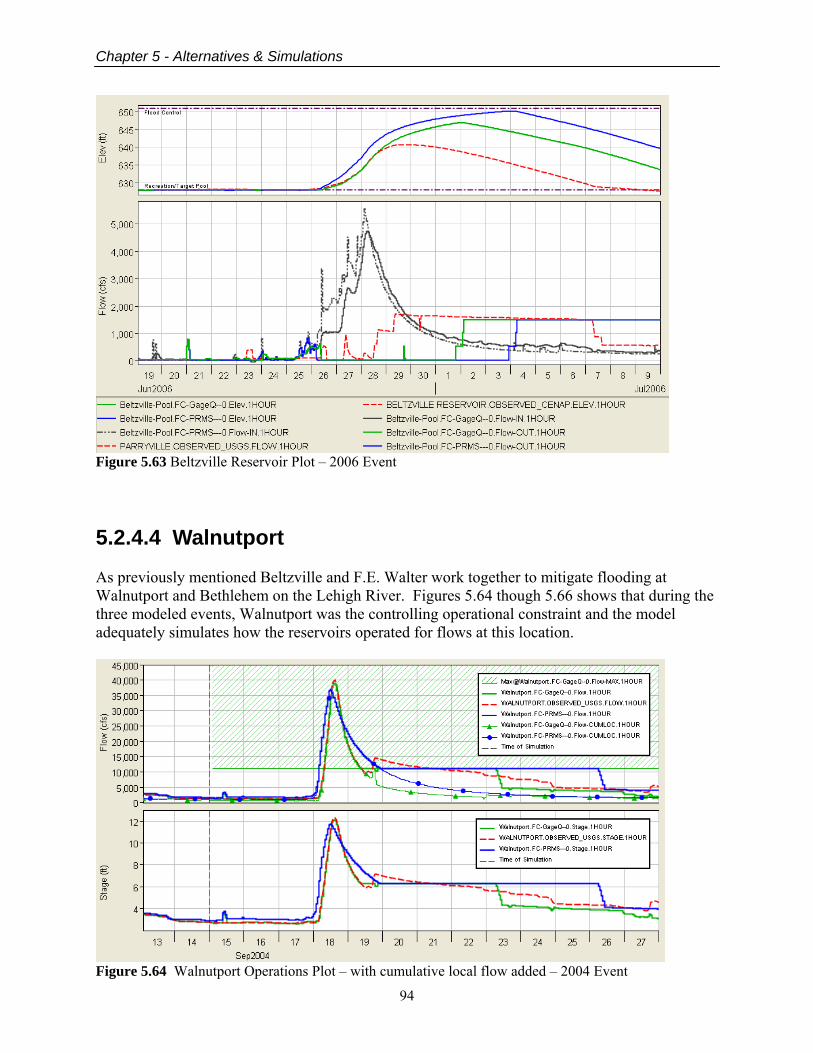
Chapter 5 - Alternatives & Simulations
94
Figure 5.63 Beltzville Reservoir Plot – 2006 Event 5.2.4.4 Walnutport As previously mentioned Beltzville and F.E. Walter work together to mitigate flooding at Walnutport and Bethlehem on the Lehigh River. Figures 5.64 though 5.66 shows that during the three modeled events, Walnutport was the controlling operational constraint and the model adequately simulates how the reservoirs operated for flows at this location.
Figure 5.64 Walnutport Operations Plot – with cumulative local flow added – 2004 Event
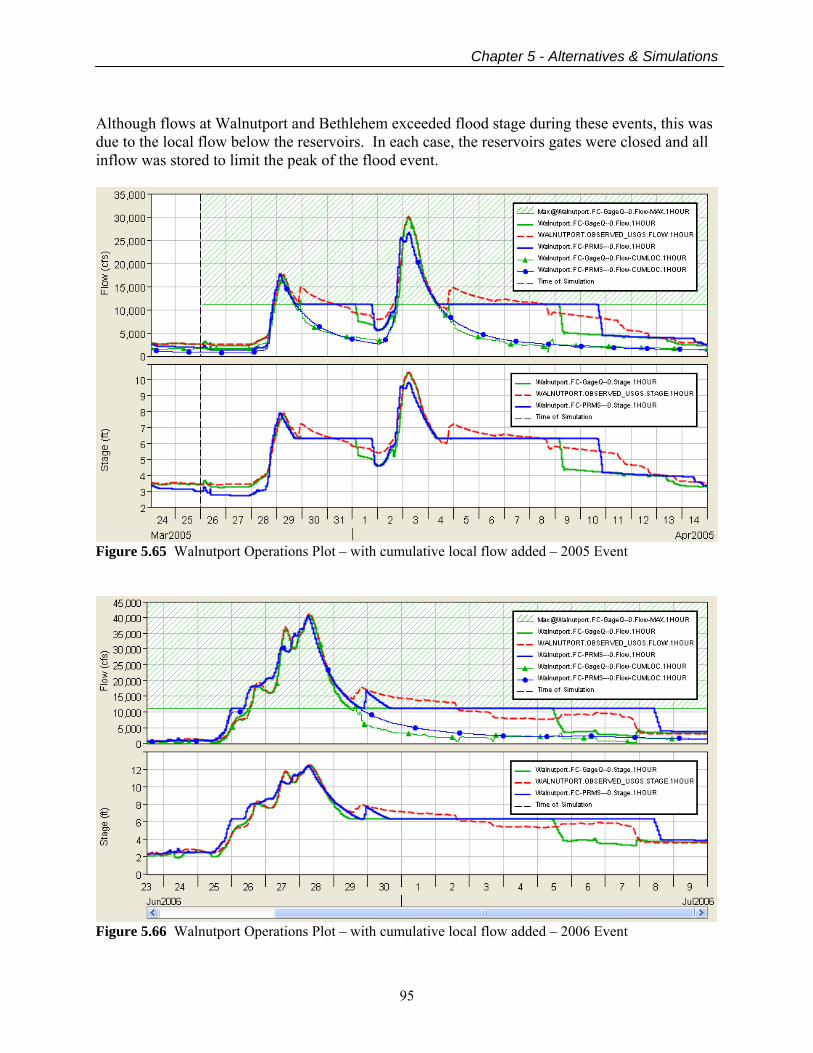
Chapter 5 - Alternatives & Simulations
95
Although flows at Walnutport and Bethlehem exceeded flood stage during these events, this was due to the local flow below the reservoirs. In each case, the reservoirs gates were closed and all inflow was stored to limit the peak of the flood event.
Figure 5.65 Walnutport Operations Plot – with cumulative local flow added – 2005 Event
Figure 5.66 Walnutport Operations Plot – with cumulative local flow added – 2006 Event
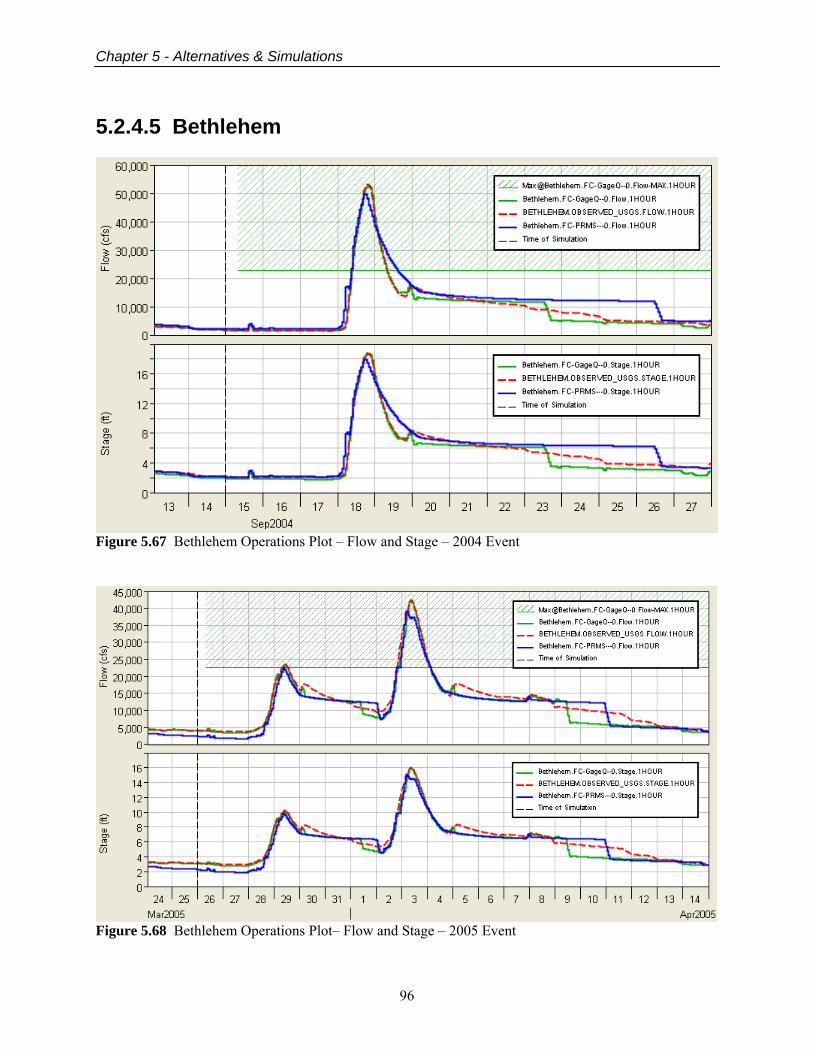
Chapter 5 - Alternatives & Simulations
96
5.2.4.5 Bethlehem
Figure 5.67 Bethlehem Operations Plot – Flow and Stage – 2004 Event
Figure 5.68 Bethlehem Operations Plot– Flow and Stage – 2005 Event
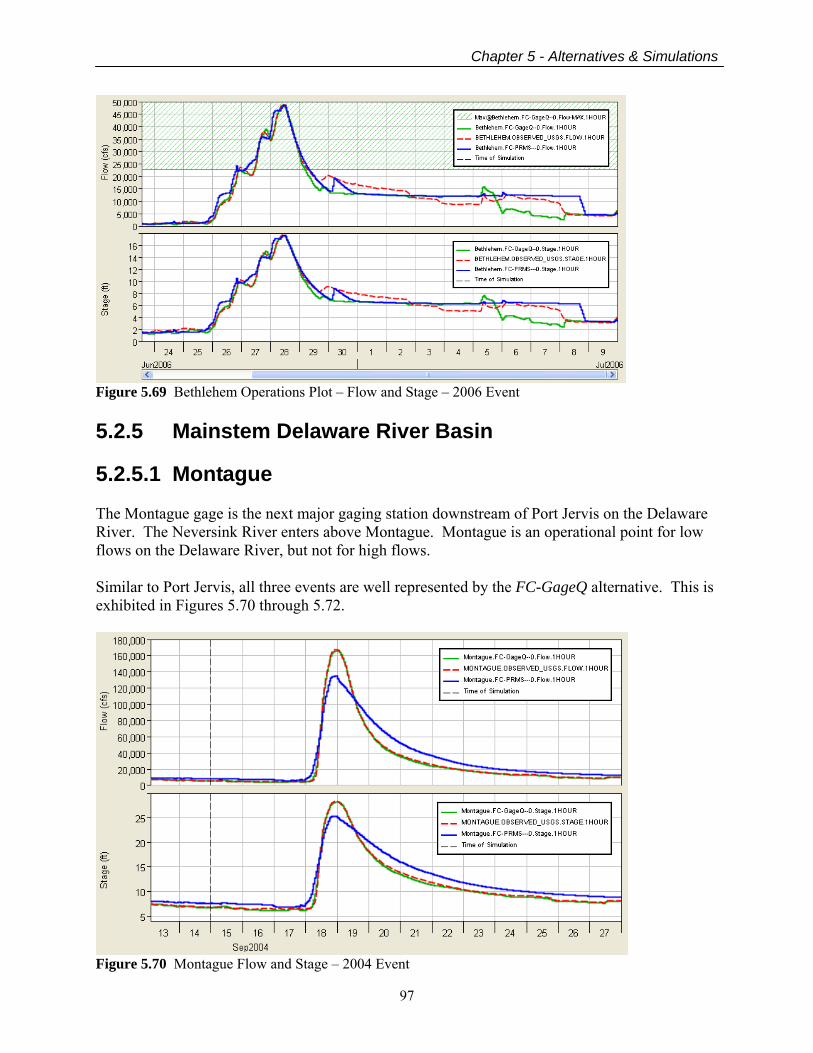
Chapter 5 - Alternatives & Simulations
97
Figure 5.69 Bethlehem Operations Plot – Flow and Stage – 2006 Event 5.2.5 Mainstem Delaware River Basin 5.2.5.1 Montague The Montague gage is the next major gaging station downstream of Port Jervis on the Delaware River. The Neversink River enters above Montague. Montague is an operational point for low flows on the Delaware River, but not for high flows. Similar to Port Jervis, all three events are well represented by the FC-GageQ alternative. This is exhibited in Figures 5.70 through 5.72.
Figure 5.70 Montague Flow and Stage – 2004 Event
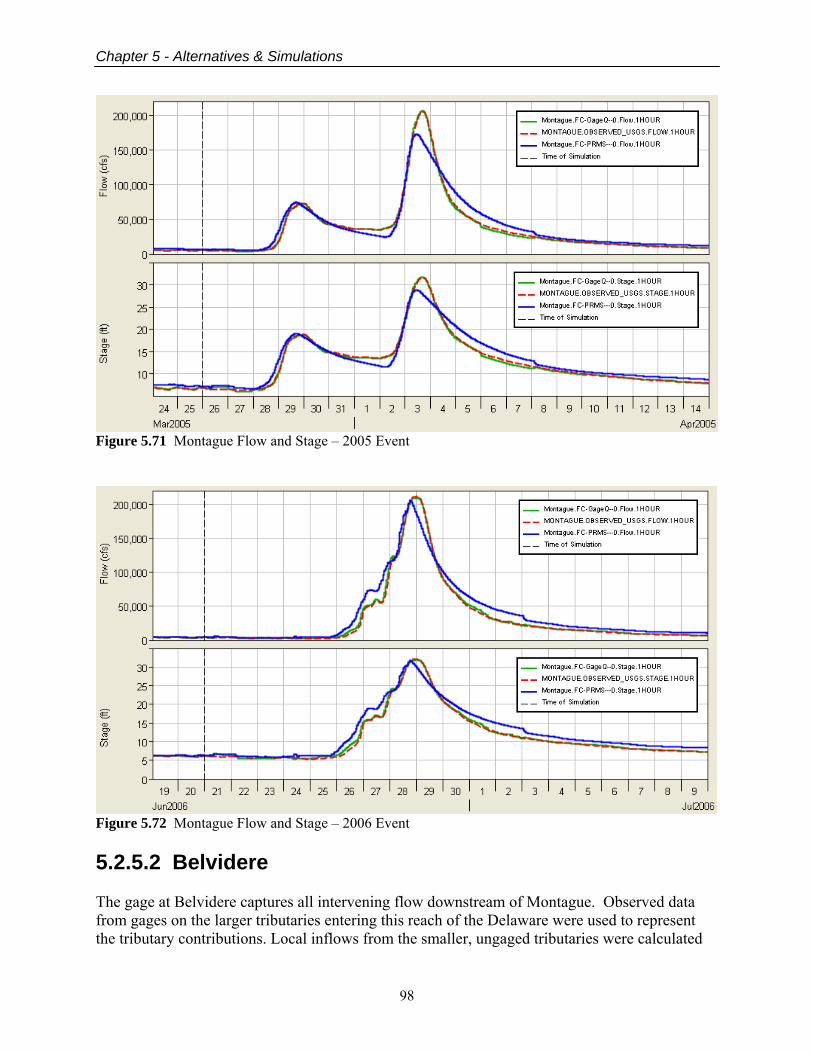
Chapter 5 - Alternatives & Simulations
98
Figure 5.71 Montague Flow and Stage – 2005 Event
Figure 5.72 Montague Flow and Stage – 2006 Event 5.2.5.2 Belvidere The gage at Belvidere captures all intervening flow downstream of Montague. Observed data from gages on the larger tributaries entering this reach of the Delaware were used to represent the tributary contributions. Local inflows from the smaller, ungaged tributaries were calculated
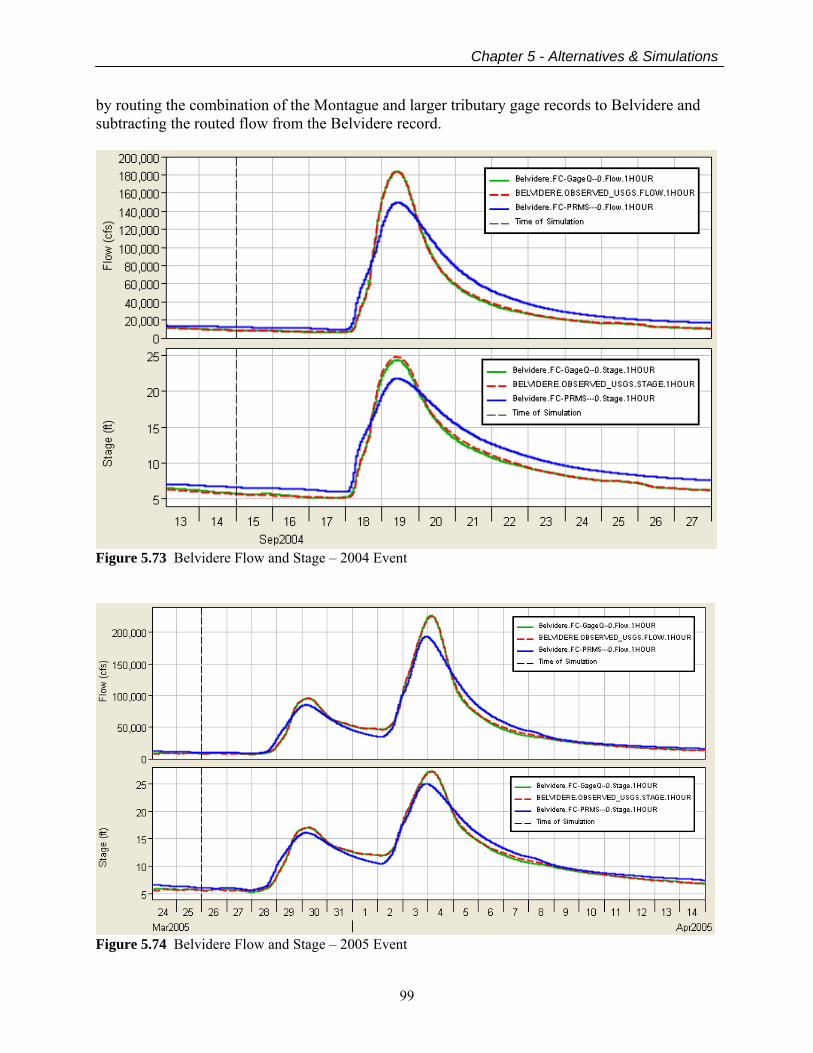
Chapter 5 - Alternatives & Simulations
99
by routing the combination of the Montague and larger tributary gage records to Belvidere and subtracting the routed flow from the Belvidere record.
Figure 5.73 Belvidere Flow and Stage – 2004 Event
Figure 5.74 Belvidere Flow and Stage – 2005 Event
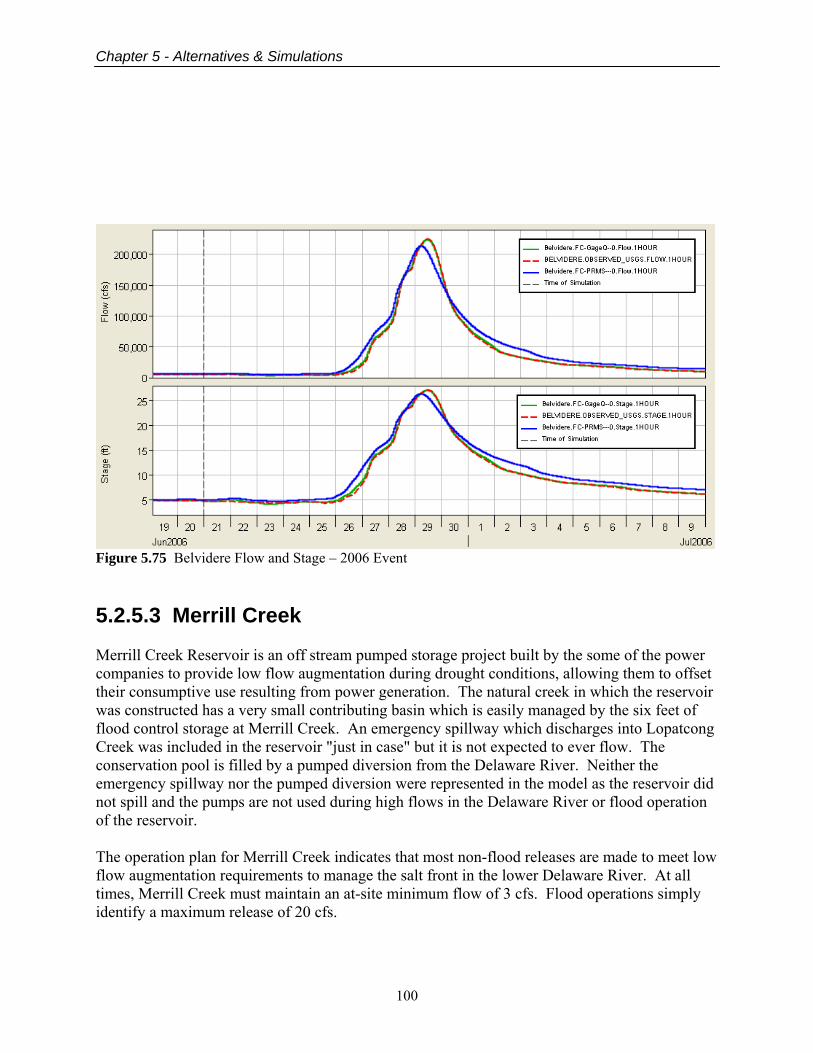
Chapter 5 - Alternatives & Simulations
100
Figure 5.75 Belvidere Flow and Stage – 2006 Event 5.2.5.3 Merrill Creek Merrill Creek Reservoir is an off stream pumped storage project built by the some of the power companies to provide low flow augmentation during drought conditions, allowing them to offset their consumptive use resulting from power generation. The natural creek in which the reservoir was constructed has a very small contributing basin which is easily managed by the six feet of flood control storage at Merrill Creek. An emergency spillway which discharges into Lopatcong Creek was included in the reservoir "just in case" but it is not expected to ever flow. The conservation pool is filled by a pumped diversion from the Delaware River. Neither the emergency spillway nor the pumped diversion were represented in the model as the reservoir did not spill and the pumps are not used during high flows in the Delaware River or flood operation of the reservoir. The operation plan for Merrill Creek indicates that most non-flood releases are made to meet low flow augmentation requirements to manage the salt front in the lower Delaware River. At all times, Merrill Creek must maintain an at-site minimum flow of 3 cfs. Flood operations simply identify a maximum release of 20 cfs.
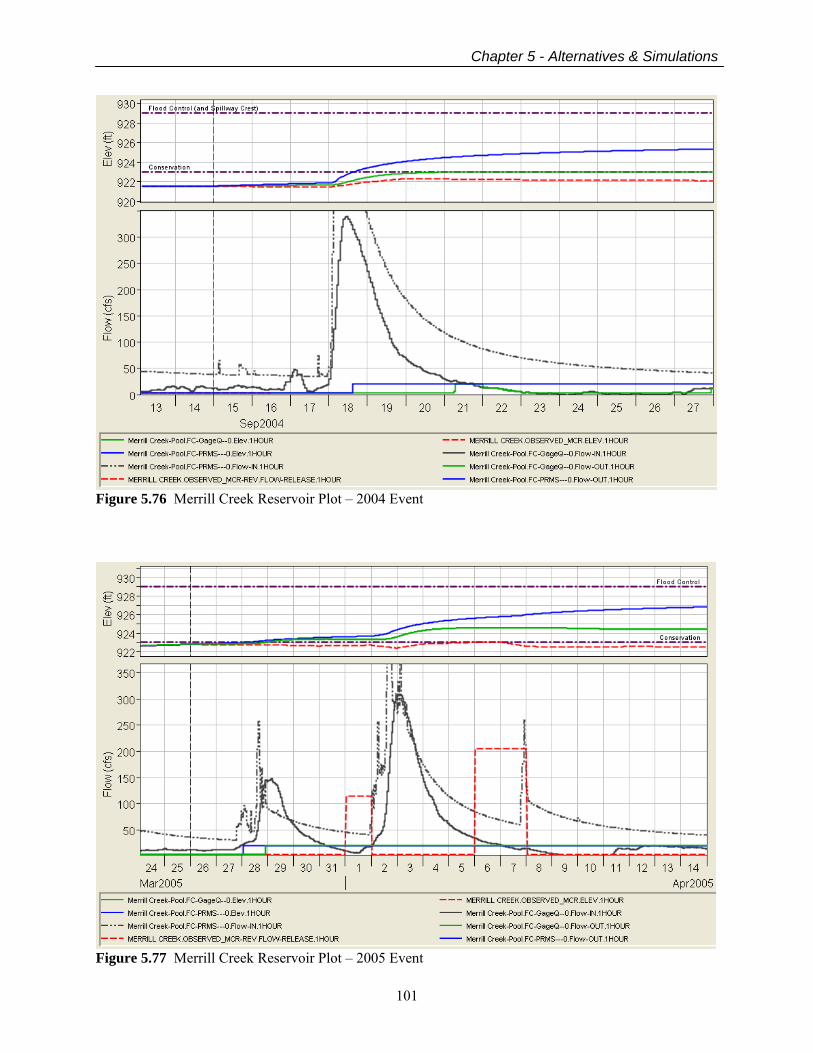
Chapter 5 - Alternatives & Simulations
101
Figure 5.76 Merrill Creek Reservoir Plot – 2004 Event
Figure 5.77 Merrill Creek Reservoir Plot – 2005 Event
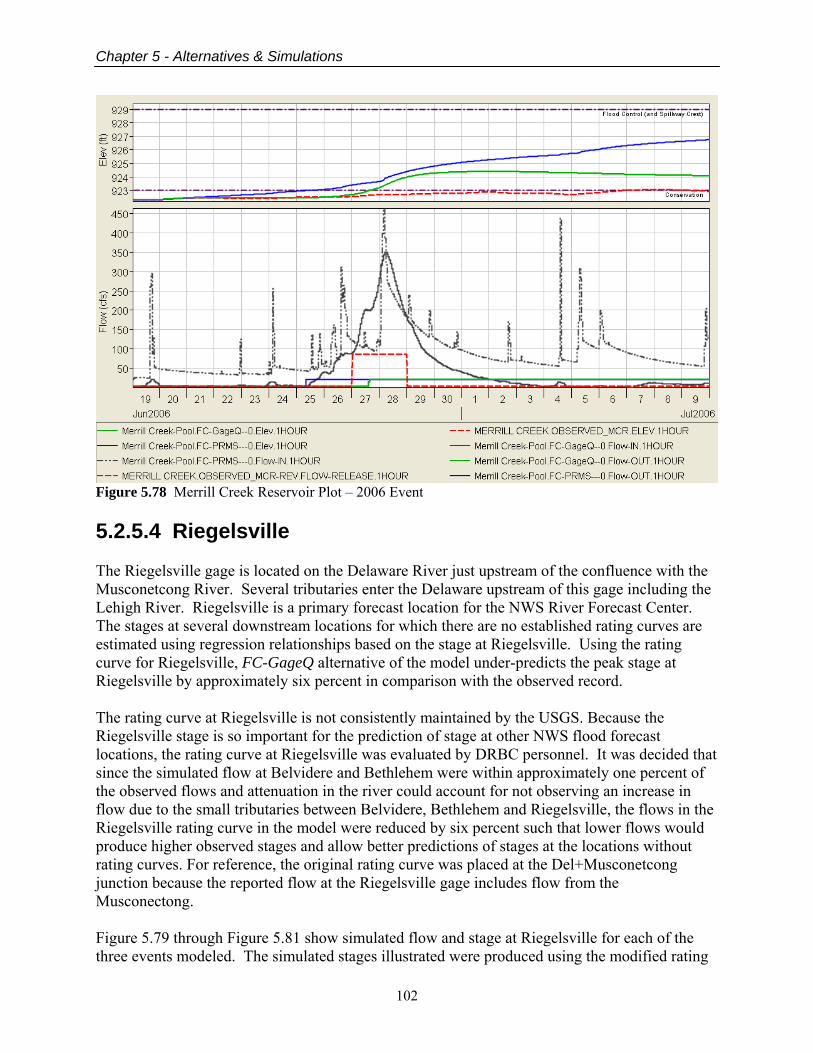
Chapter 5 - Alternatives & Simulations
102
Figure 5.78 Merrill Creek Reservoir Plot – 2006 Event 5.2.5.4 Riegelsville The Riegelsville gage is located on the Delaware River just upstream of the confluence with the Musconetcong River. Several tributaries enter the Delaware upstream of this gage including the Lehigh River. Riegelsville is a primary forecast location for the NWS River Forecast Center. The stages at several downstream locations for which there are no established rating curves are estimated using regression relationships based on the stage at Riegelsville. Using the rating curve for Riegelsville, FC-GageQ alternative of the model under-predicts the peak stage at Riegelsville by approximately six percent in comparison with the observed record. The rating curve at Riegelsville is not consistently maintained by the USGS. Because the Riegelsville stage is so important for the prediction of stage at other NWS flood forecast locations, the rating curve at Riegelsville was evaluated by DRBC personnel. It was decided that since the simulated flow at Belvidere and Bethlehem were within approximately one percent of the observed flows and attenuation in the river could account for not observing an increase in flow due to the small tributaries between Belvidere, Bethlehem and Riegelsville, the flows in the Riegelsville rating curve in the model were reduced by six percent such that lower flows would produce higher observed stages and allow better predictions of stages at the locations without rating curves. For reference, the original rating curve was placed at the Del+Musconetcong junction because the reported flow at the Riegelsville gage includes flow from the Musconectong. Figure 5.79 through Figure 5.81 show simulated flow and stage at Riegelsville for each of the three events modeled. The simulated stages illustrated were produced using the modified rating
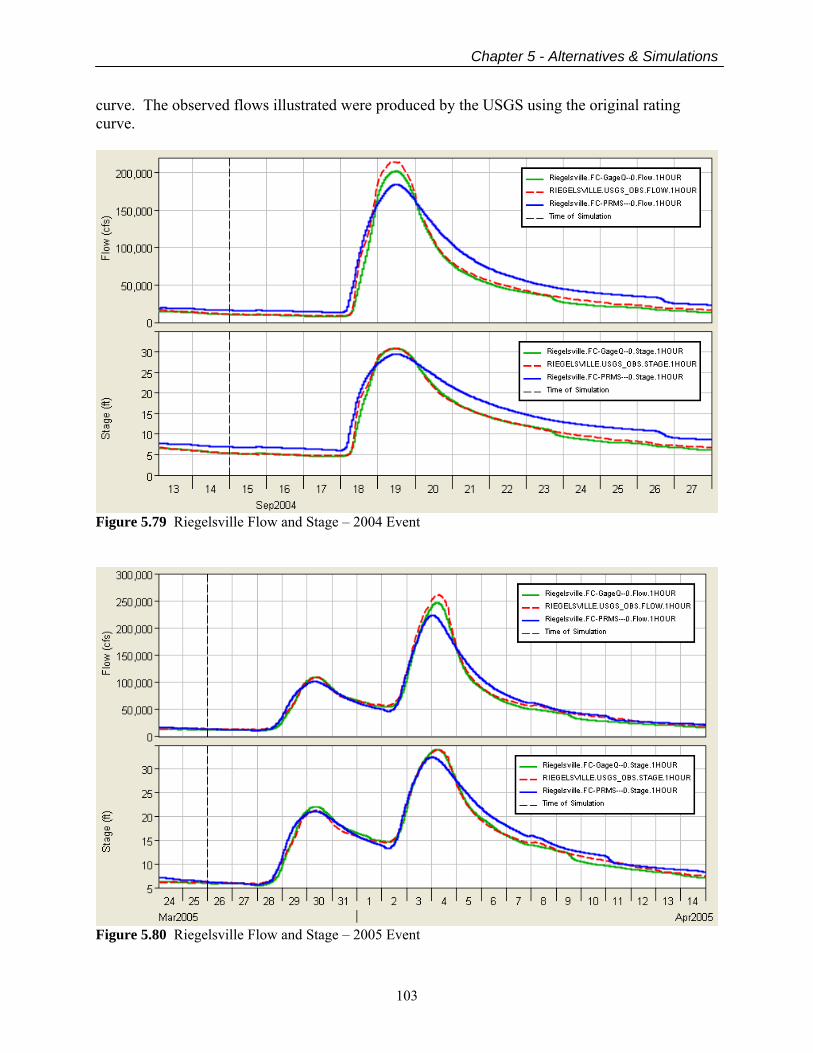
Chapter 5 - Alternatives & Simulations
103
curve. The observed flows illustrated were produced by the USGS using the original rating curve.
Figure 5.79 Riegelsville Flow and Stage – 2004 Event
Figure 5.80 Riegelsville Flow and Stage – 2005 Event
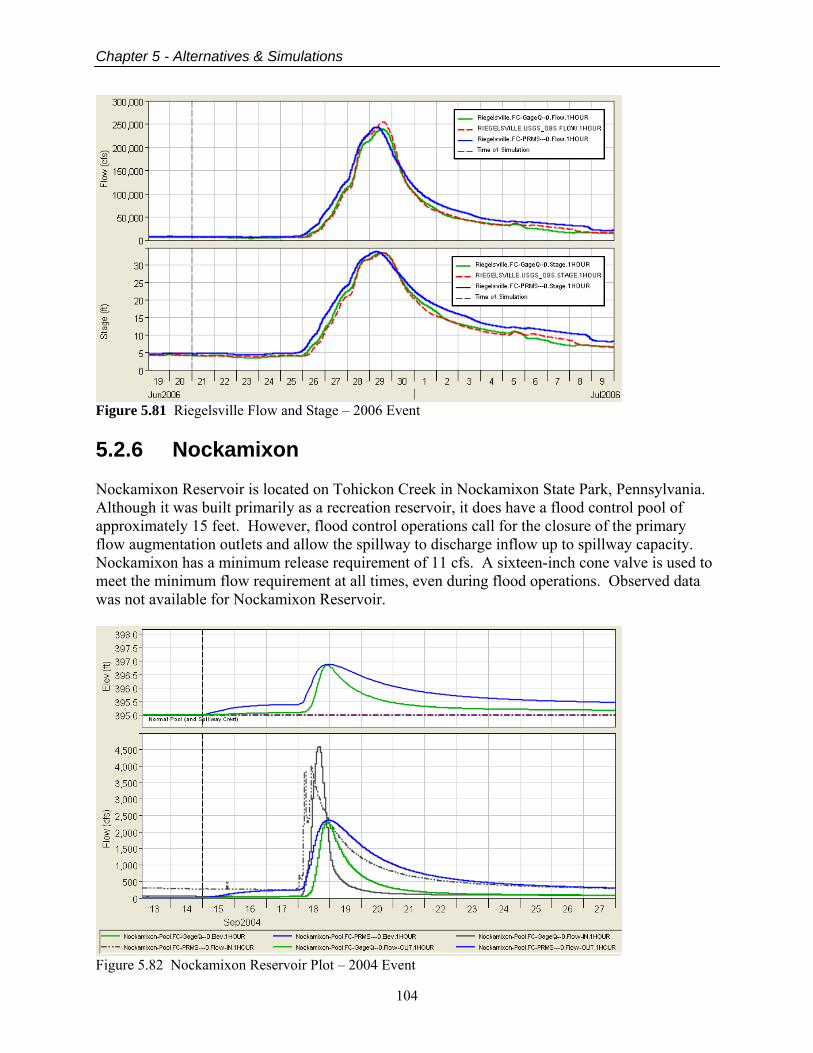
Chapter 5 - Alternatives & Simulations
104
Figure 5.81 Riegelsville Flow and Stage – 2006 Event 5.2.6 Nockamixon Nockamixon Reservoir is located on Tohickon Creek in Nockamixon State Park, Pennsylvania. Although it was built primarily as a recreation reservoir, it does have a flood control pool of approximately 15 feet. However, flood control operations call for the closure of the primary flow augmentation outlets and allow the spillway to discharge inflow up to spillway capacity. Nockamixon has a minimum release requirement of 11 cfs. A sixteen-inch cone valve is used to meet the minimum flow requirement at all times, even during flood operations. Observed data was not available for Nockamixon Reservoir.
Figure 5.82 Nockamixon Reservoir Plot – 2004 Event
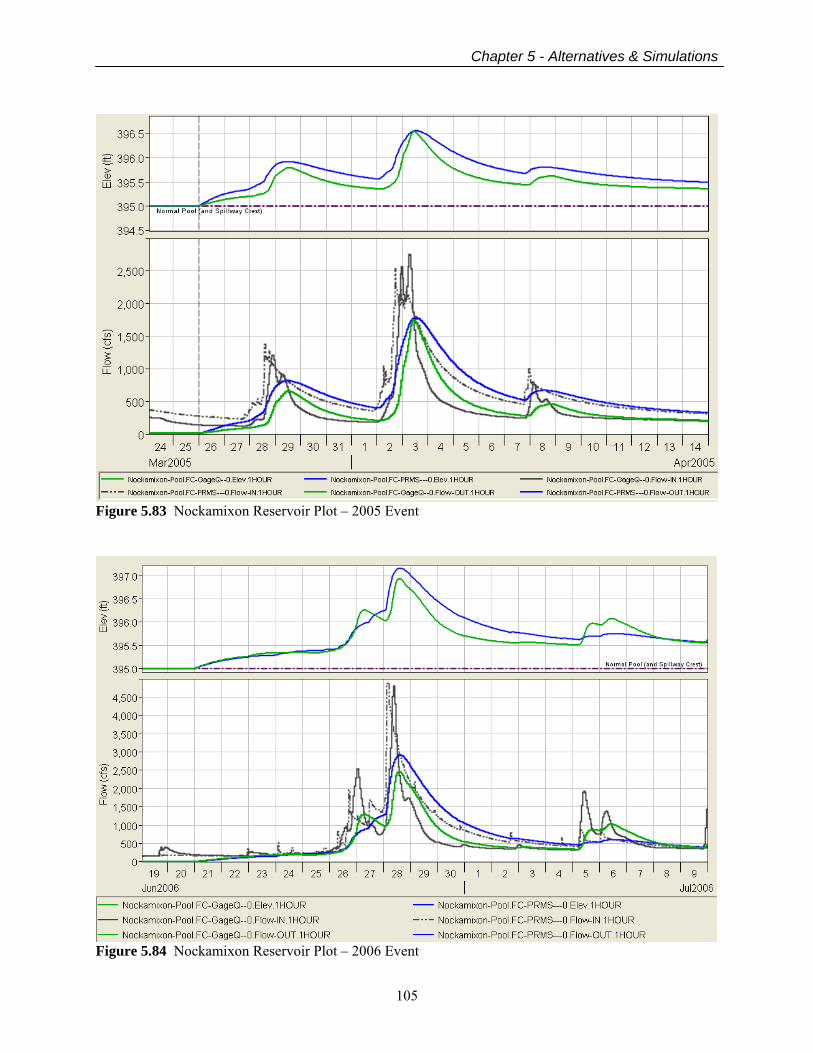
Chapter 5 - Alternatives & Simulations
105
Figure 5.83 Nockamixon Reservoir Plot – 2005 Event
Figure 5.84 Nockamixon Reservoir Plot – 2006 Event
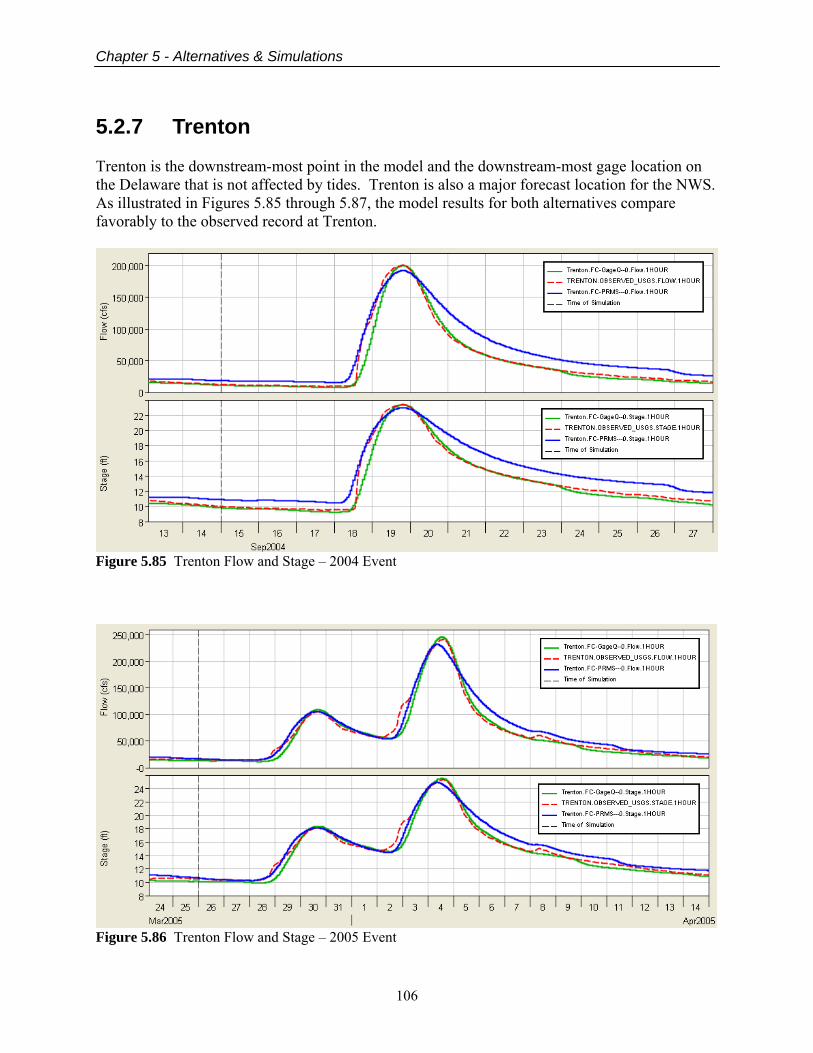
Chapter 5 - Alternatives & Simulations
106
5.2.7 Trenton Trenton is the downstream-most point in the model and the downstream-most gage location on the Delaware that is not affected by tides. Trenton is also a major forecast location for the NWS. As illustrated in Figures 5.85 through 5.87, the model results for both alternatives compare favorably to the observed record at Trenton.
Figure 5.85 Trenton Flow and Stage – 2004 Event
Figure 5.86 Trenton Flow and Stage – 2005 Event
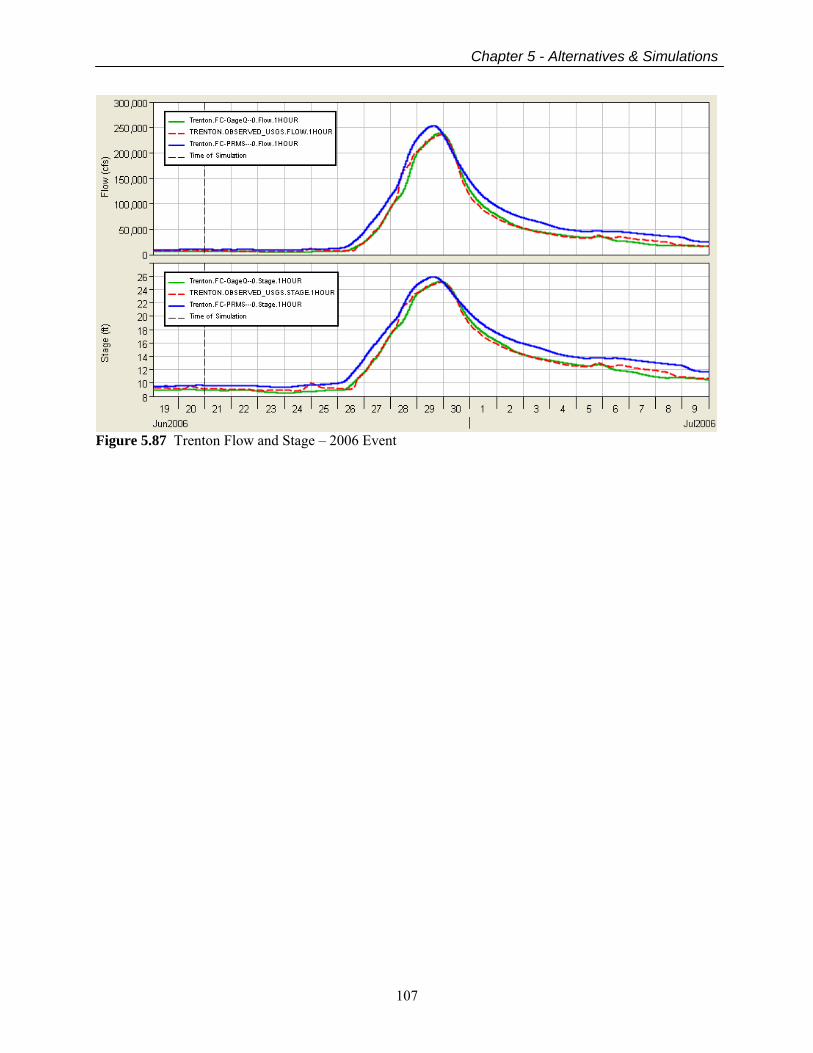
Chapter 5 - Alternatives & Simulations
107
Figure 5.87 Trenton Flow and Stage – 2006 Event

Chapter 5 - Alternatives & Simulations
108

Chapter 6 - Summary
109
Chapter 6
Summary 6.1 Model Summary The reservoir simulation and routing model developed by the USACE, Hydrologic Engineering Center as a component of the Delaware River Flood Analysis Model simulates the operation of thirteen reservoirs in the basin and the routing of their releases along with intervening local flows through the river system down to Trenton. The purpose of the model is to serve as the basis for analysis of alternative flood risk management strategies. Data for the model was provided by the US Geological Survey, the US Army Corps of Engineers, Philadelphia District, the National Weather Service, and the Delaware River Basin Commission and its partner agencies. Streamflows downstream of the reservoirs on the main stem Delaware River and some of its major tributaries are well gaged. However, some of the major tributaries as well as most of the minor tributaries are not well gaged which made modeling of the reservoir operations and routing on these streams challenging. At the request of the Delaware River Basin Commission, two base alternatives were developed. In the model, these alternatives were named FC-PRMS and FC-GageQ. Both alternatives simulate the individual reservoir flood operating policies in effect at the time of the three events studies. The FC-PRMS alternative uses inflows computed by the PRMS-based hydrology model developed by the USGS as the rainfall-runoff component of the Flood Analysis Model. The objective of the PRMS model was to produce inflow for HEC-ResSim that could be used to adequately represent the flows that would be experienced in the basin under a selected set of hydrologic conditions. Due to uncertainties in rainfall-runoff modeling, the DRBC determined that the FC-PRMS alternative did not satisfactorily reproduce the peak flows or total volumes that occurred during the three major flood events of 2004, 2005 and 2006. The FC-GageQ alternative uses gaged and derived-from-gaged inflows. The objective of this alternative was to reduce the uncertainty and error contributed by the rainfall-runoff modeling by using the observed flow record to develop the inflows to the model and to carefully configure the operations in order to reproduce as closely as possible the observed flow in the system. With only one exception (described in Chapter 4), all operational adjustments made in the FC-GageQ alternative are reflected in the FC-PRMS alternative. 6.2 Recommended Application of the Model Due to the different sources of inflows, the recommended uses of each alternative are different. The use of inflows produced by a rainfall-runoff model makes the FC-PRMS alternative
Chapter 6 - Summary
110
appropriate for investigating the response of the reservoir system to differing inflow scenarios. The PRMS model could be used to develop an assortment of inflow data sets for the ResSim model representing different rainfall intensities, storm centerings and distribution, soil moisture conditions, and other variations on basin conditions. On the other hand, the FC-GageQ alternative which uses observed and derived-from-observed inflow is designed specifically for its current inflow data set. This alternative would be appropriate to use in investigating the impacts of changes in initial reservoir conditions or different reservoir operating plans. 6.3 Recommendations for Model Enhancements Although the model is ready for use by the DRBC in their flood operations analysis of the Delaware River system above Trenton, the following suggestions for further enhancement to the model could be pursued should data and resources become available. The flood operation of Lake Wallenpaupack could also be expanded. The current operation defined in the model is a simplification of the complex operating guidelines described in the Lake Wallenpaupack Emergency Action Plan (EAP). The EAP describes a release decision policy that relies on consensus by a number of managers, each responsible for a different aspect of the Lake Wallenpaupack Hydropower System who must take into account situational factors that are outside the scope of the model. With the assistance of the operators of Lake Wallenpaupack, it may be possible to redevelop the flood operations in the model so that the key factors that influence release decisions at the lake could be accounted for and the appropriate release for each trigger level defined. At the time this model was developed, the new owners of the reservoirs in the Mongaup River Basin were just beginning to process the records they inherited. With experience and reorganization, the new owners will likely be able to play a more active role in describing the behavior of the Mongaup Reservoirs during high flow conditions and provide more data for development of a more robust operating scheme for the model. One of the key elements of a new operating scheme could be improvement of the scripts that model the flashboard operation. These scripts currently assume that when the flashboards fall, they all fall at once. In reality, this is rarely the case. Enhancements to the scripts and the operation set could be added to define a more incremental falling behavior of the flashboards. Lastly, the remaining three reservoirs that exist in the basin could be added to the model. While none of these reservoirs is currently tasked to operate to reduce flood peaks in the rivers downstream of them, any reservoir, large or small, can have an impact on flood flow routing in a system. That impact is typically related to the lag and attenuation of the flood hydrograph as it is routed through a reservoir pool, possibly resulting in a small reduction in peak flows at damage centers. In addition, as with the 13 other reservoirs in the basin, possible changes in operating schemes could be investigated at these reservoirs to determine if they could play a more active role in reducing flood risk.
Chapter 7 - References
111
Chapter 7
References DRBC, 1984. "Docket No. D-77-110 CP, Merrill Creek Owners Group (MCOG), Merrill
Creek Reservoir, Pumping Station and Transmission Main, Warren County, New Jersey", Delaware River Basin Commission, October 24, 1984, 11 p.
DRBC, 1990. "Docket No. D-77-110 CP (Amendment 1), Merrill Creek Owners Group
(MCOG), Merrill Creek Reservoir Project, Warren County, New Jersey", Delaware River Basin Commission, May 23, 1990, 8 p.
DRBC, 2002. "Resolution No. 2002-33", Delaware River Basin Commission, November 25,
2002, 6 p.
DRBC, 2004. "Resolution No. 2004-3, Docket No. D-77-20 CP (Revision 7)", Delaware River
Basin Commission, April 21, 2004, 11 p.
Hydrologic Engineering Center, 2007. "HEC-ResSim, Reservoir System Simulation, User's
Manual, Version 3.0, April 2007", U.S. Army Corps of Engineers, Report CPD-82, Davis, Calif., 512 p.
MCR, 1999. Letter from Merrill Creek Reservoir, Subject: Merrill Creek Reservoir Project,
Reservoir Volume - Elevation Curve, August 26, 1999, 6 p.
NWS, 2006. "Model Simulations for the Upper Delaware River Basin Flooding of April, 2005",
National Weather Service-Middle Atlantic River Forecast Center, State College, PA, August 2006, 7 p.
PA-DER. "Operation and Maintenance Manual for Nockamixon State Park Dam, Bucks
County, Pennsylvania", Department of Environmental Resources (PA-DER), Bureau of Operation and Maintenance, Harrisburg, Pennsylvania, 33 p.
PA-DER, 1979. Letter from Commonwealth of Pennsylvania, Department of Environmental
Resources, May 22, 1979, (re: DRBC Docket No. D-66-122CP), 2 p.
Mirant, 2007. "Mongaup River Hydroelectric System Operating Plan", Mirant NY-Gen, LLC,
New York, May 7, 2007 DRAFT, 17 p.
Chapter 7 - References
112
OASIS, 2004. OASIS Model 2.1 -- "simbase2.1_run_ocl.zip", "NYC-reservoir-data-OASIS-july2007.xls", and email correspondence from DRBC, August – December 2007.
PPL, 2007. "Emergency Action Plan, Wallenpaupack Hydroelectric Station, FERC Project No.
487, PA Dam No. 52-051, NATDAM Nos. PA00302 (Dam) and PA83011 (Dike), Dam, Dike, or Pipeline Emergency", PPL Generation, LLC, Allentown, PA, 1975, Revised December 28, 2007, 86 p.
USACE, 2003a. "Water Control Manual (Revised), Francis E. Walter Dam and Reservoir,
Lehigh River Basin, Pennsylvania", U. S. Army Corps of Engineers, Philadelphia District, Philadelphia, PA, October 1961, Revised October 1994 and Revised February-April 2003.
USACE, 2003b. "Water Control Manual (Revised), Beltzville Dam and Lake, Lehigh River
Basin, Pennsylvania", U. S. Army Corps of Engineers, Philadelphia District, Philadelphia, PA, February 1972, Revised April 1985 and Revised June 1996 and Revised March-April 2003.
USACE, 1997a. "Water Control Manual, Jadwin Reservoir, Dyberry Creek Pennsylvania,
Lackawaxen River Basin", U. S. Army Corps of Engineers, Philadelphia District, Philadelphia, PA, September 1968, Revised September 1997, 127 p.
USACE, 1997b. "Water Control Manual, Prompton Reservoir, West Branch Lackawaxen River
Pennsylvania, Lackawaxen River Basin", U. S. Army Corps of Engineers, Philadelphia District, Philadelphia, PA, September 1968, Revised September 1997, 146 p.
Appendix A - Scope of Work
A-1
Appendix A
Scope of Work Delaware River Basin Flood Analysis Model
Originally Prepared and Approved – 6 Aug 2007 Revised and Approved – 29 Feb 2008

Appendix A - Scope of Work
A-2
Appendix A - Scope of Work
A-3
`
DELAWARE RIVER BASIN
FLOOD ANALYSIS MODEL
Scope of Work
Prepared for
Delaware River Basin Commission
Submitted by: U.S. Geological Survey
U.S. Army Corps of Engineers – Hydrologic Engineering Center NOAA - National Weather Service
corrected February 29, 2008
U.S. Army Corps of Engineers Institute for Water Resources Hydrologic Engineering Center

Appendix A - Scope of Work
A-4
Appendix A - Scope of Work
A-5
DELAWARE RIVER BASIN FLOOD ANALYSIS MODEL
Problem: Three major main stem floods between September of 2004 and June of 2006 have focused attention on the potential effects of storage volumes (voids) in major reservoirs within the Delaware River Basin on downstream discharges. Some of the major reservoirs were designed and built for flood control purposes while others were designed for water supply, hydropower, and recreation. Evaluation of alternative operational scenarios for this complex reservoir system can be improved by use of a physically-based flood analysis model that simulates runoff and streamflow routing, incorporating the impact of storage in and discharge from major reservoirs. DRBC Resolution 2006-20 authorizes the Executive Director of the Delaware River Basin Commission (DRBC) to develop a flood analysis model for the basin. Complex models that represent rainfall and snowmelt runoff, reservoir hydraulics, and flow routing are required and need to be combined into a single flood analysis model. The tool is needed to allow:
• The DRBC and others the capability to evaluate the potential for the basin's major reservoirs to be operated for flood mitigation;
• The DRBC and others to evaluate the feasibility of various reservoir operating alternatives; • The DRBC and others to evaluate the effect of reservoir voids of different magnitudes on
streamflow at locations downstream from the reservoirs; • The DRBC and others the ability to examine, modify, and improve the model and datasets as
new information and technology become available; and • The DRBC and others to use the output from the tool as an educational instrument for
demonstrating the operations of reservoirs and basin hydrology. In cooperation with the Delaware River Basin Commission (DRBC), the U.S. Geological Survey (USGS), U.S. Army Corps of Engineers (USACE) - Hydrologic Engineering Center (HEC), and the NOAA's National Weather Service (NWS) will develop an integrated flood analysis model for the Delaware River Basin to allow evaluation of flood operations at individual reservoirs and the reservoir system.
Purpose: Develop a flood analysis model that will allow the evaluation of existing reservoirs for flood mitigation. The model will provide data to evaluate the effects of various reservoir operating alternatives on flooding at locations downstream of the reservoirs. The tool will incorporate rainfall/runoff processes, reservoir operations and flow routing components into a model for simulation of flood hydrographs at USGS stream gage locations and co-located NWS flood forecast points on the Delaware River and its tributaries.
Objectives: 1. Construct a rainfall/runoff and snowmelt model for the non-tidal Delaware River Basin to
Trenton, New Jersey, for the non-tidal Schuylkill River Basin, and for the non-tidal Christina River Basin.
2. Construct reservoir simulation models for 15 reservoirs in the Delaware River Basin, as designated by the DRBC.
3. Construct a flow routing model for the Delaware River and major tributaries above Trenton, as well as for the non-tidal Schuylkill and Christina Rivers.
4. Integrate datasets for rainfall/runoff and snowmelt, reservoir simulation, and routing models into a common database structure and framework.
5. Integrate the rainfall/runoff, reservoir simulation, and flow routing models into a single operational tool that will incorporate a graphical user interface for input parameters and datasets as well as output from the models. The modeling system will be modular and allow future

Appendix A - Scope of Work
A-6
incorporation of improved algorithms and improved datasets, such as higher-resolution digital elevation models (DEM's). As an initial step, the model components will first be applied to a pilot watershed to avoid incompatibility and integration issues, and to provide opportunities for reviewer inputs on the final model development approach. The pilot application will provide a test of model function and integration of features rather than calibration.
Approach: The multi-agency project team will include participation of NWS, HEC, and USGS. Project coordination will be provided by the USGS Pennsylvania Water Science Center, with additional USGS contributions by the New Jersey and New York Water Science Centers, National Research Program, and Office of Surface Water. HEC will have lead responsibility for the reservoir and flow-routing models, and will contribute to all project products. USACE Philadelphia District will provide information on USACE reservoirs in the basin. The NWS Middle Atlantic River Forecast Center (MARFC), as well as Eastern Region Headquarters and Office of Hydrologic Development, will focus primarily, but not exclusively, on assisting with the flow-routing model components. Ongoing advisory input will be sought from staff of the Delaware River Basin Commission, the USGS Delaware River Master, and the Delaware River Basin Commission Flood Advisory Committee. Task 1 –Database Development and Maintenance: A unified relational database will be constructed for the flood analysis model. The database will contain all data needed to simulate streamflow using the rainfall/runoff, reservoir, and flow-routing components described in following tasks. This database will provide a controlled system to quality assure input information and minimize redundancy in compiling input data that may be used in more than one model component. Many of the spatial GIS coverages needed have already been compiled for USGS projects in the Basin such as the ongoing National Water Quality Assessment (Fischer and others, 2004) and the SPARROW basin-scale nutrient transport model (Chepiga and others, 2004). Streamflow routing model datasets are in use for current river forecasting by MARFC. Additional datasets will include USACE reservoir storage curves and operation rules, radar and gage precipitation, stream gage rating curves, digital elevation model, streams, hydrologic response units, streamflow-routing parameters and coefficients. USGS will lead this task. Description of Subtasks: 1.1 Determine required data sets needed for model development, design database structure, and identify format and metadata requirements.
Deliverable: Electronic text file including description of database structure Expected Completion: Sep 07 Responsible Party: USGS
1.2 Acquire available data sets including spatial datasets such as the 1:24,000 National Hydrography Dataset (NHD) and Delaware Basin NAWQA land use and other coverages.
Deliverable: Electronic database files Expected Completion: Nov 07 Responsible Party: USGS; DRBC will provide reservoir physical and operational data (including elevation, storage, area of the pool, dam elevation and length, outlet capacity tables, pool levels for operation (top of flood, top of con, top of power, inactive, etc) and release objective and constraints) and diversion data (including demand and conduit capacity).
1.3 Populate and update working database and spatial database, fill data gaps using appropriate procedures.
Deliverable: Electronic database files Expected Completion: Jan 08 Responsible Party: USGS

Appendix A - Scope of Work
A-7
1.4 Quality assure and maintain the database, incorporate new datasets from modeling tasks, or from outside efforts
Deliverable: Electronic database files Expected Completion: Jan 09 Responsible Party: USGS
Task 2 – Rainfall/Runoff Model Development: The USGS Precipitation Runoff Modeling System (PRMS) will be used for the rainfall/runoff model component (Leavesley and others, 1983). PRMS is a modular-design, deterministic, distributed-parameter modeling system developed to evaluate the impacts of various combinations of precipitation, climate, and land use on streamflow (Leavesley and others, 1983; Leavesley and Saindon, 1995). Geospatial datasets for the rainfall/snowmelt/runoff model component using the USGS Precipitation Runoff Modeling System (PRMS) include:
raster (e.g.: NEXRAD) precipitation and gage precipitation air temperature solar radiation (estimated where unavailable) digital elevation model (DEM) hydrologic response units (sub-watersheds) stream locations land use
Description of Subtasks: 2.1 Construct pilot watershed PRMS model for part of Delaware River Basin
Deliverable: Presentation of pilot model construction and preliminary results for the East and West Branches of the Delaware River, electronic datafiles for use in other model components Expected Completion: Nov 07 Responsible Party: USGS
2.2 Construct full Delaware River Basin PRMS model above Trenton Deliverable: Electronic model files Expected Completion: Feb 08 Responsible Party: USGS
2.3 Calibrate and verify PRMS model discharges using three recent high-flow events Deliverable: Electronic model files Expected Completion: Mar 08 Responsible Party: USGS
2.4 Construct, calibrate and verify PRMS model for Schuylkill Basin Deliverable: Electronic model files Expected Completion: Apr 08 Responsible Party: USGS
2.5 Construct, calibrate and verify PRMS model for Christina Basin Deliverable: Electronic model files Expected Completion: May 08 Responsible Party: USGS
Appendix A - Scope of Work
A-8
Task 3 – Reservoir Simulation and Flow Routing – (HEC-ResSim): HEC will lead development and application of HEC-ResSim for simulation of reservoirs and flow routing. HEC-ResSim (USACE, 2007) was developed to assist in planning studies for evaluating proposed reservoirs in a system and to assist in sizing the flood control and conservation storage requirements for each project. HEC-ResSim will be used to determine the influence of major reservoirs on streamflow in the basin and evaluate selected alternative reservoir release rules to mitigate downstream flooding. HEC will coordinate with the DRBC, USGS and NWS in the creation of a HEC-ResSim model of the Delaware River Basin. See Appendix A for a list of the reservoirs to be modeled. Description of Subtasks: 3.1. Gather and analyze data required for flow-routing and reservoir modeling. These data include:
• time-series data (computed inflow and incremental local flow hydrographs from PRMS, observed flow hydrographs, observed reservoir pool elevations and releases and the associated computed reservoir inflows, etc.) for the three major flood events that have occurred within the last 4 years,
• physical and operational reservoir data including reservoir pool definition (elevation-storage-area tables), outlet capacity curves, hydropower plant data (outflow and generation capacities, efficiency, losses, etc), operational zones, minimum and maximum release requirements, etc.,
• rating curves at each stream gage location, and • routing reach parameters from existing NWS forecasting models.
Other resources that will be needed include reservoir regulation manuals or other descriptions of the current reservoir operational objectives and constraints, and geo-referenced map files of the Delaware River Basin including a rivers and streams map file, a lakes map file that identifies the reservoir locations and extents, and, if available, a watershed boundary map file that may include the sub-basin delineations, a stream gage locations map file, and a state boundaries map file.
Deliverable: Electronic data files Expected Completion: Jan 08 Responsible Party: HEC, with data from DRBC and USACE Philadelphia District
3.2. Develop a model schematic that identifies the key locations in the watershed. Key locations include reservoirs, gage locations, control points, forecast points, and any other locations that are needed as data transfer points between the PRMS model and the HEC-ResSim model or for information for the analysis of results. Geo-referenced map files (identified in step 1) will be used as the background of the model schematic and for delineation of the stream alignment (the framework or skeleton upon which the model schematic is created). The map files will be obtained from and/or shared with the PRMS modelers so that both models will use the same units and spatial transformation.
Deliverable: Model schematic map (digital) and definitions (text file) Expected Completion: Feb 08 Responsible Party: HEC
3.3. HEC, in cooperation with USGS, and in consultation with NWS, will evaluate the use of several alternative approaches for flow routing in the main channel and major tributaries of the Delaware River. HEC-ResSim contains seven methods for routing streamflow (Coefficient, Muskingum, Muskingum-Cunge 8-pt Channel, Muskingum-Cunge Prismatic Channel, Modified Puls, SSARR, and Working R&D Routing), each method with its own set of routing parameters. In addition, the NWS variable lag & K routing method will be incorporated into HEC-ResSim so that existing operational parameters developed by NWS can be used, where applicable.
Appendix A - Scope of Work
A-9
Deliverable: Updated executables for HEC-ResSim with NWS flow routing Expected Completion: Nov 07 Responsible Party: HEC, with input from NWS
3.4. Define the physical and operational data for each major reservoir in the basin. Physical reservoir data include: reservoir pool storage definition, dam elevation and length, outlets and their release capacities, and power plant data (if applicable). Defining the operational data includes specifying the operation zones or levels, the rules that constrain the releases for each zone, and a release allocation strategy that indicates how the releases will be allotted to the available outlets.
Deliverable: Datasets for reservoir simulation with HEC-ResSim Expected Completion: Apr 08 Responsible Party: HEC, in cooperation with DRBC and input from USACE Philadelphia District
3.5. For each river junction that will receive incremental local inflow (i.e., subbasin runoff from hydrologic model), identify the source and an appropriate ratio (usually 1.0). In addition to key control point locations, the NWS forecast locations and USGS gage locations will be identified and included as junctions. Discharge to stage conversion at relevant locations will be computed from available rating curves.
Deliverable: Datasets for local inflow in HEC-ResSim and table of ratios Expected Completion: Apr 08 Responsible Party: HEC, in consultation with USGS
3.6. Demonstration of the model for the "pilot" basin will be done by simulation of three selected high-flow events using observed (flow and reservoir elevation & releases) datasets from NWS, USGS, and USACE Philadelphia District.
Deliverable: Electronic model files Expected Completion: Nov 07
Responsible Party: HEC 3.7. Verification of the models for the Delaware Basin to Trenton, the Schuylkill Basin, and the Christina Basin will be done by simulation of three selected high-flow events using observed (flow and reservoir elevation & releases) datasets from NWS, USGS, and USACE Philadelphia District. A single alternative will be developed to represent the current conditions and operations in the watershed. It is expected to be the basis for future modeling efforts by the DRBC.
Deliverable: Electronic model files Expected Completion: Jun 08 Responsible Party: HEC
Task 4 – Integration of the model components into the Modular Modeling System (MMS): The Modular Modeling System (MMS) (Leavesley and others, 1996) is an open-source computer software system developed to (1) provide the integrated software environment needed to develop, test, and evaluate physical-process algorithms; (2) facilitate integration of user-selected algorithms into operational physical-process models; and (3) provide a common framework in which to apply historic or new models and analyze their results. MMS uses a library that contains modules for simulating a variety of physical processes (Leavesley and others, 1996). The MMS will be used to link all simulation models utilized in the system to a common database (Task 1) and to a graphical user interface (Task 5) for user interactions and the analysis of simulation results. This will provide a database-centered approach to support model applications and analysis. PRMS is currently incorporated in MMS, and interfaces will be developed to incorporate HEC-ResSim complete with the newly integrated flow routing algorithms into
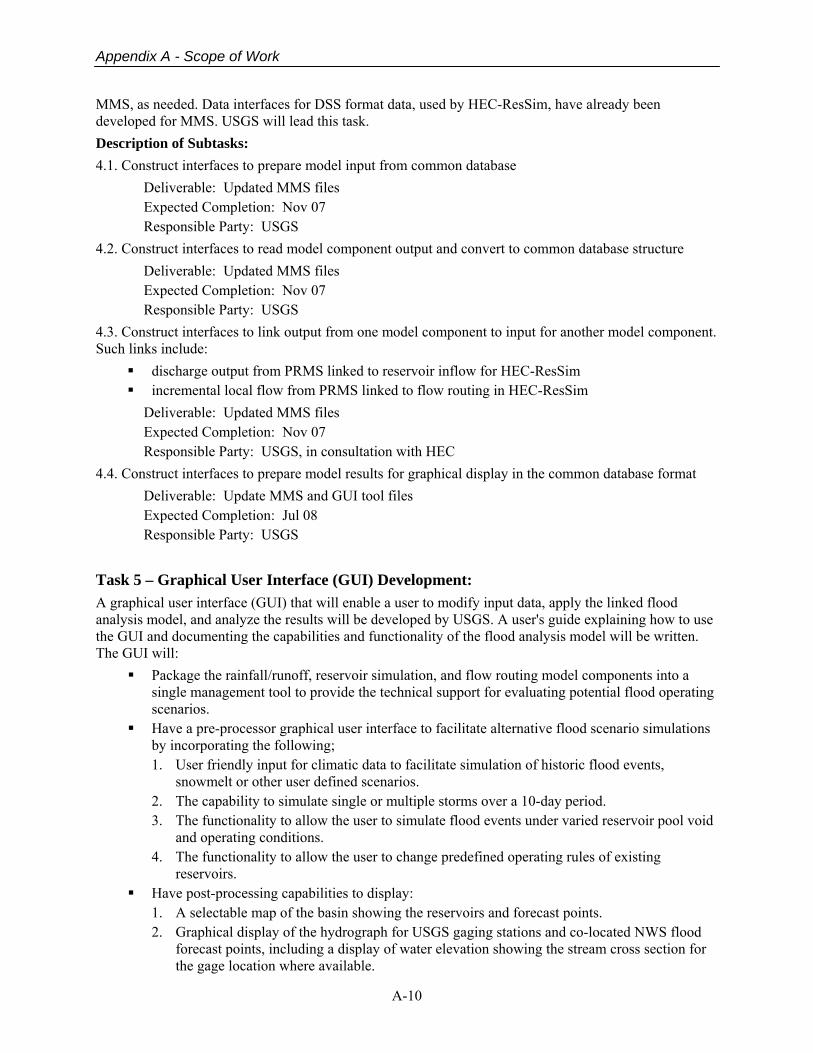
Appendix A - Scope of Work
A-10
MMS, as needed. Data interfaces for DSS format data, used by HEC-ResSim, have already been developed for MMS. USGS will lead this task. Description of Subtasks: 4.1. Construct interfaces to prepare model input from common database
Deliverable: Updated MMS files Expected Completion: Nov 07 Responsible Party: USGS
4.2. Construct interfaces to read model component output and convert to common database structure Deliverable: Updated MMS files Expected Completion: Nov 07 Responsible Party: USGS
4.3. Construct interfaces to link output from one model component to input for another model component. Such links include:
discharge output from PRMS linked to reservoir inflow for HEC-ResSim incremental local flow from PRMS linked to flow routing in HEC-ResSim
Deliverable: Updated MMS files Expected Completion: Nov 07 Responsible Party: USGS, in consultation with HEC
4.4. Construct interfaces to prepare model results for graphical display in the common database format Deliverable: Update MMS and GUI tool files Expected Completion: Jul 08 Responsible Party: USGS
Task 5 – Graphical User Interface (GUI) Development: A graphical user interface (GUI) that will enable a user to modify input data, apply the linked flood analysis model, and analyze the results will be developed by USGS. A user's guide explaining how to use the GUI and documenting the capabilities and functionality of the flood analysis model will be written. The GUI will:
Package the rainfall/runoff, reservoir simulation, and flow routing model components into a single management tool to provide the technical support for evaluating potential flood operating scenarios.
Have a pre-processor graphical user interface to facilitate alternative flood scenario simulations by incorporating the following; 1. User friendly input for climatic data to facilitate simulation of historic flood events,
snowmelt or other user defined scenarios. 2. The capability to simulate single or multiple storms over a 10-day period. 3. The functionality to allow the user to simulate flood events under varied reservoir pool void
and operating conditions. 4. The functionality to allow the user to change predefined operating rules of existing
reservoirs. Have post-processing capabilities to display:
1. A selectable map of the basin showing the reservoirs and forecast points. 2. Graphical display of the hydrograph for USGS gaging stations and co-located NWS flood
forecast points, including a display of water elevation showing the stream cross section for the gage location where available.
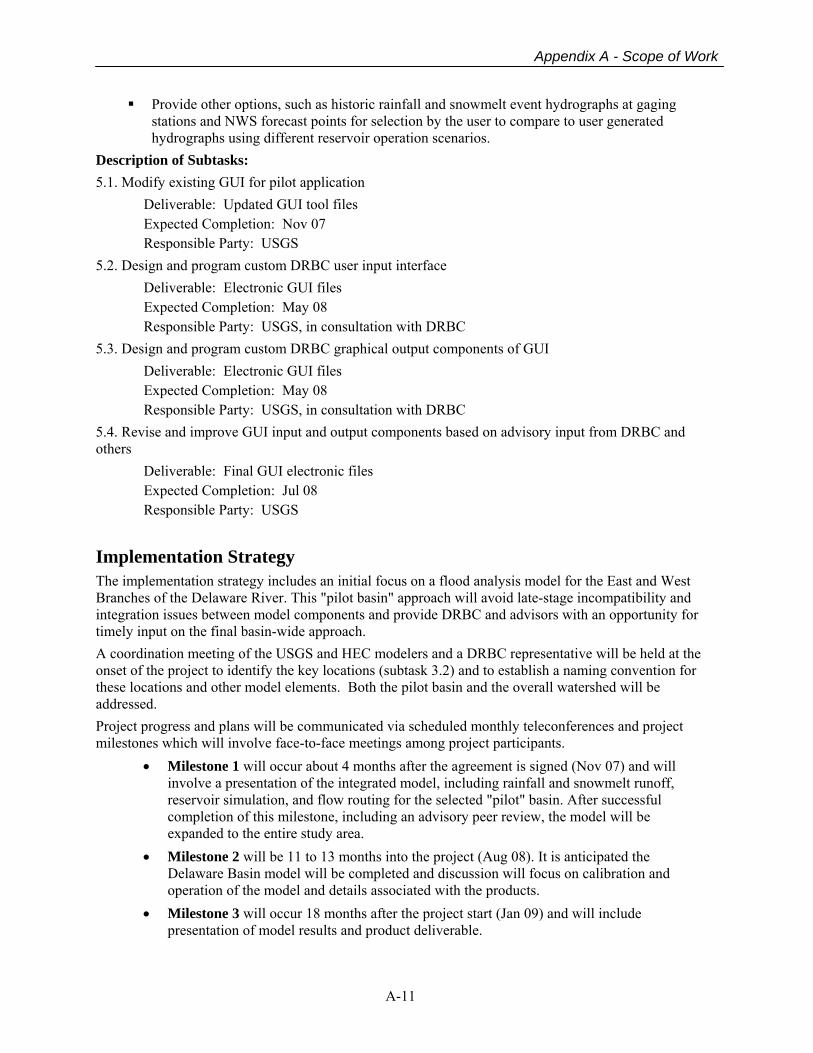
Appendix A - Scope of Work
A-11
Provide other options, such as historic rainfall and snowmelt event hydrographs at gaging stations and NWS forecast points for selection by the user to compare to user generated hydrographs using different reservoir operation scenarios.
Description of Subtasks: 5.1. Modify existing GUI for pilot application
Deliverable: Updated GUI tool files Expected Completion: Nov 07 Responsible Party: USGS
5.2. Design and program custom DRBC user input interface Deliverable: Electronic GUI files Expected Completion: May 08 Responsible Party: USGS, in consultation with DRBC
5.3. Design and program custom DRBC graphical output components of GUI Deliverable: Electronic GUI files Expected Completion: May 08 Responsible Party: USGS, in consultation with DRBC
5.4. Revise and improve GUI input and output components based on advisory input from DRBC and others
Deliverable: Final GUI electronic files Expected Completion: Jul 08 Responsible Party: USGS
Implementation Strategy The implementation strategy includes an initial focus on a flood analysis model for the East and West Branches of the Delaware River. This "pilot basin" approach will avoid late-stage incompatibility and integration issues between model components and provide DRBC and advisors with an opportunity for timely input on the final basin-wide approach. A coordination meeting of the USGS and HEC modelers and a DRBC representative will be held at the onset of the project to identify the key locations (subtask 3.2) and to establish a naming convention for these locations and other model elements. Both the pilot basin and the overall watershed will be addressed. Project progress and plans will be communicated via scheduled monthly teleconferences and project milestones which will involve face-to-face meetings among project participants.
• Milestone 1 will occur about 4 months after the agreement is signed (Nov 07) and will involve a presentation of the integrated model, including rainfall and snowmelt runoff, reservoir simulation, and flow routing for the selected "pilot" basin. After successful completion of this milestone, including an advisory peer review, the model will be expanded to the entire study area.
• Milestone 2 will be 11 to 13 months into the project (Aug 08). It is anticipated the Delaware Basin model will be completed and discussion will focus on calibration and operation of the model and details associated with the products.
• Milestone 3 will occur 18 months after the project start (Jan 09) and will include presentation of model results and product deliverable.

Appendix A - Scope of Work
A-12
Products: A joint USGS/HEC Report will be written that will document the flood analysis model development, including the rainfall/runoff, reservoir simulation, and flow routing components. This final report will also present results of selected applications to evaluate the impact of reservoir operations on flood mitigation. A users' guide will be written and included as an appendix of the joint final report. USGS will prepare an Open-File report on development of the rainfall/runoff model and documentation of the model database. HEC will prepare a report on the reservoir modeling and flow routing, focusing primarily on the aspects or features that subsequent modelers will need to be aware of as further alternatives are developed. At least one journal article or technical conference presentation will be written describing the integrated model of runoff, stream flow routing, and reservoir storage and releases in the Delaware River Basin. USGS and HEC will deliver and install the flood analysis model, with all necessary input files and software components, on DRBC computer systems, and train DRBC staff in its operation. USGS and HEC will prepare presentations suitable for delivery to the public that describe model development, calibration, verification, and results of simulation of historic high flow events such as the floods of September 2004, April 2005, and June 2006. In summary, project products will include:
Documentation of the model development, model assumptions, model database, and model calibration and verification in a joint USGS/HEC report (Draft in Dec 08).
A user's guide for running the flood analysis model. The user's guide will document the capabilities and functionality of the tool. The user's guide will be included in the final report (Draft in Dec 08).
A USGS Open-File report on details of rainfall/runoff modeling and the model database (Draft in Jul 08).
A HEC report on reservoir modeling and flow routing (Draft in Jul 08). Journal article or technical conference presentation (Draft in Jan 09). Delivery of the model in a package that will allow modification, additional simulation,
expansion, and distribution by DRBC. USGS products are generally public domain. HEC-ResSim software is free and models developed using these tools can be used by anyone. (Initial version Jul 08, with ongoing updates).
Development and, if requested, delivery of public presentations for DRBC on modeling results (Dec 07, Aug 08, Jan 09).

Appendix A - Scope of Work
A-13
References: Chepiga, Mary; Colarullo, S.J.; and Fischer, J.M., 2004, Preliminary analysis of estimated total nitrogen and total phosphorus
loads and factors affecting nutrient distribution within the Delaware River Basin [abs.], in Proc. of the American Water Resources Assoc. 2004 Spring Specialty Conf. - Geographic Information Systems (GIS) and Water Resources III: American Water Resources Assoc., May 17-19, 2004, Nashville, Tenn.
Fischer, J.M., Riva-Murray, Karen, Hickman, R.E., Chichester, D.C., Brightbill, R.A., Romanok, K.M., and Bilger, M.D., 2004, Water quality in the Delaware River Basin, Pennsylvania, New Jersey, New York, and Delaware, 1998-2001: USGS Circular 1227, 38 p.
Flippo, H. N., Jr. and Madden, T. M., Jr., 1994, Calibration of a streamflow-routing model for the Delaware River and its principal tributaries in New York, New Jersey, and Pennsylvania: U.S. Geological Survey Water-Resources Investigations Report 93-4160, 54 p.
Hydrologic Engineering Center, 2007, HEC-ResSim, Reservoir System Simulation, User's Manual Version 3.0: U.S. Army Corps of Engineers, Report CPD-82, Davis, Calif., 512 p.
HydroLogics, Inc., 2002, Modeling the Delaware River Basin with OASIS, Prepared for the Delaware River Basin Commission. Leavesley, G.H., Lichty, R.W., Troutman, B.M., and Saindon, L.G., 1983, Precipitation-runoff modeling system--User's manual,
USGS Water Resources Investigation Rep. 83-4238, 207 p. Leavesley, G.H., and Stannard, L.G., 1995. The precipitation-runoff modeling system—PRMS, in Singh V.P. (ed.), Computer
Models of Watershed Hydrology, Water Resources Publications: Highlands Ranch, CO; p. 281–310. Leavesley, G.H., Restrepo, P.J., Markstrom, S.L., Dixon, M., and Stannard, L.G., 1996a, The Modular Modeling System (MMS):
User's Manual, USGS Open-File Report 96-151, 142 p. Leavesley, G.H., Markstrom, S.L., Brewer, M.S., and Viger, R.J., 1996b, The modular modeling system (MMS)—the physical
process modeling component of a database-centered decision support system for water and power management. Water, Air, and Soil Pollution 90: 303–311.
National Weather Service-Middle Atlantic River Forecast Center, 2006, Model simulations for the Upper Delaware River Basin flooding, 7 p. <http://www.state.nj.us/drbc/Flood_Website/NWSResSimRPTAug2006.pdf>
National Weather Service, 2007 (accessed online), National Weather Service River Forecast System (NWSRFS) User Manual: <http://www.nws.noaa.gov/oh/hrl/nwsrfs/users_manual/htm/xrfsdocpdf.php>
Quinodoz, H.A., 2006, Reservoir operations and flow modeling to support decision making in the Delaware River Basin: Eos Trans. AGU, 87(52), Fall Meet. Suppl., Abstract H41D-0441.
U.S. Army Corps of Engineers, 1984, Delaware River Basin Survey Report, 83 p., appendices.
U.S. Army Corps of Engineers, 2007 (accessed online), HEC-ResSim: <http://www.hec.usace.army.mil/software/hec-ressim/hecressim-hecressim.htm>
Watson, K.M., Reiser, R.G., Nieswand, S.P., and Schopp, R.D., 2005, Streamflow characteristics and trends in New Jersey, water years 1897-2003: U.S. Geological Survey Scientific Investigations Report 2005-5105, 131 p.
Zagona, E.A., Fulp, T.J., Goranflo, H.M., and Shane, R.M., 1998, RiverWare: A general river and reservoir modeling environment: Proceedings of the First Federal Interagency Hydrologic Modeling Conference, Las Vegas, Nevada, April 19-23, 1998, pp. 5-113-120.

Appendix A - Scope of Work
A-14
Budget: Total (gross) costs by Task are shown in Table 1. Table 1: Summary of estimated budget (in gross dollars) by Task.
Tasks
Total Cost
Database Development $80,000
Rainfall/Runoff Model Development $220,000
Reservoir Simulation and Flow Routing Model Development $209,000
Model Integration and GUI Tool Development $35,000
Products & Management
$191,000
NOAA-NWS In-kind services (divided among proj. tasks)
$30,000 (estimated value)
Total $765,000
Funds to conduct the proposed work will be provided by DRBC with additional funds and in-kind support from USGS and USACE, and in-kind support by NWS. USGS funds would come from the Federal-State Cooperative Program and are subject to the availability of funds. NWS staff availability may be affected by operational needs during hydrologic events. Funding sources for the project are listed in table 2.
Table 2: Summary of estimated funding (in gross dollars) (1USGS contribution is subject to availability of Federal-Cooperative Program funds; 2 scheduling of NWS in-kind support is subject to staff availability due to hydrologic events; 3Estimated monetary value for NOAA NWS's in-kind services provided; 4Proposed cost-sharing agreement between DRBC and USACE)
Agencies Total
DRBC $500,000 USGS Match1 & in-kind
$100,000 $35,000
NOAA's NWS in-kind 2 (about ⅓ FTE) $30,0003
USACE4 $100,000 Total contribution $765,000
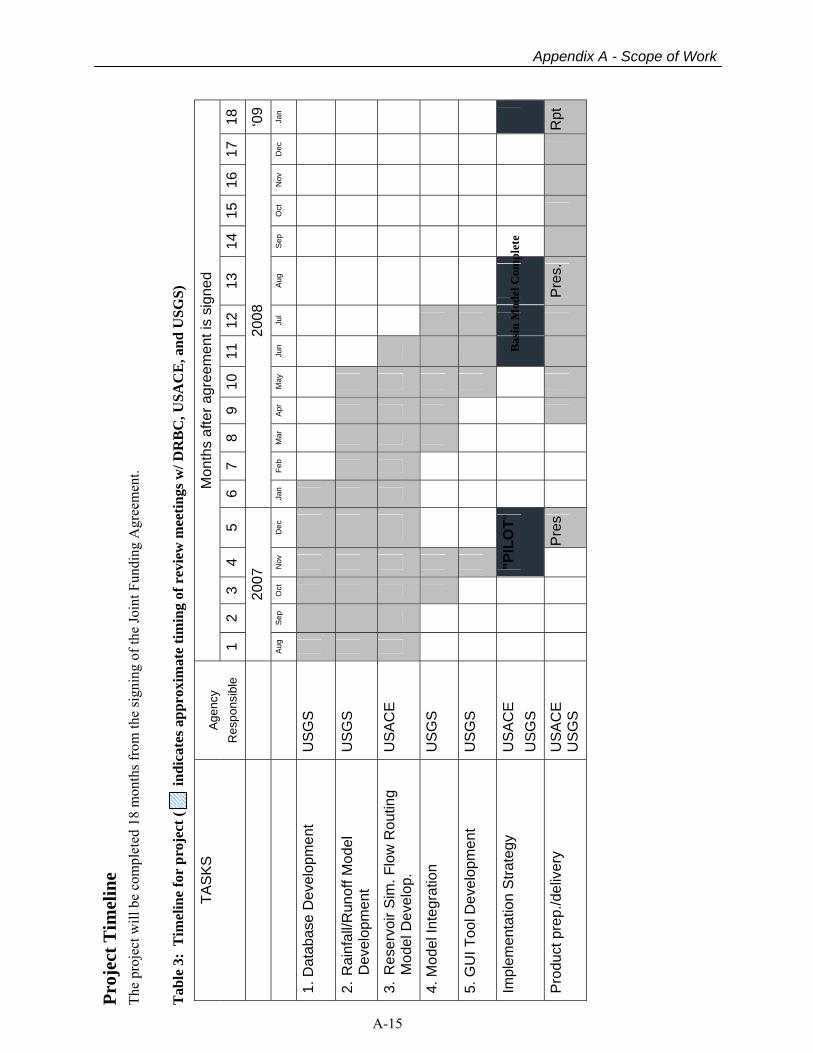
A-15
Appendix A - Scope of Work
Proj
ect T
imel
ine
The
proj
ect w
ill b
e co
mpl
eted
18
mon
ths f
rom
the
sign
ing
of th
e Jo
int F
undi
ng A
gree
men
t. T
able
3:
Tim
elin
e fo
r pr
ojec
t (
in
dica
tes a
ppro
xim
ate
timin
g of
rev
iew
mee
tings
w/ D
RB
C, U
SAC
E, a
nd U
SGS)
Mon
ths
afte
r agr
eem
ent i
s si
gned
TA
SK
S
Agen
cy
Res
pons
ible
1
2 3
4 5
6 7
8 9
1011
1213
14
1516
1718
2007
20
08
‘09
Aug
S
ep
Oct
N
ov
Dec
Ja
n Fe
b M
ar
Apr
M
ay
Jun
Jul
Aug
S
ep
Oct
N
ov
Dec
Ja
n
1. D
atab
ase
Dev
elop
men
t U
SG
S
2. R
ainf
all/R
unof
f Mod
el
Dev
elop
men
t U
SG
S
3. R
eser
voir
Sim
. Flo
w R
outin
g M
odel
Dev
elop
. U
SA
CE
4. M
odel
Inte
grat
ion
US
GS
5. G
UI T
ool D
evel
opm
ent
US
GS
Impl
emen
tatio
n S
trate
gy
US
AC
E
US
GS
"PIL
OT"
Pro
duct
pre
p./d
eliv
ery
US
AC
E
US
GS
P
res
P
res.
Rpt
Bas
in M
odel
Com
plet
e
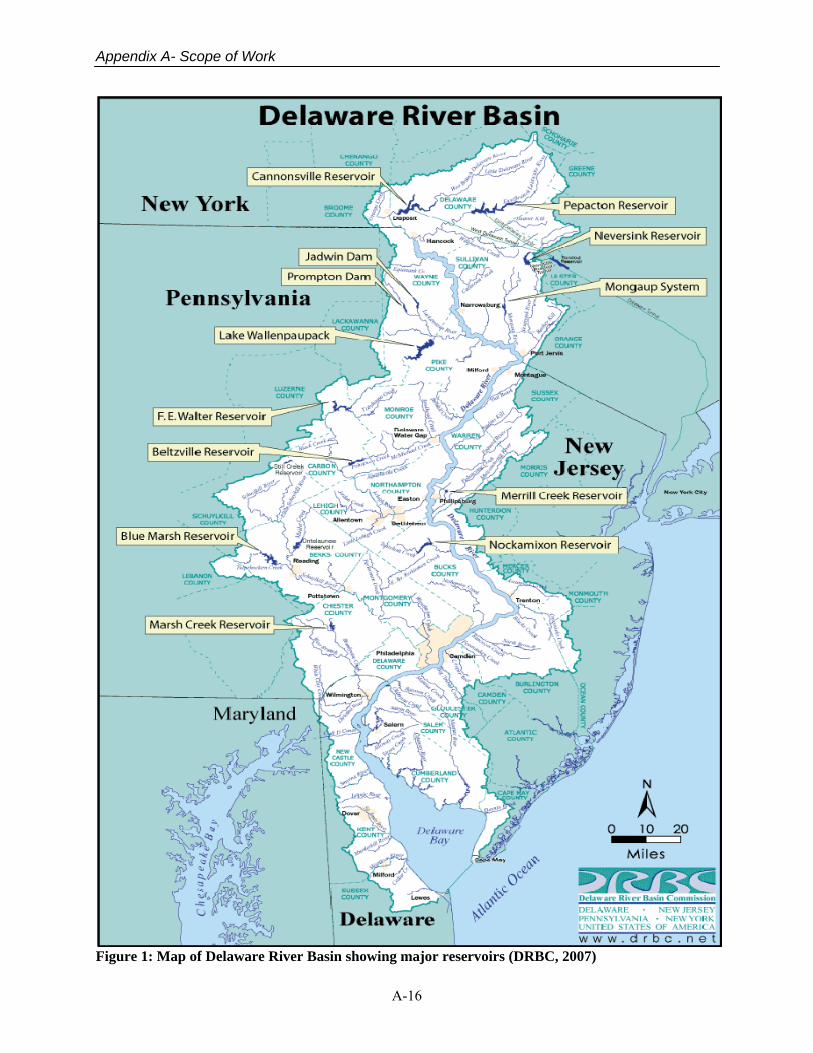
Appendix A- Scope of Work
A-16
Figure 1: Map of Delaware River Basin showing major reservoirs (DRBC, 2007)
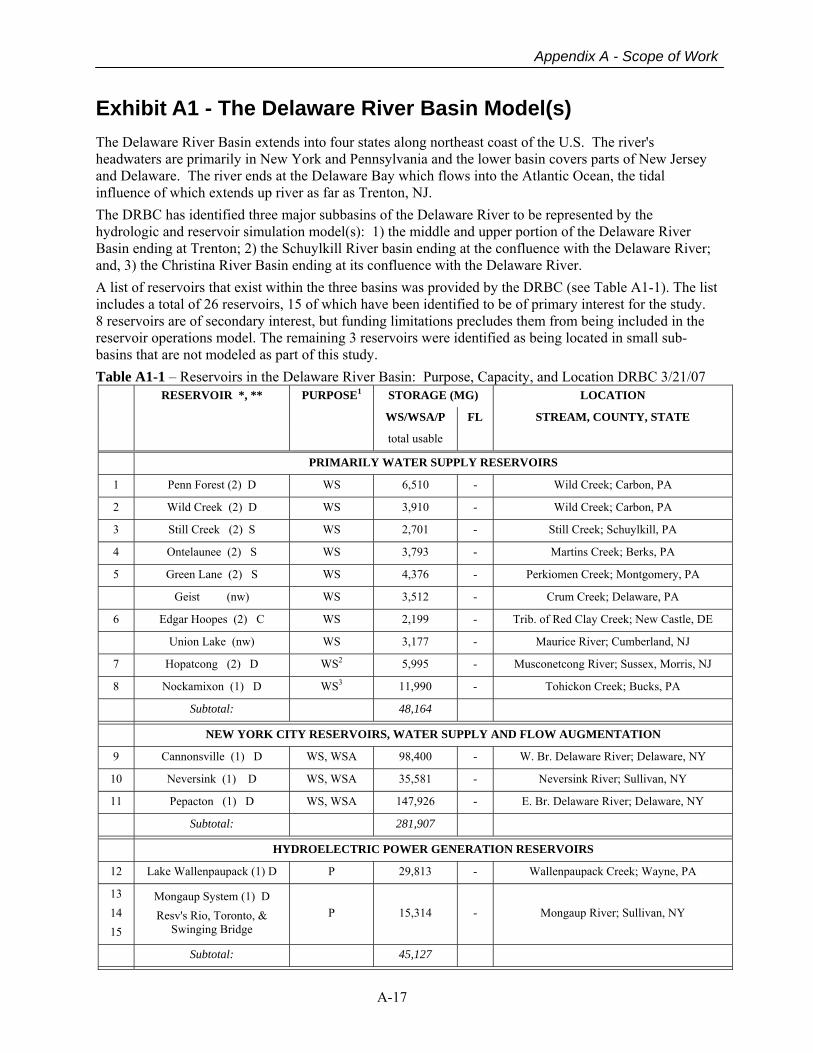
Appendix A - Scope of Work
A-17
Exhibit A1 - The Delaware River Basin Model(s)
The Delaware River Basin extends into four states along northeast coast of the U.S. The river's headwaters are primarily in New York and Pennsylvania and the lower basin covers parts of New Jersey and Delaware. The river ends at the Delaware Bay which flows into the Atlantic Ocean, the tidal influence of which extends up river as far as Trenton, NJ. The DRBC has identified three major subbasins of the Delaware River to be represented by the hydrologic and reservoir simulation model(s): 1) the middle and upper portion of the Delaware River Basin ending at Trenton; 2) the Schuylkill River basin ending at the confluence with the Delaware River; and, 3) the Christina River Basin ending at its confluence with the Delaware River. A list of reservoirs that exist within the three basins was provided by the DRBC (see Table A1-1). The list includes a total of 26 reservoirs, 15 of which have been identified to be of primary interest for the study. 8 reservoirs are of secondary interest, but funding limitations precludes them from being included in the reservoir operations model. The remaining 3 reservoirs were identified as being located in small sub-basins that are not modeled as part of this study. Table A1-1 – Reservoirs in the Delaware River Basin: Purpose, Capacity, and Location DRBC 3/21/07
RESERVOIR *, ** PURPOSE1 STORAGE (MG) LOCATION
WS/WSA/P FL STREAM, COUNTY, STATE
total usable
PRIMARILY WATER SUPPLY RESERVOIRS
1 Penn Forest (2) D WS 6,510 - Wild Creek; Carbon, PA
2 Wild Creek (2) D WS 3,910 - Wild Creek; Carbon, PA
3 Still Creek (2) S WS 2,701 - Still Creek; Schuylkill, PA
4 Ontelaunee (2) S WS 3,793 - Martins Creek; Berks, PA
5 Green Lane (2) S WS 4,376 - Perkiomen Creek; Montgomery, PA
Geist (nw) WS 3,512 - Crum Creek; Delaware, PA
6 Edgar Hoopes (2) C WS 2,199 - Trib. of Red Clay Creek; New Castle, DE
Union Lake (nw) WS 3,177 - Maurice River; Cumberland, NJ
7 Hopatcong (2) D WS2 5,995 - Musconetcong River; Sussex, Morris, NJ
8 Nockamixon (1) D WS3 11,990 - Tohickon Creek; Bucks, PA
Subtotal: 48,164
NEW YORK CITY RESERVOIRS, WATER SUPPLY AND FLOW AUGMENTATION
9 Cannonsville (1) D WS, WSA 98,400 - W. Br. Delaware River; Delaware, NY
10 Neversink (1) D WS, WSA 35,581 - Neversink River; Sullivan, NY
11 Pepacton (1) D WS, WSA 147,926 - E. Br. Delaware River; Delaware, NY
Subtotal: 281,907
HYDROELECTRIC POWER GENERATION RESERVOIRS
12 Lake Wallenpaupack (1) D P 29,813 - Wallenpaupack Creek; Wayne, PA
13 14 15
Mongaup System (1) D Resv's Rio, Toronto, &
Swinging Bridge P 15,314 - Mongaup River; Sullivan, NY
Subtotal: 45,127
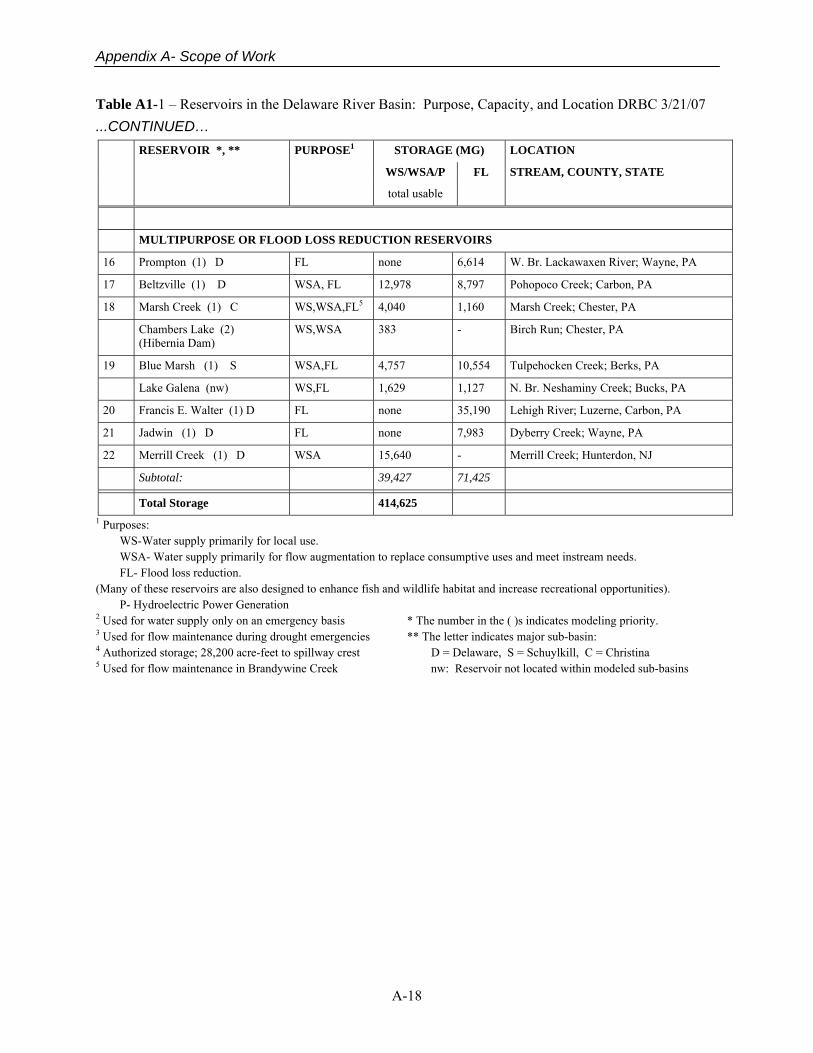
Appendix A- Scope of Work
A-18
Table A1-1 – Reservoirs in the Delaware River Basin: Purpose, Capacity, and Location DRBC 3/21/07 ...CONTINUED…
RESERVOIR *, ** PURPOSE1 STORAGE (MG) LOCATION
WS/WSA/P FL STREAM, COUNTY, STATE
total usable
MULTIPURPOSE OR FLOOD LOSS REDUCTION RESERVOIRS
16 Prompton (1) D FL none 6,614 W. Br. Lackawaxen River; Wayne, PA
17 Beltzville (1) D WSA, FL 12,978 8,797 Pohopoco Creek; Carbon, PA
18 Marsh Creek (1) C WS,WSA,FL5 4,040 1,160 Marsh Creek; Chester, PA
Chambers Lake (2) (Hibernia Dam)
WS,WSA 383 - Birch Run; Chester, PA
19 Blue Marsh (1) S WSA,FL 4,757 10,554 Tulpehocken Creek; Berks, PA
Lake Galena (nw) WS,FL 1,629 1,127 N. Br. Neshaminy Creek; Bucks, PA
20 Francis E. Walter (1) D FL none 35,190 Lehigh River; Luzerne, Carbon, PA
21 Jadwin (1) D FL none 7,983 Dyberry Creek; Wayne, PA
22 Merrill Creek (1) D WSA 15,640 - Merrill Creek; Hunterdon, NJ
Subtotal: 39,427 71,425
Total Storage 414,625 1 Purposes:
WS-Water supply primarily for local use. WSA- Water supply primarily for flow augmentation to replace consumptive uses and meet instream needs. FL- Flood loss reduction.
(Many of these reservoirs are also designed to enhance fish and wildlife habitat and increase recreational opportunities). P- Hydroelectric Power Generation
2 Used for water supply only on an emergency basis * The number in the ( )s indicates modeling priority. 3 Used for flow maintenance during drought emergencies ** The letter indicates major sub-basin: 4 Authorized storage; 28,200 acre-feet to spillway crest D = Delaware, S = Schuylkill, C = Christina 5 Used for flow maintenance in Brandywine Creek nw: Reservoir not located within modeled sub-basins

Appendix A - Scope of Work
A-19
Table A1-2 – Simplified list of the Priority 1 and 2 reservoirs in the Delaware River Basin listed by major
subbasin. The Priority 1 reservoirs will be modeled, the Priority 2 reservoirs will not.
Delaware Basin above Trenton Schuylkill Basin Christina Basin Priority 1 (reservoirs to be modeled)
Nockamixon Blue Marsh Marsh Creek
Cannonsville (NY)
Neversink (NY)
Pepacton (NY)
Lake Wallenpaupack
Mongaup – Rio
Mongaup – Toronto
Mongaup - Swinging Bridge
Prompton
Beltzville
Francis E Walter
Jadwin
Merrill Creek
Basin Total = 13 1 1
Priority 2 (reservoirs for future consideration)
Penn Forest Still Creek Edgar Hoopes
Wild Creek Green Lane Chambers Lake
Hopatcong Ontelaunee (Hibernia Dam)
Basin Total = 3 3 2
The following reservoirs will not be modeled
Geist
Union Lake
Lake Galena

Appendix A- Scope of Work
A-20
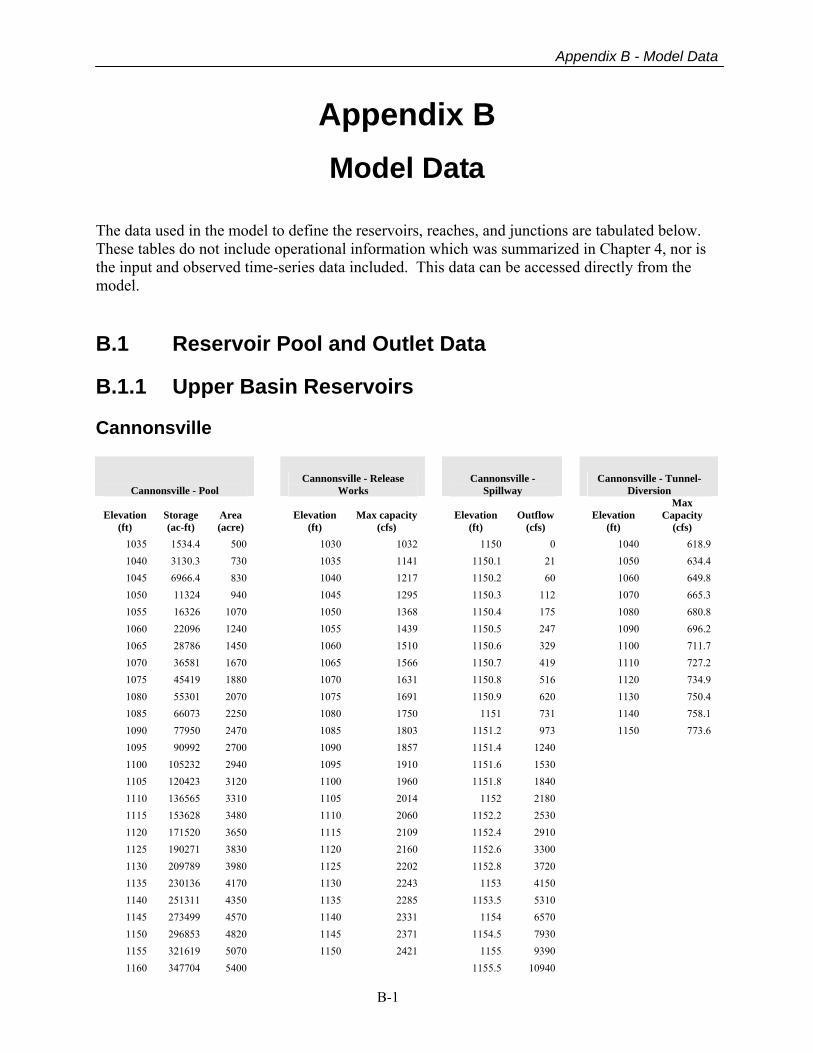
Appendix B - Model Data
B-1
Appendix B
Model Data The data used in the model to define the reservoirs, reaches, and junctions are tabulated below. These tables do not include operational information which was summarized in Chapter 4, nor is the input and observed time-series data included. This data can be accessed directly from the model. B.1 Reservoir Pool and Outlet Data B.1.1 Upper Basin Reservoirs Cannonsville
Cannonsville - Pool Cannonsville - Release
Works Cannonsville -
Spillway Cannonsville - Tunnel-
Diversion
Elevation (ft)
Storage (ac-ft)
Area (acre)
Elevation (ft)
Max capacity (cfs)
Elevation (ft)
Outflow (cfs)
Elevation (ft)
Max Capacity
(cfs) 1035 1534.4 500 1030 1032 1150 0 1040 618.9 1040 3130.3 730 1035 1141 1150.1 21 1050 634.4 1045 6966.4 830 1040 1217 1150.2 60 1060 649.8 1050 11324 940 1045 1295 1150.3 112 1070 665.3 1055 16326 1070 1050 1368 1150.4 175 1080 680.8 1060 22096 1240 1055 1439 1150.5 247 1090 696.2 1065 28786 1450 1060 1510 1150.6 329 1100 711.7 1070 36581 1670 1065 1566 1150.7 419 1110 727.2 1075 45419 1880 1070 1631 1150.8 516 1120 734.9 1080 55301 2070 1075 1691 1150.9 620 1130 750.4 1085 66073 2250 1080 1750 1151 731 1140 758.1 1090 77950 2470 1085 1803 1151.2 973 1150 773.6 1095 90992 2700 1090 1857 1151.4 1240 1100 105232 2940 1095 1910 1151.6 1530 1105 120423 3120 1100 1960 1151.8 1840 1110 136565 3310 1105 2014 1152 2180 1115 153628 3480 1110 2060 1152.2 2530 1120 171520 3650 1115 2109 1152.4 2910 1125 190271 3830 1120 2160 1152.6 3300 1130 209789 3980 1125 2202 1152.8 3720 1135 230136 4170 1130 2243 1153 4150 1140 251311 4350 1135 2285 1153.5 5310 1145 273499 4570 1140 2331 1154 6570 1150 296853 4820 1145 2371 1154.5 7930 1155 321619 5070 1150 2421 1155 9390 1160 347704 5400 1155.5 10940
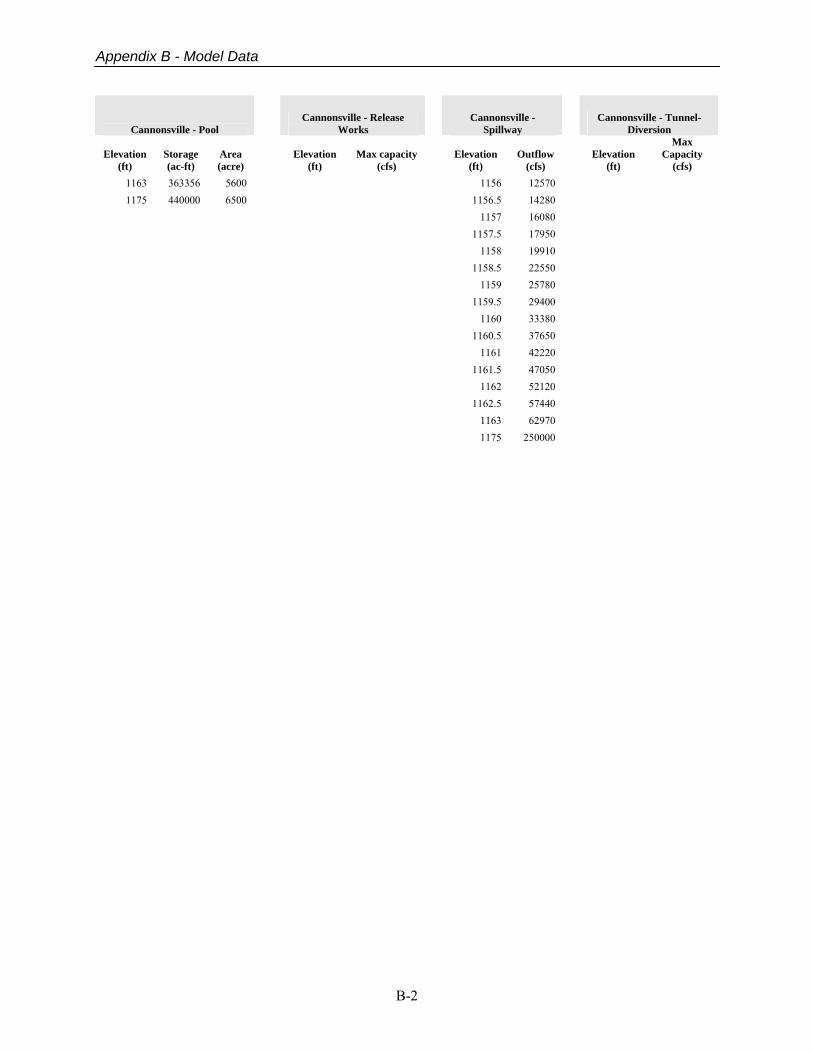
Appendix B - Model Data
B-2
Cannonsville - Pool Cannonsville - Release
Works Cannonsville -
Spillway Cannonsville - Tunnel-
Diversion
Elevation (ft)
Storage (ac-ft)
Area (acre)
Elevation (ft)
Max capacity (cfs)
Elevation (ft)
Outflow (cfs)
Elevation (ft)
Max Capacity
(cfs) 1163 363356 5600 1156 12570 1175 440000 6500 1156.5 14280
1157 16080 1157.5 17950 1158 19910 1158.5 22550 1159 25780 1159.5 29400 1160 33380 1160.5 37650 1161 42220 1161.5 47050 1162 52120 1162.5 57440 1163 62970 1175 250000
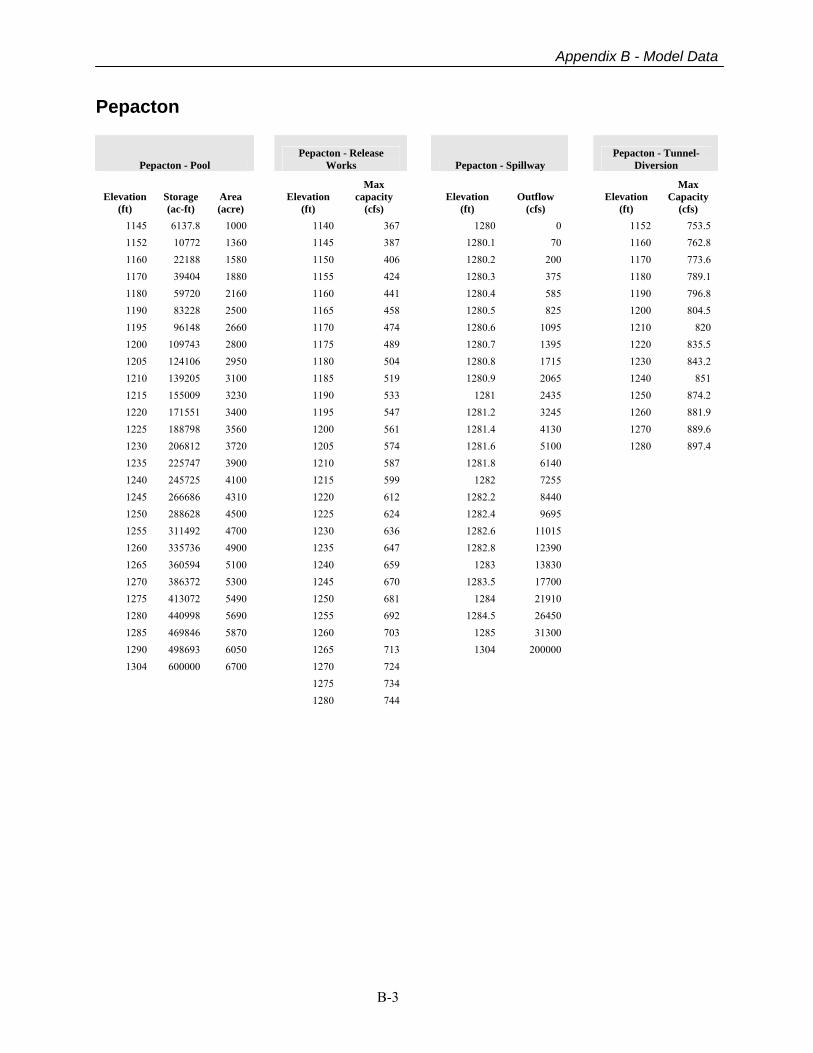
Appendix B - Model Data
B-3
Pepacton
Pepacton - Pool Pepacton - Release
Works Pepacton - Spillway Pepacton - Tunnel-
Diversion
Elevation (ft)
Storage (ac-ft)
Area (acre)
Elevation (ft)
Max capacity
(cfs) Elevation
(ft) Outflow
(cfs) Elevation
(ft)
Max Capacity
(cfs) 1145 6137.8 1000 1140 367 1280 0 1152 753.5 1152 10772 1360 1145 387 1280.1 70 1160 762.8 1160 22188 1580 1150 406 1280.2 200 1170 773.6 1170 39404 1880 1155 424 1280.3 375 1180 789.1 1180 59720 2160 1160 441 1280.4 585 1190 796.8 1190 83228 2500 1165 458 1280.5 825 1200 804.5 1195 96148 2660 1170 474 1280.6 1095 1210 820 1200 109743 2800 1175 489 1280.7 1395 1220 835.5 1205 124106 2950 1180 504 1280.8 1715 1230 843.2 1210 139205 3100 1185 519 1280.9 2065 1240 851 1215 155009 3230 1190 533 1281 2435 1250 874.2 1220 171551 3400 1195 547 1281.2 3245 1260 881.9 1225 188798 3560 1200 561 1281.4 4130 1270 889.6 1230 206812 3720 1205 574 1281.6 5100 1280 897.4 1235 225747 3900 1210 587 1281.8 6140 1240 245725 4100 1215 599 1282 7255 1245 266686 4310 1220 612 1282.2 8440 1250 288628 4500 1225 624 1282.4 9695 1255 311492 4700 1230 636 1282.6 11015 1260 335736 4900 1235 647 1282.8 12390 1265 360594 5100 1240 659 1283 13830 1270 386372 5300 1245 670 1283.5 17700 1275 413072 5490 1250 681 1284 21910 1280 440998 5690 1255 692 1284.5 26450 1285 469846 5870 1260 703 1285 31300 1290 498693 6050 1265 713 1304 200000 1304 600000 6700 1270 724
1275 734 1280 744
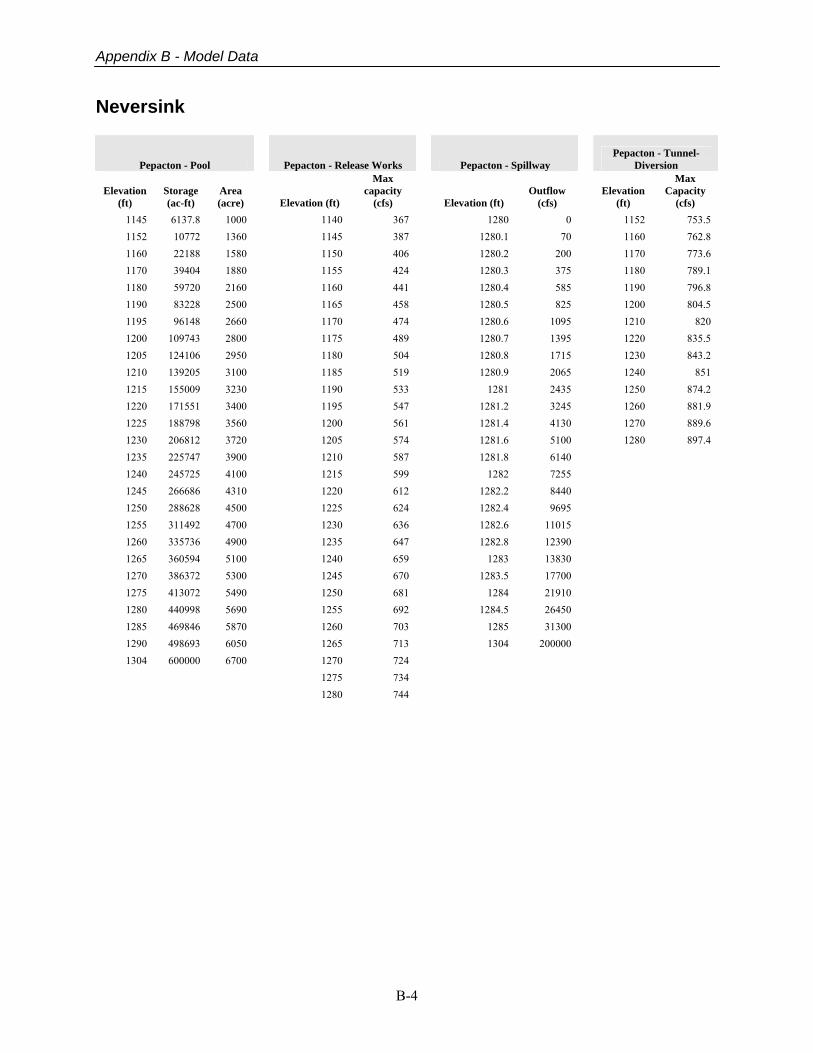
Appendix B - Model Data
B-4
Neversink
Pepacton - Pool Pepacton - Release Works Pepacton - Spillway Pepacton - Tunnel-
Diversion
Elevation (ft)
Storage (ac-ft)
Area (acre) Elevation (ft)
Max capacity
(cfs) Elevation (ft) Outflow
(cfs) Elevation
(ft)
Max Capacity
(cfs) 1145 6137.8 1000 1140 367 1280 0 1152 753.5 1152 10772 1360 1145 387 1280.1 70 1160 762.8 1160 22188 1580 1150 406 1280.2 200 1170 773.6 1170 39404 1880 1155 424 1280.3 375 1180 789.1 1180 59720 2160 1160 441 1280.4 585 1190 796.8 1190 83228 2500 1165 458 1280.5 825 1200 804.5 1195 96148 2660 1170 474 1280.6 1095 1210 820 1200 109743 2800 1175 489 1280.7 1395 1220 835.5 1205 124106 2950 1180 504 1280.8 1715 1230 843.2 1210 139205 3100 1185 519 1280.9 2065 1240 851 1215 155009 3230 1190 533 1281 2435 1250 874.2 1220 171551 3400 1195 547 1281.2 3245 1260 881.9 1225 188798 3560 1200 561 1281.4 4130 1270 889.6 1230 206812 3720 1205 574 1281.6 5100 1280 897.4 1235 225747 3900 1210 587 1281.8 6140 1240 245725 4100 1215 599 1282 7255 1245 266686 4310 1220 612 1282.2 8440 1250 288628 4500 1225 624 1282.4 9695 1255 311492 4700 1230 636 1282.6 11015 1260 335736 4900 1235 647 1282.8 12390 1265 360594 5100 1240 659 1283 13830 1270 386372 5300 1245 670 1283.5 17700 1275 413072 5490 1250 681 1284 21910 1280 440998 5690 1255 692 1284.5 26450 1285 469846 5870 1260 703 1285 31300 1290 498693 6050 1265 713 1304 200000 1304 600000 6700 1270 724
1275 734 1280 744
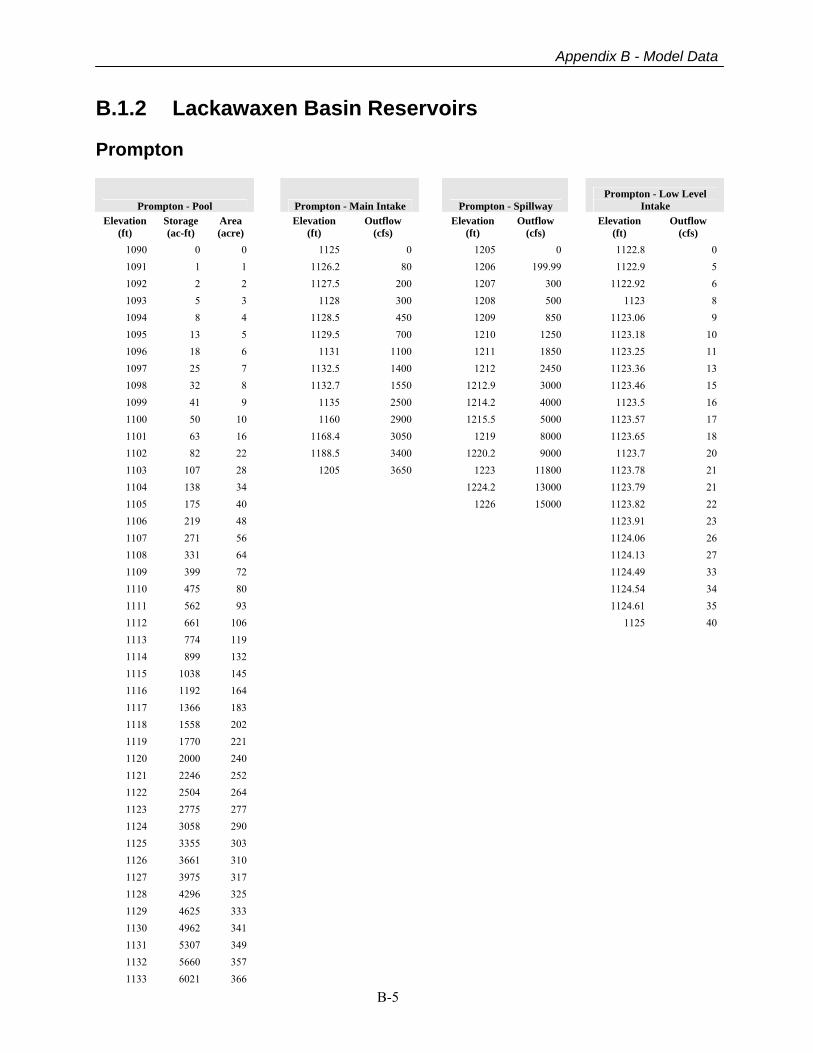
Appendix B - Model Data
B-5
B.1.2 Lackawaxen Basin Reservoirs Prompton
Prompton - Pool Prompton - Main Intake Prompton - Spillway Prompton - Low Level
Intake Elevation
(ft) Storage (ac-ft)
Area (acre)
Elevation (ft)
Outflow (cfs)
Elevation (ft)
Outflow (cfs)
Elevation (ft)
Outflow (cfs)
1090 0 0 1125 0 1205 0 1122.8 0 1091 1 1 1126.2 80 1206 199.99 1122.9 5 1092 2 2 1127.5 200 1207 300 1122.92 6 1093 5 3 1128 300 1208 500 1123 8 1094 8 4 1128.5 450 1209 850 1123.06 9 1095 13 5 1129.5 700 1210 1250 1123.18 10 1096 18 6 1131 1100 1211 1850 1123.25 11 1097 25 7 1132.5 1400 1212 2450 1123.36 13 1098 32 8 1132.7 1550 1212.9 3000 1123.46 15 1099 41 9 1135 2500 1214.2 4000 1123.5 16 1100 50 10 1160 2900 1215.5 5000 1123.57 17 1101 63 16 1168.4 3050 1219 8000 1123.65 18 1102 82 22 1188.5 3400 1220.2 9000 1123.7 20 1103 107 28 1205 3650 1223 11800 1123.78 21 1104 138 34 1224.2 13000 1123.79 21 1105 175 40 1226 15000 1123.82 22 1106 219 48 1123.91 23 1107 271 56 1124.06 26 1108 331 64 1124.13 27 1109 399 72 1124.49 33 1110 475 80 1124.54 34 1111 562 93 1124.61 35 1112 661 106 1125 40 1113 774 119 1114 899 132 1115 1038 145 1116 1192 164 1117 1366 183 1118 1558 202 1119 1770 221 1120 2000 240 1121 2246 252 1122 2504 264 1123 2775 277 1124 3058 290 1125 3355 303 1126 3661 310 1127 3975 317 1128 4296 325 1129 4625 333 1130 4962 341 1131 5307 349 1132 5660 357 1133 6021 366
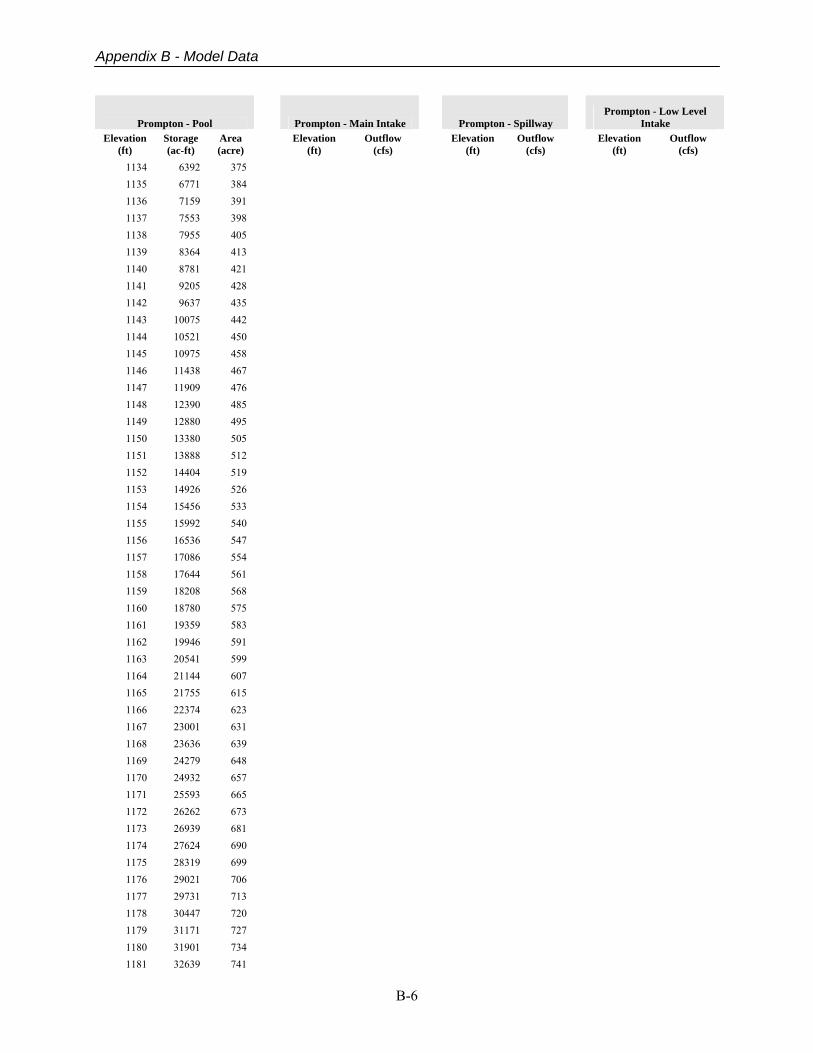
Appendix B - Model Data
B-6
Prompton - Pool Prompton - Main Intake Prompton - Spillway Prompton - Low Level
Intake Elevation
(ft) Storage (ac-ft)
Area (acre)
Elevation (ft)
Outflow (cfs)
Elevation (ft)
Outflow (cfs)
Elevation (ft)
Outflow (cfs)
1134 6392 375 1135 6771 384 1136 7159 391 1137 7553 398 1138 7955 405 1139 8364 413 1140 8781 421 1141 9205 428 1142 9637 435 1143 10075 442 1144 10521 450 1145 10975 458 1146 11438 467 1147 11909 476 1148 12390 485 1149 12880 495 1150 13380 505 1151 13888 512 1152 14404 519 1153 14926 526 1154 15456 533 1155 15992 540 1156 16536 547 1157 17086 554 1158 17644 561 1159 18208 568 1160 18780 575 1161 19359 583 1162 19946 591 1163 20541 599 1164 21144 607 1165 21755 615 1166 22374 623 1167 23001 631 1168 23636 639 1169 24279 648 1170 24932 657 1171 25593 665 1172 26262 673 1173 26939 681 1174 27624 690 1175 28319 699 1176 29021 706 1177 29731 713 1178 30447 720 1179 31171 727 1180 31901 734 1181 32639 741
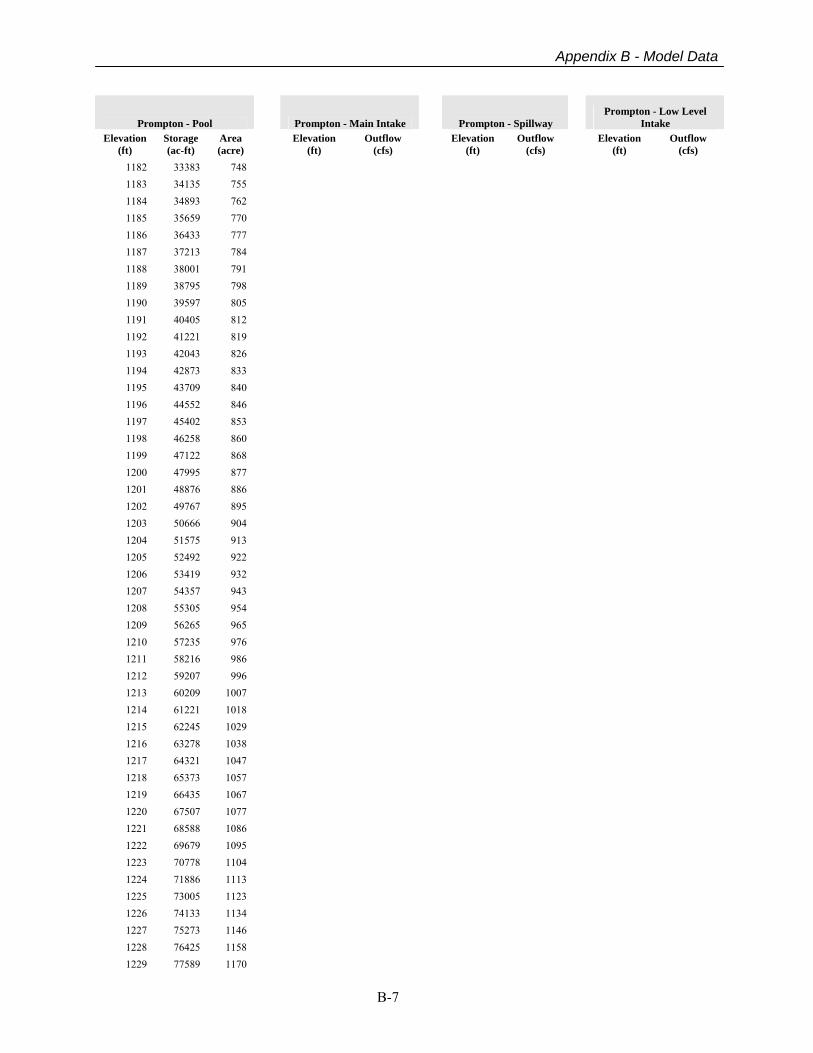
Appendix B - Model Data
B-7
Prompton - Pool Prompton - Main Intake Prompton - Spillway Prompton - Low Level
Intake Elevation
(ft) Storage (ac-ft)
Area (acre)
Elevation (ft)
Outflow (cfs)
Elevation (ft)
Outflow (cfs)
Elevation (ft)
Outflow (cfs)
1182 33383 748 1183 34135 755 1184 34893 762 1185 35659 770 1186 36433 777 1187 37213 784 1188 38001 791 1189 38795 798 1190 39597 805 1191 40405 812 1192 41221 819 1193 42043 826 1194 42873 833 1195 43709 840 1196 44552 846 1197 45402 853 1198 46258 860 1199 47122 868 1200 47995 877 1201 48876 886 1202 49767 895 1203 50666 904 1204 51575 913 1205 52492 922 1206 53419 932 1207 54357 943 1208 55305 954 1209 56265 965 1210 57235 976 1211 58216 986 1212 59207 996 1213 60209 1007 1214 61221 1018 1215 62245 1029 1216 63278 1038 1217 64321 1047 1218 65373 1057 1219 66435 1067 1220 67507 1077 1221 68588 1086 1222 69679 1095 1223 70778 1104 1224 71886 1113 1225 73005 1123 1226 74133 1134 1227 75273 1146 1228 76425 1158 1229 77589 1170

Appendix B - Model Data
B-8
Prompton - Pool Prompton - Main Intake Prompton - Spillway Prompton - Low Level
Intake Elevation
(ft) Storage (ac-ft)
Area (acre)
Elevation (ft)
Outflow (cfs)
Elevation (ft)
Outflow (cfs)
Elevation (ft)
Outflow (cfs)
1230 78765 1182 1231 79952 1191 1232 81148 1201 1233 82354 1211 1234 83570 1221 1235 84796 1231 1236 86031 1239 1237 87274 1247 1238 88585 1255 1239 89784 1264 1240 91053 1273
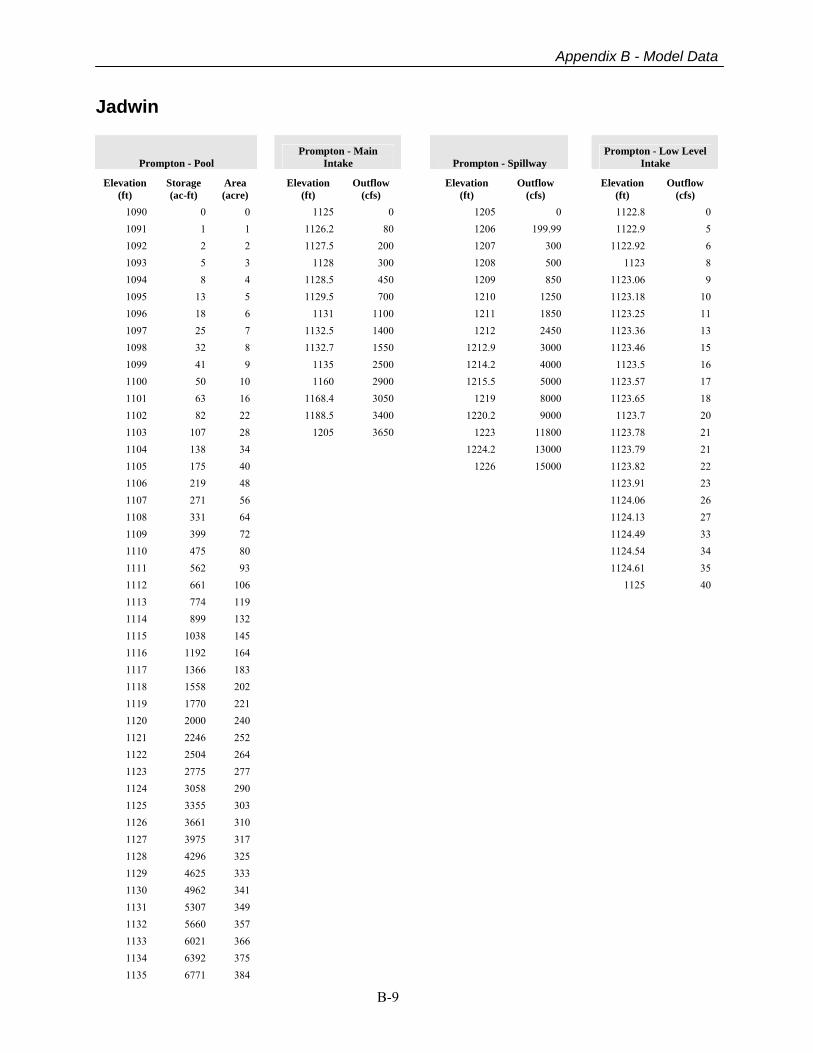
Appendix B - Model Data
B-9
Jadwin
Prompton - Pool Prompton - Main
Intake Prompton - Spillway Prompton - Low Level
Intake
Elevation (ft)
Storage (ac-ft)
Area (acre)
Elevation (ft)
Outflow (cfs)
Elevation (ft)
Outflow (cfs)
Elevation (ft)
Outflow (cfs)
1090 0 0 1125 0 1205 0 1122.8 0 1091 1 1 1126.2 80 1206 199.99 1122.9 5 1092 2 2 1127.5 200 1207 300 1122.92 6 1093 5 3 1128 300 1208 500 1123 8 1094 8 4 1128.5 450 1209 850 1123.06 9 1095 13 5 1129.5 700 1210 1250 1123.18 10 1096 18 6 1131 1100 1211 1850 1123.25 11 1097 25 7 1132.5 1400 1212 2450 1123.36 13 1098 32 8 1132.7 1550 1212.9 3000 1123.46 15 1099 41 9 1135 2500 1214.2 4000 1123.5 16 1100 50 10 1160 2900 1215.5 5000 1123.57 17 1101 63 16 1168.4 3050 1219 8000 1123.65 18 1102 82 22 1188.5 3400 1220.2 9000 1123.7 20 1103 107 28 1205 3650 1223 11800 1123.78 21 1104 138 34 1224.2 13000 1123.79 21 1105 175 40 1226 15000 1123.82 22 1106 219 48 1123.91 23 1107 271 56 1124.06 26 1108 331 64 1124.13 27 1109 399 72 1124.49 33 1110 475 80 1124.54 34 1111 562 93 1124.61 35 1112 661 106 1125 40 1113 774 119 1114 899 132 1115 1038 145 1116 1192 164 1117 1366 183 1118 1558 202 1119 1770 221 1120 2000 240 1121 2246 252 1122 2504 264 1123 2775 277 1124 3058 290 1125 3355 303 1126 3661 310 1127 3975 317 1128 4296 325 1129 4625 333 1130 4962 341 1131 5307 349 1132 5660 357 1133 6021 366 1134 6392 375 1135 6771 384
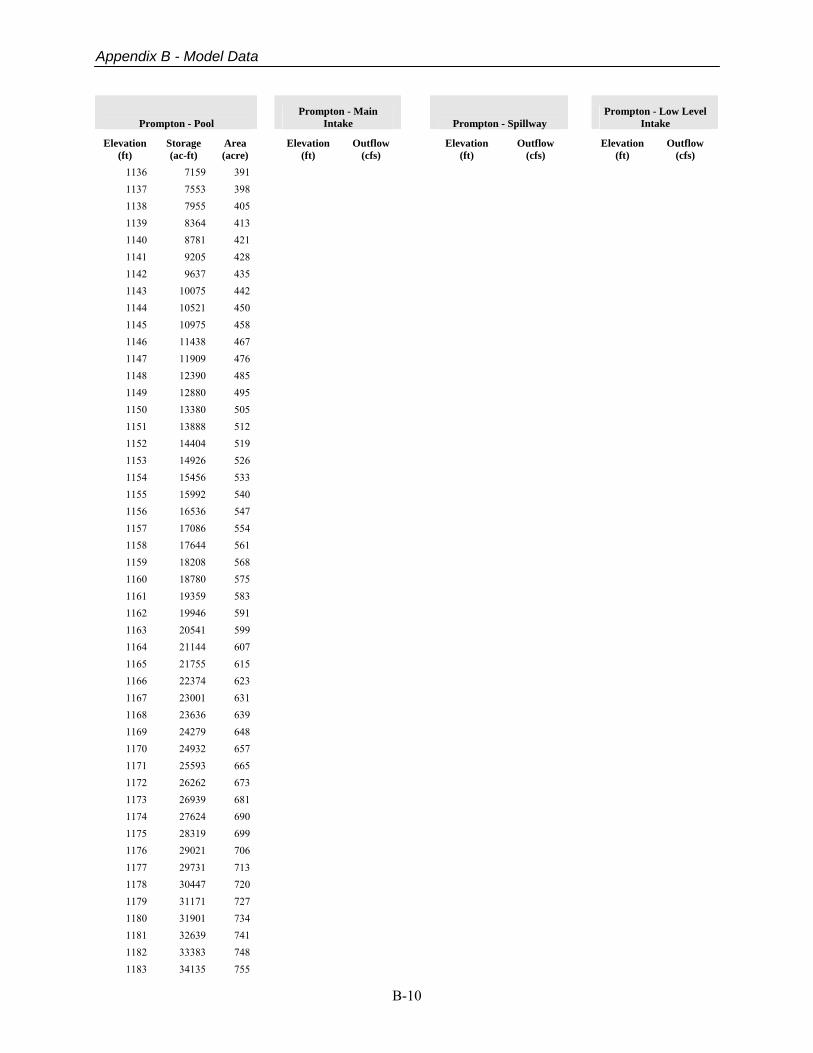
Appendix B - Model Data
B-10
Prompton - Pool Prompton - Main
Intake Prompton - Spillway Prompton - Low Level
Intake
Elevation (ft)
Storage (ac-ft)
Area (acre)
Elevation (ft)
Outflow (cfs)
Elevation (ft)
Outflow (cfs)
Elevation (ft)
Outflow (cfs)
1136 7159 391 1137 7553 398 1138 7955 405 1139 8364 413 1140 8781 421 1141 9205 428 1142 9637 435 1143 10075 442 1144 10521 450 1145 10975 458 1146 11438 467 1147 11909 476 1148 12390 485 1149 12880 495 1150 13380 505 1151 13888 512 1152 14404 519 1153 14926 526 1154 15456 533 1155 15992 540 1156 16536 547 1157 17086 554 1158 17644 561 1159 18208 568 1160 18780 575 1161 19359 583 1162 19946 591 1163 20541 599 1164 21144 607 1165 21755 615 1166 22374 623 1167 23001 631 1168 23636 639 1169 24279 648 1170 24932 657 1171 25593 665 1172 26262 673 1173 26939 681 1174 27624 690 1175 28319 699 1176 29021 706 1177 29731 713 1178 30447 720 1179 31171 727 1180 31901 734 1181 32639 741 1182 33383 748 1183 34135 755

Appendix B - Model Data
B-11
Prompton - Pool Prompton - Main
Intake Prompton - Spillway Prompton - Low Level
Intake
Elevation (ft)
Storage (ac-ft)
Area (acre)
Elevation (ft)
Outflow (cfs)
Elevation (ft)
Outflow (cfs)
Elevation (ft)
Outflow (cfs)
1184 34893 762 1185 35659 770 1186 36433 777 1187 37213 784 1188 38001 791 1189 38795 798 1190 39597 805 1191 40405 812 1192 41221 819 1193 42043 826 1194 42873 833 1195 43709 840 1196 44552 846 1197 45402 853 1198 46258 860 1199 47122 868 1200 47995 877 1201 48876 886 1202 49767 895 1203 50666 904 1204 51575 913 1205 52492 922 1206 53419 932 1207 54357 943 1208 55305 954 1209 56265 965 1210 57235 976 1211 58216 986 1212 59207 996 1213 60209 1007 1214 61221 1018 1215 62245 1029 1216 63278 1038 1217 64321 1047 1218 65373 1057 1219 66435 1067 1220 67507 1077 1221 68588 1086 1222 69679 1095 1223 70778 1104 1224 71886 1113 1225 73005 1123 1226 74133 1134 1227 75273 1146 1228 76425 1158 1229 77589 1170 1230 78765 1182 1231 79952 1191

Appendix B - Model Data
B-12
Prompton - Pool Prompton - Main
Intake Prompton - Spillway Prompton - Low Level
Intake
Elevation (ft)
Storage (ac-ft)
Area (acre)
Elevation (ft)
Outflow (cfs)
Elevation (ft)
Outflow (cfs)
Elevation (ft)
Outflow (cfs)
1232 81148 1201 1233 82354 1211 1234 83570 1221 1235 84796 1231 1236 86031 1239 1237 87274 1247 1238 88585 1255 1239 89784 1264 1240 91053 1273
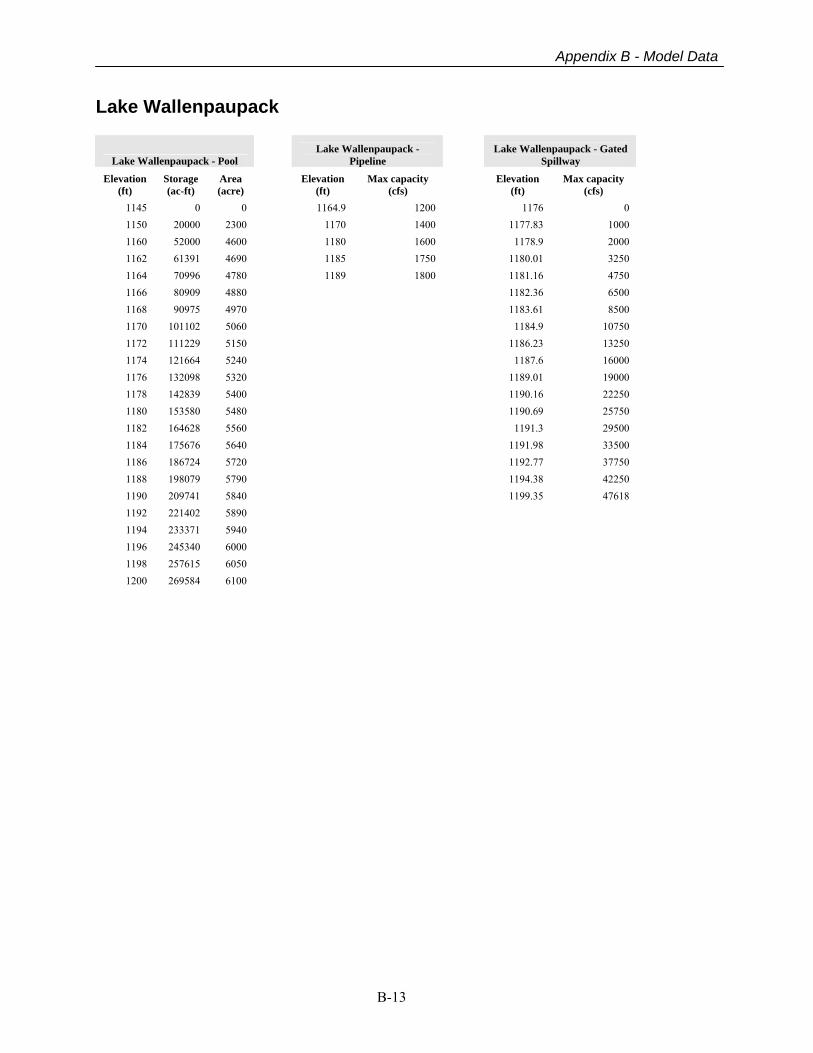
Appendix B - Model Data
B-13
Lake Wallenpaupack
Lake Wallenpaupack - Pool Lake Wallenpaupack -
Pipeline Lake Wallenpaupack - Gated
Spillway
Elevation (ft)
Storage (ac-ft)
Area (acre)
Elevation (ft)
Max capacity (cfs)
Elevation (ft)
Max capacity (cfs)
1145 0 0 1164.9 1200 1176 0 1150 20000 2300 1170 1400 1177.83 1000 1160 52000 4600 1180 1600 1178.9 2000 1162 61391 4690 1185 1750 1180.01 3250 1164 70996 4780 1189 1800 1181.16 4750 1166 80909 4880 1182.36 6500 1168 90975 4970 1183.61 8500 1170 101102 5060 1184.9 10750 1172 111229 5150 1186.23 13250 1174 121664 5240 1187.6 16000 1176 132098 5320 1189.01 19000 1178 142839 5400 1190.16 22250 1180 153580 5480 1190.69 25750 1182 164628 5560 1191.3 29500 1184 175676 5640 1191.98 33500 1186 186724 5720 1192.77 37750 1188 198079 5790 1194.38 42250 1190 209741 5840 1199.35 47618 1192 221402 5890 1194 233371 5940 1196 245340 6000 1198 257615 6050 1200 269584 6100
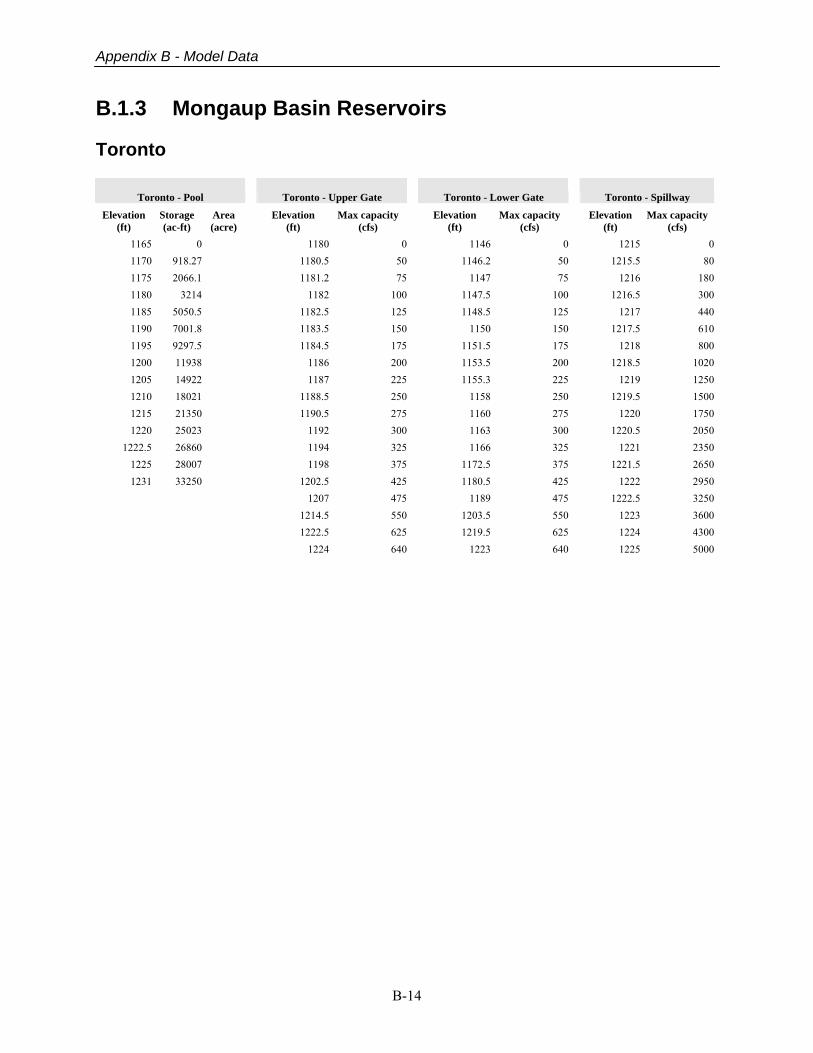
Appendix B - Model Data
B-14
B.1.3 Mongaup Basin Reservoirs Toronto
Toronto - Pool Toronto - Upper Gate Toronto - Lower Gate Toronto - Spillway
Elevation (ft)
Storage (ac-ft)
Area (acre)
Elevation (ft)
Max capacity (cfs)
Elevation (ft)
Max capacity (cfs)
Elevation (ft)
Max capacity (cfs)
1165 0 1180 0 1146 0 1215 01170 918.27 1180.5 50 1146.2 50 1215.5 801175 2066.1 1181.2 75 1147 75 1216 1801180 3214 1182 100 1147.5 100 1216.5 3001185 5050.5 1182.5 125 1148.5 125 1217 4401190 7001.8 1183.5 150 1150 150 1217.5 6101195 9297.5 1184.5 175 1151.5 175 1218 8001200 11938 1186 200 1153.5 200 1218.5 10201205 14922 1187 225 1155.3 225 1219 12501210 18021 1188.5 250 1158 250 1219.5 15001215 21350 1190.5 275 1160 275 1220 17501220 25023 1192 300 1163 300 1220.5 2050
1222.5 26860 1194 325 1166 325 1221 23501225 28007 1198 375 1172.5 375 1221.5 26501231 33250 1202.5 425 1180.5 425 1222 2950
1207 475 1189 475 1222.5 3250 1214.5 550 1203.5 550 1223 3600 1222.5 625 1219.5 625 1224 4300 1224 640 1223 640 1225 5000
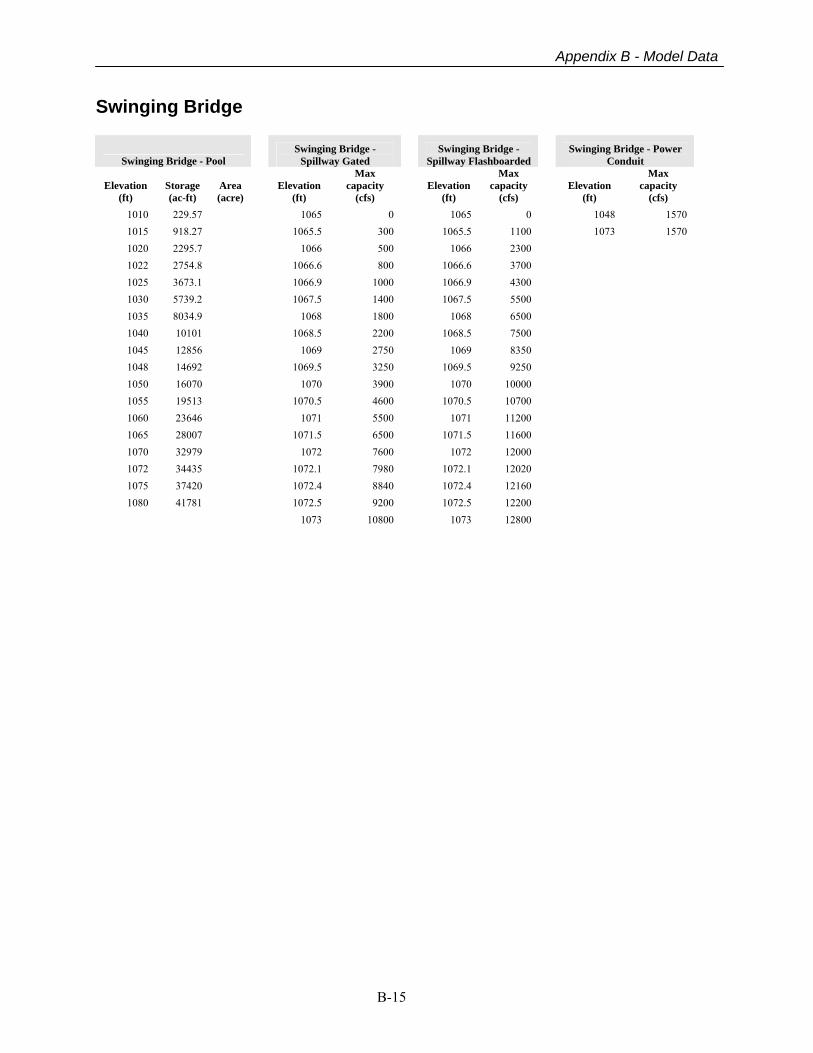
Appendix B - Model Data
B-15
Swinging Bridge
Swinging Bridge - Pool Swinging Bridge -
Spillway Gated Swinging Bridge -
Spillway Flashboarded Swinging Bridge - Power
Conduit
Elevation (ft)
Storage (ac-ft)
Area (acre)
Elevation (ft)
Max capacity
(cfs) Elevation
(ft)
Max capacity
(cfs) Elevation
(ft)
Max capacity
(cfs) 1010 229.57 1065 0 1065 0 1048 1570 1015 918.27 1065.5 300 1065.5 1100 1073 1570 1020 2295.7 1066 500 1066 2300 1022 2754.8 1066.6 800 1066.6 3700 1025 3673.1 1066.9 1000 1066.9 4300 1030 5739.2 1067.5 1400 1067.5 5500 1035 8034.9 1068 1800 1068 6500 1040 10101 1068.5 2200 1068.5 7500 1045 12856 1069 2750 1069 8350 1048 14692 1069.5 3250 1069.5 9250 1050 16070 1070 3900 1070 10000 1055 19513 1070.5 4600 1070.5 10700 1060 23646 1071 5500 1071 11200 1065 28007 1071.5 6500 1071.5 11600 1070 32979 1072 7600 1072 12000 1072 34435 1072.1 7980 1072.1 12020 1075 37420 1072.4 8840 1072.4 12160 1080 41781 1072.5 9200 1072.5 12200
1073 10800 1073 12800
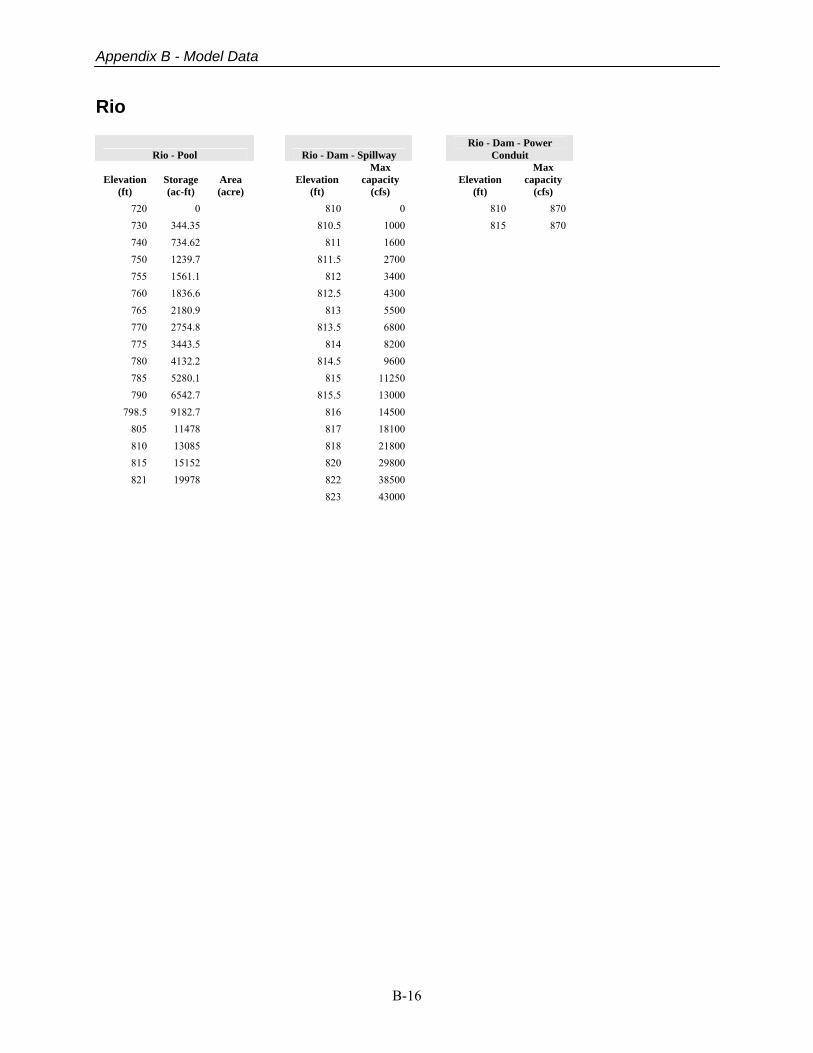
Appendix B - Model Data
B-16
Rio
Rio - Pool Rio - Dam - Spillway Rio - Dam - Power
Conduit
Elevation (ft)
Storage (ac-ft)
Area (acre)
Elevation (ft)
Max capacity
(cfs) Elevation
(ft)
Max capacity
(cfs) 720 0 810 0 810 870 730 344.35 810.5 1000 815 870 740 734.62 811 1600 750 1239.7 811.5 2700 755 1561.1 812 3400 760 1836.6 812.5 4300 765 2180.9 813 5500 770 2754.8 813.5 6800 775 3443.5 814 8200 780 4132.2 814.5 9600 785 5280.1 815 11250 790 6542.7 815.5 13000
798.5 9182.7 816 14500 805 11478 817 18100 810 13085 818 21800 815 15152 820 29800 821 19978 822 38500
823 43000
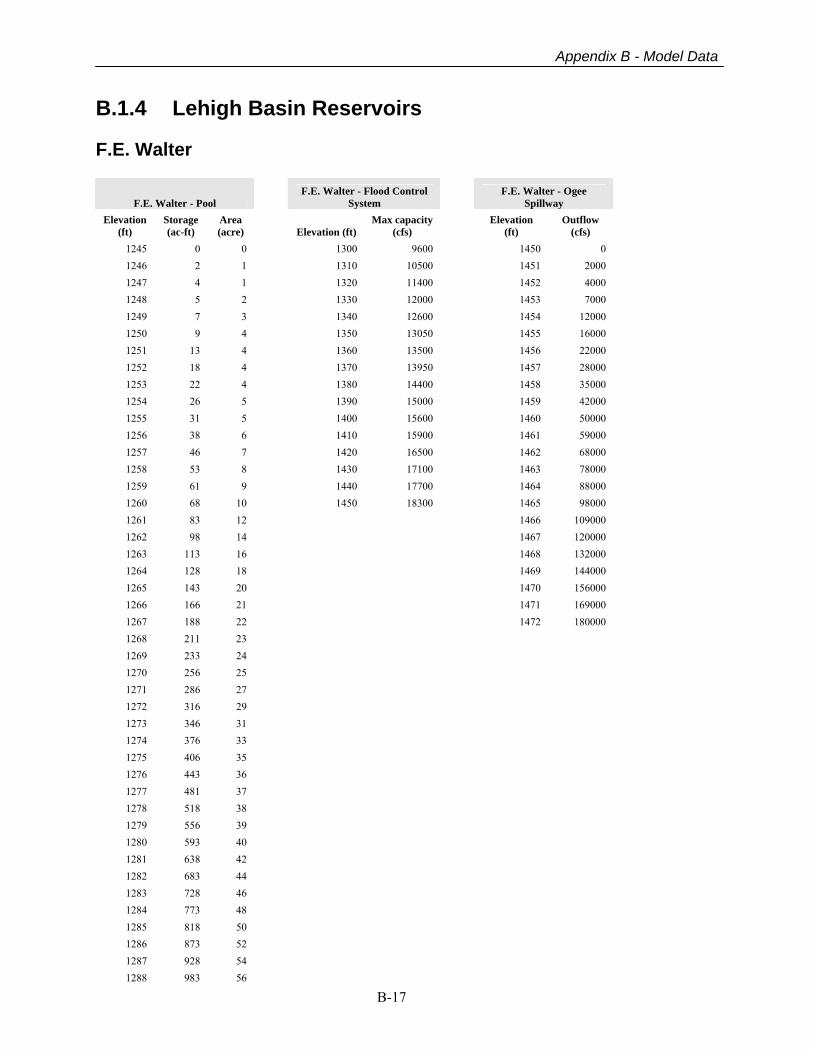
Appendix B - Model Data
B-17
B.1.4 Lehigh Basin Reservoirs F.E. Walter
F.E. Walter - Pool F.E. Walter - Flood Control
System F.E. Walter - Ogee
Spillway Elevation
(ft) Storage (ac-ft)
Area (acre) Elevation (ft)
Max capacity (cfs)
Elevation (ft)
Outflow (cfs)
1245 0 0 1300 9600 1450 0 1246 2 1 1310 10500 1451 2000 1247 4 1 1320 11400 1452 4000 1248 5 2 1330 12000 1453 7000 1249 7 3 1340 12600 1454 12000 1250 9 4 1350 13050 1455 16000 1251 13 4 1360 13500 1456 22000 1252 18 4 1370 13950 1457 28000 1253 22 4 1380 14400 1458 35000 1254 26 5 1390 15000 1459 42000 1255 31 5 1400 15600 1460 50000 1256 38 6 1410 15900 1461 59000 1257 46 7 1420 16500 1462 68000 1258 53 8 1430 17100 1463 78000 1259 61 9 1440 17700 1464 88000 1260 68 10 1450 18300 1465 98000 1261 83 12 1466 109000 1262 98 14 1467 120000 1263 113 16 1468 132000 1264 128 18 1469 144000 1265 143 20 1470 156000 1266 166 21 1471 169000 1267 188 22 1472 180000 1268 211 23 1269 233 24 1270 256 25 1271 286 27 1272 316 29 1273 346 31 1274 376 33 1275 406 35 1276 443 36 1277 481 37 1278 518 38 1279 556 39 1280 593 40 1281 638 42 1282 683 44 1283 728 46 1284 773 48 1285 818 50 1286 873 52 1287 928 54 1288 983 56

Appendix B - Model Data
B-18
F.E. Walter - Pool F.E. Walter - Flood Control
System F.E. Walter - Ogee
Spillway Elevation
(ft) Storage (ac-ft)
Area (acre) Elevation (ft)
Max capacity (cfs)
Elevation (ft)
Outflow (cfs)
1289 1038 58 1290 1093 60 1291 1150 62 1292 1223 64 1293 1288 66 1294 1353 68 1295 1418 70 1296 1493 72 1297 1568 74 1298 1643 76 1299 1718 78 1300 1793 80 1301 1883 84 1302 1973 88 1303 2063 92 1304 2153 96 1305 2243 100 1306 2353 104 1307 2463 108 1308 2573 112 1309 2683 116 1310 2793 120 1311 2923 124 1312 3053 128 1313 3183 132 1314 3313 136 1315 3443 140 1316 3593 144 1317 3743 148 1318 3893 152 1319 4043 156 1320 4193 160 1321 4366 165 1322 4538 170 1323 4711 175 1324 4883 180 1325 5056 185 1326 5253 190 1327 5451 195 1328 5648 200 1329 5846 205 1330 6043 210 1331 6268 216 1332 6493 222 1333 6718 228 1334 6943 234 1335 7168 240 1336 7423 246 1337 7678 252
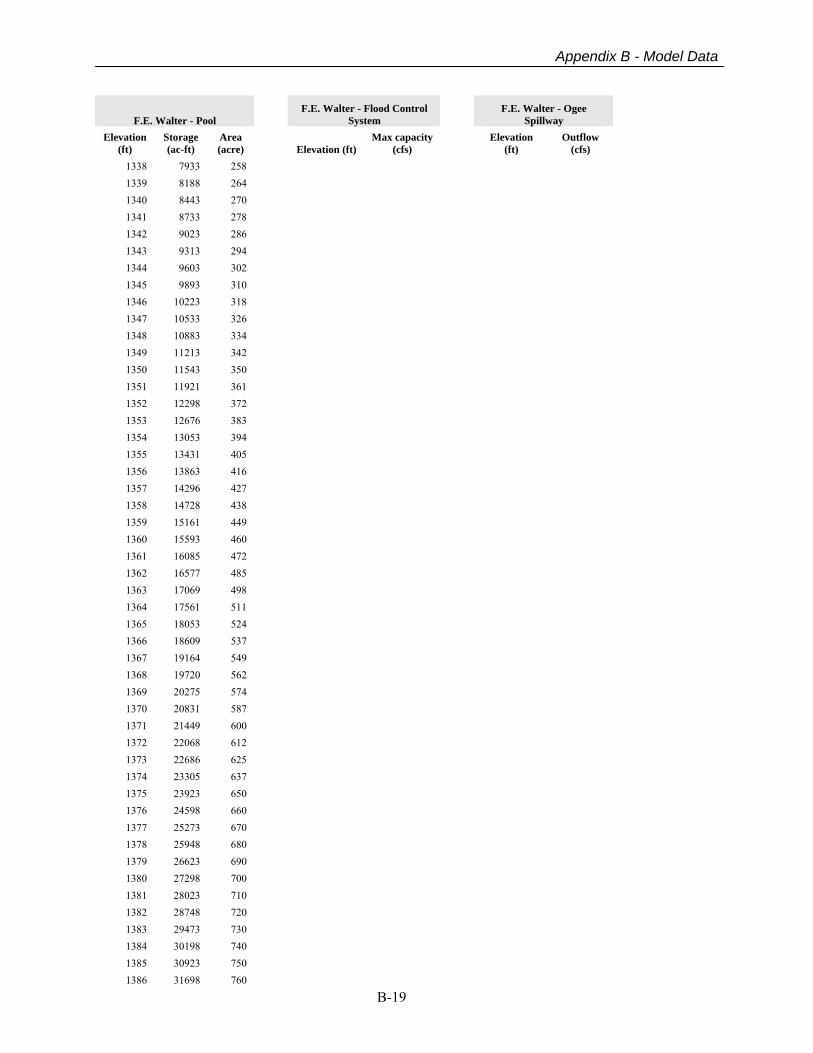
Appendix B - Model Data
B-19
F.E. Walter - Pool F.E. Walter - Flood Control
System F.E. Walter - Ogee
Spillway Elevation
(ft) Storage (ac-ft)
Area (acre) Elevation (ft)
Max capacity (cfs)
Elevation (ft)
Outflow (cfs)
1338 7933 258 1339 8188 264 1340 8443 270 1341 8733 278 1342 9023 286 1343 9313 294 1344 9603 302 1345 9893 310 1346 10223 318 1347 10533 326 1348 10883 334 1349 11213 342 1350 11543 350 1351 11921 361 1352 12298 372 1353 12676 383 1354 13053 394 1355 13431 405 1356 13863 416 1357 14296 427 1358 14728 438 1359 15161 449 1360 15593 460 1361 16085 472 1362 16577 485 1363 17069 498 1364 17561 511 1365 18053 524 1366 18609 537 1367 19164 549 1368 19720 562 1369 20275 574 1370 20831 587 1371 21449 600 1372 22068 612 1373 22686 625 1374 23305 637 1375 23923 650 1376 24598 660 1377 25273 670 1378 25948 680 1379 26623 690 1380 27298 700 1381 28023 710 1382 28748 720 1383 29473 730 1384 30198 740 1385 30923 750 1386 31698 760
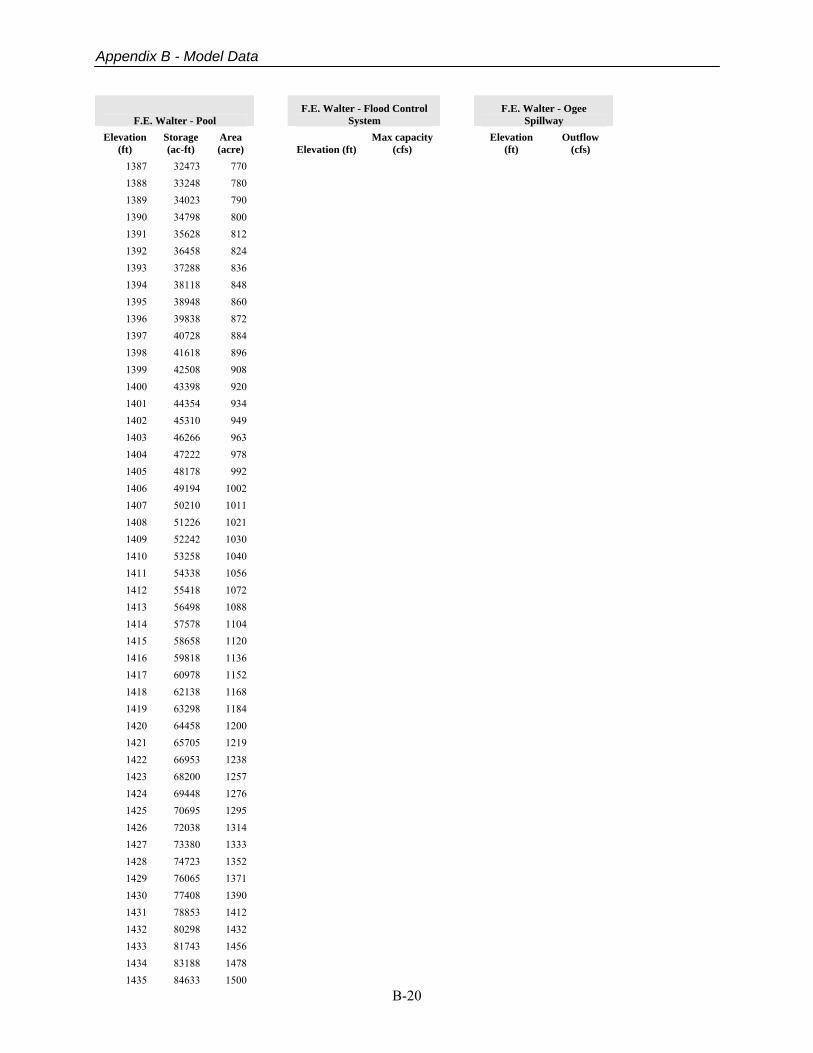
Appendix B - Model Data
B-20
F.E. Walter - Pool F.E. Walter - Flood Control
System F.E. Walter - Ogee
Spillway Elevation
(ft) Storage (ac-ft)
Area (acre) Elevation (ft)
Max capacity (cfs)
Elevation (ft)
Outflow (cfs)
1387 32473 770 1388 33248 780 1389 34023 790 1390 34798 800 1391 35628 812 1392 36458 824 1393 37288 836 1394 38118 848 1395 38948 860 1396 39838 872 1397 40728 884 1398 41618 896 1399 42508 908 1400 43398 920 1401 44354 934 1402 45310 949 1403 46266 963 1404 47222 978 1405 48178 992 1406 49194 1002 1407 50210 1011 1408 51226 1021 1409 52242 1030 1410 53258 1040 1411 54338 1056 1412 55418 1072 1413 56498 1088 1414 57578 1104 1415 58658 1120 1416 59818 1136 1417 60978 1152 1418 62138 1168 1419 63298 1184 1420 64458 1200 1421 65705 1219 1422 66953 1238 1423 68200 1257 1424 69448 1276 1425 70695 1295 1426 72038 1314 1427 73380 1333 1428 74723 1352 1429 76065 1371 1430 77408 1390 1431 78853 1412 1432 80298 1432 1433 81743 1456 1434 83188 1478 1435 84633 1500
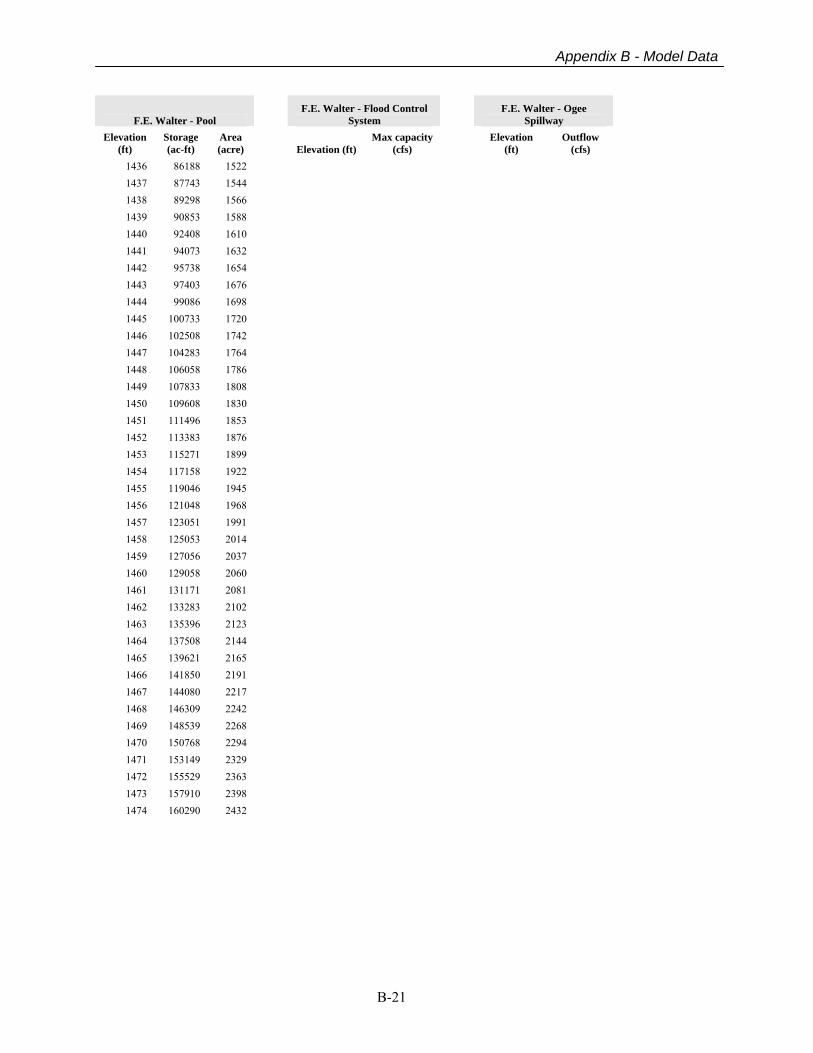
Appendix B - Model Data
B-21
F.E. Walter - Pool F.E. Walter - Flood Control
System F.E. Walter - Ogee
Spillway Elevation
(ft) Storage (ac-ft)
Area (acre) Elevation (ft)
Max capacity (cfs)
Elevation (ft)
Outflow (cfs)
1436 86188 1522 1437 87743 1544 1438 89298 1566 1439 90853 1588 1440 92408 1610 1441 94073 1632 1442 95738 1654 1443 97403 1676 1444 99086 1698 1445 100733 1720 1446 102508 1742 1447 104283 1764 1448 106058 1786 1449 107833 1808 1450 109608 1830 1451 111496 1853 1452 113383 1876 1453 115271 1899 1454 117158 1922 1455 119046 1945 1456 121048 1968 1457 123051 1991 1458 125053 2014 1459 127056 2037 1460 129058 2060 1461 131171 2081 1462 133283 2102 1463 135396 2123 1464 137508 2144 1465 139621 2165 1466 141850 2191 1467 144080 2217 1468 146309 2242 1469 148539 2268 1470 150768 2294 1471 153149 2329 1472 155529 2363 1473 157910 2398 1474 160290 2432
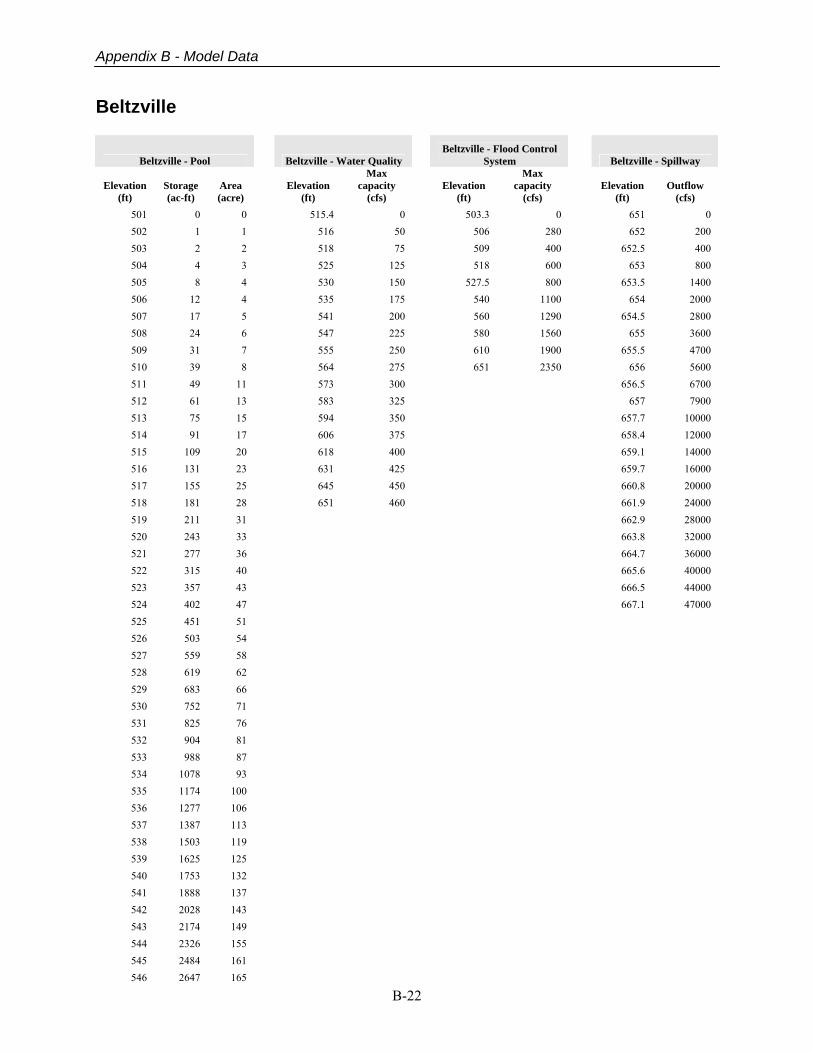
Appendix B - Model Data
B-22
Beltzville
Beltzville - Pool Beltzville - Water Quality Beltzville - Flood Control
System Beltzville - Spillway
Elevation (ft)
Storage (ac-ft)
Area (acre)
Elevation (ft)
Max capacity
(cfs) Elevation
(ft)
Max capacity
(cfs) Elevation
(ft) Outflow
(cfs) 501 0 0 515.4 0 503.3 0 651 0 502 1 1 516 50 506 280 652 200 503 2 2 518 75 509 400 652.5 400 504 4 3 525 125 518 600 653 800 505 8 4 530 150 527.5 800 653.5 1400 506 12 4 535 175 540 1100 654 2000 507 17 5 541 200 560 1290 654.5 2800 508 24 6 547 225 580 1560 655 3600 509 31 7 555 250 610 1900 655.5 4700 510 39 8 564 275 651 2350 656 5600 511 49 11 573 300 656.5 6700 512 61 13 583 325 657 7900 513 75 15 594 350 657.7 10000 514 91 17 606 375 658.4 12000 515 109 20 618 400 659.1 14000 516 131 23 631 425 659.7 16000 517 155 25 645 450 660.8 20000 518 181 28 651 460 661.9 24000 519 211 31 662.9 28000 520 243 33 663.8 32000 521 277 36 664.7 36000 522 315 40 665.6 40000 523 357 43 666.5 44000 524 402 47 667.1 47000 525 451 51 526 503 54 527 559 58 528 619 62 529 683 66 530 752 71 531 825 76 532 904 81 533 988 87 534 1078 93 535 1174 100 536 1277 106 537 1387 113 538 1503 119 539 1625 125 540 1753 132 541 1888 137 542 2028 143 543 2174 149 544 2326 155 545 2484 161 546 2647 165

Appendix B - Model Data
B-23
Beltzville - Pool Beltzville - Water Quality Beltzville - Flood Control
System Beltzville - Spillway
Elevation (ft)
Storage (ac-ft)
Area (acre)
Elevation (ft)
Max capacity
(cfs) Elevation
(ft)
Max capacity
(cfs) Elevation
(ft) Outflow
(cfs) 547 2814 170 548 2987 175 549 3164 179 550 3345 184 551 3532 190 552 3725 195 553 3923 201 554 4127 207 555 4337 213 556 4551 216 557 4770 221 558 4993 226 559 5222 231 560 5456 237 561 5695 241 562 5939 247 563 6189 253 564 6445 259 565 6707 266 566 6976 272 567 7261 278 568 7533 285 569 7821 291 570 8115 298 571 8417 306 572 8727 314 573 9045 322 574 9371 330 575 9706 339 576 10049 347 577 10400 355 578 10758 362 579 11124 369 580 11496 376 581 11876 384 582 12264 392 583 12660 400 584 13064 408 585 13476 416 586 13897 425 587 14326 434 588 14764 442 589 15210 450 590 15664 458 591 16127 467 592 16559 477 593 17081 487 594 17572 496
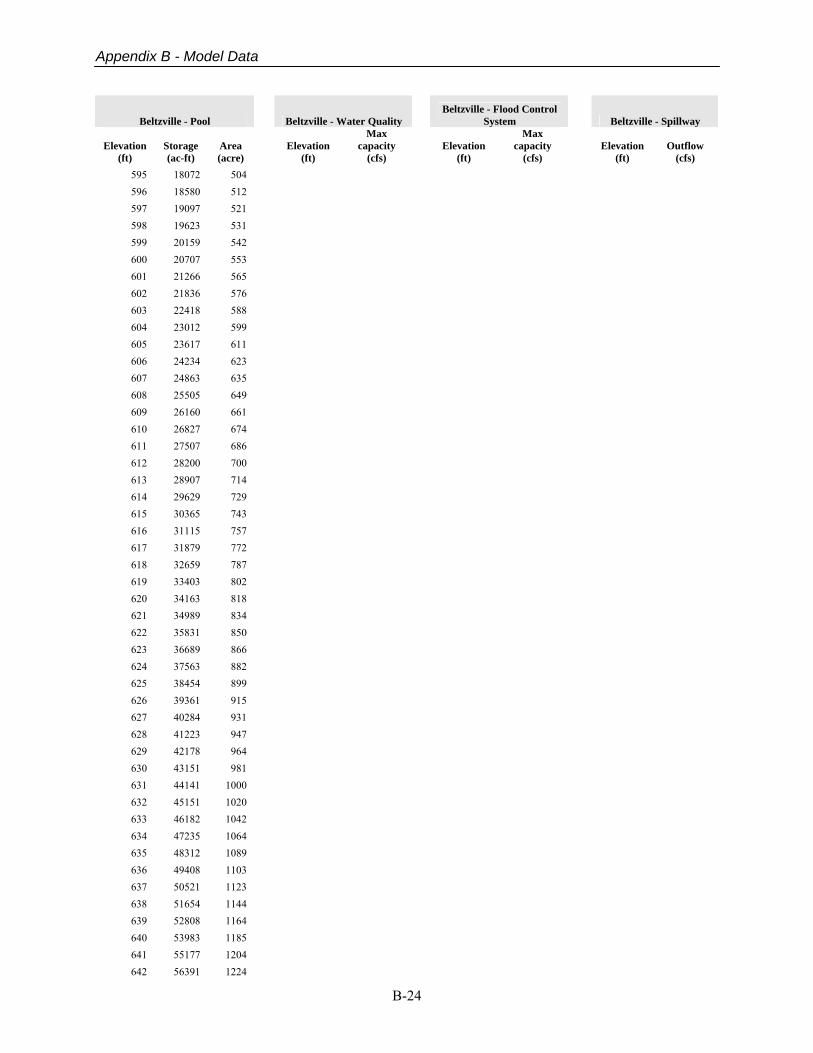
Appendix B - Model Data
B-24
Beltzville - Pool Beltzville - Water Quality Beltzville - Flood Control
System Beltzville - Spillway
Elevation (ft)
Storage (ac-ft)
Area (acre)
Elevation (ft)
Max capacity
(cfs) Elevation
(ft)
Max capacity
(cfs) Elevation
(ft) Outflow
(cfs) 595 18072 504 596 18580 512 597 19097 521 598 19623 531 599 20159 542 600 20707 553 601 21266 565 602 21836 576 603 22418 588 604 23012 599 605 23617 611 606 24234 623 607 24863 635 608 25505 649 609 26160 661 610 26827 674 611 27507 686 612 28200 700 613 28907 714 614 29629 729 615 30365 743 616 31115 757 617 31879 772 618 32659 787 619 33403 802 620 34163 818 621 34989 834 622 35831 850 623 36689 866 624 37563 882 625 38454 899 626 39361 915 627 40284 931 628 41223 947 629 42178 964 630 43151 981 631 44141 1000 632 45151 1020 633 46182 1042 634 47235 1064 635 48312 1089 636 49408 1103 637 50521 1123 638 51654 1144 639 52808 1164 640 53983 1185 641 55177 1204 642 56391 1224
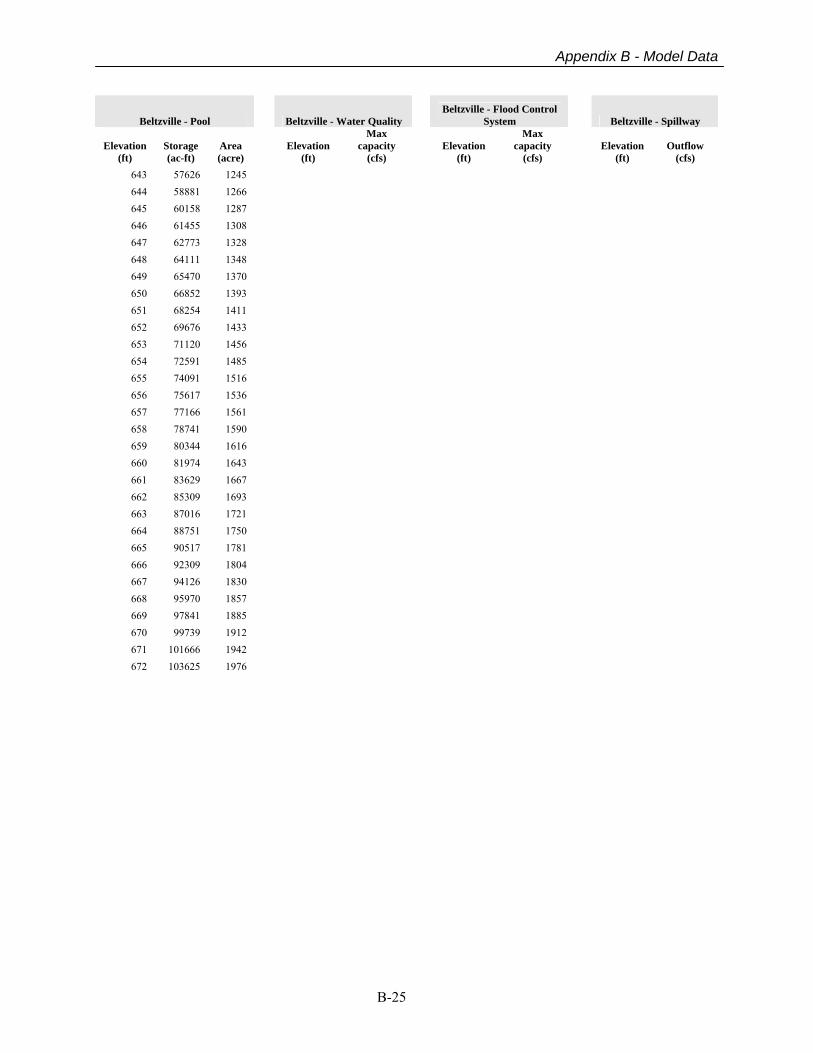
Appendix B - Model Data
B-25
Beltzville - Pool Beltzville - Water Quality Beltzville - Flood Control
System Beltzville - Spillway
Elevation (ft)
Storage (ac-ft)
Area (acre)
Elevation (ft)
Max capacity
(cfs) Elevation
(ft)
Max capacity
(cfs) Elevation
(ft) Outflow
(cfs) 643 57626 1245 644 58881 1266 645 60158 1287 646 61455 1308 647 62773 1328 648 64111 1348 649 65470 1370 650 66852 1393 651 68254 1411 652 69676 1433 653 71120 1456 654 72591 1485 655 74091 1516 656 75617 1536 657 77166 1561 658 78741 1590 659 80344 1616 660 81974 1643 661 83629 1667 662 85309 1693 663 87016 1721 664 88751 1750 665 90517 1781 666 92309 1804 667 94126 1830 668 95970 1857 669 97841 1885 670 99739 1912 671 101666 1942 672 103625 1976
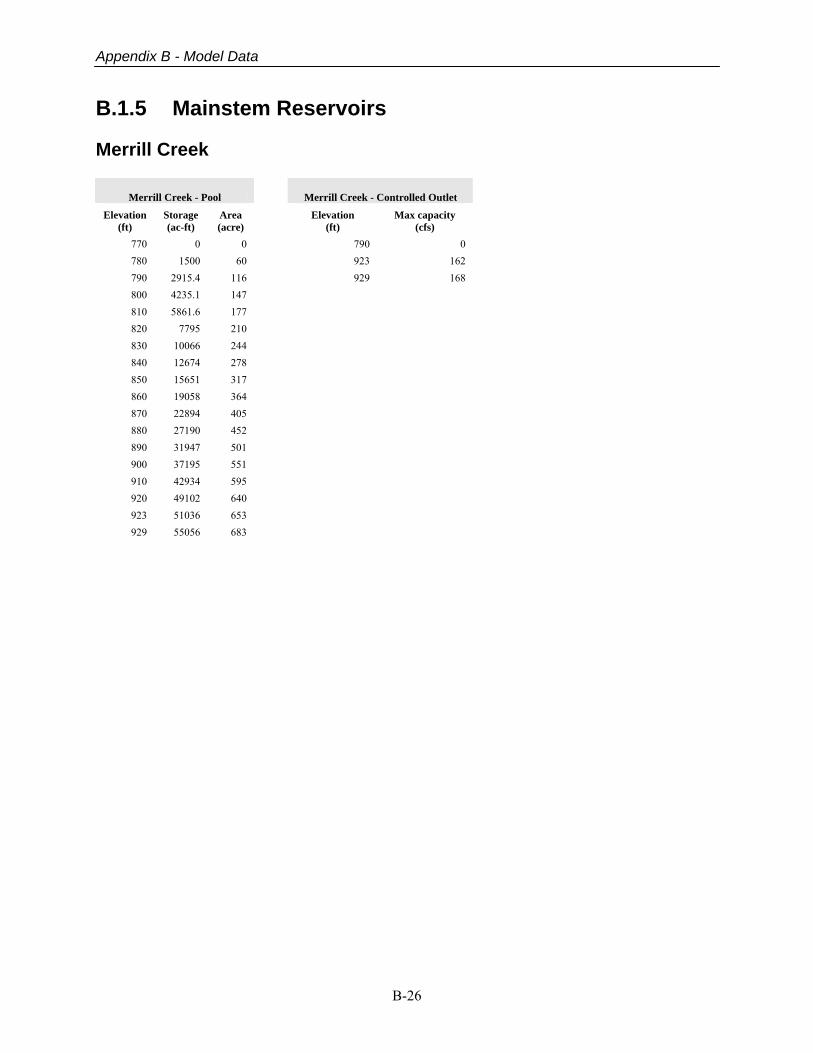
Appendix B - Model Data
B-26
B.1.5 Mainstem Reservoirs Merrill Creek
Merrill Creek - Pool Merrill Creek - Controlled Outlet
Elevation (ft)
Storage (ac-ft)
Area (acre)
Elevation (ft)
Max capacity (cfs)
770 0 0 790 0 780 1500 60 923 162 790 2915.4 116 929 168 800 4235.1 147 810 5861.6 177 820 7795 210 830 10066 244 840 12674 278 850 15651 317 860 19058 364 870 22894 405 880 27190 452 890 31947 501 900 37195 551 910 42934 595 920 49102 640 923 51036 653 929 55056 683
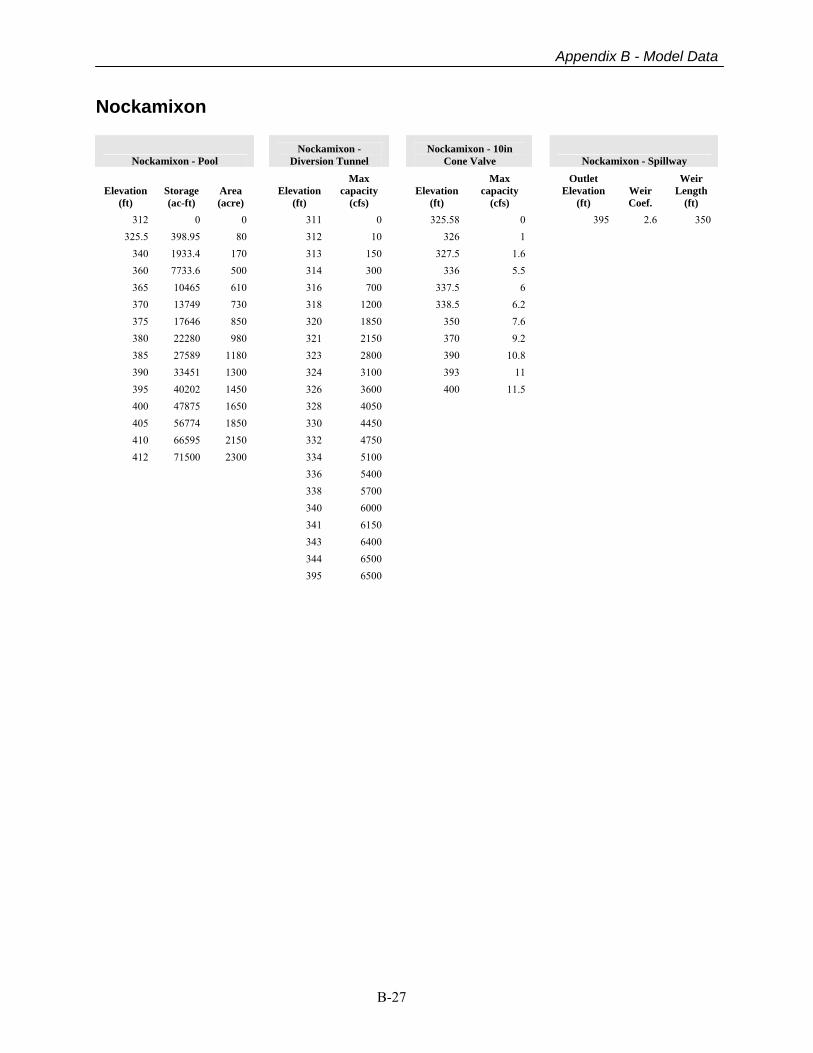
Appendix B - Model Data
B-27
Nockamixon
Nockamixon - Pool Nockamixon -
Diversion Tunnel Nockamixon - 10in
Cone Valve Nockamixon - Spillway
Elevation (ft)
Storage (ac-ft)
Area (acre)
Elevation (ft)
Max capacity
(cfs) Elevation
(ft)
Max capacity
(cfs)
Outlet Elevation
(ft) Weir Coef.
Weir Length
(ft) 312 0 0 311 0 325.58 0 395 2.6 350
325.5 398.95 80 312 10 326 1 340 1933.4 170 313 150 327.5 1.6 360 7733.6 500 314 300 336 5.5 365 10465 610 316 700 337.5 6 370 13749 730 318 1200 338.5 6.2 375 17646 850 320 1850 350 7.6 380 22280 980 321 2150 370 9.2 385 27589 1180 323 2800 390 10.8 390 33451 1300 324 3100 393 11 395 40202 1450 326 3600 400 11.5 400 47875 1650 328 4050 405 56774 1850 330 4450 410 66595 2150 332 4750 412 71500 2300 334 5100
336 5400 338 5700 340 6000 341 6150 343 6400 344 6500 395 6500
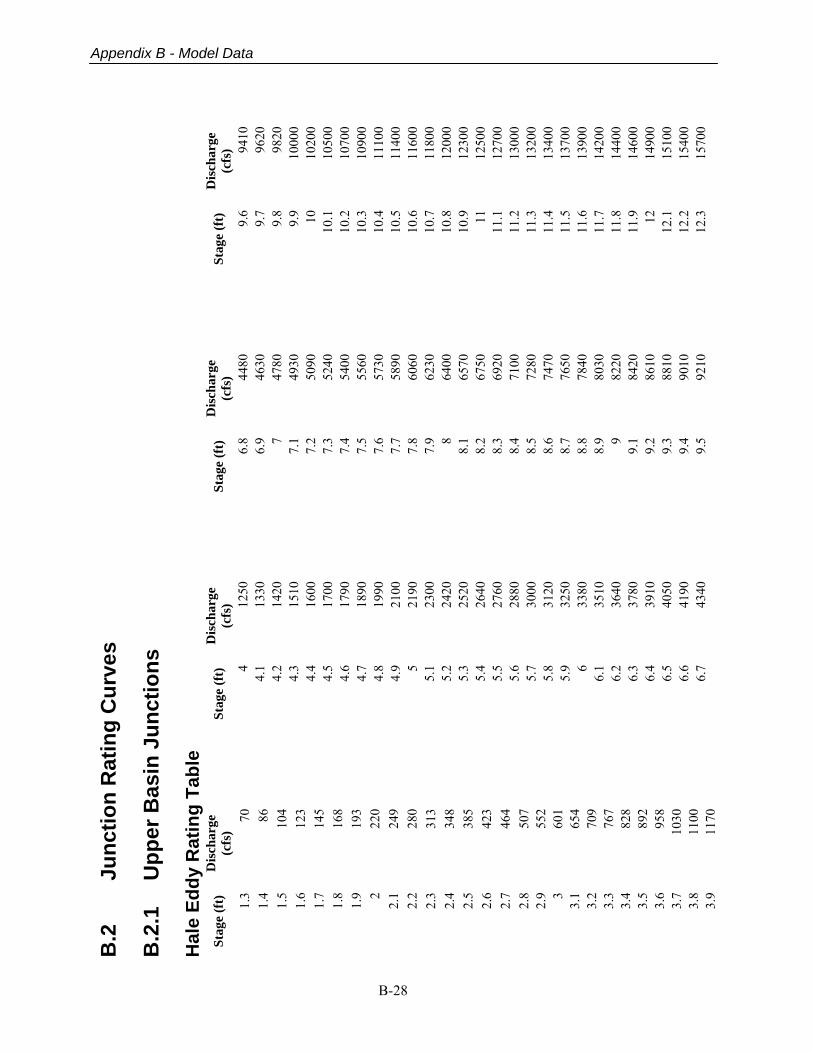
B-28
Appendix B - Model Data
B.2
Ju
nctio
n R
atin
g C
urve
s B
.2.1
U
pper
Bas
in J
unct
ions
H
ale
Eddy
Rat
ing
Tabl
e St
age
(ft)
D
isch
arge
(c
fs)
1.3
70
1.4
86
1.5
104
1.6
123
1.7
145
1.8
168
1.9
193
2 22
0 2.
1 24
9 2.
2 28
0 2.
3 31
3 2.
4 34
8 2.
5 38
5 2.
6 42
3 2.
7 46
4 2.
8 50
7 2.
9 55
2 3
601
3.1
654
3.2
709
3.3
767
3.4
828
3.5
892
3.6
958
3.7
1030
3.
8 11
00
3.9
1170
Stag
e (f
t)
Dis
char
ge
(cfs
) 4
1250
4.
1 13
30
4.2
1420
4.
3 15
10
4.4
1600
4.
5 17
00
4.6
1790
4.
7 18
90
4.8
1990
4.
9 21
00
5 21
90
5.1
2300
5.
2 24
20
5.3
2520
5.
4 26
40
5.5
2760
5.
6 28
80
5.7
3000
5.
8 31
20
5.9
3250
6
3380
6.
1 35
10
6.2
3640
6.
3 37
80
6.4
3910
6.
5 40
50
6.6
4190
6.
7 43
40
Stag
e (f
t)
Dis
char
ge
(cfs
) 6.
8 44
80
6.9
4630
7
4780
7.
1 49
30
7.2
5090
7.
3 52
40
7.4
5400
7.
5 55
60
7.6
5730
7.
7 58
90
7.8
6060
7.
9 62
30
8 64
00
8.1
6570
8.
2 67
50
8.3
6920
8.
4 71
00
8.5
7280
8.
6 74
70
8.7
7650
8.
8 78
40
8.9
8030
9
8220
9.
1 84
20
9.2
8610
9.
3 88
10
9.4
9010
9.
5 92
10
Stag
e (f
t)
Dis
char
ge
(cfs
) 9.
6 94
10
9.7
9620
9.
8 98
20
9.9
1000
0 10
10
200
10.1
10
500
10.2
10
700
10.3
10
900
10.4
11
100
10.5
11
400
10.6
11
600
10.7
11
800
10.8
12
000
10.9
12
300
11
1250
0 11
.1
1270
0 11
.2
1300
0 11
.3
1320
0 11
.4
1340
0 11
.5
1370
0 11
.6
1390
0 11
.7
1420
0 11
.8
1440
0 11
.9
1460
0 12
14
900
12.1
15
100
12.2
15
400
12.3
15
700
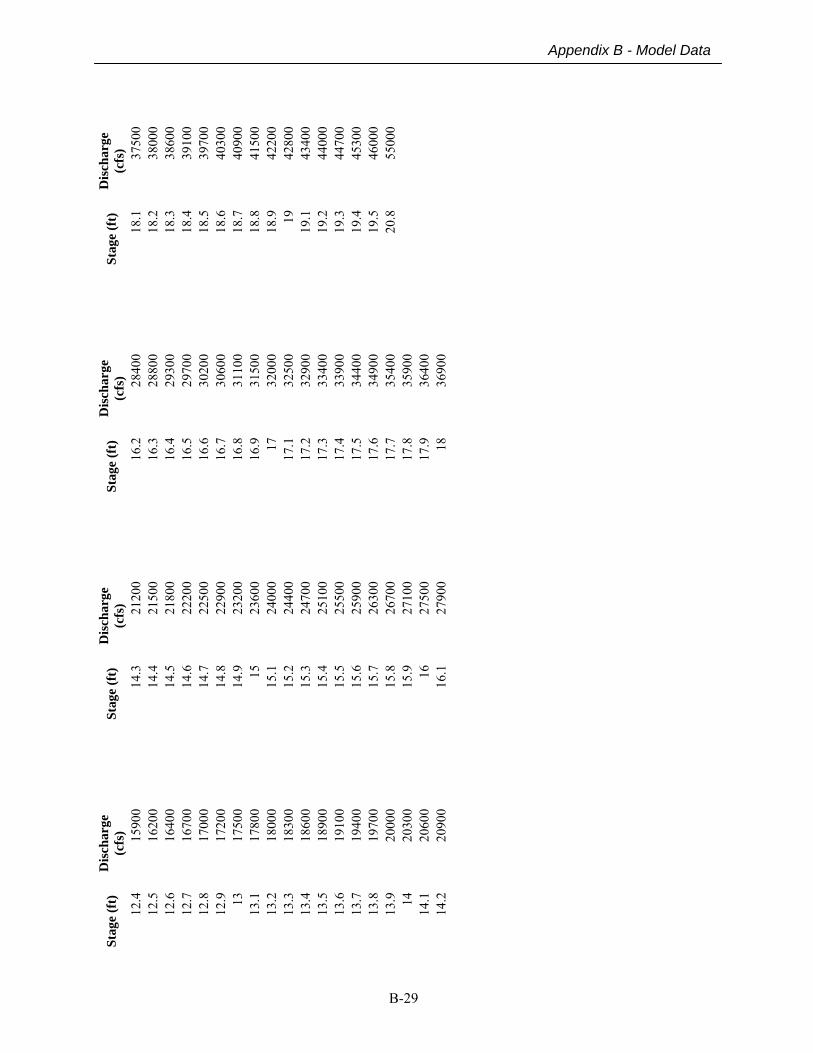
B-29
Appendix B - Model Data
Stag
e (f
t)
Dis
char
ge
(cfs
) 12
.4
1590
0 12
.5
1620
0 12
.6
1640
0 12
.7
1670
0 12
.8
1700
0 12
.9
1720
0 13
17
500
13.1
17
800
13.2
18
000
13.3
18
300
13.4
18
600
13.5
18
900
13.6
19
100
13.7
19
400
13.8
19
700
13.9
20
000
14
2030
0 14
.1
2060
0 14
.2
2090
0
Stag
e (f
t)
Dis
char
ge
(cfs
) 14
.3
2120
0 14
.4
2150
0 14
.5
2180
0 14
.6
2220
0 14
.7
2250
0 14
.8
2290
0 14
.9
2320
0 15
23
600
15.1
24
000
15.2
24
400
15.3
24
700
15.4
25
100
15.5
25
500
15.6
25
900
15.7
26
300
15.8
26
700
15.9
27
100
16
2750
0 16
.1
2790
0
Stag
e (f
t)
Dis
char
ge
(cfs
) 16
.2
2840
0 16
.3
2880
0 16
.4
2930
0 16
.5
2970
0 16
.6
3020
0 16
.7
3060
0 16
.8
3110
0 16
.9
3150
0 17
32
000
17.1
32
500
17.2
32
900
17.3
33
400
17.4
33
900
17.5
34
400
17.6
34
900
17.7
35
400
17.8
35
900
17.9
36
400
18
3690
0
Stag
e (f
t)
Dis
char
ge
(cfs
) 18
.1
3750
0 18
.2
3800
0 18
.3
3860
0 18
.4
3910
0 18
.5
3970
0 18
.6
4030
0 18
.7
4090
0 18
.8
4150
0 18
.9
4220
0 19
42
800
19.1
43
400
19.2
44
000
19.3
44
700
19.4
45
300
19.5
46
000
20.8
55
000
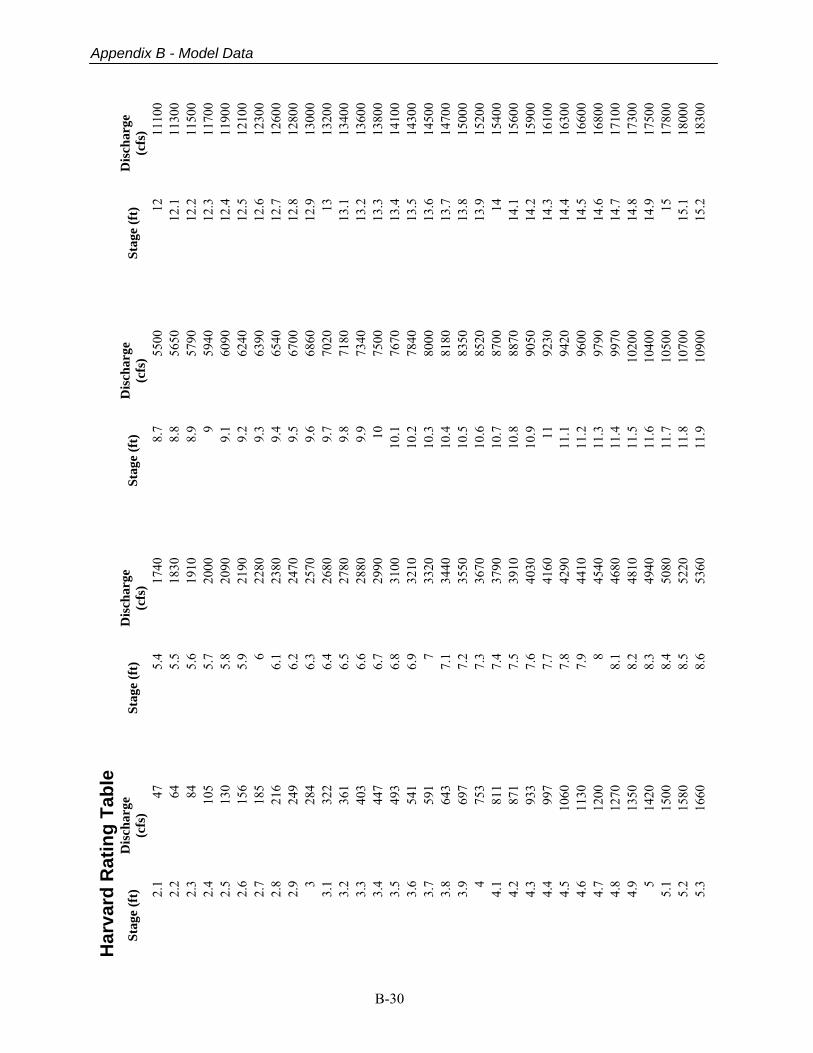
B-30
Appendix B - Model Data
Har
vard
Rat
ing
Tabl
e St
age
(ft)
D
isch
arge
(c
fs)
2.1
47
2.2
64
2.3
84
2.4
105
2.5
130
2.6
156
2.7
185
2.8
216
2.9
249
3 28
4 3.
1 32
2 3.
2 36
1 3.
3 40
3 3.
4 44
7 3.
5 49
3 3.
6 54
1 3.
7 59
1 3.
8 64
3 3.
9 69
7 4
753
4.1
811
4.2
871
4.3
933
4.4
997
4.5
1060
4.
6 11
30
4.7
1200
4.
8 12
70
4.9
1350
5
1420
5.
1 15
00
5.2
1580
5.
3 16
60
Stag
e (f
t)
Dis
char
ge
(cfs
) 5.
4 17
40
5.5
1830
5.
6 19
10
5.7
2000
5.
8 20
90
5.9
2190
6
2280
6.
1 23
80
6.2
2470
6.
3 25
70
6.4
2680
6.
5 27
80
6.6
2880
6.
7 29
90
6.8
3100
6.
9 32
10
7 33
20
7.1
3440
7.
2 35
50
7.3
3670
7.
4 37
90
7.5
3910
7.
6 40
30
7.7
4160
7.
8 42
90
7.9
4410
8
4540
8.
1 46
80
8.2
4810
8.
3 49
40
8.4
5080
8.
5 52
20
8.6
5360
Stag
e (f
t)
Dis
char
ge
(cfs
) 8.
7 55
00
8.8
5650
8.
9 57
90
9 59
40
9.1
6090
9.
2 62
40
9.3
6390
9.
4 65
40
9.5
6700
9.
6 68
60
9.7
7020
9.
8 71
80
9.9
7340
10
75
00
10.1
76
70
10.2
78
40
10.3
80
00
10.4
81
80
10.5
83
50
10.6
85
20
10.7
87
00
10.8
88
70
10.9
90
50
11
9230
11
.1
9420
11
.2
9600
11
.3
9790
11
.4
9970
11
.5
1020
0 11
.6
1040
0 11
.7
1050
0 11
.8
1070
0 11
.9
1090
0
Stag
e (f
t)
Dis
char
ge
(cfs
) 12
11
100
12.1
11
300
12.2
11
500
12.3
11
700
12.4
11
900
12.5
12
100
12.6
12
300
12.7
12
600
12.8
12
800
12.9
13
000
13
1320
0 13
.1
1340
0 13
.2
1360
0 13
.3
1380
0 13
.4
1410
0 13
.5
1430
0 13
.6
1450
0 13
.7
1470
0 13
.8
1500
0 13
.9
1520
0 14
15
400
14.1
15
600
14.2
15
900
14.3
16
100
14.4
16
300
14.5
16
600
14.6
16
800
14.7
17
100
14.8
17
300
14.9
17
500
15
1780
0 15
.1
1800
0 15
.2
1830
0
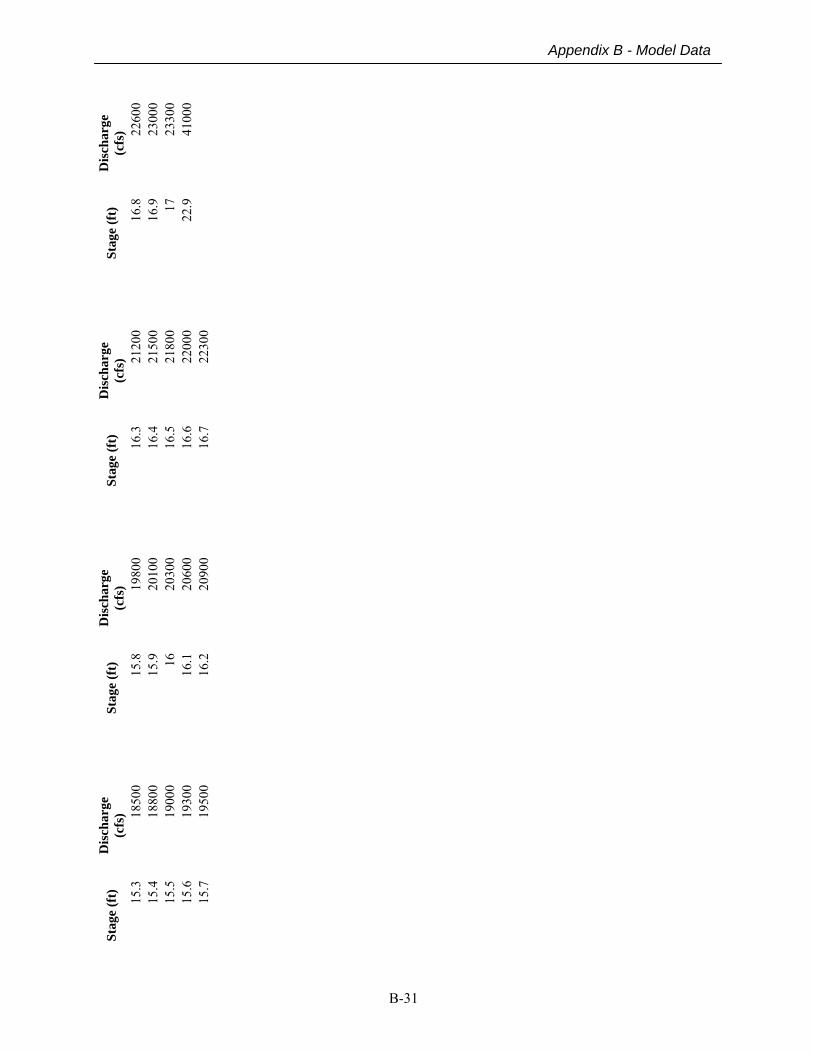
B-31
Appendix B - Model Data
Stag
e (f
t)
Dis
char
ge
(cfs
) 15
.3
1850
0 15
.4
1880
0 15
.5
1900
0 15
.6
1930
0 15
.7
1950
0
Stag
e (f
t)
Dis
char
ge
(cfs
) 15
.8
1980
0 15
.9
2010
0 16
20
300
16.1
20
600
16.2
20
900
Stag
e (f
t)
Dis
char
ge
(cfs
) 16
.3
2120
0 16
.4
2150
0 16
.5
2180
0 16
.6
2200
0 16
.7
2230
0
Stag
e (f
t)
Dis
char
ge
(cfs
) 16
.8
2260
0 16
.9
2300
0 17
23
300
22.9
41
000
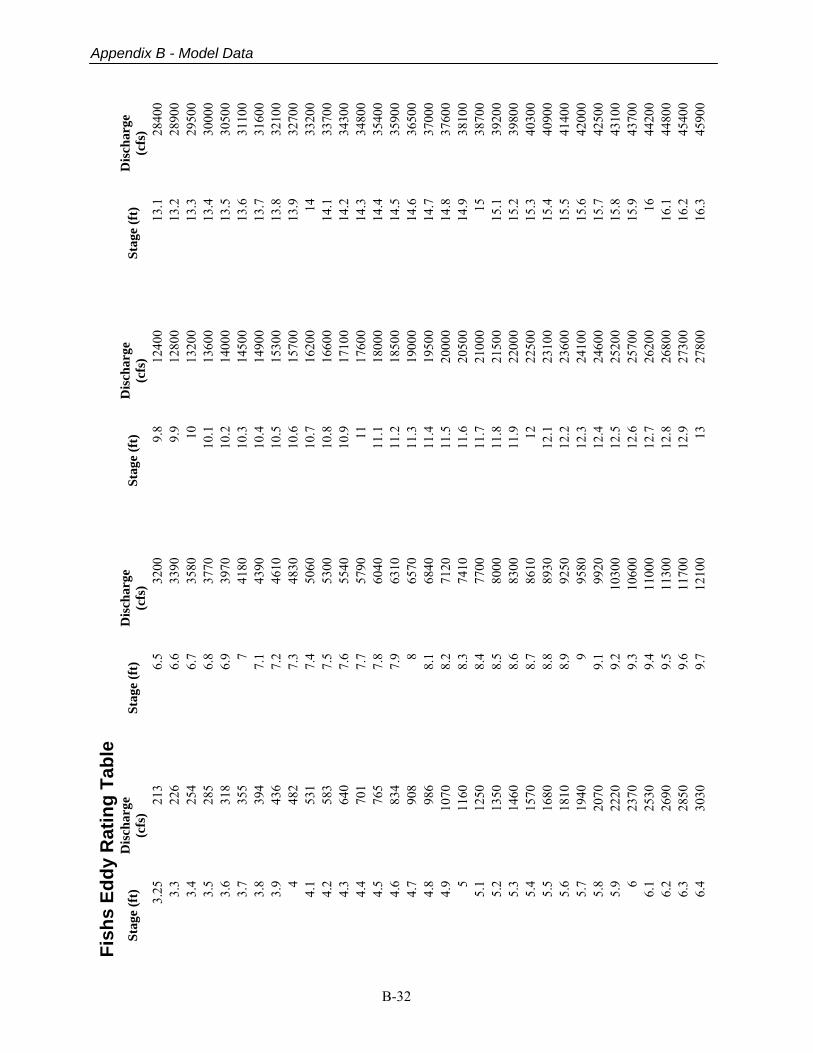
B-32
Appendix B - Model Data
Fish
s Ed
dy R
atin
g Ta
ble
Stag
e (f
t)
Dis
char
ge
(cfs
) 3.
25
213
3.3
226
3.4
254
3.5
285
3.6
318
3.7
355
3.8
394
3.9
436
4 48
2 4.
1 53
1 4.
2 58
3 4.
3 64
0 4.
4 70
1 4.
5 76
5 4.
6 83
4 4.
7 90
8 4.
8 98
6 4.
9 10
70
5 11
60
5.1
1250
5.
2 13
50
5.3
1460
5.
4 15
70
5.5
1680
5.
6 18
10
5.7
1940
5.
8 20
70
5.9
2220
6
2370
6.
1 25
30
6.2
2690
6.
3 28
50
6.4
3030
Stag
e (f
t)
Dis
char
ge
(cfs
) 6.
5 32
00
6.6
3390
6.
7 35
80
6.8
3770
6.
9 39
70
7 41
80
7.1
4390
7.
2 46
10
7.3
4830
7.
4 50
60
7.5
5300
7.
6 55
40
7.7
5790
7.
8 60
40
7.9
6310
8
6570
8.
1 68
40
8.2
7120
8.
3 74
10
8.4
7700
8.
5 80
00
8.6
8300
8.
7 86
10
8.8
8930
8.
9 92
50
9 95
80
9.1
9920
9.
2 10
300
9.3
1060
0 9.
4 11
000
9.5
1130
0 9.
6 11
700
9.7
1210
0
Stag
e (f
t)
Dis
char
ge
(cfs
) 9.
8 12
400
9.9
1280
0 10
13
200
10.1
13
600
10.2
14
000
10.3
14
500
10.4
14
900
10.5
15
300
10.6
15
700
10.7
16
200
10.8
16
600
10.9
17
100
11
1760
0 11
.1
1800
0 11
.2
1850
0 11
.3
1900
0 11
.4
1950
0 11
.5
2000
0 11
.6
2050
0 11
.7
2100
0 11
.8
2150
0 11
.9
2200
0 12
22
500
12.1
23
100
12.2
23
600
12.3
24
100
12.4
24
600
12.5
25
200
12.6
25
700
12.7
26
200
12.8
26
800
12.9
27
300
13
2780
0
Stag
e (f
t)
Dis
char
ge
(cfs
) 13
.1
2840
0 13
.2
2890
0 13
.3
2950
0 13
.4
3000
0 13
.5
3050
0 13
.6
3110
0 13
.7
3160
0 13
.8
3210
0 13
.9
3270
0 14
33
200
14.1
33
700
14.2
34
300
14.3
34
800
14.4
35
400
14.5
35
900
14.6
36
500
14.7
37
000
14.8
37
600
14.9
38
100
15
3870
0 15
.1
3920
0 15
.2
3980
0 15
.3
4030
0 15
.4
4090
0 15
.5
4140
0 15
.6
4200
0 15
.7
4250
0 15
.8
4310
0 15
.9
4370
0 16
44
200
16.1
44
800
16.2
45
400
16.3
45
900
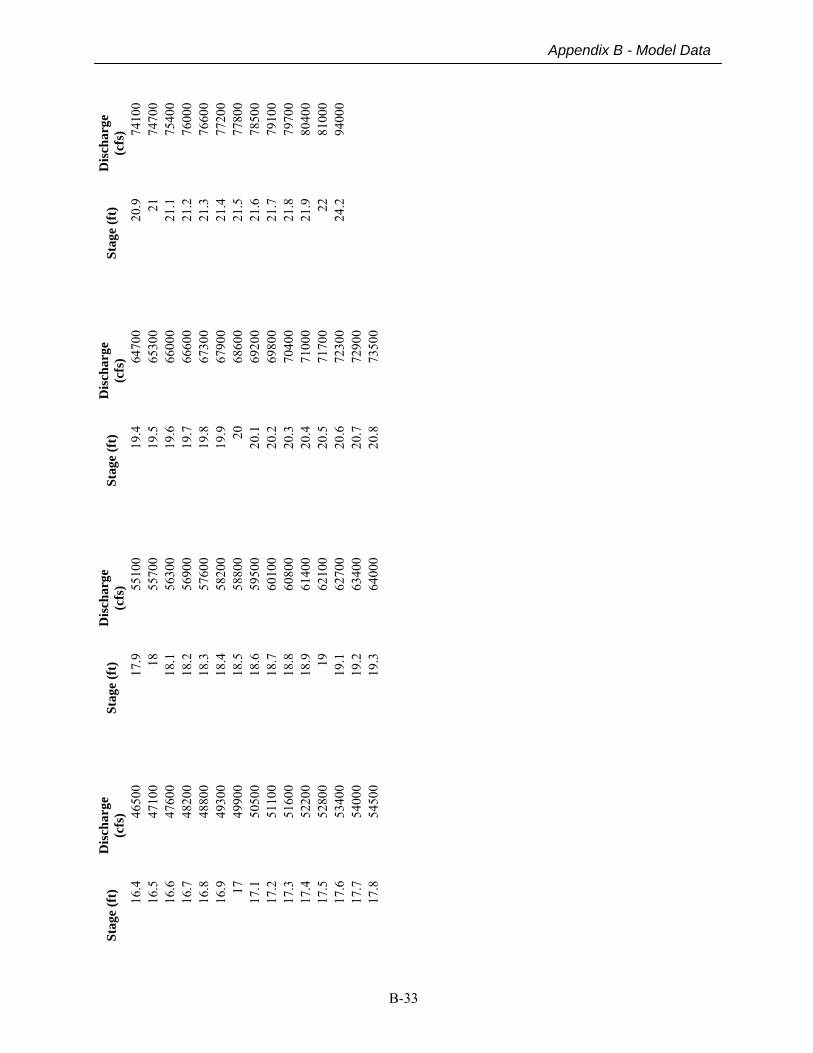
B-33
Appendix B - Model Data
Stag
e (f
t)
Dis
char
ge
(cfs
) 16
.4
4650
0 16
.5
4710
0 16
.6
4760
0 16
.7
4820
0 16
.8
4880
0 16
.9
4930
0 17
49
900
17.1
50
500
17.2
51
100
17.3
51
600
17.4
52
200
17.5
52
800
17.6
53
400
17.7
54
000
17.8
54
500
Stag
e (f
t)
Dis
char
ge
(cfs
) 17
.9
5510
0 18
55
700
18.1
56
300
18.2
56
900
18.3
57
600
18.4
58
200
18.5
58
800
18.6
59
500
18.7
60
100
18.8
60
800
18.9
61
400
19
6210
0 19
.1
6270
0 19
.2
6340
0 19
.3
6400
0
Stag
e (f
t)
Dis
char
ge
(cfs
) 19
.4
6470
0 19
.5
6530
0 19
.6
6600
0 19
.7
6660
0 19
.8
6730
0 19
.9
6790
0 20
68
600
20.1
69
200
20.2
69
800
20.3
70
400
20.4
71
000
20.5
71
700
20.6
72
300
20.7
72
900
20.8
73
500
Stag
e (f
t)
Dis
char
ge
(cfs
) 20
.9
7410
0 21
74
700
21.1
75
400
21.2
76
000
21.3
76
600
21.4
77
200
21.5
77
800
21.6
78
500
21.7
79
100
21.8
79
700
21.9
80
400
22
8100
0 24
.2
9400
0

B-34
Appendix B - Model Data
Brid
gevi
lle R
atin
g Ta
ble
Stag
e (f
t)
Dis
char
ge
(cfs
) 4.
3 47
4.
4 64
4.
5 84
4.
6 10
6 4.
7 13
2 4.
8 16
0 4.
9 19
1 5
224
5.1
261
5.2
300
5.3
342
5.4
386
5.5
434
5.6
484
5.7
537
5.8
593
5.9
651
6 71
3 6.
1 77
7 6.
2 84
4 6.
3 90
7 6.
4 96
7 6.
5 10
30
6.6
1090
6.
7 11
50
6.8
1220
6.
9 12
90
7 13
50
7.1
1420
7.
2 15
00
7.3
1570
7.
4 16
40
7.5
1720
Stag
e (f
t)
Dis
char
ge
(cfs
) 7.
6 17
90
7.7
1870
7.
8 19
50
7.9
2030
8
2110
8.
1 22
00
8.2
2280
8.
3 23
70
8.4
2450
8.
5 25
40
8.6
2630
8.
7 27
20
8.8
2820
8.
9 29
10
9 30
00
9.1
3100
9.
2 32
00
9.3
3290
9.
4 33
90
9.5
3490
9.
6 36
00
9.7
3700
9.
8 38
00
9.9
3910
10
40
20
10.1
41
20
10.2
42
30
10.3
43
40
10.4
44
50
10.5
45
70
10.6
46
80
10.7
47
90
10.8
49
10
Stag
e (f
t)
Dis
char
ge
(cfs
) 10
.9
5030
11
51
40
11.1
52
60
11.2
53
80
11.3
55
00
11.4
56
30
11.5
57
50
11.6
58
70
11.7
60
00
11.8
61
30
11.9
62
50
12
6380
12
.1
6510
12
.2
6640
12
.3
6780
12
.4
6910
12
.5
7040
12
.6
7180
12
.7
7310
12
.8
7450
12
.9
7590
13
77
30
13.1
78
70
13.2
80
10
13.3
81
50
13.4
82
90
13.5
84
40
13.6
85
80
13.7
87
30
13.8
88
80
13.9
90
30
14
9180
14
.1
9330
Stag
e (f
t)
Dis
char
ge
(cfs
) 14
.2
9480
14
.3
9630
14
.4
9780
14
.5
9940
14
.6
1010
0 14
.7
1020
0 14
.8
1040
0 14
.9
1060
0 15
10
700
15.1
10
900
15.2
11
000
15.3
11
200
15.4
11
400
15.5
11
500
15.6
11
700
15.7
11
900
15.8
12
000
15.9
12
200
16
1240
0 16
.1
1250
0 16
.2
1270
0 16
.3
1290
0 16
.4
1300
0 16
.5
1320
0 16
.6
1340
0 16
.7
1370
0 16
.8
1390
0 16
.9
1410
0 17
14
300
17.1
14
600
17.2
14
800
17.3
15
000
17.4
15
300
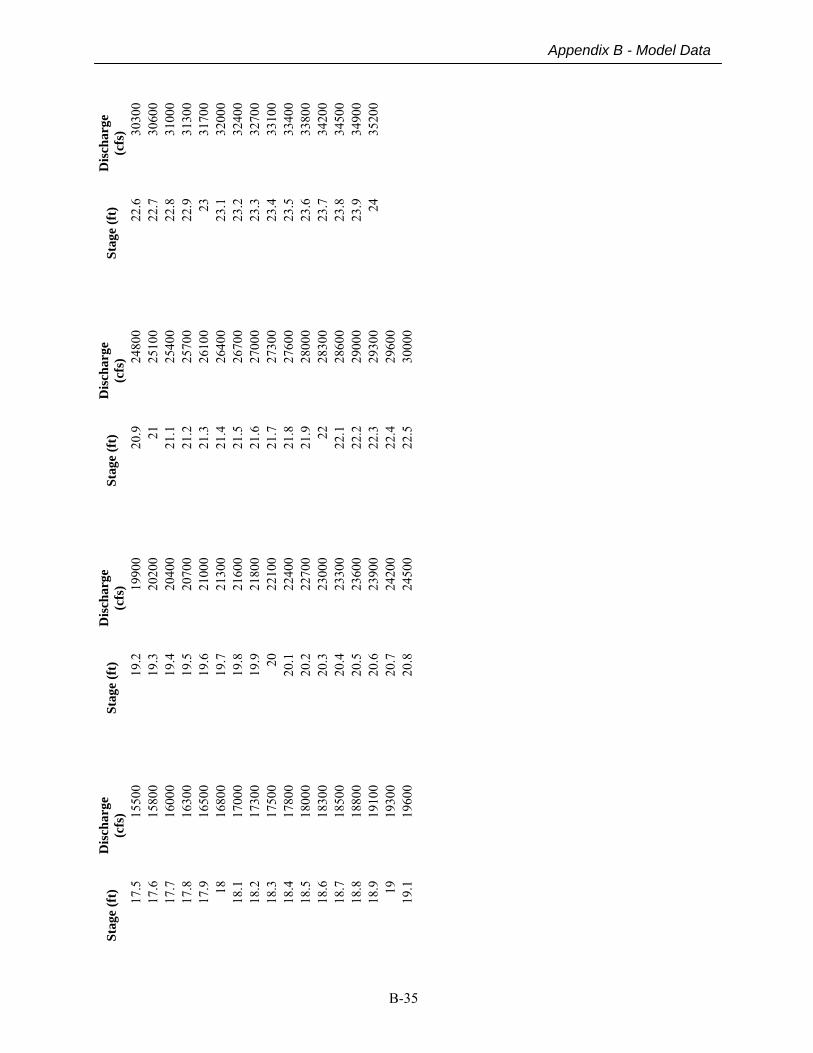
B-35
Appendix B - Model Data
Stag
e (f
t)
Dis
char
ge
(cfs
) 17
.5
1550
0 17
.6
1580
0 17
.7
1600
0 17
.8
1630
0 17
.9
1650
0 18
16
800
18.1
17
000
18.2
17
300
18.3
17
500
18.4
17
800
18.5
18
000
18.6
18
300
18.7
18
500
18.8
18
800
18.9
19
100
19
1930
0 19
.1
1960
0
Stag
e (f
t)
Dis
char
ge
(cfs
) 19
.2
1990
0 19
.3
2020
0 19
.4
2040
0 19
.5
2070
0 19
.6
2100
0 19
.7
2130
0 19
.8
2160
0 19
.9
2180
0 20
22
100
20.1
22
400
20.2
22
700
20.3
23
000
20.4
23
300
20.5
23
600
20.6
23
900
20.7
24
200
20.8
24
500
Stag
e (f
t)
Dis
char
ge
(cfs
) 20
.9
2480
0 21
25
100
21.1
25
400
21.2
25
700
21.3
26
100
21.4
26
400
21.5
26
700
21.6
27
000
21.7
27
300
21.8
27
600
21.9
28
000
22
2830
0 22
.1
2860
0 22
.2
2900
0 22
.3
2930
0 22
.4
2960
0 22
.5
3000
0
Stag
e (f
t)
Dis
char
ge
(cfs
) 22
.6
3030
0 22
.7
3060
0 22
.8
3100
0 22
.9
3130
0 23
31
700
23.1
32
000
23.2
32
400
23.3
32
700
23.4
33
100
23.5
33
400
23.6
33
800
23.7
34
200
23.8
34
500
23.9
34
900
24
3520
0

B-36
Appendix B - Model Data
Cal
licoo
n R
atin
g Ta
ble
Stag
e (f
t)
Dis
char
ge
(cfs
) 2.
7 31
0 2.
8 41
9 2.
9 53
6 3
660
3.1
790
3.2
958
3.3
1100
3.
4 12
50
3.5
1430
3.
6 16
00
3.7
1770
3.
8 19
70
3.9
2210
4
2460
4.
1 27
80
4.2
3110
4.
3 34
30
4.4
3800
4.
5 41
80
4.6
4540
4.
7 49
60
4.8
5390
4.
9 57
90
5 62
60
5.1
6730
5.
2 71
80
5.3
7680
5.
4 82
10
5.5
8670
5.
6 91
90
5.7
9660
5.
8 10
200
5.9
1070
0
Stag
e (f
t)
Dis
char
ge
(cfs
) 6
1120
0 6.
1 11
800
6.2
1240
0 6.
3 12
900
6.4
1350
0 6.
5 14
100
6.6
1460
0 6.
7 15
200
6.8
1590
0 6.
9 16
400
7 17
100
7.1
1770
0 7.
2 18
300
7.3
1900
0 7.
4 19
700
7.5
2030
0 7.
6 21
000
7.7
2170
0 7.
8 22
300
7.9
2300
0 8
2370
0 8.
1 24
400
8.2
2510
0 8.
3 25
800
8.4
2650
0 8.
5 27
300
8.6
2800
0 8.
7 28
700
8.8
2950
0 8.
9 30
200
9 31
000
9.1
3170
0 9.
2 32
500
Stag
e (f
t)
Dis
char
ge
(cfs
) 9.
3 33
200
9.4
3390
0 9.
5 34
700
9.6
3540
0 9.
7 36
200
9.8
3690
0 9.
9 37
700
10
3850
0 10
.1
3930
0 10
.2
4000
0 10
.3
4080
0 10
.4
4160
0 10
.5
4240
0 10
.6
4320
0 10
.7
4400
0 10
.8
4490
0 10
.9
4570
0 11
46
500
11.1
47
300
11.2
48
200
11.3
49
000
11.4
49
800
11.5
50
700
11.6
51
600
11.7
52
400
11.8
53
300
11.9
54
100
12
5500
0 12
.1
5590
0 12
.2
5680
0 12
.3
5770
0 12
.4
5860
0 12
.5
5950
0
Stag
e (f
t)
Dis
char
ge
(cfs
) 12
.6
6040
0 12
.7
6130
0 12
.8
6220
0 12
.9
6310
0 13
64
000
13.1
65
000
13.2
65
900
13.3
66
800
13.4
67
800
13.5
68
700
13.6
69
700
13.7
70
600
13.8
71
600
13.9
72
500
14
7350
0 14
.1
7450
0 14
.2
7550
0 14
.3
7640
0 14
.4
7740
0 14
.5
7840
0 14
.6
7940
0 14
.7
8040
0 14
.8
8140
0 14
.9
8240
0 15
83
400
15.1
84
400
15.2
85
500
15.3
86
500
15.4
87
500
15.5
88
500
15.6
89
600
15.7
90
600
15.8
91
700
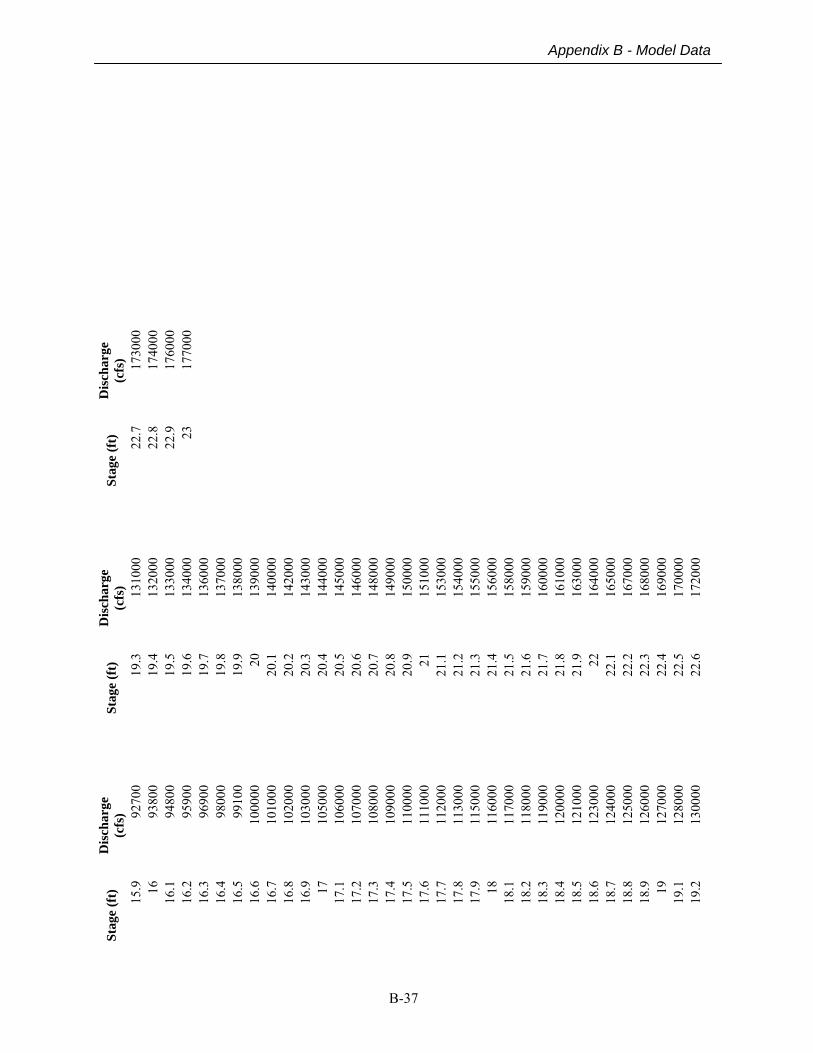
B-37
Appendix B - Model Data
Stag
e (f
t)
Dis
char
ge
(cfs
) 15
.9
9270
0 16
93
800
16.1
94
800
16.2
95
900
16.3
96
900
16.4
98
000
16.5
99
100
16.6
10
0000
16
.7
1010
00
16.8
10
2000
16
.9
1030
00
17
1050
00
17.1
10
6000
17
.2
1070
00
17.3
10
8000
17
.4
1090
00
17.5
11
0000
17
.6
1110
00
17.7
11
2000
17
.8
1130
00
17.9
11
5000
18
11
6000
18
.1
1170
00
18.2
11
8000
18
.3
1190
00
18.4
12
0000
18
.5
1210
00
18.6
12
3000
18
.7
1240
00
18.8
12
5000
18
.9
1260
00
19
1270
00
19.1
12
8000
19
.2
1300
00
Stag
e (f
t)
Dis
char
ge
(cfs
) 19
.3
1310
00
19.4
13
2000
19
.5
1330
00
19.6
13
4000
19
.7
1360
00
19.8
13
7000
19
.9
1380
00
20
1390
00
20.1
14
0000
20
.2
1420
00
20.3
14
3000
20
.4
1440
00
20.5
14
5000
20
.6
1460
00
20.7
14
8000
20
.8
1490
00
20.9
15
0000
21
15
1000
21
.1
1530
00
21.2
15
4000
21
.3
1550
00
21.4
15
6000
21
.5
1580
00
21.6
15
9000
21
.7
1600
00
21.8
16
1000
21
.9
1630
00
22
1640
00
22.1
16
5000
22
.2
1670
00
22.3
16
8000
22
.4
1690
00
22.5
17
0000
22
.6
1720
00
Stag
e (f
t)
Dis
char
ge
(cfs
) 22
.7
1730
00
22.8
17
4000
22
.9
1760
00
23
1770
00
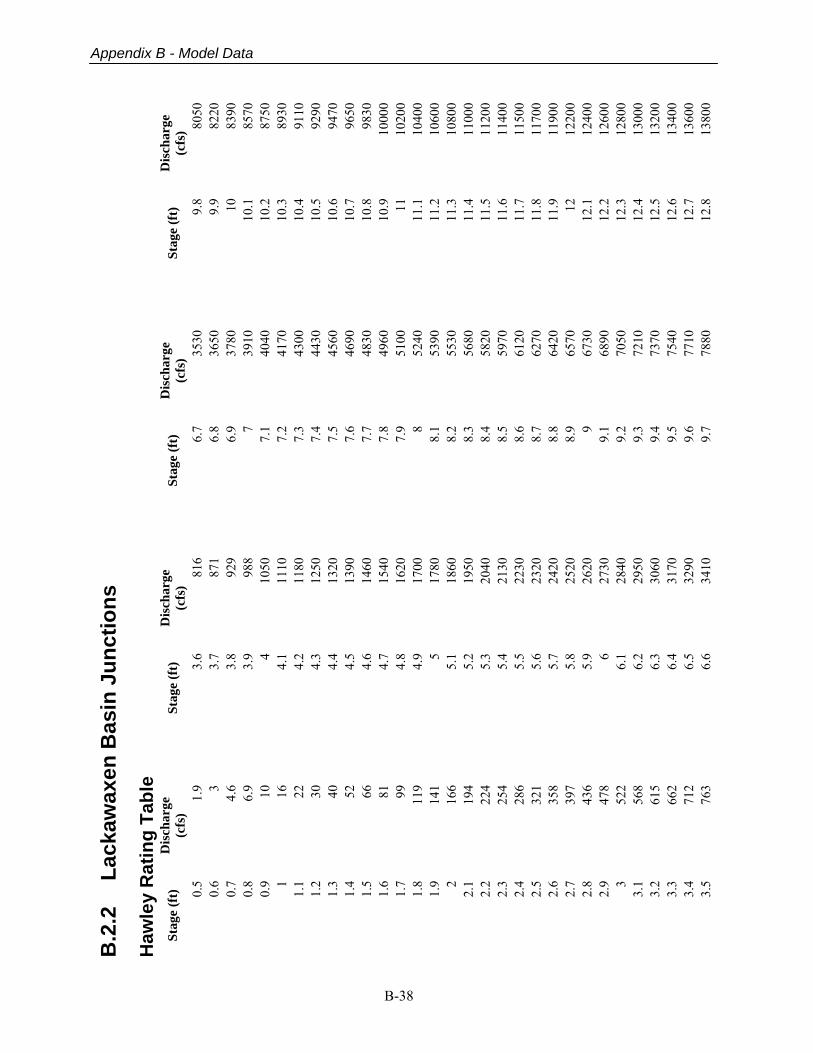
B-38
Appendix B - Model Data
B.2
.2
Lack
awax
en B
asin
Jun
ctio
ns
Haw
ley
Rat
ing
Tabl
e St
age
(ft)
D
isch
arge
(c
fs)
0.5
1.9
0.6
3 0.
7 4.
6 0.
8 6.
9 0.
9 10
1
16
1.1
22
1.2
30
1.3
40
1.4
52
1.5
66
1.6
81
1.7
99
1.8
119
1.9
141
2 16
6 2.
1 19
4 2.
2 22
4 2.
3 25
4 2.
4 28
6 2.
5 32
1 2.
6 35
8 2.
7 39
7 2.
8 43
6 2.
9 47
8 3
522
3.1
568
3.2
615
3.3
662
3.4
712
3.5
763
Stag
e (f
t)
Dis
char
ge
(cfs
) 3.
6 81
6 3.
7 87
1 3.
8 92
9 3.
9 98
8 4
1050
4.
1 11
10
4.2
1180
4.
3 12
50
4.4
1320
4.
5 13
90
4.6
1460
4.
7 15
40
4.8
1620
4.
9 17
00
5 17
80
5.1
1860
5.
2 19
50
5.3
2040
5.
4 21
30
5.5
2230
5.
6 23
20
5.7
2420
5.
8 25
20
5.9
2620
6
2730
6.
1 28
40
6.2
2950
6.
3 30
60
6.4
3170
6.
5 32
90
6.6
3410
Stag
e (f
t)
Dis
char
ge
(cfs
) 6.
7 35
30
6.8
3650
6.
9 37
80
7 39
10
7.1
4040
7.
2 41
70
7.3
4300
7.
4 44
30
7.5
4560
7.
6 46
90
7.7
4830
7.
8 49
60
7.9
5100
8
5240
8.
1 53
90
8.2
5530
8.
3 56
80
8.4
5820
8.
5 59
70
8.6
6120
8.
7 62
70
8.8
6420
8.
9 65
70
9 67
30
9.1
6890
9.
2 70
50
9.3
7210
9.
4 73
70
9.5
7540
9.
6 77
10
9.7
7880
Stag
e (f
t)
Dis
char
ge
(cfs
) 9.
8 80
50
9.9
8220
10
83
90
10.1
85
70
10.2
87
50
10.3
89
30
10.4
91
10
10.5
92
90
10.6
94
70
10.7
96
50
10.8
98
30
10.9
10
000
11
1020
0 11
.1
1040
0 11
.2
1060
0 11
.3
1080
0 11
.4
1100
0 11
.5
1120
0 11
.6
1140
0 11
.7
1150
0 11
.8
1170
0 11
.9
1190
0 12
12
200
12.1
12
400
12.2
12
600
12.3
12
800
12.4
13
000
12.5
13
200
12.6
13
400
12.7
13
600
12.8
13
800
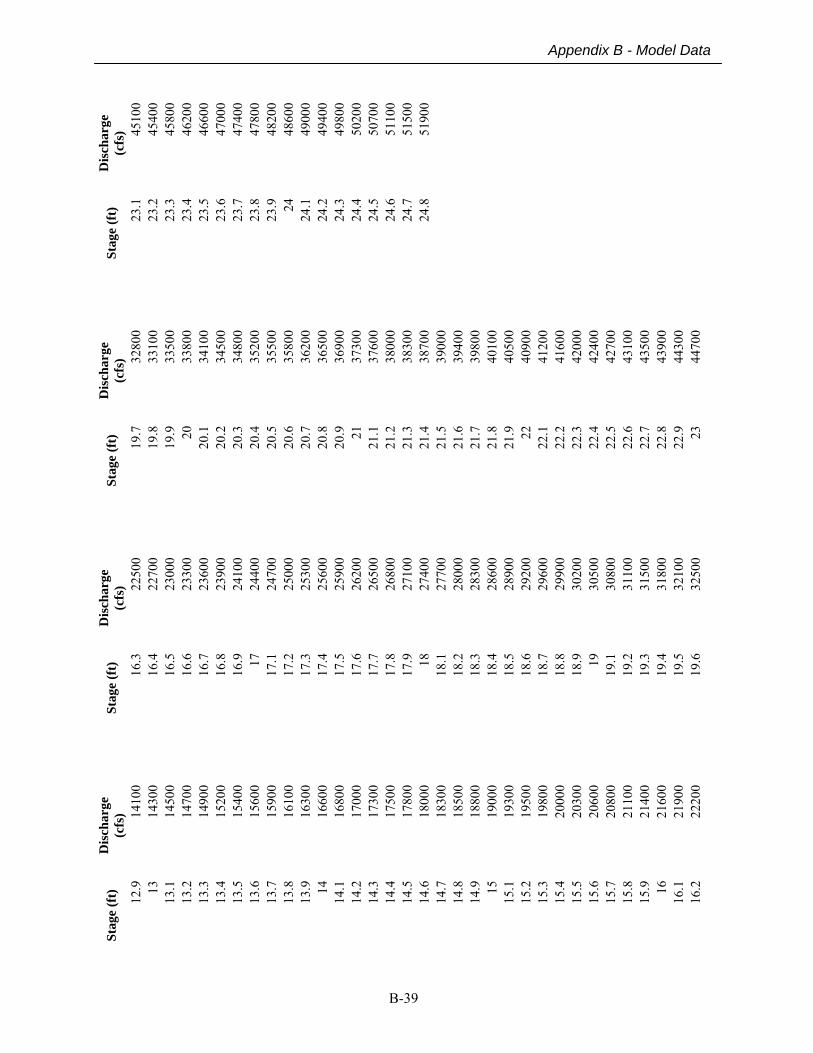
B-39
Appendix B - Model Data
Stag
e (f
t)
Dis
char
ge
(cfs
) 12
.9
1410
0 13
14
300
13.1
14
500
13.2
14
700
13.3
14
900
13.4
15
200
13.5
15
400
13.6
15
600
13.7
15
900
13.8
16
100
13.9
16
300
14
1660
0 14
.1
1680
0 14
.2
1700
0 14
.3
1730
0 14
.4
1750
0 14
.5
1780
0 14
.6
1800
0 14
.7
1830
0 14
.8
1850
0 14
.9
1880
0 15
19
000
15.1
19
300
15.2
19
500
15.3
19
800
15.4
20
000
15.5
20
300
15.6
20
600
15.7
20
800
15.8
21
100
15.9
21
400
16
2160
0 16
.1
2190
0 16
.2
2220
0
Stag
e (f
t)
Dis
char
ge
(cfs
) 16
.3
2250
0 16
.4
2270
0 16
.5
2300
0 16
.6
2330
0 16
.7
2360
0 16
.8
2390
0 16
.9
2410
0 17
24
400
17.1
24
700
17.2
25
000
17.3
25
300
17.4
25
600
17.5
25
900
17.6
26
200
17.7
26
500
17.8
26
800
17.9
27
100
18
2740
0 18
.1
2770
0 18
.2
2800
0 18
.3
2830
0 18
.4
2860
0 18
.5
2890
0 18
.6
2920
0 18
.7
2960
0 18
.8
2990
0 18
.9
3020
0 19
30
500
19.1
30
800
19.2
31
100
19.3
31
500
19.4
31
800
19.5
32
100
19.6
32
500
Stag
e (f
t)
Dis
char
ge
(cfs
) 19
.7
3280
0 19
.8
3310
0 19
.9
3350
0 20
33
800
20.1
34
100
20.2
34
500
20.3
34
800
20.4
35
200
20.5
35
500
20.6
35
800
20.7
36
200
20.8
36
500
20.9
36
900
21
3730
0 21
.1
3760
0 21
.2
3800
0 21
.3
3830
0 21
.4
3870
0 21
.5
3900
0 21
.6
3940
0 21
.7
3980
0 21
.8
4010
0 21
.9
4050
0 22
40
900
22.1
41
200
22.2
41
600
22.3
42
000
22.4
42
400
22.5
42
700
22.6
43
100
22.7
43
500
22.8
43
900
22.9
44
300
23
4470
0
Stag
e (f
t)
Dis
char
ge
(cfs
) 23
.1
4510
0 23
.2
4540
0 23
.3
4580
0 23
.4
4620
0 23
.5
4660
0 23
.6
4700
0 23
.7
4740
0 23
.8
4780
0 23
.9
4820
0 24
48
600
24.1
49
000
24.2
49
400
24.3
49
800
24.4
50
200
24.5
50
700
24.6
51
100
24.7
51
500
24.8
51
900
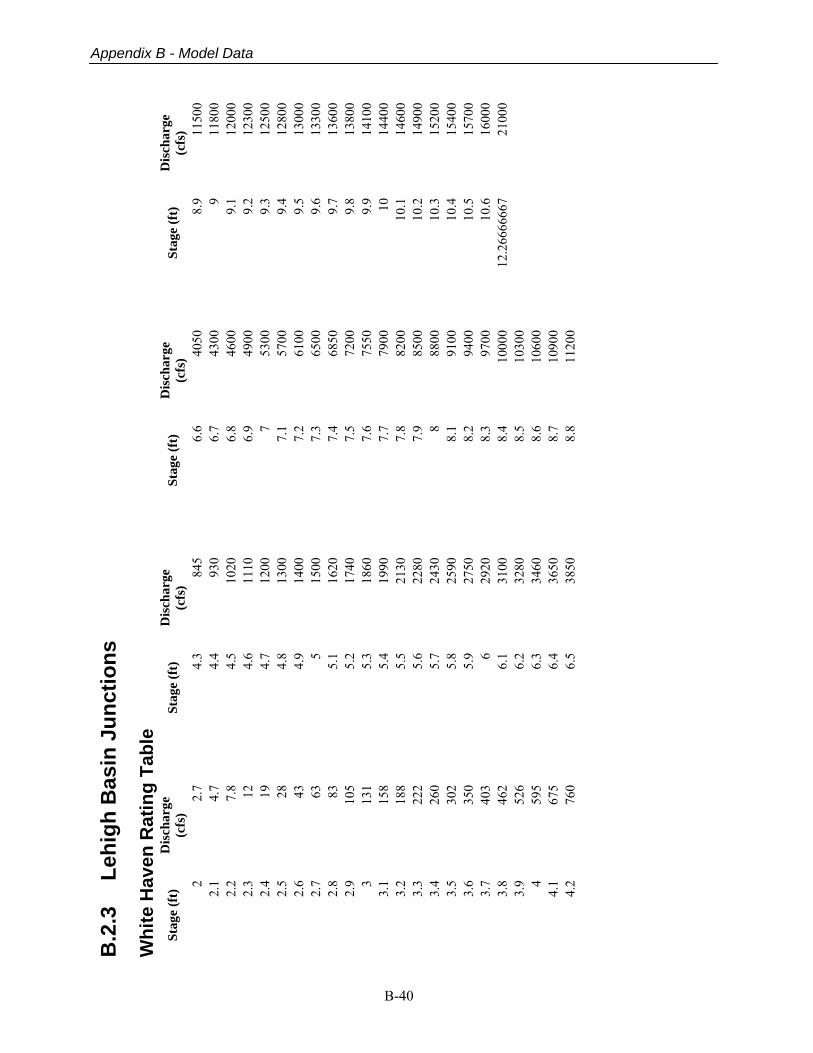
B-40
Appendix B - Model Data
B.2
.3
Lehi
gh B
asin
Jun
ctio
ns
Whi
te H
aven
Rat
ing
Tabl
e St
age
(ft)
D
isch
arge
(c
fs)
2 2.
7 2.
1 4.
7 2.
2 7.
8 2.
3 12
2.
4 19
2.
5 28
2.
6 43
2.
7 63
2.
8 83
2.
9 10
5 3
131
3.1
158
3.2
188
3.3
222
3.4
260
3.5
302
3.6
350
3.7
403
3.8
462
3.9
526
4 59
5 4.
1 67
5 4.
2 76
0
Stag
e (f
t)
Dis
char
ge
(cfs
) 4.
3 84
5 4.
4 93
0 4.
5 10
20
4.6
1110
4.
7 12
00
4.8
1300
4.
9 14
00
5 15
00
5.1
1620
5.
2 17
40
5.3
1860
5.
4 19
90
5.5
2130
5.
6 22
80
5.7
2430
5.
8 25
90
5.9
2750
6
2920
6.
1 31
00
6.2
3280
6.
3 34
60
6.4
3650
6.
5 38
50
Stag
e (f
t)
Dis
char
ge
(cfs
) 6.
6 40
50
6.7
4300
6.
8 46
00
6.9
4900
7
5300
7.
1 57
00
7.2
6100
7.
3 65
00
7.4
6850
7.
5 72
00
7.6
7550
7.
7 79
00
7.8
8200
7.
9 85
00
8 88
00
8.1
9100
8.
2 94
00
8.3
9700
8.
4 10
000
8.5
1030
0 8.
6 10
600
8.7
1090
0 8.
8 11
200
Stag
e (f
t)
Dis
char
ge
(cfs
) 8.
9 11
500
9 11
800
9.1
1200
0 9.
2 12
300
9.3
1250
0 9.
4 12
800
9.5
1300
0 9.
6 13
300
9.7
1360
0 9.
8 13
800
9.9
1410
0 10
14
400
10.1
14
600
10.2
14
900
10.3
15
200
10.4
15
400
10.5
15
700
10.6
16
000
12.2
6666
667
2100
0
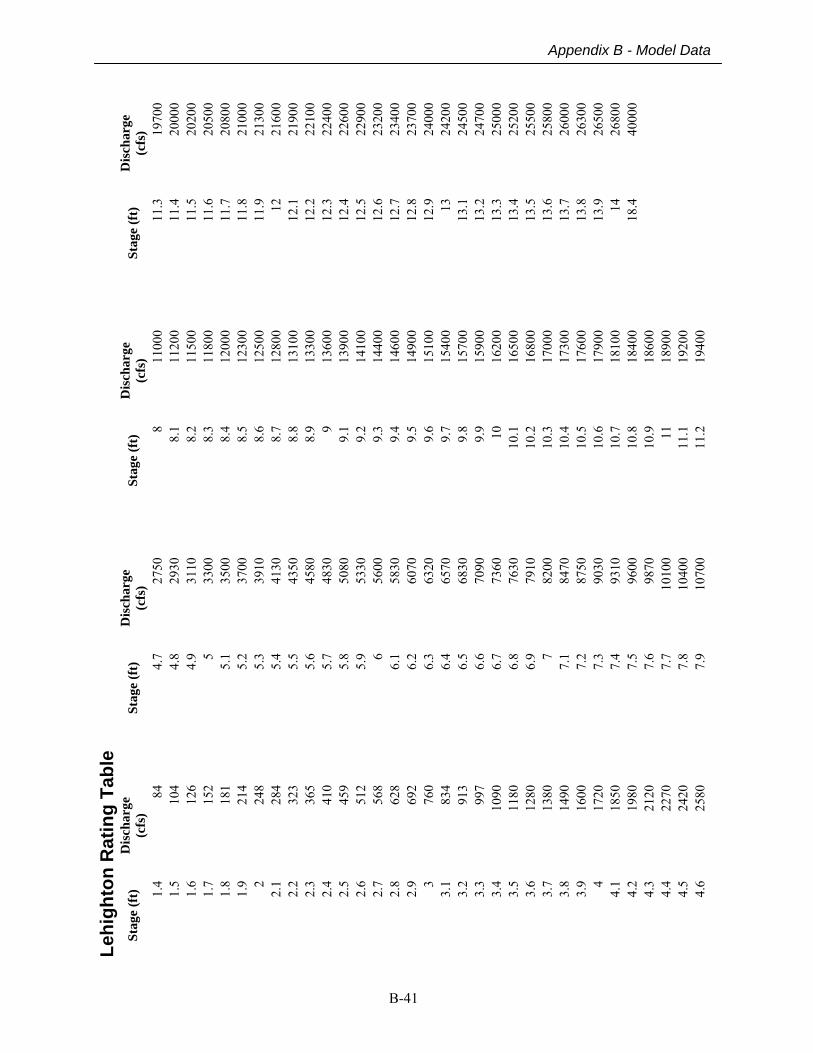
B-41
Appendix B - Model Data
Lehi
ghto
n R
atin
g Ta
ble
Stag
e (f
t)
Dis
char
ge
(cfs
) 1.
4 84
1.
5 10
4 1.
6 12
6 1.
7 15
2 1.
8 18
1 1.
9 21
4 2
248
2.1
284
2.2
323
2.3
365
2.4
410
2.5
459
2.6
512
2.7
568
2.8
628
2.9
692
3 76
0 3.
1 83
4 3.
2 91
3 3.
3 99
7 3.
4 10
90
3.5
1180
3.
6 12
80
3.7
1380
3.
8 14
90
3.9
1600
4
1720
4.
1 18
50
4.2
1980
4.
3 21
20
4.4
2270
4.
5 24
20
4.6
2580
Stag
e (f
t)
Dis
char
ge
(cfs
) 4.
7 27
50
4.8
2930
4.
9 31
10
5 33
00
5.1
3500
5.
2 37
00
5.3
3910
5.
4 41
30
5.5
4350
5.
6 45
80
5.7
4830
5.
8 50
80
5.9
5330
6
5600
6.
1 58
30
6.2
6070
6.
3 63
20
6.4
6570
6.
5 68
30
6.6
7090
6.
7 73
60
6.8
7630
6.
9 79
10
7 82
00
7.1
8470
7.
2 87
50
7.3
9030
7.
4 93
10
7.5
9600
7.
6 98
70
7.7
1010
0 7.
8 10
400
7.9
1070
0
Stag
e (f
t)
Dis
char
ge
(cfs
) 8
1100
0 8.
1 11
200
8.2
1150
0 8.
3 11
800
8.4
1200
0 8.
5 12
300
8.6
1250
0 8.
7 12
800
8.8
1310
0 8.
9 13
300
9 13
600
9.1
1390
0 9.
2 14
100
9.3
1440
0 9.
4 14
600
9.5
1490
0 9.
6 15
100
9.7
1540
0 9.
8 15
700
9.9
1590
0 10
16
200
10.1
16
500
10.2
16
800
10.3
17
000
10.4
17
300
10.5
17
600
10.6
17
900
10.7
18
100
10.8
18
400
10.9
18
600
11
1890
0 11
.1
1920
0 11
.2
1940
0
Stag
e (f
t)
Dis
char
ge
(cfs
) 11
.3
1970
0 11
.4
2000
0 11
.5
2020
0 11
.6
2050
0 11
.7
2080
0 11
.8
2100
0 11
.9
2130
0 12
21
600
12.1
21
900
12.2
22
100
12.3
22
400
12.4
22
600
12.5
22
900
12.6
23
200
12.7
23
400
12.8
23
700
12.9
24
000
13
2420
0 13
.1
2450
0 13
.2
2470
0 13
.3
2500
0 13
.4
2520
0 13
.5
2550
0 13
.6
2580
0 13
.7
2600
0 13
.8
2630
0 13
.9
2650
0 14
26
800
18.4
40
000
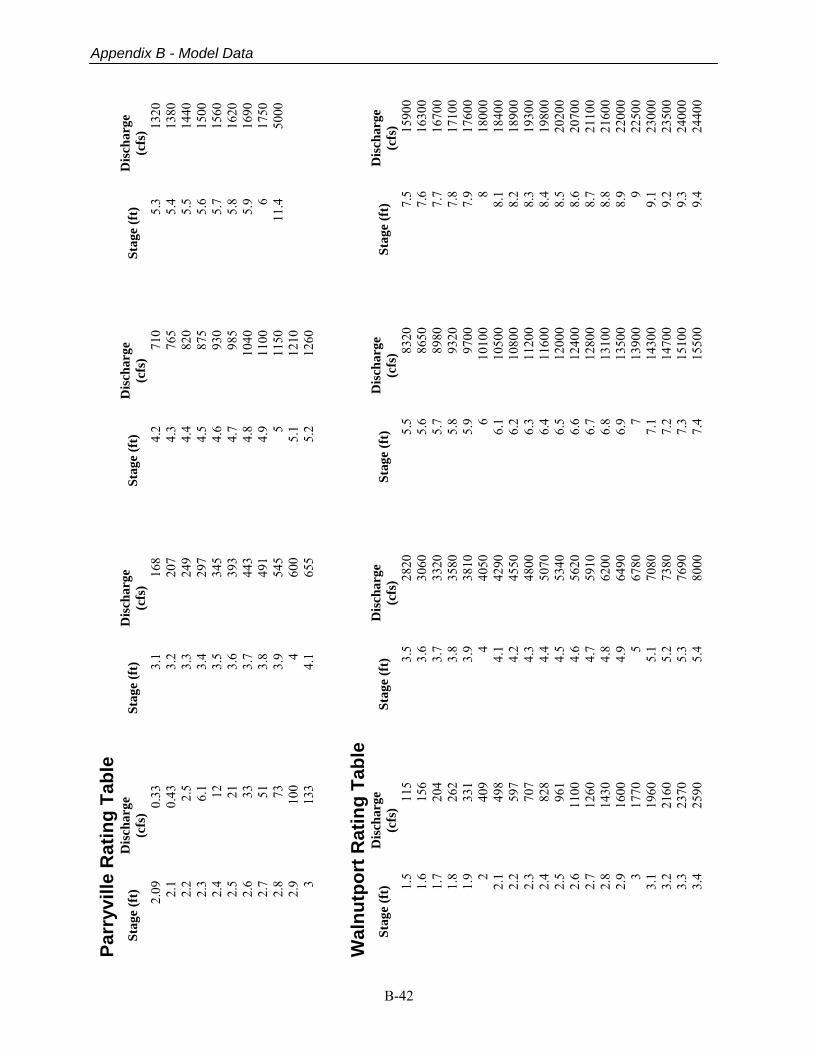
B-42
Appendix B - Model Data
Parr
yvill
e R
atin
g Ta
ble
Stag
e (f
t)
Dis
char
ge
(cfs
) 2.
09
0.33
2.
1 0.
43
2.2
2.5
2.3
6.1
2.4
12
2.5
21
2.6
33
2.7
51
2.8
73
2.9
100
3 13
3
Stag
e (f
t)
Dis
char
ge
(cfs
) 3.
1 16
8 3.
2 20
7 3.
3 24
9 3.
4 29
7 3.
5 34
5 3.
6 39
3 3.
7 44
3 3.
8 49
1 3.
9 54
5 4
600
4.1
655
Stag
e (f
t)
Dis
char
ge
(cfs
) 4.
2 71
0 4.
3 76
5 4.
4 82
0 4.
5 87
5 4.
6 93
0 4.
7 98
5 4.
8 10
40
4.9
1100
5
1150
5.
1 12
10
5.2
1260
Stag
e (f
t)
Dis
char
ge
(cfs
) 5.
3 13
20
5.4
1380
5.
5 14
40
5.6
1500
5.
7 15
60
5.8
1620
5.
9 16
90
6 17
50
11.4
50
00
Wal
nutp
ort R
atin
g Ta
ble
Stag
e (f
t)
Dis
char
ge
(cfs
) 1.
5 11
5 1.
6 15
6 1.
7 20
4 1.
8 26
2 1.
9 33
1 2
409
2.1
498
2.2
597
2.3
707
2.4
828
2.5
961
2.6
1100
2.
7 12
60
2.8
1430
2.
9 16
00
3 17
70
3.1
1960
3.
2 21
60
3.3
2370
3.
4 25
90
Stag
e (f
t)
Dis
char
ge
(cfs
) 3.
5 28
20
3.6
3060
3.
7 33
20
3.8
3580
3.
9 38
10
4 40
50
4.1
4290
4.
2 45
50
4.3
4800
4.
4 50
70
4.5
5340
4.
6 56
20
4.7
5910
4.
8 62
00
4.9
6490
5
6780
5.
1 70
80
5.2
7380
5.
3 76
90
5.4
8000
Stag
e (f
t)
Dis
char
ge
(cfs
) 5.
5 83
20
5.6
8650
5.
7 89
80
5.8
9320
5.
9 97
00
6 10
100
6.1
1050
0 6.
2 10
800
6.3
1120
0 6.
4 11
600
6.5
1200
0 6.
6 12
400
6.7
1280
0 6.
8 13
100
6.9
1350
0 7
1390
0 7.
1 14
300
7.2
1470
0 7.
3 15
100
7.4
1550
0
Stag
e (f
t)
Dis
char
ge
(cfs
) 7.
5 15
900
7.6
1630
0 7.
7 16
700
7.8
1710
0 7.
9 17
600
8 18
000
8.1
1840
0 8.
2 18
900
8.3
1930
0 8.
4 19
800
8.5
2020
0 8.
6 20
700
8.7
2110
0 8.
8 21
600
8.9
2200
0 9
2250
0 9.
1 23
000
9.2
2350
0 9.
3 24
000
9.4
2440
0
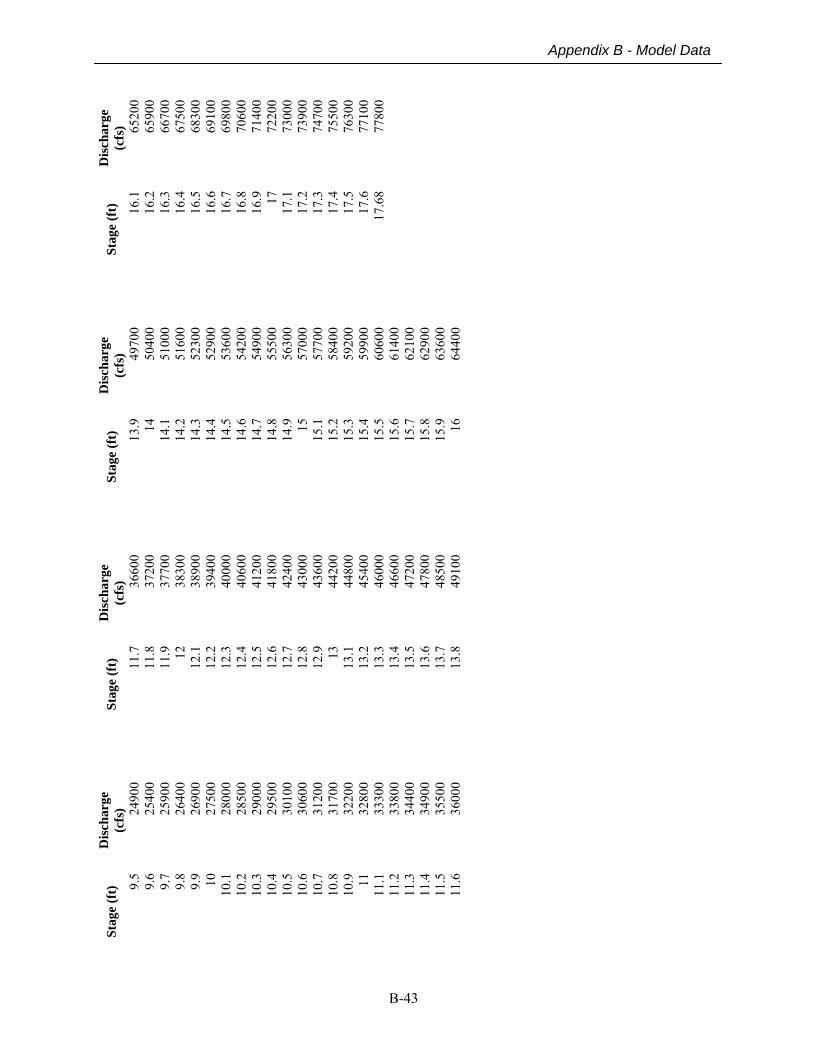
B-43
Appendix B - Model Data
Stag
e (f
t)
Dis
char
ge
(cfs
) 9.
5 24
900
9.6
2540
0 9.
7 25
900
9.8
2640
0 9.
9 26
900
10
2750
0 10
.1
2800
0 10
.2
2850
0 10
.3
2900
0 10
.4
2950
0 10
.5
3010
0 10
.6
3060
0 10
.7
3120
0 10
.8
3170
0 10
.9
3220
0 11
32
800
11.1
33
300
11.2
33
800
11.3
34
400
11.4
34
900
11.5
35
500
11.6
36
000
Stag
e (f
t)
Dis
char
ge
(cfs
) 11
.7
3660
0 11
.8
3720
0 11
.9
3770
0 12
38
300
12.1
38
900
12.2
39
400
12.3
40
000
12.4
40
600
12.5
41
200
12.6
41
800
12.7
42
400
12.8
43
000
12.9
43
600
13
4420
0 13
.1
4480
0 13
.2
4540
0 13
.3
4600
0 13
.4
4660
0 13
.5
4720
0 13
.6
4780
0 13
.7
4850
0 13
.8
4910
0
Stag
e (f
t)
Dis
char
ge
(cfs
) 13
.9
4970
0 14
50
400
14.1
51
000
14.2
51
600
14.3
52
300
14.4
52
900
14.5
53
600
14.6
54
200
14.7
54
900
14.8
55
500
14.9
56
300
15
5700
0 15
.1
5770
0 15
.2
5840
0 15
.3
5920
0 15
.4
5990
0 15
.5
6060
0 15
.6
6140
0 15
.7
6210
0 15
.8
6290
0 15
.9
6360
0 16
64
400
Stag
e (f
t)
Dis
char
ge
(cfs
) 16
.1
6520
0 16
.2
6590
0 16
.3
6670
0 16
.4
6750
0 16
.5
6830
0 16
.6
6910
0 16
.7
6980
0 16
.8
7060
0 16
.9
7140
0 17
72
200
17.1
73
000
17.2
73
900
17.3
74
700
17.4
75
500
17.5
76
300
17.6
77
100
17.6
8 77
800
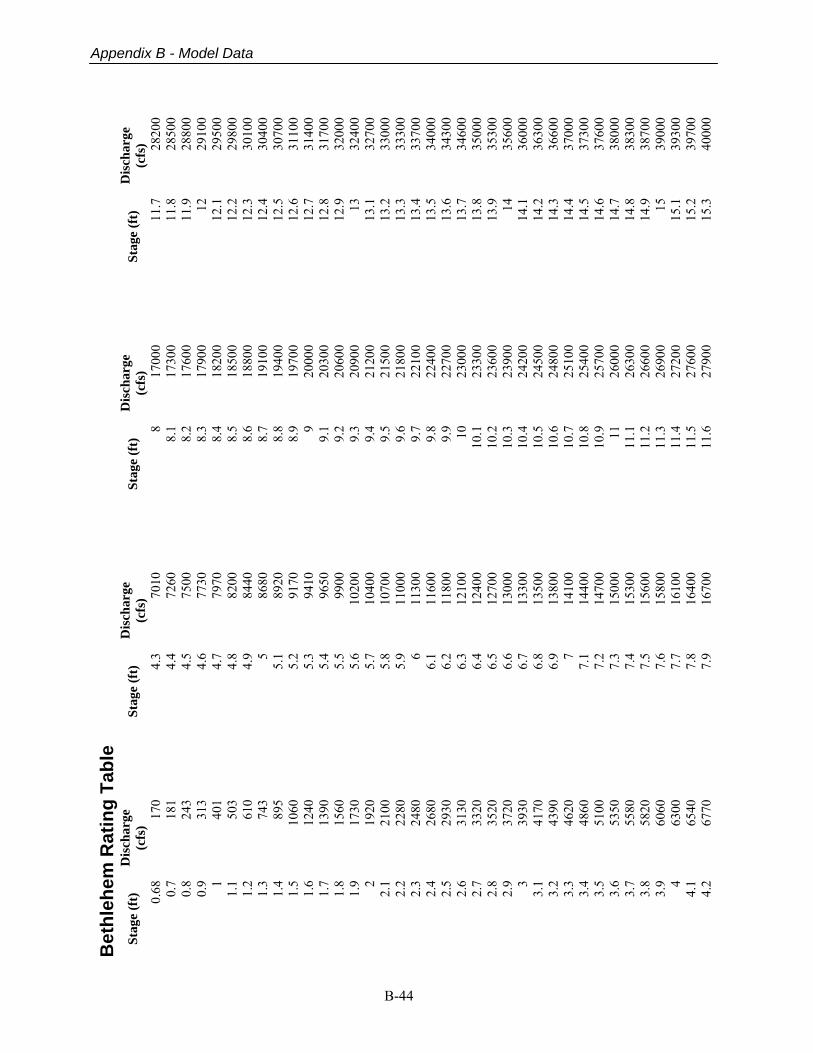
B-44
Appendix B - Model Data
Bet
hleh
em R
atin
g Ta
ble
Stag
e (f
t)
Dis
char
ge
(cfs
) 0.
68
170
0.7
181
0.8
243
0.9
313
1 40
1 1.
1 50
3 1.
2 61
0 1.
3 74
3 1.
4 89
5 1.
5 10
60
1.6
1240
1.
7 13
90
1.8
1560
1.
9 17
30
2 19
20
2.1
2100
2.
2 22
80
2.3
2480
2.
4 26
80
2.5
2930
2.
6 31
30
2.7
3320
2.
8 35
20
2.9
3720
3
3930
3.
1 41
70
3.2
4390
3.
3 46
20
3.4
4860
3.
5 51
00
3.6
5350
3.
7 55
80
3.8
5820
3.
9 60
60
4 63
00
4.1
6540
4.
2 67
70
Stag
e (f
t)
Dis
char
ge
(cfs
) 4.
370
104.
472
604.
575
004.
677
304.
779
704.
882
004.
984
405
8680
5.1
8920
5.2
9170
5.3
9410
5.4
9650
5.5
9900
5.6
1020
05.
710
400
5.8
1070
05.
911
000
611
300
6.1
1160
06.
211
800
6.3
1210
06.
412
400
6.5
1270
06.
613
000
6.7
1330
06.
813
500
6.9
1380
07
1410
07.
114
400
7.2
1470
07.
315
000
7.4
1530
07.
515
600
7.6
1580
07.
716
100
7.8
1640
07.
916
700
Stag
e (f
t)
Dis
char
ge
(cfs
) 8
1700
08.
1 17
300
8.2
1760
08.
3 17
900
8.4
1820
08.
5 18
500
8.6
1880
08.
7 19
100
8.8
1940
08.
9 19
700
9 20
000
9.1
2030
09.
2 20
600
9.3
2090
09.
4 21
200
9.5
2150
09.
6 21
800
9.7
2210
09.
8 22
400
9.9
2270
010
23
000
10.1
23
300
10.2
23
600
10.3
23
900
10.4
24
200
10.5
24
500
10.6
24
800
10.7
25
100
10.8
25
400
10.9
25
700
11
2600
011
.1
2630
011
.2
2660
011
.3
2690
011
.4
2720
011
.5
2760
011
.6
2790
0
Stag
e (f
t)
Dis
char
ge
(cfs
) 11
.728
200
11.8
2850
011
.928
800
1229
100
12.1
2950
012
.229
800
12.3
3010
012
.430
400
12.5
3070
012
.631
100
12.7
3140
012
.831
700
12.9
3200
013
3240
013
.132
700
13.2
3300
013
.333
300
13.4
3370
013
.534
000
13.6
3430
013
.734
600
13.8
3500
013
.935
300
1435
600
14.1
3600
014
.236
300
14.3
3660
014
.437
000
14.5
3730
014
.637
600
14.7
3800
014
.838
300
14.9
3870
015
3900
015
.139
300
15.2
3970
015
.340
000
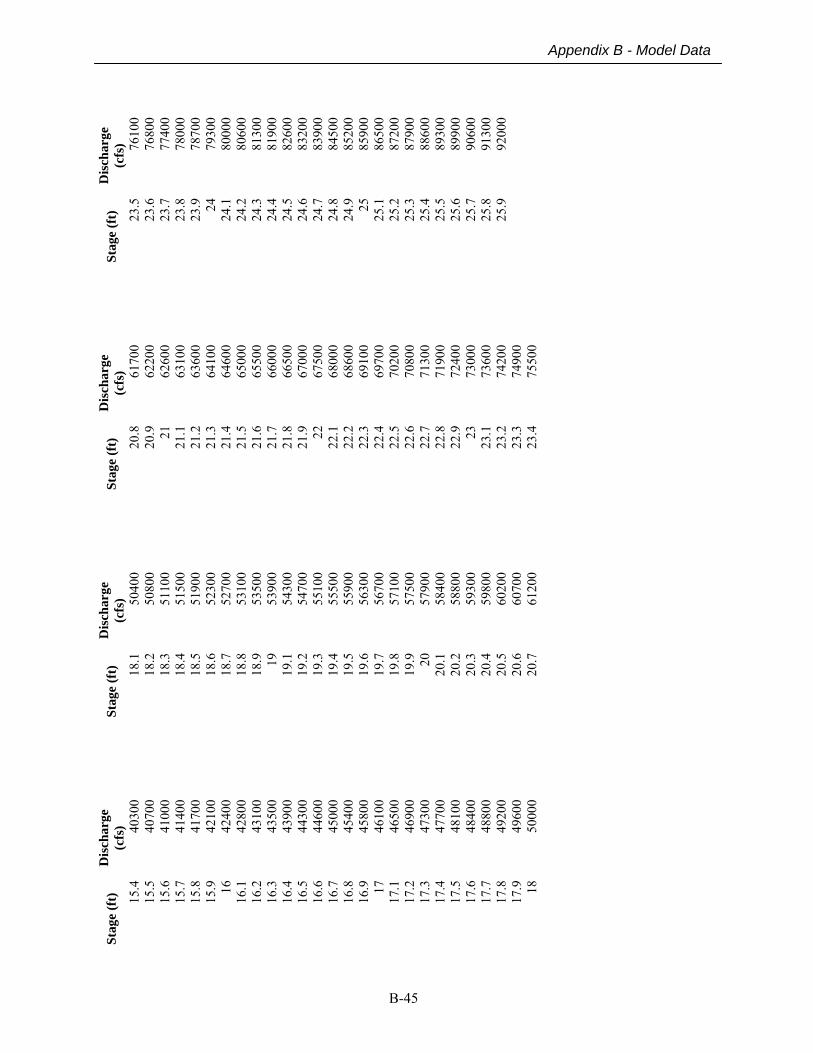
B-45
Appendix B - Model Data
Stag
e (f
t)
Dis
char
ge
(cfs
) 15
.4
4030
0 15
.5
4070
0 15
.6
4100
0 15
.7
4140
0 15
.8
4170
0 15
.9
4210
0 16
42
400
16.1
42
800
16.2
43
100
16.3
43
500
16.4
43
900
16.5
44
300
16.6
44
600
16.7
45
000
16.8
45
400
16.9
45
800
17
4610
0 17
.1
4650
0 17
.2
4690
0 17
.3
4730
0 17
.4
4770
0 17
.5
4810
0 17
.6
4840
0 17
.7
4880
0 17
.8
4920
0 17
.9
4960
0 18
50
000
Stag
e (f
t)
Dis
char
ge
(cfs
) 18
.150
400
18.2
5080
018
.351
100
18.4
5150
018
.551
900
18.6
5230
018
.752
700
18.8
5310
018
.953
500
1953
900
19.1
5430
019
.254
700
19.3
5510
019
.455
500
19.5
5590
019
.656
300
19.7
5670
019
.857
100
19.9
5750
020
5790
020
.158
400
20.2
5880
020
.359
300
20.4
5980
020
.560
200
20.6
6070
020
.761
200
Stag
e (f
t)
Dis
char
ge
(cfs
) 20
.8
6170
020
.9
6220
021
62
600
21.1
63
100
21.2
63
600
21.3
64
100
21.4
64
600
21.5
65
000
21.6
65
500
21.7
66
000
21.8
66
500
21.9
67
000
22
6750
022
.1
6800
022
.2
6860
022
.3
6910
022
.4
6970
022
.5
7020
022
.6
7080
022
.7
7130
022
.8
7190
022
.9
7240
023
73
000
23.1
73
600
23.2
74
200
23.3
74
900
23.4
75
500
Stag
e (f
t)
Dis
char
ge
(cfs
) 23
.576
100
23.6
7680
023
.777
400
23.8
7800
023
.978
700
2479
300
24.1
8000
024
.280
600
24.3
8130
024
.481
900
24.5
8260
024
.683
200
24.7
8390
024
.884
500
24.9
8520
025
8590
025
.186
500
25.2
8720
025
.387
900
25.4
8860
025
.589
300
25.6
8990
025
.790
600
25.8
9130
025
.992
000
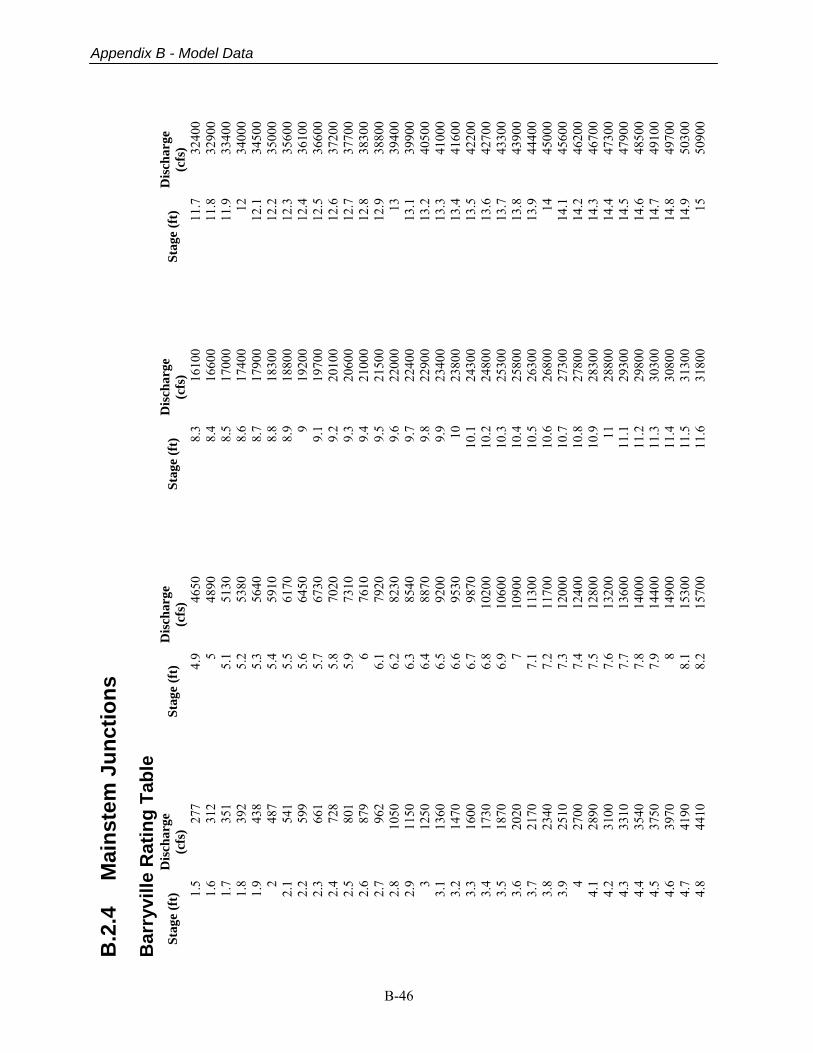
B-46
Appendix B - Model Data
B.2
.4
Mai
nste
m J
unct
ions
B
arry
ville
Rat
ing
Tabl
e St
age
(ft)
D
isch
arge
(c
fs)
1.5
277
1.6
312
1.7
351
1.8
392
1.9
438
248
7 2.
154
1 2.
259
9 2.
366
1 2.
472
8 2.
580
1 2.
687
9 2.
796
2 2.
810
50
2.9
1150
3
1250
3.
113
60
3.2
1470
3.
316
00
3.4
1730
3.
518
70
3.6
2020
3.
721
70
3.8
2340
3.
925
10
427
00
4.1
2890
4.
231
00
4.3
3310
4.
435
40
4.5
3750
4.
639
70
4.7
4190
4.
844
10
Stag
e (f
t)
Dis
char
ge
(cfs
) 4.
946
505
4890
5.1
5130
5.2
5380
5.3
5640
5.4
5910
5.5
6170
5.6
6450
5.7
6730
5.8
7020
5.9
7310
676
106.
179
206.
282
306.
385
406.
488
706.
592
006.
695
306.
798
706.
810
200
6.9
1060
07
1090
07.
111
300
7.2
1170
07.
312
000
7.4
1240
07.
512
800
7.6
1320
07.
713
600
7.8
1400
07.
914
400
814
900
8.1
1530
08.
215
700
Stag
e (f
t)
Dis
char
ge
(cfs
) 8.
316
100
8.4
1660
08.
517
000
8.6
1740
08.
717
900
8.8
1830
08.
918
800
919
200
9.1
1970
09.
220
100
9.3
2060
09.
421
000
9.5
2150
09.
622
000
9.7
2240
09.
822
900
9.9
2340
010
2380
010
.124
300
10.2
2480
010
.325
300
10.4
2580
010
.526
300
10.6
2680
010
.727
300
10.8
2780
010
.928
300
1128
800
11.1
2930
011
.229
800
11.3
3030
011
.430
800
11.5
3130
011
.631
800
Stag
e (f
t)
Dis
char
ge
(cfs
) 11
.732
400
11.8
3290
011
.933
400
1234
000
12.1
3450
012
.235
000
12.3
3560
012
.436
100
12.5
3660
012
.637
200
12.7
3770
012
.838
300
12.9
3880
013
3940
013
.139
900
13.2
4050
013
.341
000
13.4
4160
013
.542
200
13.6
4270
013
.743
300
13.8
4390
013
.944
400
1445
000
14.1
4560
014
.246
200
14.3
4670
014
.447
300
14.5
4790
014
.648
500
14.7
4910
014
.849
700
14.9
5030
015
5090
0
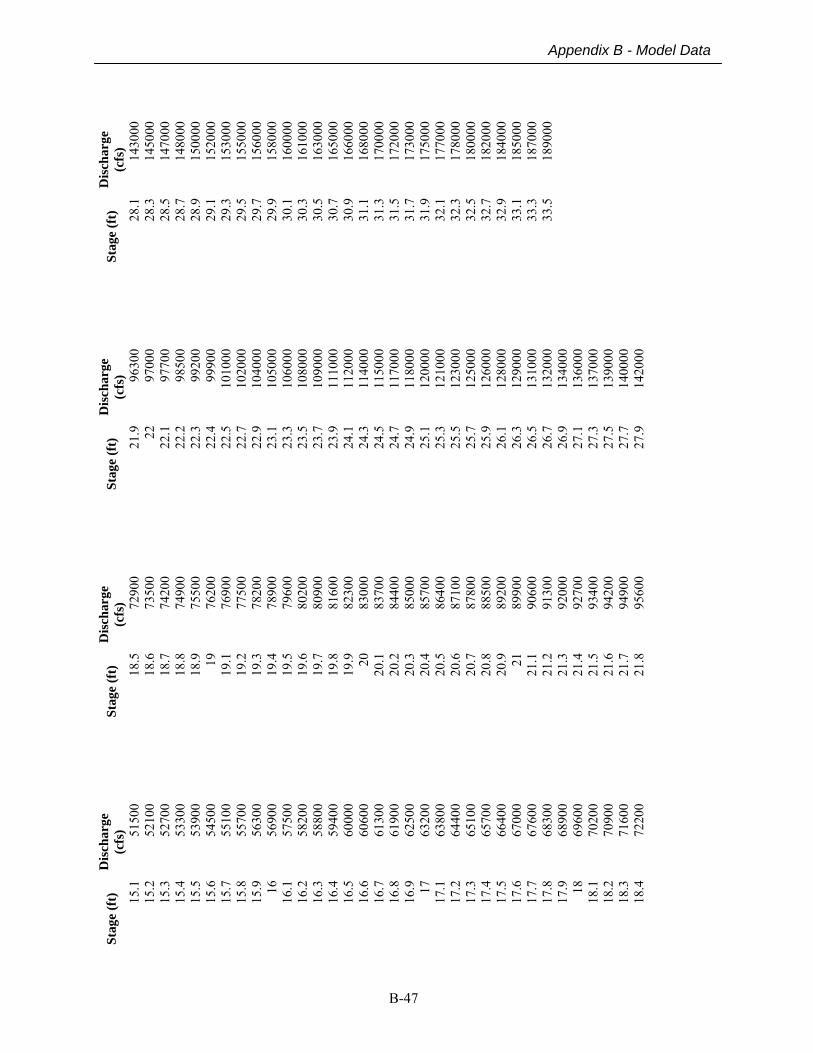
B-47
Appendix B - Model Data
Stag
e (f
t)
Dis
char
ge
(cfs
) 15
.151
500
15.2
5210
0 15
.352
700
15.4
5330
0 15
.553
900
15.6
5450
0 15
.755
100
15.8
5570
0 15
.956
300
1656
900
16.1
5750
0 16
.258
200
16.3
5880
0 16
.459
400
16.5
6000
0 16
.660
600
16.7
6130
0 16
.861
900
16.9
6250
0 17
6320
0 17
.163
800
17.2
6440
0 17
.365
100
17.4
6570
0 17
.566
400
17.6
6700
0 17
.767
600
17.8
6830
0 17
.968
900
1869
600
18.1
7020
0 18
.270
900
18.3
7160
0 18
.472
200
Stag
e (f
t)
Dis
char
ge
(cfs
) 18
.572
900
18.6
7350
018
.774
200
18.8
7490
018
.975
500
1976
200
19.1
7690
019
.277
500
19.3
7820
019
.478
900
19.5
7960
019
.680
200
19.7
8090
019
.881
600
19.9
8230
020
8300
020
.183
700
20.2
8440
020
.385
000
20.4
8570
020
.586
400
20.6
8710
020
.787
800
20.8
8850
020
.989
200
2189
900
21.1
9060
021
.291
300
21.3
9200
021
.492
700
21.5
9340
021
.694
200
21.7
9490
021
.895
600
Stag
e (f
t)
Dis
char
ge
(cfs
) 21
.996
300
2297
000
22.1
9770
022
.298
500
22.3
9920
022
.499
900
22.5
1010
0022
.710
2000
22.9
1040
0023
.110
5000
23.3
1060
0023
.510
8000
23.7
1090
0023
.911
1000
24.1
1120
0024
.311
4000
24.5
1150
0024
.711
7000
24.9
1180
0025
.112
0000
25.3
1210
0025
.512
3000
25.7
1250
0025
.912
6000
26.1
1280
0026
.312
9000
26.5
1310
0026
.713
2000
26.9
1340
0027
.113
6000
27.3
1370
0027
.513
9000
27.7
1400
0027
.914
2000
Stag
e (f
t)
Dis
char
ge
(cfs
) 28
.114
3000
28.3
1450
0028
.514
7000
28.7
1480
0028
.915
0000
29.1
1520
0029
.315
3000
29.5
1550
0029
.715
6000
29.9
1580
0030
.116
0000
30.3
1610
0030
.516
3000
30.7
1650
0030
.916
6000
31.1
1680
0031
.317
0000
31.5
1720
0031
.717
3000
31.9
1750
0032
.117
7000
32.3
1780
0032
.518
0000
32.7
1820
0032
.918
4000
33.1
1850
0033
.318
7000
33.5
1890
00
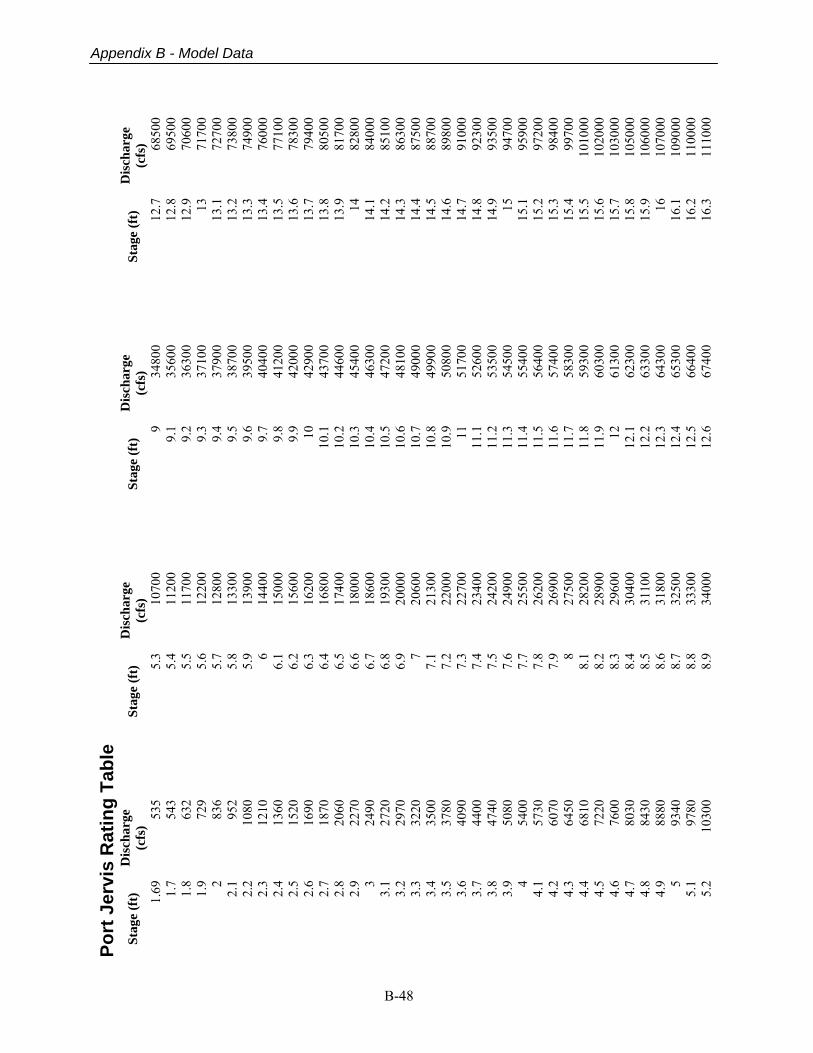
B-48
Appendix B - Model Data
Port
Jer
vis
Rat
ing
Tabl
e St
age
(ft)
D
isch
arge
(c
fs)
1.69
53
5 1.
7 54
3 1.
8 63
2 1.
9 72
9 2
836
2.1
952
2.2
1080
2.
3 12
10
2.4
1360
2.
5 15
20
2.6
1690
2.
7 18
70
2.8
2060
2.
9 22
70
3 24
90
3.1
2720
3.
2 29
70
3.3
3220
3.
4 35
00
3.5
3780
3.
6 40
90
3.7
4400
3.
8 47
40
3.9
5080
4
5400
4.
1 57
30
4.2
6070
4.
3 64
50
4.4
6810
4.
5 72
20
4.6
7600
4.
7 80
30
4.8
8430
4.
9 88
80
5 93
40
5.1
9780
5.
2 10
300
Stag
e (f
t)
Dis
char
ge
(cfs
) 5.
310
700
5.4
1120
05.
511
700
5.6
1220
05.
712
800
5.8
1330
05.
913
900
614
400
6.1
1500
06.
215
600
6.3
1620
06.
416
800
6.5
1740
06.
618
000
6.7
1860
06.
819
300
6.9
2000
07
2060
07.
121
300
7.2
2200
07.
322
700
7.4
2340
07.
524
200
7.6
2490
07.
725
500
7.8
2620
07.
926
900
827
500
8.1
2820
08.
228
900
8.3
2960
08.
430
400
8.5
3110
08.
631
800
8.7
3250
08.
833
300
8.9
3400
0
Stag
e (f
t)
Dis
char
ge
(cfs
) 9
3480
09.
1 35
600
9.2
3630
09.
3 37
100
9.4
3790
09.
5 38
700
9.6
3950
09.
7 40
400
9.8
4120
09.
9 42
000
10
4290
010
.1
4370
010
.2
4460
010
.3
4540
010
.4
4630
010
.5
4720
010
.6
4810
010
.7
4900
010
.8
4990
010
.9
5080
011
51
700
11.1
52
600
11.2
53
500
11.3
54
500
11.4
55
400
11.5
56
400
11.6
57
400
11.7
58
300
11.8
59
300
11.9
60
300
12
6130
012
.1
6230
012
.2
6330
012
.3
6430
012
.4
6530
012
.5
6640
012
.6
6740
0
Stag
e (f
t)
Dis
char
ge
(cfs
) 12
.768
500
12.8
6950
012
.970
600
1371
700
13.1
7270
013
.273
800
13.3
7490
013
.476
000
13.5
7710
013
.678
300
13.7
7940
013
.880
500
13.9
8170
014
8280
014
.184
000
14.2
8510
014
.386
300
14.4
8750
014
.588
700
14.6
8980
014
.791
000
14.8
9230
014
.993
500
1594
700
15.1
9590
015
.297
200
15.3
9840
015
.499
700
15.5
1010
0015
.610
2000
15.7
1030
0015
.810
5000
15.9
1060
0016
1070
0016
.110
9000
16.2
1100
0016
.311
1000
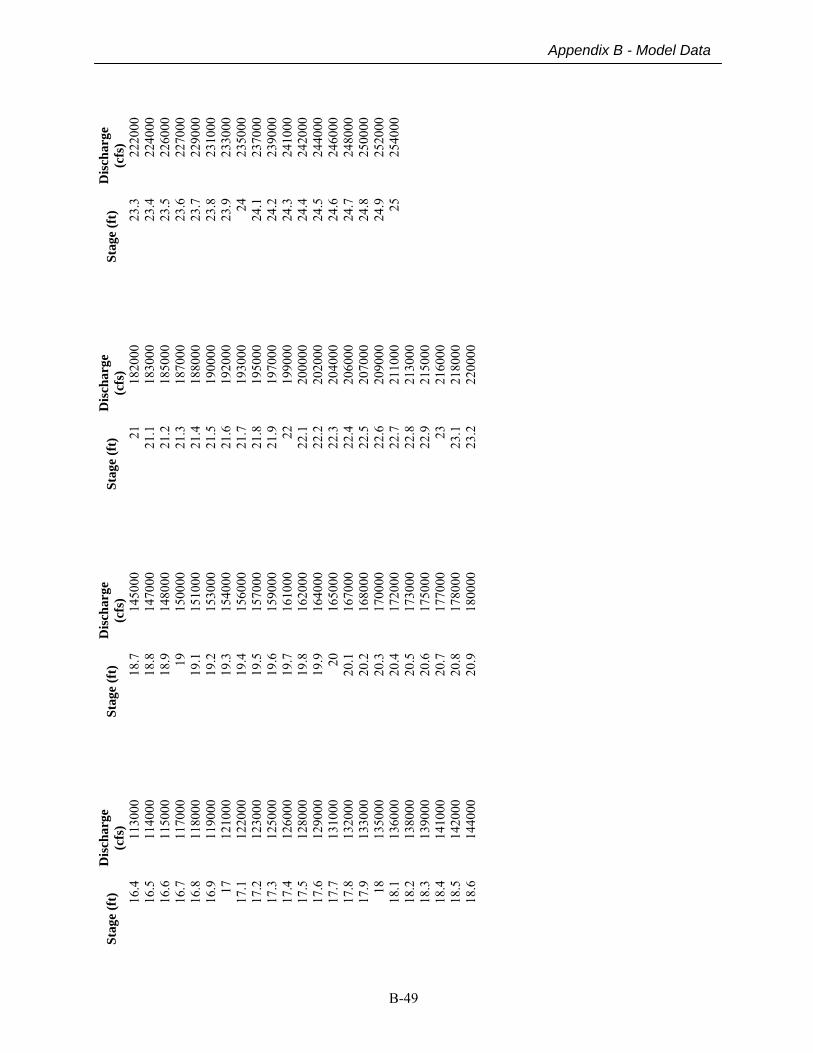
B-49
Appendix B - Model Data
Stag
e (f
t)
Dis
char
ge
(cfs
) 16
.4
1130
00
16.5
11
4000
16
.6
1150
00
16.7
11
7000
16
.8
1180
00
16.9
11
9000
17
12
1000
17
.1
1220
00
17.2
12
3000
17
.3
1250
00
17.4
12
6000
17
.5
1280
00
17.6
12
9000
17
.7
1310
00
17.8
13
2000
17
.9
1330
00
18
1350
00
18.1
13
6000
18
.2
1380
00
18.3
13
9000
18
.4
1410
00
18.5
14
2000
18
.6
1440
00
Stag
e (f
t)
Dis
char
ge
(cfs
) 18
.714
5000
18.8
1470
0018
.914
8000
1915
0000
19.1
1510
0019
.215
3000
19.3
1540
0019
.415
6000
19.5
1570
0019
.615
9000
19.7
1610
0019
.816
2000
19.9
1640
0020
1650
0020
.116
7000
20.2
1680
0020
.317
0000
20.4
1720
0020
.517
3000
20.6
1750
0020
.717
7000
20.8
1780
0020
.918
0000
Stag
e (f
t)
Dis
char
ge
(cfs
) 21
18
2000
21.1
18
3000
21.2
18
5000
21.3
18
7000
21.4
18
8000
21.5
19
0000
21.6
19
2000
21.7
19
3000
21.8
19
5000
21.9
19
7000
22
1990
0022
.1
2000
0022
.2
2020
0022
.3
2040
0022
.4
2060
0022
.5
2070
0022
.6
2090
0022
.7
2110
0022
.8
2130
0022
.9
2150
0023
21
6000
23.1
21
8000
23.2
22
0000
Stag
e (f
t)
Dis
char
ge
(cfs
) 23
.322
2000
23.4
2240
0023
.522
6000
23.6
2270
0023
.722
9000
23.8
2310
0023
.923
3000
2423
5000
24.1
2370
0024
.223
9000
24.3
2410
0024
.424
2000
24.5
2440
0024
.624
6000
24.7
2480
0024
.825
0000
24.9
2520
0025
2540
00

B-50
Appendix B - Model Data
Mon
tagu
e R
atin
g Ta
ble
Stag
e (f
t)
Dis
char
ge
(cfs
) 4.
04
600
4.1
663
4.2
773
4.3
891
4.4
1020
4.
5 11
50
4.6
1290
4.
7 14
30
4.8
1590
4.
9 17
40
5 19
10
5.1
2080
5.
2 22
60
5.3
2450
5.
4 26
40
5.5
2840
5.
6 30
40
5.7
3250
5.
8 34
70
5.9
3690
6
3920
6.
1 41
50
6.2
4390
6.
3 46
40
6.4
4890
6.
5 51
50
6.6
5410
6.
7 56
80
6.8
5960
6.
9 62
40
7 65
20
7.1
6820
7.
2 71
10
7.3
7420
7.
4 77
20
7.5
8040
7.
6 83
60
Stag
e (f
t)
Dis
char
ge
(cfs
) 7.
786
807.
890
107.
993
508
9690
8.1
1000
08.
210
400
8.3
1070
08.
411
100
8.5
1150
08.
611
800
8.7
1220
08.
812
600
8.9
1300
09
1340
09.
113
800
9.2
1420
09.
314
600
9.4
1500
09.
515
400
9.6
1580
09.
716
300
9.8
1670
09.
917
100
1017
600
10.1
1800
010
.218
500
10.3
1900
010
.419
400
10.5
1990
010
.620
400
10.7
2080
010
.821
300
10.9
2180
011
2230
011
.122
800
11.2
2330
011
.323
800
Stag
e (f
t)
Dis
char
ge
(cfs
) 11
.4
2430
011
.5
2480
011
.6
2540
011
.7
2590
011
.8
2640
011
.9
2700
012
27
500
12.1
28
000
12.2
28
600
12.3
29
200
12.4
29
700
12.5
30
300
12.6
30
800
12.7
31
400
12.8
32
000
12.9
32
600
13
3310
013
.1
3370
013
.2
3430
013
.3
3490
013
.4
3550
013
.5
3600
013
.6
3660
013
.7
3720
013
.8
3780
013
.9
3840
014
39
100
14.1
39
700
14.2
40
300
14.3
40
900
14.4
41
500
14.5
42
200
14.6
42
800
14.7
43
400
14.8
44
100
14.9
44
700
15
4540
0
Stag
e (f
t)
Dis
char
ge
(cfs
) 15
.146
000
15.2
4670
015
.347
400
15.4
4800
015
.548
700
15.6
4940
015
.750
100
15.8
5070
015
.951
400
1652
100
16.1
5280
016
.253
500
16.3
5420
016
.454
900
16.5
5560
016
.656
300
16.7
5710
016
.857
800
16.9
5850
017
5920
017
.160
000
17.2
6070
017
.361
400
17.4
6220
017
.562
900
17.6
6370
017
.764
400
17.8
6520
017
.965
900
1866
700
18.1
6750
018
.268
300
18.3
6900
018
.469
800
18.5
7060
018
.671
400
18.7
7220
0
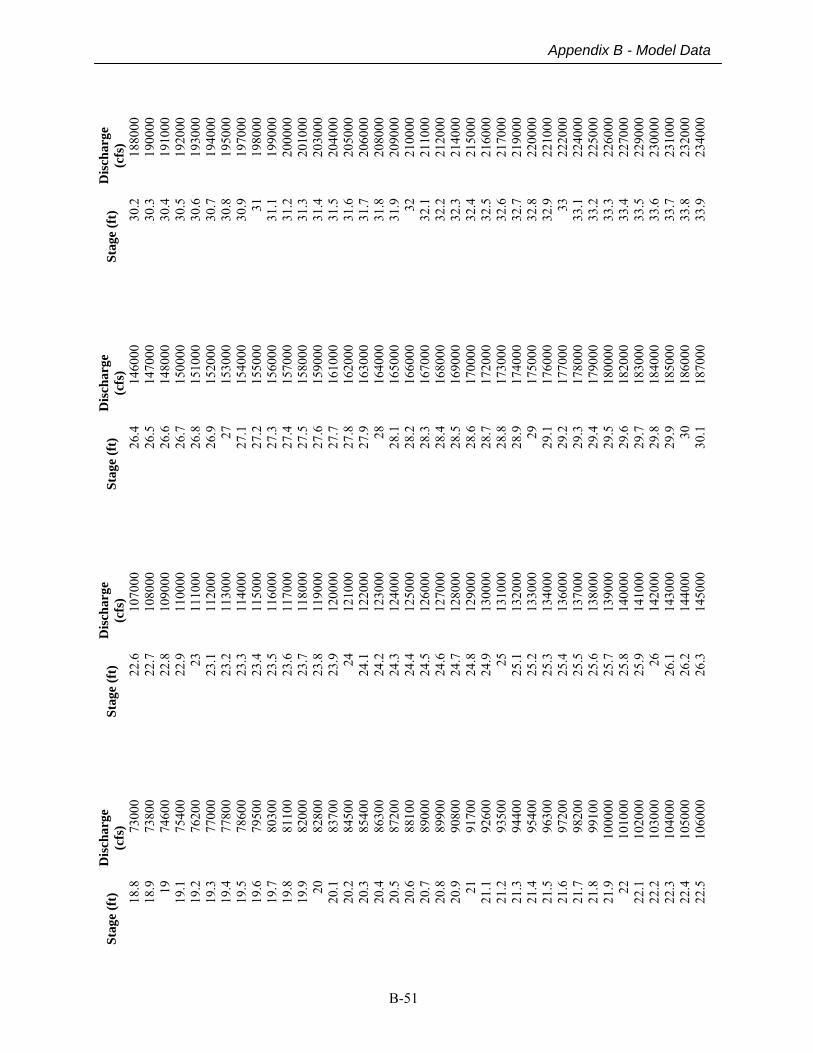
B-51
Appendix B - Model Data
Stag
e (f
t)
Dis
char
ge
(cfs
) 18
.8
7300
0 18
.9
7380
0 19
74
600
19.1
75
400
19.2
76
200
19.3
77
000
19.4
77
800
19.5
78
600
19.6
79
500
19.7
80
300
19.8
81
100
19.9
82
000
20
8280
0 20
.1
8370
0 20
.2
8450
0 20
.3
8540
0 20
.4
8630
0 20
.5
8720
0 20
.6
8810
0 20
.7
8900
0 20
.8
8990
0 20
.9
9080
0 21
91
700
21.1
92
600
21.2
93
500
21.3
94
400
21.4
95
400
21.5
96
300
21.6
97
200
21.7
98
200
21.8
99
100
21.9
10
0000
22
10
1000
22
.1
1020
00
22.2
10
3000
22
.3
1040
00
22.4
10
5000
22
.5
1060
00
Stag
e (f
t)
Dis
char
ge
(cfs
) 22
.610
7000
22.7
1080
0022
.810
9000
22.9
1100
0023
1110
0023
.111
2000
23.2
1130
0023
.311
4000
23.4
1150
0023
.511
6000
23.6
1170
0023
.711
8000
23.8
1190
0023
.912
0000
2412
1000
24.1
1220
0024
.212
3000
24.3
1240
0024
.412
5000
24.5
1260
0024
.612
7000
24.7
1280
0024
.812
9000
24.9
1300
0025
1310
0025
.113
2000
25.2
1330
0025
.313
4000
25.4
1360
0025
.513
7000
25.6
1380
0025
.713
9000
25.8
1400
0025
.914
1000
2614
2000
26.1
1430
0026
.214
4000
26.3
1450
00
Stag
e (f
t)
Dis
char
ge
(cfs
) 26
.4
1460
0026
.5
1470
0026
.6
1480
0026
.7
1500
0026
.8
1510
0026
.9
1520
0027
15
3000
27.1
15
4000
27.2
15
5000
27.3
15
6000
27.4
15
7000
27.5
15
8000
27.6
15
9000
27.7
16
1000
27.8
16
2000
27.9
16
3000
28
1640
0028
.1
1650
0028
.2
1660
0028
.3
1670
0028
.4
1680
0028
.5
1690
0028
.6
1700
0028
.7
1720
0028
.8
1730
0028
.9
1740
0029
17
5000
29.1
17
6000
29.2
17
7000
29.3
17
8000
29.4
17
9000
29.5
18
0000
29.6
18
2000
29.7
18
3000
29.8
18
4000
29.9
18
5000
30
1860
0030
.1
1870
00
Stag
e (f
t)
Dis
char
ge
(cfs
) 30
.218
8000
30.3
1900
0030
.419
1000
30.5
1920
0030
.619
3000
30.7
1940
0030
.819
5000
30.9
1970
0031
1980
0031
.119
9000
31.2
2000
0031
.320
1000
31.4
2030
0031
.520
4000
31.6
2050
0031
.720
6000
31.8
2080
0031
.920
9000
3221
0000
32.1
2110
0032
.221
2000
32.3
2140
0032
.421
5000
32.5
2160
0032
.621
7000
32.7
2190
0032
.822
0000
32.9
2210
0033
2220
0033
.122
4000
33.2
2250
0033
.322
6000
33.4
2270
0033
.522
9000
33.6
2300
0033
.723
1000
33.8
2320
0033
.923
4000
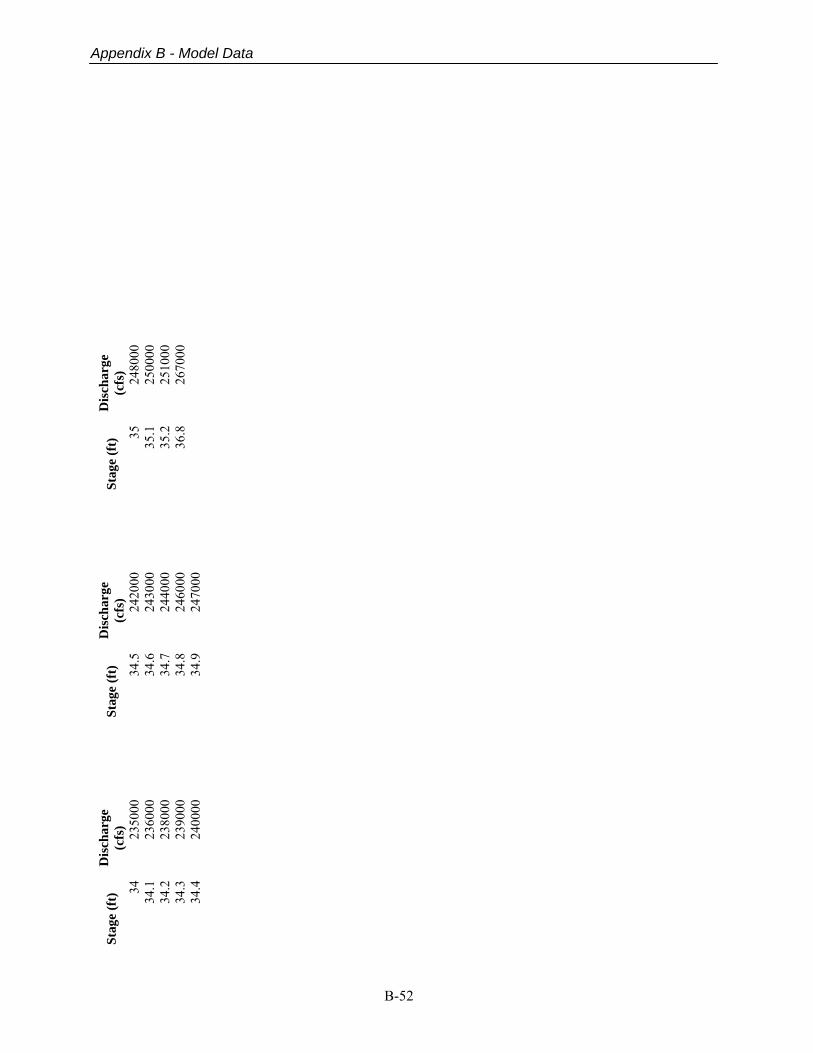
B-52
Appendix B - Model Data
Stag
e (f
t)
Dis
char
ge
(cfs
) 34
23
5000
34
.1
2360
00
34.2
23
8000
34
.3
2390
00
34.4
24
0000
Stag
e (f
t)
Dis
char
ge
(cfs
) 34
.524
2000
34.6
2430
0034
.724
4000
34.8
2460
0034
.924
7000
Stag
e (f
t)
Dis
char
ge
(cfs
) 35
24
8000
35.1
25
0000
35.2
25
1000
36.8
26
7000
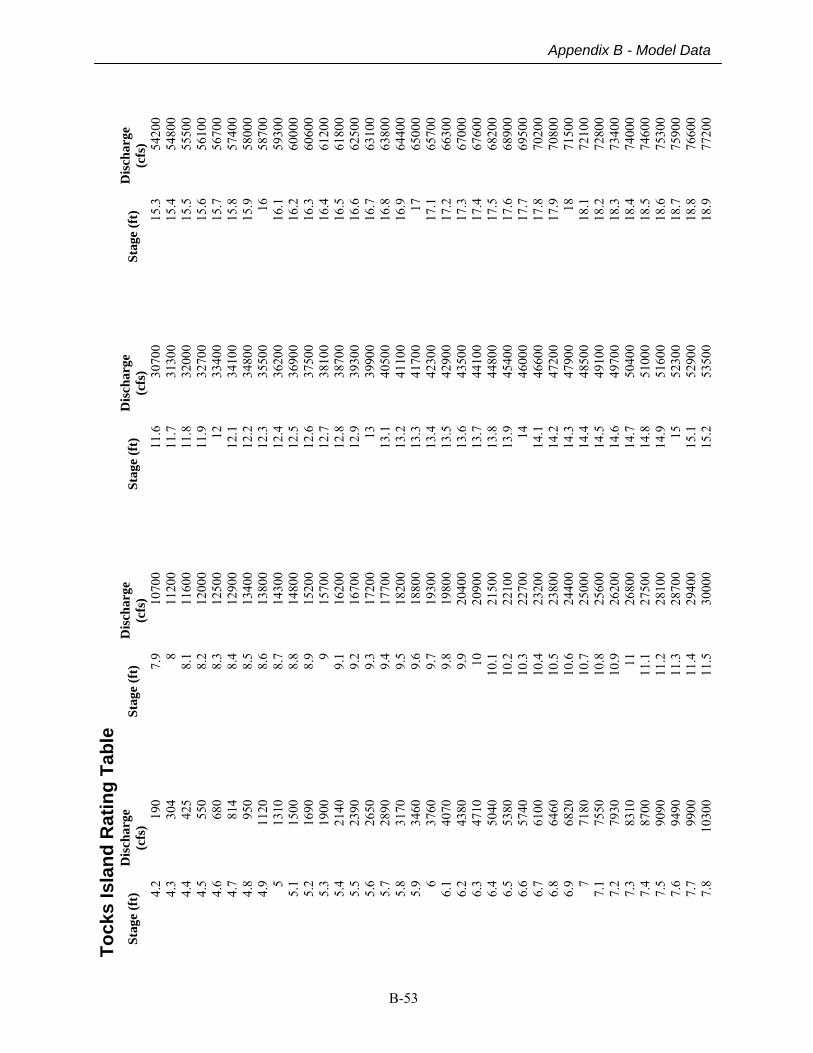
B-53
Appendix B - Model Data
Tock
s Is
land
Rat
ing
Tabl
e St
age
(ft)
D
isch
arge
(c
fs)
4.2
190
4.3
304
4.4
425
4.5
550
4.6
680
4.7
814
4.8
950
4.9
1120
5
1310
5.
1 15
00
5.2
1690
5.
3 19
00
5.4
2140
5.
5 23
90
5.6
2650
5.
7 28
90
5.8
3170
5.
9 34
60
6 37
60
6.1
4070
6.
2 43
80
6.3
4710
6.
4 50
40
6.5
5380
6.
6 57
40
6.7
6100
6.
8 64
60
6.9
6820
7
7180
7.
1 75
50
7.2
7930
7.
3 83
10
7.4
8700
7.
5 90
90
7.6
9490
7.
7 99
00
7.8
1030
0
Stag
e (f
t)
Dis
char
ge
(cfs
) 7.
910
700
811
200
8.1
1160
08.
212
000
8.3
1250
08.
412
900
8.5
1340
08.
613
800
8.7
1430
08.
814
800
8.9
1520
09
1570
09.
116
200
9.2
1670
09.
317
200
9.4
1770
09.
518
200
9.6
1880
09.
719
300
9.8
1980
09.
920
400
1020
900
10.1
2150
010
.222
100
10.3
2270
010
.423
200
10.5
2380
010
.624
400
10.7
2500
010
.825
600
10.9
2620
011
2680
011
.127
500
11.2
2810
011
.328
700
11.4
2940
011
.530
000
Stag
e (f
t)
Dis
char
ge
(cfs
) 11
.6
3070
011
.7
3130
011
.8
3200
011
.9
3270
012
33
400
12.1
34
100
12.2
34
800
12.3
35
500
12.4
36
200
12.5
36
900
12.6
37
500
12.7
38
100
12.8
38
700
12.9
39
300
13
3990
013
.1
4050
013
.2
4110
013
.3
4170
013
.4
4230
013
.5
4290
013
.6
4350
013
.7
4410
013
.8
4480
013
.9
4540
014
46
000
14.1
46
600
14.2
47
200
14.3
47
900
14.4
48
500
14.5
49
100
14.6
49
700
14.7
50
400
14.8
51
000
14.9
51
600
15
5230
015
.1
5290
015
.2
5350
0
Stag
e (f
t)
Dis
char
ge
(cfs
) 15
.354
200
15.4
5480
015
.555
500
15.6
5610
015
.756
700
15.8
5740
015
.958
000
1658
700
16.1
5930
016
.260
000
16.3
6060
016
.461
200
16.5
6180
016
.662
500
16.7
6310
016
.863
800
16.9
6440
017
6500
017
.165
700
17.2
6630
017
.367
000
17.4
6760
017
.568
200
17.6
6890
017
.769
500
17.8
7020
017
.970
800
1871
500
18.1
7210
018
.272
800
18.3
7340
018
.474
000
18.5
7460
018
.675
300
18.7
7590
018
.876
600
18.9
7720
0
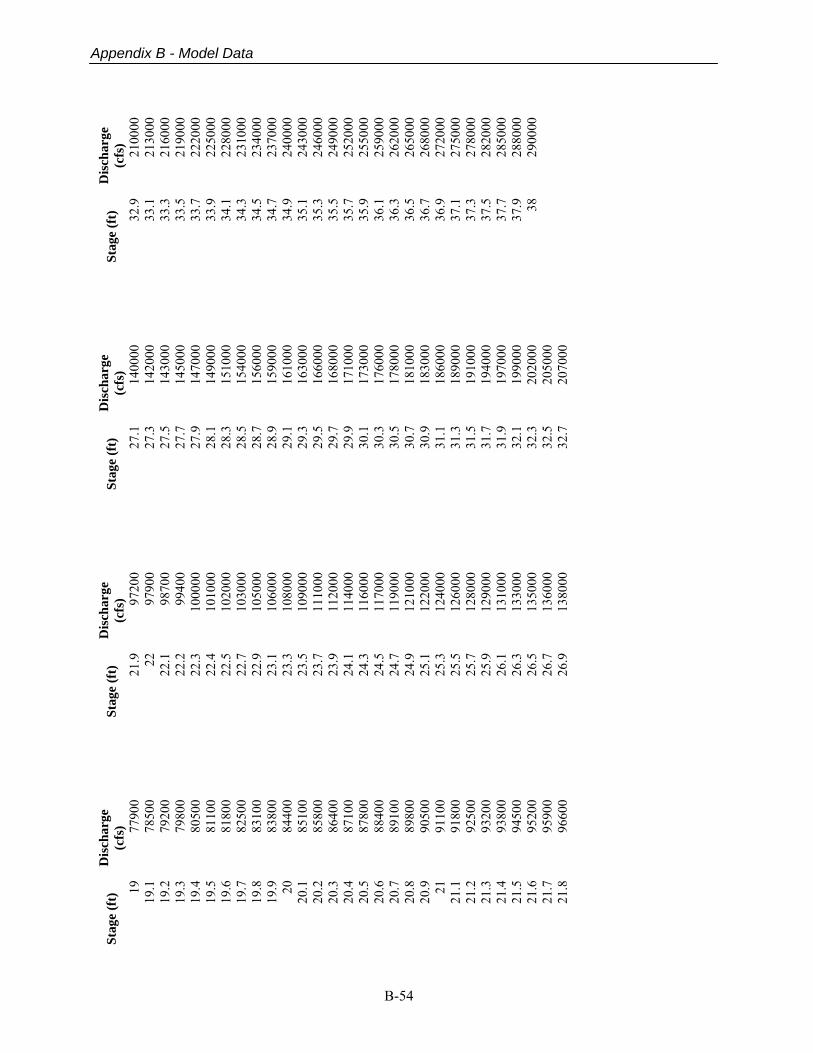
B-54
Appendix B - Model Data
Stag
e (f
t)
Dis
char
ge
(cfs
) 19
77
900
19.1
78
500
19.2
79
200
19.3
79
800
19.4
80
500
19.5
81
100
19.6
81
800
19.7
82
500
19.8
83
100
19.9
83
800
20
8440
0 20
.1
8510
0 20
.2
8580
0 20
.3
8640
0 20
.4
8710
0 20
.5
8780
0 20
.6
8840
0 20
.7
8910
0 20
.8
8980
0 20
.9
9050
0 21
91
100
21.1
91
800
21.2
92
500
21.3
93
200
21.4
93
800
21.5
94
500
21.6
95
200
21.7
95
900
21.8
96
600
Stag
e (f
t)
Dis
char
ge
(cfs
) 21
.997
200
2297
900
22.1
9870
022
.299
400
22.3
1000
0022
.410
1000
22.5
1020
0022
.710
3000
22.9
1050
0023
.110
6000
23.3
1080
0023
.510
9000
23.7
1110
0023
.911
2000
24.1
1140
0024
.311
6000
24.5
1170
0024
.711
9000
24.9
1210
0025
.112
2000
25.3
1240
0025
.512
6000
25.7
1280
0025
.912
9000
26.1
1310
0026
.313
3000
26.5
1350
0026
.713
6000
26.9
1380
00
Stag
e (f
t)
Dis
char
ge
(cfs
) 27
.1
1400
0027
.3
1420
0027
.5
1430
0027
.7
1450
0027
.9
1470
0028
.1
1490
0028
.3
1510
0028
.5
1540
0028
.7
1560
0028
.9
1590
0029
.1
1610
0029
.3
1630
0029
.5
1660
0029
.7
1680
0029
.9
1710
0030
.1
1730
0030
.3
1760
0030
.5
1780
0030
.7
1810
0030
.9
1830
0031
.1
1860
0031
.3
1890
0031
.5
1910
0031
.7
1940
0031
.9
1970
0032
.1
1990
0032
.3
2020
0032
.5
2050
0032
.7
2070
00
Stag
e (f
t)
Dis
char
ge
(cfs
) 32
.921
0000
33.1
2130
0033
.321
6000
33.5
2190
0033
.722
2000
33.9
2250
0034
.122
8000
34.3
2310
0034
.523
4000
34.7
2370
0034
.924
0000
35.1
2430
0035
.324
6000
35.5
2490
0035
.725
2000
35.9
2550
0036
.125
9000
36.3
2620
0036
.526
5000
36.7
2680
0036
.927
2000
37.1
2750
0037
.327
8000
37.5
2820
0037
.728
5000
37.9
2880
0038
2900
00
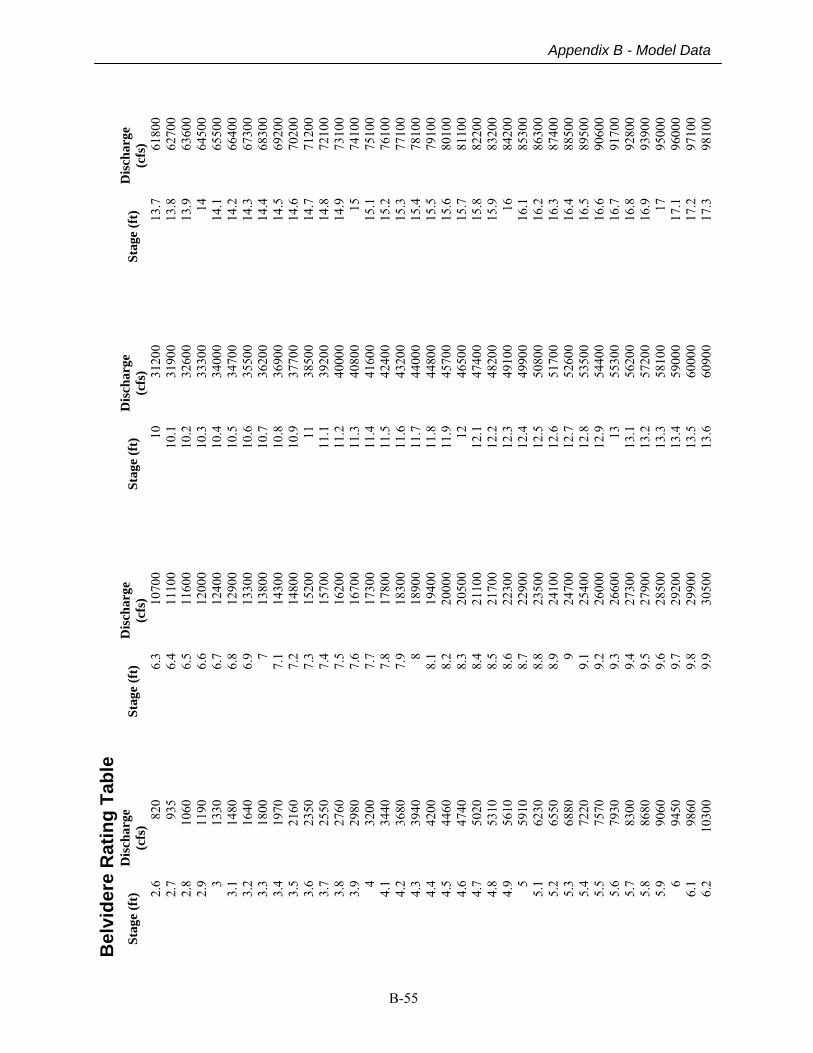
B-55
Appendix B - Model Data
Bel
vide
re R
atin
g Ta
ble
Stag
e (f
t)
Dis
char
ge
(cfs
) 2.
6 82
0 2.
7 93
5 2.
8 10
60
2.9
1190
3
1330
3.
1 14
80
3.2
1640
3.
3 18
00
3.4
1970
3.
5 21
60
3.6
2350
3.
7 25
50
3.8
2760
3.
9 29
80
4 32
00
4.1
3440
4.
2 36
80
4.3
3940
4.
4 42
00
4.5
4460
4.
6 47
40
4.7
5020
4.
8 53
10
4.9
5610
5
5910
5.
1 62
30
5.2
6550
5.
3 68
80
5.4
7220
5.
5 75
70
5.6
7930
5.
7 83
00
5.8
8680
5.
9 90
60
6 94
50
6.1
9860
6.
2 10
300
Stag
e (f
t)
Dis
char
ge
(cfs
) 6.
310
700
6.4
1110
06.
511
600
6.6
1200
06.
712
400
6.8
1290
06.
913
300
713
800
7.1
1430
07.
214
800
7.3
1520
07.
415
700
7.5
1620
07.
616
700
7.7
1730
07.
817
800
7.9
1830
08
1890
08.
119
400
8.2
2000
08.
320
500
8.4
2110
08.
521
700
8.6
2230
08.
722
900
8.8
2350
08.
924
100
924
700
9.1
2540
09.
226
000
9.3
2660
09.
427
300
9.5
2790
09.
628
500
9.7
2920
09.
829
900
9.9
3050
0
Stag
e (f
t)
Dis
char
ge
(cfs
) 10
31
200
10.1
31
900
10.2
32
600
10.3
33
300
10.4
34
000
10.5
34
700
10.6
35
500
10.7
36
200
10.8
36
900
10.9
37
700
11
3850
011
.1
3920
011
.2
4000
011
.3
4080
011
.4
4160
011
.5
4240
011
.6
4320
011
.7
4400
011
.8
4480
011
.9
4570
012
46
500
12.1
47
400
12.2
48
200
12.3
49
100
12.4
49
900
12.5
50
800
12.6
51
700
12.7
52
600
12.8
53
500
12.9
54
400
13
5530
013
.1
5620
013
.2
5720
013
.3
5810
013
.4
5900
013
.5
6000
013
.6
6090
0
Stag
e (f
t)
Dis
char
ge
(cfs
) 13
.761
800
13.8
6270
013
.963
600
1464
500
14.1
6550
014
.266
400
14.3
6730
014
.468
300
14.5
6920
014
.670
200
14.7
7120
014
.872
100
14.9
7310
015
7410
015
.175
100
15.2
7610
015
.377
100
15.4
7810
015
.579
100
15.6
8010
015
.781
100
15.8
8220
015
.983
200
1684
200
16.1
8530
016
.286
300
16.3
8740
016
.488
500
16.5
8950
016
.690
600
16.7
9170
016
.892
800
16.9
9390
017
9500
017
.196
000
17.2
9710
017
.398
100
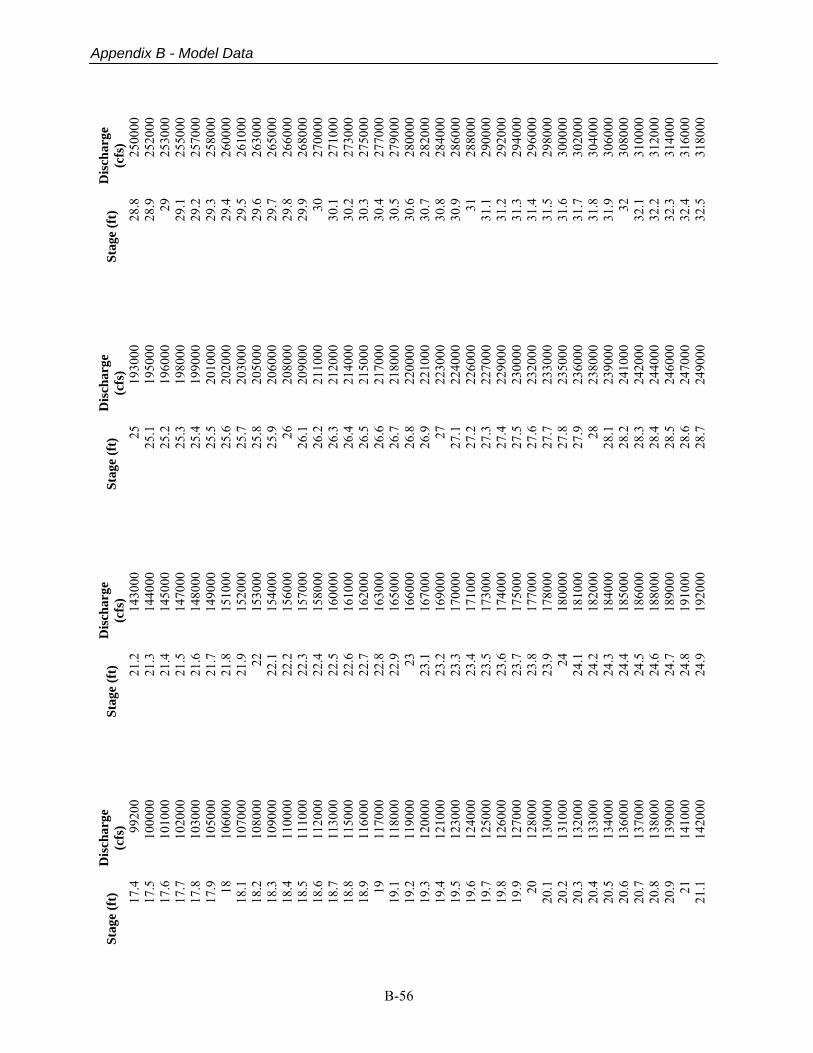
B-56
Appendix B - Model Data
Stag
e (f
t)
Dis
char
ge
(cfs
) 17
.4
9920
0 17
.5
1000
00
17.6
10
1000
17
.7
1020
00
17.8
10
3000
17
.9
1050
00
18
1060
00
18.1
10
7000
18
.2
1080
00
18.3
10
9000
18
.4
1100
00
18.5
11
1000
18
.6
1120
00
18.7
11
3000
18
.8
1150
00
18.9
11
6000
19
11
7000
19
.1
1180
00
19.2
11
9000
19
.3
1200
00
19.4
12
1000
19
.5
1230
00
19.6
12
4000
19
.7
1250
00
19.8
12
6000
19
.9
1270
00
20
1280
00
20.1
13
0000
20
.2
1310
00
20.3
13
2000
20
.4
1330
00
20.5
13
4000
20
.6
1360
00
20.7
13
7000
20
.8
1380
00
20.9
13
9000
21
14
1000
21
.1
1420
00
Stag
e (f
t)
Dis
char
ge
(cfs
) 21
.214
3000
21.3
1440
0021
.414
5000
21.5
1470
0021
.614
8000
21.7
1490
0021
.815
1000
21.9
1520
0022
1530
0022
.115
4000
22.2
1560
0022
.315
7000
22.4
1580
0022
.516
0000
22.6
1610
0022
.716
2000
22.8
1630
0022
.916
5000
2316
6000
23.1
1670
0023
.216
9000
23.3
1700
0023
.417
1000
23.5
1730
0023
.617
4000
23.7
1750
0023
.817
7000
23.9
1780
0024
1800
0024
.118
1000
24.2
1820
0024
.318
4000
24.4
1850
0024
.518
6000
24.6
1880
0024
.718
9000
24.8
1910
0024
.919
2000
Stag
e (f
t)
Dis
char
ge
(cfs
) 25
19
3000
25.1
19
5000
25.2
19
6000
25.3
19
8000
25.4
19
9000
25.5
20
1000
25.6
20
2000
25.7
20
3000
25.8
20
5000
25.9
20
6000
26
2080
0026
.1
2090
0026
.2
2110
0026
.3
2120
0026
.4
2140
0026
.5
2150
0026
.6
2170
0026
.7
2180
0026
.8
2200
0026
.9
2210
0027
22
3000
27.1
22
4000
27.2
22
6000
27.3
22
7000
27.4
22
9000
27.5
23
0000
27.6
23
2000
27.7
23
3000
27.8
23
5000
27.9
23
6000
28
2380
0028
.1
2390
0028
.2
2410
0028
.3
2420
0028
.4
2440
0028
.5
2460
0028
.6
2470
0028
.7
2490
00
Stag
e (f
t)
Dis
char
ge
(cfs
) 28
.825
0000
28.9
2520
0029
2530
0029
.125
5000
29.2
2570
0029
.325
8000
29.4
2600
0029
.526
1000
29.6
2630
0029
.726
5000
29.8
2660
0029
.926
8000
3027
0000
30.1
2710
0030
.227
3000
30.3
2750
0030
.427
7000
30.5
2790
0030
.628
0000
30.7
2820
0030
.828
4000
30.9
2860
0031
2880
0031
.129
0000
31.2
2920
0031
.329
4000
31.4
2960
0031
.529
8000
31.6
3000
0031
.730
2000
31.8
3040
0031
.930
6000
3230
8000
32.1
3100
0032
.231
2000
32.3
3140
0032
.431
6000
32.5
3180
00
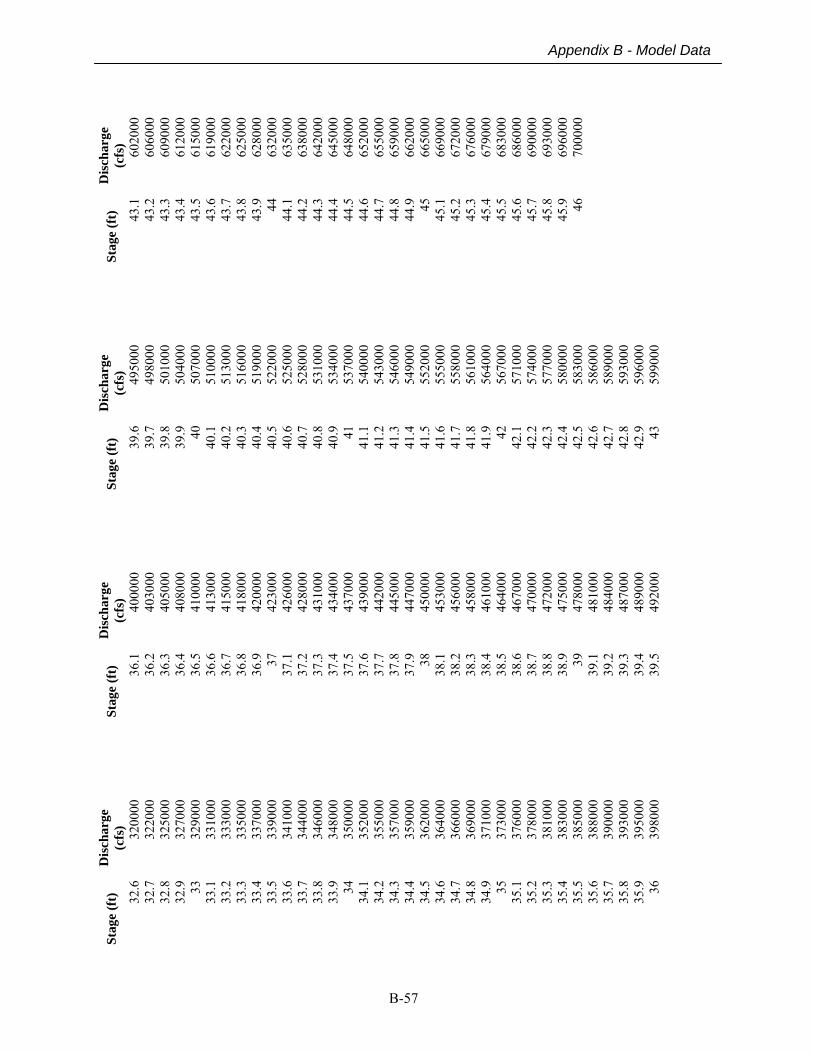
B-57
Appendix B - Model Data
Stag
e (f
t)
Dis
char
ge
(cfs
) 32
.6
3200
00
32.7
32
2000
32
.8
3250
00
32.9
32
7000
33
32
9000
33
.1
3310
00
33.2
33
3000
33
.3
3350
00
33.4
33
7000
33
.5
3390
00
33.6
34
1000
33
.7
3440
00
33.8
34
6000
33
.9
3480
00
34
3500
00
34.1
35
2000
34
.2
3550
00
34.3
35
7000
34
.4
3590
00
34.5
36
2000
34
.6
3640
00
34.7
36
6000
34
.8
3690
00
34.9
37
1000
35
37
3000
35
.1
3760
00
35.2
37
8000
35
.3
3810
00
35.4
38
3000
35
.5
3850
00
35.6
38
8000
35
.7
3900
00
35.8
39
3000
35
.9
3950
00
36
3980
00
Stag
e (f
t)
Dis
char
ge
(cfs
) 36
.140
0000
36.2
4030
0036
.340
5000
36.4
4080
0036
.541
0000
36.6
4130
0036
.741
5000
36.8
4180
0036
.942
0000
3742
3000
37.1
4260
0037
.242
8000
37.3
4310
0037
.443
4000
37.5
4370
0037
.643
9000
37.7
4420
0037
.844
5000
37.9
4470
0038
4500
0038
.145
3000
38.2
4560
0038
.345
8000
38.4
4610
0038
.546
4000
38.6
4670
0038
.747
0000
38.8
4720
0038
.947
5000
3947
8000
39.1
4810
0039
.248
4000
39.3
4870
0039
.448
9000
39.5
4920
00
Stag
e (f
t)
Dis
char
ge
(cfs
) 39
.6
4950
0039
.7
4980
0039
.8
5010
0039
.9
5040
0040
50
7000
40.1
51
0000
40.2
51
3000
40.3
51
6000
40.4
51
9000
40.5
52
2000
40.6
52
5000
40.7
52
8000
40.8
53
1000
40.9
53
4000
41
5370
0041
.1
5400
0041
.2
5430
0041
.3
5460
0041
.4
5490
0041
.5
5520
0041
.6
5550
0041
.7
5580
0041
.8
5610
0041
.9
5640
0042
56
7000
42.1
57
1000
42.2
57
4000
42.3
57
7000
42.4
58
0000
42.5
58
3000
42.6
58
6000
42.7
58
9000
42.8
59
3000
42.9
59
6000
43
5990
00
Stag
e (f
t)
Dis
char
ge
(cfs
) 43
.160
2000
43.2
6060
0043
.360
9000
43.4
6120
0043
.561
5000
43.6
6190
0043
.762
2000
43.8
6250
0043
.962
8000
4463
2000
44.1
6350
0044
.263
8000
44.3
6420
0044
.464
5000
44.5
6480
0044
.665
2000
44.7
6550
0044
.865
9000
44.9
6620
0045
6650
0045
.166
9000
45.2
6720
0045
.367
6000
45.4
6790
0045
.568
3000
45.6
6860
0045
.769
0000
45.8
6930
0045
.969
6000
4670
0000
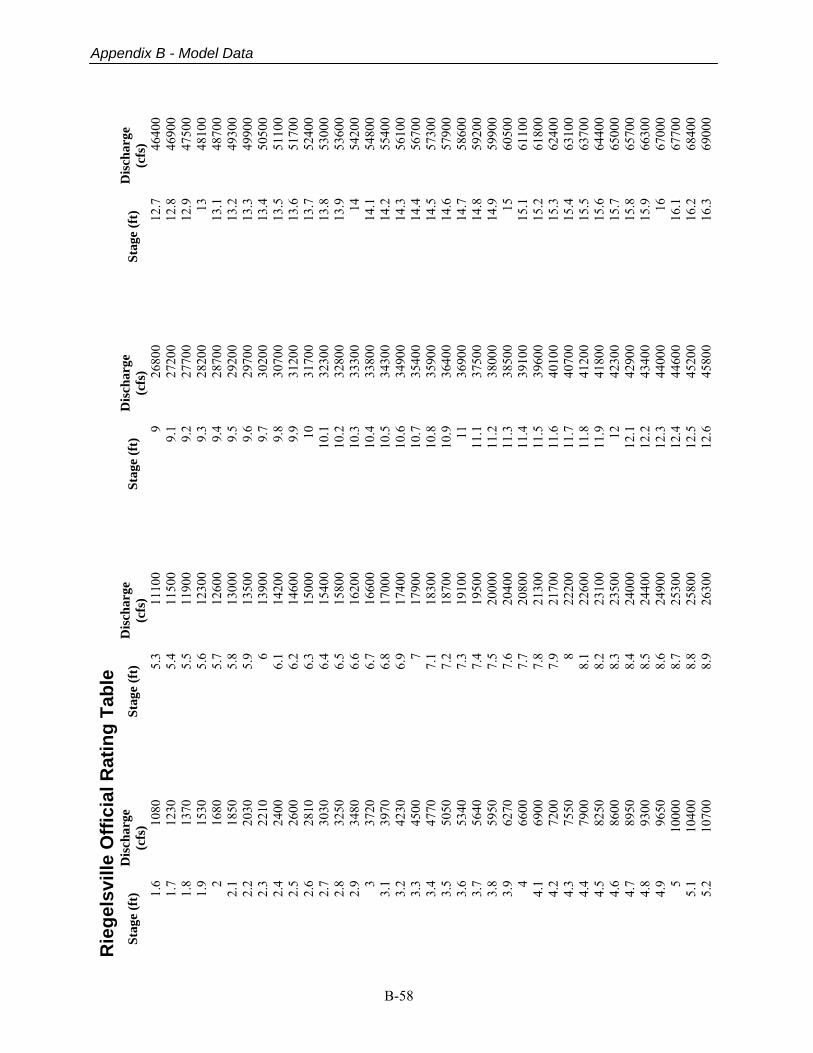
B-58
Appendix B - Model Data
Rie
gels
ville
Offi
cial
Rat
ing
Tabl
e St
age
(ft)
D
isch
arge
(c
fs)
1.6
1080
1.
7 12
30
1.8
1370
1.
9 15
30
2 16
80
2.1
1850
2.
2 20
30
2.3
2210
2.
4 24
00
2.5
2600
2.
6 28
10
2.7
3030
2.
8 32
50
2.9
3480
3
3720
3.
1 39
70
3.2
4230
3.
3 45
00
3.4
4770
3.
5 50
50
3.6
5340
3.
7 56
40
3.8
5950
3.
9 62
70
4 66
00
4.1
6900
4.
2 72
00
4.3
7550
4.
4 79
00
4.5
8250
4.
6 86
00
4.7
8950
4.
8 93
00
4.9
9650
5
1000
0 5.
1 10
400
5.2
1070
0
Stag
e (f
t)
Dis
char
ge
(cfs
) 5.
311
100
5.4
1150
05.
511
900
5.6
1230
05.
712
600
5.8
1300
05.
913
500
613
900
6.1
1420
06.
214
600
6.3
1500
06.
415
400
6.5
1580
06.
616
200
6.7
1660
06.
817
000
6.9
1740
07
1790
07.
118
300
7.2
1870
07.
319
100
7.4
1950
07.
520
000
7.6
2040
07.
720
800
7.8
2130
07.
921
700
822
200
8.1
2260
08.
223
100
8.3
2350
08.
424
000
8.5
2440
08.
624
900
8.7
2530
08.
825
800
8.9
2630
0
Stag
e (f
t)
Dis
char
ge
(cfs
) 9
2680
09.
1 27
200
9.2
2770
09.
3 28
200
9.4
2870
09.
5 29
200
9.6
2970
09.
7 30
200
9.8
3070
09.
9 31
200
10
3170
010
.1
3230
010
.2
3280
010
.3
3330
010
.4
3380
010
.5
3430
010
.6
3490
010
.7
3540
010
.8
3590
010
.9
3640
011
36
900
11.1
37
500
11.2
38
000
11.3
38
500
11.4
39
100
11.5
39
600
11.6
40
100
11.7
40
700
11.8
41
200
11.9
41
800
12
4230
012
.1
4290
012
.2
4340
012
.3
4400
012
.4
4460
012
.5
4520
012
.6
4580
0
Stag
e (f
t)
Dis
char
ge
(cfs
) 12
.746
400
12.8
4690
012
.947
500
1348
100
13.1
4870
013
.249
300
13.3
4990
013
.450
500
13.5
5110
013
.651
700
13.7
5240
013
.853
000
13.9
5360
014
5420
014
.154
800
14.2
5540
014
.356
100
14.4
5670
014
.557
300
14.6
5790
014
.758
600
14.8
5920
014
.959
900
1560
500
15.1
6110
015
.261
800
15.3
6240
015
.463
100
15.5
6370
015
.664
400
15.7
6500
015
.865
700
15.9
6630
016
6700
016
.167
700
16.2
6840
016
.369
000
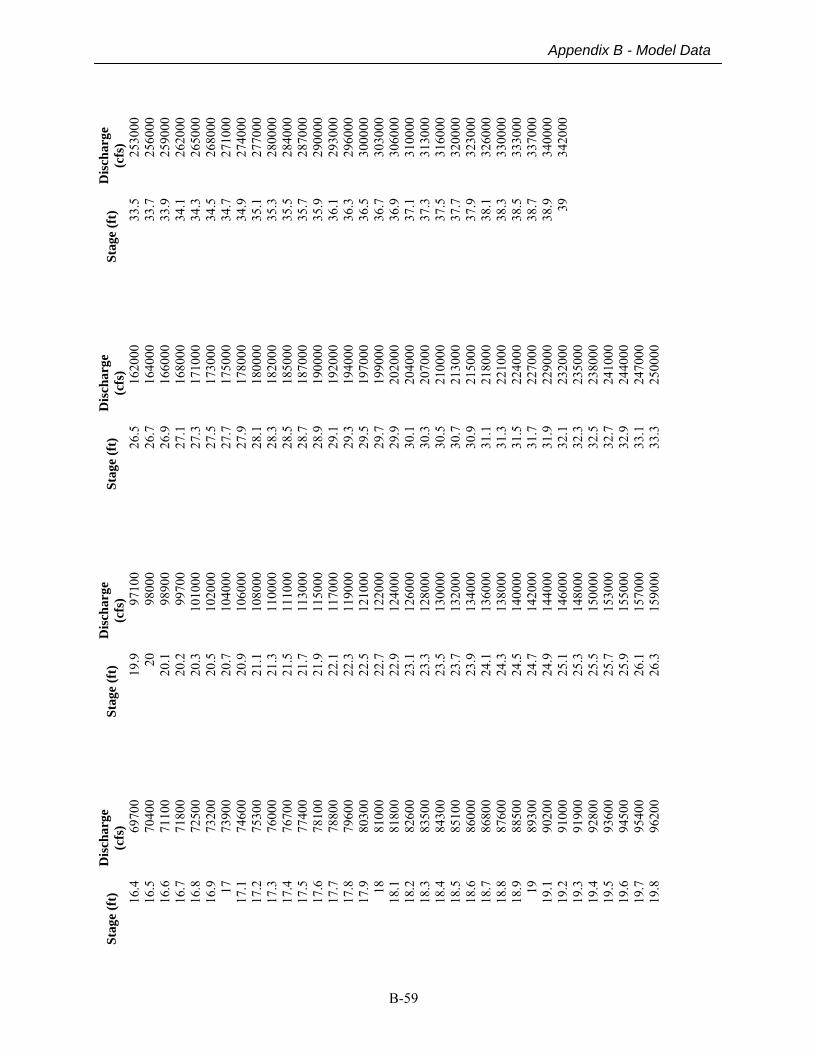
B-59
Appendix B - Model Data
Stag
e (f
t)
Dis
char
ge
(cfs
) 16
.4
6970
0 16
.5
7040
0 16
.6
7110
0 16
.7
7180
0 16
.8
7250
0 16
.9
7320
0 17
73
900
17.1
74
600
17.2
75
300
17.3
76
000
17.4
76
700
17.5
77
400
17.6
78
100
17.7
78
800
17.8
79
600
17.9
80
300
18
8100
0 18
.1
8180
0 18
.2
8260
0 18
.3
8350
0 18
.4
8430
0 18
.5
8510
0 18
.6
8600
0 18
.7
8680
0 18
.8
8760
0 18
.9
8850
0 19
89
300
19.1
90
200
19.2
91
000
19.3
91
900
19.4
92
800
19.5
93
600
19.6
94
500
19.7
95
400
19.8
96
200
Stag
e (f
t)
Dis
char
ge
(cfs
) 19
.997
100
2098
000
20.1
9890
020
.299
700
20.3
1010
0020
.510
2000
20.7
1040
0020
.910
6000
21.1
1080
0021
.311
0000
21.5
1110
0021
.711
3000
21.9
1150
0022
.111
7000
22.3
1190
0022
.512
1000
22.7
1220
0022
.912
4000
23.1
1260
0023
.312
8000
23.5
1300
0023
.713
2000
23.9
1340
0024
.113
6000
24.3
1380
0024
.514
0000
24.7
1420
0024
.914
4000
25.1
1460
0025
.314
8000
25.5
1500
0025
.715
3000
25.9
1550
0026
.115
7000
26.3
1590
00
Stag
e (f
t)
Dis
char
ge
(cfs
) 26
.5
1620
0026
.7
1640
0026
.9
1660
0027
.1
1680
0027
.3
1710
0027
.5
1730
0027
.7
1750
0027
.9
1780
0028
.1
1800
0028
.3
1820
0028
.5
1850
0028
.7
1870
0028
.9
1900
0029
.1
1920
0029
.3
1940
0029
.5
1970
0029
.7
1990
0029
.9
2020
0030
.1
2040
0030
.3
2070
0030
.5
2100
0030
.7
2130
0030
.9
2150
0031
.1
2180
0031
.3
2210
0031
.5
2240
0031
.7
2270
0031
.9
2290
0032
.1
2320
0032
.3
2350
0032
.5
2380
0032
.7
2410
0032
.9
2440
0033
.1
2470
0033
.3
2500
00
Stag
e (f
t)
Dis
char
ge
(cfs
) 33
.525
3000
33.7
2560
0033
.925
9000
34.1
2620
0034
.326
5000
34.5
2680
0034
.727
1000
34.9
2740
0035
.127
7000
35.3
2800
0035
.528
4000
35.7
2870
0035
.929
0000
36.1
2930
0036
.329
6000
36.5
3000
0036
.730
3000
36.9
3060
0037
.131
0000
37.3
3130
0037
.531
6000
37.7
3200
0037
.932
3000
38.1
3260
0038
.333
0000
38.5
3330
0038
.733
7000
38.9
3400
0039
3420
00
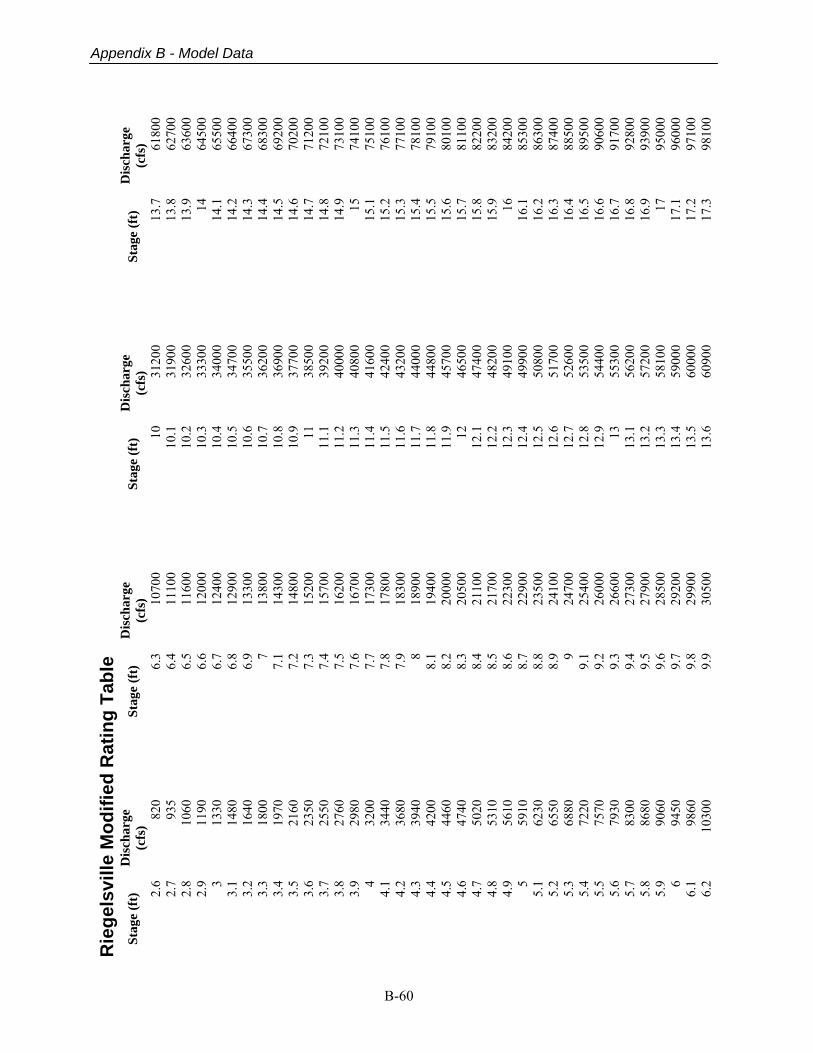
B-60
Appendix B - Model Data
Rie
gels
ville
Mod
ified
Rat
ing
Tabl
e St
age
(ft)
D
isch
arge
(c
fs)
2.6
820
2.7
935
2.8
1060
2.
9 11
90
3 13
30
3.1
1480
3.
2 16
40
3.3
1800
3.
4 19
70
3.5
2160
3.
6 23
50
3.7
2550
3.
8 27
60
3.9
2980
4
3200
4.
1 34
40
4.2
3680
4.
3 39
40
4.4
4200
4.
5 44
60
4.6
4740
4.
7 50
20
4.8
5310
4.
9 56
10
5 59
10
5.1
6230
5.
2 65
50
5.3
6880
5.
4 72
20
5.5
7570
5.
6 79
30
5.7
8300
5.
8 86
80
5.9
9060
6
9450
6.
1 98
60
6.2
1030
0
Stag
e (f
t)
Dis
char
ge
(cfs
) 6.
310
700
6.4
1110
06.
511
600
6.6
1200
06.
712
400
6.8
1290
06.
913
300
713
800
7.1
1430
07.
214
800
7.3
1520
07.
415
700
7.5
1620
07.
616
700
7.7
1730
07.
817
800
7.9
1830
08
1890
08.
119
400
8.2
2000
08.
320
500
8.4
2110
08.
521
700
8.6
2230
08.
722
900
8.8
2350
08.
924
100
924
700
9.1
2540
09.
226
000
9.3
2660
09.
427
300
9.5
2790
09.
628
500
9.7
2920
09.
829
900
9.9
3050
0
Stag
e (f
t)
Dis
char
ge
(cfs
) 10
31
200
10.1
31
900
10.2
32
600
10.3
33
300
10.4
34
000
10.5
34
700
10.6
35
500
10.7
36
200
10.8
36
900
10.9
37
700
11
3850
011
.1
3920
011
.2
4000
011
.3
4080
011
.4
4160
011
.5
4240
011
.6
4320
011
.7
4400
011
.8
4480
011
.9
4570
012
46
500
12.1
47
400
12.2
48
200
12.3
49
100
12.4
49
900
12.5
50
800
12.6
51
700
12.7
52
600
12.8
53
500
12.9
54
400
13
5530
013
.1
5620
013
.2
5720
013
.3
5810
013
.4
5900
013
.5
6000
013
.6
6090
0
Stag
e (f
t)
Dis
char
ge
(cfs
) 13
.761
800
13.8
6270
013
.963
600
1464
500
14.1
6550
014
.266
400
14.3
6730
014
.468
300
14.5
6920
014
.670
200
14.7
7120
014
.872
100
14.9
7310
015
7410
015
.175
100
15.2
7610
015
.377
100
15.4
7810
015
.579
100
15.6
8010
015
.781
100
15.8
8220
015
.983
200
1684
200
16.1
8530
016
.286
300
16.3
8740
016
.488
500
16.5
8950
016
.690
600
16.7
9170
016
.892
800
16.9
9390
017
9500
017
.196
000
17.2
9710
017
.398
100
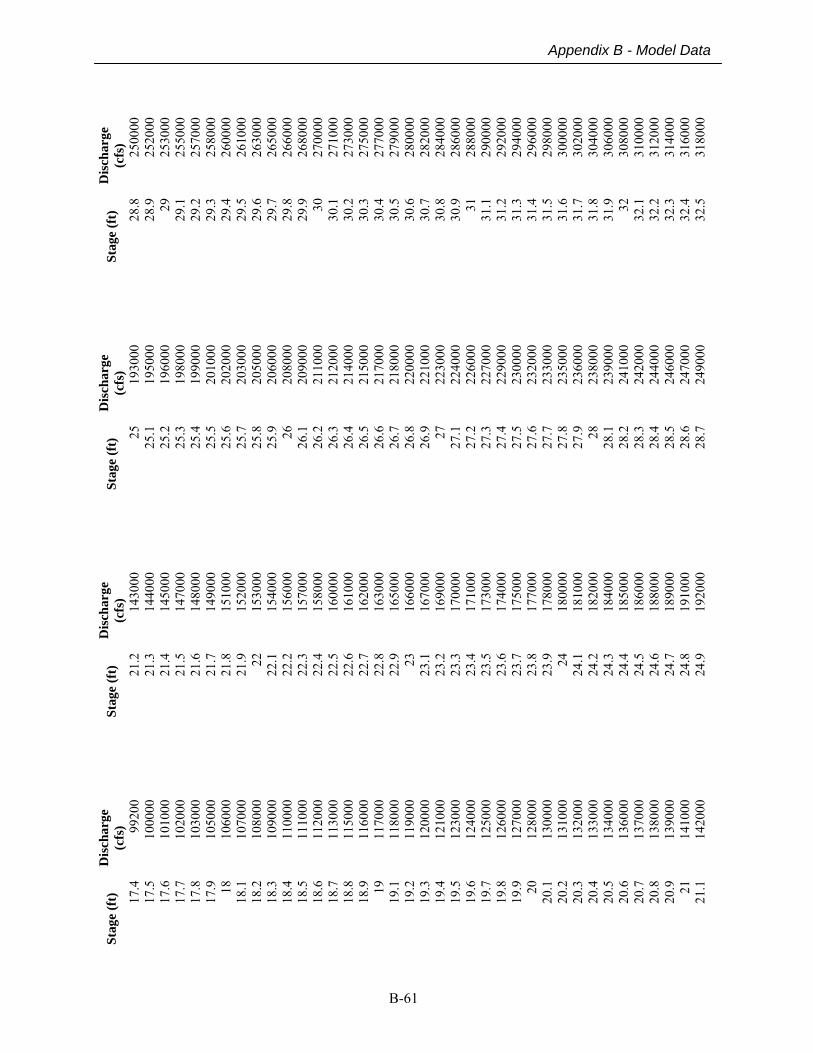
B-61
Appendix B - Model Data
Stag
e (f
t)
Dis
char
ge
(cfs
) 17
.4
9920
0 17
.5
1000
00
17.6
10
1000
17
.7
1020
00
17.8
10
3000
17
.9
1050
00
18
1060
00
18.1
10
7000
18
.2
1080
00
18.3
10
9000
18
.4
1100
00
18.5
11
1000
18
.6
1120
00
18.7
11
3000
18
.8
1150
00
18.9
11
6000
19
11
7000
19
.1
1180
00
19.2
11
9000
19
.3
1200
00
19.4
12
1000
19
.5
1230
00
19.6
12
4000
19
.7
1250
00
19.8
12
6000
19
.9
1270
00
20
1280
00
20.1
13
0000
20
.2
1310
00
20.3
13
2000
20
.4
1330
00
20.5
13
4000
20
.6
1360
00
20.7
13
7000
20
.8
1380
00
20.9
13
9000
21
14
1000
21
.1
1420
00
Stag
e (f
t)
Dis
char
ge
(cfs
) 21
.214
3000
21.3
1440
0021
.414
5000
21.5
1470
0021
.614
8000
21.7
1490
0021
.815
1000
21.9
1520
0022
1530
0022
.115
4000
22.2
1560
0022
.315
7000
22.4
1580
0022
.516
0000
22.6
1610
0022
.716
2000
22.8
1630
0022
.916
5000
2316
6000
23.1
1670
0023
.216
9000
23.3
1700
0023
.417
1000
23.5
1730
0023
.617
4000
23.7
1750
0023
.817
7000
23.9
1780
0024
1800
0024
.118
1000
24.2
1820
0024
.318
4000
24.4
1850
0024
.518
6000
24.6
1880
0024
.718
9000
24.8
1910
0024
.919
2000
Stag
e (f
t)
Dis
char
ge
(cfs
) 25
19
3000
25.1
19
5000
25.2
19
6000
25.3
19
8000
25.4
19
9000
25.5
20
1000
25.6
20
2000
25.7
20
3000
25.8
20
5000
25.9
20
6000
26
2080
0026
.1
2090
0026
.2
2110
0026
.3
2120
0026
.4
2140
0026
.5
2150
0026
.6
2170
0026
.7
2180
0026
.8
2200
0026
.9
2210
0027
22
3000
27.1
22
4000
27.2
22
6000
27.3
22
7000
27.4
22
9000
27.5
23
0000
27.6
23
2000
27.7
23
3000
27.8
23
5000
27.9
23
6000
28
2380
0028
.1
2390
0028
.2
2410
0028
.3
2420
0028
.4
2440
0028
.5
2460
0028
.6
2470
0028
.7
2490
00
Stag
e (f
t)
Dis
char
ge
(cfs
) 28
.825
0000
28.9
2520
0029
2530
0029
.125
5000
29.2
2570
0029
.325
8000
29.4
2600
0029
.526
1000
29.6
2630
0029
.726
5000
29.8
2660
0029
.926
8000
3027
0000
30.1
2710
0030
.227
3000
30.3
2750
0030
.427
7000
30.5
2790
0030
.628
0000
30.7
2820
0030
.828
4000
30.9
2860
0031
2880
0031
.129
0000
31.2
2920
0031
.329
4000
31.4
2960
0031
.529
8000
31.6
3000
0031
.730
2000
31.8
3040
0031
.930
6000
3230
8000
32.1
3100
0032
.231
2000
32.3
3140
0032
.431
6000
32.5
3180
00
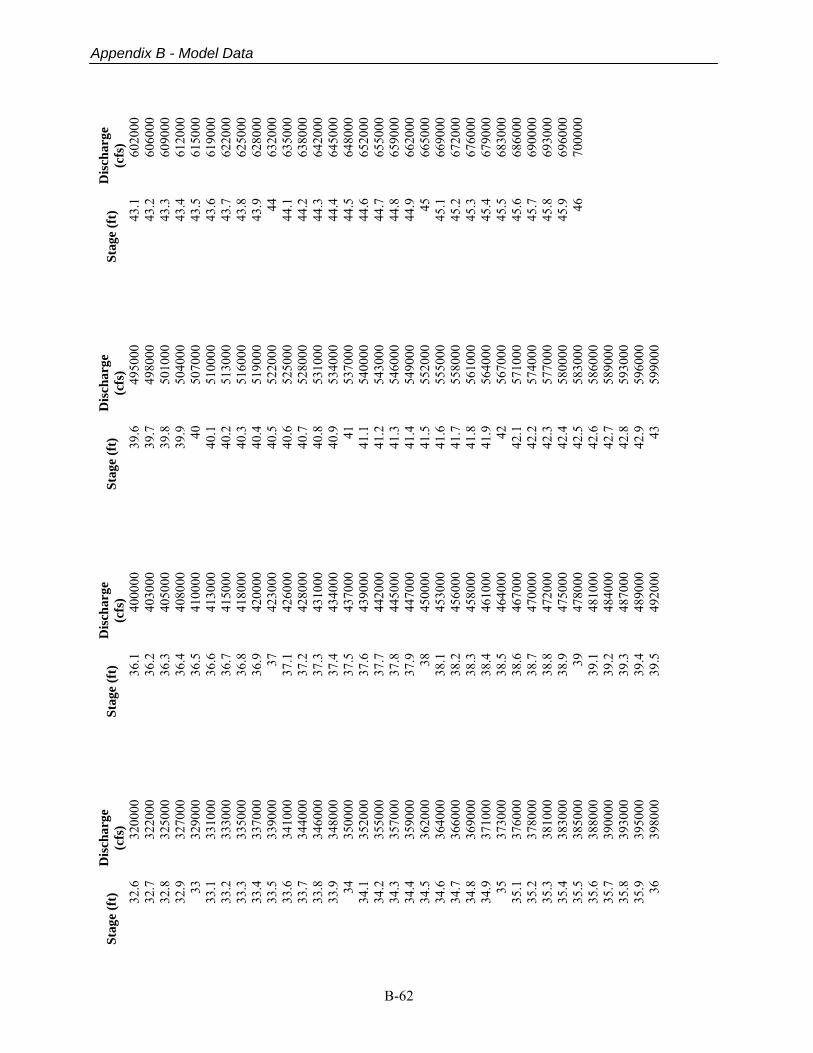
B-62
Appendix B - Model Data
Stag
e (f
t)
Dis
char
ge
(cfs
) 32
.6
3200
00
32.7
32
2000
32
.8
3250
00
32.9
32
7000
33
32
9000
33
.1
3310
00
33.2
33
3000
33
.3
3350
00
33.4
33
7000
33
.5
3390
00
33.6
34
1000
33
.7
3440
00
33.8
34
6000
33
.9
3480
00
34
3500
00
34.1
35
2000
34
.2
3550
00
34.3
35
7000
34
.4
3590
00
34.5
36
2000
34
.6
3640
00
34.7
36
6000
34
.8
3690
00
34.9
37
1000
35
37
3000
35
.1
3760
00
35.2
37
8000
35
.3
3810
00
35.4
38
3000
35
.5
3850
00
35.6
38
8000
35
.7
3900
00
35.8
39
3000
35
.9
3950
00
36
3980
00
Stag
e (f
t)
Dis
char
ge
(cfs
) 36
.140
0000
36.2
4030
0036
.340
5000
36.4
4080
0036
.541
0000
36.6
4130
0036
.741
5000
36.8
4180
0036
.942
0000
3742
3000
37.1
4260
0037
.242
8000
37.3
4310
0037
.443
4000
37.5
4370
0037
.643
9000
37.7
4420
0037
.844
5000
37.9
4470
0038
4500
0038
.145
3000
38.2
4560
0038
.345
8000
38.4
4610
0038
.546
4000
38.6
4670
0038
.747
0000
38.8
4720
0038
.947
5000
3947
8000
39.1
4810
0039
.248
4000
39.3
4870
0039
.448
9000
39.5
4920
00
Stag
e (f
t)
Dis
char
ge
(cfs
) 39
.6
4950
0039
.7
4980
0039
.8
5010
0039
.9
5040
0040
50
7000
40.1
51
0000
40.2
51
3000
40.3
51
6000
40.4
51
9000
40.5
52
2000
40.6
52
5000
40.7
52
8000
40.8
53
1000
40.9
53
4000
41
5370
0041
.1
5400
0041
.2
5430
0041
.3
5460
0041
.4
5490
0041
.5
5520
0041
.6
5550
0041
.7
5580
0041
.8
5610
0041
.9
5640
0042
56
7000
42.1
57
1000
42.2
57
4000
42.3
57
7000
42.4
58
0000
42.5
58
3000
42.6
58
6000
42.7
58
9000
42.8
59
3000
42.9
59
6000
43
5990
00
Stag
e (f
t)
Dis
char
ge
(cfs
) 43
.160
2000
43.2
6060
0043
.360
9000
43.4
6120
0043
.561
5000
43.6
6190
0043
.762
2000
43.8
6250
0043
.962
8000
4463
2000
44.1
6350
0044
.263
8000
44.3
6420
0044
.464
5000
44.5
6480
0044
.665
2000
44.7
6550
0044
.865
9000
44.9
6620
0045
6650
0045
.166
9000
45.2
6720
0045
.367
6000
45.4
6790
0045
.568
3000
45.6
6860
0045
.769
0000
45.8
6930
0045
.969
6000
4670
0000
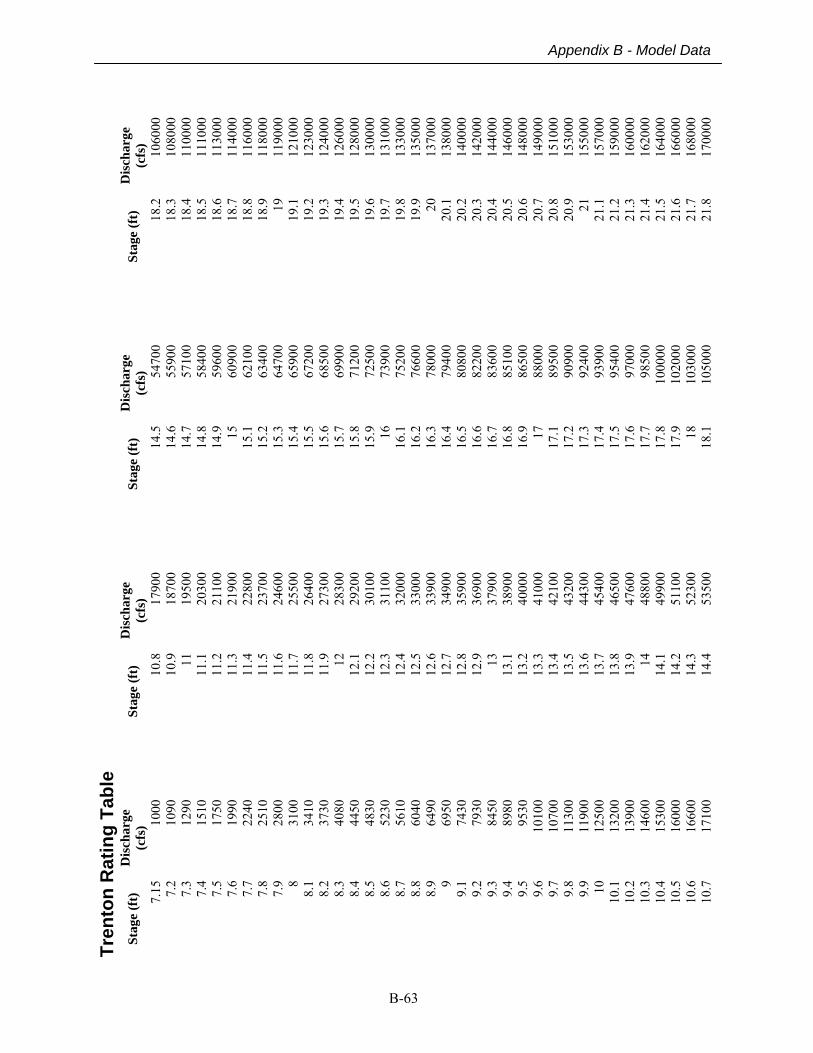
B-63
Appendix B - Model Data
Tren
ton
Rat
ing
Tabl
e St
age
(ft)
D
isch
arge
(c
fs)
7.15
10
00
7.2
1090
7.
3 12
90
7.4
1510
7.
5 17
50
7.6
1990
7.
7 22
40
7.8
2510
7.
9 28
00
8 31
00
8.1
3410
8.
2 37
30
8.3
4080
8.
4 44
50
8.5
4830
8.
6 52
30
8.7
5610
8.
8 60
40
8.9
6490
9
6950
9.
1 74
30
9.2
7930
9.
3 84
50
9.4
8980
9.
5 95
30
9.6
1010
0 9.
7 10
700
9.8
1130
0 9.
9 11
900
10
1250
0 10
.1
1320
0 10
.2
1390
0 10
.3
1460
0 10
.4
1530
0 10
.5
1600
0 10
.6
1660
0 10
.7
1710
0
Stag
e (f
t)
Dis
char
ge
(cfs
) 10
.817
900
10.9
1870
011
1950
011
.120
300
11.2
2110
011
.321
900
11.4
2280
011
.523
700
11.6
2460
011
.725
500
11.8
2640
011
.927
300
1228
300
12.1
2920
012
.230
100
12.3
3110
012
.432
000
12.5
3300
012
.633
900
12.7
3490
012
.835
900
12.9
3690
013
3790
013
.138
900
13.2
4000
013
.341
000
13.4
4210
013
.543
200
13.6
4430
013
.745
400
13.8
4650
013
.947
600
1448
800
14.1
4990
014
.251
100
14.3
5230
014
.453
500
Stag
e (f
t)
Dis
char
ge
(cfs
) 14
.5
5470
014
.6
5590
014
.7
5710
014
.8
5840
014
.9
5960
015
60
900
15.1
62
100
15.2
63
400
15.3
64
700
15.4
65
900
15.5
67
200
15.6
68
500
15.7
69
900
15.8
71
200
15.9
72
500
16
7390
016
.1
7520
016
.2
7660
016
.3
7800
016
.4
7940
016
.5
8080
016
.6
8220
016
.7
8360
016
.8
8510
016
.9
8650
017
88
000
17.1
89
500
17.2
90
900
17.3
92
400
17.4
93
900
17.5
95
400
17.6
97
000
17.7
98
500
17.8
10
0000
17.9
10
2000
18
1030
0018
.1
1050
00
Stag
e (f
t)
Dis
char
ge
(cfs
) 18
.210
6000
18.3
1080
0018
.411
0000
18.5
1110
0018
.611
3000
18.7
1140
0018
.811
6000
18.9
1180
0019
1190
0019
.112
1000
19.2
1230
0019
.312
4000
19.4
1260
0019
.512
8000
19.6
1300
0019
.713
1000
19.8
1330
0019
.913
5000
2013
7000
20.1
1380
0020
.214
0000
20.3
1420
0020
.414
4000
20.5
1460
0020
.614
8000
20.7
1490
0020
.815
1000
20.9
1530
0021
1550
0021
.115
7000
21.2
1590
0021
.316
0000
21.4
1620
0021
.516
4000
21.6
1660
0021
.716
8000
21.8
1700
00
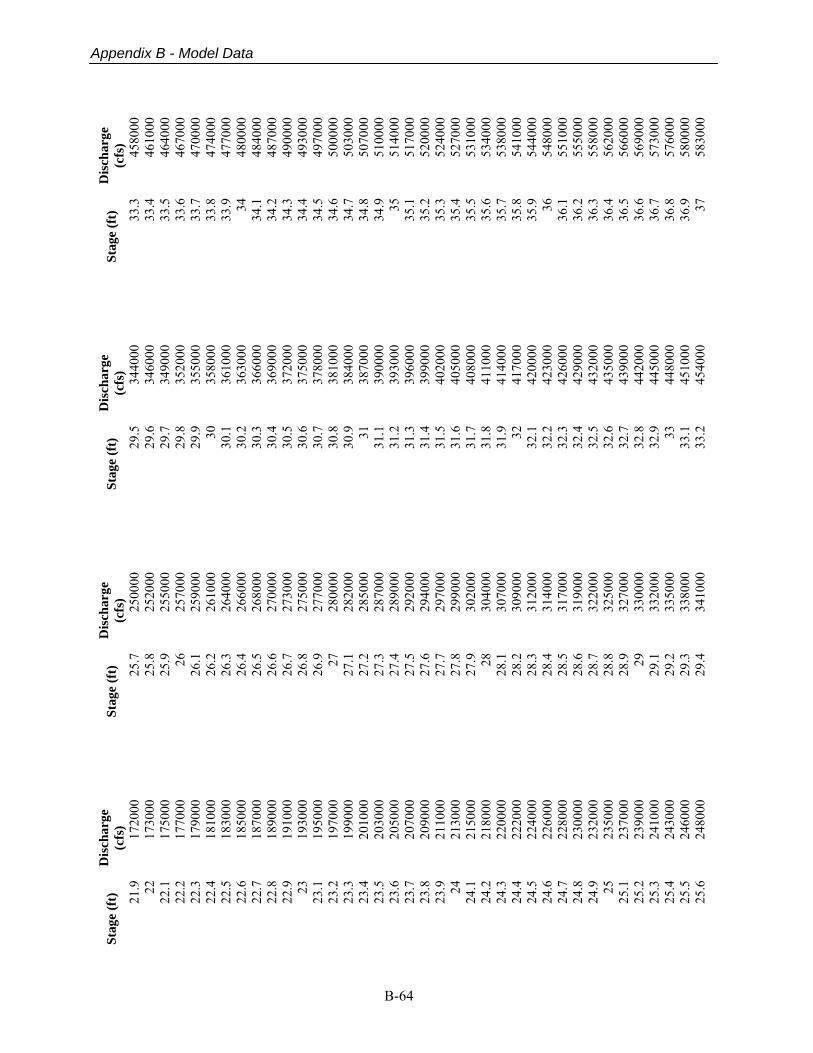
B-64
Appendix B - Model Data
Stag
e (f
t)
Dis
char
ge
(cfs
) 21
.9
1720
00
22
1730
00
22.1
17
5000
22
.2
1770
00
22.3
17
9000
22
.4
1810
00
22.5
18
3000
22
.6
1850
00
22.7
18
7000
22
.8
1890
00
22.9
19
1000
23
19
3000
23
.1
1950
00
23.2
19
7000
23
.3
1990
00
23.4
20
1000
23
.5
2030
00
23.6
20
5000
23
.7
2070
00
23.8
20
9000
23
.9
2110
00
24
2130
00
24.1
21
5000
24
.2
2180
00
24.3
22
0000
24
.4
2220
00
24.5
22
4000
24
.6
2260
00
24.7
22
8000
24
.8
2300
00
24.9
23
2000
25
23
5000
25
.1
2370
00
25.2
23
9000
25
.3
2410
00
25.4
24
3000
25
.5
2460
00
25.6
24
8000
Stag
e (f
t)
Dis
char
ge
(cfs
) 25
.725
0000
25.8
2520
0025
.925
5000
2625
7000
26.1
2590
0026
.226
1000
26.3
2640
0026
.426
6000
26.5
2680
0026
.627
0000
26.7
2730
0026
.827
5000
26.9
2770
0027
2800
0027
.128
2000
27.2
2850
0027
.328
7000
27.4
2890
0027
.529
2000
27.6
2940
0027
.729
7000
27.8
2990
0027
.930
2000
2830
4000
28.1
3070
0028
.230
9000
28.3
3120
0028
.431
4000
28.5
3170
0028
.631
9000
28.7
3220
0028
.832
5000
28.9
3270
0029
3300
0029
.133
2000
29.2
3350
0029
.333
8000
29.4
3410
00
Stag
e (f
t)
Dis
char
ge
(cfs
) 29
.5
3440
0029
.6
3460
0029
.7
3490
0029
.8
3520
0029
.9
3550
0030
35
8000
30.1
36
1000
30.2
36
3000
30.3
36
6000
30.4
36
9000
30.5
37
2000
30.6
37
5000
30.7
37
8000
30.8
38
1000
30.9
38
4000
31
3870
0031
.1
3900
0031
.2
3930
0031
.3
3960
0031
.4
3990
0031
.5
4020
0031
.6
4050
0031
.7
4080
0031
.8
4110
0031
.9
4140
0032
41
7000
32.1
42
0000
32.2
42
3000
32.3
42
6000
32.4
42
9000
32.5
43
2000
32.6
43
5000
32.7
43
9000
32.8
44
2000
32.9
44
5000
33
4480
0033
.1
4510
0033
.2
4540
00
Stag
e (f
t)
Dis
char
ge
(cfs
) 33
.345
8000
33.4
4610
0033
.546
4000
33.6
4670
0033
.747
0000
33.8
4740
0033
.947
7000
3448
0000
34.1
4840
0034
.248
7000
34.3
4900
0034
.449
3000
34.5
4970
0034
.650
0000
34.7
5030
0034
.850
7000
34.9
5100
0035
5140
0035
.151
7000
35.2
5200
0035
.352
4000
35.4
5270
0035
.553
1000
35.6
5340
0035
.753
8000
35.8
5410
0035
.954
4000
3654
8000
36.1
5510
0036
.255
5000
36.3
5580
0036
.456
2000
36.5
5660
0036
.656
9000
36.7
5730
0036
.857
6000
36.9
5800
0037
5830
00
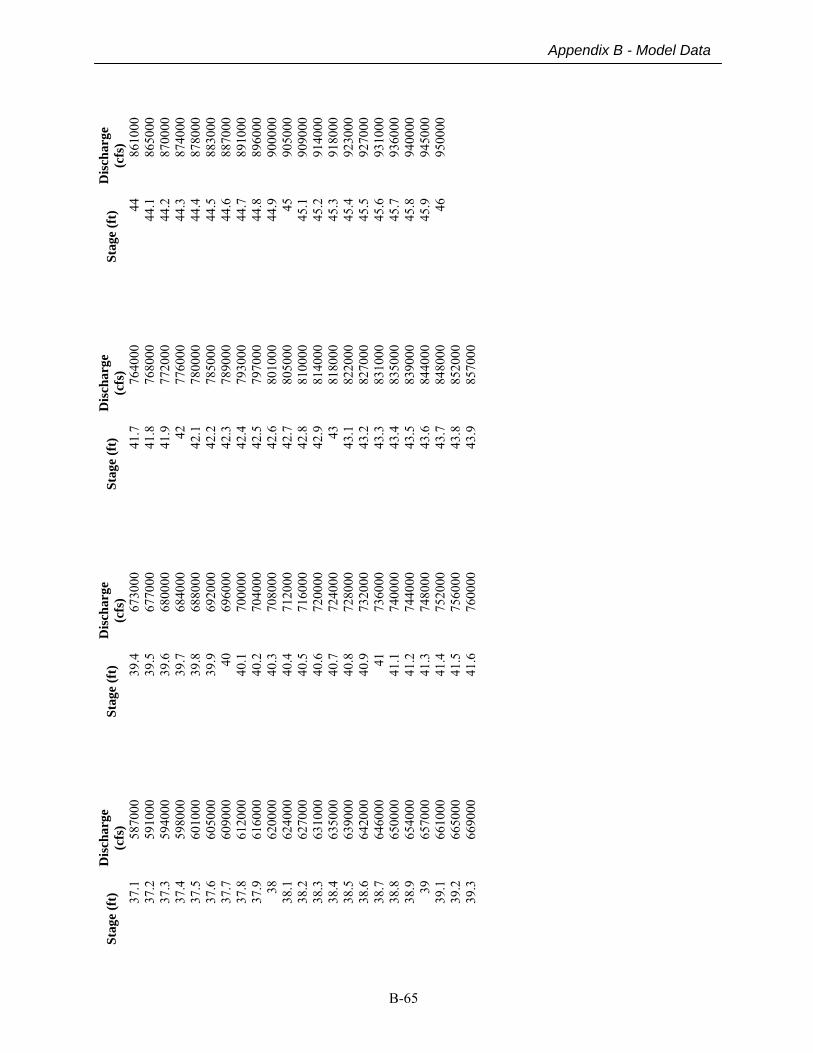
B-65
Appendix B - Model Data
Stag
e (f
t)
Dis
char
ge
(cfs
) 37
.1
5870
00
37.2
59
1000
37
.3
5940
00
37.4
59
8000
37
.5
6010
00
37.6
60
5000
37
.7
6090
00
37.8
61
2000
37
.9
6160
00
38
6200
00
38.1
62
4000
38
.2
6270
00
38.3
63
1000
38
.4
6350
00
38.5
63
9000
38
.6
6420
00
38.7
64
6000
38
.8
6500
00
38.9
65
4000
39
65
7000
39
.1
6610
00
39.2
66
5000
39
.3
6690
00
Stag
e (f
t)
Dis
char
ge
(cfs
) 39
.467
3000
39.5
6770
0039
.668
0000
39.7
6840
0039
.868
8000
39.9
6920
0040
6960
0040
.170
0000
40.2
7040
0040
.370
8000
40.4
7120
0040
.571
6000
40.6
7200
0040
.772
4000
40.8
7280
0040
.973
2000
4173
6000
41.1
7400
0041
.274
4000
41.3
7480
0041
.475
2000
41.5
7560
0041
.676
0000
Stag
e (f
t)
Dis
char
ge
(cfs
) 41
.7
7640
0041
.8
7680
0041
.9
7720
0042
77
6000
42.1
78
0000
42.2
78
5000
42.3
78
9000
42.4
79
3000
42.5
79
7000
42.6
80
1000
42.7
80
5000
42.8
81
0000
42.9
81
4000
43
8180
0043
.1
8220
0043
.2
8270
0043
.3
8310
0043
.4
8350
0043
.5
8390
0043
.6
8440
0043
.7
8480
0043
.8
8520
0043
.9
8570
00
Stag
e (f
t)
Dis
char
ge
(cfs
) 44
8610
0044
.186
5000
44.2
8700
0044
.387
4000
44.4
8780
0044
.588
3000
44.6
8870
0044
.789
1000
44.8
8960
0044
.990
0000
4590
5000
45.1
9090
0045
.291
4000
45.3
9180
0045
.492
3000
45.5
9270
0045
.693
1000
45.7
9360
0045
.894
0000
45.9
9450
0046
9500
00
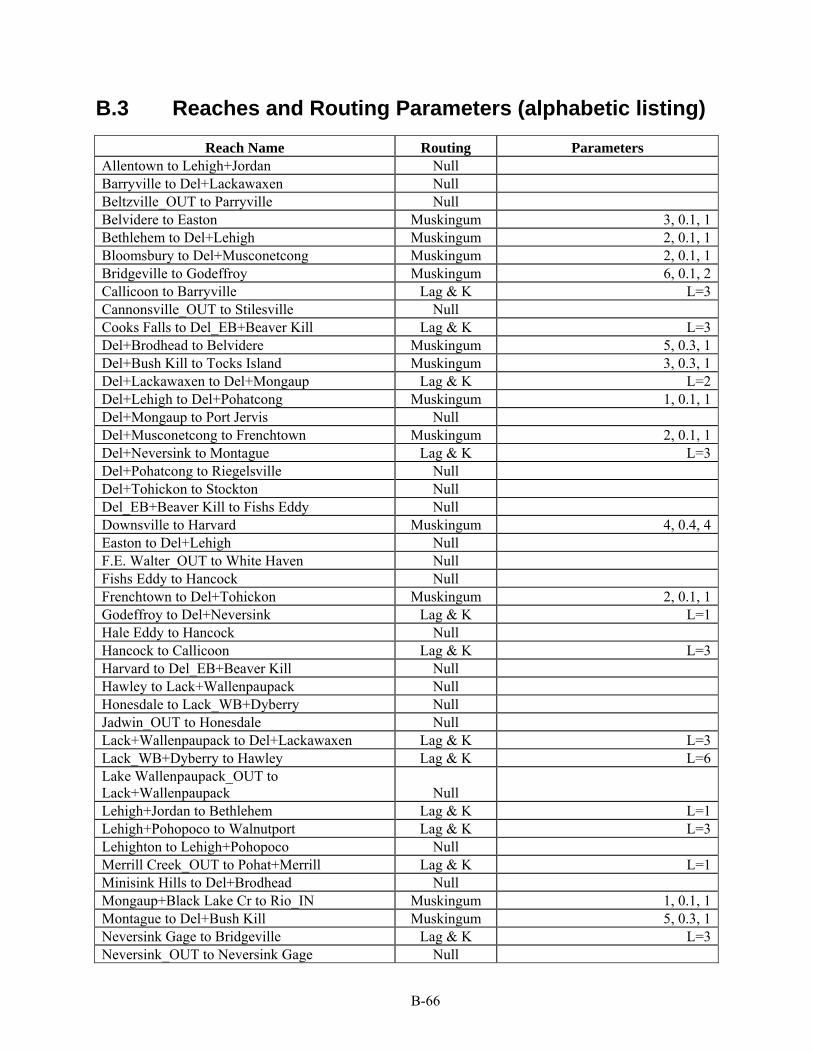
B-66
B.3 Reaches and Routing Parameters (alphabetic listing)
Reach Name Routing Parameters Allentown to Lehigh+Jordan Null Barryville to Del+Lackawaxen Null Beltzville_OUT to Parryville Null Belvidere to Easton Muskingum 3, 0.1, 1Bethlehem to Del+Lehigh Muskingum 2, 0.1, 1Bloomsbury to Del+Musconetcong Muskingum 2, 0.1, 1Bridgeville to Godeffroy Muskingum 6, 0.1, 2Callicoon to Barryville Lag & K L=3Cannonsville_OUT to Stilesville Null Cooks Falls to Del_EB+Beaver Kill Lag & K L=3Del+Brodhead to Belvidere Muskingum 5, 0.3, 1Del+Bush Kill to Tocks Island Muskingum 3, 0.3, 1Del+Lackawaxen to Del+Mongaup Lag & K L=2Del+Lehigh to Del+Pohatcong Muskingum 1, 0.1, 1Del+Mongaup to Port Jervis Null Del+Musconetcong to Frenchtown Muskingum 2, 0.1, 1Del+Neversink to Montague Lag & K L=3Del+Pohatcong to Riegelsville Null Del+Tohickon to Stockton Null Del_EB+Beaver Kill to Fishs Eddy Null Downsville to Harvard Muskingum 4, 0.4, 4Easton to Del+Lehigh Null F.E. Walter_OUT to White Haven Null Fishs Eddy to Hancock Null Frenchtown to Del+Tohickon Muskingum 2, 0.1, 1Godeffroy to Del+Neversink Lag & K L=1Hale Eddy to Hancock Null Hancock to Callicoon Lag & K L=3Harvard to Del_EB+Beaver Kill Null Hawley to Lack+Wallenpaupack Null Honesdale to Lack_WB+Dyberry Null Jadwin_OUT to Honesdale Null Lack+Wallenpaupack to Del+Lackawaxen Lag & K L=3Lack_WB+Dyberry to Hawley Lag & K L=6Lake Wallenpaupack_OUT to Lack+Wallenpaupack Null Lehigh+Jordan to Bethlehem Lag & K L=1Lehigh+Pohopoco to Walnutport Lag & K L=3Lehighton to Lehigh+Pohopoco Null Merrill Creek_OUT to Pohat+Merrill Lag & K L=1Minisink Hills to Del+Brodhead Null Mongaup+Black Lake Cr to Rio_IN Muskingum 1, 0.1, 1Montague to Del+Bush Kill Muskingum 5, 0.3, 1Neversink Gage to Bridgeville Lag & K L=3Neversink_OUT to Neversink Gage Null
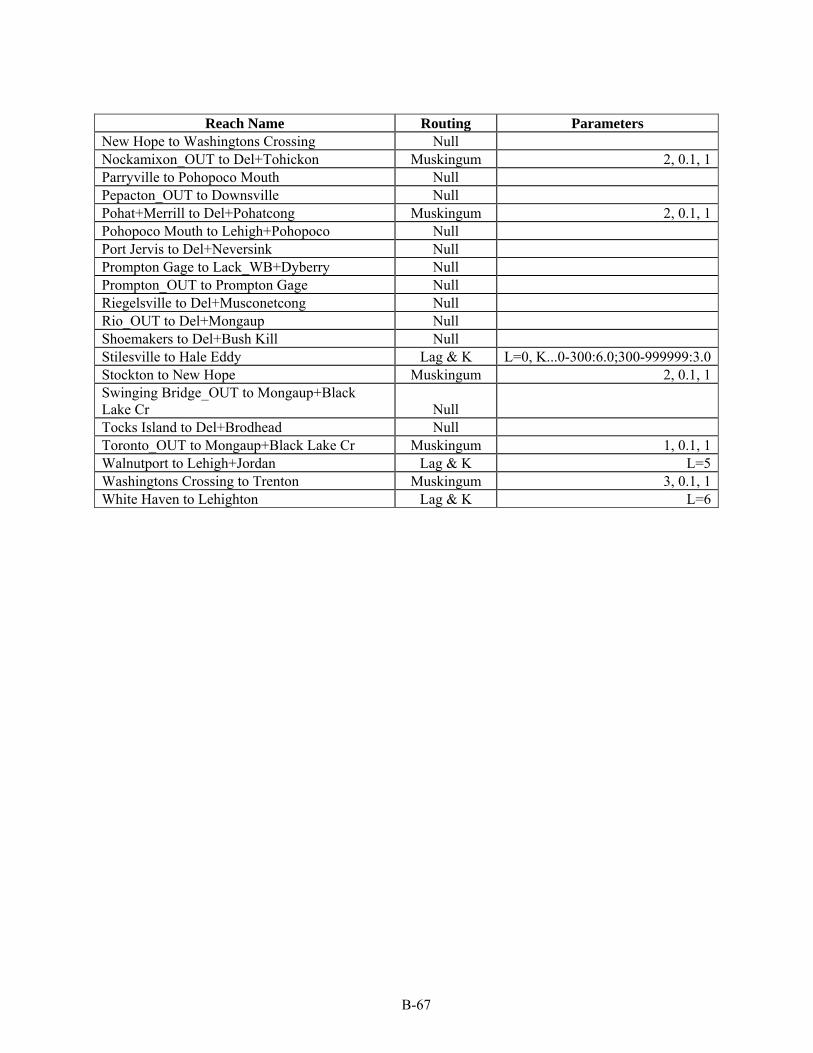
B-67
Reach Name Routing Parameters
New Hope to Washingtons Crossing Null Nockamixon_OUT to Del+Tohickon Muskingum 2, 0.1, 1Parryville to Pohopoco Mouth Null Pepacton_OUT to Downsville Null Pohat+Merrill to Del+Pohatcong Muskingum 2, 0.1, 1Pohopoco Mouth to Lehigh+Pohopoco Null Port Jervis to Del+Neversink Null Prompton Gage to Lack_WB+Dyberry Null Prompton_OUT to Prompton Gage Null Riegelsville to Del+Musconetcong Null Rio_OUT to Del+Mongaup Null Shoemakers to Del+Bush Kill Null Stilesville to Hale Eddy Lag & K L=0, K...0-300:6.0;300-999999:3.0Stockton to New Hope Muskingum 2, 0.1, 1Swinging Bridge_OUT to Mongaup+Black Lake Cr Null Tocks Island to Del+Brodhead Null Toronto_OUT to Mongaup+Black Lake Cr Muskingum 1, 0.1, 1Walnutport to Lehigh+Jordan Lag & K L=5Washingtons Crossing to Trenton Muskingum 3, 0.1, 1White Haven to Lehighton Lag & K L=6
Related Documents