Delaware River Basin Commission Overview of Consumptive Use Coefficients October 16, 2018 Water Management Advisory Committee Chad Pindar, P.E. Manager, Water Resource Planning Section PSEG Hope-Salem Creek Nuclear Power Plant Complex: Credit Google Images Presented to an advisory committee of the DRBC on October 16, 2018. Contents should not be published or re-posted in whole or in part without the permission of DRBC.

Welcome message from author
This document is posted to help you gain knowledge. Please leave a comment to let me know what you think about it! Share it to your friends and learn new things together.
Transcript

Delaware River Basin Commission
Overview of Consumptive Use Coefficients
October 16, 2018Water Management Advisory Committee
Chad Pindar, P.E.Manager, Water Resource Planning Section
PSEG Hope-Salem Creek Nuclear Power Plant Complex: Credit Google Images
Presented to an advisory committee of the DRBC on October 16, 2018. Contents should not be published or re-posted in whole or in part without the permission of DRBC.
Agenda
Overview of consumptive use (CU) in the DRB
Water use sectors
6 sectors used for reporting
22 sub-sectors stored in database
DRBC Programs & CU coefficients
Review Summer 2018 research results
2016 Water Use/Consumptive Use in the DRB
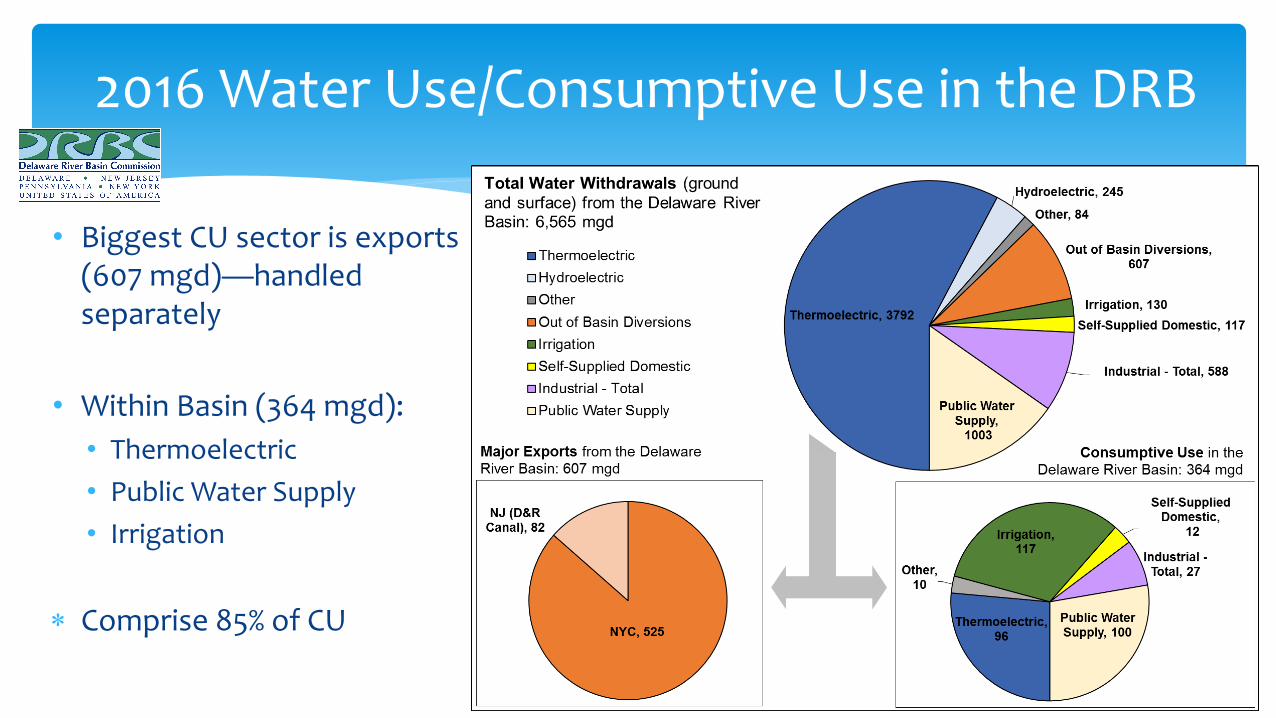
• Biggest CU sector is exports (607 mgd)—handled separately
• Within Basin (364 mgd):
• Thermoelectric
• Public Water Supply
• Irrigation
Comprise 85% of CU

Total DRB WDs in 2015 by Type/Location
*Tidal WDs highly inflated by Hope-Salem**Hydropower facilities inflate “Other DRB Tribs” significantly, so taken as a separate “region:
*
1
2
3Schuylkill, 268
mgd, 23%
Lehigh, 59mgd, 5%
Brandywine-Christina, 68 mgd, 6%
Mainstem Delaware, 274
mgd, 24%
Other DRB Tribs, 175 mgd, 15%
Hydropower**, 303, 27%

Consumptive Use over time: Thermoelectric

Consumptive Use over time: Public Water

Consumptive Use over time
100
200
300
400
500
600
700
800
900
mgd
Reported Values1981 Level B Observations & Projections2000 Consumptive Use Report Observations & Projections2008 Multi-Jurisdictional Study
DRBC Consumptive Use Projections vs. Reported Values
OBSERVED & REPORTED CU VALUES
YearCU rate
(MGD)Source
1965 304 Staff report (1988)
1986 303 Staff report (1988)
1987 325Water Resources Program
(1990-91)
1991 311Water Resources Program
(1999)
1996 276 Staff report (2000)
2003 324State of the Basin report
(2008)
2007 300 Water Resources Program
2011 293 Water Resources Program
2014 284 Water Resources Program
2015 360 Staff analysis
2016 364
Staff analysis; pending
publication in FY2019-2021
WRP
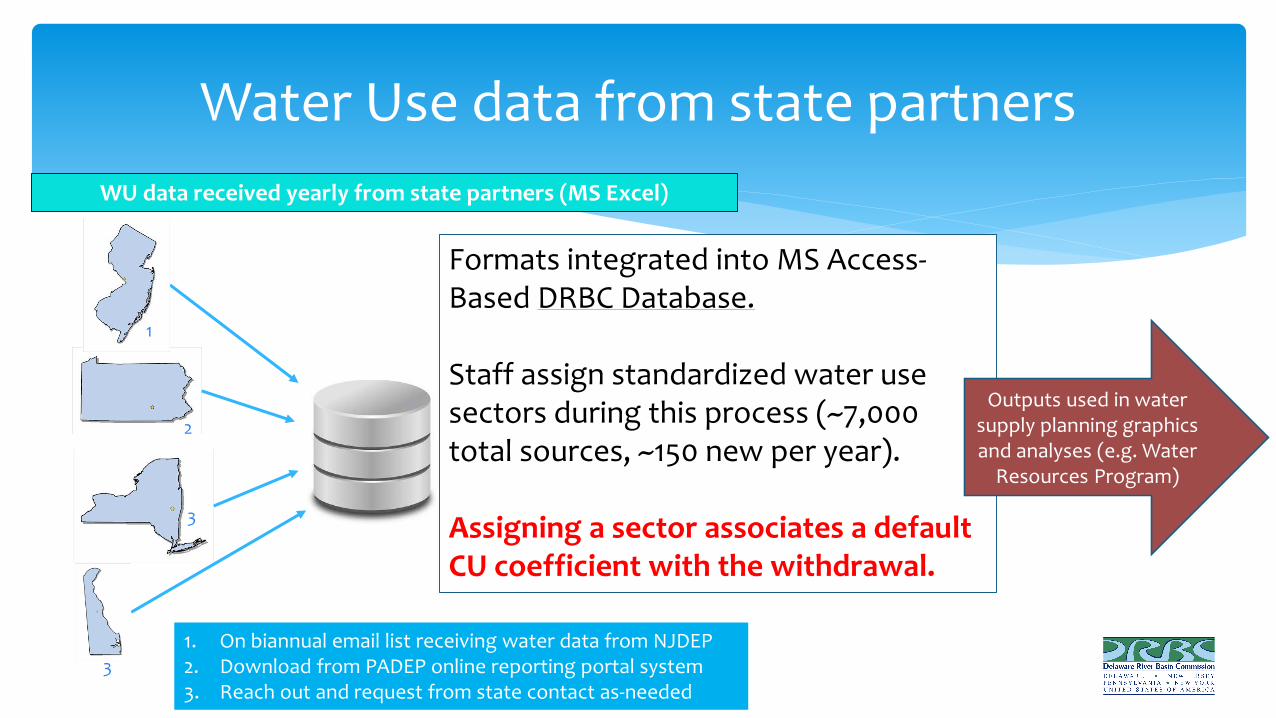
Water Use data from state partners
Formats integrated into MS Access-Based DRBC Database.
Staff assign standardized water use sectors during this process (~7,000 total sources, ~150 new per year).
Assigning a sector associates a default CU coefficient with the withdrawal.
WU data received yearly from state partners (MS Excel)
Outputs used in water supply planning graphics and analyses (e.g. Water
Resources Program)
3
3
1
2
1. On biannual email list receiving water data from NJDEP2. Download from PADEP online reporting portal system3. Reach out and request from state contact as-needed
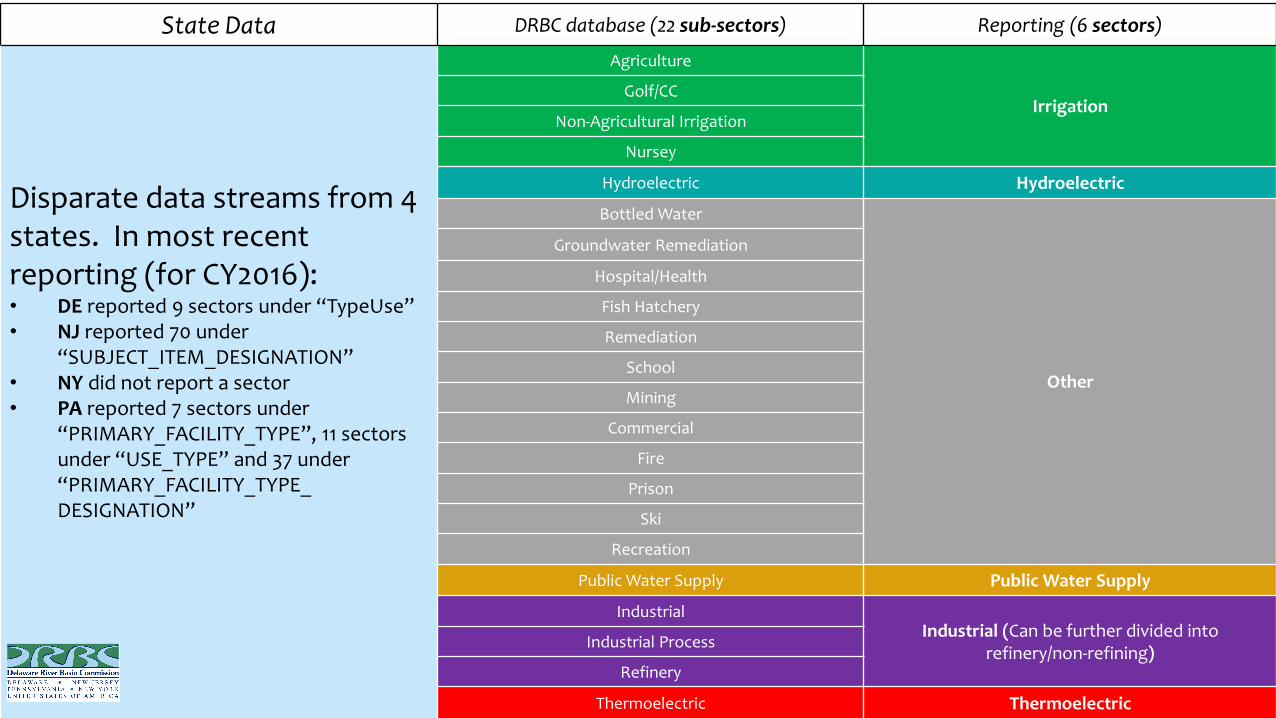
State Data DRBC database (22 sub-sectors) Reporting (6 sectors)
Disparate data streams from 4 states. In most recent reporting (for CY2016):• DE reported 9 sectors under “TypeUse”• NJ reported 70 under
“SUBJECT_ITEM_DESIGNATION”• NY did not report a sector• PA reported 7 sectors under
“PRIMARY_FACILITY_TYPE”, 11 sectors under “USE_TYPE” and 37 under “PRIMARY_FACILITY_TYPE_ DESIGNATION”
Agriculture
IrrigationGolf/CC
Non-Agricultural Irrigation
Nursey
Hydroelectric Hydroelectric
Bottled Water
Other
Groundwater Remediation
Hospital/Health
Fish Hatchery
Remediation
School
Mining
Commercial
Fire
Prison
Ski
Recreation
Public Water Supply Public Water Supply
IndustrialIndustrial (Can be further divided into
refinery/non-refining)Industrial Process
Refinery
Thermoelectric Thermoelectric

DRBC Program-level use of CU Coefficients
Operations
Surface Water Charging
• ~288 SW users who pay
• Rates:
• Consumptive: $82.14/Mgal
• Non-Cons.: $0.82/Mgal
• About 50% report site-specific CU factor
• Standard CU factors on forms:
• Skiing: 22%
• Golf: 90%
Consumptive Use Replacement
• Power (Merrill Creek)
Project Review
• Written into most WD dockets
• ~600/1250 docket records have site-specific coefficient populated in database
• Unclear whether >1 mgdwithdrawals have site-specific CU coefficients
Planning
• Annual water use reporting such as the Water Resources Program
• Water Supply Planning
• 2060 studies
• SEPA-GWPA

Summer 2018 Research Objectives
1. Document the origin of DRBC CU coefficients
2. Identify current CU coefficients used by DRBC for each sector
3. Compare to published sector coefficients
Thank you to Allison Kaltenbach: Summer 2018 Water Resource Planning Section Intern, University of Delaware rising senior Photo: Flickr - USDA - Center pivot irrigation on a farm in DE

Summer 2018 Intern Findings
• No DRBC regulations (Water Code & RPP) on CU coefficients
• No formal policy/resolution that establishes CU coefficients
• 2000 internal DRBC report using 1996 data documents some CU coefficients
• Current sub-sectors organized following 2000 report
Summer 2018 Intern Findings
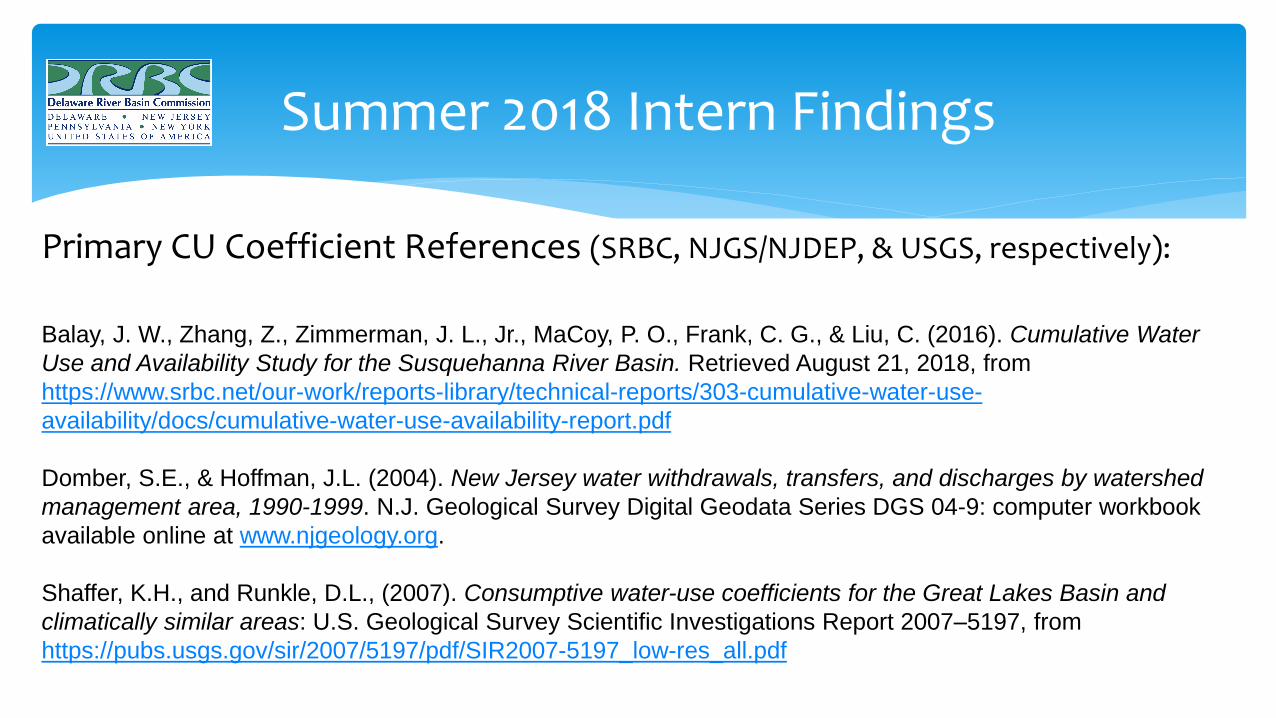
Primary CU Coefficient References (SRBC, NJGS/NJDEP, & USGS, respectively):
Balay, J. W., Zhang, Z., Zimmerman, J. L., Jr., MaCoy, P. O., Frank, C. G., & Liu, C. (2016). Cumulative Water
Use and Availability Study for the Susquehanna River Basin. Retrieved August 21, 2018, from
https://www.srbc.net/our-work/reports-library/technical-reports/303-cumulative-water-use-
availability/docs/cumulative-water-use-availability-report.pdf
Domber, S.E., & Hoffman, J.L. (2004). New Jersey water withdrawals, transfers, and discharges by watershed
management area, 1990-1999. N.J. Geological Survey Digital Geodata Series DGS 04-9: computer workbook
available online at www.njgeology.org.
Shaffer, K.H., and Runkle, D.L., (2007). Consumptive water-use coefficients for the Great Lakes Basin and
climatically similar areas: U.S. Geological Survey Scientific Investigations Report 2007–5197, from
https://pubs.usgs.gov/sir/2007/5197/pdf/SIR2007-5197_low-res_all.pdf

Comparative analysis
Sub-Sector DRBC Default Factor SRBC Default FactorDomber & Hoffman
(2004)Shaffer & Runkle
(2007)Bottled Water 100% 80% 80% NA
Agriculture 90% 90% 90% 91%Golf/CC 90% 90% 90% 91%
Non-Agricultural Irrigation 90% 90% 90% 91%Nursery 90% 90% 90% 91%
Fire 20% 20% 50% NAMining 20% 12% 12% 13%
Remediation 20% 10% 10% NASki 22% 15% NA NA
Commercial 15% 10% 23% 10%Hospital/Health 10% 10% 13% 10%
Industrial 10% 10% 10% 10%Prison 10% 15% 23% NA
Public Water Supply 10% 15% 13% 13%Recreation 10% 10% 0% NA
School 10% 15% 23% 10%Fish Hatchery 5% 5% 5% NA
Thermoelectric 2% 2% 3% 2%Groundwater Remediation 0% 10% 10% NA
Hydroelectric 0% 3% 0% 0%Refinery NA NA NA *15%

Improved Data Management based on Findings
• Triggered a “clean up” of withdrawal sectors for Water Use Reporting:• Clearly delineated sectors and sub-sectors• Eliminated redundant sub-sectors• Assigned more specific sectors to sources where possible (sectors vs. sub-sectors)• Created new sub-sector under industrial for refineries
• Standardizing reporting procedures• Apply site-specific from Power and Industrial dockets where applicable• Fill in the blanks with “defaults”

Discussion Items
• PWS: current value vs. values documented in literature
• Establish formal policy on subsectors & associated CU coefficient
• CU replacement for industrial users during Critical Hydrologic Condition
• Database synchronization between Project Review and Water Use
Related Documents