Cryoscopic Determination of Molar Mass Prepared by: Jerlyn Rose Yasay

Cryoscopic Determination of Molar Mass
Nov 27, 2015
Freezing Point Depression Report
Welcome message from author
This document is posted to help you gain knowledge. Please leave a comment to let me know what you think about it! Share it to your friends and learn new things together.
Transcript

Cryoscopic Determination of Molar Mass
Prepared by: Jerlyn Rose Yasay

Introduction
What is Cryoscopy?
study or practice of determining the freezing point of liquids.
Freezing point
Freezing point depression+ solute
Introduction
Baekmann method,

Introduction
Baekmann method,
Cooled
Steady and Slow
Temperature readings
Introduction
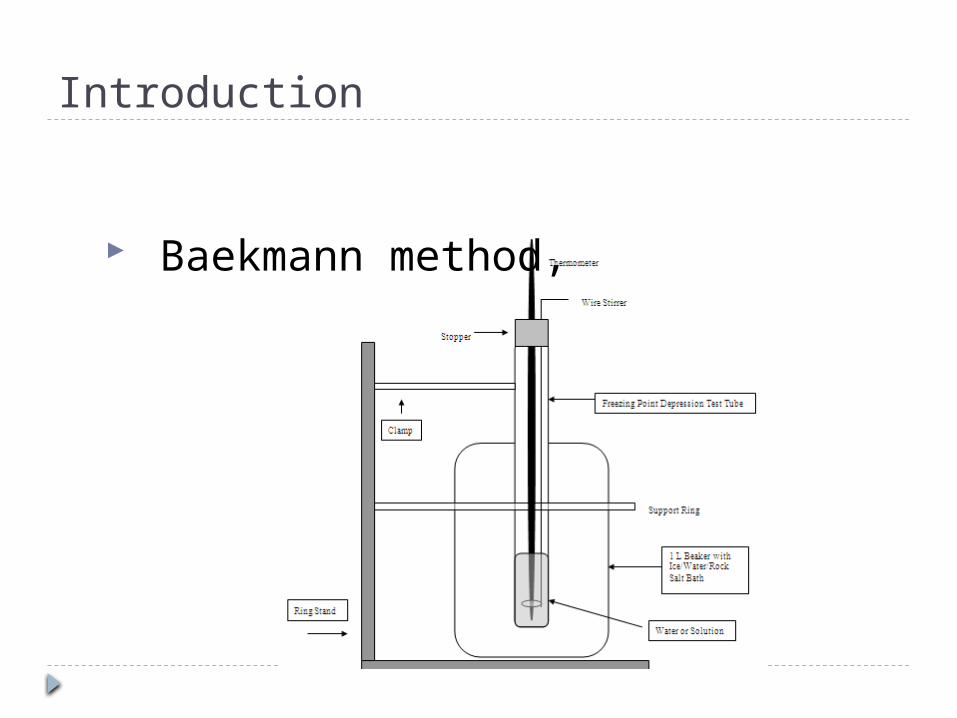
Figure 1 Cooling curve of (a) pure solvent and (b) solution

Introduction
=molar mass of the unknown solute, = , = ; = and is the mass of the solute and
solvent, respectively

Introduction
In the experiment, the molar mass of the unknown solid was determined by the freezing point of the benzene and the freezing point depression of the solution when the unknown was added,

Data and Results
Time
(s)
Benzene°C
Unknown°C
0 10.041 12.12520 8.054 10.30640 6.384 8.19560 5.125 6.72380 5.315 4.793
100 5.322 3.876120 5.323 5.285140 5.33 5.284
Time(s)
Benzene°C
Unknown°C
160 5.33 5.284180 5.33 5.274200 5.33 5.264220 5.33 5.145240 - 4.98260 - 4.7280 - 4.559
Table 1 temperature reading for benzene and the solution at an interval of 20 sec
Data and Results
0 100 200 3000
2
4
6
8
10
12
timr,t
tem
pera
ture
, °
C
0 100 200 3000
2
4
6
8
10
12
14
time, t
Tem
pera
ture
, °C
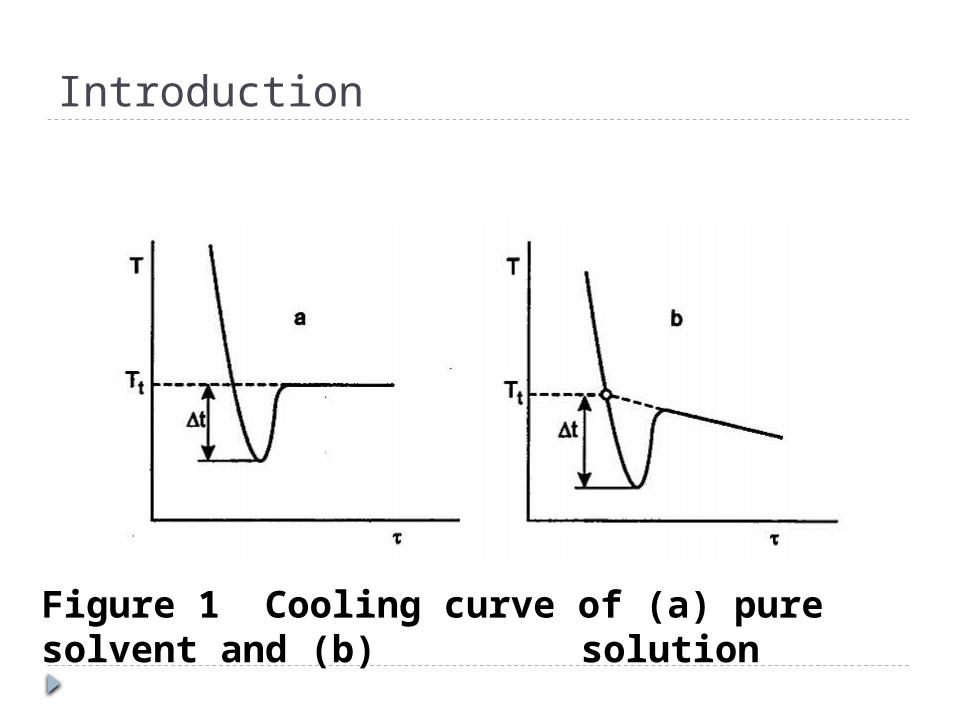
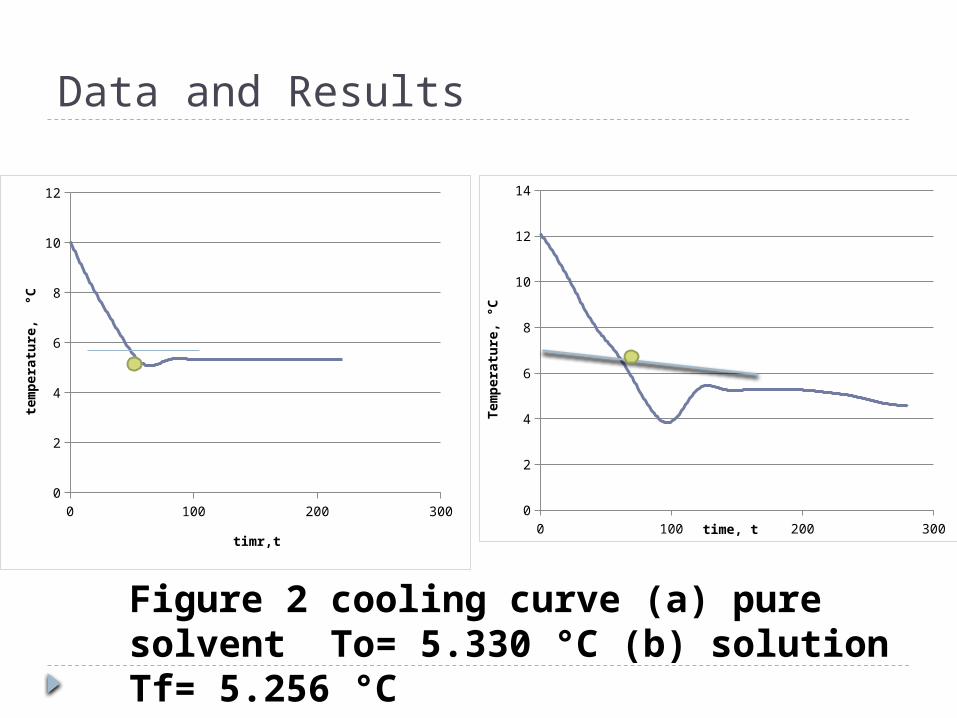
Figure 2 cooling curve (a) pure solvent To= 5.330 °C (b) solution Tf= 5.256 °C

Data and Results
Trial To T ΔTf M Mave
1 5.330
5.256
-0.074
191.3
195.32 5.36
05.28
4-
0.071199.4
Table 2 Freezing point depression and molar mass of unknown solid for each trial

Discussion
No of solutes=
Freezing point
entropy
Discussion
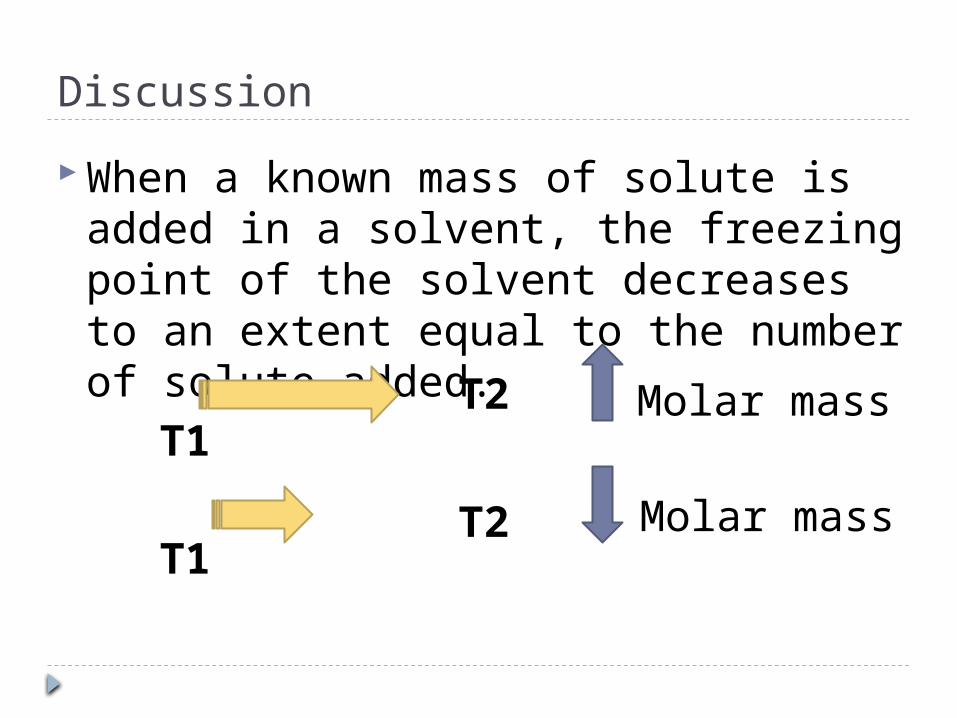
When a known mass of solute is added in a solvent, the freezing point of the solvent decreases to an extent equal to the number of solute added.
T1
T1
T2 Molar mass
T2 Molar mass
Sample Calculation

Conclusion
color-= dark yellow
Trial To T ΔTf M Mave
1 5.330
5.256
-0.074
191.3
195.32 5.36
05.28
4-
0.071199.4
Conclusion The molar mass of the unknown solid
was 195.3 g/mol .
.;. It is potassium chromate K2CrO4 with 194.19 g/mol.
%error= 0.588%
Related Documents