CrIS SDR Calibration and Cross-sensor Comparisons Yong Han NOAA Center for Satellite Applications and Research, College Park, MD, USA and CrIS SDR Science Team ITSC-19 March 25 – April 1, 2014 Jeju Island, South Korea 1

Welcome message from author
This document is posted to help you gain knowledge. Please leave a comment to let me know what you think about it! Share it to your friends and learn new things together.
Transcript
CrIS SDR Calibration and Cross-sensor Comparisons
Yong Han NOAA Center for Satellite Applications and Research, College Park, MD, USA
and CrIS SDR Science Team
ITSC-19 March 25 – April 1, 2014 Jeju Island, South Korea
1
Presenter
Presentation Notes
I change your title a little bit
Outline
• CrIS SDR Science Team
• Data processing and Cal/Val process
• SDR product quality and calibration uncertainties
• Cross-sensor comparisons
• Summary
2
SDR: Sensor Data Record
JPSS CrIS SDR Science Team member & Cal/Val Process
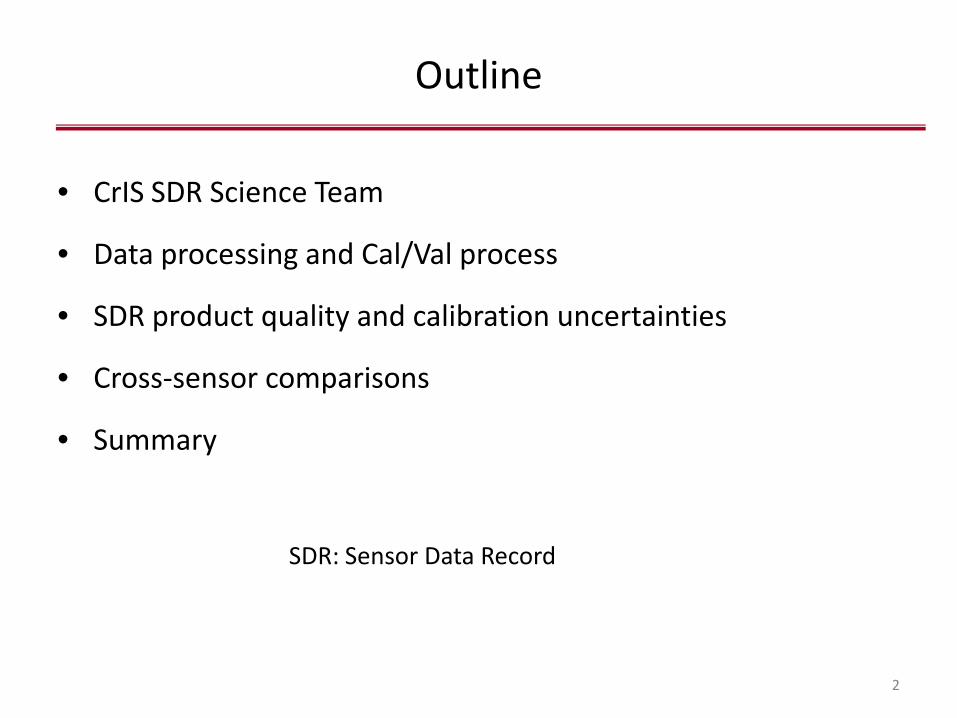
• Early Orbit Checkout (EOC), 18 January – 23 February 2012 • Intensive Calibration and Validation (ICV), 23 February 2012 – 20 December 2013 • Long-term Monitoring (LTM), remaining NPP mission
3
Organization PI NOAA Center for Satellite Applications & Research (NOAA/STAR) Yong Han
University of Wisconsin (UW) Hank Revercomb
University of Maryland Baltimore County (UMBC) Larrabee Strow
Space Dynamics Laboratory/Utah State University (SDL) Deron Scott
Massachusetts Institute of Technology/Lincoln Labs (MIT/LL) Dan Mooney
Northrop Grumman Aerospace Systems Degui Gu
Exelis-ITT Mike Cromp
NASA Dave Johnson
Raytheon Wael Ibrahim
CrIS SDR calibration and validation (Cal/Val) team members (Subject Matter Experts):
CrIS SDR Validation phases:
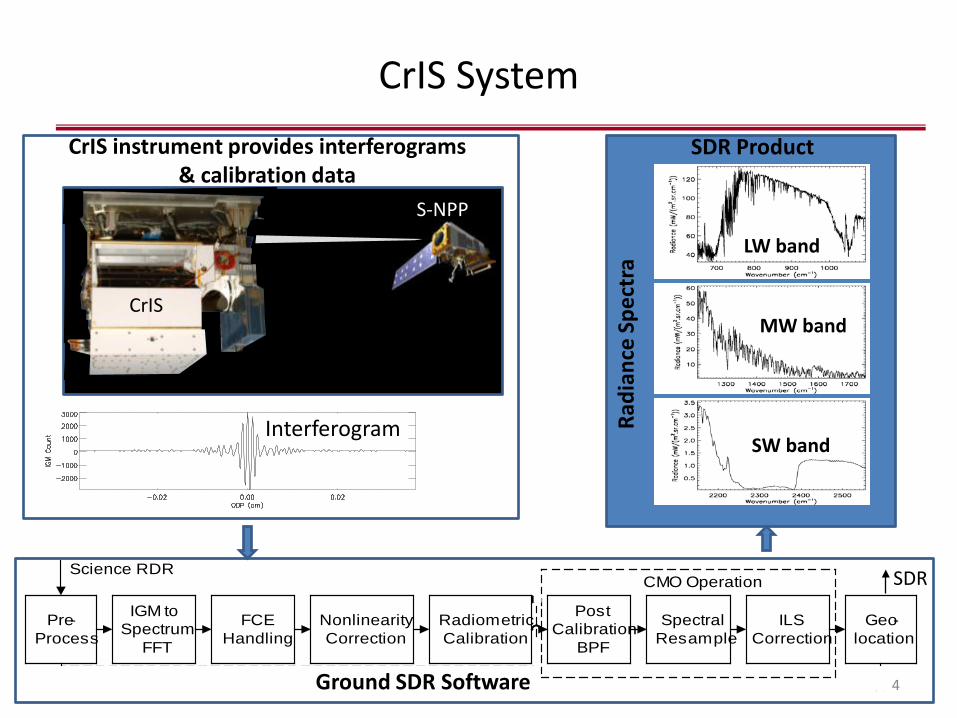
CrIS System
4
Pre-Process
IGM to Spectrum
FFT
FCEHandling
NonlinearityCorrection
RadiometricCalibration
PostCalibration
BPF
SpectralResample
ILSCorrection
Geo-location
CMO Operation
SDR
Science RDR
CrIS instrument provides interferograms & calibration data
Interferogram
Ground SDR Software
LW band
MW band
SW band
S-NPP
CrIS
Radi
ance
Spe
ctra
SDR Product
SDR
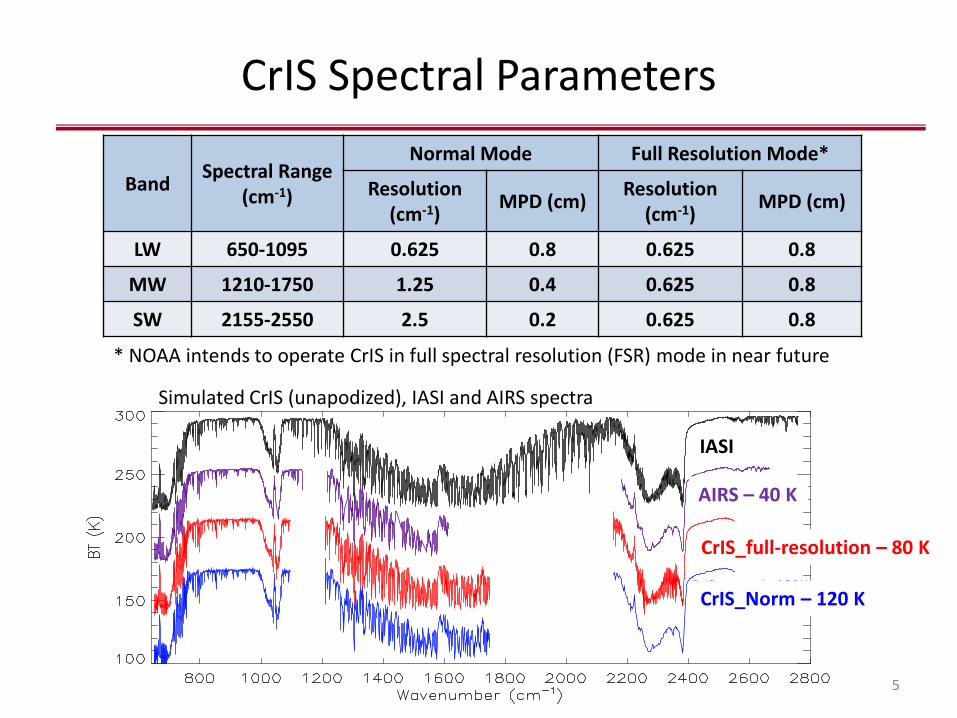
CrIS Spectral Parameters
5
Simulated CrIS (unapodized), IASI and AIRS spectra
Band Spectral Range (cm-1)
Normal Mode Full Resolution Mode*
Resolution (cm-1) MPD (cm) Resolution
(cm-1) MPD (cm)
LW 650-1095 0.625 0.8 0.625 0.8
MW 1210-1750 1.25 0.4 0.625 0.8
SW 2155-2550 2.5 0.2 0.625 0.8
* NOAA intends to operate CrIS in full spectral resolution (FSR) mode in near future
IASI
AIRS – 40 K
CrIS_full-resolution – 80 K
CrIS_Norm – 120 K
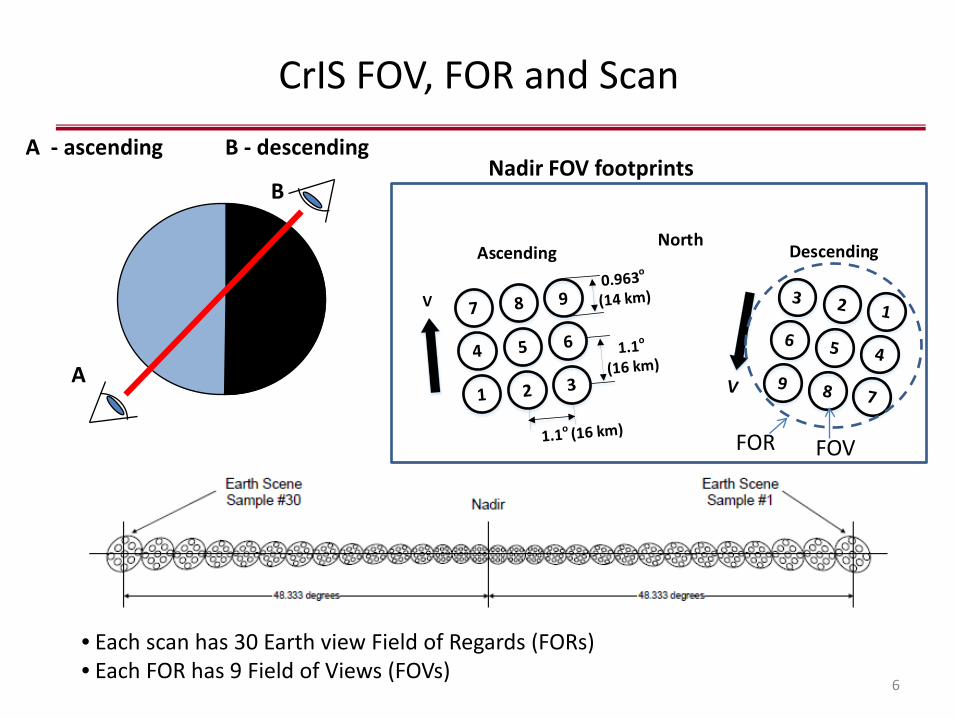
CrIS FOV, FOR and Scan
6
Ascending Descending
V
(A)North
A
A - ascending Nadir FOV footprints
FOR FOV
• Each scan has 30 Earth view Field of Regards (FORs) • Each FOR has 9 Field of Views (FOVs)
B - descending
B

CrIS SDR CalVal Milestones
7
12/20/2013 Time 01/31/2013
Provisional status Beta status
First SDR product
Validated status
Calibration algorithm and
coefficient updates
02/20/2014
04/19/2012
04/02/2012 Intensive Calibration & Validation (ICV)
• Major ICV activities – SDR algorithm and software improvement – CrIS performance characterization – Radiometric CalVal – Spectral CalVal – Geolocation CalVal – CrIS instrument and SDR trending and monitoring
SDR validated in three stages: Beta, Provisional, and Validated
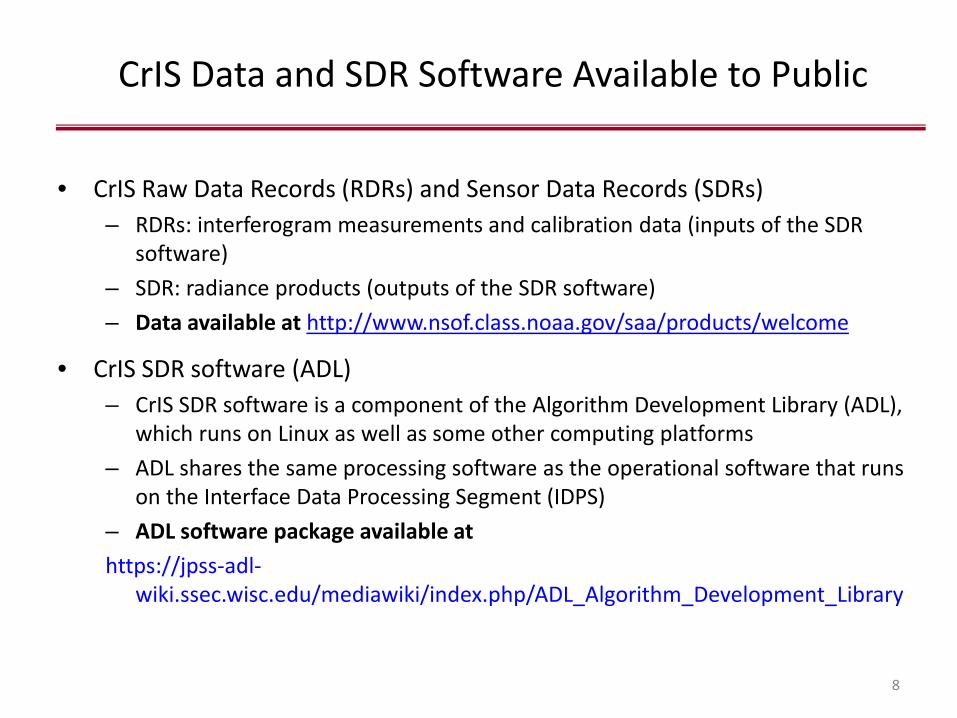
CrIS Data and SDR Software Available to Public
• CrIS Raw Data Records (RDRs) and Sensor Data Records (SDRs) – RDRs: interferogram measurements and calibration data (inputs of the SDR
software) – SDR: radiance products (outputs of the SDR software) – Data available at http://www.nsof.class.noaa.gov/saa/products/welcome
• CrIS SDR software (ADL) – CrIS SDR software is a component of the Algorithm Development Library (ADL),
which runs on Linux as well as some other computing platforms – ADL shares the same processing software as the operational software that runs
on the Interface Data Processing Segment (IDPS) – ADL software package available at https://jpss-adl-
wiki.ssec.wisc.edu/mediawiki/index.php/ADL_Algorithm_Development_Library
8
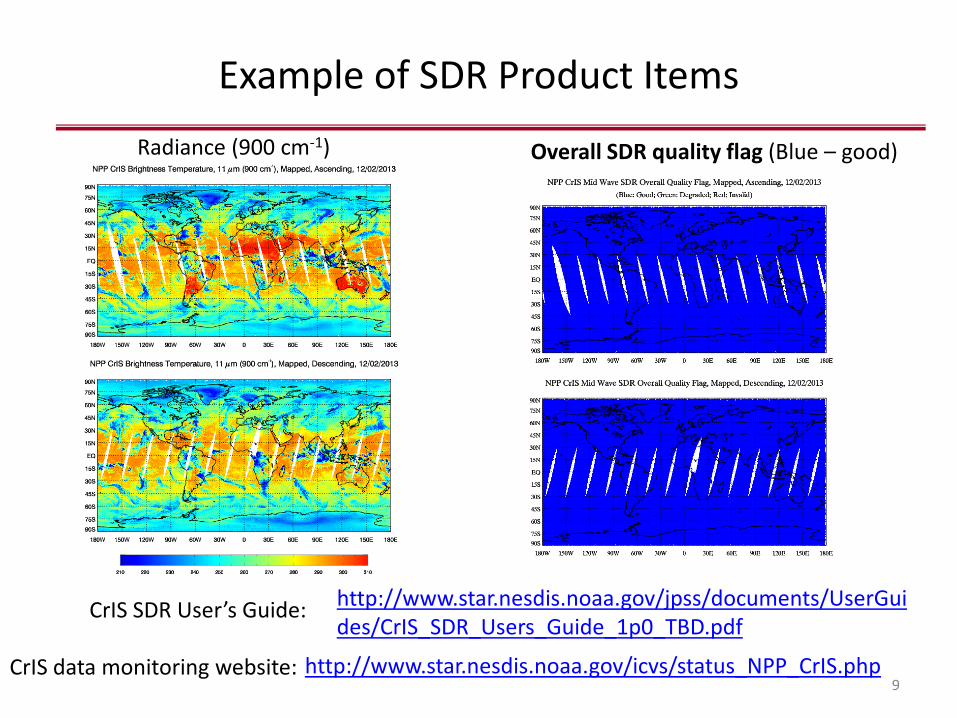
Example of SDR Product Items
9
Radiance (900 cm-1) Overall SDR quality flag (Blue – good)
http://www.star.nesdis.noaa.gov/icvs/status_NPP_CrIS.php
http://www.star.nesdis.noaa.gov/jpss/documents/UserGuides/CrIS_SDR_Users_Guide_1p0_TBD.pdf
CrIS SDR User’s Guide:
CrIS data monitoring website:
10
CrIS Data Quality and Calibration Uncertainty Estimates
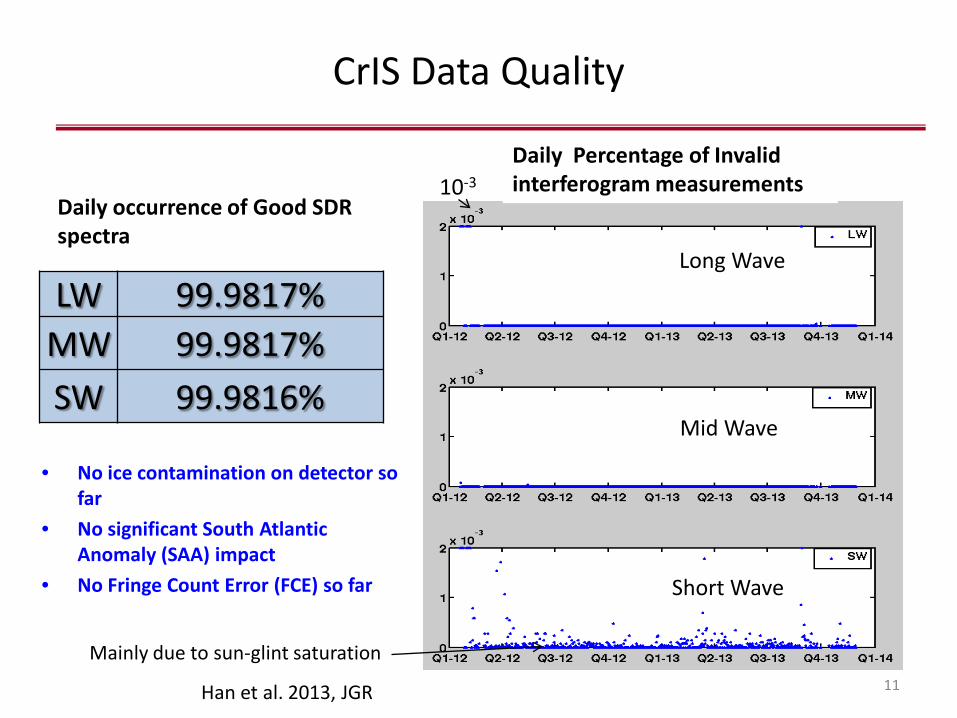
CrIS Data Quality
• No ice contamination on detector so far
• No significant South Atlantic Anomaly (SAA) impact
• No Fringe Count Error (FCE) so far
11
LW 99.9817% MW 99.9817% SW 99.9816%
Long Wave
Mid Wave
Short Wave
Daily Percentage of Invalid interferogram measurements
Daily occurrence of Good SDR spectra
Mainly due to sun-glint saturation
10-3
Han et al. 2013, JGR
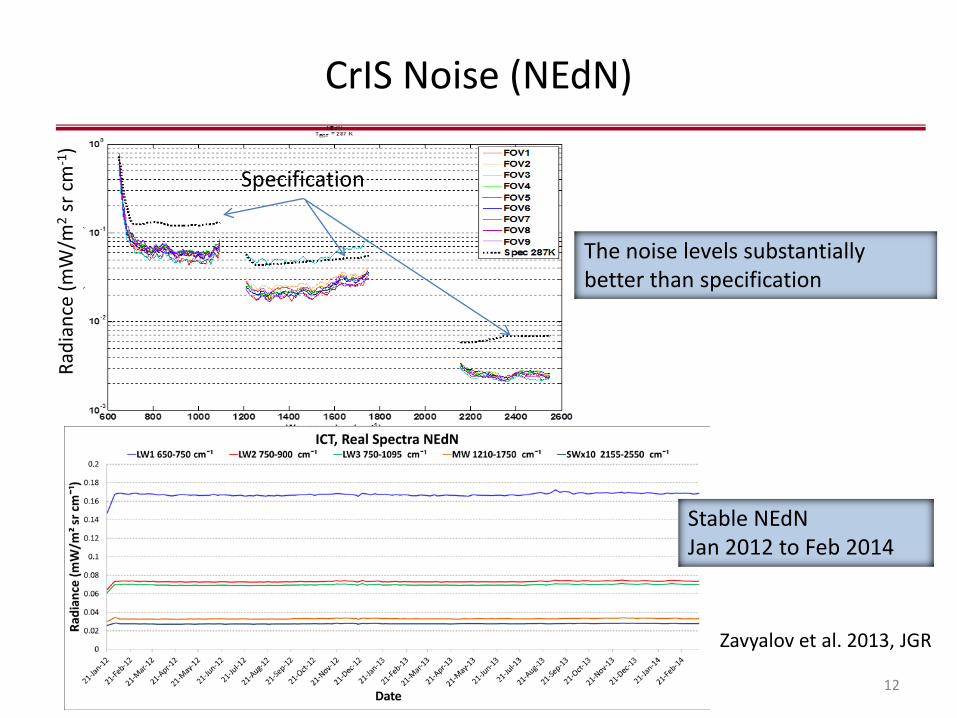
CrIS Noise (NEdN)
12
The noise levels substantially better than specification
Radi
ance
(mW
/m2 s
r cm
-1)
Specification
Stable NEdN Jan 2012 to Feb 2014
Zavyalov et al. 2013, JGR
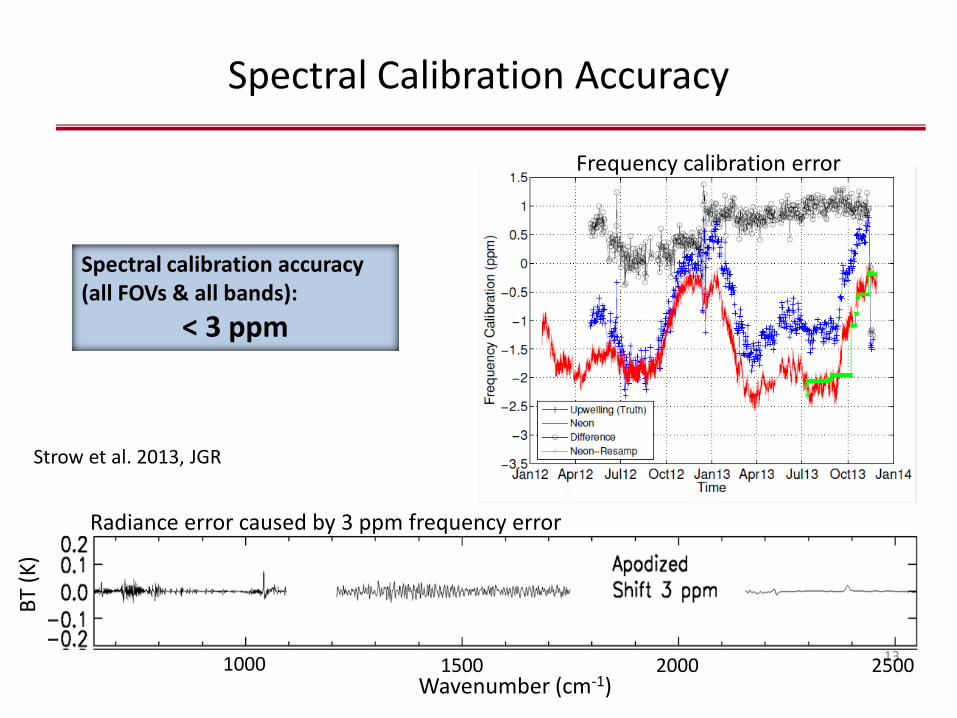
Spectral Calibration Accuracy
13
Radiance error caused by 3 ppm frequency error
1000 2000 1500 2500 Wavenumber (cm-1)
Spectral calibration accuracy (all FOVs & all bands):
< 3 ppm
BT (K
)
Frequency calibration error
Strow et al. 2013, JGR
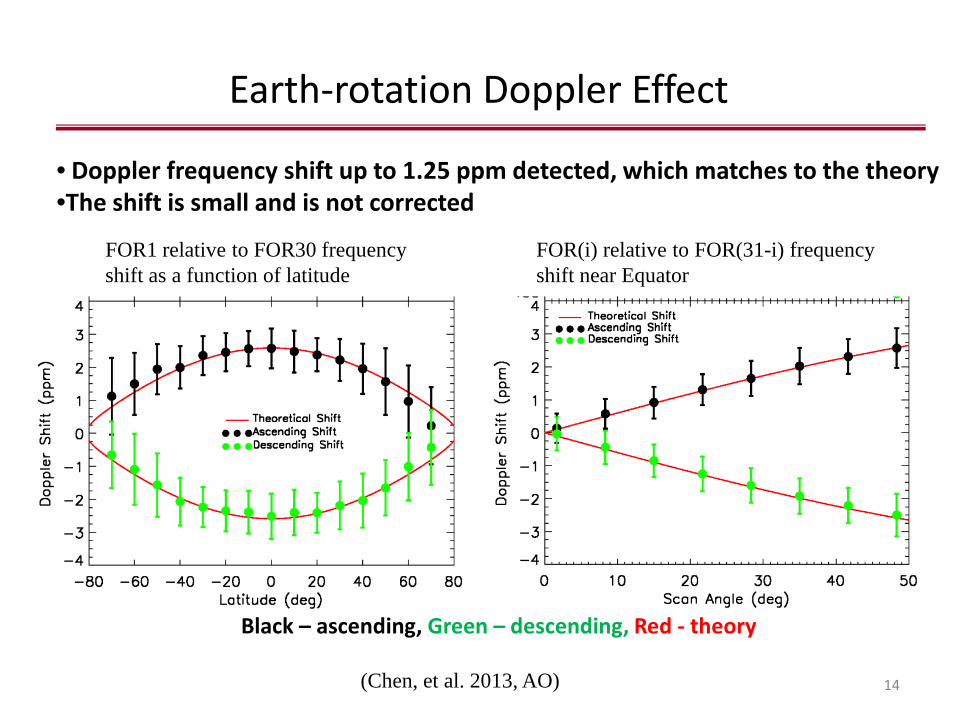
Earth-rotation Doppler Effect
14 (Chen, et al. 2013, AO)
Black – ascending, Green – descending, Red - theory
FOR(i) relative to FOR(31-i) frequency shift near Equator
FOR1 relative to FOR30 frequency shift as a function of latitude
• Doppler frequency shift up to 1.25 ppm detected, which matches to the theory •The shift is small and is not corrected

Radiometric Uncertainty (RU)
15
BT u
ncer
tain
ty
Uncertainty specification @287K blackbody
1.7 K
0.39 K
Distribution of 3-sigma RU for one orbit of data
RU u
ncer
tain
ty (K
) 3-
sigm
a RU
(K)
3-sigma specification
1-sigma specification
RU better than spec by approximately a factor 4
Tobin et al. 2013, JGR
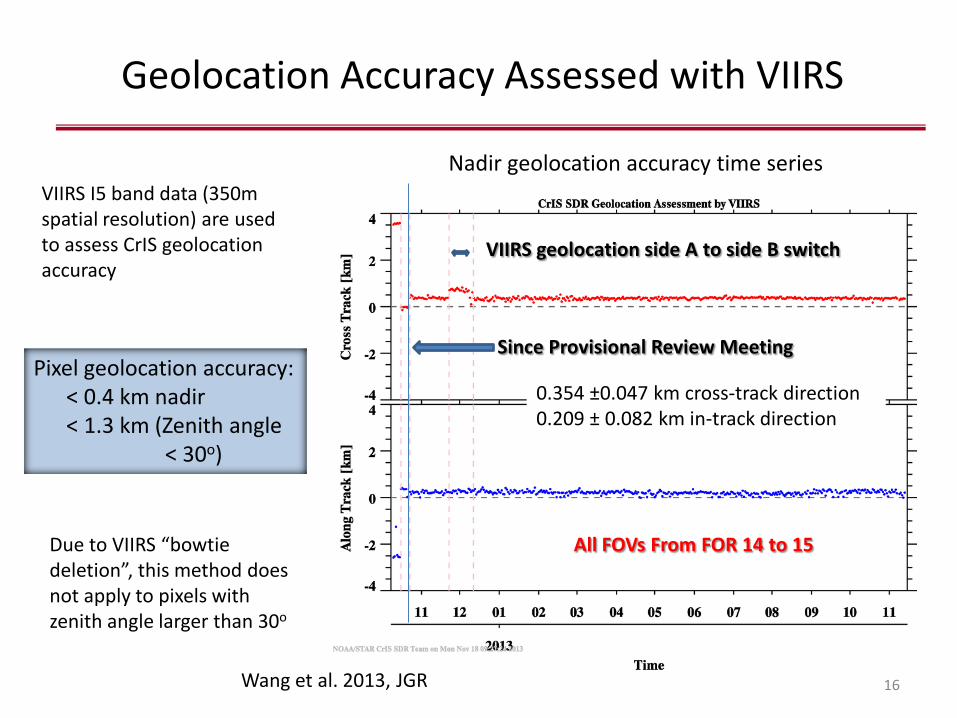
Geolocation Accuracy Assessed with VIIRS
16
Since Provisional Review Meeting
VIIRS geolocation side A to side B switch
All FOVs From FOR 14 to 15
Pixel geolocation accuracy: < 0.4 km nadir < 1.3 km (Zenith angle < 30o)
Due to VIIRS “bowtie deletion”, this method does not apply to pixels with zenith angle larger than 30o
VIIRS I5 band data (350m spatial resolution) are used to assess CrIS geolocation accuracy
Nadir geolocation accuracy time series
0.354 ±0.047 km cross-track direction 0.209 ± 0.082 km in-track direction
Wang et al. 2013, JGR
17
Cross-sensor Comparisons
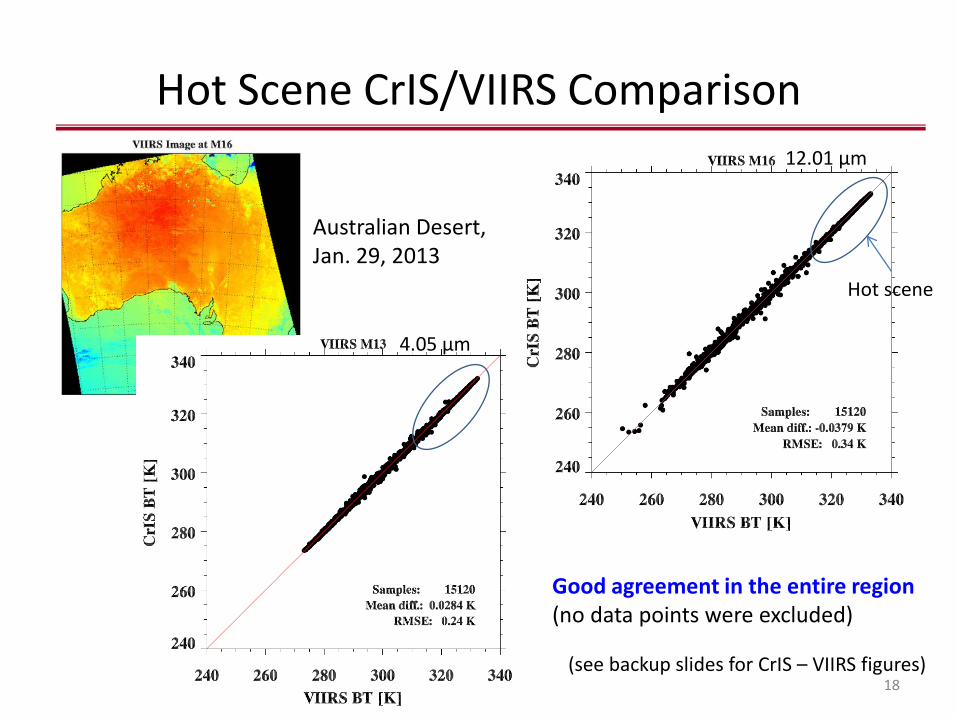
Hot Scene CrIS/VIIRS Comparison
18
Australian Desert, Jan. 29, 2013
Good agreement in the entire region (no data points were excluded)
12.01 μm
4.05 μm
Hot scene
(see backup slides for CrIS – VIIRS figures)
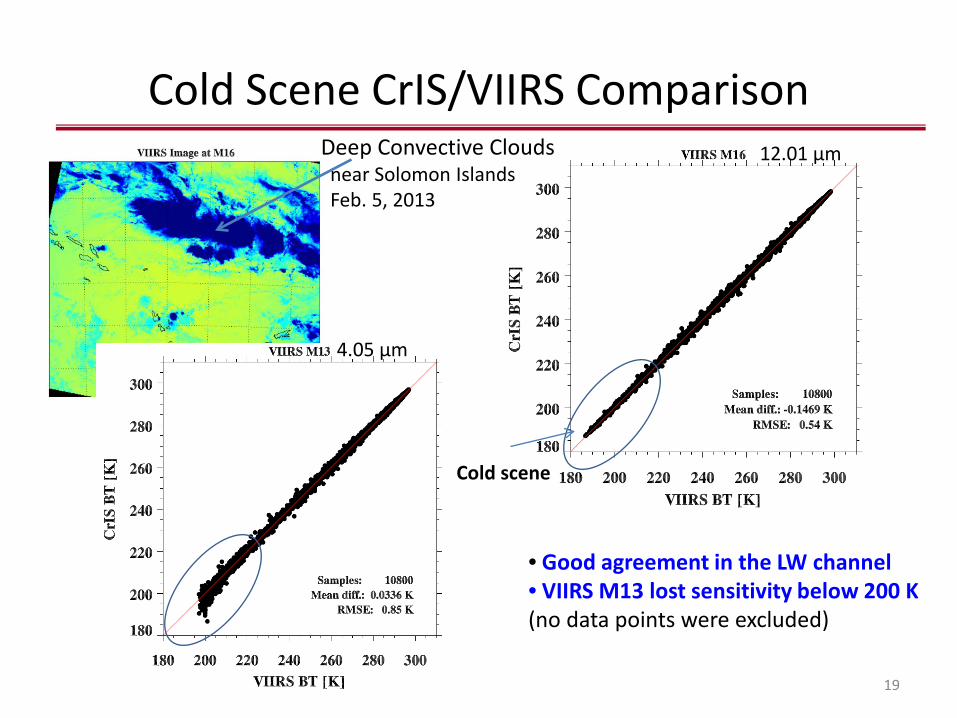
Cold Scene CrIS/VIIRS Comparison
19
• Good agreement in the LW channel • VIIRS M13 lost sensitivity below 200 K (no data points were excluded)
4.05 μm
12.01 μm Deep Convective Clouds near Solomon Islands Feb. 5, 2013
Cold scene
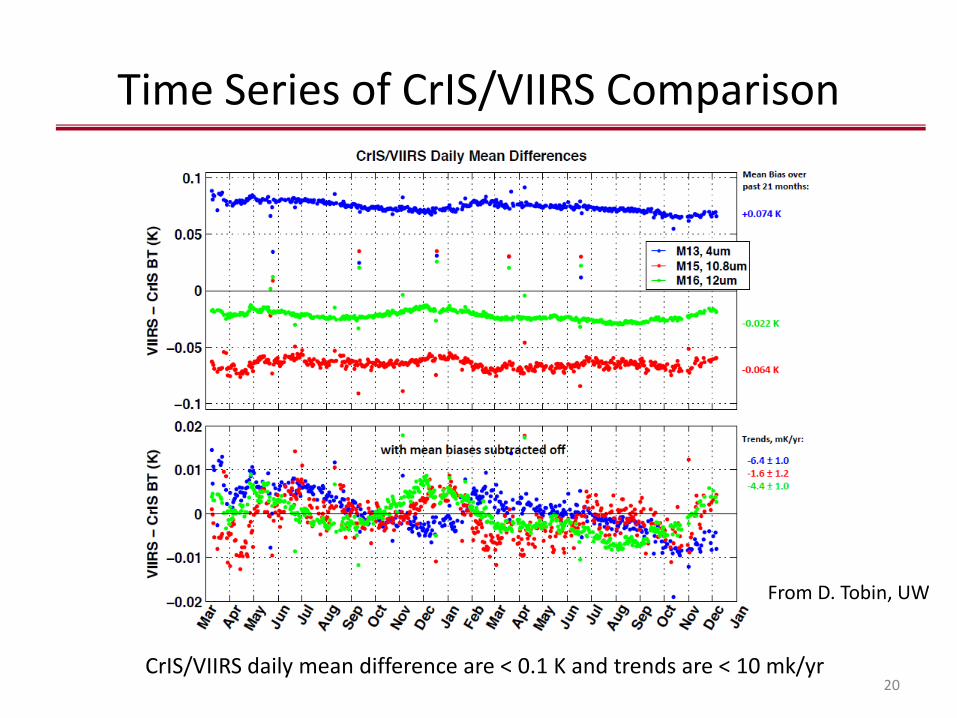
Time Series of CrIS/VIIRS Comparison
20 CrIS/VIIRS daily mean difference are < 0.1 K and trends are < 10 mk/yr
From D. Tobin, UW
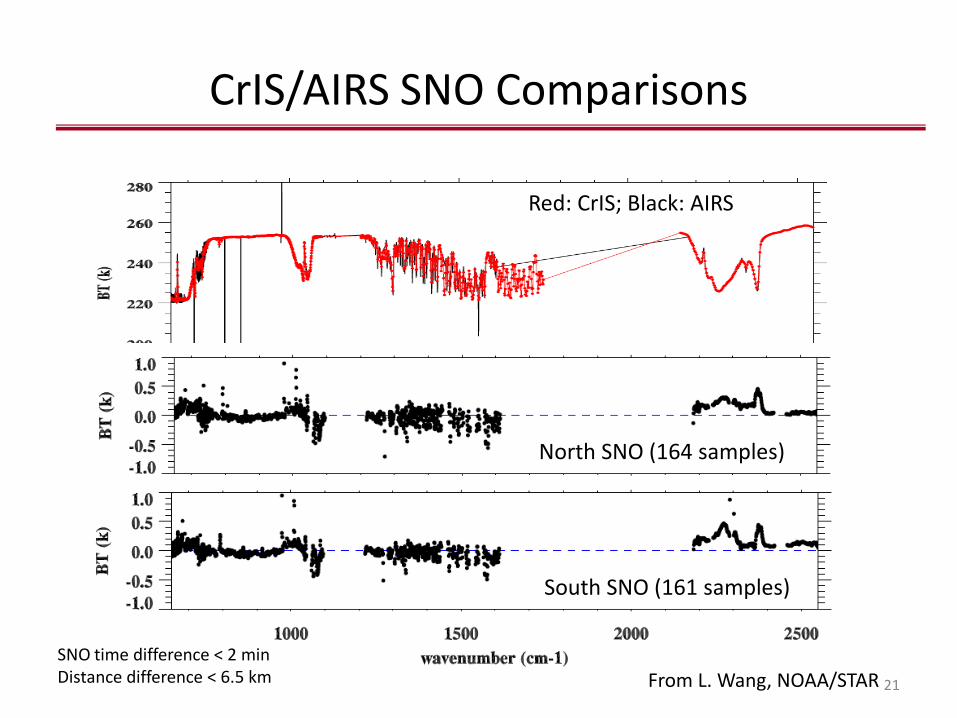
CrIS/AIRS SNO Comparisons
21
North SNO (164 samples)
South SNO (161 samples)
Red: CrIS; Black: AIRS
From L. Wang, NOAA/STAR SNO time difference < 2 min Distance difference < 6.5 km
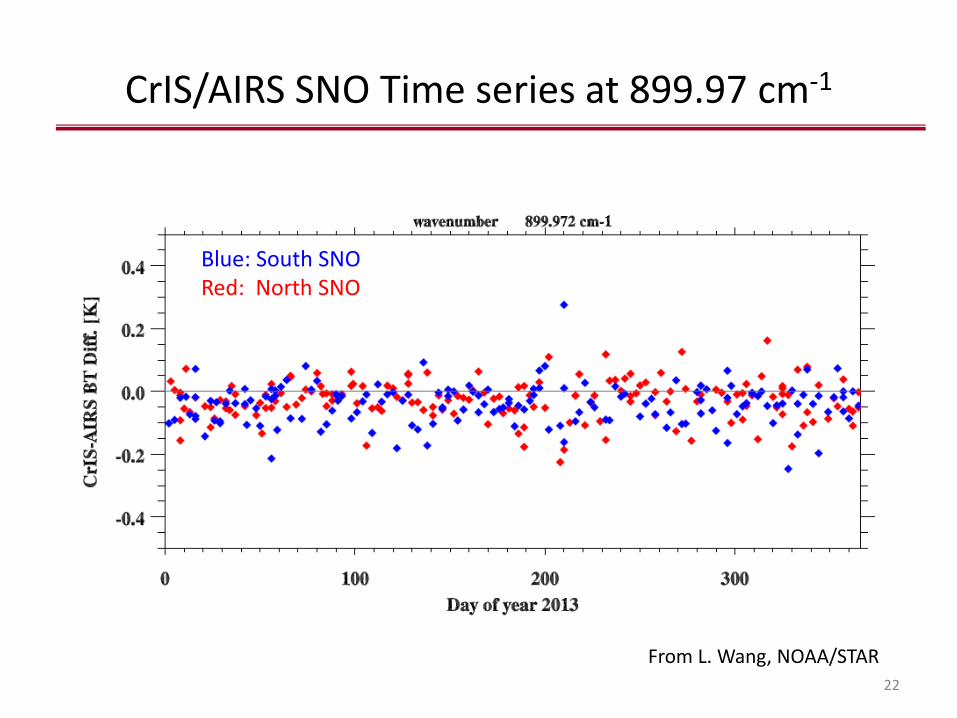
CrIS/AIRS SNO Time series at 899.97 cm-1
22
Blue: South SNO Red: North SNO
From L. Wang, NOAA/STAR
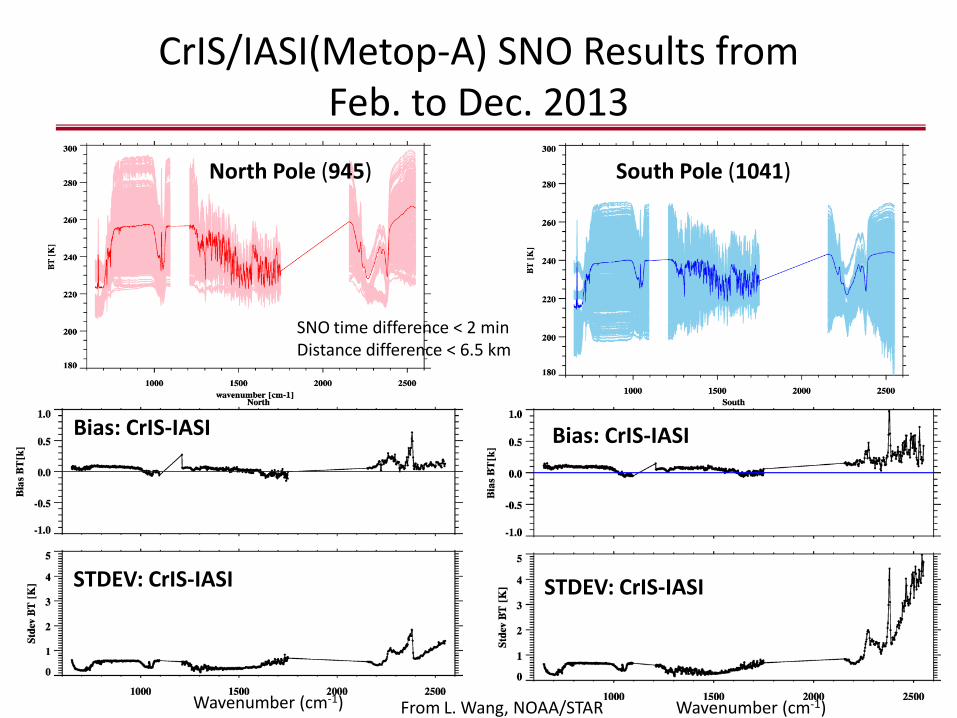
CrIS/IASI(Metop-A) SNO Results from Feb. to Dec. 2013
23
North Pole
South Pole (1041) North Pole (945)
Bias: CrIS-IASI
STDEV: CrIS-IASI
Bias: CrIS-IASI
STDEV: CrIS-IASI
Wavenumber (cm-1) Wavenumber (cm-1) From L. Wang, NOAA/STAR
SNO time difference < 2 min Distance difference < 6.5 km
24
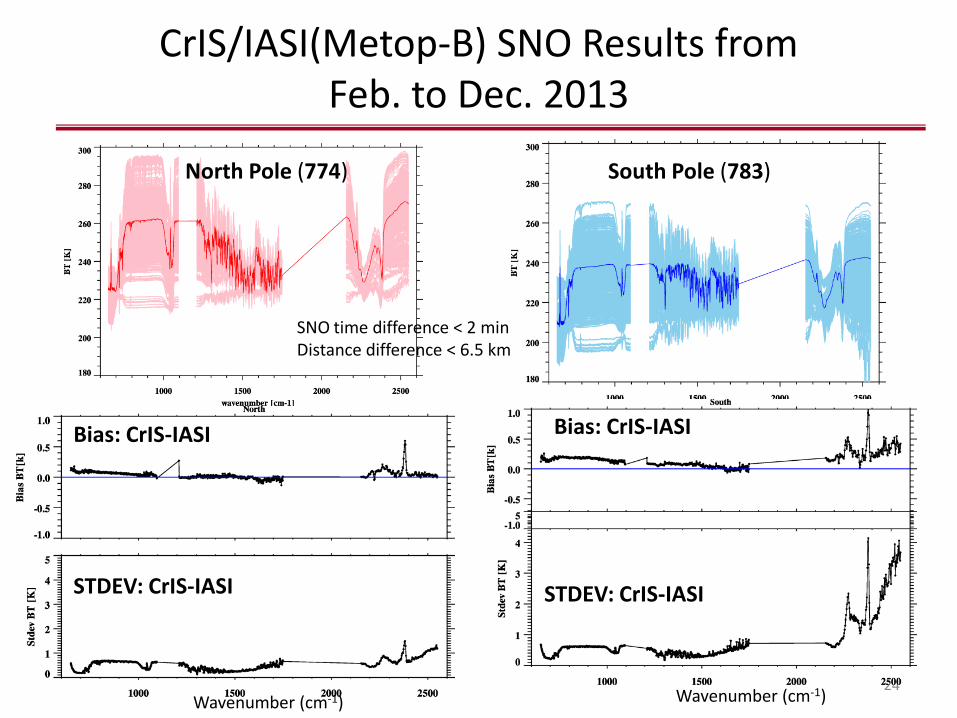
South Pole (783) North Pole (774)
Bias: CrIS-IASI
STDEV: CrIS-IASI
Bias: CrIS-IASI
STDEV: CrIS-IASI
CrIS/IASI(Metop-B) SNO Results from Feb. to Dec. 2013
Wavenumber (cm-1) Wavenumber (cm-1)
SNO time difference < 2 min Distance difference < 6.5 km
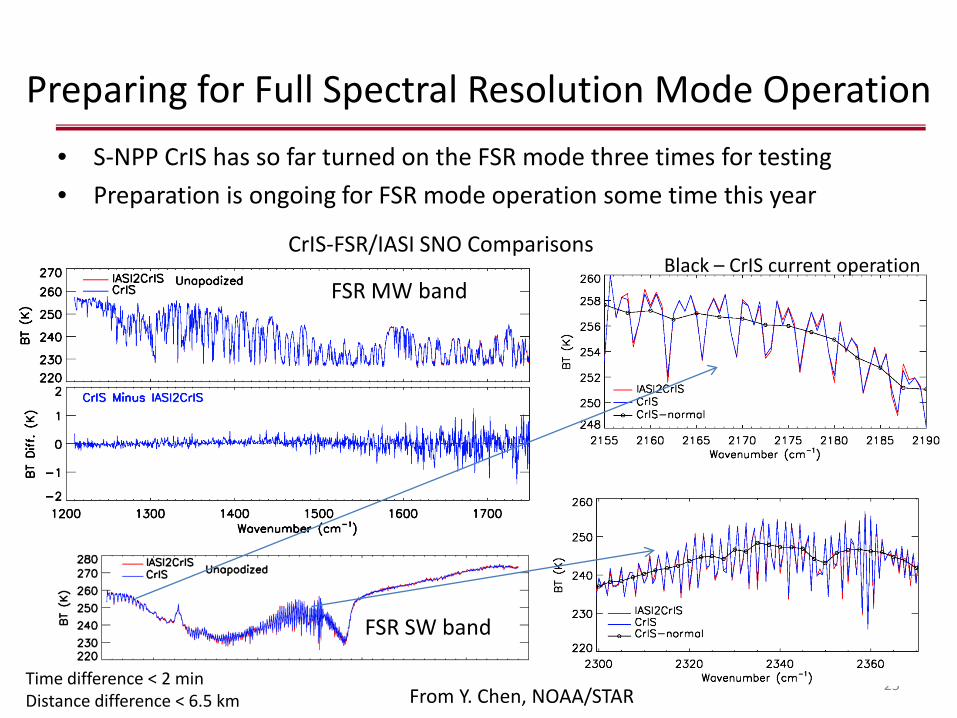
Preparing for Full Spectral Resolution Mode Operation • S-NPP CrIS has so far turned on the FSR mode three times for testing • Preparation is ongoing for FSR mode operation some time this year
25
FSR MW band
FSR SW band
CrIS-FSR/IASI SNO Comparisons Black – CrIS current operation
From Y. Chen, NOAA/STAR Time difference < 2 min Distance difference < 6.5 km
References (JGR Special Issue)
• Han, Y., et al. (2013), Suomi NPP CrIS measurements, sensor data record algorithm, calibration and validation activities, and record data quality, J. Geophys. Res. Atmos., 118, doi:10.1002/2013JD020344
• Tobin, D., et al. (2013), Suomi-NPP CrIS radiometric calibration uncertainty, J. Geophys. Res. Atmos., 118, 10,589–10,600, doi:10.1002/jgrd.50809
• Strow, L. L., H. Motteler, D. Tobin, H. Revercomb, S. Hannon, H. Buijs, J. Predina, L. Suwinski, and R. Glumb (2013), Spectral calibration and validation of the Cross‒track Infrared Sounder (CrIS) on the Suomi NPP satellite, J. Geophys. Res. Atmos., 118, doi:10.1002/2013JD020480.
• Zavyalov, V., M. Esplin, D. Scott, B. Esplin, G. Bingham, E. Hoffman, C. Lietzke, J. Predina, R. Frain, L. Suwinski, Y. Han, C. Major, B. Graham, L. Phillips (2013), Noise performance of the CrIS instrument, J. Geophys. Res., doi: 10.1002/2013JD020457
• Wang, L., D. A. Tremblay, Y. Han, M. Esplin, D. E. Hagan, J. Predina, L. Suwinski, X. Jin, and Y. Chen (2013), Geolocation assessment for CrIS sensor data records, J. Geophys. Res. Atmos., 118, doi:10.1002/2013JD020376.
26
Summary
• The CrIS instrument has been working very well and stable since the beginning of the NPP mission
• CrIS SDR product has been validated, which meets the requirements with large margin
• Instrument performance and SDR calibration/validation are well characterized and documented
• The differences between CrIS and IASI/AIRS/VIIRS are in general within 0.1-0.2 K
27

Backup Slides
28
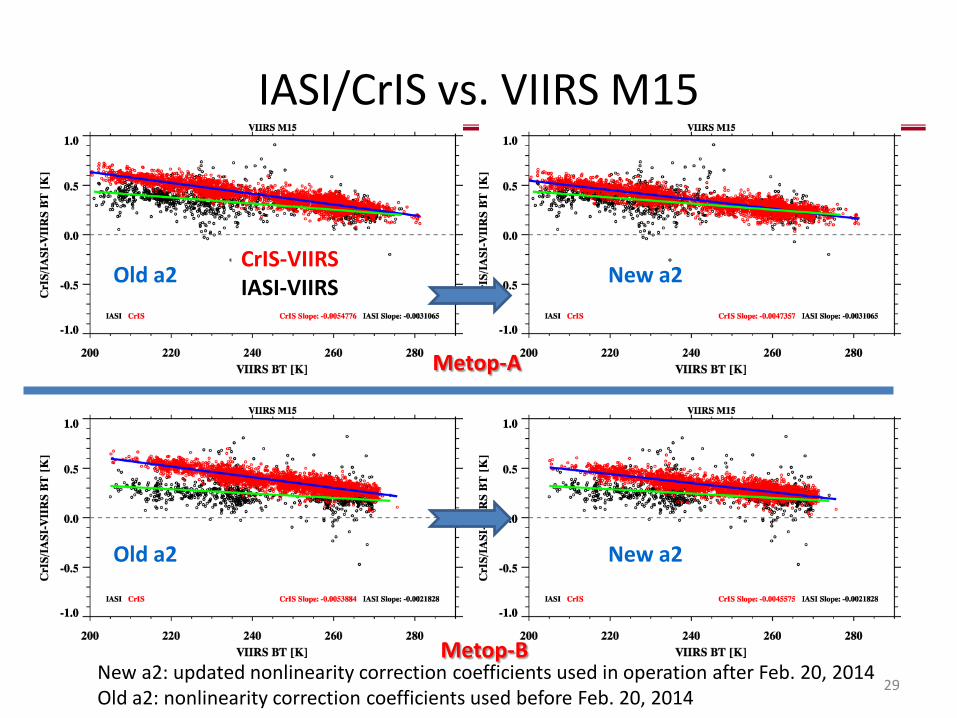
IASI/CrIS vs. VIIRS M15
29
New a2
New a2
Metop-A
Metop-B
Old a2
Old a2
CrIS-VIIRS IASI-VIIRS
New a2: updated nonlinearity correction coefficients used in operation after Feb. 20, 2014 Old a2: nonlinearity correction coefficients used before Feb. 20, 2014
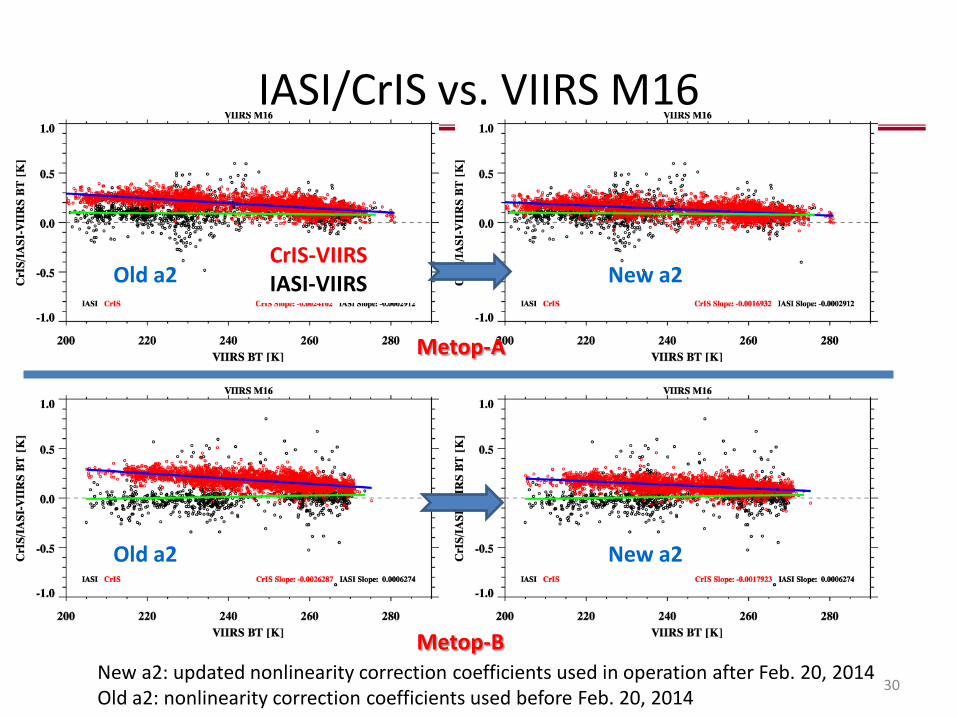
IASI/CrIS vs. VIIRS M16
30
New a2
New a2
Metop-A
Metop-B
Old a2
Old a2
CrIS-VIIRS IASI-VIIRS
New a2: updated nonlinearity correction coefficients used in operation after Feb. 20, 2014 Old a2: nonlinearity correction coefficients used before Feb. 20, 2014
Related Documents