Local government National report December 2005 Scores and analysis of performance in single tier and county councils 2005 CPA – The Harder Test

Welcome message from author
This document is posted to help you gain knowledge. Please leave a comment to let me know what you think about it! Share it to your friends and learn new things together.
Transcript
Local government
National report
December 2005
Scores and analysis of performance in single tier andcounty councils 2005
CPA – The Harder Test

The Audit Commission is an independent body responsible forensuring that public money is spent economically, efficiently andeffectively, to achieve high quality local services for the public. Ourremit covers around 11,000 bodies in England, which betweenthem spend more than £180 billion of public money each year. Ourwork covers local government, health, housing, community safetyand fire and rescue services.
As an independent watchdog, we provide important information onthe quality of public services. As a driving force for improvement inthose services, we provide practical recommendations and spreadbest practice. As an independent auditor, we ensure that publicservices are good value for money and that public money isproperly spent.
For further information about the Audit Commission, visit ourwebsite at www.audit-commission.gov.uk
For additional copies of Audit Commission reports please contact:Audit Commission Publications, PO Box 99, Wetherby LS23 75A Tel: 0800 502030

1 Key messages 2
2 Background to CPA 3
3 CPA scores for 2005 6Direction of travel assessments 6CPA star categories 11Supporting improvement 15
4 Use of resources 16
5 Service assessments 21
6 Corporate assessments 25
7 Planned changes for 2006 27
8 Table of scores and categories 28
© Audit Commission 2005
First published in December 2005 by the Audit Commission forlocal authorities and the National Health Service in England, 1stFloor, Millbank Tower, Millbank, London SW1P 4HQ
CPA – The Harder Test | Contents 1
1Key messages
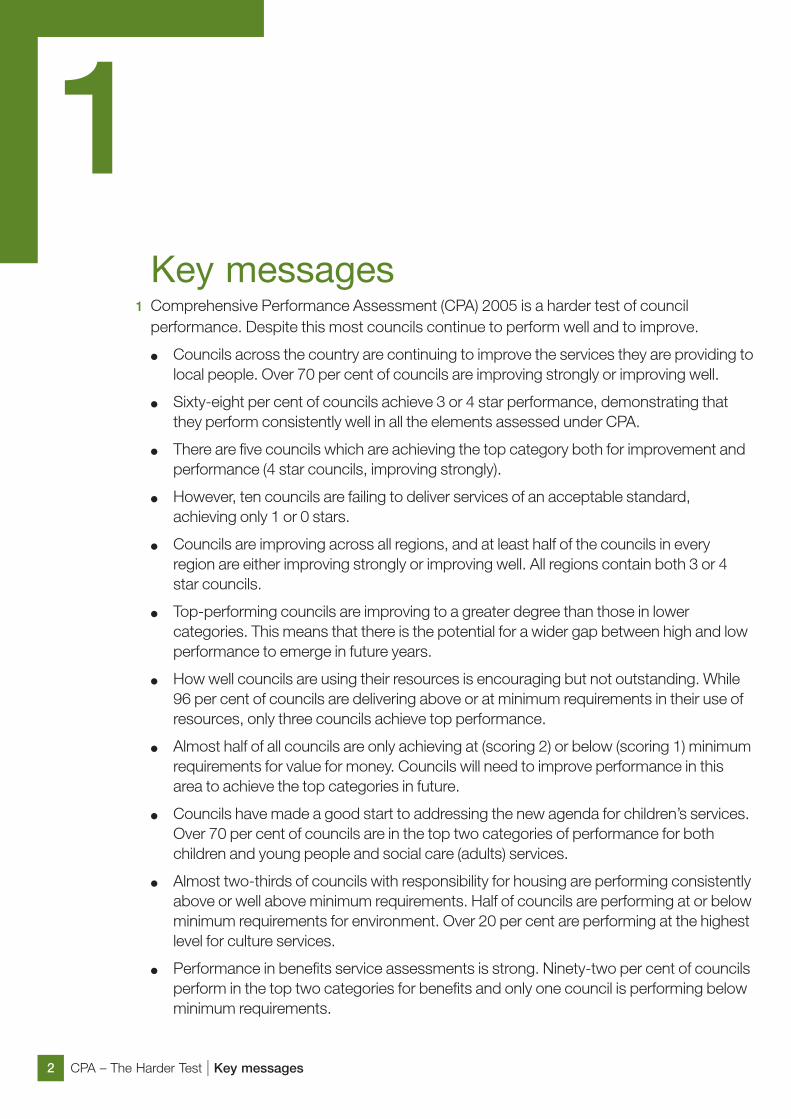
1 Comprehensive Performance Assessment (CPA) 2005 is a harder test of councilperformance. Despite this most councils continue to perform well and to improve.
● Councils across the country are continuing to improve the services they are providing tolocal people. Over 70 per cent of councils are improving strongly or improving well.
● Sixty-eight per cent of councils achieve 3 or 4 star performance, demonstrating thatthey perform consistently well in all the elements assessed under CPA.
● There are five councils which are achieving the top category both for improvement andperformance (4 star councils, improving strongly).
● However, ten councils are failing to deliver services of an acceptable standard,achieving only 1 or 0 stars.
● Councils are improving across all regions, and at least half of the councils in everyregion are either improving strongly or improving well. All regions contain both 3 or 4star councils.
● Top-performing councils are improving to a greater degree than those in lowercategories. This means that there is the potential for a wider gap between high and lowperformance to emerge in future years.
● How well councils are using their resources is encouraging but not outstanding. While96 per cent of councils are delivering above or at minimum requirements in their use ofresources, only three councils achieve top performance.
● Almost half of all councils are only achieving at (scoring 2) or below (scoring 1) minimumrequirements for value for money. Councils will need to improve performance in thisarea to achieve the top categories in future.
● Councils have made a good start to addressing the new agenda for children’s services.Over 70 per cent of councils are in the top two categories of performance for bothchildren and young people and social care (adults) services.
● Almost two-thirds of councils with responsibility for housing are performing consistentlyabove or well above minimum requirements. Half of councils are performing at or belowminimum requirements for environment. Over 20 per cent are performing at the highestlevel for culture services.
● Performance in benefits service assessments is strong. Ninety-two per cent of councilsperform in the top two categories for benefits and only one council is performing belowminimum requirements.
CPA – The Harder Test | Key messages2

2Background to CPA
2 Comprehensive Performance Assessment (CPA) is a tool for improvement, whichmeasures how well councils are delivering services for local people and communitieswhile reducing the overall regulatory burden on them.
3 Since its introduction in 2002, council services have improved significantly, and CPA isacknowledged to be one of the catalysts for this. CPA has also been a lever for reducinginspection and regulation in better performing councils and focusing support for others.CPA 2005 brings together information from other inspectorates and auditors to form anoverall view of the performance of councils.
4 The Audit Commission has introduced a new framework for CPA in single tier and countycouncils from 2005 to 2008, CPA – The Harder Test, which will further reduce theregulatory burden on councils in line with our principles of Strategic Regulation. Thisfollowed extensive consultation with local government and other key stakeholders,including several formal consultations undertaken since January 2004.
5 The framework is both a harder and a different test and the CPA categories have beenrenamed to reflect this change. The different elements of the assessment now place agreater emphasis on value for money, user focus and community leadership. The newapproach is harder, but fair. The old and new CPA categories therefore cannot be directlycompared.
6 The overall CPA framework for single tier and county councils (Figure 1, overleaf)comprises:
● Direction of travel assessments, reported by the Audit Commission.
● Annual use of resources assessments by the Audit Commission, based on the work ofits appointed auditors.
● Annual service assessments by the Audit Commission (environment, housing,culture), or provided to the Audit Commission by the Office for Standards in Education(children and young people), the Commission for Social Care Inspection (children andyoung people and adult social care) and the Benefit Fraud Inspectorate (benefits).
● Periodic corporate assessments of a council’s capacity to improve by the AuditCommission.
CPA – The Harder Test | Background to CPA 3
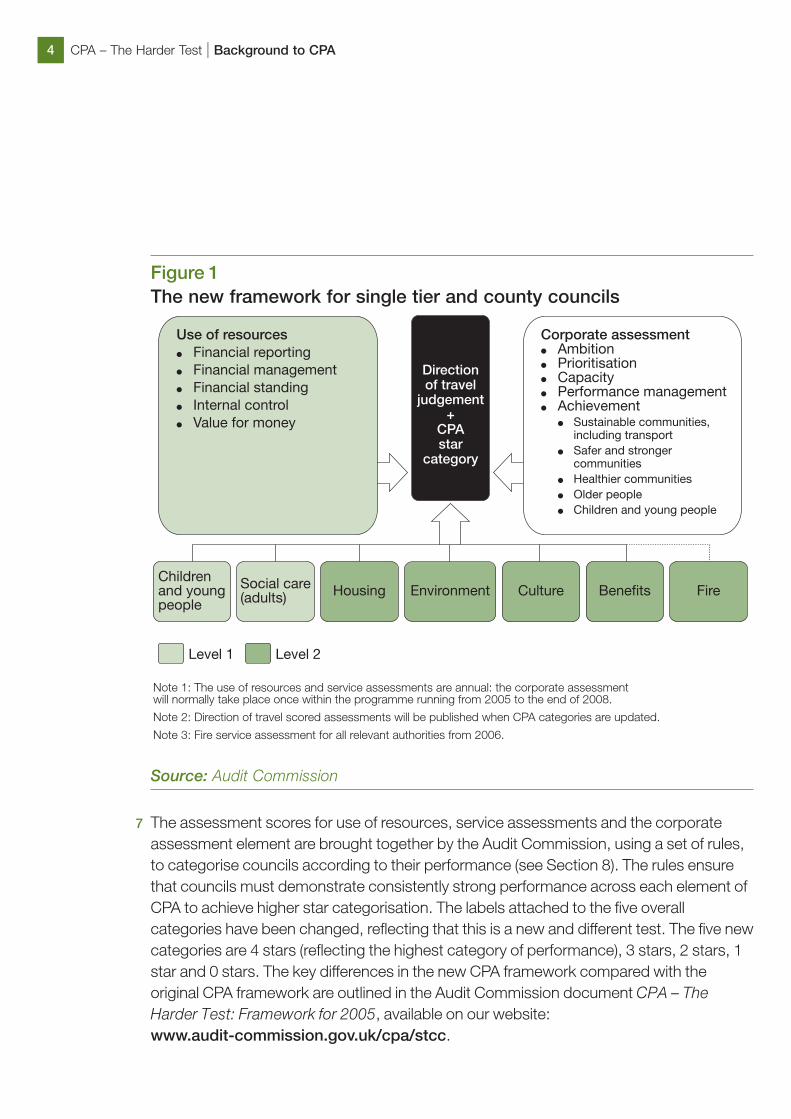
Figure 1The new framework for single tier and county councils
Source: Audit Commission
7 The assessment scores for use of resources, service assessments and the corporateassessment element are brought together by the Audit Commission, using a set of rules,to categorise councils according to their performance (see Section 8). The rules ensurethat councils must demonstrate consistently strong performance across each element ofCPA to achieve higher star categorisation. The labels attached to the five overallcategories have been changed, reflecting that this is a new and different test. The five newcategories are 4 stars (reflecting the highest category of performance), 3 stars, 2 stars, 1star and 0 stars. The key differences in the new CPA framework compared with theoriginal CPA framework are outlined in the Audit Commission document CPA – TheHarder Test: Framework for 2005, available on our website:www.audit-commission.gov.uk/cpa/stcc.
CPA – The Harder Test | Background to CPA4
8 For the first time a direction of travel assessment has been made, which makes ajudgement about how well councils are complying with the duty to make arrangements tosecure continuous improvement.
9 The individual CPA scores for all single tier and county councils in 2005 are detailed in thisdocument. It also provides analysis of progress being made towards achievingimprovement and current performance.
CPA – The Harder Test | Background to CPA 5
3CPA scores for 2005
10 The new CPA framework formally categorises both whether or not a council is improvingand how well it is performing overall.
11 Full details of each council’s direction of travel, CPA category and score for each elementof the assessment for 2005 are provided in the table at the back of this document. Somedirection of travel assessments and CPA star categories are currently subject to reviewand this is indicated in the table where appropriate. As a result, the analysis of scores isnot based upon a complete view of performance in all 150 councils. The Commission willpublish CPA scores for councils on the website following conclusion of individual reviewsand will update this analysis at the first quarterly update.
Direction of travel assessments12 Direction of travel assessments use clear labels that indicate the progress being made, or
otherwise, to achieve improvement. The four labels are:
● improving strongly;
● improving well;
● improving adequately; and
● not improving adequately (or not improving).
13 Improvement is widespread and most councils across the country are continuing toimprove the services they are providing to local people. Over 70 per cent of councils areimproving strongly or improving well. There are 8 councils improving strongly, 98improving well, 33 improving adequately and 2 not improving adequately (9 subject toreview). Councils improving strongly are also performing well overall. Five of the eightauthorities that are improving strongly are 4 star authorities and the other three arecategorised as 3 star.
CPA – The Harder Test | CPA scores for 20056

Figure 2Direction of travelOver 70 per cent of single tier and county councils are improving strongly or
improving well in 2005.
Source: Audit Commission
14 An initial analysis of direction of travel assessments for councils that are improvingstrongly identifies some common characteristics. A strong track record of improvementand ensuring that capacity is in place to deliver on plans helps to deliver sustainable andcontinuous improvement. Good progress following investment where weaknesses areidentified and in addressing local priorities also contributes to strong improvement.Effective partnership working to achieve community outcomes and a strong focus ondelivering value for money are also prevalent.
15 Direction of travel assessments for nine councils are currently subject to review whichinclude three 3 star councils, one 2 star council, one 1 star council and four councils withstar ratings subject to review.
������������������������
��������������� ��
������
��
��� �
�
�� �
��� �
���
����
����
����
� ��
����
����
� ��
����
����
��
����
� ��
����
���
��
���
���
�� ��
CPA – The Harder Test | CPA scores for 2005 7

16 Only two councils are not improving adequately (of which none were judged to be notimproving). These are one 1 star authority (Isles of Scilly) and one 0 star authority (NorthEast Lincolnshire).
Table 1Councils improving stronglyCouncils across all categories are demonstrating improvement. However, all
councils that are improving strongly in 2005 are either 3 or 4 star councils.
Source: Audit Commission
Direction of travel by council type17 Table 2 shows direction of travel by type of council. London councils are improving best
with over 80 per cent either improving strongly or improving well. Metropolitan and countycouncil authorities also show widespread improvement while only slightly more than halfof unitary authorities are improving well. County councils have the largest number ofcouncils that are improving strongly.
Councils improving strongly Star category
Derbyshire 4 stars
Kensington and Chelsea 4 stars
Kent 4 stars
Shropshire 4 stars
Wandsworth 4 stars
East Riding of Yorkshire 3 stars
Rotherham 3 stars
Wiltshire 3 stars
CPA – The Harder Test | CPA scores for 20058

Table 2Direction of travel by council type
Source: Audit Commission
Direction of travel by government region18 Table 3 (overleaf) shows the direction of travel by government office region. Councils
across all regions demonstrate improvement, and at least half of the councils in everyregion are either improving strongly or improving well. London and the North East containthe most councils that are either improving strongly or improving well. However, the NorthEast, East of England and the North West regions contain no councils that are improvingstrongly.
CPA – The Harder Test | CPA scores for 2005 9
Number ofcouncils
Improvingstrongly
Improvingwell
Improvingadequately
Not improvingadequately
Subjecttoreview
County 34 4 21 6 0 3
London 33 2 26 3 0 2
Metropolitan 36 1 26 7 0 2
Unitary 47 1 25 17 2 2
Total 150 8 98 33 2 9

Table 3Direction of travel by government region
Source: Audit Commission
Case study 1Improvement at the highest levels
Rotherham Metropolitan Borough Council – Improving stronglyRotherham Metropolitan Borough Council has delivered significant improvements toservices for the public in line with its priorities. The Council is working effectively inpartnership with other agencies to support local communities and businesses andhas achieved Beacon Status for supporting new businesses. Educational attainmenthas improved significantly from its low base and targeted support has led to greaterrates of improvement in previously underperforming primary schools. Social careservices have an improved star rating reflecting the positive impact of newdevelopments such as the new carers’ strategy on the support provided particularly toolder carers. Tenants have experienced substantial improvements in the housing
CPA – The Harder Test | CPA scores for 200510
Numberofcouncils
Improvingstrongly
Improvingwell
Improvingadequately
Not improvingadequately
Subjecttoreview
East Midlands 9 1 5 3 0 0
East of England 10 0 7 3 0 0
London 33 2 26 3 0 2
North East 12 0 11 0 0 1
North West 22 0 15 5 0 2
South East 19 1 12 6 0 0
South West 16 1 8 5 1 1
West Midlands 14 1 8 3 0 2
Yorks and Humber 15 2 6 5 1 1
Total 150 8 98 33 2 9
management service and the Neighbourhood Warden Service has contributed toreducing the number of domestic burglaries, robberies and thefts involving motorvehicles. Rotherham Streetpride received national recognition for its innovativeapproach to tackling environmental issues in response to the local needs andpriorities and the Council’s Benefits Service has again been rated as excellent.
The Council achieves good value for money and has reviewed the way it works toimprove this further. Good progress has been made to improve financial reporting andcorporate governance. The Council has developed major strategic partnerships whichare improving access to services for customers and citizens and achieving financialsavings. The Council is realistic about the challenges that it faces. In particular, it istaking action to improve culture and leisure provision. Robust plans for serviceimprovement are well monitored and services are performing well in relation to theperformance management and planning framework.
Source: Audit Commission
CPA star categories19 CPA has changed and is now a more stringent test with more emphasis on outcomes for
local people and value for money. We have strengthened our methodologies forassessing user focus and include, within corporate assessments, an explicit judgementon this. Because the framework is both a harder and a different test the CPA categorieshave been renamed to reflect this change.
20 Councils are performing well. Two-thirds of councils achieve 3 or 4 star performance. Thisdemonstrates strong performance in all elements of CPA. Almost 50 per cent of councilsscore 3 stars. Almost 25 per cent of councils are performing at the highest level (4 star)while less than 10 per cent of councils are categorised as 0 stars or 1 star councils.
CPA – The Harder Test | CPA scores for 2005 11
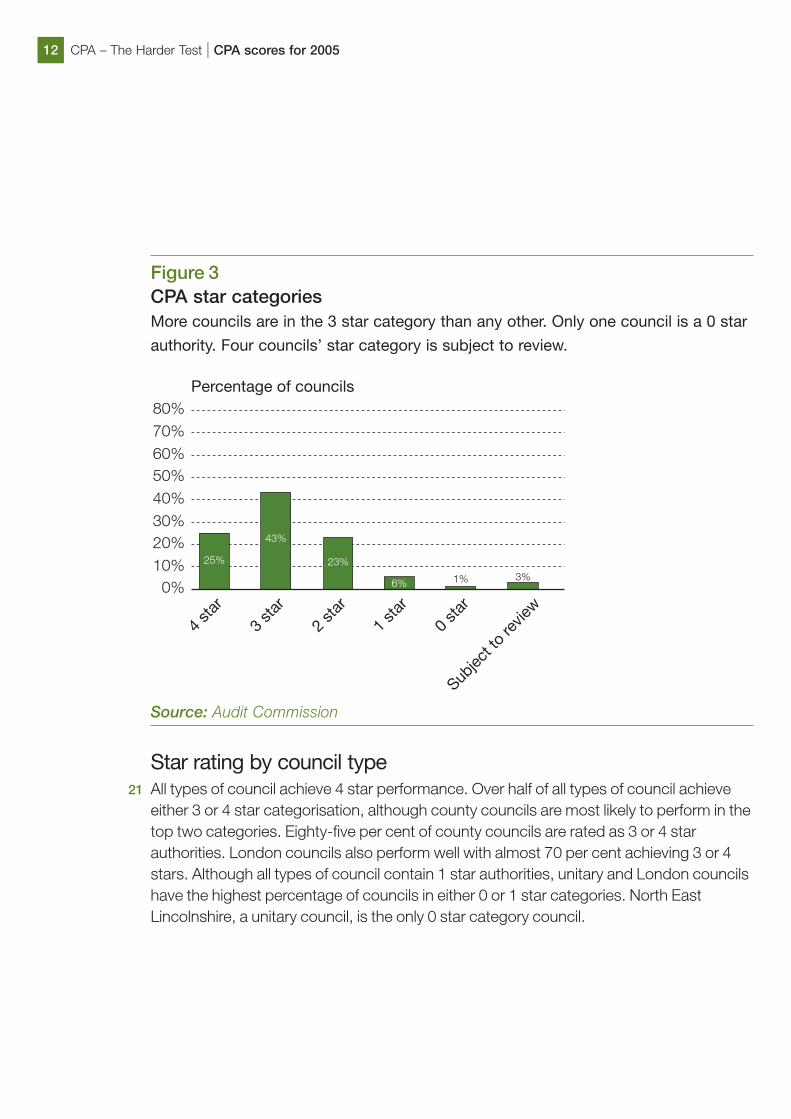
Figure 3CPA star categoriesMore councils are in the 3 star category than any other. Only one council is a 0 star
authority. Four councils’ star category is subject to review.
Source: Audit Commission
Star rating by council type21 All types of council achieve 4 star performance. Over half of all types of council achieve
either 3 or 4 star categorisation, although county councils are most likely to perform in thetop two categories. Eighty-five per cent of county councils are rated as 3 or 4 starauthorities. London councils also perform well with almost 70 per cent achieving 3 or 4stars. Although all types of council contain 1 star authorities, unitary and London councilshave the highest percentage of councils in either 0 or 1 star categories. North EastLincolnshire, a unitary council, is the only 0 star category council.
CPA – The Harder Test | CPA scores for 200512
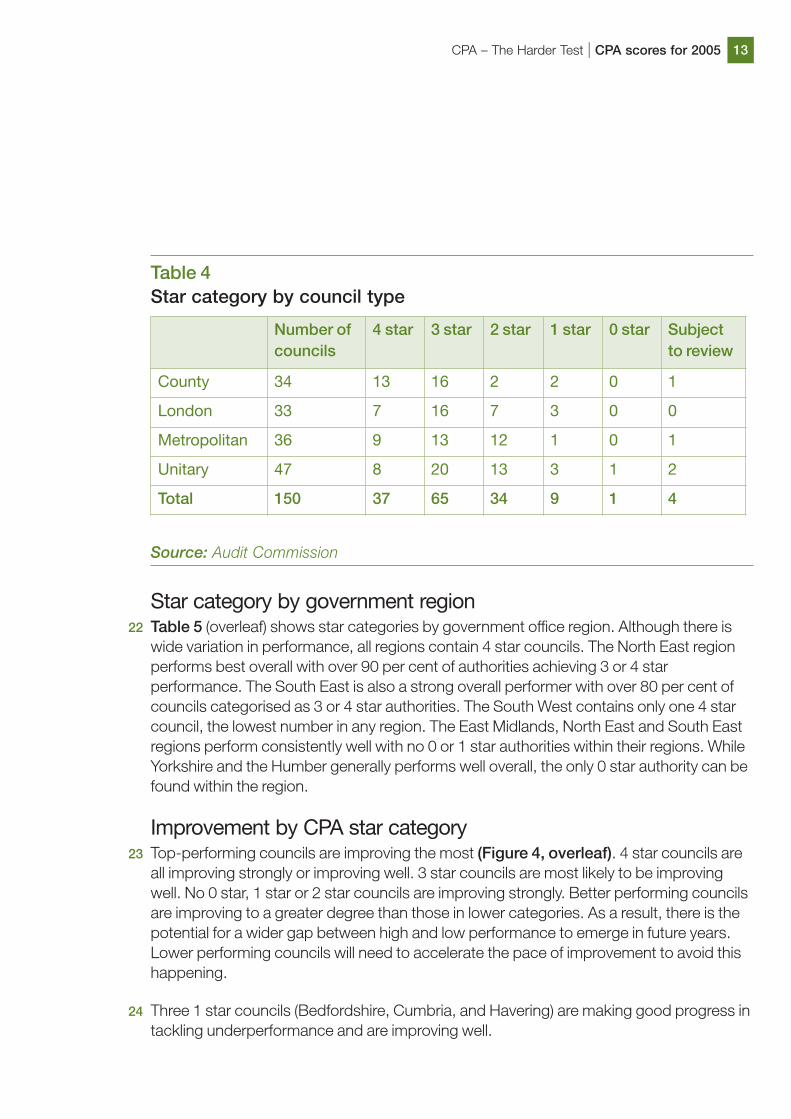
Table 4Star category by council type
Source: Audit Commission
Star category by government region22 Table 5 (overleaf) shows star categories by government office region. Although there is
wide variation in performance, all regions contain 4 star councils. The North East regionperforms best overall with over 90 per cent of authorities achieving 3 or 4 starperformance. The South East is also a strong overall performer with over 80 per cent ofcouncils categorised as 3 or 4 star authorities. The South West contains only one 4 starcouncil, the lowest number in any region. The East Midlands, North East and South Eastregions perform consistently well with no 0 or 1 star authorities within their regions. WhileYorkshire and the Humber generally performs well overall, the only 0 star authority can befound within the region.
Improvement by CPA star category23 Top-performing councils are improving the most (Figure 4, overleaf). 4 star councils are
all improving strongly or improving well. 3 star councils are most likely to be improvingwell. No 0 star, 1 star or 2 star councils are improving strongly. Better performing councilsare improving to a greater degree than those in lower categories. As a result, there is thepotential for a wider gap between high and low performance to emerge in future years.Lower performing councils will need to accelerate the pace of improvement to avoid thishappening.
24 Three 1 star councils (Bedfordshire, Cumbria, and Havering) are making good progress intackling underperformance and are improving well.
Number ofcouncils
4 star 3 star 2 star 1 star 0 star Subjectto review
County 34 13 16 2 2 0 1
London 33 7 16 7 3 0 0
Metropolitan 36 9 13 12 1 0 1
Unitary 47 8 20 13 3 1 2
Total 150 37 65 34 9 1 4
CPA – The Harder Test | CPA scores for 2005 13
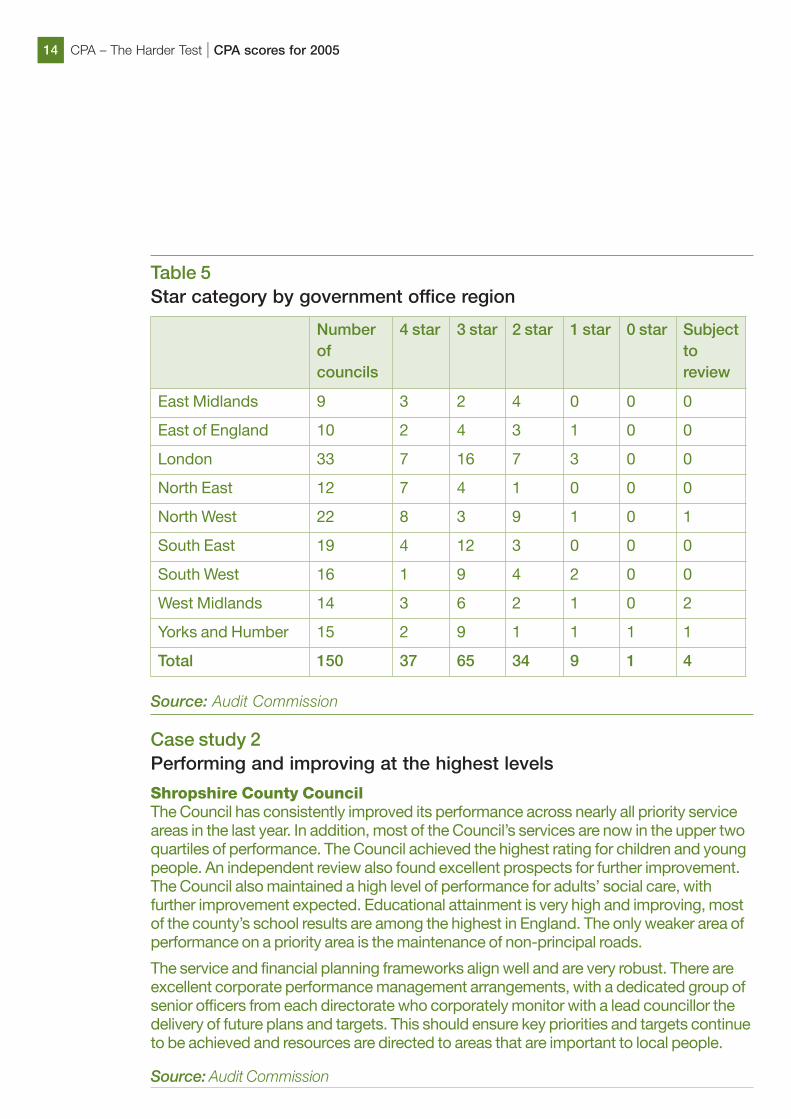
Table 5Star category by government office region
Source: Audit Commission
Case study 2Performing and improving at the highest levels
Shropshire County CouncilThe Council has consistently improved its performance across nearly all priority serviceareas in the last year. In addition, most of the Council’s services are now in the upper twoquartiles of performance. The Council achieved the highest rating for children and youngpeople. An independent review also found excellent prospects for further improvement.The Council also maintained a high level of performance for adults’ social care, withfurther improvement expected. Educational attainment is very high and improving, mostof the county’s school results are among the highest in England. The only weaker area ofperformance on a priority area is the maintenance of non-principal roads.
The service and financial planning frameworks align well and are very robust. There areexcellent corporate performance management arrangements, with a dedicated group ofsenior officers from each directorate who corporately monitor with a lead councillor thedelivery of future plans and targets. This should ensure key priorities and targets continueto be achieved and resources are directed to areas that are important to local people.
Source: Audit Commission
Numberofcouncils
4 star 3 star 2 star 1 star 0 star Subjecttoreview
East Midlands 9 3 2 4 0 0 0
East of England 10 2 4 3 1 0 0
London 33 7 16 7 3 0 0
North East 12 7 4 1 0 0 0
North West 22 8 3 9 1 0 1
South East 19 4 12 3 0 0 0
South West 16 1 9 4 2 0 0
West Midlands 14 3 6 2 1 0 2
Yorks and Humber 15 2 9 1 1 1 1
Total 150 37 65 34 9 1 4
CPA – The Harder Test | CPA scores for 200514

Figure 4Improvement by CPA star categoryTop performing councils are improving better than those in lower categories.
Note: Excludes scores subject to review.
Source: Audit Commission
25 Star ratings for four councils are currently subject to review. Direction of travel statementsfor each of these councils are also subject to review.
Supporting improvement26 The Office of the Deputy Prime Minister, the Audit Commission and the Local Government
Association have recently restated their commitment to working together in order tosupport improvement in local authorities. Both local and central government aredetermined that improvement should continue and recognise that the primaryresponsibility for delivering improvement must lie within the local government sector. Thejoint statement can be found atwww.audit-commission.gov.uk/cpa/stcc/downloads/CPA2005SupportingImprovement.pdf
CPA – The Harder Test | CPA scores for 2005 15
4Use of resources
27 A use of resources assessment is carried out annually, as part of each council’s externalaudit and covers financial reporting, financial management, financial standing, internalcontrol and value for money. The use of resources assessment focuses on financialmanagement but links to the strategic management of the authority. It looks at howfinancial management is integrated with the council’s strategy and corporatemanagement, supports its priorities and delivers value for money.
28 Overall, how councils are using their resources is encouraging but not outstanding. While96 per cent of councils are delivering at or above minimum requirements in their use ofresources, only three councils (City of London, East Riding of Yorkshire and Wandsworth)achieve top performance. Over half of councils are performing well and deliveringconsistently above minimum requirements. County councils and London councilsperform strongly in their use of resources with over 60 per cent performing above or wellabove minimum requirements. Unitary councils perform least well with almost 60 per centof councils in the bottom two categories (scoring 1 or 2).
29 Councils show the best overall performance in their financial standing, assessing how wella council manages its spending within available resources, with almost 60 per centachieving a score of 3 or 4 (Figure 6, overleaf) and the highest number of councils in thetop category. Internal control, how well a council manages its risks and has effectivearrangements to ensure proper use of public funds, is the area where councils mostconsistently underperform. Over 60 per cent of councils’ internal control scores are onlyat or below minimum requirements. Twice as many councils perform below minimumrequirements for financial reporting than for any other theme within use of resources (16per cent scoring 1). London councils are most likely to perform in the bottom twocategories for financial reporting, followed by unitary councils.
CPA – The Harder Test | Use of resources16

Figure 5Use of resourcesThree councils are performing below minimum requirements for use of resources.
Only three are delivering well above minimum requirements.
Source: Audit Commission
CPA – The Harder Test | Use of resources 17

Figure 6Use of resources – theme scoresStrongest performance is shown in financial standing while over 60 per cent of
councils are delivering internal control only at or below minimum requirements
(scoring 2 or 1).
Source: Audit Commission
30 We have introduced an explicit value for money judgement as part of the use of resourcesassessment for 2005, focusing on whether councils currently achieve value for money,and how they manage and improve value for money. Almost half of all councils areachieving at or below minimum requirements for value for money (scoring 1 or 2)(Figure 7), and only three councils achieve well above minimum requirements (scoring 4).Over 70 per cent of county councils are achieving above or well above minimumrequirements in their delivery of value for money, compared to only 45 per cent of unitarycouncils.
CPA – The Harder Test | Use of resources18
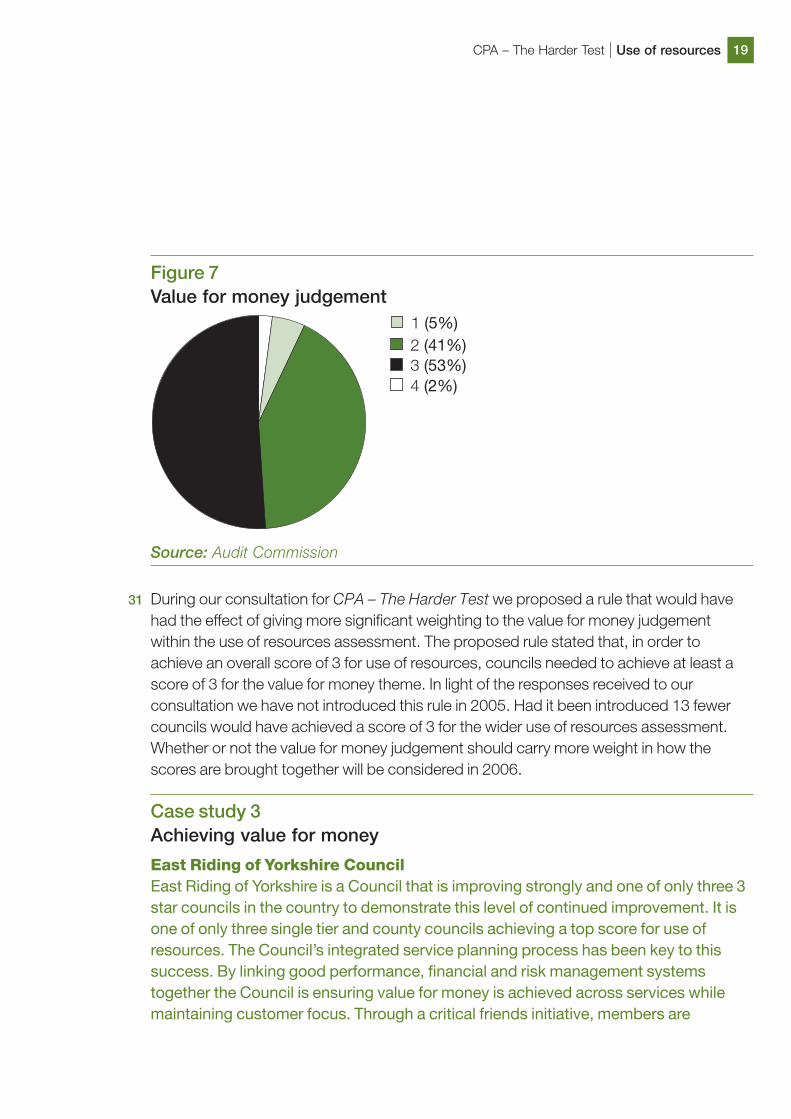
Figure 7Value for money judgement
Source: Audit Commission
31 During our consultation for CPA – The Harder Test we proposed a rule that would havehad the effect of giving more significant weighting to the value for money judgementwithin the use of resources assessment. The proposed rule stated that, in order toachieve an overall score of 3 for use of resources, councils needed to achieve at least ascore of 3 for the value for money theme. In light of the responses received to ourconsultation we have not introduced this rule in 2005. Had it been introduced 13 fewercouncils would have achieved a score of 3 for the wider use of resources assessment.Whether or not the value for money judgement should carry more weight in how thescores are brought together will be considered in 2006.
Case study 3Achieving value for money
East Riding of Yorkshire CouncilEast Riding of Yorkshire is a Council that is improving strongly and one of only three 3star councils in the country to demonstrate this level of continued improvement. It isone of only three single tier and county councils achieving a top score for use ofresources. The Council’s integrated service planning process has been key to thissuccess. By linking good performance, financial and risk management systemstogether the Council is ensuring value for money is achieved across services whilemaintaining customer focus. Through a critical friends initiative, members are
CPA – The Harder Test | Use of resources 19
appointed to each service area to ensure the focus remains on performancemonitoring and achievement, regularly meeting with service officers.
The Council has a clear focus on value for money and is using technology to driveimprovement and increase value for money. While having some of the lowest costservices in the country the Council continues to maintain high levels of performance.Working together, departments continually monitor priorities and procedures toanticipate change and improve services. There is a clear commitment to staff trainingand setting and achieving challenging targets.
Effective financial systems are embedded and used successfully throughout theauthority supporting early closedown of the accounts to a high quality. Strongfinancial management supports the Council to seek new ways to use its resourcesmore effectively. It has recently commenced a public private partnership (PPP) todeliver a range of services including revenues, information technology and customerservice centres. The PPP aims to deliver top 10 per cent service levels in already top-performing services and improve them elsewhere. It is also pursuing inwardinvestment of 600 new jobs over four years, a regional business centre and furtheremployment opportunities through a joint venture company.
Source: Audit Commission
CPA – The Harder Test | Use of resources20

5Service assessments
32 This section describes performance in six service areas: children and young people,social care (adults), housing, environment, culture and benefits. The Office for Standardsin Education (OFSTED) and the Commission for Social Care Inspection (CSCI) makejudgements in relation to children and young people, based either on an annualperformance assessment or, in relevant years, a Joint Area Review (JAR). Judgements inrelation to social care for adults and benefits are provided by CSCI and the Benefit FraudInspectorate (BFI) respectively. Councils are assessed on the relevant services andcomponents of those services depending on their council type.
33 Children and young people and social care (adults) services, along with use of resources,are level 1 assessments and carry greater weight in determining the overall score withinthe current framework. Figure 8 (overleaf) shows scores for each service assessmenttheme.
34 The combined assessment of the overall performance of services for children and youngpeople has resulted in 74 per cent of councils being rated as 3 or 4. OFSTED and CSCIacknowledge that this assessment has been made during a period of transition for localauthorities and their partnerships. Councils have made a good start to addressing thenew agenda for children’s services. Many however are only just establishing theirchildren’s services directorates and moving towards joint working procedures andpractices. The grade profile therefore reflects the current situation and the expectationsplaced on local areas at this early stage in terms of moving towards joint planning,information sharing and service delivery. Children and young people scores for four arecurrently subject to review.
35 With the further developments in children’s services coming into force next year, includingthe production of a joint Children and Young People’s Plan, councils will need todemonstrate their ability to meet new expectations and secure continuous and sustainedimprovement. Such improvement will need to be achieved within a relatively shorttimescale and before next year’s CPA assessment.
36 Councils in London, the North East, East Midlands and the South East perform strongestin providing children and young people’s services, with less than a quarter of councils inthe bottom categories. Over 90 per cent of London councils are in the top two categoriesfor children and young people while unitary authorities tend to perform worst.
CPA – The Harder Test | Service assessments 21

Figure 8Service assessment scoresStrong performance is achieved in benefits where over 90 per cent of councils are
in the top two categories of performance, and children and young people and social
care (adults) where over 70 per cent of councils score 3 or 4. Environment is the
worst performing service overall with nearly 50 per cent of councils either at only
minimum requirements (scoring 2) or below minimum requirements (scoring 1).
Source: Audit Commission
37 This is the first year that there has been a separately reported adult services score withinCPA. Although adult services have always been assessed separately the score haspreviously been a component of the overall social care score. The 2005 assessmentshows that 73 per cent of councils score 3 or 4. No councils have been assessed asscoring 1. This represents a continuing trend of improvement on previous years. Adultsocial care services are judged against a set of standards and criteria which are adjustedto reflect increasing expectations. The basis of the 2005 assessment has remainedbroadly unchanged from previous years. However, the impending Health and Social CareWhite Paper will require a new framework of assessment to be developed and agreedwith stakeholders.
CPA – The Harder Test | Service assessments22

38 Almost two-thirds of councils with responsibility for housing are performing consistentlyabove or well above minimum requirements. Ten per cent of councils are in the topcategory for housing services while only 4 per cent are performing below minimumrequirements (scoring 1). The proportion of councils performing below minimumrequirements in housing is greater than in any other service assessment area. Londoncouncils are most likely to deliver housing services that are only at or below minimumrequirements while metropolitan and unitary councils tend to perform more strongly.
39 Environment is the service area where councils tend to perform less well. Half of councilsare performing at (scoring 2) or below (scoring 1) minimum requirements. This is greaterthan any other service assessment theme. Metropolitan councils perform particularly wellin their delivery of environment services. Two-thirds of metropolitan councils and over 60per cent of county councils are performing in the top two categories compared with only30 per cent of London councils. However, the South West region performs least welloverall. Only two authorities (13 per cent) in the South West are delivering environmentservices that are above or well above minimum requirements.
40 For culture services councils have been assigned the higher of their 2004 score or a scoregenerated by the new 2005 framework. As a result two-thirds of councils register aperformance above minimum requirements. Over 20 per cent are performing at thehighest level. Two-thirds of councils in the North East are achieving the highest set ofscores in culture services. However, 60 per cent of councils in Yorkshire and the Humberand over 40 per cent in the North West and West Midlands have scores at or belowminimum requirements for culture. County councils register higher scores than othertypes of council with almost 90 per cent in the top two categories.
41 Benefits is the strongest performing service assessment theme overall. This reflectsimprovements seen by BFI during its inspections and performance figures reported bycouncils to the Department for Work and Pensions. Only 8 per cent of councils are in thebottom two categories for benefits, but the gap between the worst and best performers issignificant. More than one-third of councils achieved the highest score for their provisionof benefit services, and this figure includes almost two-thirds of councils in the North Westand 57 per cent of councils in Yorkshire and the Humber.
CPA – The Harder Test | Service assessments 23

Case study 4Improving local services
London Borough of Enfield The London Borough of Enfield is performing and improving well. It has deliveredimprovements in key services including street cleaning, community safety andrecycling, in line with Council priorities. It has a well-articulated vision which isunderpinned by priorities and has delivered effectively on some of its shared prioritiessuch as safer and stronger communities. The local ambition has been developed withkey partners and is supported by clear priorities. It is owned and understood byofficers, councillors and partners. There is a strong focus on cross-cutting issues suchas safer communities.
Although performance management needs to be further improved overall, customersatisfaction is increasing and effective partnership working is enabling the Council toaddress issues that matter to local people such as anti-social behaviour and healthpromotion. Successful outcomes in the reduction of anti-social behaviour are alsoevident. Crime overall has fallen and reduced waiting times for drug treatment havebeen achieved. Well-established health partnerships are delivering outcomes such asthe overall improvement in the health of children and services are performing well. TheCouncil is working well with partners to safeguard vulnerable children and youngchildren.
Although some services are showing less improvement, notably housing,regeneration and older people, Enfield is clear about what it wants to achieve andkeeps its focus well. Based on the Council’s current plans and by addressing capacityand performance management issues, it will be well placed to improve further theservices delivered to local people.
Source: Audit Commission
CPA – The Harder Test | Service assessments24

6Corporate assessments
42 From 2005, CPA – The Harder Test has strengthened the methodology for corporateassessments. They now test more fully how well councils understand their localcommunities and provide community leadership, how this understanding of local peopleand places translates into councils’ ambitions and priorities, and what, in practice,councils are achieving. Corporate assessments report, as one of their five achievementthemes, on the contribution of the council to the quality of outcomes for children andyoung people. This assessment is based on a Joint Area Review (JAR) undertaken by theCommission with other inspectorates (led by OFSTED and CSCI). Seven new-stylecorporate assessments have been reported.
43 During the corporate assessment, the Audit Commission talks to a number of partners,officers and members. We have developed a tool to help shape our work by gathering theviews of a wider range of key stakeholders. We are doing this through a confidential onlinesurvey. This aims to inform and complement the interview process, to help focus theinterviews and provide a ‘can-opener’ for issues.
User focus and diversity44 The revised corporate assessment methodology places a key emphasis on how well
councils engage with their service users and wider communities and what difference thisengagement makes in practice.
45 Against a national picture of falling customer satisfaction, the corporate assessmentscarried out this year indicate that council approaches to consultation and engagementare at different stages of maturity. At one end of the spectrum are councils with a goodunderstanding of the needs of their communities. These councils engage well withresidents and ensure that diversity, user focus and human rights considerations routinelyunderpin decisions about service delivery. For others, approaches to engagement are stilldeveloping and there is a lack of clarity about the purpose of this engagement or how itfeeds into planning and decision making.
CPA – The Harder Test | Corporate assessments 25
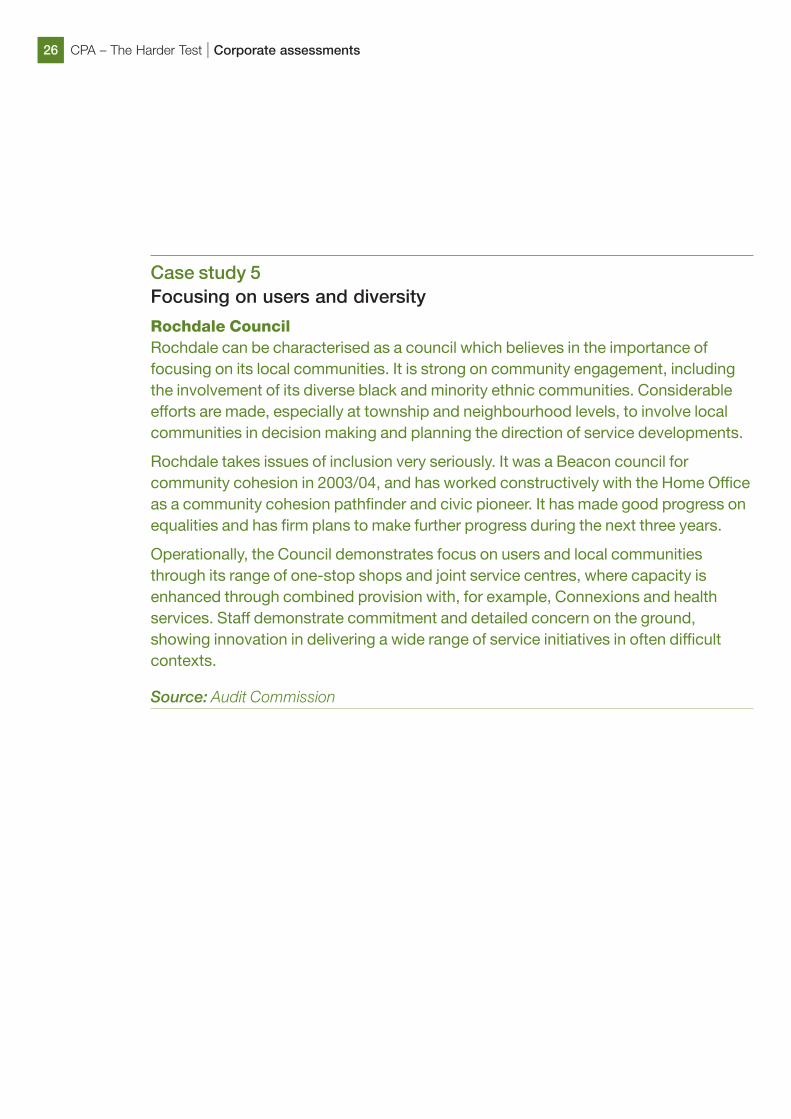
Case study 5Focusing on users and diversity
Rochdale CouncilRochdale can be characterised as a council which believes in the importance offocusing on its local communities. It is strong on community engagement, includingthe involvement of its diverse black and minority ethnic communities. Considerableefforts are made, especially at township and neighbourhood levels, to involve localcommunities in decision making and planning the direction of service developments.
Rochdale takes issues of inclusion very seriously. It was a Beacon council forcommunity cohesion in 2003/04, and has worked constructively with the Home Officeas a community cohesion pathfinder and civic pioneer. It has made good progress onequalities and has firm plans to make further progress during the next three years.
Operationally, the Council demonstrates focus on users and local communitiesthrough its range of one-stop shops and joint service centres, where capacity isenhanced through combined provision with, for example, Connexions and healthservices. Staff demonstrate commitment and detailed concern on the ground,showing innovation in delivering a wide range of service initiatives in often difficultcontexts.
Source: Audit Commission
CPA – The Harder Test | Corporate assessments26
7Planned changes for 2006
46 Following extensive consultation with the local government community and otherstakeholders, this year marks the first year of CPA – The Harder Test. However, the newframework is not static. Some changes for 2006 have already been agreed but furtherrefinements and changes will be consulted upon during 2006. This will ensure that CPAcontinues to meet the expectations of users and promote continuous and sustainedimprovement in local government. The main changes are set out below.
47 At present, categories are updated only once in December each year. This annual processwill be the main categorisation activity that we carry out. To take into account results fromcorporate assessments that are carried out during the year, and any other relevant workundertaken in the year, we will also update categories, where appropriate, quarterly ratherthan at the end of the year.
48 From 2006 we will include a fire service assessment in line with the principles of the localservices inspectorate forum (LSIF) within the overall CPA framework for the relevant 16county councils.
49 CPA is not static and to ensure that it continues to evolve there will be further changes oncewe have evaluated the learning from the first year of the new framework. The value formoney element of use of resources may get tougher with the introduction of an additionalrule not introduced this year. The Commission will also be reviewing various aspects of theservice assessments and direction of travel assessments. We will consult in the spring onchanges we intend to implement in our 2006 reporting. Other inspectorates will also bereviewing their methodologies in light of experience and further developments in their keyservice areas.
50 The Commission also plans to undertake research to examine the impact of local factors oncouncils’ performance. This work will aim to identify the nature and extent of therelationship, exploring how, or if at all, external factors impact on performance.
CPA – The Harder Test | Planned changes for 2006 27

8Table of scores and categories
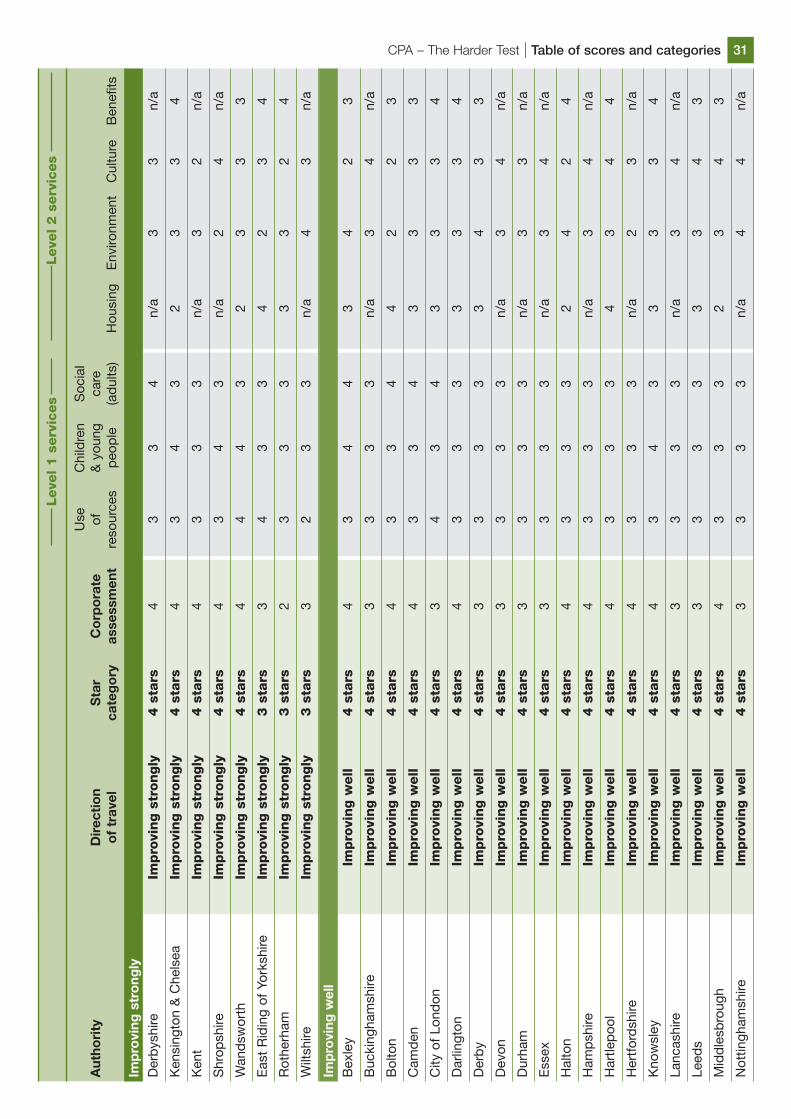
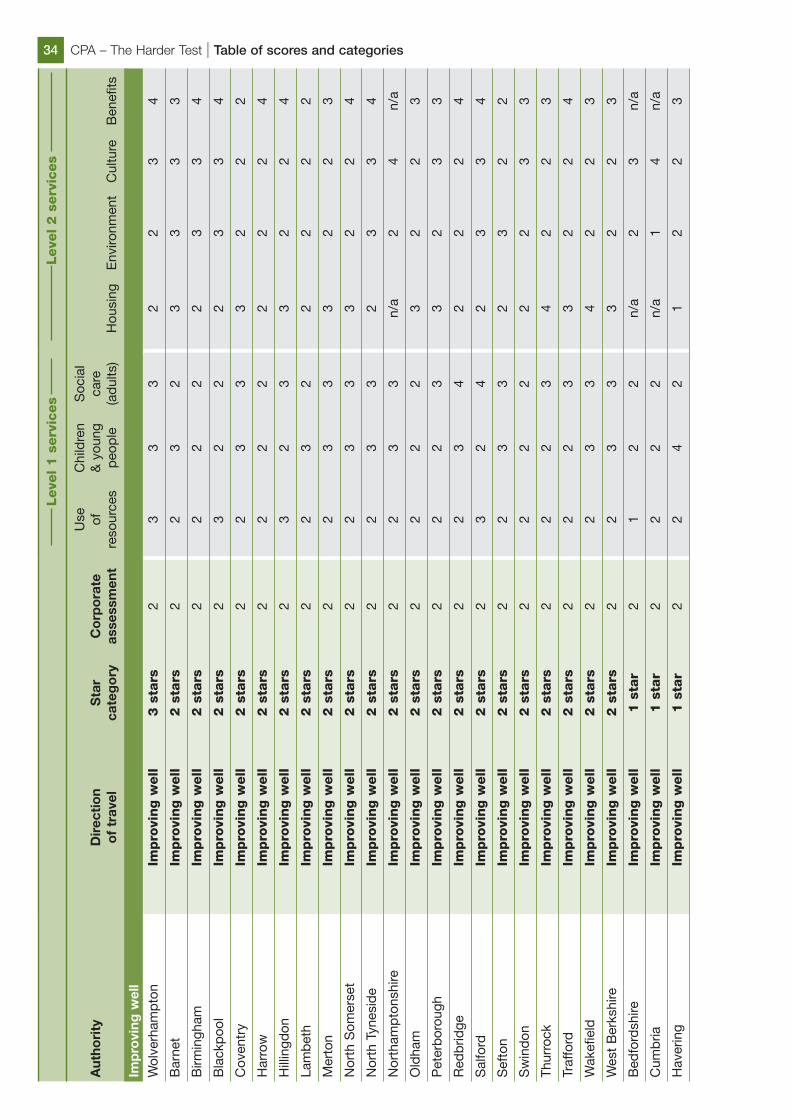
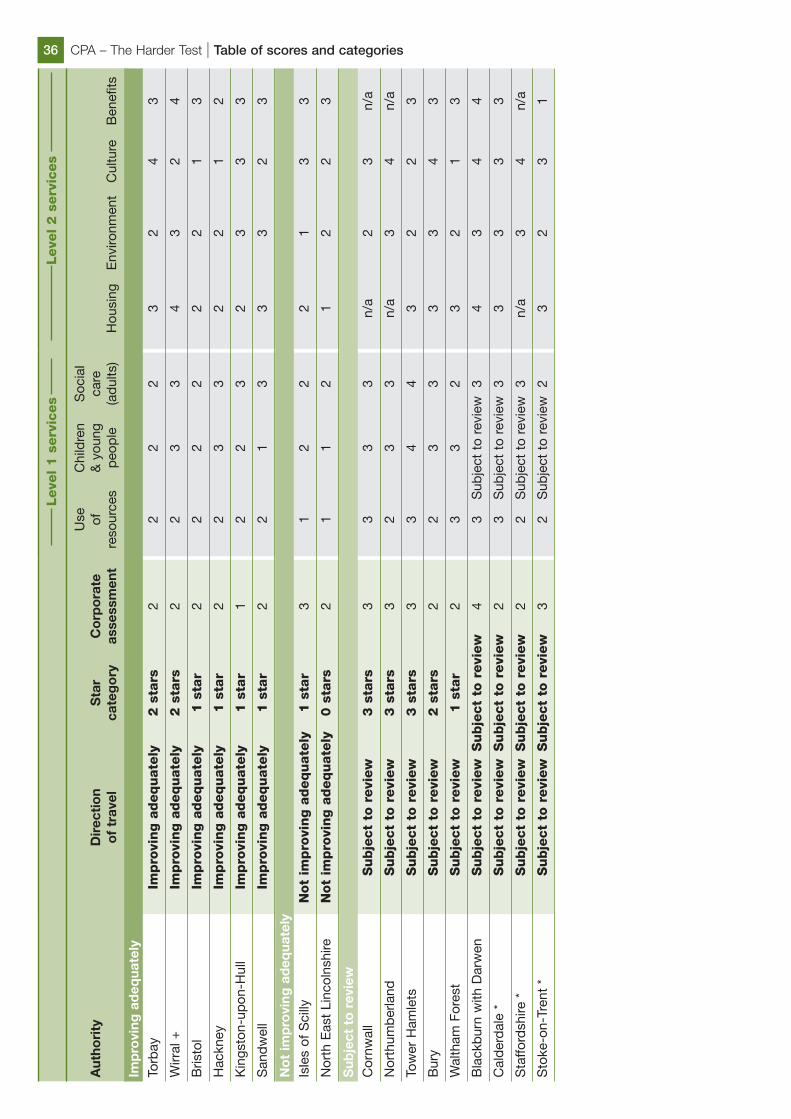
51 The table overleaf displays the direction of travel, CPA categories and scores for all singletier and county councils in England. The information is a summary of that provided oneach council’s scorecard on the CPA website: www.audit-commission.gov.uk/cpa/authorityList.asp.
52 The table groups councils together by their direction of travel (improving strongly,improving well, improving adequately, not improving adequately) and then listed by theirCPA category (4 star, 3 star, 2 star, 1 star, 0 star). All scores subject to review are situatedat the end of the table. The table also contains the individual scores for corporateassessments, use of resources, and the six service assessments.
53 Each score is on a scale from 1 to 4, where 1 is the lowest score and 4 the highest score.The scoring key for categorisation of single tier and county councils in 2005 is shown inTable 6, below. Scores for corporate assessments and level 1 services (use of resources,children and young people and adults’ social care) are given more weight than otherassessments within the 2005 framework.
Table 6
Source: Audit Commission
54 Where we have carried out a new-style corporate assessment our approach will be toreport publicly both the new-style and the previous corporate assessment scores on theauthority’s scorecard. The higher of the two scores will be used to determine the overallCPA category, until all councils have undergone the new-style corporate assessment.This will provide temporary protection for councils during the transitional period to ensurecomparability. Categorisation at the end of 2008 will be based on the score from the new-style corporate assessment.
4 well above minimum requirements – performing strongly
3 consistently above minimum requirements – performing well
2 only at minimum requirements – adequate performance
1 below minimum requirements – inadequate performance
CPA – The Harder Test | Table of scores and categories28
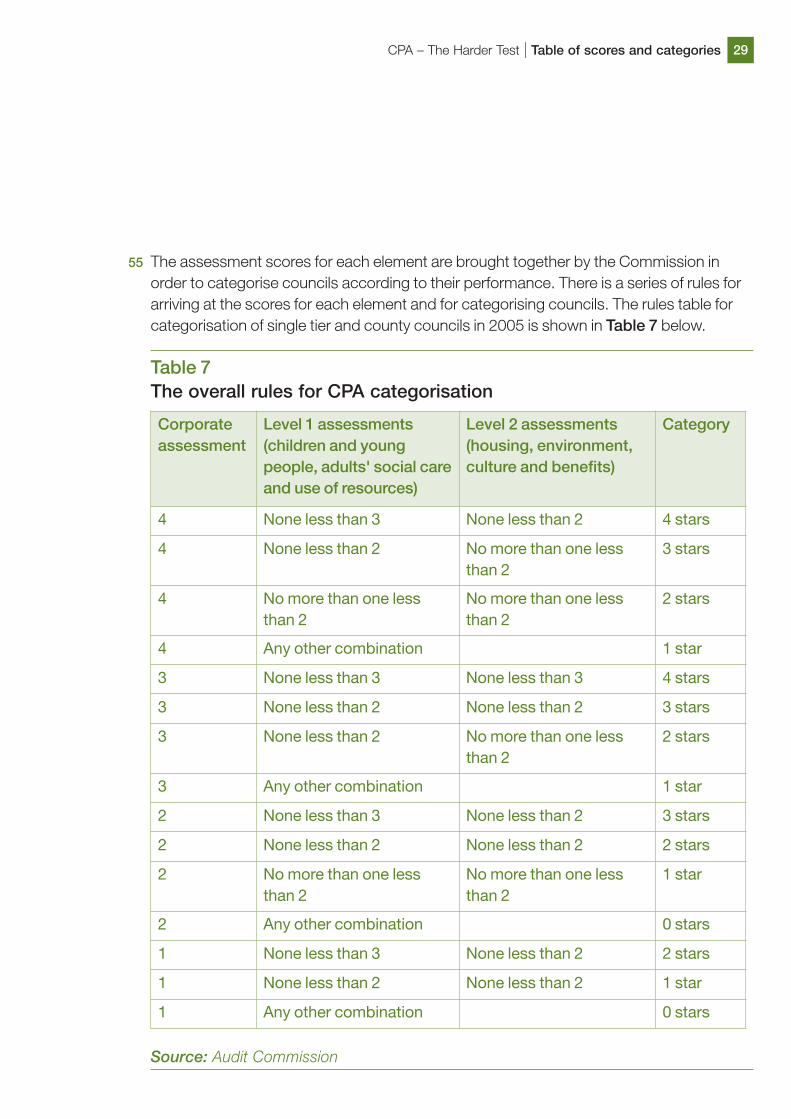
55 The assessment scores for each element are brought together by the Commission inorder to categorise councils according to their performance. There is a series of rules forarriving at the scores for each element and for categorising councils. The rules table forcategorisation of single tier and county councils in 2005 is shown in Table 7 below.
Table 7The overall rules for CPA categorisation
Source: Audit Commission
Corporateassessment
Level 1 assessments (children and youngpeople, adults' social careand use of resources)
Level 2 assessments(housing, environment,culture and benefits)
Category
4 None less than 3 None less than 2 4 stars
4 None less than 2 No more than one lessthan 2
3 stars
4 No more than one lessthan 2
No more than one lessthan 2
2 stars
4 Any other combination 1 star
3 None less than 3 None less than 3 4 stars
3 None less than 2 None less than 2 3 stars
3 None less than 2 No more than one lessthan 2
2 stars
3 Any other combination 1 star
2 None less than 3 None less than 2 3 stars
2 None less than 2 None less than 2 2 stars
2 No more than one lessthan 2
No more than one lessthan 2
1 star
2 Any other combination 0 stars
1 None less than 3 None less than 2 2 stars
1 None less than 2 None less than 2 1 star
1 Any other combination 0 stars
CPA – The Harder Test | Table of scores and categories 29

Key to table+ Councils that have received a new-style corporate assessment and the score
has been used to inform the overall CPA star category.
# Councils that have received a new-style corporate assessment and the score has been protected. In these cases the previous corporate assessment score has been used to inform the overall category.
n/a Not applicable (because that service is not provided by the council).
* Councils that have received a new-style corporate assessment and the corporate assessment score is currently subject to review. In these cases the previous corporate assessment score has been used to inform the overall category.
CPA – The Harder Test | Table of scores and categories30
CPA – The Harder Test | Table of scores and categories 31
Use
Chi
ldre
nS
ocia
lA
utho
rity
Dir
ecti
on
Sta
rC
orp
ora
teof
& y
oung
care
of
trav
elca
teg
ory
asse
ssm
ent
reso
urce
sp
eop
le(a
dul
ts)
Hou
sing
Env
ironm
ent
Cul
ture
Ben
efits
Leve
l 1 s
erv
ices
Leve
l 2 s
erv
ices
Imp
rovi
ng s
tro
ngly
Der
bys
hire
Impro
ving s
trongly
4 s
tars
43
34
n/a
33
n/a
Ken
sing
ton
& C
hels
eaIm
pro
ving s
trongly
4 s
tars
43
43
23
34
Ken
tIm
pro
ving s
trongly
4 s
tars
43
33
n/a
32
n/a
Shr
opsh
ireIm
pro
ving s
trongly
4 s
tars
43
43
n/a
24
n/a
Wan
dsw
orth
Impro
ving s
trongly
4 s
tars
44
43
23
33
Eas
t R
idin
g of
Yor
kshi
reIm
pro
ving s
trongly
3 s
tars
34
33
42
34
Rot
herh
amIm
pro
ving s
trongly
3 s
tars
23
33
33
24
Wilt
shire
Impro
ving s
trongly
3 s
tars
32
33
n/a
43
n/a
Imp
rovi
ng w
ell
Bex
ley
Impro
ving w
ell
4 s
tars
43
44
34
23
Buc
king
ham
shire
Impro
ving w
ell
4 s
tars
33
33
n/a
34
n/a
Bol
ton
Impro
ving w
ell
4 s
tars
43
34
42
23
Cam
den
Impro
ving w
ell
4 s
tars
43
34
33
33
City
of
Lond
onIm
pro
ving w
ell
4 s
tars
34
34
33
34
Dar
lingt
on
Impro
ving w
ell
4 s
tars
43
33
33
34
Der
by
Impro
ving w
ell
4 s
tars
33
33
34
33
Dev
onIm
pro
ving w
ell
4 s
tars
33
33
n/a
34
n/a
Dur
ham
Impro
ving w
ell
4 s
tars
33
33
n/a
33
n/a
Ess
exIm
pro
ving w
ell
4 s
tars
33
33
n/a
34
n/a
Hal
ton
Impro
ving w
ell
4 s
tars
43
33
24
24
Ham
psh
ireIm
pro
ving w
ell
4 s
tars
43
33
n/a
34
n/a
Har
tlep
ool
Impro
ving w
ell
4 s
tars
43
33
43
44
Her
tfor
dsh
ireIm
pro
ving w
ell
4 s
tars
43
33
n/a
23
n/a
Kno
wsl
ey
Impro
ving w
ell
4 s
tars
43
43
33
34
Lanc
ashi
reIm
pro
ving w
ell
4 s
tars
33
33
n/a
34
n/a
Leed
s Im
pro
ving w
ell
4 s
tars
33
33
33
43
Mid
dle
sbro
ugh
Impro
ving w
ell
4 s
tars
43
33
23
43
Not
tingh
amsh
ireIm
pro
ving w
ell
4 s
tars
33
33
n/a
44
n/a

CPA – The Harder Test | Table of scores and categories32
Use
Chi
ldre
nS
ocia
lA
utho
rity
Dir
ecti
on
Sta
rC
orp
ora
teof
& y
oung
care
of
trav
elca
teg
ory
asse
ssm
ent
reso
urce
sp
eop
le(a
dul
ts)
Hou
sing
Env
ironm
ent
Cul
ture
Ben
efits
Leve
l 1 s
erv
ices
Leve
l 2 s
erv
ices
Imp
rovi
ng w
ell
Red
car
& C
leve
land
Impro
ving w
ell
4 s
tars
33
33
43
43
She
ffiel
dIm
pro
ving w
ell
4 s
tars
43
33
32
34
St
Hel
ens
Impro
ving w
ell
4 s
tars
43
33
24
24
Sto
ckp
ort
Impro
ving w
ell
4 s
tars
33
33
33
34
Sto
ckto
n-on
-Tee
sIm
pro
ving w
ell
4 s
tars
43
33
34
33
Sun
der
land
Impro
ving w
ell
4 s
tars
43
33
32
44
Sur
rey
Impro
ving w
ell
4 s
tars
33
33
n/a
33
n/a
Sut
ton
Impro
ving w
ell
4 s
tars
43
33
33
43
Tam
esid
eIm
pro
ving w
ell
4 s
tars
43
33
23
34
Telfo
rd &
Wre
kin
Impro
ving w
ell
4 s
tars
43
33
33
44
Wes
tmin
ster
Impro
ving w
ell
4 s
tars
43
33
33
43
Wig
anIm
pro
ving w
ell
4 s
tars
43
33
33
33
Wor
cest
ersh
ireIm
pro
ving w
ell
4 s
tars
33
43
n/a
33
n/a
Bar
nsle
yIm
pro
ving w
ell
3 s
tars
33
34
43
24
Bra
ckne
ll Fo
rest
Impro
ving w
ell
3 s
tars
43
32
12
34
Bre
ntIm
pro
ving w
ell
3 s
tars
33
33
32
33
Brig
hton
& H
ove
Impro
ving w
ell
3 s
tars
32
33
32
23
Bro
mle
yIm
pro
ving w
ell
3 s
tars
33
33
23
43
Cam
brid
gesh
ireIm
pro
ving w
ell
3 s
tars
43
32
n/a
22
n/a
Cro
ydon
Impro
ving w
ell
3 s
tars
33
33
22
24
Dor
set
Impro
ving w
ell
3 s
tars
33
32
n/a
24
n/a
Dud
ley
Impro
ving w
ell
3 s
tars
23
33
33
24
Eas
t S
usse
xIm
pro
ving w
ell
3 s
tars
33
32
n/a
32
n/a
Enf
ield
+Im
pro
ving w
ell
3 s
tars
33
32
22
34
Gat
eshe
adIm
pro
ving w
ell
3 s
tars
42
43
33
43
Glo
uces
ters
hire
Impro
ving w
ell
3 s
tars
33
32
n/a
22
n/a
Gre
enw
ich
Impro
ving w
ell
3 s
tars
33
32
32
34

CPA – The Harder Test | Table of scores and categories 33
Use
Chi
ldre
nS
ocia
lA
utho
rity
Dir
ecti
on
Sta
rC
orp
ora
teof
& y
oung
care
of
trav
elca
teg
ory
asse
ssm
ent
reso
urce
sp
eop
le(a
dul
ts)
Hou
sing
Env
ironm
ent
Cul
ture
Ben
efits
Leve
l 1 s
erv
ices
Leve
l 2 s
erv
ices
Imp
rovi
ng w
ell
Ham
mer
smith
& F
ulha
mIm
pro
ving w
ell
3 s
tars
42
33
32
22
Har
inge
yIm
pro
ving w
ell
3 s
tars
23
33
22
33
Hou
nslo
wIm
pro
ving w
ell
3 s
tars
33
33
32
33
Islin
gton
Impro
ving w
ell
3 s
tars
32
33
32
33
Kin
gsto
n-up
on-T
ham
esIm
pro
ving w
ell
3 s
tars
33
43
32
33
Kirk
lees
Impro
ving w
ell
3 s
tars
33
34
33
24
Leic
este
rIm
pro
ving w
ell
3 s
tars
33
33
32
33
Leic
este
rshi
reIm
pro
ving w
ell
3 s
tars
33
33
n/a
23
n/a
Lew
isha
mIm
pro
ving w
ell
3 s
tars
33
33
22
34
Med
way
Impro
ving w
ell
3 s
tars
33
23
32
34
New
cast
le u
pon
Tyn
eIm
pro
ving w
ell
3 s
tars
32
24
22
43
New
ham
Impro
ving w
ell
3 s
tars
33
32
22
33
Nor
th Y
orks
hire
Impro
ving w
ell
3 s
tars
23
33
n/a
33
n/a
Poo
leIm
pro
ving w
ell
3 s
tars
32
33
32
43
Ric
hmon
d-u
pon
-Tha
mes
Impro
ving w
ell
3 s
tars
33
33
23
34
Slo
ugh
+Im
pro
ving w
ell
3 s
tars
32
33
22
33
Sol
ihul
lIm
pro
ving w
ell
3 s
tars
23
33
23
23
Som
erse
tIm
pro
ving w
ell
3 s
tars
23
34
n/a
24
n/a
Sou
th G
louc
este
rshi
reIm
pro
ving w
ell
3 s
tars
33
32
32
33
Sou
th T
ynes
ide
Impro
ving w
ell
3 s
tars
32
33
23
43
Sou
tham
pto
nIm
pro
ving w
ell
3 s
tars
32
33
33
43
Sou
thw
ark
Impro
ving w
ell
3 s
tars
33
33
32
33
Suf
folk
Impro
ving w
ell
3 s
tars
42
33
n/a
34
n/a
Wal
sall
Impro
ving w
ell
3 s
tars
33
32
33
22
War
ringt
onIm
pro
ving w
ell
3 s
tars
32
33
43
24
Win
dso
r &
Mai
den
head
Impro
ving w
ell
3 s
tars
33
33
32
33
Wok
ingh
amIm
pro
ving w
ell
3 s
tars
33
32
22
23
CPA – The Harder Test | Table of scores and categories34
Use
Chi
ldre
nS
ocia
lA
utho
rity
Dir
ecti
on
Sta
rC
orp
ora
teof
& y
oung
care
of
trav
elca
teg
ory
asse
ssm
ent
reso
urce
sp
eop
le(a
dul
ts)
Hou
sing
Env
ironm
ent
Cul
ture
Ben
efits
Leve
l 1 s
erv
ices
Leve
l 2 s
erv
ices
Imp
rovi
ng w
ell
Wol
verh
amp
ton
Impro
ving w
ell
3 s
tars
23
33
22
34
Bar
net
Impro
ving w
ell
2 s
tars
22
32
33
33
Birm
ingh
amIm
pro
ving w
ell
2 s
tars
22
22
23
34
Bla
ckp
ool
Impro
ving w
ell
2 s
tars
23
22
23
34
Cov
entr
yIm
pro
ving w
ell
2 s
tars
22
33
32
22
Har
row
Impro
ving w
ell
2 s
tars
22
22
22
24
Hill
ingd
onIm
pro
ving w
ell
2 s
tars
23
23
32
24
Lam
bet
hIm
pro
ving w
ell
2 s
tars
22
32
22
22
Mer
ton
Impro
ving w
ell
2 s
tars
22
33
32
23
Nor
th S
omer
set
Impro
ving w
ell
2 s
tars
22
33
32
24
Nor
th T
ynes
ide
Impro
ving w
ell
2 s
tars
22
33
23
34
Nor
tham
pto
nshi
reIm
pro
ving w
ell
2 s
tars
22
33
n/a
24
n/a
Old
ham
Impro
ving w
ell
2 s
tars
22
22
32
23
Pet
erb
orou
ghIm
pro
ving w
ell
2 s
tars
22
23
32
33
Red
brid
geIm
pro
ving w
ell
2 s
tars
22
34
22
24
Sal
ford
Impro
ving w
ell
2 s
tars
23
24
23
34
Sef
ton
Impro
ving w
ell
2 s
tars
22
33
23
22
Sw
ind
onIm
pro
ving w
ell
2 s
tars
22
22
22
33
Thur
rock
Impro
ving w
ell
2 s
tars
22
23
42
23
Traf
ford
Impro
ving w
ell
2 s
tars
22
23
32
24
Wak
efie
ldIm
pro
ving w
ell
2 s
tars
22
33
42
23
Wes
t B
erks
hire
Impro
ving w
ell
2 s
tars
22
33
32
23
Bed
ford
shire
Impro
ving w
ell
1 s
tar
21
22
n/a
23
n/a
Cum
bria
Impro
ving w
ell
1 s
tar
22
22
n/a
14
n/a
Hav
erin
gIm
pro
ving w
ell
1 s
tar
22
42
12
23

CPA – The Harder Test | Table of scores and categories 35
Use
Chi
ldre
nS
ocia
lA
utho
rity
Dir
ecti
on
Sta
rC
orp
ora
teof
& y
oung
care
of
trav
elca
teg
ory
asse
ssm
ent
reso
urce
sp
eop
le(a
dul
ts)
Hou
sing
Env
ironm
ent
Cul
ture
Ben
efits
Leve
l 1 s
erv
ices
Leve
l 2 s
erv
ices
Imp
rovi
ng a
deq
uate
lyB
ath
& N
E S
omer
set
Impro
ving a
dequate
ly3 s
tars
32
32
32
33
Bou
rnem
outh
+Im
pro
ving a
dequate
ly3 s
tars
23
33
32
43
Bra
dfo
rdIm
pro
ving a
dequate
ly3 s
tars
32
23
32
24
Che
shire
Impro
ving a
dequate
ly3 s
tars
32
33
n/a
34
n/a
Don
cast
erIm
pro
ving a
dequate
ly3 s
tars
32
22
22
24
Eal
ing
Impro
ving a
dequate
ly3 s
tars
32
32
22
33
Her
efor
dsh
ire #
Impro
ving a
dequate
ly3 s
tars
33
22
42
23
Luto
nIm
pro
ving a
dequate
ly3 s
tars
32
22
33
32
Man
ches
ter
Impro
ving a
dequate
ly3 s
tars
32
23
43
33
Nor
folk
Impro
ving a
dequate
ly3 s
tars
32
22
n/a
34
n/a
Nor
th L
inco
lnsh
ireIm
pro
ving a
dequate
ly3 s
tars
33
33
32
24
Oxf
ord
shire
Im
pro
ving a
dequate
ly3 s
tars
32
33
n/a
23
n/a
Por
tsm
outh
Impro
ving a
dequate
ly3 s
tars
32
33
33
32
Rea
din
gIm
pro
ving a
dequate
ly3 s
tars
32
22
23
23
War
wic
kshi
reIm
pro
ving a
dequate
ly3 s
tars
33
32
n/a
33
n/a
Wes
t S
usse
x +
Impro
ving a
dequate
ly3 s
tars
33
32
n/a
34
n/a
York
Impro
ving a
dequate
ly3 s
tars
33
43
32
23
Bar
king
& D
agen
ham
Impro
ving a
dequate
ly2 s
tars
22
23
22
33
Isle
of
Wig
htIm
pro
ving a
dequate
ly2 s
tars
22
23
33
33
Linc
olns
hire
Impro
ving a
dequate
ly2 s
tars
22
22
n/a
23
n/a
Live
rpoo
lIm
pro
ving a
dequate
ly2 s
tars
32
32
13
34
Milt
on K
eyne
sIm
pro
ving a
dequate
ly2 s
tars
22
23
23
33
Not
tingh
am
Impro
ving a
dequate
ly2 s
tars
22
22
33
34
Ply
mou
thIm
pro
ving a
dequate
ly2 s
tars
22
22
32
24
Roc
hdal
e +
Impro
ving a
dequate
ly2 s
tars
23
23
22
23
Rut
land
Impro
ving a
dequate
ly2 s
tars
22
33
33
24
Sou
then
d-o
n-se
aIm
pro
ving a
dequate
ly2 s
tars
32
22
13
44
CPA – The Harder Test | Table of scores and categories36
Use
Chi
ldre
nS
ocia
lA
utho
rity
Dir
ecti
on
Sta
rC
orp
ora
teof
& y
oung
care
of
trav
elca
teg
ory
asse
ssm
ent
reso
urce
sp
eop
le(a
dul
ts)
Hou
sing
Env
ironm
ent
Cul
ture
Ben
efits
Leve
l 1 s
erv
ices
Leve
l 2 s
erv
ices
Imp
rovi
ng a
deq
uate
lyTo
rbay
Impro
ving a
dequate
ly2 s
tars
22
22
32
43
Wirr
al +
Impro
ving a
dequate
ly2 s
tars
22
33
43
24
Bris
tol
Impro
ving a
dequate
ly1 s
tar
22
22
22
13
Hac
kney
Impro
ving a
dequate
ly1 s
tar
22
33
22
12
Kin
gsto
n-up
on-H
ull
Impro
ving a
dequate
ly1 s
tar
12
23
23
33
San
dw
ell
Impro
ving a
dequate
ly1 s
tar
22
13
33
23
No
t im
pro
ving
ad
equa
tely
Isle
s of
Sci
llyN
ot
impro
ving a
dequate
ly1 s
tar
31
22
21
33
Nor
th E
ast
Linc
olns
hire
Not
impro
ving a
dequate
ly0 s
tars
21
12
12
23
Sub
ject
to
rev
iew
Cor
nwal
lS
ubje
ct
to r
evi
ew
3 s
tars
33
33
n/a
23
n/a
Nor
thum
ber
land
Subje
ct
to r
evi
ew
3 s
tars
32
33
n/a
34
n/a
Tow
er H
amle
tsS
ubje
ct
to r
evi
ew
3 s
tars
33
44
32
23
Bur
yS
ubje
ct
to r
evi
ew
2 s
tars
22
33
33
43
Wal
tham
For
est
Subje
ct
to r
evi
ew
1 s
tar
23
32
32
13
Bla
ckb
urn
with
Dar
wen
Subje
ct
to r
evi
ew
Subje
ct
to r
evi
ew
43
Sub
ject
to
revi
ew3
43
44
Cal
der
dal
e *
Subje
ct
to r
evi
ew
Subje
ct
to r
evi
ew
23
Sub
ject
to
revi
ew3
33
33
Sta
fford
shire
*S
ubje
ct
to r
evi
ew
Subje
ct
to r
evi
ew
22
Sub
ject
to
revi
ew3
n/a
34
n/a
Sto
ke-o
n-Tr
ent
*S
ubje
ct
to r
evi
ew
Subje
ct
to r
evi
ew
32
Sub
ject
to
revi
ew2
32
31


This report is available on our website at
www.audit-commission.gov.uk. Our website contains a
searchable version of this report, as well as a text-only version
that can easily be copied into other software for wider
accessibility.
If you require a copy of this report in large print, in braille, on
tape, or in a language other than English, please call
0845 0522613.
To order additional copies of this report or other Audit
Commission publications please contact
Audit Commission Publications, PO Box 99, Wetherby,
LS23 7SA Tel 0800 502030.
Audit Commission1st Floor, Millbank Tower,Millbank, London SW1P 4HQTel: 020 7828 1212 Fax: 020 7976 6187Textphone (minicom): 020 7630 0421www.audit-commission.gov.uk
Stock code: LNR3303
Related Documents