New approach for aggregated labor productivity comparisons: accounting for structural differences. The Russian regions case Zaytsev Alexander, Deputy Head, Sector of International Economic Research, Research fellow, Ph.D., Center for Comprehensive European and International Studies (CCEIS), Higher School of Economics (HSE) Russia, Moscow alex [email protected] Klochko Olga, Associate Professor, Ph.D., Faculty of World Economy and World Politics HSE, Department of World Economy, [email protected] Sirotin Ernest 1 st year master student, Faculty of World Economy and World Politics HSE, [email protected]

Welcome message from author
This document is posted to help you gain knowledge. Please leave a comment to let me know what you think about it! Share it to your friends and learn new things together.
Transcript
New approach for aggregated labor productivity comparisons: accounting for structural differences. The Russian regions case
Zaytsev Alexander,
Deputy Head, Sector of International Economic Research, Research fellow, Ph.D.,
Center for Comprehensive European and International Studies (CCEIS), Higher School of Economics (HSE)
Russia, [email protected]
Klochko Olga,Associate Professor, Ph.D.,
Faculty of World Economy and World Politics HSE,Department of World Economy,
Sirotin Ernest 1st year master student,
Faculty of World Economy and World Politics HSE,[email protected]
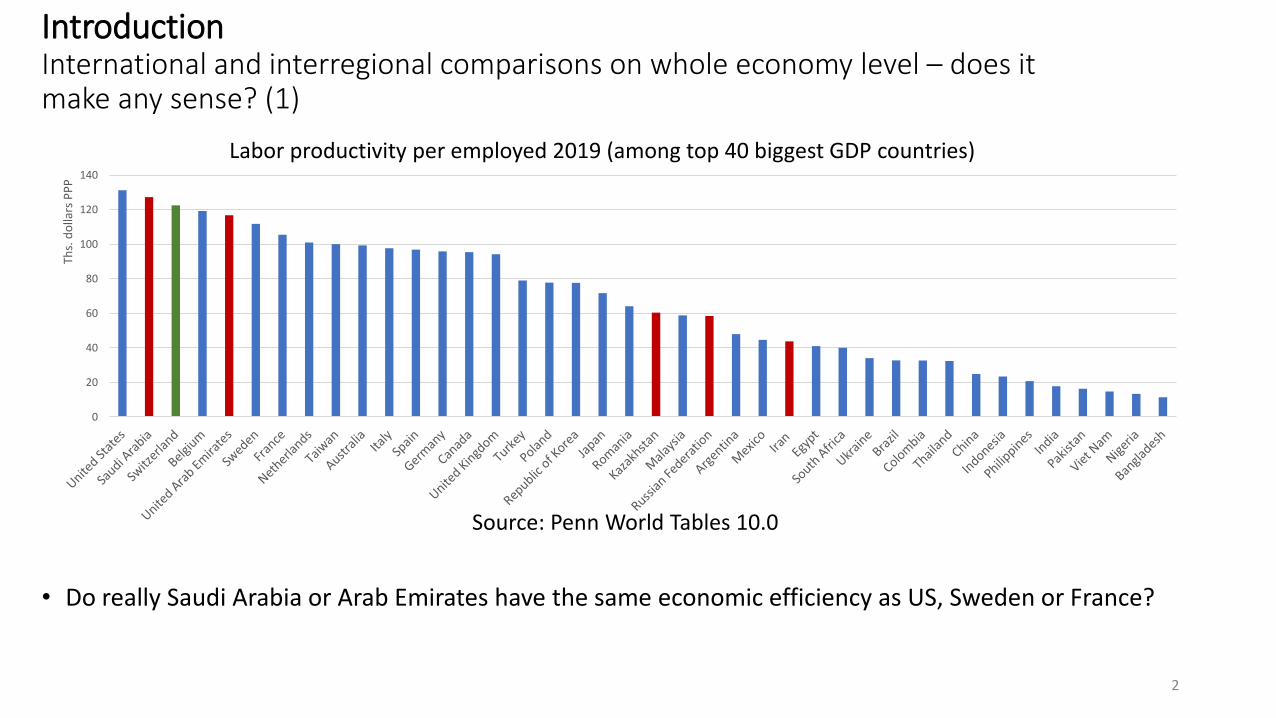
Introduction International and interregional comparisons on whole economy level – does it make any sense? (1)
• Do really Saudi Arabia or Arab Emirates have the same economic efficiency as US, Sweden or France?
2
Source: Penn World Tables 10.0
0
20
40
60
80
100
120
140
Ths.
do
llars
PP
P
Labor productivity per employed 2019 (among top 40 biggest GDP countries)
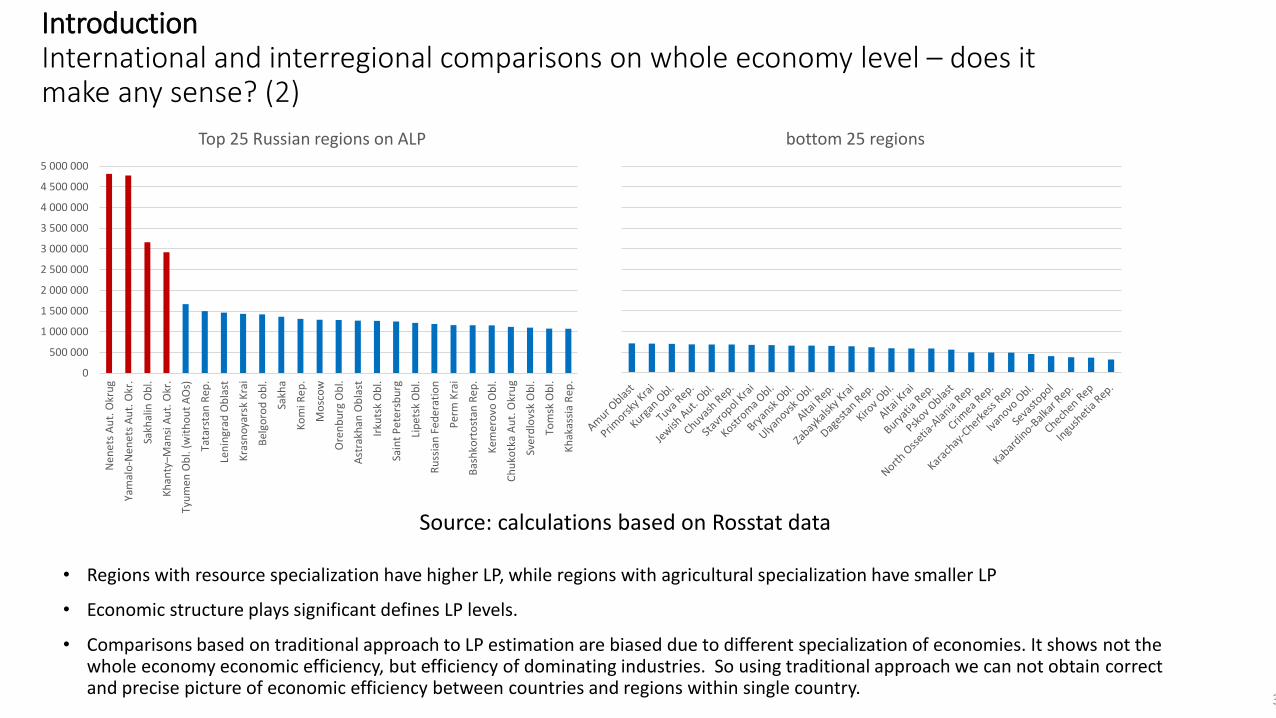
Introduction International and interregional comparisons on whole economy level – does it make any sense? (2)
• Regions with resource specialization have higher LP, while regions with agricultural specialization have smaller LP
• Economic structure plays significant defines LP levels.
• Comparisons based on traditional approach to LP estimation are biased due to different specialization of economies. It shows not the whole economy economic efficiency, but efficiency of dominating industries. So using traditional approach we can not obtain correct and precise picture of economic efficiency between countries and regions within single country.
3
Source: calculations based on Rosstat data
0
500 000
1 000 000
1 500 000
2 000 000
2 500 000
3 000 000
3 500 000
4 000 000
4 500 000
5 000 000
Ne
ne
ts A
ut.
Okr
ug
Yam
alo
-Ne
ne
ts A
ut.
Okr
.
Sakh
alin
Ob
l.
Kh
anty–M
ansi
Au
t. O
kr.
Tyu
men
Ob
l. (w
ith
ou
t A
Os)
Tata
rsta
n R
ep.
Len
ingr
ad O
bla
st
Kra
sno
yars
k K
rai
Bel
goro
d o
bl.
Sakh
a
Ko
mi R
ep
.
Mo
sco
w
Ore
nb
urg
Ob
l.
Ast
rakh
an O
bla
st
Irku
tsk
Ob
l.
Sain
t P
ete
rsb
urg
Lip
ets
k O
bl.
Ru
ssia
n F
ede
rati
on
Per
m K
rai
Bas
hko
rto
stan
Re
p.
Kem
ero
vo O
bl.
Ch
uko
tka
Au
t. O
kru
g
Sve
rdlo
vsk
Ob
l.
Tom
sk O
bl.
Kh
akas
sia
Rep
.
Top 25 Russian regions on ALP bottom 25 regions
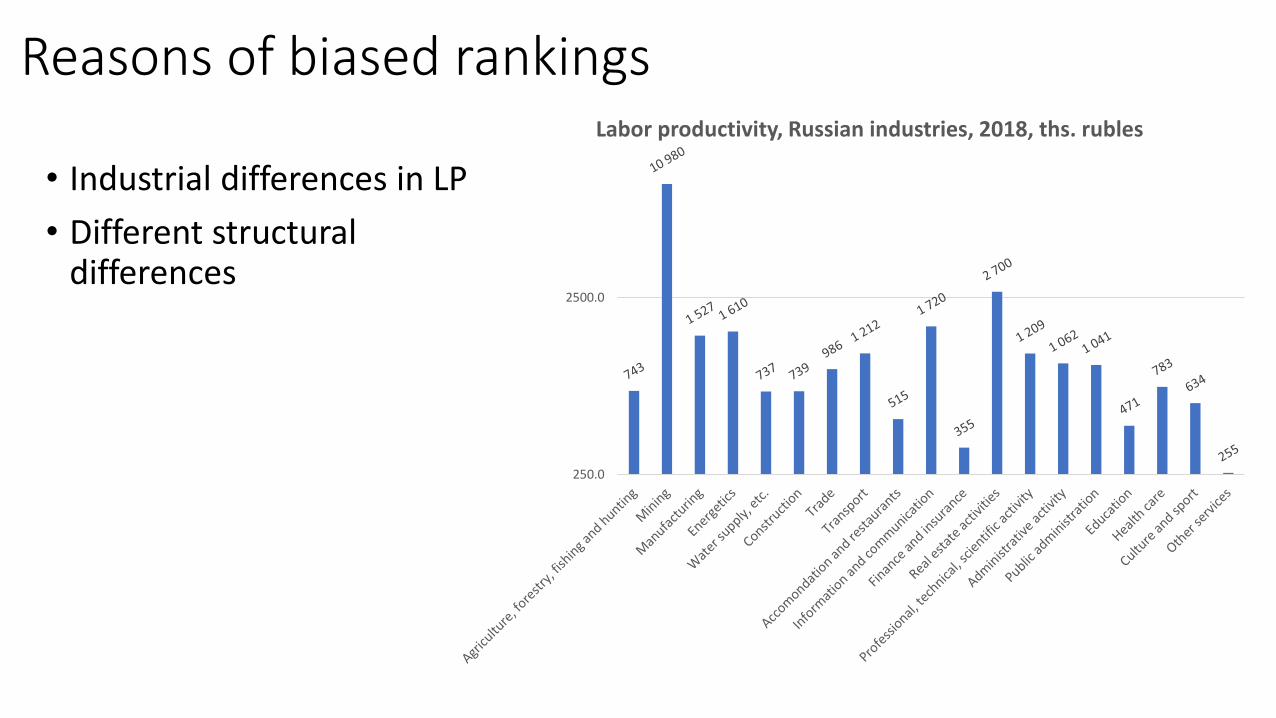
Reasons of biased rankings
• Industrial differences in LP
• Different structural differences
250.0
2500.0
Labor productivity, Russian industries, 2018, ths. rubles
Research questions
• How to deal with the bias in ALP comparisons caused by structural differences?
• How to correct our methodology of ALP estimation to take into account the structural differences between economies?
Literature
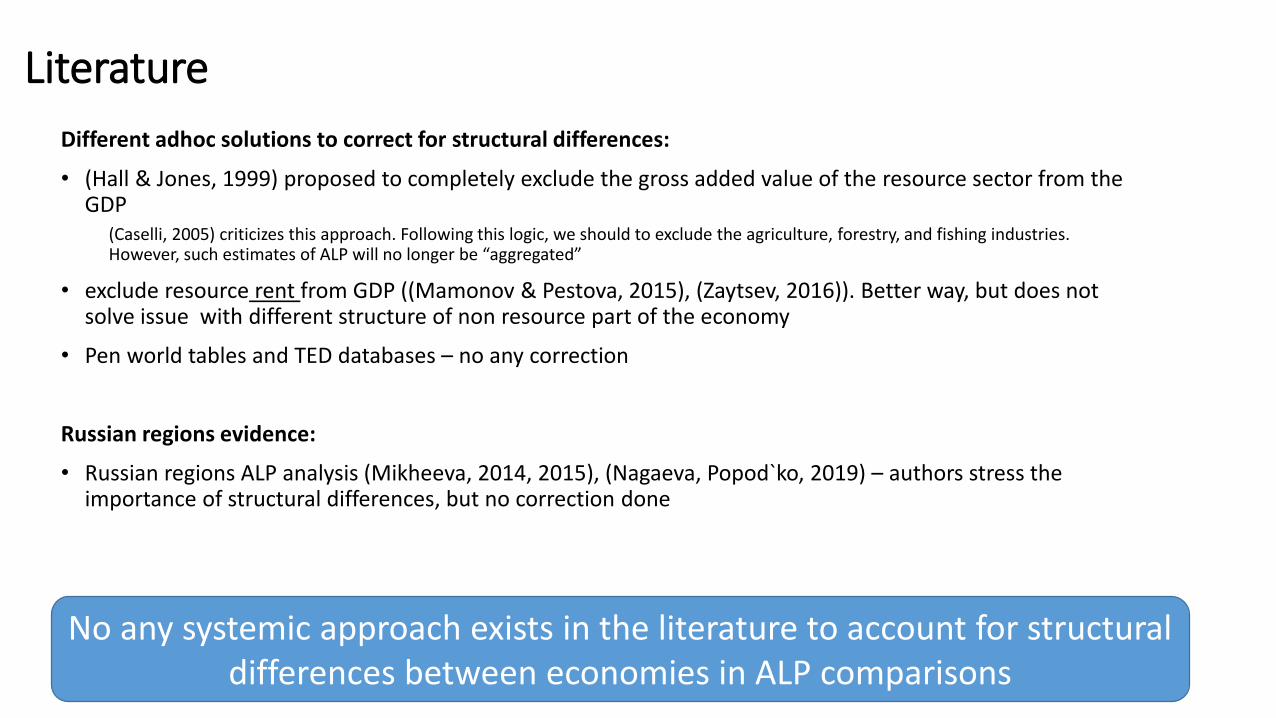
Different adhoc solutions to correct for structural differences:
• (Hall & Jones, 1999) proposed to completely exclude the gross added value of the resource sector from the GDP
(Caselli, 2005) criticizes this approach. Following this logic, we should to exclude the agriculture, forestry, and fishing industries. However, such estimates of ALP will no longer be “aggregated”
• exclude resource rent from GDP ((Mamonov & Pestova, 2015), (Zaytsev, 2016)). Better way, but does not solve issue with different structure of non resource part of the economy
• Pen world tables and TED databases – no any correction
Russian regions evidence:
• Russian regions ALP analysis (Mikheeva, 2014, 2015), (Nagaeva, Popod`ko, 2019) – authors stress the importance of structural differences, but no correction done
No any systemic approach exists in the literature to account for structural differences between economies in ALP comparisons
Methodology (1)
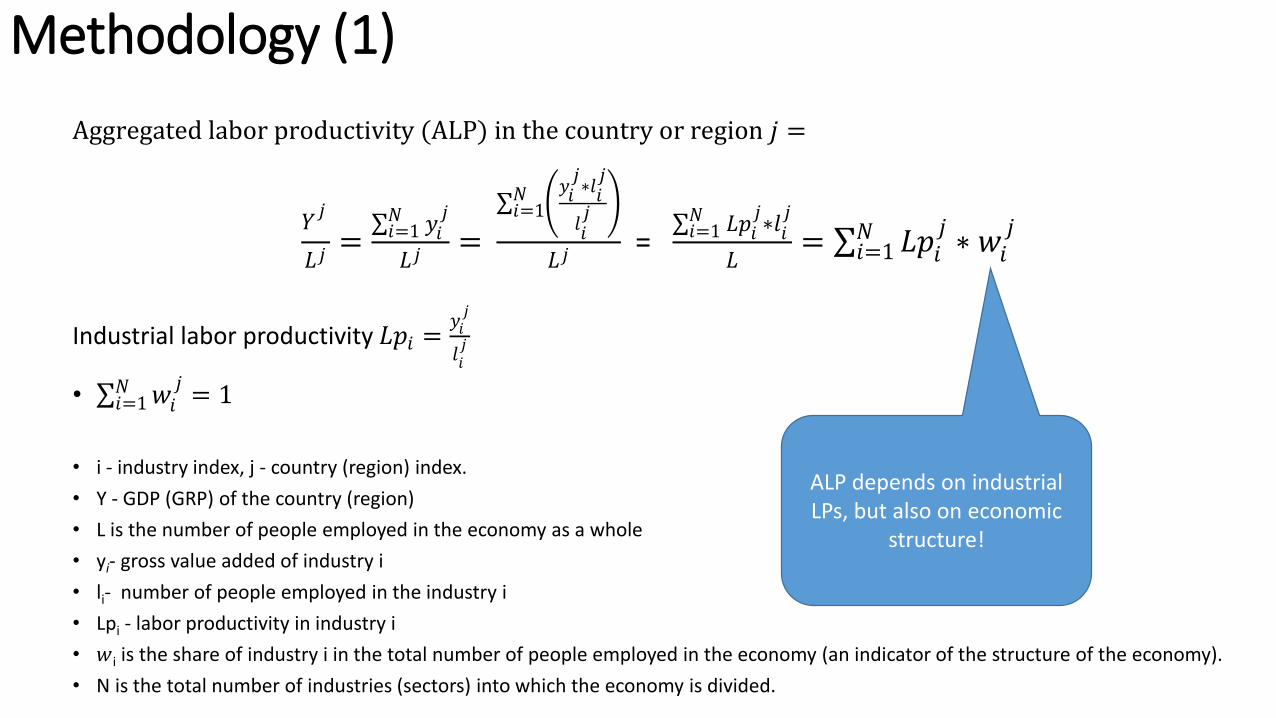
Aggregated labor productivity (ALP) in the country or region 𝑗 =
𝑌𝑗
𝐿 𝑗=
σ𝑖=1𝑁 𝑦𝑖
𝑗
𝐿 𝑗=
σ𝑖=1𝑁 𝑦𝑖
𝑗∗𝑙𝑖𝑗
𝑙𝑖𝑗
𝐿 𝑗=
σ𝑖=1𝑁 𝐿𝑝𝑖
𝑗∗𝑙𝑖
𝑗
𝐿= σ𝑖=1
𝑁 𝐿𝑝𝑖𝑗∗ 𝑤𝑖
𝑗
Industrial labor productivity 𝐿𝑝𝑖 =𝑦𝑖𝑗
𝑙𝑖𝑗
• σ𝑖=1𝑁 𝑤𝑖
𝑗= 1
• i - industry index, j - country (region) index.
• Y - GDP (GRP) of the country (region)
• L is the number of people employed in the economy as a whole
• yi- gross value added of industry i
• li- number of people employed in the industry i
• Lpi - labor productivity in industry i
• 𝑤i is the share of industry i in the total number of people employed in the economy (an indicator of the structure of the economy).
• N is the total number of industries (sectors) into which the economy is divided.
ALP depends on industrial LPs, but also on economic
structure!
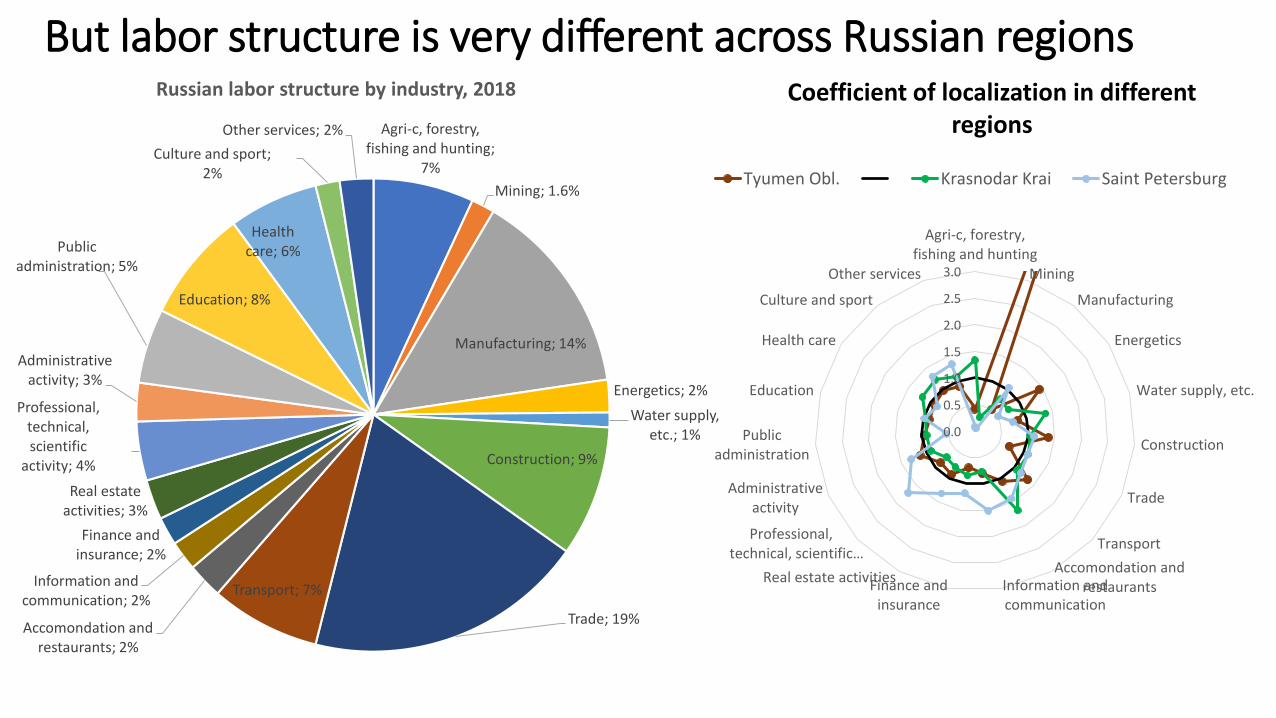
But labor structure is very different across Russian regions
Agri-c, forestry, fishing and hunting;
7%
Mining; 1.6%
Manufacturing; 14%
Energetics; 2%
Water supply, etc.; 1%
Construction; 9%
Trade; 19%
Transport; 7%
Accomondation and restaurants; 2%
Information and communication; 2%
Finance and insurance; 2%
Real estate activities; 3%
Professional, technical, scientific
activity; 4%
Administrative activity; 3%
Public administration; 5%
Education; 8%
Health care; 6%
Culture and sport; 2%
Other services; 2%
0.0
0.5
1.0
1.5
2.0
2.5
3.0
Agri-c, forestry,fishing and hunting
Mining
Manufacturing
Energetics
Water supply, etc.
Construction
Trade
Transport
Accomondation andrestaurantsInformation and
communicationFinance and
insurance
Real estate activities
Professional,technical, scientific…
Administrativeactivity
Publicadministration
Education
Health care
Culture and sport
Other services
Coefficient of localization in different regions
Tyumen Obl. Krasnodar Krai Saint Petersburg
Russian labor structure by industry, 2018
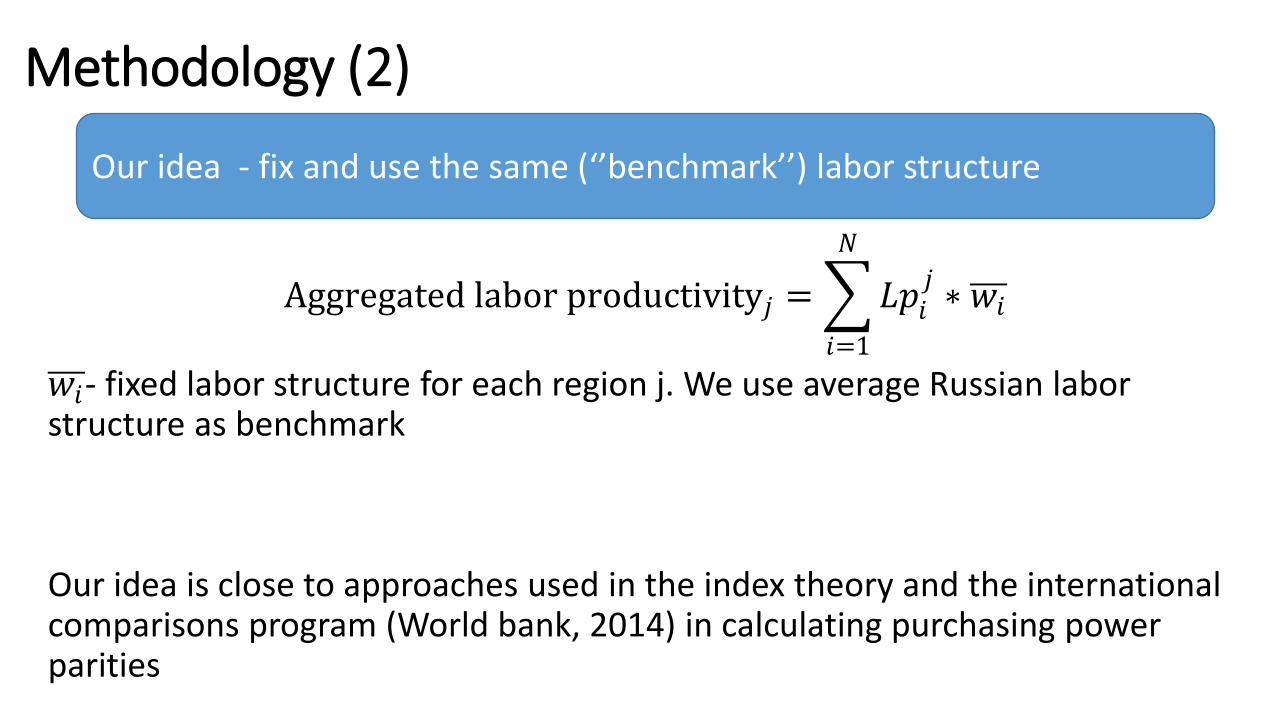
Methodology (2)
Aggregated labor productivity𝑗 =
𝑖=1
𝑁
𝐿𝑝𝑖𝑗∗ 𝑤𝑖
𝑤𝑖- fixed labor structure for each region j. We use average Russian labor structure as benchmark
Our idea is close to approaches used in the index theory and the international comparisons program (World bank, 2014) in calculating purchasing power parities
Our idea - fix and use the same (‘’benchmark’’) labor structure
Data
• Data on industrial GVA and employment on 85 Russian regions
• 2018 year
• 19 industries
• Source of data: official Rosstat data
11Source: calculations based on Rosstat database
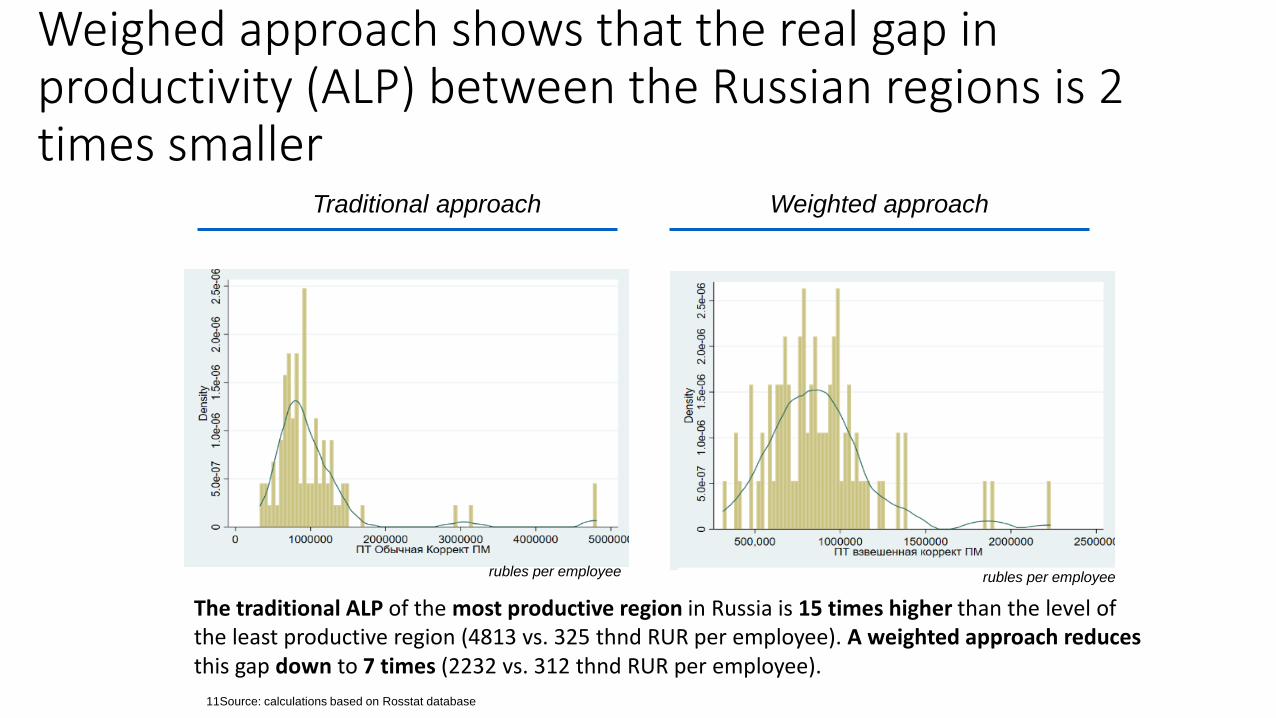
Weighed approach shows that the real gap in productivity (ALP) between the Russian regions is 2 times smaller
Traditional approach Weighted approach
The traditional ALP of the most productive region in Russia is 15 times higher than the level of the least productive region (4813 vs. 325 thnd RUR per employee). A weighted approach reduces this gap down to 7 times (2232 vs. 312 thnd RUR per employee).
rubles per employee rubles per employee
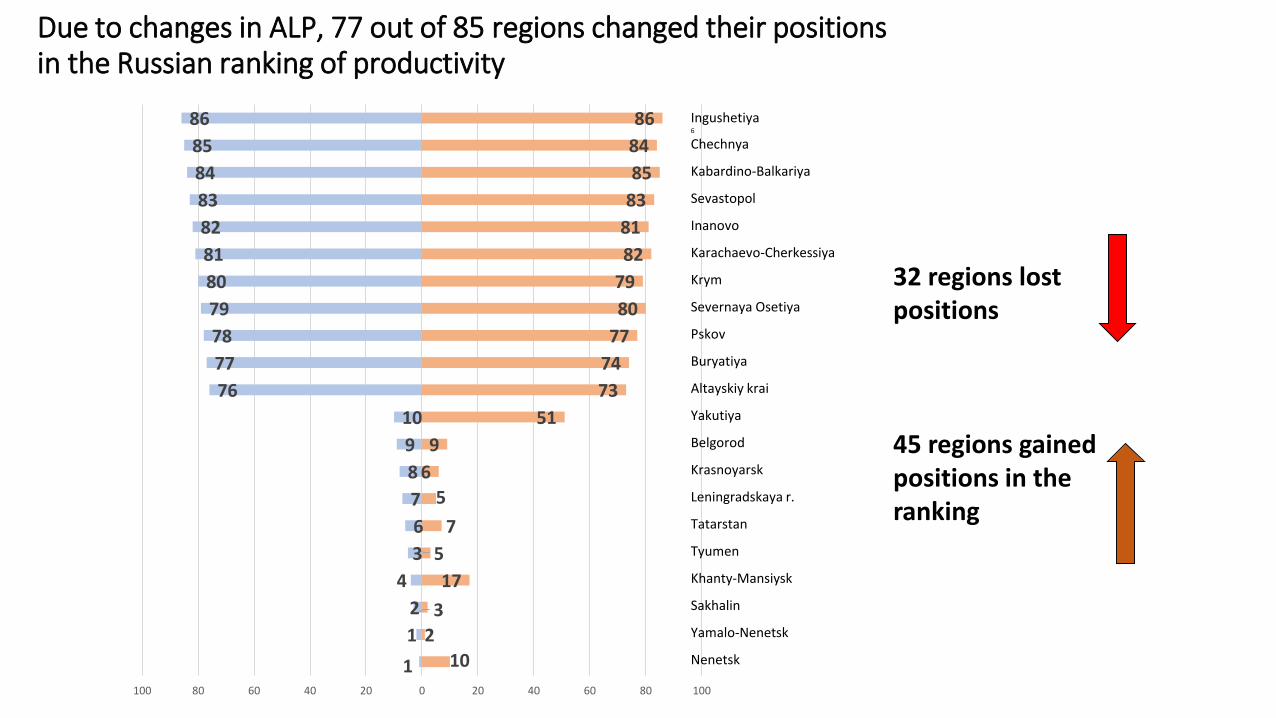
Due to changes in ALP, 77 out of 85 regions changed their positions in the Russian ranking of productivity
1
2
3
4
5
6
7
8
9
10
76
77
78
79
80
81
82
83
84
85
86
10
1
2
17
3
7
5
6
9
51
73
74
77
80
79
82
81
83
85
84
86
100 80 60 40 20 0 20 40 60 80 100
32 regions lost positions
45 regions gained positions in the ranking
Ingushetiya6
Chechnya
Kabardino-Balkariya
Sevastopol
Inanovo
Karachaevo-Cherkessiya
Krym
Severnaya Osetiya
Pskov
Buryatiya
Altayskiy krai
Yakutiya
Belgorod
Krasnoyarsk
Leningradskaya r.
Tatarstan
Tyumen
Khanty-Mansiysk
Sakhalin
Yamalo-Nenetsk
Nenetsk
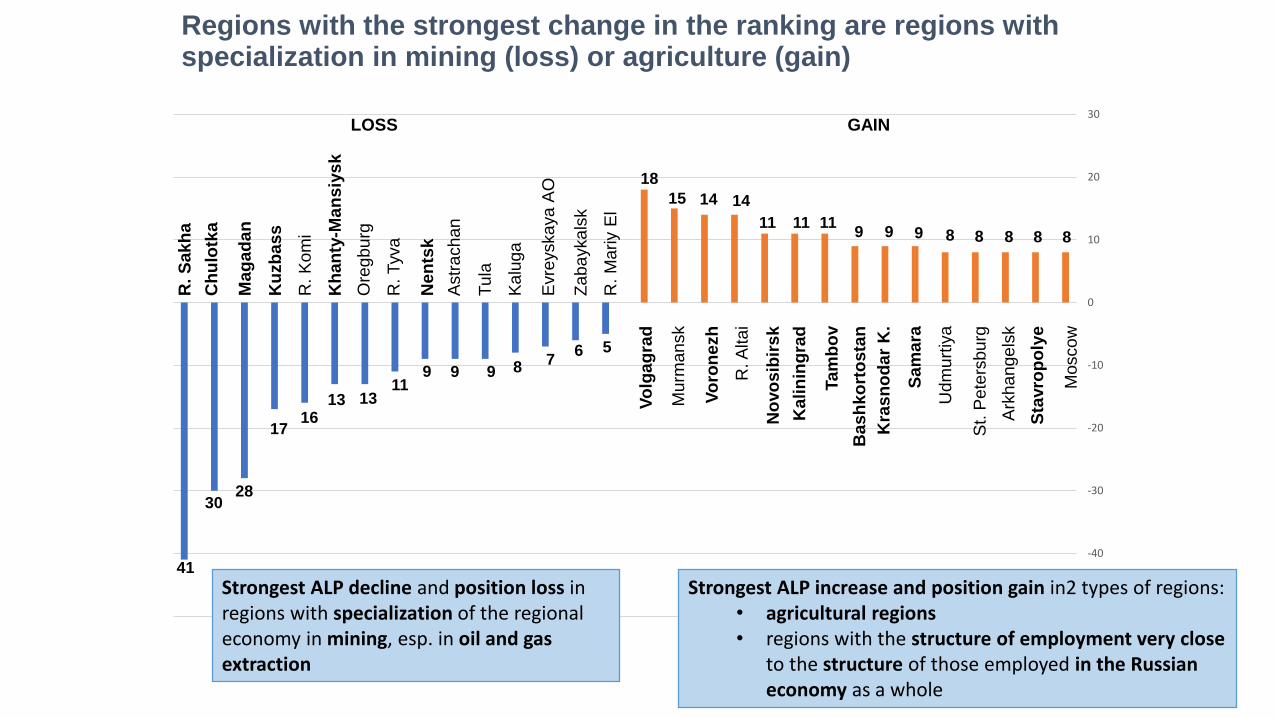
Regions with the strongest change in the ranking are regions with specialization in mining (loss) or agriculture (gain)
-50
-40
-30
-20
-10
0
10
20
30
Strongest ALP decline and position loss in regions with specialization of the regional economy in mining, esp. in oil and gas extraction
Strongest ALP increase and position gain in2 types of regions:• agricultural regions • regions with the structure of employment very close
to the structure of those employed in the Russian economy as a whole
18
15 14 14
11 11 119 9 9 8 8 8 8 8
41
3028
1716
13 1311
9 9 9 8 76 5
LOSS GAIN
R.
Sakh
a
Ch
ulo
tka
Mag
ad
an
Ku
zb
as
s
R.
Kom
i
Kh
an
ty-M
an
siy
sk
Ore
gburg
R. T
yva
Ne
nts
k
Astr
achan
Tula
Kalu
ga
Evre
yskaya A
O
Zabaykals
k
R.
Mariy E
l
Vo
lga
gra
d
Murm
ansk
Vo
ron
ezh
R. A
ltai
No
vo
sib
irs
k
Ka
lin
ing
rad
Tam
bo
v
Ba
sh
ko
rto
sta
n
Kra
sn
od
ar
K.
Sam
ara
Ud
mu
rtiy
a
St. P
ete
rsburg
Ark
hangels
k
Sta
vro
po
lye
Moscow
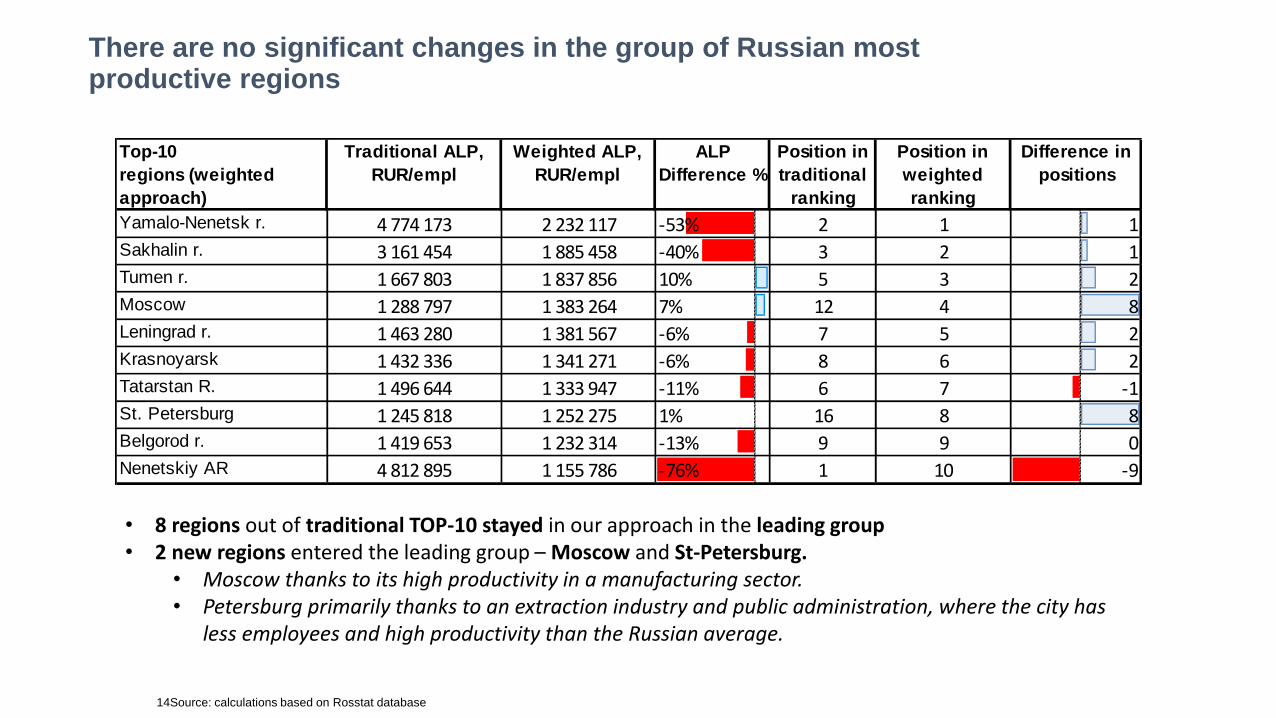
There are no significant changes in the group of Russian most productive regions
Top-10
regions (weighted
approach)
Traditional ALP,
RUR/empl
Weighted ALP,
RUR/empl
ALP
Difference %
Position in
traditional
ranking
Position in
weighted
ranking
Difference in
positions
Yamalo-Nenetsk r. 4 774 173 2 232 117 -53% 2 1 1Sakhalin r. 3 161 454 1 885 458 -40% 3 2 1Tumen r. 1 667 803 1 837 856 10% 5 3 2Moscow 1 288 797 1 383 264 7% 12 4 8Leningrad r. 1 463 280 1 381 567 -6% 7 5 2Krasnoyarsk 1 432 336 1 341 271 -6% 8 6 2Tatarstan R. 1 496 644 1 333 947 -11% 6 7 -1St. Petersburg 1 245 818 1 252 275 1% 16 8 8Belgorod r. 1 419 653 1 232 314 -13% 9 9 0Nenetskiy AR 4 812 895 1 155 786 -76% 1 10 -9
• 8 regions out of traditional TOP-10 stayed in our approach in the leading group• 2 new regions entered the leading group – Moscow and St-Petersburg.
• Moscow thanks to its high productivity in a manufacturing sector. • Petersburg primarily thanks to an extraction industry and public administration, where the city has
less employees and high productivity than the Russian average.
14Source: calculations based on Rosstat database
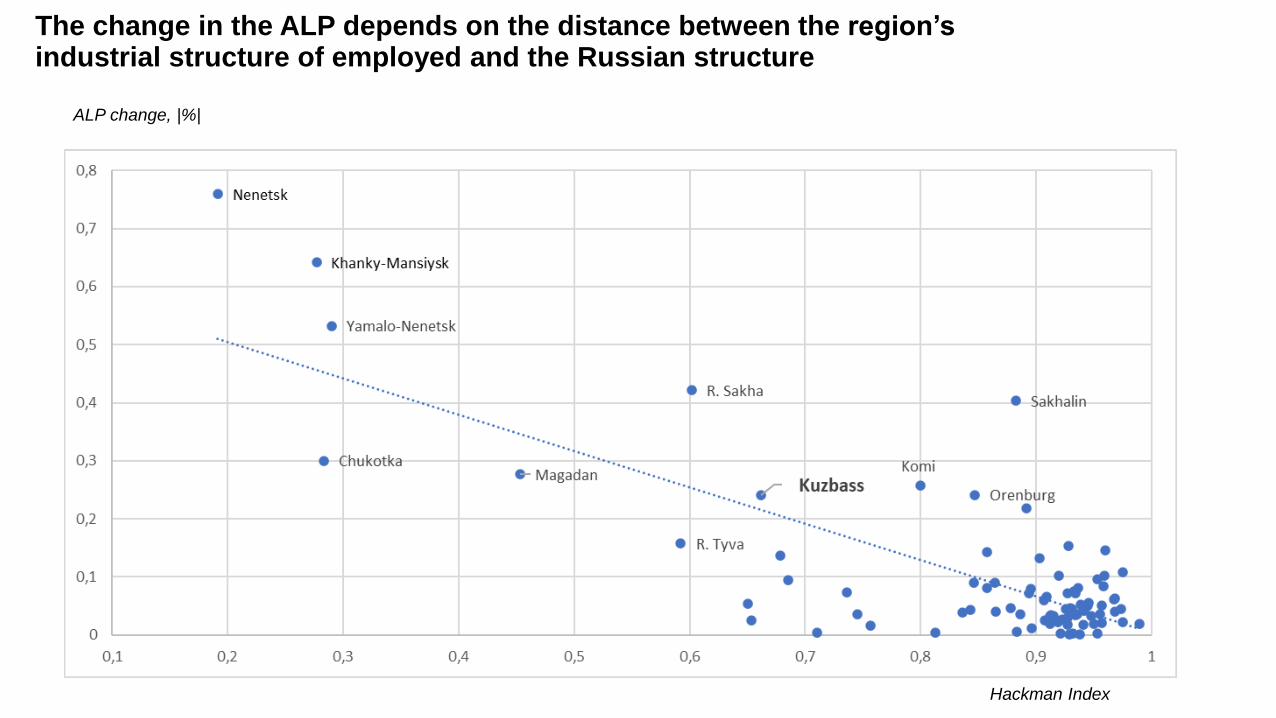
The change in the ALP depends on the distance between the region’sindustrial structure of employed and the Russian structure
Hackman Index
ALP change, |%|
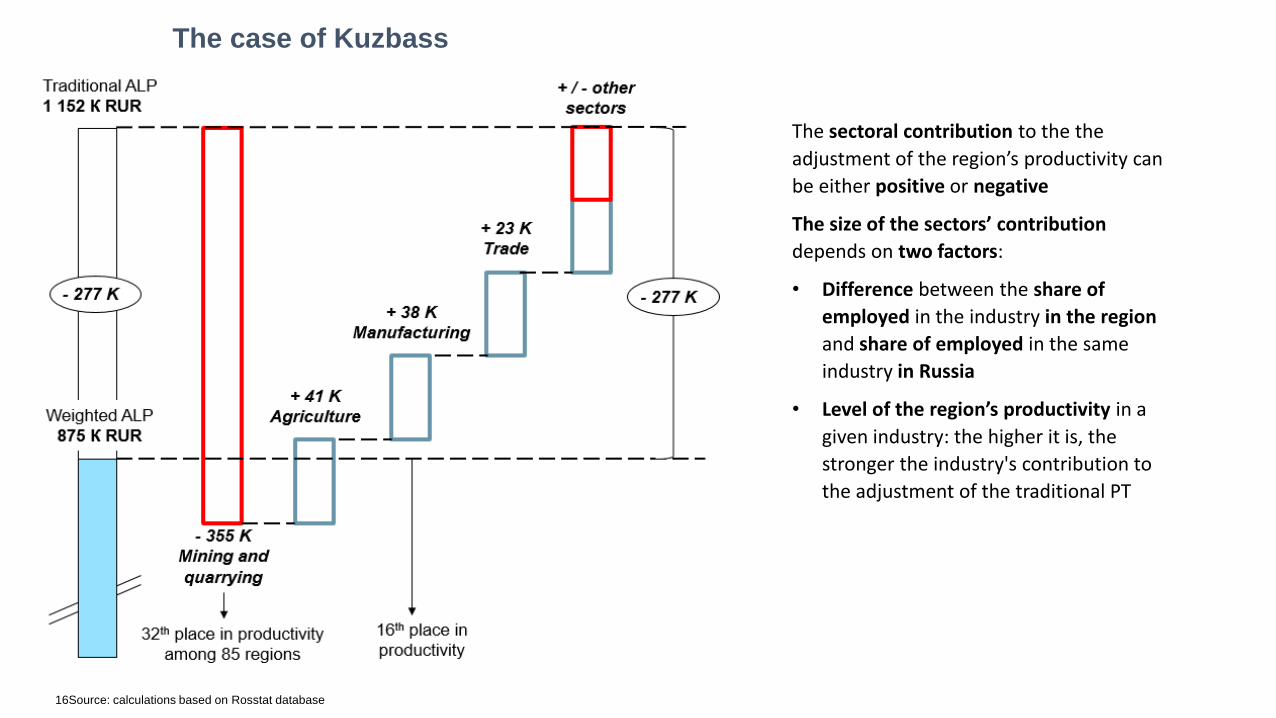
The case of Kuzbass
16Source: calculations based on Rosstat database
The sectoral contribution to the the
adjustment of the region’s productivity can
be either positive or negative
The size of the sectors’ contribution
depends on two factors:
• Difference between the share of
employed in the industry in the region
and share of employed in the same
industry in Russia
• Level of the region’s productivity in a
given industry: the higher it is, the
stronger the industry's contribution to
the adjustment of the traditional PT
Summary of results
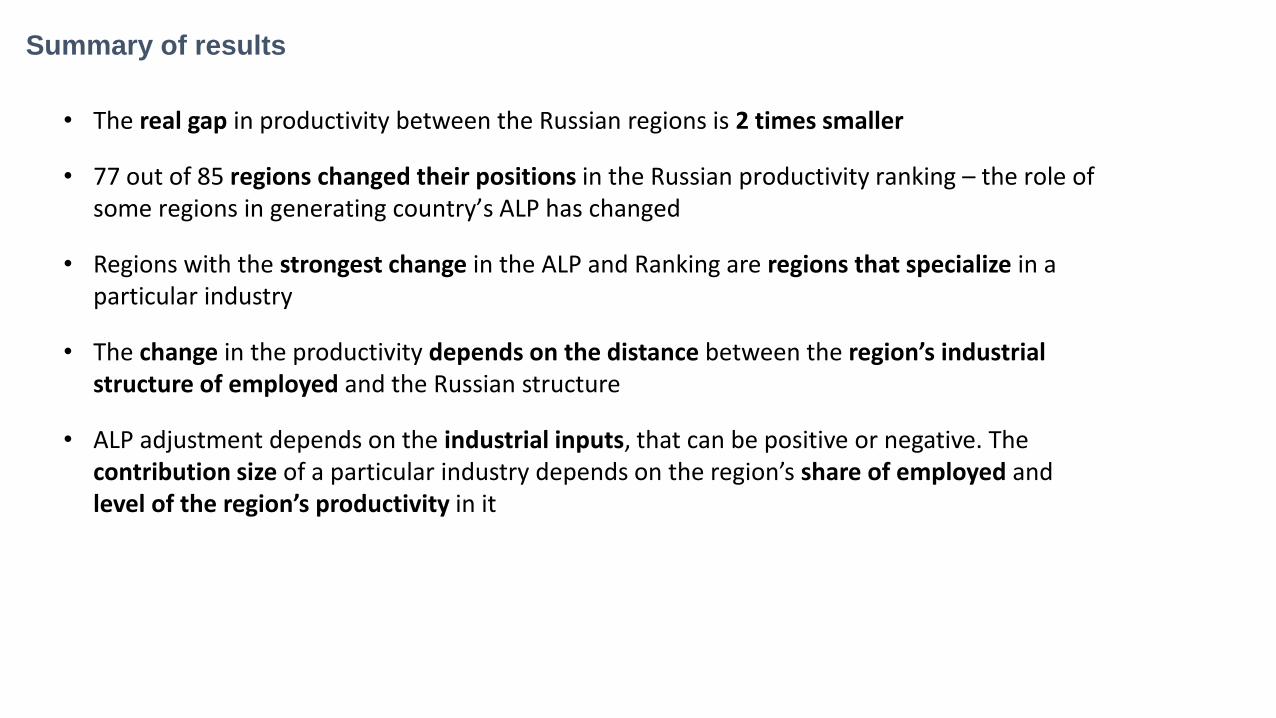
• The real gap in productivity between the Russian regions is 2 times smaller
• 77 out of 85 regions changed their positions in the Russian productivity ranking – the role of some regions in generating country’s ALP has changed
• Regions with the strongest change in the ALP and Ranking are regions that specialize in a particular industry
• The change in the productivity depends on the distance between the region’s industrialstructure of employed and the Russian structure
• ALP adjustment depends on the industrial inputs, that can be positive or negative. The contribution size of a particular industry depends on the region’s share of employed and level of the region’s productivity in it

Thank you!!!
Zaytsev Alexander,
Ph.D., Research fellow, Center for Comprehensive European and International Studies
(CCEIS), Higher School of Economics (HSE)
Russia, [email protected]
Klochko Olga,Associate Professor, Ph.D.,
Faculty of World Economy and World Politics HSE,Department of World Economy,
Sirotin Ernest 1st year master student,
Faculty of World Economy and World Politics HSE,[email protected]
Literature• Balatsky E. V ., Ekimova N. A. Interregional structural factor of labour productivity growth in Russia. Mir novoj ekonomiki = World of the New Economy. 2019;13(4):90-102. DOI: 10.26794/2220-
6469-2019-13-4-90-102
• Balatsky E. V., Ekimova N.A. Internal sources of labour productivity growth in Russia. Mir novoj ekonomiki = World of the new economy. 2020;14(2):32-43. (In Russ.). DOI: 10.26794/2220-6469-
2020-14-2-32-43
• Bessonov V.A. Productivity and factors of long-term development of the Russian economy [Text]: report to X Int. scientific. conf. HSE on the problems of economic and social development, Moscow,
April 7-9, 2009 / V. A. Bessonov, V. E. Gimpelson, Ya. I. Kuzminov, E. G. Yasin; Higher School of Economics. - M.: publ. house HSE, 2009. - 66, [2] p. - 1800 copies. - ISBN 978-5-7598-0668-4
• Caselli, F. (2005). Accounting for Cross-Country Income Differences. Handbook of Economic Growth, 1(SUPPL. PART A), 679–741. https://doi.org/10.1016/S1574-0684(05)01009-9
• Hall, R. E., & Jones, C. I. (1999). Why do some countries produce so much more output per worker than others? The Quarterly Journal of Economics, 114(1), 83–116.
https://doi.org/10.1162/003355399555954
• Lavrovsky, B.L., & Murzov, I.A. Bol'shaya Sibir': tendentsii proizvoditel'nosti truda. Region: ekonomika i sotsiologiya = [Greater Siberia: Labor Productivity Trends]. Region: Economics and Sociology,
2014; (4), 103-117. (In Russ.)
• Mamonov, M.E., & Pestova, A.A. The Technical Efficiency of National Economies: Do the Institutions, Infrastructure and Resources Rents matter? Journal of the New Economic Association, 2015; 3
(27), 44–78. (In Russ.) http://journal.econorus.org/jlast.phtml
• Mikheeva, N.N. Regional'nyye aspekty issledovaniya dinamiki proizvoditel'nosti truda = [Regional aspects of the study of the dynamics of labor productivity]. Region: Economics and Sociology, 2014; 1
(81), 6–28. (In Russ.)
• Mikheeva, N. N. Sravnitel'nyy analiz proizvoditel'nosti truda v rossiyskikh regionakh = [Comparative analysis of labor productivity in Russian regions]. Region: Economics and Sociology, 2015; 2 (86),
86-112. (In Russ.) https://doi.org/10.15372/REG20150605
• Nagaeva O.S., Popodko G.I. (2019) Sravnitelnyy analiz proizvoditelnosti truda v resursnyh i neresursnyh regionakh Rossii [Comparative analysis of labour productivity in the resource and non-resource
regions of Russia]. Ekonomika truda. 6. (4). – 1299-1316. doi:10.18334/et.6.4.41271
• Rastvortseva S.N. Labor productivity and capital to labor ratio in ensuring the economic growth of the Russian regions. Social area, 2018, no. 1 (13). DOI: 10.15838/sa/2018.1.13.1
• Timmer, M. P., Inklaar, R., O’Mahony, M., & Ark, B. van. (2010). Economic Growth in Europe: A Comparative Industry Perspective. Cambridge University Press.
https://doi.org/10.1017/CBO9780511762703
• World Bank. (2014). Purchasing Power Parities and the Real Size of World Economies. Retrieved from http://siteresources.worldbank.org/ICPEXT/Resources/ICP-2011-report.pdf
• Zaytsev, A. (). Regionalnaya diagnostika i otraslevoy analiz proizvoditelnosti truda [Regional diagnostics and branch analysis of labor productivity]. Federalism, 2013; 1 (69), 54–77. (In Russ.)
• Zaitsev, A.A. (2014). International comparisons of sectoral labor productivity in 1991-2008 period. Institute of Economics RAS. Institute of Economics RAS.
http://inecon.org/docs/Zaytsev_paper_20140424.pdf (In Russ.)
• Zaitsev, A.A. Mezhstranovyye razlichiya v proizvoditel'nosti truda: rol' kapitala, urovnya tekhnologiy i prirodnoy renty. [International differences in per capita GDP and labor productivity: role of capital,
technological level, and resource rent]. Economic Issues, 2016; 9 (9), 67-93. (In Russ.)
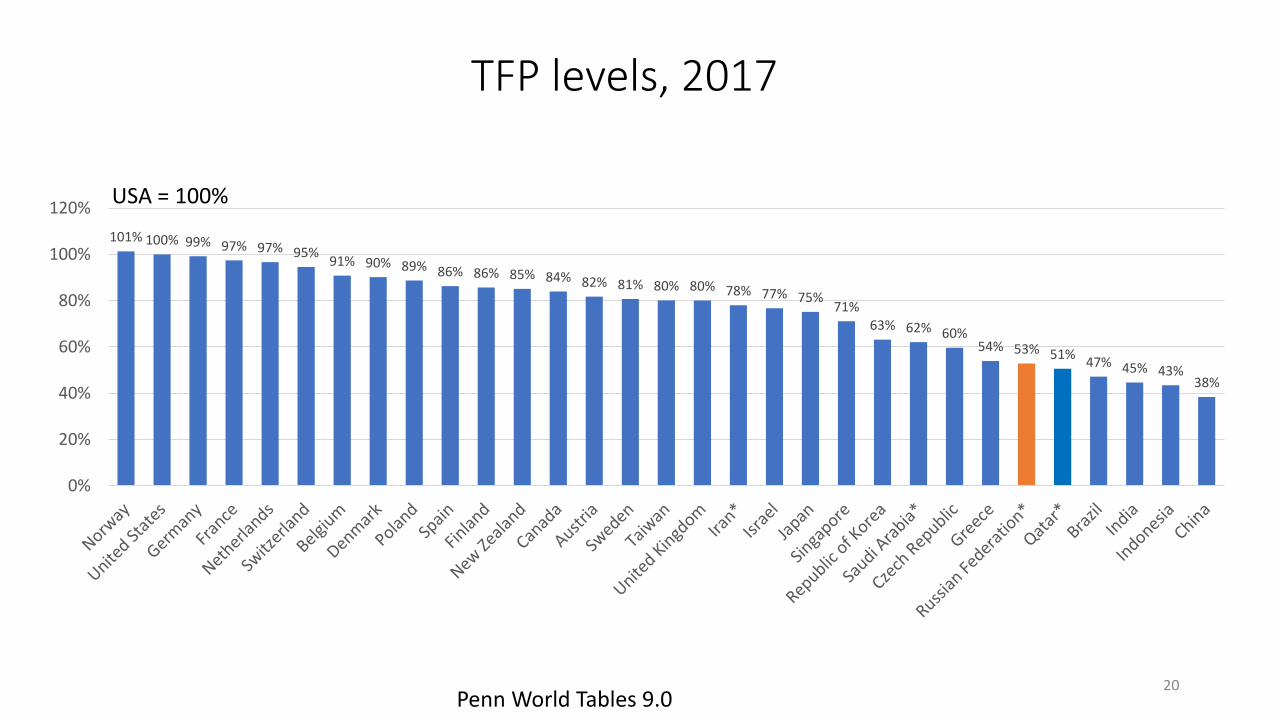
TFP levels, 2017
Penn World Tables 9.020
101% 100% 99% 97% 97% 95%91% 90% 89% 86% 86% 85% 84% 82% 81% 80% 80% 78% 77% 75%
71%63% 62% 60%
54% 53% 51%47% 45% 43%
38%
0%
20%
40%
60%
80%
100%
120%USA = 100%
Related Documents