Converting Waste Agricultural Biomass into Energy Source Report on Assessment of Environmentally Sound Technologies (ESTs) for Waste Agricultural Biomass (WAB) In District Sanghar, Pakistan By: Prof. Dr. Rasool Bux Mahar Institute of Environmental Engineering & Management Mehran University of Engineering & Technology Jamshoro, Pakistan United Nations Environmental Programme International Environmental Technology Centre Osaka/Shiga, Japan

Welcome message from author
This document is posted to help you gain knowledge. Please leave a comment to let me know what you think about it! Share it to your friends and learn new things together.
Transcript
Converting Waste Agricultural Biomass into Energy Source
Report on
Assessment of Environmentally Sound
Technologies (ESTs) for
Waste Agricultural Biomass (WAB)
In District Sanghar, Pakistan
By: Prof. Dr. Rasool Bux Mahar
Institute of Environmental Engineering & Management Mehran University of Engineering & Technology
Jamshoro, Pakistan
United Nations Environmental Programme International Environmental Technology Centre
Osaka/Shiga, Japan
2
PREFACE
Rapid increase in demand and consumption of fossil fuels and its consequent
impact on climate change and environment has put greater emphasis on development
of alternative and renewable sources of energy. Waste biomass, as a renewable energy
source, presents a viable solution for meeting our energy demands. It addresses the
climate change issues as well as reduces our dependence on fossil fuels. In developing
countries this could be developed as a versatile source of energy for domestic as well
as industrial/commercial purposes.
Biomass is a broad term, which generally refers to any plant or animal matter.
The main categories of biomass are; agriculture residues (referred to hereafter as
waste agricultural biomass), forestry residues, wood (both from forests and firewood
plantations), animal residues, organic wastes from cities and dwellings. The
discussions in this guideline pertain only to waste agricultural biomass.
In this Report district Sanghar, which is one of the largest districts of province
Sindh, Pakistan was selected as the study area for the assessment of the technology
for converting waste agricultural biomass (WAB) into energy/ resource.
This report is divided into three parts. Part- I is Introduction, Part- II is
proposed environmentally sound technologies (ESTs) for converting WAB into
energy/resource in Sanghar and Part- III is assessment of environmentally sound
technologies.
3
TABLE OF CONTENTS Description Page
Preface 2 Part- I INTRODUCTION 1.1 Biomass
6
1.2 Biomass Energy 7 1.3 Waste Agricultural Biomass (WAB) 7 1.3.1 Field residue 7 1.3.2 Process residue 7 1.4 Why To Use Waste Agricultural Biomass? 7 1.5 Study Area 8
1.6 Environmentally Sound Technologies (ESTs) 10 1.7 Environmental Technology Assessment (EnTA) 10 1.8 Purpose and Scope EnTA 11 1.9 Criteria for Critical Analysis of EST
11
Part- II PROPOSED ENVIRONMENTALLY SOUND TECHNOLOGIES (ESTS) FOR CONVERTING WAB INTO ENERGY/RESOURCE IN SANGHAR
2.1 Proposed Technologies for District Sanghar 14 2.2 Direct Combustion 14 2.3 Biomass Pellets 16 2.3.1 Description of the Pelleting Process 17 2.3.2 Feedstock Grinding 18 2.3.3 Moisture Control 18 2.3.4 Extrusion 18 2.3.5 Cooling 19 2.3.6 Packaging 19 2.4 Energy Requirements For Pellet Manufacture 19 2.6 Composting 19 2.7 Advantages Of Composting 21 2.8 Disadvantages Of Composting 21 2.9 Composting Systems 21 2.9.1 Windrow/pile Composting – Turning 22 2.9.2 Windrow/pile Composting – Active Aeration, 22 2.9.3 Windrow/pile Composting – Passive Aeration, 23 2.9.4 Windrow/pile Composting – Static Piles, not Aerated 23 2.9.5 In-vessel Composting 24 2.9.6 Vermi-composting 24
2.10 Gasification 24 2.11 Principle Of Operation 24 2.12 History On Gasification 27 2.13 Types Of Gasifiers 27 2.13.1 Moving Bed Gasifier 27 2.13.2 Entrained Flow Gasifier 28 2.13.3 Fluidized Bed Gasifier 29
4
2.14 Common Biomass Feedstock For Gasification 29 2.14.1 Fuel-wood 29 2.14.2 Biomass Briquettes 30 2.14.3 Agriculture Residue 30 2.15 Advantages Of Gasification 30 2.16 Disadvantages Of Gasification 31 2.17 Anaerobic Digestion 31 2.18 Principle Of Operation 32 2.18.1 Hydrolysis 32 2.18.2 Acetogenesis 32 2.18.3 Methanogenesis 32 2.19 History Of Anaerobic Digestion 33 2.20 Energy Conversion 33 2.21 Conditions And Variables Influencing AD 34 2.23 TYPES OF DIGESTERS 36 2.24 Advantages Of Anaerobic Digestion 36 2.25 Disadvantages Of Anaerobic Digestion 37
Part- III ASSESSMENT OF ENVIRONMENTALLY SOUND TECHNOLOGIES
3.1 Problem Statement 40 3.2 Steps By Step Assessment of ESTs 45 3.2.1 Screening tier 45 3.2.2 Scoping tier 45 3.2.3 Detailed assessment tier 47 CONCLUSION & RECOMMENDATION 50

5
PART- I
INTRODUCTION

6
PART- I
INTRODUCTION
1.1 BIOMASS
The word biomass is the combination of two “Bio”, which is the prefix
indicating the action of living organisms and the “Mass”, which is the matter in the
body. Biomass is the mass of living organisms and recently dead matter like wood,
leaves, stalks, straw and other organic matter. It is accessible on a renewable basis,
and also includes agricultural crops and their residues, animal wastes (dung), wood
and wood residues, aquatic plants and organic portion of the municipal solid waste
(garbage). The basic step in the constitution of the biomass is photosynthesis, which
can be symbolized as Eq. (1.1).
OHOOHCkJOHCO lchlorophyl22612622 662800126 ++ →++ (1.1)
Photosynthesis is the chemical process, in which the small portion of the
sunlight is absorbed by chlorophyll of green plant cells, which is consumed by it to
generate carbohydrates (sugars) from water and carbon dioxide. Fig. 1.1 indicates the
interaction of the solar energy and the biomass. Only green plants are capable of
photosynthesis, where as other living organisms either consumes green plants or their
by-products and generate biomass.
Fig. 1.1: Interaction of sun and biomass during photosynthesis
7
1.2 BIOMASS ENERGY
The energy obtained from the floras and their residues and fauna’s waste is
known as biomass energy. In other words biomass energy is the accumulation of the
solar energy into the animals, plants and their different types of wastes. By the
definition of the biomass the fossil fuels do not considered as biomass energy, though
their origin is biomass. One of the reasons is that the fossil fuels are not renewable
source of energy; second they are long term decayed organisms forming after several
million years under certain conditions of pressure, temperature, etc.
1.3 WASTE AGRICULTURAL BIOMASS (WAB)
The agricultural residues are referred as the Waste Agricultural Biomass,
which may be assorted as field residues and process residues.
1.3.1 Field residue
It is the matter leftover in an agricultural field after the crop has been reaped
e.g. leaves, straw, stalks, roots etc.
1.3.2 Process residue
It is the matter leftover after the processing of the crop at the mills or factories
into a valuable resource e.g. husks, sugar cane fiber (bagasse), seeds, groundnut
shells, maize cobs etc.
1.4 WHY TO USE WASTE AGRICULTURAL BIOMASS?
There are several social, economical and environmental benefits of the waste
agricultural biomass to be uses as the fuel. Following are the few important points to
be considered;
� The waste agricultural biomass is a clean, renewable source of energy, and is
the replacement of a non-renewable energy sources.
� It is free from worldwide price variations and supply doubts, as it is domestic
fuel and is available on the periodic basis, hence provides the energy security.
� The use of waste agricultural biomass can substantially reduce the carbon
emissions if managed in a suitable manner. Its management includes
collection, processing, transportation and use for energy recovery technology.
� It will enhance energy security by utilizing locally available resources mean
while decreasing the dependency to the fossil fuels.
8
� The proper consumption of waste agricultural biomass decreased green house
gas (GHG) emissions, achieved by decreasing the open field burning and
methane discharges due to decomposing of the WAB available into the field.
� It will reduce the problem of waste agricultural biomass management and
disposal.
� In addition to the environmental benefits the proper utilization of the WAB
can potentially increases the profit to the farmers/ landowners.
� Management of the WAB creates new job opportunities.
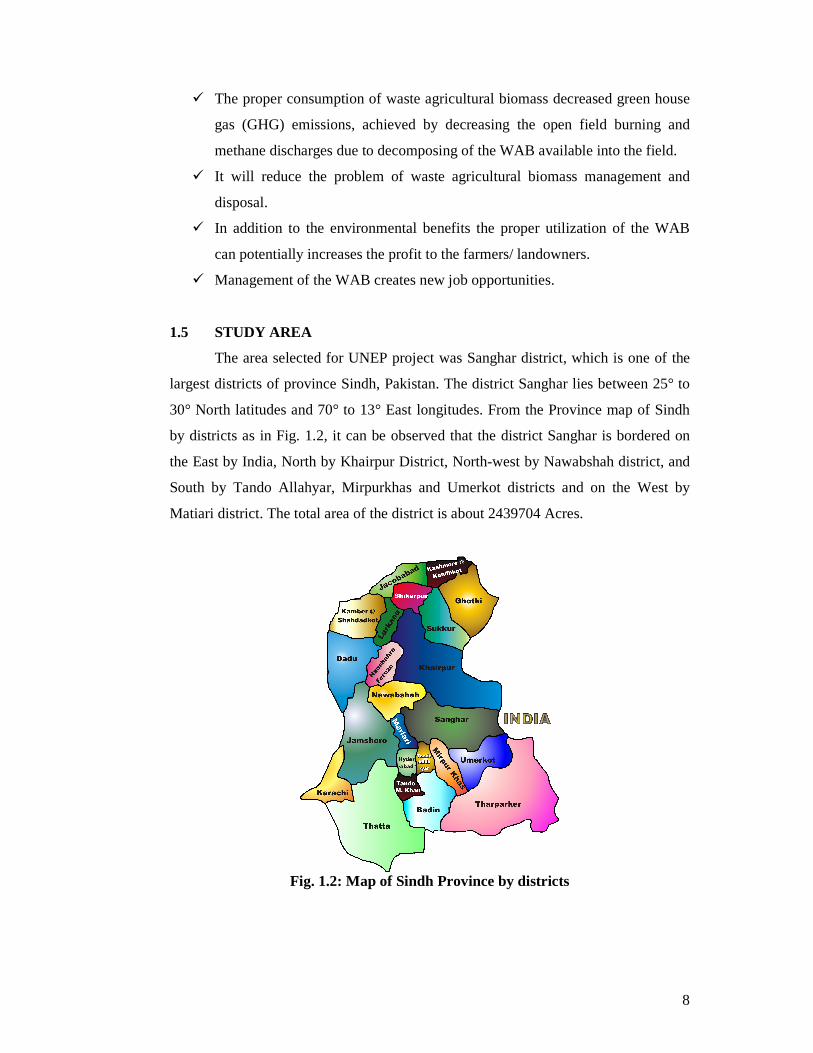
1.5 STUDY AREA
The area selected for UNEP project was Sanghar district, which is one of the
largest districts of province Sindh, Pakistan. The district Sanghar lies between 25° to
30° North latitudes and 70° to 13° East longitudes. From the Province map of Sindh
by districts as in Fig. 1.2, it can be observed that the district Sanghar is bordered on
the East by India, North by Khairpur District, North-west by Nawabshah district, and
South by Tando Allahyar, Mirpurkhas and Umerkot districts and on the West by
Matiari district. The total area of the district is about 2439704 Acres.
Fig. 1.2: Map of Sindh Province by districts
9
The district Sanghar principally is an agrarian district except the large part of
Taluka Khipro and some part of Taluka Sanghar, which comes on the left side of Nara
Canal and is known as Thar Desert. The rest of the part of the district is very fertile.
Wheat, Cotton, Sugarcane and Rice are main crops of the district. Groundnuts,
Vegetables, Pulses, Maize, Bananas and many other crops are also grown there.
District Sanghar has great importance due to Political, Economic and Cultural
causes. There exist many small industries like cotton factories, flour mills, rice mills,
oil mills, ice factories, match factories & only one large sugar mill. People of district
Sanghar are very hospitable. The climate there in summer is dry and hot, where as in
winter it is dry and cold. The temperature in the region ranges from 43°C to 6°C in
summer and winter respectively. The district average out receives 12mm of the
rainfall annually.
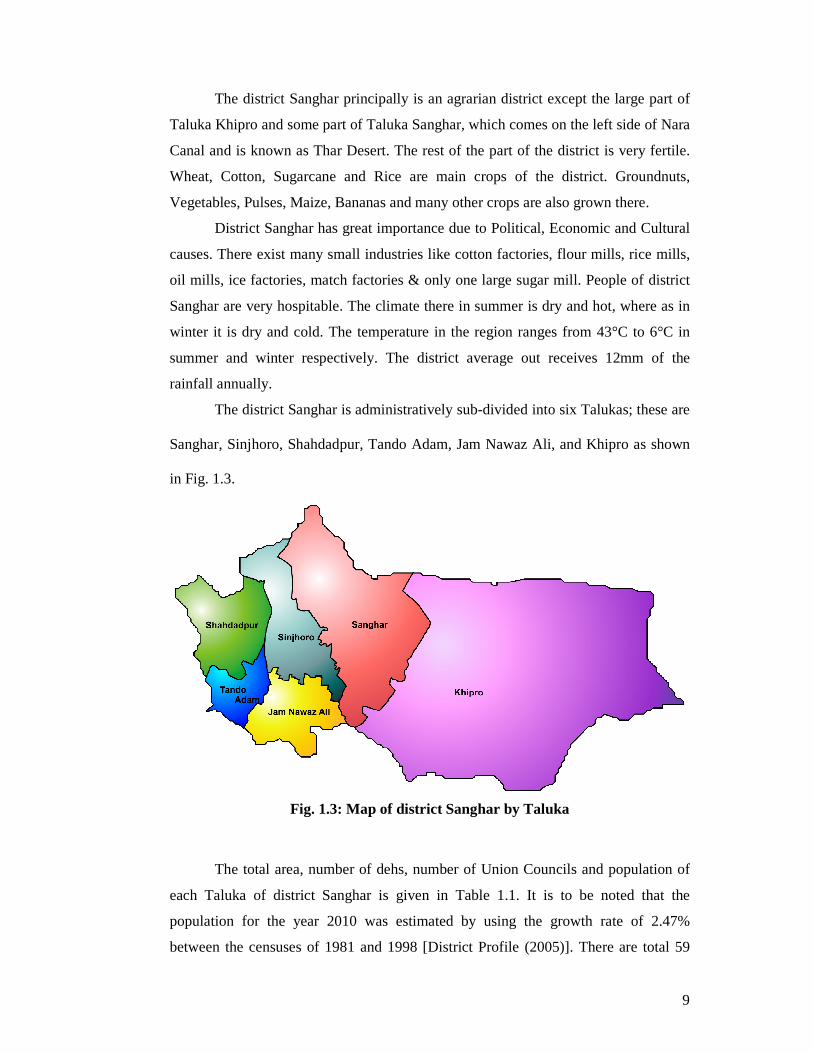
The district Sanghar is administratively sub-divided into six Talukas; these are
Sanghar, Sinjhoro, Shahdadpur, Tando Adam, Jam Nawaz Ali, and Khipro as shown
in Fig. 1.3.
Fig. 1.3: Map of district Sanghar by Taluka
The total area, number of dehs, number of Union Councils and population of
each Taluka of district Sanghar is given in Table 1.1. It is to be noted that the
population for the year 2010 was estimated by using the growth rate of 2.47%
between the censuses of 1981 and 1998 [District Profile (2005)]. There are total 59
10
union councils are in district Sanghar. In order to get the representative data, each of
them was considered as a unit area for the survey.
Table 1.1: Area and population of district Sanghar by Taluka
S# Name of taluka Area (Acre)
No of Dehs
No of Union
Councils
Population by census
1998
Population in 2010
01 Sanghar 590782 69 11 262050 362459
02 Sinjhoro 217070 88 8 196849 272275
03 Shahdadpur 108377 47 13 327408 452860
04 Tando Adam 107688 28 10 255941 354009
05 Jam Nawaz Ali 115021 51 4 88908 122975
06 Khipro 1300766 78 13 321874 445206
Total 2439704 361 59 1453030 2009784
1.6 ENVIRONMENTALLY SOUND TECHNOLOGIES (ESTs)
Environmentally Sound Technologies ESTs can be defined as those
technologies that protect the environment, are less polluting, use all resources in a
more sustainable manner, recycle more of their waste and products and handle
residual waste in a more sustainable manner than the technologies for which they are
substitutes.
ESTs include a variety of cleaner production process and pollution prevention
technologies, as well as end-of-pipe and monitoring technologies. Apart from just
technologies, they can be considered as total ‘systems’ that may include knowledge
and skills transfer, operating procedures, goods, services and equipment, and also
organizational and managerial procedures.
1.7 ENVIRONMENTAL TECHNOLOGY ASSESSMENT (EnTA)
EnTA is conceived as a system for technology assessment focusing on not just the
environmental performance of the various processes and components of the technology,
but also on its cultural and socio-economic consequences. Simply put, EnTA is a system
to facilitate the identification and selection of the ‘best possible technology option’.
11
1.8 PURPOSE AND SCOPE OF EnTA
EnTA targets planners, decision makers in the government and private sectors,
communities through community leaders and community-based organizations, and
other stakeholders to enable them to arrive at an informed consensus on the proposed
technology intervention. More specifically, the purpose of EnTA for different users is
as described below:
� Decision makers and managers in industry – To identify/recognize
environmental implications of the proposed technology intervention,
potentially avoiding adverse financial and legal issues
� Development planners and government sector officials – To identify and thus
address implications of technology based development and integrate it in
planning
� Community and non-government organizations – To ensure that the rights and
responsibilities of communities are given due consideration where technology-
based development is being planned
� Stakeholders in sustainable development – To enable citizens to ensure that
environmental outcomes are recognized and suitable modifications are
implemented for a more positive technology-based development
1.9 CRITERIA FOR CRITICAL ANALYSIS OF EST
The EST criteria begin with four basic requirements:
1. Environmental soundness
a. Protecting the environment
b. Less polluting and handles wastes in a more acceptable manner
c. Uses resources in a more sustainable manner
d. Accepts by-products and wastes as inputs
2. Economic viability
a. Lesser capital costs
b. Availability of financial incentives / rebates for raising capital
c. Lesser operating and maintenance costs
d. Leads to additional monetary savings from operation

12
3. Social and cultural acceptability
a. Protects and enhances social aspects
b. Culturally acceptable and/or enhancing
4. Characterization (of technologies) by sufficient and verified information
13
PART- II
PROPOSED ENVIRONMENTALLY SOUND
TECHNOLOGIES (ESTs) FOR
CONVERTING WAB INTO
ENERGY/RESOURCE IN SANGHAR
14
2.1 PROPOSED TECHNOLOGIES FOR DISTRICT SANGHAR
The following five technologies are proposed for converting Waste
Agricultural Biomass (WAB) into energy/ material source:
1. Direct Combustion
2. Biomass Pellets
3. Composting
4. Gasification
5. Anaerobic Digestion
2.2 DIRECT COMBUSTION
The simplest way, and oldest way, of generating electricity from biomass is to
burn it. This is called direct combustion. Direct combustion systems burn biomass in
boilers to produce high pressure steam. This steam turns a turbine connected to a
generator. As the steam causes the turbine to rotate, the generator turns and electricity
is produced. Most of the world’s biomass power plants use direct combustion. In
some cases, the steam from the plants is also captured to heat water and buildings.
These are known as cogeneration facilities. Direct combustion processes can be used
to convert various raw fuel materials besides wood, including municipal garbage and
crop wastes. If they burn woody materials, these commonly take the form of
woodchips, bark or sawdust that originates as waste by-products of forest industries.
Although this technology is dependable and proven, its efficiency is limited.
Direct combustion systems typically have thermal efficiencies around 20 per cent.
These efficiencies can be increased through cogeneration. Biomass cogeneration
refers to the combustion of a mixture of fossil fuels such as coal and biomass fuels.
Direct combustion is the main process of converting the biomass to the useful
form of energy. Technology for direct combustion can generate heat, electricity or
both (Cogeneration or combined heat and power, CHP). Biomass direct combustion is
generally based on the Rankin cycle, where a steam turbine is employed to drive the
generator. This type of system is well developed, and available commercially around
the world. Most bioelectricity plants today are direct-fired. In direct combustion,
steam is generated in boilers burning solid biomass which has been suitably prepared
(dried, baled, chipped, formed into pellets or briquettes or otherwise modified to suit
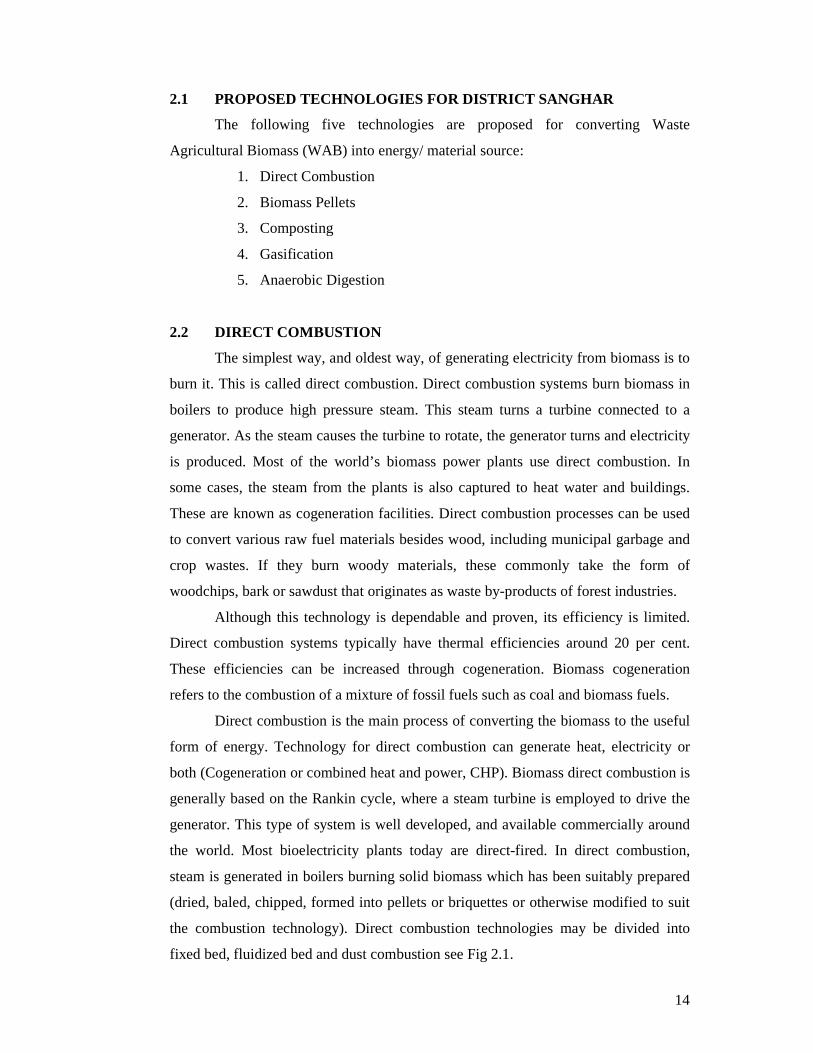
the combustion technology). Direct combustion technologies may be divided into
fixed bed, fluidized bed and dust combustion see Fig 2.1.
15
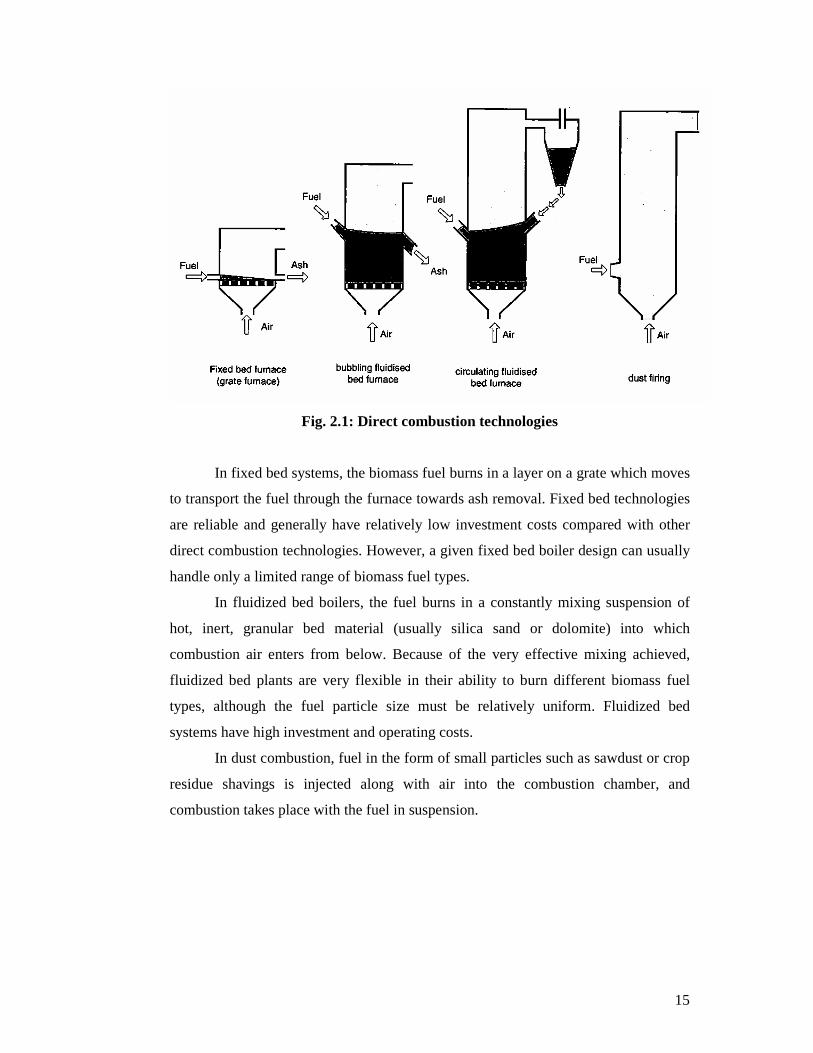
Fig. 2.1: Direct combustion technologies
In fixed bed systems, the biomass fuel burns in a layer on a grate which moves
to transport the fuel through the furnace towards ash removal. Fixed bed technologies
are reliable and generally have relatively low investment costs compared with other
direct combustion technologies. However, a given fixed bed boiler design can usually
handle only a limited range of biomass fuel types.
In fluidized bed boilers, the fuel burns in a constantly mixing suspension of
hot, inert, granular bed material (usually silica sand or dolomite) into which
combustion air enters from below. Because of the very effective mixing achieved,
fluidized bed plants are very flexible in their ability to burn different biomass fuel
types, although the fuel particle size must be relatively uniform. Fluidized bed
systems have high investment and operating costs.
In dust combustion, fuel in the form of small particles such as sawdust or crop
residue shavings is injected along with air into the combustion chamber, and
combustion takes place with the fuel in suspension.
16
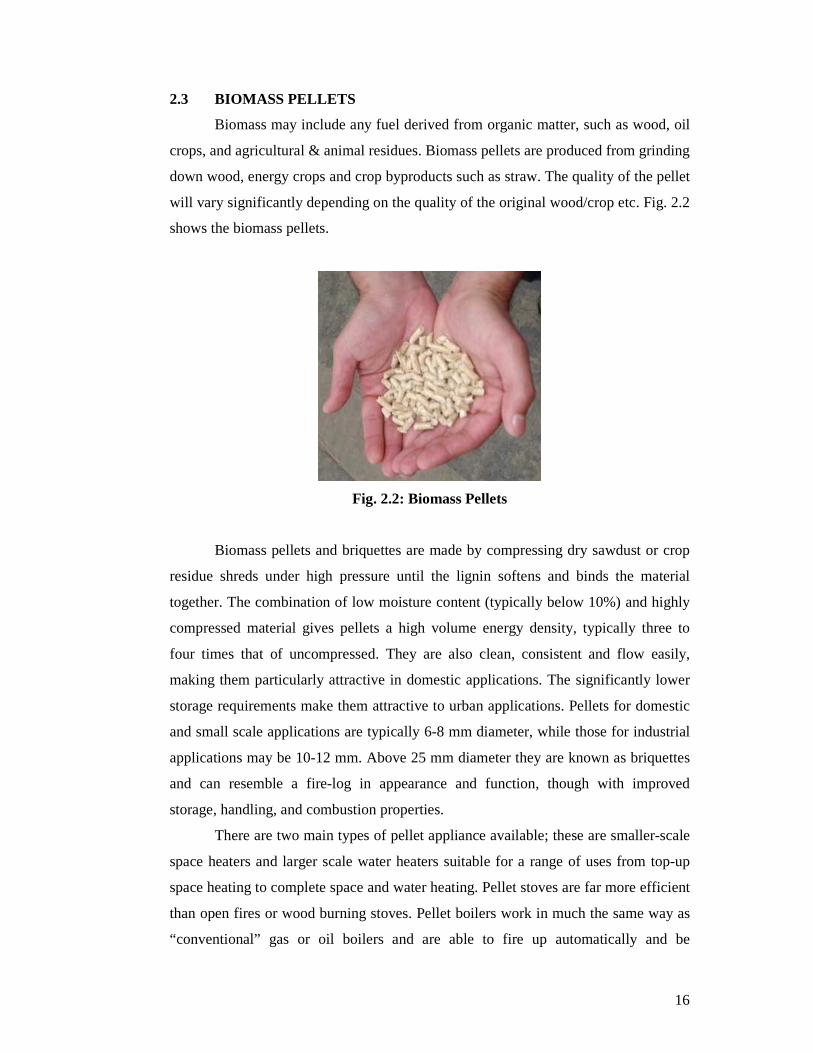
2.3 BIOMASS PELLETS
Biomass may include any fuel derived from organic matter, such as wood, oil
crops, and agricultural & animal residues. Biomass pellets are produced from grinding
down wood, energy crops and crop byproducts such as straw. The quality of the pellet
will vary significantly depending on the quality of the original wood/crop etc. Fig. 2.2
shows the biomass pellets.
Fig. 2.2: Biomass Pellets
Biomass pellets and briquettes are made by compressing dry sawdust or crop
residue shreds under high pressure until the lignin softens and binds the material
together. The combination of low moisture content (typically below 10%) and highly
compressed material gives pellets a high volume energy density, typically three to
four times that of uncompressed. They are also clean, consistent and flow easily,
making them particularly attractive in domestic applications. The significantly lower
storage requirements make them attractive to urban applications. Pellets for domestic
and small scale applications are typically 6-8 mm diameter, while those for industrial
applications may be 10-12 mm. Above 25 mm diameter they are known as briquettes
and can resemble a fire-log in appearance and function, though with improved
storage, handling, and combustion properties.
There are two main types of pellet appliance available; these are smaller-scale
space heaters and larger scale water heaters suitable for a range of uses from top-up
space heating to complete space and water heating. Pellet stoves are far more efficient
than open fires or wood burning stoves. Pellet boilers work in much the same way as
“conventional” gas or oil boilers and are able to fire up automatically and be
17
controlled by time clocks etc. The ash created will be very small (<2% of total fuel
burnt) provided the pellet is of high enough quality.
Biomass pellets are generally a superior fuel when compared to their raw
feedstock. Not only are the pellets more energy dense, they are also easier to handle
and use in automated feed systems. These advantages, when combined with the
sustainable and ecologically sound properties of the fuel, make it very attractive for
use.
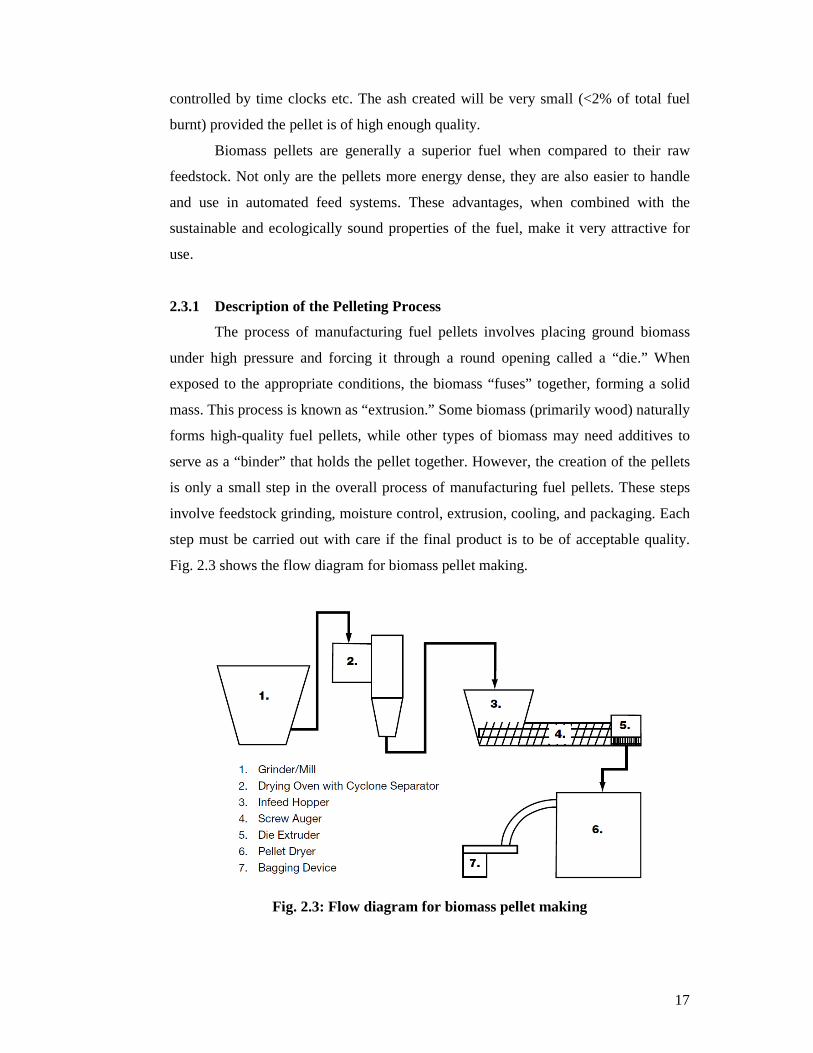
2.3.1 Description of the Pelleting Process
The process of manufacturing fuel pellets involves placing ground biomass
under high pressure and forcing it through a round opening called a “die.” When
exposed to the appropriate conditions, the biomass “fuses” together, forming a solid
mass. This process is known as “extrusion.” Some biomass (primarily wood) naturally
forms high-quality fuel pellets, while other types of biomass may need additives to
serve as a “binder” that holds the pellet together. However, the creation of the pellets
is only a small step in the overall process of manufacturing fuel pellets. These steps
involve feedstock grinding, moisture control, extrusion, cooling, and packaging. Each
step must be carried out with care if the final product is to be of acceptable quality.
Fig. 2.3 shows the flow diagram for biomass pellet making.
Fig. 2.3: Flow diagram for biomass pellet making
18
2.3.2 Feedstock Grinding
Standard-sized pellet mills generally require biomass that is ground to
particles that are no more than 3 millimeters in size. Several types of equipment are
available to carry out this task. If the biomass is quite large and dense (e.g., wood),
the material is first run through a “chipper,” and then run through a hammer mill or
similar device to reduce the particles to the required size. Smaller and softer biomass
(e.g., straw) can be fed directly into the hammer mill without first being chipped.
2.3.3 Moisture Control
Maintaining an appropriate moisture level in your feedstock is vital for overall
quality of the final pellets. For wood, the required moisture level of the feedstock is at
or near 15 percent. Other types of biomass have other requirements—you may need to
experiment a bit. Moisture can be removed from the feedstock by oven-drying or by
blowing hot air over or through the particles. If the feedstock is too dry, moisture can
be added by injecting steam or water into the feedstock.
2.3.4 Extrusion
The pellet is actually created in this step. A roller is used to compress the
biomass against a heated metal plate called a “die.” The die includes several small
holes drilled through it, which allow the biomass to be squeezed through under high
temperature and pressure conditions. If the conditions are right, the biomass particles
will fuse into a solid mass, thus turning into a pellet. A blade is typically used to slice
the pellet to a predefined length as it exits the die. Some biomass tends to fuse
together better than other biomass. Sawdust is an especially suitable feedstock for
pelleting because the lignin that is naturally present in the wood acts as a glue to hold
the pellet together. Grasses tend to not fuse nearly as well, and the resulting pellets are
less dense and more easily broken. The proper combination of input material
properties and pelleting equipment operation may minimize or eliminate this problem.
It is also possible to add a “binder” material to the biomass to help it stick together, or
to mix a fraction of sawdust, with similar results. Distillers Dry Grains (a product of
the corn ethanol industry) are reported to improve the binding properties of some
biomass.
19
2.3.5 Cooling
Pellets, as they leave the die, are quite hot (~150°C) and fairly soft. Therefore,
they must be cooled and dried before they are ready for use. This is usually achieved
by blowing air through the pellets as they sit in a metal bin. The final moisture content
of the pellets should be no higher than 8 percent.
2.3.6 Packaging
Pellets are typically sold in 18-kilogram bags, which can be easily filled using
an overhead hopper and conveyor belt arrangement. The bags should be clearly
labeled with the type of pellet, their grade (i.e., premium or standard), and their heat
content.
2.4 ENERGY REQUIREMENTS FOR PELLET MANUFACTURE
Pellet manufacture requires quite a bit of energy, both for drying damp
feedstock and for running the various pieces of machinery. Large plants typically burn
a portion of their feedstock to provide heat for drying, whereas smaller facilities often
use other means. As a rule of thumb, a pelletizer requires between 50 and 100
kilowatts of electrical demand for every ton per hour of production capacity. In
addition, electricity is usually needed to operate any chopping, grinding, drying,
cooling, and bagging equipment that is in use. If a reliable source of electricity is not
available, gasoline or diesel-based equipment is available.
2.5 ADVANTAGES OF BIOMASS PELLETS
Biomass pellets have following advantages:
� Low moisture content, typically <10%
� High volume energy density: 3-3.5 MWh/m3
� Many different designs of pellet store available off the shelf
� Usually low ash <1%
� Relatively compact storage requirements
2.6 COMPOSTING
Composting is the biological decomposition of organic materials by
microorganisms under controlled, aerobic conditions to a relatively stable humus-like
20
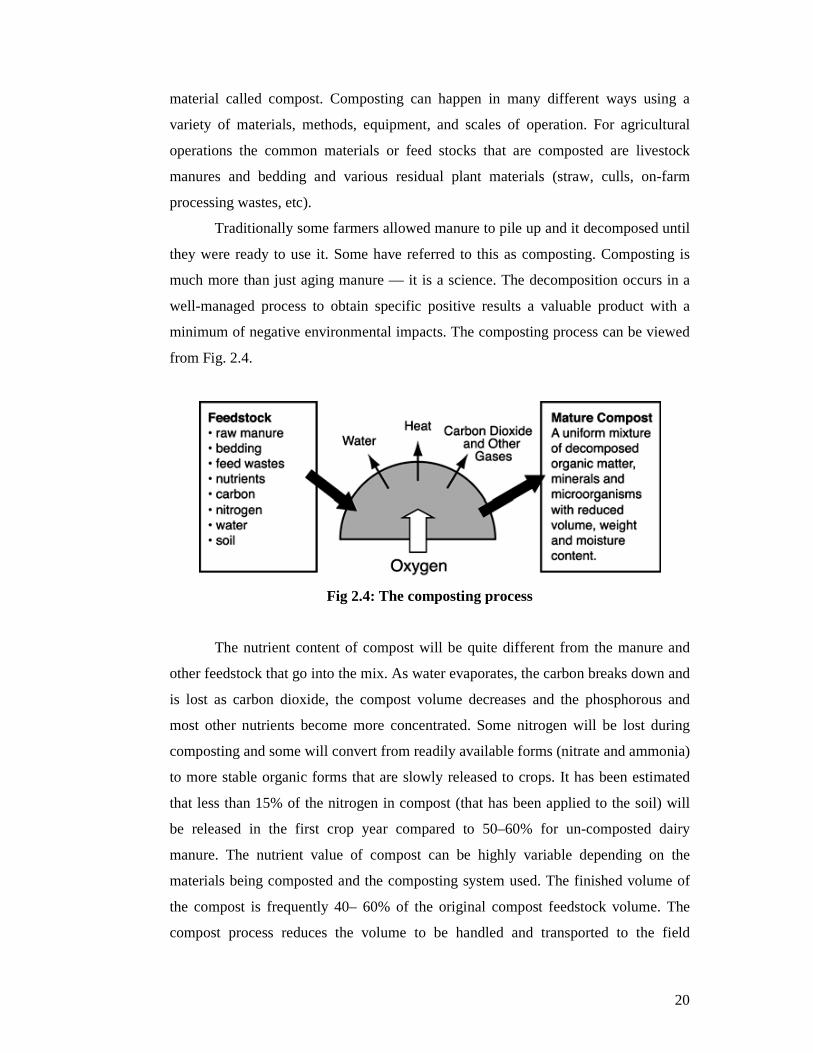
material called compost. Composting can happen in many different ways using a
variety of materials, methods, equipment, and scales of operation. For agricultural
operations the common materials or feed stocks that are composted are livestock
manures and bedding and various residual plant materials (straw, culls, on-farm
processing wastes, etc).
Traditionally some farmers allowed manure to pile up and it decomposed until
they were ready to use it. Some have referred to this as composting. Composting is
much more than just aging manure — it is a science. The decomposition occurs in a
well-managed process to obtain specific positive results a valuable product with a
minimum of negative environmental impacts. The composting process can be viewed
from Fig. 2.4.
Fig 2.4: The composting process
The nutrient content of compost will be quite different from the manure and
other feedstock that go into the mix. As water evaporates, the carbon breaks down and
is lost as carbon dioxide, the compost volume decreases and the phosphorous and
most other nutrients become more concentrated. Some nitrogen will be lost during
composting and some will convert from readily available forms (nitrate and ammonia)
to more stable organic forms that are slowly released to crops. It has been estimated
that less than 15% of the nitrogen in compost (that has been applied to the soil) will
be released in the first crop year compared to 50–60% for un-composted dairy
manure. The nutrient value of compost can be highly variable depending on the
materials being composted and the composting system used. The finished volume of
the compost is frequently 40– 60% of the original compost feedstock volume. The
compost process reduces the volume to be handled and transported to the field
21
utilization site. It also concentrates many of the nutrients in the compost material
compared to their concentrations in the original materials. Well-managed compost
reduces odors and runoff moisture to reduce potential environmental hazards.
2.7 ADVANTAGES OF COMPOSTING
Composting has following advantages:
� Reduce/eliminate pathogens
� Reduce volume and moisture content
� Reduces viable weed seeds
� Reduces insect larvae (fly problems)
� Reduce odor
� Stabilize organic components and nutrients
� Produce a soil amendment/fertilizer
2.8 DISADVANTAGES OF COMPOSTING
Composting has following disadvantages:
� Pathogen control requires high temperatures and good aeration
� Often requires additional bulking material (carbon)
� Long processing time
� Poorly run processes achieve very little
� Land required for composting and storage areas
� May require large investment
� Requires more labour
2.9 COMPOSTING SYSTEMS
There are many different methods and types of equipment and structures
suitable for composting. These include:
1. Windrow/pile composting – turning
2. Windrow/pile composting – active aeration
3. Windrow/pile composting – passive aeration
4. Windrow/pile composting – static pile
5. In-vessel composting
6. Vermi-composting
22
2.9.1 Windrow/pile Composting – Turning
There are several advantages of turning the compost windrow. Thorough
turning will ensure that there is a uniform mix of the feedstock materials throughout
the windrow. This reduces the likelihood of hot spots where there is overheating or
accumulation of high moisture materials that reduce microbial activity. The frequency
of turning can be managed to respond to changes in moisture or temperature as
required. The moisture content of the windrow usually decreases after turning. If the
compost has become too dry, water can be added when turning to increase the
moisture within the windrow and to increase the composting activity of the
microorganisms. Turning adds air spaces and oxygen in the windrow.
Turning at regular intervals during the initial 2–3 weeks of composting is
advisable to reach and maintain temperatures above 55ºC for 15 days. This
temperature is known to kill most pathogens and weed seeds.
2.9.2 Windrow/pile Composting – Active Aeration,
Static pile Active aeration of windrows requires more careful design for
appropriate airflows, and usually a more expensive system than turned windrow
systems. The most common design of this system is to place aeration pipes along the
length of the windrow with adequate holes for proper airflow. The pipes and middle
portion of the base of the windrow is then covered with a porous material such as
wood chips. The windrow is then placed on top of the aeration bed. Proper mixing of
the feedstock materials and optimum moisture contents are critical to success since
these windrows are usually not turned therefore not disturbing the aeration system).
Fans are attached to the ventilation tube and air is either blown into the windrow
(positive pressure) or vacuumed out of the pipe (negative pressure). When using a
negative pressure, biofilters may be needed to remove the odors from the exhausted
air. The aerated windrows also need to be covered with an insulated blanket of
material to allow adequate heating of the surface of the materials that need to be
composted. This covering is frequently straw or mature compost and is 6-12 in. thick
over the whole windrow.
2.9.3 Windrow/pile Composting – Passive Aeration,
Static piles sometimes known as PAWS (Passive Aeration Windrow System),
this system involves the insertion of aeration pipes into or under the pile. The
23
feedstock materials are usually piled on a bed of coarse material such as wood chips
and/or aerated pipes to improve aeration. The air is permitted to flow passively
through the pipes and the coarse material under the pile.
PAWS allows better aeration than the static piles and can achieve higher
temperatures, but can be subject to many of the same problems especially if the
mixing is inadequate or if the feedstock materials are of improper C:N ratio or
moisture. The aeration pipes make it difficult to turn the piles as a means of correcting
problems such as hot spots. As a result the degree of composting may vary throughout
the pile.
2.9.4 Windrow/pile Composting – Static Piles, not Aerated
This is a very low management system where you pile it and leave it. While it
is the easiest and least expensive composting system, it can also be the most
troublesome and produce the poorest quality compost. When there is no turning of a
windrow, the uniform mixing of feedstock materials and the moisture content going
into the windrow are very critical. There needs to be enough void space (porosity) in
the materials to allow air to penetrate the windrow. Water is released as the feedstock
breaks down, but if there is insufficient airflow, this water goes to the bottom of the
pile creating anaerobic conditions near the bottom of the pile. This problem is
increased if the windrow is not covered to prevent the inclusion of rainwater. Under
hot, dry weather conditions, the surface layer of the windrow can become too dry for
microorganisms to work effectively. Turning the pile would mix it to create more
uniform moisture content throughout the windrow.
Windrows that are not turned and do not have mechanical aeration systems,
frequently do not reach adequate temperatures to kill pathogens and weed seeds. This
is especially true in anaerobic zones within the centre of the windrow, as well as near
the surface of the windrow, where temperatures are well below the temperatures
required for pathogen kill (55ºC).
2.9.5 In-vessel Composting
In-vessel composting systems include a group of composting methods. They
have the greatest amount of design requirements. They range from concrete channels
with mechanical mixers to rotating steel drum type systems. Many are continuous
flow and designed for high capacity commercial composting operations. Frequently
24
they are contained in buildings designed for the purpose. High initial cost and
continuous management are disadvantages. They are usually used for high volume or
central composting systems and require a higher level of management than other
systems discussed here. Some designs use rectangular concrete channels that may
have aerated floors and be turned either with turners that travel on overhead rails or in
some on-farm cases by using multiple channels and tractor-loaders to turn and move
the material from one channel to another.
2.9.6 Vermi-composting
Vermi-composting is worm composting. Common worm species for this type
of composting are Eisenia foetida and Lumbricus rubellus. These are sometimes
called "red wigglers" or manure worms. These worms are added to the feedstock
materials to assist in the decomposition of the organic matter and transform it into
worm castings. This type of composting does not reach high temperatures but
research is showing that there can be good kill of pathogens and weed seeds.
2.10 GASIFICATION
Gasification is a thermo-chemical process in which carbonaceous (carbon-
rich) feed stocks such as coal or biomass are converted into a gas consisting of
hydrogen and carbon monoxide (and lesser amounts of carbon dioxide and other trace
gases) under oxygen depleted, high pressure, high-heat and/or steam conditions. The
resulting gaseous compound is called Syngas.
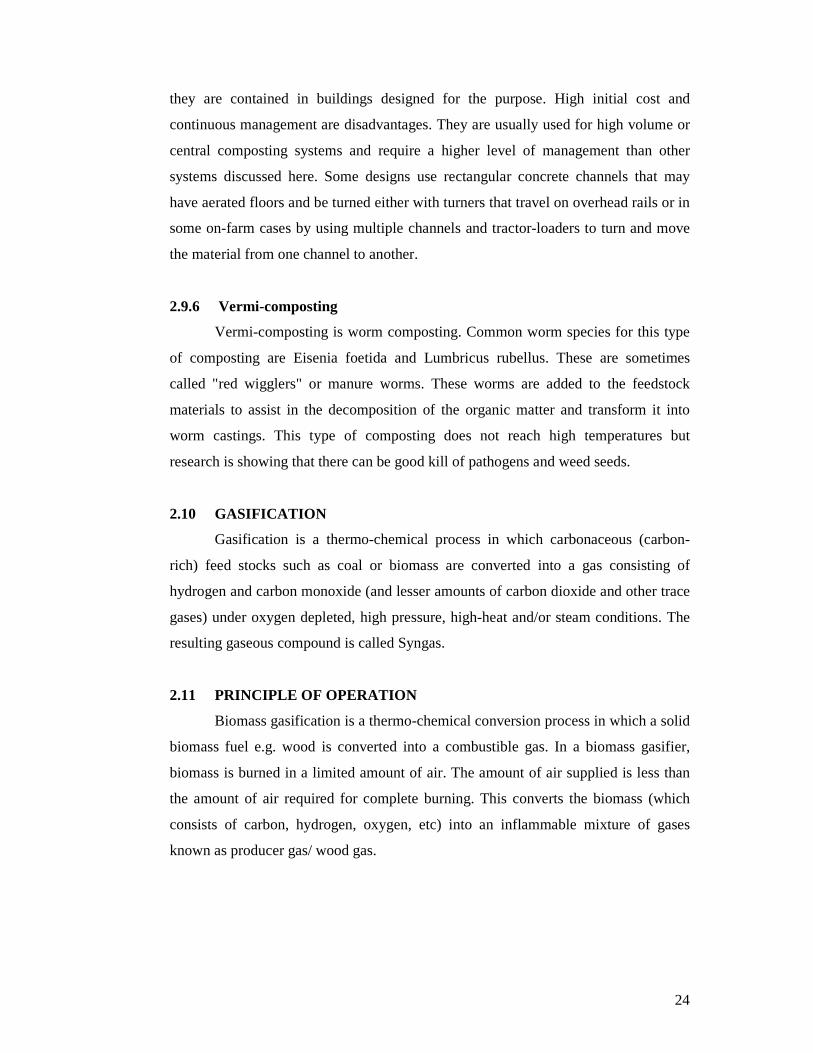
2.11 PRINCIPLE OF OPERATION
Biomass gasification is a thermo-chemical conversion process in which a solid
biomass fuel e.g. wood is converted into a combustible gas. In a biomass gasifier,
biomass is burned in a limited amount of air. The amount of air supplied is less than
the amount of air required for complete burning. This converts the biomass (which
consists of carbon, hydrogen, oxygen, etc) into an inflammable mixture of gases
known as producer gas/ wood gas.
25
Fig 2.5: A typical biomass gassifier
The producer gas consists of carbon monoxide (CO), hydrogen (H2), and
methane (CH4), along with carbon dioxide (CO2) and nitrogen (N2). In a gasifier
biomass is progressively heated from the ambient temperature to a temperature of
around 1100 oC. The main reactions which take place in a gasifier are:
1. DRYING: Biomass fuels usually contain up to 35% moisture. When the
biomass is heated to around 100oC, the moisture gets converted into steam.
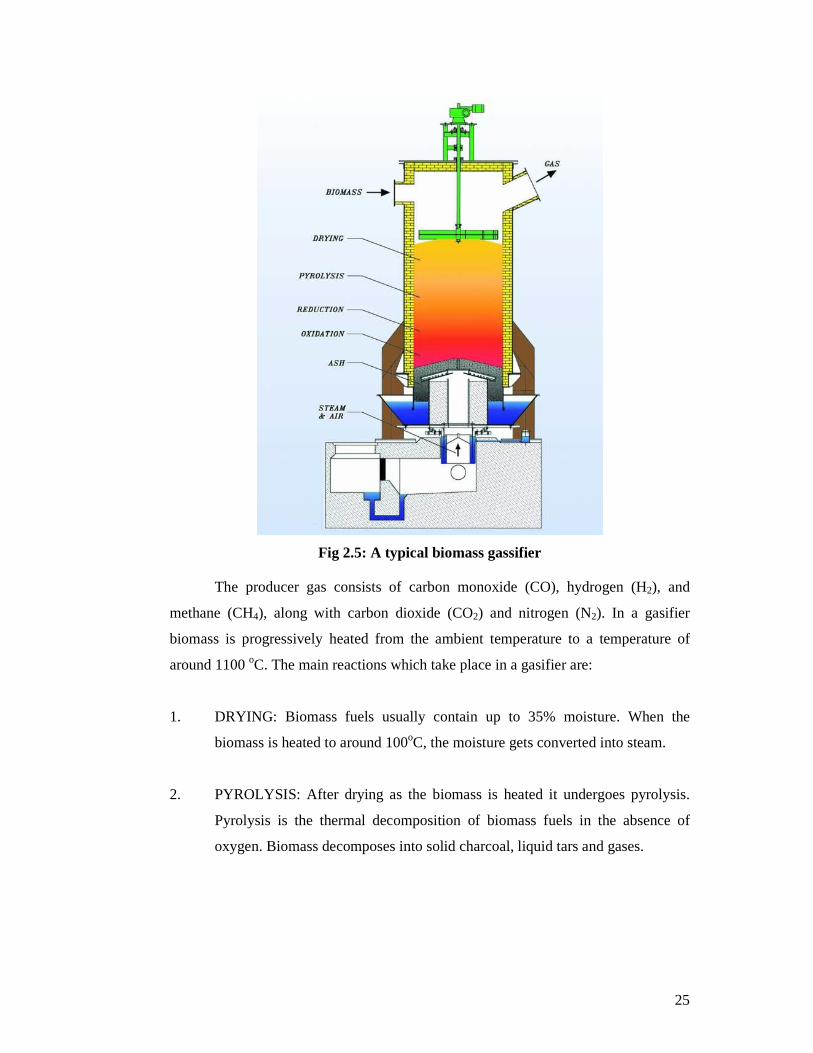
2. PYROLYSIS: After drying as the biomass is heated it undergoes pyrolysis.
Pyrolysis is the thermal decomposition of biomass fuels in the absence of
oxygen. Biomass decomposes into solid charcoal, liquid tars and gases.
26
Fig 2.6: Pyrolysis of carbonaceous fuels & Gasification of char
3. OXIDATION: Air is introduced in a gasifier in the oxidation zone. The
oxidation takes place at about 700-1400 oC, in which the solid carbonized fuel
reacts with oxygen in the air producing carbon dioxide and releasing heat.
C+O2 = CO2 + 406 kJ/g.mol
4. REDUCTION: At higher temperatures and under reducing conditions several
reactions take place which results in formation of CO, H2 and CH4.
CO2 + C = 2CO -172.6 kJ/g.mol
C+H2O = CO + H2 -131.4 kJ/g.mol
CO2+H2 = CO +H2O -41.2 kJ/g.mol
C+2H2 = CH4 +75 kJ/g.mol
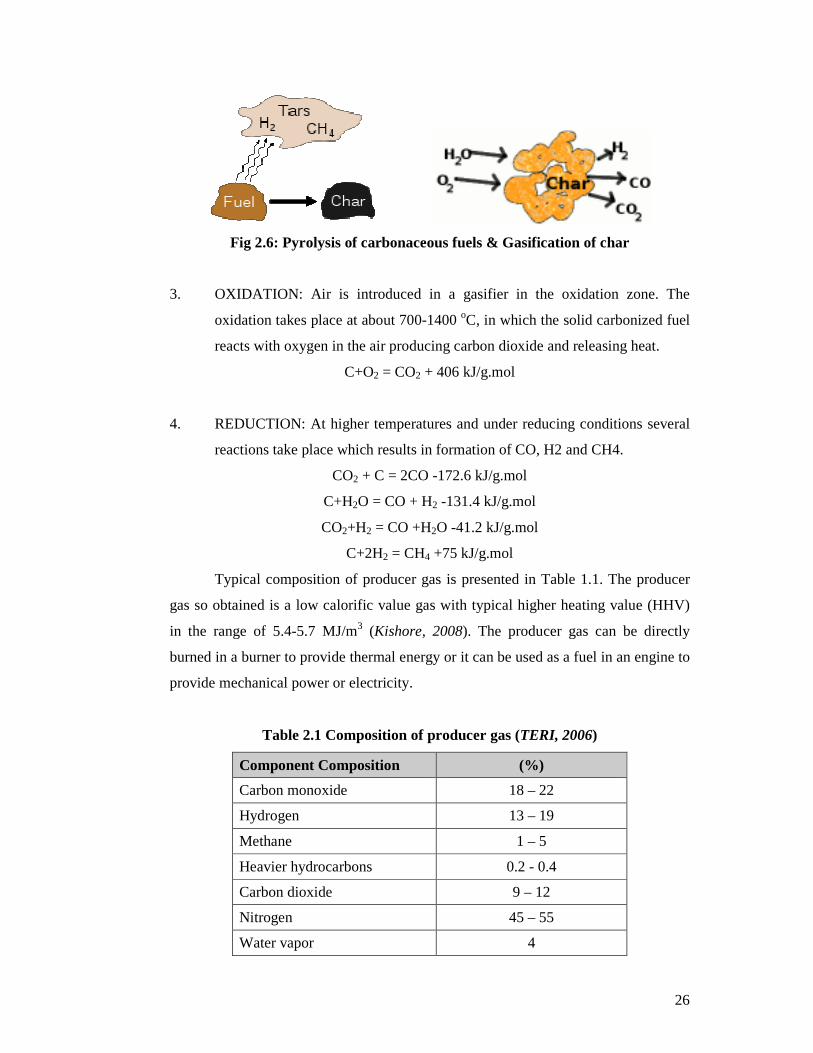
Typical composition of producer gas is presented in Table 1.1. The producer
gas so obtained is a low calorific value gas with typical higher heating value (HHV)
in the range of 5.4-5.7 MJ/m3 (Kishore, 2008). The producer gas can be directly
burned in a burner to provide thermal energy or it can be used as a fuel in an engine to
provide mechanical power or electricity.
Table 2.1 Composition of producer gas (TERI, 2006)
Component Composition (%)
Carbon monoxide 18 – 22
Hydrogen 13 – 19
Methane 1 – 5
Heavier hydrocarbons 0.2 - 0.4
Carbon dioxide 9 – 12
Nitrogen 45 – 55
Water vapor 4
27
2.12 HISTORY ON GASIFICATION
Gasification is an old technology with a long history of development. The
process was mainly used from the mid-1800’s through the early-1900’s to produce
“town gas” from coal for heating and lighting purposes. The subsequent development
of natural gas fields soon replaced “town gas." World War II brought a resurgence of
gasification when petroleum starved Europeans used wood gas generators to power
vehicles. But the need for liquid fuels remained and German engineers devised a way
to make synthetic liquid fuel from gasified coal.
The 1970’s brought The Arab Oil Embargo and the “energy crisis” which
prompted the U.S. government to support industrial scale gasification projects. From
this development came the first Integrated Gasification Combined Cycle (IGCC)
electric generating plant. Presently, several IGCC power plants are operating
throughout the world. And crude oil price spikes and geopolitical instabilities in major
oil-producing countries have generated serious interest in using gasification for GTL
(Gas to Liquid) synthetic fuel processes.
2.13 TYPES OF GASIFIERS
Many design variations of Gasification Reactors (Gasifiers) exist, however,
depending upon the type of flow conditions present in the equipment, they all fall into
one of three general categories:
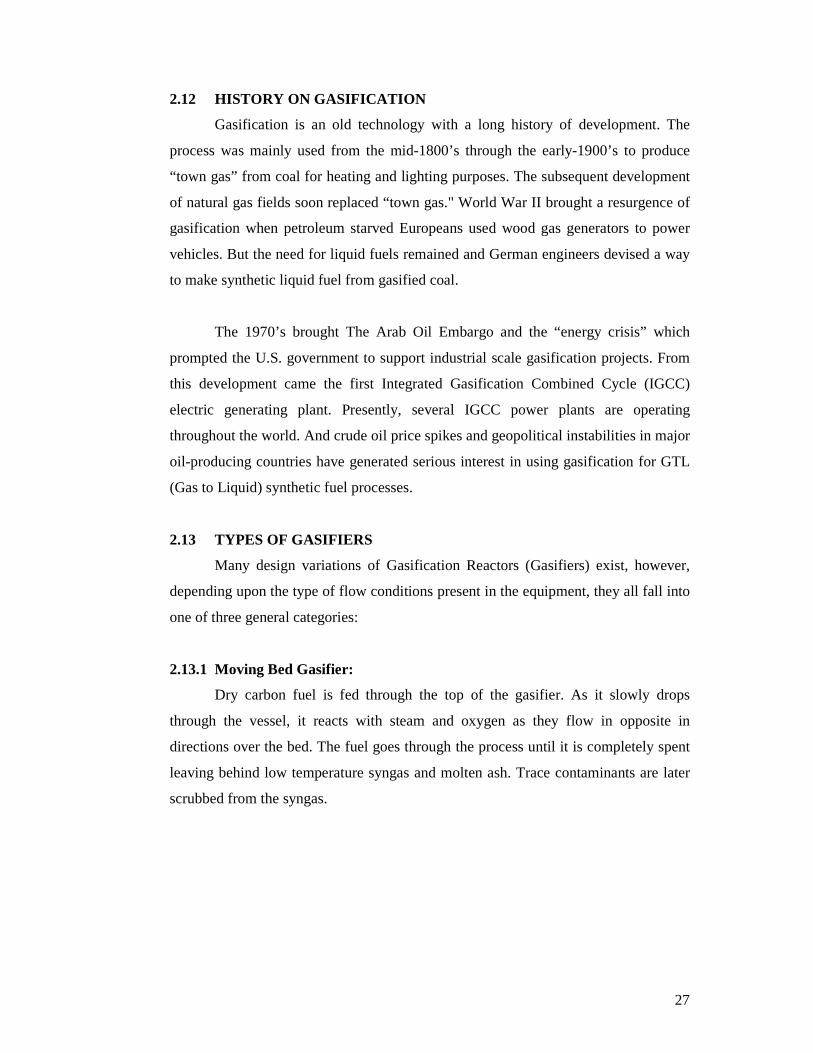
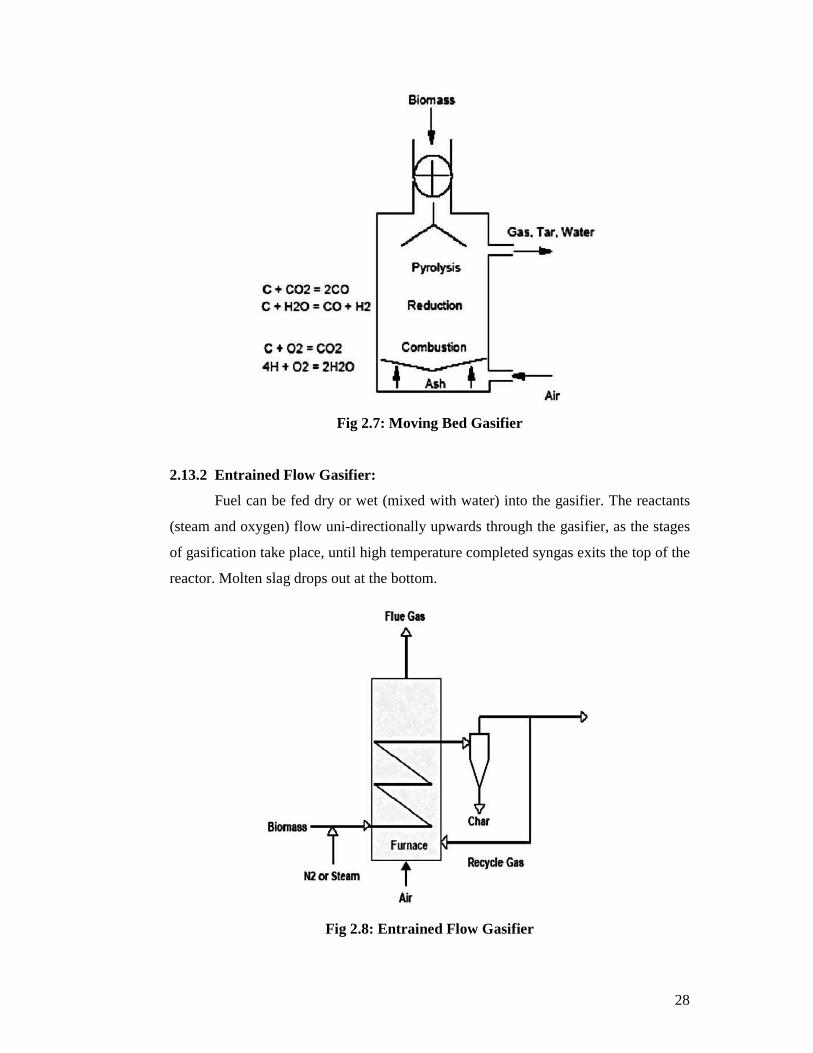
2.13.1 Moving Bed Gasifier:
Dry carbon fuel is fed through the top of the gasifier. As it slowly drops
through the vessel, it reacts with steam and oxygen as they flow in opposite in
directions over the bed. The fuel goes through the process until it is completely spent
leaving behind low temperature syngas and molten ash. Trace contaminants are later
scrubbed from the syngas.
28
Fig 2.7: Moving Bed Gasifier
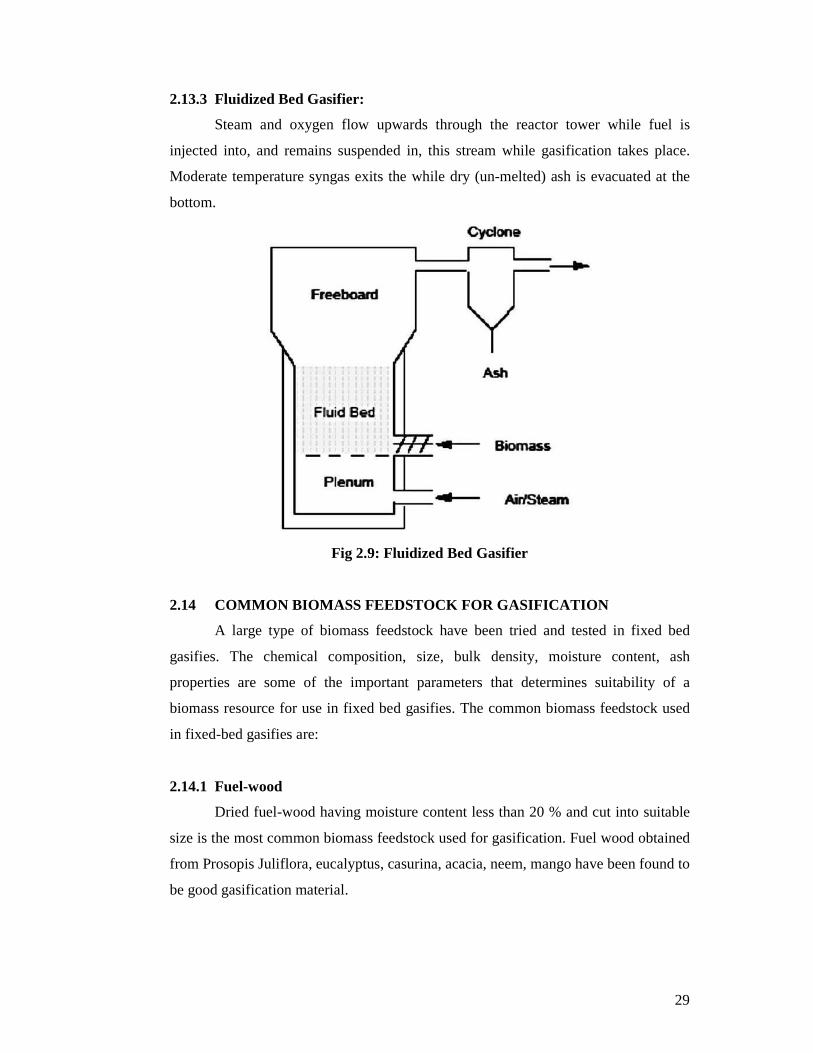
2.13.2 Entrained Flow Gasifier:
Fuel can be fed dry or wet (mixed with water) into the gasifier. The reactants
(steam and oxygen) flow uni-directionally upwards through the gasifier, as the stages
of gasification take place, until high temperature completed syngas exits the top of the
reactor. Molten slag drops out at the bottom.
Fig 2.8: Entrained Flow Gasifier
29
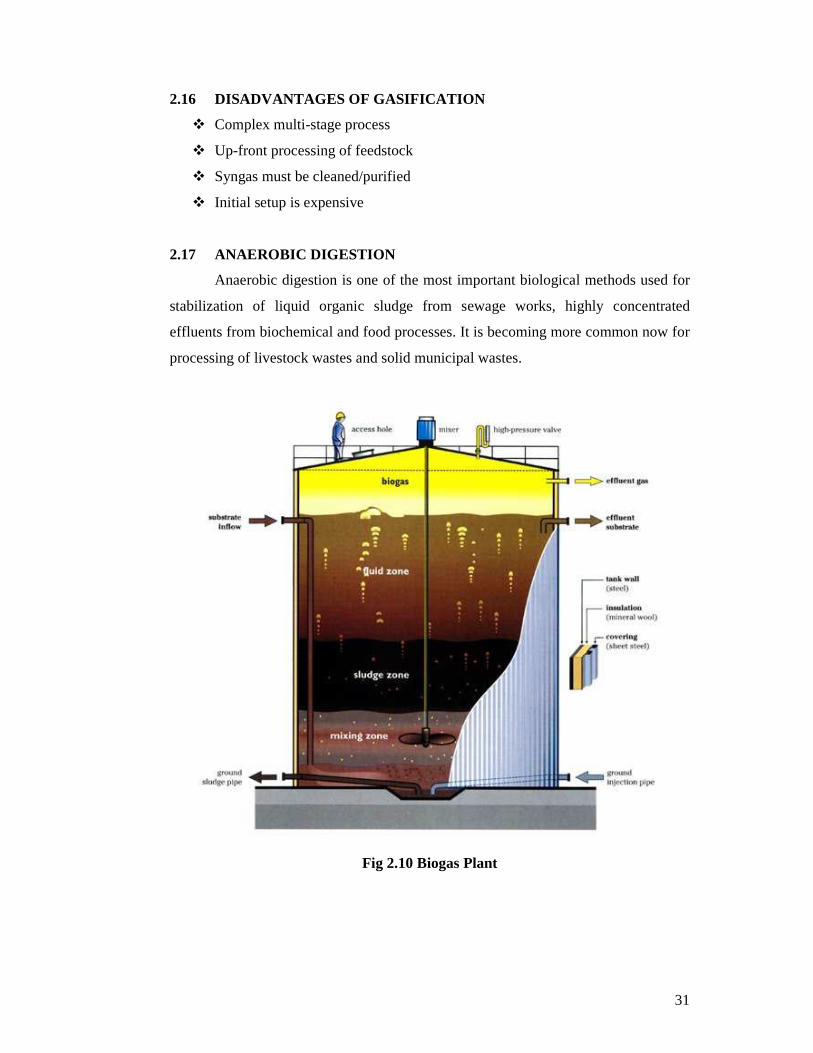
2.13.3 Fluidized Bed Gasifier:
Steam and oxygen flow upwards through the reactor tower while fuel is
injected into, and remains suspended in, this stream while gasification takes place.
Moderate temperature syngas exits the while dry (un-melted) ash is evacuated at the
bottom.
Fig 2.9: Fluidized Bed Gasifier
2.14 COMMON BIOMASS FEEDSTOCK FOR GASIFICATION
A large type of biomass feedstock have been tried and tested in fixed bed
gasifies. The chemical composition, size, bulk density, moisture content, ash
properties are some of the important parameters that determines suitability of a
biomass resource for use in fixed bed gasifies. The common biomass feedstock used
in fixed-bed gasifies are:
2.14.1 Fuel-wood
Dried fuel-wood having moisture content less than 20 % and cut into suitable
size is the most common biomass feedstock used for gasification. Fuel wood obtained
from Prosopis Juliflora, eucalyptus, casurina, acacia, neem, mango have been found to
be good gasification material.

30
2.14.2 Biomass Briquettes:
Due to low bulk densities (50-200 kg/m3), many non-woody biomass residues
poses problem in direct utilization in fixed-bed gasifies. Such biomass materials can
be densified and converted into briquettes (density: 800-1200 kg/m3) and can then be
easily used in gasifiers. Briquettes made from sawdust, coffee husk, groundnut shells,
pulverized mustard stalk, and cotton sticks are found to be good feedstock for fixed
bed gasifiers.
2.14.3 Agriculture Residue:
Several agriculture residues have been successfully used directly (without
densification) in fixed bed gasifiers. However, it should be noted that utilization of
some of these materials necessitates modification in the design of gasifiers which are
designed primarily for utilization of fuelwood or biomass briquettes. Some of the
prominent agriculture residues which have been used in fixed-bed gasifiers are:
coconut shells, stalks such as mustard, arhar and cotton, rice husk, cashew nut shell,
corn cob, etc.
2.15 ADVANTAGES OF GASIFICATION
� Feedstock flexibility
� Product flexibility
� Near-zero emissions
� High efficiency
� Energy security
� Gasification plants produce significantly lower quantities of criteria air
pollutants.
� Gasification can reduce the environmental impact of waste disposal because it
can use waste products as feed stocks generating valuable products from
materials that would otherwise be disposed as wastes.
� Gasification's byproducts are non-hazardous and are readily marketable.
� Gasification plants use significantly less water than traditional coal-based
power generation, and can be designed so they recycle their process water,
discharging none into the surrounding environment.
31
2.16 DISADVANTAGES OF GASIFICATION
� Complex multi-stage process
� Up-front processing of feedstock
� Syngas must be cleaned/purified
� Initial setup is expensive
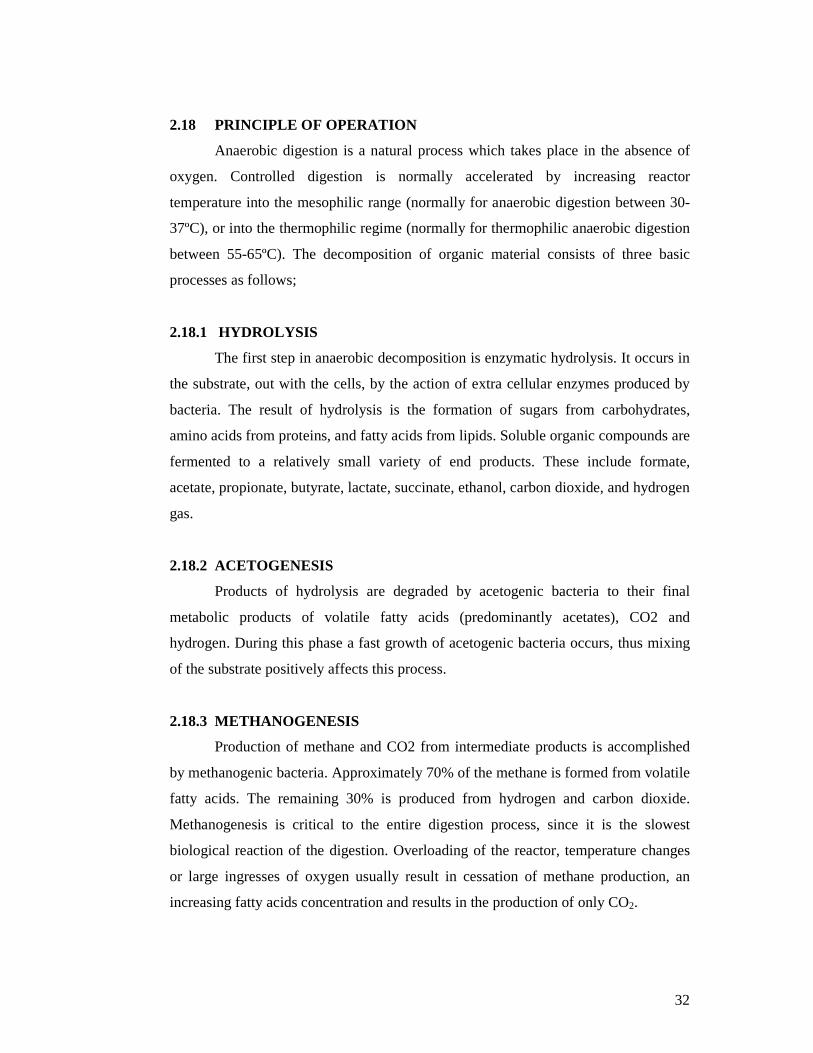
2.17 ANAEROBIC DIGESTION
Anaerobic digestion is one of the most important biological methods used for
stabilization of liquid organic sludge from sewage works, highly concentrated
effluents from biochemical and food processes. It is becoming more common now for
processing of livestock wastes and solid municipal wastes.
Fig 2.10 Biogas Plant
32
2.18 PRINCIPLE OF OPERATION
Anaerobic digestion is a natural process which takes place in the absence of
oxygen. Controlled digestion is normally accelerated by increasing reactor
temperature into the mesophilic range (normally for anaerobic digestion between 30-
37ºC), or into the thermophilic regime (normally for thermophilic anaerobic digestion
between 55-65ºC). The decomposition of organic material consists of three basic
processes as follows;
2.18.1 HYDROLYSIS
The first step in anaerobic decomposition is enzymatic hydrolysis. It occurs in
the substrate, out with the cells, by the action of extra cellular enzymes produced by
bacteria. The result of hydrolysis is the formation of sugars from carbohydrates,
amino acids from proteins, and fatty acids from lipids. Soluble organic compounds are
fermented to a relatively small variety of end products. These include formate,
acetate, propionate, butyrate, lactate, succinate, ethanol, carbon dioxide, and hydrogen
gas.
2.18.2 ACETOGENESIS
Products of hydrolysis are degraded by acetogenic bacteria to their final
metabolic products of volatile fatty acids (predominantly acetates), CO2 and
hydrogen. During this phase a fast growth of acetogenic bacteria occurs, thus mixing
of the substrate positively affects this process.
2.18.3 METHANOGENESIS
Production of methane and CO2 from intermediate products is accomplished
by methanogenic bacteria. Approximately 70% of the methane is formed from volatile
fatty acids. The remaining 30% is produced from hydrogen and carbon dioxide.
Methanogenesis is critical to the entire digestion process, since it is the slowest
biological reaction of the digestion. Overloading of the reactor, temperature changes
or large ingresses of oxygen usually result in cessation of methane production, an
increasing fatty acids concentration and results in the production of only CO2.
33
2.19 HISTORY OF ANAEROBIC DIGESTION
Historical evidence indicates that the anaerobic digestion (AD) process is one
of the oldest technologies. However, the industrialization of AD began in 1859 with
the first digestion plant in Bombay. By 1895, biogas was recovered from a sewage
treatment facility and used to fuel street lamps in Exeter, England. Research led by
Buswell and others in the 1930s identified anaerobic bacteria and the conditions that
promote methane production. As the understanding of the AD process and its benefits
improved, more sophisticated equipments and operational techniques emerged. The
result was the used of closed tank and heating and mixing systems to optimize AD.
Regardless of improvements, AD suffered from the development of aerobic treatment
and low costs of coal or petroleum. While AD was used only for the treatment of
wastewater sludge digestion, developing countries such as India and China embraced
the technology. Small-scale AD systems were mostly used for energy and sanitation
purposes. Numerous failures were reported. Nevertheless, technical improvements
and increasing energy prices have led to a diversification of the waste treated and
larger size AD plants.
2.20 ENERGY CONVERSION
The anaerobic degradation of organic substances to its most reduced form,
methane (CH4), is a microbial process. The energy released, originally stored in the
substrate, and is predominantly recovered by the formed methane.
33g org. material = 22g CO2 + 8g CH4 + 3g biomass
The AD plant will provide biogas which will be used to generate two forms of
energy, electricity and heat, in combined heat and power (CHP) units of gas engines.
Anaerobic digestion is a proven technology but it is not a simple process. It requires
storage space for the raw and treated material, dosing pumps, a gas tight reactor with
heat exchanger and mixing facilities, a bio-gas reservoir, boiler and/or internal
combustion engine with an electrical energy generator. To make the process
economical, with a payback period of less than 5 years, a high percentage of biogas
has to be utilised. This target is achievable in larger plants, where electrical
energy/heat co-generation is the most practical design.
34
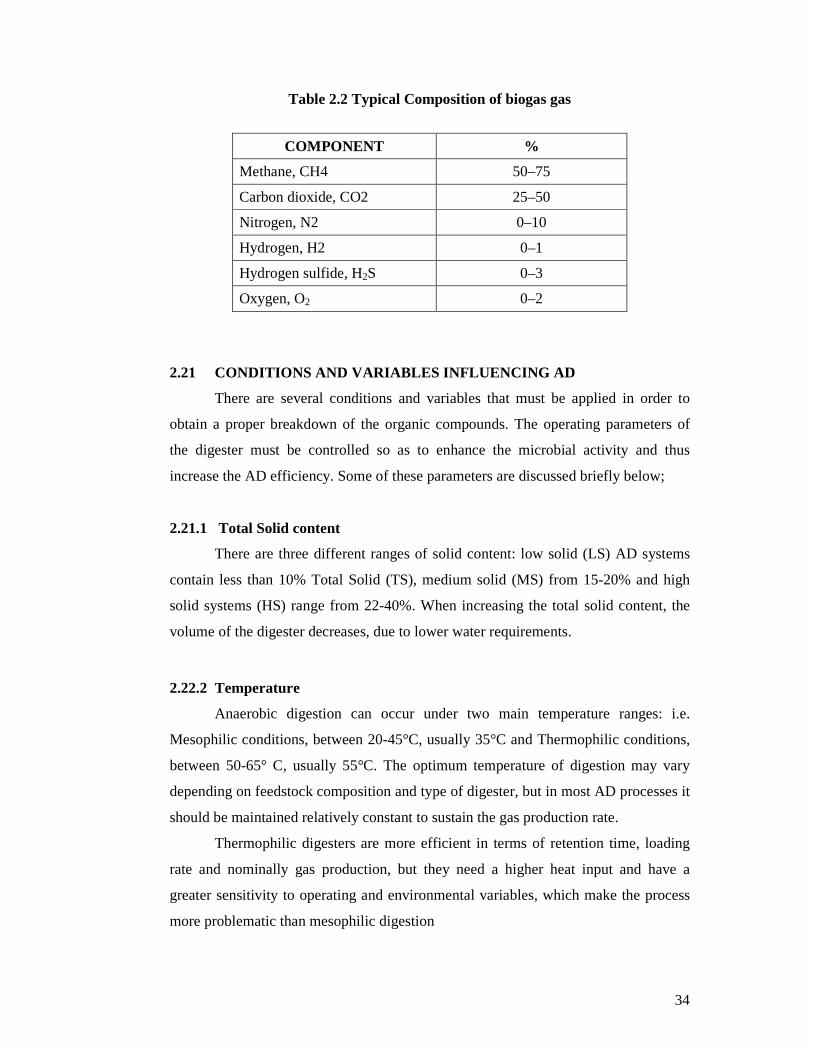
Table 2.2 Typical Composition of biogas gas
COMPONENT %
Methane, CH4 50–75
Carbon dioxide, CO2 25–50
Nitrogen, N2 0–10
Hydrogen, H2 0–1
Hydrogen sulfide, H2S 0–3
Oxygen, O2 0–2
2.21 CONDITIONS AND VARIABLES INFLUENCING AD
There are several conditions and variables that must be applied in order to
obtain a proper breakdown of the organic compounds. The operating parameters of
the digester must be controlled so as to enhance the microbial activity and thus
increase the AD efficiency. Some of these parameters are discussed briefly below;
2.21.1 Total Solid content
There are three different ranges of solid content: low solid (LS) AD systems
contain less than 10% Total Solid (TS), medium solid (MS) from 15-20% and high
solid systems (HS) range from 22-40%. When increasing the total solid content, the
volume of the digester decreases, due to lower water requirements.
2.22.2 Temperature
Anaerobic digestion can occur under two main temperature ranges: i.e.
Mesophilic conditions, between 20-45°C, usually 35°C and Thermophilic conditions,
between 50-65° C, usually 55°C. The optimum temperature of digestion may vary
depending on feedstock composition and type of digester, but in most AD processes it
should be maintained relatively constant to sustain the gas production rate.
Thermophilic digesters are more efficient in terms of retention time, loading
rate and nominally gas production, but they need a higher heat input and have a
greater sensitivity to operating and environmental variables, which make the process
more problematic than mesophilic digestion
35
The sterilization of the waste is also linked to the temperature. The higher it is
the more effective it is in eliminating pathogens, viruses and seeds.
2.22.3 Retention time
Retention time is the time needed to achieve the complete degradation of the
organic matter. The retention time varies with process parameters, such as process
temperature and waste composition. The retention time for waste treated in a
mesophilic digester ranges from 15 to 30 days and 12-14 days for thermophilic
digester.
2.22.4 pH
The optimal pH values for the acidogenesis and methanogenesis stages are
different. During acidogenesis, acetic, lactic and propionic acids are formed and, thus
the pH falls. Low pH can inhibit acidogenesis and pH below 6.4 can be toxic for
methane-forming bacteria. The optimal range for methanogenesis is between 6.6 to 7.
An optimal pH range for all is between 6.4 and 7.2.
2.22.5 Carbon to Nitrogen ratio (C: N)
The relationship between the amount of carbon and nitrogen present in organic
materials is represented by the C: N ratio. Optimum C: N ratios in anaerobic digesters
are between 20 and 30. A high C: N ration is an indication of a rapid consumption of
nitrogen by the methanogens and results in a lower gas production. On the other hand,
a lower C: N ratio causes ammonia accumulation and pH values exceeding 8.5, which
is toxic to methanogenic bacteria. Optimum C: N ratio of the feedstock materials can
be achieved by mixing waste of low and high C: N ratio, such as organic solid waste
mixed with sewage or animal manure.
2.22.6 Mixing
Mixing, within the digester, improves the contact between the micro-
organisms and substrate and improves the bacterial population's ability to obtain
nutrients. Mixing also prevents the formation of scum and the development of
temperature gradients within the digester. However excessive mixing can disrupt the
micro-organisms and therefore slow mixing is preferred.
36
In case of co-digestion, the different feedstocks should be mixed before
entering the digester to ensure a sufficient homogeneity.
2.22.7 Organic loading rate (OLR)/ Volatile Solids (VS)
OLR is a measure of the biological conversion capacity of the AD system.
Feeding the system above its sustainable OLR, results in low biogas yield due to
accumulation of inhibiting substances in the digester slurry (i.e. fatty acids). Under
such circumstances, the feeding rate of the system must be reduced. OLR is a
particularly important control parameter in continuous systems. Many plants have
reported system failure due to overloading. OLR is expressed in kg Chemical Oxygen
Demand (COD) or Volatile Solids (VS) per cubic meter of reactor. It is linked with
retention time for any particular feedstock and anaerobic reactor volume.
Volatile Solids (VS) represents the organic matter in a sample which is
measured as solid content minus ash content, as obtained by complete combustion of
the feed wastes. VS comprise the biodegradable VS (BVS) fraction and the refractory
VS (RVS). High VS content with low RVS is more suitable for AD.
2.23 TYPES OF DIGESTERS
Anaerobic digesters can be classified into the following three categories:
1. single-stage
2. multi-stage
3. batch
The temperature range of the digestion, mesophilic or thermophilic, as well as the
solid content also define the type of reactor used.
2.24 ADVANTAGES OF ANAEROBIC DIGESTION
� The methane produced by AD plants can be collected and managed in an
environmentally sound manner, by using it as a natural gas substitute either
directly, or in the production of hot water, steam or electricity. When
combusted, the methane is converted to CO2, which is much less damaging as
a greenhouse gas (methane is 21 times more powerful than CO2 as a
greenhouse gas).
37
� The methane produced in the digester will be used as an energy source. If it
displaces oil, natural gas or coal, used for the generation of electricity, this
waste management approach has significant greenhouse gas benefits.
� Anaerobic digestion is a net energy producing process. Surplus biogas can be
used to generate electricity and thus defray the cost of the process. Also, the
excess of heat can be sold for heating of large buildings and/or district heating
purposes.
� The compost product produced through the anaerobic digestion of organic
waste is a valuable soil amendment; when added to soil it can improve plant
growth, reduce soil erosion and nutrient runoff, alleviate soil compaction, and
help soil retain water. In addition, there is evidence that compost can suppress
diseases and ward off pests.
� Compost can also reduce the need for artificial fertilizers, which are derived
from natural gas, result in water contamination, and deplete soil health.
Further, greenhouse gases are created during their production and nitrous
oxide (N2O) is released during tillage. This harmful practice can be replaced,
in part, by returning nitrogen bound in organic waste to the soil.
� The quantifiable benefits of displacing artificial fertilizer include reducing the
significant CO2 emissions associated with their manufacture, and reducing the
N2O emissions released through their use.
2.25 DISADVANTAGES OF ANAEROBIC DIGESTION
� Relatively complicated process, the centralized plant has to be run by
specialists
� Complete volatile solids destruction of the waste does not occur in anaerobic
digester
� Possible problems resulting from explosive gas production from aerobically
digested sludge
� Cost of construction of AD is expensive
38
� Difficulty of storage of gas (corrosive)
� Significant consumption of water
� Storage of fertilizer is difficult
� Problem of management of the sludge
� Does not destroy all pathogens
� High operating cost due to temperature management
� Longer start-up time to develop necessary biomass inventory
� May require alkalinity and/or specific ion addition
� May require further treatment with an aerobic treatment process to meet
discharge requirements
� Increased potential for production of odors and corrosive gases.
39
PART- III
ASSESSMENT OF ENVIRONMENTALLY
SOUND TECHNOLOGIES
40
3.1 PROBLEM STATEMENT
Transforming biomass waste into a source of energy is very important from
reduction of the pollution. Resource augmentation by utilizing waste biomass has
emerged as a major issue in both developed and developing countries. There are three
important motivational factors for converting waste biomass into a resource:
1. Economic Benefit
Huge costs can be avoided which are otherwise required to manage huge
volumes of waste through conventional waste management practice, viz.: collection,
transportation, treatment and proper disposal.
2. Energy/ Material Production
Waste biomass contains precious resources which could be obtained in the
form of material or energy to reduce pressure on natural resources which are required
to support economic development and improved living standards. This could also be
in line with strategies for poverty alleviation through income generation activities and
through reducing costs for obtaining energy to support livelihoods.
3. GHG Mitigation
These reductions take place on two accounts. Burning or decomposition of
waste biomass produces GHG emissions and proper management of waste biomass
would reduce these GHG emissions. So far, most of the waste biomass is left in the
fields and to clear the land for planting next crop, farmers use open burning, which
creates local air pollution as well as GHG emissions (CO2). The waste biomass that is
left over the months, gets rotten and generates methane; thus creating GHG emissions.
Hence, converting that waste biomass into an energy source, GHG emissions, which
are caused due to open burning or from rotten waste biomass, could be avoided in
addition to the GHG emissions which are offset due to use of this alternative energy
source.
41
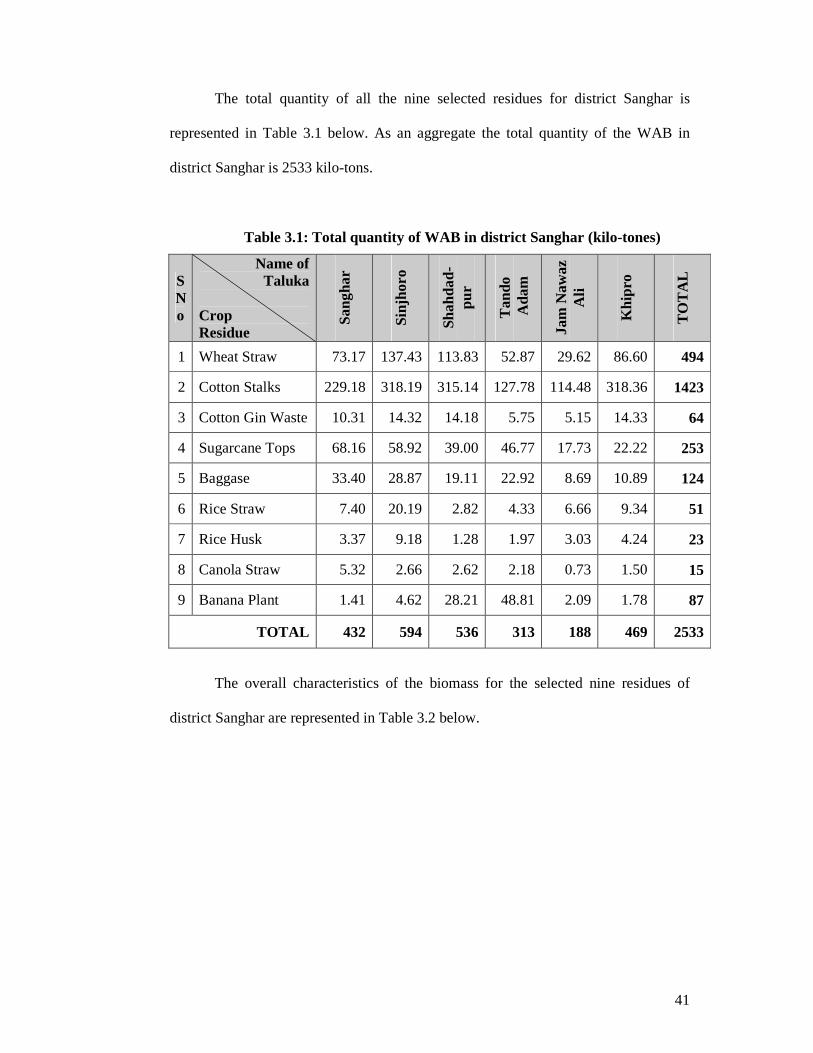
The total quantity of all the nine selected residues for district Sanghar is
represented in Table 3.1 below. As an aggregate the total quantity of the WAB in
district Sanghar is 2533 kilo-tons.
Table 3.1: Total quantity of WAB in district Sanghar (kilo-tones)
S No
Name of Taluka
Crop Residue
San
ghar
Sin
jhor
o
Sha
hdad
- pu
r
Tan
do
Ada
m
Jam
Naw
az
Ali
Khi
pro
TO
TA
L
1 Wheat Straw 73.17 137.43 113.83 52.87 29.62 86.60 494
2 Cotton Stalks 229.18 318.19 315.14 127.78 114.48 318.36 1423
3 Cotton Gin Waste 10.31 14.32 14.18 5.75 5.15 14.33 64
4 Sugarcane Tops 68.16 58.92 39.00 46.77 17.73 22.22 253
5 Baggase 33.40 28.87 19.11 22.92 8.69 10.89 124
6 Rice Straw 7.40 20.19 2.82 4.33 6.66 9.34 51
7 Rice Husk 3.37 9.18 1.28 1.97 3.03 4.24 23
8 Canola Straw 5.32 2.66 2.62 2.18 0.73 1.50 15
9 Banana Plant 1.41 4.62 28.21 48.81 2.09 1.78 87
TOTAL 432 594 536 313 188 469 2533
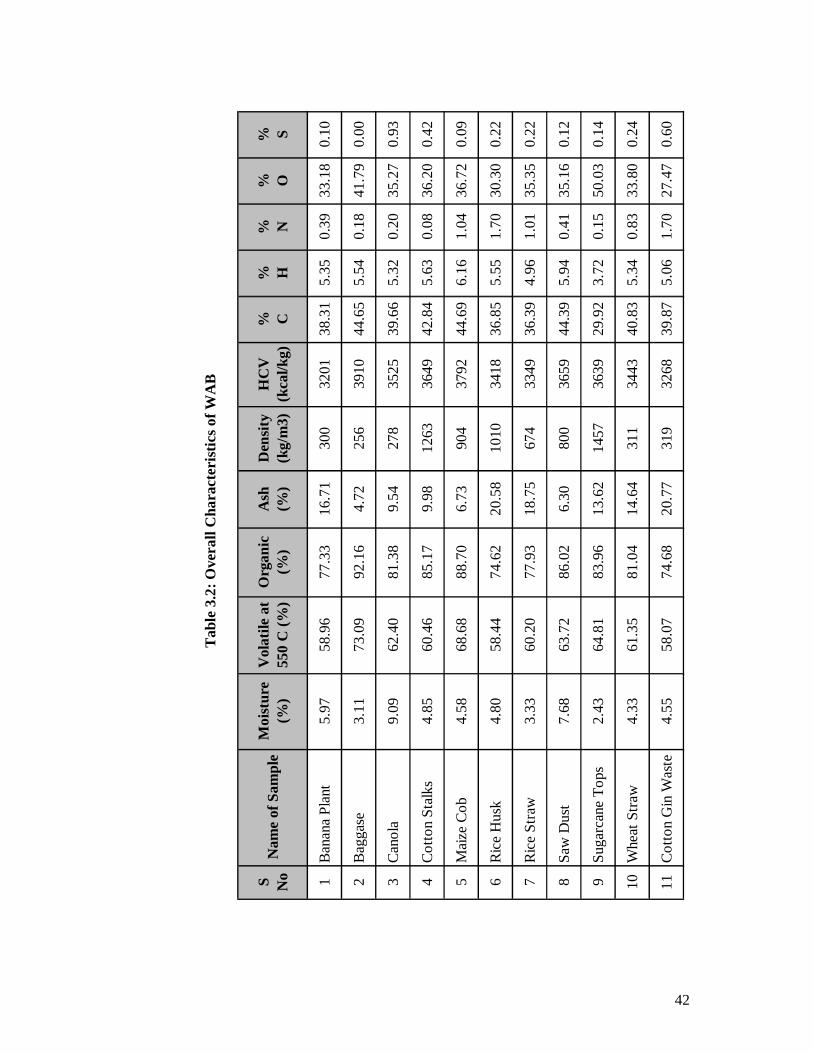
The overall characteristics of the biomass for the selected nine residues of
district Sanghar are represented in Table 3.2 below.
42
S
No
Nam
e of
Sam
ple
Moi
stur
e (%
)V
olat
ile a
t 55
0 C
(%
)O
rgan
ic
(%)
Ash
(%
)D
ensi
ty
(kg/
m3)
HC
V
(kca
l/kg)
% C% H
% N% O
% S
1B
ana
na P
lant
5.97
58.9
677
.33
16.7
130
032
0138
.31
5.35
0.3
933
.18
0.10
2B
agga
se3.
1173
.09
92.1
64.
7225
639
1044
.65
5.54
0.18
41.7
90.
00
3C
ano
la9.
0962
.40
81.3
89.
5427
835
2539
.66
5.32
0.20
35.2
70
.93
4C
ott
on
Sta
lks
4.85
60.4
685
.17
9.98
1263
3649
42.8
45.
630.
0836
.20
0.42
5M
aize
Co
b4.
5868
.68
88.7
06.
7390
437
9244
.69
6.16
1.04
36.
720.
09
6R
ice
Hus
k4.
8058
.44
74.6
220
.58
1010
3418
36.8
55.
551.
703
0.30
0.22
7R
ice
Str
aw3.
3360
.20
77.9
318
.75
674
3349
36.3
94.
961.
013
5.35
0.22
8S
aw D
ust
7.68
63.7
286
.02
6.30
800
3659
44.3
95.
940.
4135
.16
0.12
9S
uga
rcan
e T
ops
2.43
64.8
183
.96
13.6
214
5736
3929
.92
3.720.15
50.0
30.
14
10W
heat
Str
aw
4.33
61.3
581
.04
14.6
431
134
4340
.83
5.34
0.8
333
.80
0.24
11C
ott
on
Gin
Wa
ste
4.55
58.0
774
.68
20.7
731
932
6839
.87
5.0
61.
7027
.47
0.60
Tab
le 3
.2: O
vera
ll C
hara
cter
istic
s of
WA
B
43
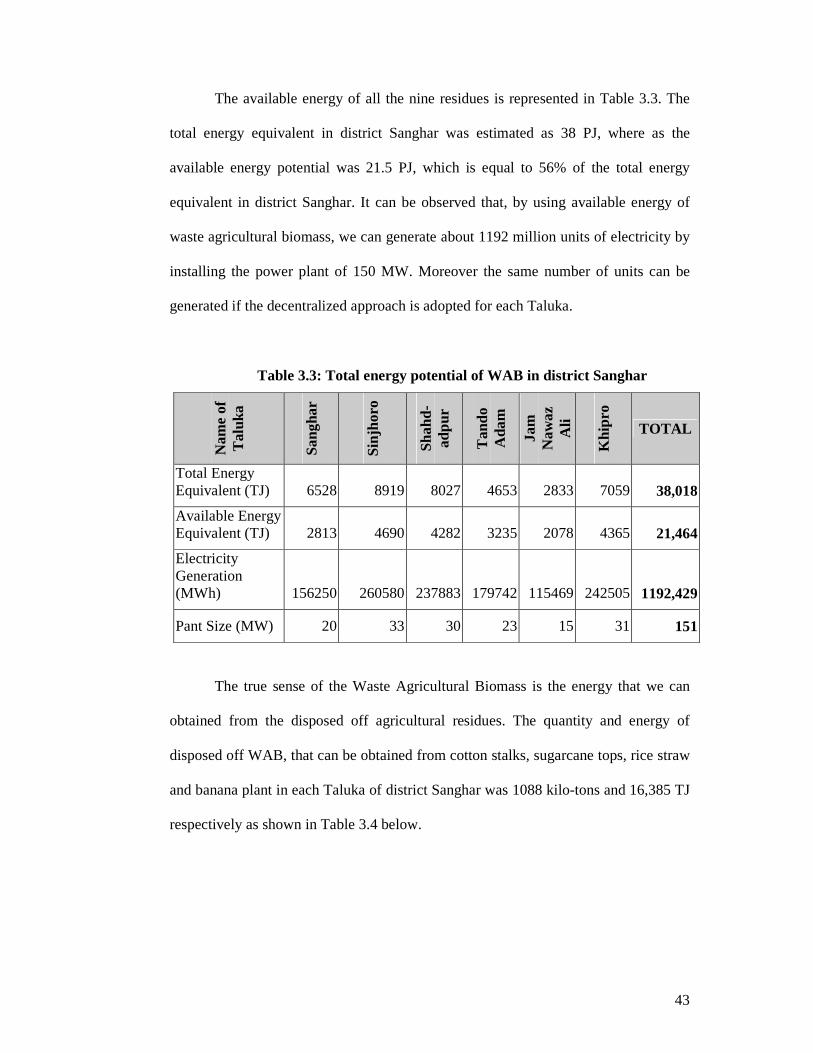
The available energy of all the nine residues is represented in Table 3.3. The
total energy equivalent in district Sanghar was estimated as 38 PJ, where as the
available energy potential was 21.5 PJ, which is equal to 56% of the total energy
equivalent in district Sanghar. It can be observed that, by using available energy of
waste agricultural biomass, we can generate about 1192 million units of electricity by
installing the power plant of 150 MW. Moreover the same number of units can be
generated if the decentralized approach is adopted for each Taluka.
Table 3.3: Total energy potential of WAB in district Sanghar
Nam
e of
T
aluk
a
San
ghar
Sin
jhor
o
Sha
hd-
adpu
r
Tan
do
Ada
m
Jam
N
awaz
A
li
Khi
pro
TOTAL
Total Energy Equivalent (TJ) 6528 8919 8027 4653 2833 7059 38,018
Available Energy Equivalent (TJ) 2813 4690 4282 3235 2078 4365 21,464
Electricity Generation (MWh) 156250 260580 237883 179742 115469 242505 1192,429
Pant Size (MW) 20 33 30 23 15 31 151
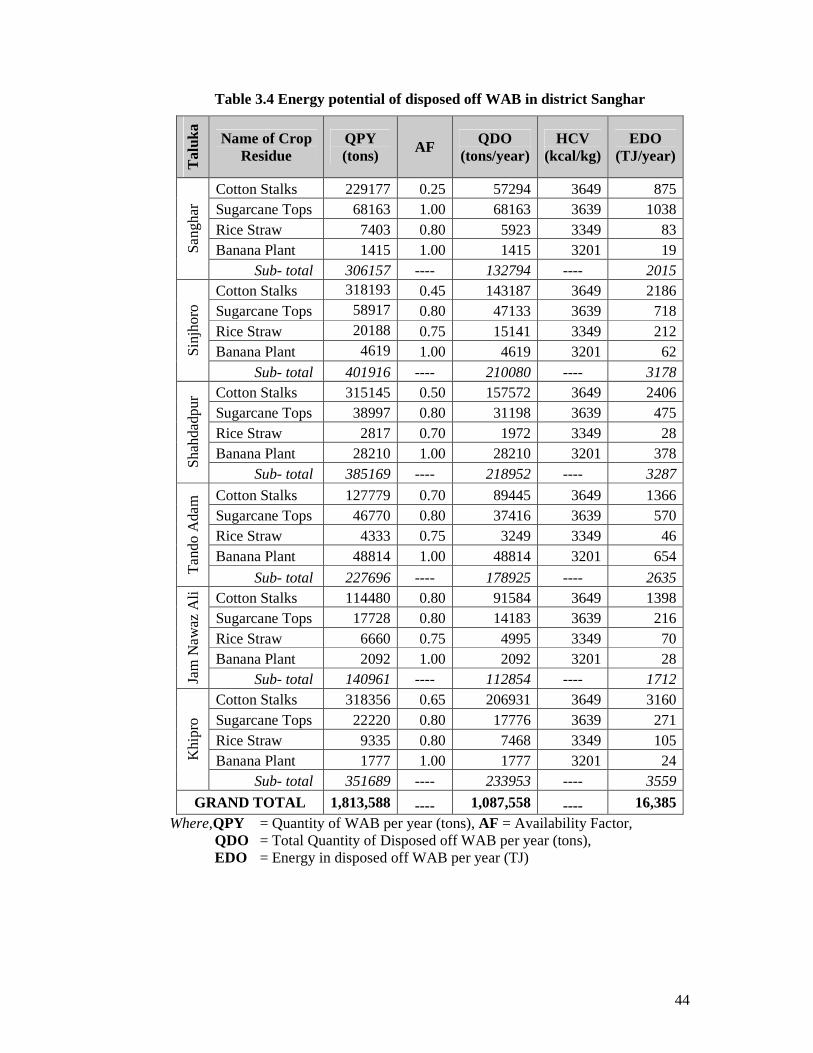
The true sense of the Waste Agricultural Biomass is the energy that we can
obtained from the disposed off agricultural residues. The quantity and energy of
disposed off WAB, that can be obtained from cotton stalks, sugarcane tops, rice straw
and banana plant in each Taluka of district Sanghar was 1088 kilo-tons and 16,385 TJ
respectively as shown in Table 3.4 below.
44
Table 3.4 Energy potential of disposed off WAB in district Sanghar
Tal
uka
Name of Crop Residue
QPY (tons)
AF QDO (tons/year)
HCV (kcal/kg)
EDO (TJ/year)
Cotton Stalks 229177 0.25 57294 3649 875 Sugarcane Tops 68163 1.00 68163 3639 1038 Rice Straw 7403 0.80 5923 3349 83 Banana Plant 1415 1.00 1415 3201 19 S
ang
har
Sub- total 306157 ---- 132794 ---- 2015 Cotton Stalks 318193 0.45 143187 3649 2186 Sugarcane Tops 58917 0.80 47133 3639 718 Rice Straw 20188 0.75 15141 3349 212 Banana Plant 4619 1.00 4619 3201 62 S
injh
oro
Sub- total 401916 ---- 210080 ---- 3178 Cotton Stalks 315145 0.50 157572 3649 2406 Sugarcane Tops 38997 0.80 31198 3639 475 Rice Straw 2817 0.70 1972 3349 28 Banana Plant 28210 1.00 28210 3201 378
Sha
hda
dpur
Sub- total 385169 ---- 218952 ---- 3287
Cotton Stalks 127779 0.70 89445 3649 1366 Sugarcane Tops 46770 0.80 37416 3639 570 Rice Straw 4333 0.75 3249 3349 46 Banana Plant 48814 1.00 48814 3201 654
Ta
ndo
Ada
m
Sub- total 227696 ---- 178925 ---- 2635 Cotton Stalks 114480 0.80 91584 3649 1398 Sugarcane Tops 17728 0.80 14183 3639 216 Rice Straw 6660 0.75 4995 3349 70 Banana Plant 2092 1.00 2092 3201 28
Jam
Na
waz
Ali
Sub- total 140961 ---- 112854 ---- 1712 Cotton Stalks 318356 0.65 206931 3649 3160 Sugarcane Tops 22220 0.80 17776 3639 271 Rice Straw 9335 0.80 7468 3349 105 Banana Plant 1777 1.00 1777 3201 24 K
hipr
o
Sub- total 351689 ---- 233953 ---- 3559
GRAND TOTAL 1,813,588 ---- 1,087,558 ---- 16,385 Where,QPY = Quantity of WAB per year (tons), AF = Availability Factor,
QDO = Total Quantity of Disposed off WAB per year (tons), EDO = Energy in disposed off WAB per year (TJ)
45
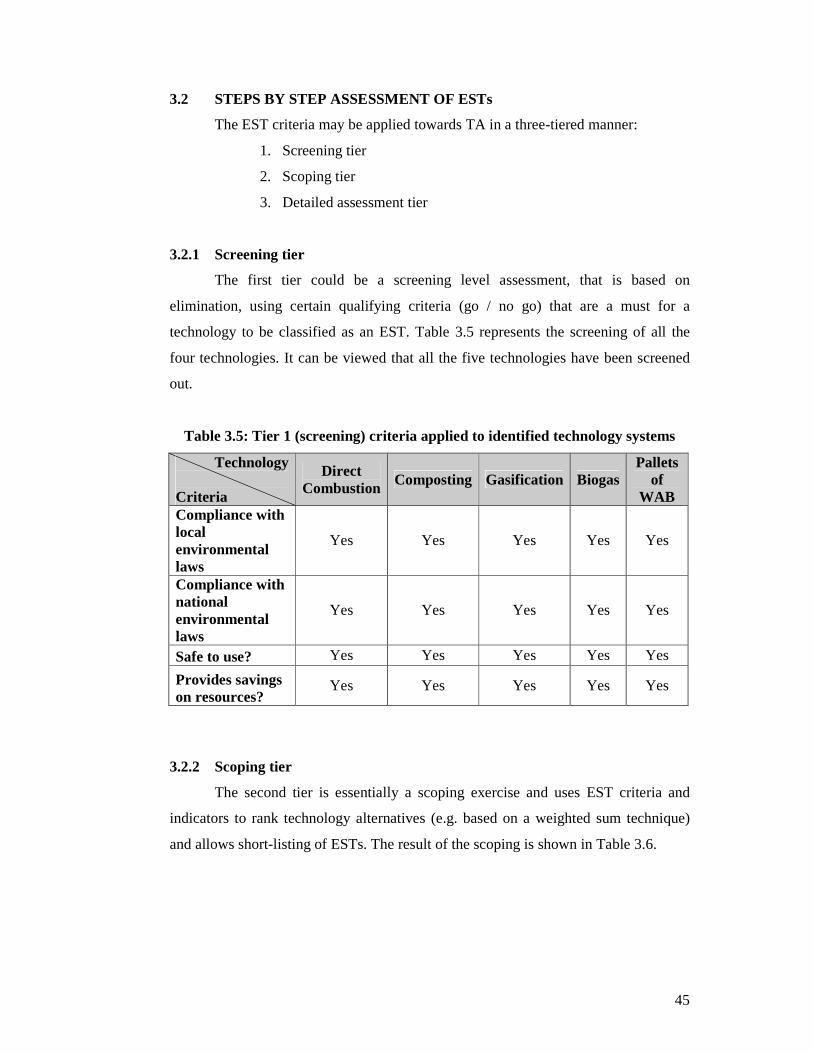
3.2 STEPS BY STEP ASSESSMENT OF ESTs
The EST criteria may be applied towards TA in a three-tiered manner:
1. Screening tier
2. Scoping tier
3. Detailed assessment tier
3.2.1 Screening tier
The first tier could be a screening level assessment, that is based on
elimination, using certain qualifying criteria (go / no go) that are a must for a
technology to be classified as an EST. Table 3.5 represents the screening of all the
four technologies. It can be viewed that all the five technologies have been screened
out.
Table 3.5: Tier 1 (screening) criteria applied to identified technology systems
Technology
Criteria
Direct Combustion Composting Gasification Biogas
Pallets of
WAB Compliance with local environmental laws
Yes Yes Yes Yes Yes
Compliance with national environmental laws
Yes Yes Yes Yes Yes
Safe to use? Yes Yes Yes Yes Yes
Provides savings on resources?
Yes Yes Yes Yes Yes
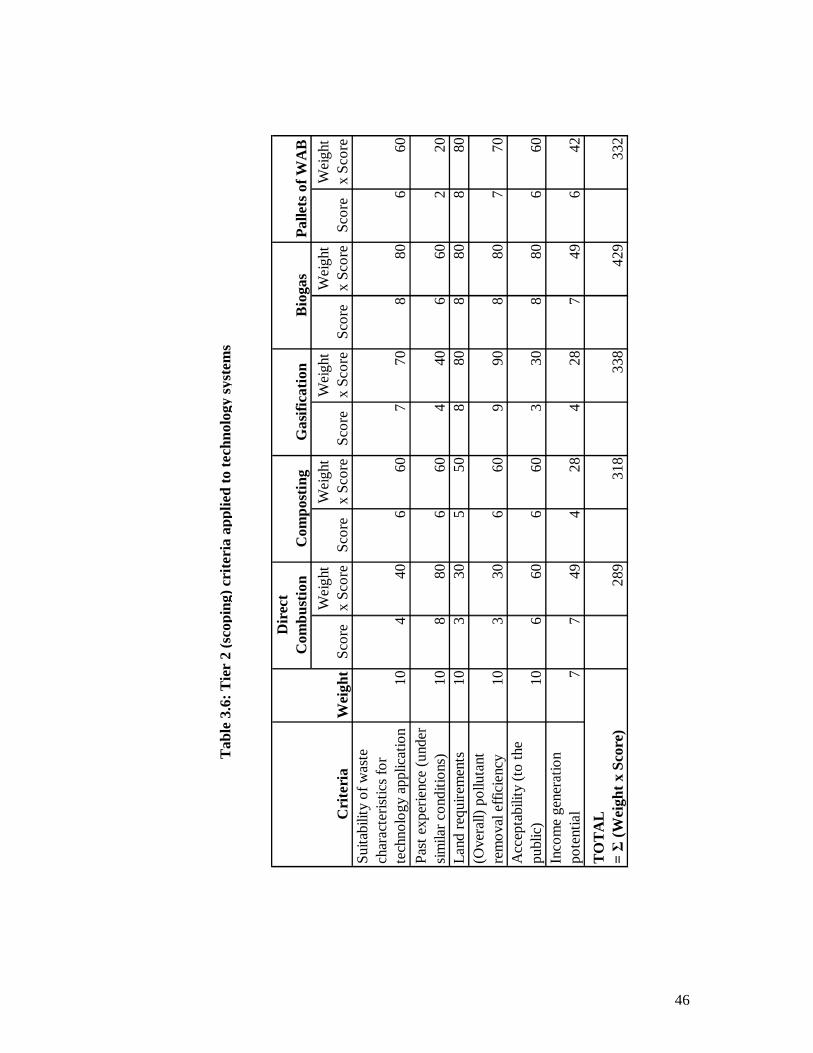
3.2.2 Scoping tier
The second tier is essentially a scoping exercise and uses EST criteria and
indicators to rank technology alternatives (e.g. based on a weighted sum technique)
and allows short-listing of ESTs. The result of the scoping is shown in Table 3.6.
46
Sco
reW
eig
ht
x S
core
Sco
reW
eigh
t x
Sco
reS
core
Wei
ght
x S
core
Sco
reW
eigh
t x
Sco
reS
core
Wei
ght
x S
core
Sui
tabi
lity
of w
aste
ch
arac
teris
tics
for
tech
nolo
gy
appl
icat
ion
104
406
607
708
806
60P
ast
expe
rienc
e (u
nder
si
mila
r co
nditi
ons
)10
880
660
440
660
220
Land
req
uire
men
ts10
330
550
880
880
880
(Ove
rall)
po
lluta
nt
rem
ova
l effi
cien
cy10
330
660
990
880
770
Acc
epta
bilit
y (t
o t
he
publ
ic)
106
606
603
308
806
60In
com
e ge
nera
tion
pote
ntia
l7
749
428
428
749
642
289
318
338
429
332
Pal
lets
of W
AB
Wei
ght
Crit
eria
TO
TA
L = Σ
(W
eigh
t x
Sco
re)
Dire
ct
Com
bust
ion
Com
post
ing
Gas
ifica
tion
Bio
gas
Tab
le 3
.6: T
ier
2 (s
copi
ng)
crite
ria a
pplie
d to
tech
nolo
gy s
ystem
s
47
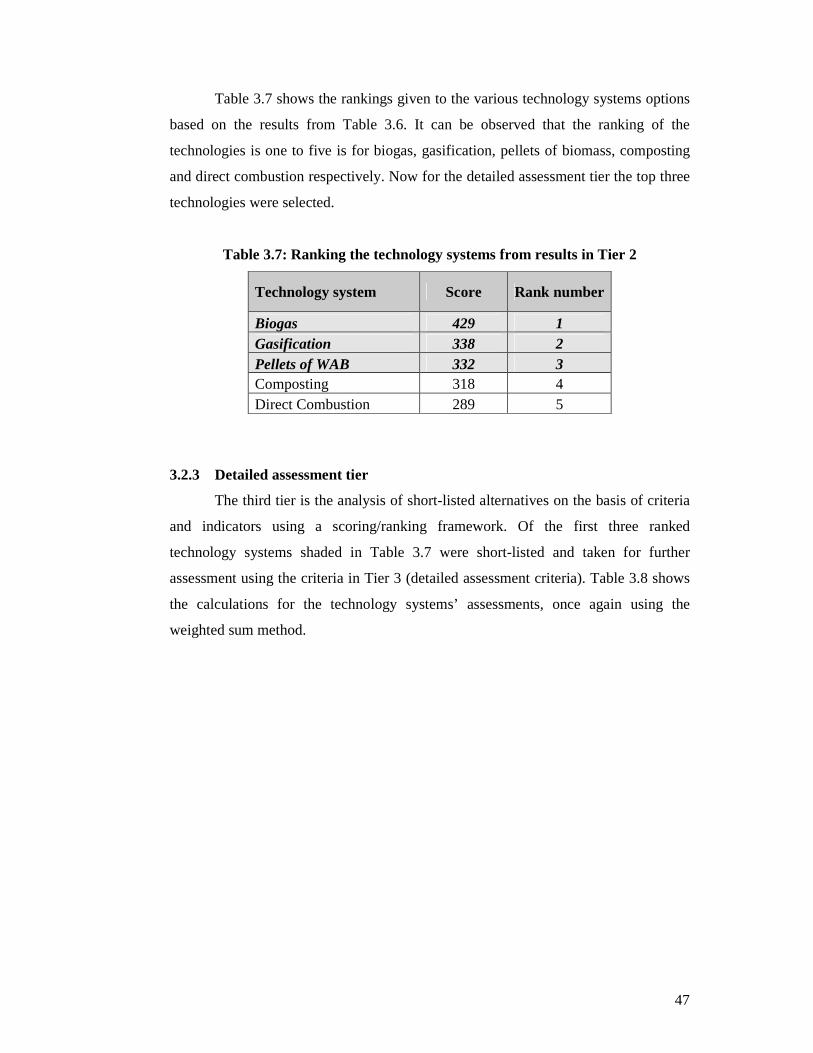
Table 3.7 shows the rankings given to the various technology systems options
based on the results from Table 3.6. It can be observed that the ranking of the
technologies is one to five is for biogas, gasification, pellets of biomass, composting
and direct combustion respectively. Now for the detailed assessment tier the top three
technologies were selected.
Table 3.7: Ranking the technology systems from results in Tier 2
Technology system Score Rank number
Biogas 429 1 Gasification 338 2 Pellets of WAB 332 3 Composting 318 4 Direct Combustion 289 5
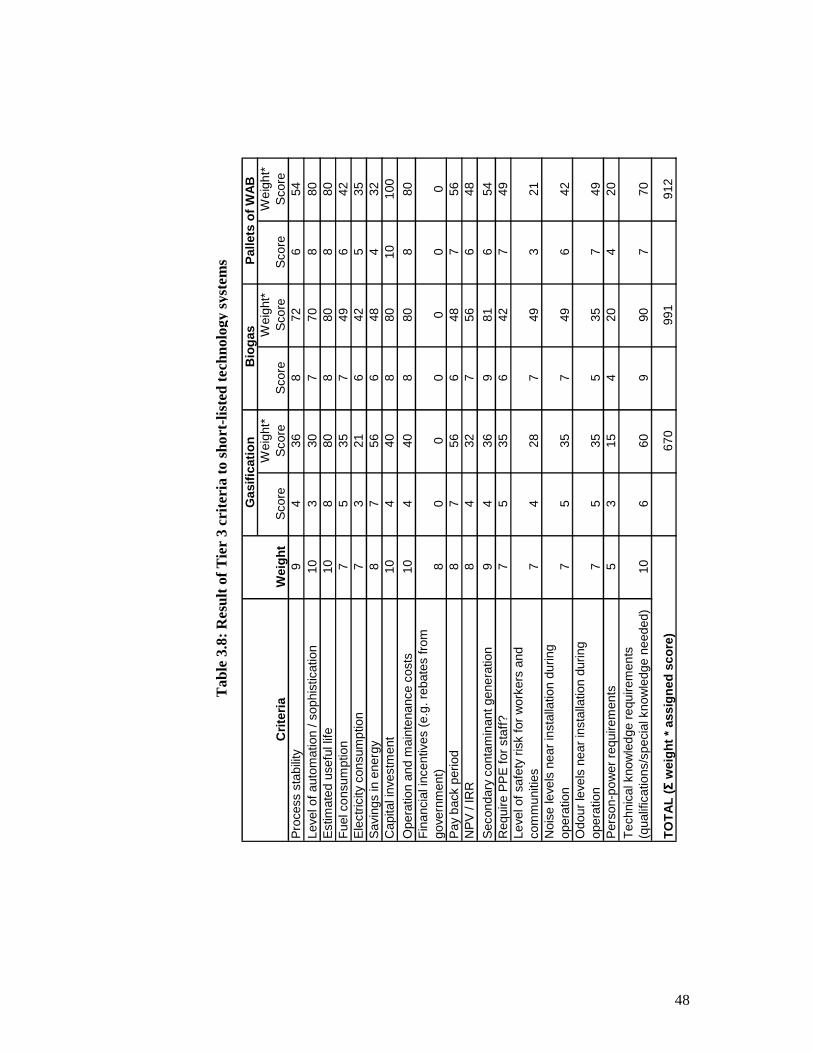
3.2.3 Detailed assessment tier
The third tier is the analysis of short-listed alternatives on the basis of criteria
and indicators using a scoring/ranking framework. Of the first three ranked
technology systems shaded in Table 3.7 were short-listed and taken for further
assessment using the criteria in Tier 3 (detailed assessment criteria). Table 3.8 shows
the calculations for the technology systems’ assessments, once again using the
weighted sum method.
48
Sco
reW
eigh
t*
Sco
reS
core
Wei
ght*
S
core
Sco
reW
eigh
t*
Sco
reP
roce
ss s
tabi
lity
94
368
726
54Le
vel o
f aut
omat
ion
/ sop
hist
icat
ion
103
307
708
80E
stim
ated
use
ful l
ife10
880
880
880
Fue
l con
sum
ptio
n7
535
749
642
Ele
ctric
ity c
onsu
mpt
ion
73
216
425
35S
avin
gs in
ene
rgy
87
566
484
32C
apita
l inv
estm
ent
104
408
8010
100
Ope
ratio
n an
d m
aint
enan
ce c
osts
104
408
808
80F
inan
cial
ince
ntiv
es (
e.g.
reb
ates
from
go
vern
men
t)8
00
00
00
Pay
bac
k pe
riod
87
566
487
56N
PV
/ IR
R8
432
756
648
Sec
onda
ry c
onta
min
ant g
ener
atio
n9
436
981
654
Req
uire
PP
E fo
r st
aff?
75
356
427
49Le
vel o
f saf
ety
risk
for
wor
kers
and
co
mm
uniti
es7
428
749
321
Noi
se le
vels
nea
r in
stal
latio
n du
ring
oper
atio
n7
535
749
642
Odo
ur le
vels
nea
r in
stal
latio
n du
ring
oper
atio
n7
535
535
749
Per
son-
pow
er r
equi
rem
ents
53
154
204
20T
echn
ical
kno
wle
dge
requ
irem
ents
(q
ualif
icat
ions
/spe
cial
kno
wle
dge
need
ed)
106
609
907
70
670
991
912
Gas
ific
atio
nB
iog
asP
alle
ts o
f W
AB
TO
TA
L (Σ
wei
gh
t *
assi
gn
ed s
core
)
Cri
teri
aW
eig
ht
Tab
le 3
.8: R
esult
of T
ier
3 cr
iteria
to s
hort
-list
ed te
chno
logy
sys
tem
s
49
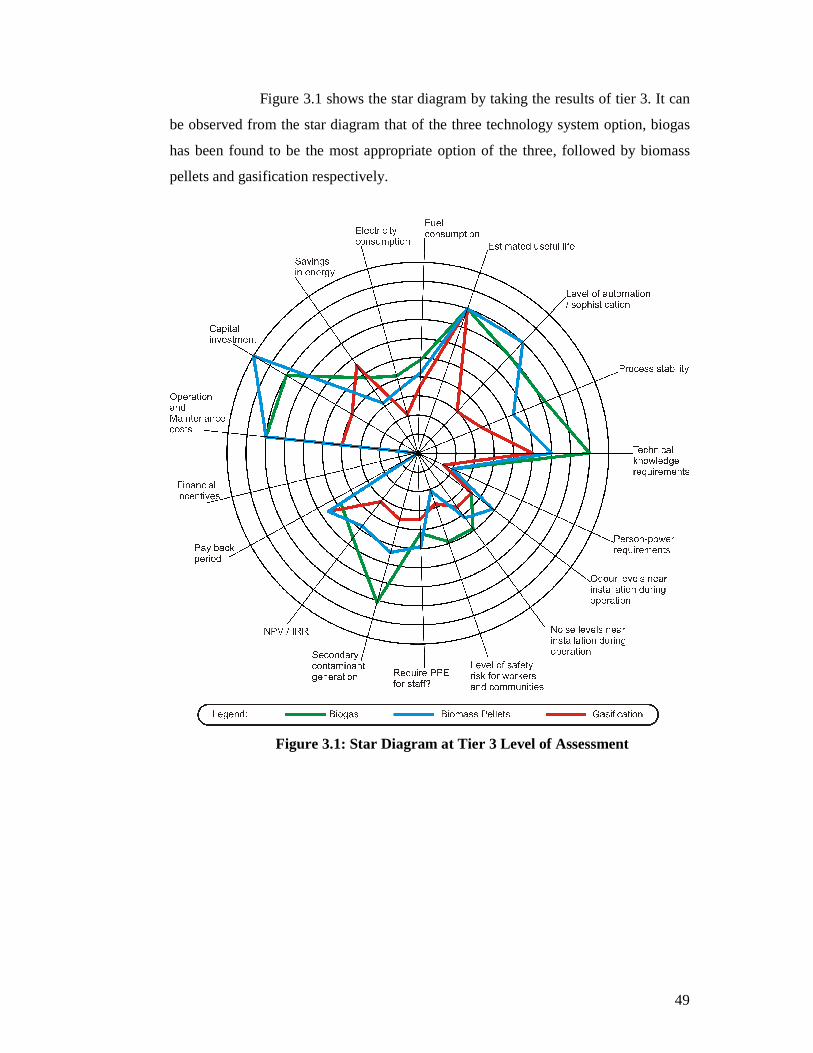
Figure 3.1 shows the star diagram by taking the results of tier 3. It can
be observed from the star diagram that of the three technology system option, biogas
has been found to be the most appropriate option of the three, followed by biomass
pellets and gasification respectively.
Figure 3.1: Star Diagram at Tier 3 Level of Assessment
50
CONCLUSION & RECOMMENDATION
From the detail assessment of the selected technologies following three
technologies were come out as most feasible and environmentally sound, sustainable
and economically viable.
1. Biogas
2. Biomass Pellets
3. Gasification
From the results of Tier 3 criteria to short-listed technology systems as in
Table 3.8, the score obtained by Biogas, Biomass Pellets and Gasification is in the
order of 991, 912 and 670 respectively. The gasification technology is less feasible
from the assorted technologies because of more sophistication, automation, capital
investment, safety risk for workers and requirements of technical knowledge. On the
other hand Biogas gasification is most feasible. The biomass pellets according to the
score comes at the second number. For pilot scale biogas (Anaerobic Digestion) is
recommended for pilot scale project in Sanghar.
Related Documents