Colloids and Surfaces A: Physicochem. Eng. Aspects 396 (2012) 51–62 Contents lists available at SciVerse ScienceDirect Colloids and Surfaces A: Physicochemical and Engineering Aspects jo ur nal homep a ge: www.elsevier.com/locate/colsurfa Manipulating microparticle interactions using highly charged nanoparticles Shunxi Ji, David Herman, John Y. Walz ∗ Virginia Tech Deptartment of Chemical Engineering, M/C 0211 Blacksburg, VA 24061, United States a r t i c l e i n f o Article history: Received 6 November 2011 Received in revised form 6 December 2011 Accepted 8 December 2011 Available online 17 December 2011 Keywords: Nanoparticle halos Colloidal probe atomic force microscopy Nanoparticle adsorption Depletion forces Colloidal forces Zeta potential measurement a b s t r a c t An experimental study was performed to investigate the potential use of highly charged, spherical nanoparticles to control the forces between spherical microparticles, with the aim of developing novel methods for reversibly controlling the stability of a colloidal dispersion. A specific focus of the project was to determine the degree to which the nanoparticles strongly adsorb to the microparticles, as such adsorption would severely limit reversibly controlling forces and stability. Colloidal probe atomic force microscopy (CP-AFM) was used to measure the force between a silica microparticle and a silica plate in solutions of highly charged polystyrene nanoparticles at varying pH, covering the range over which the silica surfaces were very weakly charged (e.g., pH ≤ 3) to highly charged (e.g., pH 6.0). It was found that except for the highest pH, where the silica zeta potential was approximately −60 mV, addition of relatively low concentrations of the nanoparticles (e.g., 0.1% vol.) led to an increased repulsion between the microparticle and plate. This increased repulsion was evident even at pH 4.0 when the fractional sur- face coverage of the nanoparticles was only 1%. At low nanoparticle concentrations, this force decayed exponentially with a decay length equal to the bulk Debye length, indicating that it was electrostatic in origin. At higher nanoparticle concentrations (1.0% vol.), long-range depletion forces became signifi- cant, causing a deviation from the exponential behavior. This increased repulsion did not disappear upon flushing the nanoparticles out of the system, indicating that the nanoparticles were held in relatively deep energy wells. These results suggest that strong adsorption of nanoparticles should be expected in all but the most highly repulsive systems and also illustrate the challenges associated with using charged nanoparticles as a tool for controlling stability. © 2012 Elsevier B.V. All rights reserved. 1. Introduction and background The use of nanometer-sized particles (nanoparticles) to alter the interaction force between larger colloidal particles (micropar- ticles) has been investigated for well over 50 years and continues to be a topic of interest. In the early 1950s, Asakura and Oosawa derived a simple algebraic expression for the interaction between two hard spherical particles in a solution of nonadsorbing hard spherical ‘macromolecules’ that was based on the increase in free volume available to the macromolecules upon close approach of the two particles [1,2]. (An identical expression can also be derived by calculating the osmotic pressure gradient due to exclusion of the nanoparticles from the gap region [3].) Since the initial work of Asakura and Oosawa, other researchers have investigated the effects of nanoparticle charge and shape on the resulting depletion force [3–15]. It is also recognized that as the concentration of nanoparticles increases beyond the dilute limit, interactions between the nanoparticles can lead to ∗ Corresponding author. Tel.: +1 540 231 4213; fax: +1 540 231 5022. E-mail address: [email protected] (J.Y. Walz). oscillations in the local density of nanoparticles next to the sur- face of a microparticle, and the overlap of these density oscillations leads to an oscillatory force profile between the microparticles. These structural forces have also been studied in great detail, both computationally and experimentally [16–27]. In the majority of the studies referenced above, the assumption has been that the nanoparticles and microparticles are mutually repulsive, such as hard sphere or electrostatic repulsions arising from surface charges. Such repulsion leads to negative adsorption of the nanoparticles onto the surface. Recently, however, sev- eral researchers have begun investigating systems in which the microparticle–nanoparticle interaction is much weaker, or even locally attractive. For example, McKee and Walz [28] used col- loid probe atomic force microscopy to measure the force profile between a large glass sphere and a glass substrate in solutions of either polystyrene or zirconia nanoparticles. The systems were conducted at pH values near the isoelectric point of the glass such that the average zeta potential of these surfaces was quite low. In addition, the impurities present in the glass (e.g., potassium, alu- minum, calcium, and magnesium) allowed significant deposition of the nanoparticles to occur. Unlike the results at high pH when all surfaces were highly negatively charged, McKee and Walz found 0927-7757/$ – see front matter © 2012 Elsevier B.V. All rights reserved. doi:10.1016/j.colsurfa.2011.12.040

Welcome message from author
This document is posted to help you gain knowledge. Please leave a comment to let me know what you think about it! Share it to your friends and learn new things together.
Transcript
M
SV
a
ARRAA
KNCNDCZ
1
tttdtsvtbn
hotd
0d
Colloids and Surfaces A: Physicochem. Eng. Aspects 396 (2012) 51– 62
Contents lists available at SciVerse ScienceDirect
Colloids and Surfaces A: Physicochemical andEngineering Aspects
jo ur nal homep a ge: www.elsev ier .com/ locate /co lsur fa
anipulating microparticle interactions using highly charged nanoparticles
hunxi Ji, David Herman, John Y. Walz ∗
irginia Tech Deptartment of Chemical Engineering, M/C 0211 Blacksburg, VA 24061, United States
r t i c l e i n f o
rticle history:eceived 6 November 2011eceived in revised form 6 December 2011ccepted 8 December 2011vailable online 17 December 2011
eywords:anoparticle halosolloidal probe atomic force microscopyanoparticle adsorptionepletion forcesolloidal forceseta potential measurement
a b s t r a c t
An experimental study was performed to investigate the potential use of highly charged, sphericalnanoparticles to control the forces between spherical microparticles, with the aim of developing novelmethods for reversibly controlling the stability of a colloidal dispersion. A specific focus of the projectwas to determine the degree to which the nanoparticles strongly adsorb to the microparticles, as suchadsorption would severely limit reversibly controlling forces and stability. Colloidal probe atomic forcemicroscopy (CP-AFM) was used to measure the force between a silica microparticle and a silica platein solutions of highly charged polystyrene nanoparticles at varying pH, covering the range over whichthe silica surfaces were very weakly charged (e.g., pH ≤ 3) to highly charged (e.g., pH 6.0). It was foundthat except for the highest pH, where the silica zeta potential was approximately −60 mV, addition ofrelatively low concentrations of the nanoparticles (e.g., 0.1% vol.) led to an increased repulsion betweenthe microparticle and plate. This increased repulsion was evident even at pH 4.0 when the fractional sur-face coverage of the nanoparticles was only 1%. At low nanoparticle concentrations, this force decayedexponentially with a decay length equal to the bulk Debye length, indicating that it was electrostatic
in origin. At higher nanoparticle concentrations (1.0% vol.), long-range depletion forces became signifi-cant, causing a deviation from the exponential behavior. This increased repulsion did not disappear uponflushing the nanoparticles out of the system, indicating that the nanoparticles were held in relativelydeep energy wells. These results suggest that strong adsorption of nanoparticles should be expected inall but the most highly repulsive systems and also illustrate the challenges associated with using chargednanoparticles as a tool for controlling stability.© 2012 Elsevier B.V. All rights reserved.
. Introduction and background
The use of nanometer-sized particles (nanoparticles) to alterhe interaction force between larger colloidal particles (micropar-icles) has been investigated for well over 50 years and continueso be a topic of interest. In the early 1950s, Asakura and Oosawaerived a simple algebraic expression for the interaction betweenwo hard spherical particles in a solution of nonadsorbing hardpherical ‘macromolecules’ that was based on the increase in freeolume available to the macromolecules upon close approach ofhe two particles [1,2]. (An identical expression can also be derivedy calculating the osmotic pressure gradient due to exclusion of theanoparticles from the gap region [3].)
Since the initial work of Asakura and Oosawa, other researchersave investigated the effects of nanoparticle charge and shape
n the resulting depletion force [3–15]. It is also recognizedhat as the concentration of nanoparticles increases beyond theilute limit, interactions between the nanoparticles can lead to∗ Corresponding author. Tel.: +1 540 231 4213; fax: +1 540 231 5022.E-mail address: [email protected] (J.Y. Walz).
927-7757/$ – see front matter © 2012 Elsevier B.V. All rights reserved.oi:10.1016/j.colsurfa.2011.12.040
oscillations in the local density of nanoparticles next to the sur-face of a microparticle, and the overlap of these density oscillationsleads to an oscillatory force profile between the microparticles.These structural forces have also been studied in great detail, bothcomputationally and experimentally [16–27].
In the majority of the studies referenced above, the assumptionhas been that the nanoparticles and microparticles are mutuallyrepulsive, such as hard sphere or electrostatic repulsions arisingfrom surface charges. Such repulsion leads to negative adsorptionof the nanoparticles onto the surface. Recently, however, sev-eral researchers have begun investigating systems in which themicroparticle–nanoparticle interaction is much weaker, or evenlocally attractive. For example, McKee and Walz [28] used col-loid probe atomic force microscopy to measure the force profilebetween a large glass sphere and a glass substrate in solutionsof either polystyrene or zirconia nanoparticles. The systems wereconducted at pH values near the isoelectric point of the glass suchthat the average zeta potential of these surfaces was quite low. In
addition, the impurities present in the glass (e.g., potassium, alu-minum, calcium, and magnesium) allowed significant depositionof the nanoparticles to occur. Unlike the results at high pH when allsurfaces were highly negatively charged, McKee and Walz found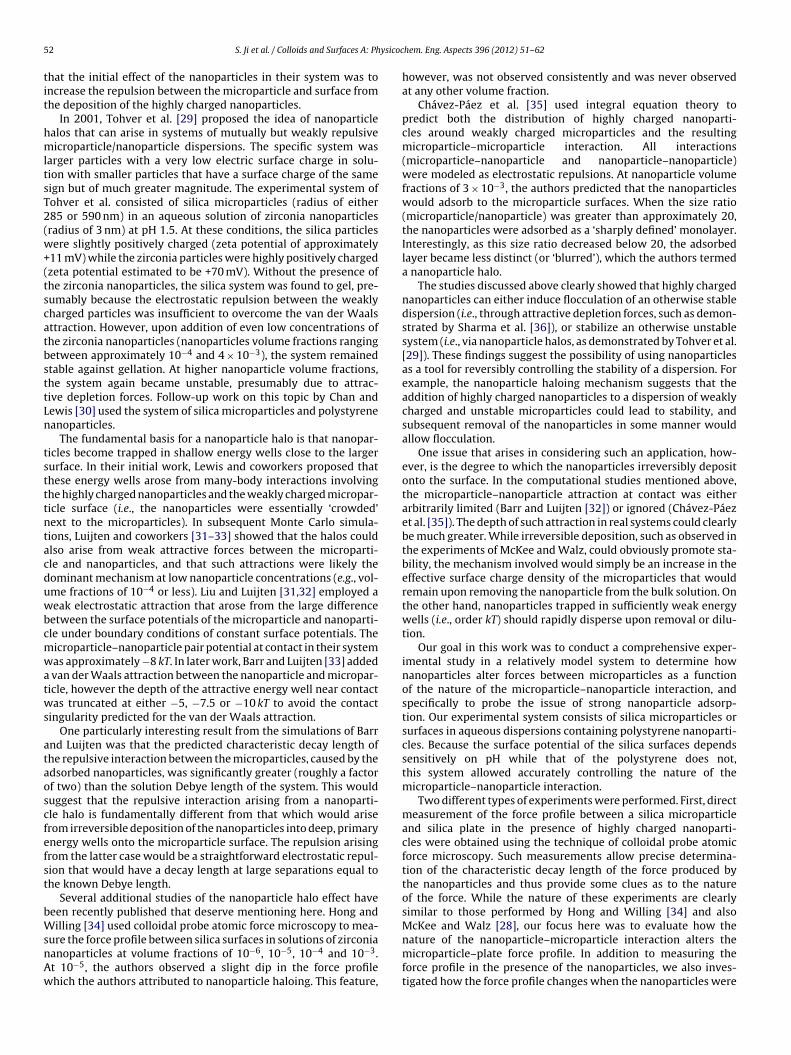
5 ysicoc
tit
hmltsT2(w+(tscatbsttLn
tstttntacduwbcmwatws
ataoscfefst
bWsnAw
2 S. Ji et al. / Colloids and Surfaces A: Ph
hat the initial effect of the nanoparticles in their system was toncrease the repulsion between the microparticle and surface fromhe deposition of the highly charged nanoparticles.
In 2001, Tohver et al. [29] proposed the idea of nanoparticlealos that can arise in systems of mutually but weakly repulsiveicroparticle/nanoparticle dispersions. The specific system was
arger particles with a very low electric surface charge in solu-ion with smaller particles that have a surface charge of the sameign but of much greater magnitude. The experimental system ofohver et al. consisted of silica microparticles (radius of either85 or 590 nm) in an aqueous solution of zirconia nanoparticlesradius of 3 nm) at pH 1.5. At these conditions, the silica particlesere slightly positively charged (zeta potential of approximately
11 mV) while the zirconia particles were highly positively chargedzeta potential estimated to be +70 mV). Without the presence ofhe zirconia nanoparticles, the silica system was found to gel, pre-umably because the electrostatic repulsion between the weaklyharged particles was insufficient to overcome the van der Waalsttraction. However, upon addition of even low concentrations ofhe zirconia nanoparticles (nanoparticles volume fractions rangingetween approximately 10−4 and 4 × 10⁻³), the system remainedtable against gellation. At higher nanoparticle volume fractions,he system again became unstable, presumably due to attrac-ive depletion forces. Follow-up work on this topic by Chan andewis [30] used the system of silica microparticles and polystyreneanoparticles.
The fundamental basis for a nanoparticle halo is that nanopar-icles become trapped in shallow energy wells close to the largerurface. In their initial work, Lewis and coworkers proposed thathese energy wells arose from many-body interactions involvinghe highly charged nanoparticles and the weakly charged micropar-icle surface (i.e., the nanoparticles were essentially ‘crowded’ext to the microparticles). In subsequent Monte Carlo simula-ions, Luijten and coworkers [31–33] showed that the halos couldlso arise from weak attractive forces between the microparti-le and nanoparticles, and that such attractions were likely theominant mechanism at low nanoparticle concentrations (e.g., vol-me fractions of 10−4 or less). Liu and Luijten [31,32] employed aeak electrostatic attraction that arose from the large difference
etween the surface potentials of the microparticle and nanoparti-le under boundary conditions of constant surface potentials. Theicroparticle–nanoparticle pair potential at contact in their systemas approximately −8 kT. In later work, Barr and Luijten [33] added
van der Waals attraction between the nanoparticle and micropar-icle, however the depth of the attractive energy well near contactas truncated at either −5, −7.5 or −10 kT to avoid the contact
ingularity predicted for the van der Waals attraction.One particularly interesting result from the simulations of Barr
nd Luijten was that the predicted characteristic decay length ofhe repulsive interaction between the microparticles, caused by thedsorbed nanoparticles, was significantly greater (roughly a factorf two) than the solution Debye length of the system. This woulduggest that the repulsive interaction arising from a nanoparti-le halo is fundamentally different from that which would ariserom irreversible deposition of the nanoparticles into deep, primarynergy wells onto the microparticle surface. The repulsion arisingrom the latter case would be a straightforward electrostatic repul-ion that would have a decay length at large separations equal tohe known Debye length.
Several additional studies of the nanoparticle halo effect haveeen recently published that deserve mentioning here. Hong andilling [34] used colloidal probe atomic force microscopy to mea-
ure the force profile between silica surfaces in solutions of zirconiaanoparticles at volume fractions of 10−6, 10−5, 10−4 and 10−3.t 10−5, the authors observed a slight dip in the force profilehich the authors attributed to nanoparticle haloing. This feature,
hem. Eng. Aspects 396 (2012) 51– 62
however, was not observed consistently and was never observedat any other volume fraction.
Chávez-Páez et al. [35] used integral equation theory topredict both the distribution of highly charged nanoparti-cles around weakly charged microparticles and the resultingmicroparticle–microparticle interaction. All interactions(microparticle–nanoparticle and nanoparticle–nanoparticle)were modeled as electrostatic repulsions. At nanoparticle volumefractions of 3 × 10⁻³, the authors predicted that the nanoparticleswould adsorb to the microparticle surfaces. When the size ratio(microparticle/nanoparticle) was greater than approximately 20,the nanoparticles were adsorbed as a ‘sharply defined’ monolayer.Interestingly, as this size ratio decreased below 20, the adsorbedlayer became less distinct (or ‘blurred’), which the authors termeda nanoparticle halo.
The studies discussed above clearly showed that highly chargednanoparticles can either induce flocculation of an otherwise stabledispersion (i.e., through attractive depletion forces, such as demon-strated by Sharma et al. [36]), or stabilize an otherwise unstablesystem (i.e., via nanoparticle halos, as demonstrated by Tohver et al.[29]). These findings suggest the possibility of using nanoparticlesas a tool for reversibly controlling the stability of a dispersion. Forexample, the nanoparticle haloing mechanism suggests that theaddition of highly charged nanoparticles to a dispersion of weaklycharged and unstable microparticles could lead to stability, andsubsequent removal of the nanoparticles in some manner wouldallow flocculation.
One issue that arises in considering such an application, how-ever, is the degree to which the nanoparticles irreversibly depositonto the surface. In the computational studies mentioned above,the microparticle–nanoparticle attraction at contact was eitherarbitrarily limited (Barr and Luijten [32]) or ignored (Chávez-Páezet al. [35]). The depth of such attraction in real systems could clearlybe much greater. While irreversible deposition, such as observed inthe experiments of McKee and Walz, could obviously promote sta-bility, the mechanism involved would simply be an increase in theeffective surface charge density of the microparticles that wouldremain upon removing the nanoparticle from the bulk solution. Onthe other hand, nanoparticles trapped in sufficiently weak energywells (i.e., order kT) should rapidly disperse upon removal or dilu-tion.
Our goal in this work was to conduct a comprehensive exper-imental study in a relatively model system to determine hownanoparticles alter forces between microparticles as a functionof the nature of the microparticle–nanoparticle interaction, andspecifically to probe the issue of strong nanoparticle adsorp-tion. Our experimental system consists of silica microparticles orsurfaces in aqueous dispersions containing polystyrene nanoparti-cles. Because the surface potential of the silica surfaces dependssensitively on pH while that of the polystyrene does not,this system allowed accurately controlling the nature of themicroparticle–nanoparticle interaction.
Two different types of experiments were performed. First, directmeasurement of the force profile between a silica microparticleand silica plate in the presence of highly charged nanoparti-cles were obtained using the technique of colloidal probe atomicforce microscopy. Such measurements allow precise determina-tion of the characteristic decay length of the force produced bythe nanoparticles and thus provide some clues as to the natureof the force. While the nature of these experiments are clearlysimilar to those performed by Hong and Willing [34] and alsoMcKee and Walz [28], our focus here was to evaluate how the
nature of the nanoparticle–microparticle interaction alters themicroparticle–plate force profile. In addition to measuring theforce profile in the presence of the nanoparticles, we also inves-tigated how the force profile changes when the nanoparticles were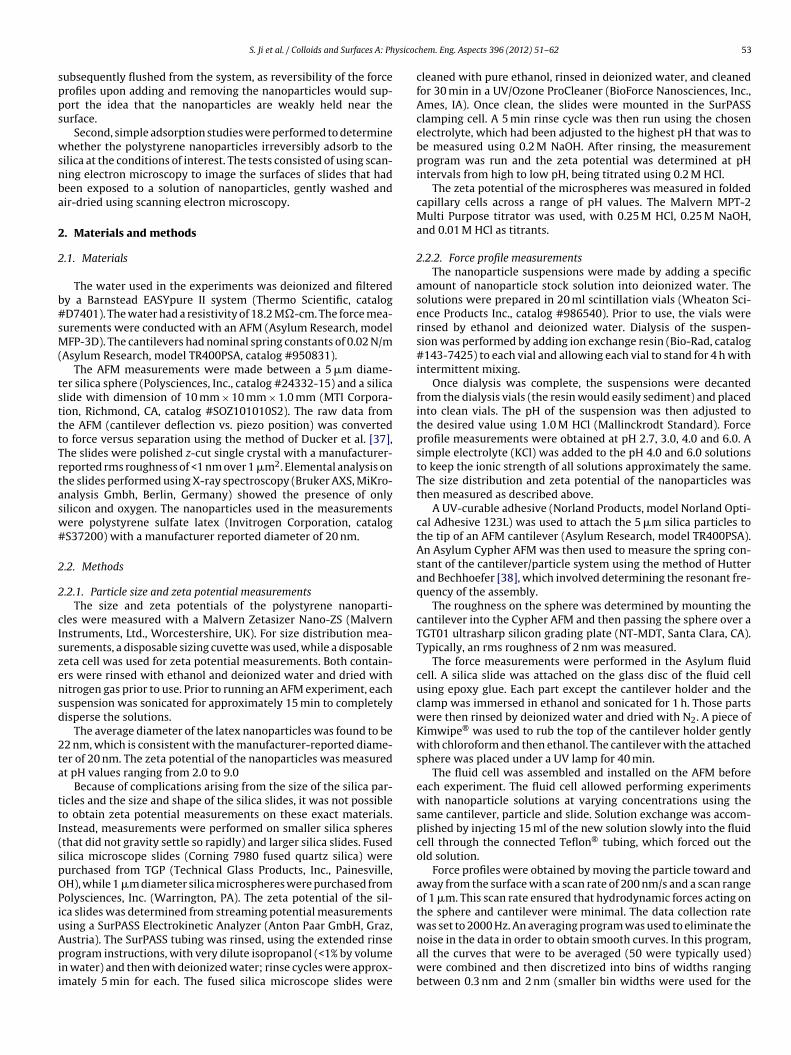
ysicoc
spps
wsnba
2
2
b#sM(
tstttTrtasw#
2
2
cIszensd
2ta
ttI(spOPiuApii
S. Ji et al. / Colloids and Surfaces A: Ph
ubsequently flushed from the system, as reversibility of the forcerofiles upon adding and removing the nanoparticles would sup-ort the idea that the nanoparticles are weakly held near theurface.
Second, simple adsorption studies were performed to determinehether the polystyrene nanoparticles irreversibly adsorb to the
ilica at the conditions of interest. The tests consisted of using scan-ing electron microscopy to image the surfaces of slides that hadeen exposed to a solution of nanoparticles, gently washed andir-dried using scanning electron microscopy.
. Materials and methods
.1. Materials
The water used in the experiments was deionized and filteredy a Barnstead EASYpure II system (Thermo Scientific, catalogD7401). The water had a resistivity of 18.2 M�-cm. The force mea-urements were conducted with an AFM (Asylum Research, modelFP-3D). The cantilevers had nominal spring constants of 0.02 N/m
Asylum Research, model TR400PSA, catalog #950831).The AFM measurements were made between a 5 �m diame-
er silica sphere (Polysciences, Inc., catalog #24332-15) and a silicalide with dimension of 10 mm × 10 mm × 1.0 mm (MTI Corpora-ion, Richmond, CA, catalog #SOZ101010S2). The raw data fromhe AFM (cantilever deflection vs. piezo position) was convertedo force versus separation using the method of Ducker et al. [37],he slides were polished z-cut single crystal with a manufacturer-eported rms roughness of <1 nm over 1 �m2. Elemental analysis onhe slides performed using X-ray spectroscopy (Bruker AXS, MiKro-nalysis Gmbh, Berlin, Germany) showed the presence of onlyilicon and oxygen. The nanoparticles used in the measurementsere polystyrene sulfate latex (Invitrogen Corporation, catalogS37200) with a manufacturer reported diameter of 20 nm.
.2. Methods
.2.1. Particle size and zeta potential measurementsThe size and zeta potentials of the polystyrene nanoparti-
les were measured with a Malvern Zetasizer Nano-ZS (Malvernnstruments, Ltd., Worcestershire, UK). For size distribution mea-urements, a disposable sizing cuvette was used, while a disposableeta cell was used for zeta potential measurements. Both contain-rs were rinsed with ethanol and deionized water and dried withitrogen gas prior to use. Prior to running an AFM experiment, eachuspension was sonicated for approximately 15 min to completelyisperse the solutions.
The average diameter of the latex nanoparticles was found to be2 nm, which is consistent with the manufacturer-reported diame-er of 20 nm. The zeta potential of the nanoparticles was measuredt pH values ranging from 2.0 to 9.0
Because of complications arising from the size of the silica par-icles and the size and shape of the silica slides, it was not possibleo obtain zeta potential measurements on these exact materials.nstead, measurements were performed on smaller silica spheresthat did not gravity settle so rapidly) and larger silica slides. Fusedilica microscope slides (Corning 7980 fused quartz silica) wereurchased from TGP (Technical Glass Products, Inc., Painesville,H), while 1 �m diameter silica microspheres were purchased fromolysciences, Inc. (Warrington, PA). The zeta potential of the sil-ca slides was determined from streaming potential measurementssing a SurPASS Electrokinetic Analyzer (Anton Paar GmbH, Graz,
ustria). The SurPASS tubing was rinsed, using the extended rinserogram instructions, with very dilute isopropanol (<1% by volumen water) and then with deionized water; rinse cycles were approx-mately 5 min for each. The fused silica microscope slides were
hem. Eng. Aspects 396 (2012) 51– 62 53
cleaned with pure ethanol, rinsed in deionized water, and cleanedfor 30 min in a UV/Ozone ProCleaner (BioForce Nanosciences, Inc.,Ames, IA). Once clean, the slides were mounted in the SurPASSclamping cell. A 5 min rinse cycle was then run using the chosenelectrolyte, which had been adjusted to the highest pH that was tobe measured using 0.2 M NaOH. After rinsing, the measurementprogram was run and the zeta potential was determined at pHintervals from high to low pH, being titrated using 0.2 M HCl.
The zeta potential of the microspheres was measured in foldedcapillary cells across a range of pH values. The Malvern MPT-2Multi Purpose titrator was used, with 0.25 M HCl, 0.25 M NaOH,and 0.01 M HCl as titrants.
2.2.2. Force profile measurementsThe nanoparticle suspensions were made by adding a specific
amount of nanoparticle stock solution into deionized water. Thesolutions were prepared in 20 ml scintillation vials (Wheaton Sci-ence Products Inc., catalog #986540). Prior to use, the vials wererinsed by ethanol and deionized water. Dialysis of the suspen-sion was performed by adding ion exchange resin (Bio-Rad, catalog#143-7425) to each vial and allowing each vial to stand for 4 h withintermittent mixing.
Once dialysis was complete, the suspensions were decantedfrom the dialysis vials (the resin would easily sediment) and placedinto clean vials. The pH of the suspension was then adjusted tothe desired value using 1.0 M HCl (Mallinckrodt Standard). Forceprofile measurements were obtained at pH 2.7, 3.0, 4.0 and 6.0. Asimple electrolyte (KCl) was added to the pH 4.0 and 6.0 solutionsto keep the ionic strength of all solutions approximately the same.The size distribution and zeta potential of the nanoparticles wasthen measured as described above.
A UV-curable adhesive (Norland Products, model Norland Opti-cal Adhesive 123L) was used to attach the 5 �m silica particles tothe tip of an AFM cantilever (Asylum Research, model TR400PSA).An Asylum Cypher AFM was then used to measure the spring con-stant of the cantilever/particle system using the method of Hutterand Bechhoefer [38], which involved determining the resonant fre-quency of the assembly.
The roughness on the sphere was determined by mounting thecantilever into the Cypher AFM and then passing the sphere over aTGT01 ultrasharp silicon grading plate (NT-MDT, Santa Clara, CA).Typically, an rms roughness of 2 nm was measured.
The force measurements were performed in the Asylum fluidcell. A silica slide was attached on the glass disc of the fluid cellusing epoxy glue. Each part except the cantilever holder and theclamp was immersed in ethanol and sonicated for 1 h. Those partswere then rinsed by deionized water and dried with N2. A piece ofKimwipe® was used to rub the top of the cantilever holder gentlywith chloroform and then ethanol. The cantilever with the attachedsphere was placed under a UV lamp for 40 min.
The fluid cell was assembled and installed on the AFM beforeeach experiment. The fluid cell allowed performing experimentswith nanoparticle solutions at varying concentrations using thesame cantilever, particle and slide. Solution exchange was accom-plished by injecting 15 ml of the new solution slowly into the fluidcell through the connected Teflon® tubing, which forced out theold solution.
Force profiles were obtained by moving the particle toward andaway from the surface with a scan rate of 200 nm/s and a scan rangeof 1 �m. This scan rate ensured that hydrodynamic forces acting onthe sphere and cantilever were minimal. The data collection ratewas set to 2000 Hz. An averaging program was used to eliminate the
noise in the data in order to obtain smooth curves. In this program,all the curves that were to be averaged (50 were typically used)were combined and then discretized into bins of widths rangingbetween 0.3 nm and 2 nm (smaller bin widths were used for the
54 S. Ji et al. / Colloids and Surfaces A: Physicochem. Eng. Aspects 396 (2012) 51– 62
pH1086420
Zeta
pot
entia
l/mV
-100
-80
-60
-40
-20
0
Fr
se
2
cessUnUat
tsb3litspdi
3
3
ptizr
1ttqop
pH1086420
Zeta
pot
entia
l/mV
-120
-100
-80
-60
-40
-20
0
20
401 μm silica spheresSilica slide (SurPASS)Literature (Scales et al., 1992)
Fig. 2. The measured zeta potential of 1 �m silica spheres and a silica plate versus
a separate experiment with a unique silica microparticle, freshlycleaned silica slide, and fresh nanoparticle solution. Thus whilethe trends in the forces obtained in these different experimentscan be compared (e.g., the variation of the force profile with
Table 1Approximate zeta potentials of the nanoparticles, microparticle and plate at theexperimental conditions used in the experiments.
pH Solution ionicstrength (mM)
�nanoparticle (mV) �microparticle,plate (mV)
ig. 1. Zeta potential of polystyrene nanoparticles versus solution pH. The error barsepresent standard deviation.
teeper regions of the force curves). The measured forces withinach bin were then averaged.
.2.3. Nanoparticle adsorption measurementsThe procedure used to test for adsorption of the nanoparti-
les onto the silica surfaces was to image surfaces (using scanninglectron microscopy) that had been immersed in a nanoparticleolution, rinsed and dried. The silica slides were first cleaned byonication in ethanol. Initially, the slides were next cleaned viaV/ozone, however this step was discontinued after tests showedo difference in behavior between surfaces with and without theV/ozone cleaning. An appropriate volume of nanoparticle solutiont 0.1% vol. concentration was prepared, briefly sonicated, and thenitrated to the desired pH using 0.2 M HCl (Mallinckrodt Standard).
A beaker of deionized water was then titrated, using 0.2 M HCl,o the same pH as the nanoparticle solution. The cleaned and driedilica slides were briefly soaked in the pH-adjusted water beforeeing placed in a beaker containing the nanoparticle solution for0 min. After the adsorption time, the silica was removed from the
atex particles and gently rinsed in the beaker of pH-adjusted watern order to remove any excess (non-adsorbed) nanoparticles fromhe slide. By using the same pH in both solutions, the surface chargehould remain the same and the adsorbed particles (if they wereresent) would remain on the slide. The silica was allowed to airry, and then sputter-coated with a 1–2 nm layer of gold for SEM
maging.
. Results
.1. Zeta potentials
Shown in Fig. 1 are the zeta potentials measured on theolystyrene nanoparticles. While there is considerable scatter inhe results, (e.g., from Brownian movement of the nanoparticles),t is clear that the particles maintain a strong negative charge, witheta potentials ranging from −60 to −70 mV over the entire pHange.
Fig. 2 presents the zeta potentials measured obtained on the �m silica spheres and silica plates. Again, it should be mentionedhat while these were not the same slides and particles used in
he force measurements, they were pure silica and thus should beuite similar. Also shown for comparison are the published resultsf Scales et al. [39], which were obtained on silica slides in a parallellate configuration.solution pH. Also shown are the literature values reported by Scales et al. [39]for silica slides in a parallel plate configuration. The error bars represent standarddeviation.
While there are clear differences in the magnitude of the zetapotential measured in the various experiments, the overall trendsare clearly consistent. The isolectric point varies between pH 2 and3, depending on the geometry and type of measurement performed.
Table 1 summarizes the zeta potentials of the latex and sil-ica nanoparticles at the four different pH values used in the forceexperiments. For the polystyrene nanoparticles, the average zetapotential measured over the entire range of pH values shown inFig. 1 (approximately −60 mV) is listed. For the silica microparti-cle and silica plate, the listed value is the average of the resultsin Fig. 2 at each pH. These values were also used in the pre-dicted nanoparticle–microparticle pair potentials described andpresented in Section 4.
3.2. Force profiles in presence of nanoparticles
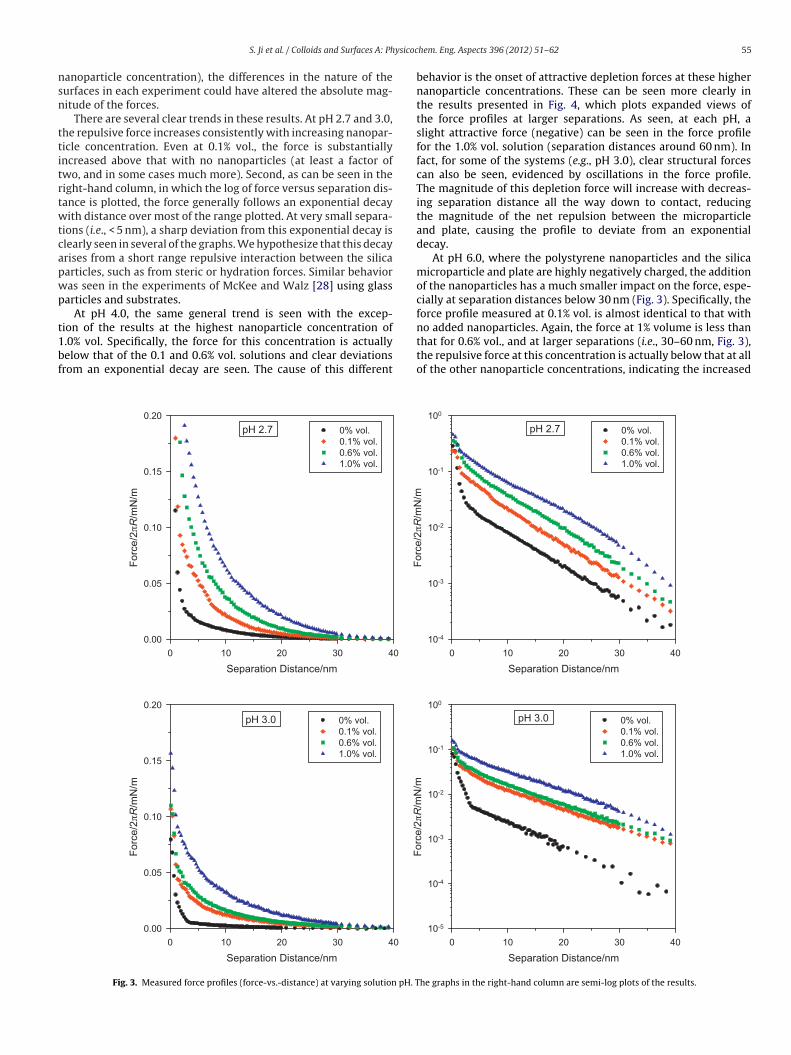
The effect of the polystyrene nanoparticles on the force profile(force-vs.-distance) between the silica microparticle and plate ispresented in Fig. 3. The measured forces have been normalized by2�R, where R is the radius of the microparticle, as this is equivalentto the energy per unit area between two parallel plates assumingthe Derjaguin approximation is valid for the microparticle/plateinteraction. Forces were measured at bulk pH values of 2.7, 3.0, 4.0and 6.0, and at each pH, nanoparticle concentrations of 0, 0.1, 0.6,and 1.0% vol. were used. As mentioned above, salt (KCl) was addedto the pH 4 and 6 solutions to keep the ionic strength of each testsolution approximately the same (the ionic strengths are listed inTable 1).
It should be mentioned that the results at a given pH involved
2.7 2.0 −60 −63.0 1.0 −60 −224.0 1.1 −60 −426.0 1.0 −60 −65
ysicoc
nsn
ttitrtwtcapwp
t1bf
S. Ji et al. / Colloids and Surfaces A: Ph
anoparticle concentration), the differences in the nature of theurfaces in each experiment could have altered the absolute mag-itude of the forces.
There are several clear trends in these results. At pH 2.7 and 3.0,he repulsive force increases consistently with increasing nanopar-icle concentration. Even at 0.1% vol., the force is substantiallyncreased above that with no nanoparticles (at least a factor ofwo, and in some cases much more). Second, as can be seen in theight-hand column, in which the log of force versus separation dis-ance is plotted, the force generally follows an exponential decayith distance over most of the range plotted. At very small separa-
ions (i.e., < 5 nm), a sharp deviation from this exponential decay islearly seen in several of the graphs. We hypothesize that this decayrises from a short range repulsive interaction between the silicaarticles, such as from steric or hydration forces. Similar behavioras seen in the experiments of McKee and Walz [28] using glassarticles and substrates.
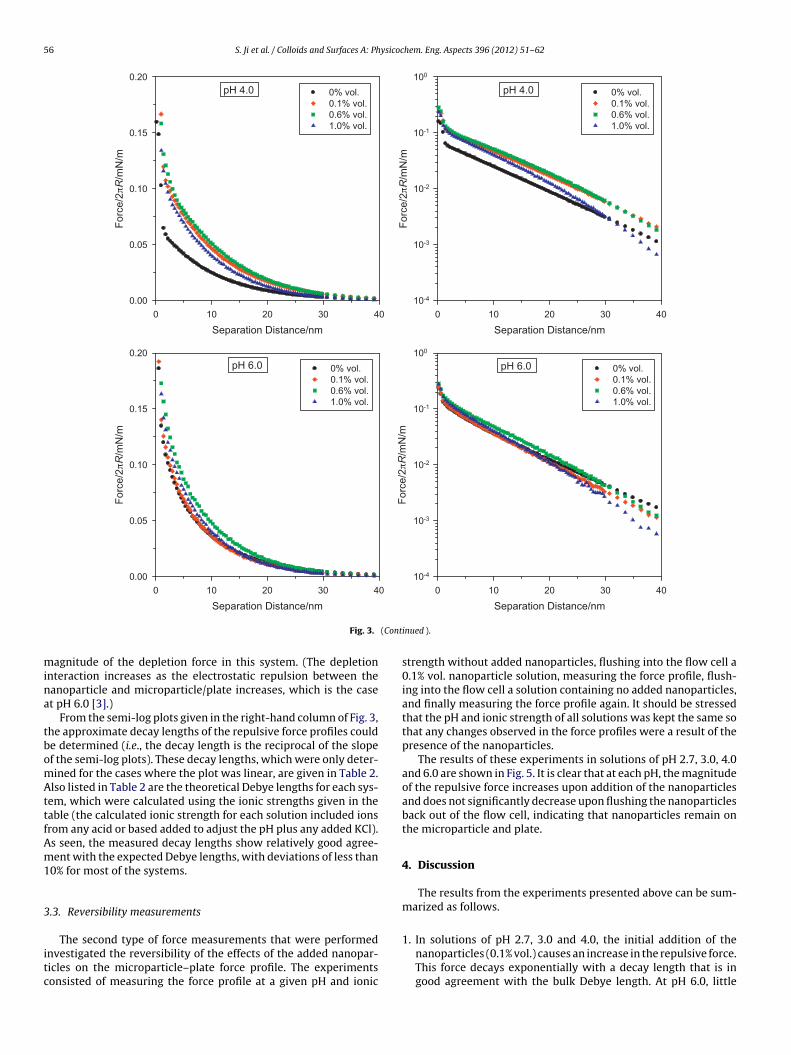
At pH 4.0, the same general trend is seen with the excep-ion of the results at the highest nanoparticle concentration of
.0% vol. Specifically, the force for this concentration is actuallyelow that of the 0.1 and 0.6% vol. solutions and clear deviationsrom an exponential decay are seen. The cause of this differentSeparation Distan ce/nm0 10 20 30 40
Forc
e/2π
R/m
N/m
0.00
0.05
0.10
0.15
0.200% vol.0.1% vol.0.6% vol.1.0% vol.
pH 2.7
Separation Distan ce/n m403020100
Forc
e/2π
R/m
N/m
0.00
0.05
0.10
0.15
0.200% vol.0.1% vol.0.6% vol.1.0% vol.
pH 3.0
Fig. 3. Measured force profiles (force-vs.-distance) at varying solution pH. T
hem. Eng. Aspects 396 (2012) 51– 62 55
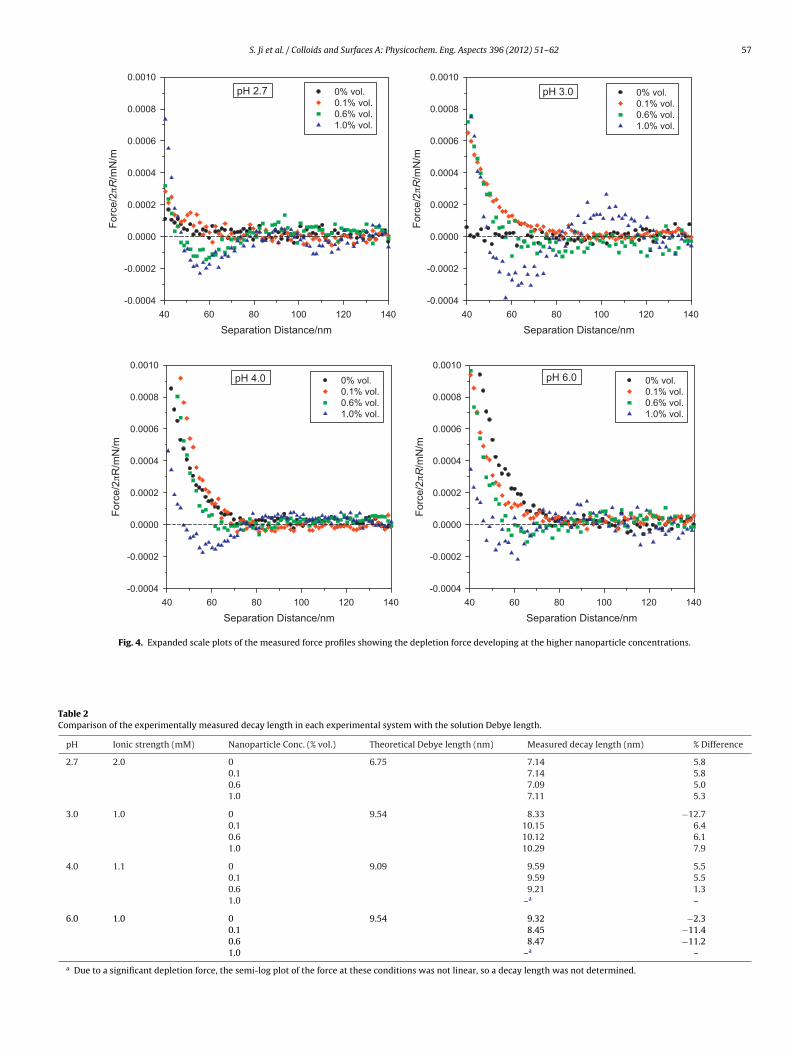
behavior is the onset of attractive depletion forces at these highernanoparticle concentrations. These can be seen more clearly inthe results presented in Fig. 4, which plots expanded views ofthe force profiles at larger separations. As seen, at each pH, aslight attractive force (negative) can be seen in the force profilefor the 1.0% vol. solution (separation distances around 60 nm). Infact, for some of the systems (e.g., pH 3.0), clear structural forcescan also be seen, evidenced by oscillations in the force profile.The magnitude of this depletion force will increase with decreas-ing separation distance all the way down to contact, reducingthe magnitude of the net repulsion between the microparticleand plate, causing the profile to deviate from an exponentialdecay.
At pH 6.0, where the polystyrene nanoparticles and the silicamicroparticle and plate are highly negatively charged, the additionof the nanoparticles has a much smaller impact on the force, espe-cially at separation distances below 30 nm (Fig. 3). Specifically, theforce profile measured at 0.1% vol. is almost identical to that withno added nanoparticles. Again, the force at 1% volume is less than
that for 0.6% vol., and at larger separations (i.e., 30–60 nm, Fig. 3),the repulsive force at this concentration is actually below that at allof the other nanoparticle concentrations, indicating the increasedSeparation Distance/nm0 10 20 30 40
Forc
e/2π
R/m
N/m
10-4
10-3
10-2
10-1
100
0% vol.0.1% vol.0.6% vol.1.0% vol.
pH 2.7
Separation Distance/nm403020100
Forc
e/2π
R/m
N/m
10-5
10-4
10-3
10-2
10-1
100
0% vol.0.1% vol.0.6% vol.1.0% vol.
pH 3.0
he graphs in the right-hand column are semi-log plots of the results.
56 S. Ji et al. / Colloids and Surfaces A: Physicochem. Eng. Aspects 396 (2012) 51– 62
Separation Distan ce/n m403020100
Forc
e/2π
R/m
N/m
0.00
0.05
0.10
0.15
0.200% vol.0.1% vol.0.6% vol.1.0% vol.
pH 4.0
Separation Dista nce/nm403020100
Forc
e/2π
R/m
N/m
10-4
10-3
10-2
10-1
100
0% vol.0.1% vol .0.6% vol .1.0% vol .
pH 4.0
403020100
Forc
e/2π
R/m
N/m
0.00
0.05
0.10
0.15
0.200% vol.0.1% vol.0.6% vol.1.0% vol.
pH 6.0
403020100
Forc
e/2π
R/m
N/m
10-4
10-3
10-2
10-1
100
0% vo l.0.1% vol.0.6% vol.1.0% vol.
pH 6.0
(Cont
mina
tbomAttfAm1
3
itc
Separation Distan ce/n m
Fig. 3.
agnitude of the depletion force in this system. (The depletionnteraction increases as the electrostatic repulsion between theanoparticle and microparticle/plate increases, which is the caset pH 6.0 [3].)
From the semi-log plots given in the right-hand column of Fig. 3,he approximate decay lengths of the repulsive force profiles coulde determined (i.e., the decay length is the reciprocal of the slopef the semi-log plots). These decay lengths, which were only deter-ined for the cases where the plot was linear, are given in Table 2.lso listed in Table 2 are the theoretical Debye lengths for each sys-
em, which were calculated using the ionic strengths given in theable (the calculated ionic strength for each solution included ionsrom any acid or based added to adjust the pH plus any added KCl).s seen, the measured decay lengths show relatively good agree-ent with the expected Debye lengths, with deviations of less than
0% for most of the systems.
.3. Reversibility measurements
The second type of force measurements that were performednvestigated the reversibility of the effects of the added nanopar-icles on the microparticle–plate force profile. The experimentsonsisted of measuring the force profile at a given pH and ionic
Separation Dista nce/nm
inued ).
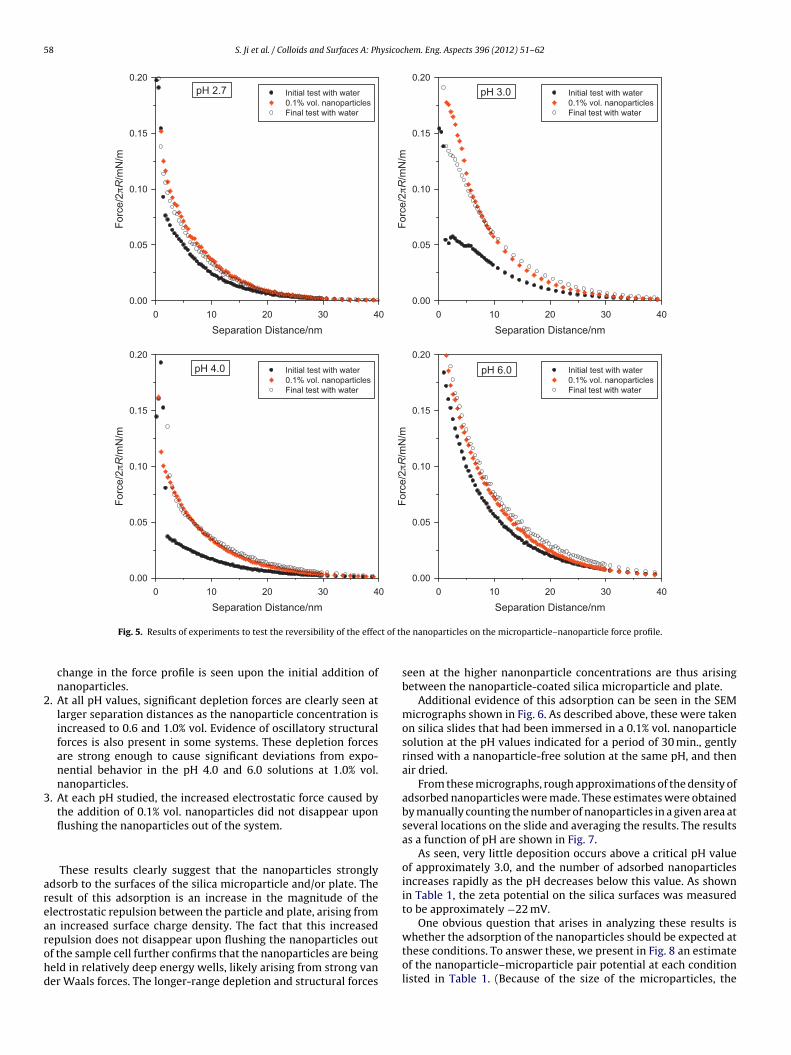
strength without added nanoparticles, flushing into the flow cell a0.1% vol. nanoparticle solution, measuring the force profile, flush-ing into the flow cell a solution containing no added nanoparticles,and finally measuring the force profile again. It should be stressedthat the pH and ionic strength of all solutions was kept the same sothat any changes observed in the force profiles were a result of thepresence of the nanoparticles.
The results of these experiments in solutions of pH 2.7, 3.0, 4.0and 6.0 are shown in Fig. 5. It is clear that at each pH, the magnitudeof the repulsive force increases upon addition of the nanoparticlesand does not significantly decrease upon flushing the nanoparticlesback out of the flow cell, indicating that nanoparticles remain onthe microparticle and plate.
4. Discussion
The results from the experiments presented above can be sum-marized as follows.
1. In solutions of pH 2.7, 3.0 and 4.0, the initial addition of thenanoparticles (0.1% vol.) causes an increase in the repulsive force.This force decays exponentially with a decay length that is ingood agreement with the bulk Debye length. At pH 6.0, little
S. Ji et al. / Colloids and Surfaces A: Physicochem. Eng. Aspects 396 (2012) 51– 62 57
Separation Distance/nm140120100806040
Forc
e/2π
R/m
N/m
-0.0004
-0.0002
0.0000
0.0002
0.0004
0.0006
0.0008
0.00100% vol.0.1% vol.0.6% vol.1.0% vol.
pH 2.7
Separation Distance/nm140120100806040
Forc
e/2π
R/m
N/m
-0.0004
-0.0002
0.0000
0.0002
0.0004
0.0006
0.0008
0.00100% vol .0.1% vol .0.6% vol .1.0% vol .
pH 3. 0
Separation Distance/nm140120100806040
Forc
e/2π
R/m
N/m
-0.0004
-0.0002
0.0000
0.0002
0.0004
0.0006
0.0008
0.00100% vol .0.1% vol .0.6% vol .1.0% vol .
pH 4.0
Separation Distance/nm140120100806040
Forc
e/2π
R/m
N/m
-0.0004
-0.0002
0.0000
0.0002
0.0004
0.0006
0.0008
0.00100% vol .0.1% vol .0.6% vol .1.0% vol .
pH 6.0
Fig. 4. Expanded scale plots of the measured force profiles showing the depletion force developing at the higher nanoparticle concentrations.
Table 2Comparison of the experimentally measured decay length in each experimental system with the solution Debye length.
pH Ionic strength (mM) Nanoparticle Conc. (% vol.) Theoretical Debye length (nm) Measured decay length (nm) % Difference
2.7 2.0 0 6.75 7.14 5.80.1 7.14 5.80.6 7.09 5.01.0 7.11 5.3
3.0 1.0 0 9.54 8.33 −12.70.1 10.15 6.40.6 10.12 6.11.0 10.29 7.9
4.0 1.1 0 9.09 9.59 5.50.1 9.59 5.50.6 9.21 1.31.0 –a –
6.0 1.0 0 9.54 9.32 −2.30.1 8.45 −11.40.6 8.47 −11.21.0 –a –
a Due to a significant depletion force, the semi-log plot of the force at these conditions was not linear, so a decay length was not determined.
58 S. Ji et al. / Colloids and Surfaces A: Physicochem. Eng. Aspects 396 (2012) 51– 62
Separation Distance/nm0 10 20 30 40
Forc
e/2π
R/m
N/m
0.00
0.05
0.10
0.15
0.20Initial test with water0.1% vol. nanoparticlesFinal test with water
pH 2.7
Separation Distance/nm0 10 20 30 40
Forc
e/2π
R/m
N/m
0.00
0.05
0.10
0.15
0.20Initial test with water0.1% vol. nanoparticlesFinal test with water
pH 3.0
Separation Distance/nm0 10 20 30 40
Forc
e/2π
R/m
N/m
0.00
0.05
0.10
0.15
0.20Initial test with water0.1% vol. nanoparticlesFinal test with water
pH 4.0
Separation Distance/nm0 10 20 30 40
Forc
e/2π
R/m
N/m
0.00
0.05
0.10
0.15
0.20Initial test with water0.1% vol. nanoparticlesFinal test with water
pH 6.0
t of th
2
3
arearohd
Fig. 5. Results of experiments to test the reversibility of the effec
change in the force profile is seen upon the initial addition ofnanoparticles.
. At all pH values, significant depletion forces are clearly seen atlarger separation distances as the nanoparticle concentration isincreased to 0.6 and 1.0% vol. Evidence of oscillatory structuralforces is also present in some systems. These depletion forcesare strong enough to cause significant deviations from expo-nential behavior in the pH 4.0 and 6.0 solutions at 1.0% vol.nanoparticles.
. At each pH studied, the increased electrostatic force caused bythe addition of 0.1% vol. nanoparticles did not disappear uponflushing the nanoparticles out of the system.
These results clearly suggest that the nanoparticles stronglydsorb to the surfaces of the silica microparticle and/or plate. Theesult of this adsorption is an increase in the magnitude of thelectrostatic repulsion between the particle and plate, arising fromn increased surface charge density. The fact that this increased
epulsion does not disappear upon flushing the nanoparticles outf the sample cell further confirms that the nanoparticles are beingeld in relatively deep energy wells, likely arising from strong vaner Waals forces. The longer-range depletion and structural forcese nanoparticles on the microparticle–nanoparticle force profile.
seen at the higher nanonparticle concentrations are thus arisingbetween the nanoparticle-coated silica microparticle and plate.
Additional evidence of this adsorption can be seen in the SEMmicrographs shown in Fig. 6. As described above, these were takenon silica slides that had been immersed in a 0.1% vol. nanoparticlesolution at the pH values indicated for a period of 30 min., gentlyrinsed with a nanoparticle-free solution at the same pH, and thenair dried.
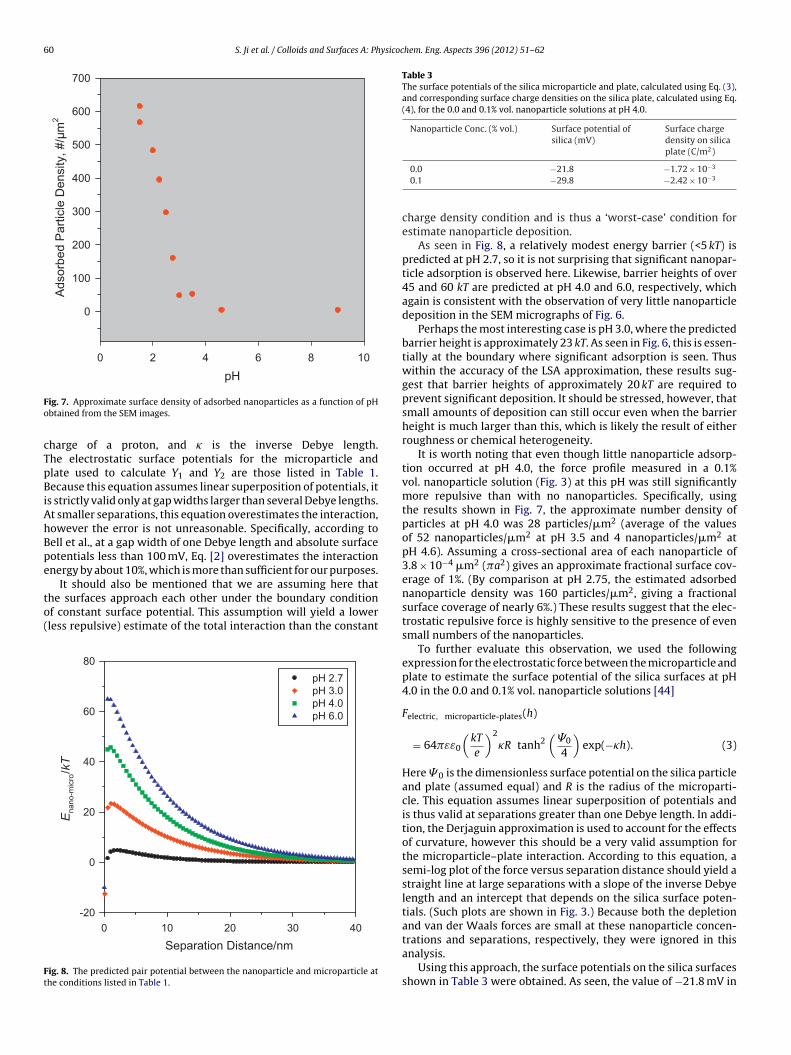
From these micrographs, rough approximations of the density ofadsorbed nanoparticles were made. These estimates were obtainedby manually counting the number of nanoparticles in a given area atseveral locations on the slide and averaging the results. The resultsas a function of pH are shown in Fig. 7.
As seen, very little deposition occurs above a critical pH valueof approximately 3.0, and the number of adsorbed nanoparticlesincreases rapidly as the pH decreases below this value. As shownin Table 1, the zeta potential on the silica surfaces was measuredto be approximately −22 mV.
One obvious question that arises in analyzing these results is
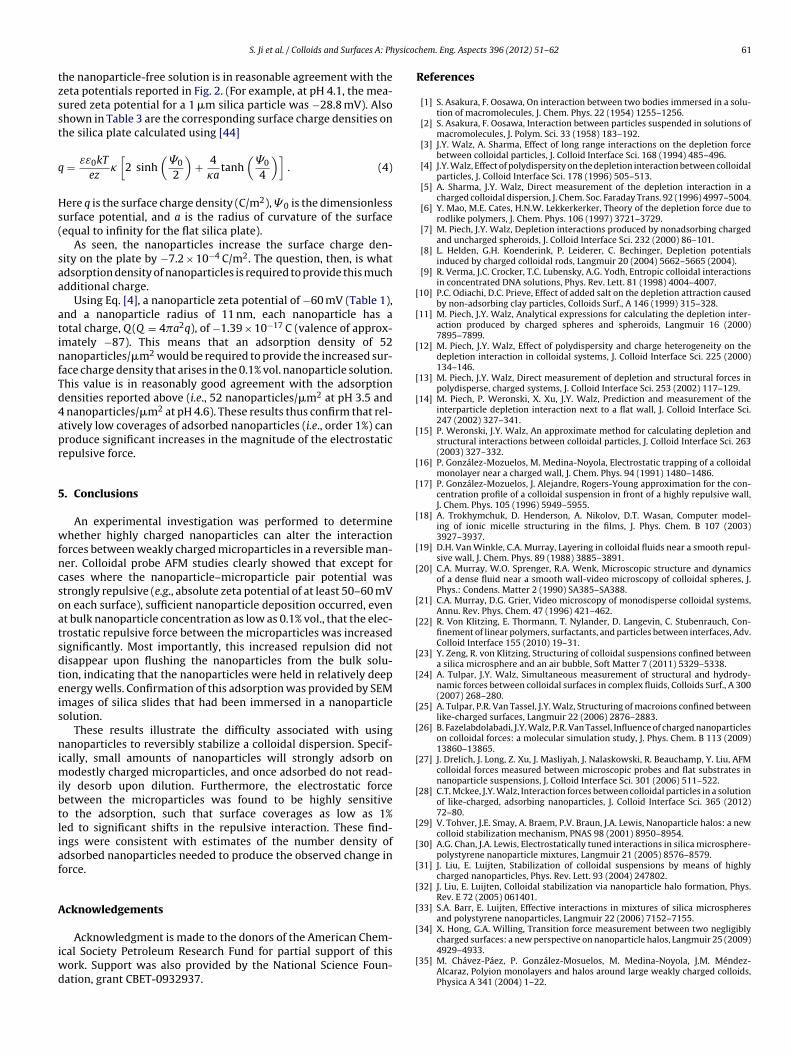
whether the adsorption of the nanoparticles should be expected atthese conditions. To answer these, we present in Fig. 8 an estimateof the nanoparticle–microparticle pair potential at each conditionlisted in Table 1. (Because of the size of the microparticles, the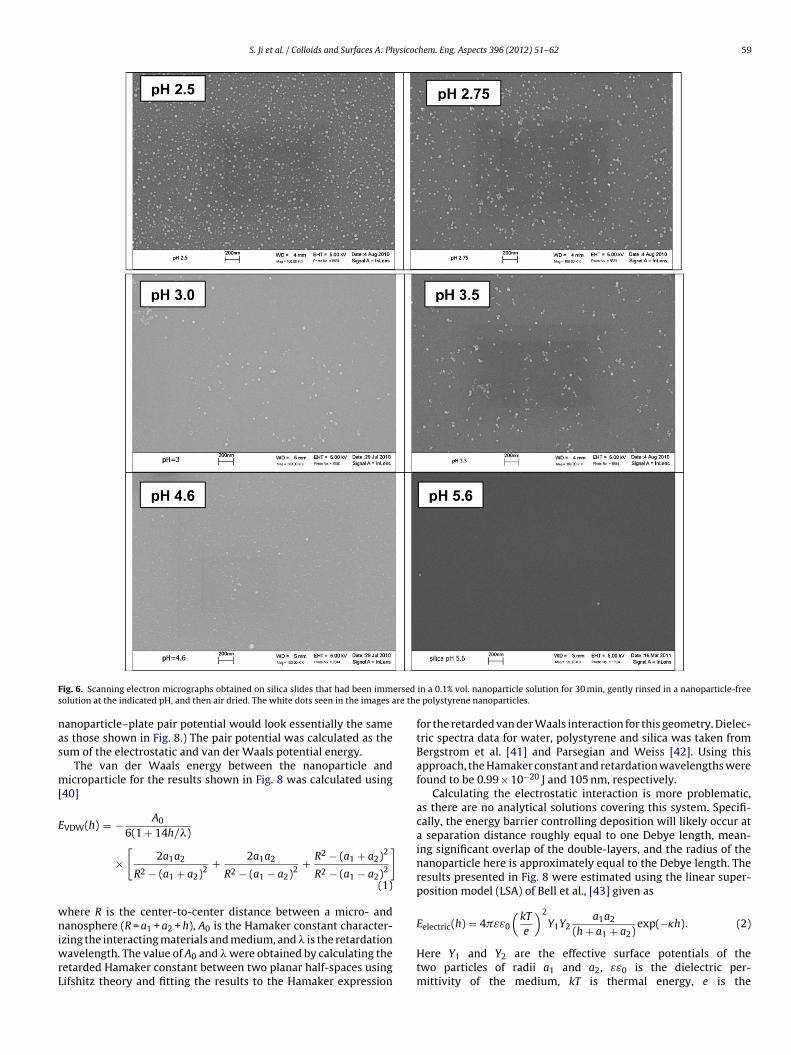
S. Ji et al. / Colloids and Surfaces A: Physicochem. Eng. Aspects 396 (2012) 51– 62 59
F ersed
s re the
nas
m[
E
wniwrL
ig. 6. Scanning electron micrographs obtained on silica slides that had been immolution at the indicated pH, and then air dried. The white dots seen in the images a
anoparticle–plate pair potential would look essentially the sames those shown in Fig. 8.) The pair potential was calculated as theum of the electrostatic and van der Waals potential energy.
The van der Waals energy between the nanoparticle andicroparticle for the results shown in Fig. 8 was calculated using
40]
VDW(h) = − A0
6(1 + 14h/�)
×[
2a1a2
R2 − (a1 + a2)2+ 2a1a2
R2 − (a1 − a2)2+ R2 − (a1 + a2)2
R2 − (a1 − a2)2
]
(1)
here R is the center-to-center distance between a micro- andanosphere (R = a1 + a2 + h), A0 is the Hamaker constant character-
zing the interacting materials and medium, and � is the retardationavelength. The value of A0 and � were obtained by calculating the
etarded Hamaker constant between two planar half-spaces usingifshitz theory and fitting the results to the Hamaker expression
in a 0.1% vol. nanoparticle solution for 30 min, gently rinsed in a nanoparticle-free polystyrene nanoparticles.
for the retarded van der Waals interaction for this geometry. Dielec-tric spectra data for water, polystyrene and silica was taken fromBergstrom et al. [41] and Parsegian and Weiss [42]. Using thisapproach, the Hamaker constant and retardation wavelengths werefound to be 0.99 × 10⁻²⁰ J and 105 nm, respectively.
Calculating the electrostatic interaction is more problematic,as there are no analytical solutions covering this system. Specifi-cally, the energy barrier controlling deposition will likely occur ata separation distance roughly equal to one Debye length, mean-ing significant overlap of the double-layers, and the radius of thenanoparticle here is approximately equal to the Debye length. Theresults presented in Fig. 8 were estimated using the linear super-position model (LSA) of Bell et al., [43] given as
Eelectric(h) = 4�εε0
(kT
)2
Y1Y2a1a2 exp(−�h). (2)
e (h + a1 + a2)
Here Y1 and Y2 are the effective surface potentials of thetwo particles of radii a1 and a2, εε0 is the dielectric per-mittivity of the medium, kT is thermal energy, e is the
60 S. Ji et al. / Colloids and Surfaces A: Physicochem. Eng. Aspects 396 (2012) 51– 62
pH1086420
Ads
orbe
d P
artic
le D
ensi
ty, #
/µm
2
0
100
200
300
400
500
600
700
Fo
cTpBiAhBpe
to(
Ft
Table 3The surface potentials of the silica microparticle and plate, calculated using Eq. (3),and corresponding surface charge densities on the silica plate, calculated using Eq.(4), for the 0.0 and 0.1% vol. nanoparticle solutions at pH 4.0.
Nanoparticle Conc. (% vol.) Surface potential ofsilica (mV)
Surface chargedensity on silicaplate (C/m2)
ig. 7. Approximate surface density of adsorbed nanoparticles as a function of pHbtained from the SEM images.
harge of a proton, and � is the inverse Debye length.he electrostatic surface potentials for the microparticle andlate used to calculate Y1 and Y2 are those listed in Table 1.ecause this equation assumes linear superposition of potentials, it
s strictly valid only at gap widths larger than several Debye lengths.t smaller separations, this equation overestimates the interaction,owever the error is not unreasonable. Specifically, according toell et al., at a gap width of one Debye length and absolute surfaceotentials less than 100 mV, Eq. [2] overestimates the interactionnergy by about 10%, which is more than sufficient for our purposes.
It should also be mentioned that we are assuming here thathe surfaces approach each other under the boundary conditionf constant surface potential. This assumption will yield a lowerless repulsive) estimate of the total interaction than the constant
Separation Distance/nm403020100
Ena
no-m
icro
/kT
-20
0
20
40
60
80pH 2.7pH 3.0pH 4.0pH 6.0
ig. 8. The predicted pair potential between the nanoparticle and microparticle athe conditions listed in Table 1.
0.0 −21.8 −1.72 × 10⁻³
0.1 −29.8 −2.42 × 10⁻³
charge density condition and is thus a ‘worst-case’ condition forestimate nanoparticle deposition.
As seen in Fig. 8, a relatively modest energy barrier (<5 kT) ispredicted at pH 2.7, so it is not surprising that significant nanopar-ticle adsorption is observed here. Likewise, barrier heights of over45 and 60 kT are predicted at pH 4.0 and 6.0, respectively, whichagain is consistent with the observation of very little nanoparticledeposition in the SEM micrographs of Fig. 6.
Perhaps the most interesting case is pH 3.0, where the predictedbarrier height is approximately 23 kT. As seen in Fig. 6, this is essen-tially at the boundary where significant adsorption is seen. Thuswithin the accuracy of the LSA approximation, these results sug-gest that barrier heights of approximately 20 kT are required toprevent significant deposition. It should be stressed, however, thatsmall amounts of deposition can still occur even when the barrierheight is much larger than this, which is likely the result of eitherroughness or chemical heterogeneity.
It is worth noting that even though little nanoparticle adsorp-tion occurred at pH 4.0, the force profile measured in a 0.1%vol. nanoparticle solution (Fig. 3) at this pH was still significantlymore repulsive than with no nanoparticles. Specifically, usingthe results shown in Fig. 7, the approximate number density ofparticles at pH 4.0 was 28 particles/�m2 (average of the valuesof 52 nanoparticles/�m2 at pH 3.5 and 4 nanoparticles/�m2 atpH 4.6). Assuming a cross-sectional area of each nanoparticle of3.8 × 10−4 �m2 (�a2) gives an approximate fractional surface cov-erage of 1%. (By comparison at pH 2.75, the estimated adsorbednanoparticle density was 160 particles/�m2, giving a fractionalsurface coverage of nearly 6%.) These results suggest that the elec-trostatic repulsive force is highly sensitive to the presence of evensmall numbers of the nanoparticles.
To further evaluate this observation, we used the followingexpression for the electrostatic force between the microparticle andplate to estimate the surface potential of the silica surfaces at pH4.0 in the 0.0 and 0.1% vol. nanoparticle solutions [44]
Felectric, microparticle-plates(h)
= 64�εε0
(kT
e
)2
�R tanh2(
�0
4
)exp(−�h). (3)
Here � 0 is the dimensionless surface potential on the silica particleand plate (assumed equal) and R is the radius of the microparti-cle. This equation assumes linear superposition of potentials andis thus valid at separations greater than one Debye length. In addi-tion, the Derjaguin approximation is used to account for the effectsof curvature, however this should be a very valid assumption forthe microparticle–plate interaction. According to this equation, asemi-log plot of the force versus separation distance should yield astraight line at large separations with a slope of the inverse Debyelength and an intercept that depends on the silica surface poten-tials. (Such plots are shown in Fig. 3.) Because both the depletionand van der Waals forces are small at these nanoparticle concen-
trations and separations, respectively, they were ignored in thisanalysis.Using this approach, the surface potentials on the silica surfacesshown in Table 3 were obtained. As seen, the value of −21.8 mV in
ysicoc
tzsst
q
Hs(
saa
atinfTd4apr
5
wfncsoatsdteis
nimibtliaf
A
iwd
[
[
[
[
[
[
[
[
[
[
[
[
[
[
[
[
[
[
[
[
[
[
[
[
[
S. Ji et al. / Colloids and Surfaces A: Ph
he nanoparticle-free solution is in reasonable agreement with theeta potentials reported in Fig. 2. (For example, at pH 4.1, the mea-ured zeta potential for a 1 �m silica particle was −28.8 mV). Alsohown in Table 3 are the corresponding surface charge densities onhe silica plate calculated using [44]
= εε0kT
ez�[
2 sinh(
�0
2
)+ 4
�atanh
(�0
4
)]. (4)
ere q is the surface charge density (C/m2), � 0 is the dimensionlessurface potential, and a is the radius of curvature of the surfaceequal to infinity for the flat silica plate).
As seen, the nanoparticles increase the surface charge den-ity on the plate by −7.2 × 10⁻⁴ C/m2. The question, then, is whatdsorption density of nanoparticles is required to provide this muchdditional charge.
Using Eq. [4], a nanoparticle zeta potential of −60 mV (Table 1),nd a nanoparticle radius of 11 nm, each nanoparticle has aotal charge, Q (Q = 4�a2q), of −1.39 × 10⁻¹⁷ C (valence of approx-mately −87). This means that an adsorption density of 52anoparticles/�m2 would be required to provide the increased sur-
ace charge density that arises in the 0.1% vol. nanoparticle solution.his value is in reasonably good agreement with the adsorptionensities reported above (i.e., 52 nanoparticles/�m2 at pH 3.5 and
nanoparticles/�m2 at pH 4.6). These results thus confirm that rel-tively low coverages of adsorbed nanoparticles (i.e., order 1%) canroduce significant increases in the magnitude of the electrostaticepulsive force.
. Conclusions
An experimental investigation was performed to determinehether highly charged nanoparticles can alter the interaction
orces between weakly charged microparticles in a reversible man-er. Colloidal probe AFM studies clearly showed that except forases where the nanoparticle–microparticle pair potential wastrongly repulsive (e.g., absolute zeta potential of at least 50–60 mVn each surface), sufficient nanoparticle deposition occurred, event bulk nanoparticle concentration as low as 0.1% vol., that the elec-rostatic repulsive force between the microparticles was increasedignificantly. Most importantly, this increased repulsion did notisappear upon flushing the nanoparticles from the bulk solu-ion, indicating that the nanoparticles were held in relatively deepnergy wells. Confirmation of this adsorption was provided by SEMmages of silica slides that had been immersed in a nanoparticleolution.
These results illustrate the difficulty associated with usinganoparticles to reversibly stabilize a colloidal dispersion. Specif-
cally, small amounts of nanoparticles will strongly adsorb onodestly charged microparticles, and once adsorbed do not read-
ly desorb upon dilution. Furthermore, the electrostatic forceetween the microparticles was found to be highly sensitiveo the adsorption, such that surface coverages as low as 1%ed to significant shifts in the repulsive interaction. These find-ngs were consistent with estimates of the number density ofdsorbed nanoparticles needed to produce the observed change inorce.
cknowledgements
Acknowledgment is made to the donors of the American Chem-cal Society Petroleum Research Fund for partial support of this
ork. Support was also provided by the National Science Foun-ation, grant CBET-0932937.
[
hem. Eng. Aspects 396 (2012) 51– 62 61
References
[1] S. Asakura, F. Oosawa, On interaction between two bodies immersed in a solu-tion of macromolecules, J. Chem. Phys. 22 (1954) 1255–1256.
[2] S. Asakura, F. Oosawa, Interaction between particles suspended in solutions ofmacromolecules, J. Polym. Sci. 33 (1958) 183–192.
[3] J.Y. Walz, A. Sharma, Effect of long range interactions on the depletion forcebetween colloidal particles, J. Colloid Interface Sci. 168 (1994) 485–496.
[4] J.Y. Walz, Effect of polydispersity on the depletion interaction between colloidalparticles, J. Colloid Interface Sci. 178 (1996) 505–513.
[5] A. Sharma, J.Y. Walz, Direct measurement of the depletion interaction in acharged colloidal dispersion, J. Chem. Soc. Faraday Trans. 92 (1996) 4997–5004.
[6] Y. Mao, M.E. Cates, H.N.W. Lekkerkerker, Theory of the depletion force due torodlike polymers, J. Chem. Phys. 106 (1997) 3721–3729.
[7] M. Piech, J.Y. Walz, Depletion interactions produced by nonadsorbing chargedand uncharged spheroids, J. Colloid Interface Sci. 232 (2000) 86–101.
[8] L. Helden, G.H. Koenderink, P. Leiderer, C. Bechinger, Depletion potentialsinduced by charged colloidal rods, Langmuir 20 (2004) 5662–5665 (2004).
[9] R. Verma, J.C. Crocker, T.C. Lubensky, A.G. Yodh, Entropic colloidal interactionsin concentrated DNA solutions, Phys. Rev. Lett. 81 (1998) 4004–4007.
10] P.C. Odiachi, D.C. Prieve, Effect of added salt on the depletion attraction causedby non-adsorbing clay particles, Colloids Surf., A 146 (1999) 315–328.
11] M. Piech, J.Y. Walz, Analytical expressions for calculating the depletion inter-action produced by charged spheres and spheroids, Langmuir 16 (2000)7895–7899.
12] M. Piech, J.Y. Walz, Effect of polydispersity and charge heterogeneity on thedepletion interaction in colloidal systems, J. Colloid Interface Sci. 225 (2000)134–146.
13] M. Piech, J.Y. Walz, Direct measurement of depletion and structural forces inpolydisperse, charged systems, J. Colloid Interface Sci. 253 (2002) 117–129.
14] M. Piech, P. Weronski, X. Xu, J.Y. Walz, Prediction and measurement of theinterparticle depletion interaction next to a flat wall, J. Colloid Interface Sci.247 (2002) 327–341.
15] P. Weronski, J.Y. Walz, An approximate method for calculating depletion andstructural interactions between colloidal particles, J. Colloid Interface Sci. 263(2003) 327–332.
16] P. González-Mozuelos, M. Medina-Noyola, Electrostatic trapping of a colloidalmonolayer near a charged wall, J. Chem. Phys. 94 (1991) 1480–1486.
17] P. González-Mozuelos, J. Alejandre, Rogers-Young approximation for the con-centration profile of a colloidal suspension in front of a highly repulsive wall,J. Chem. Phys. 105 (1996) 5949–5955.
18] A. Trokhymchuk, D. Henderson, A. Nikolov, D.T. Wasan, Computer model-ing of ionic micelle structuring in the films, J. Phys. Chem. B 107 (2003)3927–3937.
19] D.H. Van Winkle, C.A. Murray, Layering in colloidal fluids near a smooth repul-sive wall, J. Chem. Phys. 89 (1988) 3885–3891.
20] C.A. Murray, W.O. Sprenger, R.A. Wenk, Microscopic structure and dynamicsof a dense fluid near a smooth wall-video microscopy of colloidal spheres, J.Phys.: Condens. Matter 2 (1990) SA385–SA388.
21] C.A. Murray, D.G. Grier, Video microscopy of monodisperse colloidal systems,Annu. Rev. Phys. Chem. 47 (1996) 421–462.
22] R. Von Klitzing, E. Thormann, T. Nylander, D. Langevin, C. Stubenrauch, Con-finement of linear polymers, surfactants, and particles between interfaces, Adv.Colloid Interface 155 (2010) 19–31.
23] Y. Zeng, R. von Klitzing, Structuring of colloidal suspensions confined betweena silica microsphere and an air bubble, Soft Matter 7 (2011) 5329–5338.
24] A. Tulpar, J.Y. Walz, Simultaneous measurement of structural and hydrody-namic forces between colloidal surfaces in complex fluids, Colloids Surf., A 300(2007) 268–280.
25] A. Tulpar, P.R. Van Tassel, J.Y. Walz, Structuring of macroions confined betweenlike-charged surfaces, Langmuir 22 (2006) 2876–2883.
26] B. Fazelabdolabadi, J.Y. Walz, P.R. Van Tassel, Influence of charged nanoparticleson colloidal forces: a molecular simulation study, J. Phys. Chem. B 113 (2009)13860–13865.
27] J. Drelich, J. Long, Z. Xu, J. Masliyah, J. Nalaskowski, R. Beauchamp, Y. Liu, AFMcolloidal forces measured between microscopic probes and flat substrates innanoparticle suspensions, J. Colloid Interface Sci. 301 (2006) 511–522.
28] C.T. Mckee, J.Y. Walz, Interaction forces between colloidal particles in a solutionof like-charged, adsorbing nanoparticles, J. Colloid Interface Sci. 365 (2012)72–80.
29] V. Tohver, J.E. Smay, A. Braem, P.V. Braun, J.A. Lewis, Nanoparticle halos: a newcolloid stabilization mechanism, PNAS 98 (2001) 8950–8954.
30] A.G. Chan, J.A. Lewis, Electrostatically tuned interactions in silica microsphere-polystyrene nanoparticle mixtures, Langmuir 21 (2005) 8576–8579.
31] J. Liu, E. Luijten, Stabilization of colloidal suspensions by means of highlycharged nanoparticles, Phys. Rev. Lett. 93 (2004) 247802.
32] J. Liu, E. Luijten, Colloidal stabilization via nanoparticle halo formation, Phys.Rev. E 72 (2005) 061401.
33] S.A. Barr, E. Luijten, Effective interactions in mixtures of silica microspheresand polystyrene nanoparticles, Langmuir 22 (2006) 7152–7155.
34] X. Hong, G.A. Willing, Transition force measurement between two negligibly
charged surfaces: a new perspective on nanoparticle halos, Langmuir 25 (2009)4929–4933.35] M. Chávez-Páez, P. González-Mosuelos, M. Medina-Noyola, J.M. Méndez-Alcaraz, Polyion monolayers and halos around large weakly charged colloids,Physica A 341 (2004) 1–22.

6 ysicoc
[
[
[
[
[
[
[
[43] G.M. Bell, S. Levine, L.N. McCartney, Approximate methods of determining thedouble-layer free energy of interaction between two charged colloidal spheres,
2 S. Ji et al. / Colloids and Surfaces A: Ph
36] A. Sharma, S. Tan, J.Y. Walz, Measurement of colloidal stability in solutionsof simple, nonadsorbing polyelectrolytes, J. Colloid Interface Sci. 190 (1997)392–407.
37] W.A. Ducker, T.J. Senden, R.M. Pashley, Measurement of forces in liquids usinga force microscope, Langmuir 8 (1992) 1831–1836.
38] J.L. Hutter, J. Bechhoefer, Calibration of atomic force microscope tips, Rev. Sci.Instrum. 64 (1993) 1868–1873.
39] P.J. Scales, F. Grieser, T.W. Healy, Electrokinetics of the silica-solution interface:a flat plate streaming potential study, Langmuir 8 (1992) 965–974.
40] M. Elimelech, J. Gregory, X. Jia, R. Williams, Particle Deposition & Aggregation:Measurement, Modeling and Simulation, Butterworth-Heinemann Ltd., Oxford,1995.
[
hem. Eng. Aspects 396 (2012) 51– 62
41] L. Bergstrom, A. Meurk, H. Arwin, D.J. Rowcliffe, Estimation of Hamaker con-stants of ceramic materials from optical data using Lifshitz theory, J. Am. Ceram.Soc. 79 (1996) 339–348.
42] V.A. Parsegian, G.H. Weiss, Spectroscopic parameters for computation of vander Waals forces, J. Colloid Interface Sci. 81 (1981) 285–289.
J. Colloid Interface Sci. 33 (1970) 335–359.44] W.B. Russel, D.A. Saville, W.R. Schowalter, Colloidal Dispersions, Cambridge
University Press, Cambridge, 1989.
Related Documents


![Colloids and Surfaces B: Biointerfaces Colloids Surfaces B... · Colloids and Surfaces B: Biointerfaces 116 (2014) ... antibiotics [3–6]. Their broad ... Alamethicin is most effective](https://static.cupdf.com/doc/110x72/5a94ecce7f8b9a9c5b8c50e4/colloids-and-surfaces-b-colloids-surfaces-bcolloids-and-surfaces-b-biointerfaces.jpg)