CONSUMPtION OF ALCOHOLIC BeVeRAGeS 1. exposure Data 1.1 types and ethanol contents of alcoholic beverages 1.1.1 Types of alcoholic beverage Most cultures throughout the world have traditionally consumed some form of alcoholic beverages for thousands of years, and local specialty alcoholic beverages still account for the majority of all those that exist. Only a small number have evolved into commodities that are produced commercially on a large scale. In world trade, beer from barley, wine from grapes and certain distilled beverages are sold as commodities. Other alcoholic beverages are not sold on the international market. In many developing countries, however, various types of home-made or locally produced alcoholic bever- ages such as sorghum beer, palm wine or sugarcane spirits continue to be the main available beverage types (WHO, 2004). It is difficult to measure the global production or consumption of locally available beverages, and few data exist on their specific chemical composition (see Section 1.6). A discussion of unrecorded alcohol production, which includes these traditional or home-made beverages, is given in Section 1.3. Although these types of alcoholic bev- erage can be important in several countries at the national level, their impact is fairly small on a global scale. This monograph focuses on the main beverage categories of beer, wine and spir- its unless there is a specific reason to examine some subcategory, e.g. alcopops or flavoured alcoholic beverages. These categories are, however, not as clear-cut as they may seem. There are several beverages that are a combination of two types (e.g. forti- fied wines, in which spirits are added to wine). The categorization above is based on production methods and raw materials, and not on the ethanol content of the beverages (see Section 1.2). Another classification of beverages is the Standard International Trade Classification (SITC) that has four categories: wine from fresh grapes, cider and other fermented –41–

Welcome message from author
This document is posted to help you gain knowledge. Please leave a comment to let me know what you think about it! Share it to your friends and learn new things together.
Transcript
CONSUMPtION OF ALCOHOLIC BeVeRAGeS
1. exposure Data
1.1 types and ethanol contents of alcoholic beverages
1.1.1. Types.of.alcoholic.beverage
Most cultures throughout the world have traditionally consumed some form of alcoholic beverages for thousands of years, and local specialty alcoholic beverages still account for the majority of all those that exist. Only a small number have evolved into commodities that are produced commercially on a large scale. In world trade, beer from barley, wine from grapes and certain distilled beverages are sold as commodities. Other alcoholic beverages are not sold on the international market. In many developing countries, however, various types of home-made or locally produced alcoholic bever-ages such as sorghum beer, palm wine or sugarcane spirits continue to be the main available beverage types (WHO, 2004).
It is difficult to measure the global production or consumption of locally available beverages, and few data exist on their specific chemical composition (see Section 1.6). A discussion of unrecorded alcohol production, which includes these traditional or home-made beverages, is given in Section 1.3. Although these types of alcoholic bev-erage can be important in several countries at the national level, their impact is fairly small on a global scale.
This monograph focuses on the main beverage categories of beer, wine and spir-its unless there is a specific reason to examine some subcategory, e.g. alcopops or flavoured alcoholic beverages. These categories are, however, not as clear-cut as they may seem. There are several beverages that are a combination of two types (e.g. forti-fied wines, in which spirits are added to wine). The categorization above is based on production methods and raw materials, and not on the ethanol content of the beverages (see Section 1.2).
Another classification of beverages is the Standard International Trade Classification (SITC) that has four categories: wine from fresh grapes, cider and other fermented
–41–
beverages, beer and distilled alcoholic beverages (for further details, see SITC Rev 3 at United Nations Statistics Division (2007; http://unstats.un.org/unsd/cr)).
1.1.2. alcohol.content.of.different.beverages
In this monograph, percentage by volume (% vol) is used to indicate the etha-nol content of beverages; this is also called the French or Gay-Lussac system. The American proof system is double the percentage by volume; a vodka which is 40% by volume is thus 80 proof in the USA (IARC, 1988).
The standard approach to measuring the amount of ethanol contained in a specific drink is as follows. The amount of alcoholic beverage typically consumed for each type of beverage (e.g. a 330-mL bottle of beer or a 200-mL glass of wine) is multiplied by the ethanol conversion factor, i.e. the proportion of the total volume of the beverage that is alcohol. Ethanol conversion factors differ by country, but are generally about 4–5% vol for beer, about 12% vol for wine and about 40% vol for distilled spirits. Thus, the ethanol content of a bottle of beer is calculated as (330 mL) × (0.04) = 13.2 mL etha-nol. In many countries, ethanol conversion factors are used to convert the volume of beverage directly into grams of ethanol. In other countries, volumes of alcohol may be recorded in ‘ounces’. Relevant alcohol conversion factors for these different measures are (WHO, 2000): 1 mL ethanol = 0.79 g; 1 United Kingdom fluid oz = 2.84 cL = 28.4 mL = 22.3 g; 1 US fluid oz = 2.96 cL = 29.6 mL = 23.2 g.
The ethanol content in beer usually varies from 2.3% to over 10% vol, and is mostly 5–5.5% vol. In some countries, low-alcohol beer, i.e. below 2.3% vol, has obtained a considerable share of the market. In general, beer refers to barley beer, although sor-ghum beer is consumed in large quantities in Africa.
The ethanol content of wine usually varies from 8 to 15% vol, but light wines and even non-alcoholic wines also exist.
The ethanol content of spirits is approximately 40% vol, but may be considerably higher in some national specialty spirits. Also within the spirits category are aperitifs, which contain around 20% vol of alcohol. Alcopops, flavoured alcoholic beverages or ready-to-drink beverages usually contain 4–7% vol of alcohol, and are often pre-mixed beverages that contain vodka or rum.
1.2 Production and trade of alcoholic beverages
1.2.1. production
(a). production.methodsMost yeasts cannot grow when the concentration of alcohol is higher than 18%.
This is therefore the practical limit for the strength of fermented beverages, such as wine, beer and sake (rice wine). In distillation, neutral alcohol can be produced at strengths in excess of 96% vol of alcohol.
42 IARC MONOGRAPHS VOLUME 96
(i). Beer.productionThe process of producing beer has remained unchanged for hundreds of years.
The basic ingredients for most beers are malted barley, water, hops and yeast. Barley starch supplies most of the sugars from which the alcohol is derived in the majority of beers throughout the world. Other grains used are wheat and sorghum. The starch in barley is enclosed in a cell wall, and these wrappings are stripped away in the first step of the brewing process, which is called malting. Removal of the wall softens the grain and makes it more readily milled. The malted grain is milled to produce relatively fine particles and these are then mixed with hot water in a process that is called mashing. The water must process the right mix of salts. Typically, mashes contain approximately three parts of water to one part of malt and are maintained at a temperature of ~65 °C. Some brewers add starch from other sources such as maize (corn) or rice to supple-ment the malt. After ~1 h of mashing, the liquid portion is recovered by either strain-ing or filtering. The liquid (the wort) is then boiled for ~1 h. Boiling serves various functions, including sterilization and the removal of unpleasant grainy contents that cause cloudiness. Many brewers add sugar or at least hops at this stage. The hopped wort is then cooled and pitched with yeast. There are many strains of brewing yeast and brewers tend their strains carefully because of their importance to the identity of the brand. Fundamentally, yeasts can be divided into lager and ale strains. Both types need a little oxygen to trigger off their metabolism. Ale fermentations are usually complete within a few days at temperatures as high as 20 °C, whereas lager fermenta-tions, at temperatures which are as low as 6 °C, can take several weeks. Fermentation is complete when the desired alcohol content has been reached and when an unpleas-ant butterscotch flavour, which develops during all fermentation, has been removed by the yeast. The yeast is then harvested for use in the next fermentation. Nowadays, the majority of beers receive a relatively short conditioning period after fermentation and before filtration. This is performed at –1 °C or lower (but not so low as to freeze the beer) for a minimum of 3 days. This eliminates more proteins and ensures that the beer is less likely to cloud in the packaging or glass. The filtered beer is adjusted to the required degree of carbonation before being packed into cans, kegs, or glass or plastic bottles (Bamforth, 2004).
(ii). Wine.productionA great majority of wine is produced from grapes, but it can also be produced from
other fruits and berries. The main steps in the process of wine making are picking the grapes, crushing them and possibly adding sulfur dioxide to produce a wine must. After addition of saccharomyces, a primary/secondary fermentation then takes place. This newly fermented wine is then stabilized and left to mature, after which the stabi-lized wine is bottled (and possibly left to mature further in the bottle).
Red grapes are fermented with the skin, and yield ~20% more alcohol than white grapes. Ripe fruit should be picked immediately before it is to be crushed. Harvesting is becoming increasingly mechanical although it causes more physical damage to the
43ALCOHOL CONSUMPTION
grapes, and sulfur dioxide may be added during the mechanical harvesting. The grapes are then stemmed and crushed. The stems are not usually left in contact with crushed grapes to avoid off-flavours. An initial crushing separates grapes from stems with the aim of achieving an even breakage of grapes. It is not necessary to separate the juice from the skins immediately for red wine, but it is for white, rosé or blushwines. The juice is settled at a low temperature (< 12 °C), after which it is drained and pressed. To accelerate juice settling and obtain a clearer product, pectic enzyme is frequently added at the crushing stage. Once the juice is separated from the skins, it is held over-night in a closed container. Thereafter, it is centrifuged before the addition of yeast. In locations where the grapes do not ripen well because of a short growing season, it may be necessary to add sugar (sucrose). Dried yeast is usually used in wine making (contrary to beer brewing). Oxygen is introduced to satisfy the demand of the yeast. White wines are fermented at 10–15 °C, whereas red wines are fermented at 20–30 °C. Fermentation is complete within 20–30 days. Wine is usually racked off the yeast when the fermentation is complete, although some winemakers leave the yeast for several months to improve the flavour. After fermentation, the wine is clarified with different compounds depending on the type of wine (bentonite, gelatine, silica gels). Maintaining them in an anaerobic state then stabilizes the wines and prevents spoilage by most bacteria and yeast. Wines tend to benefit from ageing, which is performed in either a tank, barrel or bottle. The extent of ageing is usually less for white than for red wines. During ageing, the colour, aroma, taste and level of sulfur dioxide are moni-tored. If wine is aged in oak barrels, some characteristics are derived from the barrel.
Residual oxygen is removed during packaging and some winemakers add sorbic acid as a preservative to sweet table wines. To avoid the use of additives, attention must be paid to cold filling and sterility, and to avoid taints, corks should be kept at a very low moisture content. The shelf life of wine is enhanced by low-temperature storage (Bamforth, 2005).
(iii). production.of.spiritsThe neutral alcohol base used for several different spirits is frequently produced
from cereals (e.g. corn, wheat), beet or molasses, grapes or other fruit, cane sugar or potatoes. These basic substances are first fermented and then purified and distilled. Distillation entails heating the base liquid so that all volatile substances evaporate, collecting these vapours and cooling them. This liquid may be distilled several times to increase purity. The process leads to a colourless, neutral spirit, which may then be flavoured in a multitude of ways. For some spirits, such as cognac and whisky, the original flavouring of the base liquid is retained throughout the distilling process, to give the distinct flavour. After distillation, water is added to give the desired strength of the beverage.
Vodka is a pure unaged spirit distilled from agricultural products and is usually filtered through charcoal. Neutral alcohol is the base for vodka, although many flavour-ings can be found in modern vodkas, such as fruit and spices. Other beverages based
44 IARC MONOGRAPHS VOLUME 96
on neutral distilled alcohol are gin, genever, aquavit, anis and ouzo. For example, the distinct flavour of gin comes from distillation in the presence of plants such as juniper, coriander and angelica, and the peel of oranges and lemons.
Rum is produced from molasses or cane sugar; whisky is produced from a mash of cereals and is matured for a minimum of 3 years. Brandy comes from distilled wine and needs to mature in oak. Fruit spirits may be produced by fermentation and distil-lation of a large number of fruit and berries, such as cherries, plums, peaches, apples, pears, apricots, figs, citrus fruit, grapes, raspberries or blackberries (Bamforth, 2005).
(b). production.and.trade.volumesAccording to the SITC (SITC Rev. 3.1, code 155; United Nations Statistic Division
2007), the activity of manufacture of alcoholic beverages is divided into three categories:1551 - Distilling, rectifying and blending of spirits; ethyl alcohol production
from fermented materials. This class includes: the manufacture of distilled, potable, alcoholic beverages: whisky, brandy, gin, liqueurs and ‘mixed drinks’; the blending of distilled spirits; the production of ethyl alcohol from fermented materials; and the production of neutral spirits.
1552 – Manufacture of wine. This class includes: the manufacture of wine from grapes not grown by the same unit; the manufacture of sparkling wine; the manu-facture of wine from concentrated grape must; the manufacture of fermented but not distilled alcoholic beverages: sake, cider, perry, mead, other fruit wines and mixed bev-erages containing alcohol; the manufacture of vermouth and similar fortified wines; the blending of wine; and the manufacture of low-alcohol or non-alcoholic wine.
1553 – Manufacture of malt liquors and malt. This class includes: the manufac-ture of malt liquors, such as beer, ale, porter and stout; the manufacture of malt; and the manufacture of low-alcohol or non-alcoholic beer.
According to the alcoholic beverage industry, the global market for alcoholic drinks reached a volume of 160.2 billion litres of alcohol in 2006. The market is forecasted to grow further in the coming years. The compound annual average growth rate in vol-ume has been around 2% per year from 2000 to 2006. A similar growth rate is expected in the coming 5 years. The value of the global drinks market in 2006 was 812.4 billion US $ (Market is valued according to retail selling price including any applicable taxes). Both volume and value grow at a steady rate of around 1–2% per year.
The sales of beer, cider and flavoured alcoholic beverages dominate the market with a 48.7% share of the global value. Wine is the second highest in value at 28.3% and is followed by spirits at 22.9%.
Europe continues to be the largest alcoholic drinks market and accounts for 59% of the global market value. Europe is followed by the USA (23.7%) and the Asia-Pacific region (17.2%).
On-trade (on-premises) sales distribute alcoholic products worth 38.7% of the total market revenue, followed by supermarkets/hypermarkets (20.8%) and specialist
45ALCOHOL CONSUMPTION
retailers (12.1%) (Datamonitor, 2006, Datamonitor does not cover all countries as it is more focused on developed countries; for e.g. Africa, the data are almost non-existent).
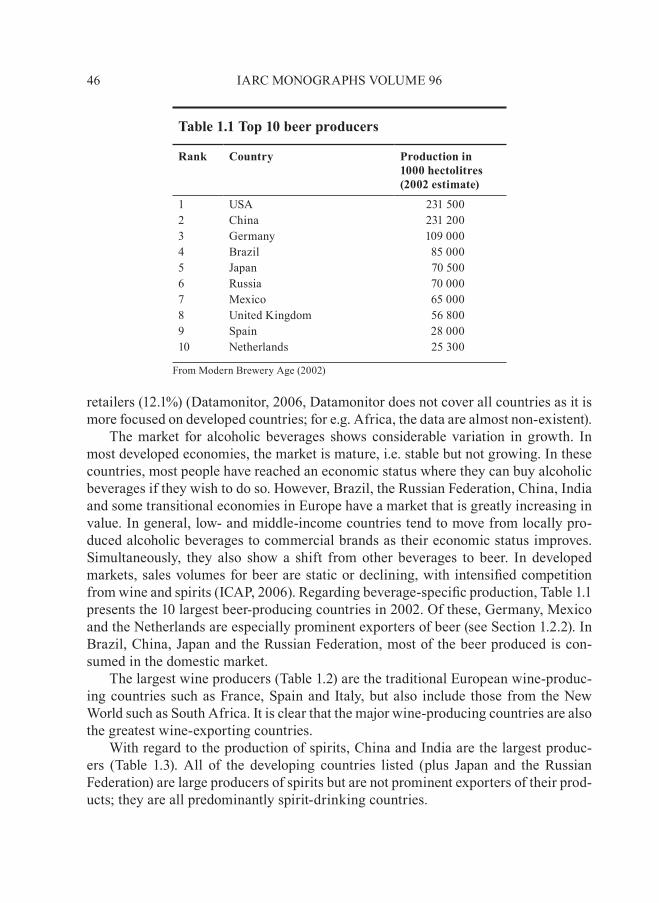
The market for alcoholic beverages shows considerable variation in growth. In most developed economies, the market is mature, i.e. stable but not growing. In these countries, most people have reached an economic status where they can buy alcoholic beverages if they wish to do so. However, Brazil, the Russian Federation, China, India and some transitional economies in Europe have a market that is greatly increasing in value. In general, low- and middle-income countries tend to move from locally pro-duced alcoholic beverages to commercial brands as their economic status improves. Simultaneously, they also show a shift from other beverages to beer. In developed markets, sales volumes for beer are static or declining, with intensified competition from wine and spirits (ICAP, 2006). Regarding beverage-specific production, Table 1.1 presents the 10 largest beer-producing countries in 2002. Of these, Germany, Mexico and the Netherlands are especially prominent exporters of beer (see Section 1.2.2). In Brazil, China, Japan and the Russian Federation, most of the beer produced is con-sumed in the domestic market.
The largest wine producers (Table 1.2) are the traditional European wine-produc-ing countries such as France, Spain and Italy, but also include those from the New World such as South Africa. It is clear that the major wine-producing countries are also the greatest wine-exporting countries.
With regard to the production of spirits, China and India are the largest produc-ers (Table 1.3). All of the developing countries listed (plus Japan and the Russian Federation) are large producers of spirits but are not prominent exporters of their prod-ucts; they are all predominantly spirit-drinking countries.
46 IARC MONOGRAPHS VOLUME 96
table 1.1 top 10 beer producers
Rank Country Production in 1000 hectolitres (2002 estimate)
1 USA 231 5002 China 231 2003 Germany 109 0004 Brazil 85 0005 Japan 70 5006 Russia 70 0007 Mexico 65 0008 United Kingdom 56 8009 Spain 28 00010 Netherlands 25 300
From Modern Brewery Age (2002)
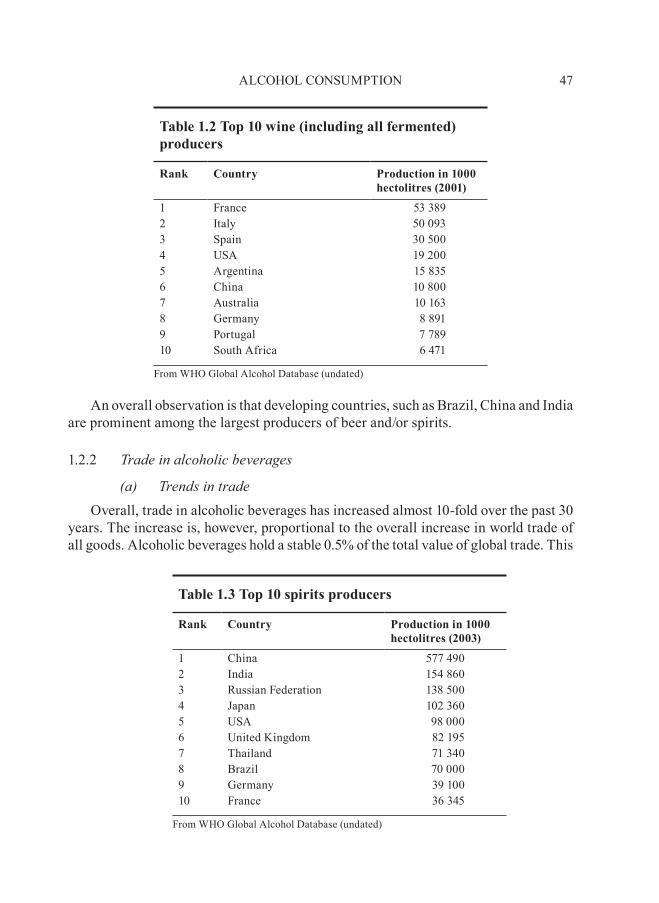
An overall observation is that developing countries, such as Brazil, China and India are prominent among the largest producers of beer and/or spirits.
1.2.2. Trade.in.alcoholic.beverages
(a). Trends.in.tradeOverall, trade in alcoholic beverages has increased almost 10-fold over the past 30
years. The increase is, however, proportional to the overall increase in world trade of all goods. Alcoholic beverages hold a stable 0.5% of the total value of global trade. This
47ALCOHOL CONSUMPTION
table 1.2 top 10 wine (including all fermented) producers
Rank Country Production in 1000 hectolitres (2001)
1 France 53 3892 Italy 50 0933 Spain 30 5004 USA 19 2005 Argentina 15 8356 China 10 8007 Australia 10 1638 Germany 8 8919 Portugal 7 78910 South Africa 6 471
From WHO Global Alcohol Database (undated)
table 1.3 top 10 spirits producers
Rank Country Production in 1000 hectolitres (2003)
1 China 577 4902 India 154 8603 Russian Federation 138 5004 Japan 102 3605 USA 98 0006 United Kingdom 82 1957 Thailand 71 3408 Brazil 70 0009 Germany 39 10010 France 36 345
From WHO Global Alcohol Database (undated)
would mean that for every 200 US $ in global trade, 1 US $ involves alcoholic bever-ages. The trends in trade do not correlate to trends in consumption.
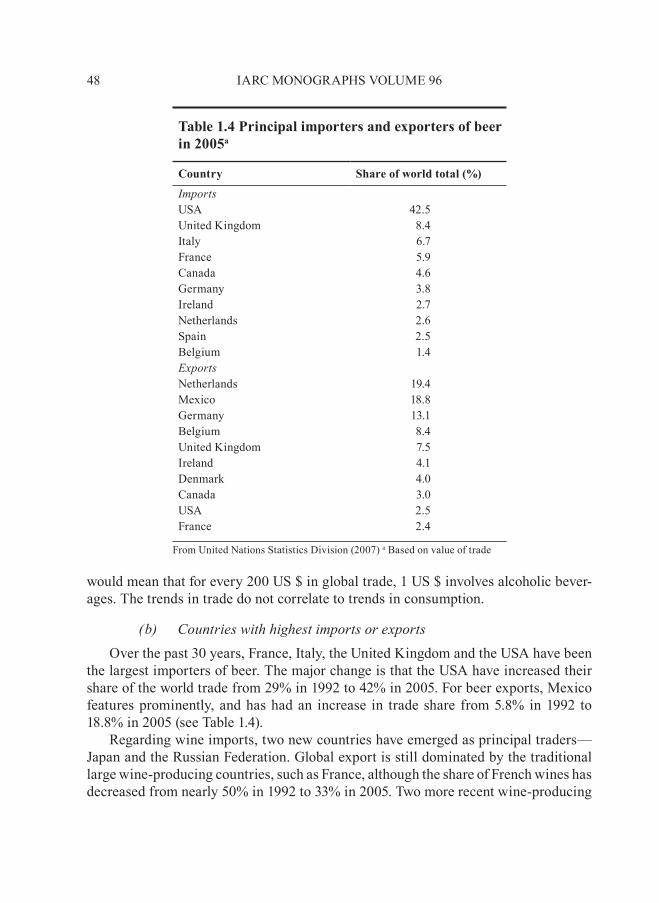
(b). Countries.with.highest.imports.or.exportsOver the past 30 years, France, Italy, the United Kingdom and the USA have been
the largest importers of beer. The major change is that the USA have increased their share of the world trade from 29% in 1992 to 42% in 2005. For beer exports, Mexico features prominently, and has had an increase in trade share from 5.8% in 1992 to 18.8% in 2005 (see Table 1.4).
Regarding wine imports, two new countries have emerged as principal traders—Japan and the Russian Federation. Global export is still dominated by the traditional large wine-producing countries, such as France, although the share of French wines has decreased from nearly 50% in 1992 to 33% in 2005. Two more recent wine-producing
48 IARC MONOGRAPHS VOLUME 96
table 1.4 Principal importers and exporters of beer in 2005a
Country Share of world total (%)
ImportsUSA 42.5United Kingdom 8.4Italy 6.7France 5.9Canada 4.6Germany 3.8Ireland 2.7Netherlands 2.6Spain 2.5Belgium 1.4ExportsNetherlands 19.4Mexico 18.8Germany 13.1Belgium 8.4United Kingdom 7.5Ireland 4.1Denmark 4.0Canada 3.0USA 2.5France 2.4
From United Nations Statistics Division (2007) a Based on value of trade
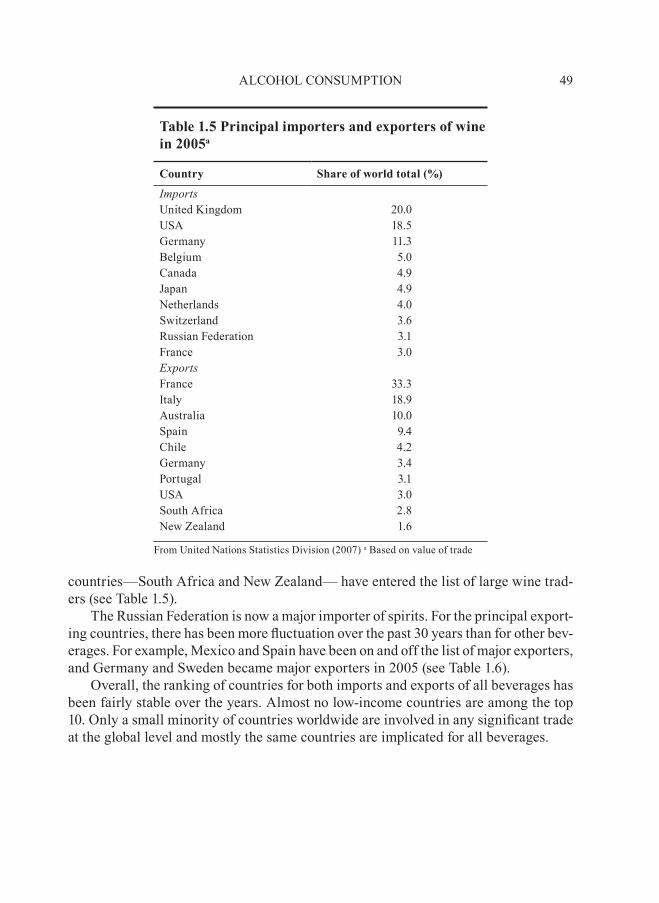
countries—South Africa and New Zealand— have entered the list of large wine trad-ers (see Table 1.5).
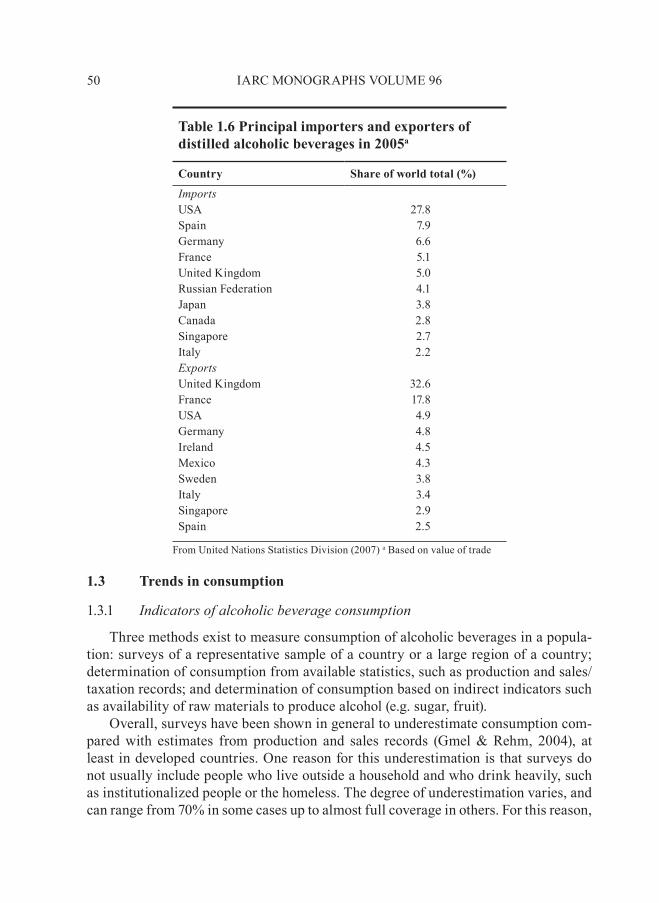
The Russian Federation is now a major importer of spirits. For the principal export-ing countries, there has been more fluctuation over the past 30 years than for other bev-erages. For example, Mexico and Spain have been on and off the list of major exporters, and Germany and Sweden became major exporters in 2005 (see Table 1.6).
Overall, the ranking of countries for both imports and exports of all beverages has been fairly stable over the years. Almost no low-income countries are among the top 10. Only a small minority of countries worldwide are involved in any significant trade at the global level and mostly the same countries are implicated for all beverages.
49ALCOHOL CONSUMPTION
table 1.5 Principal importers and exporters of wine in 2005a
Country Share of world total (%)
ImportsUnited Kingdom 20.0USA 18.5Germany 11.3Belgium 5.0Canada 4.9Japan 4.9Netherlands 4.0Switzerland 3.6Russian Federation 3.1France 3.0ExportsFrance 33.3Italy 18.9Australia 10.0Spain 9.4Chile 4.2Germany 3.4Portugal 3.1USA 3.0South Africa 2.8New Zealand 1.6
From United Nations Statistics Division (2007) a Based on value of trade
1.3 trends in consumption
1.3.1. Indicators.of.alcoholic.beverage.consumption
Three methods exist to measure consumption of alcoholic beverages in a popula-tion: surveys of a representative sample of a country or a large region of a country; determination of consumption from available statistics, such as production and sales/taxation records; and determination of consumption based on indirect indicators such as availability of raw materials to produce alcohol (e.g. sugar, fruit).
Overall, surveys have been shown in general to underestimate consumption com-pared with estimates from production and sales records (Gmel & Rehm, 2004), at least in developed countries. One reason for this underestimation is that surveys do not usually include people who live outside a household and who drink heavily, such as institutionalized people or the homeless. The degree of underestimation varies, and can range from 70% in some cases up to almost full coverage in others. For this reason,
50 IARC MONOGRAPHS VOLUME 96
table 1.6 Principal importers and exporters of distilled alcoholic beverages in 2005a
Country Share of world total (%)
ImportsUSA 27.8Spain 7.9Germany 6.6France 5.1United Kingdom 5.0Russian Federation 4.1Japan 3.8Canada 2.8Singapore 2.7Italy 2.2ExportsUnited Kingdom 32.6France 17.8USA 4.9Germany 4.8Ireland 4.5Mexico 4.3Sweden 3.8Italy 3.4Singapore 2.9Spain 2.5
From United Nations Statistics Division (2007) a Based on value of trade
international comparisons of total consumption between developed countries mostly use production and sales-based statistics (Rehm et. al ., 2003). Whenever possible, recorded consumption should be supplemented by estimates of unrecorded consump-tion. This is especially important in developing countries, where unrecorded consump-tion is on average more common and, in some regions of the world, constitutes more than 50% of the overall consumption.
1.3.2. assessment.of.total.consumption.per.head.(per-capita.consumption)
(a). Measurement.of.adult.per-capita.consumption.of.recorded.alcoholic.beverages
Data on per-capita alcoholic beverage consumption provide the consumption in litres of pure alcohol per inhabitant in a given year. They are available for the major-ity of countries, often given over time, and avoid the underestimation of total volume of consumption that is commonly inherent in survey data (e.g. Midanik, 1982; Rehm, 1998; Gmel & Rehm, 2004). Adult per-capita consumption, i.e. consumption by all per-sons aged 15 years and above, is preferable to per-capita consumption per.se since alco-holic beverages are largely consumed in adulthood. The age pyramid varies in different countries; therefore, per-capita consumption figures based on the total population tend to underestimate consumption in countries where a large proportion of the population is under the age of 15 years, as is the case in many developing countries. For more information and guidance on estimating per-capita consumption, see WHO (2000).
Three principal sources for per-capita estimates are national government data, information from the Food and Agriculture Organization of the United Nations (FAO) and data from the alcoholic beverage industry (Rehm et.al ., 2003). Where available, the best and most reliable information stems from national governments, usually based on sales figures, tax revenue and/or production data. Generally, sales figures are con-sidered to be the most accurate, provided that sales of alcoholic beverages are sepa-rated from those of any other possible items sold at a given location, and that they are beverage-specific. One of the drawbacks of production figures is that they are always dependent on accurate export and import data; if these are not available, the produc-tion figures will yield an under- or an overestimation.
The most complete and comprehensive international data set on per-capita con-sumption was published by FAO (until 2003). FAOSTAT, the database of the FAO, publishes production and trade information for different types of alcoholic beverage for almost 200 countries. The estimates are based on official reports of production by national governments, mainly by the Ministries of Agriculture in response to an annual FAO questionnaire. The statistics on imports and exports derive mainly from Customs Departments. If these sources are not available, other government data such as statisti-cal yearbooks are consulted. The accuracy of the FAO data relies on reporting by mem-ber nations. The information from member nations probably underestimates informal,
51ALCOHOL CONSUMPTION
home and illegal production, but these sources are still covered more accurately by the FAO than by estimates based solely on production or sales figures.
The third main source of information is the alcoholic beverage industry. In this category the most widely used is World Drinks Trends (WDT), published by the Commission for Distilled Spirits (World Advertising Research Centre Ltd, 2005). The WDT estimates are based on total sales in litres divided by the total mid-year popula-tion and use conversion rates that are not published. WDT also tries to calculate the consumption of both incoming and outgoing tourists. Currently, at least partial data are available for 58 countries. Other sources from the alcoholic beverage industry, as well as market research companies, are less systematic, entail fewer countries and are more limited in providing information over time.
The WHO Global Alcohol Database (undated) systematically collects and com-pares per-capita data from different sources on a regular basis (for procedures and further information, see Rehm et.al ., 2003; WHO, 2004) using data from the United Nations for population estimates. The information in this section derives from this database, which has explicit rules for selecting and processing data to ensure their comparability.
The main limitations of adult per-capita estimates are twofold: they do not incor-porate most unrecorded consumption (see below); and they are only aggregate statis-tics that cannot easily be disaggregated into sex and age groups. Thus, surveys have to play a crucial role in any analysis of the effect of consumption of alcoholic beverages on the burden of disease (see below).
(b). assessment.of.adult.per-capita.consumption.of.unrecorded.alcoholic.beverages
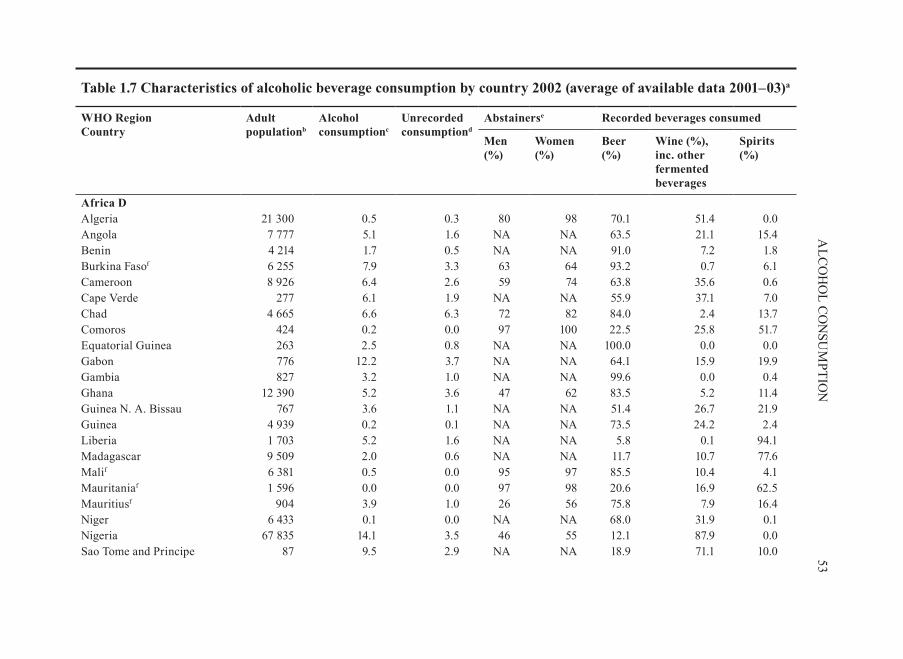
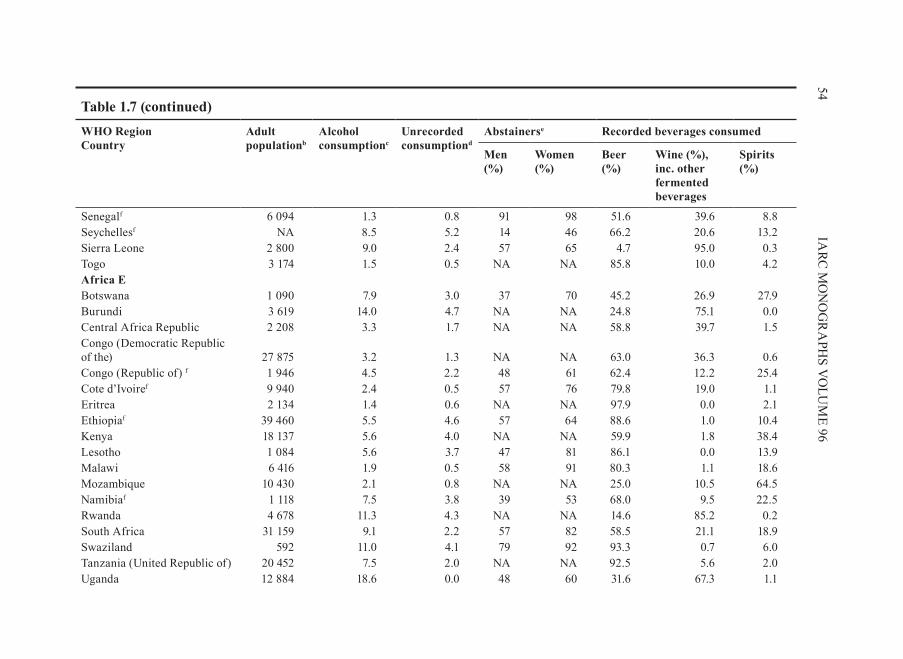
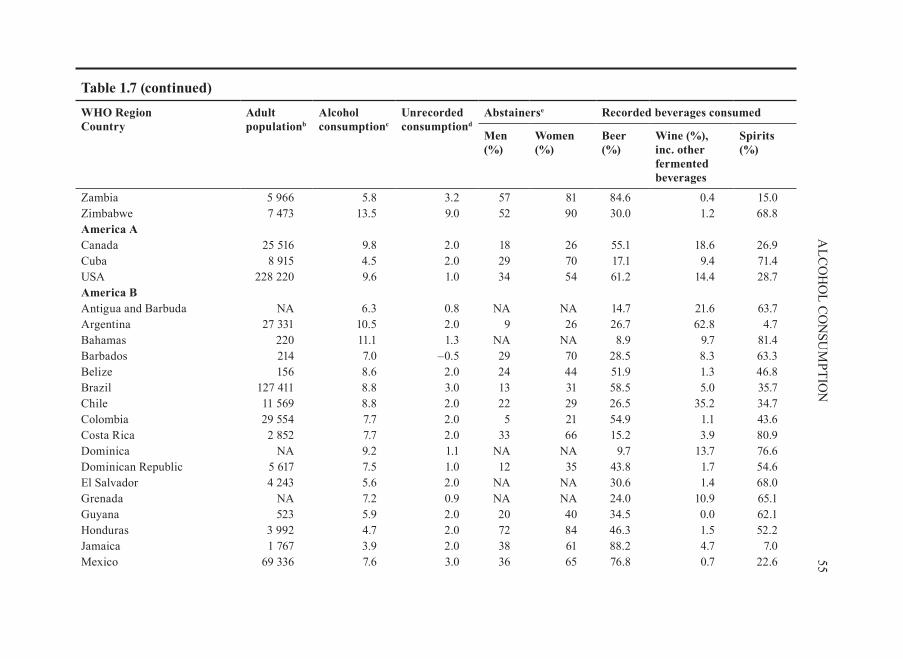
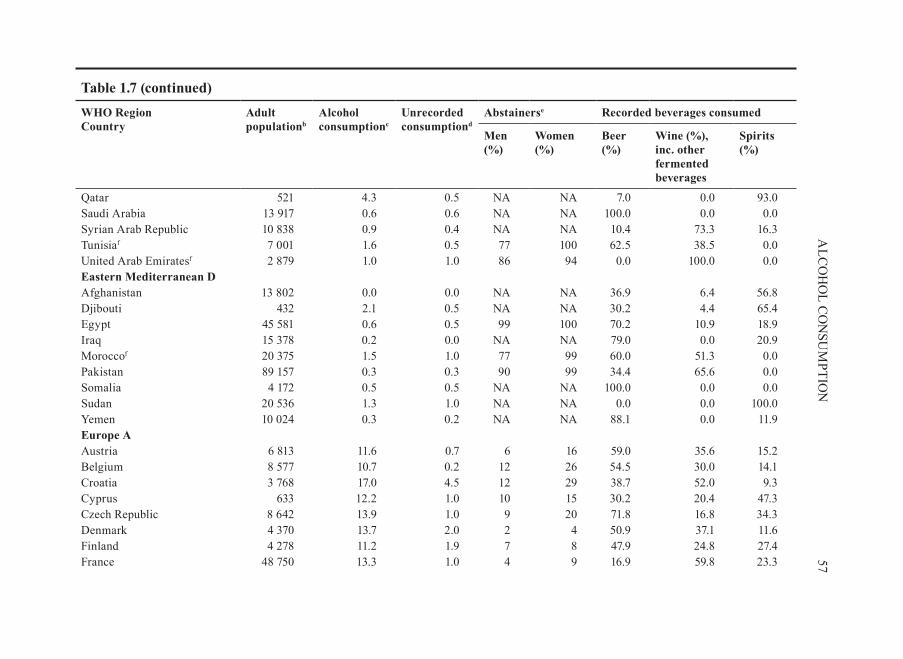
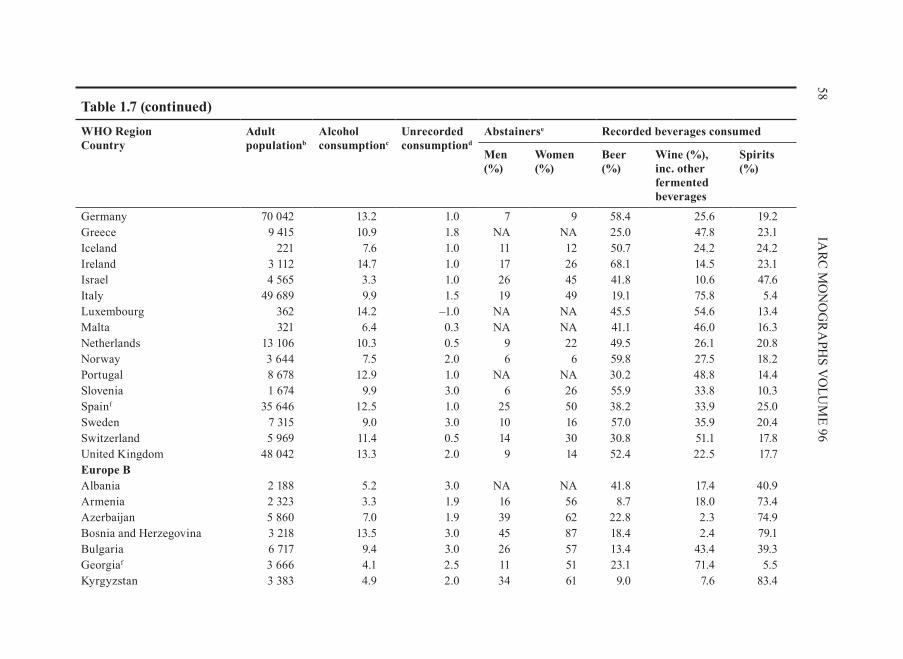
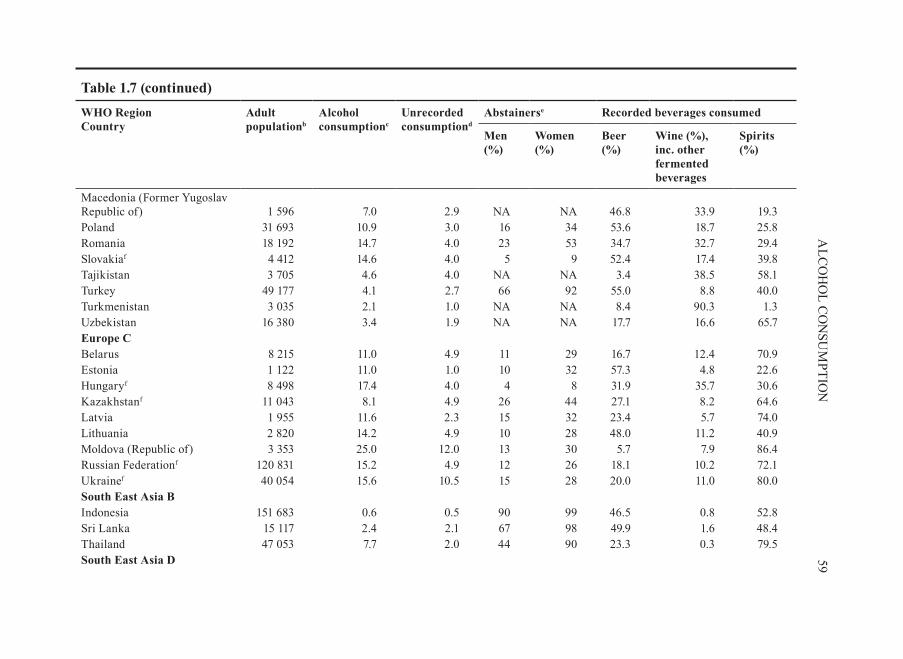
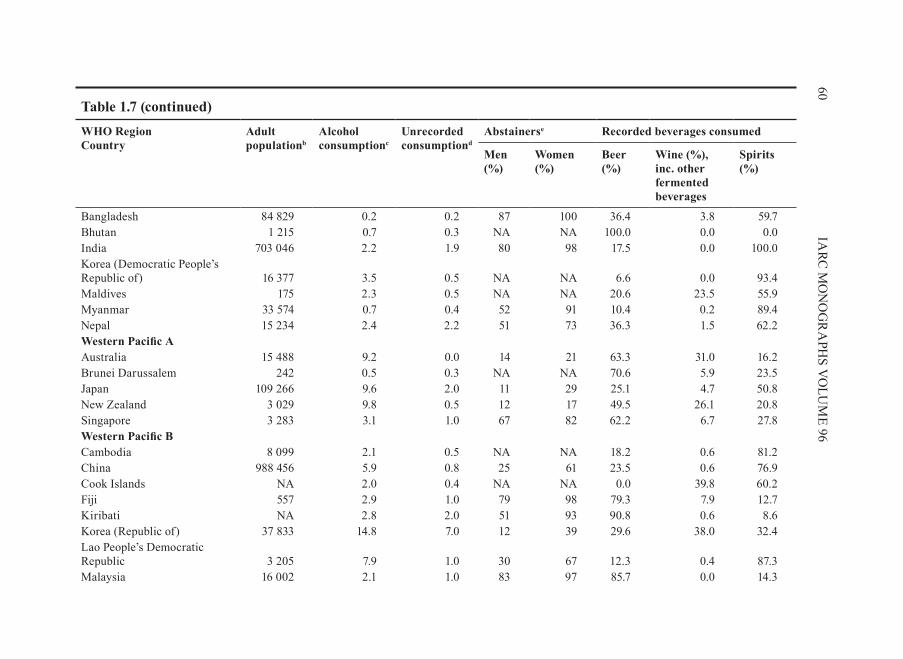
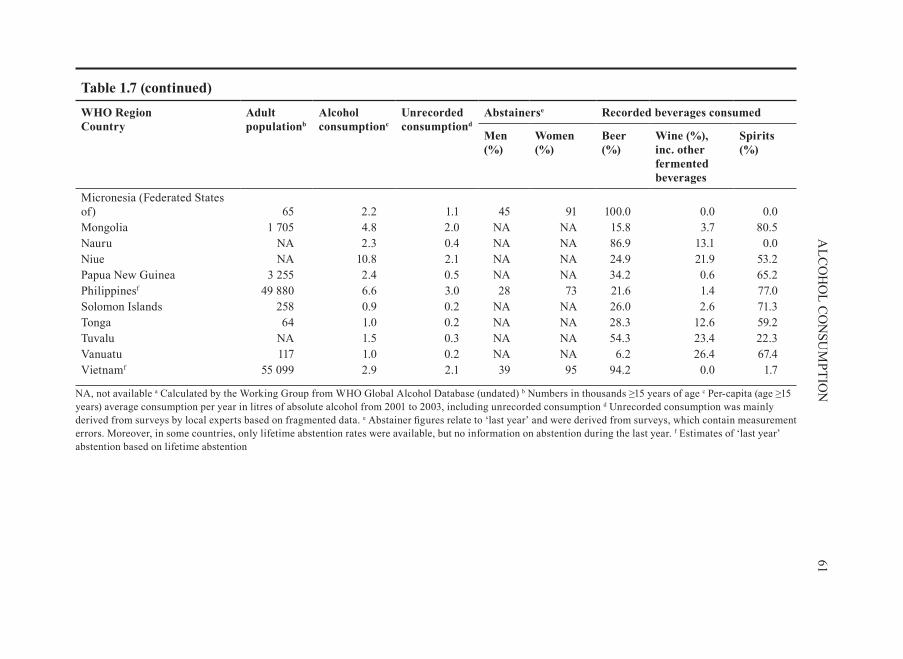
Most countries have at least a low level of so-called unrecorded alcoholic beverage consumption. Unrecorded alcoholic beverages simply means that the alcoholic bever-ages produced and/or consumed are not recorded in official statistics of sales, produc-tion or trade. In some countries, unrecorded alcoholic beverages are the major source of such commodities (see Table 1.7). Unrecorded consumption stems from a variety of sources (Giesbrecht et.al ., 2000): home production, illegal production and sales, illegal (smuggling) and legal imports (cross-border shopping) and other production and use of alcoholic beverages that are not taxed and/or are not included in official production and sales statistics.
A portion of the unrecorded alcoholic beverages derives from different local or traditional beverages that are produced and consumed in villages or homes. The pro-duction may be legal or illegal, depending on the strength of the beverage. Worldwide, information on these alcoholic beverages and their production or consumption volumes is scarce. Local production consists mostly of the fermentation of seeds, grains, fruit, vegetables or parts of palm trees, and is a fairly simple process. The alcohol content is quite low and the shelf life is usually short—1 or 2 days before the beverage is spoilt.
52 IARC MONOGRAPHS VOLUME 96
53A
LCO
HO
L CO
NSU
MPTIO
Ntable 1.7 Characteristics of alcoholic beverage consumption by country 2002 (average of available data 2001–03)a
WHO Region Country
Adult populationb
Alcohol consumptionc
Unrecorded consumptiond
Abstainerse Recorded beverages consumed
Men (%)
Women (%)
Beer (%)
Wine (%), inc. other fermented beverages
Spirits (%)
Africa DAlgeria 21 300 0.5 0.3 80 98 70.1 51.4 0.0Angola 7 777 5.1 1.6 NA NA 63.5 21.1 15.4Benin 4 214 1.7 0.5 NA NA 91.0 7.2 1.8Burkina Fasof 6 255 7.9 3.3 63 64 93.2 0.7 6.1Cameroon 8 926 6.4 2.6 59 74 63.8 35.6 0.6Cape Verde 277 6.1 1.9 NA NA 55.9 37.1 7.0Chad 4 665 6.6 6.3 72 82 84.0 2.4 13.7Comoros 424 0.2 0.0 97 100 22.5 25.8 51.7Equatorial Guinea 263 2.5 0.8 NA NA 100.0 0.0 0.0Gabon 776 12.2 3.7 NA NA 64.1 15.9 19.9Gambia 827 3.2 1.0 NA NA 99.6 0.0 0.4Ghana 12 390 5.2 3.6 47 62 83.5 5.2 11.4Guinea N. A. Bissau 767 3.6 1.1 NA NA 51.4 26.7 21.9Guinea 4 939 0.2 0.1 NA NA 73.5 24.2 2.4Liberia 1 703 5.2 1.6 NA NA 5.8 0.1 94.1Madagascar 9 509 2.0 0.6 NA NA 11.7 10.7 77.6Malif 6 381 0.5 0.0 95 97 85.5 10.4 4.1Mauritaniaf 1 596 0.0 0.0 97 98 20.6 16.9 62.5Mauritiusf 904 3.9 1.0 26 56 75.8 7.9 16.4Niger 6 433 0.1 0.0 NA NA 68.0 31.9 0.1Nigeria 67 835 14.1 3.5 46 55 12.1 87.9 0.0Sao Tome and Principe 87 9.5 2.9 NA NA 18.9 71.1 10.0
54IA
RC M
ON
OG
RA
PHS V
OLU
ME 96
WHO Region Country
Adult populationb
Alcohol consumptionc
Unrecorded consumptiond
Abstainerse Recorded beverages consumed
Men (%)
Women (%)
Beer (%)
Wine (%), inc. other fermented beverages
Spirits (%)
Senegalf 6 094 1.3 0.8 91 98 51.6 39.6 8.8Seychellesf NA 8.5 5.2 14 46 66.2 20.6 13.2Sierra Leone 2 800 9.0 2.4 57 65 4.7 95.0 0.3Togo 3 174 1.5 0.5 NA NA 85.8 10.0 4.2Africa eBotswana 1 090 7.9 3.0 37 70 45.2 26.9 27.9Burundi 3 619 14.0 4.7 NA NA 24.8 75.1 0.0Central Africa Republic 2 208 3.3 1.7 NA NA 58.8 39.7 1.5Congo (Democratic Republic of the) 27 875 3.2 1.3 NA NA 63.0 36.3 0.6Congo (Republic of) f 1 946 4.5 2.2 48 61 62.4 12.2 25.4Cote d’Ivoiref 9 940 2.4 0.5 57 76 79.8 19.0 1.1Eritrea 2 134 1.4 0.6 NA NA 97.9 0.0 2.1Ethiopiaf 39 460 5.5 4.6 57 64 88.6 1.0 10.4Kenya 18 137 5.6 4.0 NA NA 59.9 1.8 38.4Lesotho 1 084 5.6 3.7 47 81 86.1 0.0 13.9Malawi 6 416 1.9 0.5 58 91 80.3 1.1 18.6Mozambique 10 430 2.1 0.8 NA NA 25.0 10.5 64.5Namibiaf 1 118 7.5 3.8 39 53 68.0 9.5 22.5Rwanda 4 678 11.3 4.3 NA NA 14.6 85.2 0.2South Africa 31 159 9.1 2.2 57 82 58.5 21.1 18.9Swaziland 592 11.0 4.1 79 92 93.3 0.7 6.0Tanzania (United Republic of) 20 452 7.5 2.0 NA NA 92.5 5.6 2.0Uganda 12 884 18.6 0.0 48 60 31.6 67.3 1.1
table 1.7 (continued)
55A
LCO
HO
L CO
NSU
MPTIO
N
WHO Region Country
Adult populationb
Alcohol consumptionc
Unrecorded consumptiond
Abstainerse Recorded beverages consumed
Men (%)
Women (%)
Beer (%)
Wine (%), inc. other fermented beverages
Spirits (%)
Zambia 5 966 5.8 3.2 57 81 84.6 0.4 15.0Zimbabwe 7 473 13.5 9.0 52 90 30.0 1.2 68.8America ACanada 25 516 9.8 2.0 18 26 55.1 18.6 26.9Cuba 8 915 4.5 2.0 29 70 17.1 9.4 71.4USA 228 220 9.6 1.0 34 54 61.2 14.4 28.7America BAntigua and Barbuda NA 6.3 0.8 NA NA 14.7 21.6 63.7Argentina 27 331 10.5 2.0 9 26 26.7 62.8 4.7Bahamas 220 11.1 1.3 NA NA 8.9 9.7 81.4Barbados 214 7.0 –0.5 29 70 28.5 8.3 63.3Belize 156 8.6 2.0 24 44 51.9 1.3 46.8Brazil 127 411 8.8 3.0 13 31 58.5 5.0 35.7Chile 11 569 8.8 2.0 22 29 26.5 35.2 34.7Colombia 29 554 7.7 2.0 5 21 54.9 1.1 43.6Costa Rica 2 852 7.7 2.0 33 66 15.2 3.9 80.9Dominica NA 9.2 1.1 NA NA 9.7 13.7 76.6Dominican Republic 5 617 7.5 1.0 12 35 43.8 1.7 54.6El Salvador 4 243 5.6 2.0 NA NA 30.6 1.4 68.0Grenada NA 7.2 0.9 NA NA 24.0 10.9 65.1Guyana 523 5.9 2.0 20 40 34.5 0.0 62.1Honduras 3 992 4.7 2.0 72 84 46.3 1.5 52.2Jamaica 1 767 3.9 2.0 38 61 88.2 4.7 7.0Mexico 69 336 7.6 3.0 36 65 76.8 0.7 22.6
table 1.7 (continued)

56IA
RC M
ON
OG
RA
PHS V
OLU
ME 96
WHO Region Country
Adult populationb
Alcohol consumptionc
Unrecorded consumptiond
Abstainerse Recorded beverages consumed
Men (%)
Women (%)
Beer (%)
Wine (%), inc. other fermented beverages
Spirits (%)
Panama 2 106 6.6 0.8 NA NA 60.2 2.7 37.1Paraguayf 3 512 5.2 1.5 9 33 92.4 6.7 0.0St Kitts and Nevis NA 7.6 0.9 NA NA 45.9 9.3 44.9St Lucia 109 9.7 –1.0 24 52 19.7 4.5 75.8St Vincent and the Grenadines 81 7.9 1.0 NA NA 14.1 3.2 82.7Suriname 302 6.2 0.0 30 55 47.2 0.8 52.1Trinidad and Tobago 991 4.3 0.0 29 70 56.3 2.1 41.6Uruguayf 2 557 9.8 2.0 25 43 15.3 61.2 17.6Venezuela 17 072 9.0 2.0 19 39 84.6 0.0 14.6America DBolivia 5 276 6.3 3.0 24 45 59.2 2.0 38.8Ecuador 8 407 7.2 5.4 41 67 76.9 3.2 19.9Guatemalaf 6 582 3.8 2.0 49 84 40.5 1.7 57.8Haiti 4 967 7.5 0.0 58 62 0.4 0.4 99.2Nicaragua 3 057 3.6 1.0 12 50 32.4 1.6 65.9Peru 17 761 9.9 5.9 20 29 NA NA NAeastern Mediterranean BBahrain 503 6.8 0.0 NA NA 32.5 5.2 62.3Iran 45 725 1.0 1.0 90 95 0.0 1.8 98.2Jordan 3 236 0.5 0.3 NA NA 71.8 2.0 26.1Kuwait 1 823 0.1 0.0 NA NA 63.2 0.0 36.8Lebanon 2 431 4.0 0.5 67 87 10.3 18.4 71.4Libyan Arab Jamahiriya 3 789 0.0 0.0 NA NA 76.4 10.3 13.3Oman 1 606 0.6 0.3 NA NA 100.0 0.0 0.0
table 1.7 (continued)
57A
LCO
HO
L CO
NSU
MPTIO
N
WHO Region Country
Adult populationb
Alcohol consumptionc
Unrecorded consumptiond
Abstainerse Recorded beverages consumed
Men (%)
Women (%)
Beer (%)
Wine (%), inc. other fermented beverages
Spirits (%)
Qatar 521 4.3 0.5 NA NA 7.0 0.0 93.0Saudi Arabia 13 917 0.6 0.6 NA NA 100.0 0.0 0.0Syrian Arab Republic 10 838 0.9 0.4 NA NA 10.4 73.3 16.3Tunisiaf 7 001 1.6 0.5 77 100 62.5 38.5 0.0United Arab Emiratesf 2 879 1.0 1.0 86 94 0.0 100.0 0.0eastern Mediterranean DAfghanistan 13 802 0.0 0.0 NA NA 36.9 6.4 56.8Djibouti 432 2.1 0.5 NA NA 30.2 4.4 65.4Egypt 45 581 0.6 0.5 99 100 70.2 10.9 18.9Iraq 15 378 0.2 0.0 NA NA 79.0 0.0 20.9Moroccof 20 375 1.5 1.0 77 99 60.0 51.3 0.0Pakistan 89 157 0.3 0.3 90 99 34.4 65.6 0.0Somalia 4 172 0.5 0.5 NA NA 100.0 0.0 0.0Sudan 20 536 1.3 1.0 NA NA 0.0 0.0 100.0Yemen 10 024 0.3 0.2 NA NA 88.1 0.0 11.9europe AAustria 6 813 11.6 0.7 6 16 59.0 35.6 15.2Belgium 8 577 10.7 0.2 12 26 54.5 30.0 14.1Croatia 3 768 17.0 4.5 12 29 38.7 52.0 9.3Cyprus 633 12.2 1.0 10 15 30.2 20.4 47.3Czech Republic 8 642 13.9 1.0 9 20 71.8 16.8 34.3Denmark 4 370 13.7 2.0 2 4 50.9 37.1 11.6Finland 4 278 11.2 1.9 7 8 47.9 24.8 27.4France 48 750 13.3 1.0 4 9 16.9 59.8 23.3
table 1.7 (continued)
58IA
RC M
ON
OG
RA
PHS V
OLU
ME 96
WHO Region Country
Adult populationb
Alcohol consumptionc
Unrecorded consumptiond
Abstainerse Recorded beverages consumed
Men (%)
Women (%)
Beer (%)
Wine (%), inc. other fermented beverages
Spirits (%)
Germany 70 042 13.2 1.0 7 9 58.4 25.6 19.2Greece 9 415 10.9 1.8 NA NA 25.0 47.8 23.1Iceland 221 7.6 1.0 11 12 50.7 24.2 24.2Ireland 3 112 14.7 1.0 17 26 68.1 14.5 23.1Israel 4 565 3.3 1.0 26 45 41.8 10.6 47.6Italy 49 689 9.9 1.5 19 49 19.1 75.8 5.4Luxembourg 362 14.2 –1.0 NA NA 45.5 54.6 13.4Malta 321 6.4 0.3 NA NA 41.1 46.0 16.3Netherlands 13 106 10.3 0.5 9 22 49.5 26.1 20.8Norway 3 644 7.5 2.0 6 6 59.8 27.5 18.2Portugal 8 678 12.9 1.0 NA NA 30.2 48.8 14.4Slovenia 1 674 9.9 3.0 6 26 55.9 33.8 10.3Spainf 35 646 12.5 1.0 25 50 38.2 33.9 25.0Sweden 7 315 9.0 3.0 10 16 57.0 35.9 20.4Switzerland 5 969 11.4 0.5 14 30 30.8 51.1 17.8United Kingdom 48 042 13.3 2.0 9 14 52.4 22.5 17.7europe BAlbania 2 188 5.2 3.0 NA NA 41.8 17.4 40.9Armenia 2 323 3.3 1.9 16 56 8.7 18.0 73.4Azerbaijan 5 860 7.0 1.9 39 62 22.8 2.3 74.9Bosnia and Herzegovina 3 218 13.5 3.0 45 87 18.4 2.4 79.1Bulgaria 6 717 9.4 3.0 26 57 13.4 43.4 39.3Georgiaf 3 666 4.1 2.5 11 51 23.1 71.4 5.5Kyrgyzstan 3 383 4.9 2.0 34 61 9.0 7.6 83.4
table 1.7 (continued)
59A
LCO
HO
L CO
NSU
MPTIO
N
WHO Region Country
Adult populationb
Alcohol consumptionc
Unrecorded consumptiond
Abstainerse Recorded beverages consumed
Men (%)
Women (%)
Beer (%)
Wine (%), inc. other fermented beverages
Spirits (%)
Macedonia (Former Yugoslav Republic of) 1 596 7.0 2.9 NA NA 46.8 33.9 19.3Poland 31 693 10.9 3.0 16 34 53.6 18.7 25.8Romania 18 192 14.7 4.0 23 53 34.7 32.7 29.4Slovakiaf 4 412 14.6 4.0 5 9 52.4 17.4 39.8Tajikistan 3 705 4.6 4.0 NA NA 3.4 38.5 58.1Turkey 49 177 4.1 2.7 66 92 55.0 8.8 40.0Turkmenistan 3 035 2.1 1.0 NA NA 8.4 90.3 1.3Uzbekistan 16 380 3.4 1.9 NA NA 17.7 16.6 65.7europe CBelarus 8 215 11.0 4.9 11 29 16.7 12.4 70.9Estonia 1 122 11.0 1.0 10 32 57.3 4.8 22.6Hungaryf 8 498 17.4 4.0 4 8 31.9 35.7 30.6Kazakhstanf 11 043 8.1 4.9 26 44 27.1 8.2 64.6Latvia 1 955 11.6 2.3 15 32 23.4 5.7 74.0Lithuania 2 820 14.2 4.9 10 28 48.0 11.2 40.9Moldova (Republic of) 3 353 25.0 12.0 13 30 5.7 7.9 86.4Russian Federationf 120 831 15.2 4.9 12 26 18.1 10.2 72.1Ukrainef 40 054 15.6 10.5 15 28 20.0 11.0 80.0South east Asia BIndonesia 151 683 0.6 0.5 90 99 46.5 0.8 52.8Sri Lanka 15 117 2.4 2.1 67 98 49.9 1.6 48.4Thailand 47 053 7.7 2.0 44 90 23.3 0.3 79.5South east Asia D
table 1.7 (continued)
60IA
RC M
ON
OG
RA
PHS V
OLU
ME 96
WHO Region Country
Adult populationb
Alcohol consumptionc
Unrecorded consumptiond
Abstainerse Recorded beverages consumed
Men (%)
Women (%)
Beer (%)
Wine (%), inc. other fermented beverages
Spirits (%)
Bangladesh 84 829 0.2 0.2 87 100 36.4 3.8 59.7Bhutan 1 215 0.7 0.3 NA NA 100.0 0.0 0.0India 703 046 2.2 1.9 80 98 17.5 0.0 100.0Korea (Democratic People’s Republic of) 16 377 3.5 0.5 NA NA 6.6 0.0 93.4Maldives 175 2.3 0.5 NA NA 20.6 23.5 55.9Myanmar 33 574 0.7 0.4 52 91 10.4 0.2 89.4Nepal 15 234 2.4 2.2 51 73 36.3 1.5 62.2Western Pacific AAustralia 15 488 9.2 0.0 14 21 63.3 31.0 16.2Brunei Darussalem 242 0.5 0.3 NA NA 70.6 5.9 23.5Japan 109 266 9.6 2.0 11 29 25.1 4.7 50.8New Zealand 3 029 9.8 0.5 12 17 49.5 26.1 20.8Singapore 3 283 3.1 1.0 67 82 62.2 6.7 27.8Western Pacific BCambodia 8 099 2.1 0.5 NA NA 18.2 0.6 81.2China 988 456 5.9 0.8 25 61 23.5 0.6 76.9Cook Islands NA 2.0 0.4 NA NA 0.0 39.8 60.2Fiji 557 2.9 1.0 79 98 79.3 7.9 12.7Kiribati NA 2.8 2.0 51 93 90.8 0.6 8.6Korea (Republic of) 37 833 14.8 7.0 12 39 29.6 38.0 32.4Lao People’s Democratic Republic 3 205 7.9 1.0 30 67 12.3 0.4 87.3Malaysia 16 002 2.1 1.0 83 97 85.7 0.0 14.3
table 1.7 (continued)
61A
LCO
HO
L CO
NSU
MPTIO
N
WHO Region Country
Adult populationb
Alcohol consumptionc
Unrecorded consumptiond
Abstainerse Recorded beverages consumed
Men (%)
Women (%)
Beer (%)
Wine (%), inc. other fermented beverages
Spirits (%)
Micronesia (Federated States of) 65 2.2 1.1 45 91 100.0 0.0 0.0Mongolia 1 705 4.8 2.0 NA NA 15.8 3.7 80.5Nauru NA 2.3 0.4 NA NA 86.9 13.1 0.0Niue NA 10.8 2.1 NA NA 24.9 21.9 53.2Papua New Guinea 3 255 2.4 0.5 NA NA 34.2 0.6 65.2Philippinesf 49 880 6.6 3.0 28 73 21.6 1.4 77.0Solomon Islands 258 0.9 0.2 NA NA 26.0 2.6 71.3Tonga 64 1.0 0.2 NA NA 28.3 12.6 59.2Tuvalu NA 1.5 0.3 NA NA 54.3 23.4 22.3Vanuatu 117 1.0 0.2 NA NA 6.2 26.4 67.4Vietnamf 55 099 2.9 2.1 39 95 94.2 0.0 1.7
NA, not available a Calculated by the Working Group from WHO Global Alcohol Database (undated) b Numbers in thousands ≥15 years of age c Per-capita (age ≥15 years) average consumption per year in litres of absolute alcohol from 2001 to 2003, including unrecorded consumption d Unrecorded consumption was mainly derived from surveys by local experts based on fragmented data. e Abstainer figures relate to ‘last year’ and were derived from surveys, which contain measurement errors. Moreover, in some countries, only lifetime abstention rates were available, but no information on abstention during the last year. f Estimates of ‘last year’ abstention based on lifetime abstention
table 1.7 (continued)
In terms of pricing, locally produced traditional alcoholic beverages tend to be consid-erably cheaper than their western-style, commercially produced counterparts.
In many regions of the world, illegal alcoholic beverages are approximately 2–6 times cheaper (McKee et.al ., 2005; Lang et.al ., 2006) than commercial alcoholic bev-erages and are thus most likely to be consumed by those who are on the margins of society, are very heavy drinkers or are dependent on alcohol, all of whom are com-monly underrepresented in surveys. In spite of the higher price, industrially produced alcoholic beverages are gaining popularity in many of these countries.
1.3.3. global.consumption.in.2002
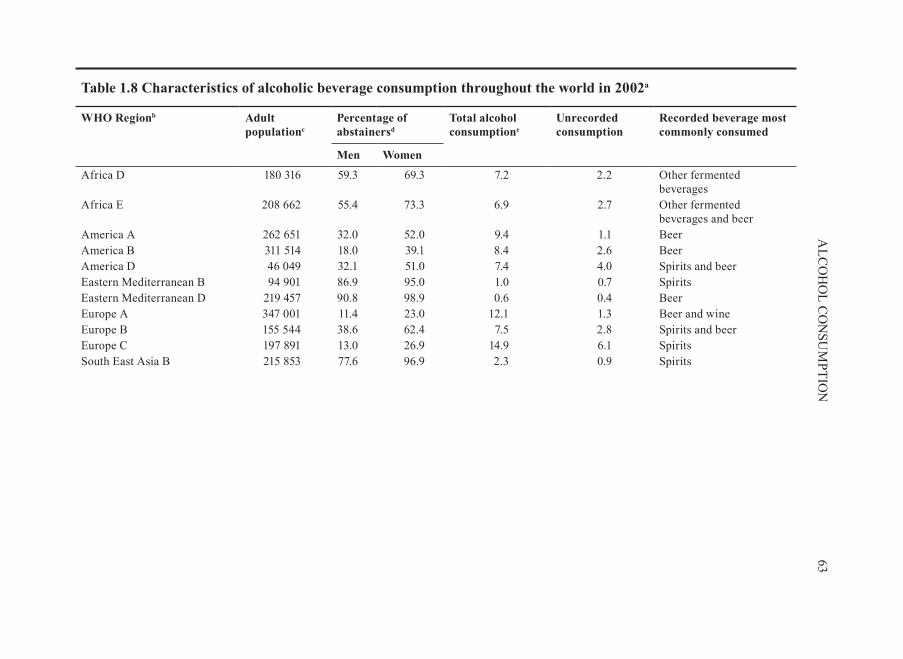
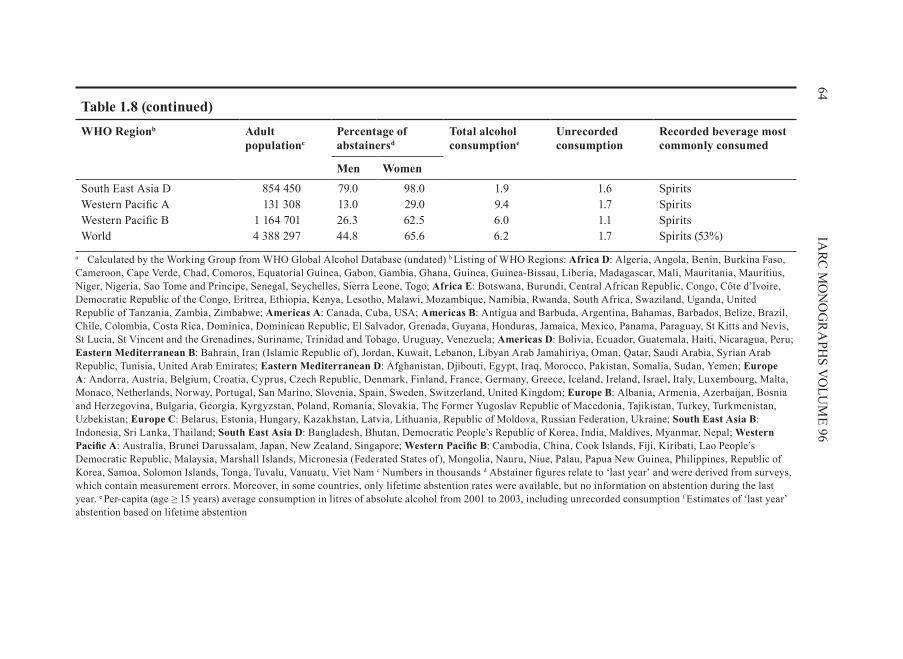
Although the global average consumption is 6.2 L of pure alcohol per.capita per year, there is wide variation around the world (Table 1.8). The countries with the highest overall consumption are those in eastern Europe that surround the Russian Federation; however, other areas of Europe also have high overall consumption. The Americas have the next highest overall consumption. Except for some individual coun-tries, alcoholic beverage consumption is lower in other parts of the world. Globally, 55.2% of adult men and 34.4% of adult women consume alcoholic beverages; in 2002, this constituted more than 1.9 billion adults. The fraction of unrecorded consumption is higher in less developed parts of the world, and is thus highest in the poorest regions of Africa, Asia and South America. In addition, unrecorded consumption is estimated to be proportionally high in the Eastern Mediterranean Region where many of the countries are Islamic, although the level of consumption is very low. Table 1.8 gives further details on consumption.
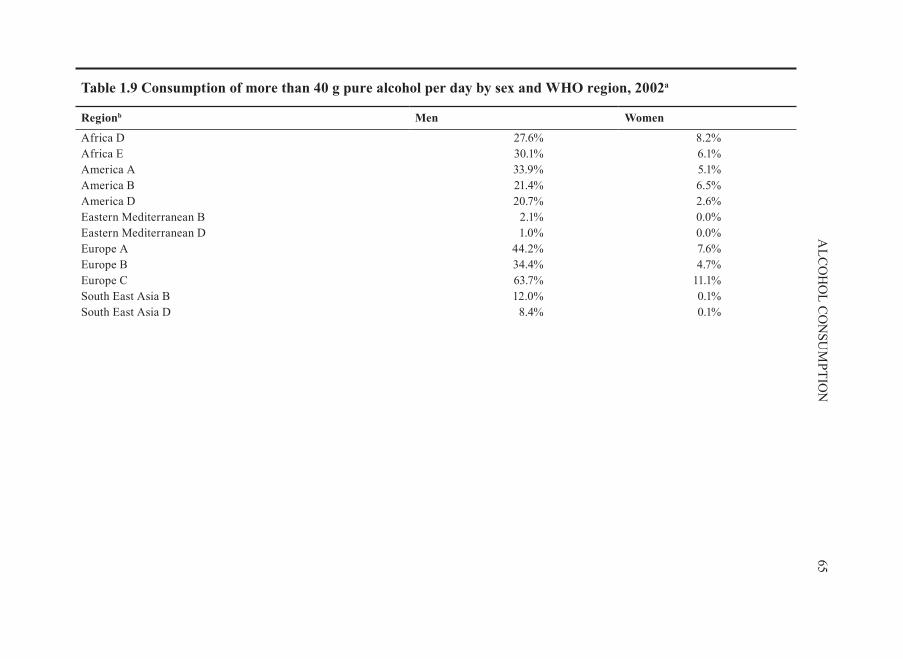
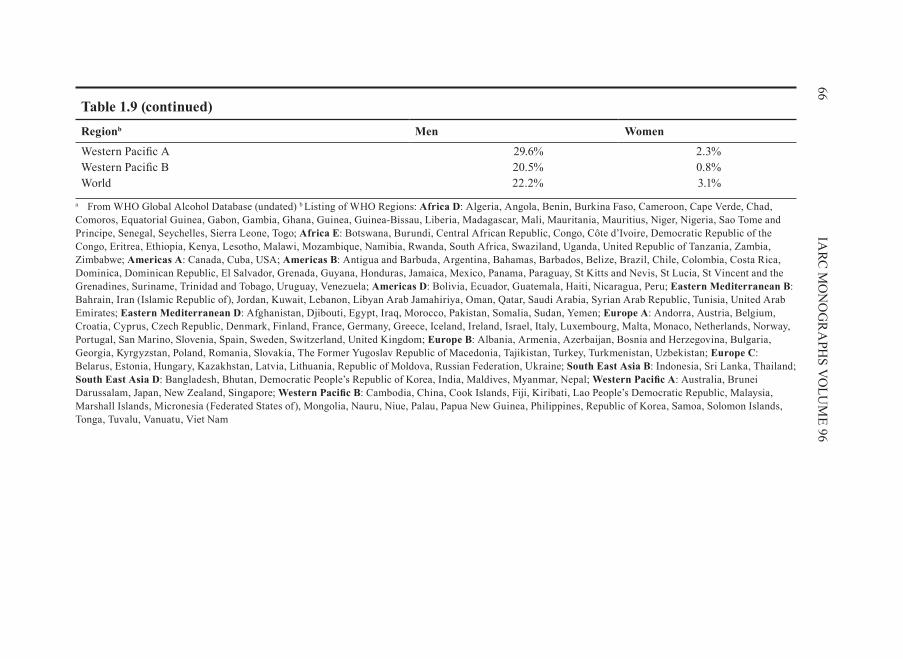
Table 1.9 shows the rates of drinking more than 40 g pure alcohol per day in dif-ferent parts of the world. As expected from the per-capita figures, there is huge varia-tion between sexes and by region, with highest prevalence in eastern Europe (Russian Federation and surrounding countries) and lowest prevalence in the WHO Eastern Mediterranean Region where countries are mostly Islamic.
1.3.4. Trends.in.recorded.per-capita.consumption
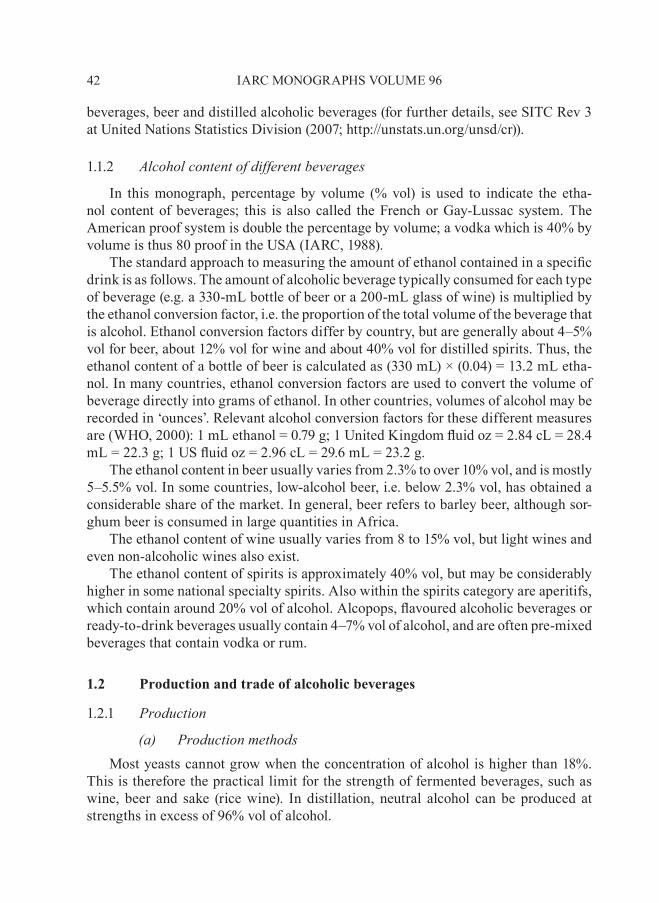
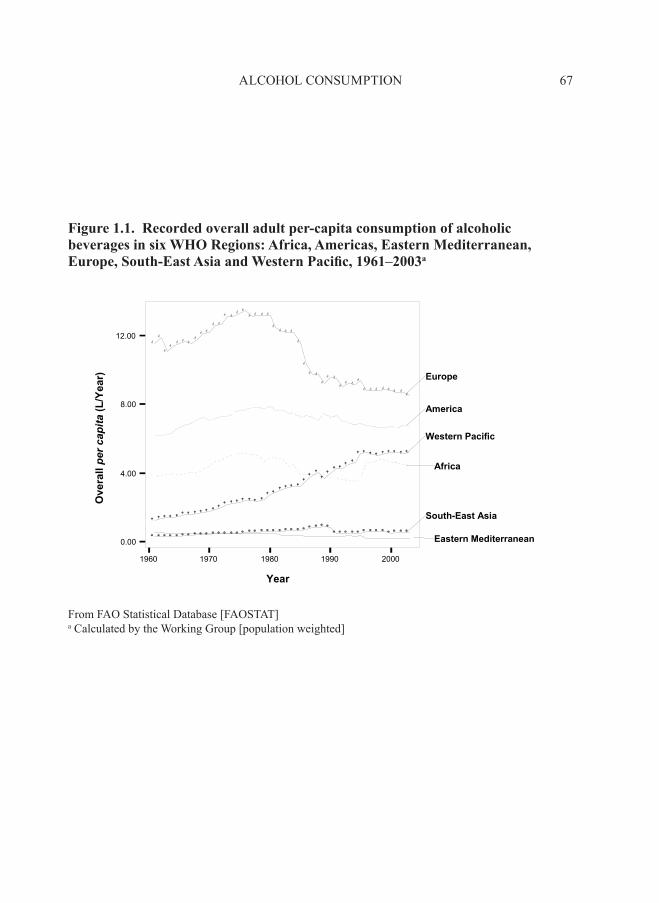
Figs. 1.1–1.4 give an overview of trends in alcoholic beverage consumption over the past 40 years. Trends of unrecorded consumption are not available because of the lack of data. However, in regions that have relatively high recorded consumption, these figures also reflect the trend of overall consumption.
Changes in the trend of overall alcoholic beverage consumption have varied between different countries and regions. In Europe, consumption declined in the 1980s and has been stable since 1990. The European trend obscures various developments in different countries, such as an increase in countries with formerly lower consumption such as the Nordic countries, and a decline in consumption in traditional wine-produc-ing countries such as France, Italy, Portugal and Spain. Other regions have remained
62 IARC MONOGRAPHS VOLUME 96
63A
LCO
HO
L CO
NSU
MPTIO
Ntable 1.8 Characteristics of alcoholic beverage consumption throughout the world in 2002a
WHO Regionb Adult populationc
Percentage of abstainersd
total alcohol consumptione
Unrecorded consumption
Recorded beverage most commonly consumed
Men Women
Africa D 180 316 59.3 69.3 7.2 2.2 Other fermented beverages
Africa E 208 662 55.4 73.3 6.9 2.7 Other fermented beverages and beer
America A 262 651 32.0 52.0 9.4 1.1 BeerAmerica B 311 514 18.0 39.1 8.4 2.6 BeerAmerica D 46 049 32.1 51.0 7.4 4.0 Spirits and beerEastern Mediterranean B 94 901 86.9 95.0 1.0 0.7 Spirits Eastern Mediterranean D 219 457 90.8 98.9 0.6 0.4 BeerEurope A 347 001 11.4 23.0 12.1 1.3 Beer and wineEurope B 155 544 38.6 62.4 7.5 2.8 Spirits and beerEurope C 197 891 13.0 26.9 14.9 6.1 Spirits South East Asia B 215 853 77.6 96.9 2.3 0.9 Spirits
64IA
RC M
ON
OG
RA
PHS V
OLU
ME 96
WHO Regionb Adult populationc
Percentage of abstainersd
total alcohol consumptione
Unrecorded consumption
Recorded beverage most commonly consumed
Men Women
South East Asia D 854 450 79.0 98.0 1.9 1.6 SpiritsWestern Pacific A 131 308 13.0 29.0 9.4 1.7 SpiritsWestern Pacific B 1 164 701 26.3 62.5 6.0 1.1 SpiritsWorld 4 388 297 44.8 65.6 6.2 1.7 Spirits (53%)
a Calculated by the Working Group from WHO Global Alcohol Database (undated) b Listing of WHO Regions: Africa D: Algeria, Angola, Benin, Burkina Faso, Cameroon, Cape Verde, Chad, Comoros, Equatorial Guinea, Gabon, Gambia, Ghana, Guinea, Guinea-Bissau, Liberia, Madagascar, Mali, Mauritania, Mauritius, Niger, Nigeria, Sao Tome and Principe, Senegal, Seychelles, Sierra Leone, Togo; Africa e: Botswana, Burundi, Central African Republic, Congo, Côte d’Ivoire, Democratic Republic of the Congo, Eritrea, Ethiopia, Kenya, Lesotho, Malawi, Mozambique, Namibia, Rwanda, South Africa, Swaziland, Uganda, United Republic of Tanzania, Zambia, Zimbabwe; Americas A: Canada, Cuba, USA; Americas B: Antigua and Barbuda, Argentina, Bahamas, Barbados, Belize, Brazil, Chile, Colombia, Costa Rica, Dominica, Dominican Republic, El Salvador, Grenada, Guyana, Honduras, Jamaica, Mexico, Panama, Paraguay, St Kitts and Nevis, St Lucia, St Vincent and the Grenadines, Suriname, Trinidad and Tobago, Uruguay, Venezuela; Americas D: Bolivia, Ecuador, Guatemala, Haiti, Nicaragua, Peru; eastern Mediterranean B: Bahrain, Iran (Islamic Republic of), Jordan, Kuwait, Lebanon, Libyan Arab Jamahiriya, Oman, Qatar, Saudi Arabia, Syrian Arab Republic, Tunisia, United Arab Emirates; eastern Mediterranean D: Afghanistan, Djibouti, Egypt, Iraq, Morocco, Pakistan, Somalia, Sudan, Yemen; europe A: Andorra, Austria, Belgium, Croatia, Cyprus, Czech Republic, Denmark, Finland, France, Germany, Greece, Iceland, Ireland, Israel, Italy, Luxembourg, Malta, Monaco, Netherlands, Norway, Portugal, San Marino, Slovenia, Spain, Sweden, Switzerland, United Kingdom; europe B: Albania, Armenia, Azerbaijan, Bosnia and Herzegovina, Bulgaria, Georgia, Kyrgyzstan, Poland, Romania, Slovakia, The Former Yugoslav Republic of Macedonia, Tajikistan, Turkey, Turkmenistan, Uzbekistan; europe C: Belarus, Estonia, Hungary, Kazakhstan, Latvia, Lithuania, Republic of Moldova, Russian Federation, Ukraine; South east Asia B: Indonesia, Sri Lanka, Thailand; South east Asia D: Bangladesh, Bhutan, Democratic People’s Republic of Korea, India, Maldives, Myanmar, Nepal; Western Pacific A: Australia, Brunei Darussalam, Japan, New Zealand, Singapore; Western Pacific B: Cambodia, China, Cook Islands, Fiji, Kiribati, Lao People’s Democratic Republic, Malaysia, Marshall Islands, Micronesia (Federated States of), Mongolia, Nauru, Niue, Palau, Papua New Guinea, Philippines, Republic of Korea, Samoa, Solomon Islands, Tonga, Tuvalu, Vanuatu, Viet Nam c Numbers in thousands d Abstainer figures relate to ‘last year’ and were derived from surveys, which contain measurement errors. Moreover, in some countries, only lifetime abstention rates were available, but no information on abstention during the last year. e Per-capita (age ≥ 15 years) average consumption in litres of absolute alcohol from 2001 to 2003, including unrecorded consumption f Estimates of ‘last year’ abstention based on lifetime abstention
table 1.8 (continued)
65A
LCO
HO
L CO
NSU
MPTIO
Ntable 1.9 Consumption of more than 40 g pure alcohol per day by sex and WHO region, 2002a
Regionb Men Women
Africa D 27.6% 8.2%Africa E 30.1% 6.1%America A 33.9% 5.1%America B 21.4% 6.5%America D 20.7% 2.6%Eastern Mediterranean B 2.1% 0.0%Eastern Mediterranean D 1.0% 0.0%Europe A 44.2% 7.6%Europe B 34.4% 4.7%Europe C 63.7% 11.1%South East Asia B 12.0% 0.1%South East Asia D 8.4% 0.1%
66IA
RC M
ON
OG
RA
PHS V
OLU
ME 96
Regionb Men Women
Western Pacific A 29.6% 2.3%Western Pacific B 20.5% 0.8%World 22.2% 3.1%
a From WHO Global Alcohol Database (undated) b Listing of WHO Regions: Africa D: Algeria, Angola, Benin, Burkina Faso, Cameroon, Cape Verde, Chad, Comoros, Equatorial Guinea, Gabon, Gambia, Ghana, Guinea, Guinea-Bissau, Liberia, Madagascar, Mali, Mauritania, Mauritius, Niger, Nigeria, Sao Tome and Principe, Senegal, Seychelles, Sierra Leone, Togo; Africa e: Botswana, Burundi, Central African Republic, Congo, Côte d’Ivoire, Democratic Republic of the Congo, Eritrea, Ethiopia, Kenya, Lesotho, Malawi, Mozambique, Namibia, Rwanda, South Africa, Swaziland, Uganda, United Republic of Tanzania, Zambia, Zimbabwe; Americas A: Canada, Cuba, USA; Americas B: Antigua and Barbuda, Argentina, Bahamas, Barbados, Belize, Brazil, Chile, Colombia, Costa Rica, Dominica, Dominican Republic, El Salvador, Grenada, Guyana, Honduras, Jamaica, Mexico, Panama, Paraguay, St Kitts and Nevis, St Lucia, St Vincent and the Grenadines, Suriname, Trinidad and Tobago, Uruguay, Venezuela; Americas D: Bolivia, Ecuador, Guatemala, Haiti, Nicaragua, Peru; eastern Mediterranean B: Bahrain, Iran (Islamic Republic of), Jordan, Kuwait, Lebanon, Libyan Arab Jamahiriya, Oman, Qatar, Saudi Arabia, Syrian Arab Republic, Tunisia, United Arab Emirates; eastern Mediterranean D: Afghanistan, Djibouti, Egypt, Iraq, Morocco, Pakistan, Somalia, Sudan, Yemen; europe A: Andorra, Austria, Belgium, Croatia, Cyprus, Czech Republic, Denmark, Finland, France, Germany, Greece, Iceland, Ireland, Israel, Italy, Luxembourg, Malta, Monaco, Netherlands, Norway, Portugal, San Marino, Slovenia, Spain, Sweden, Switzerland, United Kingdom; europe B: Albania, Armenia, Azerbaijan, Bosnia and Herzegovina, Bulgaria, Georgia, Kyrgyzstan, Poland, Romania, Slovakia, The Former Yugoslav Republic of Macedonia, Tajikistan, Turkey, Turkmenistan, Uzbekistan; europe C: Belarus, Estonia, Hungary, Kazakhstan, Latvia, Lithuania, Republic of Moldova, Russian Federation, Ukraine; South east Asia B: Indonesia, Sri Lanka, Thailand; South east Asia D: Bangladesh, Bhutan, Democratic People’s Republic of Korea, India, Maldives, Myanmar, Nepal; Western Pacific A: Australia, Brunei Darussalam, Japan, New Zealand, Singapore; Western Pacific B: Cambodia, China, Cook Islands, Fiji, Kiribati, Lao People’s Democratic Republic, Malaysia, Marshall Islands, Micronesia (Federated States of), Mongolia, Nauru, Niue, Palau, Papua New Guinea, Philippines, Republic of Korea, Samoa, Solomon Islands, Tonga, Tuvalu, Vanuatu, Viet Nam
table 1.9 (continued)
ALCOHOL CONSUMPTION 67
Figure 1.1. Recorded overall adult per-capita consumption of alcoholic beverages in six WHO Regions: Africa, Americas, eastern Mediterranean, europe, South-east Asia and Western Pacific, 1961–2003a
1960 1970 1980 1990 2000
Year
0.00
4.00
8.00
12.00
Ove
rall
per c
apita
(L/Y
ear)
Europe
America
Western Pacific
Africa
South-East Asia
Eastern Mediterranean
From FAO Statistical Database [FAOSTAT]a Calculated by the Working Group [population weighted]
IARC MONOGRAPHS VOLUME 9668
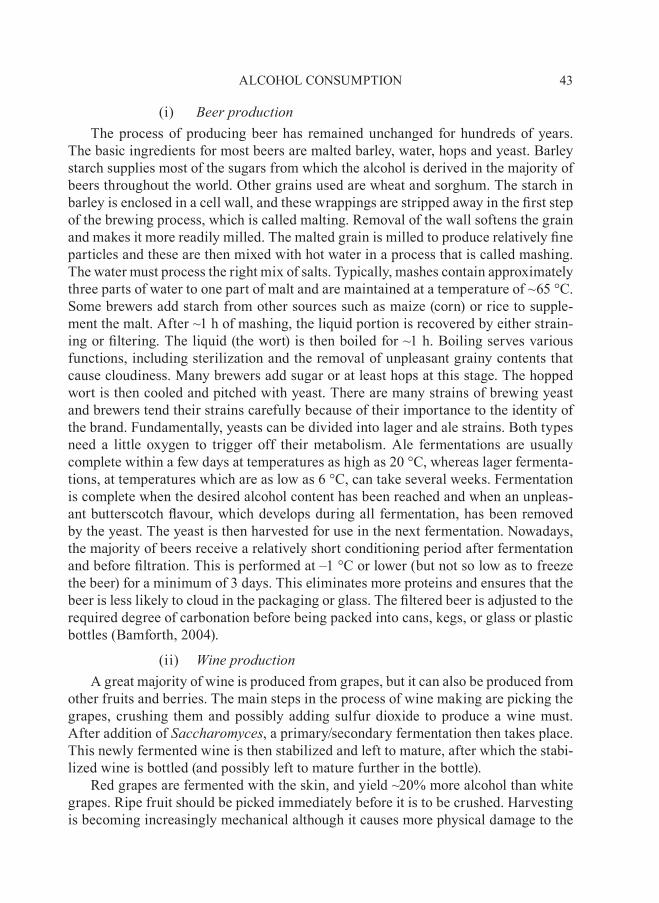
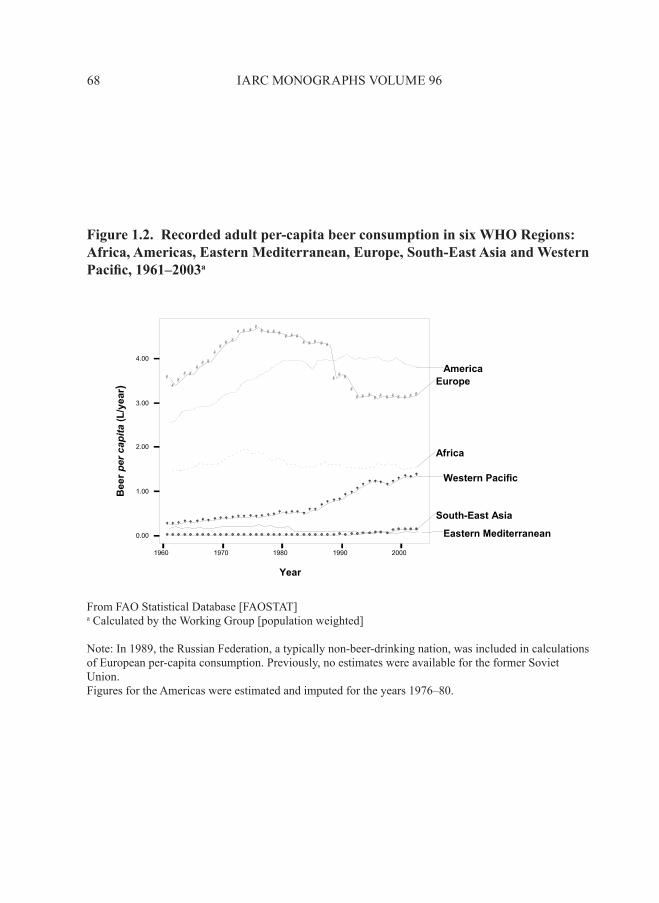
Figure 1.2. Recorded adult per-capita beer consumption in six WHO Regions: Africa, Americas, eastern Mediterranean, europe, South-east Asia and Western Pacific, 1961–2003a
1960 1970 1980
1990 2000
Year
0.00
1.00
2.00
3.00
4.00
Bee
r per
cap
ita (L
/yea
r)
AmericaEurope
Africa
Western Pacific
South-East Asia
Eastern Mediterranean
From FAO Statistical Database [FAOSTAT]a Calculated by the Working Group [population weighted]
Note: In 1989, the Russian Federation, a typically non-beer-drinking nation, was included in calculations of European per-capita consumption. Previously, no estimates were available for the former Soviet Union.Figures for the Americas were estimated and imputed for the years 1976–80.
ALCOHOL CONSUMPTION 69
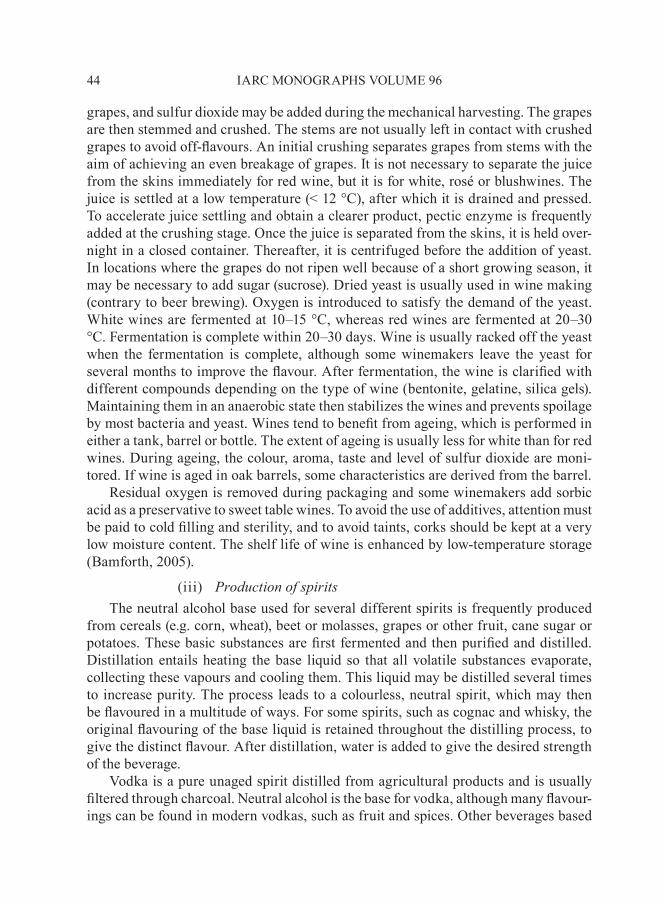
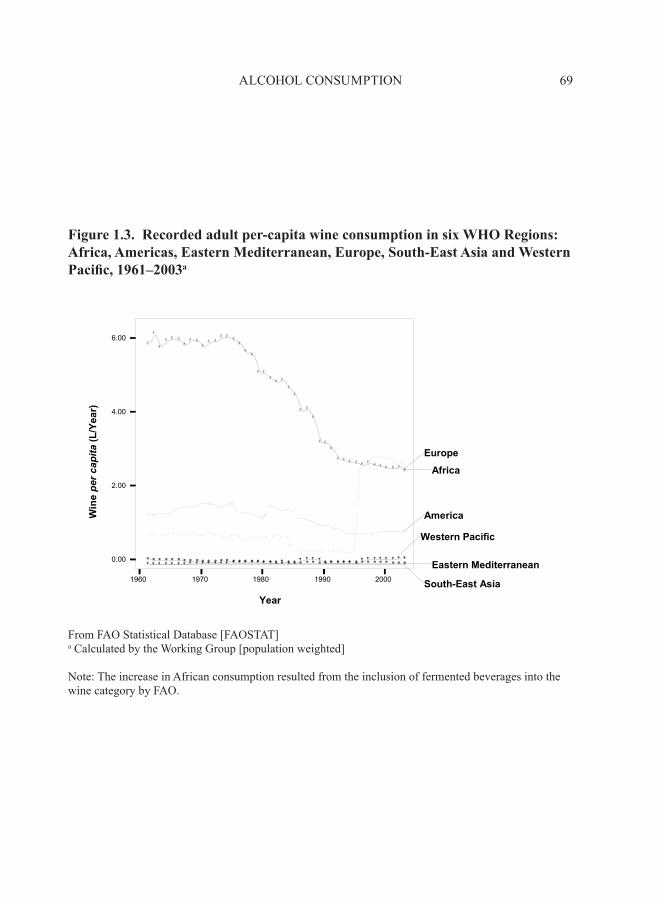
Figure 1.3. Recorded adult per-capita wine consumption in six WHO Regions: Africa, Americas, eastern Mediterranean, europe, South-east Asia and Western Pacific, 1961–2003a
1960 1970 1980 1990 2000
Year
0.00
2.00
6.00
4.00
Win
epe
r cap
ita (L
/Yea
r)
Europe
Africa
America
Western Pacific
Eastern Mediterranean
South-East Asia
From FAO Statistical Database [FAOSTAT]a Calculated by the Working Group [population weighted]
Note: The increase in African consumption resulted from the inclusion of fermented beverages into the wine category by FAO.
IARC MONOGRAPHS VOLUME 9670
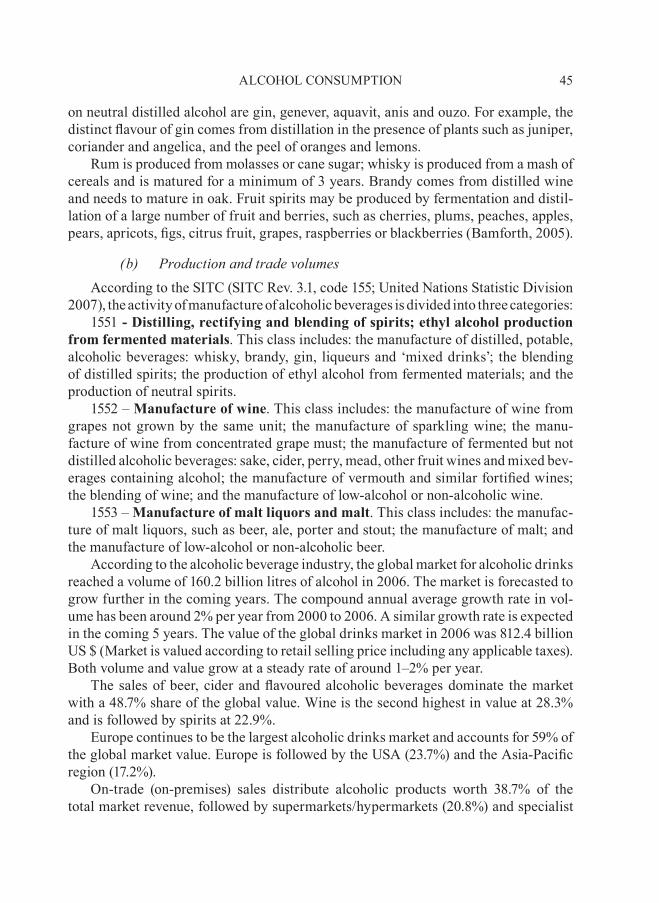
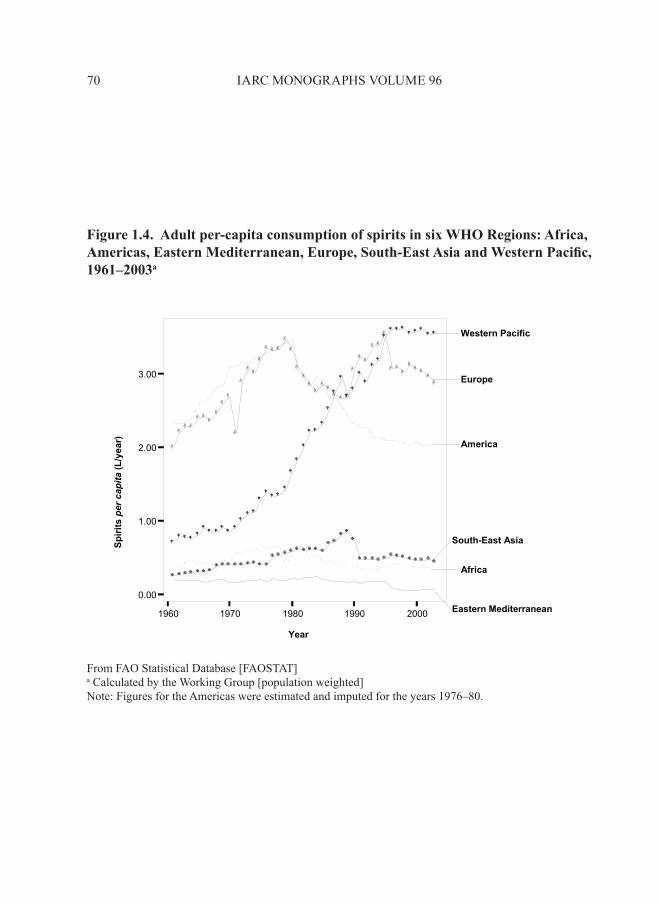
Figure 1.4. Adult per-capita consumption of spirits in six WHO Regions: Africa, Americas, eastern Mediterranean, europe, South-east Asia and Western Pacific, 1961–2003a
1960 1970 1980 1990 2000
Year
0.00
1.00
2.00
3.00
Spiri
ts p
er c
apita
(L/y
ear)
Western Pacific
Europe
America
South-East Asia
Africa
Eastern Mediterranean
From FAO Statistical Database [FAOSTAT]a Calculated by the Working Group [population weighted]Note: Figures for the Americas were estimated and imputed for the years 1976–80.
relatively stable, but consumption in the Western Pacific Region, mostly influenced by China because of the large population there, has almost steadily increased.
The trends in beer consumption follow the same pattern. In addition, beer con-sumption has been increasing in the Americas; this region now has the biggest beer consumption per.capita in the world.
Europe and, to a much lesser degree, America are the only regions with notable consumption of wine. The seemingly high consumption in Africa is due to the fact that FAO has been recording fermented beverages under this category since the mid 1990s.
Finally, spirits are the most commonly consumed beverage type around the world. They have also contributed to the large increase in consumption in the Western Pacific Region. In a global perspective, the Western Pacific Region, and especially China, is now the region with the highest consumption of spirits in the world. It should also be noted that the consumption of spirits has decreased in the Americas, where this type of beverage has been replaced by beer.
1.4 Sociodemographic determinants of alcoholic beverage consumption
1.4.1. Introduction
As noted in Section 1.3, per-capita consumption figures offer overall a comparable picture of alcoholic beverage consumption across countries and avoid the problems of underestimation as well as other sources of bias present in survey methods (e.g. recall bias). However, per-capita consumption does not provide any information on patterns of consumption within a country; that is, the frequency and quantity of consumption as well as occasions on which a large amount of alcoholic beverages may be consumed at one time. Also, with per-capita consumption, it is not known which subgroups engage in particular patterns of drinking. Survey data, although imperfect in certain respects, still provide the only method to obtain knowledge on the patterns of consumption within a population.
Key measures of patterns of consumption include the assessment, within a given period, of the proportion of the population that drinks at all and, conversely, the pro-portion that abstains from drinking. Among those who drink, central measures include the frequency of drinking over a pre-defined period and the total amount or volume of ethanol consumed over that period. It is also informative to gather this information for the three major classes of beverage: beer, wine and spirits. In addition, it is helpful to calculate the average amount of alcoholic beverages consumed per day as well as the number of drinking days. The former measure is often used to communicate safe drinking limits to the public (e.g. British Medical Association, 1995). A final important indicator of patterns of consumption is a measure of so-called ‘heavy episodic drink-ing’. This is defined as an intake of ethanol sufficient to lead to intoxication in a single session of drinking, and is usually 60 g ethanol or more (WHO, 2000).
71ALCOHOL CONSUMPTION
Knowledge of the patterns and habits of alcoholic beverage consumption in various countries and among cultures has increased markedly over the past decade. This has been due to efforts of various cross-cultural social-epidemiological studies as well as initiatives of various regional and global institutions such as the European Commission and the WHO to conduct general population surveys. Despite these advances, gaps in knowledge still exist; however, it is now possible to obtain a general picture of drink-ing habits in various regions of the world, which was not the case previously. Such information can help to indicate which geographic and demographic groups may be at greater risk from certain exposures to alcoholic beverage consumption than others.
1.4.2. gender
It has been often observed that men are more frequently drinkers of alcoholic bev-erages, drink larger amounts and drink more often than women (Wilsnack et.al ., 2000, 2005). This appears to be a universal gender difference in human social behaviour. However, the magnitude of these gender differences varies by age group, socioeco-nomic group and by region and/or culture.
With respect to the European Region, gender differences in the rates of current drinkers are small, with gender ratios (i.e. the value of a variable for men divided by that for women) that range between 1.0 and 1.2 (calculated from Mäkelä et.al ., 2006). In the adult drinking population (20–64 years), gender ratios for overall drinking fre-quency are between 1.8 and 2.5. Larger variation exists for beverage-specific drink-ing frequency: men and women are most similar in their wine-drinking habits and the least similar in their beer-drinking habits. This basic pattern holds true for beverage-specific volume. Although in some countries women may drink wine more frequently than men, men almost always consume more of each beverage than women. Gender ratios for mean quantities of specific beverages consumed per drinking day have a nar-row range for wine (1.0–1.8) and a wider range for spirits (1.1–2.0) and beer (1.3–2.2). For total mean volume and frequency of heavy episodic drinking, gender ratios are larger than those for drinking status or drinking frequency and most range between 1.8 and 5.8 across the European Region. Gender differences are smaller in the north-ern European countries for current drinking, frequency of drinking and frequency of heavy episodic drinking, but gender ratios for mean consumption reveal no clear regional pattern (Mäkelä et.al ., 2006).
In the 14 WHO regions, more women than men are abstainers, yet the rates of current drinking for both men and women are similar across the regions, showing that, where the level of current drinking for men is high, that for women is also high. The gender ratios are extremely variable: western Europe and the Western Pacific (e.g. Australia and Japan) have low ratios of 1.1 while the Eastern Mediterranean (e.g. Afghanistan and Pakistan) has a ratio of 17 and South-East Asia (e.g. Bangladesh and India) has a ratio of 6.5 (Wilsnack et.al ., 2005). Furthermore, the percentage of alco-holic beverages consumed by women also varies greatly across regions. In Europe, the
72 IARC MONOGRAPHS VOLUME 96
share of alcoholic beverages consumed by women generally varies between 20% and 30% (Mäkelä et.al ., 2006). In developing countries, the percentage share can be much lower: based on recently conducted surveys, it is, for example, 8% in China, 10% in India and 15% in Ecuador (WHO, 2004).
Data – as yet unpublished – obtained from a recent general population survey in many countries (Argentina, Australia, Austria, Brazil, Costa Rica, Czech Republic, Denmark, Finland, France, Germany, Hungary, Iceland, India, Israel, Italy, Japan, Mexico, the Netherlands, Nigeria, Norway, Spain, Sri Lanka, Sweden, Uganda, United Kingdom, USA, Uruguay) in various regions of the world through the GENACIS project (Rahav et.al ., 2006) confirm the previously mentioned variations in drinking by gender: men are more likely to be drinkers than women, women are more likely to be lifetime abstainers, men are more likely to drink heavily and more frequently and women drinkers are more likely to be light drinkers. These gender differences are more marked for countries outside North America and northern Europe.
1.4.3. age
The relationship of age to drinking habits is very much affected by gender and culture. In general terms, however, among adult populations in the developed world, abstention rates increase with older age and, among those who drink, frequency of drinking increases. Heavy episodic drinking is most frequent among the younger age groups; however, in some countries (e.g. central Europe), such rates do not always decline.
As stated, these general tendencies are very much affected by both age and region. For example, in Europe, a decrease in current drinking rates with age (age categories of 20–34, 35–49, 50–64 years) has been seen for some (e.g. northern and eastern Europe) but not all European countries (Mäkelä et.al ., 2006). Men and women tend to have sim-ilar current drinking rates at a given age. In many European countries, drinking fre-quency increases with increasing age, which can be attributed mostly to an increase in the frequency of drinking wine. This holds for both sexes. Typical amounts of alcoholic beverage consumed also generally decrease with age across many European countries and across the genders, although a slight increase in wine consumption with increasing age can be observed in France (Mäkelä et.al ., 2006). In most northern European coun-tries, heavy episodic drinking clearly declines with increasing age, but such reductions are not as observed in more central European countries.
Age also interacts variously with gender across the GENACIS study countries. For example, drinking status and frequency of drinking do not decline with age eve-rywhere. For most European countries, the gender ratio for current drinking status remains rather stable across age groups and, in low- and middle-income countries, there is no clear pattern of the gender gap being larger at younger or older ages. The proportion of heavy drinkers (e.g. 23.2 g ethanol per day or more) tends to decline with increasing age (age categories of 18–34, 35–49, 50–65 years) among the North
73ALCOHOL CONSUMPTION
American and European countries (central and southern European countries tend to be exceptions). The non-European, non-North American countries have varying pat-terns: in several low- and middle-income countries (e.g. Brazil, India, Nigeria) as well as Japan, heavy drinking is positively correlated with increasing age, especially among men. Heavy episodic drinking has much clearer patterns. In almost all of the GENACIS study countries, the prevalence of heavy episodic drinking decreases with increasing age. However, this reduction is not always proportional across the sexes, leading to higher gender ratios in the older age categories (Rahav et.al ., 2006).
1.4.4. socioeconomic.status
In developed economies, people with higher socioeconomic status are more likely to be current drinkers than those with lower socioeconomic status. Among those who drink, drinking frequency is higher among those with higher status. Heavy drinking and heavy episodic drinking are, in general, found to be more common among women of higher socioeconomic status; for men, the trend for both indicators is converse (e.g. Bloomfield et.al ., 2006). Further, in the USA, it is known that household income, edu-cation and employment status are positively associated with current drinking status and more frequent drinking, but are negatively correlated with measures of heavier drinking such as weekly heavy drinking (Midanik & Clark, 1994; Greenfield et.al ., 2000).
In the Netherlands, van Oers et.al . (1999) found that lower educational status was positively related to abstinence from alcohol for both men and women; however, among men, very excessive drinking was more prevalent in the lowest educational group. Among women, higher educational level was associated with fewer reports of psycho-logical dependence and symptomatic drinking, while among men higher educational level was associated with fewer reports of social problems.
Bloomfield et.al . (2000) investigated socioeconomic status and drinking behaviour in a sample of the German general population and found, in comparison with men of high socioeconomic status, that men of middle status had increased odds for heavy episodic drinking, while men of lower status had higher odds for symptoms of alcohol dependence. Women of middle socioeconomic status had significantly lower odds for reporting alcohol-related problems and symptoms of alcohol abuse in comparison with women of higher status.
Marmot (1997) examined data from the Whitehall II Study in the United Kingdom and found variations in prevalence of alcoholic beverage consumption by grade of employment. Higher rates of abstention were evident for both sexes among those in the lower employment grades. More moderate drinking was found among men in the higher employment grades, but the proportion of heavier drinkers was rather con-stant from the highest to lowest grades. However, among women, there was not only a higher proportion of women in the higher grades who drank moderately, but also a much higher rate of heavier drinking.
74 IARC MONOGRAPHS VOLUME 96
In a comparative study of socioeconomic position and health, Kunst et.al . (1996) found differing associations between heavy drinking and level of education among men and women in eight European countries. Excessive (four glasses or more per day) alcoholic beverage consumption was more common among men with a lower level of education. Among women, no substantial differences were found.
A less consistent pattern has emerged in some low- and middle-income countries such as Brazil, where the higher classes tend to have higher rates of heavier drinking among both genders (Almeida-Filho et.al ., 2005; Bloomfield et.al ., 2006). Similarly, among Argentinean men, more of those with a low level of education (less than 8 years of schooling) are abstainers, while more of those who drink weekly or engage in heavy episodic drinking are more highly educated; for Argentinean women, however, more of those who usually drink three or more drinks or engage in heavy episodic drink-ing are less educated (Munné, 2005). In a regional sample of China, Wei et.al . (2001) reported that men and women with a lower level of education (0–6 years of schooling) were more frequently abstainers, but also more men with a lower level of education drank daily or more frequently than those with a higher level.
1.4.5. socioeconomic.status.and.beverage.preferences
Those who prefer wine compared with beer, spirits or a more mixed consumption come from higher sociodemographic backgrounds (higher socioeconomic status, higher education) and are more frequently light or moderate drinkers. Men and younger indi-viduals more frequently tend to be beer drinkers and women and older people are more frequently wine drinkers (see e.g. the literature reviews in Wannamethee & Shaper, 1999; Graves & Kaskutas, 2002; Klatsky et.al ., 2003; Nielsen et.al ., 2004). With regard to age, Gmel et.al . (1999) have shown, in a longitudinal study in Switzerland with clearly different drinking cultures between the German- and Latin-speaking regions, that young people across all regions more often preferred beer, but were more likely when growing older to change to the typical regional pattern. The preference for beer at younger ages was probably related to the fact that beer is the cheapest alcoholic beverage.
Most of the studies on background characteristics of individuals who have differ-ent beverage preferences were conducted in only very few countries such as the North American countries, the United Kingdom or Denmark, which are commonly ‘beer countries’, and thus wine consumption might be more closely associated with the hab-its of the more prosperous sectors of the population. Some similarities have also been found for southern European ‘wine’ countries, such as a higher proportion of heavy drinkers among those who do not drink exclusively wine in Greece (San José et.al ., 2001), consumption of more beer and spirits compared with wine among younger individuals in Spain (Del Rio et.al ., 1995) and the proportion of beer in total alcoholic beverage consumption increasing with total ethanol intake in France (Ruidavets et.al ., 2002). There is nevertheless sufficient evidence that harm from chronic heavy drinking
75ALCOHOL CONSUMPTION
of wine is found in southern European countries where wine is the culturally preferred and therefore often also the cheapest alcoholic beverage.
The price of alcoholic beverages seems to be a main determinant of which type of beverage is usually preferred, and thus wine as the ‘drink of moderation’ in many established market economies may reflect the better economical status of wine drink-ers, which in turn is related to better education and other healthier lifestyles. Decades ago, excessive drinkers or even alcoholics in the USA were called ‘winos’ because they drank the cheapest wines from which they could obtain the most alcohol for their money (Klatsky, 2002). It has been argued that there has been a worldwide shift away from cheap wines to quality wines marketed to middle-class consumers, which may have helped to make table wine the more frequent choice of alcoholic beverage among the better-educated segments of society in Denmark, the USA and some other countries.
Outside the established market economies, the gender and sociocultural back-grounds of beverage preferences are much less consistent. It appears that beverage preference is mostly determined by economic conditions, and the poorest people drink the cheapest and most readily available beverages, which can be wine, beer or locally produced beverages. In contrast, people who have a higher standard of living drink the more expensive beverages, which can be industrial, lager type beers or foreign spirits such as whiskies (WHO, 2005).
According to Benegal (2005), 95% of the total alcoholic beverages consumed in India by both male and female drinkers is in the form of licit and illicitly distilled spirits; the remainder is mainly beer. The market for wine is small and wine is mainly drunk by people in high socioeconomic classes and predominantly by women. In con-trast, consumption of illicit ‘moonshine’ by women was more frequently found among rural and working classes. Men who drink beer consume less alcohol than those who drink spirits in India. On the basis of equal quantities of alcohol, beer is more expen-sive than spirits, and thus beer is drunk by the middle and upper socioeconomic classes (Saxena, 1999). Beer is also more expensive in Brazil than locally produced spirits such as cachaça and thus the latter is more often consumed by heavy drinkers and is pre-ferred by the poorest and least educated (Carlini-Cotrim, 1999). In Mexico (Romero-Mendoza et.al ., 2005), most women drink beer and spirits, but not table wine. Table wine is consumed by the highest socioeconomic classes, whereas the poorest people drink pulque and aquardiente which are often produced illicitly (Medina-Mora, 1999). Among men, more than half of the pulque drinkers were heavy drinkers. In Nigeria (Ibanga et.al ., 2005), although wine is the only alcoholic beverage consumed by more women than men, a higher percentage of women (but fewer men) drink beer and local beverages such as burukutu, palmwine and ogogoro (distilled from palmwine) com-pared with wine. Among men, lower socioeconomic classes prefer traditional African beers and other local beverages whereas commercial western-style beers are pre-ferred by higher socioeconomic classes (Gureje, 1999). In Zimbabwe, the traditional opaque beer is most frequently consumed. Among people with higher incomes, this is
76 IARC MONOGRAPHS VOLUME 96
replaced by clear (lager-style) beer, fortified wines and imported spirits that are more expensive than the cheapest opaque beer (Jernigan, 1999). Beer and cheap local brews are also more popular than wine among women who drink in Sri Lanka (Hettige & Paranagama, 2005) where women in higher socioeconomic classes also drink wine and whisky, and those in the lower classes also drink hard liquor such as arrak and illicit liquor. In Papua New Guinea (Marshall, 1999), beer is again by far the most popular beverage, followed by rum and Scotch whiskies. White wines are consumed regularly by only a small number of modern, well educated urban women.
The poorest populations and those on the fringe of society, very heavy drinkers and those who are dependent on alcohol are also the people who show the highest prevalence of consumption of surrogate and illegally produced alcoholic beverages (see Sections 1.3 and 1.5). The reasons for using illicit and surrogate alcoholic bever-ages are mainly twofold. Illegal alcoholic beverages are much cheaper, e.g. around 2–6 times less expensive in Estonia and the Russian Federation (McKee et.al ., 2005; Lang et.al ., 2006) than commercial alcoholic beverages. Another reason can be the restricted availability of alcoholic beverages during particular periods (e.g. war or economic cri-ses), or in particular regions such as the native American reservations in the USA (see Section 1.4). Particularly in developing countries, illegally produced alcoholic bever-ages are often the main source of alcohol intake in the lower socioeconomic groups (Marshall, 1999; WHO, 2001).
Few representative population surveys on the use of illicit and surrogate alcoholic beverages have been carried out to date. Nevertheless, there is evidence from small-scale studies that their use can be substantial. Lang et.al . (2006) reported that 8% of alcoholic beverage consumers in Estonia drink illegal and surrogate alcohols. Mc Kee et.al . (2005) estimated that among 25–54-year-olds in Izhevsk, the Russian Federation, 7.3% have drunk surrogate alcoholic beverages in the past year and 4.7% drink them weekly. Consumption of illegally produced alcoholic beverages is very high and can represent up to more than 50% of total alcoholic beverage consumption (see Section 1.5) in developing countries (WHO, 2001).
1.5 Non-beverage alcohol consumption
Particularly in central and eastern Europe, but also in developing countries, large discrepancies between recorded alcoholic beverage consumption and potentially alco-hol-related mortality can be found. One example is Hungary where mortality from liver disease is approximately fourfold higher than that in countries with similar per-capita consumption of alcohol (e.g. Szücs et.al ., 2005; Rehm et.al ., 2007). One reason might be the particularly high unrecorded consumption in parts of eastern and cen-tral Europe (see Section 1.4), which may account for even more alcoholic beverage consumption from unrecorded sources in some countries than from recorded sources (Szücs et.al ., 2005). In addition to smuggled commercial and illegally produced, home-made alcoholic beverages, the latter of which are commonly called ‘samogon’ in the
77ALCOHOL CONSUMPTION
Russian Federation or ‘moonshine’ in the USA, a proportion of unrecorded consump-tion is so-called ‘surrogate alcohol’.
Surrogate alcohol is not defined consistently in the literature. Some authors also include under ‘surrogate alcohol’ illegally produced alcoholic beverages that are intended for consumption as well as alcohols that are not initially intended for consump-tion (McKee et.al ., 2005). Others define surrogate alcohol more strictly as substances that contain ethanol but are ‘not intended’ for consumption such as medicinal alco-hol, aftershaves, technical spirits or fire-lighting liquids. Even more strictly, Nordlund and Osterberg (2000) divided the ‘not intended for consumption alcohols’ into alcohol produced for industrial, technical and medical purposes and what they call ‘surrogate alcohol’, namely denatured spirits, medicines and car chemicals that contain alcohol, but which are meant, for example, for car washing. In this section, only surrogate alco-hol that is apparently not intended for consumption is discussed. In fact, as argued by McKee et.al . (2005), in some countries, mainly in eastern Europe, it is questionable that part of the production of surrogate alcohols is truly not intended for consumption, e.g. medicinal alcohols sold in bottles with colourful labels that are much larger than those in western Europe or aftershaves that have no discernible warning labels such as ‘for external use only’.
A few studies have used gas chromatography/mass spectrometry to analyse the compounds in such products, mainly in eastern Europe. In these, surrogate alcohol commonly consisted of relatively pure ethanol but at a very high concentration: medic-inal spirits contained 60–70% vol ethanol, aftershaves slightly less and other non-medicinal (fire-lighting liquids) contained very high concentrations of > 90% (McKee et.al ., 2005; Lang et.al ., 2006). Methanol was undetected in theses studies. This, how-ever, might be related to the kind of surrogate alcohol that was analysed, namely medi-cines, aftershaves and fire-lighting liquids and not industrial alcohol, and to the way in which the alcohol was denatured (e.g. by bitter constituents or methanol) to make it undrinkable. [The Working Group noted that the usual denaturing agents were not analysed in these studies, but the undetected methanol points to the fact that only bitter-ants were used.] Alcohol is denatured for the purposes of exemption from excise duty. Different substances may be used, e.g. 5 L methylene per 100 L ethanol. Methylene is raw methanol and is produced from the dry distillation of wood that contains at least 10% by weight acetone or a mixture of methylene and methanol. Other denaturing sub-stances include methylethylketone (approx. 1 L per 100 L alcohol) or bitterants such as denatonium benzoate (Lachenmeier et.al ., 2007).
Industrial alcohol is often denatured by addition of up to 5% methanol (methyl-ated). So-called ‘meths’ drinking is known all over the world and often has fatal conse-quences. One of the problems is unintentional ‘meths’ drinking. Alcohol that is offered for consumption on the illegal market is often adulterated by non-drinkable alcohol (e.g. sold as aquardiente in Mexico) (Medina-Mora, 1999), and thus consumers are not aware of the potential risks. However, there is also evidence that some heavy drinkers, commonly the most economically disadvantaged, mix beverage alcohol with industrial
78 IARC MONOGRAPHS VOLUME 96
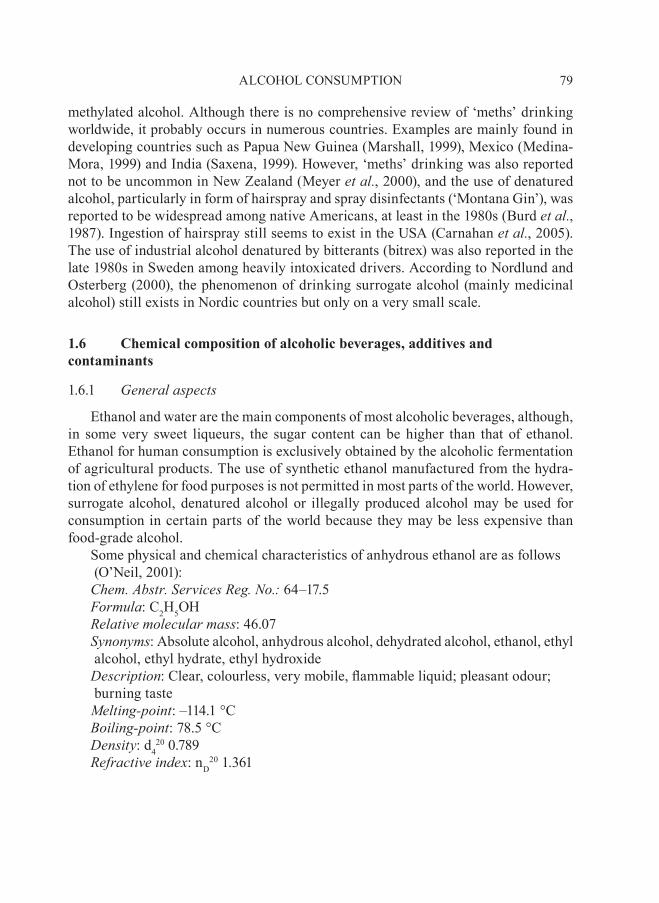
methylated alcohol. Although there is no comprehensive review of ‘meths’ drinking worldwide, it probably occurs in numerous countries. Examples are mainly found in developing countries such as Papua New Guinea (Marshall, 1999), Mexico (Medina-Mora, 1999) and India (Saxena, 1999). However, ‘meths’ drinking was also reported not to be uncommon in New Zealand (Meyer et.al ., 2000), and the use of denatured alcohol, particularly in form of hairspray and spray disinfectants (‘Montana Gin’), was reported to be widespread among native Americans, at least in the 1980s (Burd et.al ., 1987). Ingestion of hairspray still seems to exist in the USA (Carnahan et.al ., 2005). The use of industrial alcohol denatured by bitterants (bitrex) was also reported in the late 1980s in Sweden among heavily intoxicated drivers. According to Nordlund and Osterberg (2000), the phenomenon of drinking surrogate alcohol (mainly medicinal alcohol) still exists in Nordic countries but only on a very small scale.
1.6 Chemical composition of alcoholic beverages, additives and contaminants
1.6.1. general.aspects
Ethanol and water are the main components of most alcoholic beverages, although, in some very sweet liqueurs, the sugar content can be higher than that of ethanol. Ethanol for human consumption is exclusively obtained by the alcoholic fermentation of agricultural products. The use of synthetic ethanol manufactured from the hydra-tion of ethylene for food purposes is not permitted in most parts of the world. However, surrogate alcohol, denatured alcohol or illegally produced alcohol may be used for consumption in certain parts of the world because they may be less expensive than food-grade alcohol.
Some physical and chemical characteristics of anhydrous ethanol are as follows (O’Neil, 2001):Chem ..abstr ..services.reg ..no .: 64–17.5Formula: C2H5OHrelative.molecular.mass: 46.07synonyms: Absolute alcohol, anhydrous alcohol, dehydrated alcohol, ethanol, ethyl alcohol, ethyl hydrate, ethyl hydroxideDescription: Clear, colourless, very mobile, flammable liquid; pleasant odour; burning tasteMelting-point: –114.1 °CBoiling-point: 78.5 °CDensity: d4
20 0.789refractive.index: nD
20 1.361
79ALCOHOL CONSUMPTION
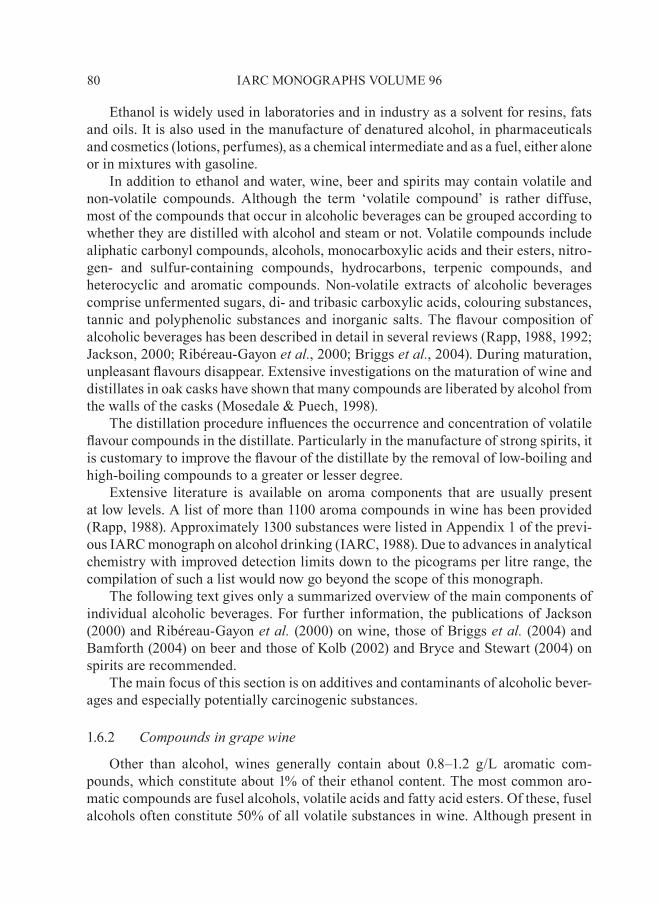
Ethanol is widely used in laboratories and in industry as a solvent for resins, fats and oils. It is also used in the manufacture of denatured alcohol, in pharmaceuticals and cosmetics (lotions, perfumes), as a chemical intermediate and as a fuel, either alone or in mixtures with gasoline.
In addition to ethanol and water, wine, beer and spirits may contain volatile and non-volatile compounds. Although the term ‘volatile compound’ is rather diffuse, most of the compounds that occur in alcoholic beverages can be grouped according to whether they are distilled with alcohol and steam or not. Volatile compounds include aliphatic carbonyl compounds, alcohols, monocarboxylic acids and their esters, nitro-gen- and sulfur-containing compounds, hydrocarbons, terpenic compounds, and heterocyclic and aromatic compounds. Non-volatile extracts of alcoholic beverages comprise unfermented sugars, di- and tribasic carboxylic acids, colouring substances, tannic and polyphenolic substances and inorganic salts. The flavour composition of alcoholic beverages has been described in detail in several reviews (Rapp, 1988, 1992; Jackson, 2000; Ribéreau-Gayon et.al ., 2000; Briggs et.al ., 2004). During maturation, unpleasant flavours disappear. Extensive investigations on the maturation of wine and distillates in oak casks have shown that many compounds are liberated by alcohol from the walls of the casks (Mosedale & Puech, 1998).
The distillation procedure influences the occurrence and concentration of volatile flavour compounds in the distillate. Particularly in the manufacture of strong spirits, it is customary to improve the flavour of the distillate by the removal of low-boiling and high-boiling compounds to a greater or lesser degree.
Extensive literature is available on aroma components that are usually present at low levels. A list of more than 1100 aroma compounds in wine has been provided (Rapp, 1988). Approximately 1300 substances were listed in Appendix 1 of the previ-ous IARC monograph on alcohol drinking (IARC, 1988). Due to advances in analytical chemistry with improved detection limits down to the picograms per litre range, the compilation of such a list would now go beyond the scope of this monograph.
The following text gives only a summarized overview of the main components of individual alcoholic beverages. For further information, the publications of Jackson (2000) and Ribéreau-Gayon et.al . (2000) on wine, those of Briggs et.al . (2004) and Bamforth (2004) on beer and those of Kolb (2002) and Bryce and Stewart (2004) on spirits are recommended.
The main focus of this section is on additives and contaminants of alcoholic bever-ages and especially potentially carcinogenic substances.
1.6.2. Compounds.in.grape.wine
Other than alcohol, wines generally contain about 0.8–1.2 g/L aromatic com-pounds, which constitute about 1% of their ethanol content. The most common aro-matic compounds are fusel alcohols, volatile acids and fatty acid esters. Of these, fusel alcohols often constitute 50% of all volatile substances in wine. Although present in
80 IARC MONOGRAPHS VOLUME 96
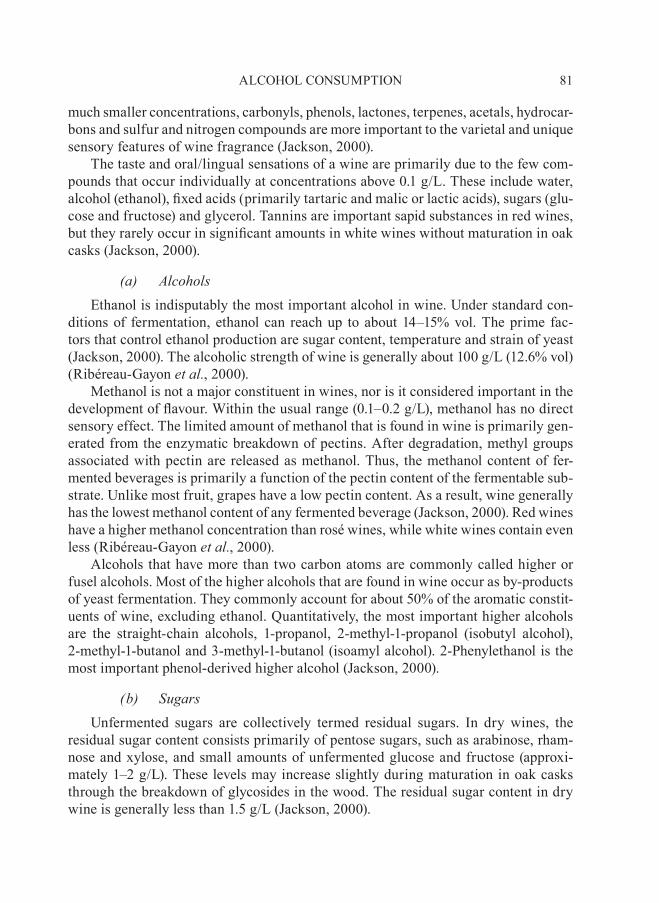
much smaller concentrations, carbonyls, phenols, lactones, terpenes, acetals, hydrocar-bons and sulfur and nitrogen compounds are more important to the varietal and unique sensory features of wine fragrance (Jackson, 2000).
The taste and oral/lingual sensations of a wine are primarily due to the few com-pounds that occur individually at concentrations above 0.1 g/L. These include water, alcohol (ethanol), fixed acids (primarily tartaric and malic or lactic acids), sugars (glu-cose and fructose) and glycerol. Tannins are important sapid substances in red wines, but they rarely occur in significant amounts in white wines without maturation in oak casks (Jackson, 2000).
(a). alcoholsEthanol is indisputably the most important alcohol in wine. Under standard con-
ditions of fermentation, ethanol can reach up to about 14–15% vol. The prime fac-tors that control ethanol production are sugar content, temperature and strain of yeast (Jackson, 2000). The alcoholic strength of wine is generally about 100 g/L (12.6% vol) (Ribéreau-Gayon et.al ., 2000).
Methanol is not a major constituent in wines, nor is it considered important in the development of flavour. Within the usual range (0.1–0.2 g/L), methanol has no direct sensory effect. The limited amount of methanol that is found in wine is primarily gen-erated from the enzymatic breakdown of pectins. After degradation, methyl groups associated with pectin are released as methanol. Thus, the methanol content of fer-mented beverages is primarily a function of the pectin content of the fermentable sub-strate. Unlike most fruit, grapes have a low pectin content. As a result, wine generally has the lowest methanol content of any fermented beverage (Jackson, 2000). Red wines have a higher methanol concentration than rosé wines, while white wines contain even less (Ribéreau-Gayon et.al ., 2000).
Alcohols that have more than two carbon atoms are commonly called higher or fusel alcohols. Most of the higher alcohols that are found in wine occur as by-products of yeast fermentation. They commonly account for about 50% of the aromatic constit-uents of wine, excluding ethanol. Quantitatively, the most important higher alcohols are the straight-chain alcohols, 1-propanol, 2-methyl-1-propanol (isobutyl alcohol), 2-methyl-1-butanol and 3-methyl-1-butanol (isoamyl alcohol). 2-Phenylethanol is the most important phenol-derived higher alcohol (Jackson, 2000).
(b). sugarsUnfermented sugars are collectively termed residual sugars. In dry wines, the
residual sugar content consists primarily of pentose sugars, such as arabinose, rham-nose and xylose, and small amounts of unfermented glucose and fructose (approxi-mately 1–2 g/L). These levels may increase slightly during maturation in oak casks through the breakdown of glycosides in the wood. The residual sugar content in dry wine is generally less than 1.5 g/L (Jackson, 2000).
81ALCOHOL CONSUMPTION
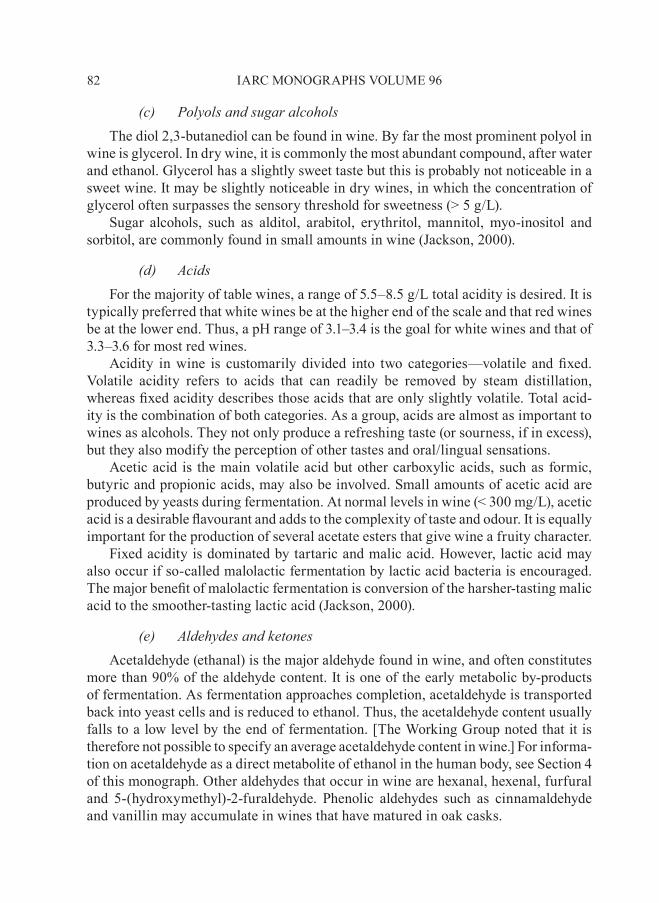
(c). polyols.and.sugar.alcoholsThe diol 2,3-butanediol can be found in wine. By far the most prominent polyol in
wine is glycerol. In dry wine, it is commonly the most abundant compound, after water and ethanol. Glycerol has a slightly sweet taste but this is probably not noticeable in a sweet wine. It may be slightly noticeable in dry wines, in which the concentration of glycerol often surpasses the sensory threshold for sweetness (> 5 g/L).
Sugar alcohols, such as alditol, arabitol, erythritol, mannitol, myo-inositol and sorbitol, are commonly found in small amounts in wine (Jackson, 2000).
(d). acidsFor the majority of table wines, a range of 5.5–8.5 g/L total acidity is desired. It is
typically preferred that white wines be at the higher end of the scale and that red wines be at the lower end. Thus, a pH range of 3.1–3.4 is the goal for white wines and that of 3.3–3.6 for most red wines.
Acidity in wine is customarily divided into two categories—volatile and fixed. Volatile acidity refers to acids that can readily be removed by steam distillation, whereas fixed acidity describes those acids that are only slightly volatile. Total acid-ity is the combination of both categories. As a group, acids are almost as important to wines as alcohols. They not only produce a refreshing taste (or sourness, if in excess), but they also modify the perception of other tastes and oral/lingual sensations.
Acetic acid is the main volatile acid but other carboxylic acids, such as formic, butyric and propionic acids, may also be involved. Small amounts of acetic acid are produced by yeasts during fermentation. At normal levels in wine (< 300 mg/L), acetic acid is a desirable flavourant and adds to the complexity of taste and odour. It is equally important for the production of several acetate esters that give wine a fruity character.
Fixed acidity is dominated by tartaric and malic acid. However, lactic acid may also occur if so-called malolactic fermentation by lactic acid bacteria is encouraged. The major benefit of malolactic fermentation is conversion of the harsher-tasting malic acid to the smoother-tasting lactic acid (Jackson, 2000).
(e). aldehydes.and.ketonesAcetaldehyde (ethanal) is the major aldehyde found in wine, and often constitutes
more than 90% of the aldehyde content. It is one of the early metabolic by-products of fermentation. As fermentation approaches completion, acetaldehyde is transported back into yeast cells and is reduced to ethanol. Thus, the acetaldehyde content usually falls to a low level by the end of fermentation. [The Working Group noted that it is therefore not possible to specify an average acetaldehyde content in wine.] For informa-tion on acetaldehyde as a direct metabolite of ethanol in the human body, see Section 4 of this monograph. Other aldehydes that occur in wine are hexanal, hexenal, furfural and 5-(hydroxymethyl)-2-furaldehyde. Phenolic aldehydes such as cinnamaldehyde and vanillin may accumulate in wines that have matured in oak casks.
82 IARC MONOGRAPHS VOLUME 96
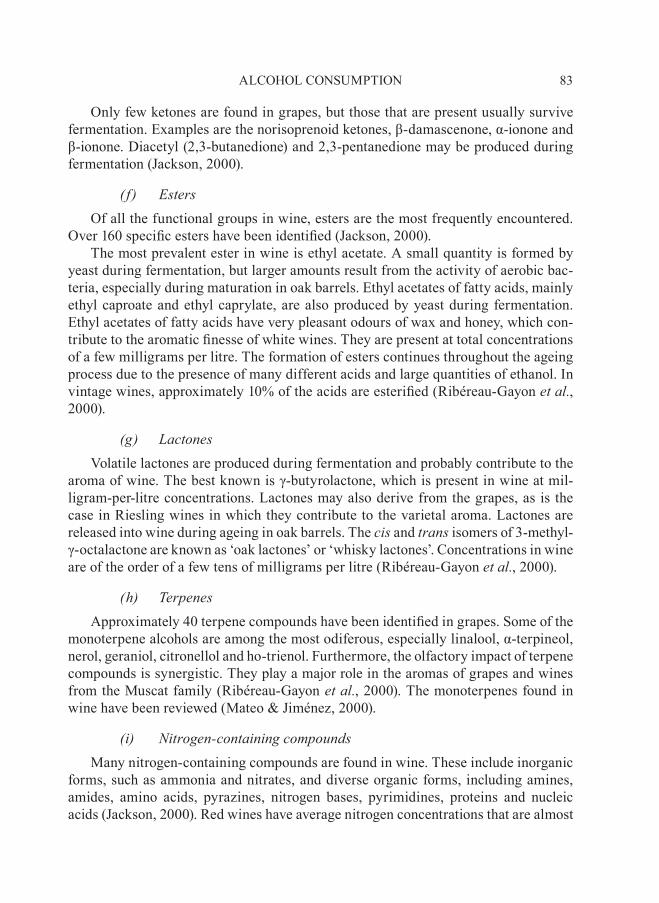
Only few ketones are found in grapes, but those that are present usually survive fermentation. Examples are the norisoprenoid ketones, β-damascenone, α-ionone and β-ionone. Diacetyl (2,3-butanedione) and 2,3-pentanedione may be produced during fermentation (Jackson, 2000).
( f ). EstersOf all the functional groups in wine, esters are the most frequently encountered.
Over 160 specific esters have been identified (Jackson, 2000).The most prevalent ester in wine is ethyl acetate. A small quantity is formed by
yeast during fermentation, but larger amounts result from the activity of aerobic bac-teria, especially during maturation in oak barrels. Ethyl acetates of fatty acids, mainly ethyl caproate and ethyl caprylate, are also produced by yeast during fermentation. Ethyl acetates of fatty acids have very pleasant odours of wax and honey, which con-tribute to the aromatic finesse of white wines. They are present at total concentrations of a few milligrams per litre. The formation of esters continues throughout the ageing process due to the presence of many different acids and large quantities of ethanol. In vintage wines, approximately 10% of the acids are esterified (Ribéreau-Gayon et.al ., 2000).
(g). LactonesVolatile lactones are produced during fermentation and probably contribute to the
aroma of wine. The best known is γ-butyrolactone, which is present in wine at mil-ligram-per-litre concentrations. Lactones may also derive from the grapes, as is the case in Riesling wines in which they contribute to the varietal aroma. Lactones are released into wine during ageing in oak barrels. The cis and trans isomers of 3-methyl-γ-octalactone are known as ‘oak lactones’ or ‘whisky lactones’. Concentrations in wine are of the order of a few tens of milligrams per litre (Ribéreau-Gayon et.al ., 2000).
(h). TerpenesApproximately 40 terpene compounds have been identified in grapes. Some of the
monoterpene alcohols are among the most odiferous, especially linalool, α-terpineol, nerol, geraniol, citronellol and ho-trienol. Furthermore, the olfactory impact of terpene compounds is synergistic. They play a major role in the aromas of grapes and wines from the Muscat family (Ribéreau-Gayon et.al ., 2000). The monoterpenes found in wine have been reviewed (Mateo & Jiménez, 2000).
(i). nitrogen-containing.compoundsMany nitrogen-containing compounds are found in wine. These include inorganic
forms, such as ammonia and nitrates, and diverse organic forms, including amines, amides, amino acids, pyrazines, nitrogen bases, pyrimidines, proteins and nucleic acids (Jackson, 2000). Red wines have average nitrogen concentrations that are almost
83ALCOHOL CONSUMPTION
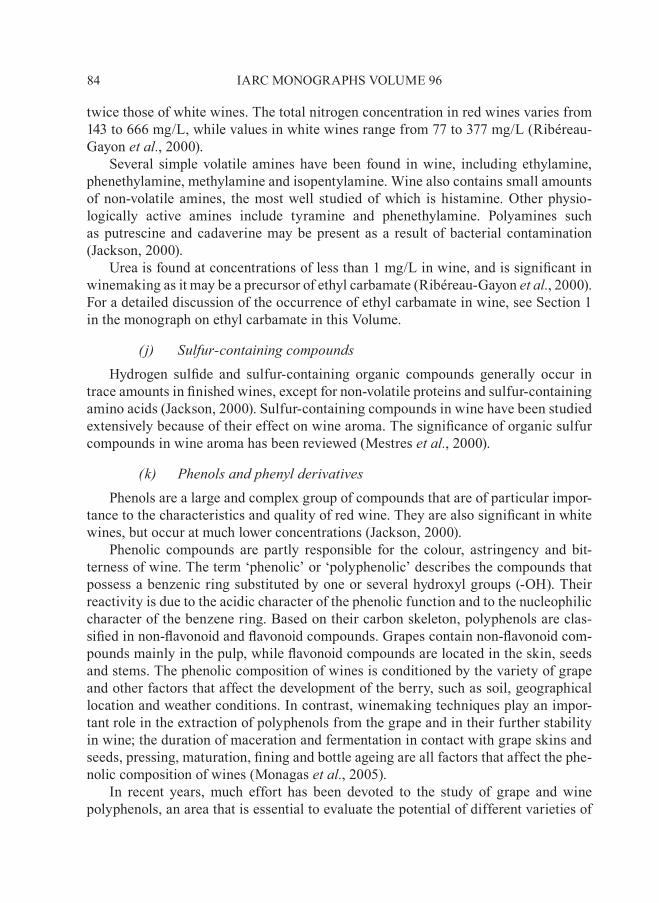
twice those of white wines. The total nitrogen concentration in red wines varies from 143 to 666 mg/L, while values in white wines range from 77 to 377 mg/L (Ribéreau-Gayon et.al ., 2000).
Several simple volatile amines have been found in wine, including ethylamine, phenethylamine, methylamine and isopentylamine. Wine also contains small amounts of non-volatile amines, the most well studied of which is histamine. Other physio-logically active amines include tyramine and phenethylamine. Polyamines such as putrescine and cadaverine may be present as a result of bacterial contamination (Jackson, 2000).
Urea is found at concentrations of less than 1 mg/L in wine, and is significant in winemaking as it may be a precursor of ethyl carbamate (Ribéreau-Gayon et.al ., 2000). For a detailed discussion of the occurrence of ethyl carbamate in wine, see Section 1 in the monograph on ethyl carbamate in this Volume.
( j). sulfur-containing.compoundsHydrogen sulfide and sulfur-containing organic compounds generally occur in
trace amounts in finished wines, except for non-volatile proteins and sulfur-containing amino acids (Jackson, 2000). Sulfur-containing compounds in wine have been studied extensively because of their effect on wine aroma. The significance of organic sulfur compounds in wine aroma has been reviewed (Mestres et.al ., 2000).
(k). phenols.and.phenyl.derivativesPhenols are a large and complex group of compounds that are of particular impor-
tance to the characteristics and quality of red wine. They are also significant in white wines, but occur at much lower concentrations (Jackson, 2000).
Phenolic compounds are partly responsible for the colour, astringency and bit-terness of wine. The term ‘phenolic’ or ‘polyphenolic’ describes the compounds that possess a benzenic ring substituted by one or several hydroxyl groups (-OH). Their reactivity is due to the acidic character of the phenolic function and to the nucleophilic character of the benzene ring. Based on their carbon skeleton, polyphenols are clas-sified in non-flavonoid and flavonoid compounds. Grapes contain non-flavonoid com-pounds mainly in the pulp, while flavonoid compounds are located in the skin, seeds and stems. The phenolic composition of wines is conditioned by the variety of grape and other factors that affect the development of the berry, such as soil, geographical location and weather conditions. In contrast, winemaking techniques play an impor-tant role in the extraction of polyphenols from the grape and in their further stability in wine; the duration of maceration and fermentation in contact with grape skins and seeds, pressing, maturation, fining and bottle ageing are all factors that affect the phe-nolic composition of wines (Monagas et.al ., 2005).
In recent years, much effort has been devoted to the study of grape and wine polyphenols, an area that is essential to evaluate the potential of different varieties of
84 IARC MONOGRAPHS VOLUME 96
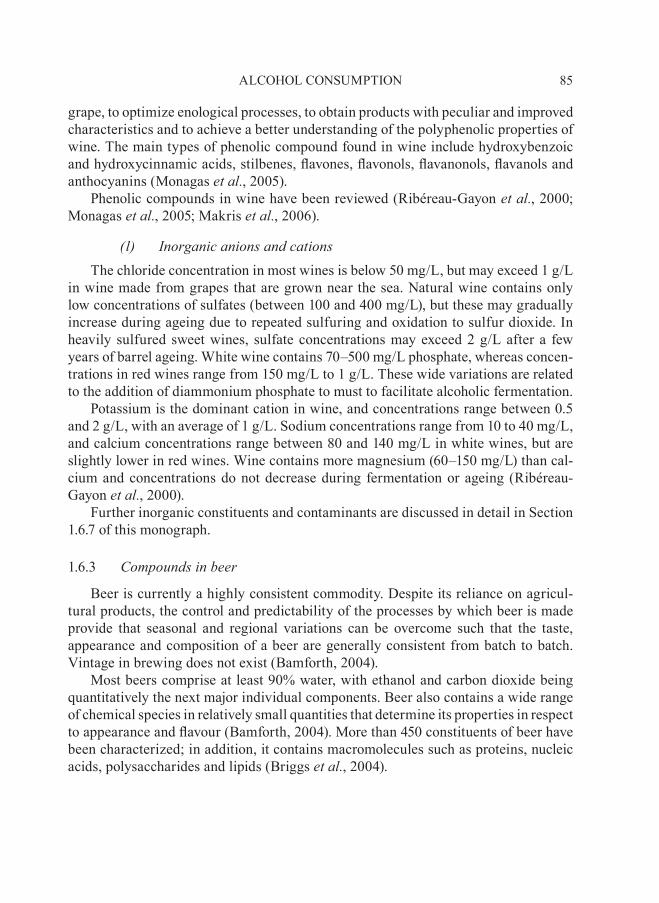
grape, to optimize enological processes, to obtain products with peculiar and improved characteristics and to achieve a better understanding of the polyphenolic properties of wine. The main types of phenolic compound found in wine include hydroxybenzoic and hydroxycinnamic acids, stilbenes, flavones, flavonols, flavanonols, flavanols and anthocyanins (Monagas et.al ., 2005).
Phenolic compounds in wine have been reviewed (Ribéreau-Gayon et.al ., 2000; Monagas et.al ., 2005; Makris et.al ., 2006).
(l). Inorganic.anions.and.cationsThe chloride concentration in most wines is below 50 mg/L, but may exceed 1 g/L
in wine made from grapes that are grown near the sea. Natural wine contains only low concentrations of sulfates (between 100 and 400 mg/L), but these may gradually increase during ageing due to repeated sulfuring and oxidation to sulfur dioxide. In heavily sulfured sweet wines, sulfate concentrations may exceed 2 g/L after a few years of barrel ageing. White wine contains 70–500 mg/L phosphate, whereas concen-trations in red wines range from 150 mg/L to 1 g/L. These wide variations are related to the addition of diammonium phosphate to must to facilitate alcoholic fermentation.
Potassium is the dominant cation in wine, and concentrations range between 0.5 and 2 g/L, with an average of 1 g/L. Sodium concentrations range from 10 to 40 mg/L, and calcium concentrations range between 80 and 140 mg/L in white wines, but are slightly lower in red wines. Wine contains more magnesium (60–150 mg/L) than cal-cium and concentrations do not decrease during fermentation or ageing (Ribéreau-Gayon et.al ., 2000).
Further inorganic constituents and contaminants are discussed in detail in Section 1.6.7 of this monograph.
1.6.3. Compounds.in.beer
Beer is currently a highly consistent commodity. Despite its reliance on agricul-tural products, the control and predictability of the processes by which beer is made provide that seasonal and regional variations can be overcome such that the taste, appearance and composition of a beer are generally consistent from batch to batch. Vintage in brewing does not exist (Bamforth, 2004).
Most beers comprise at least 90% water, with ethanol and carbon dioxide being quantitatively the next major individual components. Beer also contains a wide range of chemical species in relatively small quantities that determine its properties in respect to appearance and flavour (Bamforth, 2004). More than 450 constituents of beer have been characterized; in addition, it contains macromolecules such as proteins, nucleic acids, polysaccharides and lipids (Briggs et.al ., 2004).
85ALCOHOL CONSUMPTION
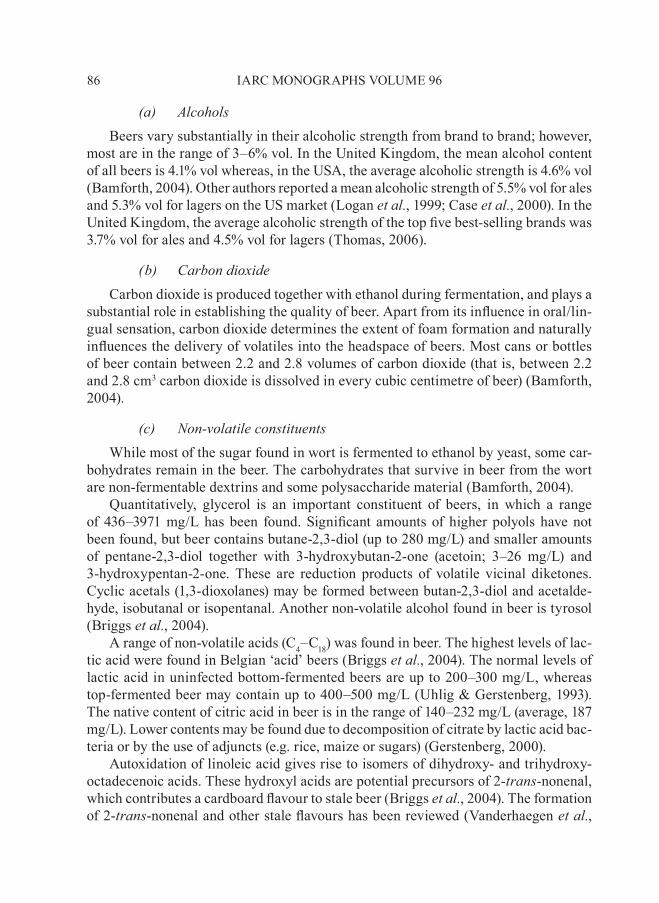
(a). alcoholsBeers vary substantially in their alcoholic strength from brand to brand; however,
most are in the range of 3–6% vol. In the United Kingdom, the mean alcohol content of all beers is 4.1% vol whereas, in the USA, the average alcoholic strength is 4.6% vol (Bamforth, 2004). Other authors reported a mean alcoholic strength of 5.5% vol for ales and 5.3% vol for lagers on the US market (Logan et.al ., 1999; Case et.al ., 2000). In the United Kingdom, the average alcoholic strength of the top five best-selling brands was 3.7% vol for ales and 4.5% vol for lagers (Thomas, 2006).
(b). Carbon.dioxideCarbon dioxide is produced together with ethanol during fermentation, and plays a
substantial role in establishing the quality of beer. Apart from its influence in oral/lin-gual sensation, carbon dioxide determines the extent of foam formation and naturally influences the delivery of volatiles into the headspace of beers. Most cans or bottles of beer contain between 2.2 and 2.8 volumes of carbon dioxide (that is, between 2.2 and 2.8 cm3 carbon dioxide is dissolved in every cubic centimetre of beer) (Bamforth, 2004).
(c). non-volatile.constituentsWhile most of the sugar found in wort is fermented to ethanol by yeast, some car-
bohydrates remain in the beer. The carbohydrates that survive in beer from the wort are non-fermentable dextrins and some polysaccharide material (Bamforth, 2004).
Quantitatively, glycerol is an important constituent of beers, in which a range of 436–3971 mg/L has been found. Significant amounts of higher polyols have not been found, but beer contains butane-2,3-diol (up to 280 mg/L) and smaller amounts of pentane-2,3-diol together with 3-hydroxybutan-2-one (acetoin; 3–26 mg/L) and 3-hydroxypentan-2-one. These are reduction products of volatile vicinal diketones. Cyclic acetals (1,3-dioxolanes) may be formed between butan-2,3-diol and acetalde-hyde, isobutanal or isopentanal. Another non-volatile alcohol found in beer is tyrosol (Briggs et.al ., 2004).
A range of non-volatile acids (C4–C18) was found in beer. The highest levels of lac-tic acid were found in Belgian ‘acid’ beers (Briggs et.al ., 2004). The normal levels of lactic acid in uninfected bottom-fermented beers are up to 200–300 mg/L, whereas top-fermented beer may contain up to 400–500 mg/L (Uhlig & Gerstenberg, 1993). The native content of citric acid in beer is in the range of 140–232 mg/L (average, 187 mg/L). Lower contents may be found due to decomposition of citrate by lactic acid bac-teria or by the use of adjuncts (e.g. rice, maize or sugars) (Gerstenberg, 2000).
Autoxidation of linoleic acid gives rise to isomers of dihydroxy- and trihydroxy-octadecenoic acids. These hydroxyl acids are potential precursors of 2-trans-nonenal, which contributes a cardboard flavour to stale beer (Briggs et.al ., 2004). The formation of 2-trans-nonenal and other stale flavours has been reviewed (Vanderhaegen et.al .,
86 IARC MONOGRAPHS VOLUME 96
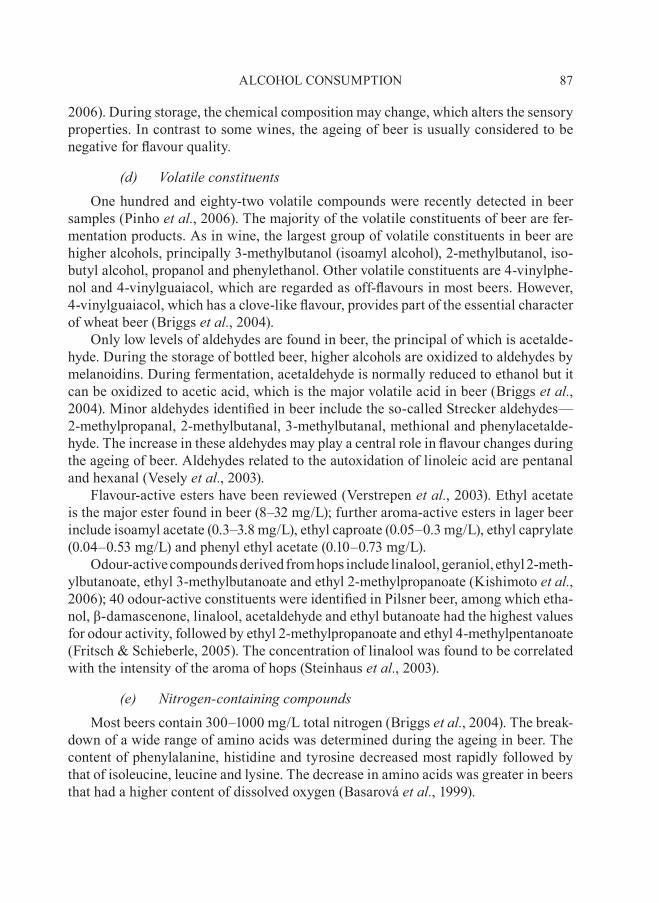
2006). During storage, the chemical composition may change, which alters the sensory properties. In contrast to some wines, the ageing of beer is usually considered to be negative for flavour quality.
(d). Volatile.constituentsOne hundred and eighty-two volatile compounds were recently detected in beer
samples (Pinho et.al ., 2006). The majority of the volatile constituents of beer are fer-mentation products. As in wine, the largest group of volatile constituents in beer are higher alcohols, principally 3-methylbutanol (isoamyl alcohol), 2-methylbutanol, iso-butyl alcohol, propanol and phenylethanol. Other volatile constituents are 4-vinylphe-nol and 4-vinylguaiacol, which are regarded as off-flavours in most beers. However, 4-vinylguaiacol, which has a clove-like flavour, provides part of the essential character of wheat beer (Briggs et.al ., 2004).
Only low levels of aldehydes are found in beer, the principal of which is acetalde-hyde. During the storage of bottled beer, higher alcohols are oxidized to aldehydes by melanoidins. During fermentation, acetaldehyde is normally reduced to ethanol but it can be oxidized to acetic acid, which is the major volatile acid in beer (Briggs et.al ., 2004). Minor aldehydes identified in beer include the so-called Strecker aldehydes—2-methylpropanal, 2-methylbutanal, 3-methylbutanal, methional and phenylacetalde-hyde. The increase in these aldehydes may play a central role in flavour changes during the ageing of beer. Aldehydes related to the autoxidation of linoleic acid are pentanal and hexanal (Vesely et.al ., 2003).
Flavour-active esters have been reviewed (Verstrepen et.al ., 2003). Ethyl acetate is the major ester found in beer (8–32 mg/L); further aroma-active esters in lager beer include isoamyl acetate (0.3–3.8 mg/L), ethyl caproate (0.05–0.3 mg/L), ethyl caprylate (0.04–0.53 mg/L) and phenyl ethyl acetate (0.10–0.73 mg/L).
Odour-active compounds derived from hops include linalool, geraniol, ethyl 2-meth-ylbutanoate, ethyl 3-methylbutanoate and ethyl 2-methylpropanoate (Kishimoto et.al ., 2006); 40 odour-active constituents were identified in Pilsner beer, among which etha-nol, β-damascenone, linalool, acetaldehyde and ethyl butanoate had the highest values for odour activity, followed by ethyl 2-methylpropanoate and ethyl 4-methylpentanoate (Fritsch & Schieberle, 2005). The concentration of linalool was found to be correlated with the intensity of the aroma of hops (Steinhaus et.al ., 2003).
(e). nitrogen-containing.compoundsMost beers contain 300–1000 mg/L total nitrogen (Briggs et.al ., 2004). The break-
down of a wide range of amino acids was determined during the ageing in beer. The content of phenylalanine, histidine and tyrosine decreased most rapidly followed by that of isoleucine, leucine and lysine. The decrease in amino acids was greater in beers that had a higher content of dissolved oxygen (Basarová et.al ., 1999).
87ALCOHOL CONSUMPTION
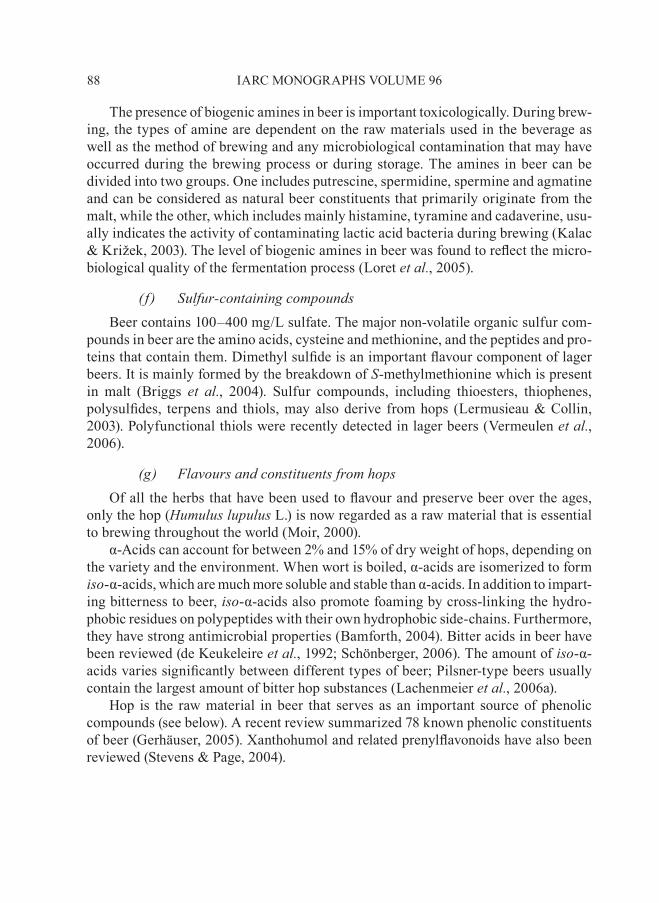
The presence of biogenic amines in beer is important toxicologically. During brew-ing, the types of amine are dependent on the raw materials used in the beverage as well as the method of brewing and any microbiological contamination that may have occurred during the brewing process or during storage. The amines in beer can be divided into two groups. One includes putrescine, spermidine, spermine and agmatine and can be considered as natural beer constituents that primarily originate from the malt, while the other, which includes mainly histamine, tyramine and cadaverine, usu-ally indicates the activity of contaminating lactic acid bacteria during brewing (Kalac & Križek, 2003). The level of biogenic amines in beer was found to reflect the micro-biological quality of the fermentation process (Loret et.al ., 2005).
( f ). sulfur-containing.compoundsBeer contains 100–400 mg/L sulfate. The major non-volatile organic sulfur com-
pounds in beer are the amino acids, cysteine and methionine, and the peptides and pro-teins that contain them. Dimethyl sulfide is an important flavour component of lager beers. It is mainly formed by the breakdown of s-methylmethionine which is present in malt (Briggs et. al ., 2004). Sulfur compounds, including thioesters, thiophenes, polysulfides, terpens and thiols, may also derive from hops (Lermusieau & Collin, 2003). Polyfunctional thiols were recently detected in lager beers (Vermeulen et.al ., 2006).
(g). Flavours.and.constituents.from.hopsOf all the herbs that have been used to flavour and preserve beer over the ages,
only the hop (humulus.lupulus L.) is now regarded as a raw material that is essential to brewing throughout the world (Moir, 2000).
α-Acids can account for between 2% and 15% of dry weight of hops, depending on the variety and the environment. When wort is boiled, α-acids are isomerized to form iso-α-acids, which are much more soluble and stable than α-acids. In addition to impart-ing bitterness to beer, iso-α-acids also promote foaming by cross-linking the hydro-phobic residues on polypeptides with their own hydrophobic side-chains. Furthermore, they have strong antimicrobial properties (Bamforth, 2004). Bitter acids in beer have been reviewed (de Keukeleire et.al ., 1992; Schönberger, 2006). The amount of iso-α-acids varies significantly between different types of beer; Pilsner-type beers usually contain the largest amount of bitter hop substances (Lachenmeier et.al ., 2006a).
Hop is the raw material in beer that serves as an important source of phenolic compounds (see below). A recent review summarized 78 known phenolic constituents of beer (Gerhäuser, 2005). xanthohumol and related prenylflavonoids have also been reviewed (Stevens & Page, 2004).
88 IARC MONOGRAPHS VOLUME 96
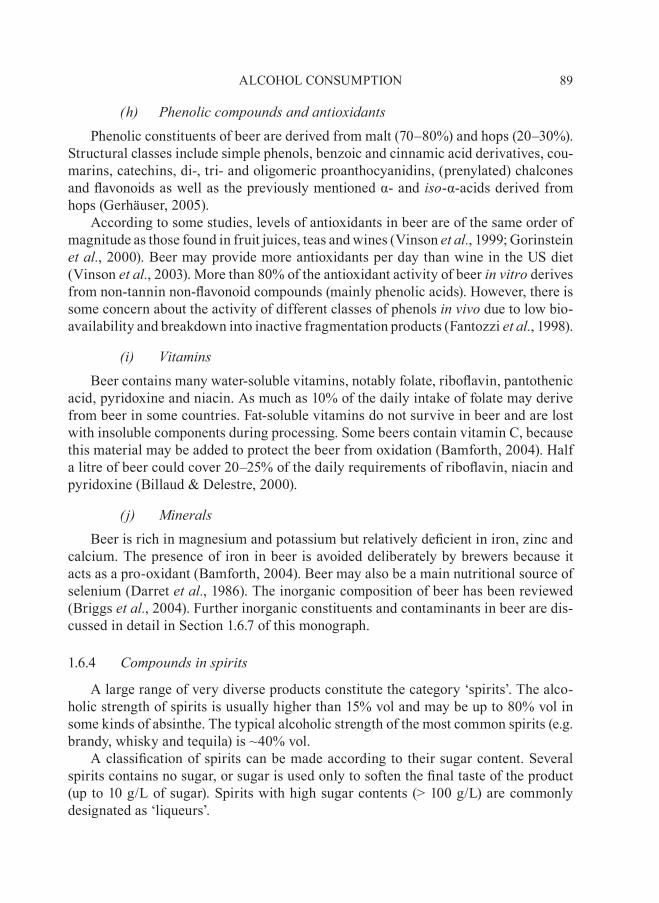
(h). phenolic.compounds.and.antioxidantsPhenolic constituents of beer are derived from malt (70–80%) and hops (20–30%).
Structural classes include simple phenols, benzoic and cinnamic acid derivatives, cou-marins, catechins, di-, tri- and oligomeric proanthocyanidins, (prenylated) chalcones and flavonoids as well as the previously mentioned α- and iso-α-acids derived from hops (Gerhäuser, 2005).
According to some studies, levels of antioxidants in beer are of the same order of magnitude as those found in fruit juices, teas and wines (Vinson et.al ., 1999; Gorinstein et.al ., 2000). Beer may provide more antioxidants per day than wine in the US diet (Vinson et.al ., 2003). More than 80% of the antioxidant activity of beer in.vitro derives from non-tannin non-flavonoid compounds (mainly phenolic acids). However, there is some concern about the activity of different classes of phenols in.vivo due to low bio-availability and breakdown into inactive fragmentation products (Fantozzi et.al ., 1998).
(i). VitaminsBeer contains many water-soluble vitamins, notably folate, riboflavin, pantothenic
acid, pyridoxine and niacin. As much as 10% of the daily intake of folate may derive from beer in some countries. Fat-soluble vitamins do not survive in beer and are lost with insoluble components during processing. Some beers contain vitamin C, because this material may be added to protect the beer from oxidation (Bamforth, 2004). Half a litre of beer could cover 20–25% of the daily requirements of riboflavin, niacin and pyridoxine (Billaud & Delestre, 2000).
( j). MineralsBeer is rich in magnesium and potassium but relatively deficient in iron, zinc and
calcium. The presence of iron in beer is avoided deliberately by brewers because it acts as a pro-oxidant (Bamforth, 2004). Beer may also be a main nutritional source of selenium (Darret et.al ., 1986). The inorganic composition of beer has been reviewed (Briggs et.al ., 2004). Further inorganic constituents and contaminants in beer are dis-cussed in detail in Section 1.6.7 of this monograph.
1.6.4. Compounds.in.spirits
A large range of very diverse products constitute the category ‘spirits’. The alco-holic strength of spirits is usually higher than 15% vol and may be up to 80% vol in some kinds of absinthe. The typical alcoholic strength of the most common spirits (e.g. brandy, whisky and tequila) is ~40% vol.
A classification of spirits can be made according to their sugar content. Several spirits contains no sugar, or sugar is used only to soften the final taste of the product (up to 10 g/L of sugar). Spirits with high sugar contents (> 100 g/L) are commonly designated as ‘liqueurs’.
89ALCOHOL CONSUMPTION
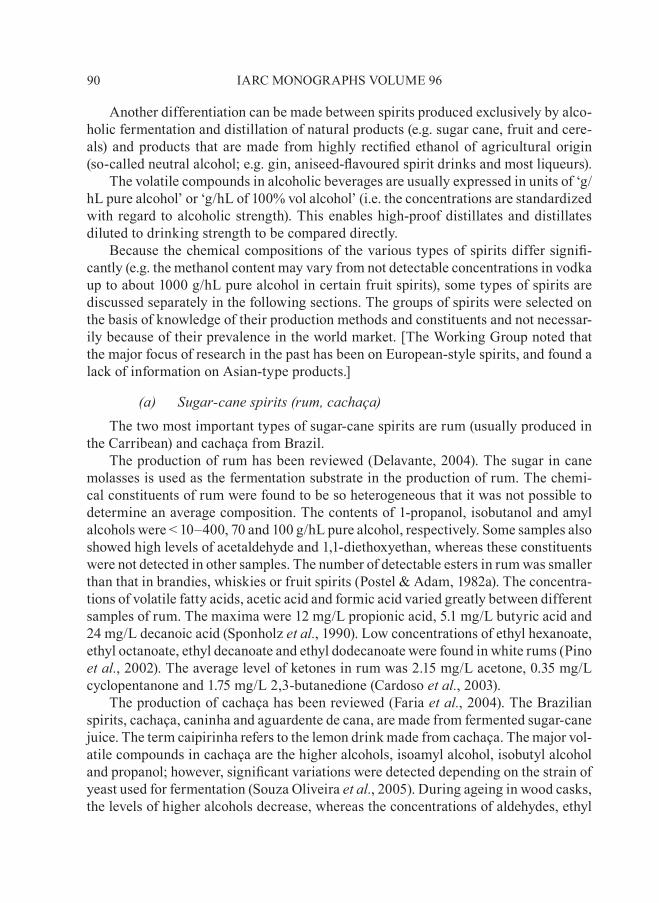
Another differentiation can be made between spirits produced exclusively by alco-holic fermentation and distillation of natural products (e.g. sugar cane, fruit and cere-als) and products that are made from highly rectified ethanol of agricultural origin (so-called neutral alcohol; e.g. gin, aniseed-flavoured spirit drinks and most liqueurs).
The volatile compounds in alcoholic beverages are usually expressed in units of ‘g/hL pure alcohol’ or ‘g/hL of 100% vol alcohol’ (i.e. the concentrations are standardized with regard to alcoholic strength). This enables high-proof distillates and distillates diluted to drinking strength to be compared directly.
Because the chemical compositions of the various types of spirits differ signifi-cantly (e.g. the methanol content may vary from not detectable concentrations in vodka up to about 1000 g/hL pure alcohol in certain fruit spirits), some types of spirits are discussed separately in the following sections. The groups of spirits were selected on the basis of knowledge of their production methods and constituents and not necessar-ily because of their prevalence in the world market. [The Working Group noted that the major focus of research in the past has been on European-style spirits, and found a lack of information on Asian-type products.]
(a). sugar-cane.spirits.(rum,.cachaça)The two most important types of sugar-cane spirits are rum (usually produced in
the Carribean) and cachaça from Brazil.The production of rum has been reviewed (Delavante, 2004). The sugar in cane
molasses is used as the fermentation substrate in the production of rum. The chemi-cal constituents of rum were found to be so heterogeneous that it was not possible to determine an average composition. The contents of 1-propanol, isobutanol and amyl alcohols were < 10–400, 70 and 100 g/hL pure alcohol, respectively. Some samples also showed high levels of acetaldehyde and 1,1-diethoxyethan, whereas these constituents were not detected in other samples. The number of detectable esters in rum was smaller than that in brandies, whiskies or fruit spirits (Postel & Adam, 1982a). The concentra-tions of volatile fatty acids, acetic acid and formic acid varied greatly between different samples of rum. The maxima were 12 mg/L propionic acid, 5.1 mg/L butyric acid and 24 mg/L decanoic acid (Sponholz et.al ., 1990). Low concentrations of ethyl hexanoate, ethyl octanoate, ethyl decanoate and ethyl dodecanoate were found in white rums (Pino et.al ., 2002). The average level of ketones in rum was 2.15 mg/L acetone, 0.35 mg/L cyclopentanone and 1.75 mg/L 2,3-butanedione (Cardoso et.al ., 2003).
The production of cachaça has been reviewed (Faria et.al ., 2004). The Brazilian spirits, cachaça, caninha and aguardente de cana, are made from fermented sugar-cane juice. The term caipirinha refers to the lemon drink made from cachaça. The major vol-atile compounds in cachaça are the higher alcohols, isoamyl alcohol, isobutyl alcohol and propanol; however, significant variations were detected depending on the strain of yeast used for fermentation (Souza Oliveira et.al ., 2005). During ageing in wood casks, the levels of higher alcohols decrease, whereas the concentrations of aldehydes, ethyl
90 IARC MONOGRAPHS VOLUME 96

acetate and acetic acid increase (Bolini et.al ., 2006). The most abundant acid in cach-aça is acetic acid, which represents up to 90–95% of the total content of acids found. The concentration of acids (C2–C18) in cachaça is in the same order of magnitude as that in whiskies, rums and cognacs (Ferreira Do Nascimento et.al ., 2000). The major aldehyde in cachaça is acetaldehyde (average, 11 g/hL pure alcohol). Minor aldehydes include formaldehyde, 5-hydroxymethylfurfural, acrolein, furfural, propionaldehyde, butyraldehyde, benzaldehyde, isovaleraldehyde and n-valeraldehyde (all below 5 g/hL pure alcohol) (Nascimento et. al ., 1997). The levels of 5-hydroxymethylfurfural can be attributed to the use of very old barrels or barrels that undergo no treatment before re-utilization. Other markers of ageing detected in cachaça include gallic acid, vanillic acid, syringic acid, vanillin, syringaldehyde, coniferaldehyde, sinapaldehyde and coumarin (de Aquino et.al ., 2006). Quantification of ketones in cachaças yielded the following average levels: 3.31 mg/L acetone, 1.24 mg/L acetophenone, 1.15 mg/L cyclopentanone and 4.34 mg/L 2,3-butanedione. Except for acetophenone, cachaça and rum exhibited the same qualitative profile of ketones (Cardoso et.al ., 2003). Large variations in the phenol content of cachaça were noted. Concentrations of total phenols were between 1.5 and 70 mg/L, and those of flavonoids were from below detection to 3.5 mg/L (Bettin et.al ., 2002).
Differences in the composition of cachaça and rum were found using multivariate data analysis. Protocatechuic acid, propanol, isobutanol, isopentanol, copper, man-ganese and magnesium were selected as chemical discriminators from a range of volatile components, acids, polyphenols and metals (Cardoso et. al ., 2004). Flavour differences between cachaça and rum were easily recognizable; the flavour compounds β-damascenone, ethyl butyrate, isobutyrate and 2-methylbutyrate were found at the same levels in both cachaça and rum, whereas levels of spicy-smelling eugenol, 4-ethyl-guaiacol and 2,4-nonadienal were much higher in cachaça (de Souza et.al ., 2006).
(b). Whisky.or.whiskeyScotch whisky has been reviewed (Halliday, 2004). Further important interna-
tional types of whisky include American whiskey (e.g. bourbon) and Canadian whis-key, and the production of whiskey has also been reviewed (Ströhmer, 2002).
Scotch whisky and Irish whiskey are produced exclusively from the distillation of a mash made from malted cereals that has been saccharified, fermented by the action of yeast and distilled by one or more distillations at less than 94.8% vol, so that the dis-tillate has an aroma and taste derived from the raw materials. The final distillate must mature for at least 3 years in wooden casks that do not exceed 700 L in capacity. The minimum alcoholic strength of such beverages is 40% vol (European Council, 1989).
The composition of the different whiskies was compared and significant differences in their volatile composition were detected (Postel & Adam, 1977, 1978, 1979). The American bourbons contained the largest amount of volatile compounds (> 500 g/hL pure alcohol), followed by Scotch (~250 g/hL pure alcohol) and Canadian blends (~100
91ALCOHOL CONSUMPTION
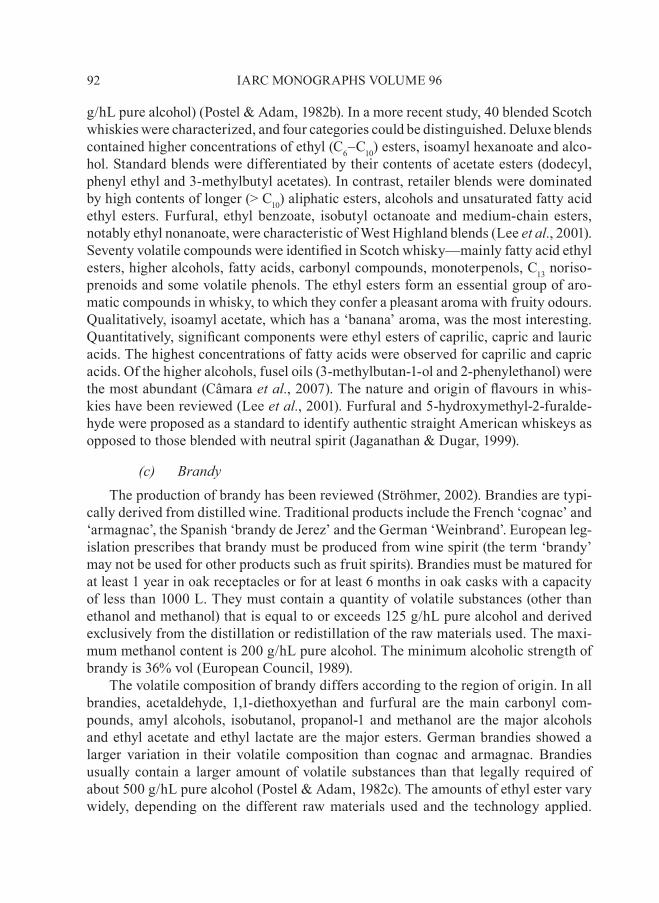
g/hL pure alcohol) (Postel & Adam, 1982b). In a more recent study, 40 blended Scotch whiskies were characterized, and four categories could be distinguished. Deluxe blends contained higher concentrations of ethyl (C6–C10) esters, isoamyl hexanoate and alco-hol. Standard blends were differentiated by their contents of acetate esters (dodecyl, phenyl ethyl and 3-methylbutyl acetates). In contrast, retailer blends were dominated by high contents of longer (> C10) aliphatic esters, alcohols and unsaturated fatty acid ethyl esters. Furfural, ethyl benzoate, isobutyl octanoate and medium-chain esters, notably ethyl nonanoate, were characteristic of West Highland blends (Lee et.al ., 2001). Seventy volatile compounds were identified in Scotch whisky—mainly fatty acid ethyl esters, higher alcohols, fatty acids, carbonyl compounds, monoterpenols, C13 noriso-prenoids and some volatile phenols. The ethyl esters form an essential group of aro-matic compounds in whisky, to which they confer a pleasant aroma with fruity odours. Qualitatively, isoamyl acetate, which has a ‘banana’ aroma, was the most interesting. Quantitatively, significant components were ethyl esters of caprilic, capric and lauric acids. The highest concentrations of fatty acids were observed for caprilic and capric acids. Of the higher alcohols, fusel oils (3-methylbutan-1-ol and 2-phenylethanol) were the most abundant (Câmara et.al ., 2007). The nature and origin of flavours in whis-kies have been reviewed (Lee et.al ., 2001). Furfural and 5-hydroxymethyl-2-furalde-hyde were proposed as a standard to identify authentic straight American whiskeys as opposed to those blended with neutral spirit (Jaganathan & Dugar, 1999).
(c). BrandyThe production of brandy has been reviewed (Ströhmer, 2002). Brandies are typi-
cally derived from distilled wine. Traditional products include the French ‘cognac’ and ‘armagnac’, the Spanish ‘brandy de Jerez’ and the German ‘Weinbrand’. European leg-islation prescribes that brandy must be produced from wine spirit (the term ‘brandy’ may not be used for other products such as fruit spirits). Brandies must be matured for at least 1 year in oak receptacles or for at least 6 months in oak casks with a capacity of less than 1000 L. They must contain a quantity of volatile substances (other than ethanol and methanol) that is equal to or exceeds 125 g/hL pure alcohol and derived exclusively from the distillation or redistillation of the raw materials used. The maxi-mum methanol content is 200 g/hL pure alcohol. The minimum alcoholic strength of brandy is 36% vol (European Council, 1989).
The volatile composition of brandy differs according to the region of origin. In all brandies, acetaldehyde, 1,1-diethoxyethan and furfural are the main carbonyl com-pounds, amyl alcohols, isobutanol, propanol-1 and methanol are the major alcohols and ethyl acetate and ethyl lactate are the major esters. German brandies showed a larger variation in their volatile composition than cognac and armagnac. Brandies usually contain a larger amount of volatile substances than that legally required of about 500 g/hL pure alcohol (Postel & Adam, 1982c). The amounts of ethyl ester vary widely, depending on the different raw materials used and the technology applied.
92 IARC MONOGRAPHS VOLUME 96
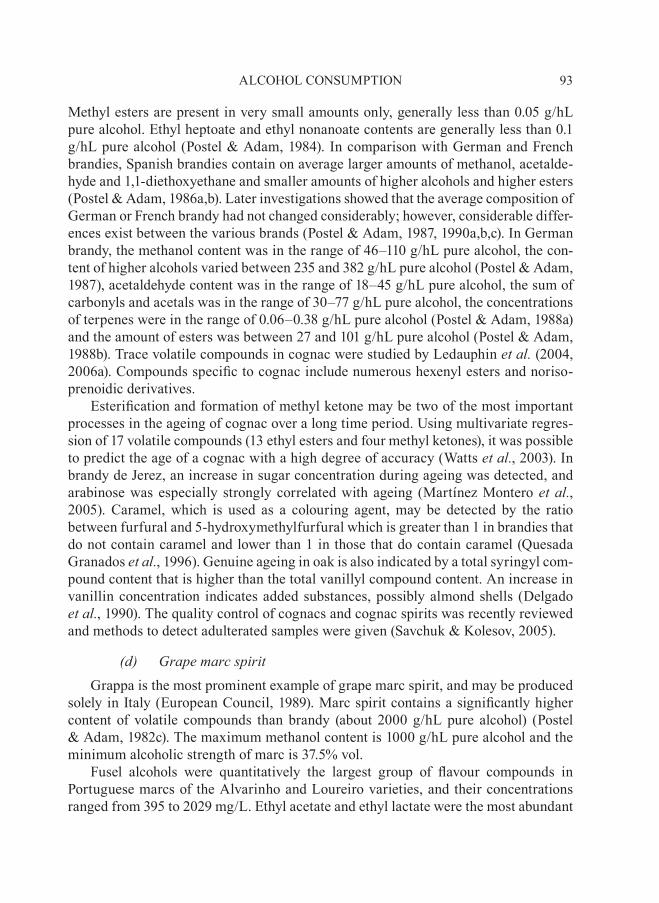
Methyl esters are present in very small amounts only, generally less than 0.05 g/hL pure alcohol. Ethyl heptoate and ethyl nonanoate contents are generally less than 0.1 g/hL pure alcohol (Postel & Adam, 1984). In comparison with German and French brandies, Spanish brandies contain on average larger amounts of methanol, acetalde-hyde and 1,1-diethoxyethane and smaller amounts of higher alcohols and higher esters (Postel & Adam, 1986a,b). Later investigations showed that the average composition of German or French brandy had not changed considerably; however, considerable differ-ences exist between the various brands (Postel & Adam, 1987, 1990a,b,c). In German brandy, the methanol content was in the range of 46–110 g/hL pure alcohol, the con-tent of higher alcohols varied between 235 and 382 g/hL pure alcohol (Postel & Adam, 1987), acetaldehyde content was in the range of 18–45 g/hL pure alcohol, the sum of carbonyls and acetals was in the range of 30–77 g/hL pure alcohol, the concentrations of terpenes were in the range of 0.06–0.38 g/hL pure alcohol (Postel & Adam, 1988a) and the amount of esters was between 27 and 101 g/hL pure alcohol (Postel & Adam, 1988b). Trace volatile compounds in cognac were studied by Ledauphin et.al . (2004, 2006a). Compounds specific to cognac include numerous hexenyl esters and noriso-prenoidic derivatives.
Esterification and formation of methyl ketone may be two of the most important processes in the ageing of cognac over a long time period. Using multivariate regres-sion of 17 volatile compounds (13 ethyl esters and four methyl ketones), it was possible to predict the age of a cognac with a high degree of accuracy (Watts et.al ., 2003). In brandy de Jerez, an increase in sugar concentration during ageing was detected, and arabinose was especially strongly correlated with ageing (Martínez Montero et.al ., 2005). Caramel, which is used as a colouring agent, may be detected by the ratio between furfural and 5-hydroxymethylfurfural which is greater than 1 in brandies that do not contain caramel and lower than 1 in those that do contain caramel (Quesada Granados et.al ., 1996). Genuine ageing in oak is also indicated by a total syringyl com-pound content that is higher than the total vanillyl compound content. An increase in vanillin concentration indicates added substances, possibly almond shells (Delgado et.al ., 1990). The quality control of cognacs and cognac spirits was recently reviewed and methods to detect adulterated samples were given (Savchuk & Kolesov, 2005).
(d). grape.marc.spiritGrappa is the most prominent example of grape marc spirit, and may be produced
solely in Italy (European Council, 1989). Marc spirit contains a significantly higher content of volatile compounds than brandy (about 2000 g/hL pure alcohol) (Postel & Adam, 1982c). The maximum methanol content is 1000 g/hL pure alcohol and the minimum alcoholic strength of marc is 37.5% vol.
Fusel alcohols were quantitatively the largest group of flavour compounds in Portuguese marcs of the Alvarinho and Loureiro varieties, and their concentrations ranged from 395 to 2029 mg/L. Ethyl acetate and ethyl lactate were the most abundant
93ALCOHOL CONSUMPTION
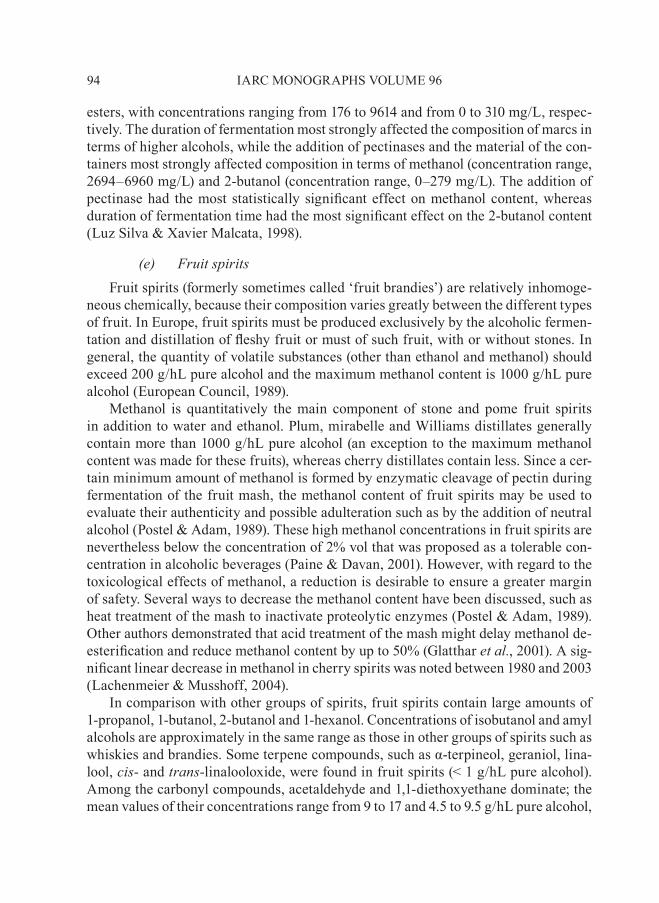
esters, with concentrations ranging from 176 to 9614 and from 0 to 310 mg/L, respec-tively. The duration of fermentation most strongly affected the composition of marcs in terms of higher alcohols, while the addition of pectinases and the material of the con-tainers most strongly affected composition in terms of methanol (concentration range, 2694–6960 mg/L) and 2-butanol (concentration range, 0–279 mg/L). The addition of pectinase had the most statistically significant effect on methanol content, whereas duration of fermentation time had the most significant effect on the 2-butanol content (Luz Silva & xavier Malcata, 1998).
(e). Fruit.spiritsFruit spirits (formerly sometimes called ‘fruit brandies’) are relatively inhomoge-
neous chemically, because their composition varies greatly between the different types of fruit. In Europe, fruit spirits must be produced exclusively by the alcoholic fermen-tation and distillation of fleshy fruit or must of such fruit, with or without stones. In general, the quantity of volatile substances (other than ethanol and methanol) should exceed 200 g/hL pure alcohol and the maximum methanol content is 1000 g/hL pure alcohol (European Council, 1989).
Methanol is quantitatively the main component of stone and pome fruit spirits in addition to water and ethanol. Plum, mirabelle and Williams distillates generally contain more than 1000 g/hL pure alcohol (an exception to the maximum methanol content was made for these fruits), whereas cherry distillates contain less. Since a cer-tain minimum amount of methanol is formed by enzymatic cleavage of pectin during fermentation of the fruit mash, the methanol content of fruit spirits may be used to evaluate their authenticity and possible adulteration such as by the addition of neutral alcohol (Postel & Adam, 1989). These high methanol concentrations in fruit spirits are nevertheless below the concentration of 2% vol that was proposed as a tolerable con-centration in alcoholic beverages (Paine & Davan, 2001). However, with regard to the toxicological effects of methanol, a reduction is desirable to ensure a greater margin of safety. Several ways to decrease the methanol content have been discussed, such as heat treatment of the mash to inactivate proteolytic enzymes (Postel & Adam, 1989). Other authors demonstrated that acid treatment of the mash might delay methanol de-esterification and reduce methanol content by up to 50% (Glatthar et.al ., 2001). A sig-nificant linear decrease in methanol in cherry spirits was noted between 1980 and 2003 (Lachenmeier & Musshoff, 2004).
In comparison with other groups of spirits, fruit spirits contain large amounts of 1-propanol, 1-butanol, 2-butanol and 1-hexanol. Concentrations of isobutanol and amyl alcohols are approximately in the same range as those in other groups of spirits such as whiskies and brandies. Some terpene compounds, such as α-terpineol, geraniol, lina-lool, cis- and trans-linalooloxide, were found in fruit spirits (< 1 g/hL pure alcohol). Among the carbonyl compounds, acetaldehyde and 1,1-diethoxyethane dominate; the mean values of their concentrations range from 9 to 17 and 4.5 to 9.5 g/hL pure alcohol,
94 IARC MONOGRAPHS VOLUME 96
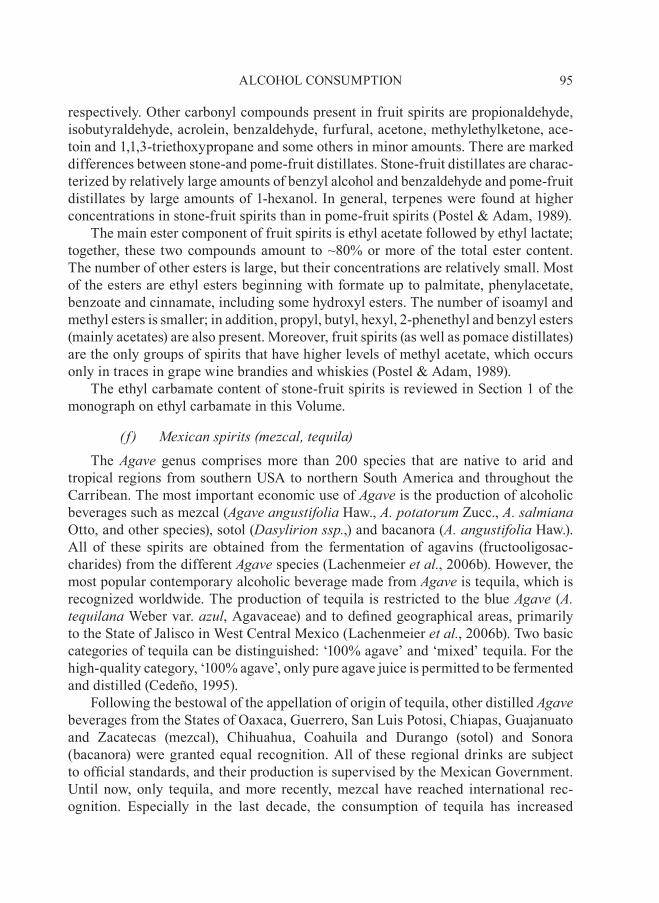
respectively. Other carbonyl compounds present in fruit spirits are propionaldehyde, isobutyraldehyde, acrolein, benzaldehyde, furfural, acetone, methylethylketone, ace-toin and 1,1,3-triethoxypropane and some others in minor amounts. There are marked differences between stone-and pome-fruit distillates. Stone-fruit distillates are charac-terized by relatively large amounts of benzyl alcohol and benzaldehyde and pome-fruit distillates by large amounts of 1-hexanol. In general, terpenes were found at higher concentrations in stone-fruit spirits than in pome-fruit spirits (Postel & Adam, 1989).
The main ester component of fruit spirits is ethyl acetate followed by ethyl lactate; together, these two compounds amount to ~80% or more of the total ester content. The number of other esters is large, but their concentrations are relatively small. Most of the esters are ethyl esters beginning with formate up to palmitate, phenylacetate, benzoate and cinnamate, including some hydroxyl esters. The number of isoamyl and methyl esters is smaller; in addition, propyl, butyl, hexyl, 2-phenethyl and benzyl esters (mainly acetates) are also present. Moreover, fruit spirits (as well as pomace distillates) are the only groups of spirits that have higher levels of methyl acetate, which occurs only in traces in grape wine brandies and whiskies (Postel & Adam, 1989).
The ethyl carbamate content of stone-fruit spirits is reviewed in Section 1 of the monograph on ethyl carbamate in this Volume.
( f ). Mexican.spirits.(mezcal,.tequila)The agave genus comprises more than 200 species that are native to arid and
tropical regions from southern USA to northern South America and throughout the Carribean. The most important economic use of agave is the production of alcoholic beverages such as mezcal (agave.angustifolia Haw., a ..potatorum Zucc., a ..salmiana Otto, and other species), sotol (Dasylirion.ssp .,) and bacanora (a ..angustifolia Haw.). All of these spirits are obtained from the fermentation of agavins (fructooligosac-charides) from the different agave species (Lachenmeier et.al ., 2006b). However, the most popular contemporary alcoholic beverage made from agave is tequila, which is recognized worldwide. The production of tequila is restricted to the blue agave (a ..tequilana Weber var. azul, Agavaceae) and to defined geographical areas, primarily to the State of Jalisco in West Central Mexico (Lachenmeier et.al ., 2006b). Two basic categories of tequila can be distinguished: ‘100% agave’ and ‘mixed’ tequila. For the high-quality category, ‘100% agave’, only pure agave juice is permitted to be fermented and distilled (Cedeño, 1995).
Following the bestowal of the appellation of origin of tequila, other distilled agave beverages from the States of Oaxaca, Guerrero, San Luis Potosi, Chiapas, Guajanuato and Zacatecas (mezcal), Chihuahua, Coahuila and Durango (sotol) and Sonora (bacanora) were granted equal recognition. All of these regional drinks are subject to official standards, and their production is supervised by the Mexican Government. Until now, only tequila, and more recently, mezcal have reached international rec-ognition. Especially in the last decade, the consumption of tequila has increased
95ALCOHOL CONSUMPTION
tremendously worldwide. Tequila and mezcal are protected under the North American Free Trade Agreement and an agreement between the European Union and the United Mexican States on the mutual recognition and protection of designations for spirit drinks (Lachenmeier et.al ., 2006b).
Due to their production from plant material that contains oxalate, all agave spir-its contain significant concentrations of this compound (0.1–9.7 mg/L). The composi-tion of Mexican agave spirits was found to vary over a relatively large range. The two tequila categories (‘100% agave’ and ‘mixed’) showed differences in concentrations of methanol, 2-/3-methyl-1-butanol and 2-phenylethanol, with lower concentrations in the ‘mixed’ category (Lachenmeier et.al ., 2006b).
Quantitative differences in ethyl esters were found in tequila depending on the duration of ageing. Ethyl hexadecanoate and octadecanoate were the most abundant ethyl esters in all tequila types; Añejo (extra aged) tequila presented the highest con-centration of ethyl esters (Vallejo-Cordoba et. al ., 2004). Isovaleraldehyde, isoamyl alcohol, β-damascenone, 2-phenylethanol and vanillin were the most powerful odour-ants of tequila from a range of 175 components identified (Benn & Peppard, 1996). The most potent odourants were: phenylethanol and phenylethyl acetate in Blanco tequila; phenylethanol, phenylethyl acetate and vanillin in Reposado (aged) tequila; and phe-nylethanol, vanillin and an unknown substance in Añejo tequila (López & Dufour, 2001).
Considerably higher concentrations of 2-furaldehyde and 5-methylfuraldehyde were found in tequilas than in brandies. Furthermore, 100% agave tequilas contained higher levels of these two compounds (mean values, 18.6 and 5.97 mg/L, respectively) than the mixed brands (mean values, 6.46 and 3.30 mg/L). The profile of furanic alde-hydes depends on the type of fructans contained in the raw material and also on heat treatment before fermentation. In contrast to other polysaccharides, inulin hydrolyses at elevated temperature and the contribution of Maillard browning reactions increases the production of furanic compounds (Munoz-Rodriguez et.al ., 2005).
Saturated alcohols, ethyl acetate, ethyl 2-hydroxypropanoate and acetic acid are the major compounds in mezcal produced from a ..salmiana. Minor compounds in mez-cal include other alcohols, aldehydes, ketones, large-chain ethyl esters, organic acids, furans, terpenes, alkenes and alkynes. Most of the compounds found in mezcals are similar to those present in tequilas and other alcoholic beverages. However, mezcals contain unique compounds such as limonene and pentyl butanoate, which can be used as markers for the authenticity of mezcal produced from a ..salmiana . Mezcals (but not tequilas) are sometimes conditioned with one to four larvae of Agave worms. Only mezcals with worms contained the compounds 6,9-pentadecadien-1-ol, 3-hexen-1-ol, 1,8-nonadiene and 1-dodecine. Thus, it may be possible that these unsaturated com-pounds come from the larvae (De León-Rodríguez et.al ., 2006).
96 IARC MONOGRAPHS VOLUME 96
(g). Wood.maturation.of.distilled.beveragesA wide range of distilled beverages, including whisky and cognac, are matured for
many years in oak barrels. Other spirits, such as rum, cachaça, tequila and fruit spirits, are also often matured in oak. During maturation, a range of physical and chemical interactions take place between the barrel, the surrounding atmosphere and the matur-ing spirit which transform both the flavour and composition of the drink. The effects and time required for maturation are highly variable and are influenced by a wide range of factors, particularly the type of barrel used (Mosedale & Puech, 1998). Wood age-ing is the most probable source of phenols and furans in distilled spirits. Ellagic acid was the phenol present at the highest concentration in 12 categories of spirit. Moderate amounts of syringaldehyde, syringic acid and gallic acid, as well as lesser amounts of vanillin and vanillic acid, were measurable in most samples of whisky, brandy and rum. 5-Hydroxymethylfurfural was the predominant furan, notably in cognac, fol-lowed by 2-furaldehyde. Beverages that are subjected to wood ageing also contain sig-nificant antioxidant activity, the level of which is between the ranges observed in white and red wines. Highest total antioxidant values were exhibited in armagnac, cognac and bourbon whiskey, and no antioxidants were found in rum, vodka, gin and miscel-laneous spirits, correlating with low or undetectable phenol concentrations in these spirits (Goldberg et.al ., 1999).
(h). VodkaVodka is a spirit beverage produced by rectifying ethanol of agricultural origin or
filtering it through activated charcoal, possibly followed by straightforward distillation or an equivalent treatment. This selectively reduces the organoleptic characteristics of the raw materials. Flavouring may be added to give the product special organoleptic characteristics, such as a mellow taste (European Council, 1989). The raw spirit put through rectification is usually produced from grain (rye and wheat) and potatoes. In the production of vodka, the quality of the water used is of the utmost importance. For premium vodka brands, demineralized water is filtered through activated carbon to absorb unwanted organic and inorganic materials.
The contents of anions in Russian vodkas usually lie in the ranges of 0.5–10 mg/L chloride, 0.5–3.5 mg/L nitrate, 3.5–30 mg/L sulfate and < 0.1 mg/L phosphate (Obrezkov et.al ., 1997). Vodkas bottled in Germany were found to contain significantly higher amounts of anions (up to 147.6 mg/L) (Lachenmeier et.al ., 2003).
Since vodkas are manufactured in such a way that they have no distinctive aroma or taste, residual congeners are present at levels much lower than those found in other spirits that have various flavour characteristics. The congeners present at microgram per litre levels were isolated using solid-phase microextraction. Ethyl esters of C8–C18 fatty acids were detected and differentiation between Canadian and American vodkas was possible (Ng et.al ., 1996).
97ALCOHOL CONSUMPTION
(i). spirits.produced.from.neutral.alcoholIn contrast to spirits such as whisky or brandy, which are manufactured by fer-
mentation and retain the organoleptic properties of the raw materials, a range of spirits is manufactured using highly rectified alcohol (so-called ‘neutral alcohol’ or ‘ethanol of agricultural origin’). The European requirements for neutral alcohol are shown in Table 1.10. Neutral alcohol contains significantly lower concentrations of volatile con-stituents than the spirits discussed previously (e.g. whisky, rum, brandy). However, the composition of vodka is relatively similar to that of neutral alcohol. The typical com-ponents and flavour characteristics of spirits manufactured from neutral alcohol derive from other materials and not from the alcohol or fermentation products.
A prominent type of a spirit manufactured from neutral alcohol is gin. The most popular is London Dry Gin. It belongs to the ‘distilled gin’ class in European legisla-tion and is produced by redistillation of neutral alcohol in the presence of juniper ber-ries (Juniperus.communis) and other natural ingredients (European Council, 1989). Gin was found to contain over 70 components (mainly mono- and sesquiterpenic com-pounds) (Vichi et.al ., 2005).
Most liqueurs are also produced by mixing neutral alcohol with sugars and a wide range of plant extracts or fruit juices. For example, Italian lemon liqueurs (Limoncello) are obtained by alcoholic extraction of essential oils from lemon peel and dilution with sugar syrup. The liqueur, therefore, shows a composition similar to lemon essential oil with a high content of β-pinene, myrcene, trans-α-bergamottene and β-bisabolene (Versari et al., 2003). Another example is traditional walnut liqueur that contains phe-nolic compounds extracted from walnut husks (Stampar et.al ., 2006).
98 IARC MONOGRAPHS VOLUME 96
table 1.10 Properties of neutral alcohol in europe
Alcoholic strength >96.0% volTotal acidity (expressed as acetic acid) <1.5 g/hL pure alcoholEsters (expressed as ethyl acetate) <1.3 g/hL pure alcoholAldehydes (expressed as acetaldehyde) <0.5 g/hL pure alcoholHigher alcohols (expressed as 2-methyl-1-propanol) <0.5 g/hL pure alcoholMethanol <50 g/hL pure alcohola
Dry extract <1.5 g/hL pure alcoholVolatile bases that contain nitrogen (expressed as nitrogen) <0.1 g/hL pure alcoholFurfural Not detectable
From European Council (1989) a The methanol content of commercial neutral alcohol is usually significantly below the limit of 50 g/hL pure alcohol.
1.6.5. Compounds.in.other.alcoholic.beverages
(a). Cider.(apple.wine)Cider is an alcoholic beverage made from apples and has very different characteris-
tics according to the origin of the fruit and methods of production. French cider (Breton and Norman) has a low alcohol content and contains significant residual unfermented sugar. German cider, mostly from the state of Hessen, is fully fermented and very dry. Spanish (mostly Asturian) cider is characterized by a high volatile acidity and by its foaming characteristics when served. Modern English ciders are for the most part char-acterized by light flavours, which arise from chaptalization with glucose syrup before fermentation to give high-alcohol apple wines, which are then diluted with water and sweetener before retailing (Lea, 2004).
The differences between English, French and German ciders are compared in Table 1.11.
The standard German ‘apple wine’ should have an alcoholic strength of 7.0% vol, a total dry extract of 25 g/L, a sugar content of 2 g/L, a pH of 3.1, a volatile acidity of 0.5 g/L, a glycerine content of 4.7 g/L, a potassium content of 1100 mg/L, a magne-sium content of 60 mg/L, a calcium content of 60 mg/L and a copper content of 0.3 mg/L (Scholten, 1992).
French ciders can be classified according to their residual sugar content into ‘brut’ (< 28 g/L of residual sugar), ‘demi-sec’ (28–42 g/L of residual sugar) and ‘doux’ (< 3% vol alcohol and > 35 g/L of residual sugar) (Anon., 1992).
During the fermentation of apple juice, organic acids undergo several changes. It was shown that concentrations of malic and citric acid decrease, while those of lactic and succinic acid increase (Blanco Gomis et.al ., 1988).
99ALCOHOL CONSUMPTION
table 1.11 Differences in the composition of ciders from england, France and Germany
english cider French cidre German Apfelwein
Alcoholic strength 1.2–8.5% vol >1.5% vol >5% volSugar-free extract >13 g/L >16 g/L >18 g/LVolatile acidity <1.4 g/L <1 g/L <1 g/LSulfur dioxide <200 mg/L <175 mg/L <300 mg/LRaw materials Apple juice,
concentrate, glucose syrup, water
Apple juice, concentrate (up to 50%)
Apple juice, concentrate, certain amounts of sugar
Additives Organic acids, sugars, sweeteners, colours, sorbic acid
Organic acids, sugars, colours
Lactic acid (<3 g/L), sugar (<10 g/L), caramel sugar, sorbic acid
From Anon. (1992)
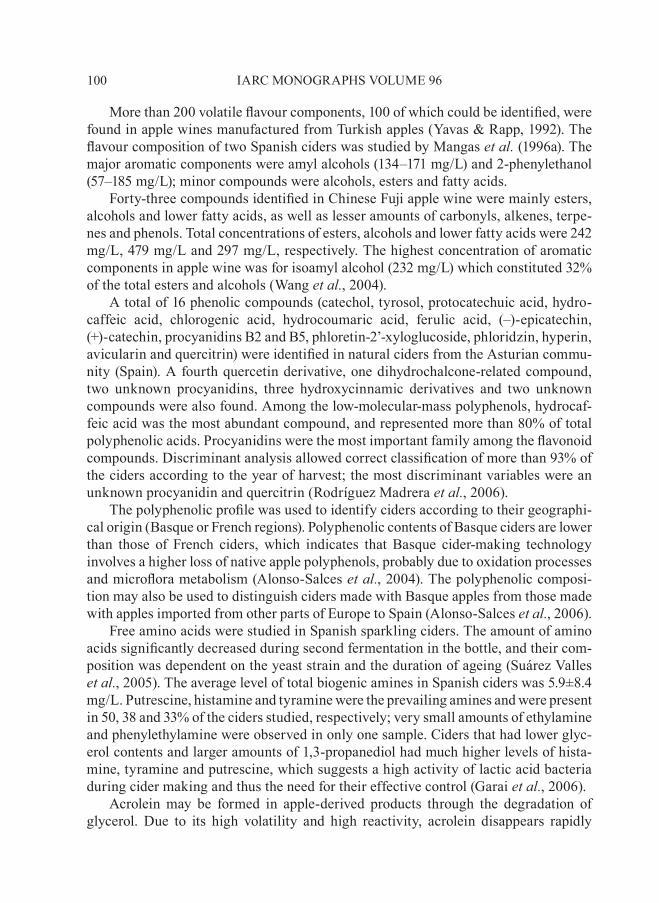
More than 200 volatile flavour components, 100 of which could be identified, were found in apple wines manufactured from Turkish apples (Yavas & Rapp, 1992). The flavour composition of two Spanish ciders was studied by Mangas et.al . (1996a). The major aromatic components were amyl alcohols (134–171 mg/L) and 2-phenylethanol (57–185 mg/L); minor compounds were alcohols, esters and fatty acids.
Forty-three compounds identified in Chinese Fuji apple wine were mainly esters, alcohols and lower fatty acids, as well as lesser amounts of carbonyls, alkenes, terpe-nes and phenols. Total concentrations of esters, alcohols and lower fatty acids were 242 mg/L, 479 mg/L and 297 mg/L, respectively. The highest concentration of aromatic components in apple wine was for isoamyl alcohol (232 mg/L) which constituted 32% of the total esters and alcohols (Wang et.al ., 2004).
A total of 16 phenolic compounds (catechol, tyrosol, protocatechuic acid, hydro-caffeic acid, chlorogenic acid, hydrocoumaric acid, ferulic acid, (–)-epicatechin, (+)-catechin, procyanidins B2 and B5, phloretin-2’-xyloglucoside, phloridzin, hyperin, avicularin and quercitrin) were identified in natural ciders from the Asturian commu-nity (Spain). A fourth quercetin derivative, one dihydrochalcone-related compound, two unknown procyanidins, three hydroxycinnamic derivatives and two unknown compounds were also found. Among the low-molecular-mass polyphenols, hydrocaf-feic acid was the most abundant compound, and represented more than 80% of total polyphenolic acids. Procyanidins were the most important family among the flavonoid compounds. Discriminant analysis allowed correct classification of more than 93% of the ciders according to the year of harvest; the most discriminant variables were an unknown procyanidin and quercitrin (Rodríguez Madrera et.al ., 2006).
The polyphenolic profile was used to identify ciders according to their geographi-cal origin (Basque or French regions). Polyphenolic contents of Basque ciders are lower than those of French ciders, which indicates that Basque cider-making technology involves a higher loss of native apple polyphenols, probably due to oxidation processes and microflora metabolism (Alonso-Salces et.al ., 2004). The polyphenolic composi-tion may also be used to distinguish ciders made with Basque apples from those made with apples imported from other parts of Europe to Spain (Alonso-Salces et.al ., 2006).
Free amino acids were studied in Spanish sparkling ciders. The amount of amino acids significantly decreased during second fermentation in the bottle, and their com-position was dependent on the yeast strain and the duration of ageing (Suárez Valles et.al ., 2005). The average level of total biogenic amines in Spanish ciders was 5.9±8.4 mg/L. Putrescine, histamine and tyramine were the prevailing amines and were present in 50, 38 and 33% of the ciders studied, respectively; very small amounts of ethylamine and phenylethylamine were observed in only one sample. Ciders that had lower glyc-erol contents and larger amounts of 1,3-propanediol had much higher levels of hista-mine, tyramine and putrescine, which suggests a high activity of lactic acid bacteria during cider making and thus the need for their effective control (Garai et.al ., 2006).
Acrolein may be formed in apple-derived products through the degradation of glycerol. Due to its high volatility and high reactivity, acrolein disappears rapidly
100 IARC MONOGRAPHS VOLUME 96
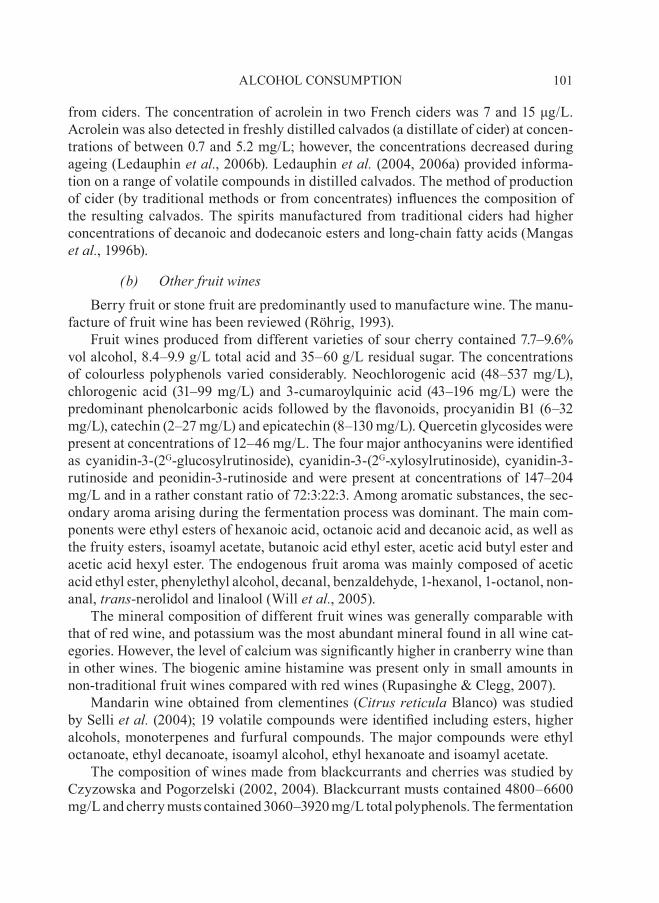
from ciders. The concentration of acrolein in two French ciders was 7 and 15 μg/L. Acrolein was also detected in freshly distilled calvados (a distillate of cider) at concen-trations of between 0.7 and 5.2 mg/L; however, the concentrations decreased during ageing (Ledauphin et.al ., 2006b). Ledauphin et.al . (2004, 2006a) provided informa-tion on a range of volatile compounds in distilled calvados. The method of production of cider (by traditional methods or from concentrates) influences the composition of the resulting calvados. The spirits manufactured from traditional ciders had higher concentrations of decanoic and dodecanoic esters and long-chain fatty acids (Mangas et.al ., 1996b).
(b). other.fruit.winesBerry fruit or stone fruit are predominantly used to manufacture wine. The manu-
facture of fruit wine has been reviewed (Röhrig, 1993).Fruit wines produced from different varieties of sour cherry contained 7.7–9.6%
vol alcohol, 8.4–9.9 g/L total acid and 35–60 g/L residual sugar. The concentrations of colourless polyphenols varied considerably. Neochlorogenic acid (48–537 mg/L), chlorogenic acid (31–99 mg/L) and 3-cumaroylquinic acid (43–196 mg/L) were the predominant phenolcarbonic acids followed by the flavonoids, procyanidin B1 (6–32 mg/L), catechin (2–27 mg/L) and epicatechin (8–130 mg/L). Quercetin glycosides were present at concentrations of 12–46 mg/L. The four major anthocyanins were identified as cyanidin-3-(2G-glucosylrutinoside), cyanidin-3-(2G-xylosylrutinoside), cyanidin-3-rutinoside and peonidin-3-rutinoside and were present at concentrations of 147–204 mg/L and in a rather constant ratio of 72:3:22:3. Among aromatic substances, the sec-ondary aroma arising during the fermentation process was dominant. The main com-ponents were ethyl esters of hexanoic acid, octanoic acid and decanoic acid, as well as the fruity esters, isoamyl acetate, butanoic acid ethyl ester, acetic acid butyl ester and acetic acid hexyl ester. The endogenous fruit aroma was mainly composed of acetic acid ethyl ester, phenylethyl alcohol, decanal, benzaldehyde, 1-hexanol, 1-octanol, non-anal, trans-nerolidol and linalool (Will et.al ., 2005).
The mineral composition of different fruit wines was generally comparable with that of red wine, and potassium was the most abundant mineral found in all wine cat-egories. However, the level of calcium was significantly higher in cranberry wine than in other wines. The biogenic amine histamine was present only in small amounts in non-traditional fruit wines compared with red wines (Rupasinghe & Clegg, 2007).
Mandarin wine obtained from clementines (Citrus.reticula Blanco) was studied by Selli et.al . (2004); 19 volatile compounds were identified including esters, higher alcohols, monoterpenes and furfural compounds. The major compounds were ethyl octanoate, ethyl decanoate, isoamyl alcohol, ethyl hexanoate and isoamyl acetate.
The composition of wines made from blackcurrants and cherries was studied by Czyzowska and Pogorzelski (2002, 2004). Blackcurrant musts contained 4800–6600 mg/L and cherry musts contained 3060–3920 mg/L total polyphenols. The fermentation
101ALCOHOL CONSUMPTION
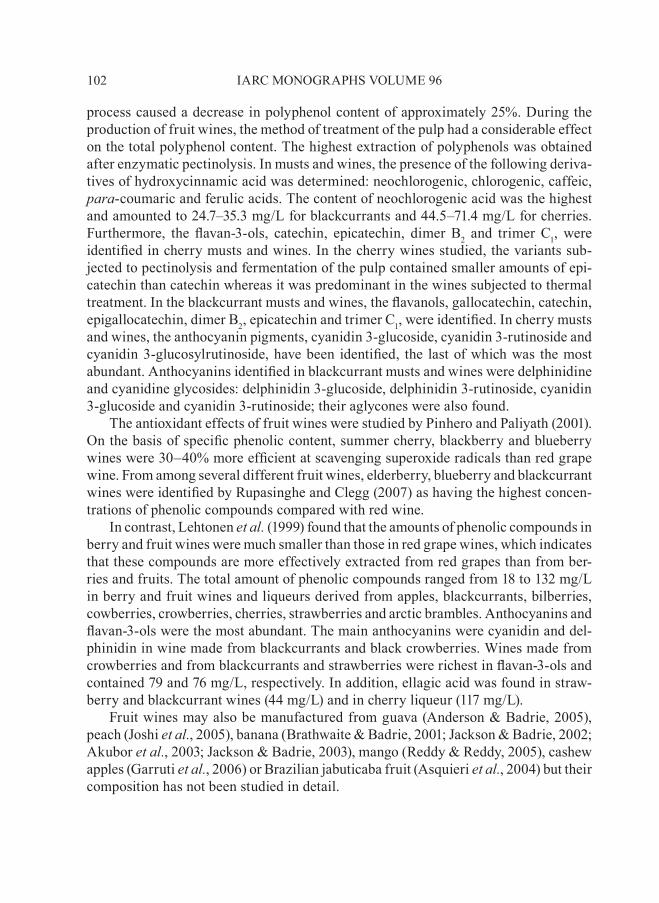
process caused a decrease in polyphenol content of approximately 25%. During the production of fruit wines, the method of treatment of the pulp had a considerable effect on the total polyphenol content. The highest extraction of polyphenols was obtained after enzymatic pectinolysis. In musts and wines, the presence of the following deriva-tives of hydroxycinnamic acid was determined: neochlorogenic, chlorogenic, caffeic, para-coumaric and ferulic acids. The content of neochlorogenic acid was the highest and amounted to 24.7–35.3 mg/L for blackcurrants and 44.5–71.4 mg/L for cherries. Furthermore, the flavan-3-ols, catechin, epicatechin, dimer B2 and trimer C1, were identified in cherry musts and wines. In the cherry wines studied, the variants sub-jected to pectinolysis and fermentation of the pulp contained smaller amounts of epi-catechin than catechin whereas it was predominant in the wines subjected to thermal treatment. In the blackcurrant musts and wines, the flavanols, gallocatechin, catechin, epigallocatechin, dimer B2, epicatechin and trimer C1, were identified. In cherry musts and wines, the anthocyanin pigments, cyanidin 3-glucoside, cyanidin 3-rutinoside and cyanidin 3-glucosylrutinoside, have been identified, the last of which was the most abundant. Anthocyanins identified in blackcurrant musts and wines were delphinidine and cyanidine glycosides: delphinidin 3-glucoside, delphinidin 3-rutinoside, cyanidin 3-glucoside and cyanidin 3-rutinoside; their aglycones were also found.
The antioxidant effects of fruit wines were studied by Pinhero and Paliyath (2001). On the basis of specific phenolic content, summer cherry, blackberry and blueberry wines were 30–40% more efficient at scavenging superoxide radicals than red grape wine. From among several different fruit wines, elderberry, blueberry and blackcurrant wines were identified by Rupasinghe and Clegg (2007) as having the highest concen-trations of phenolic compounds compared with red wine.
In contrast, Lehtonen et.al . (1999) found that the amounts of phenolic compounds in berry and fruit wines were much smaller than those in red grape wines, which indicates that these compounds are more effectively extracted from red grapes than from ber-ries and fruits. The total amount of phenolic compounds ranged from 18 to 132 mg/L in berry and fruit wines and liqueurs derived from apples, blackcurrants, bilberries, cowberries, crowberries, cherries, strawberries and arctic brambles. Anthocyanins and flavan-3-ols were the most abundant. The main anthocyanins were cyanidin and del-phinidin in wine made from blackcurrants and black crowberries. Wines made from crowberries and from blackcurrants and strawberries were richest in flavan-3-ols and contained 79 and 76 mg/L, respectively. In addition, ellagic acid was found in straw-berry and blackcurrant wines (44 mg/L) and in cherry liqueur (117 mg/L).
Fruit wines may also be manufactured from guava (Anderson & Badrie, 2005), peach (Joshi et.al ., 2005), banana (Brathwaite & Badrie, 2001; Jackson & Badrie, 2002; Akubor et.al ., 2003; Jackson & Badrie, 2003), mango (Reddy & Reddy, 2005), cashew apples (Garruti et.al ., 2006) or Brazilian jabuticaba fruit (Asquieri et.al ., 2004) but their composition has not been studied in detail.
102 IARC MONOGRAPHS VOLUME 96
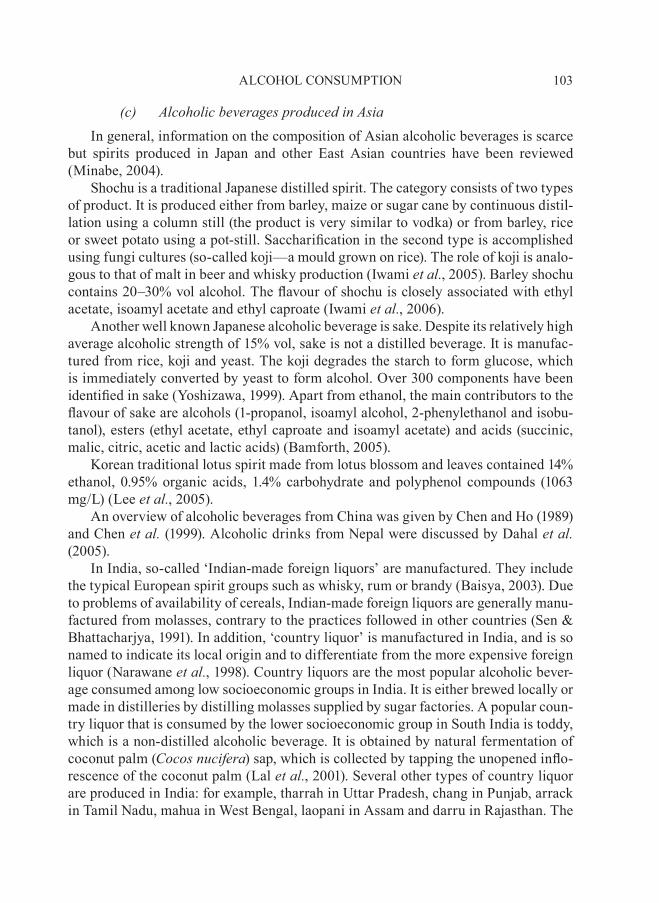
(c). alcoholic.beverages.produced.in.asiaIn general, information on the composition of Asian alcoholic beverages is scarce
but spirits produced in Japan and other East Asian countries have been reviewed (Minabe, 2004).
Shochu is a traditional Japanese distilled spirit. The category consists of two types of product. It is produced either from barley, maize or sugar cane by continuous distil-lation using a column still (the product is very similar to vodka) or from barley, rice or sweet potato using a pot-still. Saccharification in the second type is accomplished using fungi cultures (so-called koji—a mould grown on rice). The role of koji is analo-gous to that of malt in beer and whisky production (Iwami et.al ., 2005). Barley shochu contains 20–30% vol alcohol. The flavour of shochu is closely associated with ethyl acetate, isoamyl acetate and ethyl caproate (Iwami et.al ., 2006).
Another well known Japanese alcoholic beverage is sake. Despite its relatively high average alcoholic strength of 15% vol, sake is not a distilled beverage. It is manufac-tured from rice, koji and yeast. The koji degrades the starch to form glucose, which is immediately converted by yeast to form alcohol. Over 300 components have been identified in sake (Yoshizawa, 1999). Apart from ethanol, the main contributors to the flavour of sake are alcohols (1-propanol, isoamyl alcohol, 2-phenylethanol and isobu-tanol), esters (ethyl acetate, ethyl caproate and isoamyl acetate) and acids (succinic, malic, citric, acetic and lactic acids) (Bamforth, 2005).
Korean traditional lotus spirit made from lotus blossom and leaves contained 14% ethanol, 0.95% organic acids, 1.4% carbohydrate and polyphenol compounds (1063 mg/L) (Lee et.al ., 2005).
An overview of alcoholic beverages from China was given by Chen and Ho (1989) and Chen et.al . (1999). Alcoholic drinks from Nepal were discussed by Dahal et.al . (2005).
In India, so-called ‘Indian-made foreign liquors’ are manufactured. They include the typical European spirit groups such as whisky, rum or brandy (Baisya, 2003). Due to problems of availability of cereals, Indian-made foreign liquors are generally manu-factured from molasses, contrary to the practices followed in other countries (Sen & Bhattacharjya, 1991). In addition, ‘country liquor’ is manufactured in India, and is so named to indicate its local origin and to differentiate from the more expensive foreign liquor (Narawane et.al ., 1998). Country liquors are the most popular alcoholic bever-age consumed among low socioeconomic groups in India. It is either brewed locally or made in distilleries by distilling molasses supplied by sugar factories. A popular coun-try liquor that is consumed by the lower socioeconomic group in South India is toddy, which is a non-distilled alcoholic beverage. It is obtained by natural fermentation of coconut palm (Cocos.nucifera) sap, which is collected by tapping the unopened inflo-rescence of the coconut palm (Lal et.al ., 2001). Several other types of country liquor are produced in India: for example, tharrah in Uttar Pradesh, chang in Punjab, arrack in Tamil Nadu, mahua in West Bengal, laopani in Assam and darru in Rajasthan. The
103ALCOHOL CONSUMPTION
Bureau of Indian Standards had difficulty in identifying every type of country liquor and devising individual standards. However, requirements have been set for the three major types of distilled country liquor. Plain country liquor is an alcoholic distillate of fermented mash of different agricultural products (e.g. cereals, potatoes, fruit, coco-nut). Blended country liquor is a pot-still distillate, rectified spirit and/or neutral alco-hol. Spiced country liquor is plain or blended country liquor that is flavoured and/or coloured (Sen & Bhattacharjya, 1991).
(d). alcopopsAlcopops are also known as ‘ready-to-drink’ or ‘flavoured alcoholic beverages’;
they tend to be sweet, to be served in small bottles (typically 200–275 mL) and to con-tain between 5 and 7% vol alcohol.
In a recent study, the alcoholic strength of alcopops was in the range of 2.4–8% vol with an average of 4.7% vol. A significant deviation was detected in the volatile com-position of alcopops that contain beer, wine and spirits. Alcopops derived from wine alcohol showed concentrations of volatile compounds (especially methanol, 1-propa-nol and 2-/3-methylbutanol-1) that were 10–100 times higher than those in products derived from spirits. However, this study noted the variability in alcopop composition, and the possibility of changes in recipes has to be taken into consideration even if the brand name of a given product has not been changed (Lachenmeier et.al ., 2006c).
The recent practice of combined consumption of alcohol and so-called energy drinks has rapidly become popular. The main components of the marketed energy drinks are caffeine, taurine, carbohydrates, gluconolactone, inositol, niacin, pantenol and B-complex vitamins (Ferreira et.al ., 2006). The levels of taurine in such alcoholic energy drinks were recently determined and large variations were detected. Ready-mixed energy drinks with spirits contained 223–4325 mg/L taurine (median, 314 mg/L), energy drinks with beer contained 112–151 mg/L taurine (median, 151 mg/L) and energy drinks with wine contained 132–4868 mg/L taurine (median, 305 mg/L) (Triebel et.al ., 2007). However, valid scientific information on interactions between the ingredients of energy drinks (for example, taurine and caffeine) and alcohol was not available.
Another category of alcoholic beverages that is relatively similar to alcopops in their presentation is hemp beverages. Typical products are so-called hemp beers, which are flavoured with dried hemp (Cannabis) inflorescences, and hemp liqueurs. Δ9-Tetrahydrocannabinol, the main psychoactive substance found in the Cannabis plant, was not detected in hemp beers (Lachenmeier & Walch, 2005).
104 IARC MONOGRAPHS VOLUME 96
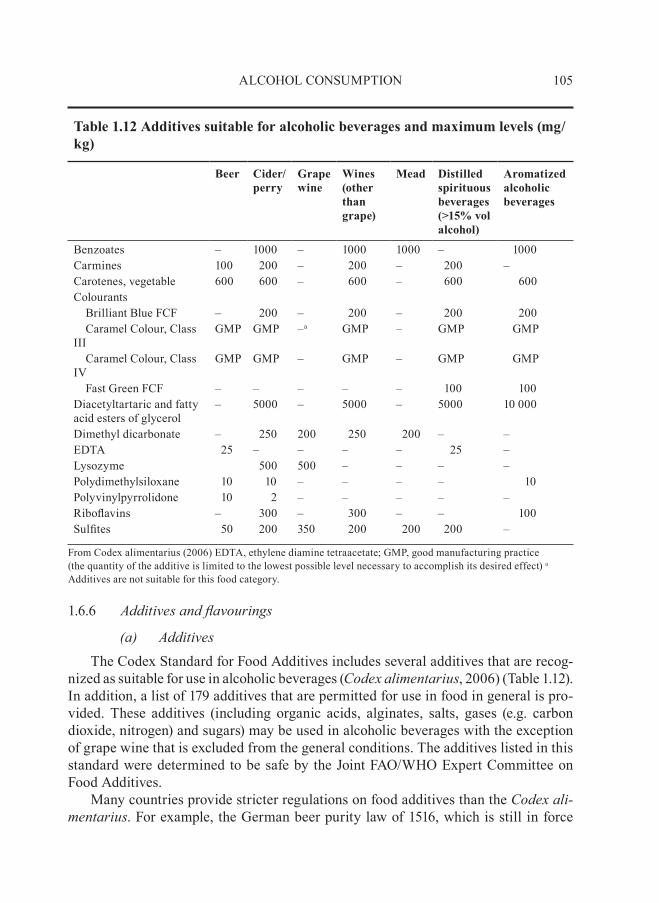
1.6.6. additives.and.flavourings
(a). additivesThe Codex Standard for Food Additives includes several additives that are recog-
nized as suitable for use in alcoholic beverages (Codex.alimentarius, 2006) (Table 1.12). In addition, a list of 179 additives that are permitted for use in food in general is pro-vided. These additives (including organic acids, alginates, salts, gases (e.g. carbon dioxide, nitrogen) and sugars) may be used in alcoholic beverages with the exception of grape wine that is excluded from the general conditions. The additives listed in this standard were determined to be safe by the Joint FAO/WHO Expert Committee on Food Additives.
Many countries provide stricter regulations on food additives than the Codex.ali-mentarius. For example, the German beer purity law of 1516, which is still in force
105ALCOHOL CONSUMPTION
table 1.12 Additives suitable for alcoholic beverages and maximum levels (mg/kg)
Beer Cider/ perry
Grape wine
Wines (other than grape)
Mead Distilled spirituous beverages (>15% vol alcohol)
Aromatized alcoholic beverages
Benzoates – 1000 – 1000 1000 – 1000Carmines 100 200 – 200 – 200 –Carotenes, vegetable 600 600 – 600 – 600 600Colourants Brilliant Blue FCF – 200 – 200 – 200 200 Caramel Colour, Class III
GMP GMP –a GMP – GMP GMP
Caramel Colour, Class IV
GMP GMP – GMP – GMP GMP
Fast Green FCF – – – – – 100 100Diacetyltartaric and fatty acid esters of glycerol
– 5000 – 5000 – 5000 10 000
Dimethyl dicarbonate – 250 200 250 200 – –EDTA 25 – – – – 25 –Lysozyme 500 500 – – – –Polydimethylsiloxane 10 10 – – – – 10Polyvinylpyrrolidone 10 2 – – – – –Riboflavins – 300 – 300 – – 100Sulfites 50 200 350 200 200 200 –
From Codex alimentarius (2006) EDTA, ethylene diamine tetraacetate; GMP, good manufacturing practice (the quantity of the additive is limited to the lowest possible level necessary to accomplish its desired effect) a Additives are not suitable for this food category.
106 IARC MONOGRAPHS VOLUME 96
today, states that only barley malt, hops, yeast and water are permitted in beer pro-duction (Donhauser, 1988). According to European law, no additives are permitted in most traditional spirits, e.g. rum, whisky, brandy, fruit spirits and many other types (European Council, 1989). In contrast, additives are regularly added to liqueurs (artifi-cial colourings) or alcopops (artificial colourings, preservatives). Some national regula-tions also permit the use of additives other than those listed by the Codex.alimentarius, e.g. a multitude of artificial colourings, sweeteners or further preservatives (e.g. sorbic acid). Caramel colouring is frequently used to ensure colour consistency of aged prod-ucts (Boscolo et.al ., 2002).
The most frequent additives in alcoholic beverages are sulfur dioxide and sulfites. Sulfite additives have been associated with allergic-like asthmatic responses in certain individuals (Vally & Thompson, 2003). For this reason, many countries require the labelling of sulfur dioxide and sulfites used as ingredients at concentrations of more than 10 mg/L (expressed as sulfur dioxide) (Lachenmeier & Nerlich, 2006).
In conjunction with added sulfite, natural sulfite may evolve in alcoholic beverages during fermentation by the metabolism of yeasts (Ilett, 1995).
Sulfite is a desirable component in beer because it has an antioxidative effect as a scavenger and binds to carbonyl compounds that cause a stale flavour. In contrast, during the early phases of fermentation, high concentrations of sulfite may cause an undesirable flavour (Guido, 2005). The formation of sulfite is strongly influenced by predisposition of the yeast and parameters that affect yeast growth during fermen-tation, such as the physiological state of the yeast and the availability of nutrients and oxygen (Wurzbacher et.al ., 2005). The average residual quantities of sulfur diox-ide were 7.5 mg/L in French beer and 25 mg/L in cider (Mareschi et.al ., 1992). In a recent study, the average concentrations expressed as sulfur dioxide were 4.2 mg/L for beer (195 samples) and 1.0 mg/L for spirits (101 samples). The concentrations of sulfite in spirits were found to be significantly lower than those in beer (p < 0.0001) (Lachenmeier & Nerlich, 2006).
Generally higher levels of sulfur dioxide were determined in wine than in spirits or beer. However, during the last decade, a decrease in the sulfite content of wine has been detected that is probably due to new technological processes that improve the stability of wine using a smaller quantity of sulfite (Leclercq et.al ., 2000). In a large survey of wines conducted in the 1980s, 3655 samples of Italian wine and 8061 sam-ples of French wine that were analysed had mean sulfite contents of 135 mg/L and 136 mg/L, respectively (Ough, 1986). In later studies, an average of 92 mg/L sulfite was determined in 85 samples of wine in Italy (Leclercq et.al ., 2000), whereas in France, the mean concentrations were 75 mg/L (Mareschi et.al ., 1992).
(b). FlavouringsThe Codex.alimentarius (1987) provides general requirements for natural flavour-
ings. Some flavourings contain biologically active substances for which maximum
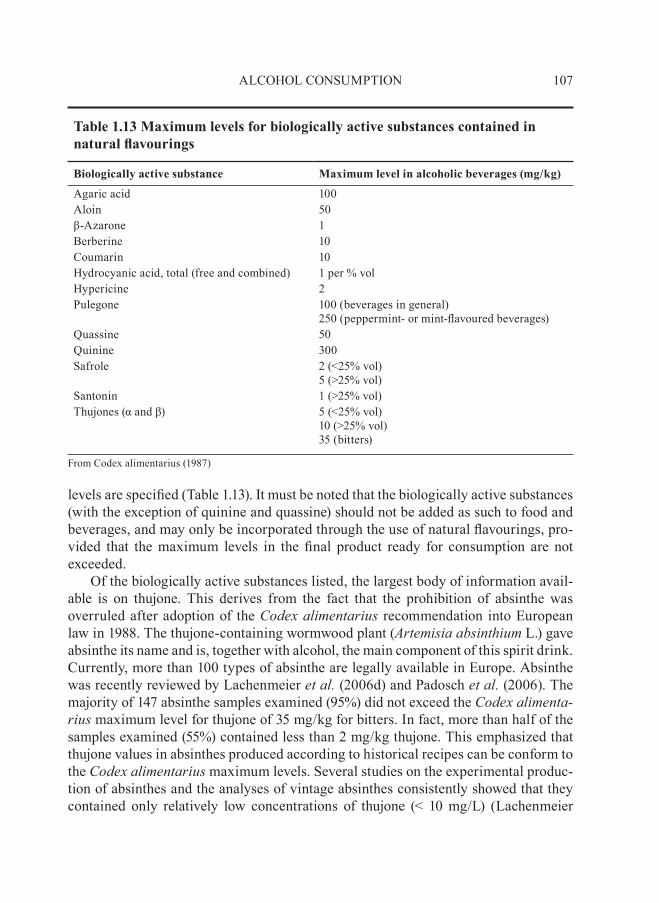
107ALCOHOL CONSUMPTION
levels are specified (Table 1.13). It must be noted that the biologically active substances (with the exception of quinine and quassine) should not be added as such to food and beverages, and may only be incorporated through the use of natural flavourings, pro-vided that the maximum levels in the final product ready for consumption are not exceeded.
Of the biologically active substances listed, the largest body of information avail-able is on thujone. This derives from the fact that the prohibition of absinthe was overruled after adoption of the Codex.alimentarius recommendation into European law in 1988. The thujone-containing wormwood plant (artemisia.absinthium L.) gave absinthe its name and is, together with alcohol, the main component of this spirit drink. Currently, more than 100 types of absinthe are legally available in Europe. Absinthe was recently reviewed by Lachenmeier et.al . (2006d) and Padosch et.al . (2006). The majority of 147 absinthe samples examined (95%) did not exceed the Codex.alimenta-rius maximum level for thujone of 35 mg/kg for bitters. In fact, more than half of the samples examined (55%) contained less than 2 mg/kg thujone. This emphasized that thujone values in absinthes produced according to historical recipes can be conform to the Codex.alimentarius maximum levels. Several studies on the experimental produc-tion of absinthes and the analyses of vintage absinthes consistently showed that they contained only relatively low concentrations of thujone (< 10 mg/L) (Lachenmeier
table 1.13 Maximum levels for biologically active substances contained in natural flavourings
Biologically active substance Maximum level in alcoholic beverages (mg/kg)
Agaric acid 100Aloin 50β-Azarone 1Berberine 10Coumarin 10Hydrocyanic acid, total (free and combined) 1 per % volHypericine 2Pulegone 100 (beverages in general)
250 (peppermint- or mint-flavoured beverages)Quassine 50Quinine 300Safrole 2 (<25% vol)
5 (>25% vol)Santonin 1 (>25% vol)Thujones (α and β) 5 (<25% vol)
10 (>25% vol) 35 (bitters)
From Codex alimentarius (1987)
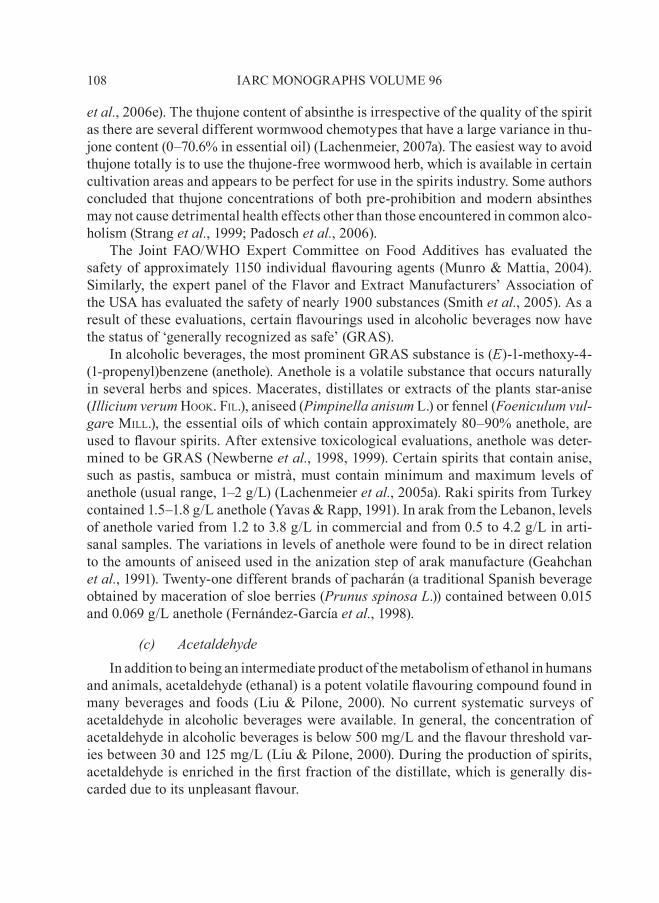
108 IARC MONOGRAPHS VOLUME 96
et.al ., 2006e). The thujone content of absinthe is irrespective of the quality of the spirit as there are several different wormwood chemotypes that have a large variance in thu-jone content (0–70.6% in essential oil) (Lachenmeier, 2007a). The easiest way to avoid thujone totally is to use the thujone-free wormwood herb, which is available in certain cultivation areas and appears to be perfect for use in the spirits industry. Some authors concluded that thujone concentrations of both pre-prohibition and modern absinthes may not cause detrimental health effects other than those encountered in common alco-holism (Strang et.al ., 1999; Padosch et.al ., 2006).
The Joint FAO/WHO Expert Committee on Food Additives has evaluated the safety of approximately 1150 individual flavouring agents (Munro & Mattia, 2004). Similarly, the expert panel of the Flavor and Extract Manufacturers’ Association of the USA has evaluated the safety of nearly 1900 substances (Smith et.al ., 2005). As a result of these evaluations, certain flavourings used in alcoholic beverages now have the status of ‘generally recognized as safe’ (GRAS).
In alcoholic beverages, the most prominent GRAS substance is (E)-1-methoxy-4-(1-propenyl)benzene (anethole). Anethole is a volatile substance that occurs naturally in several herbs and spices. Macerates, distillates or extracts of the plants star-anise (Illicium.verum Hook. Fil.), aniseed (pimpinella.anisum L.) or fennel (Foeniculum.vul-gare Mill.), the essential oils of which contain approximately 80–90% anethole, are used to flavour spirits. After extensive toxicological evaluations, anethole was deter-mined to be GRAS (Newberne et.al ., 1998, 1999). Certain spirits that contain anise, such as pastis, sambuca or mistrà, must contain minimum and maximum levels of anethole (usual range, 1–2 g/L) (Lachenmeier et.al ., 2005a). Raki spirits from Turkey contained 1.5–1.8 g/L anethole (Yavas & Rapp, 1991). In arak from the Lebanon, levels of anethole varied from 1.2 to 3.8 g/L in commercial and from 0.5 to 4.2 g/L in arti-sanal samples. The variations in levels of anethole were found to be in direct relation to the amounts of aniseed used in the anization step of arak manufacture (Geahchan et.al ., 1991). Twenty-one different brands of pacharán (a traditional Spanish beverage obtained by maceration of sloe berries (prunus.spinosa.L.)) contained between 0.015 and 0.069 g/L anethole (Fernández-García et.al ., 1998).
(c). acetaldehydeIn addition to being an intermediate product of the metabolism of ethanol in humans
and animals, acetaldehyde (ethanal) is a potent volatile flavouring compound found in many beverages and foods (Liu & Pilone, 2000). No current systematic surveys of acetaldehyde in alcoholic beverages were available. In general, the concentration of acetaldehyde in alcoholic beverages is below 500 mg/L and the flavour threshold var-ies between 30 and 125 mg/L (Liu & Pilone, 2000). During the production of spirits, acetaldehyde is enriched in the first fraction of the distillate, which is generally dis-carded due to its unpleasant flavour.
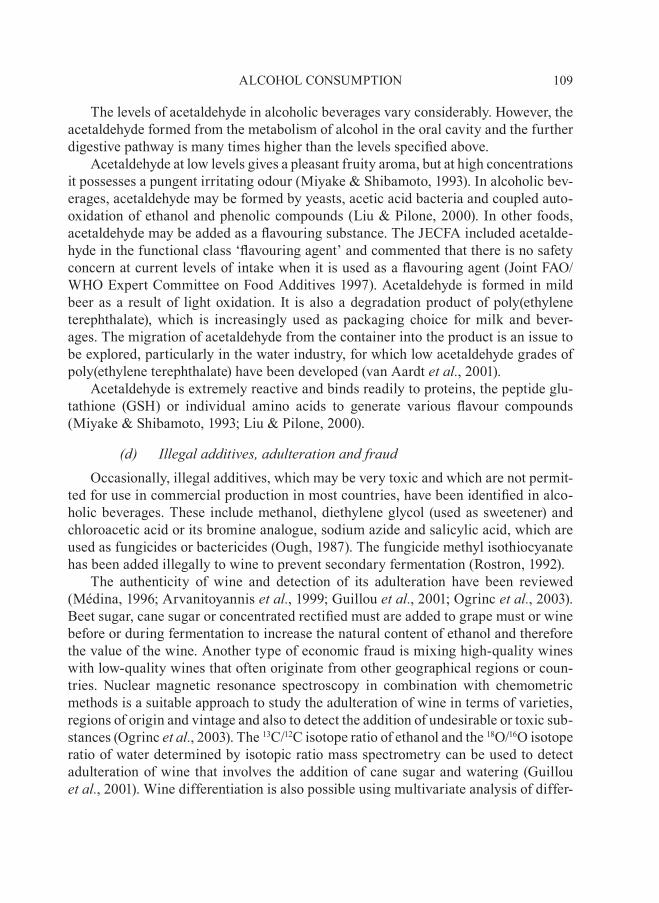
109ALCOHOL CONSUMPTION
The levels of acetaldehyde in alcoholic beverages vary considerably. However, the acetaldehyde formed from the metabolism of alcohol in the oral cavity and the further digestive pathway is many times higher than the levels specified above.
Acetaldehyde at low levels gives a pleasant fruity aroma, but at high concentrations it possesses a pungent irritating odour (Miyake & Shibamoto, 1993). In alcoholic bev-erages, acetaldehyde may be formed by yeasts, acetic acid bacteria and coupled auto-oxidation of ethanol and phenolic compounds (Liu & Pilone, 2000). In other foods, acetaldehyde may be added as a flavouring substance. The JECFA included acetalde-hyde in the functional class ‘flavouring agent’ and commented that there is no safety concern at current levels of intake when it is used as a flavouring agent (Joint FAO/WHO Expert Committee on Food Additives 1997). Acetaldehyde is formed in mild beer as a result of light oxidation. It is also a degradation product of poly(ethylene terephthalate), which is increasingly used as packaging choice for milk and bever-ages. The migration of acetaldehyde from the container into the product is an issue to be explored, particularly in the water industry, for which low acetaldehyde grades of poly(ethylene terephthalate) have been developed (van Aardt et.al ., 2001).
Acetaldehyde is extremely reactive and binds readily to proteins, the peptide glu-tathione (GSH) or individual amino acids to generate various flavour compounds (Miyake & Shibamoto, 1993; Liu & Pilone, 2000).
(d). Illegal.additives,.adulteration.and.fraudOccasionally, illegal additives, which may be very toxic and which are not permit-
ted for use in commercial production in most countries, have been identified in alco-holic beverages. These include methanol, diethylene glycol (used as sweetener) and chloroacetic acid or its bromine analogue, sodium azide and salicylic acid, which are used as fungicides or bactericides (Ough, 1987). The fungicide methyl isothiocyanate has been added illegally to wine to prevent secondary fermentation (Rostron, 1992).
The authenticity of wine and detection of its adulteration have been reviewed (Médina, 1996; Arvanitoyannis et.al ., 1999; Guillou et.al ., 2001; Ogrinc et.al ., 2003). Beet sugar, cane sugar or concentrated rectified must are added to grape must or wine before or during fermentation to increase the natural content of ethanol and therefore the value of the wine. Another type of economic fraud is mixing high-quality wines with low-quality wines that often originate from other geographical regions or coun-tries. Nuclear magnetic resonance spectroscopy in combination with chemometric methods is a suitable approach to study the adulteration of wine in terms of varieties, regions of origin and vintage and also to detect the addition of undesirable or toxic sub-stances (Ogrinc et.al ., 2003). The 13C/12C isotope ratio of ethanol and the 18O/16O isotope ratio of water determined by isotopic ratio mass spectrometry can be used to detect adulteration of wine that involves the addition of cane sugar and watering (Guillou et.al ., 2001). Wine differentiation is also possible using multivariate analysis of differ-
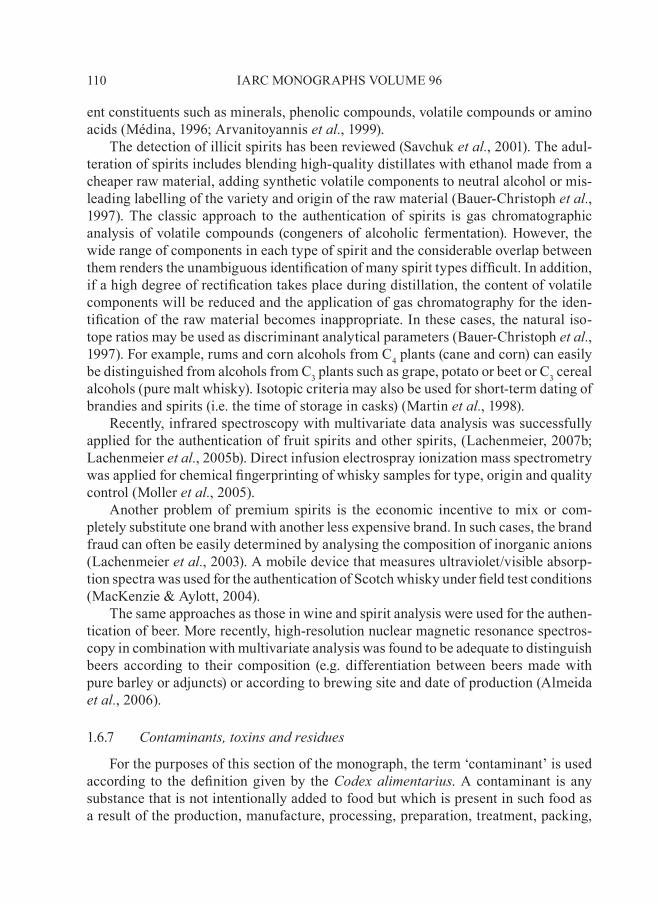
110 IARC MONOGRAPHS VOLUME 96
ent constituents such as minerals, phenolic compounds, volatile compounds or amino acids (Médina, 1996; Arvanitoyannis et.al ., 1999).
The detection of illicit spirits has been reviewed (Savchuk et.al ., 2001). The adul-teration of spirits includes blending high-quality distillates with ethanol made from a cheaper raw material, adding synthetic volatile components to neutral alcohol or mis-leading labelling of the variety and origin of the raw material (Bauer-Christoph et.al ., 1997). The classic approach to the authentication of spirits is gas chromatographic analysis of volatile compounds (congeners of alcoholic fermentation). However, the wide range of components in each type of spirit and the considerable overlap between them renders the unambiguous identification of many spirit types difficult. In addition, if a high degree of rectification takes place during distillation, the content of volatile components will be reduced and the application of gas chromatography for the iden-tification of the raw material becomes inappropriate. In these cases, the natural iso-tope ratios may be used as discriminant analytical parameters (Bauer-Christoph et.al ., 1997). For example, rums and corn alcohols from C4 plants (cane and corn) can easily be distinguished from alcohols from C3 plants such as grape, potato or beet or C3 cereal alcohols (pure malt whisky). Isotopic criteria may also be used for short-term dating of brandies and spirits (i.e. the time of storage in casks) (Martin et.al ., 1998).
Recently, infrared spectroscopy with multivariate data analysis was successfully applied for the authentication of fruit spirits and other spirits, (Lachenmeier, 2007b; Lachenmeier et.al ., 2005b). Direct infusion electrospray ionization mass spectrometry was applied for chemical fingerprinting of whisky samples for type, origin and quality control (Moller et.al ., 2005).
Another problem of premium spirits is the economic incentive to mix or com-pletely substitute one brand with another less expensive brand. In such cases, the brand fraud can often be easily determined by analysing the composition of inorganic anions (Lachenmeier et.al ., 2003). A mobile device that measures ultraviolet/visible absorp-tion spectra was used for the authentication of Scotch whisky under field test conditions (MacKenzie & Aylott, 2004).
The same approaches as those in wine and spirit analysis were used for the authen-tication of beer. More recently, high-resolution nuclear magnetic resonance spectros-copy in combination with multivariate analysis was found to be adequate to distinguish beers according to their composition (e.g. differentiation between beers made with pure barley or adjuncts) or according to brewing site and date of production (Almeida et.al ., 2006).
1.6.7. Contaminants,.toxins.and.residues
For the purposes of this section of the monograph, the term ‘contaminant’ is used according to the definition given by the Codex.alimentarius. A contaminant is any substance that is not intentionally added to food but which is present in such food as a result of the production, manufacture, processing, preparation, treatment, packing,
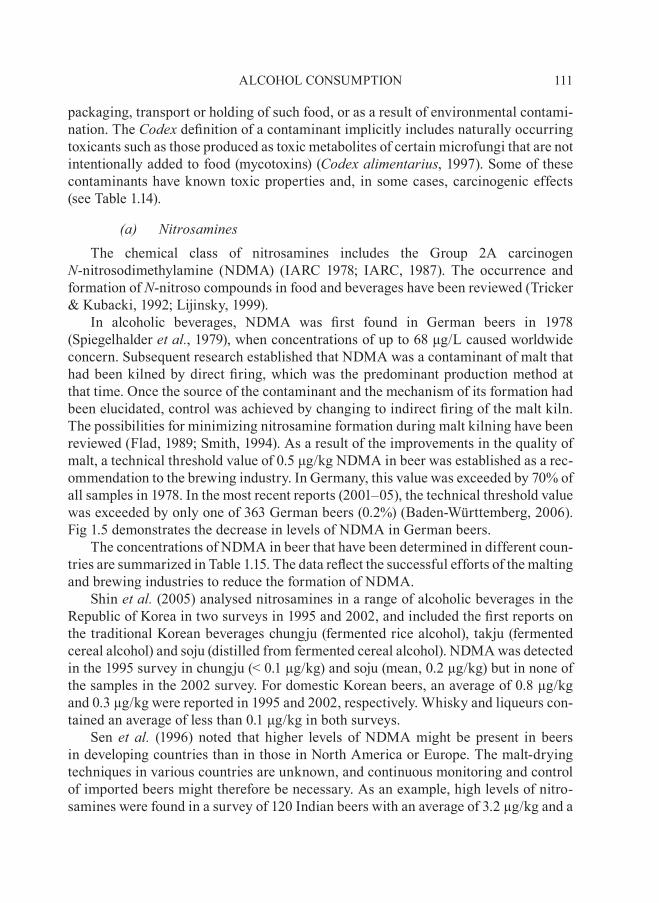
111ALCOHOL CONSUMPTION
packaging, transport or holding of such food, or as a result of environmental contami-nation. The Codex definition of a contaminant implicitly includes naturally occurring toxicants such as those produced as toxic metabolites of certain microfungi that are not intentionally added to food (mycotoxins) (Codex.alimentarius, 1997). Some of these contaminants have known toxic properties and, in some cases, carcinogenic effects (see Table 1.14).
(a). nitrosaminesThe chemical class of nitrosamines includes the Group 2A carcinogen
n-nitrosodimethylamine (NDMA) (IARC 1978; IARC, 1987). The occurrence and formation of n-nitroso compounds in food and beverages have been reviewed (Tricker & Kubacki, 1992; Lijinsky, 1999).
In alcoholic beverages, NDMA was first found in German beers in 1978 (Spiegelhalder et.al ., 1979), when concentrations of up to 68 μg/L caused worldwide concern. Subsequent research established that NDMA was a contaminant of malt that had been kilned by direct firing, which was the predominant production method at that time. Once the source of the contaminant and the mechanism of its formation had been elucidated, control was achieved by changing to indirect firing of the malt kiln. The possibilities for minimizing nitrosamine formation during malt kilning have been reviewed (Flad, 1989; Smith, 1994). As a result of the improvements in the quality of malt, a technical threshold value of 0.5 μg/kg NDMA in beer was established as a rec-ommendation to the brewing industry. In Germany, this value was exceeded by 70% of all samples in 1978. In the most recent reports (2001–05), the technical threshold value was exceeded by only one of 363 German beers (0.2%) (Baden-Württemberg, 2006). Fig 1.5 demonstrates the decrease in levels of NDMA in German beers.
The concentrations of NDMA in beer that have been determined in different coun-tries are summarized in Table 1.15. The data reflect the successful efforts of the malting and brewing industries to reduce the formation of NDMA.
Shin et.al . (2005) analysed nitrosamines in a range of alcoholic beverages in the Republic of Korea in two surveys in 1995 and 2002, and included the first reports on the traditional Korean beverages chungju (fermented rice alcohol), takju (fermented cereal alcohol) and soju (distilled from fermented cereal alcohol). NDMA was detected in the 1995 survey in chungju (< 0.1 µg/kg) and soju (mean, 0.2 µg/kg) but in none of the samples in the 2002 survey. For domestic Korean beers, an average of 0.8 µg/kg and 0.3 µg/kg were reported in 1995 and 2002, respectively. Whisky and liqueurs con-tained an average of less than 0.1 μg/kg in both surveys.
Sen et. al . (1996) noted that higher levels of NDMA might be present in beers in developing countries than in those in North America or Europe. The malt-drying techniques in various countries are unknown, and continuous monitoring and control of imported beers might therefore be necessary. As an example, high levels of nitro-samines were found in a survey of 120 Indian beers with an average of 3.2 µg/kg and a
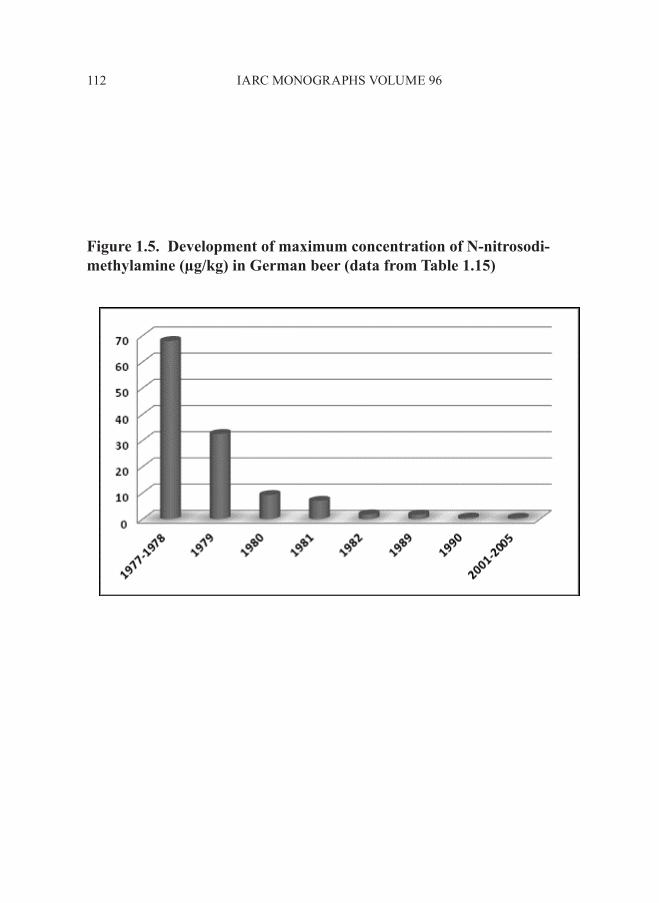
IARC MONOGRAPHS VOLUME 96112
Figure 1.5. Development of maximum concentration of N-nitrosodi-methylamine (µg/kg) in German beer (data from table 1.15)

maximum of 24.7 µg/kg (Prasad & Krishnaswamy, 1994). [The Working Group noted the lack of data on nitrosamine contents of beer in developing countries.]
In a single study, volatile n-nitrosamines in mixed beverages containing beer (e.g. beer-cola, shandy) were reported. The contents were below 0.3 μg/kg in all samples. The formation of nitrosamines that might arise due to the low pH value of these bever-ages was not detected (Fritz et.al ., 1998).
Tricker and Preussmann (1991) reviewed food surveys on NDMA. Dietary intake of NDMA was approximately 0.5 µg/day or less in most countries, which is about one-third of the intake in 1979–80. Previously, beer was the major source of NDMA in human nutrition (65% contribution). In 1990, beer was estimated to contribute to about 31% of total NDMA intake.
113ALCOHOL CONSUMPTION
table 1.14 Summary of carcinogens that may be present in alcoholic beverages
Agent Amount in alcoholic beveragesa
IarC.Monographs evaluation of carcinogenicity
IarC.Monographs volume, year
In animals In humans IARC group
Acetaldehyde Lower mg/L range
Sufficient Inadequate 2B 71, 1999
Acrylamide Beer; <10 µg/kg Sufficient Inadequate 2A 60, 1994Aflatoxins Beer (Table 1.22) Sufficient Sufficient 1 56, 82, 2002Arsenic (Table 1.25) Sufficient Sufficient 1 84, 2004Benzene (no sufficient
data)Sufficient Sufficient 1 Suppl. 7,
1987Cadmium (Table 1.24) Sufficient Sufficient 1 58, 1993Deoxynivalenol Beer (Table 1.19) Inadequate Inadequate 3 56, 1993Ethanol (2–80% vol) Inadequate Sufficient 1 44, 96, 2010Ethyl carbamate (urethane)
See monograph in this volume
Sufficient Inadequate 2A 7, 96, 2010
Furan Beer; <20 µg/kg Sufficient Inadequate 2B 63, 1995Lead (Table 1.23) Sufficient Limited 2A 87, 2006n-Nitrosodimethylamine Beer: <0.5 µg/kg
(Table 1.16)Sufficient Inadequate 2A Suppl. 7,
1987Nivalenol Beer (Table 1.20) Inadequate Inadequate 3 56, 1993Ochratoxin A Wine, beer
(Table 1.17)Sufficient Inadequate 2B 56, 1993
Organolead compounds Wine; limited data
Inadequate Inadequate 3 87, 2006
Patulin Apple cider Inadequate Inadequate 3 Suppl. 7, 1987
a Most carcinogens are contained at very different concentration ranges depending on the origin and different production technologies, so that no average concentration can be derived.
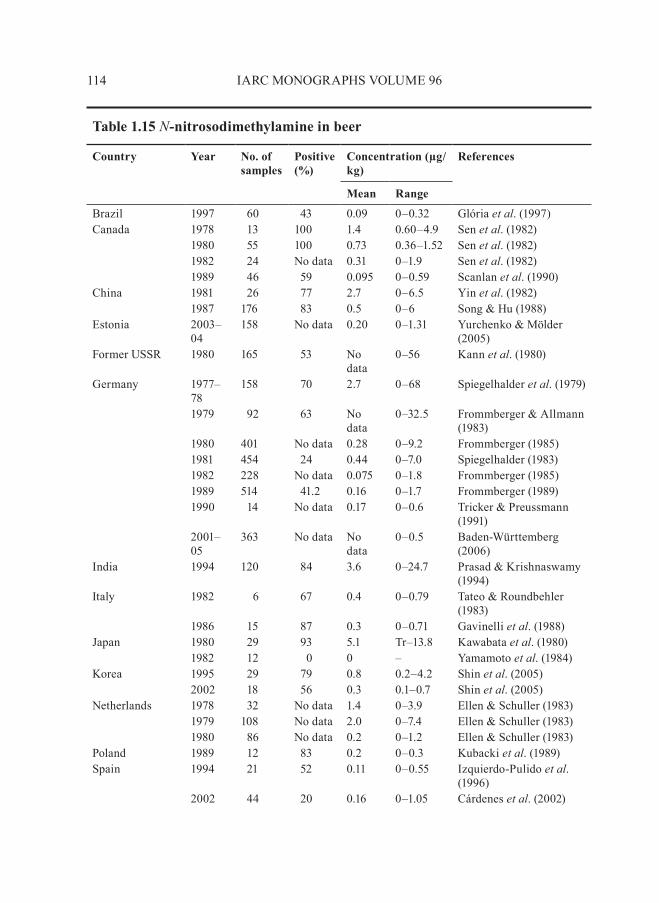
114 IARC MONOGRAPHS VOLUME 96
table 1.15 n-nitrosodimethylamine in beer
Country Year No. of samples
Positive(%)
Concentration (µg/kg)
References
Mean Range
Brazil 1997 60 43 0.09 0–0.32 Glória et.al. (1997) Canada 1978 13 100 1.4 0.60–4.9 Sen et.al. (1982)
1980 55 100 0.73 0.36–1.52 Sen et.al. (1982)1982 24 No data 0.31 0–1.9 Sen et.al. (1982)1989 46 59 0.095 0–0.59 Scanlan et.al. (1990)
China 1981 26 77 2.7 0–6.5 Yin et.al. (1982) 1987 176 83 0.5 0–6 Song & Hu (1988)
Estonia 2003–04
158 No data 0.20 0–1.31 Yurchenko & Mölder (2005)
Former USSR 1980 165 53 No data
0–56 Kann et.al. (1980)
Germany 1977–78
158 70 2.7 0–68 Spiegelhalder et.al. (1979)
1979 92 63 No data
0–32.5 Frommberger & Allmann (1983)
1980 401 No data 0.28 0–9.2 Frommberger (1985) 1981 454 24 0.44 0–7.0 Spiegelhalder (1983) 1982 228 No data 0.075 0–1.8 Frommberger (1985) 1989 514 41.2 0.16 0–1.7 Frommberger (1989) 1990 14 No data 0.17 0–0.6 Tricker & Preussmann
(1991)2001–05
363 No data No data
0–0.5 Baden-Württemberg (2006)
India 1994 120 84 3.6 0–24.7 Prasad & Krishnaswamy (1994)
Italy 1982 6 67 0.4 0–0.79 Tateo & Roundbehler (1983)
1986 15 87 0.3 0–0.71 Gavinelli et.al. (1988) Japan 1980 29 93 5.1 Tr–13.8 Kawabata et.al. (1980)
1982 12 0 0 – Yamamoto et.al. (1984) Korea 1995 29 79 0.8 0.2–4.2 Shin et.al. (2005)
2002 18 56 0.3 0.1–0.7 Shin et.al. (2005)Netherlands 1978 32 No data 1.4 0–3.9 Ellen & Schuller (1983)
1979 108 No data 2.0 0–7.4 Ellen & Schuller (1983)1980 86 No data 0.2 0–1.2 Ellen & Schuller (1983)
Poland 1989 12 83 0.2 0–0.3 Kubacki et.al. (1989) Spain 1994 21 52 0.11 0–0.55 Izquierdo-Pulido et.al.
(1996) 2002 44 20 0.16 0–1.05 Cárdenes et.al. (2002)
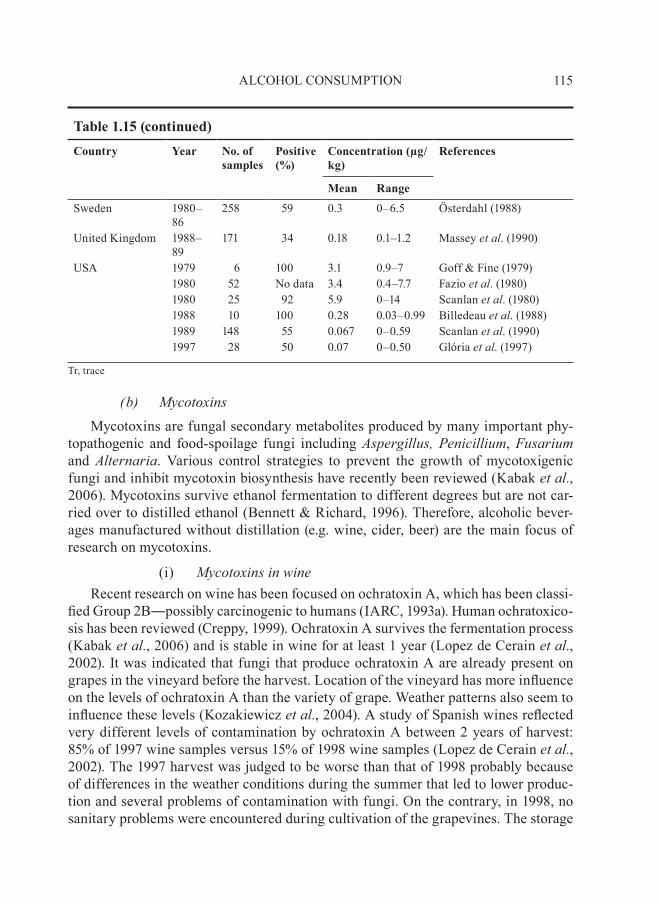
(b). MycotoxinsMycotoxins are fungal secondary metabolites produced by many important phy-
topathogenic and food-spoilage fungi including aspergillus,.penicillium, Fusarium and alternaria. Various control strategies to prevent the growth of mycotoxigenic fungi and inhibit mycotoxin biosynthesis have recently been reviewed (Kabak et.al ., 2006). Mycotoxins survive ethanol fermentation to different degrees but are not car-ried over to distilled ethanol (Bennett & Richard, 1996). Therefore, alcoholic bever-ages manufactured without distillation (e.g. wine, cider, beer) are the main focus of research on mycotoxins.
(i). Mycotoxins.in.wineRecent research on wine has been focused on ochratoxin A, which has been classi-
fied Group 2B―possibly carcinogenic to humans (IARC, 1993a). Human ochratoxico-sis has been reviewed (Creppy, 1999). Ochratoxin A survives the fermentation process (Kabak et.al ., 2006) and is stable in wine for at least 1 year (Lopez de Cerain et.al ., 2002). It was indicated that fungi that produce ochratoxin A are already present on grapes in the vineyard before the harvest. Location of the vineyard has more influence on the levels of ochratoxin A than the variety of grape. Weather patterns also seem to influence these levels (Kozakiewicz et.al ., 2004). A study of Spanish wines reflected very different levels of contamination by ochratoxin A between 2 years of harvest: 85% of 1997 wine samples versus 15% of 1998 wine samples (Lopez de Cerain et.al ., 2002). The 1997 harvest was judged to be worse than that of 1998 probably because of differences in the weather conditions during the summer that led to lower produc-tion and several problems of contamination with fungi. On the contrary, in 1998, no sanitary problems were encountered during cultivation of the grapevines. The storage
115ALCOHOL CONSUMPTION
Country Year No. of samples
Positive(%)
Concentration (µg/kg)
References
Mean Range
Sweden 1980–86
258 59 0.3 0–6.5 Österdahl (1988)
United Kingdom 1988–89
171 34 0.18 0.1–1.2 Massey et.al. (1990)
USA 1979 6 100 3.1 0.9–7 Goff & Fine (1979) 1980 52 No data 3.4 0.4–7.7 Fazio et.al. (1980) 1980 25 92 5.9 0–14 Scanlan et.al. (1980) 1988 10 100 0.28 0.03–0.99 Billedeau et.al. (1988) 1989 148 55 0.067 0–0.59 Scanlan et.al. (1990) 1997 28 50 0.07 0–0.50 Glória et.al. (1997)
Tr, trace
table 1.15 (continued)
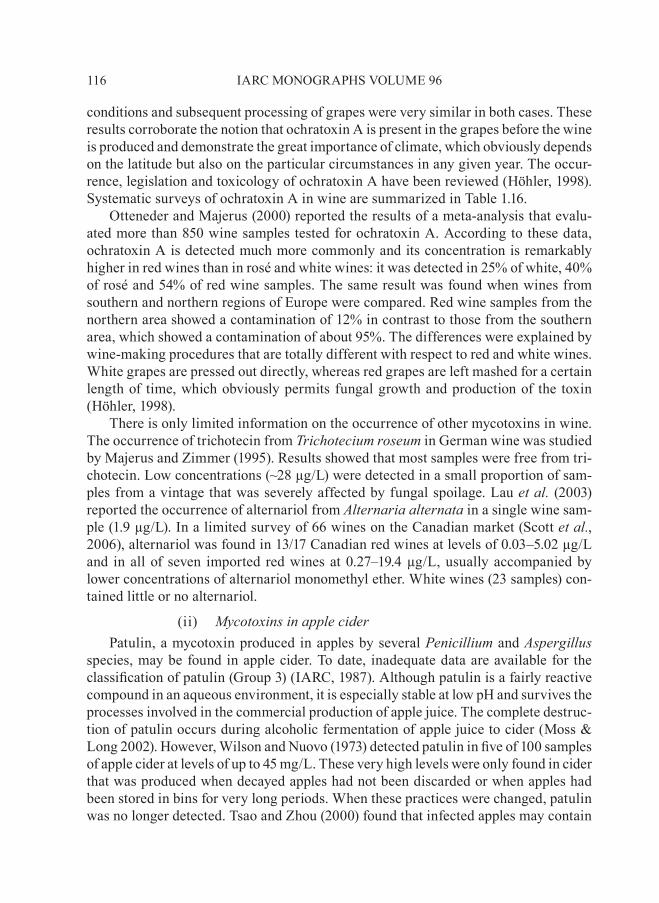
conditions and subsequent processing of grapes were very similar in both cases. These results corroborate the notion that ochratoxin A is present in the grapes before the wine is produced and demonstrate the great importance of climate, which obviously depends on the latitude but also on the particular circumstances in any given year. The occur-rence, legislation and toxicology of ochratoxin A have been reviewed (Höhler, 1998). Systematic surveys of ochratoxin A in wine are summarized in Table 1.16.
Otteneder and Majerus (2000) reported the results of a meta-analysis that evalu-ated more than 850 wine samples tested for ochratoxin A. According to these data, ochratoxin A is detected much more commonly and its concentration is remarkably higher in red wines than in rosé and white wines: it was detected in 25% of white, 40% of rosé and 54% of red wine samples. The same result was found when wines from southern and northern regions of Europe were compared. Red wine samples from the northern area showed a contamination of 12% in contrast to those from the southern area, which showed a contamination of about 95%. The differences were explained by wine-making procedures that are totally different with respect to red and white wines. White grapes are pressed out directly, whereas red grapes are left mashed for a certain length of time, which obviously permits fungal growth and production of the toxin (Höhler, 1998).
There is only limited information on the occurrence of other mycotoxins in wine. The occurrence of trichotecin from Trichotecium.roseum in German wine was studied by Majerus and Zimmer (1995). Results showed that most samples were free from tri-chotecin. Low concentrations (~28 µg/L) were detected in a small proportion of sam-ples from a vintage that was severely affected by fungal spoilage. Lau et.al . (2003) reported the occurrence of alternariol from alternaria.alternata in a single wine sam-ple (1.9 µg/L). In a limited survey of 66 wines on the Canadian market (Scott et.al ., 2006), alternariol was found in 13/17 Canadian red wines at levels of 0.03–5.02 µg/L and in all of seven imported red wines at 0.27–19.4 µg/L, usually accompanied by lower concentrations of alternariol monomethyl ether. White wines (23 samples) con-tained little or no alternariol.
(ii). Mycotoxins.in.apple.ciderPatulin, a mycotoxin produced in apples by several penicillium and aspergillus
species, may be found in apple cider. To date, inadequate data are available for the classification of patulin (Group 3) (IARC, 1987). Although patulin is a fairly reactive compound in an aqueous environment, it is especially stable at low pH and survives the processes involved in the commercial production of apple juice. The complete destruc-tion of patulin occurs during alcoholic fermentation of apple juice to cider (Moss & Long 2002). However, Wilson and Nuovo (1973) detected patulin in five of 100 samples of apple cider at levels of up to 45 mg/L. These very high levels were only found in cider that was produced when decayed apples had not been discarded or when apples had been stored in bins for very long periods. When these practices were changed, patulin was no longer detected. Tsao and Zhou (2000) found that infected apples may contain
116 IARC MONOGRAPHS VOLUME 96
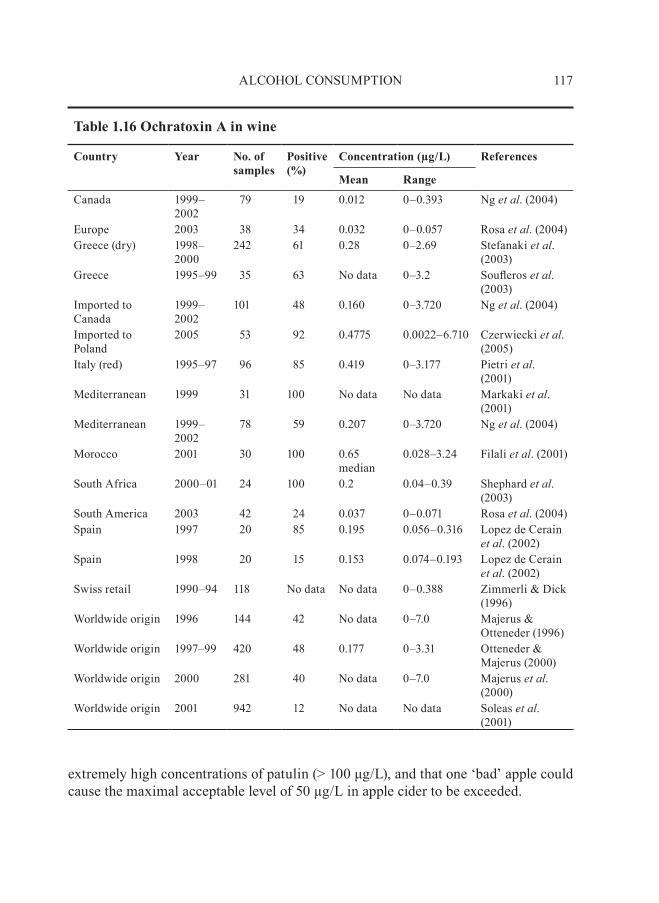
extremely high concentrations of patulin (> 100 μg/L), and that one ‘bad’ apple could cause the maximal acceptable level of 50 µg/L in apple cider to be exceeded.
117ALCOHOL CONSUMPTION
table 1.16 Ochratoxin A in wine
Country Year No. of samples
Positive(%)
Concentration (µg/L) References
Mean Range
Canada 1999–2002
79 19 0.012 0–0.393 Ng et.al. (2004)
Europe 2003 38 34 0.032 0–0.057 Rosa et.al. (2004)Greece (dry) 1998–
2000242 61 0.28 0–2.69 Stefanaki et.al.
(2003) Greece 1995–99 35 63 No data 0–3.2 Soufleros et.al.
(2003) Imported to Canada
1999–2002
101 48 0.160 0–3.720 Ng et.al. (2004)
Imported to Poland
2005 53 92 0.4775 0.0022–6.710 Czerwiecki et.al. (2005)
Italy (red) 1995–97 96 85 0.419 0–3.177 Pietri et.al. (2001)
Mediterranean 1999 31 100 No data No data Markaki et.al. (2001)
Mediterranean 1999–2002
78 59 0.207 0–3.720 Ng et.al. (2004)
Morocco 2001 30 100 0.65 median
0.028–3.24 Filali et.al. (2001)
South Africa 2000–01 24 100 0.2 0.04–0.39 Shephard et.al. (2003)
South America 2003 42 24 0.037 0–0.071 Rosa et.al. (2004) Spain 1997 20 85 0.195 0.056–0.316 Lopez de Cerain
et.al. (2002) Spain 1998 20 15 0.153 0.074–0.193 Lopez de Cerain
et.al. (2002)Swiss retail 1990–94 118 No data No data 0–0.388 Zimmerli & Dick
(1996) Worldwide origin 1996 144 42 No data 0–7.0 Majerus &
Otteneder (1996) Worldwide origin 1997–99 420 48 0.177 0–3.31 Otteneder &
Majerus (2000) Worldwide origin 2000 281 40 No data 0–7.0 Majerus et.al.
(2000) Worldwide origin 2001 942 12 No data No data Soleas et.al.
(2001)
A recent study confirmed that patulin is a good indicator of the quality of apples used to manufacture cider. Patulin was not detected in cider pressed from culled tree-picked apples stored for 4–6 weeks at 0–2 °C, but was found at levels of 0.97–64.0 µg/L in cider pressed from unculled fruit stored under the same conditions. Cider from apples that were culled before pressing and stored in controlled atmospheres contained 0–15.1 µg/L patulin, while cider made from unculled fruit contained 59.9–120.5 µg/L. The washing of ground-harvested apples before pressing reduced levels of patulin in cider by 10–100%, depending on the initial levels and the type of wash solution used. The avoidance of ground-harvested apples and the careful culling of apples before pressing are good methods for reducing the levels of patulin in cider (Jackson et.al ., 2003).
(iii). Mycotoxins.in.beerMycotoxins in beer have been reviewed (Odhav, 2005). Mycotoxins may be trans-
mitted to beers from contaminated grains during brewing. Various surveys have indi-cated that a variety of mycotoxins reach the final product, but generally in limited concentrations (Odhav, 2005).
Advances in methodology have enabled detection and quantitation of much lower levels (< 1 µg/L) of important mycotoxins such as ochratoxin A and aflatoxins in beer. Consequently, in recent years, reported incidences of ochratoxin A have increased in European and North American beers (Table 1.17). The highest levels of contamination with mycotoxin in beer from these parts of the world is caused by deoxynivalenol. Local beer brewed in Africa may have high incidences and concentrations of aflatox-ins and zearalenone (Scott, 1996).
Mycotoxins―aflatoxins, ochratoxin A, patulin, Fusarium toxins (zearalenone, fumonisins, trichlothecenes, nivalenol, desoxynivalenol)―that originate from barley or grain adjuncts survive malting and brewing processes to different extents (Scott, 1996; Dupire, 2003).
Deoxynivalenol, nivalenol and zearalenone are not classifiable as to their carci-nogenicity to humans (Group 3) (IARC, 1993a). Surveys of the occurrence of deox-ynivalenol and nivalenol in beer are summarized in Tables 1.18 and 1.19, respectively. Papadopoulou-Bouraoui et.al . (2004) observed that the level of alcohol as well as the type of fermentation had a significant effect on the amount of deoxynivalenol in beer. In general, beers that contained higher levels of alcohol contained significantly larger amounts of deoxynivalenol. Spontaneously fermenting beers contained significantly higher levels of deoxynivalenol than top- or bottom-fermenting beers, while top-fer-menting beers contained significantly higher concentrations than bottom-fermenting beers. A positive correlation between original gravity and levels of deoxynivalenol was reported by Curtui et.al . (2005).
The most abundant naturally occurring fumonisin analogues produced by Fusarium species are fumonisins B1, B2 and B3 (Rheeder et.al ., 2002). Fumonisin B1 was classified as a Group 2B carcinogen (IARC, 2002). Concentrations of fumonisin B1 in beer are
118 IARC MONOGRAPHS VOLUME 96
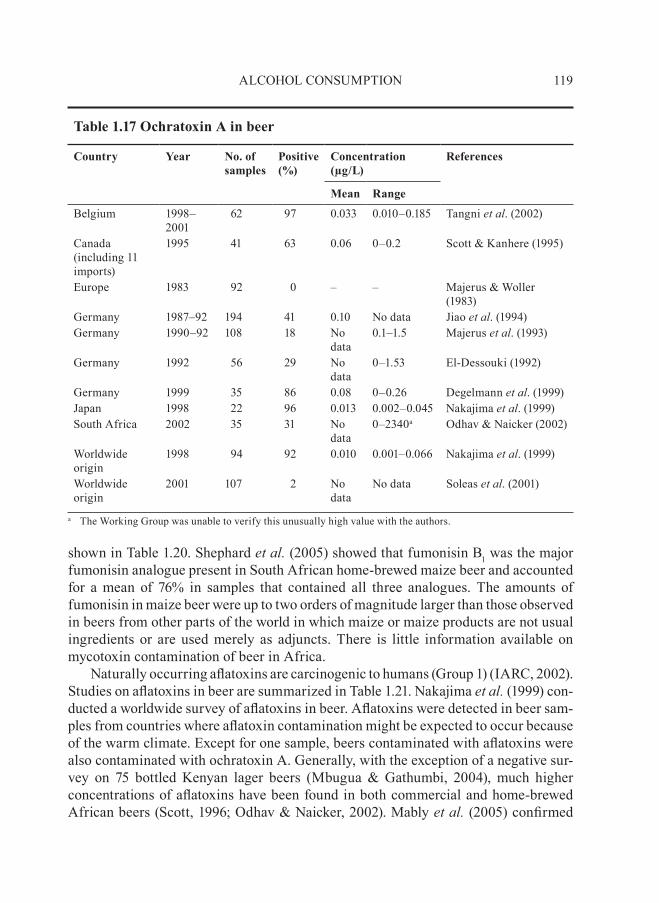
shown in Table 1.20. Shephard et.al . (2005) showed that fumonisin B1 was the major fumonisin analogue present in South African home-brewed maize beer and accounted for a mean of 76% in samples that contained all three analogues. The amounts of fumonisin in maize beer were up to two orders of magnitude larger than those observed in beers from other parts of the world in which maize or maize products are not usual ingredients or are used merely as adjuncts. There is little information available on mycotoxin contamination of beer in Africa.
Naturally occurring aflatoxins are carcinogenic to humans (Group 1) (IARC, 2002). Studies on aflatoxins in beer are summarized in Table 1.21. Nakajima et.al . (1999) con-ducted a worldwide survey of aflatoxins in beer. Aflatoxins were detected in beer sam-ples from countries where aflatoxin contamination might be expected to occur because of the warm climate. Except for one sample, beers contaminated with aflatoxins were also contaminated with ochratoxin A. Generally, with the exception of a negative sur-vey on 75 bottled Kenyan lager beers (Mbugua & Gathumbi, 2004), much higher concentrations of aflatoxins have been found in both commercial and home-brewed African beers (Scott, 1996; Odhav & Naicker, 2002). Mably et.al . (2005) confirmed
119ALCOHOL CONSUMPTION
table 1.17 Ochratoxin A in beer
Country Year No. of samples
Positive(%)
Concentration (µg/L)
References
Mean Range
Belgium 1998–2001
62 97 0.033 0.010–0.185 Tangni et.al. (2002)
Canada (including 11 imports)
1995 41 63 0.06 0–0.2 Scott & Kanhere (1995)
Europe 1983 92 0 – – Majerus & Woller (1983)
Germany 1987–92 194 41 0.10 No data Jiao et.al. (1994) Germany 1990–92 108 18 No
data0.1–1.5 Majerus et.al. (1993)
Germany 1992 56 29 No data
0–1.53 El-Dessouki (1992)
Germany 1999 35 86 0.08 0–0.26 Degelmann et.al. (1999) Japan 1998 22 96 0.013 0.002–0.045 Nakajima et.al. (1999)South Africa 2002 35 31 No
data0–2340a Odhav & Naicker (2002)
Worldwide origin
1998 94 92 0.010 0.001–0.066 Nakajima et.al. (1999)
Worldwide origin
2001 107 2 No data
No data Soleas et.al. (2001)
a The Working Group was unable to verify this unusually high value with the authors.
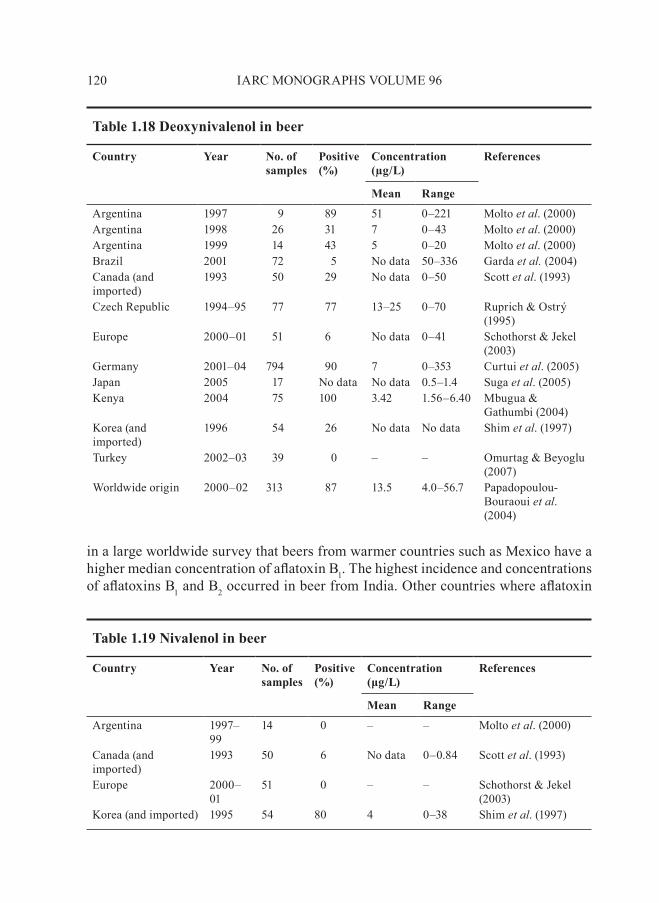
in a large worldwide survey that beers from warmer countries such as Mexico have a higher median concentration of aflatoxin B1. The highest incidence and concentrations of aflatoxins B1 and B2 occurred in beer from India. Other countries where aflatoxin
120 IARC MONOGRAPHS VOLUME 96
table 1.18 Deoxynivalenol in beer
Country Year No. of samples
Positive(%)
Concentration (µg/L)
References
Mean Range
Argentina 1997 9 89 51 0–221 Molto et.al. (2000) Argentina 1998 26 31 7 0–43 Molto et.al. (2000)Argentina 1999 14 43 5 0–20 Molto et.al. (2000)Brazil 2001 72 5 No data 50–336 Garda et.al . (2004)Canada (and imported)
1993 50 29 No data 0–50 Scott et.al. (1993)
Czech Republic 1994–95 77 77 13–25 0–70 Ruprich & Ostrý (1995)
Europe 2000–01 51 6 No data 0–41 Schothorst & Jekel (2003)
Germany 2001–04 794 90 7 0–353 Curtui et.al. (2005) Japan 2005 17 No data No data 0.5–1.4 Suga et.al. (2005) Kenya 2004 75 100 3.42 1.56–6.40 Mbugua &
Gathumbi (2004) Korea (and imported)
1996 54 26 No data No data Shim et.al. (1997)
Turkey 2002–03 39 0 – – Omurtag & Beyoglu (2007)
Worldwide origin 2000–02 313 87 13.5 4.0–56.7 Papadopoulou-Bouraoui et.al. (2004)
table 1.19 Nivalenol in beer
Country Year No. of samples
Positive(%)
Concentration (μg/L)
References
Mean Range
Argentina 1997–99
14 0 – – Molto et.al. (2000)
Canada (and imported)
1993 50 6 No data 0–0.84 Scott et.al. (1993)
Europe 2000–01
51 0 – – Schothorst & Jekel (2003)
Korea (and imported) 1995 54 80 4 0–38 Shim et.al. (1997)
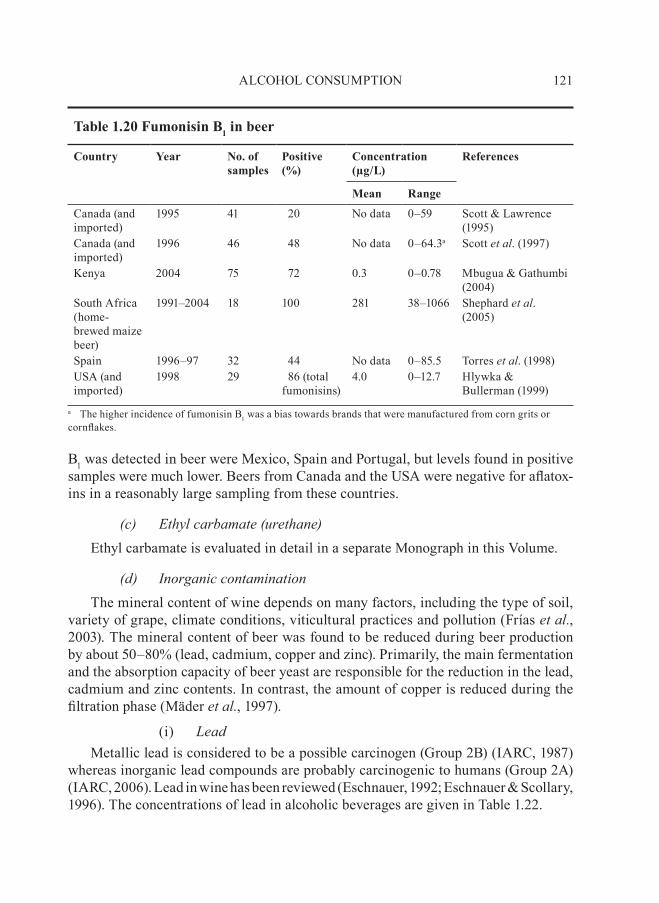
B1 was detected in beer were Mexico, Spain and Portugal, but levels found in positive samples were much lower. Beers from Canada and the USA were negative for aflatox-ins in a reasonably large sampling from these countries.
(c). Ethyl.carbamate.(urethane)Ethyl carbamate is evaluated in detail in a separate Monograph in this Volume.
(d). Inorganic.contaminationThe mineral content of wine depends on many factors, including the type of soil,
variety of grape, climate conditions, viticultural practices and pollution (Frías et.al ., 2003). The mineral content of beer was found to be reduced during beer production by about 50–80% (lead, cadmium, copper and zinc). Primarily, the main fermentation and the absorption capacity of beer yeast are responsible for the reduction in the lead, cadmium and zinc contents. In contrast, the amount of copper is reduced during the filtration phase (Mäder et.al ., 1997).
(i). LeadMetallic lead is considered to be a possible carcinogen (Group 2B) (IARC, 1987)
whereas inorganic lead compounds are probably carcinogenic to humans (Group 2A) (IARC, 2006). Lead in wine has been reviewed (Eschnauer, 1992; Eschnauer & Scollary, 1996). The concentrations of lead in alcoholic beverages are given in Table 1.22.
121ALCOHOL CONSUMPTION
table 1.20 Fumonisin B1 in beer
Country Year No. of samples
Positive(%)
Concentration (µg/L)
References
Mean Range
Canada (and imported)
1995 41 20 No data 0–59 Scott & Lawrence (1995)
Canada (and imported)
1996 46 48 No data 0–64.3a Scott et.al. (1997)
Kenya 2004 75 72 0.3 0–0.78 Mbugua & Gathumbi (2004)
South Africa (home-brewed maize beer)
1991–2004 18 100 281 38–1066 Shephard et.al. (2005)
Spain 1996–97 32 44 No data 0–85.5 Torres et.al. (1998)USA (and imported)
1998 29 86 (total fumonisins)
4.0 0–12.7 Hlywka & Bullerman (1999)
a The higher incidence of fumonisin B1 was a bias towards brands that were manufactured from corn grits or cornflakes.
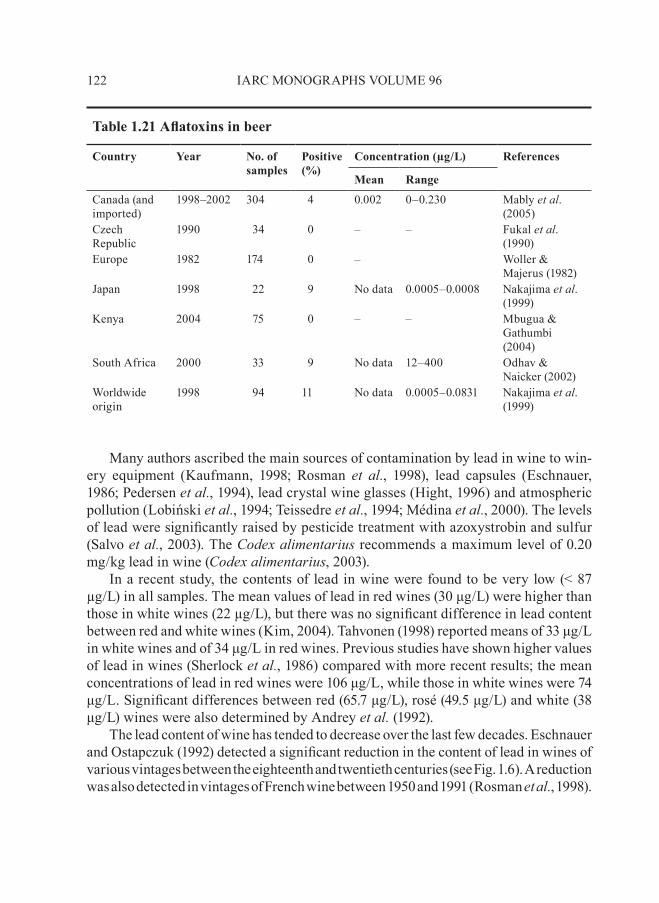
Many authors ascribed the main sources of contamination by lead in wine to win-ery equipment (Kaufmann, 1998; Rosman et. al ., 1998), lead capsules (Eschnauer, 1986; Pedersen et.al ., 1994), lead crystal wine glasses (Hight, 1996) and atmospheric pollution (Lobiński et.al ., 1994; Teissedre et.al ., 1994; Médina et.al ., 2000). The levels of lead were significantly raised by pesticide treatment with azoxystrobin and sulfur (Salvo et.al ., 2003). The Codex.alimentarius recommends a maximum level of 0.20 mg/kg lead in wine (Codex.alimentarius, 2003).
In a recent study, the contents of lead in wine were found to be very low (< 87 µg/L) in all samples. The mean values of lead in red wines (30 μg/L) were higher than those in white wines (22 µg/L), but there was no significant difference in lead content between red and white wines (Kim, 2004). Tahvonen (1998) reported means of 33 μg/L in white wines and of 34 μg/L in red wines. Previous studies have shown higher values of lead in wines (Sherlock et.al ., 1986) compared with more recent results; the mean concentrations of lead in red wines were 106 μg/L, while those in white wines were 74 μg/L. Significant differences between red (65.7 μg/L), rosé (49.5 μg/L) and white (38 μg/L) wines were also determined by Andrey et.al . (1992).
The lead content of wine has tended to decrease over the last few decades. Eschnauer and Ostapczuk (1992) detected a significant reduction in the content of lead in wines of various vintages between the eighteenth and twentieth centuries (see Fig. 1.6). A reduction was also detected in vintages of French wine between 1950 and 1991 (Rosman et.al ., 1998).
122 IARC MONOGRAPHS VOLUME 96
table 1.21 Aflatoxins in beer
Country Year No. of samples
Positive(%)
Concentration (µg/L) References
Mean Range
Canada (and imported)
1998–2002 304 4 0.002 0–0.230 Mably et.al. (2005)
Czech Republic
1990 34 0 – – Fukal et.al. (1990)
Europe 1982 174 0 – Woller & Majerus (1982)
Japan 1998 22 9 No data 0.0005–0.0008 Nakajima et.al. (1999)
Kenya 2004 75 0 – – Mbugua & Gathumbi (2004)
South Africa 2000 33 9 No data 12–400 Odhav & Naicker (2002)
Worldwide origin
1998 94 11 No data 0.0005–0.0831 Nakajima et.al. (1999)
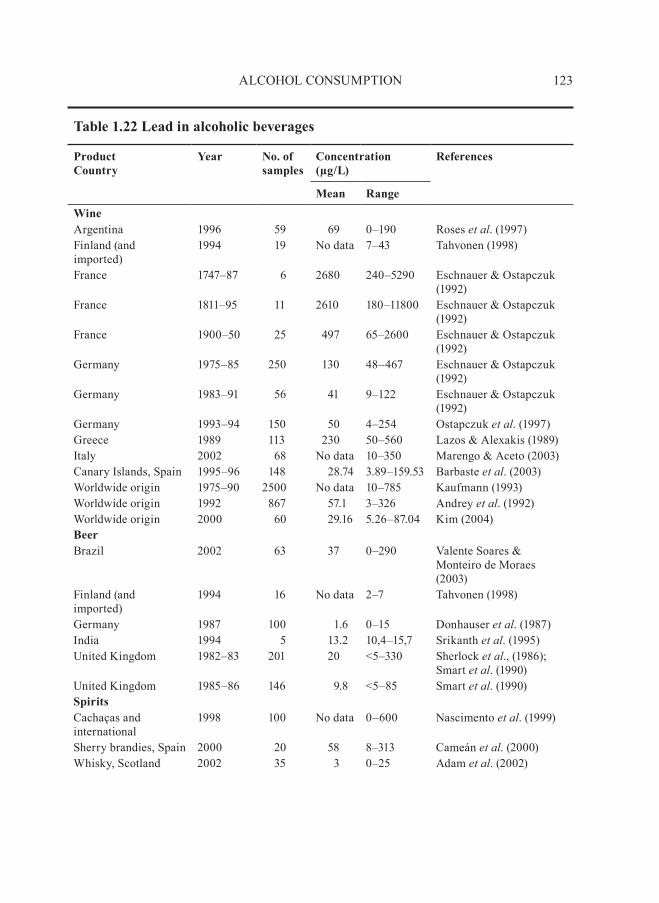
123ALCOHOL CONSUMPTION
table 1.22 Lead in alcoholic beverages
Product Country
Year No. of samples
Concentration (µg/L)
References
Mean RangeWineArgentina 1996 59 69 0–190 Roses et.al. (1997) Finland (and imported)
1994 19 No data 7–43 Tahvonen (1998)
France 1747–87 6 2680 240–5290 Eschnauer & Ostapczuk (1992)
France 1811–95 11 2610 180–11800 Eschnauer & Ostapczuk (1992)
France 1900–50 25 497 65–2600 Eschnauer & Ostapczuk (1992)
Germany 1975–85 250 130 48–467 Eschnauer & Ostapczuk (1992)
Germany 1983–91 56 41 9–122 Eschnauer & Ostapczuk (1992)
Germany 1993–94 150 50 4–254 Ostapczuk et.al. (1997) Greece 1989 113 230 50–560 Lazos & Alexakis (1989) Italy 2002 68 No data 10–350 Marengo & Aceto (2003) Canary Islands, Spain 1995–96 148 28.74 3.89–159.53 Barbaste et.al. (2003) Worldwide origin 1975–90 2500 No data 10–785 Kaufmann (1993) Worldwide origin 1992 867 57.1 3–326 Andrey et.al. (1992) Worldwide origin 2000 60 29.16 5.26–87.04 Kim (2004) BeerBrazil 2002 63 37 0–290 Valente Soares &
Monteiro de Moraes (2003)
Finland (and imported)
1994 16 No data 2–7 Tahvonen (1998)
Germany 1987 100 1.6 0–15 Donhauser et.al. (1987) India 1994 5 13.2 10,4–15,7 Srikanth et.al. (1995) United Kingdom 1982–83 201 20 <5–330 Sherlock et.al., (1986);
Smart et.al. (1990) United Kingdom 1985–86 146 9.8 <5–85 Smart et.al. (1990) SpiritsCachaças and international
1998 100 No data 0–600 Nascimento et.al. (1999)
Sherry brandies, Spain 2000 20 58 8–313 Cameán et.al. (2000) Whisky, Scotland 2002 35 3 0–25 Adam et.al. (2002)
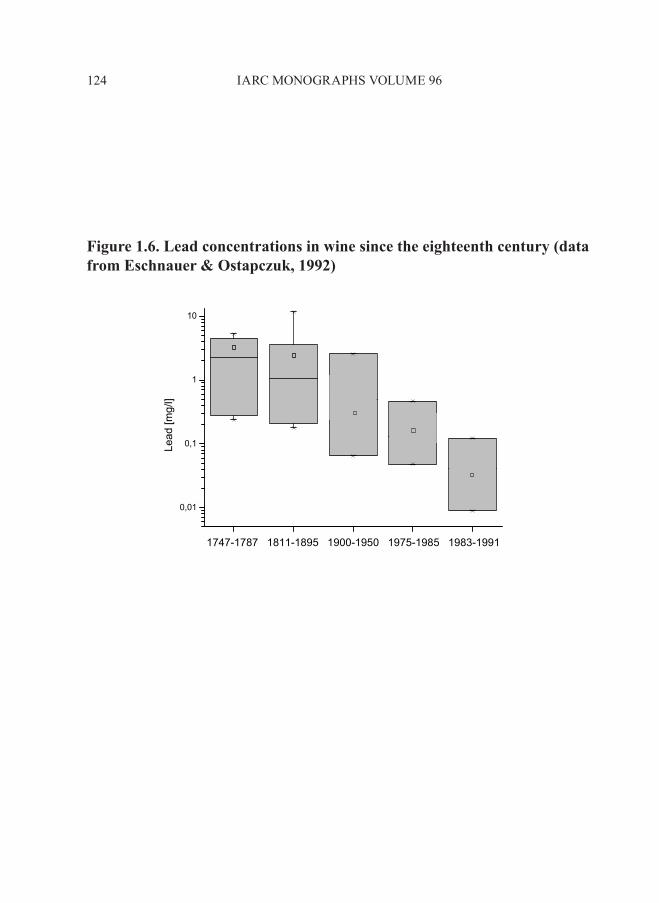
IARC MONOGRAPHS VOLUME 96124
Figure 1.6. Lead concentrations in wine since the eighteenth century (data from eschnauer & Ostapczuk, 1992)
0,01
0,1
1
10
Lead
[mg/
l]
1747-1787 1811-1895 1900-1950 1975-1985 1983-1991
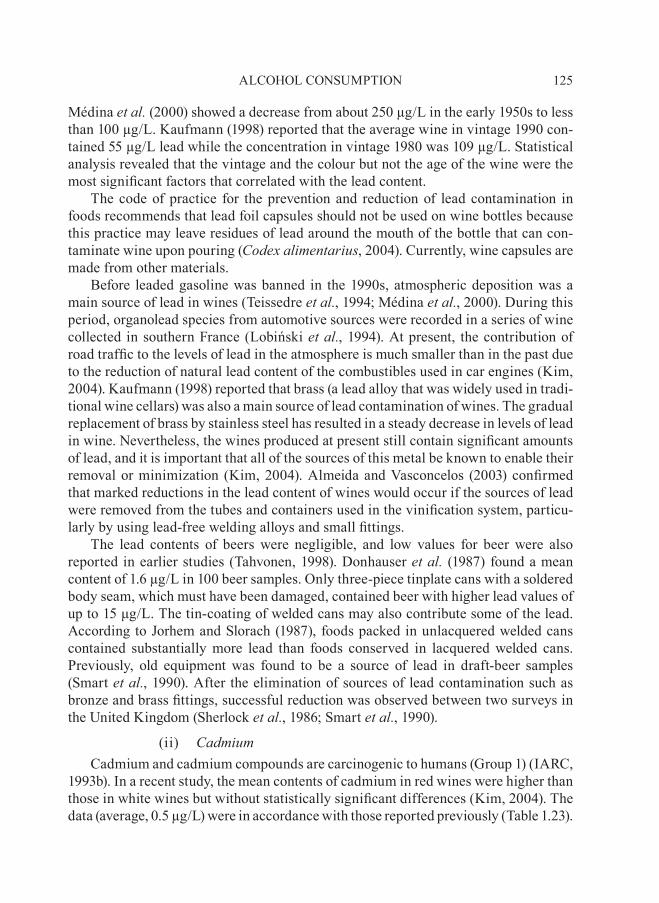
Médina et.al . (2000) showed a decrease from about 250 µg/L in the early 1950s to less than 100 µg/L. Kaufmann (1998) reported that the average wine in vintage 1990 con-tained 55 µg/L lead while the concentration in vintage 1980 was 109 µg/L. Statistical analysis revealed that the vintage and the colour but not the age of the wine were the most significant factors that correlated with the lead content.
The code of practice for the prevention and reduction of lead contamination in foods recommends that lead foil capsules should not be used on wine bottles because this practice may leave residues of lead around the mouth of the bottle that can con-taminate wine upon pouring (Codex.alimentarius, 2004). Currently, wine capsules are made from other materials.
Before leaded gasoline was banned in the 1990s, atmospheric deposition was a main source of lead in wines (Teissedre et.al ., 1994; Médina et.al ., 2000). During this period, organolead species from automotive sources were recorded in a series of wine collected in southern France (Lobiński et.al ., 1994). At present, the contribution of road traffic to the levels of lead in the atmosphere is much smaller than in the past due to the reduction of natural lead content of the combustibles used in car engines (Kim, 2004). Kaufmann (1998) reported that brass (a lead alloy that was widely used in tradi-tional wine cellars) was also a main source of lead contamination of wines. The gradual replacement of brass by stainless steel has resulted in a steady decrease in levels of lead in wine. Nevertheless, the wines produced at present still contain significant amounts of lead, and it is important that all of the sources of this metal be known to enable their removal or minimization (Kim, 2004). Almeida and Vasconcelos (2003) confirmed that marked reductions in the lead content of wines would occur if the sources of lead were removed from the tubes and containers used in the vinification system, particu-larly by using lead-free welding alloys and small fittings.
The lead contents of beers were negligible, and low values for beer were also reported in earlier studies (Tahvonen, 1998). Donhauser et.al . (1987) found a mean content of 1.6 µg/L in 100 beer samples. Only three-piece tinplate cans with a soldered body seam, which must have been damaged, contained beer with higher lead values of up to 15 μg/L. The tin-coating of welded cans may also contribute some of the lead. According to Jorhem and Slorach (1987), foods packed in unlacquered welded cans contained substantially more lead than foods conserved in lacquered welded cans. Previously, old equipment was found to be a source of lead in draft-beer samples (Smart et.al ., 1990). After the elimination of sources of lead contamination such as bronze and brass fittings, successful reduction was observed between two surveys in the United Kingdom (Sherlock et.al ., 1986; Smart et.al ., 1990).
(ii). CadmiumCadmium and cadmium compounds are carcinogenic to humans (Group 1) (IARC,
1993b). In a recent study, the mean contents of cadmium in red wines were higher than those in white wines but without statistically significant differences (Kim, 2004). The data (average, 0.5 µg/L) were in accordance with those reported previously (Table 1.23).
125ALCOHOL CONSUMPTION
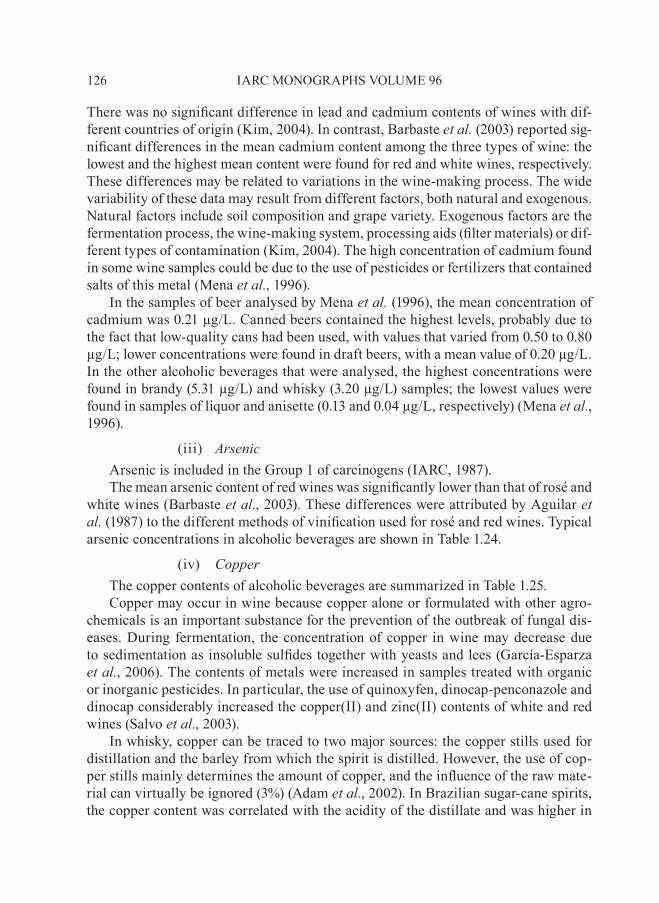
There was no significant difference in lead and cadmium contents of wines with dif-ferent countries of origin (Kim, 2004). In contrast, Barbaste et.al . (2003) reported sig-nificant differences in the mean cadmium content among the three types of wine: the lowest and the highest mean content were found for red and white wines, respectively. These differences may be related to variations in the wine-making process. The wide variability of these data may result from different factors, both natural and exogenous. Natural factors include soil composition and grape variety. Exogenous factors are the fermentation process, the wine-making system, processing aids (filter materials) or dif-ferent types of contamination (Kim, 2004). The high concentration of cadmium found in some wine samples could be due to the use of pesticides or fertilizers that contained salts of this metal (Mena et.al ., 1996).
In the samples of beer analysed by Mena et.al . (1996), the mean concentration of cadmium was 0.21 µg/L. Canned beers contained the highest levels, probably due to the fact that low-quality cans had been used, with values that varied from 0.50 to 0.80 µg/L; lower concentrations were found in draft beers, with a mean value of 0.20 µg/L. In the other alcoholic beverages that were analysed, the highest concentrations were found in brandy (5.31 µg/L) and whisky (3.20 µg/L) samples; the lowest values were found in samples of liquor and anisette (0.13 and 0.04 µg/L, respectively) (Mena et.al ., 1996).
(iii). arsenicArsenic is included in the Group 1 of carcinogens (IARC, 1987).The mean arsenic content of red wines was significantly lower than that of rosé and
white wines (Barbaste et.al ., 2003). These differences were attributed by Aguilar et.al . (1987) to the different methods of vinification used for rosé and red wines. Typical arsenic concentrations in alcoholic beverages are shown in Table 1.24.
(iv). CopperThe copper contents of alcoholic beverages are summarized in Table 1.25.Copper may occur in wine because copper alone or formulated with other agro-
chemicals is an important substance for the prevention of the outbreak of fungal dis-eases. During fermentation, the concentration of copper in wine may decrease due to sedimentation as insoluble sulfides together with yeasts and lees (García-Esparza et.al ., 2006). The contents of metals were increased in samples treated with organic or inorganic pesticides. In particular, the use of quinoxyfen, dinocap-penconazole and dinocap considerably increased the copper(II) and zinc(II) contents of white and red wines (Salvo et.al ., 2003).
In whisky, copper can be traced to two major sources: the copper stills used for distillation and the barley from which the spirit is distilled. However, the use of cop-per stills mainly determines the amount of copper, and the influence of the raw mate-rial can virtually be ignored (3%) (Adam et.al ., 2002). In Brazilian sugar-cane spirits, the copper content was correlated with the acidity of the distillate and was higher in
126 IARC MONOGRAPHS VOLUME 96
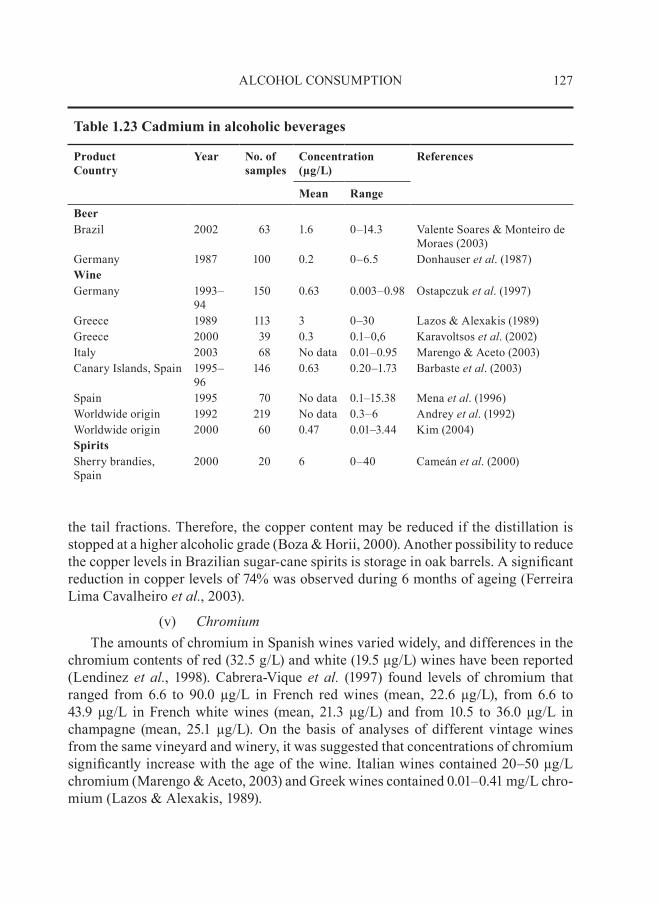
the tail fractions. Therefore, the copper content may be reduced if the distillation is stopped at a higher alcoholic grade (Boza & Horii, 2000). Another possibility to reduce the copper levels in Brazilian sugar-cane spirits is storage in oak barrels. A significant reduction in copper levels of 74% was observed during 6 months of ageing (Ferreira Lima Cavalheiro et.al ., 2003).
(v). ChromiumThe amounts of chromium in Spanish wines varied widely, and differences in the
chromium contents of red (32.5 g/L) and white (19.5 μg/L) wines have been reported (Lendinez et. al ., 1998). Cabrera-Vique et. al . (1997) found levels of chromium that ranged from 6.6 to 90.0 µg/L in French red wines (mean, 22.6 µg/L), from 6.6 to 43.9 µg/L in French white wines (mean, 21.3 µg/L) and from 10.5 to 36.0 µg/L in champagne (mean, 25.1 µg/L). On the basis of analyses of different vintage wines from the same vineyard and winery, it was suggested that concentrations of chromium significantly increase with the age of the wine. Italian wines contained 20–50 µg/L chromium (Marengo & Aceto, 2003) and Greek wines contained 0.01–0.41 mg/L chro-mium (Lazos & Alexakis, 1989).
127ALCOHOL CONSUMPTION
table 1.23 Cadmium in alcoholic beverages
Product Country
Year No. of samples
Concentration (µg/L)
References
Mean RangeBeerBrazil 2002 63 1.6 0–14.3 Valente Soares & Monteiro de
Moraes (2003) Germany 1987 100 0.2 0–6.5 Donhauser et.al. (1987) WineGermany 1993–
94150 0.63 0.003–0.98 Ostapczuk et.al. (1997)
Greece 1989 113 3 0–30 Lazos & Alexakis (1989) Greece 2000 39 0.3 0.1–0,6 Karavoltsos et.al. (2002) Italy 2003 68 No data 0.01–0.95 Marengo & Aceto (2003)Canary Islands, Spain 1995–
96146 0.63 0.20–1.73 Barbaste et.al. (2003)
Spain 1995 70 No data 0.1–15.38 Mena et.al. (1996) Worldwide origin 1992 219 No data 0.3–6 Andrey et.al. (1992) Worldwide origin 2000 60 0.47 0.01–3.44 Kim (2004) SpiritsSherry brandies, Spain
2000 20 6 0–40 Cameán et.al. (2000)
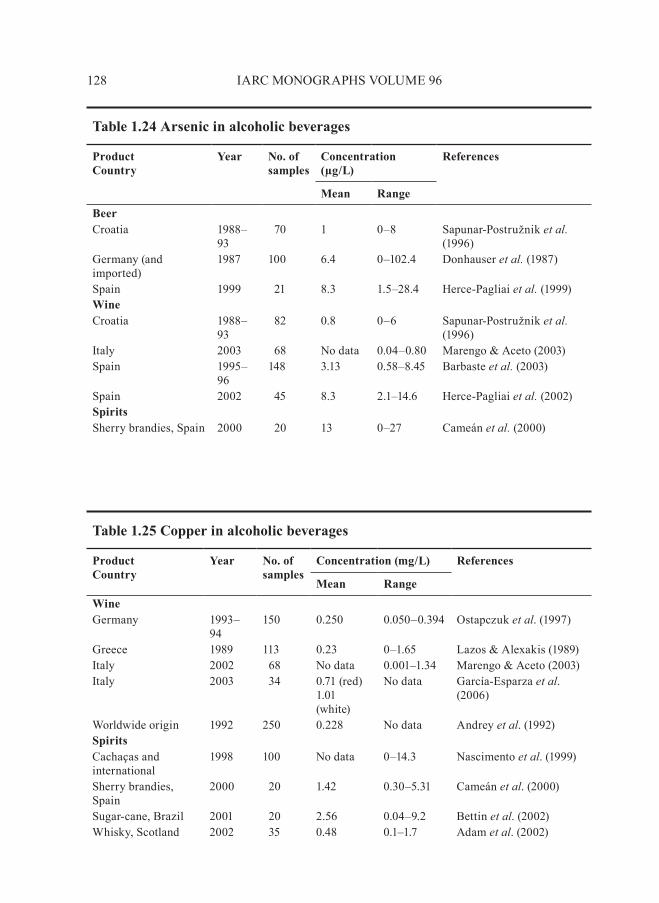
128 IARC MONOGRAPHS VOLUME 96
table 1.24 Arsenic in alcoholic beverages
Product Country
Year No. of samples
Concentration (µg/L)
References
Mean RangeBeerCroatia 1988–
93 70 1 0–8 Sapunar-Postružnik et.al .
(1996)Germany (and imported)
1987 100 6.4 0–102.4 Donhauser et.al . (1987)
Spain 1999 21 8.3 1.5–28.4 Herce-Pagliai et.al . (1999)WineCroatia 1988–
93 82 0.8 0–6 Sapunar-Postružnik et.al .
(1996)Italy 2003 68 No data 0.04–0.80 Marengo & Aceto (2003)Spain 1995–
96148 3.13 0.58–8.45 Barbaste et.al . (2003)
Spain 2002 45 8.3 2.1–14.6 Herce-Pagliai et.al . (2002)SpiritsSherry brandies, Spain 2000 20 13 0–27 Cameán et.al . (2000)
table 1.25 Copper in alcoholic beverages
Product Country
Year No. of samples
Concentration (mg/L) References
Mean RangeWineGermany 1993–
94150 0.250 0.050–0.394 Ostapczuk et.al. (1997)
Greece 1989 113 0.23 0–1.65 Lazos & Alexakis (1989) Italy 2002 68 No data 0.001–1.34 Marengo & Aceto (2003) Italy 2003 34 0.71 (red)
1.01 (white)
No data García-Esparza et.al. (2006)
Worldwide origin 1992 250 0.228 No data Andrey et.al. (1992) SpiritsCachaças and international
1998 100 No data 0–14.3 Nascimento et.al. (1999)
Sherry brandies, Spain
2000 20 1.42 0.30–5.31 Cameán et.al. (2000)
Sugar-cane, Brazil 2001 20 2.56 0.04–9.2 Bettin et.al. (2002) Whisky, Scotland 2002 35 0.48 0.1–1.7 Adam et.al. (2002)
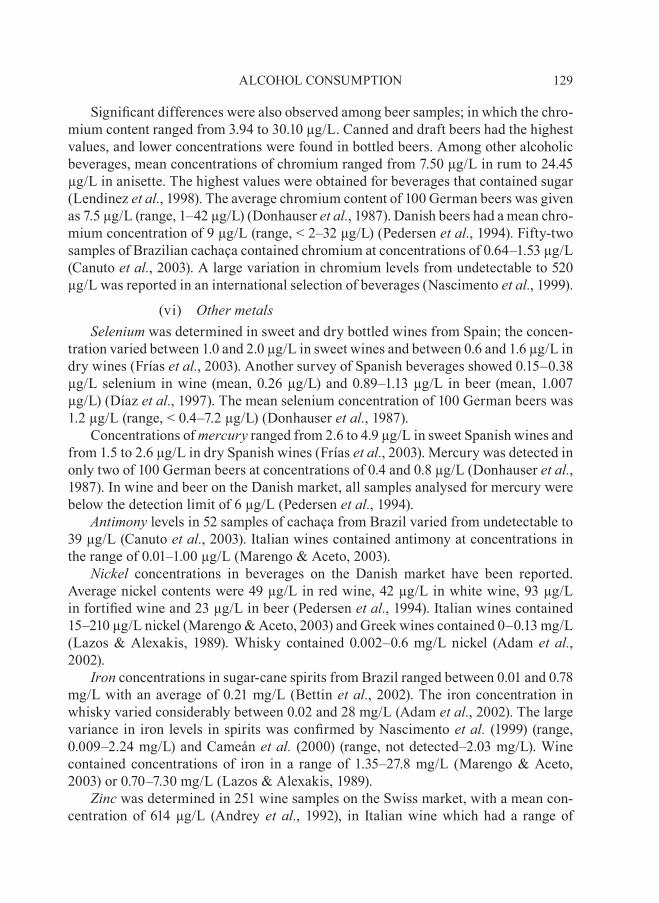
Significant differences were also observed among beer samples; in which the chro-mium content ranged from 3.94 to 30.10 µg/L. Canned and draft beers had the highest values, and lower concentrations were found in bottled beers. Among other alcoholic beverages, mean concentrations of chromium ranged from 7.50 µg/L in rum to 24.45 µg/L in anisette. The highest values were obtained for beverages that contained sugar (Lendinez et.al ., 1998). The average chromium content of 100 German beers was given as 7.5 µg/L (range, 1–42 µg/L) (Donhauser et.al ., 1987). Danish beers had a mean chro-mium concentration of 9 µg/L (range, < 2–32 μg/L) (Pedersen et.al ., 1994). Fifty-two samples of Brazilian cachaça contained chromium at concentrations of 0.64–1.53 µg/L (Canuto et.al ., 2003). A large variation in chromium levels from undetectable to 520 µg/L was reported in an international selection of beverages (Nascimento et.al ., 1999).
(vi). other.metalsselenium was determined in sweet and dry bottled wines from Spain; the concen-
tration varied between 1.0 and 2.0 µg/L in sweet wines and between 0.6 and 1.6 µg/L in dry wines (Frías et.al ., 2003). Another survey of Spanish beverages showed 0.15–0.38 µg/L selenium in wine (mean, 0.26 µg/L) and 0.89–1.13 µg/L in beer (mean, 1.007 µg/L) (Díaz et.al ., 1997). The mean selenium concentration of 100 German beers was 1.2 µg/L (range, < 0.4–7.2 µg/L) (Donhauser et.al ., 1987).
Concentrations of mercury ranged from 2.6 to 4.9 µg/L in sweet Spanish wines and from 1.5 to 2.6 µg/L in dry Spanish wines (Frías et.al ., 2003). Mercury was detected in only two of 100 German beers at concentrations of 0.4 and 0.8 µg/L (Donhauser et.al ., 1987). In wine and beer on the Danish market, all samples analysed for mercury were below the detection limit of 6 µg/L (Pedersen et.al ., 1994).
antimony levels in 52 samples of cachaça from Brazil varied from undetectable to 39 µg/L (Canuto et.al ., 2003). Italian wines contained antimony at concentrations in the range of 0.01–1.00 µg/L (Marengo & Aceto, 2003).
nickel concentrations in beverages on the Danish market have been reported. Average nickel contents were 49 µg/L in red wine, 42 µg/L in white wine, 93 µg/L in fortified wine and 23 µg/L in beer (Pedersen et.al ., 1994). Italian wines contained 15–210 µg/L nickel (Marengo & Aceto, 2003) and Greek wines contained 0–0.13 mg/L (Lazos & Alexakis, 1989). Whisky contained 0.002–0.6 mg/L nickel (Adam et.al ., 2002).
Iron concentrations in sugar-cane spirits from Brazil ranged between 0.01 and 0.78 mg/L with an average of 0.21 mg/L (Bettin et.al ., 2002). The iron concentration in whisky varied considerably between 0.02 and 28 mg/L (Adam et.al ., 2002). The large variance in iron levels in spirits was confirmed by Nascimento et.al . (1999) (range, 0.009–2.24 mg/L) and Cameán et.al . (2000) (range, not detected–2.03 mg/L). Wine contained concentrations of iron in a range of 1.35–27.8 mg/L (Marengo & Aceto, 2003) or 0.70–7.30 mg/L (Lazos & Alexakis, 1989).
Zinc was determined in 251 wine samples on the Swiss market, with a mean con-centration of 614 µg/L (Andrey et. al ., 1992), in Italian wine which had a range of
129ALCOHOL CONSUMPTION
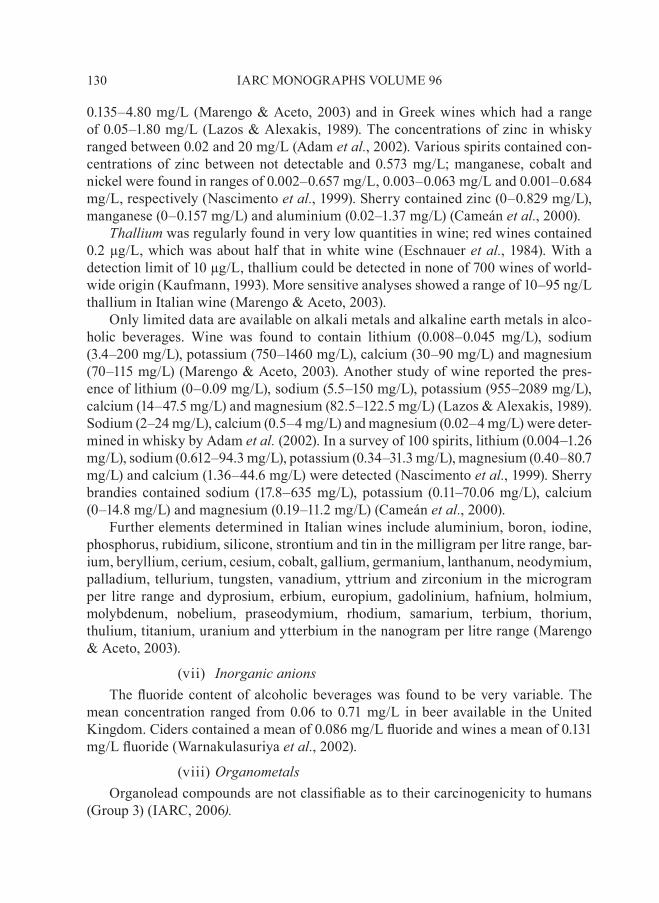
0.135–4.80 mg/L (Marengo & Aceto, 2003) and in Greek wines which had a range of 0.05–1.80 mg/L (Lazos & Alexakis, 1989). The concentrations of zinc in whisky ranged between 0.02 and 20 mg/L (Adam et.al ., 2002). Various spirits contained con-centrations of zinc between not detectable and 0.573 mg/L; manganese, cobalt and nickel were found in ranges of 0.002–0.657 mg/L, 0.003–0.063 mg/L and 0.001–0.684 mg/L, respectively (Nascimento et.al ., 1999). Sherry contained zinc (0–0.829 mg/L), manganese (0–0.157 mg/L) and aluminium (0.02–1.37 mg/L) (Cameán et.al ., 2000).
Thallium was regularly found in very low quantities in wine; red wines contained 0.2 µg/L, which was about half that in white wine (Eschnauer et.al ., 1984). With a detection limit of 10 µg/L, thallium could be detected in none of 700 wines of world-wide origin (Kaufmann, 1993). More sensitive analyses showed a range of 10–95 ng/L thallium in Italian wine (Marengo & Aceto, 2003).
Only limited data are available on alkali metals and alkaline earth metals in alco-holic beverages. Wine was found to contain lithium (0.008–0.045 mg/L), sodium (3.4–200 mg/L), potassium (750–1460 mg/L), calcium (30–90 mg/L) and magnesium (70–115 mg/L) (Marengo & Aceto, 2003). Another study of wine reported the pres-ence of lithium (0–0.09 mg/L), sodium (5.5–150 mg/L), potassium (955–2089 mg/L), calcium (14–47.5 mg/L) and magnesium (82.5–122.5 mg/L) (Lazos & Alexakis, 1989). Sodium (2–24 mg/L), calcium (0.5–4 mg/L) and magnesium (0.02–4 mg/L) were deter-mined in whisky by Adam et.al . (2002). In a survey of 100 spirits, lithium (0.004–1.26 mg/L), sodium (0.612–94.3 mg/L), potassium (0.34–31.3 mg/L), magnesium (0.40–80.7 mg/L) and calcium (1.36–44.6 mg/L) were detected (Nascimento et.al ., 1999). Sherry brandies contained sodium (17.8–635 mg/L), potassium (0.11–70.06 mg/L), calcium (0–14.8 mg/L) and magnesium (0.19–11.2 mg/L) (Cameán et.al ., 2000).
Further elements determined in Italian wines include aluminium, boron, iodine, phosphorus, rubidium, silicone, strontium and tin in the milligram per litre range, bar-ium, beryllium, cerium, cesium, cobalt, gallium, germanium, lanthanum, neodymium, palladium, tellurium, tungsten, vanadium, yttrium and zirconium in the microgram per litre range and dyprosium, erbium, europium, gadolinium, hafnium, holmium, molybdenum, nobelium, praseodymium, rhodium, samarium, terbium, thorium, thulium, titanium, uranium and ytterbium in the nanogram per litre range (Marengo & Aceto, 2003).
(vii). Inorganic.anionsThe fluoride content of alcoholic beverages was found to be very variable. The
mean concentration ranged from 0.06 to 0.71 mg/L in beer available in the United Kingdom. Ciders contained a mean of 0.086 mg/L fluoride and wines a mean of 0.131 mg/L fluoride (Warnakulasuriya et.al ., 2002).
(viii).organometalsOrganolead compounds are not classifiable as to their carcinogenicity to humans
(Group 3) (IARC, 2006) .
130 IARC MONOGRAPHS VOLUME 96
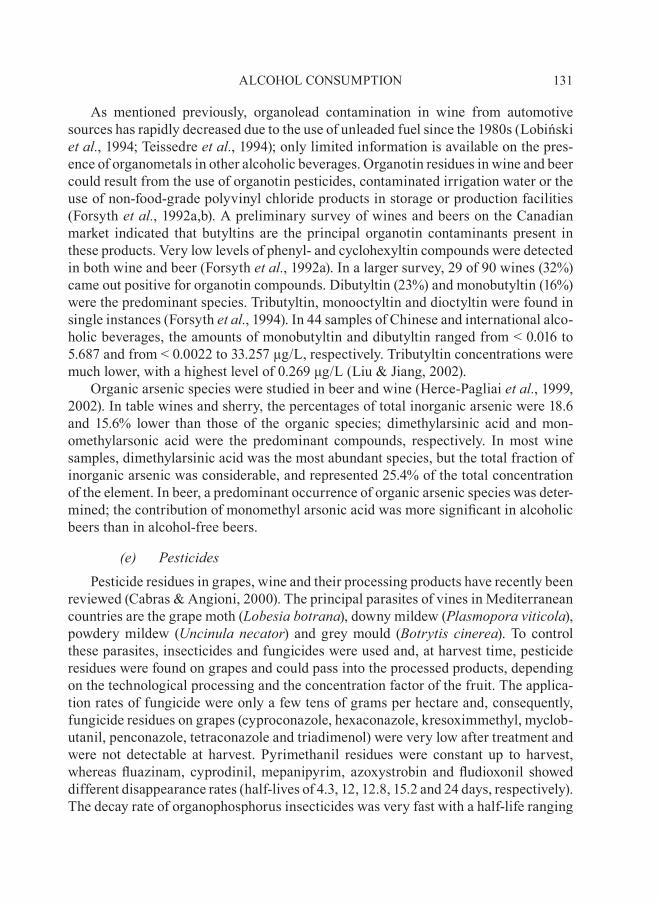
As mentioned previously, organolead contamination in wine from automotive sources has rapidly decreased due to the use of unleaded fuel since the 1980s (Lobiński et.al ., 1994; Teissedre et.al ., 1994); only limited information is available on the pres-ence of organometals in other alcoholic beverages. Organotin residues in wine and beer could result from the use of organotin pesticides, contaminated irrigation water or the use of non-food-grade polyvinyl chloride products in storage or production facilities (Forsyth et.al ., 1992a,b). A preliminary survey of wines and beers on the Canadian market indicated that butyltins are the principal organotin contaminants present in these products. Very low levels of phenyl- and cyclohexyltin compounds were detected in both wine and beer (Forsyth et.al ., 1992a). In a larger survey, 29 of 90 wines (32%) came out positive for organotin compounds. Dibutyltin (23%) and monobutyltin (16%) were the predominant species. Tributyltin, monooctyltin and dioctyltin were found in single instances (Forsyth et.al ., 1994). In 44 samples of Chinese and international alco-holic beverages, the amounts of monobutyltin and dibutyltin ranged from < 0.016 to 5.687 and from < 0.0022 to 33.257 µg/L, respectively. Tributyltin concentrations were much lower, with a highest level of 0.269 μg/L (Liu & Jiang, 2002).
Organic arsenic species were studied in beer and wine (Herce-Pagliai et.al ., 1999, 2002). In table wines and sherry, the percentages of total inorganic arsenic were 18.6 and 15.6% lower than those of the organic species; dimethylarsinic acid and mon-omethylarsonic acid were the predominant compounds, respectively. In most wine samples, dimethylarsinic acid was the most abundant species, but the total fraction of inorganic arsenic was considerable, and represented 25.4% of the total concentration of the element. In beer, a predominant occurrence of organic arsenic species was deter-mined; the contribution of monomethyl arsonic acid was more significant in alcoholic beers than in alcohol-free beers.
(e). pesticidesPesticide residues in grapes, wine and their processing products have recently been
reviewed (Cabras & Angioni, 2000). The principal parasites of vines in Mediterranean countries are the grape moth (Lobesia.botrana), downy mildew (plasmopora.viticola), powdery mildew (Uncinula.necator) and grey mould (Botrytis. cinerea). To control these parasites, insecticides and fungicides were used and, at harvest time, pesticide residues were found on grapes and could pass into the processed products, depending on the technological processing and the concentration factor of the fruit. The applica-tion rates of fungicide were only a few tens of grams per hectare and, consequently, fungicide residues on grapes (cyproconazole, hexaconazole, kresoximmethyl, myclob-utanil, penconazole, tetraconazole and triadimenol) were very low after treatment and were not detectable at harvest. Pyrimethanil residues were constant up to harvest, whereas fluazinam, cyprodinil, mepanipyrim, azoxystrobin and fludioxonil showed different disappearance rates (half-lives of 4.3, 12, 12.8, 15.2 and 24 days, respectively). The decay rate of organophosphorus insecticides was very fast with a half-life ranging
131ALCOHOL CONSUMPTION
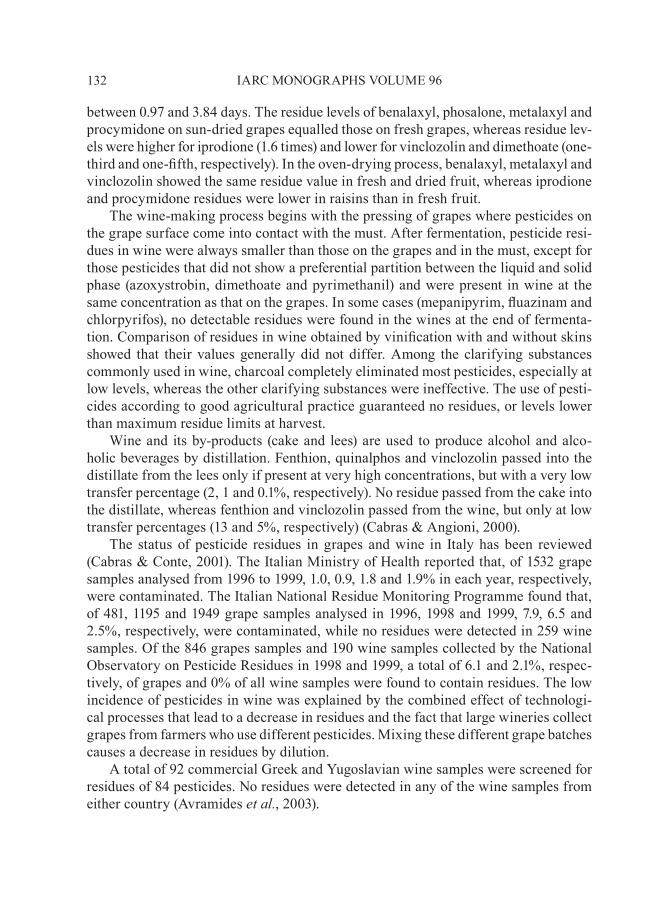
between 0.97 and 3.84 days. The residue levels of benalaxyl, phosalone, metalaxyl and procymidone on sun-dried grapes equalled those on fresh grapes, whereas residue lev-els were higher for iprodione (1.6 times) and lower for vinclozolin and dimethoate (one-third and one-fifth, respectively). In the oven-drying process, benalaxyl, metalaxyl and vinclozolin showed the same residue value in fresh and dried fruit, whereas iprodione and procymidone residues were lower in raisins than in fresh fruit.
The wine-making process begins with the pressing of grapes where pesticides on the grape surface come into contact with the must. After fermentation, pesticide resi-dues in wine were always smaller than those on the grapes and in the must, except for those pesticides that did not show a preferential partition between the liquid and solid phase (azoxystrobin, dimethoate and pyrimethanil) and were present in wine at the same concentration as that on the grapes. In some cases (mepanipyrim, fluazinam and chlorpyrifos), no detectable residues were found in the wines at the end of fermenta-tion. Comparison of residues in wine obtained by vinification with and without skins showed that their values generally did not differ. Among the clarifying substances commonly used in wine, charcoal completely eliminated most pesticides, especially at low levels, whereas the other clarifying substances were ineffective. The use of pesti-cides according to good agricultural practice guaranteed no residues, or levels lower than maximum residue limits at harvest.
Wine and its by-products (cake and lees) are used to produce alcohol and alco-holic beverages by distillation. Fenthion, quinalphos and vinclozolin passed into the distillate from the lees only if present at very high concentrations, but with a very low transfer percentage (2, 1 and 0.1%, respectively). No residue passed from the cake into the distillate, whereas fenthion and vinclozolin passed from the wine, but only at low transfer percentages (13 and 5%, respectively) (Cabras & Angioni, 2000).
The status of pesticide residues in grapes and wine in Italy has been reviewed (Cabras & Conte, 2001). The Italian Ministry of Health reported that, of 1532 grape samples analysed from 1996 to 1999, 1.0, 0.9, 1.8 and 1.9% in each year, respectively, were contaminated. The Italian National Residue Monitoring Programme found that, of 481, 1195 and 1949 grape samples analysed in 1996, 1998 and 1999, 7.9, 6.5 and 2.5%, respectively, were contaminated, while no residues were detected in 259 wine samples. Of the 846 grapes samples and 190 wine samples collected by the National Observatory on Pesticide Residues in 1998 and 1999, a total of 6.1 and 2.1%, respec-tively, of grapes and 0% of all wine samples were found to contain residues. The low incidence of pesticides in wine was explained by the combined effect of technologi-cal processes that lead to a decrease in residues and the fact that large wineries collect grapes from farmers who use different pesticides. Mixing these different grape batches causes a decrease in residues by dilution.
A total of 92 commercial Greek and Yugoslavian wine samples were screened for residues of 84 pesticides. No residues were detected in any of the wine samples from either country (Avramides et.al ., 2003).
132 IARC MONOGRAPHS VOLUME 96
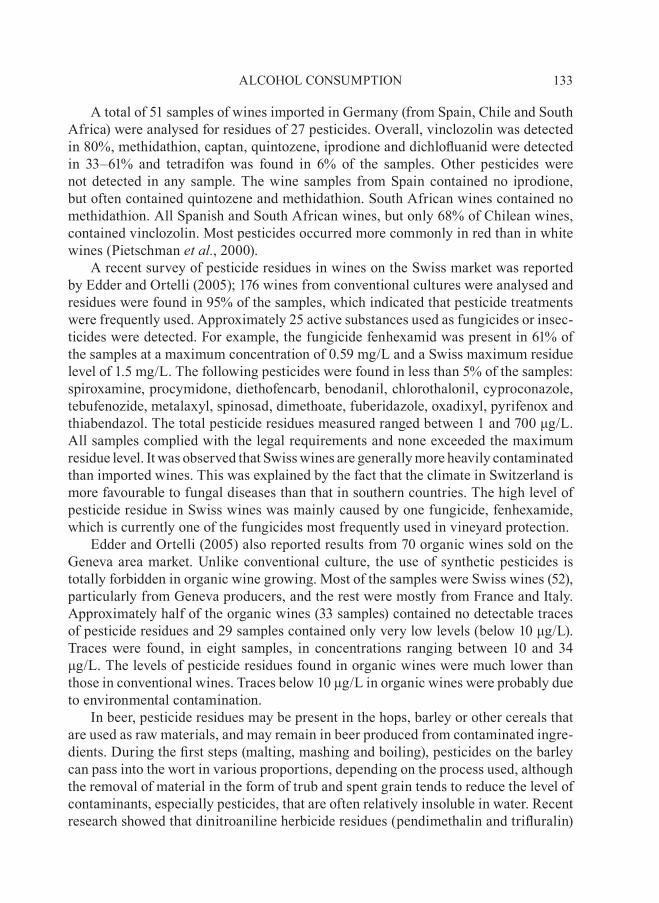
A total of 51 samples of wines imported in Germany (from Spain, Chile and South Africa) were analysed for residues of 27 pesticides. Overall, vinclozolin was detected in 80%, methidathion, captan, quintozene, iprodione and dichlofluanid were detected in 33–61% and tetradifon was found in 6% of the samples. Other pesticides were not detected in any sample. The wine samples from Spain contained no iprodione, but often contained quintozene and methidathion. South African wines contained no methidathion. All Spanish and South African wines, but only 68% of Chilean wines, contained vinclozolin. Most pesticides occurred more commonly in red than in white wines (Pietschman et.al ., 2000).
A recent survey of pesticide residues in wines on the Swiss market was reported by Edder and Ortelli (2005); 176 wines from conventional cultures were analysed and residues were found in 95% of the samples, which indicated that pesticide treatments were frequently used. Approximately 25 active substances used as fungicides or insec-ticides were detected. For example, the fungicide fenhexamid was present in 61% of the samples at a maximum concentration of 0.59 mg/L and a Swiss maximum residue level of 1.5 mg/L. The following pesticides were found in less than 5% of the samples: spiroxamine, procymidone, diethofencarb, benodanil, chlorothalonil, cyproconazole, tebufenozide, metalaxyl, spinosad, dimethoate, fuberidazole, oxadixyl, pyrifenox and thiabendazol. The total pesticide residues measured ranged between 1 and 700 μg/L. All samples complied with the legal requirements and none exceeded the maximum residue level. It was observed that Swiss wines are generally more heavily contaminated than imported wines. This was explained by the fact that the climate in Switzerland is more favourable to fungal diseases than that in southern countries. The high level of pesticide residue in Swiss wines was mainly caused by one fungicide, fenhexamide, which is currently one of the fungicides most frequently used in vineyard protection.
Edder and Ortelli (2005) also reported results from 70 organic wines sold on the Geneva area market. Unlike conventional culture, the use of synthetic pesticides is totally forbidden in organic wine growing. Most of the samples were Swiss wines (52), particularly from Geneva producers, and the rest were mostly from France and Italy. Approximately half of the organic wines (33 samples) contained no detectable traces of pesticide residues and 29 samples contained only very low levels (below 10 μg/L). Traces were found, in eight samples, in concentrations ranging between 10 and 34 μg/L. The levels of pesticide residues found in organic wines were much lower than those in conventional wines. Traces below 10 µg/L in organic wines were probably due to environmental contamination.
In beer, pesticide residues may be present in the hops, barley or other cereals that are used as raw materials, and may remain in beer produced from contaminated ingre-dients. During the first steps (malting, mashing and boiling), pesticides on the barley can pass into the wort in various proportions, depending on the process used, although the removal of material in the form of trub and spent grain tends to reduce the level of contaminants, especially pesticides, that are often relatively insoluble in water. Recent research showed that dinitroaniline herbicide residues (pendimethalin and trifluralin)
133ALCOHOL CONSUMPTION
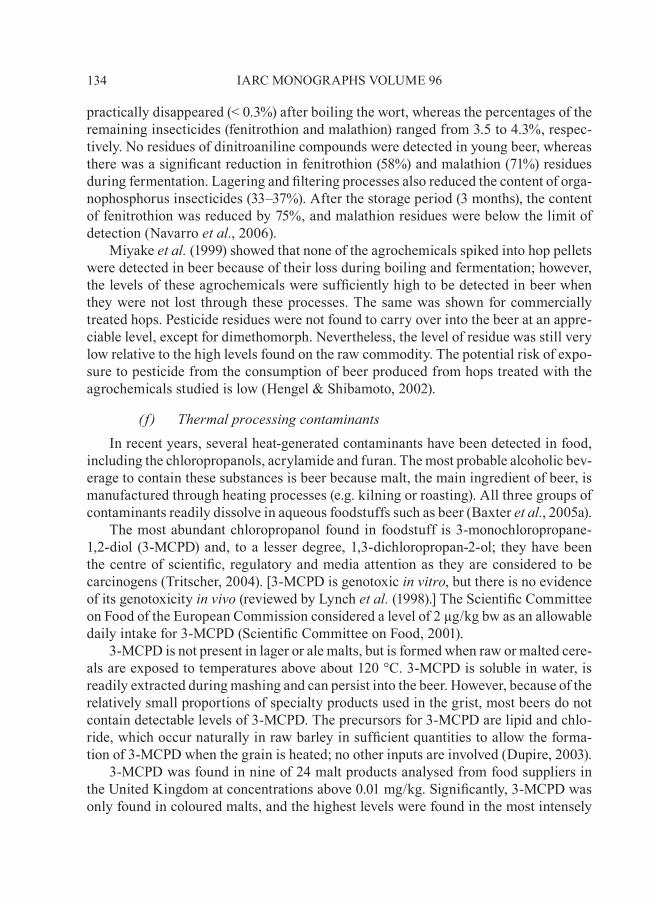
practically disappeared (< 0.3%) after boiling the wort, whereas the percentages of the remaining insecticides (fenitrothion and malathion) ranged from 3.5 to 4.3%, respec-tively. No residues of dinitroaniline compounds were detected in young beer, whereas there was a significant reduction in fenitrothion (58%) and malathion (71%) residues during fermentation. Lagering and filtering processes also reduced the content of orga-nophosphorus insecticides (33–37%). After the storage period (3 months), the content of fenitrothion was reduced by 75%, and malathion residues were below the limit of detection (Navarro et.al ., 2006).
Miyake et.al . (1999) showed that none of the agrochemicals spiked into hop pellets were detected in beer because of their loss during boiling and fermentation; however, the levels of these agrochemicals were sufficiently high to be detected in beer when they were not lost through these processes. The same was shown for commercially treated hops. Pesticide residues were not found to carry over into the beer at an appre-ciable level, except for dimethomorph. Nevertheless, the level of residue was still very low relative to the high levels found on the raw commodity. The potential risk of expo-sure to pesticide from the consumption of beer produced from hops treated with the agrochemicals studied is low (Hengel & Shibamoto, 2002).
( f ). Thermal.processing.contaminantsIn recent years, several heat-generated contaminants have been detected in food,
including the chloropropanols, acrylamide and furan. The most probable alcoholic bev-erage to contain these substances is beer because malt, the main ingredient of beer, is manufactured through heating processes (e.g. kilning or roasting). All three groups of contaminants readily dissolve in aqueous foodstuffs such as beer (Baxter et.al ., 2005a).
The most abundant chloropropanol found in foodstuff is 3-monochloropropane-1,2-diol (3-MCPD) and, to a lesser degree, 1,3-dichloropropan-2-ol; they have been the centre of scientific, regulatory and media attention as they are considered to be carcinogens (Tritscher, 2004). [3-MCPD is genotoxic in.vitro, but there is no evidence of its genotoxicity in.vivo (reviewed by Lynch et.al . (1998).] The Scientific Committee on Food of the European Commission considered a level of 2 µg/kg bw as an allowable daily intake for 3-MCPD (Scientific Committee on Food, 2001).
3-MCPD is not present in lager or ale malts, but is formed when raw or malted cere-als are exposed to temperatures above about 120 °C. 3-MCPD is soluble in water, is readily extracted during mashing and can persist into the beer. However, because of the relatively small proportions of specialty products used in the grist, most beers do not contain detectable levels of 3-MCPD. The precursors for 3-MCPD are lipid and chlo-ride, which occur naturally in raw barley in sufficient quantities to allow the forma-tion of 3-MCPD when the grain is heated; no other inputs are involved (Dupire, 2003).
3-MCPD was found in nine of 24 malt products analysed from food suppliers in the United Kingdom at concentrations above 0.01 mg/kg. Significantly, 3-MCPD was only found in coloured malts, and the highest levels were found in the most intensely
134 IARC MONOGRAPHS VOLUME 96
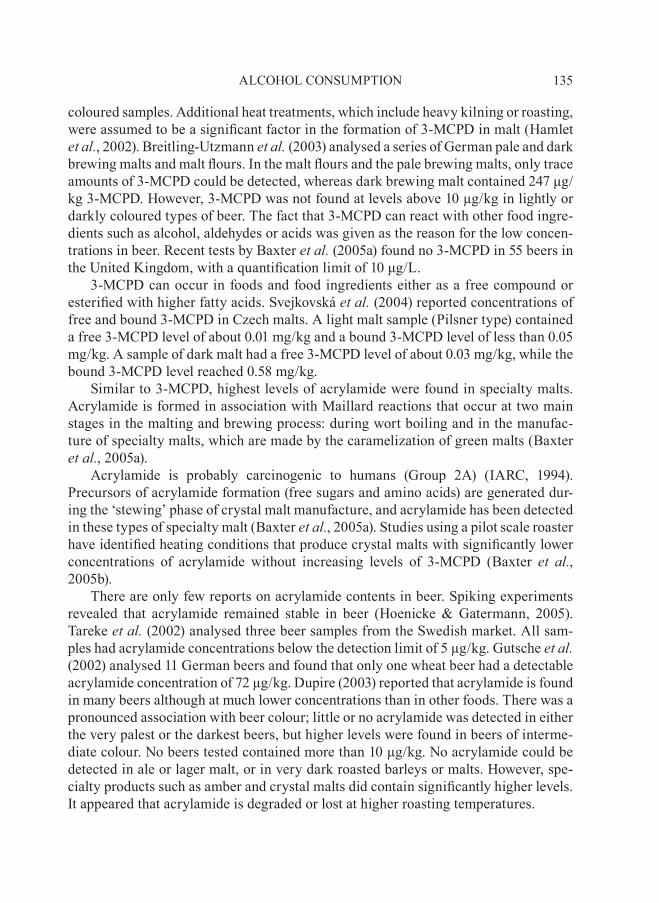
coloured samples. Additional heat treatments, which include heavy kilning or roasting, were assumed to be a significant factor in the formation of 3-MCPD in malt (Hamlet et.al ., 2002). Breitling-Utzmann et.al . (2003) analysed a series of German pale and dark brewing malts and malt flours. In the malt flours and the pale brewing malts, only trace amounts of 3-MCPD could be detected, whereas dark brewing malt contained 247 μg/kg 3-MCPD. However, 3-MCPD was not found at levels above 10 µg/kg in lightly or darkly coloured types of beer. The fact that 3-MCPD can react with other food ingre-dients such as alcohol, aldehydes or acids was given as the reason for the low concen-trations in beer. Recent tests by Baxter et.al . (2005a) found no 3-MCPD in 55 beers in the United Kingdom, with a quantification limit of 10 μg/L.
3-MCPD can occur in foods and food ingredients either as a free compound or esterified with higher fatty acids. Svejkovská et.al . (2004) reported concentrations of free and bound 3-MCPD in Czech malts. A light malt sample (Pilsner type) contained a free 3-MCPD level of about 0.01 mg/kg and a bound 3-MCPD level of less than 0.05 mg/kg. A sample of dark malt had a free 3-MCPD level of about 0.03 mg/kg, while the bound 3-MCPD level reached 0.58 mg/kg.
Similar to 3-MCPD, highest levels of acrylamide were found in specialty malts. Acrylamide is formed in association with Maillard reactions that occur at two main stages in the malting and brewing process: during wort boiling and in the manufac-ture of specialty malts, which are made by the caramelization of green malts (Baxter et.al ., 2005a).
Acrylamide is probably carcinogenic to humans (Group 2A) (IARC, 1994). Precursors of acrylamide formation (free sugars and amino acids) are generated dur-ing the ‘stewing’ phase of crystal malt manufacture, and acrylamide has been detected in these types of specialty malt (Baxter et.al ., 2005a). Studies using a pilot scale roaster have identified heating conditions that produce crystal malts with significantly lower concentrations of acrylamide without increasing levels of 3-MCPD (Baxter et. al ., 2005b).
There are only few reports on acrylamide contents in beer. Spiking experiments revealed that acrylamide remained stable in beer (Hoenicke & Gatermann, 2005). Tareke et.al . (2002) analysed three beer samples from the Swedish market. All sam-ples had acrylamide concentrations below the detection limit of 5 µg/kg. Gutsche et.al . (2002) analysed 11 German beers and found that only one wheat beer had a detectable acrylamide concentration of 72 µg/kg. Dupire (2003) reported that acrylamide is found in many beers although at much lower concentrations than in other foods. There was a pronounced association with beer colour; little or no acrylamide was detected in either the very palest or the darkest beers, but higher levels were found in beers of interme-diate colour. No beers tested contained more than 10 µg/kg. No acrylamide could be detected in ale or lager malt, or in very dark roasted barleys or malts. However, spe-cialty products such as amber and crystal malts did contain significantly higher levels. It appeared that acrylamide is degraded or lost at higher roasting temperatures.
135ALCOHOL CONSUMPTION
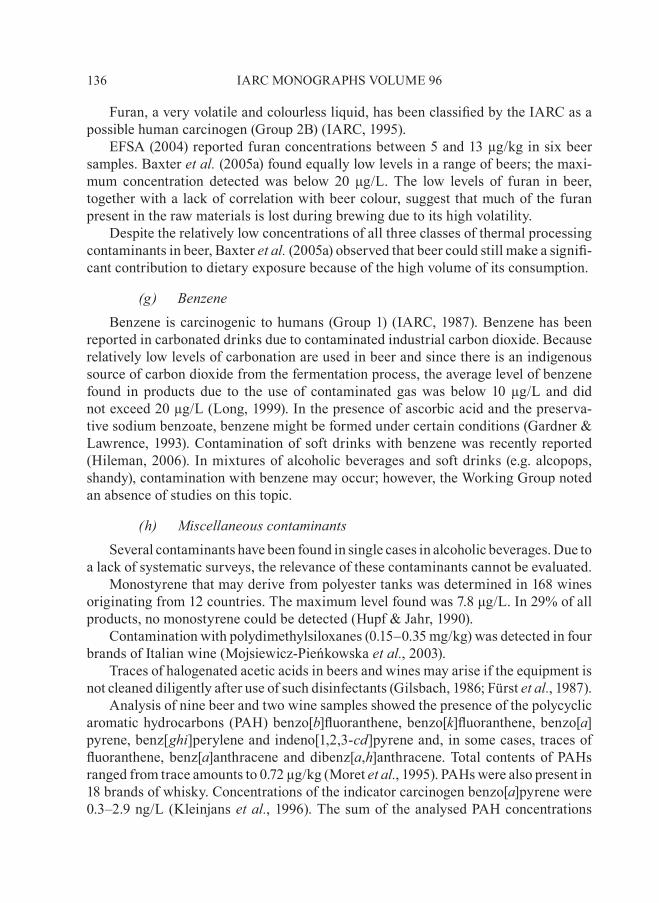
Furan, a very volatile and colourless liquid, has been classified by the IARC as a possible human carcinogen (Group 2B) (IARC, 1995).
EFSA (2004) reported furan concentrations between 5 and 13 µg/kg in six beer samples. Baxter et.al . (2005a) found equally low levels in a range of beers; the maxi-mum concentration detected was below 20 μg/L. The low levels of furan in beer, together with a lack of correlation with beer colour, suggest that much of the furan present in the raw materials is lost during brewing due to its high volatility.
Despite the relatively low concentrations of all three classes of thermal processing contaminants in beer, Baxter et.al . (2005a) observed that beer could still make a signifi-cant contribution to dietary exposure because of the high volume of its consumption.
(g). BenzeneBenzene is carcinogenic to humans (Group 1) (IARC, 1987). Benzene has been
reported in carbonated drinks due to contaminated industrial carbon dioxide. Because relatively low levels of carbonation are used in beer and since there is an indigenous source of carbon dioxide from the fermentation process, the average level of benzene found in products due to the use of contaminated gas was below 10 µg/L and did not exceed 20 µg/L (Long, 1999). In the presence of ascorbic acid and the preserva-tive sodium benzoate, benzene might be formed under certain conditions (Gardner & Lawrence, 1993). Contamination of soft drinks with benzene was recently reported (Hileman, 2006). In mixtures of alcoholic beverages and soft drinks (e.g. alcopops, shandy), contamination with benzene may occur; however, the Working Group noted an absence of studies on this topic.
(h). Miscellaneous.contaminantsSeveral contaminants have been found in single cases in alcoholic beverages. Due to
a lack of systematic surveys, the relevance of these contaminants cannot be evaluated.Monostyrene that may derive from polyester tanks was determined in 168 wines
originating from 12 countries. The maximum level found was 7.8 μg/L. In 29% of all products, no monostyrene could be detected (Hupf & Jahr, 1990).
Contamination with polydimethylsiloxanes (0.15–0.35 mg/kg) was detected in four brands of Italian wine (Mojsiewicz-Pieńkowska et.al ., 2003).
Traces of halogenated acetic acids in beers and wines may arise if the equipment is not cleaned diligently after use of such disinfectants (Gilsbach, 1986; Fürst et.al ., 1987).
Analysis of nine beer and two wine samples showed the presence of the polycyclic aromatic hydrocarbons (PAH) benzo[b]fluoranthene, benzo[k]fluoranthene, benzo[a]pyrene, benz[ghi]perylene and indeno[1,2,3-cd]pyrene and, in some cases, traces of fluoranthene, benz[a]anthracene and dibenz[a,h]anthracene. Total contents of PAHs ranged from trace amounts to 0.72 µg/kg (Moret et.al ., 1995). PAHs were also present in 18 brands of whisky. Concentrations of the indicator carcinogen benzo[a]pyrene were 0.3–2.9 ng/L (Kleinjans et.al ., 1996). The sum of the analysed PAH concentrations
136 IARC MONOGRAPHS VOLUME 96
in 26 aged alcoholic beverages ranged from zero for a white wine to 172 ng/L for a ‘brandy de Jerez solera’. Benzo[a]pyrene was found at concentrations below 10 ng/L (García-Falcón & Simal-Gándara, 2005).
1.7 Biomarkers, biomonitoring and aspects of survey measurement
In the following, two aspects of the measurement of alcohol are highlighted that are particularly relevant to epidemiological assessment of alcoholic beverage consump-tion: the use of biomarkers and the assessment of lifetime exposure. For a recent over-view of other aspects of measurement, see Gmel and Rehm (2004).
1.7.1. Biomarkers.and.biomonitoring
(a). Blood.alcohol.concentrationNo laboratory test is sufficiently reliable alone to support a diagnosis of alcohol-
ism. Sensitivities and specificities vary considerably and depend on the population concerned. The merits and limitations of traditional and newer biomarkers for alco-hol abuse (and abstinence) have been examined critically and reviewed (Sharpe, 2001; Musshoff, 2002).
Some conventional biomarkers are described briefly below (Sharpe, 2001).
(b). Ethanol.in.body.fluidsMeasurement of alcohol concentrations in blood, urine and breath has a limited,
but important role. The results provide no information regarding the severity of alco-hol drinking but, when positive, do give objective evidence of recent drinking and can identify increased tolerance.
(c). serum.γ-glutamyl.transferaseSerum γ-glutamyl transferase (γGT) activity is increased in the serum of patients
with hepatobiliary disorders and in individuals with fairly heavy consumption of alco-hol. Serum levels of γGT have been found to be elevated in about 75% of individu-als who are alcohol-dependent, with a range in sensitivity of 60–90%. In the general population, progressively higher serum γGT activities are associated with levels of alcohol consumption. Elevated serum γGT is found in 20% of men and 15% of women who consume ~40 g alcohol per day and in 40–50% of men and 30% of women who drink more than 60 g/day. γGT is primarily an indicator of chronic consumption of large amounts of alcohol and is not increased by binge drinking in non-alcohol abus-ers, unless there is concomitant liver disease. The half-life of γGT is between 14 and 26 days and its level usually returns to normal in 4–5 weeks after drinking ceases. As well as low sensitivity in some clinical situations, one of the major drawbacks to γGT as a marker of excessive alcohol consumption is its lack of specificity, which can vary
137ALCOHOL CONSUMPTION
from 55 to 100%. Numerous other disorders and drugs can elevate γGT and produce false-positive results, including biliary tract disease, non-alcoholic liver disease, obes-ity, smoking, diabetes.mellitus, inflammation and antidepressants. Although γGT is not an ideal screening marker, it is useful in the confirmation of a clinical suspicion of alcoholism.
(d). serum.transaminasesAspartate aminotransferase (AST) and alanine aminotranferase (ALT) concen-
trations in serum are often higher in patients who are alcoholics, although generally not more than 2–4 times the upper normal limits; sensitivities are 25–60% for AST and 15–40% for ALT. Serum levels depend markedly on the degree of liver damage and how recently alcohol has been consumed. Acute alcohol intakes of 3–4 g/kg body weight (bw) can lead to a moderate transient increase in AST in healthy subjects within 24–48h. The AST:ATL ratio improves the test: a ratio > 1.5 strongly suggests, and a ratio > 2.0 is almost indicative of, alcohol-induced damage of the liver. One study has shown that the AST:ALT ratio is the best of several markers to distinguish between alcohol-induced and non-alcoholic liver diseases.
(e). Mean.corpuscular.volumeAn increased mean corpuscular volume (MCV) follows chronic heavy alcohol
drinking and correlates with both the amount and frequency of alcohol ingestion, but it may take at least 1 month of drinking more than 60 g alcohol daily to raise the MCV above the reference range. It then takes several months of abstinence for MCV to return to normal. The main weakness of MCV is its low sensitivity (40–50%), but its specifi-city is high (80–90%) and very few abstainers and social drinkers have elevated MCV values.
( f ). LipidsAlthough increased high-density lipoprotein cholesterol or triglycerides can raise
suspicion of excessive alcoholic beverage consumption, neither has sufficient sensitiv-ity or specificity to be of use in diagnosis and monitoring.
The conventional marker γGT continues to be the test that combines greatest con-venience and sensitivity. Its diagnostic accuracy can be enhanced by combination with other traditional markers such as AST, ALT and MCV (Sharpe, 2001).
The development in chromatographic techniques has enhanced the possibilities for the determination of new and innovative biomarkers of alcohol abuse. New tests have been shown to be useful not only to indicate previous ethanol ingestion, but also to approximate intake and the time when ethanol ingestion has occurred. For such pur-poses, the determination of ethyl glucuronide in serum or urine samples, the analysis of 5-hydroxytryptophol in urine or the analysis of fatty acid ethyl esters appear to be useful (Musshoff, 2002). These new markers could also be detected in hair (Fig. 1.7).
138 IARC MONOGRAPHS VOLUME 96
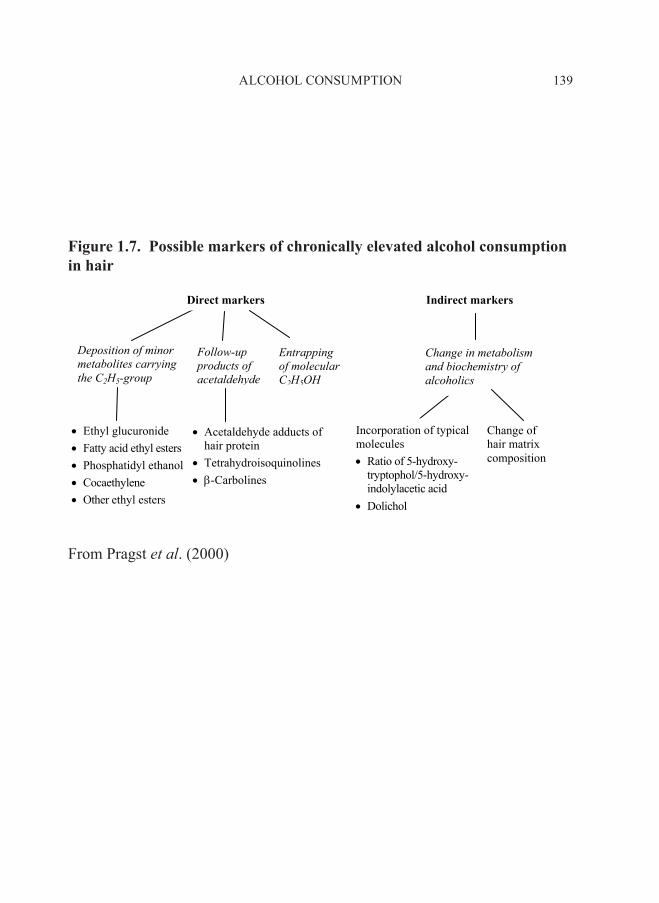
ALCOHOL CONSUMPTION 139
Figure 1.7. Possible markers of chronically elevated alcohol consumption in hair
Indirect markers
Deposition.of.minor.metabolites.carrying.the.C2h5-group
Follow-up.products.of.acetaldehyde
Change of hair matrix composition
Incorporation of typical molecules Ratio of 5-hydroxy-
tryptophol/5-hydroxy-indolylacetic acid
Dolichol
Change.in.metabolism.and.biochemistry.of.alcoholics
Entrappingof.molecularC2h5oh
Acetaldehyde adducts of hair protein
Tetrahydroisoquinolines -Carbolines
Ethyl glucuronide Fatty acid ethyl esters Phosphatidyl ethanol Cocaethylene Other ethyl esters
Direct markers
From Pragst et.al. (2000)
140 IARC MONOGRAPHS VOLUME 96
A well known advantage of hair analysis is that compounds with a relative short life-time in blood can be entrapped and are detectable for a long time and at a relatively high concentration in this sample material; hair analysis could provide a good test for the measurement of alcohol consumption (Pragst et.al ., 2000)
1.8 Regulations on alcohol1.8.1. regulations.on.the.composition.of.alcoholic.beverages
The Codex.alimentarius was created in 1963 by FAO and WHO to develop interna-tional food standards and guidelines. For alcoholic beverages, the Codex Standards for food additives (Codex.alimentarius, 2006), for natural flavourings (Codex.alimentar-ius, 1987) and contaminants (Codex.alimentarius, 1997) are of special interest. These standards are discussed in detail in Sections 1.6.6 and 1.6.7. In general, the standards provide some information about suitable additives for alcoholic beverages with maxi-mum levels for certain substances. Maximum levels are also given for certain bio-logically active substances in natural flavourings. Due to advances in food production and surveillance, the concentrations of some contaminants (e.g. nitrosamines in beer, lead in wine) have been significantly reduced over the past years (see Section 1.6.7 for details). The standards have been incorporated into the national legislation of the majority of countries. However, some countries may impose more specific or more stringent regulations. For example, the European Union has published detailed regula-tions for food additives and even defines certain categories of spirits such as whisky, rum and vodka (European Council, 1989).
1.8.2. regulations.on.alcoholic.beverage.consumption
The available data on regulations for alcoholic beverages for the majority of the WHO Member States have been reviewed by the Global Status Report: Alcohol Policy (WHO, 2004), and the following brief discussion relies mainly on that report.
Regulations for alcoholic beverages are often referred to as alcohol policy or alco-hol control policy. Alcohol policy can be defined as measures put in place to control the supply and/or affect the demand for alcoholic beverages, minimize alcohol-related harm and promote public health in a population. This includes education and treat-ment programmes, alcohol control and harm-reduction strategies. To alleviate or miti-gate the burden of alcoholic beverages on societies, most countries have employed some strategies across time to limit or regulate alcoholic beverage consumption and the distribution of alcoholic beverages. Some of these measures have been due to pub-lic health concerns, and others have been based on religious considerations or qual-ity control of products, or have been introduced to eliminate private-profit interest or increase government revenue. The different measures can be broadly divided into three main groups: population-based policies, problem-directed policies and direct interventions. The first group are policies that are aimed at altering levels of alco-holic beverage consumption among the population as a whole. They include taxation,
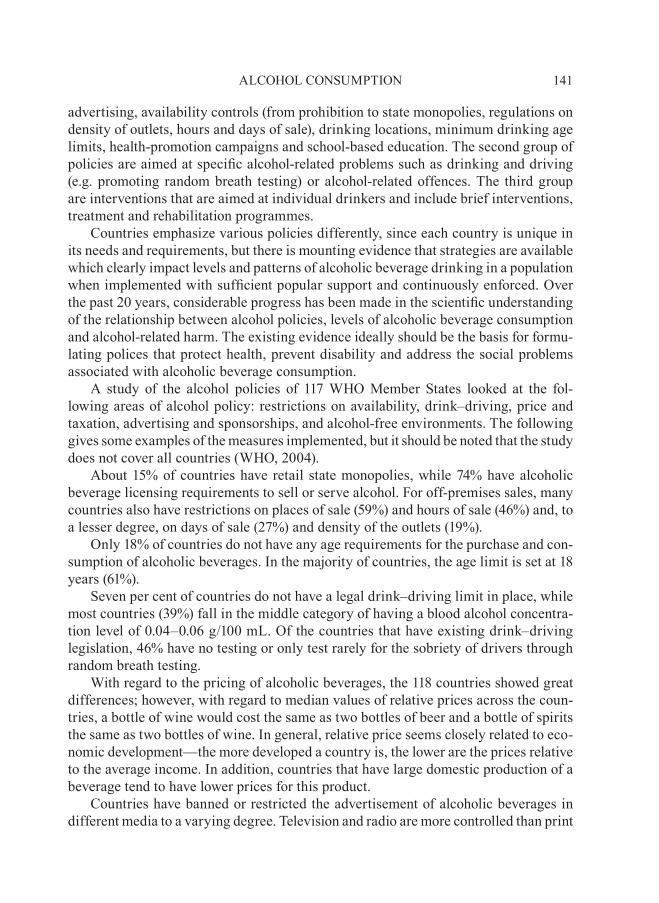
141ALCOHOL CONSUMPTION
advertising, availability controls (from prohibition to state monopolies, regulations on density of outlets, hours and days of sale), drinking locations, minimum drinking age limits, health-promotion campaigns and school-based education. The second group of policies are aimed at specific alcohol-related problems such as drinking and driving (e.g. promoting random breath testing) or alcohol-related offences. The third group are interventions that are aimed at individual drinkers and include brief interventions, treatment and rehabilitation programmes.
Countries emphasize various policies differently, since each country is unique in its needs and requirements, but there is mounting evidence that strategies are available which clearly impact levels and patterns of alcoholic beverage drinking in a population when implemented with sufficient popular support and continuously enforced. Over the past 20 years, considerable progress has been made in the scientific understanding of the relationship between alcohol policies, levels of alcoholic beverage consumption and alcohol-related harm. The existing evidence ideally should be the basis for formu-lating polices that protect health, prevent disability and address the social problems associated with alcoholic beverage consumption.
A study of the alcohol policies of 117 WHO Member States looked at the fol-lowing areas of alcohol policy: restrictions on availability, drink–driving, price and taxation, advertising and sponsorships, and alcohol-free environments. The following gives some examples of the measures implemented, but it should be noted that the study does not cover all countries (WHO, 2004).
About 15% of countries have retail state monopolies, while 74% have alcoholic beverage licensing requirements to sell or serve alcohol. For off-premises sales, many countries also have restrictions on places of sale (59%) and hours of sale (46%) and, to a lesser degree, on days of sale (27%) and density of the outlets (19%).
Only 18% of countries do not have any age requirements for the purchase and con-sumption of alcoholic beverages. In the majority of countries, the age limit is set at 18 years (61%).
Seven per cent of countries do not have a legal drink–driving limit in place, while most countries (39%) fall in the middle category of having a blood alcohol concentra-tion level of 0.04–0.06 g/100 mL. Of the countries that have existing drink–driving legislation, 46% have no testing or only test rarely for the sobriety of drivers through random breath testing.
With regard to the pricing of alcoholic beverages, the 118 countries showed great differences; however, with regard to median values of relative prices across the coun-tries, a bottle of wine would cost the same as two bottles of beer and a bottle of spirits the same as two bottles of wine. In general, relative price seems closely related to eco-nomic development—the more developed a country is, the lower are the prices relative to the average income. In addition, countries that have large domestic production of a beverage tend to have lower prices for this product.
Countries have banned or restricted the advertisement of alcoholic beverages in different media to a varying degree. Television and radio are more controlled than print
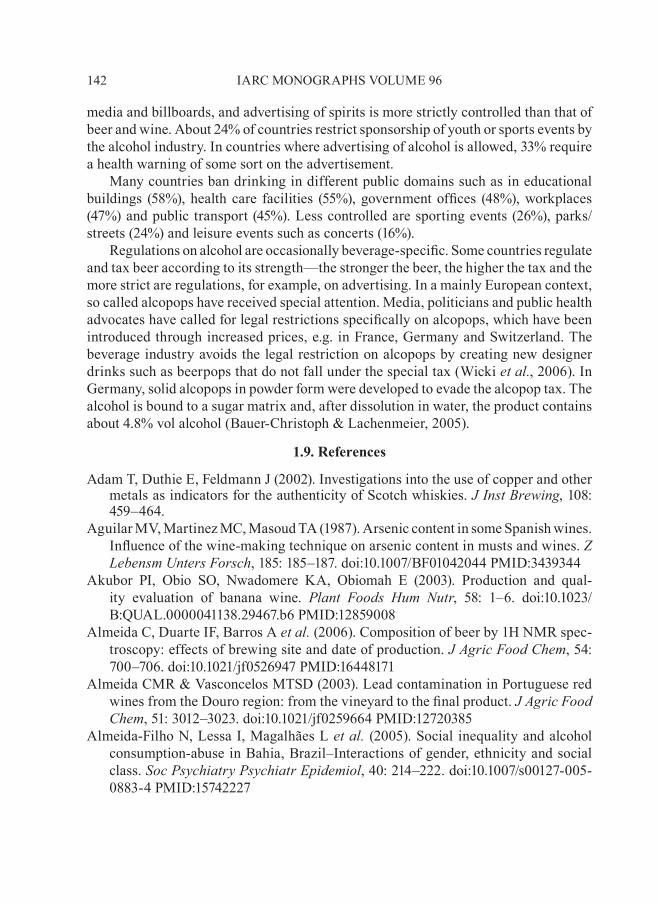
142 IARC MONOGRAPHS VOLUME 96
media and billboards, and advertising of spirits is more strictly controlled than that of beer and wine. About 24% of countries restrict sponsorship of youth or sports events by the alcohol industry. In countries where advertising of alcohol is allowed, 33% require a health warning of some sort on the advertisement.
Many countries ban drinking in different public domains such as in educational buildings (58%), health care facilities (55%), government offices (48%), workplaces (47%) and public transport (45%). Less controlled are sporting events (26%), parks/streets (24%) and leisure events such as concerts (16%).
Regulations on alcohol are occasionally beverage-specific. Some countries regulate and tax beer according to its strength—the stronger the beer, the higher the tax and the more strict are regulations, for example, on advertising. In a mainly European context, so called alcopops have received special attention. Media, politicians and public health advocates have called for legal restrictions specifically on alcopops, which have been introduced through increased prices, e.g. in France, Germany and Switzerland. The beverage industry avoids the legal restriction on alcopops by creating new designer drinks such as beerpops that do not fall under the special tax (Wicki et.al ., 2006). In Germany, solid alcopops in powder form were developed to evade the alcopop tax. The alcohol is bound to a sugar matrix and, after dissolution in water, the product contains about 4.8% vol alcohol (Bauer-Christoph & Lachenmeier, 2005).
1.9. References
Adam T, Duthie E, Feldmann J (2002). Investigations into the use of copper and other metals as indicators for the authenticity of Scotch whiskies. J.Inst.Brewing, 108: 459–464.
Aguilar MV, Martinez MC, Masoud TA (1987). Arsenic content in some Spanish wines. Influence of the wine-making technique on arsenic content in musts and wines. Z.Lebensm.Unters.Forsch, 185: 185–187. doi:10.1007/BF01042044 PMID:3439344
Akubor PI, Obio SO, Nwadomere KA, Obiomah E (2003). Production and qual-ity evaluation of banana wine. plant. Foods. hum. nutr, 58: 1–6. doi:10.1023/B:QUAL.0000041138.29467.b6 PMID:12859008
Almeida C, Duarte IF, Barros A.et.al . (2006). Composition of beer by 1H NMR spec-troscopy: effects of brewing site and date of production. J.agric.Food.Chem, 54: 700–706. doi:10.1021/jf0526947 PMID:16448171
Almeida CMR & Vasconcelos MTSD (2003). Lead contamination in Portuguese red wines from the Douro region: from the vineyard to the final product. J.agric.Food.Chem, 51: 3012–3023. doi:10.1021/jf0259664 PMID:12720385
Almeida-Filho N, Lessa I, Magalhães L.et.al . (2005). Social inequality and alcohol consumption-abuse in Bahia, Brazil–Interactions of gender, ethnicity and social class. soc.psychiatry.psychiatr.Epidemiol, 40: 214–222. doi:10.1007/s00127-005-0883-4 PMID:15742227
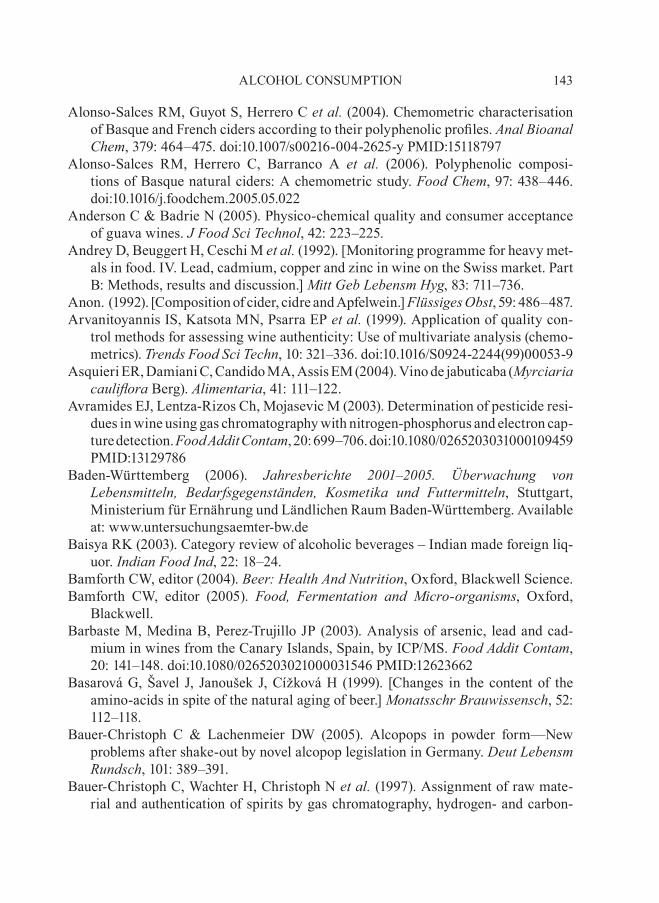
143ALCOHOL CONSUMPTION
Alonso-Salces RM, Guyot S, Herrero C.et.al . (2004). Chemometric characterisation of Basque and French ciders according to their polyphenolic profiles. anal.Bioanal.Chem, 379: 464–475. doi:10.1007/s00216-004-2625-y PMID:15118797
Alonso-Salces RM, Herrero C, Barranco A. et. al . (2006). Polyphenolic composi-tions of Basque natural ciders: A chemometric study. Food.Chem, 97: 438–446. doi:10.1016/j.foodchem.2005.05.022
Anderson C & Badrie N (2005). Physico-chemical quality and consumer acceptance of guava wines. J.Food.sci.Technol, 42: 223–225.
Andrey D, Beuggert H, Ceschi M.et.al . (1992). [Monitoring programme for heavy met-als in food. IV. Lead, cadmium, copper and zinc in wine on the Swiss market. Part B: Methods, results and discussion.] Mitt.geb.Lebensm.hyg, 83: 711–736.
Anon. (1992). [Composition of cider, cidre and Apfelwein.] Flüssiges.obst, 59: 486–487.Arvanitoyannis IS, Katsota MN, Psarra EP.et.al . (1999). Application of quality con-
trol methods for assessing wine authenticity: Use of multivariate analysis (chemo-metrics). Trends.Food.sci.Techn, 10: 321–336. doi:10.1016/S0924-2244(99)00053-9
Asquieri ER, Damiani C, Candido MA, Assis EM (2004). Vino de jabuticaba (Myrciaria.cauliflora Berg). alimentaria, 41: 111–122.
Avramides EJ, Lentza-Rizos Ch, Mojasevic M (2003). Determination of pesticide resi-dues in wine using gas chromatography with nitrogen-phosphorus and electron cap-ture detection. Food.addit.Contam, 20: 699–706. doi:10.1080/0265203031000109459 PMID:13129786
Baden-Württemberg (2006). Jahresberichte. 2001–2005 .. Überwachung. von.Lebensmitteln,. Bedarfsgegenständen,. Kosmetika. und. Futtermitteln, Stuttgart, Ministerium für Ernährung und Ländlichen Raum Baden-Württemberg. Available at: www.untersuchungsaemter-bw.de
Baisya RK (2003). Category review of alcoholic beverages – Indian made foreign liq-uor. Indian.Food.Ind, 22: 18–24.
Bamforth CW, editor (2004). Beer:.health.and.nutrition, Oxford, Blackwell Science.Bamforth CW, editor (2005). Food,. Fermentation. and. Micro-organisms, Oxford,
Blackwell.Barbaste M, Medina B, Perez-Trujillo JP (2003). Analysis of arsenic, lead and cad-
mium in wines from the Canary Islands, Spain, by ICP/MS. Food.addit.Contam, 20: 141–148. doi:10.1080/0265203021000031546 PMID:12623662
Basarová G, Šavel J, Janoušek J, Cížková H (1999). [Changes in the content of the amino-acids in spite of the natural aging of beer.] Monatsschr.Brauwissensch, 52: 112–118.
Bauer-Christoph C & Lachenmeier DW (2005). Alcopops in powder form—New problems after shake-out by novel alcopop legislation in Germany. Deut.Lebensm.rundsch, 101: 389–391.
Bauer-Christoph C, Wachter H, Christoph N.et.al . (1997). Assignment of raw mate-rial and authentication of spirits by gas chromatography, hydrogen- and carbon-
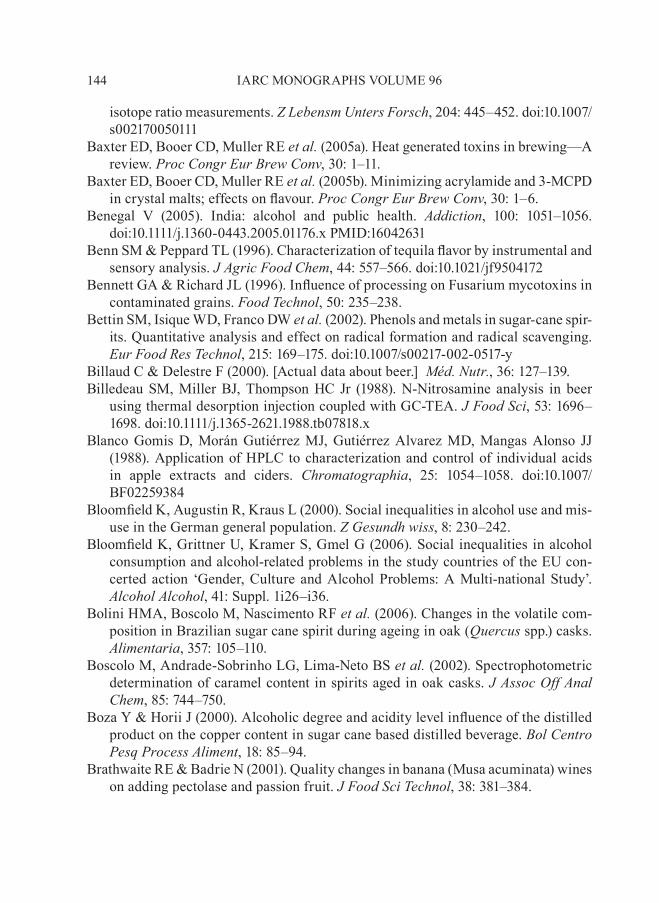
144 IARC MONOGRAPHS VOLUME 96
isotope ratio measurements. Z.Lebensm.Unters.Forsch, 204: 445–452. doi:10.1007/s002170050111
Baxter ED, Booer CD, Muller RE.et.al . (2005a). Heat generated toxins in brewing—A review. proc.Congr.Eur.Brew.Conv, 30: 1–11.
Baxter ED, Booer CD, Muller RE.et.al . (2005b). Minimizing acrylamide and 3-MCPD in crystal malts; effects on flavour. proc.Congr.Eur.Brew.Conv, 30: 1–6.
Benegal V (2005). India: alcohol and public health. addiction, 100: 1051–1056. doi:10.1111/j.1360-0443.2005.01176.x PMID:16042631
Benn SM & Peppard TL (1996). Characterization of tequila flavor by instrumental and sensory analysis. J.agric.Food.Chem, 44: 557–566. doi:10.1021/jf9504172
Bennett GA & Richard JL (1996). Influence of processing on Fusarium mycotoxins in contaminated grains. Food.Technol, 50: 235–238.
Bettin SM, Isique WD, Franco DW.et.al . (2002). Phenols and metals in sugar-cane spir-its. Quantitative analysis and effect on radical formation and radical scavenging. Eur.Food.res.Technol, 215: 169–175. doi:10.1007/s00217-002-0517-y
Billaud C & Delestre F (2000). [Actual data about beer.] Méd ..nutr ., 36: 127–139.Billedeau SM, Miller BJ, Thompson HC Jr (1988). N-Nitrosamine analysis in beer
using thermal desorption injection coupled with GC-TEA. J.Food.sci, 53: 1696–1698. doi:10.1111/j.1365-2621.1988.tb07818.x
Blanco Gomis D, Morán Gutiérrez MJ, Gutiérrez Alvarez MD, Mangas Alonso JJ (1988). Application of HPLC to characterization and control of individual acids in apple extracts and ciders. Chromatographia, 25: 1054–1058. doi:10.1007/BF02259384
Bloomfield K, Augustin R, Kraus L (2000). Social inequalities in alcohol use and mis-use in the German general population. Z.gesundh.wiss, 8: 230–242.
Bloomfield K, Grittner U, Kramer S, Gmel G (2006). Social inequalities in alcohol consumption and alcohol-related problems in the study countries of the EU con-certed action ‘Gender, Culture and Alcohol Problems: A Multi-national Study’. alcohol.alcohol, 41: Suppl. 1i26–i36.
Bolini HMA, Boscolo M, Nascimento RF.et.al . (2006). Changes in the volatile com-position in Brazilian sugar cane spirit during ageing in oak (Quercus spp.) casks. alimentaria, 357: 105–110.
Boscolo M, Andrade-Sobrinho LG, Lima-Neto BS.et.al . (2002). Spectrophotometric determination of caramel content in spirits aged in oak casks. J.assoc.off.anal.Chem, 85: 744–750.
Boza Y & Horii J (2000). Alcoholic degree and acidity level influence of the distilled product on the copper content in sugar cane based distilled beverage. Bol.Centro.pesq.process.aliment, 18: 85–94.
Brathwaite RE & Badrie N (2001). Quality changes in banana (Musa acuminata) wines on adding pectolase and passion fruit. J.Food.sci.Technol, 38: 381–384.
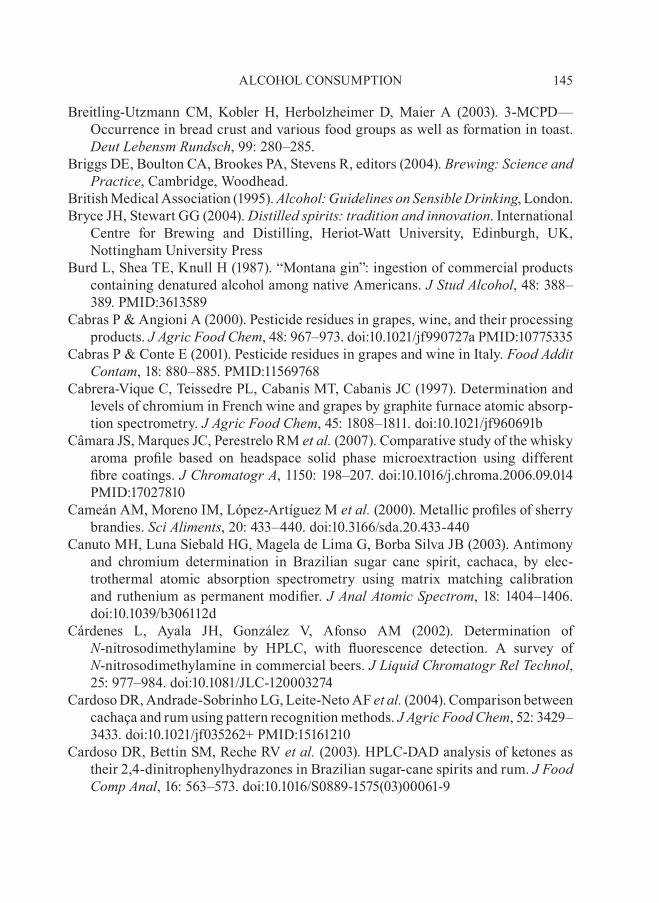
145ALCOHOL CONSUMPTION
Breitling-Utzmann CM, Kobler H, Herbolzheimer D, Maier A (2003). 3-MCPD—Occurrence in bread crust and various food groups as well as formation in toast. Deut.Lebensm.rundsch, 99: 280–285.
Briggs DE, Boulton CA, Brookes PA, Stevens R, editors (2004). Brewing:.science.and.practice, Cambridge, Woodhead.
British Medical Association (1995). alcohol:.guidelines.on.sensible.Drinking, London.Bryce JH, Stewart GG (2004). Distilled.spirits:.tradition.and.innovation. International
Centre for Brewing and Distilling, Heriot-Watt University, Edinburgh, UK, Nottingham University Press
Burd L, Shea TE, Knull H (1987). “Montana gin”: ingestion of commercial products containing denatured alcohol among native Americans. J.stud.alcohol, 48: 388–389. PMID:3613589
Cabras P & Angioni A (2000). Pesticide residues in grapes, wine, and their processing products. J.agric.Food.Chem, 48: 967–973. doi:10.1021/jf990727a PMID:10775335
Cabras P & Conte E (2001). Pesticide residues in grapes and wine in Italy. Food.addit.Contam, 18: 880–885. PMID:11569768
Cabrera-Vique C, Teissedre PL, Cabanis MT, Cabanis JC (1997). Determination and levels of chromium in French wine and grapes by graphite furnace atomic absorp-tion spectrometry. J.agric.Food.Chem, 45: 1808–1811. doi:10.1021/jf960691b
Câmara JS, Marques JC, Perestrelo RM.et.al . (2007). Comparative study of the whisky aroma profile based on headspace solid phase microextraction using different fibre coatings. J.Chromatogr.a, 1150: 198–207. doi:10.1016/j.chroma.2006.09.014 PMID:17027810
Cameán AM, Moreno IM, López-Artíguez M.et.al . (2000). Metallic profiles of sherry brandies. sci.aliments, 20: 433–440. doi:10.3166/sda.20.433-440
Canuto MH, Luna Siebald HG, Magela de Lima G, Borba Silva JB (2003). Antimony and chromium determination in Brazilian sugar cane spirit, cachaca, by elec-trothermal atomic absorption spectrometry using matrix matching calibration and ruthenium as permanent modifier. J.anal.atomic.spectrom, 18: 1404–1406. doi:10.1039/b306112d
Cárdenes L, Ayala JH, González V, Afonso AM (2002). Determination of n-nitrosodimethylamine by HPLC, with fluorescence detection. A survey of n-nitrosodimethylamine in commercial beers. J.Liquid.Chromatogr.rel.Technol, 25: 977–984. doi:10.1081/JLC-120003274
Cardoso DR, Andrade-Sobrinho LG, Leite-Neto AF.et.al . (2004). Comparison between cachaça and rum using pattern recognition methods. J.agric.Food.Chem, 52: 3429–3433. doi:10.1021/jf035262+ PMID:15161210
Cardoso DR, Bettin SM, Reche RV.et.al . (2003). HPLC-DAD analysis of ketones as their 2,4-dinitrophenylhydrazones in Brazilian sugar-cane spirits and rum. J.Food.Comp.anal, 16: 563–573. doi:10.1016/S0889-1575(03)00061-9
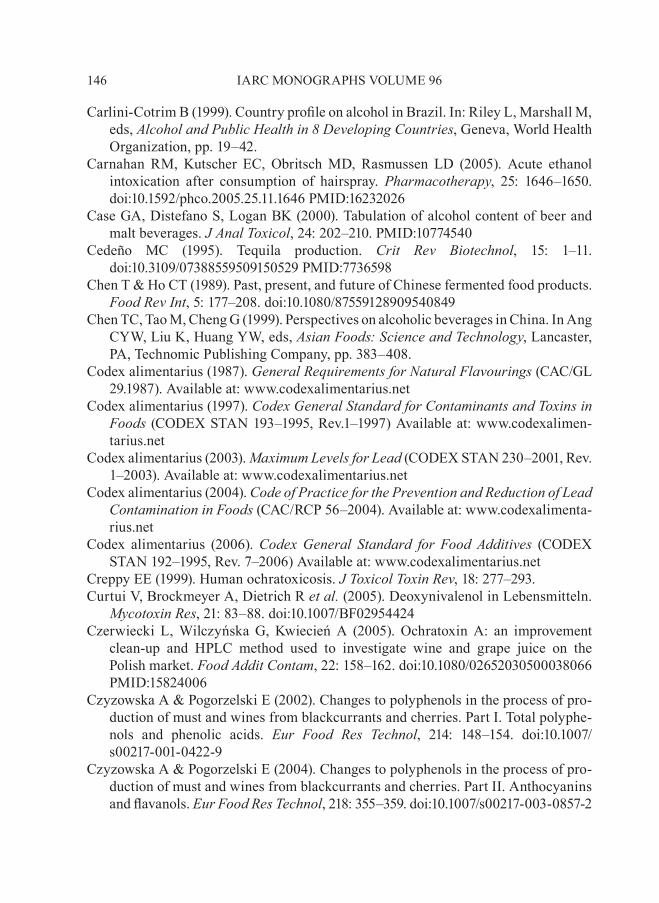
146 IARC MONOGRAPHS VOLUME 96
Carlini-Cotrim B (1999). Country profile on alcohol in Brazil. In: Riley L, Marshall M, eds, alcohol.and.public.health.in.8.Developing.Countries, Geneva, World Health Organization, pp. 19–42.
Carnahan RM, Kutscher EC, Obritsch MD, Rasmussen LD (2005). Acute ethanol intoxication after consumption of hairspray. pharmacotherapy, 25: 1646–1650. doi:10.1592/phco.2005.25.11.1646 PMID:16232026
Case GA, Distefano S, Logan BK (2000). Tabulation of alcohol content of beer and malt beverages. J.anal.Toxicol, 24: 202–210. PMID:10774540
Cedeño MC (1995). Tequila production. Crit. rev. Biotechnol, 15: 1–11. doi:10.3109/07388559509150529 PMID:7736598
Chen T & Ho CT (1989). Past, present, and future of Chinese fermented food products. Food.rev.Int, 5: 177–208. doi:10.1080/87559128909540849
Chen TC, Tao M, Cheng G (1999). Perspectives on alcoholic beverages in China. In Ang CYW, Liu K, Huang YW, eds, asian.Foods:.science.and.Technology, Lancaster, PA, Technomic Publishing Company, pp. 383–408.
Codex alimentarius (1987). general.requirements.for.natural.Flavourings (CAC/GL 29.1987). Available at: www.codexalimentarius.net
Codex alimentarius (1997). Codex.general.standard.for.Contaminants.and.Toxins.in.Foods (CODEx STAN 193–1995, Rev.1–1997) Available at: www.codexalimen-tarius.net
Codex alimentarius (2003). Maximum.Levels.for.Lead (CODEx STAN 230–2001, Rev. 1–2003). Available at: www.codexalimentarius.net
Codex alimentarius (2004). Code.of.practice.for.the.prevention.and.reduction.of.Lead.Contamination.in.Foods (CAC/RCP 56–2004). Available at: www.codexalimenta-rius.net
Codex alimentarius (2006). Codex.general. standard. for. Food.additives (CODEx STAN 192–1995, Rev. 7–2006) Available at: www.codexalimentarius.net
Creppy EE (1999). Human ochratoxicosis. J.Toxicol.Toxin.rev, 18: 277–293.Curtui V, Brockmeyer A, Dietrich R.et.al . (2005). Deoxynivalenol in Lebensmitteln.
Mycotoxin.res, 21: 83–88. doi:10.1007/BF02954424Czerwiecki L, Wilczyńska G, Kwiecień A (2005). Ochratoxin A: an improvement
clean-up and HPLC method used to investigate wine and grape juice on the Polish market. Food.addit.Contam, 22: 158–162. doi:10.1080/02652030500038066 PMID:15824006
Czyzowska A & Pogorzelski E (2002). Changes to polyphenols in the process of pro-duction of must and wines from blackcurrants and cherries. Part I. Total polyphe-nols and phenolic acids. Eur. Food. res. Technol, 214: 148–154. doi:10.1007/s00217-001-0422-9
Czyzowska A & Pogorzelski E (2004). Changes to polyphenols in the process of pro-duction of must and wines from blackcurrants and cherries. Part II. Anthocyanins and flavanols. Eur.Food.res.Technol, 218: 355–359. doi:10.1007/s00217-003-0857-2
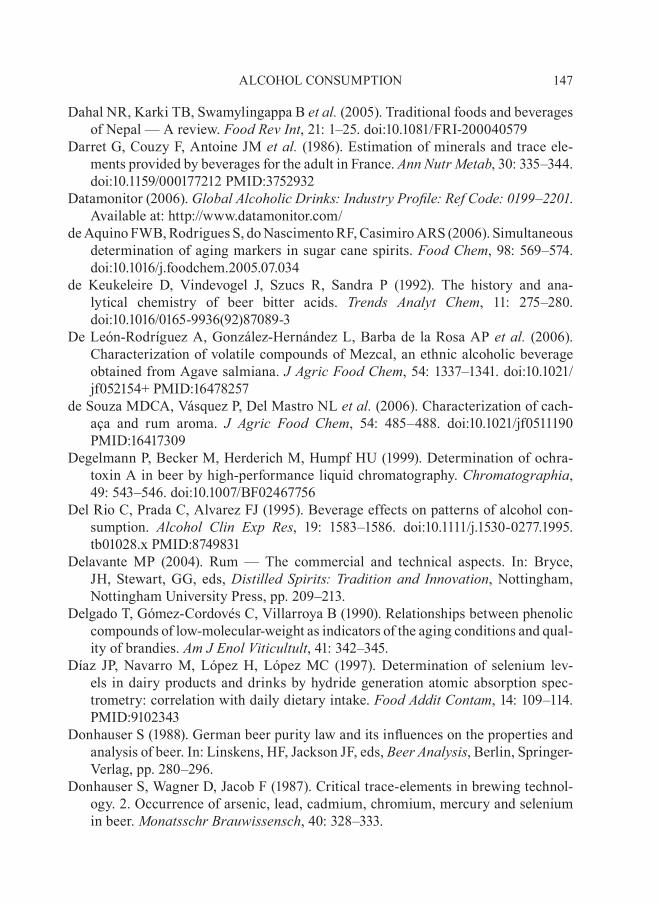
147ALCOHOL CONSUMPTION
Dahal NR, Karki TB, Swamylingappa B.et.al . (2005). Traditional foods and beverages of Nepal — A review. Food.rev.Int, 21: 1–25. doi:10.1081/FRI-200040579
Darret G, Couzy F, Antoine JM.et.al . (1986). Estimation of minerals and trace ele-ments provided by beverages for the adult in France. ann.nutr.Metab, 30: 335–344. doi:10.1159/000177212 PMID:3752932
Datamonitor (2006). global.alcoholic.Drinks:.Industry.profile:.ref.Code:.0199–2201. Available at: http://www.datamonitor.com/
de Aquino FWB, Rodrigues S, do Nascimento RF, Casimiro ARS (2006). Simultaneous determination of aging markers in sugar cane spirits. Food.Chem, 98: 569–574. doi:10.1016/j.foodchem.2005.07.034
de Keukeleire D, Vindevogel J, Szucs R, Sandra P (1992). The history and ana-lytical chemistry of beer bitter acids. Trends. analyt. Chem, 11: 275–280. doi:10.1016/0165-9936(92)87089-3
De León-Rodríguez A, González-Hernández L, Barba de la Rosa AP.et.al . (2006). Characterization of volatile compounds of Mezcal, an ethnic alcoholic beverage obtained from Agave salmiana. J.agric.Food.Chem, 54: 1337–1341. doi:10.1021/jf052154+ PMID:16478257
de Souza MDCA, Vásquez P, Del Mastro NL.et.al . (2006). Characterization of cach-aça and rum aroma. J. agric. Food. Chem, 54: 485–488. doi:10.1021/jf0511190 PMID:16417309
Degelmann P, Becker M, Herderich M, Humpf HU (1999). Determination of ochra-toxin A in beer by high-performance liquid chromatography. Chromatographia, 49: 543–546. doi:10.1007/BF02467756
Del Rio C, Prada C, Alvarez FJ (1995). Beverage effects on patterns of alcohol con-sumption. alcohol. Clin. Exp. res, 19: 1583–1586. doi:10.1111/j.1530-0277.1995.tb01028.x PMID:8749831
Delavante MP (2004). Rum — The commercial and technical aspects. In: Bryce, JH, Stewart, GG, eds, Distilled. spirits:.Tradition.and. Innovation, Nottingham, Nottingham University Press, pp. 209–213.
Delgado T, Gómez-Cordovés C, Villarroya B (1990). Relationships between phenolic compounds of low-molecular-weight as indicators of the aging conditions and qual-ity of brandies. am.J.Enol.Viticultult, 41: 342–345.
Díaz JP, Navarro M, López H, López MC (1997). Determination of selenium lev-els in dairy products and drinks by hydride generation atomic absorption spec-trometry: correlation with daily dietary intake. Food.addit.Contam, 14: 109–114. PMID:9102343
Donhauser S (1988). German beer purity law and its influences on the properties and analysis of beer. In: Linskens, HF, Jackson JF, eds, Beer.analysis, Berlin, Springer-Verlag, pp. 280–296.
Donhauser S, Wagner D, Jacob F (1987). Critical trace-elements in brewing technol-ogy. 2. Occurrence of arsenic, lead, cadmium, chromium, mercury and selenium in beer. Monatsschr.Brauwissensch, 40: 328–333.
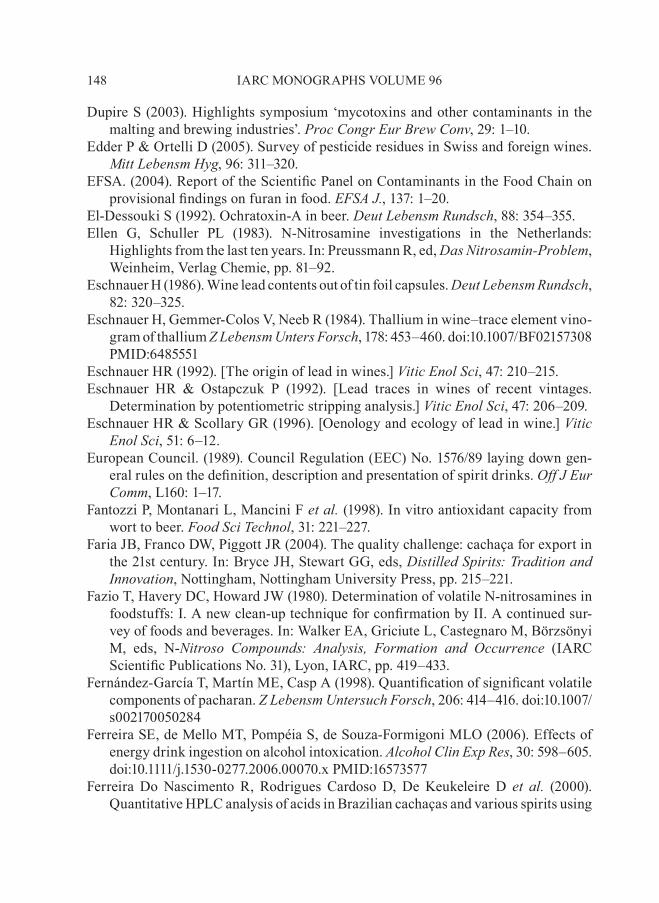
148 IARC MONOGRAPHS VOLUME 96
Dupire S (2003). Highlights symposium ‘mycotoxins and other contaminants in the malting and brewing industries’. proc.Congr.Eur.Brew.Conv, 29: 1–10.
Edder P & Ortelli D (2005). Survey of pesticide residues in Swiss and foreign wines. Mitt.Lebensm.hyg, 96: 311–320.
EFSA. (2004). Report of the Scientific Panel on Contaminants in the Food Chain on provisional findings on furan in food. EFsa.J ., 137: 1–20.
El-Dessouki S (1992). Ochratoxin-A in beer. Deut.Lebensm.rundsch, 88: 354–355.Ellen G, Schuller PL (1983). N-Nitrosamine investigations in the Netherlands:
Highlights from the last ten years. In: Preussmann R, ed, Das.nitrosamin-problem, Weinheim, Verlag Chemie, pp. 81–92.
Eschnauer H (1986). Wine lead contents out of tin foil capsules. Deut.Lebensm.rundsch, 82: 320–325.
Eschnauer H, Gemmer-Colos V, Neeb R (1984). Thallium in wine–trace element vino-gram of thallium Z.Lebensm.Unters.Forsch, 178: 453–460. doi:10.1007/BF02157308 PMID:6485551
Eschnauer HR (1992). [The origin of lead in wines.] Vitic.Enol.sci, 47: 210–215.Eschnauer HR & Ostapczuk P (1992). [Lead traces in wines of recent vintages.
Determination by potentiometric stripping analysis.] Vitic.Enol.sci, 47: 206–209.Eschnauer HR & Scollary GR (1996). [Oenology and ecology of lead in wine.] Vitic.
Enol.sci, 51: 6–12.European Council. (1989). Council Regulation (EEC) No. 1576/89 laying down gen-
eral rules on the definition, description and presentation of spirit drinks. off.J.Eur.Comm, L160: 1–17.
Fantozzi P, Montanari L, Mancini F.et.al . (1998). In vitro antioxidant capacity from wort to beer. Food.sci.Technol, 31: 221–227.
Faria JB, Franco DW, Piggott JR (2004). The quality challenge: cachaça for export in the 21st century. In: Bryce JH, Stewart GG, eds, Distilled.spirits:.Tradition.and.Innovation, Nottingham, Nottingham University Press, pp. 215–221.
Fazio T, Havery DC, Howard JW (1980). Determination of volatile N-nitrosamines in foodstuffs: I. A new clean-up technique for confirmation by II. A continued sur-vey of foods and beverages. In: Walker EA, Griciute L, Castegnaro M, Börzsönyi M, eds, N-nitroso. Compounds:. analysis,. Formation. and. occurrence (IARC Scientific Publications No. 31), Lyon, IARC, pp. 419–433.
Fernández-García T, Martín ME, Casp A (1998). Quantification of significant volatile components of pacharan. Z.Lebensm.Untersuch.Forsch, 206: 414–416. doi:10.1007/s002170050284
Ferreira SE, de Mello MT, Pompéia S, de Souza-Formigoni MLO (2006). Effects of energy drink ingestion on alcohol intoxication. alcohol.Clin.Exp.res, 30: 598–605. doi:10.1111/j.1530-0277.2006.00070.x PMID:16573577
Ferreira Do Nascimento R, Rodrigues Cardoso D, De Keukeleire D. et. al . (2000). Quantitative HPLC analysis of acids in Brazilian cachaças and various spirits using
149ALCOHOL CONSUMPTION
fluorescence detection of their 9-anthrylmethyl esters. J.agric.Food.Chem, 48: 6070–6073. doi:10.1021/jf9905267 PMID:11312779
Ferreira Lima Cavalheiro S, Andrade Sobrinho LG, Bosco Faria J, Bolini Cardello HMA (2003). Influence of aging in copper levels of ‘cachaças’. Bol.Centro.pesq.process.aliment, 21: 99–108.
Filali A, Ouammi L, Betbeder AM. et. al . (2001). Ochratoxin A in beverages from Morocco: a preliminary survey. Food.addit.Contam, 18: 565–568. PMID:11407755
Flad W (1989). Minimizing nitrosamine formation during malt kilning. Brauwelt.Int, 2: 129–134.
Forsyth DS, Sun WF, Dalglish K (1994). Survey of organotin compounds in blended wines. Food.addit.Contam, 11: 343–350. PMID:7926168
Forsyth DS, Weber D, Cléroux C (1992a). Determination of butyltin, cyclohexyltin and phenyltin compounds in beers and wines. Food.addit.Contam, 9: 161–169. PMID:1499773
Forsyth DS, Weber D, Dalglish K (1992b). Survey of butyltin, cyclohexyltin, and phe-nyltin compounds in Canadian wines. J.assoc.off.anal.Chem.Int, 75: 964–973.
Frías S, Díaz C, Conde JE, Pérez Trujillo JP (2003). Selenium and mercury concentra-tions in sweet and dry bottled wines from the Canary Islands, Spain. Food.addit.Contam, 20: 237–240. doi:10.1080/0265203021000050626 PMID:12623647
Fritsch HT & Schieberle P (2005). Identification based on quantitative measurements and aroma recombination of the character impact odorants in a Bavarian Pilsner-type beer. J.agric.Food.Chem, 53: 7544–7551. doi:10.1021/jf051167k PMID:16159184
Fritz G, Jauer H, Meklenborg M, Rühl CS (1998). Flüchtige N-Nitrosamine in Biermischgetränken Bundesgesundheitsblaut, 41: 278–279. doi:10.1007/BF03042974
Frommberger R (1985). Nitrat, Nitrit, Nitrosamine in Lebensmitteln pflanzlicher Herkunft. Ernährungs-Umschau, 32: 47–50.
Frommberger R (1989). N-Nitrosodimethylamine in German beer. Food.Chem.Toxicol, 27: 27–29. doi:10.1016/0278-6915(89)90088-4 PMID:2703190
Frommberger R, Allmann H (1983). Ergebnisse der Lebensmittelüberwachung in der Bundesrepublik Deutschland. In: Preussmann R, ed, Das.nitrosamin-problem, Weinheim, Verlag Chemie, pp. 57–63.
Fukal L, Prosek J, Rakosova A (1990). [Radiochemical determination of aflatoxin in barley, malt and beer.] Monatsschr.Brauwissensch, 43: 212–215.
Fürst P, Krüger C, Habersaat K, Groebel W (1987). Halogenated carboxylic-acids in beverages — Gas chromatographic determination and confirmation by gas chro-matography/mass spectrometry with negative chemical ionization. Z. Lebensm.Untersuch.Forsch, 185: 17–20.
Garai G, Dueñas MT, Irastorza A.et.al . (2006). Biogenic amines in natural ciders. J.Food.prot, 69: 3006–3012. PMID:17186671
150 IARC MONOGRAPHS VOLUME 96
García-Esparza MA, Capri E, Pirzadeh P, Trevisan M (2006). Copper con-tent of grape and wine from Italian farms. Food. addit. Contam, 23: 274–280. doi:10.1080/02652030500429117 PMID:16517529
García-Falcón MS & Simal-Gándara J (2005). Determination of polycyclic aromatic hydrocarbons in alcoholic drinks and the identification of their potential sources. Food.addit.Contam, 22: 791–797. doi:10.1080/02652030500198498 PMID:16192065
Garda J, Martins-Macedo R, Badiale-Furlong E (2004). Determination of trichothecenes in beer and evaluation of occurrence in the product commercialized in Rio Grande do Sul. Cienc.Tecnol.aliment, 24: 657–663.
Gardner LK & Lawrence GD (1993). Benzene production from decarboxylation of benzoic acid in the presence of ascorbic acid and a transition-metal catalyst. J.agric.Food.Chem, 41: 693–695. doi:10.1021/jf00029a001
Garruti DS, Franco MRB, da Silva MAAP. et. al . (2006). Assessment of aroma impact compounds in a cashew apple-based alcoholic beverage by GC-MS and GC-olfactometry. LWT-Food.sci.Technol, 39: 372–377.
Gavinelli M, Fanelli R, Bonfanti M.et.al . (1988). Volatile nitrosamines in foods and beverages: preliminary survey of the Italian market. Bull.Environ.Contam.Toxicol, 40: 41–46. doi:10.1007/BF01689384 PMID:3345364
Geahchan A, Khalife C, Chambon P, Chambon R (1991). Analysis of anisated fer-mented grape distillates by gas–liquid chromatography. J. Food.Comp.anal, 4: 304–314. doi:10.1016/0889-1575(91)90016-Y
Gerhäuser C (2005). Beer constituents as potential cancer chemopreventive agents. Eur.J.Cancer, 41: 1941–1954. doi:10.1016/j.ejca.2005.04.012 PMID:15953717
Gerstenberg H (2000). Über den natürlichen Zitronensäuregehalt von Bier. Brauwelt, 140: 856–857.
Giesbrecht N, Greenfield TK, Lemmens P, Österberg E (2000). Estimating alcohol consumption: measurement and policy issues related to legal sources of alcohol. Contemp.Drug.probl, 27: 221–233.
Gilsbach W (1986). Gas chromatographic determination of mono-halogenated acetic acids in beer and wine-containing drinks. Deut.Lebensm.rundsch, 82: 107–111.
Glatthar J, Senn T, Pieper HJ (2001). Investigations on reducing the methanol content in distilled spirits made of bartlett pears. Deut.Lebensm.rundsch, 97: 209–216.
Glória MBA, Barbour JF, Scanlan RA (1997). n-Nitrosodimethylamine in Brazilian, US domestic and US imported beers. J.agric.Food.Chem, 45: 814–816. doi:10.1021/jf960523j
Gmel G & Rehm J (2004). Measuring alcohol consumption. Contemp.Drug.probl, 31: 467–540.
Gmel G, Truan P, François Y (1999). Alcoholic beverage preferences and self-reported problems in Switzerland. subst. Use. Misuse, 34: 1619–1645. doi:10.3109/10826089909039419 PMID:10499412
151ALCOHOL CONSUMPTION
Goff EU & Fine DH (1979). Analysis of volatile N-nitrosamines in alcoholic bev-erages. Food. Cosmet. Toxicol, 17: 569–573. doi:10.1016/0015-6264(79)90115-9 PMID:546693
Goldberg DM, Hoffman B, Yang J, Soleas GJ (1999). Phenolic constituents, furans, and total antioxidant status of distilled spirits. J.agric.Food.Chem, 47: 3978–3985. doi:10.1021/jf9811626 PMID:10552753
Gorinstein S, Caspi A, Zemser M, Trakhtenberg S (2000). Comparative contents of some phenolics in beer, red and white wines. nutr.res, 20: 131–139. doi:10.1016/S0271-5317(99)00145-1
Graves K & Kaskutas LA (2002). Beverage choice among native american and afri-can american urban women. alcohol.Clin.Exp.res, 26: 218–222. PMID:11964561
Greenfield TK, Midanik LT, Rogers JD (2000). A 10-year national trend study of alco-hol consumption, 1984–1995: is the period of declining drinking over? am.J.public.health, 90: 47–52. doi:10.2105/AJPH.90.1.47 PMID:10630136
Guido LF (2005). How do sulfites help to control beer aging? Cerevisia, 30: 132–138.Guillou C, Jamin E, Martin GJ.et.al . (2001). Isotopic analyses of wine and of products
derived from grape. Bull ..oIV, 74: 26–36.Gureje O (1999). Country profile on alcohol in Nigeria. In: Riley L, Marshall M, ed,
alcohol. and. public. health. in. 8. Developing. Countries, Geneva, World Health Organization, pp. 101–120.
Gutsche B, Weisshaar R, Buhlert J (2002). Acrylamide in food — Screening results from food control in Baden-Württemberg. Deut.Lebensm.rundsch, 98: 437–443.
Halliday DJ (2004). Tradition and innovation in the Scotch whisky industry. In: Bryce JH, Stewart GG, eds, Distilled. spirits:. Tradition. and. Innovation, Nottingham, Nottingham University Press, pp. 1–12.
Hamlet CG, Jayaratne SM, Matthews W (2002). 3-Monochloropropane-1,2-diol (3-MCPD) in food ingredients from UK food producers and ingredient suppliers. Food.addit.Contam, 19: 15–21. doi:10.1080/02652030110072344 PMID:11817372
Hengel MJ & Shibamoto T (2002). Method development and fate determination of pesticide-treated hops and their subsequent usage in the production of beer. J.agric.Food.Chem, 50: 3412–3418. doi:10.1021/jf020089n PMID:12033804
Herce-Pagliai C, González G, Camean AM, Repetto M (1999). Presence and dis-tribution of arsenical species in beers. Food. addit. Contam, 16: 267–271. doi:10.1080/026520399284037 PMID:10560580
Herce-Pagliai C, Moreno I, González G.et.al . (2002). Determination of total arsenic, inorganic and organic arsenic species in wine. Food.addit.Contam, 19: 542–546. doi:10.1080/02652030110113762 PMID:12042019
Hettige S, Paranagama D (2005). Gender and alcohol in Sri Lanka. In: Obot I, Room R, ed, alcohol.gender.and.Drinking.problems:.perspectives.from.Low.and.Middle.Income.Countries, Geneva, World Health Organization, pp. 167–188.
Hight SC (1996). Lead migration from lead crystal wine glasses. Food.addit.Contam, 13: 747–765. PMID:8885316
152 IARC MONOGRAPHS VOLUME 96
Hileman B (2006). Dispute over benzene in drinks. Chem.Eng.news, 84: 10Hlywka JJ & Bullerman LB (1999). Occurrence of fumonisin B1 and B2 in beer. Food.
addit.Contam, 16: 319–324. doi:10.1080/026520399283885 PMID:10645345Hoenicke K & Gatermann R (2005). Studies on the stability of acrylamide in food dur-
ing storage. J.assoc.off.anal.Chem.Int, 88: 268–273.Höhler D (1998). Ochratoxin A in food and feed: occurrence, legislation and mode of
action. Z.Ernahrungswiss, 37: 2–12. PMID:9556861Hupf H & Jahr D (1990). Styrene contents in foreign wines. Deut.Lebensm.rundsch,
86: 321–322.IARC (1978). Some N-nitroso compounds. IarC.Monogr.Eval.Carcinog.risk.Chem.
Man, 17: 1–349. PMID:150392IARC (1987). Overall evaluations of carcinogenicity: an updating of IARC Monographs
volumes 1 to 42. IarC. Monogr. Eval. Carcinog. risks. hum. suppl, 7: 1–440. PMID:3482203
IARC (1988). Alcohol Drinking. IarC.Monogr.Eval.Carcinog.risks.hum, 44: 1–378. PMID:3236394
IARC (1993a). Some naturally occurring substances: food items and constituents, het-erocyclic aromatic amines and mycotoxins. IarC.Monogr.Eval.Carcinog.risks.hum, 56: 1–599.
IARC (1993b). Beryllium, cadmium, mercury, and exposures in the glass manufactur-ing industry. IarC.Monogr.Eval.Carcinog.risks.hum, 58: 1–415. PMID:8022054
IARC (1994). Some industrial chemicals. IarC.Monogr.Eval.Carcinog.risks.hum, 60: 1–560. PMID:7869568
IARC (1995). Dry cleaning, some chlorinated solvents and other industrial chemicals. IarC.Monogr.Eval.Carcinog.risks.hum, 63: 1–551.
IARC (2002). Some traditional herbal medicines, some mycotoxins, naphthalene and styrene. IarC.Monogr.Eval.Carcinog.risks.hum, 82: 1–556. PMID:12687954
IARC (2006). Inorganic and organic lead compounds. IarC.Monogr.Eval.Carcinog.risks.hum, 87: 1–471. PMID:17191367
Ibanga A, Adetula A, Dagona Z (2005). The contexts of alcohol consumption by men and women in Nigeria. In: Obot I, Room R, eds, alcohol,.gender.and.Drinking.problems.in.Low.and.Middle.Income.Countries, Geneva, World Health Organisation, pp. 143–166.
ICAP (International Center for Alcohol Policies) (2006). The.structure.of.Beverage.alcohol.Industry. (ICAP Report 17), Washington
Ilett DR (1995). Aspects of the analysis, role, and fate of sulphur dioxide in beer — A review. Tech.Q.Master.Brew.assoc.am, 32: 213–221.
Iwami A, Kajiwara Y, Takashita H.et.al . (2006). Factor analysis of the fermentation process in barley shochu production. J.Inst.Brewing, 112: 50–56.
Iwami A, Kajiwara Y, Takashita H, Omori T (2005). Effect of the variety of barley and pearling rate on the quality of shochu koji. J.Inst.Brewing, 111: 309–315.
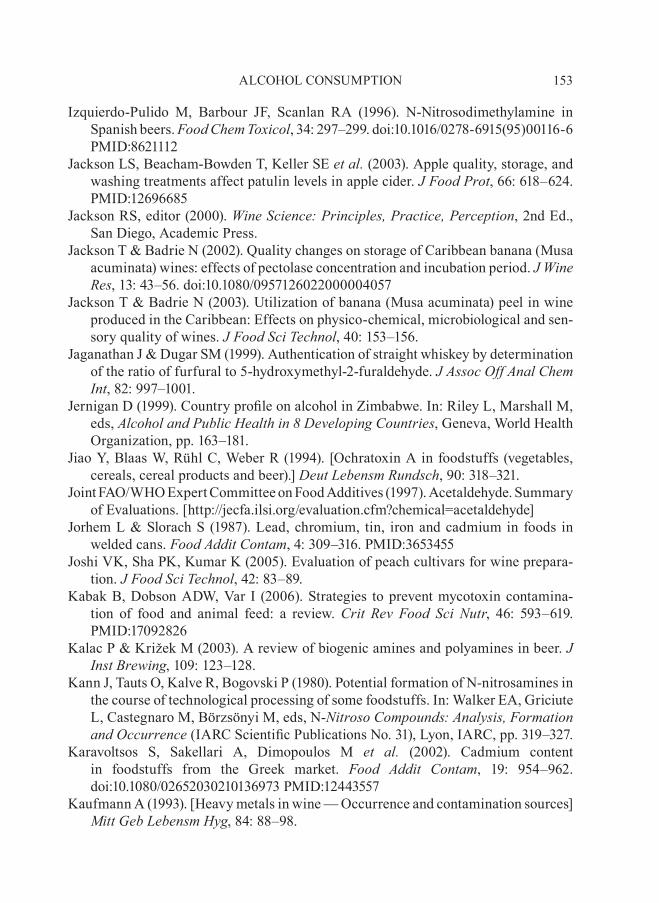
153ALCOHOL CONSUMPTION
Izquierdo-Pulido M, Barbour JF, Scanlan RA (1996). N-Nitrosodimethylamine in Spanish beers. Food.Chem.Toxicol, 34: 297–299. doi:10.1016/0278-6915(95)00116-6 PMID:8621112
Jackson LS, Beacham-Bowden T, Keller SE.et.al . (2003). Apple quality, storage, and washing treatments affect patulin levels in apple cider. J.Food.prot, 66: 618–624. PMID:12696685
Jackson RS, editor (2000). Wine.science:.principles,.practice,.perception, 2nd Ed., San Diego, Academic Press.
Jackson T & Badrie N (2002). Quality changes on storage of Caribbean banana (Musa acuminata) wines: effects of pectolase concentration and incubation period. J.Wine.res, 13: 43–56. doi:10.1080/0957126022000004057
Jackson T & Badrie N (2003). Utilization of banana (Musa acuminata) peel in wine produced in the Caribbean: Effects on physico-chemical, microbiological and sen-sory quality of wines. J.Food.sci.Technol, 40: 153–156.
Jaganathan J & Dugar SM (1999). Authentication of straight whiskey by determination of the ratio of furfural to 5-hydroxymethyl-2-furaldehyde. J.assoc.off.anal.Chem.Int, 82: 997–1001.
Jernigan D (1999). Country profile on alcohol in Zimbabwe. In: Riley L, Marshall M, eds, alcohol.and.public.health.in.8.Developing.Countries, Geneva, World Health Organization, pp. 163–181.
Jiao Y, Blaas W, Rühl C, Weber R (1994). [Ochratoxin A in foodstuffs (vegetables, cereals, cereal products and beer).] Deut.Lebensm.rundsch, 90: 318–321.
Joint FAO/WHO Expert Committee on Food Additives (1997). Acetaldehyde. Summary of Evaluations. [http://jecfa.ilsi.org/evaluation.cfm?chemical=acetaldehyde]
Jorhem L & Slorach S (1987). Lead, chromium, tin, iron and cadmium in foods in welded cans. Food.addit.Contam, 4: 309–316. PMID:3653455
Joshi VK, Sha PK, Kumar K (2005). Evaluation of peach cultivars for wine prepara-tion. J.Food.sci.Technol, 42: 83–89.
Kabak B, Dobson ADW, Var I (2006). Strategies to prevent mycotoxin contamina-tion of food and animal feed: a review. Crit. rev. Food. sci. nutr, 46: 593–619. PMID:17092826
Kalac P & Križek M (2003). A review of biogenic amines and polyamines in beer. J.Inst.Brewing, 109: 123–128.
Kann J, Tauts O, Kalve R, Bogovski P (1980). Potential formation of N-nitrosamines in the course of technological processing of some foodstuffs. In: Walker EA, Griciute L, Castegnaro M, Börzsönyi M, eds, N-nitroso.Compounds:.analysis,.Formation.and.occurrence (IARC Scientific Publications No. 31), Lyon, IARC, pp. 319–327.
Karavoltsos S, Sakellari A, Dimopoulos M. et. al . (2002). Cadmium content in foodstuffs from the Greek market. Food. addit. Contam, 19: 954–962. doi:10.1080/02652030210136973 PMID:12443557
Kaufmann A (1993). [Heavy metals in wine — Occurrence and contamination sources]Mitt.geb.Lebensm.hyg, 84: 88–98.
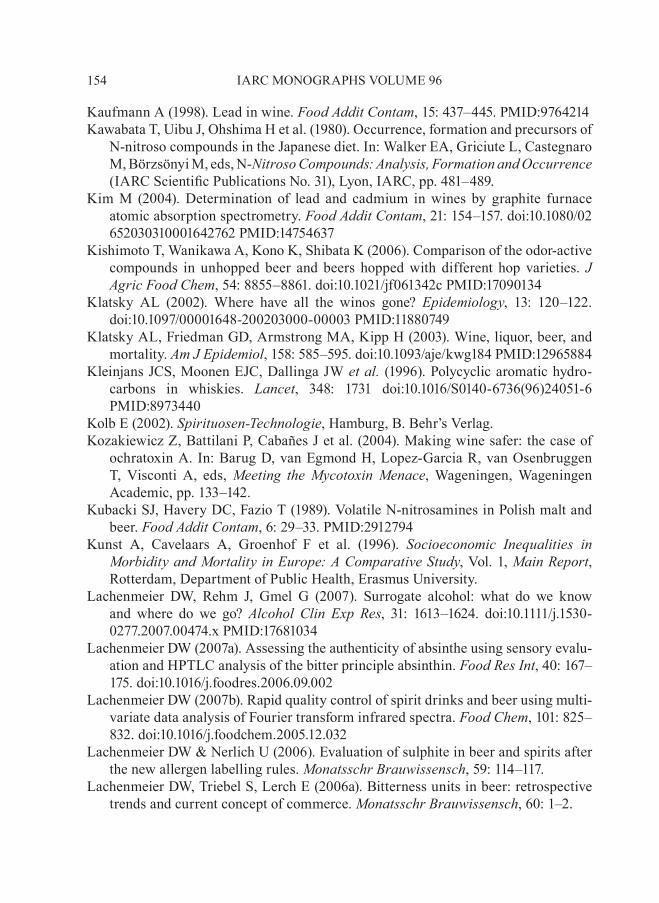
154 IARC MONOGRAPHS VOLUME 96
Kaufmann A (1998). Lead in wine. Food.addit.Contam, 15: 437–445. PMID:9764214Kawabata T, Uibu J, Ohshima H et al. (1980). Occurrence, formation and precursors of
N-nitroso compounds in the Japanese diet. In: Walker EA, Griciute L, Castegnaro M, Börzsönyi M, eds, N-nitroso.Compounds:.analysis,.Formation.and.occurrence (IARC Scientific Publications No. 31), Lyon, IARC, pp. 481–489.
Kim M (2004). Determination of lead and cadmium in wines by graphite furnace atomic absorption spectrometry. Food.addit.Contam, 21: 154–157. doi:10.1080/02652030310001642762 PMID:14754637
Kishimoto T, Wanikawa A, Kono K, Shibata K (2006). Comparison of the odor-active compounds in unhopped beer and beers hopped with different hop varieties. J.agric.Food.Chem, 54: 8855–8861. doi:10.1021/jf061342c PMID:17090134
Klatsky AL (2002). Where have all the winos gone? Epidemiology, 13: 120–122. doi:10.1097/00001648-200203000-00003 PMID:11880749
Klatsky AL, Friedman GD, Armstrong MA, Kipp H (2003). Wine, liquor, beer, and mortality. am.J.Epidemiol, 158: 585–595. doi:10.1093/aje/kwg184 PMID:12965884
Kleinjans JCS, Moonen EJC, Dallinga JW.et.al . (1996). Polycyclic aromatic hydro-carbons in whiskies. Lancet, 348: 1731 doi:10.1016/S0140-6736(96)24051-6 PMID:8973440
Kolb E (2002). spirituosen-Technologie, Hamburg, B. Behr’s Verlag.Kozakiewicz Z, Battilani P, Cabañes J et al. (2004). Making wine safer: the case of
ochratoxin A. In: Barug D, van Egmond H, Lopez-Garcia R, van Osenbruggen T, Visconti A, eds, Meeting. the.Mycotoxin.Menace, Wageningen, Wageningen Academic, pp. 133–142.
Kubacki SJ, Havery DC, Fazio T (1989). Volatile N-nitrosamines in Polish malt and beer. Food.addit.Contam, 6: 29–33. PMID:2912794
Kunst A, Cavelaars A, Groenhof F et al. (1996). socioeconomic. Inequalities. in.Morbidity.and.Mortality.in.Europe:.a.Comparative.study, Vol. 1, Main.report, Rotterdam, Department of Public Health, Erasmus University.
Lachenmeier DW, Rehm J, Gmel G (2007). Surrogate alcohol: what do we know and where do we go? alcohol. Clin. Exp. res, 31: 1613–1624. doi:10.1111/j.1530-0277.2007.00474.x PMID:17681034
Lachenmeier DW (2007a). Assessing the authenticity of absinthe using sensory evalu-ation and HPTLC analysis of the bitter principle absinthin. Food.res.Int, 40: 167–175. doi:10.1016/j.foodres.2006.09.002
Lachenmeier DW (2007b). Rapid quality control of spirit drinks and beer using multi-variate data analysis of Fourier transform infrared spectra. Food.Chem, 101: 825–832. doi:10.1016/j.foodchem.2005.12.032
Lachenmeier DW & Nerlich U (2006). Evaluation of sulphite in beer and spirits after the new allergen labelling rules. Monatsschr.Brauwissensch, 59: 114–117.
Lachenmeier DW, Triebel S, Lerch E (2006a). Bitterness units in beer: retrospective trends and current concept of commerce. Monatsschr.Brauwissensch, 60: 1–2.
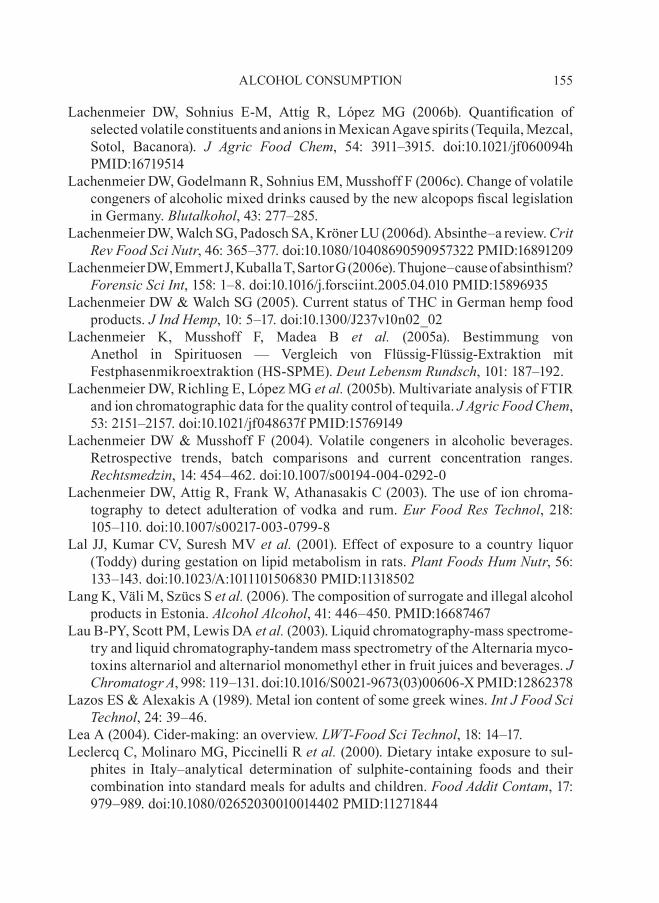
155ALCOHOL CONSUMPTION
Lachenmeier DW, Sohnius E-M, Attig R, López MG (2006b). Quantification of selected volatile constituents and anions in Mexican Agave spirits (Tequila, Mezcal, Sotol, Bacanora). J. agric. Food. Chem, 54: 3911–3915. doi:10.1021/jf060094h PMID:16719514
Lachenmeier DW, Godelmann R, Sohnius EM, Musshoff F (2006c). Change of volatile congeners of alcoholic mixed drinks caused by the new alcopops fiscal legislation in Germany. Blutalkohol, 43: 277–285.
Lachenmeier DW, Walch SG, Padosch SA, Kröner LU (2006d). Absinthe–a review. Crit.rev.Food.sci.nutr, 46: 365–377. doi:10.1080/10408690590957322 PMID:16891209
Lachenmeier DW, Emmert J, Kuballa T, Sartor G (2006e). Thujone–cause of absinthism? Forensic.sci.Int, 158: 1–8. doi:10.1016/j.forsciint.2005.04.010 PMID:15896935
Lachenmeier DW & Walch SG (2005). Current status of THC in German hemp food products. J.Ind.hemp, 10: 5–17. doi:10.1300/J237v10n02_02
Lachenmeier K, Musshoff F, Madea B. et. al . (2005a). Bestimmung von Anethol in Spirituosen — Vergleich von Flüssig-Flüssig-Extraktion mit Festphasenmikroextraktion (HS-SPME). Deut.Lebensm.rundsch, 101: 187–192.
Lachenmeier DW, Richling E, López MG.et.al . (2005b). Multivariate analysis of FTIR and ion chromatographic data for the quality control of tequila. J.agric.Food.Chem, 53: 2151–2157. doi:10.1021/jf048637f PMID:15769149
Lachenmeier DW & Musshoff F (2004). Volatile congeners in alcoholic beverages. Retrospective trends, batch comparisons and current concentration ranges. rechtsmedzin, 14: 454–462. doi:10.1007/s00194-004-0292-0
Lachenmeier DW, Attig R, Frank W, Athanasakis C (2003). The use of ion chroma-tography to detect adulteration of vodka and rum. Eur.Food.res.Technol, 218: 105–110. doi:10.1007/s00217-003-0799-8
Lal JJ, Kumar CV, Suresh MV.et.al . (2001). Effect of exposure to a country liquor (Toddy) during gestation on lipid metabolism in rats. plant.Foods.hum.nutr, 56: 133–143. doi:10.1023/A:1011101506830 PMID:11318502
Lang K, Väli M, Szücs S.et.al . (2006). The composition of surrogate and illegal alcohol products in Estonia. alcohol.alcohol, 41: 446–450. PMID:16687467
Lau B-PY, Scott PM, Lewis DA.et.al . (2003). Liquid chromatography-mass spectrome-try and liquid chromatography-tandem mass spectrometry of the Alternaria myco-toxins alternariol and alternariol monomethyl ether in fruit juices and beverages. J.Chromatogr.a, 998: 119–131. doi:10.1016/S0021-9673(03)00606-x PMID:12862378
Lazos ES & Alexakis A (1989). Metal ion content of some greek wines. Int.J.Food.sci.Technol, 24: 39–46.
Lea A (2004). Cider-making: an overview. LWT-Food.sci.Technol, 18: 14–17.Leclercq C, Molinaro MG, Piccinelli R.et.al . (2000). Dietary intake exposure to sul-
phites in Italy–analytical determination of sulphite-containing foods and their combination into standard meals for adults and children. Food.addit.Contam, 17: 979–989. doi:10.1080/02652030010014402 PMID:11271844
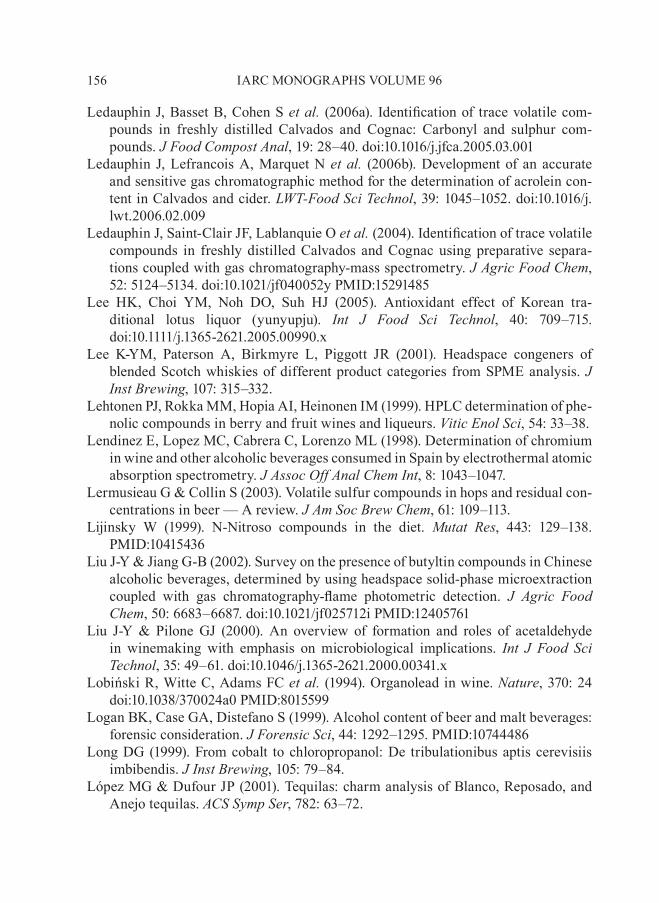
156 IARC MONOGRAPHS VOLUME 96
Ledauphin J, Basset B, Cohen S.et.al . (2006a). Identification of trace volatile com-pounds in freshly distilled Calvados and Cognac: Carbonyl and sulphur com-pounds. J.Food.Compost.anal, 19: 28–40. doi:10.1016/j.jfca.2005.03.001
Ledauphin J, Lefrancois A, Marquet N. et.al . (2006b). Development of an accurate and sensitive gas chromatographic method for the determination of acrolein con-tent in Calvados and cider. LWT-Food.sci.Technol, 39: 1045–1052. doi:10.1016/j.lwt.2006.02.009
Ledauphin J, Saint-Clair JF, Lablanquie O.et.al . (2004). Identification of trace volatile compounds in freshly distilled Calvados and Cognac using preparative separa-tions coupled with gas chromatography-mass spectrometry. J.agric.Food.Chem, 52: 5124–5134. doi:10.1021/jf040052y PMID:15291485
Lee HK, Choi YM, Noh DO, Suh HJ (2005). Antioxidant effect of Korean tra-ditional lotus liquor (yunyupju). Int. J. Food. sci. Technol, 40: 709–715. doi:10.1111/j.1365-2621.2005.00990.x
Lee K-YM, Paterson A, Birkmyre L, Piggott JR (2001). Headspace congeners of blended Scotch whiskies of different product categories from SPME analysis. J.Inst.Brewing, 107: 315–332.
Lehtonen PJ, Rokka MM, Hopia AI, Heinonen IM (1999). HPLC determination of phe-nolic compounds in berry and fruit wines and liqueurs. Vitic.Enol.sci, 54: 33–38.
Lendinez E, Lopez MC, Cabrera C, Lorenzo ML (1998). Determination of chromium in wine and other alcoholic beverages consumed in Spain by electrothermal atomic absorption spectrometry. J.assoc.off.anal.Chem.Int, 8: 1043–1047.
Lermusieau G & Collin S (2003). Volatile sulfur compounds in hops and residual con-centrations in beer — A review. J.am.soc.Brew.Chem, 61: 109–113.
Lijinsky W (1999). N-Nitroso compounds in the diet. Mutat. res, 443: 129–138. PMID:10415436
Liu J-Y & Jiang G-B (2002). Survey on the presence of butyltin compounds in Chinese alcoholic beverages, determined by using headspace solid-phase microextraction coupled with gas chromatography-flame photometric detection. J. agric. Food.Chem, 50: 6683–6687. doi:10.1021/jf025712i PMID:12405761
Liu J-Y & Pilone GJ (2000). An overview of formation and roles of acetaldehyde in winemaking with emphasis on microbiological implications. Int. J. Food. sci.Technol, 35: 49–61. doi:10.1046/j.1365-2621.2000.00341.x
Lobiński R, Witte C, Adams FC.et.al . (1994). Organolead in wine. nature, 370: 24 doi:10.1038/370024a0 PMID:8015599
Logan BK, Case GA, Distefano S (1999). Alcohol content of beer and malt beverages: forensic consideration. J.Forensic.sci, 44: 1292–1295. PMID:10744486
Long DG (1999). From cobalt to chloropropanol: De tribulationibus aptis cerevisiis imbibendis. J.Inst.Brewing, 105: 79–84.
López MG & Dufour JP (2001). Tequilas: charm analysis of Blanco, Reposado, and Anejo tequilas. aCs.symp.ser, 782: 63–72.
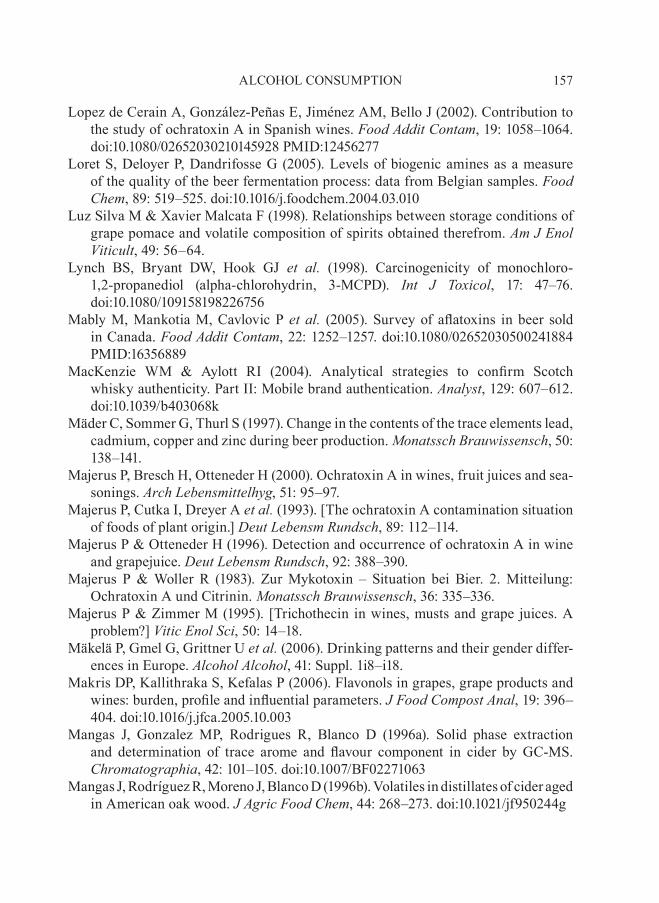
157ALCOHOL CONSUMPTION
Lopez de Cerain A, González-Peñas E, Jiménez AM, Bello J (2002). Contribution to the study of ochratoxin A in Spanish wines. Food.addit.Contam, 19: 1058–1064. doi:10.1080/02652030210145928 PMID:12456277
Loret S, Deloyer P, Dandrifosse G (2005). Levels of biogenic amines as a measure of the quality of the beer fermentation process: data from Belgian samples. Food.Chem, 89: 519–525. doi:10.1016/j.foodchem.2004.03.010
Luz Silva M & xavier Malcata F (1998). Relationships between storage conditions of grape pomace and volatile composition of spirits obtained therefrom. am.J.Enol.Viticult, 49: 56–64.
Lynch BS, Bryant DW, Hook GJ. et. al . (1998). Carcinogenicity of monochloro-1,2-propanediol (alpha-chlorohydrin, 3-MCPD). Int. J. Toxicol, 17: 47–76. doi:10.1080/109158198226756
Mably M, Mankotia M, Cavlovic P. et.al . (2005). Survey of aflatoxins in beer sold in Canada. Food.addit.Contam, 22: 1252–1257. doi:10.1080/02652030500241884 PMID:16356889
MacKenzie WM & Aylott RI (2004). Analytical strategies to confirm Scotch whisky authenticity. Part II: Mobile brand authentication. analyst, 129: 607–612. doi:10.1039/b403068k
Mäder C, Sommer G, Thurl S (1997). Change in the contents of the trace elements lead, cadmium, copper and zinc during beer production. Monatssch.Brauwissensch, 50: 138–141.
Majerus P, Bresch H, Otteneder H (2000). Ochratoxin A in wines, fruit juices and sea-sonings. arch.Lebensmittelhyg, 51: 95–97.
Majerus P, Cutka I, Dreyer A.et.al . (1993). [The ochratoxin A contamination situation of foods of plant origin.] Deut.Lebensm.rundsch, 89: 112–114.
Majerus P & Otteneder H (1996). Detection and occurrence of ochratoxin A in wine and grapejuice. Deut.Lebensm.rundsch, 92: 388–390.
Majerus P & Woller R (1983). Zur Mykotoxin – Situation bei Bier. 2. Mitteilung: Ochratoxin A und Citrinin. Monatssch.Brauwissensch, 36: 335–336.
Majerus P & Zimmer M (1995). [Trichothecin in wines, musts and grape juices. A problem?] Vitic.Enol.sci, 50: 14–18.
Mäkelä P, Gmel G, Grittner U.et.al . (2006). Drinking patterns and their gender differ-ences in Europe. alcohol.alcohol, 41: Suppl. 1i8–i18.
Makris DP, Kallithraka S, Kefalas P (2006). Flavonols in grapes, grape products and wines: burden, profile and influential parameters. J.Food.Compost.anal, 19: 396–404. doi:10.1016/j.jfca.2005.10.003
Mangas J, Gonzalez MP, Rodrigues R, Blanco D (1996a). Solid phase extraction and determination of trace arome and flavour component in cider by GC-MS. Chromatographia, 42: 101–105. doi:10.1007/BF02271063
Mangas J, Rodríguez R, Moreno J, Blanco D (1996b). Volatiles in distillates of cider aged in American oak wood. J.agric.Food.Chem, 44: 268–273. doi:10.1021/jf950244g
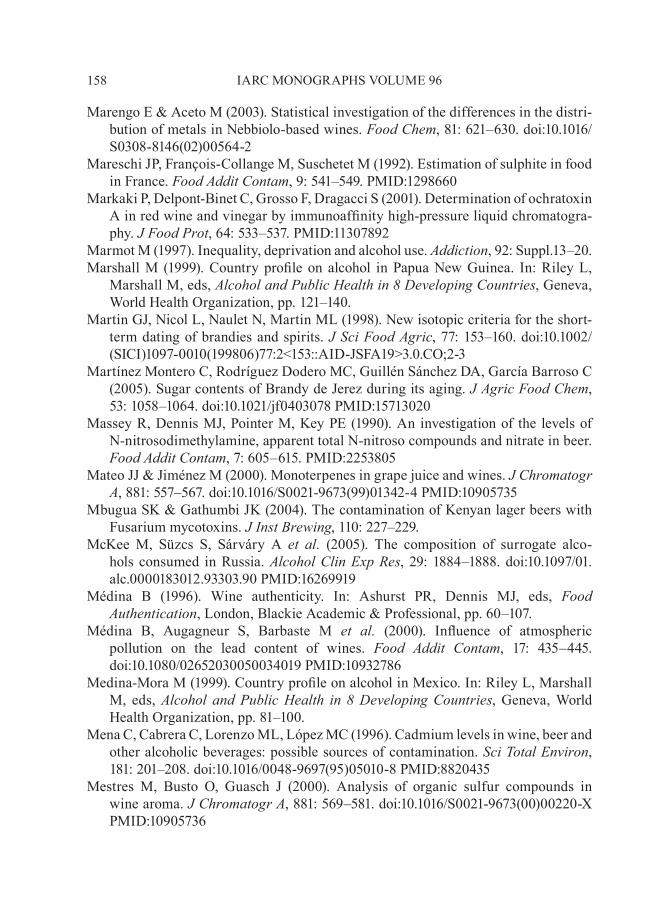
158 IARC MONOGRAPHS VOLUME 96
Marengo E & Aceto M (2003). Statistical investigation of the differences in the distri-bution of metals in Nebbiolo-based wines. Food.Chem, 81: 621–630. doi:10.1016/S0308-8146(02)00564-2
Mareschi JP, François-Collange M, Suschetet M (1992). Estimation of sulphite in food in France. Food.addit.Contam, 9: 541–549. PMID:1298660
Markaki P, Delpont-Binet C, Grosso F, Dragacci S (2001). Determination of ochratoxin A in red wine and vinegar by immunoaffinity high-pressure liquid chromatogra-phy. J.Food.prot, 64: 533–537. PMID:11307892
Marmot M (1997). Inequality, deprivation and alcohol use. addiction, 92: Suppl.13–20.Marshall M (1999). Country profile on alcohol in Papua New Guinea. In: Riley L,
Marshall M, eds, alcohol.and.public.health.in.8.Developing.Countries, Geneva, World Health Organization, pp. 121–140.
Martin GJ, Nicol L, Naulet N, Martin ML (1998). New isotopic criteria for the short-term dating of brandies and spirits. J.sci.Food.agric, 77: 153–160. doi:10.1002/(SICI)1097-0010(199806)77:2<153::AID-JSFA19>3.0.CO;2-3
Martínez Montero C, Rodríguez Dodero MC, Guillén Sánchez DA, García Barroso C (2005). Sugar contents of Brandy de Jerez during its aging. J.agric.Food.Chem, 53: 1058–1064. doi:10.1021/jf0403078 PMID:15713020
Massey R, Dennis MJ, Pointer M, Key PE (1990). An investigation of the levels of N-nitrosodimethylamine, apparent total N-nitroso compounds and nitrate in beer. Food.addit.Contam, 7: 605–615. PMID:2253805
Mateo JJ & Jiménez M (2000). Monoterpenes in grape juice and wines. J.Chromatogr.a, 881: 557–567. doi:10.1016/S0021-9673(99)01342-4 PMID:10905735
Mbugua SK & Gathumbi JK (2004). The contamination of Kenyan lager beers with Fusarium mycotoxins. J.Inst.Brewing, 110: 227–229.
McKee M, Süzcs S, Sárváry A. et. al . (2005). The composition of surrogate alco-hols consumed in Russia. alcohol.Clin.Exp.res, 29: 1884–1888. doi:10.1097/01.alc.0000183012.93303.90 PMID:16269919
Médina B (1996). Wine authenticity. In: Ashurst PR, Dennis MJ, eds, Food.authentication, London, Blackie Academic & Professional, pp. 60–107.
Médina B, Augagneur S, Barbaste M. et. al . (2000). Influence of atmospheric pollution on the lead content of wines. Food. addit. Contam, 17: 435–445. doi:10.1080/02652030050034019 PMID:10932786
Medina-Mora M (1999). Country profile on alcohol in Mexico. In: Riley L, Marshall M, eds, alcohol. and.public.health. in. 8.Developing.Countries, Geneva, World Health Organization, pp. 81–100.
Mena C, Cabrera C, Lorenzo ML, López MC (1996). Cadmium levels in wine, beer and other alcoholic beverages: possible sources of contamination. sci.Total.Environ, 181: 201–208. doi:10.1016/0048-9697(95)05010-8 PMID:8820435
Mestres M, Busto O, Guasch J (2000). Analysis of organic sulfur compounds in wine aroma. J.Chromatogr.a, 881: 569–581. doi:10.1016/S0021-9673(00)00220-x PMID:10905736
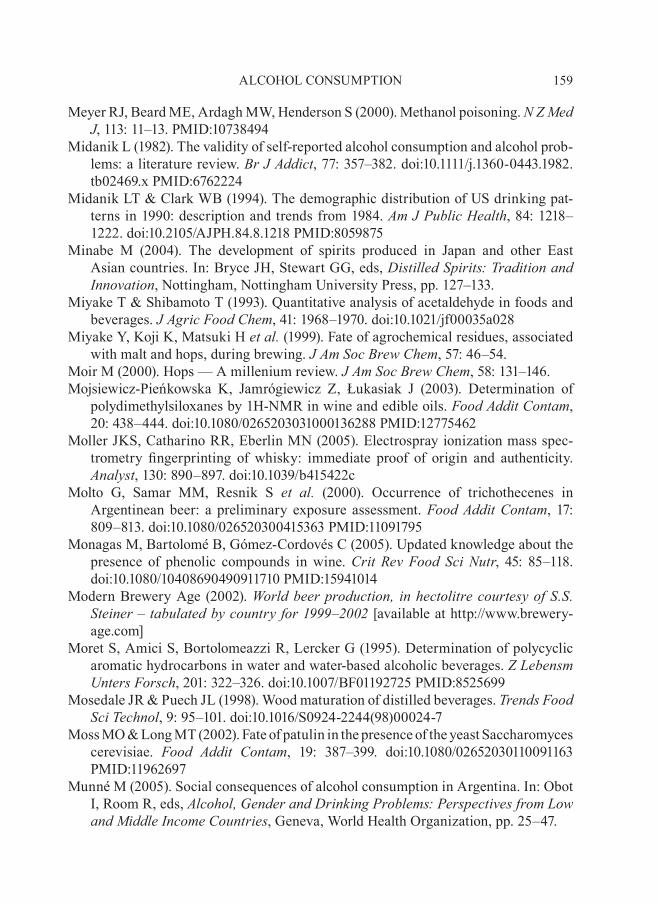
159ALCOHOL CONSUMPTION
Meyer RJ, Beard ME, Ardagh MW, Henderson S (2000). Methanol poisoning. n.Z.Med.J, 113: 11–13. PMID:10738494
Midanik L (1982). The validity of self-reported alcohol consumption and alcohol prob-lems: a literature review. Br.J.addict, 77: 357–382. doi:10.1111/j.1360-0443.1982.tb02469.x PMID:6762224
Midanik LT & Clark WB (1994). The demographic distribution of US drinking pat-terns in 1990: description and trends from 1984. am.J.public.health, 84: 1218–1222. doi:10.2105/AJPH.84.8.1218 PMID:8059875
Minabe M (2004). The development of spirits produced in Japan and other East Asian countries. In: Bryce JH, Stewart GG, eds, Distilled.spirits:.Tradition.and.Innovation, Nottingham, Nottingham University Press, pp. 127–133.
Miyake T & Shibamoto T (1993). Quantitative analysis of acetaldehyde in foods and beverages. J.agric.Food.Chem, 41: 1968–1970. doi:10.1021/jf00035a028
Miyake Y, Koji K, Matsuki H.et.al . (1999). Fate of agrochemical residues, associated with malt and hops, during brewing. J.am.soc.Brew.Chem, 57: 46–54.
Moir M (2000). Hops — A millenium review. J.am.soc.Brew.Chem, 58: 131–146.Mojsiewicz-Pieńkowska K, Jamrógiewicz Z, Łukasiak J (2003). Determination of
polydimethylsiloxanes by 1H-NMR in wine and edible oils. Food.addit.Contam, 20: 438–444. doi:10.1080/0265203031000136288 PMID:12775462
Moller JKS, Catharino RR, Eberlin MN (2005). Electrospray ionization mass spec-trometry fingerprinting of whisky: immediate proof of origin and authenticity. analyst, 130: 890–897. doi:10.1039/b415422c
Molto G, Samar MM, Resnik S. et. al . (2000). Occurrence of trichothecenes in Argentinean beer: a preliminary exposure assessment. Food.addit.Contam, 17: 809–813. doi:10.1080/026520300415363 PMID:11091795
Monagas M, Bartolomé B, Gómez-Cordovés C (2005). Updated knowledge about the presence of phenolic compounds in wine. Crit. rev.Food. sci.nutr, 45: 85–118. doi:10.1080/10408690490911710 PMID:15941014
Modern Brewery Age (2002). World.beer.production,. in.hectolitre.courtesy.of.s .s ..steiner.–.tabulated.by.country.for.1999–2002 [available at http://www.brewery-age.com]
Moret S, Amici S, Bortolomeazzi R, Lercker G (1995). Determination of polycyclic aromatic hydrocarbons in water and water-based alcoholic beverages. Z.Lebensm.Unters.Forsch, 201: 322–326. doi:10.1007/BF01192725 PMID:8525699
Mosedale JR & Puech JL (1998). Wood maturation of distilled beverages. Trends.Food.sci.Technol, 9: 95–101. doi:10.1016/S0924-2244(98)00024-7
Moss MO & Long MT (2002). Fate of patulin in the presence of the yeast Saccharomyces cerevisiae. Food. addit. Contam, 19: 387–399. doi:10.1080/02652030110091163 PMID:11962697
Munné M (2005). Social consequences of alcohol consumption in Argentina. In: Obot I, Room R, eds, alcohol,.gender.and.Drinking.problems:.perspectives.from.Low.and.Middle.Income.Countries, Geneva, World Health Organization, pp. 25–47.
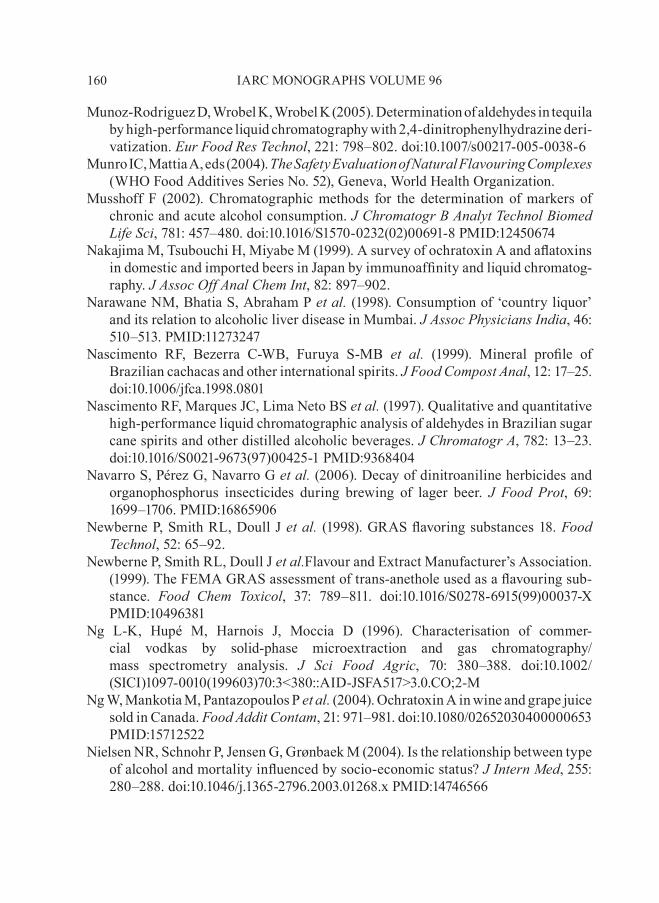
160 IARC MONOGRAPHS VOLUME 96
Munoz-Rodriguez D, Wrobel K, Wrobel K (2005). Determination of aldehydes in tequila by high-performance liquid chromatography with 2,4-dinitrophenylhydrazine deri-vatization. Eur.Food.res.Technol, 221: 798–802. doi:10.1007/s00217-005-0038-6
Munro IC, Mattia A, eds (2004). The.safety.Evaluation.of.natural.Flavouring.Complexes (WHO Food Additives Series No. 52), Geneva, World Health Organization.
Musshoff F (2002). Chromatographic methods for the determination of markers of chronic and acute alcohol consumption. J.Chromatogr.B.analyt.Technol.Biomed.Life.sci, 781: 457–480. doi:10.1016/S1570-0232(02)00691-8 PMID:12450674
Nakajima M, Tsubouchi H, Miyabe M (1999). A survey of ochratoxin A and aflatoxins in domestic and imported beers in Japan by immunoaffinity and liquid chromatog-raphy. J.assoc.off.anal.Chem.Int, 82: 897–902.
Narawane NM, Bhatia S, Abraham P.et.al . (1998). Consumption of ‘country liquor’ and its relation to alcoholic liver disease in Mumbai. J.assoc.physicians.India, 46: 510–513. PMID:11273247
Nascimento RF, Bezerra C-WB, Furuya S-MB. et. al . (1999). Mineral profile of Brazilian cachacas and other international spirits. J.Food.Compost.anal, 12: 17–25. doi:10.1006/jfca.1998.0801
Nascimento RF, Marques JC, Lima Neto BS.et.al . (1997). Qualitative and quantitative high-performance liquid chromatographic analysis of aldehydes in Brazilian sugar cane spirits and other distilled alcoholic beverages. J.Chromatogr.a, 782: 13–23. doi:10.1016/S0021-9673(97)00425-1 PMID:9368404
Navarro S, Pérez G, Navarro G.et.al . (2006). Decay of dinitroaniline herbicides and organophosphorus insecticides during brewing of lager beer. J. Food. prot, 69: 1699–1706. PMID:16865906
Newberne P, Smith RL, Doull J.et.al . (1998). GRAS flavoring substances 18. Food.Technol, 52: 65–92.
Newberne P, Smith RL, Doull J.et.al .Flavour and Extract Manufacturer’s Association. (1999). The FEMA GRAS assessment of trans-anethole used as a flavouring sub-stance. Food. Chem. Toxicol, 37: 789–811. doi:10.1016/S0278-6915(99)00037-x PMID:10496381
Ng L-K, Hupé M, Harnois J, Moccia D (1996). Characterisation of commer-cial vodkas by solid-phase microextraction and gas chromatography/mass spectrometry analysis. J. sci. Food. agric, 70: 380–388. doi:10.1002/(SICI)1097-0010(199603)70:3<380::AID-JSFA517>3.0.CO;2-M
Ng W, Mankotia M, Pantazopoulos P.et.al . (2004). Ochratoxin A in wine and grape juice sold in Canada. Food.addit.Contam, 21: 971–981. doi:10.1080/02652030400000653 PMID:15712522
Nielsen NR, Schnohr P, Jensen G, Grønbaek M (2004). Is the relationship between type of alcohol and mortality influenced by socio-economic status? J.Intern.Med, 255: 280–288. doi:10.1046/j.1365-2796.2003.01268.x PMID:14746566
161ALCOHOL CONSUMPTION
Nordlund S & Osterberg E (2000). Unrecorded alcohol consumption: its economics and its effects on alcohol control in the Nordic countries. addiction, 95: Suppl 4S551–S564. PMID:11218351
O’Neil MJ, editor (2001) The.Merck.Index, 13th Ed., Whitehouse Station, NJ, Merck & Co., Inc.,1818 pp
Obrezkov ON, Tolkacheva VA, Zaikanova GI.et.al . (1997). Application of ion chro-matography in distillery production. Determination of inorganic anions. Ind.Lab.Diagn.Mat, 63: 71–73.
Odhav B (2005). Bacterial contaminants and mycotoxins in beer and control strategies. In: Preedy VR, Watson RR, eds, reviews.in.Food.and.nutrition.Toxicity, Vol. 2, Boca Raton, FL, CRC Press, pp. 1–18.
Odhav B & Naicker V (2002). Mycotoxins in South African traditionally brewed beers. Food.addit.Contam, 19: 55–61. doi:10.1080/02652030110053426 PMID:11811766
Ogrinc N, Košir IJ, Spangenberg JE, Kidric J (2003). The application of NMR and MS methods for detection of adulteration of wine, fruit juices, and olive oil. A review. anal.Bioanal.Chem, 376: 424–430. doi:10.1007/s00216-003-1804-6 PMID:12819845
Omurtag GZ & Beyoglu D (2007). Occurrence of deoxynivalenol (vomitoxin) in beer in Turkey detected by HPLC. Food. Contr, 18: 163–166. doi:10.1016/j.foodcont.2005.09.007
Ostapczuk P, Eschnauer HR, Scollary GR (1997). Determination of cadmium, lead and copper in wine by potentiometric stripping analysis. Fresenius ..J.anal.Chem, 358: 723–727. doi:10.1007/s002160050498
Österdahl BG (1988). Volatile nitrosamines in foods on the Swedish market and esti-mation of their daily intake. Food.addit.Contam, 5: 587–595. PMID:3192011
Otteneder H & Majerus P (2000). Occurrence of ochratoxin A (OTA) in wines: influ-ence of the type of wine and its geographical origin. Food.addit.Contam, 17: 793–798. doi:10.1080/026520300415345 PMID:11091793
Ough CS (1986). Determination of sulfur dioxide in grapes and wines. J.assoc.off.anal.Chem, 69: 5–7. PMID:3949701
Ough CS (1987). Chemicals used in making wine. Chem.Engi.news, 65: 19–28.Padosch SA, Lachenmeier DW, Kröner LU (2006). Absinthism: a fictitious 19th
century syndrome with present impact. subst. abuse. Treat. prev. policy, 1: 14 doi:10.1186/1747-597x-1-14 PMID:16722551
Paine AJ & Davan AD (2001). Defining a tolerable concentration of methanol in alco-holic drinks. hum. Exp. Toxicol, 20: 563–568. doi:10.1191/096032701718620864 PMID:11926610
Papadopoulou-Bouraoui A, Vrabcheva T, Valzacchi S.et.al . (2004). Screening survey of deoxynivalenol in beer from the European market by an enzyme-linked immu-nosorbent assay. Food.addit.Contam, 21: 607–617. doi:10.1080/02652030410001677745 PMID:15204540
Pedersen GA, Mortensen GK, Larsen EH (1994). Beverages as a source of toxic trace element intake. Food.addit.Contam, 11: 351–363. PMID:7926169
162 IARC MONOGRAPHS VOLUME 96
Pietri A, Bertuzzi T, Pallaroni L, Piva G (2001). Occurrence of ochratoxin A in Italian wines. Food.addit.Contam, 18: 647–654. PMID:11469322
Pietschman M, Hupf H, Rappl A (2000). Pesticide residues in wine: problems with determination of tolerances and monitoring of residues. Lebensmittelchemie, 54: 102–104.
Pinhero RG & Paliyath G (2001). Antioxidant and calmodulin-inhibitory activities of phenolic components in fruit wines and its biotechnological implications. Food.Biotechnol, 15: 179–192. doi:10.1081/FBT-100107629
Pinho O, Ferreira IMPLVO, Santos LHMLM (2006). Method optimization by solid-phase microextraction in combination with gas chromatography with mass spec-trometry for analysis of beer volatile fraction. J.Chromatogr.a, 1121: 145–153. doi:10.1016/j.chroma.2006.04.013 PMID:16687150
Pino J, Martí MP, Mestres M.et.al . (2002). Headspace solid-phase microextraction of higher fatty acid ethyl esters in white rum aroma. J.Chromatogr.a, 954: 51–57. doi:10.1016/S0021-9673(02)00167-x PMID:12058918
Postel W & Adam L (1977). Gaschromatographische Charakterisierung von Whisky. II. Mitteilung: Schottischer Whisky. [in German]Branntweinwirtschaft, 117: 229–234.
Postel W & Adam L (1978). Gaschromatographische Charakterisierung von Whisky. III. Mitteilung: Irischer Whisky. Branntweinwirtschaft, 118: 404–407.
Postel W & Adam L (1979). Gaschromatographische Charakterisierung von Whisky. IV. Mitteilung: US-amerikanischer und kanadischer Whisky. Branntweinwirtschaft, 119: 172–176.
Postel W & Adam L (1982a). Gaschromatographische Charakterisierung von Spirituosen. Teil IV. Rum und Arrak, Rum- und Arrak-Verschnitt. alkoholindustrie, 17: 360–363.
Postel W & Adam L (1982b). Gaschromatographische Charakterisierung von Spirituosen. Teil III. Getreidebranntweine (Whisky und Korn). alkoholindustrie, 16: 339–341.
Postel W & Adam L (1982c). Gaschromatographische Charakterisierung von Spirituosen. Teil II. Branntweine aus Wein, Weintresterbranntweine, Weinalkohol. alkoholindustrie, 14–15: 304–306.
Postel W & Adam L (1984). Higher esters in wine, distilling-wine and wine distillates. Deut.Lebensm.rundsch, 80: 1–5.
Postel W & Adam L (1986a). Analytical characterization of Spanish brandies. I. Products of the German market. Deut.Lebensm.rundsch, 82: 4–10.
Postel W & Adam L (1986b). Analytical characterization of Spanish brandies. I. Products of the German market. Deut.Lebensm.rundsch, 82: 47–50.
Postel W & Adam L (1987). Flüchtige Inhaltsstoffe in deutschen Weinbränden. I. Mitteilung: Methanol und höhere Alkohole. Branntweinwirtschaft, 127: 366–371.
Postel W & Adam L (1988a). Flüchtige Stoffe in deutschen Weinbränden. II. Mitteilung: Carbonylverbindungen, Acetale und Terpene Branntweinwirtschaft, 128: 82–85.
163ALCOHOL CONSUMPTION
Postel W & Adam L (1988b). Flüchtige Inhaltsstoffe in deutschen Weinbränden. III. Mitteilung: Ester. Branntweinwirtschaft, 128: 330–337.
Postel W, Adam L (1989). Fruit distillate flavours. In: Piggott JR, Paterson A, eds, Distilled.Beverage.Flavour, Weinheim, VCH Publishers, pp. 133–147.
Postel W & Adam L (1990a). Gaschromatographische Charakterisierung von Cognac und Armagnac - Gehalte an flüchtigen Verbindungen. Branntweinwirtschaft, 130: 208–213.
Postel W & Adam L (1990b). Zur Kenntnis der Aromastoffzusammensetzung franzö-sischer Brandies. I. Mitteilung. Erzeugnisse des französischen, niederländischen und belgischen Marktes. Branntweinwirtschaft, 130: 278–280.
Postel W & Adam L (1990c). Zur Kenntnis der Aromastoffzusammensetzung französischer Brandies. II. Mitteilung. Erzeugnisse des deutschen Marktes. Branntweinwirtschaft, 130: 292–294.
Pragst F, Spiegel K, Sporkert F, Bohnenkamp M (2000). Are there possibilities for the detection of chronically elevated alcohol consumption by hair analysis? A report about the state of investigation. Forensic.sci.Int, 107: 201–223. doi:10.1016/S0379-0738(99)00164-4 PMID:10689573
Prasad MP & Krishnaswamy K (1994). N-Nitrosamines in Indian beers. Indian.J.Med.res, 100: 299–301. PMID:7829171
Quesada Granados J, Villalón Mir M, López Serrana H, López Martinez MC (1996). The influence of added caramel on furanic aldehyde content of matured brandies. Food.Chem, 56: 415–419. doi:10.1016/0308-8146(95)00210-3
Rahav G, Wilsnack R, Bloomfield K.et.al . (2006). The influence of societal level fac-tors on men’s and women’s alcohol consumption and alcohol problems. alcohol.alcohol.suppl, 41: 47–55.
Rapp A (1988). Wine aroma substances from gas chromatographic analysis. In: Linskens HF, Jackson JF, eds, Wine.analysis, Berlin, Springer-Verlag, pp. 29–66.
Rapp A (1992). Aromastoffe des Weines Chem.Unserer.Zeit, 26: 273–284. doi:10.1002/ciuz.19920260606
Reddy LVA & Reddy OVS (2005). Production and characterization of wine from mango fruit (Mangifera.indica L). World.J.Microbiol.Biotechnol, 21: 1345–1350. doi:10.1007/s11274-005-4416-9
Rehm J (1998). Measuring quantity, frequency, and volume of drinking. alcohol.Clin.Exp.res, 22: Suppl4S–14S. doi:10.1111/j.1530-0277.1998.tb04368.x PMID:9603301
Rehm J, Room R, Graham K. et. al . (2003). The relationship of average volume of alcohol consumption and patterns of drinking to burden of disease: an overview. addiction, 98: 1209–1228. doi:10.1046/j.1360-0443.2003.00467.x PMID:12930209
Rehm J, Sulkowska U, Mańczuk M.et.al . (2007). Alcohol accounts for a high propor-tion of premature mortality in central and eastern Europe. Int. J.Epidemiol, 36: 458–467. doi:10.1093/ije/dyl294 PMID:17251244
164 IARC MONOGRAPHS VOLUME 96
Rheeder JP, Marasas WFO, Vismer HF (2002). Production of fumonisin ana-logs by Fusarium species. appl. Environ.Microbiol, 68: 2101–2105. doi:10.1128/AEM.68.5.2101-2105.2002 PMID:11976077
Ribéreau-Gayon P, Glories Y, Maujean A, Dubourdieu D, editors (2000). handbook.of. Enology, Vol. 2, The. Chemistry. of. Wine. and. stabilization. and. Treatments, Chichester, John Wiley & Sons.
Rodríguez Madrera R, Picinelli Lobo A, Suárez Valles B (2006). Phenolic profile of Asturian (Spain) natural cider. J.agric.Food.Chem, 54: 120–124. doi:10.1021/jf051717e PMID:16390187
Röhrig G (1993). [Fruit wines.] Flüssiges.obst, 60: 433–434.Romero-Mendoza M, Medina-Mora ME, Villaboro J, Durand A (2005). Alcohol con-
sumption in Mexican women:implications in a syncretic culture. In: Obot I, Room R, ed, alcohol,.gender.and.Drinking.problems:.perspectives.from.Low.and.Middle.Income.Countries, Geneva., World Health Organization, pp. 125–142.
Rosa CAR, Magnoli CE, Fraga ME.et.al . (2004). Occurrence of ochratoxin A in wine and grape juice marketed in Rio de Janeiro, Brazil. Food.addit.Contam, 21: 358–364. doi:10.1080/02652030310001639549 PMID:15204560
Roses OE, González DE, López CM.et.al . (1997). Lead levels in Argentine market wines. Bull. Environ. Contam. Toxicol, 59: 210–215. doi:10.1007/s001289900466 PMID:9211690
Rosman KJR, Chisholm W, Jimi S.et.al . (1998). Lead concentrations and isotopic sig-natures in vintages of French wine between 1950 and 1991. Environ.res, 78: 161–167. doi:10.1006/enrs.1997.3812
Rostron C (1992). Methyl isothiocyanate in wine. Food.Chem.Toxicol, 30: 821–823. doi:10.1016/0278-6915(92)90089-4 PMID:1427521
Ruidavets JB, Ducimetière P, Arveiler D.et.al . (2002). Types of alcoholic beverages and blood lipids in a French population. J.Epidemiol.Community.health, 56: 24–28. doi:10.1136/jech.56.1.24 PMID:11801616
Rupasinghe HPV & Clegg S (2007). Total antioxidant capacity, total phenolic content, mineral elements, and histamine concentrations in wines of different fruit sources. J.Food.Compost.anal, 20: 133–137. doi:10.1016/j.jfca.2006.06.008
Ruprich J & Ostrý V (1995). Determination of the mycotoxin deoxynivalenol in beer by commercial elisa tests and estimation of the exposure dose from beer for the popu-lation in the Czech Republic. Cent.Eur.J.public.health, 3: 224–229. PMID:8903526
Salvo F, La Pera L, Di Bella G.et.al . (2003). Influence of different mineral and Organic pesticide treatments on Cd(II), Cu(II), Pb(II), and Zn(II) contents determined by derivative potentiometric stripping analysis in Italian white and red wines. J.agric.Food.Chem, 51: 1090–1094. doi:10.1021/jf020818z PMID:12568578
San José B, Lagiou P, Chloptsios Y, Trichopoulou A (2001). Sociodemographic cor-relates of abstinence and excessive drinking in the Greek population. subst.Use.Misuse, 36: 463–475. doi:10.1081/JA-100102637 PMID:11346277
165ALCOHOL CONSUMPTION
Sapunar-Postružnik J, Bazulić D, Kubala H (1996). Estimation of dietary intake of arsenic in the general population of the Republic of Croatia. sci.Total.Environ, 191: 119–123. doi:10.1016/0048-9697(96)05253-9 PMID:8885426
Savchuk SA & Kolesov GM (2005). Chromatographic techniques in the quality control of cognacs and cognac spirits. J. anal. Chem, 60: 752–771. doi:10.1007/s10809-005-0176-9
Savchuk SA, Vlasov VN, Appolonova SA.et.al . (2001). Application of chromatography and spectrometry to the authentication of alcoholic beverages. J.anal.Chem, 56: 214–231. doi:10.1023/A:1009446221123
Saxena S (1999). Country profile on alcohol in India. In: Riley L, Marshall M, eds, alcohol. and. public. health. in. 8. Developing. Countries, Geneva, World Health Organization, pp. 43–66.
Scanlan RA, Barbour JF, Chappel CI (1990). A survey of n-nitrosodimethylamine in US and Canadian beers. J.agric.Food.Chem, 38: 442–443. doi:10.1021/jf00092a023
Scanlan RA, Barbour JF, Hotchkiss JH, Libbey LM (1980). N-nitrosodimethylamine in beer. Food. Cosmet. Toxicol, 18: 27–29. doi:10.1016/0015-6264(80)90006-1 PMID:7372206
Scholten G (1992). [What would RSK orientation values for apple wine look like?]Flüssiges.obst, 59: 466–471.
Schönberger C (2006). Bitter is better. A review on the knowledge about bitterness in beer. Monatsschr.Brauwissensch, 59: 56–66.
Schothorst RC & Jekel AA (2003). Determination of trichothecenes in beer by capil-lary gas chromatography with flame ionisation detection. Food.Chem, 82: 475–479. doi:10.1016/S0308-8146(03)00117-1
Scientific Committee on Food (2001). opinion.of. the.scientific.Committee.on.Food.on.3-Monochloro-propane-1,2-diol.(3-MCpD), Brussels, European Commission.
Scott PM (1996). Mycotoxins transmitted into beer from contaminated grains during brewing. J.assoc.off.anal.Chem.Int, 79: 875–882.
Scott PM & Kanhere SR (1995). Determination of ochratoxin A in beer. Food.addit.Contam, 12: 591–598. PMID:7589722
Scott PM, Kanhere SR, Weber D (1993). Analysis of Canadian and imported beers for Fusarium mycotoxins by gas chromatography-mass spectrometry. Food.addit.Contam, 10: 381–389. PMID:8405577
Scott PM & Lawrence GA (1995). Analysis of beer for fumonisins. J.Food.prot, 58: 1379–1382.
Scott PM, Lawrence GA, Lau BPY (2006). Analysis of wines, grape juices and cran-berry juices for alternaria toxins. Mycotoxin. res ., 22: 142–147. doi:10.1007/BF02956778
Scott PM, Yeung JM, Lawrence GA, Prelusky DB (1997). Evaluation of enzyme-linked immunosorbent assay for analysis of beer for fumonisins. Food.addit.Contam, 14: 445–450. PMID:9328528

166 IARC MONOGRAPHS VOLUME 96
Selli S, Kürkçüoglu M, Kafkas E.et.al . (2004). Volatile flavour components of man-darin wine obtained from clementines (Citrus.reticula Blanco) extracted by solid-phase microextraction. Flav.Frag.J, 19: 413–416. doi:10.1002/ffj.1323
Sen AK & Bhattacharjya S (1991). Quality norms for alcoholic drinks. standards.India, 4: 414–417.
Sen NP, Seaman S, Tessier L (1982). Comparison of two analytical methods for the determination of dimethylnitrosamine in beer and ale, and some recent results. J.Food.saf, 4: 243–250. doi:10.1111/j.1745-4565.1982.tb00448.x
Sen NP, Seaman SW, Bergeron C, Brousseau R (1996). Trends in the levels of n-nitrosodimethylamine in Canadian and imported beers. J.agric.Food.Chem, 44: 1498–1501. doi:10.1021/jf9507250
Sharpe PC (2001). Biochemical detection and monitoring of alcohol abuse and abstinence. ann. Clin. Biochem, 38: 652–664. doi:10.1258/0004563011901064 PMID:11732647
Shephard GS, Fabiani A, Stockenström S.et.al . (2003). Quantitation of ochratoxin A in South African wines. J.agric.Food.Chem, 51: 1102–1106. doi:10.1021/jf0259866 PMID:12568580
Shephard GS, van der Westhuizen L, Gatyeni PM.et.al . (2005). Fumonisin mycotoxins in traditional xhosa maize beer in South Africa. J.agric.Food.Chem, 53: 9634–9637. doi:10.1021/jf0516080 PMID:16302789
Sherlock JC, Pickford CJ, White GF (1986). Lead in alcoholic beverages. Food.addit.Contam, 3: 347–354. PMID:3803640
Shim WB, Kim JC, Seo JA, Lee YW (1997). Natural occurrence of trichothecenes and zearalenone in Korean and imported beers. Food. addit. Contam, 14: 1–5. PMID:9059576
Shin JH, Chung MJ, Sung NJ (2005). Occurrence of N-nitrosodimethylamine in South Korean and imported alcoholic beverages. Food.addit.Contam, 22: 1083–1086. doi:10.1080/02652030500157528 PMID:16332630
Smart GA, Pickford CJ, Sherlock JC (1990). Lead in alcoholic beverages: a second sur-vey. Food.addit.Contam, 7: 93–99. PMID:2307272
Smith NA (1994). Nitrate reduction and N-nitrosation in brewing. J.Inst.Brewing, 100: 347–355.
Smith RL, Cohen SM, Doull J.et.al . (2005). GRAS flavouring substances 22. Food.Technol, 59: 24–62.
Soleas GJ, Yan J, Goldberg DM (2001). Assay of ochratoxin A in wine and beer by high-pressure liquid chromatography photodiode array and gas chromatogra-phy mass selective detection. J. agric. Food.Chem, 49: 2733–2740. doi:10.1021/jf0100651 PMID:11409959
Song PJ & Hu JF (1988). N-Nitrosamines in Chinese foods. Food.Chem.Toxicol, 26: 205–208. doi:10.1016/0278-6915(88)90120-2 PMID:3366421
Soufleros EH, Tricard C, Bouloumpasi EC (2003). Occurrence of ochratoxin A in Greek wines. J.sci.Food.agric, 83: 173–179. doi:10.1002/jsfa.1300
167ALCOHOL CONSUMPTION
Souza Oliveira E, Bolini Cardello HMA, Marques Jeronimo E.et.al . (2005). The influ-ence of different yeasts on the fermentation, composition and sensory quality of cach-aca. World.J.Microbiol.Biotechnol, 21: 707–715. doi:10.1007/s11274-004-4490-4
Spiegelhalder B (1983). Vorkommen von Nitrosaminen in der Umwelt. In: Preussmann R, ed, Das.nitrosamin-problem, Weinheim, Verlag Chemie, pp. 27–40.
Spiegelhalder B, Eisenbrand G, Preussmann R (1979). Contamination of beer with trace quantities of N-nitrosodimethylamine. Food. Cosmet. Toxicol, 17: 29–31. doi:10.1016/0015-6264(79)90155-x PMID:437609
Sponholz WR, Dittrich HH, Bausch N (1990). [Volatile fatty acids in Caribbean rums and rum blends.] Deut.Lebensm.rundsch, 86: 80–81.
Srikanth R, Ramana D, Rao V (1995). Lead uptake from beer in India. Bull.Environ.Contam.Toxicol, 54: 783–786. doi:10.1007/BF00206113 PMID:7780224
Stampar F, Solar A, Hudina M.et.al . (2006). Traditional walnut liqueur — Cocktail of phenolics. Food.Chem, 95: 627–631. doi:10.1016/j.foodchem.2005.01.035
Stefanaki I, Foufa E, Tsatsou-Dritsa A, Dais P (2003). Ochratoxin A concentrations in Greek domestic wines and dried vine fruits. Food.addit.Contam, 20: 74–83. doi:10.1080/0265203021000031537 PMID:12519722
Steinhaus M, Fritsch HT, Schieberle P (2003). Quantitation of (R)- and (S)-linalool in beer using solid phase microextraction (SPME) in combination with a stable isotope dilution assay (SIDA). J.agric.Food.Chem, 51: 7100–7105. doi:10.1021/jf0347057 PMID:14611178
Stevens JF & Page JE (2004). xanthohumol and related prenylflavonoids from hops and beer: to your good health! phytochemistry, 65: 1317–1330. doi:10.1016/j.phyto-chem.2004.04.025 PMID:15231405
Strang J, Arnold WN, Peters T (1999). Absinthe: what’s your poison? Though absinthe is intriguing, it is alcohol in general we should worry about. Br.Med.J, 319: 1590–1592. PMID:10600949
Ströhmer G (2002). Extraktfreie und extraktarme Spirituosen. In: Kolb E, ed, spirituosen-Technologie, Hamburg, B. Behr’s Verlag, pp. 43–153. (in German)
Suárez Valles B, Palacios García N, Rodríguez Madrera R, Picinelli Lobo A (2005). Influence of yeast strain and aging time on free amino acid changes in sparkling ciders. J.agric.Food.Chem, 53: 6408–6413. doi:10.1021/jf050822l PMID:16076126
Suga K, Mochizuki N, Harayama K, Yamashita H (2005). Analysis of trichothecenes in malt and beer by liquid chromatography tandem mass spectrometry. J.am.soc.Brew.Chem, 63: 1–4.
Svejkovská B, Novotný O, Divinová V.et.al . (2004). Esters of 3-chloropropane-1,2-diol in foodstuffs. Czech.J.Food.sci, 22: 190–196.
Szücs S, Sárváry A, McKee M, Adány R (2005). Could the high level of cirrhosis in central and eastern Europe be due partly to the quality of alcohol consumed? An exploratory investigation. addiction, 100: 536–542. doi:10.1111/j.1360-0443.2005.01009.x PMID:15784068
Tahvonen R (1998). Lead and cadmium in beverages consumed in Finland. Food.addit.Contam, 15: 446–450. PMID:9764215
168 IARC MONOGRAPHS VOLUME 96
Tangni EK, Ponchaut S, Maudoux M. et. al . (2002). Ochratoxin A in domestic and imported beers in Belgium: occurrence and exposure assessment. Food. addit.Contam, 19: 1169–1179. doi:10.1080/02652030210007859 PMID:12623677
Tareke E, Rydberg P, Karlsson P. et. al . (2002). Analysis of acrylamide, a carcino-gen formed in heated foodstuffs. J.agric.Food.Chem, 50: 4998–5006. doi:10.1021/jf020302f PMID:12166997
Tateo F & Roundbehler DP (1983). Use of thermal energy analyzer in the analysis of nitrosamines — Volatile nitrosamines in samples of Italian beers. Mitt.geb.Lebensm.hyg, 74: 110–120.
Teissedre PL, Lobinski R, Cabanis MT.et.al . (1994). On the origin of organolead com-pounds in wine. sci.Total.Environ, 153: 247–252. doi:10.1016/0048-9697(94)90204-6
Thomas K (2006). British beers: A survey of cask ale character. Br.Food.J, 108: 849–858. doi:10.1108/00070700610702109
Torres MR, Sanchis V, Ramos AJ (1998). Occurrence of fumonisins in Spanish beers analyzed by an enzyme-linked immunosorbent assay method. Int.J.Food.Microbiol, 39: 139–143. doi:10.1016/S0168-1605(97)00113-x PMID:9562886
Tricker AR & Kubacki SJ (1992). Review of the occurrence and formation of non-vol-atile N-nitroso compounds in foods. Food.addit.Contam, 9: 39–69. PMID:1397391
Tricker AR & Preussmann R (1991). Volatile and nonvolatile nitrosamines in beer. J.Cancer.res.Clin.oncol, 117: 130–132. doi:10.1007/BF01613136 PMID:2007611
Triebel S, Sproll C, Reusch H.et.al . (2007). Rapid analysis of taurine in energy drinks using amino acid analyzer and Fourier transform infrared (FTIR) spectroscopy as basis for toxicological evaluation. amino.acids, 33: 451–457. doi:10.1007/s00726-006-0449-0 PMID:17051421
Tritscher AM (2004). Human health risk assessment of processing-related compounds in food. Toxicol.Lett, 149: 177–186. doi:10.1016/j.toxlet.2003.12.059 PMID:15093263
Tsao R & Zhou T (2000). Micellar electrokinetic capillary electrophoresis for rapid analysis of patulin in apple cider. J.agric.Food.Chem, 48: 5231–5235. doi:10.1021/jf000217c PMID:11087465
Uhlig R & Gerstenberg H (1993). Über den Milchsäuregehalt infizierter Biere. Brauwelt, 133: 280–286.
United Nations Statistics Division (2007). Un.Classifications.registry. Available at: http://unstats.un.org/unsd/cr/registry/default.asp
Valente Soares LM & Monteiro de Moraes AM (2003). Lead and cadmium content of Brazilian beers. Cienc.Tecnol.aliment, 23: 285–289.
Vallejo-Cordoba B, González-Córdova AF, del Carmen Estrada-Montoya M (2004). Tequila volatile characterization and ethyl ester determination by solid phase microextraction gas chromatography/mass spectrometry analysis. J.agric.Food.Chem, 52: 5567–5571. doi:10.1021/jf0499119 PMID:15373393
Vally H & Thompson PJ (2003). Allergic and asthmatic reactions to alcoholic drinks. addict.Biol, 8: 3–11. doi:10.1080/1355621031000069828 PMID:12745410
van Aardt M, Duncan SE, Bourne D.et.al . (2001). Flavor threshold for acetaldehyde in milk, chocolate milk, and spring water using solid phase microextraction gas chro-matography for quantification. J.agric.Food.Chem, 49: 1377–1381. doi:10.1021/jf001069t PMID:11312867
169ALCOHOL CONSUMPTION
van Oers JAM, Bongers IMB, van de Goor LAM, Garretsen HFL (1999). Alcohol con-sumption, alcohol-related problems, problem drinking, and socioeconomic status. alcohol.alcohol, 34: 78–88. PMID:10075406
Vanderhaegen B, Neven H, Verachtert H, Derdelinckx G (2006). The chemis-try of beer aging — A critical review. Food.Chem, 95: 357–381. doi:10.1016/j.foodchem.2005.01.006
Vermeulen C, Lejeune I, Tran TT, Collin S (2006). Occurrence of polyfunctional thi-ols in fresh lager beers. J.agric.Food.Chem, 54: 5061–5068. doi:10.1021/jf060669a PMID:16819917
Versari A, Natali N, Russo MT, Antonelli A (2003). Analysis of some Italian lemon liquors (limoncello). J.agric.Food.Chem, 51: 4978–4983. doi:10.1021/jf030083d PMID:12903956
Verstrepen KJ, Derdelinckx G, Dufour JP.et.al . (2003). Flavor-active esters: adding fruitiness to beer. J.Biosci.Bioeng, 96: 110–118. PMID:16233495
Vesely P, Lusk L, Basarova G.et.al . (2003). Analysis of aldehydes in beer using solid-phase microextraction with on-fiber derivatization and gas chromatography/mass spectrometry. J. agric. Food. Chem, 51: 6941–6944. doi:10.1021/jf034410t PMID:14611150
Vichi S, Riu-Aumatell M, Mora-Pons M.et.al . (2005). Characterization of volatiles in different dry gins. J.agric.Food.Chem, 53: 10154–10160. doi:10.1021/jf058121b PMID:16366709
Vinson JA, Jang J, Yang J.et.al . (1999). Vitamins and especially flavonoids in common beverages are powerful in vitro antioxidants which enrich lower density lipopro-teins and increase their oxidative resistance after ex vivo spiking in human plasma. J.agric.Food.Chem, 47: 2502–2504. doi:10.1021/jf9902393 PMID:10552516
Vinson JA, Mandarano M, Hirst M.et.al . (2003). Phenol antioxidant quantity and quality in foods: beers and the effect of two types of beer on an animal model of atheroscle-rosis. J.agric.Food.Chem, 51: 5528–5533. doi:10.1021/jf034189k PMID:12926909
Wang L, xu Y, Zhao G, Li J (2004). Rapid analysis of flavor volatiles in apple wine using headspace solid-phase microextraction. J.Inst.Brewing, 110: 57–65.
Wannamethee SG & Shaper AG (1999). Type of alcoholic drink and risk of major coro-nary heart disease events and all-cause mortality. am.J.public.health, 89: 685–690. doi:10.2105/AJPH.89.5.685 PMID:10224979
Warnakulasuriya S, Harris C, Gelbier S.et.al . (2002). Fluoride content of alcoholic beverages. Clin.Chim.acta, 320: 1–4. PMID:11983193
Watts VA, Butzke CE, Boulton RB (2003). Study of aged cognac using solid-phase microextraction and partial least-squares regression. J.agric.Food.Chem, 51: 7738–7742. doi:10.1021/jf0302254 PMID:14664538
Wei H, Derson Z, Shuiyuan x, Lingjiang L (2001). Drinking patterns and related problems in a large general population sample in China. In: Demers A, Room R, Bourgault C, eds, surveys.of.Drinking.patterns.and.problems.in.seven.Developing.Countries, Geneva, World Health Organization, pp. 116–129.
WHO (2000). International.guide.for.Monitoring.alcohol.Consumption.and.related.harm, Geneva, World Health Organization.
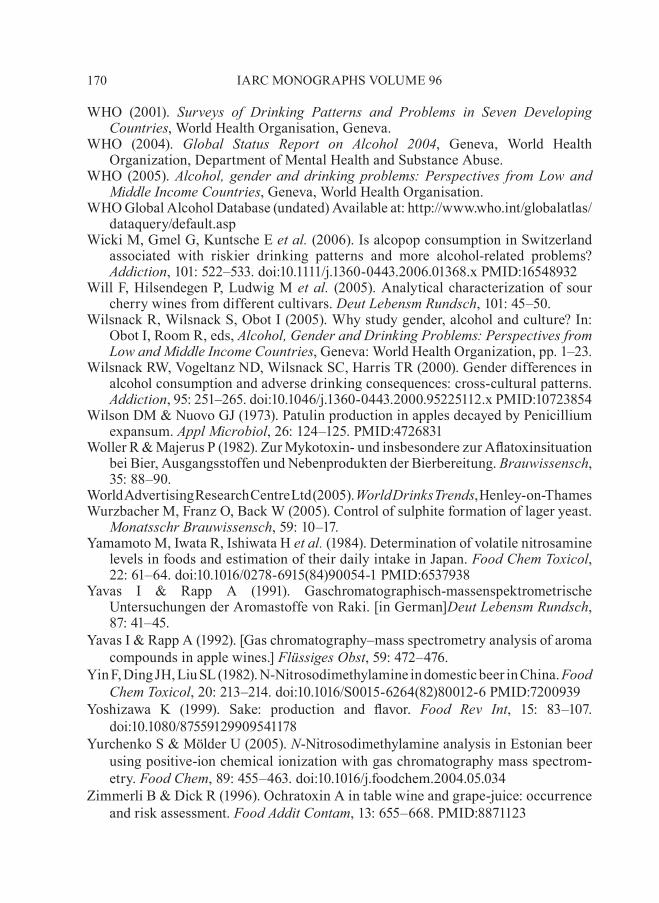
170 IARC MONOGRAPHS VOLUME 96
WHO (2001). surveys. of. Drinking. patterns. and. problems. in. seven. Developing.Countries, World Health Organisation, Geneva.
WHO (2004). global. status. report. on. alcohol. 2004, Geneva, World Health Organization, Department of Mental Health and Substance Abuse.
WHO (2005). alcohol,. gender.and.drinking.problems:.perspectives. from.Low.and.Middle.Income.Countries, Geneva, World Health Organisation.
WHO Global Alcohol Database (undated) Available at: http://www.who.int/globalatlas/dataquery/default.asp
Wicki M, Gmel G, Kuntsche E.et.al . (2006). Is alcopop consumption in Switzerland associated with riskier drinking patterns and more alcohol-related problems? addiction, 101: 522–533. doi:10.1111/j.1360-0443.2006.01368.x PMID:16548932
Will F, Hilsendegen P, Ludwig M. et.al . (2005). Analytical characterization of sour cherry wines from different cultivars. Deut.Lebensm.rundsch, 101: 45–50.
Wilsnack R, Wilsnack S, Obot I (2005). Why study gender, alcohol and culture? In: Obot I, Room R, eds, alcohol,.gender.and.Drinking.problems:.perspectives.from.Low.and.Middle.Income.Countries, Geneva: World Health Organization, pp. 1–23.
Wilsnack RW, Vogeltanz ND, Wilsnack SC, Harris TR (2000). Gender differences in alcohol consumption and adverse drinking consequences: cross-cultural patterns. addiction, 95: 251–265. doi:10.1046/j.1360-0443.2000.95225112.x PMID:10723854
Wilson DM & Nuovo GJ (1973). Patulin production in apples decayed by Penicillium expansum. appl.Microbiol, 26: 124–125. PMID:4726831
Woller R & Majerus P (1982). Zur Mykotoxin- und insbesondere zur Aflatoxinsituation bei Bier, Ausgangsstoffen und Nebenprodukten der Bierbereitung. Brauwissensch, 35: 88–90.
World Advertising Research Centre Ltd (2005). World.Drinks.Trends, Henley-on-Thames Wurzbacher M, Franz O, Back W (2005). Control of sulphite formation of lager yeast.
Monatsschr.Brauwissensch, 59: 10–17.Yamamoto M, Iwata R, Ishiwata H.et.al . (1984). Determination of volatile nitrosamine
levels in foods and estimation of their daily intake in Japan. Food.Chem.Toxicol, 22: 61–64. doi:10.1016/0278-6915(84)90054-1 PMID:6537938
Yavas I & Rapp A (1991). Gaschromatographisch-massenspektrometrische Untersuchungen der Aromastoffe von Raki. [in German]Deut.Lebensm.rundsch, 87: 41–45.
Yavas I & Rapp A (1992). [Gas chromatography–mass spectrometry analysis of aroma compounds in apple wines.] Flüssiges.obst, 59: 472–476.
Yin F, Ding JH, Liu SL (1982). N-Nitrosodimethylamine in domestic beer in China. Food.Chem.Toxicol, 20: 213–214. doi:10.1016/S0015-6264(82)80012-6 PMID:7200939
Yoshizawa K (1999). Sake: production and flavor. Food. rev. Int, 15: 83–107. doi:10.1080/87559129909541178
Yurchenko S & Mölder U (2005). n-Nitrosodimethylamine analysis in Estonian beer using positive-ion chemical ionization with gas chromatography mass spectrom-etry. Food.Chem, 89: 455–463. doi:10.1016/j.foodchem.2004.05.034
Zimmerli B & Dick R (1996). Ochratoxin A in table wine and grape-juice: occurrence and risk assessment. Food.addit.Contam, 13: 655–668. PMID:8871123
Related Documents