Welcome message from author
This document is posted to help you gain knowledge. Please leave a comment to let me know what you think about it! Share it to your friends and learn new things together.
Transcript

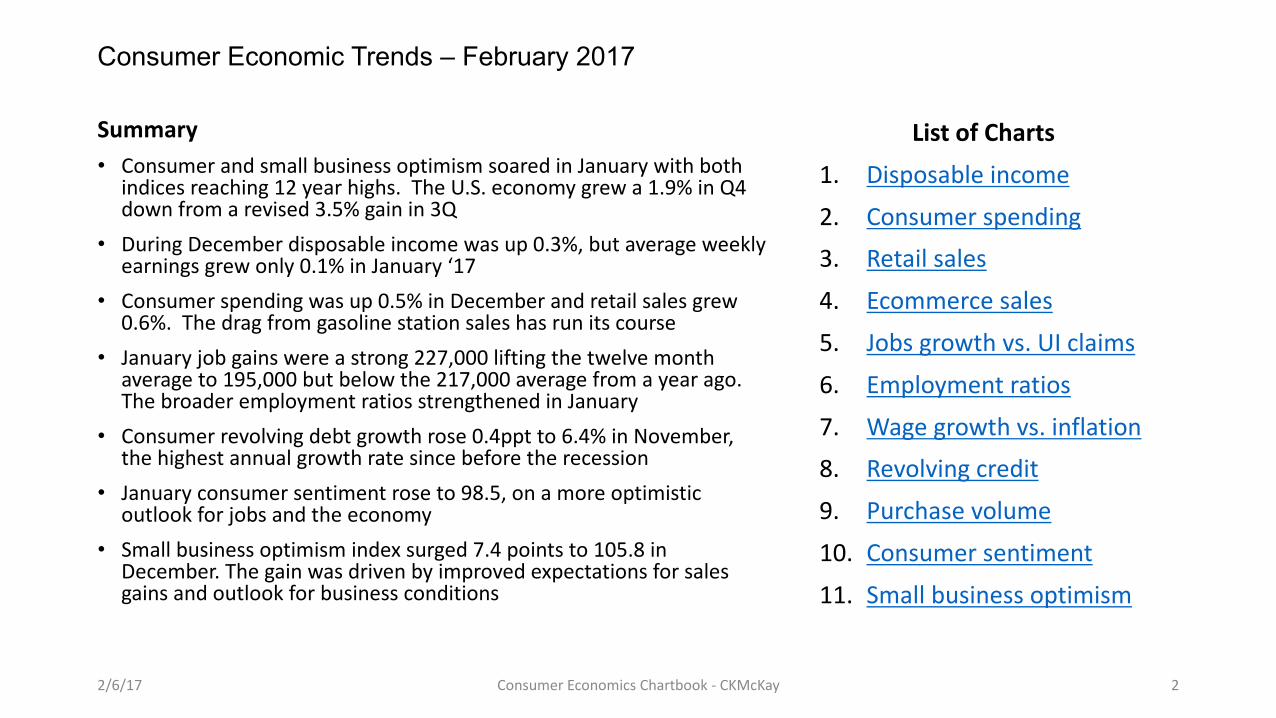
Consumer Economic Trends – February 2017
2/6/17 ConsumerEconomicsChartbook- CKMcKay 2
Summary• ConsumerandsmallbusinessoptimismsoaredinJanuarywithboth
indicesreaching12yearhighs.TheU.S.economygrewa1.9%inQ4downfromarevised3.5%gainin3Q
• DuringDecemberdisposableincomewasup0.3%,butaverageweeklyearningsgrewonly0.1%inJanuary‘17
• Consumerspendingwasup0.5%inDecemberandretailsalesgrew0.6%.Thedragfromgasolinestationsaleshasrunitscourse
• Januaryjobgainswereastrong227,000liftingthetwelvemonthaverageto195,000butbelowthe217,000averagefromayearago.ThebroaderemploymentratiosstrengthenedinJanuary
• Consumerrevolvingdebtgrowthrose0.4pptto6.4%inNovember,thehighestannualgrowthratesincebeforetherecession
• Januaryconsumersentimentroseto98.5,onamoreoptimisticoutlookforjobsandtheeconomy
• Smallbusinessoptimismindexsurged7.4pointsto105.8inDecember.Thegainwasdrivenbyimprovedexpectationsforsalesgainsandoutlookforbusinessconditions
ListofCharts1. Disposableincome2. Consumerspending3. Retailsales4. Ecommercesales5. Jobsgrowthvs.UIclaims6. Employmentratios7. Wagegrowthvs.inflation8. Revolvingcredit9. Purchasevolume10. Consumersentiment11. Smallbusinessoptimism
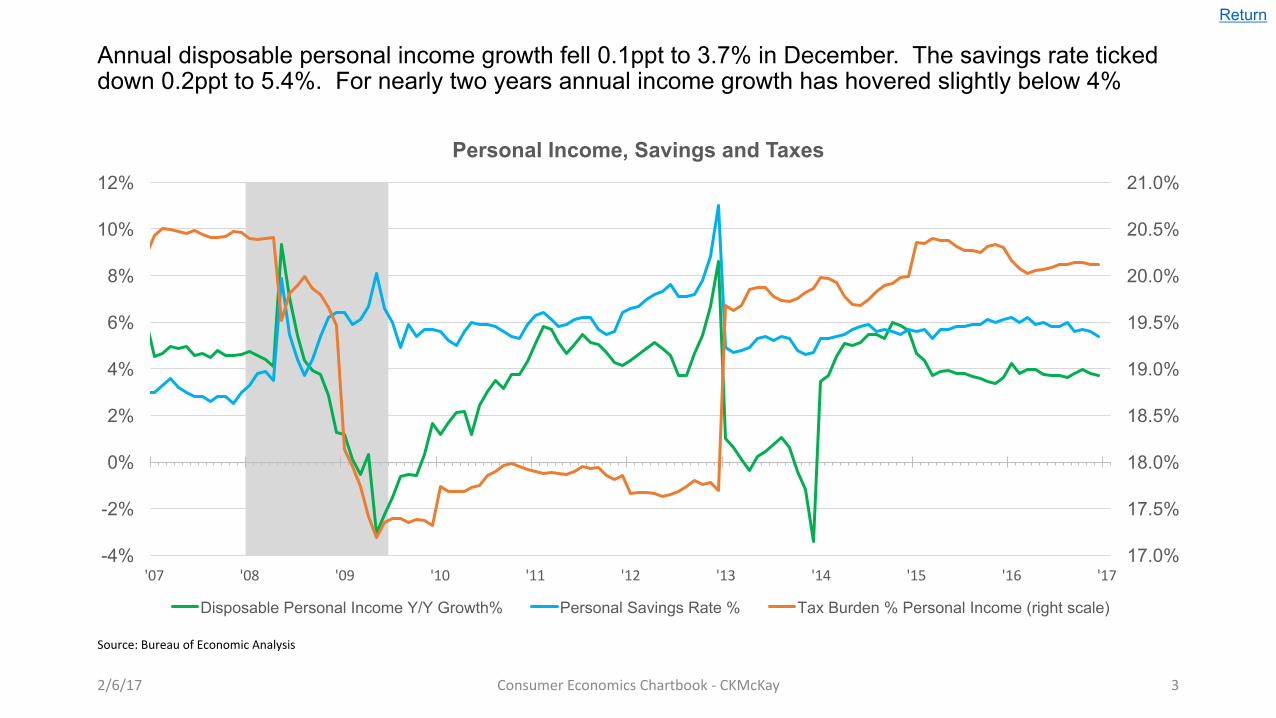
Annual disposable personal income growth fell 0.1ppt to 3.7% in December. The savings rate ticked down 0.2ppt to 5.4%. For nearly two years annual income growth has hovered slightly below 4%
2/6/17 ConsumerEconomicsChartbook- CKMcKay 3
17.0%
17.5%
18.0%
18.5%
19.0%
19.5%
20.0%
20.5%
21.0%
-4%
-2%
0%
2%
4%
6%
8%
10%
12%
'07 '08 '09 '10 '11 '12 '13 '14 '15 '16 '17
Personal Income, Savings and Taxes
Disposable Personal Income Y/Y Growth% Personal Savings Rate % Tax Burden % Personal Income (right scale)
Source:BureauofEconomicAnalysis
Return

Annual consumer spending growth advanced 3ppt to 4.5% in December led by continued strength in durable goods purchases and the end of the gasoline spending drag on non-durables spending
2/6/17 ConsumerEconomicsChartbook- CKMcKay 4
-3%-2%-1%0%1%2%3%4%5%6%7%8%9%
10%
'11 '12 '13 '14 '15 '16 '17
Nominal Consumer Spending Growth Y/Y%
Total Consumer Spending
Durable Goods
Nondurable Goods
Services
Nondurable Goods ex. Energy
Source:BureauofEconomicAnalysis
Return
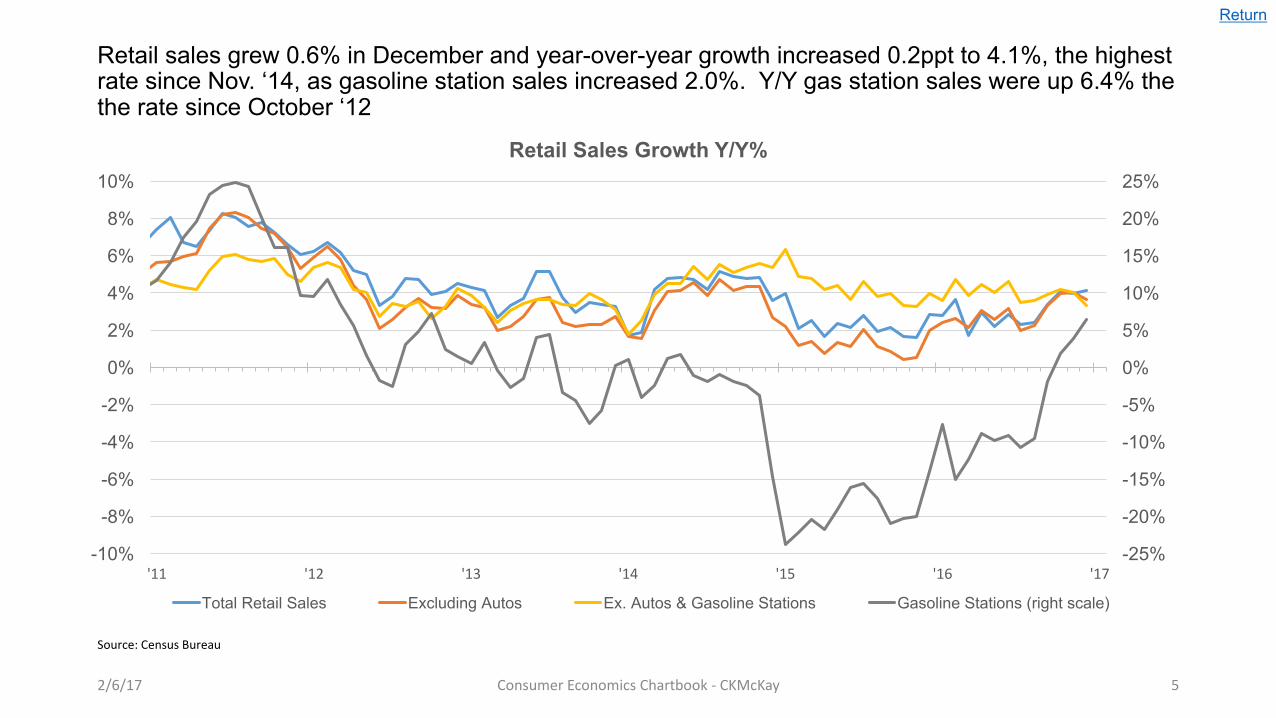
Retail sales grew 0.6% in December and year-over-year growth increased 0.2ppt to 4.1%, the highest rate since Nov. ‘14, as gasoline station sales increased 2.0%. Y/Y gas station sales were up 6.4% the the rate since October ‘12
2/6/17 ConsumerEconomicsChartbook- CKMcKay 5
-25%
-20%
-15%
-10%
-5%
0%
5%
10%
15%
20%
25%
-10%
-8%
-6%
-4%
-2%
0%
2%
4%
6%
8%
10%
'11 '12 '13 '14 '15 '16 '17
Retail Sales Growth Y/Y%
Total Retail Sales Excluding Autos Ex. Autos & Gasoline Stations Gasoline Stations (right scale)
Source:CensusBureau
Return

During the last four quarters e-commerce contributed over 54% of retail sales growth
2/6/17 ConsumerEconomicsChartbook- CKMcKay 6
-45%
-30%
-15%
0%
15%
30%
45%
60%
75%
-15%
-10%
-5%
0%
5%
10%
15%
20%
25%
'07 '08 '09 '10 '11 '12 '13 '14 '15 '16
E-Commerce Sales Growth Y/Y%Note: This chart is updated quarterly
Total Retail Sales E-commerce Total ex. E-commerce E-commerce Overall Growth Contribution 4Q Average (right scale)
Source:CensusBureau
Return
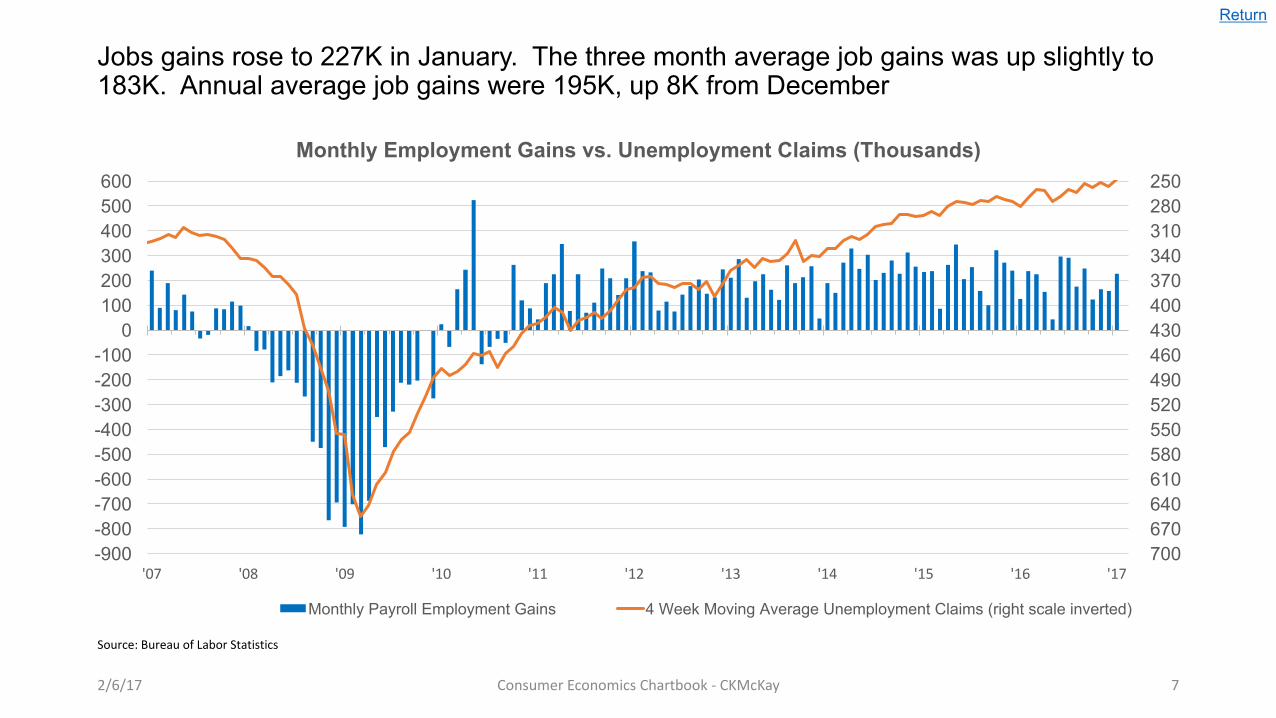
Jobs gains rose to 227K in January. The three month average job gains was up slightly to 183K. Annual average job gains were 195K, up 8K from December
2/6/17 ConsumerEconomicsChartbook- CKMcKay 7
250 280 310 340 370 400 430 460 490 520 550 580 610 640 670 700 -900
-800-700-600-500-400-300-200-100
0100200300400500600
'07 '08 '09 '10 '11 '12 '13 '14 '15 '16 '17
Monthly Employment Gains vs. Unemployment Claims (Thousands)
Monthly Payroll Employment Gains 4 Week Moving Average Unemployment Claims (right scale inverted)
Source:BureauofLaborStatistics
Return

The unemployment rate ticked to to 4.8% in January driven by an increase in the labor force. Both the labor participation rate the the employment population ratio increase by 0.2ppt and are at or near their two year highs
2/6/17 ConsumerEconomicsChartbook- CKMcKay 8
1%
2%
3%
4%
5%
6%
7%
8%
9%
10%
11%
57%
58%
59%
60%
61%
62%
63%
64%
65%
66%
67%
'07 '08 '09 '10 '11 '12 '13 '14 '15 '16 '17
Employment Ratios
Labor Force Participation Rate Employment-Population Ratio Unemployment Rate (right scale)
Source:BureauofLaborStatistics
Return

Annual wage growth fell 0.3ppt in January, but remained relatively strong at 2.5%. Annual inflation rose above 2% for the first time since May ‘14
2/6/17 ConsumerEconomicsChartbook- CKMcKay 9
-1%
0%
1%
2%
3%
4%
'10 '11 '12 '13 '14 '15 '16 '17
Wage Growth vs. Inflation
Average Hourly Earnings Y/Y Growth CPI Y/Y % Change Core CPI Y/Y % Change
Source:BureauofLaborStatistics
Return
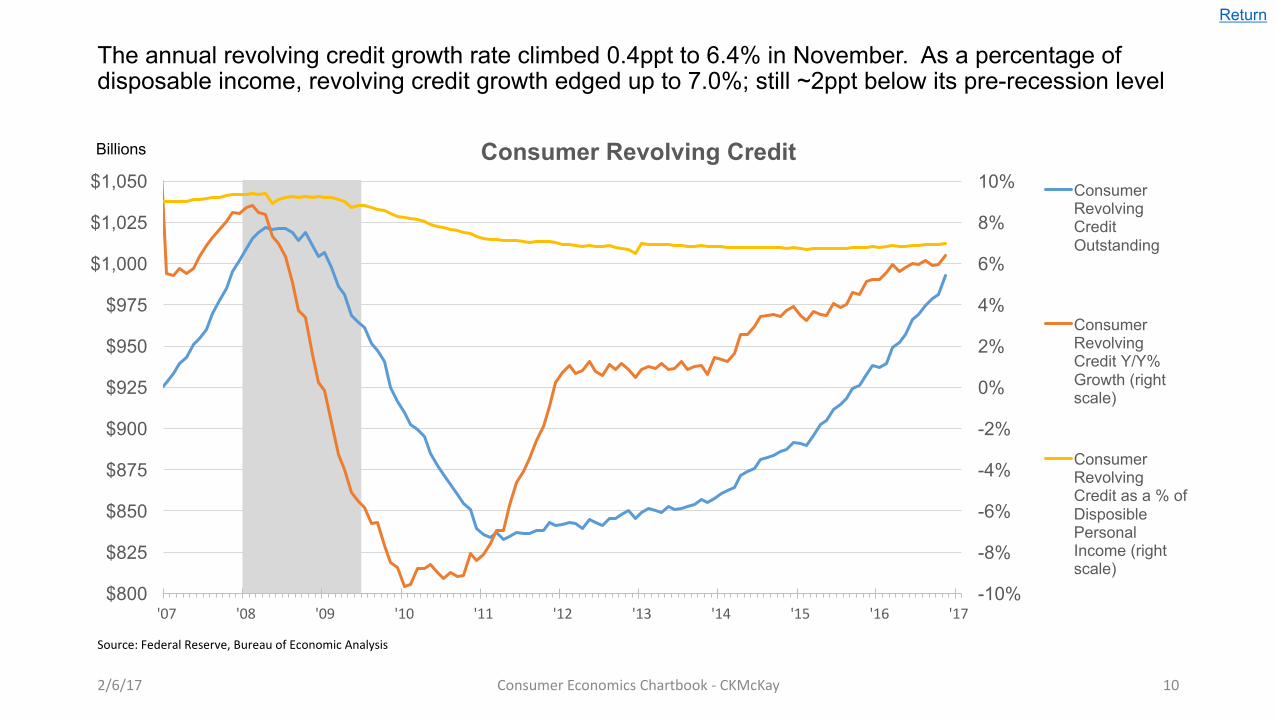
The annual revolving credit growth rate climbed 0.4ppt to 6.4% in November. As a percentage of disposable income, revolving credit growth edged up to 7.0%; still ~2ppt below its pre-recession level
2/6/17 ConsumerEconomicsChartbook- CKMcKay 10
-10%
-8%
-6%
-4%
-2%
0%
2%
4%
6%
8%
10%
$800
$825
$850
$875
$900
$925
$950
$975
$1,000
$1,025
$1,050
'07 '08 '09 '10 '11 '12 '13 '14 '15 '16 '17
Consumer Revolving Credit Consumer Revolving Credit Outstanding
Consumer Revolving Credit Y/Y% Growth (right scale)
Consumer Revolving Credit as a % of Disposible Personal Income (right scale)
Source:FederalReserve,BureauofEconomicAnalysis
Return
Billions

Q4 payment card purchase volume year-over-year growth ticked up 0.5ppt to 6.6%
2/6/17 ConsumerEconomicsChartbook- CKMcKay 11
-8%
-6%
-4%
-2%
0%
2%
4%
6%
8%
10%
12%
'08 '09 '10 '11 '12 '13 '14 '15 '16
Network Payment Card Purchase Volume Growth Y/Y%
Source:AXP,DFS,MA,VCompanyReports
Return

The Consumer Sentiment index rose to 98.5 in January. The highest level in 12 years on a more optimistic outlook for jobs and the economy
2/6/17 ConsumerEconomicsChartbook- CKMcKay 12
-40%
-30%
-20%
-10%
0%
10%
20%
30%
40%
40
50
60
70
80
90
100
110
120
'07 '08 '09 '10 '11 '12 '13 '14 '15 '16 '17
Consumer Sentiment
University of Michigan Consumer Sentiment Y/Y% Change (right scale)
Source:UniversityofMichigan
Return

Small business optimism index surged 7.4 points to 105.8 in December. The index is now at its highest level since 2004. The gain was driven by improved expectations for sales gains and outlook for business conditions
2/6/17 ConsumerEconomicsChartbook- CKMcKay 13
80
85
90
95
100
105
'07 '08 '09 '10 '11 '12 '13 '14 '15 '16
Small Business Optimism
NFIB Small Business Optimism Index 6 Month Moving Average
Source:NationalFederationofIndependentBusiness
Return
Related Documents