CONSUMER BEHAVIOUR TOWARDS CANNED BEVERAGES IN GUANGZHOU by LI HAU-TAK 李 厚 德 NG MAN-HUNG RESEARCH REPORT Presented to The Graduate School In Partial Fulfilment of the Requirements for the Degree of MASTER OF BUSINESS ADMINISTRATION TWO-YEAR MBA PROGRAMME THE CHINESE UNIVERSITY OF HONG KONG MAY 1985 Dr. Andres Inn Advisor 吴 文 雄

Welcome message from author
This document is posted to help you gain knowledge. Please leave a comment to let me know what you think about it! Share it to your friends and learn new things together.
Transcript
CONSUMER BEHAVIOUR TOWARDS CANNED BEVERAGES
IN GUANGZHOU
by
LI HAU-TAK李 厚 德
NG MAN-HUNG
RESEARCH REPORT
Presented to
The Graduate School
In Partial Fulfilment
of the Requirements for the Degree of
MASTER OF BUSINESS ADMINISTRATION
TWO-YEAR MBA PROGRAMME
THE CHINESE UNIVERSITY OF HONG KONG
MAY 1985
Dr. Andres Inn
Advisor
吴 文 雄
TABLE OF CONTENTS
Chapter
I INTRODUCTION
II METHODOLOGY
II.1 Multidimensional Scaling
II.1.1 Data Collection
11.1.2 Processing of Raw Data
11.1.3 Approach of Interpretation
11.2 Focus Group
III RESULTS & INTERPRETATION
III.1 Multidimensional Scaling
III.1.1 Names of Beers
111.1.2 Design of Beer Cans
111.1.3 Names of Soft Drinks
111.1.4 Design of Soft Drink Cans
111.2 Focus Group
111.2.1 Opinions on Beers
111.2.2 Opinions on Soft Drinks
IV CONCLUSION
BIBLIOGRAPHY
ATTACHMENTS
1 Physical Appearance of Beer Cans
2 Physical Appearance of Soft Drink Cans
1
5
5
7
11
12
14
15
15
17
23
28
33
38
38
39
41
48
49
50
51
1
CHAPTER I
Introduction
Beverages can be packed in glass bottles, Tetra-Paks, two-
piece aluminium cans, three-piece steel cans, PET bottles and PS
bottles. Among these methods of packaging, two-piece cans seem
to dominate the market. In recent years, two-piece cans have
replaced glass bottles and three-piece cans. The reasons for
that change can be understood from three aspects, the
manufacturer, the distributor and the consumer.
Light weight cans made from a one-piece cup run more
efficiently at high speeds through a continuous and semi-
automatic production process. Peak demands at hot seasons can•
more-easily be satisfied with this technology. Consequently,
manufacturers favour the two piece cans. Cans are abuse
resistent, light resistent, can be handled economically and
packed easily. Distributors such as supermarkets acknowledge
that cans are easy to store and display, are colorful,
eyecatching and have a relatively longer shelf life because light
and air cannot penetrate and affect the contents. Furthermore,
they can be sold in vending machines which are 24 hours sales
outlets. To customers, aluminium cans are not easily broken,
2
they may be quickly chilled, may be carried long distances, and
thus offer refreshment anywhere.
Aluminium cans also have good recycle value and this helps in
solving the environmental problems that may arise. In Hong Kong,
the retail price of one wasted can is about five cents. Some
people are making their living by collecting wasted cans. It is
the reason why we seldom see cans in the country side and along
streets as compared with Tetra-Paks.
The international trends that favour two-piece aluminium
cans may be expected to also operte in China. Since the economic
reforms took place, the economy of the PRC has undergone dramatic
changes. It is becoming more prosperous and the living standard
is improving, especially in the special economic zones and major
cities along the coast. Some products which were banned as signs
of capitalism have become acceptable once again. As a natural
consequence, the demand for consumer goods rises. Those who have
been in Guangzhou or Shumchun in recent years can definitely
sense the difference.
In other developing countries, the consumption of two-piece
aluminium cans increases with personal discretionary income. The
reason is that two-piece aluminium cans are more expensive
compared with other package types. The cost of aluminium cans is
the biggest cost item of the final product. From the development
trend of the PRC, the canned beverages are still in the introductory
stage and this market should have tremendous potential in the future.
3
One of the principles pointed out by leading Chinese
officials about the modernization programme is that the coastal
cities and certain chosen special economic zones will be
developed first. Inland areas then follow. Guangzhou is the
most prosperous city in southern China. In Chinese History, it
used to be one of the first places that interacted with western
cculture. Guangzhou citizens are well-known for their ability to
accept new ideas. They are more fashionable and always at the
front end of the living style. What happens in Guangzhou today
may happen in the rest of the PRC tomorrow. The spreading effect
is predictable. Therefore, it is interesting to use Guangzhou as
a test market to predict future trends in China.
This research investigates some of the dimensions that are
used by people in Guangzhou to perceive canned beverages. This
information should be useful to manufacturers when they design
the package and name their new products. More accurate market
positioning can also be done with this perception information.
In marketing consumer products, quality of products is only
one of the decisive factors that constitute success. The image
projected, the promotion campaign and how consumers perceive the
products are also important. Especially when it is desired to
launch a new brand into a new market, it is important to know
consumers' attitude towards the names, designs and images of
existing brands before formulating marketing strategies.
Suitable market positioning can help the new brand to reach the
4
appropriate target market and gain advantages from the images of
similar products. Or products may be positioned by an entirely
new package and image that consumers will not associate with
existing non-satisfactory products.
5
CHAPTER II
Methodology
Mutidimensional Scaling11.1
Multidimensional Scaling (MDS) is a set of mathematical
techniques that enable a researcher to uncover the
structure' of data. In one of the studies carried out in
Guangzhou, each respondent evaluated a series of 8 cans of
beer based on their own criteria. How similarly did the
respondents view the cans? What identifiable features were
used in the varying evaluations of the cans? Can a pattern
be discovered that helps explain what led consumers to the
choices? Do consumers differentiate the cans according to'
their styles of design, or according to their colors?
Multidimensional Scaling can help answer these questions by
locating the cans in a spatial configuration or 'perceptual
map'. Once having located the cans in the 'space', then it
is possible to uncover the hidden or underlying structure,
or theoretical meaning of this spatial representation of
cans.
Applying Multidimensional Scaling to these data
provides a way of reducing the data about 8 cans to 2 or 3
6
dimensions. Interpretation of these dimensions may then be
made. By identifying key differences between cans located
along perceptual dimension, it may be possible to develop
useful indicators that can be measured in the marketing of
cans.
Multidimensional scaling refers to a class of
techniques. These techniques use 'proximities' among `any
kind of objects as input. A proximity is a number which
indicates how similar or how different two objects are, or
are perceived to be, or any measure of this kind. The chief
output is a spatial representation or a perceptual map,
consisting of a geometric configuration of points, as on a
map. The output may be two dimensional, three dimensional
or multidimensional. However, it is seldom known in advance
whether a simple map will be adequate, or whether a 'map'
should be represented in many dimensions. For a multi-
dimensional map, the output will be represented in a number
of two dimensional configurations, with different pairs of
dimensions to depict the multidimensionality in two
dimensions at a time.
Each point in the configuration corresponds to one of
the objects. This configuration reflects the 'hidden
structure' in the data, and often makes the data much easier
to comprehend. The distance between any two objects
reflects the degree of similarity or dissimilarity of these
7
two objects. The further apart are two objects, the larger
will be the dissimilarity( or the smaller the similarity)
between these two objects.
When multidimensional scaling yields useful insights,
these generally result from examining the configuration.
One of the most useful methods of examination is simply to
look at the arrangement of points, where each point
indicates which object it represents. There are also some
other systematic methods, such as properties fitting and
regression analysis.
11.1.1 Data Collection
A common procedure for obtaining proximities data is to
ask people to directly judge the 'psychological distance'(
or closeness) of the stimulus objects. To discover rather
than impose the dimensions, the attributes on which the
stimuli will be judged will not be specified.
This research studied two different sets of canned
drinks, in terms of their names and also their design. The
first set was beers and the second was soft drinks.
Since a standard approach was applied to all four
studies, for convenience, the procedure will be described
only in the study of names for soft drinks. This description
will serve to illustrate the methodlogy for the remaining
8
three studies.
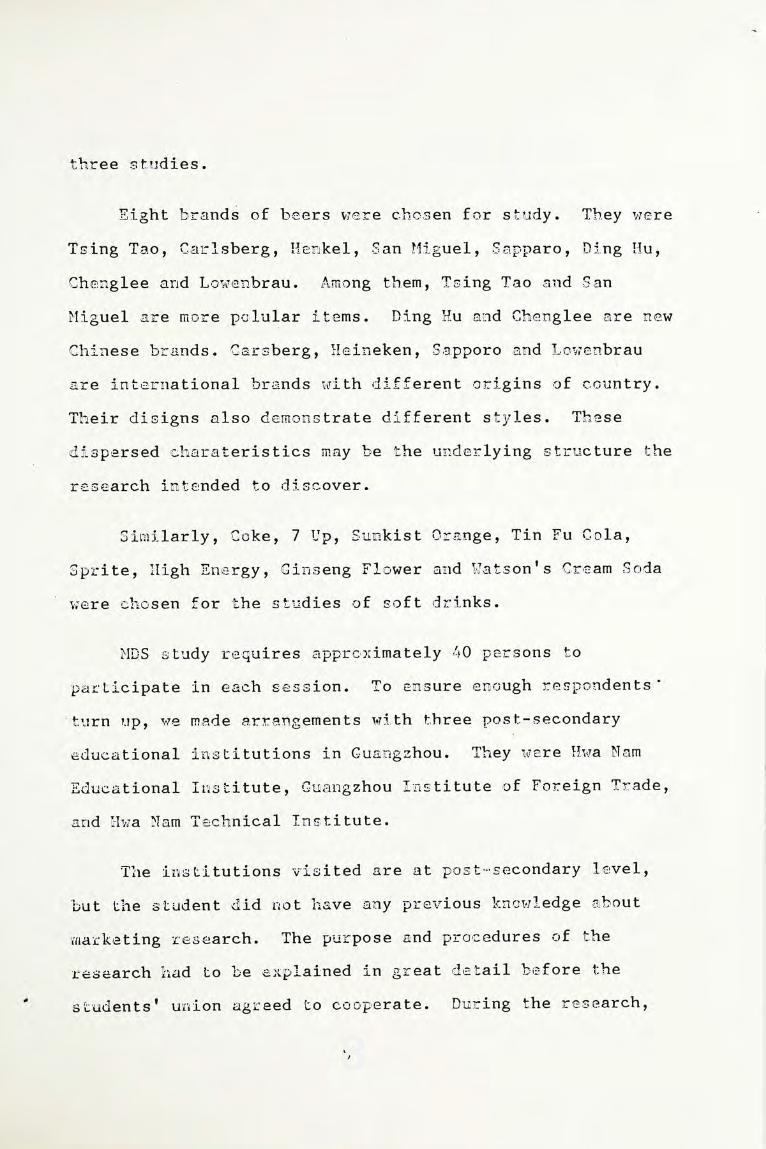
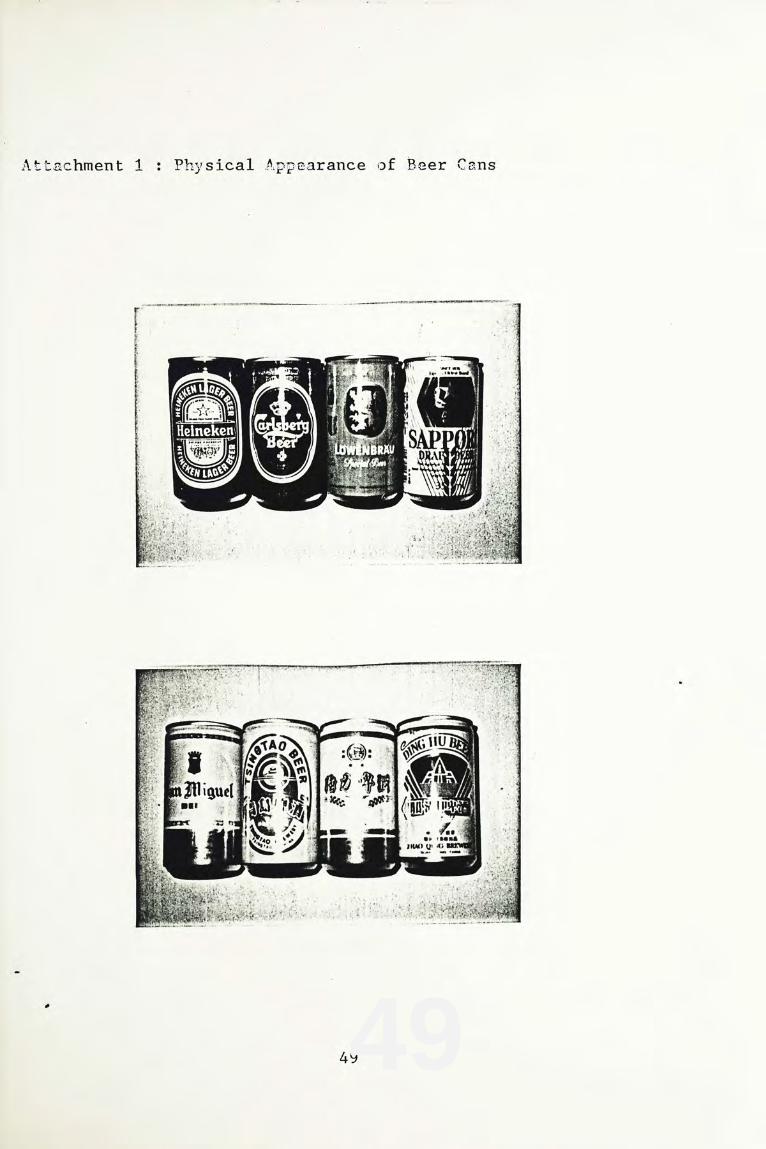
Eight brands of beers were chosen for study. They were
Tsing Tao, Carlsberg, Henkel, San Miguel, Sapparo, Ding Hu,
Chenglee and Lowenbrau. Among them, Tsing Tao and San
Miguel are more polular items. Ding Hu and Chenglee are new
Chinese brands. Carsberg, Heineken, Sapporo and Lowenbrau
are international brands with different origins of country.
Their disigns also demonstrate different styles. These
dispersed charateristics may be the underlying structure the
research intended to discover.
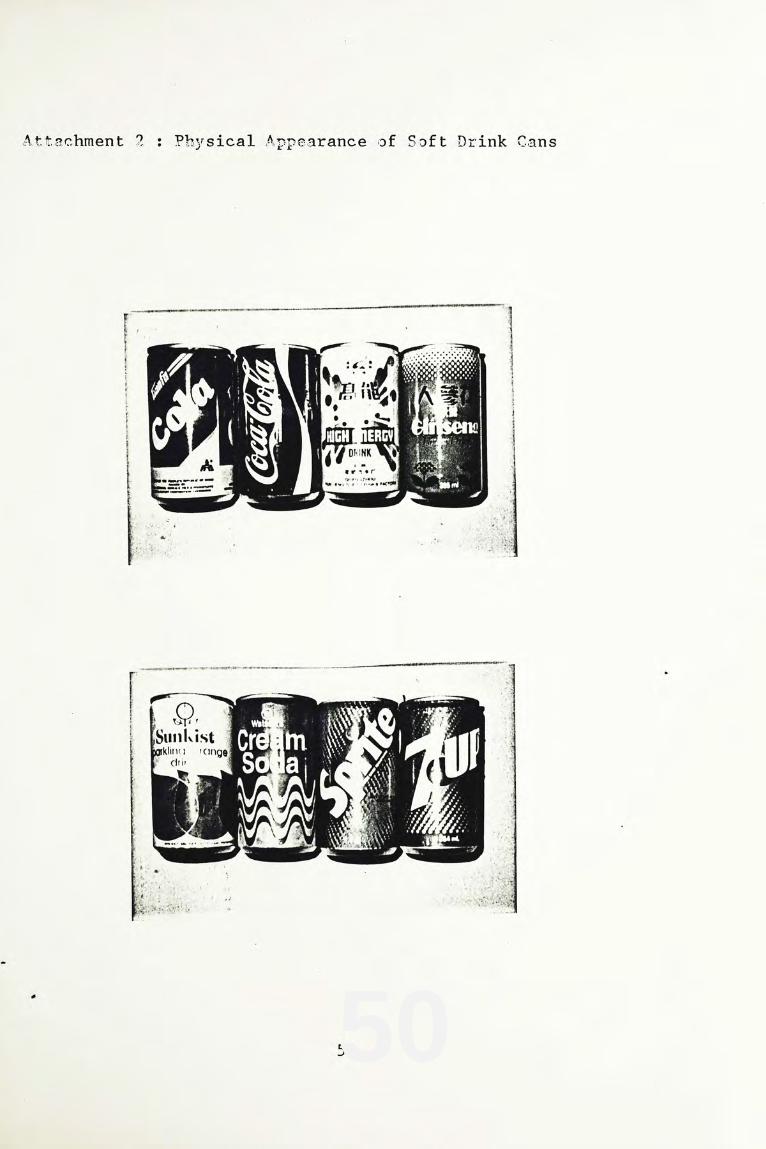
Similarly, Coke, 7 Up, Sunkist Orange, Tin Fu Cola,
Sprite, High Energy, Ginseng Flower and Watson's Cream Soda
were chosen for the studies of soft drinks.
MDS study requires approximately 40 persons to
participate in each session. To ensure enough respondents'
turn up, we made arrangements with three post-secondary
educational institutions in Guangzhou. They were Hwa Nam
Educational Institute, Guangzhou Institute of Foreign Trade,
and Hwa Nam Technical Institute.
The institutions visited are at post-secondary level,
but the student did not have any previous knowledge about
marketing research. The purpose and procedures of the
research had to be explained in great detail before the
students' union agreed to cooperate. During the research,
9
great effort was made to help respondents understand the
objectives and to follow the procedures. Much lesser amount
of effort is expected if similar research is conducted in
Hong Kong.
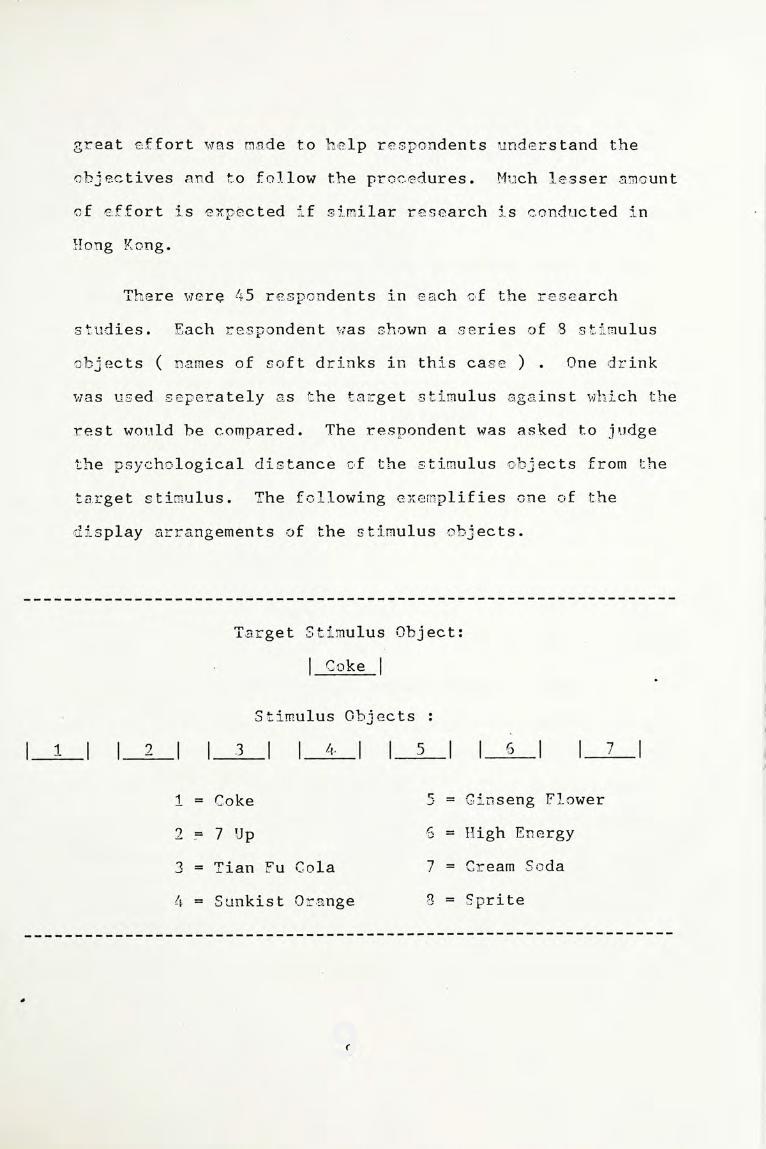
There were 45 respondents in each of the research
studies. Each respondent was shown a series of 8 stimulus
objects( names of soft drinks in this case). One drink
was used seperately as the target stimulus against which the
rest would be compared. The respondent was asked to judge
the psychological distance of the stimulus objects from the
target stimulus. The following exemplifies one of the
display arrangements of the stimulus objects.
Target Stimulus Object:
Coke
Stimulus Objects:
762 54•31
5= Ginseng Flower1= Coke
6= High Energy2 7 Up
7= Cream Soda3= Tian Fu Cola
8= Sprite4= Sunkist Orange

10
Each of the stimulus object would be taken out once as
the target stimulus object. And, each time the display
would be reordered randomly to avoid systematic bias.
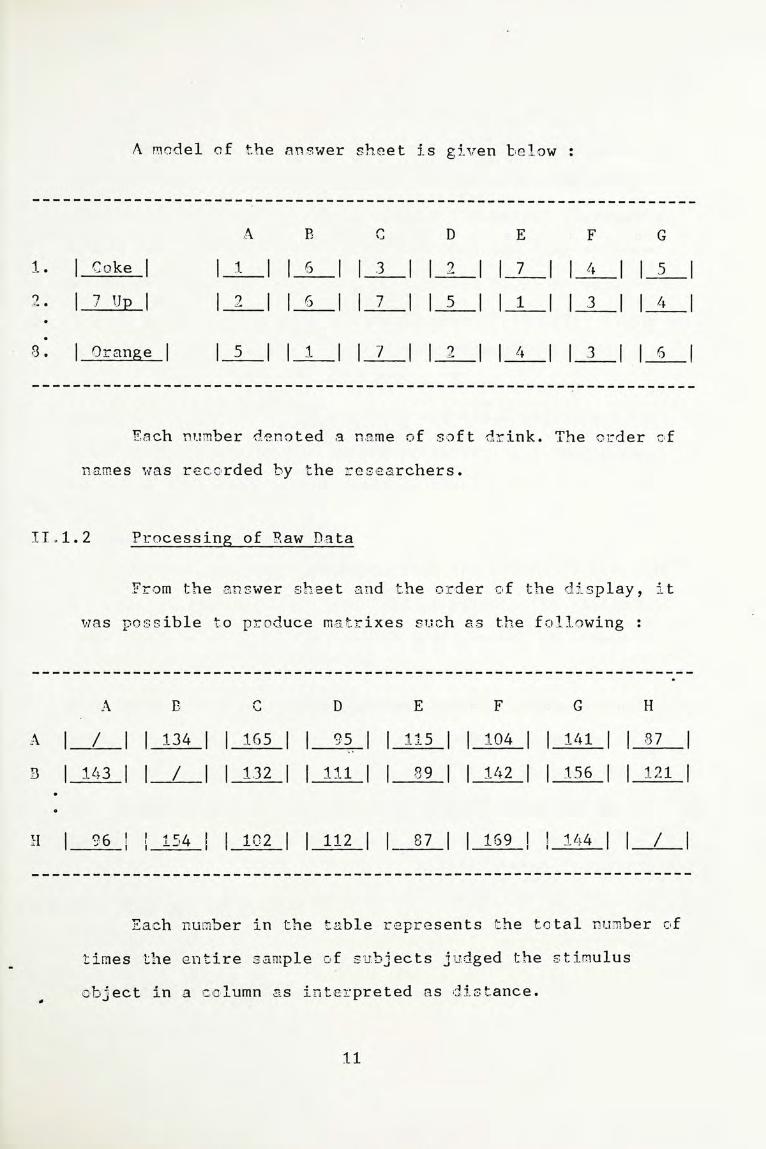
The respondent would answer on an answer sheet in the
following format.
MDS Answer Sheet
StimulusTarget
ObjectS t imu lu s
A B C D E F G
1
2
8
The name of the stimulus object that most clearly
resembled the target stimulus was written in position 'A'.
The name of the stimulus object that next closely resembled
the target was written in position W. This process was
continued until all stimulus objects had been rank ordered
with respect to their similarity to the target.
11
A model of the answer sheet is given below:
A B C D E F G
1 Coke 1 6 3 2 4 5
2 7 Up 2 6 7 5 i 3 4
7Orange8 5 1 2 4 3 6
Each number denoted a name of soft drink. The order of
names was recorded by the researchers.
11.1.2 Processing of Raw Data
From the answer sheet and the order of the display, it
was possible to produce matrixes such as the following:
A B C D E F G H
141 87134 115 104A 165 95
156 12189B 132 111 142143
96 1 1 154 1 1 102 1 1 112 1 1 87 1 1 169 1 1 144H
Each number in the table represents the total number of
times the entire sample of subjects judged the stimulus
object in a column as interpreted as distance.
12
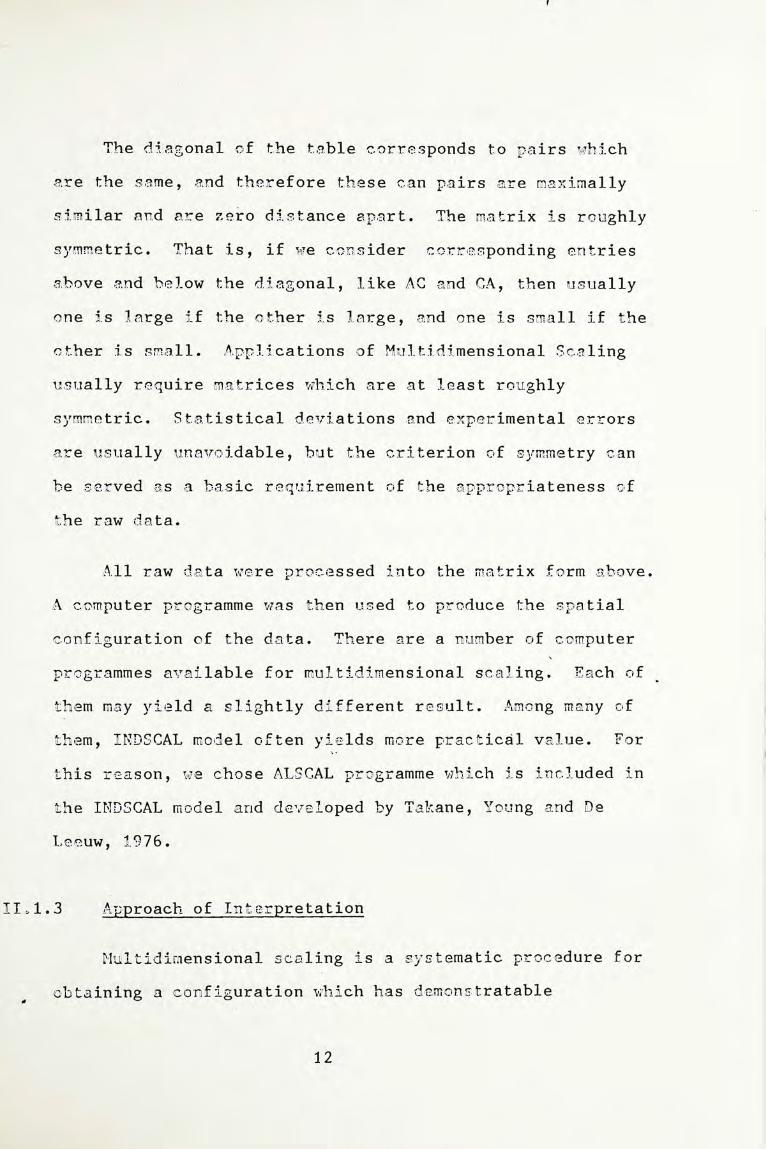
The diagonal of the table corresponds to pairs which
are the same, and therefore these can pairs are maximally
similar and are zero distance apart. The matrix is roughly
symmetric. That is, if we consider corresponding entries
above and below the diagonal, like AC and CA, then usually
one is large if the other is large, and one is small if the
other is small. Applications of Multidimensional Scaling
usually require matrices which are at least roughly
symmetric. Statistical deviations and experimental errors
are usually unavoidable, but the criterion of symmetry can
be served as a basic requirement of the appropriateness of
the raw data.
All raw data were processed into the matrix form above.
A computer programme was then used to produce the spatial
configuration of the data. There are a number of computer
programmes available for multidimensional scaling. Each of
them may yield a slightly different result. Among many of
them, INDSCAL model often yields more practical value. For
this reason, we chose ALSCAL programme which is included in
the INDSCAL model and developed by Takane, Young and De
Leeuw, 1976.
11.1.3 Approach of Interpretation
Multidimensional scaling is a systematic procedure for
obtaining a configuration which has demonstratable
13
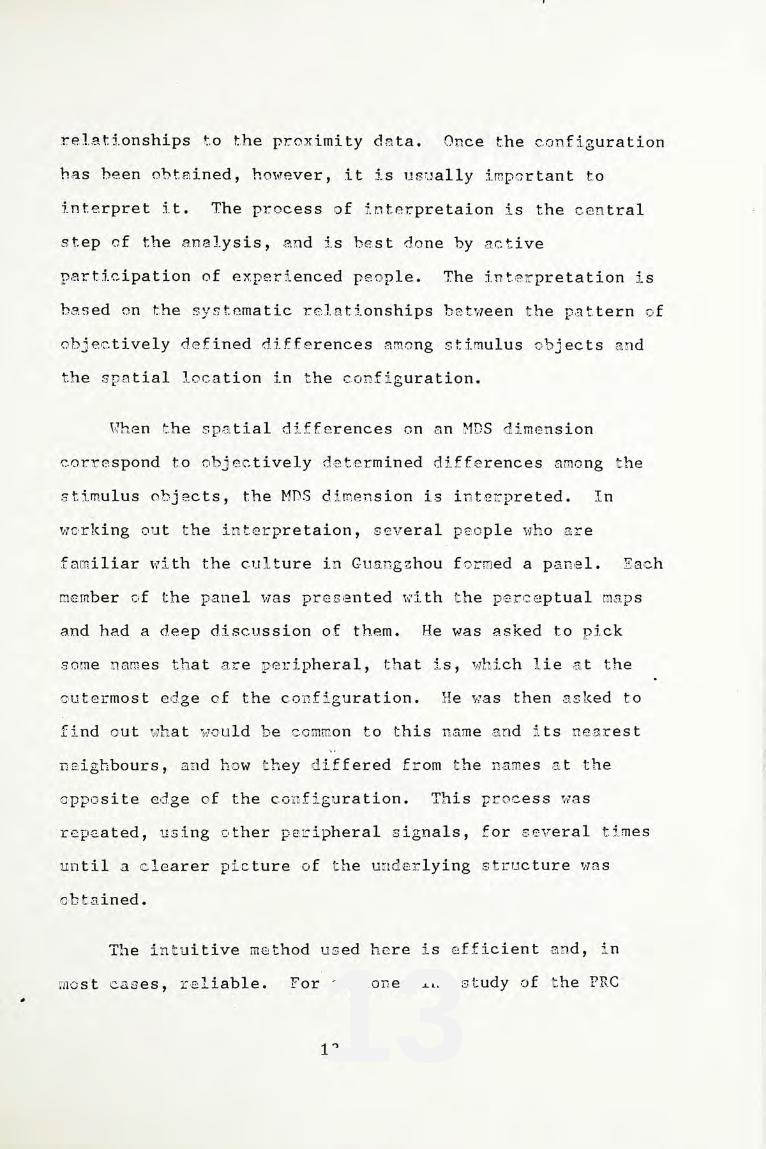
relationships to the proximity data. Once the configuration
has been obtained, however, it is usually important to
interpret it. The process of interpretaion is the central
step of the analysis, and is best done by active
participation of experienced people. The interpretation is
based on the systematic relationships between the pattern of
objectively defined differences among stimulus objects and
the spatial location in the configuration.
When the spatial differences on an MDS dimension
correspond to objectively determined differences among the
stimulus objects, the MDS dimension is interpreted. In
working out the interpretaion, several people who are
familiar with the culture in Guangzhou formed a panel. Each
member of the panel was presented with the perceptual maps
and had a deep discussion of them. He was asked to pick
some names that are peripheral, that is, which lie at the
outermost edge of the configuration. He was then asked to
find out what would be common to this name and its nearest
neighbours, and how they differed from the names at the
opposite edge of the configuration. This process was
repeated, using other peripheral signals, for several times
until a clearer picture of the underlying structure was
obtained.
The intuitive method used here is efficient and, in
most cases, reliable. For a pioneering study of the PRC
14
market, which has been changing quite rapidly in recent
years, it should be enough, at least, to serve two purposes.
First, the interpretation of the multidimensional scaling
study could be used as a basis for future study of
consumers' attitudes by regression analysis or other means
to verify the correctness of the interpretation. Second,
the configuration has shown some striking results that, some
stimulus objects seem to occupy positions that are not
intended by the manufacturers.
11.2 Focus Group
A qualitative analysis by employing the technique of
focus group interviews was also carried out, besides the
more sophisticated multidimensional study. Altogether four
groups of respondents were interviewed. Each group
consisted of 15 people who came from the universities
visited. The discussion was carried out in informal
atmosphere with concentration on the following areas:
a. The brand popularity, measured by the brands that the
group member has tried before,
b. The reasons that the respondent stated for consuming the
beverages.
c. Where to buy.
d. Image association,
e. Personal preference.
15
CHAPTER III
Results & Interpretations
III.1 Multidimensional Scaling
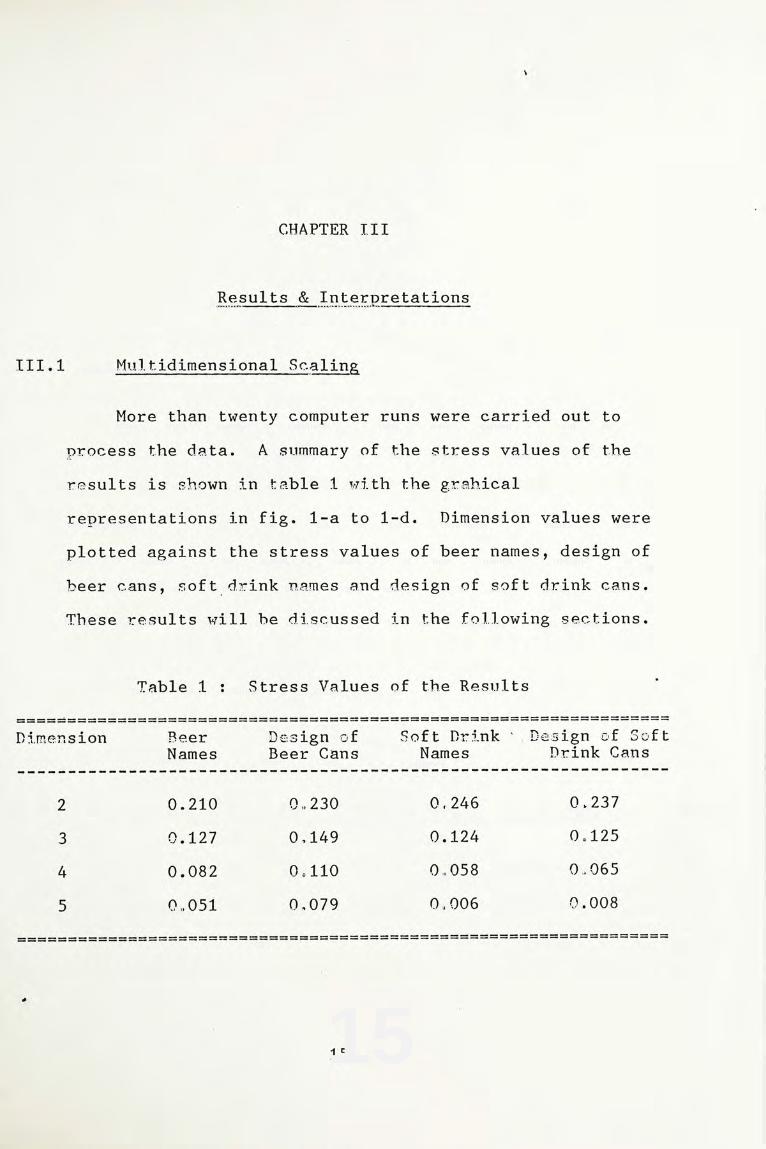
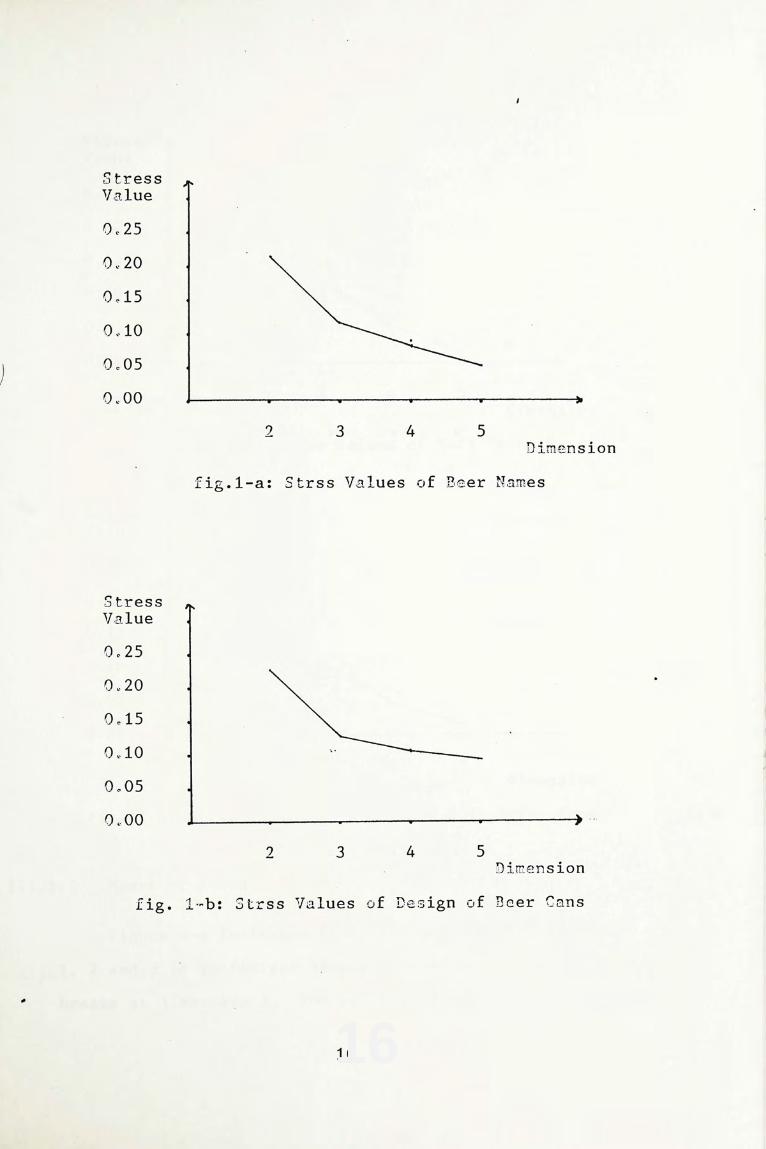
More than twenty computer runs were carried out to
process the data. A summary of the stress values of the
results is shown in table 1 with the grahical
representations in fig. 1-a to 1-d. Dimension values were
plotted against the stress values of beer names, design of
beer cans, soft drink names and design of soft drink cans.
These results will be discussed in the following sections.
Table 1: Stress Values of the Results
Dimension
2
3
4
5
Beer
Names
0.210
0.127
0.082
0.051
Design of
Beer Cans
0.230
0.149
0.110
0.079
Soft Drink
Names
0.246
0.124
0.058
0.006
Design of Soft
Drink Cans
0.237
0.125
0.065
0.008
16
Stress
Value
0.25
0.20
0.15
0.10
0.05
0.00
2 3 4 5
Dimension
fig.1-a: Strss Values of Beer Names
Stress
Value
0.25
0.20
0.15
0.10
0.05
0.00
2 3 4 5
Dimension
fig. 1-b: Strss Values of Design of Beer Cans
17
Stress
Value
0.25
0.20
0.15
0.10
0.05
0.00
2 3 4 5
Dimension
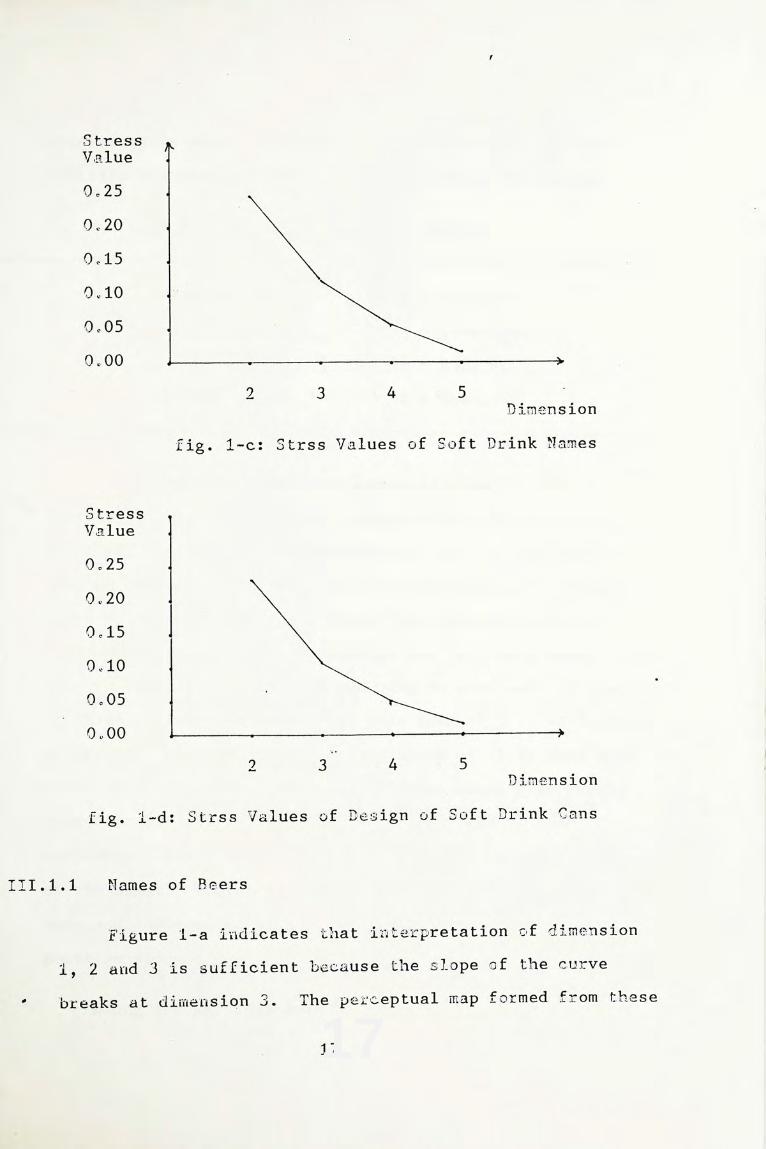
fig. 1-c: Strss Values of Soft Drink Names
Stress
Value
0.25
0.20
0.15
0.10
0.05
0.00
2 3 4 5
Dimension
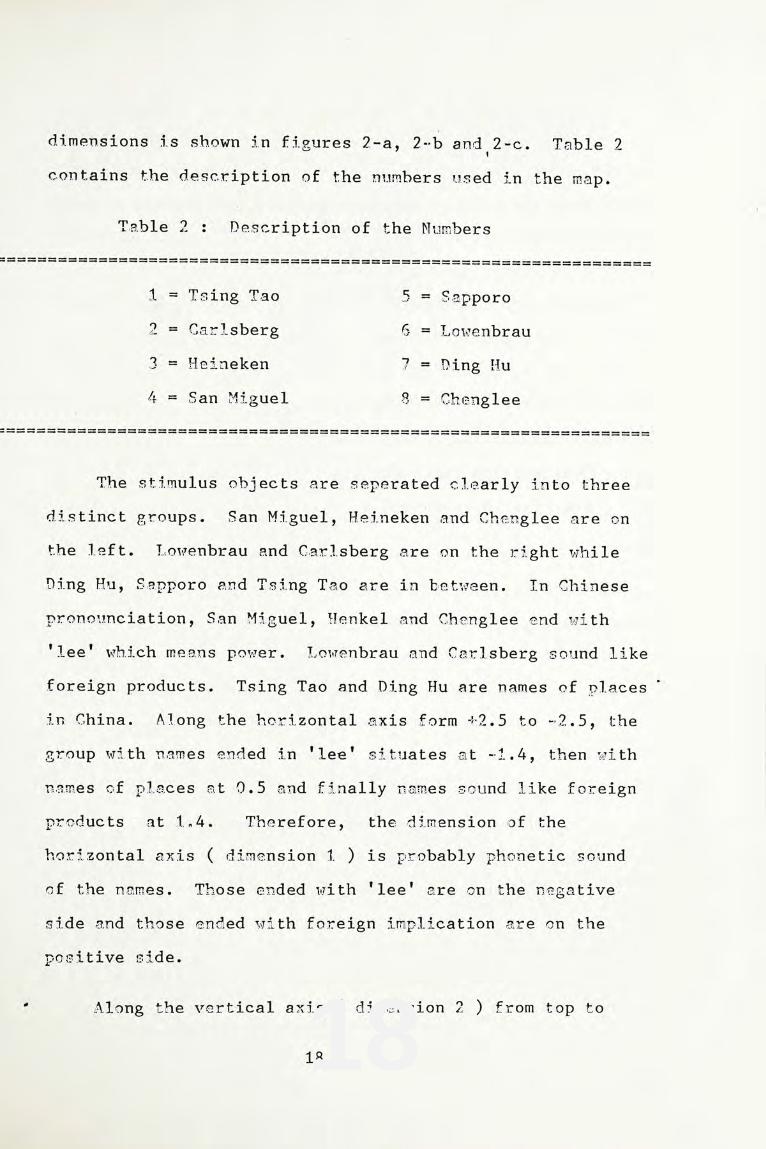
fig. 1-d: Strss Values of Design of Soft Drink Cans
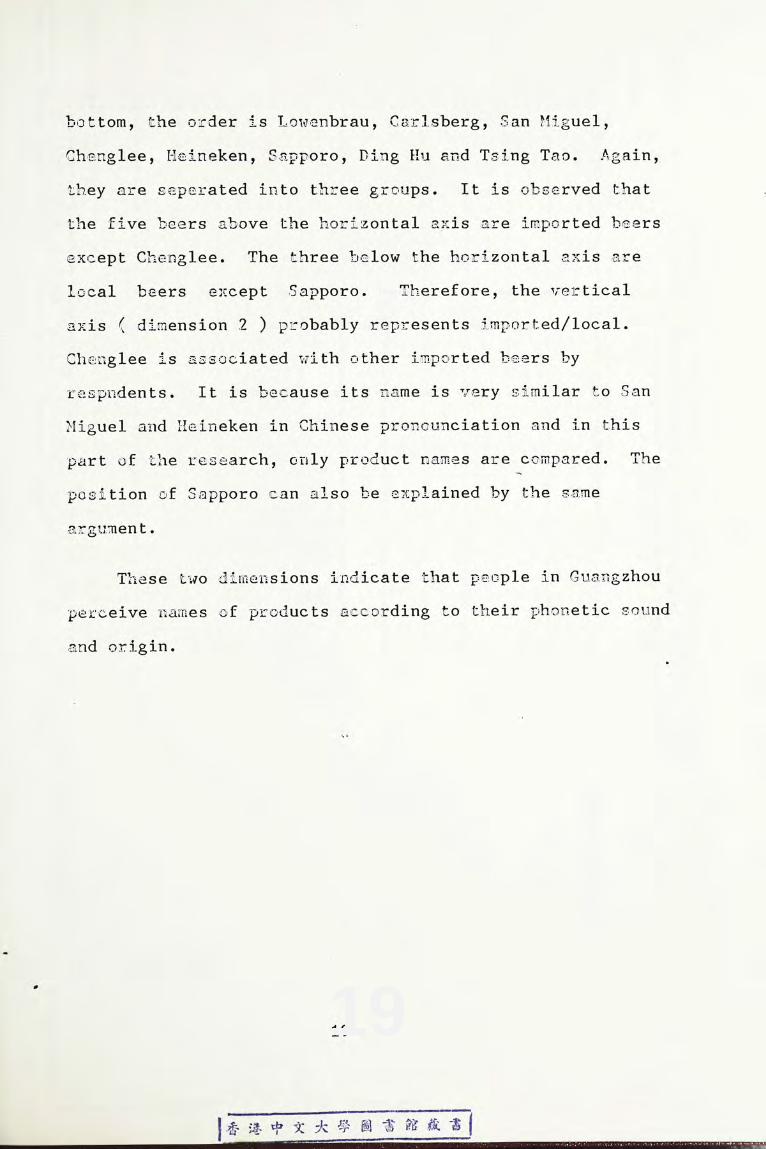
III.1.1 Names of Beers
Figure 1-a indicates that interpretation of dimension
1, 2 and 3 is sufficient because the slope of the curve
breaks at dimension 3. The perceptual map formed from these
18
dimensions is shown in figures 2-a, 2-b and 2-c. Table 2
contains the description of the numbers used in the map.
Table 2: Description of the Numbers
1= Tsing Tao 5= Sapporo
2= Carlsberg 6= Lowenbrau
3= Heineken 7= Ding Hu
4= San Miguel 8= Chenglee
The stimulus objects are seperated clearly into three
distinct groups. San Miguel, Heineken and Chenglee are on
the left. Lowenbrau and Carlsberg are on the right while
Ding Hu, Sapporo and Tsing Tao are in between. In Chinese
pronounciation, San Miguel, Henkel and Chenglee end with
'lee' which means power. Lowenbrau and Carlsberg sound like
foreign products. Tsing Tao and Ding Hu are names of places'
in-China. Along the horizontal axis form +2.5 to -2.5, the
group with names ended in 'lee' situates at -1.4, then with
names of places at 0.5 and finally names sound like foreign
products at 1.4. Therefore, the dimension of the
horizontal axis( dimension 1) is probably phonetic sound
of the names. Those ended with 'lee' are on the negative
side and those ended with foreign implication are on the
positive side.
Along the vertical axis( dimension 2) from top to
19
bottom, the order is Lowenbrau, Carlsberg, San Miguel,
Chenglee, Heineken, Sapporo, Ding Hu and Tsing Tao. Again,
they are seperated into three groups. It is observed that
the five beers above the horizontal axis are imported beers
except Chenglee. The three below the horizontal axis are
local beers except Sapporo. Therefore, the vertical
axis (dimension 2) probably represents imported/local.
Chenglee is associated with other imported beers by
respndents. It is because its name is very similar to San
Miguel and Heineken in Chinese pronounciation and in this
part of the research, only product names are compared. The
position of Sapporo can also be explained by the same
argument.
These two dimensions indicate that people in Guangzhou
perceive names of products according to their phonetic sound
and origin.
20
CONSUMERS ATTIITUDE TOWARDS CANNED BEVERAGE IN GUAGZHOU 21:33 MUNDAY. APRIL 29,1985
DERIVED STIMULUS CDNFIGURATION: DIMENSION 1 (HORIZONTAL) VS DIMENSION 2 (VSRTICAL)
2.0
1.5
1.0
0.5
-0.0
-0.5
-1.0
-1.5
-2.0
-2.5 -2.0 -1.5 -1.0 -0.5 -0.0 0.5 1.0 1.5 2.0 2.5
4
8
62
57 1
Fig. 2-a: Three-Dimensional Configuration Obtained by the
ALSCAL Program for Perceived Closeness among 8 BeerNames. Dimensions 1--and 2-are Plotted in this figure.
21
CGNSUMCRS ATTIITDE TUWARDS CANNED BEVEFAGE IN GUANGZHOUPEBCEPIION MAP
21:33 MUNDAY APRIL 29,1985
DERIVEDD STIMULUS CONFIGURATION: DIMENFNION 1 (HORIZONTAL) VS DIMRNSION 3 (VERTICAL)
2.0
1.5
1.0
0.5
-0.0
-0.5
-1.0
-1.5
-2.0
-2.5 -2.0 -1.5 -1.0 -0.5 -0.0 0.5 1. 1.5 2.0 2.5
Fig. 2-b Three-Dimensional Configuration obtained by the
ALSCAL for Perceived Clsensee among 8 Beer
Names, Dimensions 1 and 3 are Pliotted in this figure
22
COMSUMERS ATTOOTUDE TOWARDS CAMMED NEVERAGE OM GUAMGHOU 21:33 MUNDAY, APRM APRIL 29.1985PSECEPTION MAP
OERIVE STIMULUS CONF IGURATION: DIMENSION 2 (HOEIZONTAL) VS DIMENSION 3 (VERTICAL)
2.0
1.5
1.0
0.5
-0.0
-0.5
1.0
-1.5
-2.0
-2.5 -2.0 -1.5 -1.0 -0.5 -0.0 0.5 1.0 1.5 2.0 2.5
Fig.2-0 Three-Domensional Configuration Obtained by the
ALSCAL Program for Perceived Clpsensee among 8 Beer
Names. .Dimensions 2 and 3 are Plotted in this figure
23
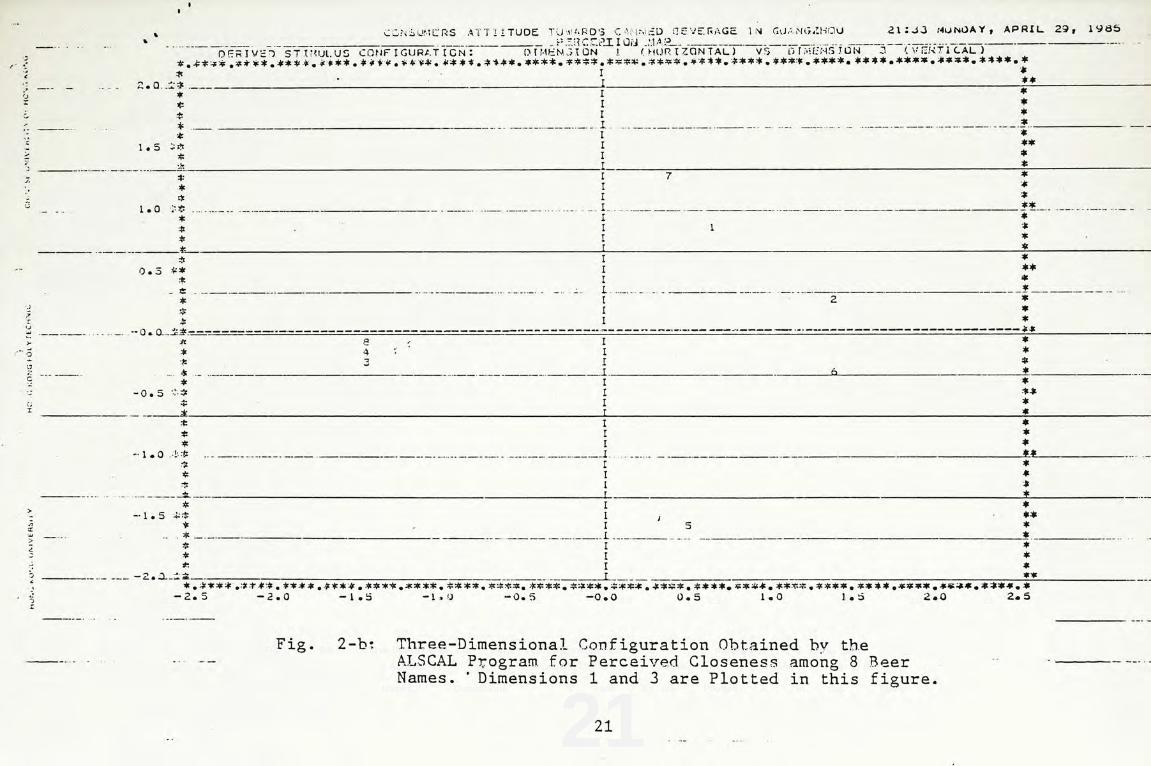
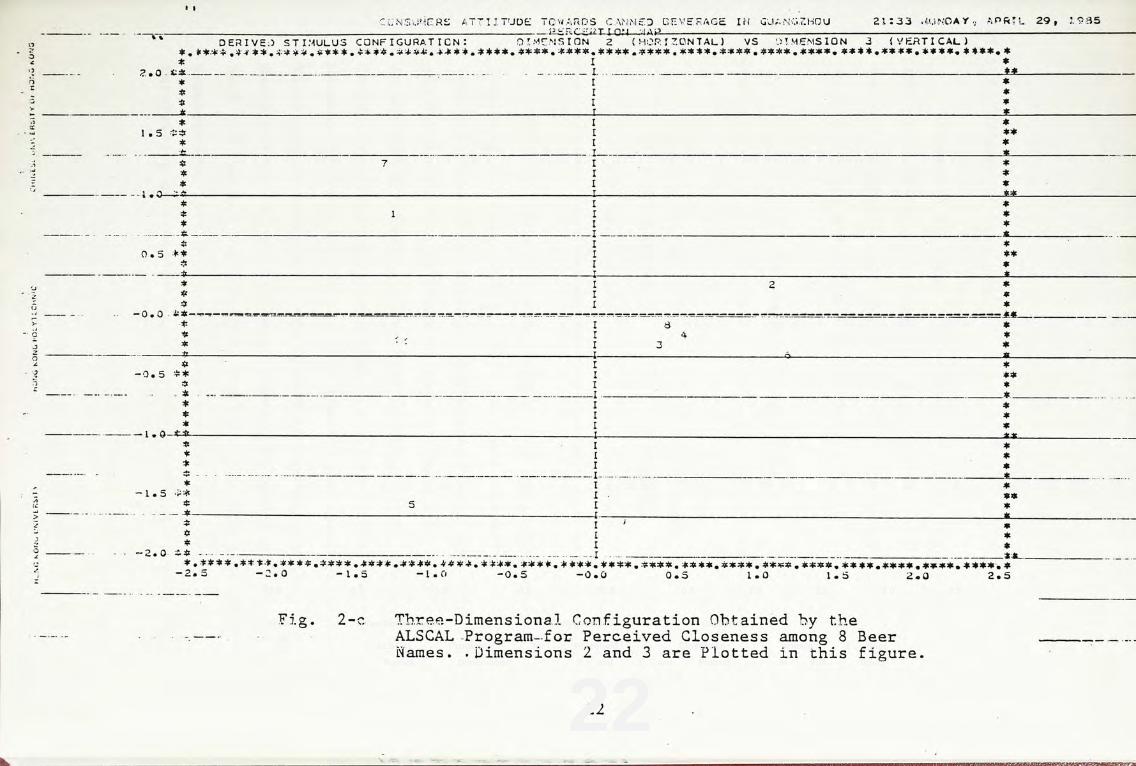
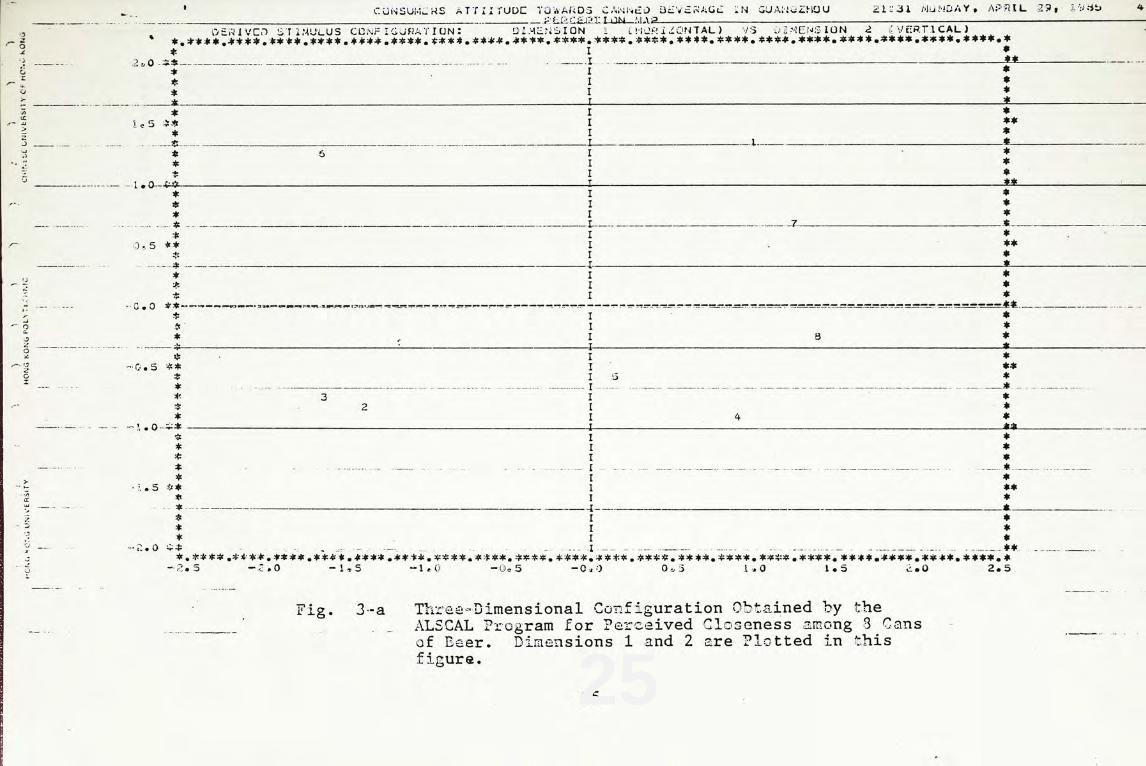
111.1.2 Design of Beer Cans
Dimension 1, 2 and 3 are necessary to be interpreted as
the curve in fig. 1-b breaks at dimension 3. The perseptual
map and description of the numbers used are shown in.fig. 3-
a, 3-b and 3-c and table 3 respectively.
Table 3: Description of the Numbers
1= Tsing Tao 5= Sapporo
2= Carlsberg 6= Lowenbrau
3= Heineken 7= Ding Hu
4= San Miguel 8= Chenglee
Stimulus objects are seperated into two groups along
dimension 1. From -2.5 to +2.5, they are Lowenbrau,
Heineken, Carlsberg, Sapporo, San Miguel, Tsing Tao, Ding Hu'
and Chenglee. The stimules objects on the negative side are
in westernized design. They-have European style labels and
English words. Sapporo's design is similar to that of the
Chinese products but it has both English and Japanese words.
Therefore it situates in the middle of the two groups. The
design of San Miguel is rather similar to Chenglee. It has
both Chinese and English words but the label design is very
westernized. Its position is near to the local beers. One
interesting observation about the colour of the cans on the
24
right hand side is that they all use gold colour
extensively. For the three local beers, they all have
Chinese words and-Chinese style labels. They are close to
each other along the horizontal axis. Therefore,
dimension 1 may represent the style of the design. Werstern
style on the negative side while Chinese style on the
positive side.
25
CONSUMERS ATTITUDE TOWARDS CANNED DEVEREAGE IN GUANGZHOUPERCEPTION MAP
DERIVED STIMULUS CONFIGURATION:
2.0
1.5
1.0
0.5
0.0
-0.5
-1.0
-2.5 -2.0 -1.5 -1.0 -0.5 -0.5 0.5 1.0 1.5 2.0 2.5
Fig. 3-a Three-Dimensional Configuration Obtained by the
ALSCAL Program for Perceived Closeness among 8 Cans
of Beer. Dimensions 1 and 2 are Plotted in this
figure.
1.5
-2.0
32
6
1
7
8
5
4
21:31 MUNDAY, APRIL 29, 1985
DIMENSION 1 (HORIZONTAL) VS DIMENSION 2 (VERTICAL)
26
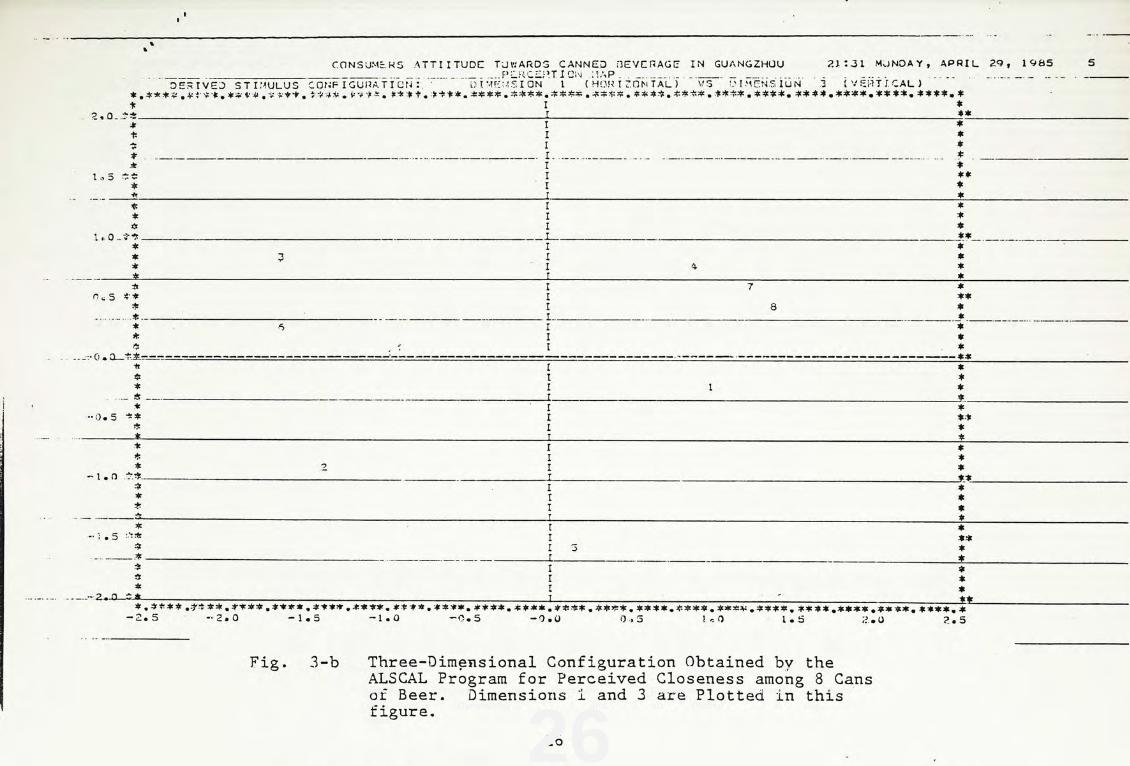
CONSUMERS ATTIITUDE TUWARDS CANNED DEVERAGC IN GUANGZHOU 21:31 MUNDAY, APRIL 29, 1985 5
DERIVED STIMULUS CONFIGURATICNDIMENSION 1 (HORIZONTAL) VS DIMENSIUN 3 (VERTICAL)
2.0
1.5
1.0
0.5
-0.0
-0.5
-1.0
-1.5
-2.0
-2.5-2.0 -1.5 -1.0 -0.5 -0.0 0.5 1.0 1.5 2.0 2.5
3
6
4
7
8
1
3
2
Fig. 3-b Three-Dimensional Configuration Obtained by the
ALSCAL Program for Perceived Closeness among 8 Cans
of Beer. Dimensions 1 and 3 are Plotted in this
figure.
27
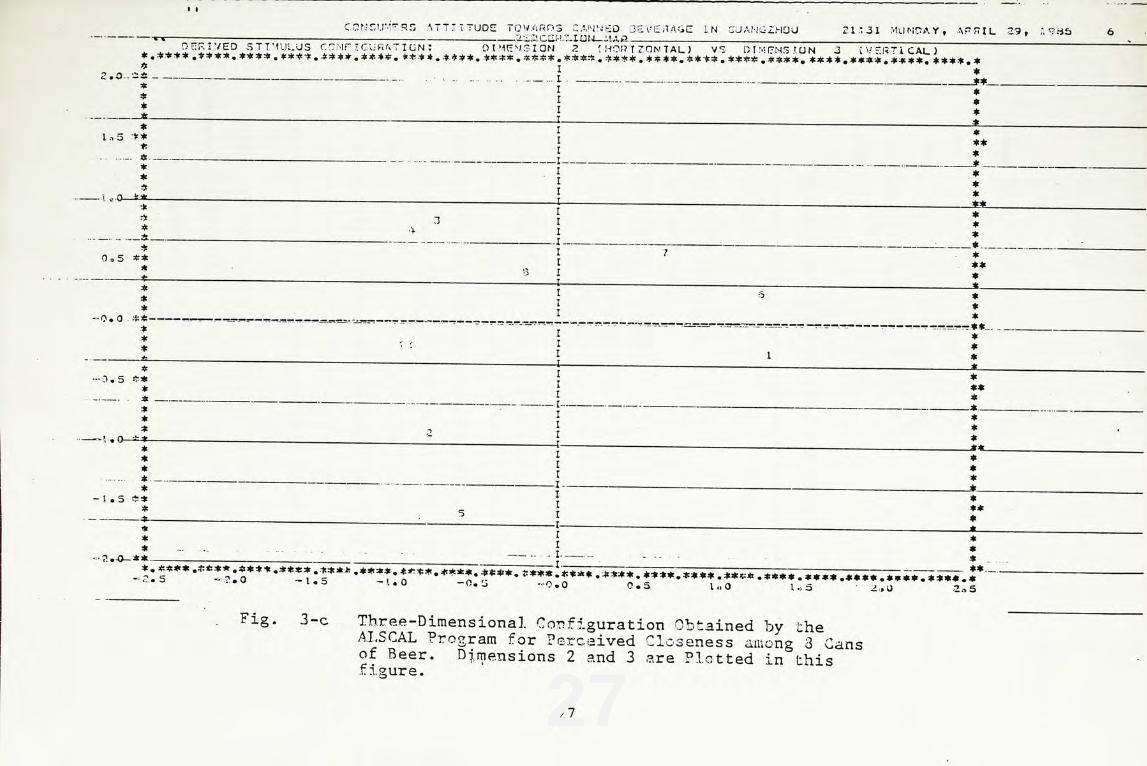
CONSUMFRS ATTIITUDE TOWARDS EANNED BEVERAGE IN GUANGZHOU 21:31 MUNDAY, APRIL 29, 1985 6
DERIVED STIMULUS CONFIGURATIONPSRCEPTION MAP
DIMENSION 2 (hORIZONTAL) VS DIMENSIUN 3 (VERICAL)
2.0
1.5
1.0
0.5
-0.0
-0.5
-1.0
-1.5
-2.0
-2.5 -2.0 -1.5 -1.0 -0.5 -0.0 0.5 1.0 1.5 2.0 2.5
43
8
7
6
1
2
5
Fig. 3-c Three-Dimensional Configuration Obtained by the
ALSCAL Program for Perceived Closeness among 8 Cans
of Beer. Dimensions 2 and 3 are Plotted in thisfigure.
28
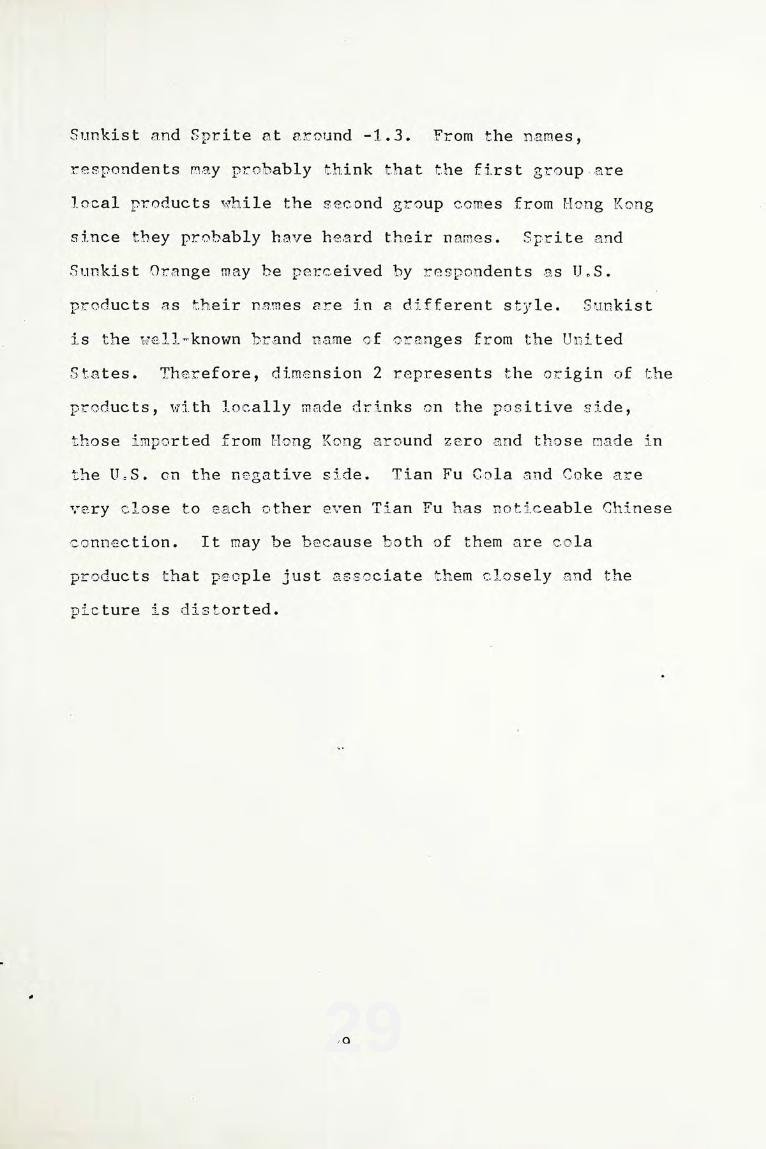
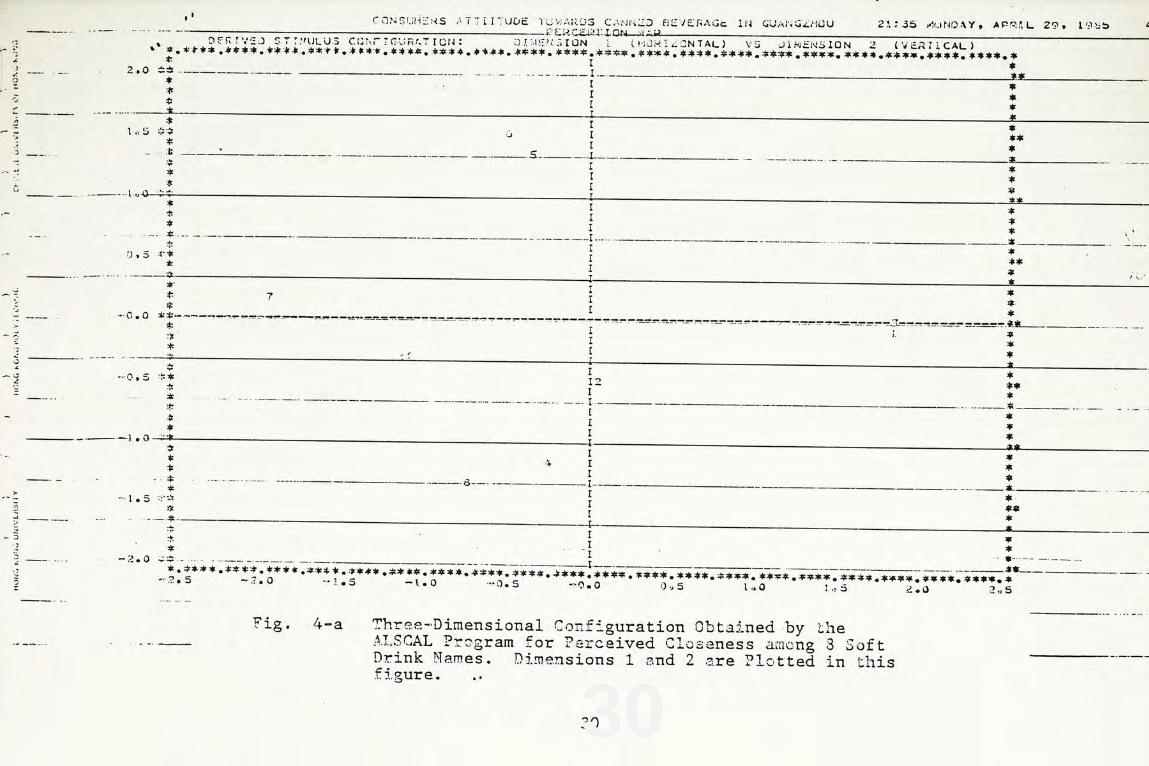
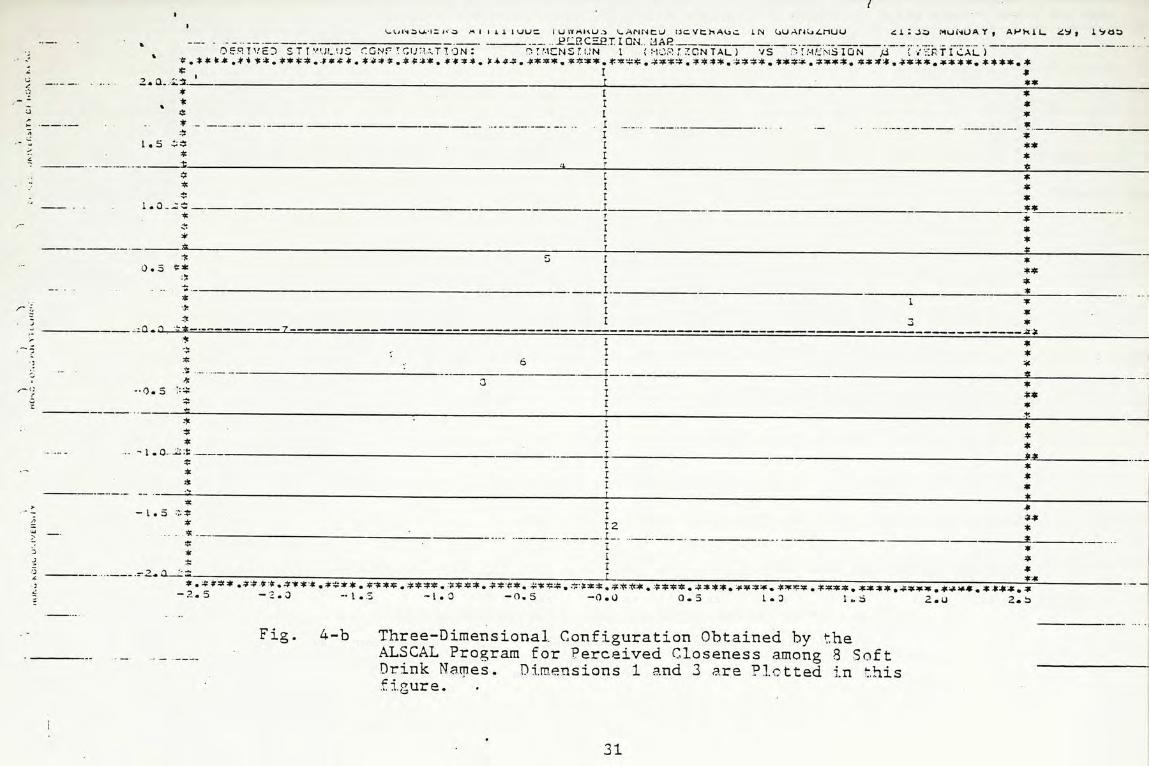
IV.1.3 Names of Soft Drinks
Again, dimension 1, 2 and 3 are needed to be
interpreted. The perceptual map and descriptions of numbers
used are shown in fig. 4-a, 4-b and 4-c and table 4
respectively.
Table 4: Description of the Numbers
5= Ginseng Flower1= Coke
6= High Energy2= 7 Up
7= Cream Soda3= Tian Fu Cola
8= Sprite4= Sunkist Orange
The stimulus objects along dimension 1 from negative
side to positive side are Cream Soda, Sprite, High Energy,
Ginseng Flower, Sunkist Orange, 7 Up, Coke and Tian Fu Cola.
Cream Soda and Coke were perceived as two very distinct
types of product. While for the rest in the middle region,
people had just mixed them up and considered them as similar
products by listening to their names. Therefore, dimension
1 represents drink types. Cream Soda situates on the
negative end and Coke situates on the positive end.
Stimulus objects are seperated into three groups along
dimension 2, with High Energy and Ginseng Flower at 1.5,
Cream Soda, Coke, Tian Fu' Cola and 7 Up at around 1.5,
29
Sunkist and Sprite at around -1.3. From the names,
respondents may probably think that the first group are
local products while the second group comes from Hong Kong
since they probably have heard their names. Sprite and
Sunkist Orange may be perceived by respondents as U.S.
products as their names are in a different style. Sunkist
is the well-known brand name of oranges from the United
States. Therefore, dimension 2 represents the origin of the
products, with locally made drinks on the positive side,
those imported from Hong Kong around zero and those made in
the U.S. on the negative side. Tian Fu Cola and Coke are
very close to each other even Tian Fu has noticeable Chinese
connection. It may be because both of them are cola
products that people just associate them closely and the
picture is distorted.
30
CONSUMERS ATTIITUDE TOWARDS CANNED BEVERAGs IN GUANGZHOU21:35 MUNDAY, APRIL 29, 1985PERCEPTION MAP
DERIVED STIMULUS CONTIGURATION DIMENSION 1 (HORI/CNTAL) VS DIMENSION 2 (VERTICAL)
2.0
1.5
1.0
0.5
-0.0
-0.5
-1.0
-1.5
-2.0
-2.5 -2.0 -1.5 -1.0 -0.5 -0.0 0.5 1.0 1.5 2.0 2.5
Fig. 4-a Three-Dimensional Configuration Obtained-by the
ALSCAL Program for Perceived Closeness among 8 Soft
Drink Names. Dimensions 1 and 2 are Plotted in this
figure.
7
5
8
4
2
31
6
DERIVED STIMULUS CONFIGURATION: DIMENS IUN 1 (HORIZONTAL) VS DIMENSION /J (VERTICAL,
-2.5 -2.0- 1.5 -1. 0 -0.5 -0.0 0.5 1.0 1.5 2.0 2.5
Fig. 4-b Three-Dimensional Configuration Obtained by the
ALSCAL Program for Perceived Closeness among 8 Soft
Drink Names. Dimensions 1 and 3 are Plotted in this
figure.
32
CONSUNCRS ATTIITUDE TOWARDS CANNED DEVERAGE IN GUANZHUO 21:35 MJNDAY, APRIL 29, 1985PERCEPTION MAP
DERIVED STIMULUS CUNFIGURATIUN: DIM NSION 2 (HUF:ILCNTAL) VS DLMENSION 3 (VERTICAL)
2.0
1.5
-1.0
0.5
-0.0
-0.5
-1.5
-2.0
-2.5 -2.0 -1.5 -1.0 -0.5 -0.0 0.5 1.0 1.5 2.0 2.5
Fig. 4-c Three-Dimensional Configuration Obtained by the
ALSCAL Program for Perceived Closeness among 8 Soft
Drink Names. Dimensions 2 and 3 are.Plotted in this
figureo,.
-1.0
33
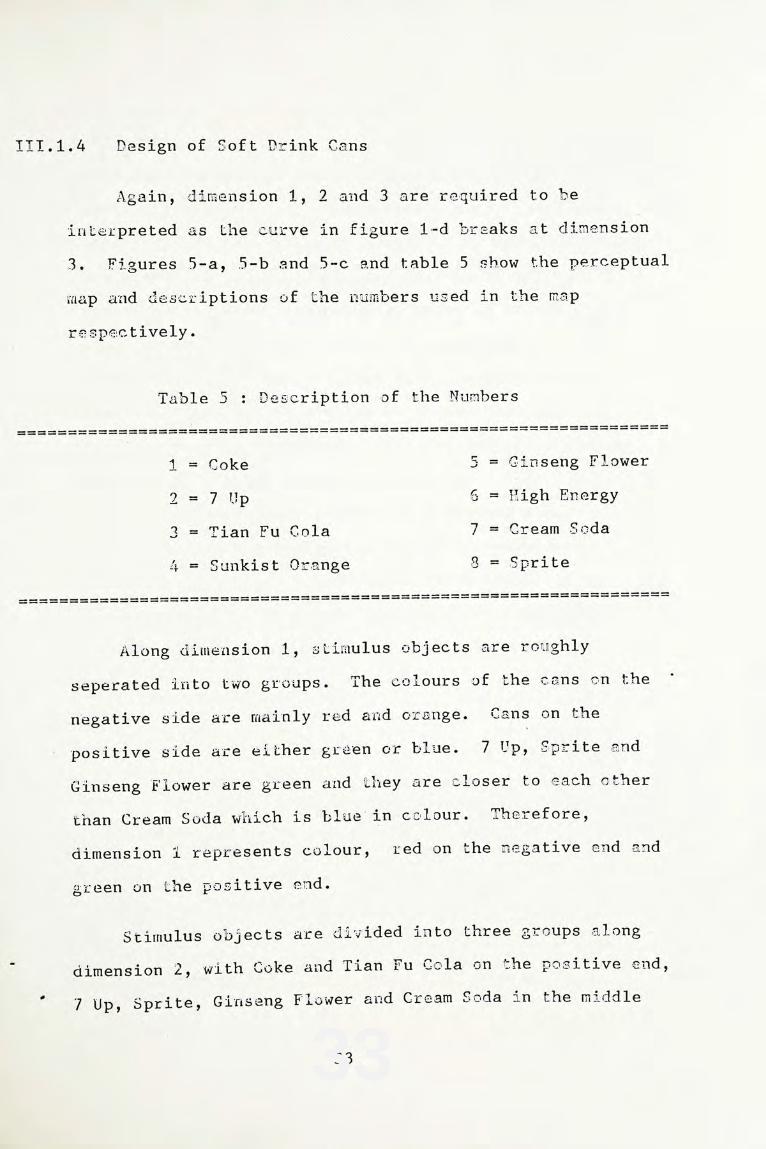
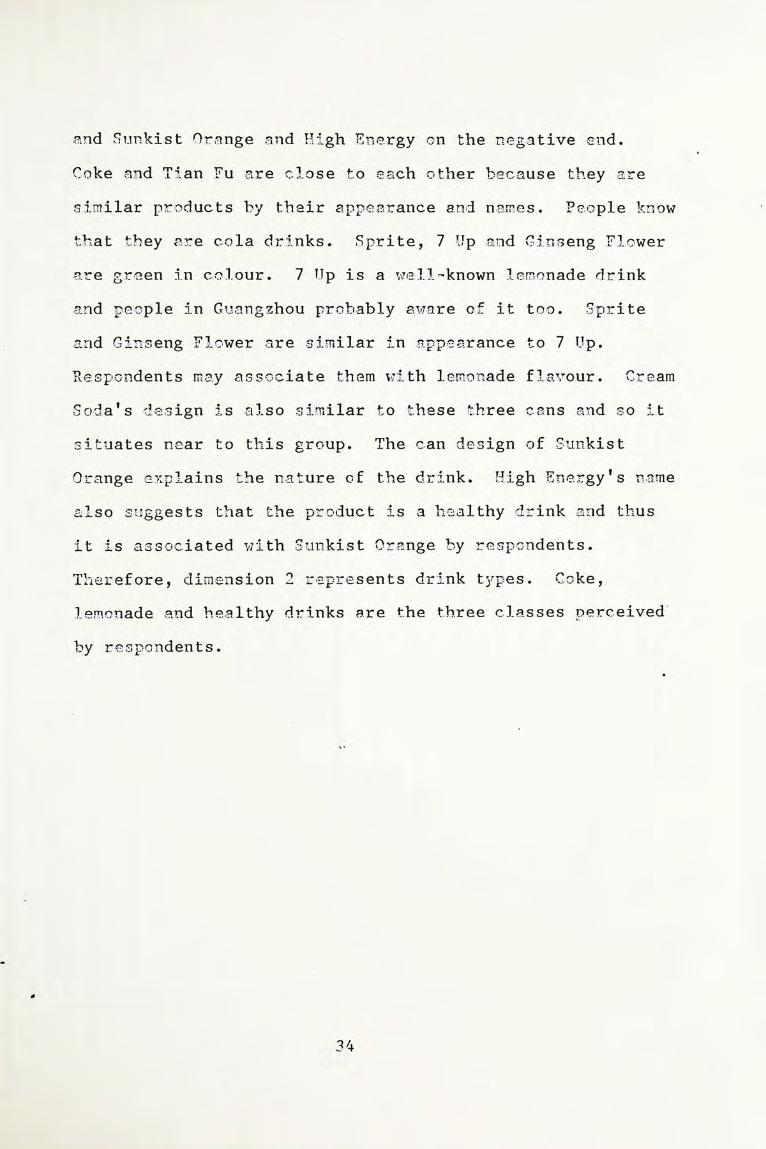
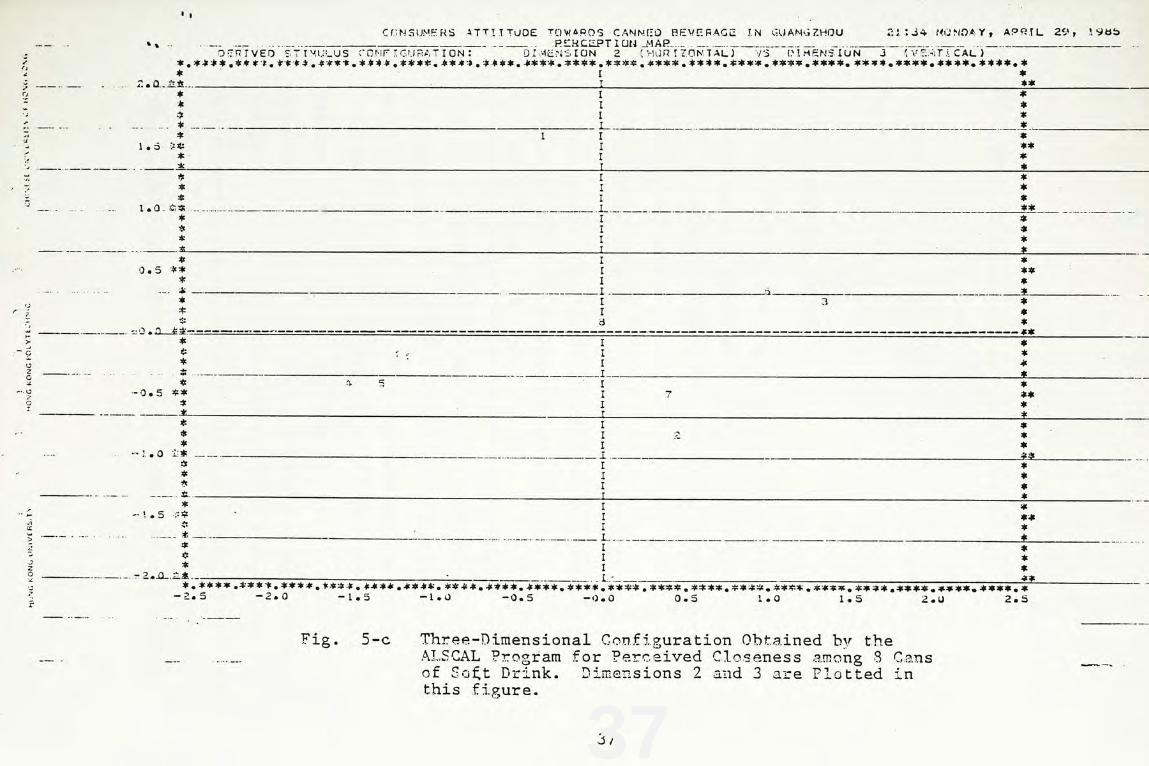
111.1.4 Design of Soft Drink Cans
Again, dimension 1, 2 and 3 are required to be
interpreted as the curve in figure 1-d breaks at dimension
3. Figures 5-a, 5-b and 5-c and table 5 show the perceptual
map and descriptions of the numbers used in the map
respectively.
Table 5: Description of the Numbers
5= Ginseng Flower1= Coke
6= High Energy2= 7 Up
7= Cream Soda3= Tian Fu Cola
8= Sprite4= Sunkist Orange
Along dimension 1, stimulus objects are roughly
seperated into two groups. The colours of the cans on the
negative side are mainly red and orange. Cans on the
positive side are either green or blue. 7 Up, Sprite and
Ginseng Flower are green and they are closer to each other
than Cream Soda which is blue-in colour. Therefore,
dimension 1 represents colour, red on the negative end and
green on the positive end.
Stimulus objects are divided into three groups along
dimension 2, with Coke and Tian Fu Cola on the positive end,
7 Up, Sprite,' Ginseng Flower and Cream Soda in the middle
34
and Sunkist Orange and High Energy on the negative end.
Coke and Tian Fu are close to each other because they are
similar products by their appearance and names. People know
that they are cola drinks. Sprite, 7 Up and Ginseng Flower
are green in colour. 7 Up is a well-known lemonade drink
and people in Guangzhou probably aware of it too. Sprite
and Ginseng Flower are similar in appearance to 7 Up.
Respondents may associate them with lemonade flavour. Cream
Soda's design is also similar to these three cans and so it
situates near to this group. The can design of Sunkist
Orange explains the nature of the drink. High Energy's name
also suggests that the product is a healthy drink and thus
it is associated with Sunkist Orange by respondents.
Therefore, dimension 2 represents drink types. Coke,
lemonade and healthy drinks are the three classes perceived'
by respondents.
35
(ONSUMEPS ATTIIT:JDE TOWARDS CANNED BEVERAGE IN GUANGZHOU 21:34 :NUNDAY, APRIL 25, 1985PERCEPTION MAP
DERIVED STIMOLUS CONFIGURATION: DIMENSION 1 (HURIZCNTAL) VS DIMENSION 2 (VERTICAL)
2.0
1.5
1.0.
-0.5
-1.0
-1.5
-2.5 -2.0 -1.5 -1.0 -0.5 -0.0 0.5 1.0 1.5 2.0 2.5
Fig. 5-a Three-Dimensional Configuration Obtained by the
ALSCAL Program for Perceived Closeness among 8 Cans
of Soft Drink. Dimensions 1 and 2 are Plotted inthis figure.
0.5
-0.0
-2.0
36
CONSUMERS ATTIITUDE TOWARDS CANNED VEVERAFE IN FUANFZHOU 21:34 MONDAY, APRIL 29,85
DEPIVED STIMULUS CDNFIGRATION DIMCNSION (HORIZONTAL) VS DIMENSION 3 (VERTICAL)
2.0
1.5
1.0
0.5
-0.0
-0.5
-1.0
-1.5
-2.0
-2.5 -2.0 -1.5 -1.0 -0.5 -0.0 0.5 1.0 1.5 2.0 2.5
Fig 5-b Three-Dimensional Configuration Obtained by the
ALSCAL Program for Perceived Closeness among 8 Cans
of Soft Drink. Dimensions 1 and 3 are Plotted in
thisfigure.
AISSYEA:ND
DNIH
DNIH
HOKC
RONFPOLYUICHNIC
CHJUSE
NSHKRSNY
OR
RINI
KING
37
CUNSUMERS ARRIITUDE TOWAROS CANNED BEVERAGE IN GUANGZHOU 21:34 MONDAY, APRIL 29,1985
DERIVED STIMULUS CONFIGURATION: DIMENSION 2 (HORIZONTAL) VS DIMENSIOU 3 (VERTUCAL)
2.0
1.5
1.0
0.5
-0.0
-0.5
-1.0
-1.5
-2.0
-2.5 -2.0 -1.5 -1.0 -0.5 -0.0 0.5 1.0 1.5 2.0 2.5
Fig. 5-c Three-Dimensional Configuration Obtained by the
ALSCAL Program for Perceived Closeness among 8 Cansof Soft Drink. Dimensions 2 and 3 are Plotted in
this figure.
1
4 5
63
7
2
38
111.2 Focus Group
Focus group discussion is used to provide a more
comprehensive basis for interpretation. The results are
summarized below.
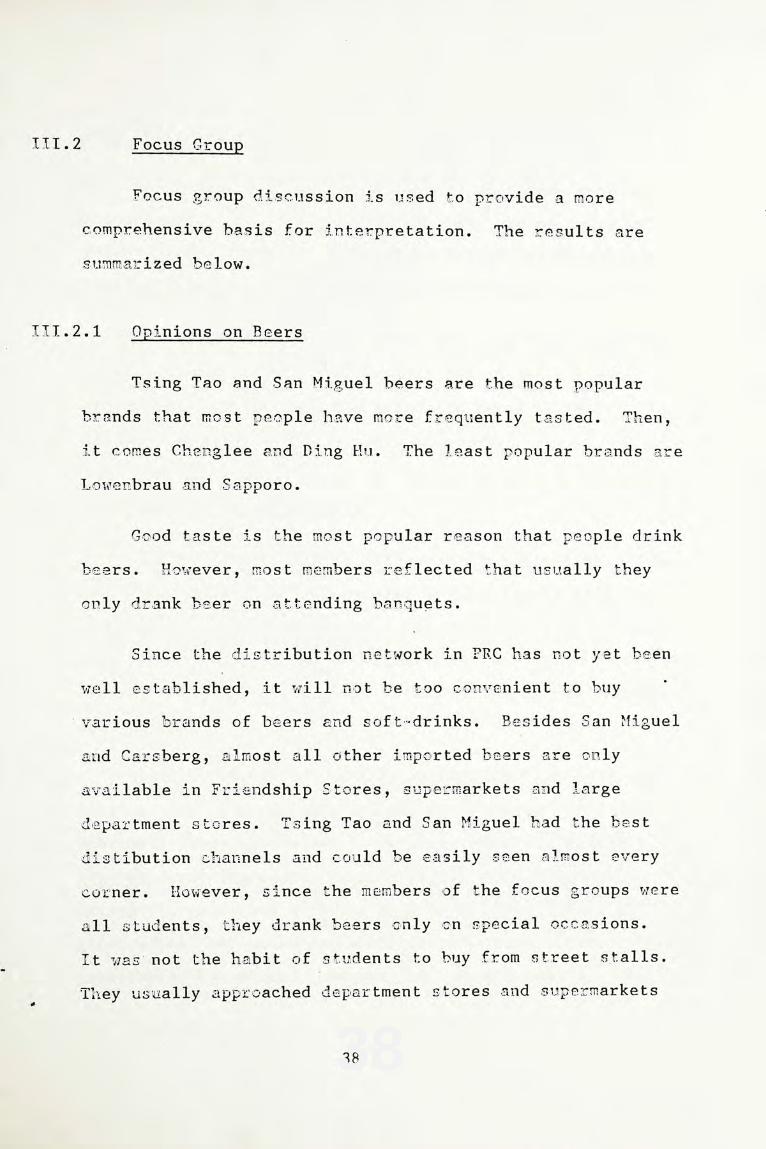
111.2.1 Opinions on Beers
Tsing Tao and San Miguel beers are the most popular
brands that most people have more frequently tasted. Then,
it comes Chenglee and Ding Hu. The least popular brands are
Lowenbrau and Sapporo.
Good taste is the most popular reason that people drink
beers. However, most members reflected that usually they
only drank beer on attending banquets.
Since the distribution network in PRC has not yet been
well established, it will not be too convenient to buy
various brands of beers and soft-drinks. Besides San Miguel
and Carsberg, almost all other imported beers are only
available in Friendship Stores, supermarkets and large
department stores. Tsing Tao and San Miguel had the best
distibution channels and could be easily seen almost every
corner. However, since the members of the focus groups were
all students, they drank beers only on special occasions.
It was'not the habit of students to buy from street stalls.
They usually approached department stores and supermarkets
39
when they bought more 'luxurious' items.
The image associated with content of beers is quite
homogeneous. The first impression they have on beers is
thirst driven. And, it is a common belief that beer is a
healthy drink and will not be harmful to human body.
People are more fond of Tsing Tao, San Miguel and the
local Chinese brands. Even Sapporo has gained a higher
preference than the imported brands in terms of their
personal preference of the beers in general.
111.2.2 Opinions on Soft Drinks
The result is slightly different for soft drinks. Coke
is predominantly the most popular brand. Almost 95% of
respondents have drunk before. For the local soft drinks,
they are not as welcome as the local beers. Tin Fu Cola is
the most popular of them but still far behind the imported
soft drinks.
However, though respondents are not familiar with the
local brands, they still showed fondness towards the local
beverage. This phenomenon is worth to note. It may be a
sign of overt expression to show patriotism. Thirst,
curiosity, taste and attraction of advertisements are all
good reasons for consuming a can of soft drink. The
priority of the places that they buy the products is very
40
similar to where they buy beers except that buying from
street stalls becomes more common.
The product image they associate with Giengshen Flowei
and High Energy is 'healthy drink'. While for the rest, the
feature of 'thirst driven' is emphasized.
41
CHAPTER IV
Conclusion
The results above have revealed some of the dimensions which
people in Guangzhou use to perceive stimulus objects. This
information is useful for market positioning. However, they are
not the only factors affecting buying behaviour. In marketing
activities, a lot of other environmental factors such as
advertising and promotion campaign should also considered.
IV.1 People classify products according to the similarities
of their names if they have not seen the actual appearances
of the products. The results in IV.1.1 support this
argument. The Chinese pronounciation of San Miguel,
Chenglee and Heineken are similar as they all end in 'lee'.
Although Heineken and San Miguel are imported beers, they
are associated with Chenglee which is a local beer.
In IV.1.3, Tian Fu Coke and Coke are close to each
other as their names end with the same wordings. For the
otherr soft drinks, their names are quite distinct.
42
IV.2 People tend to associated names of similar nature into
the same group. Sapporo, Tsing Tao and Ding Hu are close to
each other in figure 2-a along dimension 2. Tsing Tao and
Ding Hu are names of places in the PRC and it is natural
that they are grouped togather. The Chinese name of Sapporo
is also similar to name of a place in PRC and therefore it
is closed to Tsing Tao and Ding Hu. Similar argument can be
applied to Carlsberg and Lowenbrau too. The style of their
names are very westernized and people will probably know
that they are not local products by just listening to their
names( c.f. III.1 for this argument).
Tian Fu Cola and Coke are both cola drinks and they are
also close to each other. Furthermore, Cream Soda, Coke and
Sunkist Orange are three distinct types of drinks. Their
positions along dimension 1 in the perceptual maps are thus
far from each other.
IV.3 Perception of names is overriden by what people see.
The results of 111.1.2 show-that respondents related
Carlsberg, Lowenbrau and Heineken together. Sapporo is
seperated from Tsing Tao and Ding Hu while San Miguel
becomes closer to Tsing Tao and Ding Hu. This suggests that
respondents had changed their mind after looking at the
stimulus objects.
The results from the. soft drinks portion show this
point too. Ginseng Flower is close to High Energy along the
43
imported/local dimension in 111.1.3. It is regarded as a
healthy drink by respondents. However, after they have seen
the appearance of the cans, they associate it with Sprite
and 7 Up. They thought that it is a lemonade drink. The
reason for such change can easily be understood. Ginseng is
a Chinese herbel medicine that helps people get stronger.
Soft drinks with ginseng as one ingredient should be healthy
drinks. The name of High Energy implies that it is a
healthy drink too. Therefore, they are close to each other
in 111.1.3. The background colour of the can of Ginseng
Flower is green, similar to that of Sprite and 7 Up.
Respondents associated Ginseng Flower with them in 111.1.4.
One thing needed to draw attention to is that the image of
Ginseng Flower is changed from healthy drink type to
lemonade drink type by changing the stimulus. But actually,
Ginseng Flower is a cola like beverage. It means that the
name, the design and the content of this product is not
-congruent.
The orange colour of the Sunkist Orange's cans suggests
that the product contains orange juice. In Chinese
perception, orange juice is a healthy drink and thus it
becomes close to High Energy in 111.1.4.
IV.4 People group beers mainly by the style of their design.
Lowenbrau, Heineken and Carlsberg all have European style
labels and design. They have coloured background (Lowenbrau
44
in blue, Heineken and Carlsberg in green) as distincted from
others that have white background. Sapporo's position is in
between because-its style is rather distinct. It has a
large black label and the words are also in black. While
the three Chinese beers all have red words surrounded by a
gold border. Furthermore, they all have their Chinese names
at a prominent position on the cans. San Miguel is situated
in the middle between Sapporo and the three local beers. It
suggests that the style of its design is very similar to the
local beers, or the local beers imitate San Miguel's design.
The cans of both Tian Fu Cola and Coke are red in
colour. Their style is also similar but it is probable that
Tian Fu tries to imitate Coke.
IV.5 However, the reason why Lowenbrau is close to Tsing Tao
and Ding Hu in some of the maps is unclear. Properties
fitting, which is a step futher from MDS, may help us to
understand these results better. Similar problems also
happen in soft drink results.
IV.6 With the above findings, we have the following
suggestions for several brands we used in our research.
IV.6.1 Heineken should not use the Chinese name 'hei lee' if
it wants to position itself as a premium imported beer. Or,
it must have a large promotion campaign to clarify its
45
origin. At the moment, it is confused with other local
products by people in Guangzhou.
IV.6.2 Sapporo and San Miguel should re-design their cans if
they want to retain their foreign identity. Extensive use
of the gold colour has confused their status. However, it
should be noted that the confusion of their foreign identity
may be because they are targets of imitation.
IV.6.3 The change in Ginseng Flower's image in the soft drink
research shows that the can design of the product does not
agree with its nature. The market position is rather
confusing. Its name suggests that it is a healthy drink but
the graphic design of its can makes people think that it is
a lemonade drink. However, we know that the taste and
colour of Ginseng Flower are more similar to a cola than to
a lemonade. The manufacturer of this product should define
the target market more clearly and change the name and
design accordingly.
IV.6.4 People in Guangzhou are not familiar with the brand
names of beverages. In Hong Kong, most of people know that
Sprite and 7 Up are similar products. While the results of
our research show that these two names mean different kind
of products. More promotion is needed if manufacturers want
to enter the beverage market in Guangzhou( c.f. 111.1.3 4).
IV.6.5 Cream Soda occupies' a rather distinct position and so
46
does Coke. This implies that incorporating the nature of
drink into the name helps the product distinguishing itself
from others.
IV.6.6 People relate Sprite to 7 Up after they have seen the
design of the cans. This suggests that marketers can use a
design similar to that of a well-known product if the soft
drink they are going to sell belong to the same type.
Consumers can identify immediately what kind of product it
is by looking at the design. It helps in market
positioning.
IV.7 The results of the study would be useful for the
manufacturers or marketers when choosing the Chinese names
and designing the cans of the beverages. The designer
should understand clearly the present and intended market
positions of the product. Since advertising and promotion
is not so easy and efficient to be carried out in the PRC,
great care must be taken not to distort consumers'
perception.
IV.8 The research is intended to discover some basic
underlying structure of consumers' attitude towards canned
beverages. To shed more lights on the design of cans, the
company could conduct further research by means of
properties fitting or multiple regression analysis.
Specific attributes of can design can then be studied.
Furthermore, what we did so far only concerns with name and
47
design. The taste of products also takes an influential
role. A systematic taste test will be a good complement to
the above suggestion.
48
BIBLIOGRAPHY
Books
Green, P. E. and Rao, V. R. Applied Multidimensional Scaling: A
Comparison of A roach and Algorithms. New York: Holt,
Rinchart and Winston, 1972.
Green, P. E. and Carmone, F. J. Multidimensional Scaling and
Related Techniques in Marketing Analysis. Boston: Allyn
and Bacon, Inc., 1970.
Torgerson, W. S. Theory and Methods of Scaling. New York: John
Wiley, 1958.
James B. Higginbotham Focus Group Interview: A Reader.
American Marketing Association, 1979.
Periodicals
Green, P. E. and Arun Maheshwari. A Note on the
Multidimensional Scaling of Conditional Proximity Data,
Journal of Marketing Research 7 (1970):106-110.
Shepard, R. N. Analysis of Proximities, Psychometrika
27 (1962):125-139, 219-246.
49
Attachment 1: Physical Appearance of Beer Cans
50
Attachment 2: Physical Appearance of Soft Drink Cans

Related Documents