A learning style classification mechanism for e-learning Yi-Chun Chang a, * , Wen-Yan Kao a , Chih-Ping Chu a , Chiung-Hui Chiu b a Department of Computer Science and Information Engineering, National Cheng-Kung University, Tainan, Taiwan b Graduate Institute of Information and Computer Education, National Taiwan Normal University, Taipei, Taiwan article info Article history: Received 8 January 2007 Received in revised form 26 January 2009 Accepted 2 February 2009 Keywords: Adaptive learning Genetic algorithm (GA) k-Nearest neighbor classification Learning style E-learning abstract With the growing demand in e-learning, numerous research works have been done to enhance teaching quality in e-learning environments. Among these studies, researchers have indicated that adaptive learn- ing is a critical requirement for promoting the learning performance of students. Adaptive learning pro- vides adaptive learning materials, learning strategies and/or courses according to a student’s learning style. Hence, the first step for achieving adaptive learning environments is to identify students’ learning styles. This paper proposes a learning style classification mechanism to classify and then identify stu- dents’ learning styles. The proposed mechanism improves k-nearest neighbor (k-NN) classification and combines it with genetic algorithms (GA). To demonstrate the viability of the proposed mechanism, the proposed mechanism is implemented on an open-learning management system. The learning behav- ioral features of 117 elementary school students are collected and then classified by the proposed mech- anism. The experimental results indicate that the proposed classification mechanism can effectively classify and identify students’ learning styles. Ó 2009 Elsevier Ltd. All rights reserved. 1. Introduction With the popularization of Internet, the demand of e-learning has greatly increased (Allen & Seaman, 2003; Gerald & Hussar, 2003; Waits & Lewis, 2003; Wirt, Choy, Rooney, Provasnik, & Tobin, 2004). Numerous research works regarding to e-learning have been done to enhance teaching quality in e-learning environments. Among these studies, researchers have indicated that adaptive learning is a critical requirement for promoting the learning performance of students (Brusilovsky, 1999; Brusilovsky, Eklund, & Schwarz, 1998; Brusilovsky & Maybury, 2002; Graf & Kinshuk, 2006; Sessink, Beeftink, Tramper, & Hartog, 2003). Adaptive learning provides the adaptive learning mate- rials, learning strategies and/or courses according to a student’s learning style (Brusilovsky, 1999; Brusilovsky et al., 1998; Brusilovsky & Maybury, 2002; Carver, Howard, & Lane, 1999; Shang, Shi, & Chen, 2001; Pena, Narzo, & Rosa, 2002; Trantafillou, Poportsis, & Demetriadis, 2003). Learning style is an indicator of how a student learns and likes to learn, and how an instructor teaches to successfully address the needs of the individual students (Gregorc & Ward, 1977; Keefe, 1987; Tseng, Chu, Hwang, & Tsai, 2008). Hence, the first step for achieving adaptive learning environments is to identify students’ learning styles. Several learning style models have been proposed for defining and measuring learning styles (Dunn, Dunn, & Price, 1984; Felder & Silverman, 1988; Keefe, 1987; Kolb, 1984). Depending on one learning style model, numerous research works also have provided mechanisms to detect and identify learning styles for achieving an adaptive e-learning environment (Chen, Lee, & Chen, 2005; García, Amandi, Schiaffino, & Campo, 2007; Schiaffino, Garcia, & Amandi, 2008; Xenos, 2004). These mechanisms need to be based on a large number of student’s samples. As a result, the collecting process of a large number of student’s samples is time-consuming and the processing of these students’ samples is complicated. Hence, to solve the aforementioned weaknesses, this paper proposes a learning style classification mechanism to classify and then iden- tify a student’s learning style. This paper uses the classification technique to classify learning styles. One of most popular classification techniques is k-nearest neighbor (k-NN) classification (Chen, Yen, & Ho, 2004; Kuncheva & Jain, 1999). However, k-NN classification has some weaknesses. Therefore, the proposed mechanism improves k-NN classification (Chen et al., 2004; Kuncheva & Jain, 1999) and com- bines it with genetic algorithms (GA) (Holland, 1975; Kuncheva, 1995, 1997; Mitchell, 1997). Since k-NN classification only needs a small amount of samples, the weaknesses of aforementioned research works can be solved. Furthermore, the classification mechanism proposed in this paper is independent of learning style models. That is, the proposed mechanism possesses compatibility, which can be adopted for any learning style model according to users’ demand. To demonstrate the viability of the proposed mechanism, this paper implements the 0360-1315/$ - see front matter Ó 2009 Elsevier Ltd. All rights reserved. doi:10.1016/j.compedu.2009.02.008 * Corresponding author. E-mail addresses: [email protected] (Y.-C. Chang), [email protected] (C.-P. Chu). Computers & Education 53 (2009) 273–285 Contents lists available at ScienceDirect Computers & Education journal homepage: www.elsevier.com/locate/compedu

Welcome message from author
This document is posted to help you gain knowledge. Please leave a comment to let me know what you think about it! Share it to your friends and learn new things together.
Transcript
Computers & Education 53 (2009) 273–285
Contents lists available at ScienceDirect
Computers & Education
journal homepage: www.elsevier .com/locate /compedu
A learning style classification mechanism for e-learning
Yi-Chun Chang a,*, Wen-Yan Kao a, Chih-Ping Chu a, Chiung-Hui Chiu b
a Department of Computer Science and Information Engineering, National Cheng-Kung University, Tainan, Taiwanb Graduate Institute of Information and Computer Education, National Taiwan Normal University, Taipei, Taiwan
a r t i c l e i n f o
Article history:Received 8 January 2007Received in revised form 26 January 2009Accepted 2 February 2009
Keywords:Adaptive learningGenetic algorithm (GA)k-Nearest neighbor classificationLearning styleE-learning
0360-1315/$ - see front matter � 2009 Elsevier Ltd. Adoi:10.1016/j.compedu.2009.02.008
* Corresponding author.E-mail addresses: [email protected] (Y.-C.
a b s t r a c t
With the growing demand in e-learning, numerous research works have been done to enhance teachingquality in e-learning environments. Among these studies, researchers have indicated that adaptive learn-ing is a critical requirement for promoting the learning performance of students. Adaptive learning pro-vides adaptive learning materials, learning strategies and/or courses according to a student’s learningstyle. Hence, the first step for achieving adaptive learning environments is to identify students’ learningstyles. This paper proposes a learning style classification mechanism to classify and then identify stu-dents’ learning styles. The proposed mechanism improves k-nearest neighbor (k-NN) classification andcombines it with genetic algorithms (GA). To demonstrate the viability of the proposed mechanism,the proposed mechanism is implemented on an open-learning management system. The learning behav-ioral features of 117 elementary school students are collected and then classified by the proposed mech-anism. The experimental results indicate that the proposed classification mechanism can effectivelyclassify and identify students’ learning styles.
� 2009 Elsevier Ltd. All rights reserved.
1. Introduction
With the popularization of Internet, the demand of e-learning has greatly increased (Allen & Seaman, 2003; Gerald & Hussar, 2003;Waits & Lewis, 2003; Wirt, Choy, Rooney, Provasnik, & Tobin, 2004). Numerous research works regarding to e-learning have been doneto enhance teaching quality in e-learning environments. Among these studies, researchers have indicated that adaptive learning is a criticalrequirement for promoting the learning performance of students (Brusilovsky, 1999; Brusilovsky, Eklund, & Schwarz, 1998; Brusilovsky &Maybury, 2002; Graf & Kinshuk, 2006; Sessink, Beeftink, Tramper, & Hartog, 2003). Adaptive learning provides the adaptive learning mate-rials, learning strategies and/or courses according to a student’s learning style (Brusilovsky, 1999; Brusilovsky et al., 1998; Brusilovsky &Maybury, 2002; Carver, Howard, & Lane, 1999; Shang, Shi, & Chen, 2001; Pena, Narzo, & Rosa, 2002; Trantafillou, Poportsis, & Demetriadis,2003). Learning style is an indicator of how a student learns and likes to learn, and how an instructor teaches to successfully address theneeds of the individual students (Gregorc & Ward, 1977; Keefe, 1987; Tseng, Chu, Hwang, & Tsai, 2008). Hence, the first step for achievingadaptive learning environments is to identify students’ learning styles. Several learning style models have been proposed for defining andmeasuring learning styles (Dunn, Dunn, & Price, 1984; Felder & Silverman, 1988; Keefe, 1987; Kolb, 1984). Depending on one learning stylemodel, numerous research works also have provided mechanisms to detect and identify learning styles for achieving an adaptive e-learningenvironment (Chen, Lee, & Chen, 2005; García, Amandi, Schiaffino, & Campo, 2007; Schiaffino, Garcia, & Amandi, 2008; Xenos, 2004). Thesemechanisms need to be based on a large number of student’s samples. As a result, the collecting process of a large number of student’ssamples is time-consuming and the processing of these students’ samples is complicated.
Hence, to solve the aforementioned weaknesses, this paper proposes a learning style classification mechanism to classify and then iden-tify a student’s learning style. This paper uses the classification technique to classify learning styles. One of most popular classificationtechniques is k-nearest neighbor (k-NN) classification (Chen, Yen, & Ho, 2004; Kuncheva & Jain, 1999). However, k-NN classification hassome weaknesses. Therefore, the proposed mechanism improves k-NN classification (Chen et al., 2004; Kuncheva & Jain, 1999) and com-bines it with genetic algorithms (GA) (Holland, 1975; Kuncheva, 1995, 1997; Mitchell, 1997). Since k-NN classification only needs a smallamount of samples, the weaknesses of aforementioned research works can be solved. Furthermore, the classification mechanism proposedin this paper is independent of learning style models. That is, the proposed mechanism possesses compatibility, which can be adopted forany learning style model according to users’ demand. To demonstrate the viability of the proposed mechanism, this paper implements the
ll rights reserved.
Chang), [email protected] (C.-P. Chu).
274 Y.-C. Chang et al. / Computers & Education 53 (2009) 273–285
proposed mechanism on a Learning Management System (LMS) that conforms to Shareable Content Object Reference Model (SCORM) e-learning standard (SCORM, 2004). After the learning behavioral features of 117 elementary school students are collected, the proposedmechanism is used to classify the learning styles of 117 students to verify the classification accuracy of the proposed mechanism.
The rest of this paper is organized as follows: Section 2 briefly reviews related works. Section 3 presents the learning style classificationmechanism in detail. Section 4 demonstrates the experimental results. Finally, Section 5 provides a conclusion. Besides, Appendix presentsan illustrative example, which demonstrates how the proposed mechanism works.
2. Related works
2.1. Learning style
As the descriptions in Section 1, learning style indicates how a student learns and likes to learn, and facilitates that an instructor cansuccessfully teach to adapt to individual students (Gregorc & Ward, 1977; Keefe, 1987; Tseng et al., 2008). Each learning style involves dif-ferently behavioral features that can be collected and analyzed from the learning behavior of a student.
There have been several models for defining and measuring learning styles, such as (1) Kolb (1984) proposed that learners can be clas-sified into convergent learners, divergent learners, assimilators, and accommodators (Kolb, 1984). (2) In Keefe’s learning style test, the lear-ner can be identified into Sequential Processing Skill, Discrimination Skill, Analytic Skill and Spatial Skill (Keefe, 1987). (3) Felder &Silverman’s model comprises the category of intuitive/sensitive, global/sequential, visual/verbal, inductive/deductive and active/reflective,which can be used to discriminate 32 learning styles. For example, the sensitive/ sequential/ verbal/ deductive/ active is a learning style(Felder & Silverman, 1988). (4) Stangl (2002) distinguished learners into four styles, i.e., acting, hearing, reading and seeing (Stangl, 2002).
2.2. The basic concepts of genetic algorithms (GA)
Genetic algorithm (GA) is proposed by Holland in 1975 (Holland, 1975), which is widely used to solve an optimization problem by asystematic way (Hwang, Yin, Wang, Tseng, & Hwang, 2008). The standard GA consists of several executing steps, namely chromosomeencoding and population initialization, fitness evaluation, selection, crossover and mutation (Holland, 1975; Mitchell, 1997; Rothlauf,2006; Yao, 1999):
1. Chromosome encoding and population initialization: Chromosome encoding is for transferring a candidate solution into a chromosomeaccording to an optimization problem. A chromosome consists of several genes. Depending on an optimization problem, a gene canbe a binary bit, an integer or a real number. A population is composed of several chromosomes. An initial population is usually randomlygenerated. Through a number of genetic evolutional processes, the population evolves from one generation to next generation toimprove the quality of chromosomes. The population size, i.e., the number of chromosomes in a population, is kept constant.
2. Fitness evaluation: To evaluate the fitness of each chromosome, a fitness function needs to be defined according to an optimization prob-lem. The fitness value derived from the fitness function can be used to determine which chromosomes are better solutions for the opti-mization problem.
3. Selection: According to roulette selection (Holland, 1975), the chromosomes that have fitter fitness values possess higher probability tobe selected to propagate offspring.
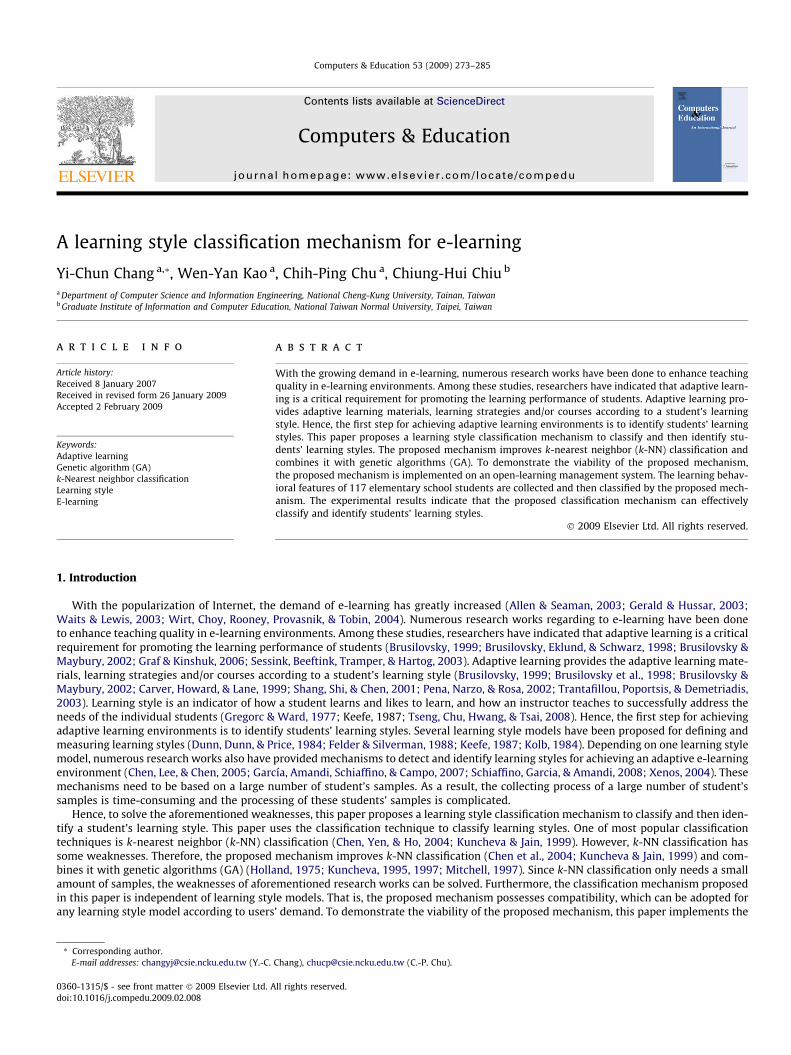
4. Crossover: It is a genetic evolutional process, in which each individual has a chance to interchange gene information from two parentchromosomes. Crossover is performed with a crossover probability. A random number can be generated between [0.0,1.0] for each mat-ing pair. If the random number is less than the crossover probability, the crossover is performed to propagate offspring. Otherwise, nocrossover is performed.There are two broadly adopted crossover operators (Syswerda, 1989). One is the single point crossover, which yields offspring by inter-changing all the genes after a random position from the parent chromosomes, as Fig. 1a depicts. The other is the two-point crossover,which generates two random positions and interchanges the genes between the two positions from the parent chromosomes, as Fig. 1bdepicts.
Parents
11011 00000
00001 11111
single point crossover
Children
11011 11111
00001 00000
Parents
110 11000 00
000 01111 11
Two-point crossover
Children
110 01111 00
000 11000 11
a
b
Fig. 1. An illustrative example of crossover
1100111100 mutation 1000111110
Fig. 2. An illustrative example of mutation
Y.-C. Chang et al. / Computers & Education 53 (2009) 273–285 275
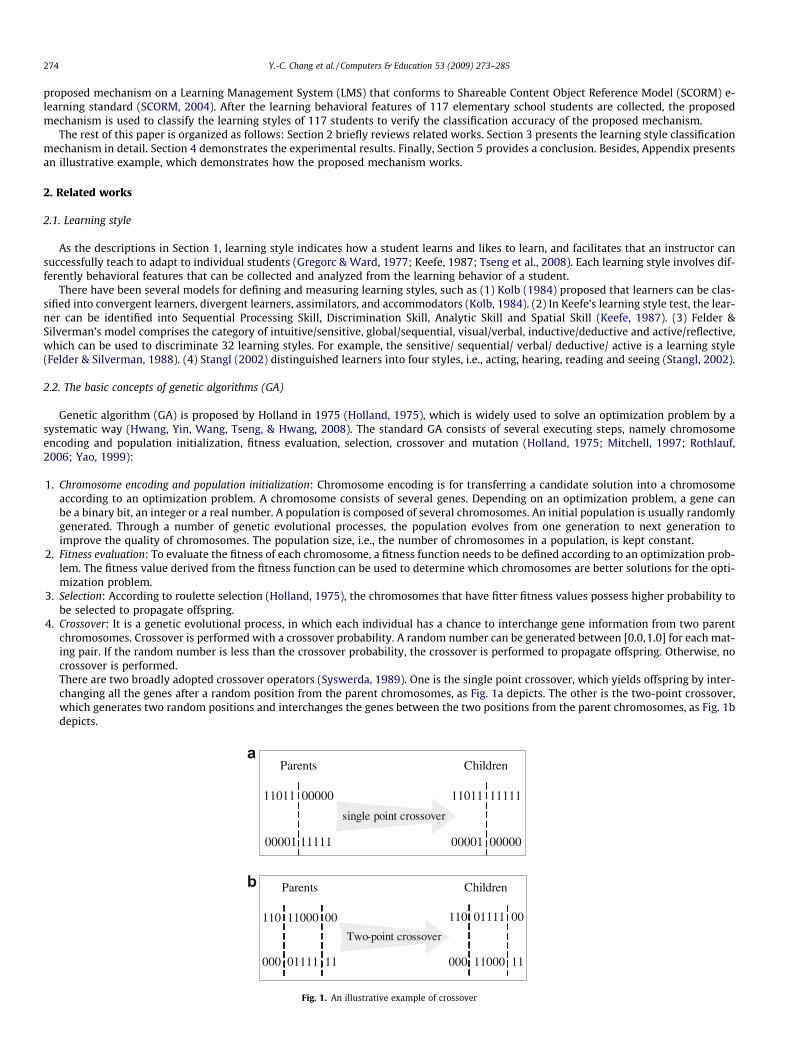
5. Mutation: It also is a genetic evolutional process, which creates a new gene that does not inherit from the parent chromosomes. Every bitin an offspring chromosome could mutate with a predefined mutation probability. In general, mutation is performed with a very lowmutation probability. For performing mutation, two genes are randomly selected to exchange their position in a chromosome. Fig. 2 isan example of mutation, where the mutated gene positions are underlined.
6. Stop criterion: In general, the stop criterion is 100 generations. That is, the steps 2–5 iteratively are performed 100 times. After 100 gen-erations, a near optimal solution can be derived by the fitness function.
3. The learning style classification mechanism using enhanced k-NN classification combined with GA
In this section, a learning style classification mechanism based on k-NN classification is proposed. Since we observe that some weak-nesses exist in k-NN classification, an enhanced k-NN classification is proposed and GA is employed to improve k-NN classification. Firstly,the basic definition of k-NN classification is presented. Then, how the enhanced k-NN classification and GA solve the weaknesses of k-NNclassification are explained. Finally, the learning style classification mechanism combined the enhance k-NN classification with GA is pre-sented in details.
3.1. Basic definitions of k-NN classification
This paper uses the classification technique to classify learning styles. One of most popular classification techniques is k-NN classi-fication (Chen et al., 2004; Kuncheva & Jain, 1999). For k-NN classification, a sample can be represented as a point in an n-dimensionalspace. If two similar samples belong to the same class, their distance is shorter than that of other samples that belong to other class. Anunclassified data sample can be determined a class by computing the distance between it and the samples. Suppose that an unclassifieddata sample contains N features, which is denoted as [a1(xu),a2(xu), . . .,an(xu)], 1 6 n 6 N, where an(xu) denotes the nth feature value forthe unclassified data sample xu. Similarly, a sample xs also contains N features, which is denoted as [a1(xs),a2(xs), . . .,an(xs)], 1 6 n 6 N,where an(xs) denotes the nth feature value for the sample xs. The distance between an unclassified data sample xu and a sample xs
can be derived using
dðxu; xsÞ ¼
ffiffiffiffiffiffiffiffiffiffiffiffiffiffiffiffiffiffiffiffiffiffiffiffiffiffiffiffiffiffiffiffiffiffiffiffiffiffiffiffiffiffiffiffiXN
n¼1
ðanðxuÞ � anðxsÞÞ2vuut ð1Þ
This paper adopts the function of k-NN classification as (Mitchell, 1997)
f ðxuÞ ctXk
i¼1
gðct ; f ðxiÞÞ ¼maxXk
i¼1
gðct ; f ðxiÞÞjct 2 C ¼ fc1; c2; . . . ; cmg; 2 6 m 6 M; if a ¼ b; then gða; bÞ ¼ 1; ifa–b; then gða; bÞ ¼ 0
( )
ð2Þ
where f(x) denotes the class to which x belongs. xi, 1 6 i 6 k, denotes k closest samples. g(a,b) is a function that determines whether or not aand b belong to the same class. If the result is positive, g(a,b) = 1. Otherwise, g(a,b) = 0. C denotes the set of classes and M is the number ofclasses.
After being computed, the k closest samples for the unclassified data sample xu can be listed. A set S = {(c1,R1), (c2,R2), ..., (cm,Rm)} andR1 + R2 + ��� + Rm = k can be given, where (c, R) represents that the class c contains R samples. If R1 P R2 P ���P Rm, the class ranks for theunclassified data sample xu are {c1,c2. . .,cm}, it means that xu has the higher priority belonging to the class c1.
3.2. Enhanced k-NN classification
In this paper, since k-NN classification is used to classify and identify a student’s learning style, the involved parameters are defined asfollows:
� C = {c1,c2, . . .,cm}, 2 6m 6M: denotes the set of classes, where M is the number of leaning styles. A class represents a learning style.� BF = {bf1,bf2, . . .,bfn}, 1 6 n 6 N: denotes the set of learning behavioral features, where N is the number of leaning behavioral features. bfn
denotes the nth learning behavioral feature.� Luc: denotes an unclassified student. Each unclassified student contains N learning behavioral features, which is denoted as [bf1(Luc),b-
f2(Luc), . . .,bfn(Luc)], 1 6 n 6 N. bfn(Luc) denotes the value of the nth learning behavioral feature bfn for the unclassified student Luc.
276 Y.-C. Chang et al. / Computers & Education 53 (2009) 273–285
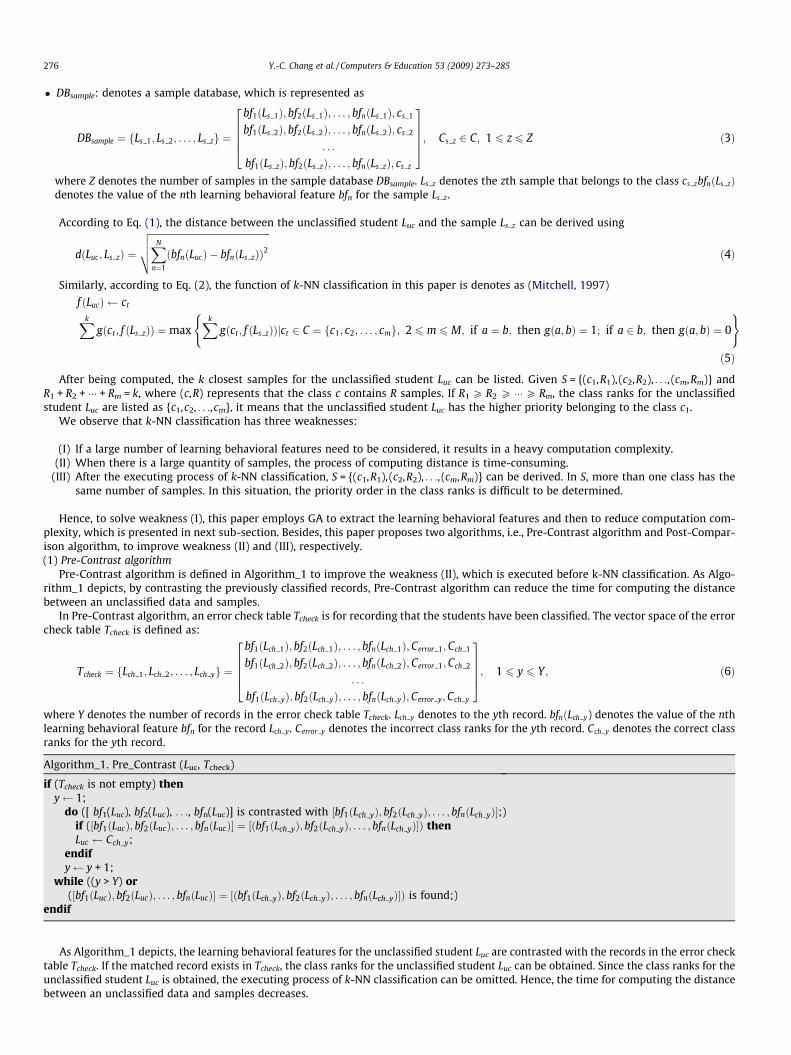
� DBsample: denotes a sample database, which is represented as
DBsample ¼ fLs 1; Ls 2; . . . ; Ls zg ¼
bf1ðLs 1Þ; bf2ðLs 1Þ; . . . ; bfnðLs 1Þ; cs 1
bf1ðLs 2Þ; bf2ðLs 2Þ; . . . ; bfnðLs 2Þ; cs 2
. . .
bf1ðLs zÞ; bf2ðLs zÞ; . . . ; bfnðLs zÞ; cs z
26664
37775; Cs z 2 C; 1 6 z 6 Z ð3Þ
where Z denotes the number of samples in the sample database DBsample. Ls z denotes the zth sample that belongs to the class cs zbfnðLs zÞdenotes the value of the nth learning behavioral feature bfn for the sample Ls z.
According to Eq. (1), the distance between the unclassified student Luc and the sample Ls z can be derived using
dðLuc; Ls zÞ ¼
ffiffiffiffiffiffiffiffiffiffiffiffiffiffiffiffiffiffiffiffiffiffiffiffiffiffiffiffiffiffiffiffiffiffiffiffiffiffiffiffiffiffiffiffiffiffiffiffiffiffiffiffiXN
n¼1
ðbfnðLucÞ � bfnðLs zÞÞ2vuut ð4Þ
Similarly, according to Eq. (2), the function of k-NN classification in this paper is denotes as (Mitchell, 1997)
f ðLucÞ ctXk
gðct ; f ðLs zÞÞ ¼maxXk
gðct ; f ðLs zÞÞjct 2 C ¼ fc1; c2; . . . ; cmg; 2 6 m 6 M; if a ¼ b; then gða; bÞ ¼ 1; if a 2 b; then gða; bÞ ¼ 0
( )
ð5Þ
After being computed, the k closest samples for the unclassified student Luc can be listed. Given S = {(c1,R1), (c2,R2), . . ., (cm,Rm)} andR1 + R2 + ��� + Rm = k, where (c,R) represents that the class c contains R samples. If R1 P R2 P ���P Rm, the class ranks for the unclassifiedstudent Luc are listed as {c1,c2, . . .,cm}, it means that the unclassified student Luc has the higher priority belonging to the class c1.
We observe that k-NN classification has three weaknesses:
(I) If a large number of learning behavioral features need to be considered, it results in a heavy computation complexity.(II) When there is a large quantity of samples, the process of computing distance is time-consuming.
(III) After the executing process of k-NN classification, S = {(c1,R1), (c2,R2), . . ., (cm,Rm)} can be derived. In S, more than one class has thesame number of samples. In this situation, the priority order in the class ranks is difficult to be determined.
Hence, to solve weakness (I), this paper employs GA to extract the learning behavioral features and then to reduce computation com-plexity, which is presented in next sub-section. Besides, this paper proposes two algorithms, i.e., Pre-Contrast algorithm and Post-Compar-ison algorithm, to improve weakness (II) and (III), respectively.(1) Pre-Contrast algorithm
Pre-Contrast algorithm is defined in Algorithm_1 to improve the weakness (II), which is executed before k-NN classification. As Algo-rithm_1 depicts, by contrasting the previously classified records, Pre-Contrast algorithm can reduce the time for computing the distancebetween an unclassified data and samples.
In Pre-Contrast algorithm, an error check table Tcheck is for recording that the students have been classified. The vector space of the errorcheck table Tcheck is defined as:
Tcheck ¼ fLch 1; Lch 2; . . . ; Lch yg ¼
bf1ðLch 1Þ; bf2ðLch 1Þ; . . . ; bfnðLch 1Þ; Cerror 1;Cch 1
bf1ðLch 2Þ; bf2ðLch 2Þ; . . . ; bfnðLch 2Þ; Cerror 1;Cch 2
. . .
bf1ðLch yÞ; bf2ðLch yÞ; . . . ; bfnðLch yÞ; Cerror y;Cch y
26664
37775; 1 6 y 6 Y; ð6Þ
where Y denotes the number of records in the error check table Tcheck. Lch y denotes to the yth record. bfnðLch y) denotes the value of the nthlearning behavioral feature bfn for the record Lch y. Cerror y denotes the incorrect class ranks for the yth record. Cch y denotes the correct classranks for the yth record.
Algorithm_1. Pre_Contrast (Luc, Tcheck)
if (Tcheck is not empty) theny 1;
do ([ bf1(Luc), bf2(Luc), . . ., bfn(Luc)] is contrasted with ½bf1ðLch yÞ; bf2ðLch yÞ; . . . ; bfnðLch yÞ�;)if (½bf1ðLucÞ; bf2ðLucÞ; . . . ; bfnðLucÞ� ¼ ½ðbf1ðLch yÞ; bf2ðLch yÞ; . . . ; bfnðLch yÞ�Þ thenLuc Cch y;
endify y + 1;
while ((y > Y) or(½bf1ðLucÞ; bf2ðLucÞ; . . . ; bfnðLucÞ� ¼ ½ðbf1ðLch yÞ; bf2ðLch yÞ; . . . ; bfnðLch yÞ�Þ is found;)
endif
As Algorithm_1 depicts, the learning behavioral features for the unclassified student Luc are contrasted with the records in the error checktable Tcheck. If the matched record exists in Tcheck, the class ranks for the unclassified student Luc can be obtained. Since the class ranks for theunclassified student Luc is obtained, the executing process of k-NN classification can be omitted. Hence, the time for computing the distancebetween an unclassified data and samples decreases.
Y.-C. Chang et al. / Computers & Education 53 (2009) 273–285 277
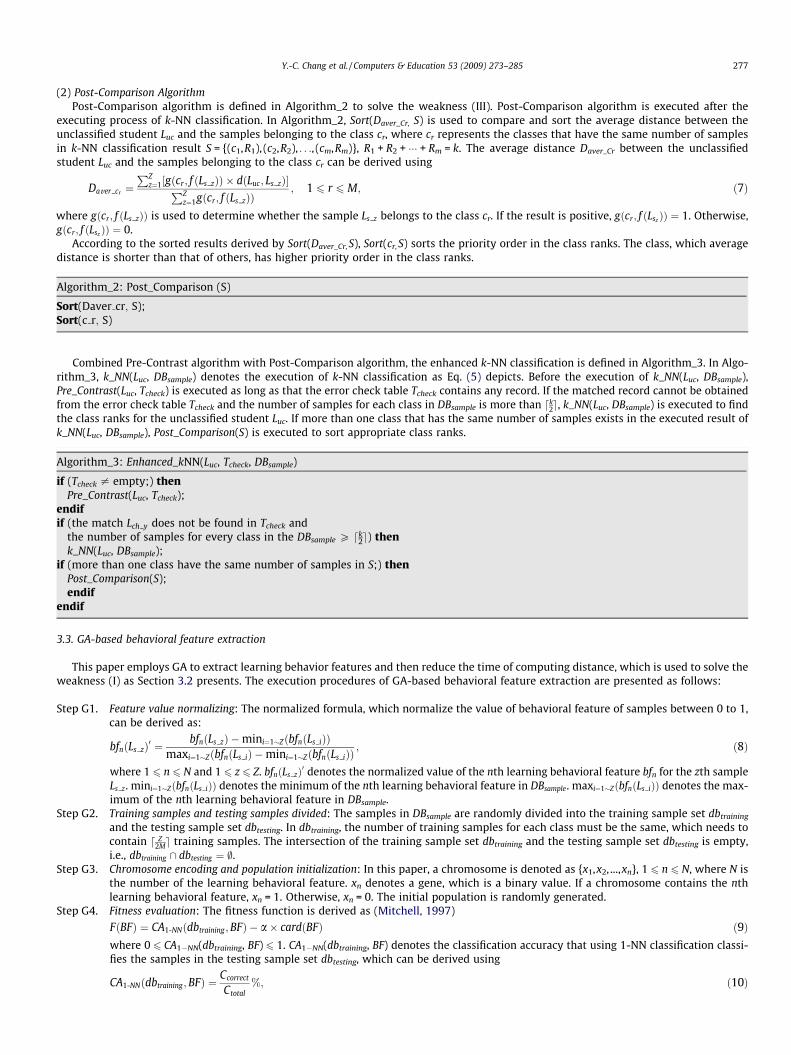
(2) Post-Comparison AlgorithmPost-Comparison algorithm is defined in Algorithm_2 to solve the weakness (III). Post-Comparison algorithm is executed after the
executing process of k-NN classification. In Algorithm_2, Sort(Daver_Cr, S) is used to compare and sort the average distance between theunclassified student Luc and the samples belonging to the class cr, where cr represents the classes that have the same number of samplesin k-NN classification result S = {(c1,R1), (c2,R2), . . ., (cm,Rm)}, R1 + R2 + ��� + Rm = k. The average distance Daver_Cr between the unclassifiedstudent Luc and the samples belonging to the class cr can be derived using
Daver cr ¼PZ
z¼1½gðcr ; f ðLs zÞÞ � dðLuc; Ls zÞ�PZz¼1gðcr ; f ðLs zÞÞ
; 1 6 r 6 M; ð7Þ
where gðcr; f ðLs zÞÞ is used to determine whether the sample Ls z belongs to the class cr. If the result is positive, gðcr ; f ðLsz ÞÞ ¼ 1. Otherwise,gðcr; f ðLsz ÞÞ ¼ 0.
According to the sorted results derived by Sort(Daver_Cr, S), Sort(cr, S) sorts the priority order in the class ranks. The class, which averagedistance is shorter than that of others, has higher priority order in the class ranks.
Algorithm_2: Post_Comparison (S)
Sort(Daver cr; S);Sort(c r; S)
Combined Pre-Contrast algorithm with Post-Comparison algorithm, the enhanced k-NN classification is defined in Algorithm_3. In Algo-rithm_3, k_NN(Luc, DBsample) denotes the execution of k-NN classification as Eq. (5) depicts. Before the execution of k_NN(Luc, DBsample),Pre_Contrast(Luc, Tcheck) is executed as long as that the error check table Tcheck contains any record. If the matched record cannot be obtainedfrom the error check table Tcheck and the number of samples for each class in DBsample is more than dk
2e, k_NN(Luc, DBsample) is executed to findthe class ranks for the unclassified student Luc. If more than one class that has the same number of samples exists in the executed result ofk_NN(Luc, DBsample), Post_Comparison(S) is executed to sort appropriate class ranks.
Algorithm_3: Enhanced_kNN(Luc, Tcheck, DBsample)
if (Tcheck – empty;) thenPre_Contrast(Luc, Tcheck);
endifif (the match Lch y does not be found in Tcheck and
the number of samples for every class in the DBsample P dk2e) thenk_NN(Luc, DBsample);
if (more than one class have the same number of samples in S;) thenPost_Comparison(S);endif
endif
3.3. GA-based behavioral feature extraction
This paper employs GA to extract learning behavior features and then reduce the time of computing distance, which is used to solve theweakness (I) as Section 3.2 presents. The execution procedures of GA-based behavioral feature extraction are presented as follows:
Step G1. Feature value normalizing: The normalized formula, which normalize the value of behavioral feature of samples between 0 to 1,can be derived as:
bfnðLs zÞ0 ¼bfnðLs zÞ �mini¼1�ZðbfnðLs iÞÞ
maxi¼1�ZðbfnðLs iÞ �mini¼1�ZðbfnðLs iÞÞ; ð8Þ
where 1 6 n 6 N and 1 6 z 6 Z. bfnðLs zÞ0 denotes the normalized value of the nth learning behavioral feature bfn for the zth sampleLs z. mini¼1�ZðbfnðLs iÞÞ denotes the minimum of the nth learning behavioral feature in DBsample. maxi¼1�ZðbfnðLs iÞÞ denotes the max-imum of the nth learning behavioral feature in DBsample.
Step G2. Training samples and testing samples divided: The samples in DBsample are randomly divided into the training sample set dbtraining
and the testing sample set dbtesting. In dbtraining, the number of training samples for each class must be the same, which needs tocontain d Z
2Me training samples. The intersection of the training sample set dbtraining and the testing sample set dbtesting is empty,i.e., dbtraining \ dbtesting ¼ ;.
Step G3. Chromosome encoding and population initialization: In this paper, a chromosome is denoted as {x1,x2, ...,xn}, 1 6 n 6 N, where N isthe number of the learning behavioral feature. xn denotes a gene, which is a binary value. If a chromosome contains the nthlearning behavioral feature, xn = 1. Otherwise, xn = 0. The initial population is randomly generated.
Step G4. Fitness evaluation: The fitness function is derived as (Mitchell, 1997)
FðBFÞ ¼ CA1-NNðdbtraining ; BFÞ � a� cardðBFÞ ð9Þwhere 0 6 CA1�NN(dbtraining, BF) 6 1. CA1�NN(dbtraining, BF) denotes the classification accuracy that using 1-NN classification classi-fies the samples in the testing sample set dbtesting, which can be derived using
CA1-NNðdbtraining ; BFÞ ¼ Ccorrect
Ctotal%; ð10Þ
278 Y.-C. Chang et al. / Computers & Education 53 (2009) 273–285
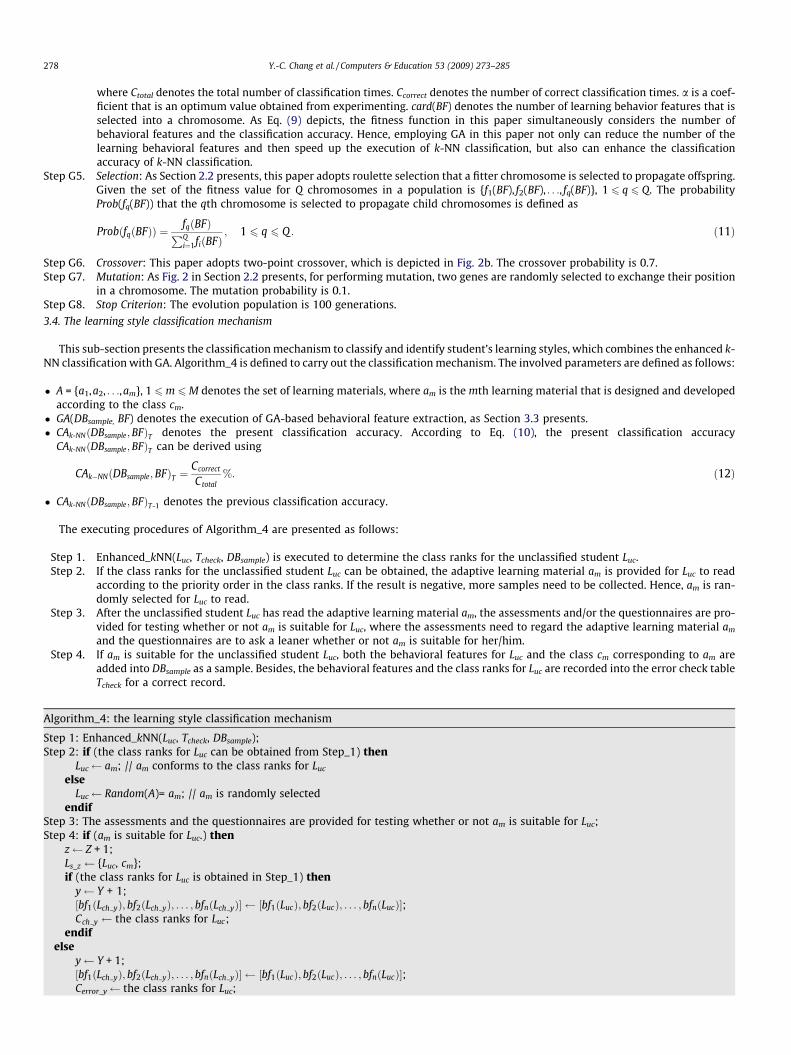
where Ctotal denotes the total number of classification times. Ccorrect denotes the number of correct classification times. a is a coef-ficient that is an optimum value obtained from experimenting. card(BF) denotes the number of learning behavior features that isselected into a chromosome. As Eq. (9) depicts, the fitness function in this paper simultaneously considers the number ofbehavioral features and the classification accuracy. Hence, employing GA in this paper not only can reduce the number of thelearning behavioral features and then speed up the execution of k-NN classification, but also can enhance the classificationaccuracy of k-NN classification.
Step G5. Selection: As Section 2.2 presents, this paper adopts roulette selection that a fitter chromosome is selected to propagate offspring.Given the set of the fitness value for Q chromosomes in a population is {f1(BF), f2(BF), . . ., fq(BF)}, 1 6 q 6 Q. The probabilityProb(fq(BF)) that the qth chromosome is selected to propagate child chromosomes is defined as
ProbðfqðBFÞÞ ¼ fqðBFÞPQi¼1fiðBFÞ
; 1 6 q 6 Q : ð11Þ
Step G6. Crossover: This paper adopts two-point crossover, which is depicted in Fig. 2b. The crossover probability is 0.7.Step G7. Mutation: As Fig. 2 in Section 2.2 presents, for performing mutation, two genes are randomly selected to exchange their position
in a chromosome. The mutation probability is 0.1.Step G8. Stop Criterion: The evolution population is 100 generations.
3.4. The learning style classification mechanism
This sub-section presents the classification mechanism to classify and identify student’s learning styles, which combines the enhanced k-NN classification with GA. Algorithm_4 is defined to carry out the classification mechanism. The involved parameters are defined as follows:
� A = {a1,a2, . . .,am}, 1 6m 6M denotes the set of learning materials, where am is the mth learning material that is designed and developedaccording to the class cm.
� GA(DBsample, BF) denotes the execution of GA-based behavioral feature extraction, as Section 3.3 presents.� CAk-NNðDBsample;BFÞT denotes the present classification accuracy. According to Eq. (10), the present classification accuracy
CAk-NNðDBsample;BFÞT can be derived using
CAk�NNðDBsample;BFÞT ¼Ccorrect
Ctotal%: ð12Þ
� CAk-NNðDBsample;BFÞT-1 denotes the previous classification accuracy.
The executing procedures of Algorithm_4 are presented as follows:
Step 1. Enhanced_kNN(Luc, Tcheck, DBsample) is executed to determine the class ranks for the unclassified student Luc.Step 2. If the class ranks for the unclassified student Luc can be obtained, the adaptive learning material am is provided for Luc to read
according to the priority order in the class ranks. If the result is negative, more samples need to be collected. Hence, am is ran-domly selected for Luc to read.
Step 3. After the unclassified student Luc has read the adaptive learning material am, the assessments and/or the questionnaires are pro-vided for testing whether or not am is suitable for Luc, where the assessments need to regard the adaptive learning material am
and the questionnaires are to ask a leaner whether or not am is suitable for her/him.Step 4. If am is suitable for the unclassified student Luc, both the behavioral features for Luc and the class cm corresponding to am are
added into DBsample as a sample. Besides, the behavioral features and the class ranks for Luc are recorded into the error check tableTcheck for a correct record.
Algorithm_4: the learning style classification mechanism
Step 1: Enhanced_kNN(Luc, Tcheck, DBsample);Step 2: if (the class ranks for Luc can be obtained from Step_1) then
Luc am; // am conforms to the class ranks for Luc
elseLuc Random(A)= am; // am is randomly selected
endifStep 3: The assessments and the questionnaires are provided for testing whether or not am is suitable for Luc;Step 4: if (am is suitable for Luc.) then
z Z + 1;Ls_z {Luc, cm};if (the class ranks for Luc is obtained in Step_1) then
y Y + 1;½bf1ðLch yÞ; bf2ðLch yÞ; . . . ; bfnðLch yÞ� ½bf1ðLucÞ; bf2ðLucÞ; . . . ; bfnðLucÞ�;Cch y the class ranks for Luc;
endifelse
y Y + 1;½bf1ðLch yÞ; bf2ðLch yÞ; . . . ; bfnðLch yÞ� ½bf1ðLucÞ; bf2ðLucÞ; . . . ; bfnðLucÞ�;Cerror_y the class ranks for Luc;
Y.-C. Chang et al. / Computers & Education 53 (2009) 273–285 279
Algorithm 4 (continued)
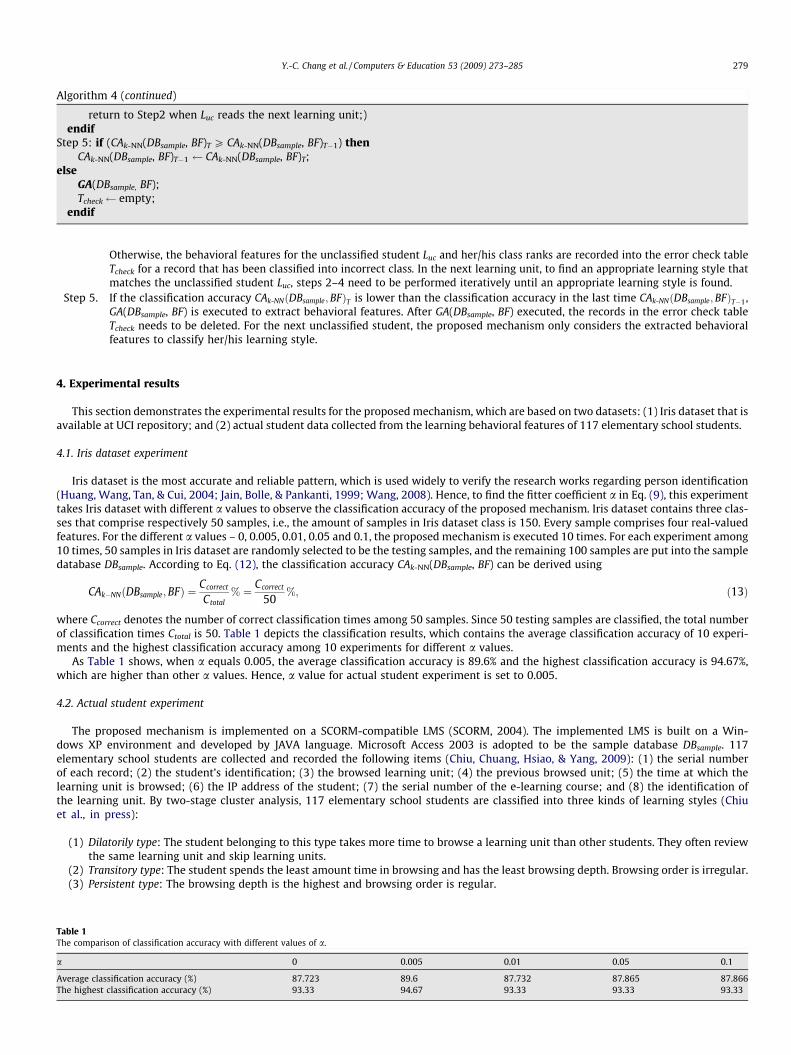
return to Step2 when Luc reads the next learning unit;)endif
Step 5: if (CAk-NN(DBsample, BF)T P CAk-NN(DBsample, BF)T�1) thenCAk-NN(DBsample, BF)T�1 CAk-NN(DBsample, BF)T;
elseGA(DBsample, BF);Tcheck empty;
endif
Table 1The compari
a
Average clasThe highest
Otherwise, the behavioral features for the unclassified student Luc and her/his class ranks are recorded into the error check tableTcheck for a record that has been classified into incorrect class. In the next learning unit, to find an appropriate learning style thatmatches the unclassified student Luc, steps 2–4 need to be performed iteratively until an appropriate learning style is found.
Step 5. If the classification accuracy CAk-NNðDBsample;BFÞT is lower than the classification accuracy in the last time CAk-NNðDBsample;BFÞT�1,GA(DBsample, BF) is executed to extract behavioral features. After GA(DBsample, BF) executed, the records in the error check tableTcheck needs to be deleted. For the next unclassified student, the proposed mechanism only considers the extracted behavioralfeatures to classify her/his learning style.
4. Experimental results
This section demonstrates the experimental results for the proposed mechanism, which are based on two datasets: (1) Iris dataset that isavailable at UCI repository; and (2) actual student data collected from the learning behavioral features of 117 elementary school students.
4.1. Iris dataset experiment
Iris dataset is the most accurate and reliable pattern, which is used widely to verify the research works regarding person identification(Huang, Wang, Tan, & Cui, 2004; Jain, Bolle, & Pankanti, 1999; Wang, 2008). Hence, to find the fitter coefficient a in Eq. (9), this experimenttakes Iris dataset with different a values to observe the classification accuracy of the proposed mechanism. Iris dataset contains three clas-ses that comprise respectively 50 samples, i.e., the amount of samples in Iris dataset class is 150. Every sample comprises four real-valuedfeatures. For the different a values – 0, 0.005, 0.01, 0.05 and 0.1, the proposed mechanism is executed 10 times. For each experiment among10 times, 50 samples in Iris dataset are randomly selected to be the testing samples, and the remaining 100 samples are put into the sampledatabase DBsample. According to Eq. (12), the classification accuracy CAk-NN(DBsample, BF) can be derived using
CAk�NNðDBsample;BFÞ ¼ Ccorrect
Ctotal% ¼ Ccorrect
50%; ð13Þ
where Ccorrect denotes the number of correct classification times among 50 samples. Since 50 testing samples are classified, the total numberof classification times Ctotal is 50. Table 1 depicts the classification results, which contains the average classification accuracy of 10 experi-ments and the highest classification accuracy among 10 experiments for different a values.
As Table 1 shows, when a equals 0.005, the average classification accuracy is 89.6% and the highest classification accuracy is 94.67%,which are higher than other a values. Hence, a value for actual student experiment is set to 0.005.
4.2. Actual student experiment
The proposed mechanism is implemented on a SCORM-compatible LMS (SCORM, 2004). The implemented LMS is built on a Win-dows XP environment and developed by JAVA language. Microsoft Access 2003 is adopted to be the sample database DBsample. 117elementary school students are collected and recorded the following items (Chiu, Chuang, Hsiao, & Yang, 2009): (1) the serial numberof each record; (2) the student’s identification; (3) the browsed learning unit; (4) the previous browsed unit; (5) the time at which thelearning unit is browsed; (6) the IP address of the student; (7) the serial number of the e-learning course; and (8) the identification ofthe learning unit. By two-stage cluster analysis, 117 elementary school students are classified into three kinds of learning styles (Chiuet al., in press):
(1) Dilatorily type: The student belonging to this type takes more time to browse a learning unit than other students. They often reviewthe same learning unit and skip learning units.
(2) Transitory type: The student spends the least amount time in browsing and has the least browsing depth. Browsing order is irregular.(3) Persistent type: The browsing depth is the highest and browsing order is regular.
son of classification accuracy with different values of a.
0 0.005 0.01 0.05 0.1
sification accuracy (%) 87.723 89.6 87.732 87.865 87.866classification accuracy (%) 93.33 94.67 93.33 93.33 93.33
280 Y.-C. Chang et al. / Computers & Education 53 (2009) 273–285
This experiment is divided into three phases to observe the classification accuracy:
(I) Initial phase: As the aforementioned description, to execute k-NN classification k_NN(Luc, DBsample), the number of samples for eachclass in DBsample must contain at least dk
2e samples. If the number of samples for each class is less than dk2e samples, the learning style of
a student is randomly determined, which is called the initial phase.(II) Developing phase: When the number of samples for each class in DBsample is more than dk
2e samples, the enhanced k-NN classificationEnhanced_kNN(Luc, Tcheck, DBsample) is executed to classify the learning style of a student, which is called the developing phase.
(III) Maturing phase: The proposed mechanism that combines the enhanced k-NN classification Enhanced_kNN(Luc, Tcheck, DBsample) withGA-based behavioral feature extraction GA(DBsample, BF) is executed to classify the learning style of a student, which is called thematuring phase.
For each phase, 50 students are randomly selected to be testing samples, and the remaining 67 students are put into the sample data-base DBsample. For the three phases, the selected 50 testing samples are classified to observe (A) the comparison of classification accuracy,(B) the comparison of classification stability, and (C) the needed number of learning behavioral features.
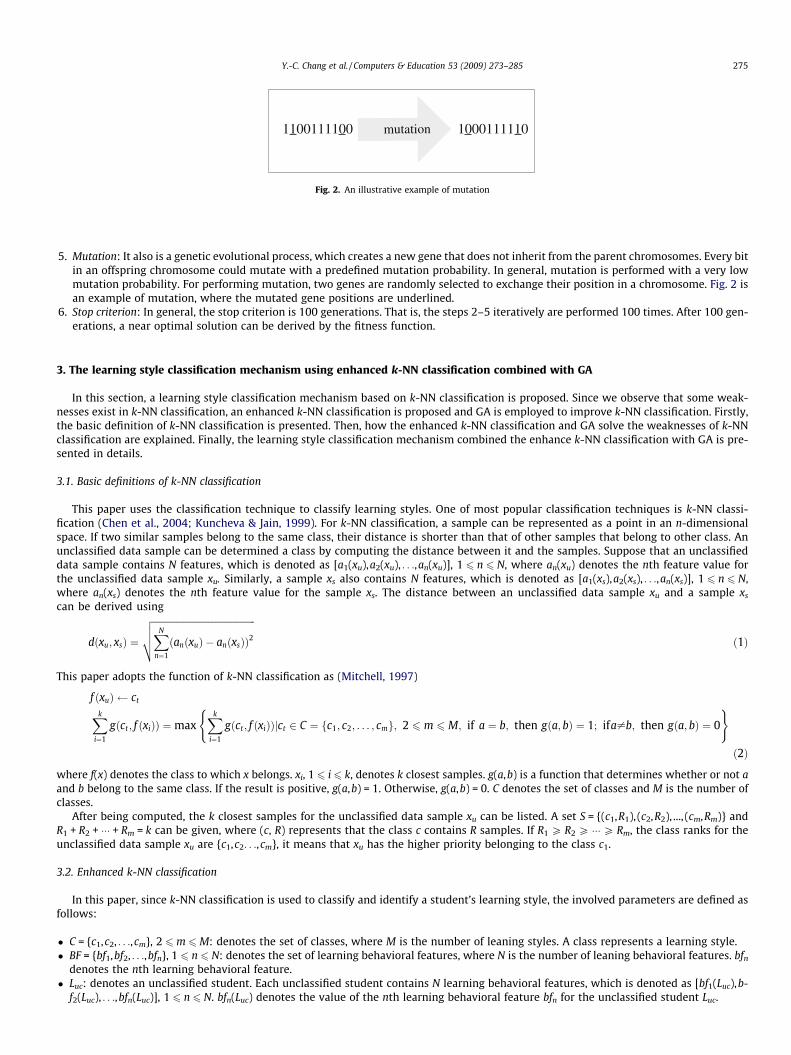
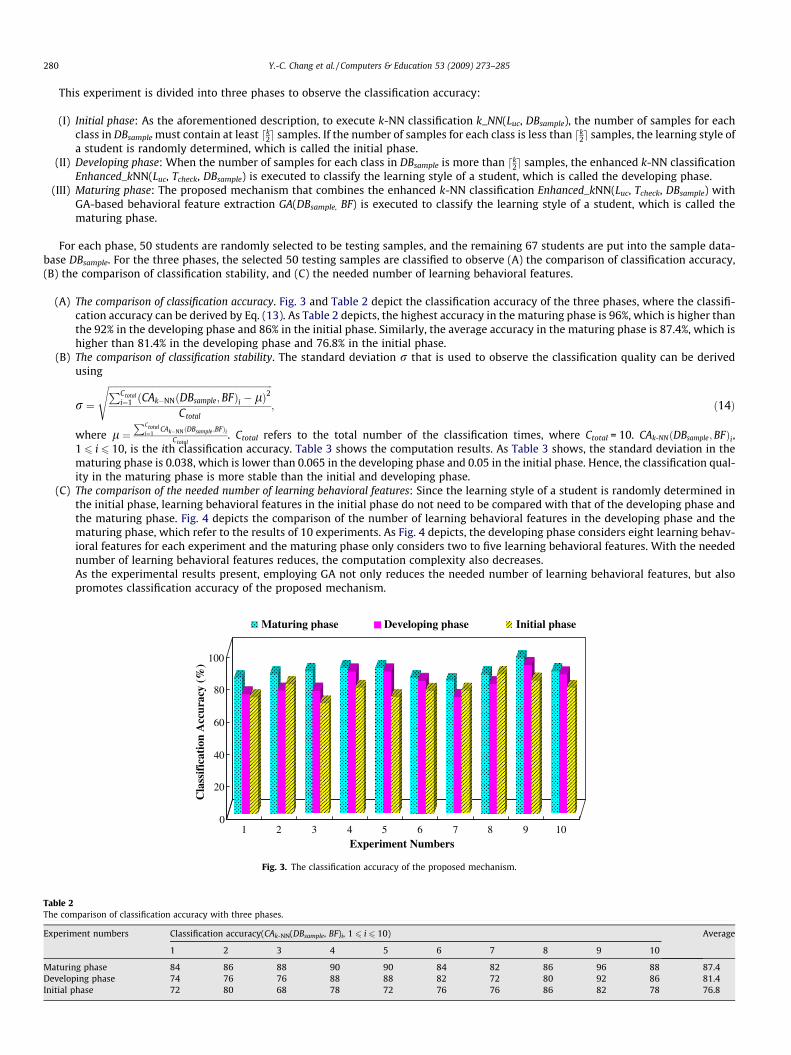
(A) The comparison of classification accuracy. Fig. 3 and Table 2 depict the classification accuracy of the three phases, where the classifi-cation accuracy can be derived by Eq. (13). As Table 2 depicts, the highest accuracy in the maturing phase is 96%, which is higher thanthe 92% in the developing phase and 86% in the initial phase. Similarly, the average accuracy in the maturing phase is 87.4%, which ishigher than 81.4% in the developing phase and 76.8% in the initial phase.
(B) The comparison of classification stability. The standard deviation r that is used to observe the classification quality can be derivedusing
Table 2The com
Experim
MaturinDevelopInitial p
r ¼
ffiffiffiffiffiffiffiffiffiffiffiffiffiffiffiffiffiffiffiffiffiffiffiffiffiffiffiffiffiffiffiffiffiffiffiffiffiffiffiffiffiffiffiffiffiffiffiffiffiffiffiffiffiffiffiffiffiffiffiffiffiffiffiffiffiffiffiffiffiffiffiPCtotali¼1 ðCAk�NNðDBsample;BFÞi � lÞ2
Ctotal
s; ð14Þ
where l ¼PCtotal
i¼1CAk�NNðDBsample ;BFÞi
Ctotal. Ctotal refers to the total number of the classification times, where Ctotal = 10. CAk-NNðDBsample;BFÞi,
1 6 i 6 10, is the ith classification accuracy. Table 3 shows the computation results. As Table 3 shows, the standard deviation in thematuring phase is 0.038, which is lower than 0.065 in the developing phase and 0.05 in the initial phase. Hence, the classification qual-ity in the maturing phase is more stable than the initial and developing phase.
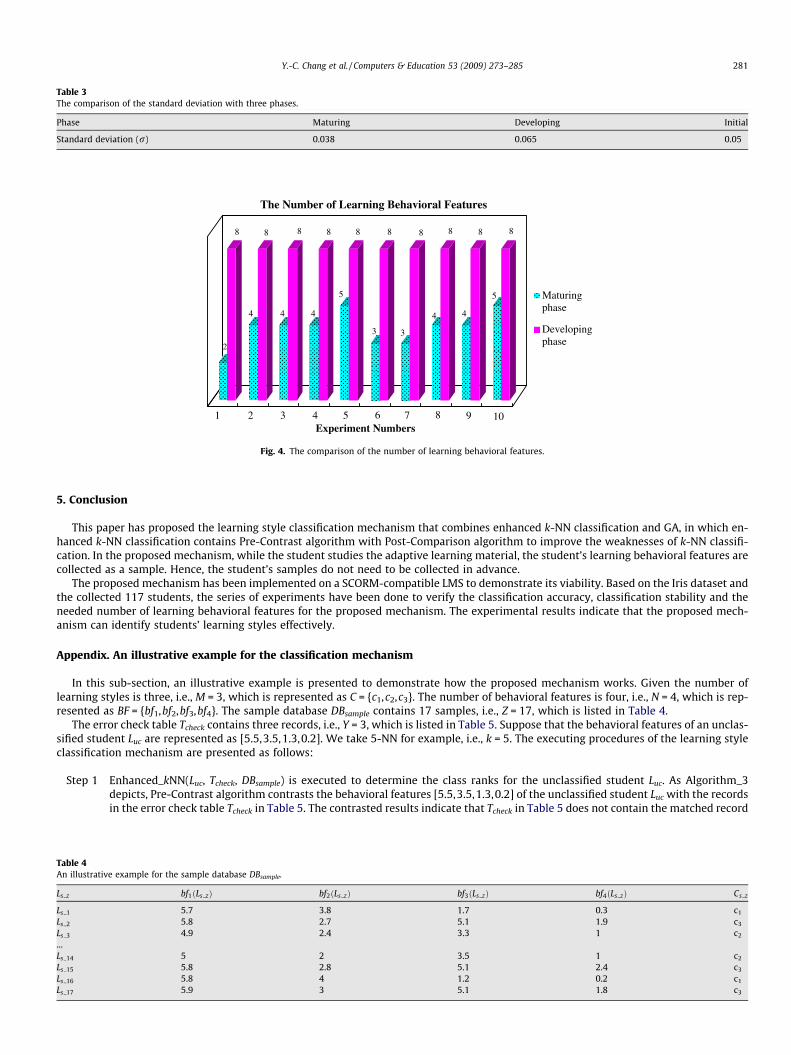
(C) The comparison of the needed number of learning behavioral features: Since the learning style of a student is randomly determined inthe initial phase, learning behavioral features in the initial phase do not need to be compared with that of the developing phase andthe maturing phase. Fig. 4 depicts the comparison of the number of learning behavioral features in the developing phase and thematuring phase, which refer to the results of 10 experiments. As Fig. 4 depicts, the developing phase considers eight learning behav-ioral features for each experiment and the maturing phase only considers two to five learning behavioral features. With the needednumber of learning behavioral features reduces, the computation complexity also decreases.As the experimental results present, employing GA not only reduces the needed number of learning behavioral features, but alsopromotes classification accuracy of the proposed mechanism.
0
20
40
60
80
100
Cla
ssif
icat
ion
Acc
urac
y (%
)
1 2 3 4 5 6 7 8 9 10Experiment Numbers
Maturing phase Developing phase Initial phase
Fig. 3. The classification accuracy of the proposed mechanism.
parison of classification accuracy with three phases.
ent numbers Classification accuracy(CAk-NN(DBsample, BF)i, 1 6 i 6 10) Average
1 2 3 4 5 6 7 8 9 10
g phase 84 86 88 90 90 84 82 86 96 88 87.4ing phase 74 76 76 88 88 82 72 80 92 86 81.4hase 72 80 68 78 72 76 76 86 82 78 76.8
2
8
4
8
4
8
4
8
5
8
3
8
3
8
4
8
4
8
5
8
1 2 3 4 5 6 7 8 9 10Experiment Numbers
The Number of Learning Behavioral Features
Maturingphase
Developingphase
Fig. 4. The comparison of the number of learning behavioral features.
Table 3The comparison of the standard deviation with three phases.
Phase Maturing Developing Initial
Standard deviation (r) 0.038 0.065 0.05
Y.-C. Chang et al. / Computers & Education 53 (2009) 273–285 281
5. Conclusion
This paper has proposed the learning style classification mechanism that combines enhanced k-NN classification and GA, in which en-hanced k-NN classification contains Pre-Contrast algorithm with Post-Comparison algorithm to improve the weaknesses of k-NN classifi-cation. In the proposed mechanism, while the student studies the adaptive learning material, the student’s learning behavioral features arecollected as a sample. Hence, the student’s samples do not need to be collected in advance.
The proposed mechanism has been implemented on a SCORM-compatible LMS to demonstrate its viability. Based on the Iris dataset andthe collected 117 students, the series of experiments have been done to verify the classification accuracy, classification stability and theneeded number of learning behavioral features for the proposed mechanism. The experimental results indicate that the proposed mech-anism can identify students’ learning styles effectively.
Appendix. An illustrative example for the classification mechanism
In this sub-section, an illustrative example is presented to demonstrate how the proposed mechanism works. Given the number oflearning styles is three, i.e., M = 3, which is represented as C = {c1,c2,c3}. The number of behavioral features is four, i.e., N = 4, which is rep-resented as BF = {bf1,bf2,bf3,bf4}. The sample database DBsample contains 17 samples, i.e., Z = 17, which is listed in Table 4.
The error check table Tcheck contains three records, i.e., Y = 3, which is listed in Table 5. Suppose that the behavioral features of an unclas-sified student Luc are represented as [5.5,3.5,1.3,0.2]. We take 5-NN for example, i.e., k = 5. The executing procedures of the learning styleclassification mechanism are presented as follows:
Step 1 Enhanced_kNN(Luc, Tcheck, DBsample) is executed to determine the class ranks for the unclassified student Luc. As Algorithm_3depicts, Pre-Contrast algorithm contrasts the behavioral features [5.5,3.5,1.3,0.2] of the unclassified student Luc with the recordsin the error check table Tcheck in Table 5. The contrasted results indicate that Tcheck in Table 5 does not contain the matched record
Table 4An illustrative example for the sample database DBsample.
Ls z bf1ðLs zÞ bf2ðLs zÞ bf3ðLs zÞ bf4ðLs zÞ Cs z
Ls 1 5.7 3.8 1.7 0.3 c1
Ls 2 5.8 2.7 5.1 1.9 c3
Ls 3 4.9 2.4 3.3 1 c2
...Ls 14 5 2 3.5 1 c2
Ls 15 5.8 2.8 5.1 2.4 c3
Ls 16 5.8 4 1.2 0.2 c1
Ls 17 5.9 3 5.1 1.8 c3
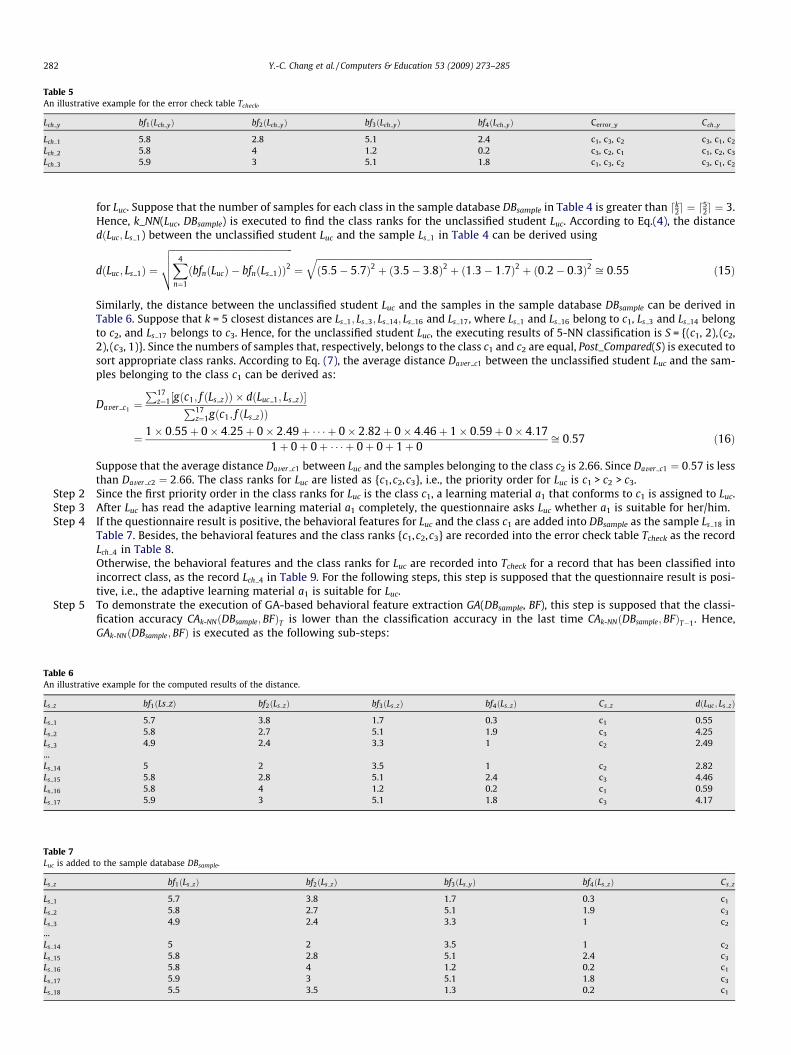
Table 5An illustrative example for the error check table Tcheck.
Lch y bf1ðLch yÞ bf2ðLch yÞ bf3ðLch yÞ bf4ðLch yÞ Cerror_y Cch y
Lch 1 5.8 2.8 5.1 2.4 c1, c3, c2 c3, c1, c2
Lch 2 5.8 4 1.2 0.2 c3, c2, c1 c1, c2, c3
Lch 3 5.9 3 5.1 1.8 c1, c3, c2 c3, c1, c2
282 Y.-C. Chang et al. / Computers & Education 53 (2009) 273–285
for Luc. Suppose that the number of samples for each class in the sample database DBsample in Table 4 is greater than dk2e ¼ d52e ¼ 3.
Hence, k_NN(Luc, DBsample) is executed to find the class ranks for the unclassified student Luc. According to Eq.(4), the distancedðLuc; Ls 1) between the unclassified student Luc and the sample Ls 1 in Table 4 can be derived using
Table 6An illustrativ
Ls z
Ls 1
Ls 2
Ls 3
...Ls 14
Ls 15
Ls 16
Ls 17
Table 7Luc is added
Ls z
Ls 1
Ls 2
Ls 3
...Ls 14
Ls 15
Ls 16
Ls 17
Ls 18
dðLuc; Ls 1Þ ¼
ffiffiffiffiffiffiffiffiffiffiffiffiffiffiffiffiffiffiffiffiffiffiffiffiffiffiffiffiffiffiffiffiffiffiffiffiffiffiffiffiffiffiffiffiffiffiffiffiffiffiffiffiX4
n¼1
ðbfnðLucÞ � bfnðLs 1ÞÞ2vuut ¼
ffiffiffiffiffiffiffiffiffiffiffiffiffiffiffiffiffiffiffiffiffiffiffiffiffiffiffiffiffiffiffiffiffiffiffiffiffiffiffiffiffiffiffiffiffiffiffiffiffiffiffiffiffiffiffiffiffiffiffiffiffiffiffiffiffiffiffiffiffiffiffiffiffiffiffiffiffiffiffiffiffiffiffiffiffiffiffiffiffiffiffiffiffiffiffiffiffiffiffiffiffiffiffiffiffiffiffiffiffiffiffiffiffiffiffiffiffiffiffiffið5:5� 5:7Þ2 þ ð3:5� 3:8Þ2 þ ð1:3� 1:7Þ2 þ ð0:2� 0:3Þ2
qffi 0:55 ð15Þ
Similarly, the distance between the unclassified student Luc and the samples in the sample database DBsample can be derived inTable 6. Suppose that k = 5 closest distances are Ls 1; Ls 3; Ls 14; Ls 16 and Ls 17, where Ls 1 and Ls 16 belong to c1, Ls 3 and Ls 14 belongto c2, and Ls 17 belongs to c3. Hence, for the unclassified student Luc, the executing results of 5-NN classification is S = {(c1, 2), (c2,2), (c3, 1)}. Since the numbers of samples that, respectively, belongs to the class c1 and c2 are equal, Post_Compared(S) is executed tosort appropriate class ranks. According to Eq. (7), the average distance Daver c1 between the unclassified student Luc and the sam-ples belonging to the class c1 can be derived as:
Daver c1 ¼P17
z¼1½gðc1; f ðLs zÞÞ � dðLuc 1; Ls zÞ�P17z¼1gðc1; f ðLs zÞÞ
¼ 1� 0:55þ 0� 4:25þ 0� 2:49þ � � � þ 0� 2:82þ 0� 4:46þ 1� 0:59þ 0� 4:171þ 0þ 0þ � � � þ 0þ 0þ 1þ 0
ffi 0:57 ð16Þ
Suppose that the average distance Daver c1 between Luc and the samples belonging to the class c2 is 2.66. Since Daver c1 ¼ 0:57 is lessthan Daver c2 ¼ 2:66. The class ranks for Luc are listed as {c1,c2,c3}, i.e., the priority order for Luc is c1 > c2 > c3.
Step 2 Since the first priority order in the class ranks for Luc is the class c1, a learning material a1 that conforms to c1 is assigned to Luc.Step 3 After Luc has read the adaptive learning material a1 completely, the questionnaire asks Luc whether a1 is suitable for her/him.Step 4 If the questionnaire result is positive, the behavioral features for Luc and the class c1 are added into DBsample as the sample Ls 18 in
Table 7. Besides, the behavioral features and the class ranks {c1,c2,c3} are recorded into the error check table Tcheck as the recordLch 4 in Table 8.Otherwise, the behavioral features and the class ranks for Luc are recorded into Tcheck for a record that has been classified intoincorrect class, as the record Lch 4 in Table 9. For the following steps, this step is supposed that the questionnaire result is posi-tive, i.e., the adaptive learning material a1 is suitable for Luc.
Step 5 To demonstrate the execution of GA-based behavioral feature extraction GA(DBsample, BF), this step is supposed that the classi-fication accuracy CAk-NNðDBsample;BFÞT is lower than the classification accuracy in the last time CAk-NNðDBsample; BFÞT�1. Hence,GAk-NNðDBsample;BFÞ is executed as the following sub-steps:
e example for the computed results of the distance.
bf1ðLs zÞ bf2ðLs zÞ bf3ðLs zÞ bf4ðLs zÞ Cs z dðLuc ; Ls zÞ
5.7 3.8 1.7 0.3 c1 0.555.8 2.7 5.1 1.9 c3 4.254.9 2.4 3.3 1 c2 2.49
5 2 3.5 1 c2 2.825.8 2.8 5.1 2.4 c3 4.465.8 4 1.2 0.2 c1 0.595.9 3 5.1 1.8 c3 4.17
to the sample database DBsample.
bf1ðLs zÞ bf2ðLs zÞ bf3ðLs yÞ bf4ðLs zÞ Cs z
5.7 3.8 1.7 0.3 c1
5.8 2.7 5.1 1.9 c3
4.9 2.4 3.3 1 c2
5 2 3.5 1 c2
5.8 2.8 5.1 2.4 c3
5.8 4 1.2 0.2 c1
5.9 3 5.1 1.8 c3
5.5 3.5 1.3 0.2 c1
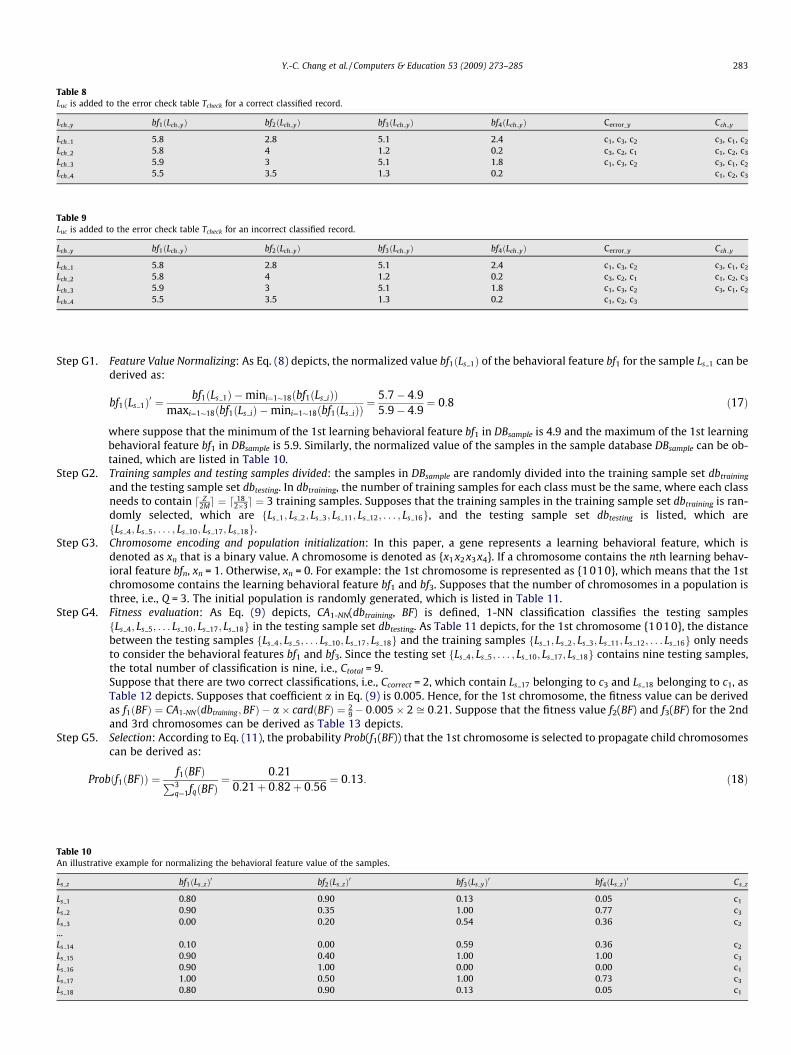
Table 8Luc is added to the error check table Tcheck for a correct classified record.
Lch y bf1ðLch yÞ bf2ðLch yÞ bf3ðLch yÞ bf4ðLch yÞ Cerror_y Cch y
Lch 1 5.8 2.8 5.1 2.4 c1, c3, c2 c3, c1, c2
Lch 2 5.8 4 1.2 0.2 c3, c2, c1 c1, c2, c3
Lch 3 5.9 3 5.1 1.8 c1, c3, c2 c3, c1, c2
Lch 4 5.5 3.5 1.3 0.2 c1, c2, c3
Table 9Luc is added to the error check table Tcheck for an incorrect classified record.
Lch y bf1ðLch yÞ bf2ðLch yÞ bf3ðLch yÞ bf4ðLch yÞ Cerror_y Cch y
Lch 1 5.8 2.8 5.1 2.4 c1, c3, c2 c3, c1, c2
Lch 2 5.8 4 1.2 0.2 c3, c2, c1 c1, c2, c3
Lch 3 5.9 3 5.1 1.8 c1, c3, c2 c3, c1, c2
Lch 4 5.5 3.5 1.3 0.2 c1, c2, c3
Y.-C. Chang et al. / Computers & Education 53 (2009) 273–285 283
Step G1. Feature Value Normalizing: As Eq. (8) depicts, the normalized value bf1ðLs 1Þ of the behavioral feature bf1 for the sample Ls 1 can bederived as:
Table 1An illus
Ls z
Ls 1
Ls 2
Ls 3
...Ls 14
Ls 15
Ls 16
Ls 17
Ls 18
bf1ðLs 1Þ0 ¼bf1ðLs 1Þ �mini¼1�18ðbf1ðLs iÞÞ
maxi¼1�18ðbf1ðLs iÞ �mini¼1�18ðbf1ðLs iÞÞ¼ 5:7� 4:9
5:9� 4:9¼ 0:8 ð17Þ
where suppose that the minimum of the 1st learning behavioral feature bf1 in DBsample is 4.9 and the maximum of the 1st learningbehavioral feature bf1 in DBsample is 5.9. Similarly, the normalized value of the samples in the sample database DBsample can be ob-tained, which are listed in Table 10.
Step G2. Training samples and testing samples divided: the samples in DBsample are randomly divided into the training sample set dbtraining
and the testing sample set dbtesting. In dbtraining, the number of training samples for each class must be the same, where each classneeds to contain d Z
2Me ¼ d 182�3e ¼ 3 training samples. Supposes that the training samples in the training sample set dbtraining is ran-
domly selected, which are fLs 1; Ls 2; Ls 3; Ls 11; Ls 12; . . . ; Ls 16g, and the testing sample set dbtesting is listed, which arefLs 4; Ls 5; . . . ; Ls 10; Ls 17; Ls 18g.
Step G3. Chromosome encoding and population initialization: In this paper, a gene represents a learning behavioral feature, which isdenoted as xn that is a binary value. A chromosome is denoted as {x1 x2 x3 x4}. If a chromosome contains the nth learning behav-ioral feature bfn, xn = 1. Otherwise, xn = 0. For example: the 1st chromosome is represented as {1010}, which means that the 1stchromosome contains the learning behavioral feature bf1 and bf3. Supposes that the number of chromosomes in a population isthree, i.e., Q = 3. The initial population is randomly generated, which is listed in Table 11.
Step G4. Fitness evaluation: As Eq. (9) depicts, CA1-NN(dbtraining, BF) is defined, 1-NN classification classifies the testing samplesfLs 4; Ls 5; . . . Ls 10; Ls 17; Ls 18g in the testing sample set dbtesting. As Table 11 depicts, for the 1st chromosome {1010}, the distancebetween the testing samples fLs 4; Ls 5; . . . Ls 10; Ls 17; Ls 18g and the training samples fLs 1; Ls 2; Ls 3; Ls 11; Ls 12; . . . Ls 16g only needsto consider the behavioral features bf1 and bf3. Since the testing set fLs 4; Ls 5; . . . ; Ls 10; Ls 17; Ls 18g contains nine testing samples,the total number of classification is nine, i.e., Ctotal = 9.Suppose that there are two correct classifications, i.e., Ccorrect = 2, which contain Ls 17 belonging to c3 and Ls 18 belonging to c1, asTable 12 depicts. Supposes that coefficient a in Eq. (9) is 0.005. Hence, for the 1st chromosome, the fitness value can be derivedas f1ðBFÞ ¼ CA1-NNðdbtraining ; BFÞ � a� cardðBFÞ ¼ 2
9� 0:005� 2 ffi 0:21. Suppose that the fitness value f2(BF) and f3(BF) for the 2ndand 3rd chromosomes can be derived as Table 13 depicts.
Step G5. Selection: According to Eq. (11), the probability Prob(f1(BF)) that the 1st chromosome is selected to propagate child chromosomescan be derived as:
Probðf1ðBFÞÞ ¼ f1ðBFÞP3q¼1fqðBFÞ
¼ 0:210:21þ 0:82þ 0:56
¼ 0:13: ð18Þ
0trative example for normalizing the behavioral feature value of the samples.
bf1ðLs zÞ0 bf2ðLs zÞ0 bf3ðLs yÞ0 bf4ðLs zÞ0 Cs z
0.80 0.90 0.13 0.05 c1
0.90 0.35 1.00 0.77 c3
0.00 0.20 0.54 0.36 c2
0.10 0.00 0.59 0.36 c2
0.90 0.40 1.00 1.00 c3
0.90 1.00 0.00 0.00 c1
1.00 0.50 1.00 0.73 c3
0.80 0.90 0.13 0.05 c1
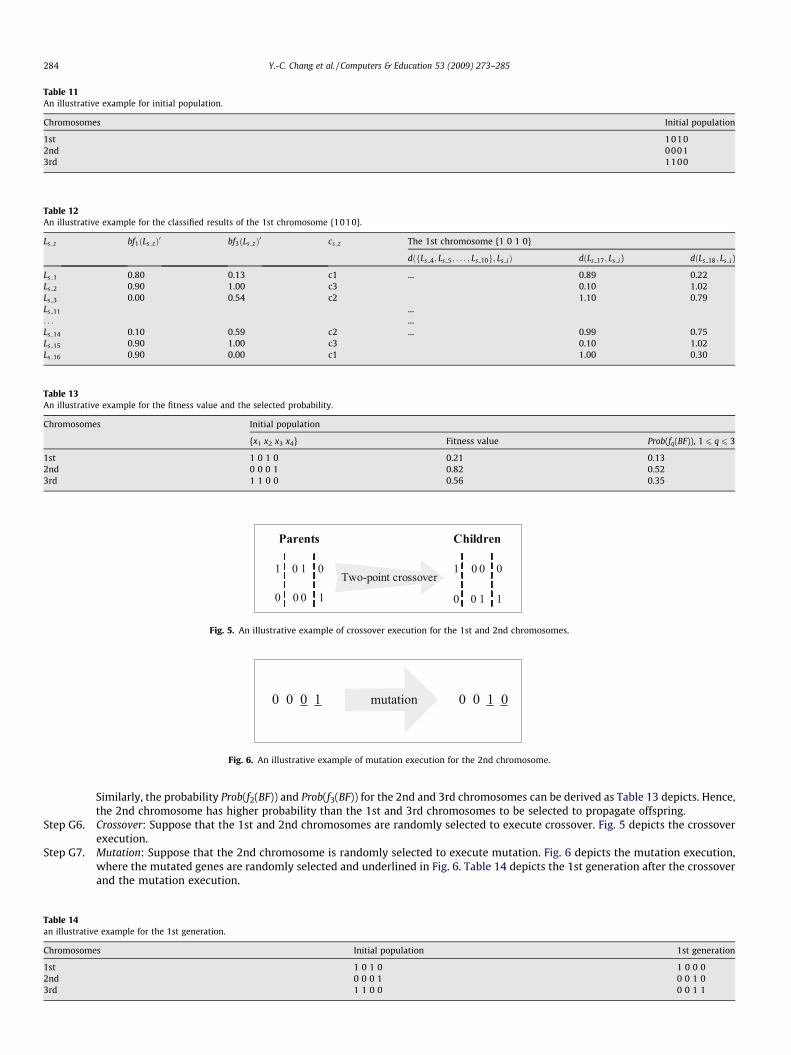
Table 11An illustrative example for initial population.
Chromosomes Initial population
1st 10102nd 00013rd 1100
Table 12An illustrative example for the classified results of the 1st chromosome {1010}.
Ls z bf1ðLs zÞ0 bf3ðLs zÞ0 cs z The 1st chromosome {1 0 1 0}
dðfLs 4; Ls 5; . . . ; Ls 10g; Ls iÞ dðLs 17; Ls i) dðLs 18; Ls i)
Ls 1 0.80 0.13 c1 ... 0.89 0.22Ls 2 0.90 1.00 c3 0.10 1.02Ls 3 0.00 0.54 c2 1.10 0.79Ls 11 .... . . ...Ls 14 0.10 0.59 c2 ... 0.99 0.75Ls 15 0.90 1.00 c3 0.10 1.02Ls 16 0.90 0.00 c1 1.00 0.30
Table 13An illustrative example for the fitness value and the selected probability.
Chromosomes Initial population
{x1 x2 x3 x4} Fitness value Prob(fq(BF)), 1 6 q 6 3
1st 1 0 1 0 0.21 0.132nd 0 0 0 1 0.82 0.523rd 1 1 0 0 0.56 0.35
0 0 0 1 mutation 0 0 1 0
Fig. 6. An illustrative example of mutation execution for the 2nd chromosome.
Two-point crossover
Parents
1 0 1 0
0 0 0 1
Children
1 0 0 0
0 0 1 1
Fig. 5. An illustrative example of crossover execution for the 1st and 2nd chromosomes.
Table 14an illustrativ
Chromosom
1st2nd3rd
284 Y.-C. Chang et al. / Computers & Education 53 (2009) 273–285
Similarly, the probability Prob(f2(BF)) and Prob(f3(BF)) for the 2nd and 3rd chromosomes can be derived as Table 13 depicts. Hence,the 2nd chromosome has higher probability than the 1st and 3rd chromosomes to be selected to propagate offspring.
Step G6. Crossover: Suppose that the 1st and 2nd chromosomes are randomly selected to execute crossover. Fig. 5 depicts the crossoverexecution.
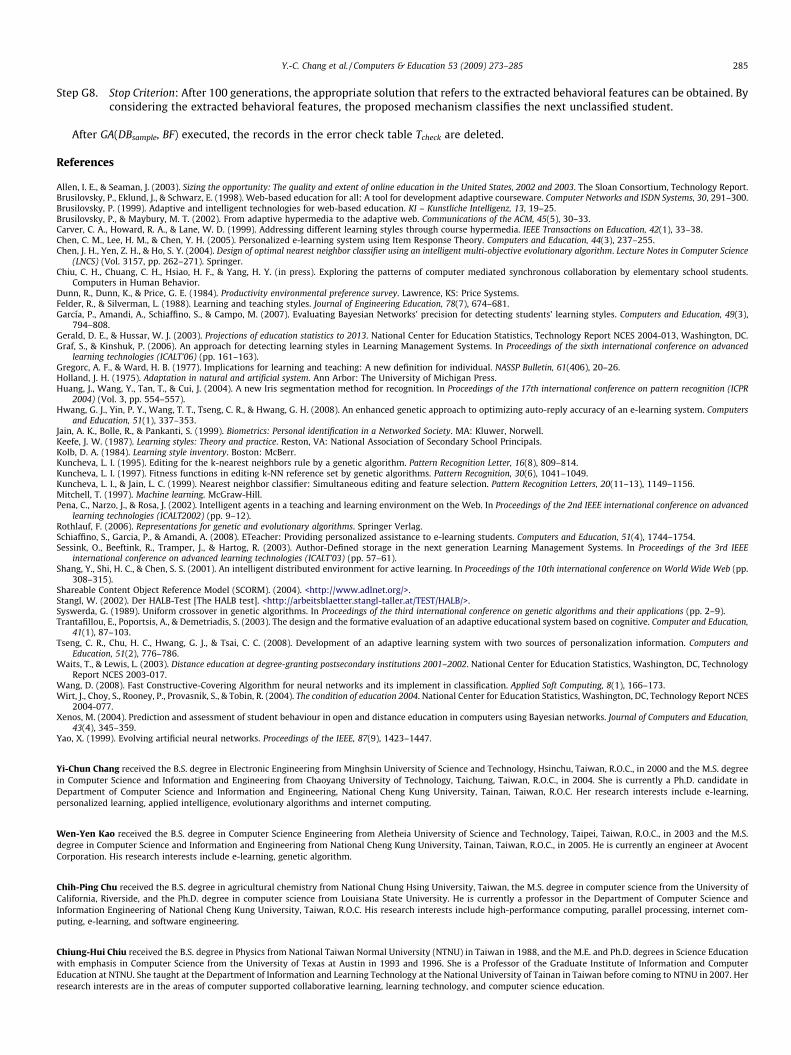
Step G7. Mutation: Suppose that the 2nd chromosome is randomly selected to execute mutation. Fig. 6 depicts the mutation execution,where the mutated genes are randomly selected and underlined in Fig. 6. Table 14 depicts the 1st generation after the crossoverand the mutation execution.
e example for the 1st generation.
es Initial population 1st generation
1 0 1 0 1 0 0 00 0 0 1 0 0 1 01 1 0 0 0 0 1 1
Y.-C. Chang et al. / Computers & Education 53 (2009) 273–285 285
Step G8. Stop Criterion: After 100 generations, the appropriate solution that refers to the extracted behavioral features can be obtained. Byconsidering the extracted behavioral features, the proposed mechanism classifies the next unclassified student.
After GA(DBsample, BF) executed, the records in the error check table Tcheck are deleted.
References
Allen, I. E., & Seaman, J. (2003). Sizing the opportunity: The quality and extent of online education in the United States, 2002 and 2003. The Sloan Consortium, Technology Report.Brusilovsky, P., Eklund, J., & Schwarz, E. (1998). Web-based education for all: A tool for development adaptive courseware. Computer Networks and ISDN Systems, 30, 291–300.Brusilovsky, P. (1999). Adaptive and intelligent technologies for web-based education. KI – Kunstliche Intelligenz, 13, 19–25.Brusilovsky, P., & Maybury, M. T. (2002). From adaptive hypermedia to the adaptive web. Communications of the ACM, 45(5), 30–33.Carver, C. A., Howard, R. A., & Lane, W. D. (1999). Addressing different learning styles through course hypermedia. IEEE Transactions on Education, 42(1), 33–38.Chen, C. M., Lee, H. M., & Chen, Y. H. (2005). Personalized e-learning system using Item Response Theory. Computers and Education, 44(3), 237–255.Chen, J. H., Yen, Z. H., & Ho, S. Y. (2004). Design of optimal nearest neighbor classifier using an intelligent multi-objective evolutionary algorithm. Lecture Notes in Computer Science
(LNCS) (Vol. 3157, pp. 262–271). Springer.Chiu, C. H., Chuang, C. H., Hsiao, H. F., & Yang, H. Y. (in press). Exploring the patterns of computer mediated synchronous collaboration by elementary school students.
Computers in Human Behavior.Dunn, R., Dunn, K., & Price, G. E. (1984). Productivity environmental preference survey. Lawrence, KS: Price Systems.Felder, R., & Silverman, L. (1988). Learning and teaching styles. Journal of Engineering Education, 78(7), 674–681.García, P., Amandi, A., Schiaffino, S., & Campo, M. (2007). Evaluating Bayesian Networks’ precision for detecting students’ learning styles. Computers and Education, 49(3),
794–808.Gerald, D. E., & Hussar, W. J. (2003). Projections of education statistics to 2013. National Center for Education Statistics, Technology Report NCES 2004-013, Washington, DC.Graf, S., & Kinshuk, P. (2006). An approach for detecting learning styles in Learning Management Systems. In Proceedings of the sixth international conference on advanced
learning technologies (ICALT’06) (pp. 161–163).Gregorc, A. F., & Ward, H. B. (1977). Implications for learning and teaching: A new definition for individual. NASSP Bulletin, 61(406), 20–26.Holland, J. H. (1975). Adaptation in natural and artificial system. Ann Arbor: The University of Michigan Press.Huang, J., Wang, Y., Tan, T., & Cui, J. (2004). A new Iris segmentation method for recognition. In Proceedings of the 17th international conference on pattern recognition (ICPR
2004) (Vol. 3, pp. 554–557).Hwang, G. J., Yin, P. Y., Wang, T. T., Tseng, C. R., & Hwang, G. H. (2008). An enhanced genetic approach to optimizing auto-reply accuracy of an e-learning system. Computers
and Education, 51(1), 337–353.Jain, A. K., Bolle, R., & Pankanti, S. (1999). Biometrics: Personal identification in a Networked Society. MA: Kluwer, Norwell.Keefe, J. W. (1987). Learning styles: Theory and practice. Reston, VA: National Association of Secondary School Principals.Kolb, D. A. (1984). Learning style inventory. Boston: McBerr.Kuncheva, L. I. (1995). Editing for the k-nearest neighbors rule by a genetic algorithm. Pattern Recognition Letter, 16(8), 809–814.Kuncheva, L. I. (1997). Fitness functions in editing k-NN reference set by genetic algorithms. Pattern Recognition, 30(6), 1041–1049.Kuncheva, L. I., & Jain, L. C. (1999). Nearest neighbor classifier: Simultaneous editing and feature selection. Pattern Recognition Letters, 20(11–13), 1149–1156.Mitchell, T. (1997). Machine learning. McGraw-Hill.Pena, C., Narzo, J., & Rosa, J. (2002). Intelligent agents in a teaching and learning environment on the Web. In Proceedings of the 2nd IEEE international conference on advanced
learning technologies (ICALT2002) (pp. 9–12).Rothlauf, F. (2006). Representations for genetic and evolutionary algorithms. Springer Verlag.Schiaffino, S., Garcia, P., & Amandi, A. (2008). ETeacher: Providing personalized assistance to e-learning students. Computers and Education, 51(4), 1744–1754.Sessink, O., Beeftink, R., Tramper, J., & Hartog, R. (2003). Author-Defined storage in the next generation Learning Management Systems. In Proceedings of the 3rd IEEE
international conference on advanced learning technologies (ICALT’03) (pp. 57–61).Shang, Y., Shi, H. C., & Chen, S. S. (2001). An intelligent distributed environment for active learning. In Proceedings of the 10th international conference on World Wide Web (pp.
308–315).Shareable Content Object Reference Model (SCORM). (2004). <http://www.adlnet.org/>.Stangl, W. (2002). Der HALB-Test [The HALB test]. <http://arbeitsblaetter.stangl-taller.at/TEST/HALB/>.Syswerda, G. (1989). Uniform crossover in genetic algorithms. In Proceedings of the third international conference on genetic algorithms and their applications (pp. 2–9).Trantafillou, E., Poportsis, A., & Demetriadis, S. (2003). The design and the formative evaluation of an adaptive educational system based on cognitive. Computer and Education,
41(1), 87–103.Tseng, C. R., Chu, H. C., Hwang, G. J., & Tsai, C. C. (2008). Development of an adaptive learning system with two sources of personalization information. Computers and
Education, 51(2), 776–786.Waits, T., & Lewis, L. (2003). Distance education at degree-granting postsecondary institutions 2001–2002. National Center for Education Statistics, Washington, DC, Technology
Report NCES 2003-017.Wang, D. (2008). Fast Constructive-Covering Algorithm for neural networks and its implement in classification. Applied Soft Computing, 8(1), 166–173.Wirt, J., Choy, S., Rooney, P., Provasnik, S., & Tobin, R. (2004). The condition of education 2004. National Center for Education Statistics, Washington, DC, Technology Report NCES
2004-077.Xenos, M. (2004). Prediction and assessment of student behaviour in open and distance education in computers using Bayesian networks. Journal of Computers and Education,
43(4), 345–359.Yao, X. (1999). Evolving artificial neural networks. Proceedings of the IEEE, 87(9), 1423–1447.
Yi-Chun Chang received the B.S. degree in Electronic Engineering from Minghsin University of Science and Technology, Hsinchu, Taiwan, R.O.C., in 2000 and the M.S. degreein Computer Science and Information and Engineering from Chaoyang University of Technology, Taichung, Taiwan, R.O.C., in 2004. She is currently a Ph.D. candidate inDepartment of Computer Science and Information and Engineering, National Cheng Kung University, Tainan, Taiwan, R.O.C. Her research interests include e-learning,personalized learning, applied intelligence, evolutionary algorithms and internet computing.
Wen-Yen Kao received the B.S. degree in Computer Science Engineering from Aletheia University of Science and Technology, Taipei, Taiwan, R.O.C., in 2003 and the M.S.degree in Computer Science and Information and Engineering from National Cheng Kung University, Tainan, Taiwan, R.O.C., in 2005. He is currently an engineer at AvocentCorporation. His research interests include e-learning, genetic algorithm.
Chih-Ping Chu received the B.S. degree in agricultural chemistry from National Chung Hsing University, Taiwan, the M.S. degree in computer science from the University ofCalifornia, Riverside, and the Ph.D. degree in computer science from Louisiana State University. He is currently a professor in the Department of Computer Science andInformation Engineering of National Cheng Kung University, Taiwan, R.O.C. His research interests include high-performance computing, parallel processing, internet com-puting, e-learning, and software engineering.
Chiung-Hui Chiu received the B.S. degree in Physics from National Taiwan Normal University (NTNU) in Taiwan in 1988, and the M.E. and Ph.D. degrees in Science Educationwith emphasis in Computer Science from the University of Texas at Austin in 1993 and 1996. She is a Professor of the Graduate Institute of Information and ComputerEducation at NTNU. She taught at the Department of Information and Learning Technology at the National University of Tainan in Taiwan before coming to NTNU in 2007. Herresearch interests are in the areas of computer supported collaborative learning, learning technology, and computer science education.
Related Documents